Shenandoah County, VA Map & Demographics
Shenandoah County Map
Shenandoah County Overview
$34,170
PER CAPITA INCOME
$76,699
AVG FAMILY INCOME
$62,149
AVG HOUSEHOLD INCOME
33.4%
WAGE / INCOME GAP [ % ]
66.6¢/ $1
WAGE / INCOME GAP [ $ ]
$10,905
FAMILY INCOME DEFICIT
0.45
INEQUALITY / GINI INDEX
44,337
TOTAL POPULATION
21,907
MALE POPULATION
22,430
FEMALE POPULATION
97.67
MALES / 100 FEMALES
102.39
FEMALES / 100 MALES
43.6
MEDIAN AGE
3.1
AVG FAMILY SIZE
2.5
AVG HOUSEHOLD SIZE
21,620
LABOR FORCE [ PEOPLE ]
59.9%
PERCENT IN LABOR FORCE
4.2%
UNEMPLOYMENT RATE
Shenandoah County Area Codes
Income in Shenandoah County
Income Overview in Shenandoah County
Per Capita Income in Shenandoah County is $34,170, while median incomes of families and households are $76,699 and $62,149 respectively.
| Characteristic | Number | Measure |
| Per Capita Income | 44,337 | $34,170 |
| Median Family Income | 11,428 | $76,699 |
| Mean Family Income | 11,428 | $93,847 |
| Median Household Income | 17,542 | $62,149 |
| Mean Household Income | 17,542 | $83,715 |
| Income Deficit | 11,428 | $10,905 |
| Wage / Income Gap (%) | 44,337 | 33.37% |
| Wage / Income Gap ($) | 44,337 | 66.63¢ per $1 |
| Gini / Inequality Index | 44,337 | 0.45 |
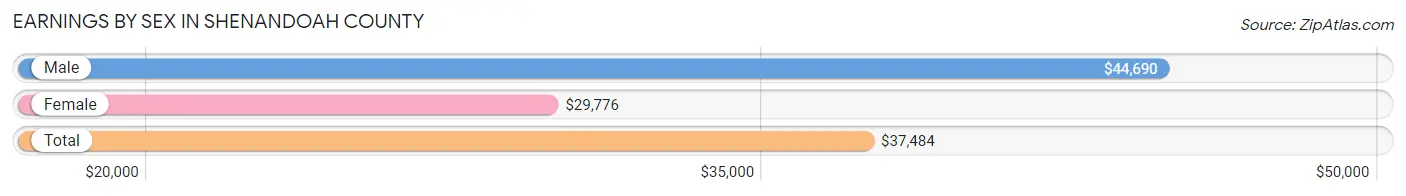
Earnings by Sex in Shenandoah County
Average Earnings in Shenandoah County are $37,484, $44,690 for men and $29,776 for women, a difference of 33.4%.
| Sex | Number | Average Earnings |
| Male | 12,031 (53.2%) | $44,690 |
| Female | 10,595 (46.8%) | $29,776 |
| Total | 22,626 (100.0%) | $37,484 |
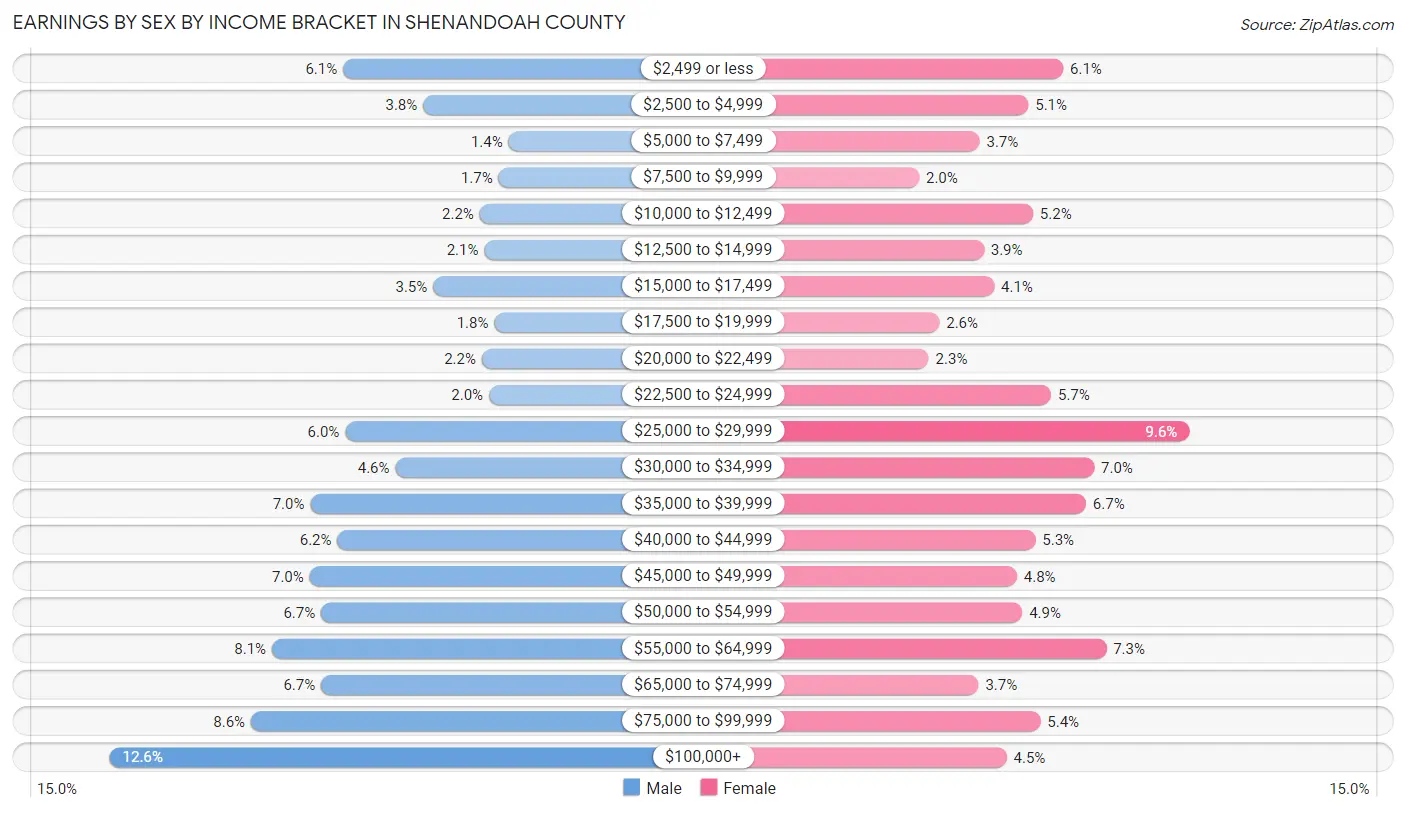
Earnings by Sex by Income Bracket in Shenandoah County
The most common earnings brackets in Shenandoah County are $100,000+ for men (1,517 | 12.6%) and $25,000 to $29,999 for women (1,019 | 9.6%).
| Income | Male | Female |
| $2,499 or less | 728 (6.0%) | 644 (6.1%) |
| $2,500 to $4,999 | 457 (3.8%) | 540 (5.1%) |
| $5,000 to $7,499 | 168 (1.4%) | 395 (3.7%) |
| $7,500 to $9,999 | 202 (1.7%) | 215 (2.0%) |
| $10,000 to $12,499 | 266 (2.2%) | 554 (5.2%) |
| $12,500 to $14,999 | 250 (2.1%) | 408 (3.8%) |
| $15,000 to $17,499 | 423 (3.5%) | 439 (4.1%) |
| $17,500 to $19,999 | 216 (1.8%) | 275 (2.6%) |
| $20,000 to $22,499 | 259 (2.1%) | 244 (2.3%) |
| $22,500 to $24,999 | 235 (1.9%) | 608 (5.7%) |
| $25,000 to $29,999 | 721 (6.0%) | 1,019 (9.6%) |
| $30,000 to $34,999 | 551 (4.6%) | 736 (7.0%) |
| $35,000 to $39,999 | 838 (7.0%) | 712 (6.7%) |
| $40,000 to $44,999 | 747 (6.2%) | 562 (5.3%) |
| $45,000 to $49,999 | 841 (7.0%) | 506 (4.8%) |
| $50,000 to $54,999 | 802 (6.7%) | 522 (4.9%) |
| $55,000 to $64,999 | 968 (8.1%) | 772 (7.3%) |
| $65,000 to $74,999 | 803 (6.7%) | 392 (3.7%) |
| $75,000 to $99,999 | 1,039 (8.6%) | 576 (5.4%) |
| $100,000+ | 1,517 (12.6%) | 476 (4.5%) |
| Total | 12,031 (100.0%) | 10,595 (100.0%) |
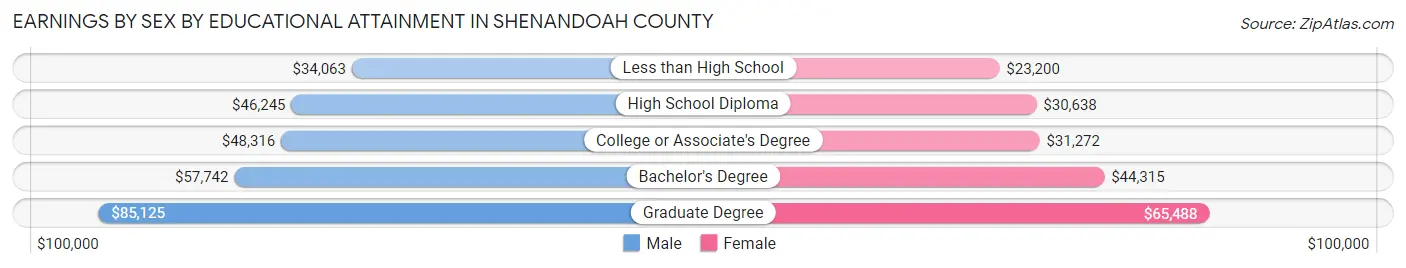
Earnings by Sex by Educational Attainment in Shenandoah County
Average earnings in Shenandoah County are $47,568 for men and $34,516 for women, a difference of 27.4%. Men with an educational attainment of graduate degree enjoy the highest average annual earnings of $85,125, while those with less than high school education earn the least with $34,063. Women with an educational attainment of graduate degree earn the most with the average annual earnings of $65,488, while those with less than high school education have the smallest earnings of $23,200.
| Educational Attainment | Male Income | Female Income |
| Less than High School | $34,063 | $23,200 |
| High School Diploma | $46,245 | $30,638 |
| College or Associate's Degree | $48,316 | $31,272 |
| Bachelor's Degree | $57,742 | $44,315 |
| Graduate Degree | $85,125 | $65,488 |
| Total | $47,568 | $34,516 |
Family Income in Shenandoah County
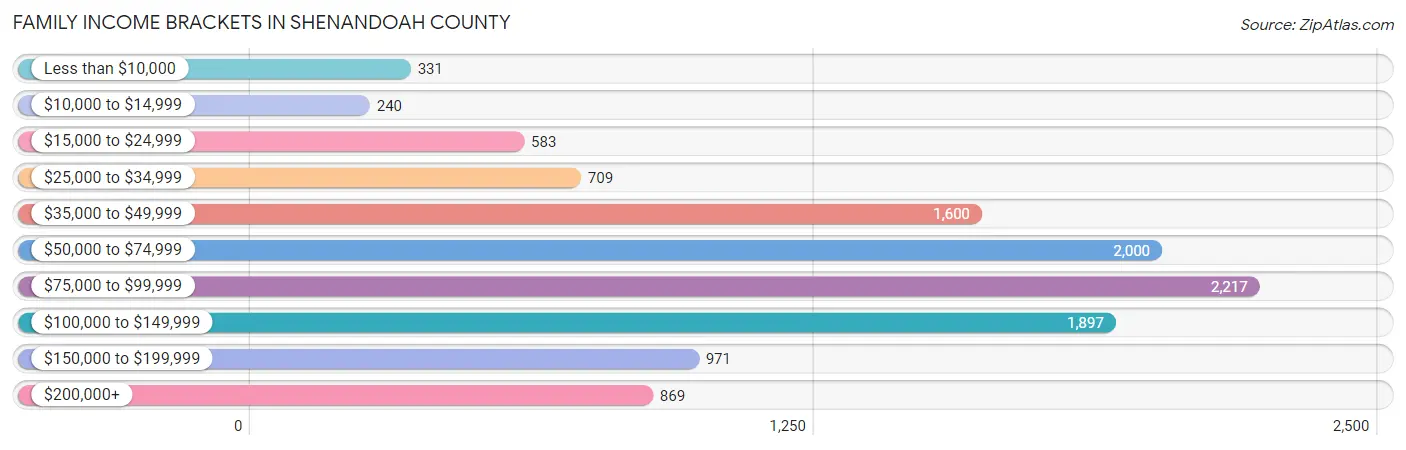
Family Income Brackets in Shenandoah County
According to the Shenandoah County family income data, there are 2,217 families falling into the $75,000 to $99,999 income range, which is the most common income bracket and makes up 19.4% of all families. Conversely, the $10,000 to $14,999 income bracket is the least frequent group with only 240 families (2.1%) belonging to this category.
| Income Bracket | # Families | % Families |
| Less than $10,000 | 331 | 2.9% |
| $10,000 to $14,999 | 240 | 2.1% |
| $15,000 to $24,999 | 583 | 5.1% |
| $25,000 to $34,999 | 709 | 6.2% |
| $35,000 to $49,999 | 1,600 | 14.0% |
| $50,000 to $74,999 | 2,000 | 17.5% |
| $75,000 to $99,999 | 2,217 | 19.4% |
| $100,000 to $149,999 | 1,897 | 16.6% |
| $150,000 to $199,999 | 971 | 8.5% |
| $200,000+ | 869 | 7.6% |
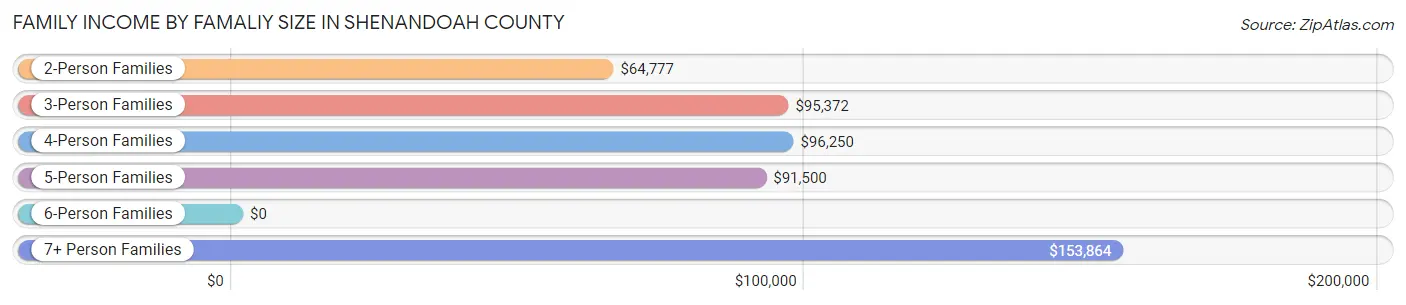
Family Income by Famaliy Size in Shenandoah County
7+ person families (152 | 1.3%) account for the highest median family income in Shenandoah County with $153,864 per family, while 2-person families (6,243 | 54.6%) have the highest median income of $32,388 per family member.
| Income Bracket | # Families | Median Income |
| 2-Person Families | 6,243 (54.6%) | $64,777 |
| 3-Person Families | 2,039 (17.8%) | $95,372 |
| 4-Person Families | 1,917 (16.8%) | $96,250 |
| 5-Person Families | 842 (7.4%) | $91,500 |
| 6-Person Families | 235 (2.1%) | $0 |
| 7+ Person Families | 152 (1.3%) | $153,864 |
| Total | 11,428 (100.0%) | $76,699 |
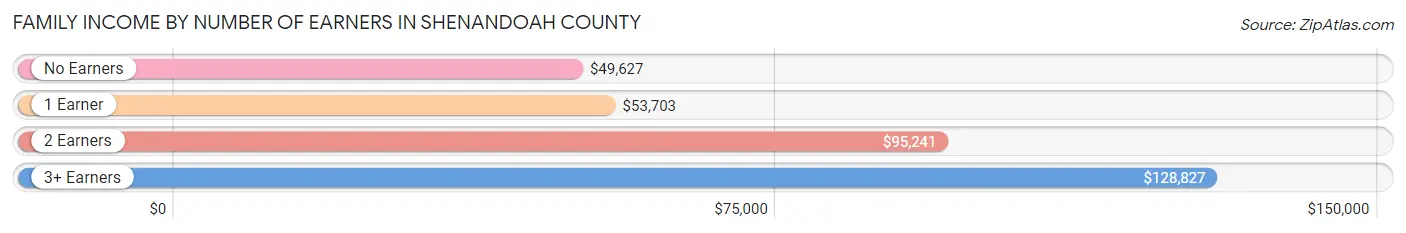
Family Income by Number of Earners in Shenandoah County
The median family income in Shenandoah County is $76,699, with families comprising 3+ earners (1,246) having the highest median family income of $128,827, while families with no earners (2,148) have the lowest median family income of $49,627, accounting for 10.9% and 18.8% of families, respectively.
| Number of Earners | # Families | Median Income |
| No Earners | 2,148 (18.8%) | $49,627 |
| 1 Earner | 3,435 (30.1%) | $53,703 |
| 2 Earners | 4,599 (40.2%) | $95,241 |
| 3+ Earners | 1,246 (10.9%) | $128,827 |
| Total | 11,428 (100.0%) | $76,699 |
Household Income in Shenandoah County
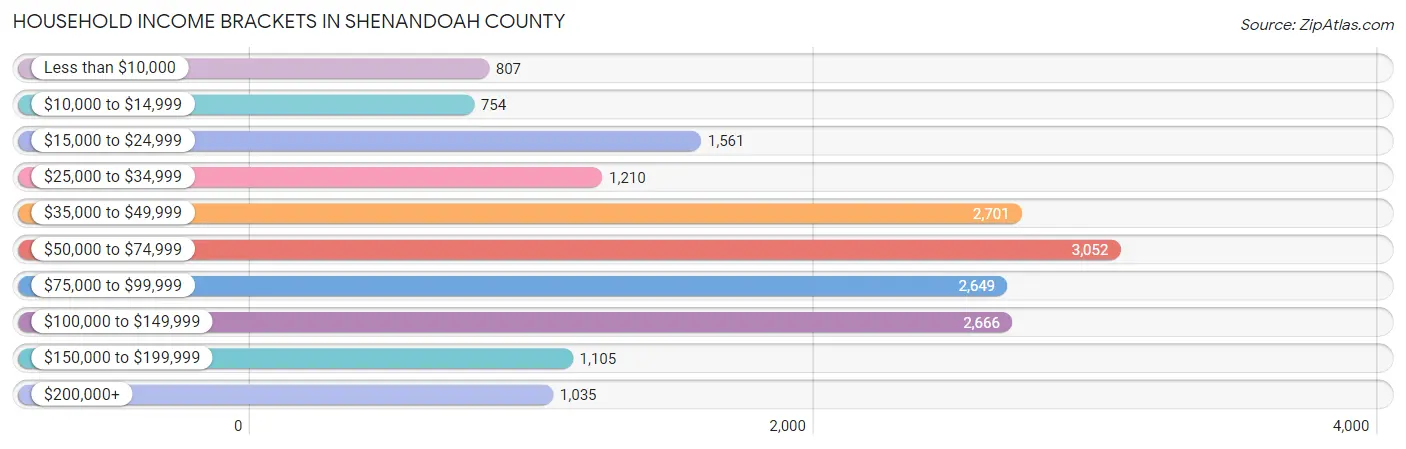
Household Income Brackets in Shenandoah County
With 3,052 households falling in the category, the $50,000 to $74,999 income range is the most frequent in Shenandoah County, accounting for 17.4% of all households. In contrast, only 754 households (4.3%) fall into the $10,000 to $14,999 income bracket, making it the least populous group.
| Income Bracket | # Households | % Households |
| Less than $10,000 | 807 | 4.6% |
| $10,000 to $14,999 | 754 | 4.3% |
| $15,000 to $24,999 | 1,561 | 8.9% |
| $25,000 to $34,999 | 1,210 | 6.9% |
| $35,000 to $49,999 | 2,701 | 15.4% |
| $50,000 to $74,999 | 3,052 | 17.4% |
| $75,000 to $99,999 | 2,649 | 15.1% |
| $100,000 to $149,999 | 2,666 | 15.2% |
| $150,000 to $199,999 | 1,105 | 6.3% |
| $200,000+ | 1,035 | 5.9% |
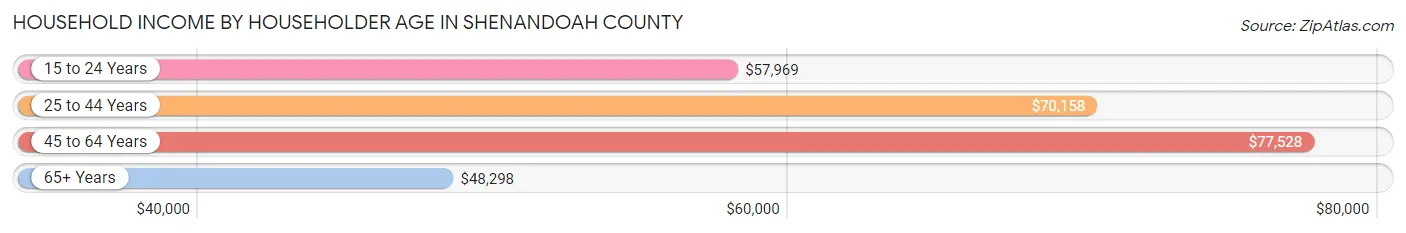
Household Income by Householder Age in Shenandoah County
The median household income in Shenandoah County is $62,149, with the highest median household income of $77,528 found in the 45 to 64 years age bracket for the primary householder. A total of 6,760 households (38.5%) fall into this category. Meanwhile, the 65+ years age bracket for the primary householder has the lowest median household income of $48,298, with 5,738 households (32.7%) in this group.
| Income Bracket | # Households | Median Income |
| 15 to 24 Years | 583 (3.3%) | $57,969 |
| 25 to 44 Years | 4,461 (25.4%) | $70,158 |
| 45 to 64 Years | 6,760 (38.5%) | $77,528 |
| 65+ Years | 5,738 (32.7%) | $48,298 |
| Total | 17,542 (100.0%) | $62,149 |
Poverty in Shenandoah County
Income Below Poverty by Sex and Age in Shenandoah County
With 9.3% poverty level for males and 15.8% for females among the residents of Shenandoah County, 6 to 11 year old males and 5 year old females are the most vulnerable to poverty, with 371 males (25.1%) and 156 females (49.8%) in their respective age groups living below the poverty level.
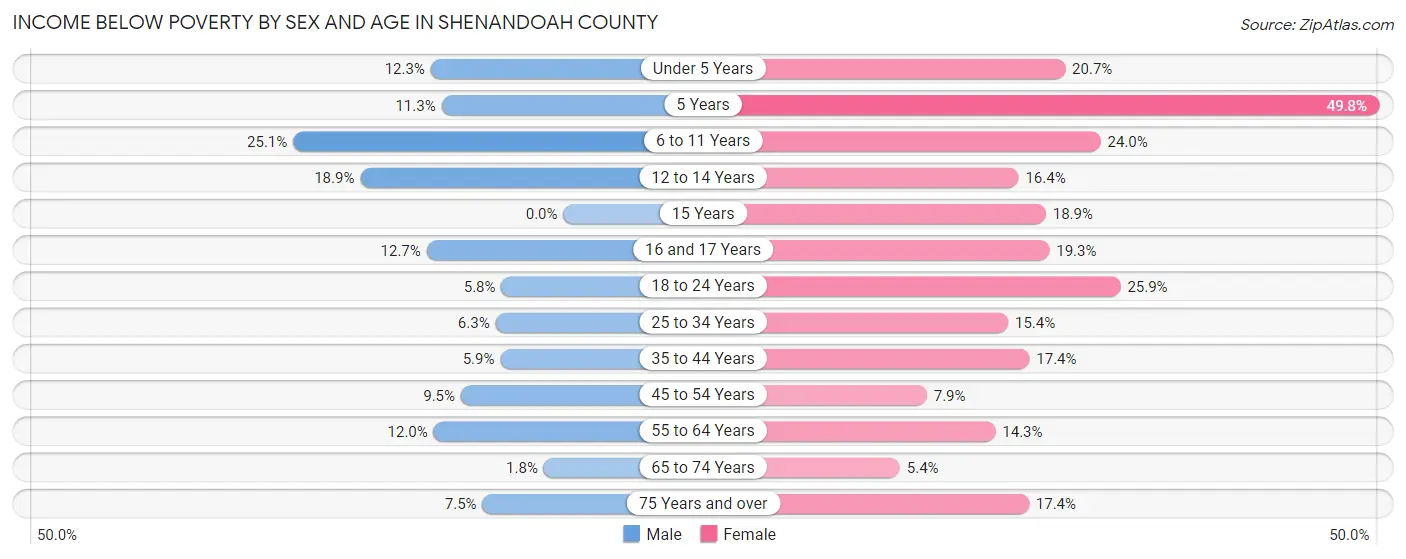
| Age Bracket | Male | Female |
| Under 5 Years | 160 (12.3%) | 251 (20.7%) |
| 5 Years | 32 (11.3%) | 156 (49.8%) |
| 6 to 11 Years | 371 (25.1%) | 351 (24.0%) |
| 12 to 14 Years | 157 (18.9%) | 103 (16.4%) |
| 15 Years | 0 (0.0%) | 53 (18.9%) |
| 16 and 17 Years | 76 (12.7%) | 115 (19.3%) |
| 18 to 24 Years | 92 (5.8%) | 434 (25.9%) |
| 25 to 34 Years | 163 (6.3%) | 361 (15.4%) |
| 35 to 44 Years | 146 (5.9%) | 440 (17.4%) |
| 45 to 54 Years | 264 (9.5%) | 220 (7.9%) |
| 55 to 64 Years | 381 (12.0%) | 458 (14.2%) |
| 65 to 74 Years | 48 (1.8%) | 147 (5.4%) |
| 75 Years and over | 133 (7.5%) | 392 (17.4%) |
| Total | 2,023 (9.3%) | 3,481 (15.8%) |
Income Above Poverty by Sex and Age in Shenandoah County
According to the poverty statistics in Shenandoah County, males aged 15 years and females aged 65 to 74 years are the age groups that are most secure financially, with 100.0% of males and 94.6% of females in these age groups living above the poverty line.
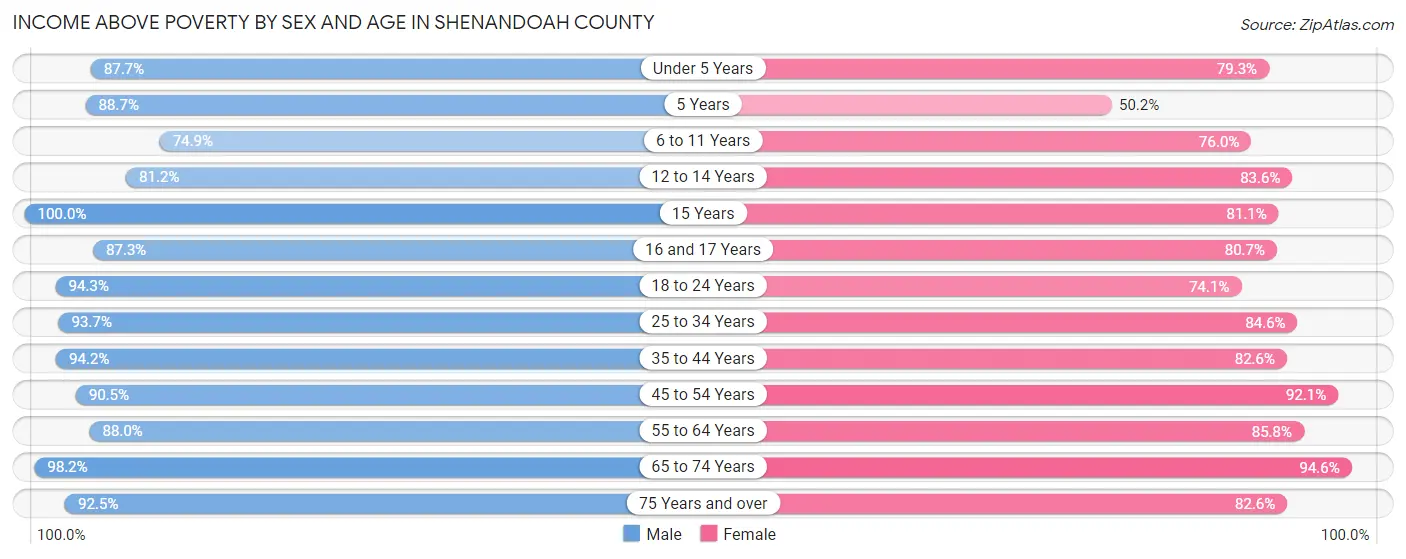
| Age Bracket | Male | Female |
| Under 5 Years | 1,140 (87.7%) | 960 (79.3%) |
| 5 Years | 251 (88.7%) | 157 (50.2%) |
| 6 to 11 Years | 1,108 (74.9%) | 1,110 (76.0%) |
| 12 to 14 Years | 676 (81.1%) | 525 (83.6%) |
| 15 Years | 292 (100.0%) | 227 (81.1%) |
| 16 and 17 Years | 523 (87.3%) | 482 (80.7%) |
| 18 to 24 Years | 1,507 (94.3%) | 1,244 (74.1%) |
| 25 to 34 Years | 2,424 (93.7%) | 1,979 (84.6%) |
| 35 to 44 Years | 2,350 (94.2%) | 2,087 (82.6%) |
| 45 to 54 Years | 2,512 (90.5%) | 2,568 (92.1%) |
| 55 to 64 Years | 2,784 (88.0%) | 2,757 (85.8%) |
| 65 to 74 Years | 2,585 (98.2%) | 2,580 (94.6%) |
| 75 Years and over | 1,637 (92.5%) | 1,866 (82.6%) |
| Total | 19,789 (90.7%) | 18,542 (84.2%) |
Income Below Poverty Among Married-Couple Families in Shenandoah County
The poverty statistics for married-couple families in Shenandoah County show that 4.9% or 397 of the total 8,185 families live below the poverty line. Families with 3 or 4 children have the highest poverty rate of 12.3%, comprising of 71 families. On the other hand, families with no children have the lowest poverty rate of 4.0%, which includes 225 families.
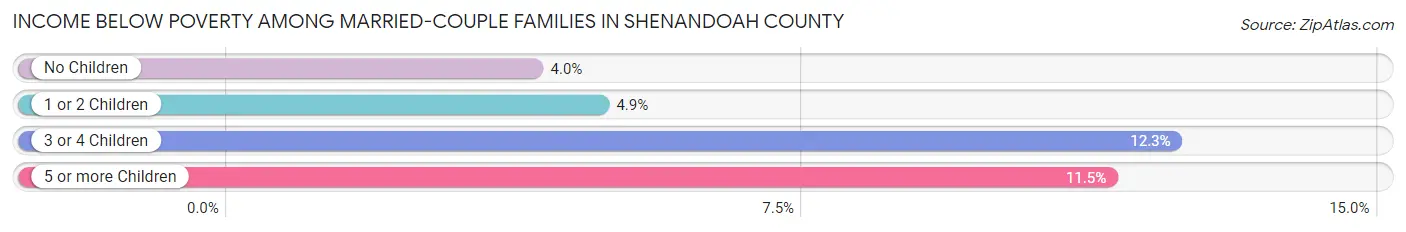
| Children | Above Poverty | Below Poverty |
| No Children | 5,420 (96.0%) | 225 (4.0%) |
| 1 or 2 Children | 1,786 (95.2%) | 91 (4.9%) |
| 3 or 4 Children | 505 (87.7%) | 71 (12.3%) |
| 5 or more Children | 77 (88.5%) | 10 (11.5%) |
| Total | 7,788 (95.2%) | 397 (4.9%) |
Income Below Poverty Among Single-Parent Households in Shenandoah County
According to the poverty data in Shenandoah County, 13.5% or 135 single-father households and 22.8% or 511 single-mother households are living below the poverty line. Among single-father households, those with 3 or 4 children have the highest poverty rate, with 17 households (34.0%) experiencing poverty. Likewise, among single-mother households, those with 3 or 4 children have the highest poverty rate, with 275 households (59.8%) falling below the poverty line.
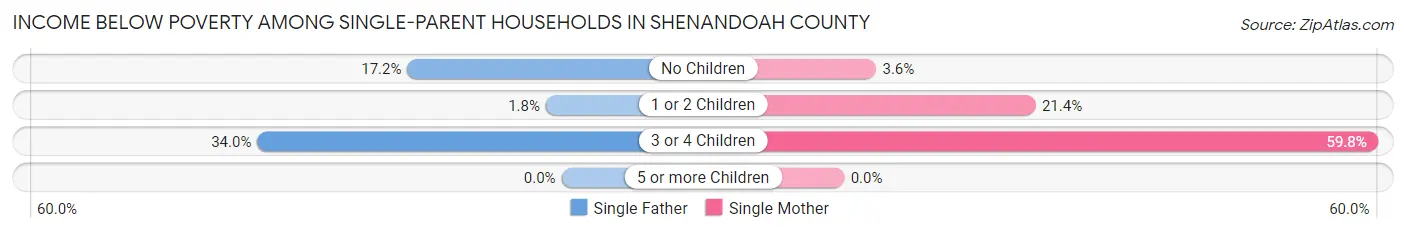
| Children | Single Father | Single Mother |
| No Children | 113 (17.2%) | 29 (3.6%) |
| 1 or 2 Children | 5 (1.8%) | 207 (21.4%) |
| 3 or 4 Children | 17 (34.0%) | 275 (59.8%) |
| 5 or more Children | 0 (0.0%) | 0 (0.0%) |
| Total | 135 (13.5%) | 511 (22.8%) |
Income Below Poverty Among Married-Couple vs Single-Parent Households in Shenandoah County
The poverty data for Shenandoah County shows that 397 of the married-couple family households (4.9%) and 646 of the single-parent households (19.9%) are living below the poverty level. Within the married-couple family households, those with 3 or 4 children have the highest poverty rate, with 71 households (12.3%) falling below the poverty line. Among the single-parent households, those with 3 or 4 children have the highest poverty rate, with 292 household (57.3%) living below poverty.
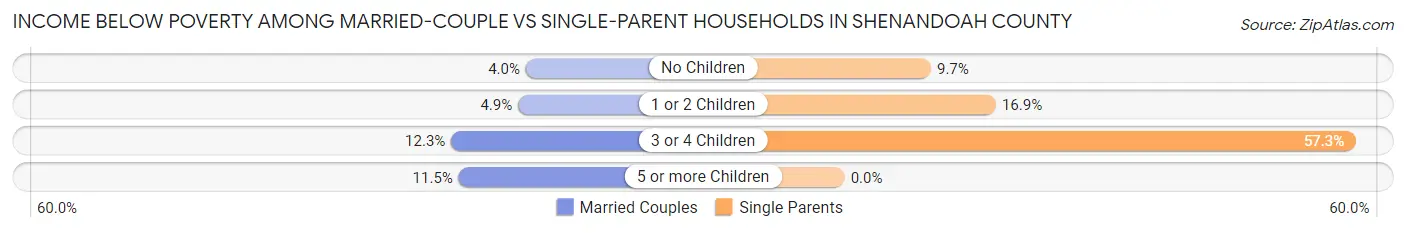
| Children | Married-Couple Families | Single-Parent Households |
| No Children | 225 (4.0%) | 142 (9.7%) |
| 1 or 2 Children | 91 (4.9%) | 212 (16.9%) |
| 3 or 4 Children | 71 (12.3%) | 292 (57.3%) |
| 5 or more Children | 10 (11.5%) | 0 (0.0%) |
| Total | 397 (4.9%) | 646 (19.9%) |
Race in Shenandoah County
The most populous races in Shenandoah County are White / Caucasian (39,293 | 88.6%), Hispanic or Latino (3,550 | 8.0%), and Two or more Races (2,504 | 5.7%).
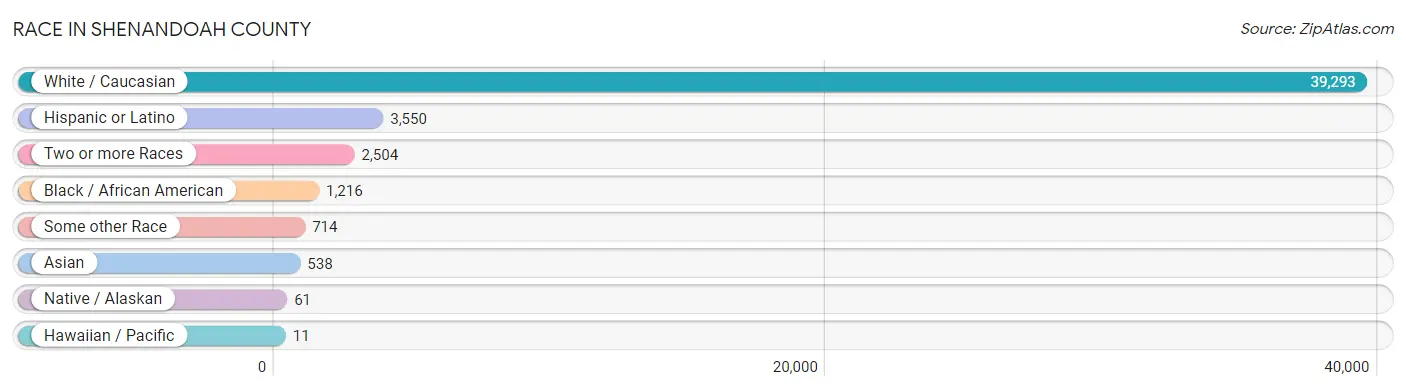
| Race | # Population | % Population |
| Asian | 538 | 1.2% |
| Black / African American | 1,216 | 2.7% |
| Hawaiian / Pacific | 11 | 0.0% |
| Hispanic or Latino | 3,550 | 8.0% |
| Native / Alaskan | 61 | 0.1% |
| White / Caucasian | 39,293 | 88.6% |
| Two or more Races | 2,504 | 5.7% |
| Some other Race | 714 | 1.6% |
| Total | 44,337 | 100.0% |
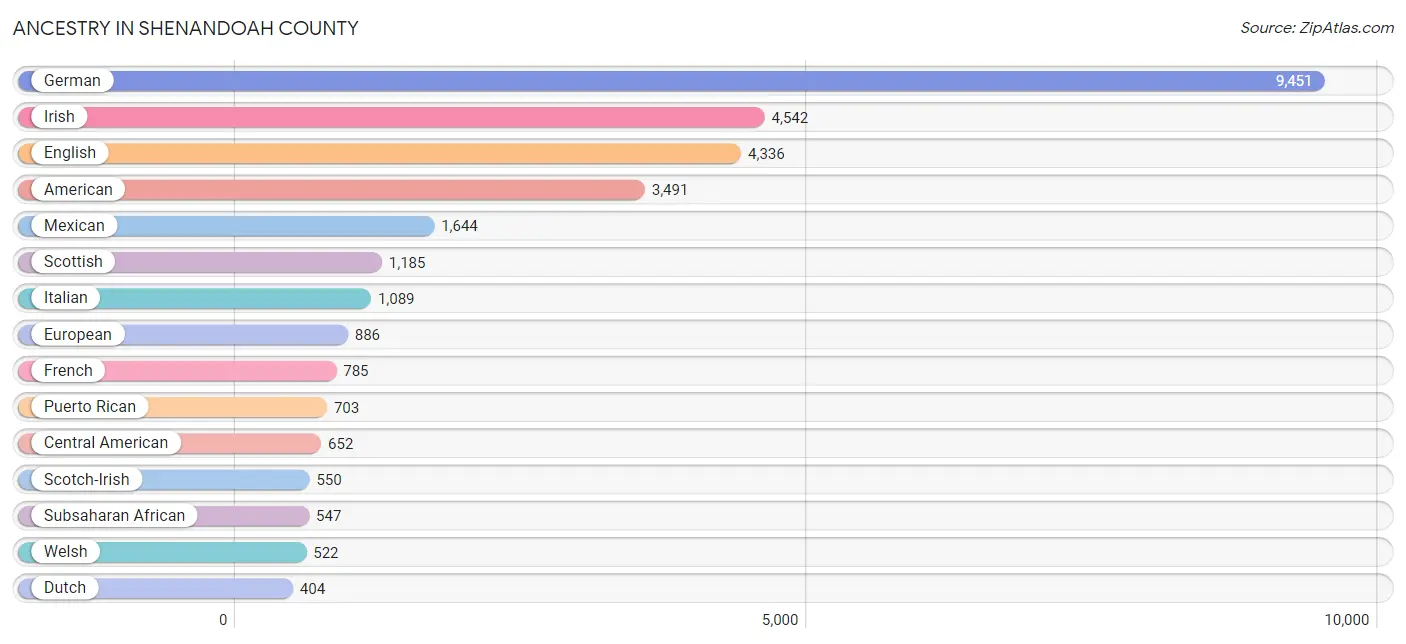
Ancestry in Shenandoah County
The most populous ancestries reported in Shenandoah County are German (9,451 | 21.3%), Irish (4,542 | 10.2%), English (4,336 | 9.8%), American (3,491 | 7.9%), and Mexican (1,644 | 3.7%), together accounting for 52.9% of all Shenandoah County residents.
| Ancestry | # Population | % Population |
| African | 319 | 0.7% |
| American | 3,491 | 7.9% |
| Apache | 3 | 0.0% |
| Arab | 31 | 0.1% |
| Argentinean | 28 | 0.1% |
| Armenian | 16 | 0.0% |
| Austrian | 88 | 0.2% |
| Barbadian | 16 | 0.0% |
| Belgian | 18 | 0.0% |
| Bhutanese | 38 | 0.1% |
| British | 319 | 0.7% |
| Burmese | 363 | 0.8% |
| Canadian | 3 | 0.0% |
| Celtic | 14 | 0.0% |
| Central American | 652 | 1.5% |
| Cherokee | 167 | 0.4% |
| Chippewa | 4 | 0.0% |
| Colombian | 6 | 0.0% |
| Costa Rican | 27 | 0.1% |
| Croatian | 46 | 0.1% |
| Cuban | 163 | 0.4% |
| Czech | 100 | 0.2% |
| Czechoslovakian | 5 | 0.0% |
| Danish | 46 | 0.1% |
| Dominican | 11 | 0.0% |
| Dutch | 404 | 0.9% |
| Eastern European | 65 | 0.2% |
| Ecuadorian | 52 | 0.1% |
| English | 4,336 | 9.8% |
| Ethiopian | 222 | 0.5% |
| European | 886 | 2.0% |
| French | 785 | 1.8% |
| French American Indian | 18 | 0.0% |
| French Canadian | 294 | 0.7% |
| German | 9,451 | 21.3% |
| Greek | 70 | 0.2% |
| Guatemalan | 72 | 0.2% |
| Honduran | 25 | 0.1% |
| Hungarian | 67 | 0.2% |
| Indian (Asian) | 5 | 0.0% |
| Iranian | 37 | 0.1% |
| Irish | 4,542 | 10.2% |
| Iroquois | 27 | 0.1% |
| Italian | 1,089 | 2.5% |
| Jamaican | 40 | 0.1% |
| Korean | 9 | 0.0% |
| Lebanese | 31 | 0.1% |
| Lithuanian | 34 | 0.1% |
| Malaysian | 34 | 0.1% |
| Mexican | 1,644 | 3.7% |
| Mexican American Indian | 104 | 0.2% |
| Nicaraguan | 119 | 0.3% |
| Northern European | 75 | 0.2% |
| Norwegian | 284 | 0.6% |
| Panamanian | 10 | 0.0% |
| Peruvian | 190 | 0.4% |
| Polish | 382 | 0.9% |
| Portuguese | 40 | 0.1% |
| Puerto Rican | 703 | 1.6% |
| Romanian | 43 | 0.1% |
| Russian | 146 | 0.3% |
| Salvadoran | 399 | 0.9% |
| Samoan | 11 | 0.0% |
| Scandinavian | 176 | 0.4% |
| Scotch-Irish | 550 | 1.2% |
| Scottish | 1,185 | 2.7% |
| Serbian | 18 | 0.0% |
| Sioux | 12 | 0.0% |
| Slovak | 92 | 0.2% |
| Slovene | 20 | 0.1% |
| South American | 293 | 0.7% |
| Spaniard | 8 | 0.0% |
| Spanish | 35 | 0.1% |
| Sri Lankan | 14 | 0.0% |
| Subsaharan African | 547 | 1.2% |
| Swedish | 247 | 0.6% |
| Swiss | 95 | 0.2% |
| Thai | 20 | 0.1% |
| Ukrainian | 66 | 0.2% |
| Venezuelan | 17 | 0.0% |
| Welsh | 522 | 1.2% |
| West Indian | 32 | 0.1% | View All 82 Rows |
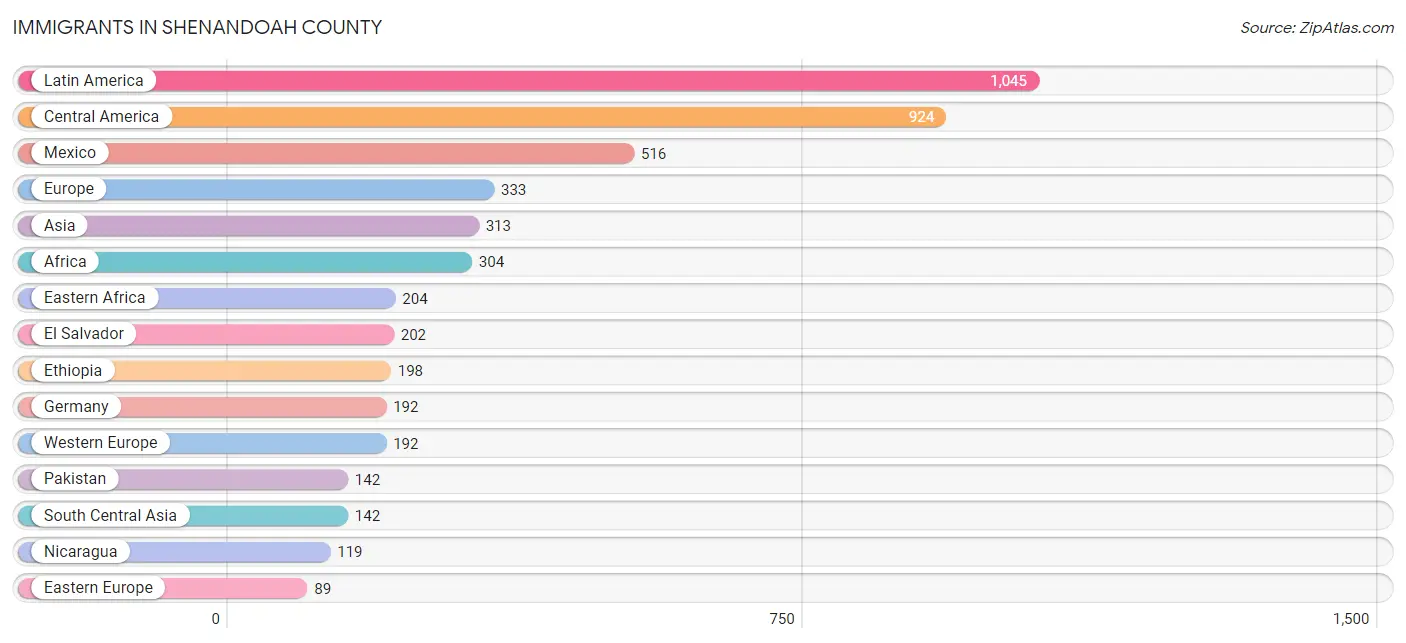
Immigrants in Shenandoah County
The most numerous immigrant groups reported in Shenandoah County came from Latin America (1,045 | 2.4%), Central America (924 | 2.1%), Mexico (516 | 1.2%), Europe (333 | 0.7%), and Asia (313 | 0.7%), together accounting for 7.1% of all Shenandoah County residents.
| Immigration Origin | # Population | % Population |
| Africa | 304 | 0.7% |
| Asia | 313 | 0.7% |
| Australia | 15 | 0.0% |
| Cameroon | 14 | 0.0% |
| Canada | 33 | 0.1% |
| Caribbean | 57 | 0.1% |
| Central America | 924 | 2.1% |
| China | 18 | 0.0% |
| Cuba | 50 | 0.1% |
| Dominican Republic | 2 | 0.0% |
| Eastern Africa | 204 | 0.5% |
| Eastern Asia | 75 | 0.2% |
| Eastern Europe | 89 | 0.2% |
| El Salvador | 202 | 0.5% |
| Eritrea | 6 | 0.0% |
| Ethiopia | 198 | 0.4% |
| Europe | 333 | 0.7% |
| Germany | 192 | 0.4% |
| Guatemala | 62 | 0.1% |
| Honduras | 25 | 0.1% |
| Hungary | 3 | 0.0% |
| Israel | 16 | 0.0% |
| Italy | 23 | 0.1% |
| Japan | 31 | 0.1% |
| Jordan | 13 | 0.0% |
| Korea | 26 | 0.1% |
| Laos | 34 | 0.1% |
| Latin America | 1,045 | 2.4% |
| Lithuania | 22 | 0.1% |
| Mexico | 516 | 1.2% |
| Middle Africa | 14 | 0.0% |
| Nicaragua | 119 | 0.3% |
| Northern Europe | 29 | 0.1% |
| Oceania | 15 | 0.0% |
| Pakistan | 142 | 0.3% |
| Peru | 64 | 0.1% |
| Philippines | 19 | 0.0% |
| Romania | 30 | 0.1% |
| Sierra Leone | 24 | 0.1% |
| South Africa | 62 | 0.1% |
| South America | 64 | 0.1% |
| South Central Asia | 142 | 0.3% |
| South Eastern Asia | 67 | 0.2% |
| Southern Europe | 23 | 0.1% |
| Trinidad and Tobago | 5 | 0.0% |
| Ukraine | 26 | 0.1% |
| Vietnam | 14 | 0.0% |
| Western Africa | 24 | 0.1% |
| Western Asia | 29 | 0.1% |
| Western Europe | 192 | 0.4% | View All 50 Rows |
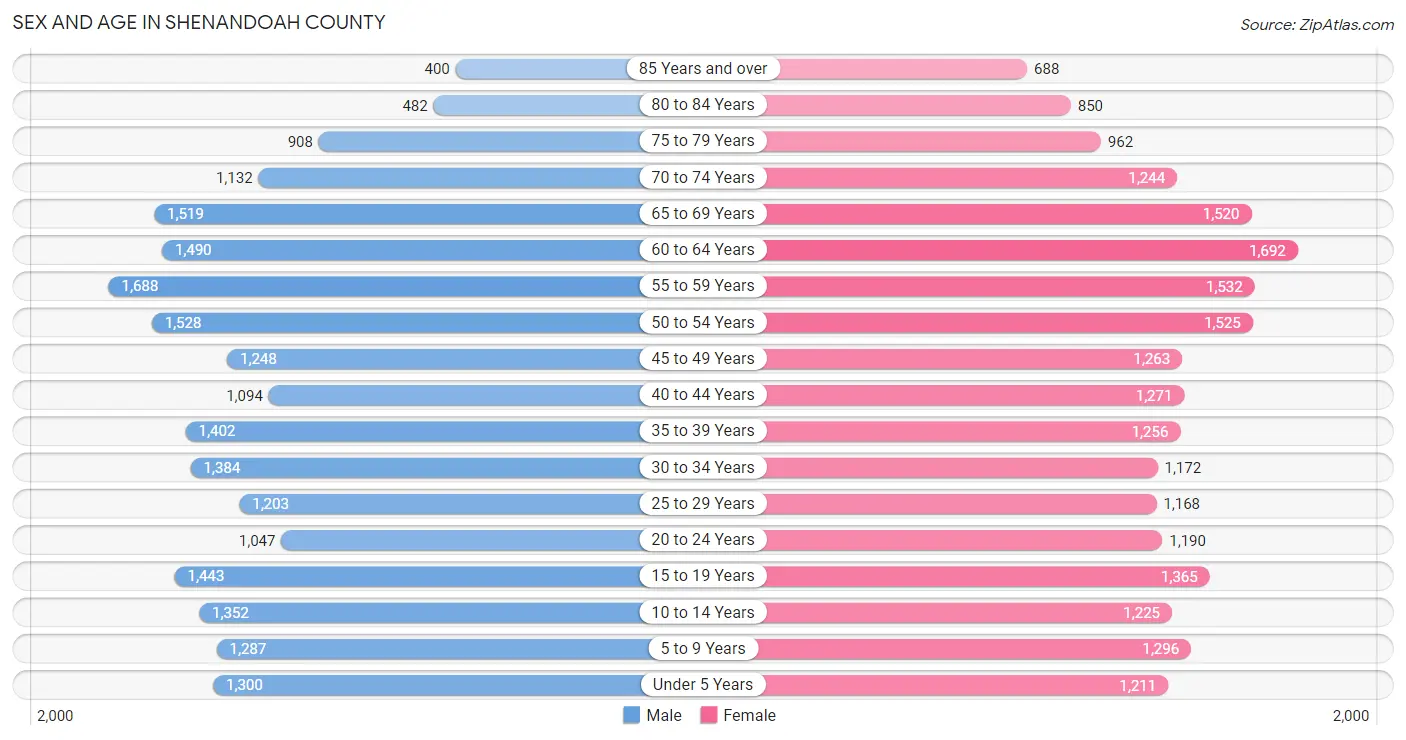
Sex and Age in Shenandoah County
Sex and Age in Shenandoah County
The most populous age groups in Shenandoah County are 55 to 59 Years (1,688 | 7.7%) for men and 60 to 64 Years (1,692 | 7.5%) for women.
| Age Bracket | Male | Female |
| Under 5 Years | 1,300 (5.9%) | 1,211 (5.4%) |
| 5 to 9 Years | 1,287 (5.9%) | 1,296 (5.8%) |
| 10 to 14 Years | 1,352 (6.2%) | 1,225 (5.5%) |
| 15 to 19 Years | 1,443 (6.6%) | 1,365 (6.1%) |
| 20 to 24 Years | 1,047 (4.8%) | 1,190 (5.3%) |
| 25 to 29 Years | 1,203 (5.5%) | 1,168 (5.2%) |
| 30 to 34 Years | 1,384 (6.3%) | 1,172 (5.2%) |
| 35 to 39 Years | 1,402 (6.4%) | 1,256 (5.6%) |
| 40 to 44 Years | 1,094 (5.0%) | 1,271 (5.7%) |
| 45 to 49 Years | 1,248 (5.7%) | 1,263 (5.6%) |
| 50 to 54 Years | 1,528 (7.0%) | 1,525 (6.8%) |
| 55 to 59 Years | 1,688 (7.7%) | 1,532 (6.8%) |
| 60 to 64 Years | 1,490 (6.8%) | 1,692 (7.5%) |
| 65 to 69 Years | 1,519 (6.9%) | 1,520 (6.8%) |
| 70 to 74 Years | 1,132 (5.2%) | 1,244 (5.6%) |
| 75 to 79 Years | 908 (4.1%) | 962 (4.3%) |
| 80 to 84 Years | 482 (2.2%) | 850 (3.8%) |
| 85 Years and over | 400 (1.8%) | 688 (3.1%) |
| Total | 21,907 (100.0%) | 22,430 (100.0%) |
Families and Households in Shenandoah County
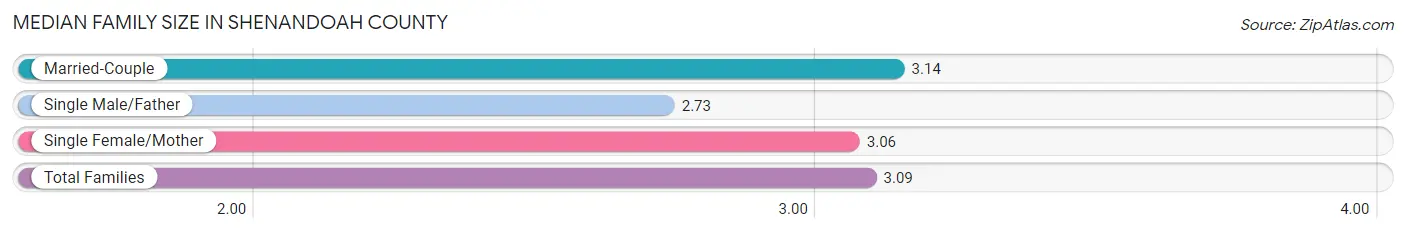
Median Family Size in Shenandoah County
The median family size in Shenandoah County is 3.09 persons per family, with married-couple families (8,185 | 71.6%) accounting for the largest median family size of 3.14 persons per family. On the other hand, single male/father families (1,000 | 8.7%) represent the smallest median family size with 2.73 persons per family.
| Family Type | # Families | Family Size |
| Married-Couple | 8,185 (71.6%) | 3.14 |
| Single Male/Father | 1,000 (8.7%) | 2.73 |
| Single Female/Mother | 2,243 (19.6%) | 3.06 |
| Total Families | 11,428 (100.0%) | 3.09 |
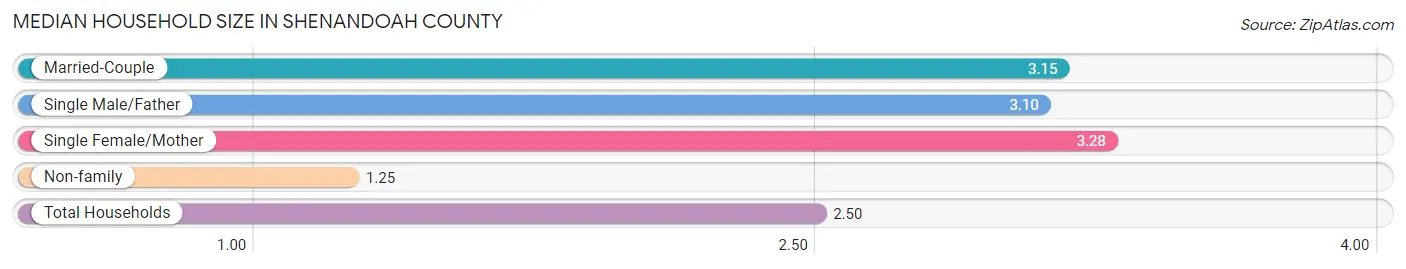
Median Household Size in Shenandoah County
The median household size in Shenandoah County is 2.50 persons per household, with single female/mother households (2,243 | 12.8%) accounting for the largest median household size of 3.28 persons per household. non-family households (6,114 | 34.8%) represent the smallest median household size with 1.25 persons per household.
| Household Type | # Households | Household Size |
| Married-Couple | 8,185 (46.7%) | 3.15 |
| Single Male/Father | 1,000 (5.7%) | 3.10 |
| Single Female/Mother | 2,243 (12.8%) | 3.28 |
| Non-family | 6,114 (34.8%) | 1.25 |
| Total Households | 17,542 (100.0%) | 2.50 |
Household Size by Marriage Status in Shenandoah County
Out of a total of 17,542 households in Shenandoah County, 11,428 (65.1%) are family households, while 6,114 (34.8%) are nonfamily households. The most numerous type of family households are 2-person households, comprising 5,773, and the most common type of nonfamily households are 1-person households, comprising 5,069.
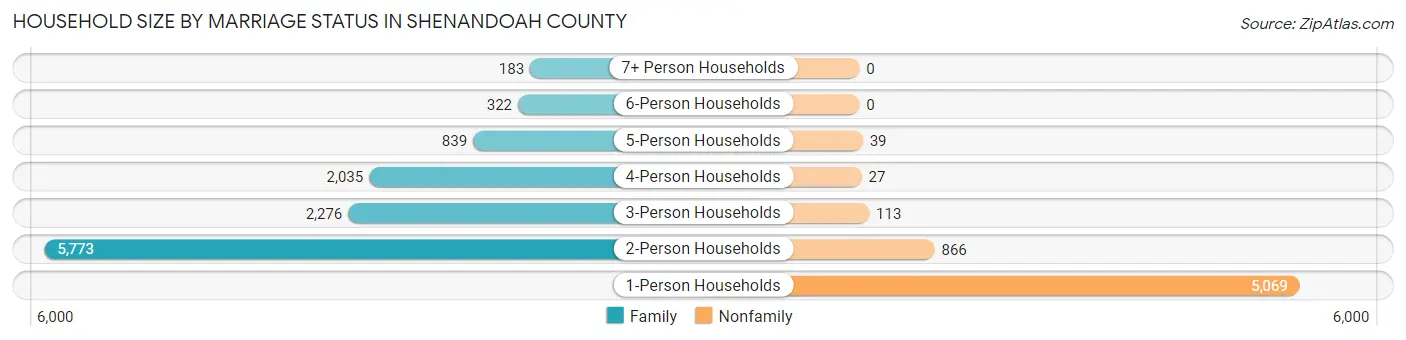
| Household Size | Family Households | Nonfamily Households |
| 1-Person Households | - | 5,069 (28.9%) |
| 2-Person Households | 5,773 (32.9%) | 866 (4.9%) |
| 3-Person Households | 2,276 (13.0%) | 113 (0.6%) |
| 4-Person Households | 2,035 (11.6%) | 27 (0.2%) |
| 5-Person Households | 839 (4.8%) | 39 (0.2%) |
| 6-Person Households | 322 (1.8%) | 0 (0.0%) |
| 7+ Person Households | 183 (1.0%) | 0 (0.0%) |
| Total | 11,428 (65.1%) | 6,114 (34.8%) |
Female Fertility in Shenandoah County
Fertility by Age in Shenandoah County
Average fertility rate in Shenandoah County is 55.0 births per 1,000 women. Women in the age bracket of 20 to 34 years have the highest fertility rate with 78.0 births per 1,000 women. Women in the age bracket of 20 to 34 years acount for 55.3% of all women with births.
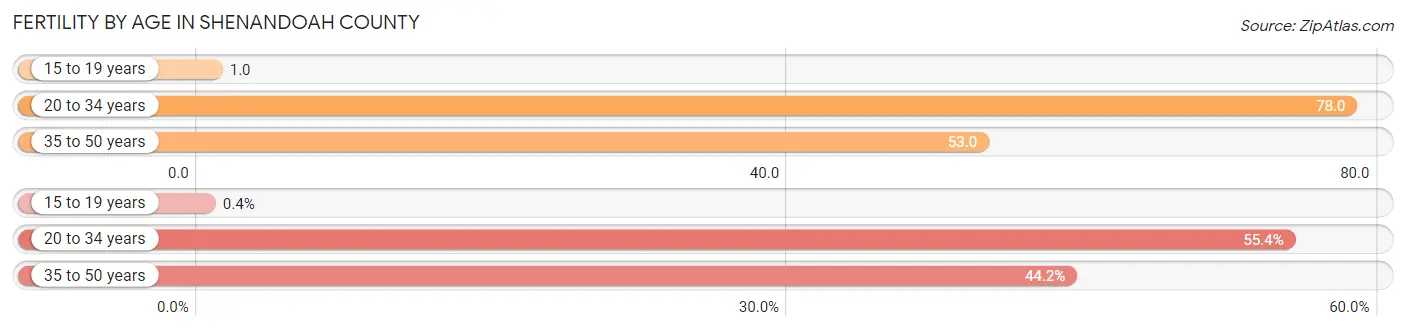
| Age Bracket | Women with Births | Births / 1,000 Women |
| 15 to 19 years | 2 (0.4%) | 1.0 |
| 20 to 34 years | 274 (55.3%) | 78.0 |
| 35 to 50 years | 219 (44.2%) | 53.0 |
| Total | 495 (100.0%) | 55.0 |
Fertility by Age by Marriage Status in Shenandoah County
69.5% of women with births (495) in Shenandoah County are married. The highest percentage of unmarried women with births falls into 15 to 19 years age bracket with 100.0% of them unmarried at the time of birth, while the lowest percentage of unmarried women with births belong to 35 to 50 years age bracket with 28.3% of them unmarried.
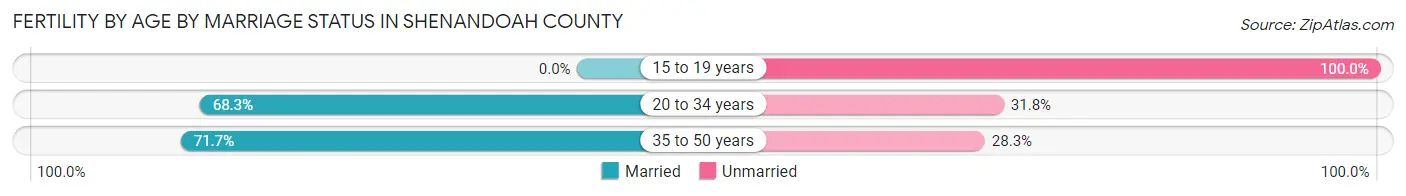
| Age Bracket | Married | Unmarried |
| 15 to 19 years | 0 (0.0%) | 2 (100.0%) |
| 20 to 34 years | 187 (68.2%) | 87 (31.8%) |
| 35 to 50 years | 157 (71.7%) | 62 (28.3%) |
| Total | 344 (69.5%) | 151 (30.5%) |
Fertility by Education in Shenandoah County
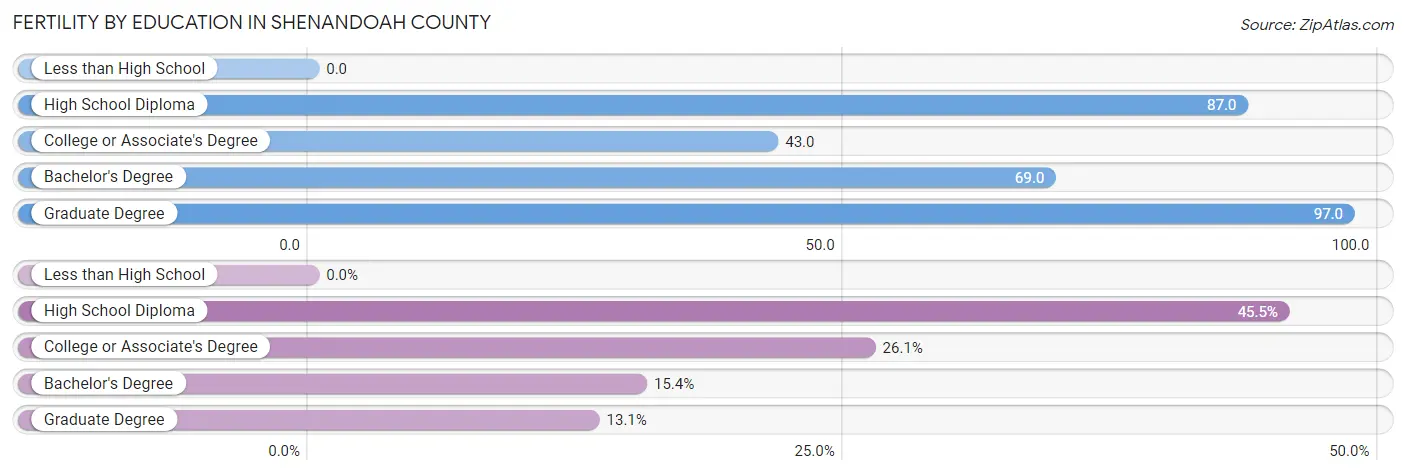
| Educational Attainment | Women with Births | Births / 1,000 Women |
| Less than High School | 0 (0.0%) | 0.0 |
| High School Diploma | 225 (45.5%) | 87.0 |
| College or Associate's Degree | 129 (26.1%) | 43.0 |
| Bachelor's Degree | 76 (15.3%) | 69.0 |
| Graduate Degree | 65 (13.1%) | 97.0 |
| Total | 495 (100.0%) | 55.0 |
Fertility by Education by Marriage Status in Shenandoah County
30.5% of women with births in Shenandoah County are unmarried. Women with the educational attainment of graduate degree are most likely to be married with 100.0% of them married at childbirth, while women with the educational attainment of college or associate's degree are least likely to be married with 48.8% of them unmarried at childbirth.
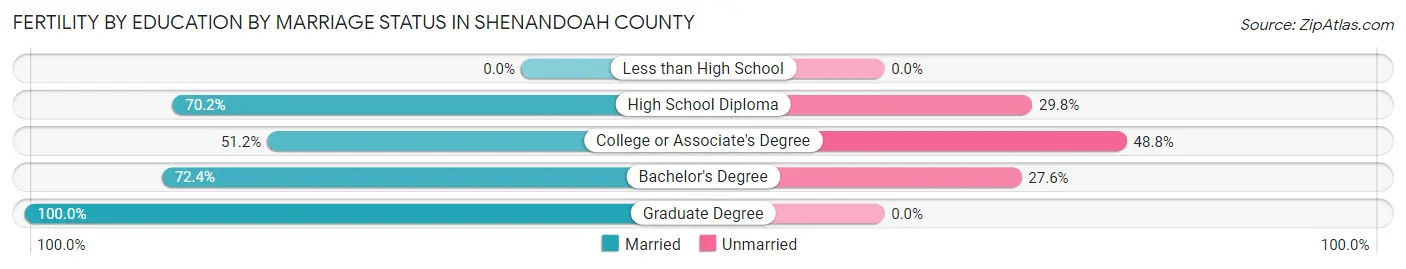
| Educational Attainment | Married | Unmarried |
| Less than High School | 0 (0.0%) | 0 (0.0%) |
| High School Diploma | 158 (70.2%) | 67 (29.8%) |
| College or Associate's Degree | 66 (51.2%) | 63 (48.8%) |
| Bachelor's Degree | 55 (72.4%) | 21 (27.6%) |
| Graduate Degree | 65 (100.0%) | 0 (0.0%) |
| Total | 344 (69.5%) | 151 (30.5%) |
Employment Characteristics in Shenandoah County
Employment by Class of Employer in Shenandoah County
Among the 20,387 employed individuals in Shenandoah County, private company employees (13,764 | 67.5%), local government employees (1,617 | 7.9%), and not-for-profit organizations (1,454 | 7.1%) make up the most common classes of employment.
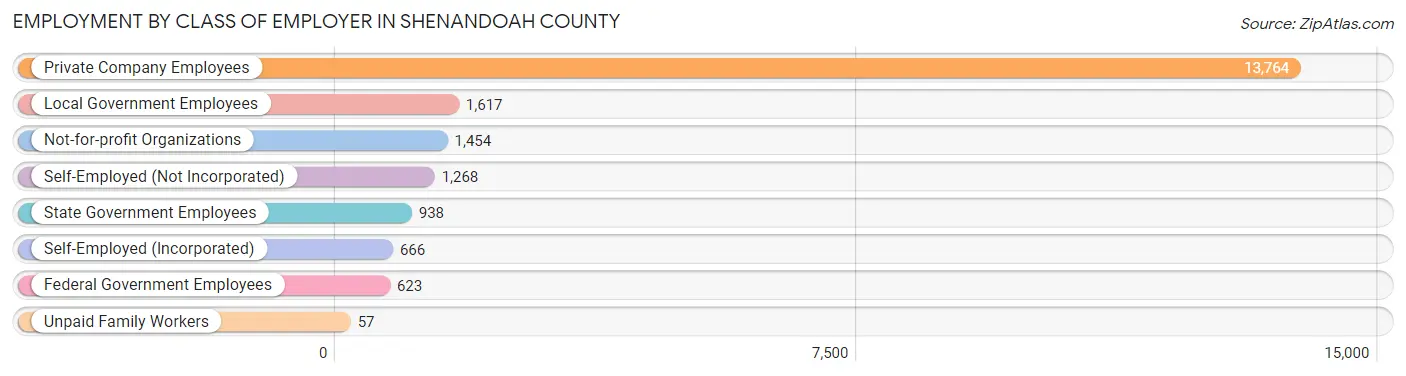
| Employer Class | # Employees | % Employees |
| Private Company Employees | 13,764 | 67.5% |
| Self-Employed (Incorporated) | 666 | 3.3% |
| Self-Employed (Not Incorporated) | 1,268 | 6.2% |
| Not-for-profit Organizations | 1,454 | 7.1% |
| Local Government Employees | 1,617 | 7.9% |
| State Government Employees | 938 | 4.6% |
| Federal Government Employees | 623 | 3.1% |
| Unpaid Family Workers | 57 | 0.3% |
| Total | 20,387 | 100.0% |
Employment Status by Age in Shenandoah County
According to the labor force statistics for Shenandoah County, out of the total population over 16 years of age (36,094), 59.9% or 21,620 individuals are in the labor force, with 4.2% or 908 of them unemployed. The age group with the highest labor force participation rate is 30 to 34 years, with 91.5% or 2,339 individuals in the labor force. Within the labor force, the 16 to 19 years age range has the highest percentage of unemployed individuals, with 13.3% or 144 of them being unemployed.
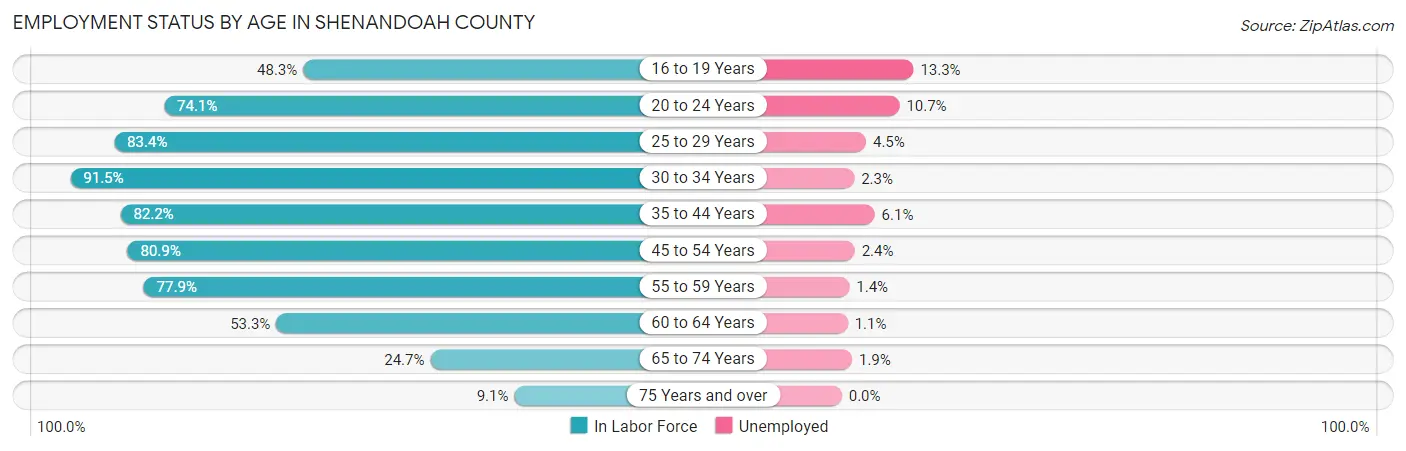
| Age Bracket | In Labor Force | Unemployed |
| 16 to 19 Years | 1,080 (48.3%) | 144 (13.3%) |
| 20 to 24 Years | 1,658 (74.1%) | 177 (10.7%) |
| 25 to 29 Years | 1,977 (83.4%) | 89 (4.5%) |
| 30 to 34 Years | 2,339 (91.5%) | 54 (2.3%) |
| 35 to 44 Years | 4,129 (82.2%) | 252 (6.1%) |
| 45 to 54 Years | 4,501 (80.9%) | 108 (2.4%) |
| 55 to 59 Years | 2,508 (77.9%) | 35 (1.4%) |
| 60 to 64 Years | 1,696 (53.3%) | 19 (1.1%) |
| 65 to 74 Years | 1,338 (24.7%) | 25 (1.9%) |
| 75 Years and over | 390 (9.1%) | 0 (0.0%) |
| Total | 21,620 (59.9%) | 908 (4.2%) |
Employment Status by Educational Attainment in Shenandoah County
According to labor force statistics for Shenandoah County, 78.3% of individuals (17,160) out of the total population between 25 and 64 years of age (21,916) are in the labor force, with 3.2% or 549 of them being unemployed. The group with the highest labor force participation rate are those with the educational attainment of bachelor's degree or higher, with 85.7% or 3,921 individuals in the labor force. Within the labor force, individuals with high school diploma education have the highest percentage of unemployment, with 3.9% or 275 of them being unemployed.
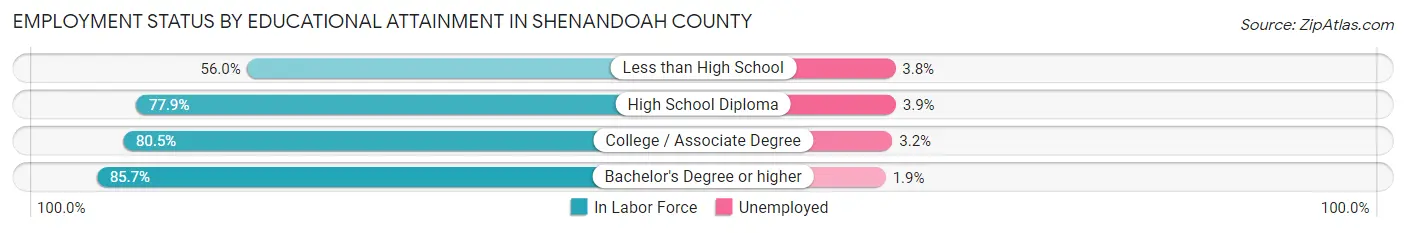
| Educational Attainment | In Labor Force | Unemployed |
| Less than High School | 1,140 (56.0%) | 77 (3.8%) |
| High School Diploma | 7,039 (77.9%) | 352 (3.9%) |
| College / Associate Degree | 5,047 (80.5%) | 201 (3.2%) |
| Bachelor's Degree or higher | 3,921 (85.7%) | 87 (1.9%) |
| Total | 17,160 (78.3%) | 701 (3.2%) |
Employment Occupations by Sex in Shenandoah County
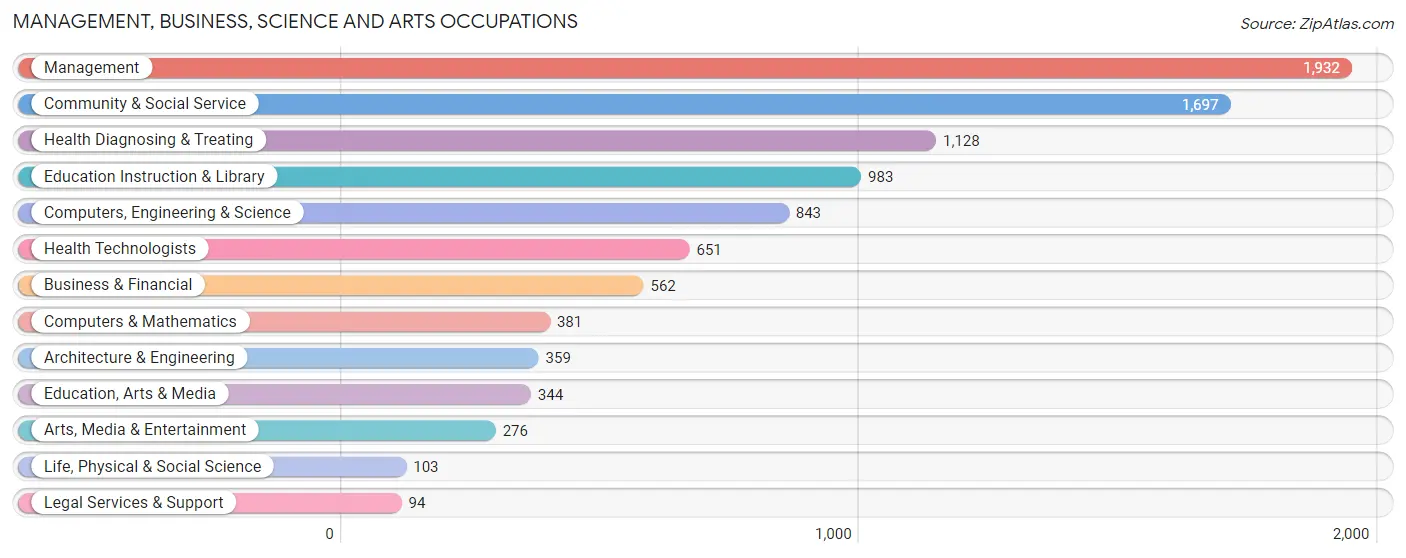
Management, Business, Science and Arts Occupations
The most common Management, Business, Science and Arts occupations in Shenandoah County are Management (1,932 | 9.3%), Community & Social Service (1,697 | 8.2%), Health Diagnosing & Treating (1,128 | 5.5%), Education Instruction & Library (983 | 4.8%), and Computers, Engineering & Science (843 | 4.1%).
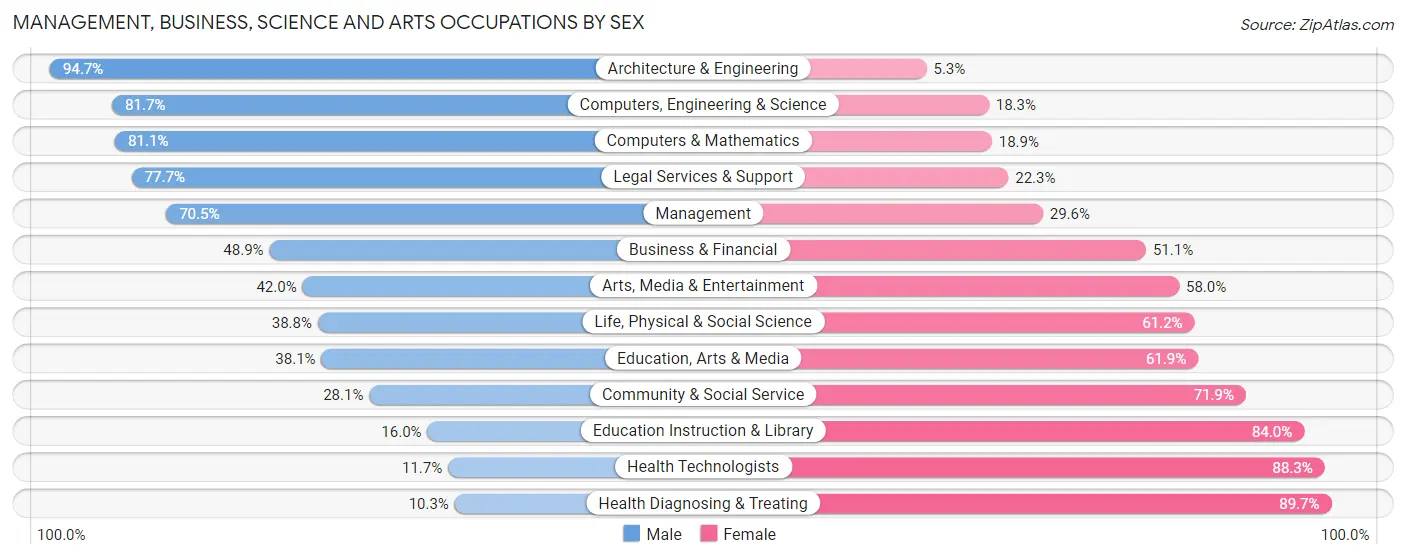
Management, Business, Science and Arts Occupations by Sex
Within the Management, Business, Science and Arts occupations in Shenandoah County, the most male-oriented occupations are Architecture & Engineering (94.7%), Computers, Engineering & Science (81.7%), and Computers & Mathematics (81.1%), while the most female-oriented occupations are Health Diagnosing & Treating (89.7%), Health Technologists (88.3%), and Education Instruction & Library (84.0%).
| Occupation | Male | Female |
| Management | 1,361 (70.5%) | 571 (29.5%) |
| Business & Financial | 275 (48.9%) | 287 (51.1%) |
| Computers, Engineering & Science | 689 (81.7%) | 154 (18.3%) |
| Computers & Mathematics | 309 (81.1%) | 72 (18.9%) |
| Architecture & Engineering | 340 (94.7%) | 19 (5.3%) |
| Life, Physical & Social Science | 40 (38.8%) | 63 (61.2%) |
| Community & Social Service | 477 (28.1%) | 1,220 (71.9%) |
| Education, Arts & Media | 131 (38.1%) | 213 (61.9%) |
| Legal Services & Support | 73 (77.7%) | 21 (22.3%) |
| Education Instruction & Library | 157 (16.0%) | 826 (84.0%) |
| Arts, Media & Entertainment | 116 (42.0%) | 160 (58.0%) |
| Health Diagnosing & Treating | 116 (10.3%) | 1,012 (89.7%) |
| Health Technologists | 76 (11.7%) | 575 (88.3%) |
| Total (Category) | 2,918 (47.3%) | 3,244 (52.6%) |
| Total (Overall) | 10,902 (52.7%) | 9,768 (47.3%) |
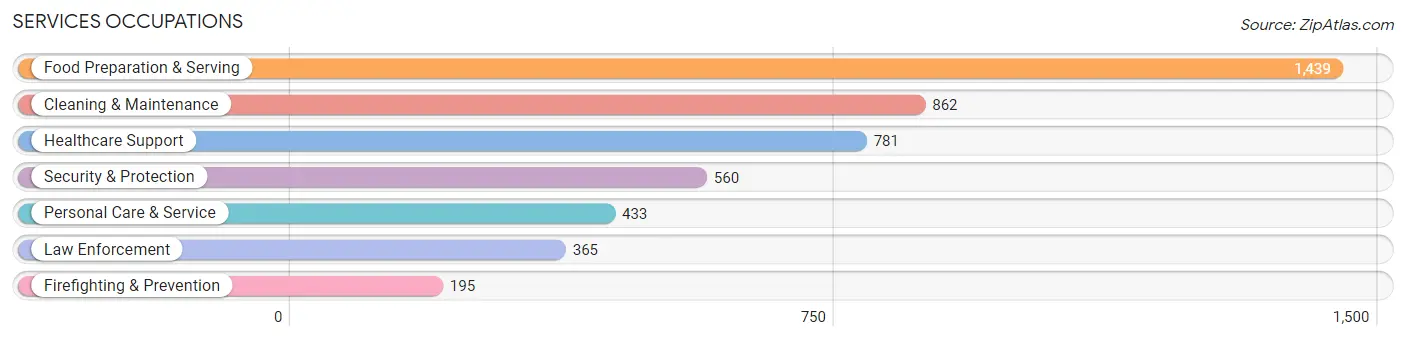
Services Occupations
The most common Services occupations in Shenandoah County are Food Preparation & Serving (1,439 | 7.0%), Cleaning & Maintenance (862 | 4.2%), Healthcare Support (781 | 3.8%), Security & Protection (560 | 2.7%), and Personal Care & Service (433 | 2.1%).
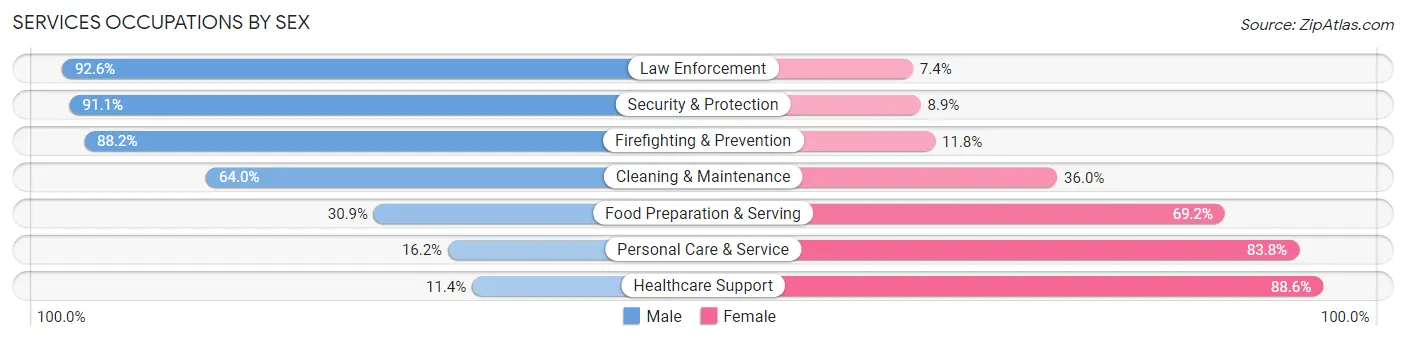
Services Occupations by Sex
Within the Services occupations in Shenandoah County, the most male-oriented occupations are Law Enforcement (92.6%), Security & Protection (91.1%), and Firefighting & Prevention (88.2%), while the most female-oriented occupations are Healthcare Support (88.6%), Personal Care & Service (83.8%), and Food Preparation & Serving (69.2%).
| Occupation | Male | Female |
| Healthcare Support | 89 (11.4%) | 692 (88.6%) |
| Security & Protection | 510 (91.1%) | 50 (8.9%) |
| Firefighting & Prevention | 172 (88.2%) | 23 (11.8%) |
| Law Enforcement | 338 (92.6%) | 27 (7.4%) |
| Food Preparation & Serving | 444 (30.8%) | 995 (69.2%) |
| Cleaning & Maintenance | 552 (64.0%) | 310 (36.0%) |
| Personal Care & Service | 70 (16.2%) | 363 (83.8%) |
| Total (Category) | 1,665 (40.9%) | 2,410 (59.1%) |
| Total (Overall) | 10,902 (52.7%) | 9,768 (47.3%) |
Sales and Office Occupations
The most common Sales and Office occupations in Shenandoah County are Office & Administration (2,471 | 11.9%), and Sales & Related (1,795 | 8.7%).
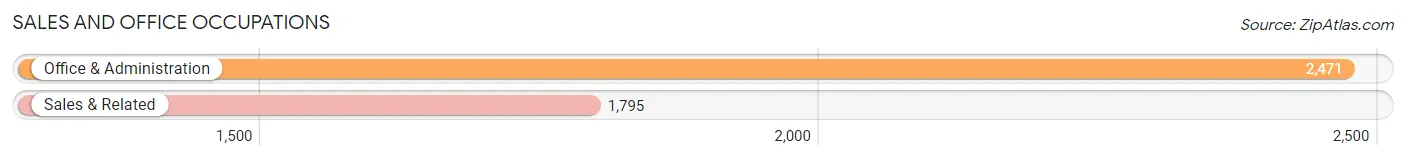
Sales and Office Occupations by Sex

| Occupation | Male | Female |
| Sales & Related | 901 (50.2%) | 894 (49.8%) |
| Office & Administration | 479 (19.4%) | 1,992 (80.6%) |
| Total (Category) | 1,380 (32.4%) | 2,886 (67.6%) |
| Total (Overall) | 10,902 (52.7%) | 9,768 (47.3%) |
Natural Resources, Construction and Maintenance Occupations
The most common Natural Resources, Construction and Maintenance occupations in Shenandoah County are Construction & Extraction (1,230 | 5.9%), Installation, Maintenance & Repair (926 | 4.5%), and Farming, Fishing & Forestry (322 | 1.6%).

Natural Resources, Construction and Maintenance Occupations by Sex
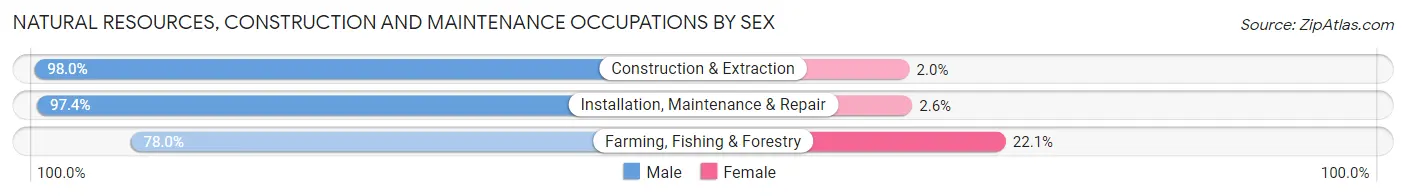
| Occupation | Male | Female |
| Farming, Fishing & Forestry | 251 (77.9%) | 71 (22.1%) |
| Construction & Extraction | 1,205 (98.0%) | 25 (2.0%) |
| Installation, Maintenance & Repair | 902 (97.4%) | 24 (2.6%) |
| Total (Category) | 2,358 (95.2%) | 120 (4.8%) |
| Total (Overall) | 10,902 (52.7%) | 9,768 (47.3%) |
Production, Transportation and Moving Occupations
The most common Production, Transportation and Moving occupations in Shenandoah County are Production (1,842 | 8.9%), Material Moving (1,088 | 5.3%), and Transportation (759 | 3.7%).
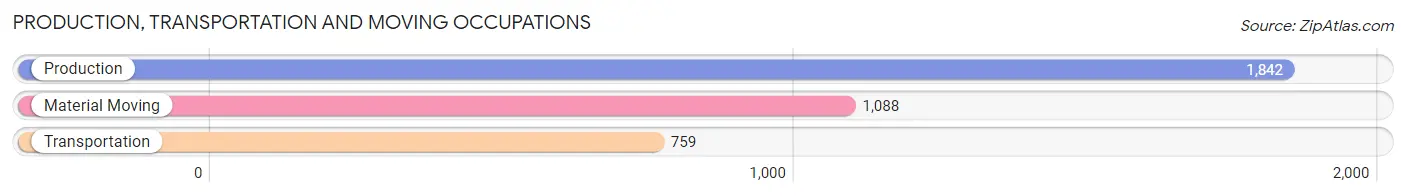
Production, Transportation and Moving Occupations by Sex
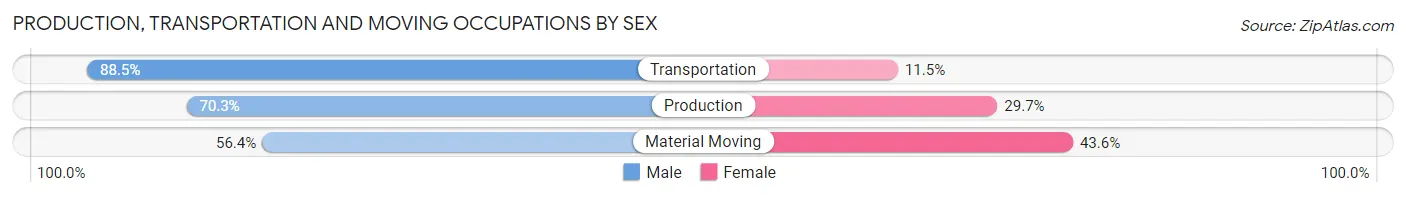
| Occupation | Male | Female |
| Production | 1,295 (70.3%) | 547 (29.7%) |
| Transportation | 672 (88.5%) | 87 (11.5%) |
| Material Moving | 614 (56.4%) | 474 (43.6%) |
| Total (Category) | 2,581 (70.0%) | 1,108 (30.0%) |
| Total (Overall) | 10,902 (52.7%) | 9,768 (47.3%) |
Employment Industries by Sex in Shenandoah County
Employment Industries in Shenandoah County
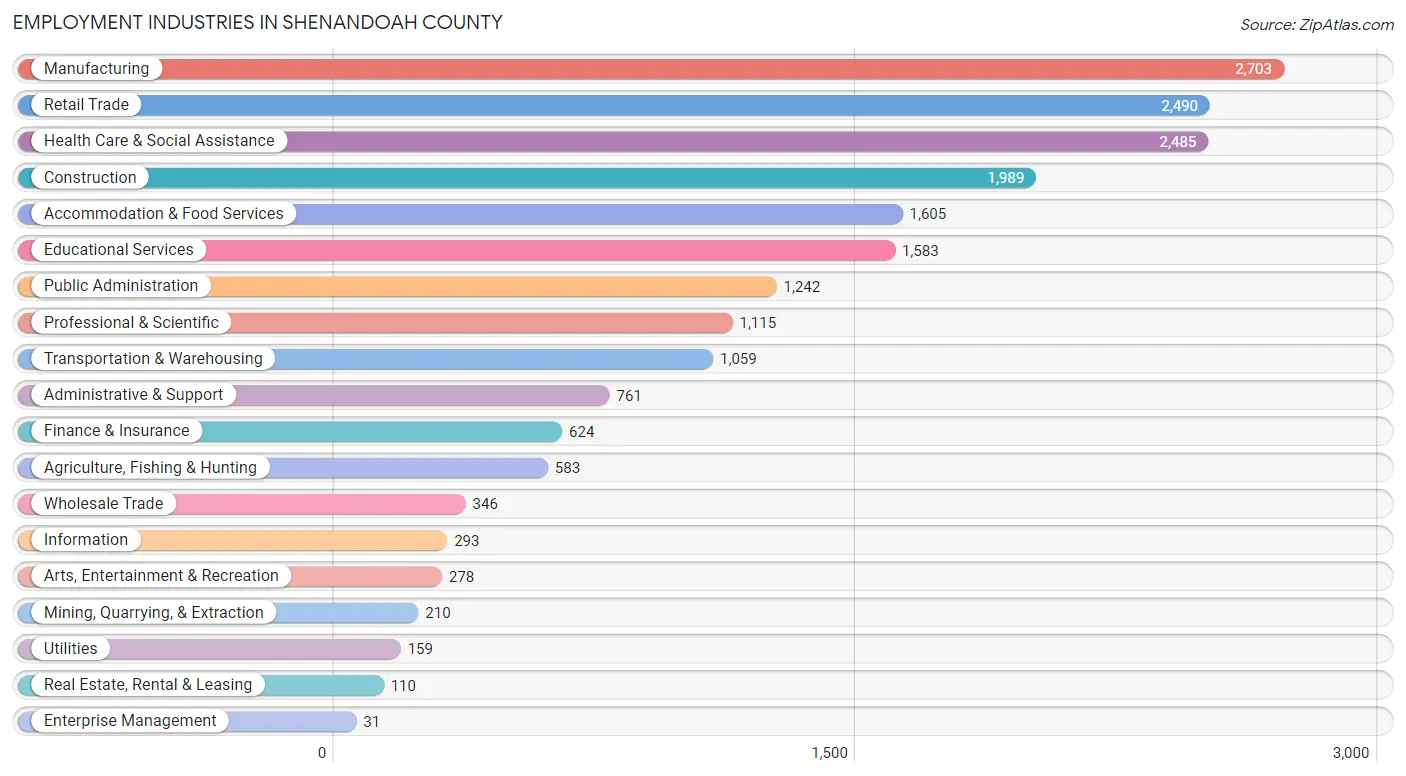
The major employment industries in Shenandoah County include Manufacturing (2,703 | 13.1%), Retail Trade (2,490 | 12.0%), Health Care & Social Assistance (2,485 | 12.0%), Construction (1,989 | 9.6%), and Accommodation & Food Services (1,605 | 7.8%).
Employment Industries by Sex in Shenandoah County
The Shenandoah County industries that see more men than women are Mining, Quarrying, & Extraction (100.0%), Construction (95.8%), and Utilities (91.8%), whereas the industries that tend to have a higher number of women are Enterprise Management (100.0%), Health Care & Social Assistance (86.8%), and Finance & Insurance (83.3%).
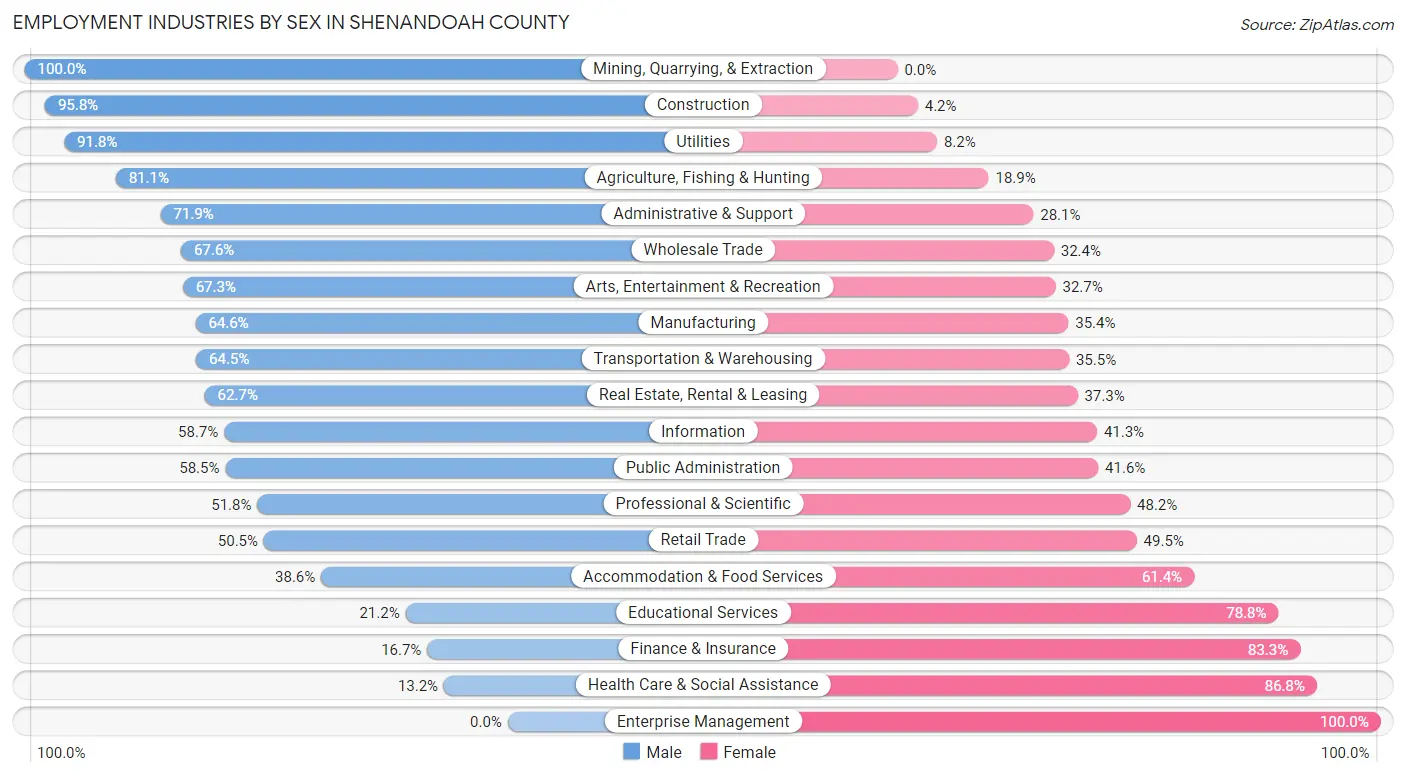
| Industry | Male | Female |
| Agriculture, Fishing & Hunting | 473 (81.1%) | 110 (18.9%) |
| Mining, Quarrying, & Extraction | 210 (100.0%) | 0 (0.0%) |
| Construction | 1,905 (95.8%) | 84 (4.2%) |
| Manufacturing | 1,747 (64.6%) | 956 (35.4%) |
| Wholesale Trade | 234 (67.6%) | 112 (32.4%) |
| Retail Trade | 1,257 (50.5%) | 1,233 (49.5%) |
| Transportation & Warehousing | 683 (64.5%) | 376 (35.5%) |
| Utilities | 146 (91.8%) | 13 (8.2%) |
| Information | 172 (58.7%) | 121 (41.3%) |
| Finance & Insurance | 104 (16.7%) | 520 (83.3%) |
| Real Estate, Rental & Leasing | 69 (62.7%) | 41 (37.3%) |
| Professional & Scientific | 578 (51.8%) | 537 (48.2%) |
| Enterprise Management | 0 (0.0%) | 31 (100.0%) |
| Administrative & Support | 547 (71.9%) | 214 (28.1%) |
| Educational Services | 335 (21.2%) | 1,248 (78.8%) |
| Health Care & Social Assistance | 328 (13.2%) | 2,157 (86.8%) |
| Arts, Entertainment & Recreation | 187 (67.3%) | 91 (32.7%) |
| Accommodation & Food Services | 620 (38.6%) | 985 (61.4%) |
| Public Administration | 726 (58.5%) | 516 (41.5%) |
| Total | 10,902 (52.7%) | 9,768 (47.3%) |
Education in Shenandoah County
School Enrollment in Shenandoah County
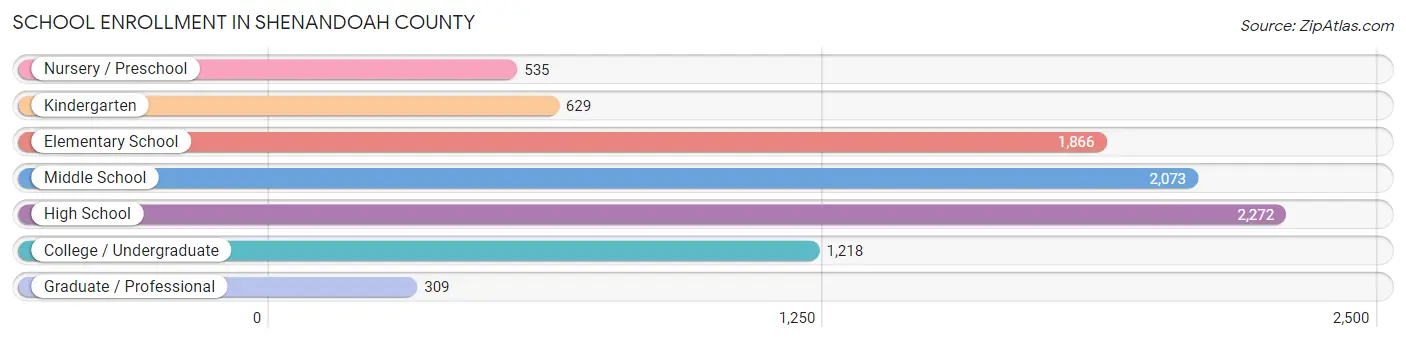
The most common levels of schooling among the 8,902 students in Shenandoah County are high school (2,272 | 25.5%), middle school (2,073 | 23.3%), and elementary school (1,866 | 21.0%).
| School Level | # Students | % Students |
| Nursery / Preschool | 535 | 6.0% |
| Kindergarten | 629 | 7.1% |
| Elementary School | 1,866 | 21.0% |
| Middle School | 2,073 | 23.3% |
| High School | 2,272 | 25.5% |
| College / Undergraduate | 1,218 | 13.7% |
| Graduate / Professional | 309 | 3.5% |
| Total | 8,902 | 100.0% |
School Enrollment by Age by Funding Source in Shenandoah County
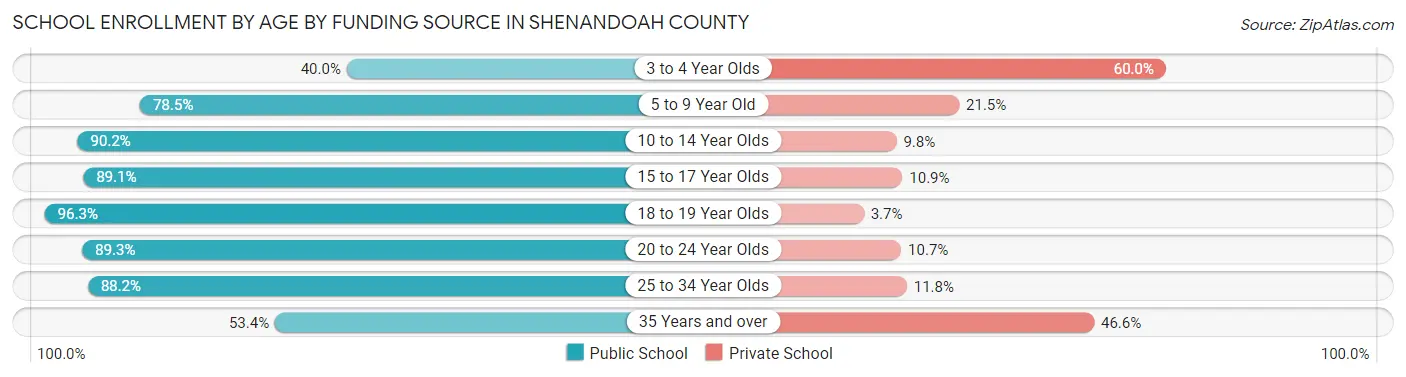
Out of a total of 8,902 students who are enrolled in schools in Shenandoah County, 1,531 (17.2%) attend a private institution, while the remaining 7,371 (82.8%) are enrolled in public schools. The age group of 3 to 4 year olds has the highest likelihood of being enrolled in private schools, with 213 (60.0% in the age bracket) enrolled. Conversely, the age group of 18 to 19 year olds has the lowest likelihood of being enrolled in a private school, with 594 (96.3% in the age bracket) attending a public institution.
| Age Bracket | Public School | Private School |
| 3 to 4 Year Olds | 142 (40.0%) | 213 (60.0%) |
| 5 to 9 Year Old | 1,910 (78.5%) | 523 (21.5%) |
| 10 to 14 Year Olds | 2,290 (90.2%) | 250 (9.8%) |
| 15 to 17 Year Olds | 1,572 (89.1%) | 193 (10.9%) |
| 18 to 19 Year Olds | 594 (96.3%) | 23 (3.7%) |
| 20 to 24 Year Olds | 392 (89.3%) | 47 (10.7%) |
| 25 to 34 Year Olds | 165 (88.2%) | 22 (11.8%) |
| 35 Years and over | 302 (53.4%) | 264 (46.6%) |
| Total | 7,371 (82.8%) | 1,531 (17.2%) |
Educational Attainment by Field of Study in Shenandoah County
Business (1,012 | 14.6%), education (954 | 13.8%), science & technology (744 | 10.7%), arts & humanities (673 | 9.7%), and bio, nature & agricultural (599 | 8.6%) are the most common fields of study among 6,927 individuals in Shenandoah County who have obtained a bachelor's degree or higher.
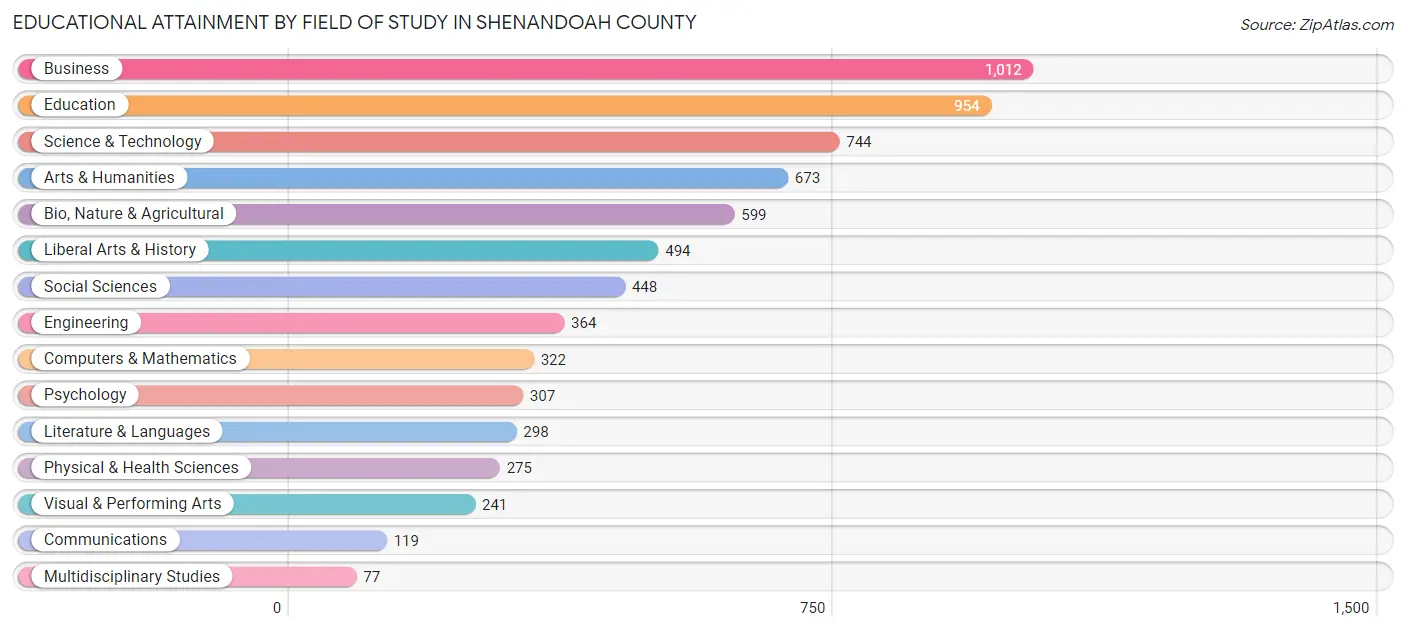
| Field of Study | # Graduates | % Graduates |
| Computers & Mathematics | 322 | 4.6% |
| Bio, Nature & Agricultural | 599 | 8.6% |
| Physical & Health Sciences | 275 | 4.0% |
| Psychology | 307 | 4.4% |
| Social Sciences | 448 | 6.5% |
| Engineering | 364 | 5.2% |
| Multidisciplinary Studies | 77 | 1.1% |
| Science & Technology | 744 | 10.7% |
| Business | 1,012 | 14.6% |
| Education | 954 | 13.8% |
| Literature & Languages | 298 | 4.3% |
| Liberal Arts & History | 494 | 7.1% |
| Visual & Performing Arts | 241 | 3.5% |
| Communications | 119 | 1.7% |
| Arts & Humanities | 673 | 9.7% |
| Total | 6,927 | 100.0% |
Transportation & Commute in Shenandoah County
Vehicle Availability by Sex in Shenandoah County
The most prevalent vehicle ownership categories in Shenandoah County are males with 2 vehicles (3,760, accounting for 34.9%) and females with 2 vehicles (3,551, making up 39.2%).
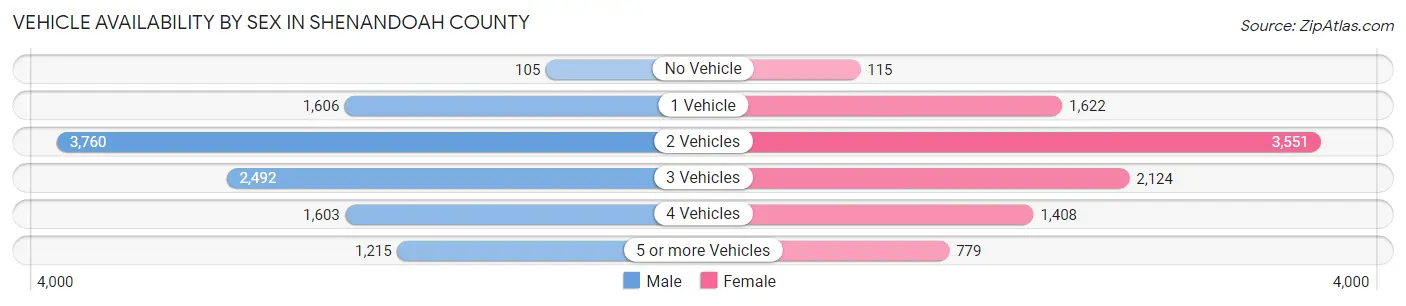
| Vehicles Available | Male | Female |
| No Vehicle | 105 (1.0%) | 115 (1.2%) |
| 1 Vehicle | 1,606 (14.9%) | 1,622 (16.9%) |
| 2 Vehicles | 3,760 (34.9%) | 3,551 (37.0%) |
| 3 Vehicles | 2,492 (23.1%) | 2,124 (22.1%) |
| 4 Vehicles | 1,603 (14.9%) | 1,408 (14.7%) |
| 5 or more Vehicles | 1,215 (11.3%) | 779 (8.1%) |
| Total | 10,781 (100.0%) | 9,599 (100.0%) |
Commute Time in Shenandoah County
The most frequently occuring commute durations in Shenandoah County are 15 to 19 minutes (2,996 commuters, 15.9%), 30 to 34 minutes (2,573 commuters, 13.6%), and 20 to 24 minutes (2,164 commuters, 11.5%).
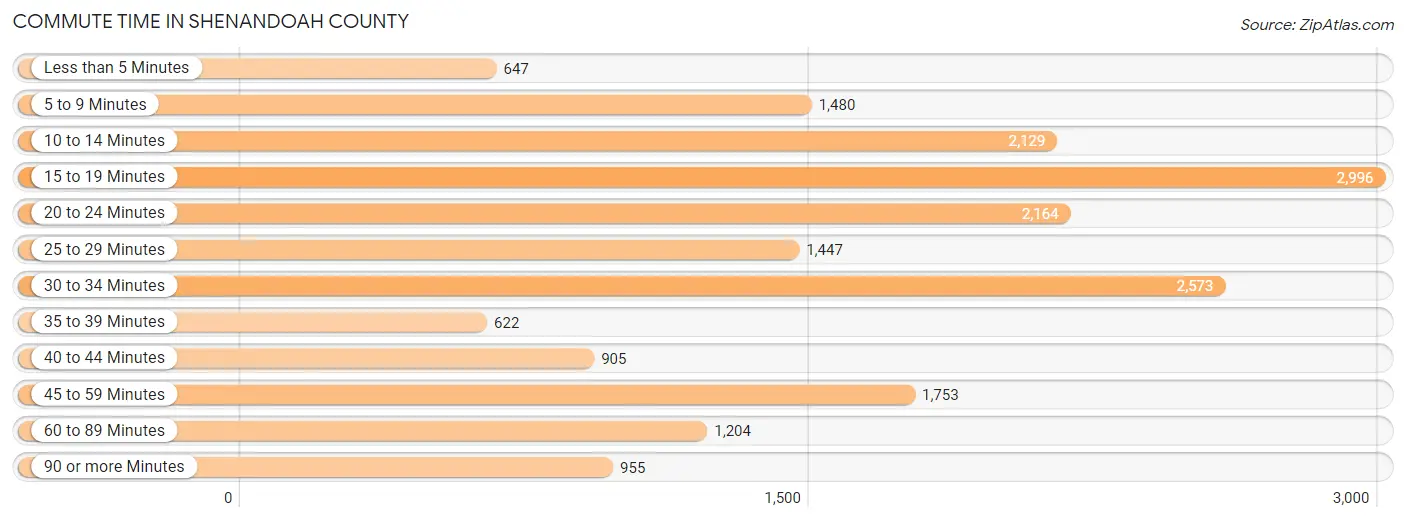
| Commute Time | # Commuters | % Commuters |
| Less than 5 Minutes | 647 | 3.4% |
| 5 to 9 Minutes | 1,480 | 7.8% |
| 10 to 14 Minutes | 2,129 | 11.3% |
| 15 to 19 Minutes | 2,996 | 15.9% |
| 20 to 24 Minutes | 2,164 | 11.5% |
| 25 to 29 Minutes | 1,447 | 7.7% |
| 30 to 34 Minutes | 2,573 | 13.6% |
| 35 to 39 Minutes | 622 | 3.3% |
| 40 to 44 Minutes | 905 | 4.8% |
| 45 to 59 Minutes | 1,753 | 9.3% |
| 60 to 89 Minutes | 1,204 | 6.4% |
| 90 or more Minutes | 955 | 5.1% |
Commute Time by Sex in Shenandoah County
The most common commute times in Shenandoah County are 15 to 19 minutes (1,501 commuters, 14.6%) for males and 15 to 19 minutes (1,495 commuters, 17.4%) for females.
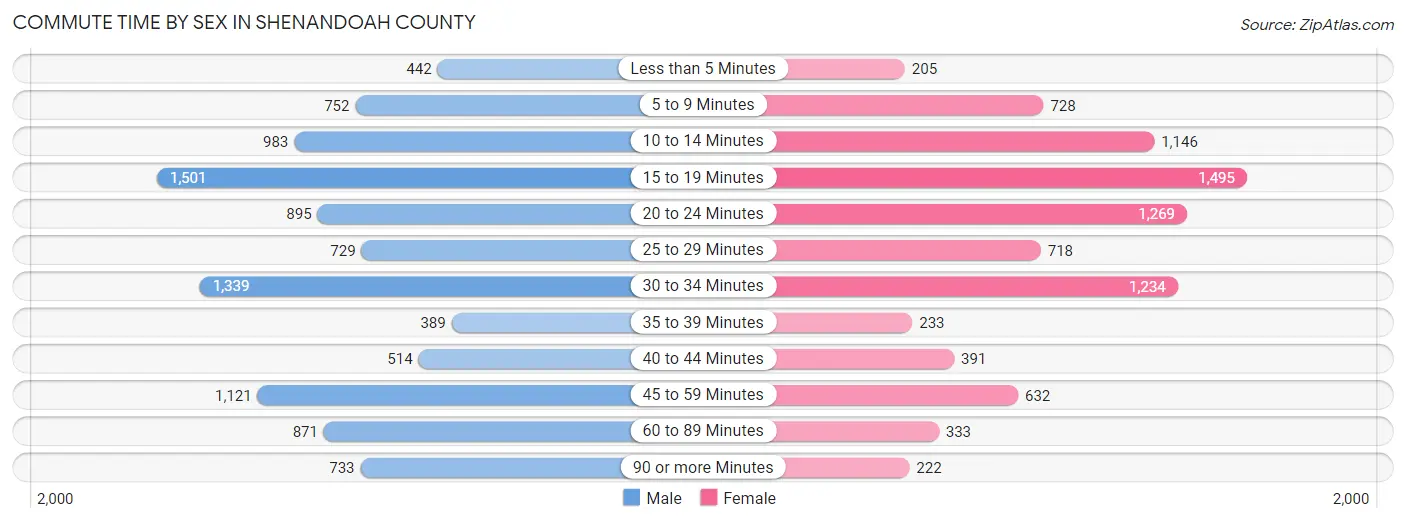
| Commute Time | Male | Female |
| Less than 5 Minutes | 442 (4.3%) | 205 (2.4%) |
| 5 to 9 Minutes | 752 (7.3%) | 728 (8.5%) |
| 10 to 14 Minutes | 983 (9.6%) | 1,146 (13.3%) |
| 15 to 19 Minutes | 1,501 (14.6%) | 1,495 (17.4%) |
| 20 to 24 Minutes | 895 (8.7%) | 1,269 (14.7%) |
| 25 to 29 Minutes | 729 (7.1%) | 718 (8.3%) |
| 30 to 34 Minutes | 1,339 (13.0%) | 1,234 (14.3%) |
| 35 to 39 Minutes | 389 (3.8%) | 233 (2.7%) |
| 40 to 44 Minutes | 514 (5.0%) | 391 (4.5%) |
| 45 to 59 Minutes | 1,121 (10.9%) | 632 (7.3%) |
| 60 to 89 Minutes | 871 (8.5%) | 333 (3.9%) |
| 90 or more Minutes | 733 (7.1%) | 222 (2.6%) |
Time of Departure to Work by Sex in Shenandoah County
The most frequent times of departure to work in Shenandoah County are 7:00 AM to 7:29 AM (1,281, 12.5%) for males and 7:00 AM to 7:29 AM (1,600, 18.6%) for females.
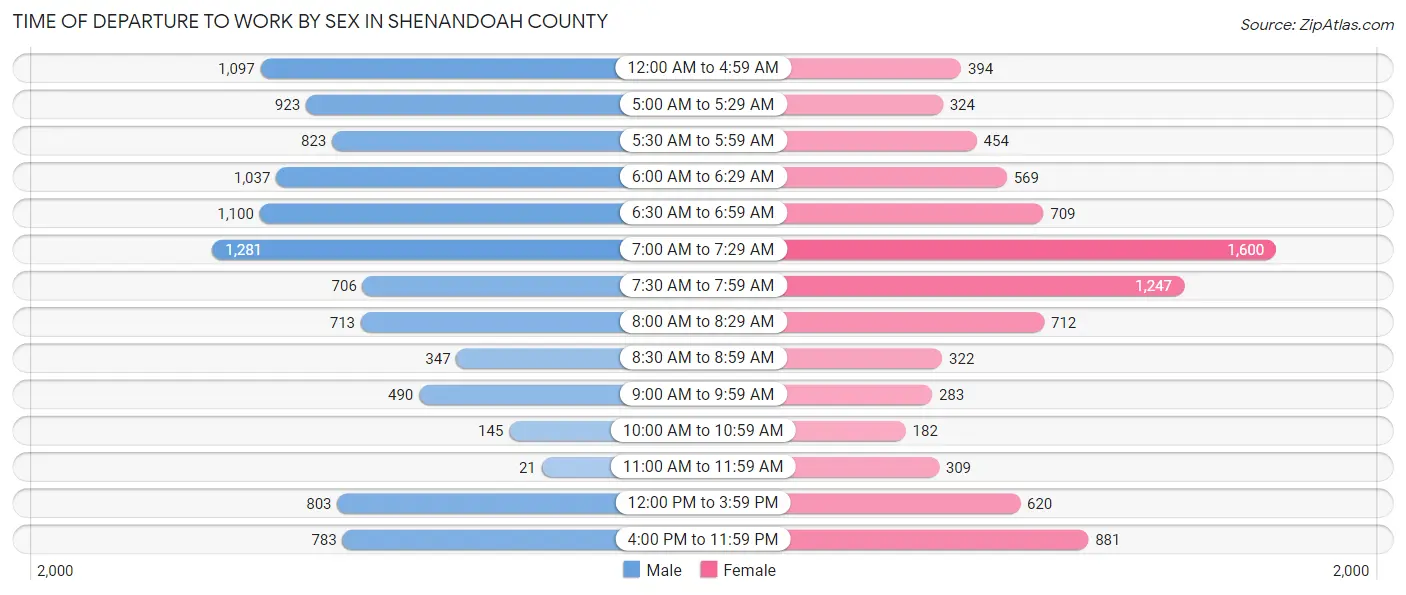
| Time of Departure | Male | Female |
| 12:00 AM to 4:59 AM | 1,097 (10.7%) | 394 (4.6%) |
| 5:00 AM to 5:29 AM | 923 (9.0%) | 324 (3.8%) |
| 5:30 AM to 5:59 AM | 823 (8.0%) | 454 (5.3%) |
| 6:00 AM to 6:29 AM | 1,037 (10.1%) | 569 (6.6%) |
| 6:30 AM to 6:59 AM | 1,100 (10.7%) | 709 (8.2%) |
| 7:00 AM to 7:29 AM | 1,281 (12.5%) | 1,600 (18.6%) |
| 7:30 AM to 7:59 AM | 706 (6.9%) | 1,247 (14.5%) |
| 8:00 AM to 8:29 AM | 713 (6.9%) | 712 (8.3%) |
| 8:30 AM to 8:59 AM | 347 (3.4%) | 322 (3.7%) |
| 9:00 AM to 9:59 AM | 490 (4.8%) | 283 (3.3%) |
| 10:00 AM to 10:59 AM | 145 (1.4%) | 182 (2.1%) |
| 11:00 AM to 11:59 AM | 21 (0.2%) | 309 (3.6%) |
| 12:00 PM to 3:59 PM | 803 (7.8%) | 620 (7.2%) |
| 4:00 PM to 11:59 PM | 783 (7.6%) | 881 (10.2%) |
| Total | 10,269 (100.0%) | 8,606 (100.0%) |
Housing Occupancy in Shenandoah County
Occupancy by Ownership in Shenandoah County
Of the total 17,542 dwellings in Shenandoah County, owner-occupied units account for 12,765 (72.8%), while renter-occupied units make up 4,777 (27.2%).
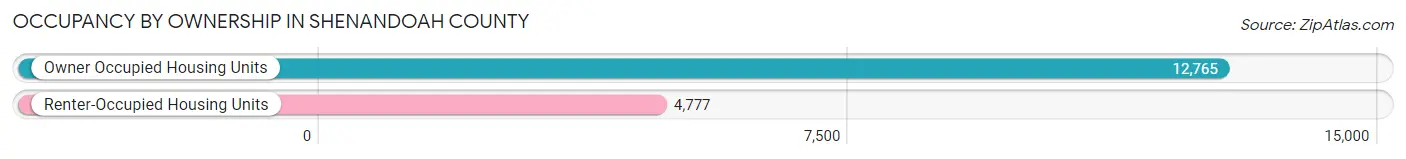
| Occupancy | # Housing Units | % Housing Units |
| Owner Occupied Housing Units | 12,765 | 72.8% |
| Renter-Occupied Housing Units | 4,777 | 27.2% |
| Total Occupied Housing Units | 17,542 | 100.0% |
Occupancy by Household Size in Shenandoah County
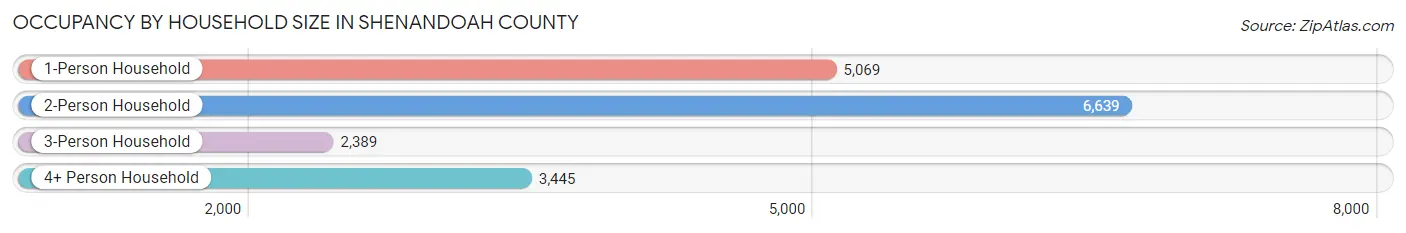
| Household Size | # Housing Units | % Housing Units |
| 1-Person Household | 5,069 | 28.9% |
| 2-Person Household | 6,639 | 37.9% |
| 3-Person Household | 2,389 | 13.6% |
| 4+ Person Household | 3,445 | 19.6% |
| Total Housing Units | 17,542 | 100.0% |
Occupancy by Ownership by Household Size in Shenandoah County
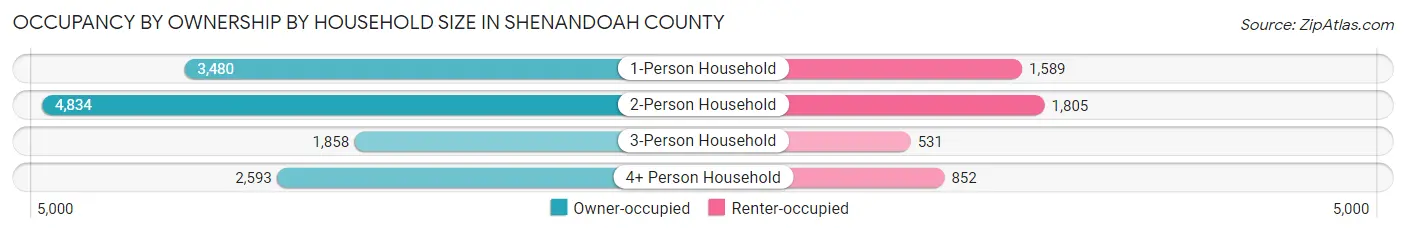
| Household Size | Owner-occupied | Renter-occupied |
| 1-Person Household | 3,480 (68.6%) | 1,589 (31.4%) |
| 2-Person Household | 4,834 (72.8%) | 1,805 (27.2%) |
| 3-Person Household | 1,858 (77.8%) | 531 (22.2%) |
| 4+ Person Household | 2,593 (75.3%) | 852 (24.7%) |
| Total Housing Units | 12,765 (72.8%) | 4,777 (27.2%) |
Occupancy by Educational Attainment in Shenandoah County
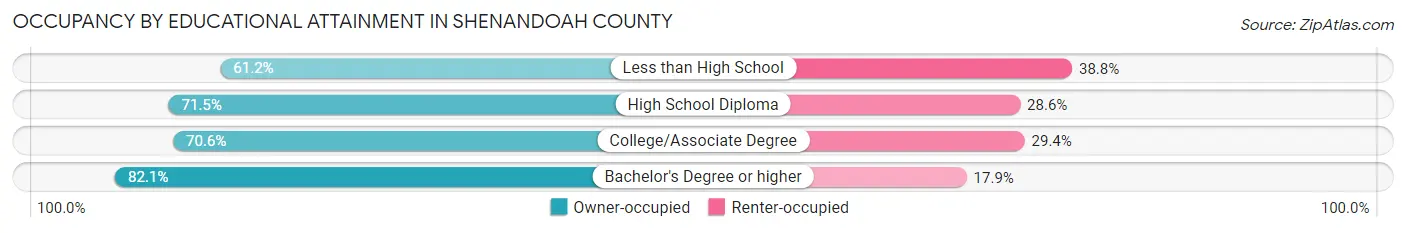
| Household Size | Owner-occupied | Renter-occupied |
| Less than High School | 928 (61.2%) | 589 (38.8%) |
| High School Diploma | 4,781 (71.5%) | 1,910 (28.5%) |
| College/Associate Degree | 3,707 (70.6%) | 1,546 (29.4%) |
| Bachelor's Degree or higher | 3,349 (82.1%) | 732 (17.9%) |
Occupancy by Age of Householder in Shenandoah County
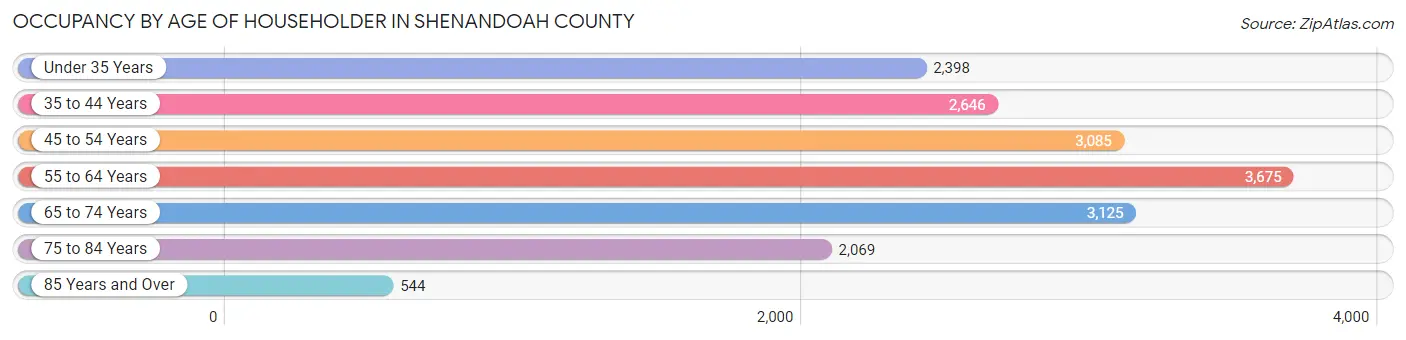
| Age Bracket | # Households | % Households |
| Under 35 Years | 2,398 | 13.7% |
| 35 to 44 Years | 2,646 | 15.1% |
| 45 to 54 Years | 3,085 | 17.6% |
| 55 to 64 Years | 3,675 | 20.9% |
| 65 to 74 Years | 3,125 | 17.8% |
| 75 to 84 Years | 2,069 | 11.8% |
| 85 Years and Over | 544 | 3.1% |
| Total | 17,542 | 100.0% |
Housing Finances in Shenandoah County
Median Income by Occupancy in Shenandoah County
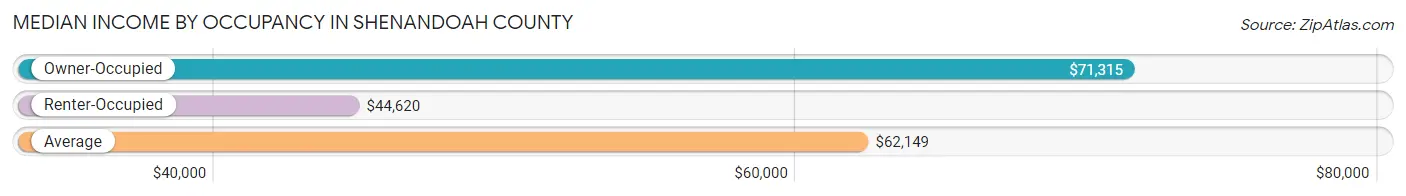
| Occupancy Type | # Households | Median Income |
| Owner-Occupied | 12,765 (72.8%) | $71,315 |
| Renter-Occupied | 4,777 (27.2%) | $44,620 |
| Average | 17,542 (100.0%) | $62,149 |
Occupancy by Householder Income Bracket in Shenandoah County
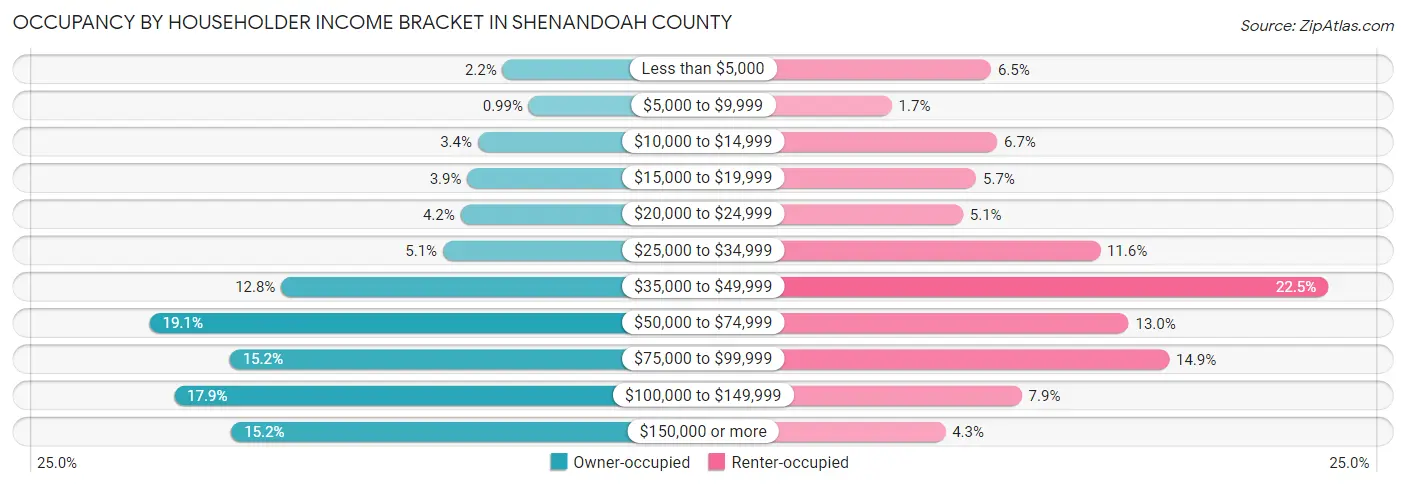
| Income Bracket | Owner-occupied | Renter-occupied |
| Less than $5,000 | 286 (2.2%) | 308 (6.5%) |
| $5,000 to $9,999 | 127 (1.0%) | 82 (1.7%) |
| $10,000 to $14,999 | 437 (3.4%) | 322 (6.7%) |
| $15,000 to $19,999 | 500 (3.9%) | 274 (5.7%) |
| $20,000 to $24,999 | 541 (4.2%) | 244 (5.1%) |
| $25,000 to $34,999 | 649 (5.1%) | 556 (11.6%) |
| $35,000 to $49,999 | 1,632 (12.8%) | 1,075 (22.5%) |
| $50,000 to $74,999 | 2,432 (19.1%) | 621 (13.0%) |
| $75,000 to $99,999 | 1,944 (15.2%) | 713 (14.9%) |
| $100,000 to $149,999 | 2,282 (17.9%) | 378 (7.9%) |
| $150,000 or more | 1,935 (15.2%) | 204 (4.3%) |
| Total | 12,765 (100.0%) | 4,777 (100.0%) |
Monthly Housing Cost Tiers in Shenandoah County
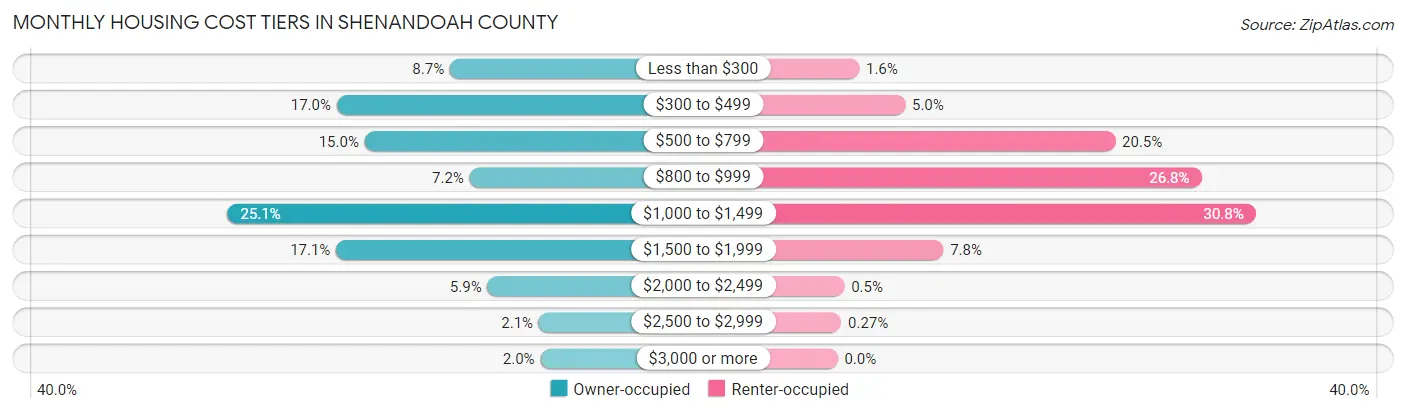
| Monthly Cost | Owner-occupied | Renter-occupied |
| Less than $300 | 1,107 (8.7%) | 76 (1.6%) |
| $300 to $499 | 2,171 (17.0%) | 238 (5.0%) |
| $500 to $799 | 1,908 (14.9%) | 977 (20.4%) |
| $800 to $999 | 922 (7.2%) | 1,280 (26.8%) |
| $1,000 to $1,499 | 3,199 (25.1%) | 1,471 (30.8%) |
| $1,500 to $1,999 | 2,176 (17.1%) | 372 (7.8%) |
| $2,000 to $2,499 | 755 (5.9%) | 24 (0.5%) |
| $2,500 to $2,999 | 270 (2.1%) | 13 (0.3%) |
| $3,000 or more | 257 (2.0%) | 0 (0.0%) |
| Total | 12,765 (100.0%) | 4,777 (100.0%) |
Physical Housing Characteristics in Shenandoah County
Housing Structures in Shenandoah County
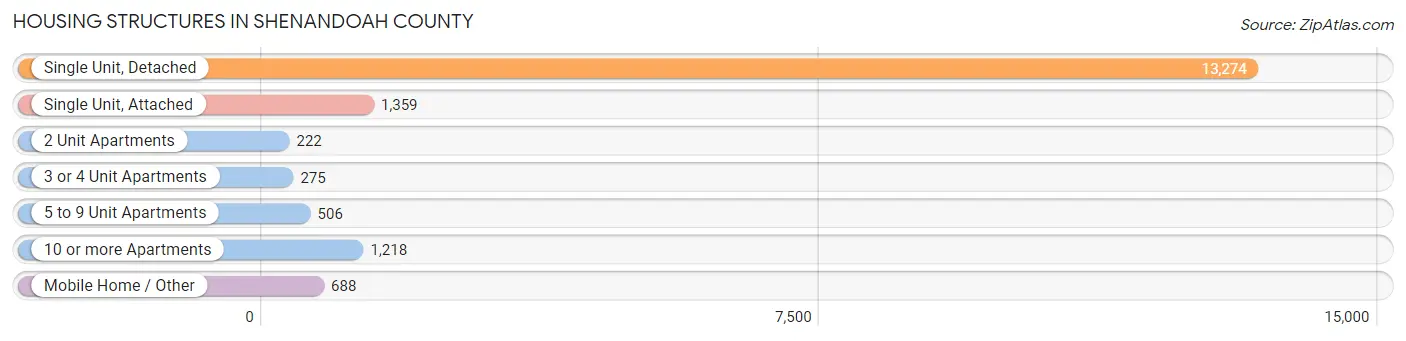
| Structure Type | # Housing Units | % Housing Units |
| Single Unit, Detached | 13,274 | 75.7% |
| Single Unit, Attached | 1,359 | 7.7% |
| 2 Unit Apartments | 222 | 1.3% |
| 3 or 4 Unit Apartments | 275 | 1.6% |
| 5 to 9 Unit Apartments | 506 | 2.9% |
| 10 or more Apartments | 1,218 | 6.9% |
| Mobile Home / Other | 688 | 3.9% |
| Total | 17,542 | 100.0% |
Housing Structures by Occupancy in Shenandoah County
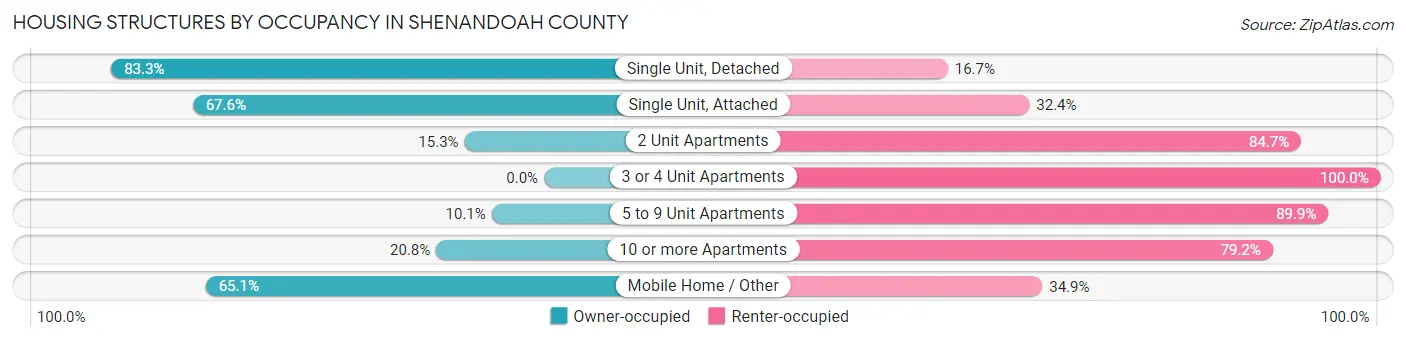
| Structure Type | Owner-occupied | Renter-occupied |
| Single Unit, Detached | 11,060 (83.3%) | 2,214 (16.7%) |
| Single Unit, Attached | 919 (67.6%) | 440 (32.4%) |
| 2 Unit Apartments | 34 (15.3%) | 188 (84.7%) |
| 3 or 4 Unit Apartments | 0 (0.0%) | 275 (100.0%) |
| 5 to 9 Unit Apartments | 51 (10.1%) | 455 (89.9%) |
| 10 or more Apartments | 253 (20.8%) | 965 (79.2%) |
| Mobile Home / Other | 448 (65.1%) | 240 (34.9%) |
| Total | 12,765 (72.8%) | 4,777 (27.2%) |
Housing Structures by Number of Rooms in Shenandoah County
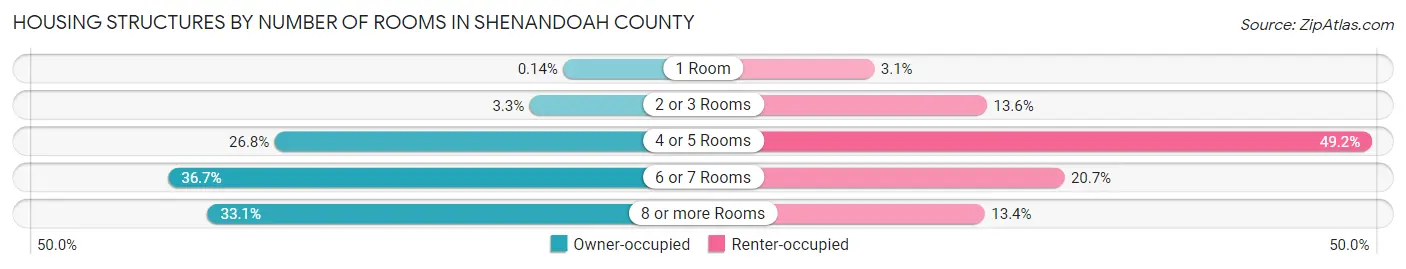
| Number of Rooms | Owner-occupied | Renter-occupied |
| 1 Room | 18 (0.1%) | 150 (3.1%) |
| 2 or 3 Rooms | 415 (3.3%) | 648 (13.6%) |
| 4 or 5 Rooms | 3,425 (26.8%) | 2,351 (49.2%) |
| 6 or 7 Rooms | 4,686 (36.7%) | 990 (20.7%) |
| 8 or more Rooms | 4,221 (33.1%) | 638 (13.4%) |
| Total | 12,765 (100.0%) | 4,777 (100.0%) |
Housing Structure by Heating Type in Shenandoah County
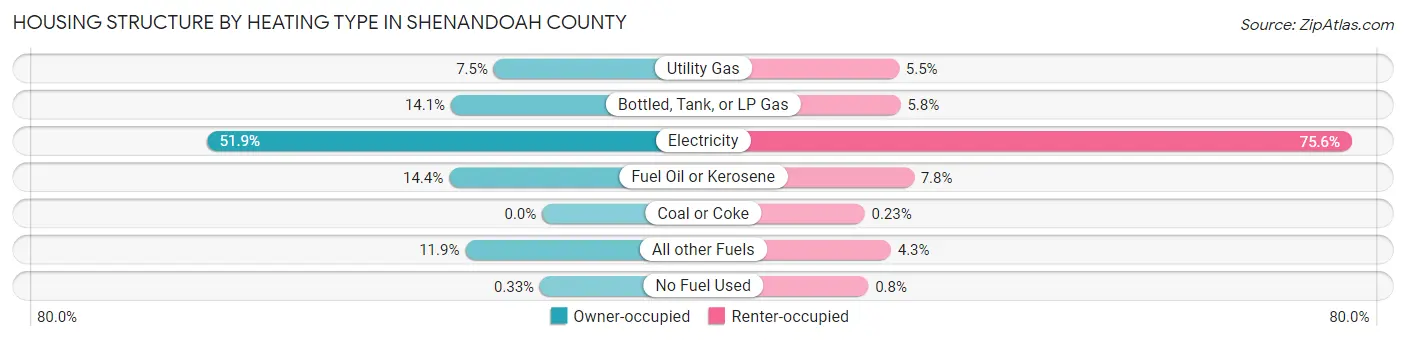
| Heating Type | Owner-occupied | Renter-occupied |
| Utility Gas | 954 (7.5%) | 264 (5.5%) |
| Bottled, Tank, or LP Gas | 1,799 (14.1%) | 276 (5.8%) |
| Electricity | 6,619 (51.8%) | 3,609 (75.5%) |
| Fuel Oil or Kerosene | 1,835 (14.4%) | 374 (7.8%) |
| Coal or Coke | 0 (0.0%) | 11 (0.2%) |
| All other Fuels | 1,516 (11.9%) | 205 (4.3%) |
| No Fuel Used | 42 (0.3%) | 38 (0.8%) |
| Total | 12,765 (100.0%) | 4,777 (100.0%) |
Household Vehicle Usage in Shenandoah County
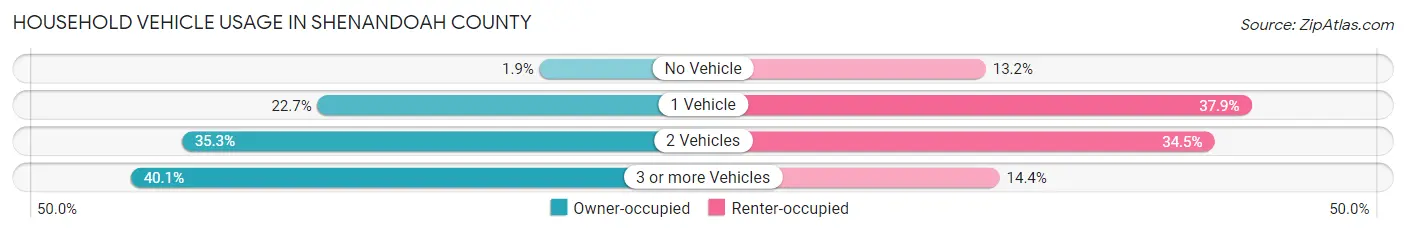
| Vehicles per Household | Owner-occupied | Renter-occupied |
| No Vehicle | 245 (1.9%) | 628 (13.2%) |
| 1 Vehicle | 2,892 (22.7%) | 1,812 (37.9%) |
| 2 Vehicles | 4,510 (35.3%) | 1,647 (34.5%) |
| 3 or more Vehicles | 5,118 (40.1%) | 690 (14.4%) |
| Total | 12,765 (100.0%) | 4,777 (100.0%) |
Real Estate & Mortgages in Shenandoah County
Real Estate and Mortgage Overview in Shenandoah County
| Characteristic | Without Mortgage | With Mortgage |
| Housing Units | 5,105 | 7,660 |
| Median Property Value | $242,900 | $251,800 |
| Median Household Income | $56,896 | $1,533 |
| Monthly Housing Costs | $430 | $257 |
| Real Estate Taxes | $1,465 | $127 |
Property Value by Mortgage Status in Shenandoah County
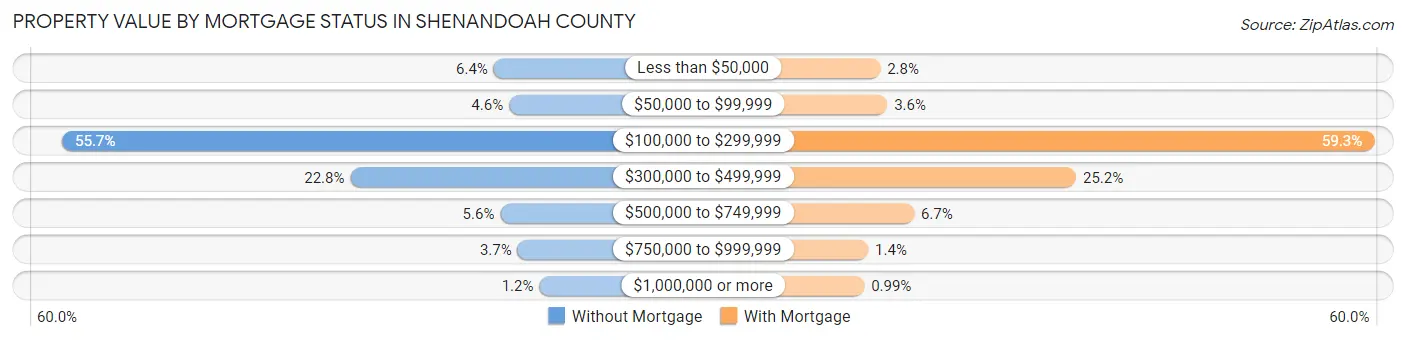
| Property Value | Without Mortgage | With Mortgage |
| Less than $50,000 | 326 (6.4%) | 216 (2.8%) |
| $50,000 to $99,999 | 237 (4.6%) | 277 (3.6%) |
| $100,000 to $299,999 | 2,844 (55.7%) | 4,539 (59.3%) |
| $300,000 to $499,999 | 1,163 (22.8%) | 1,930 (25.2%) |
| $500,000 to $749,999 | 288 (5.6%) | 512 (6.7%) |
| $750,000 to $999,999 | 187 (3.7%) | 110 (1.4%) |
| $1,000,000 or more | 60 (1.2%) | 76 (1.0%) |
| Total | 5,105 (100.0%) | 7,660 (100.0%) |
Household Income by Mortgage Status in Shenandoah County
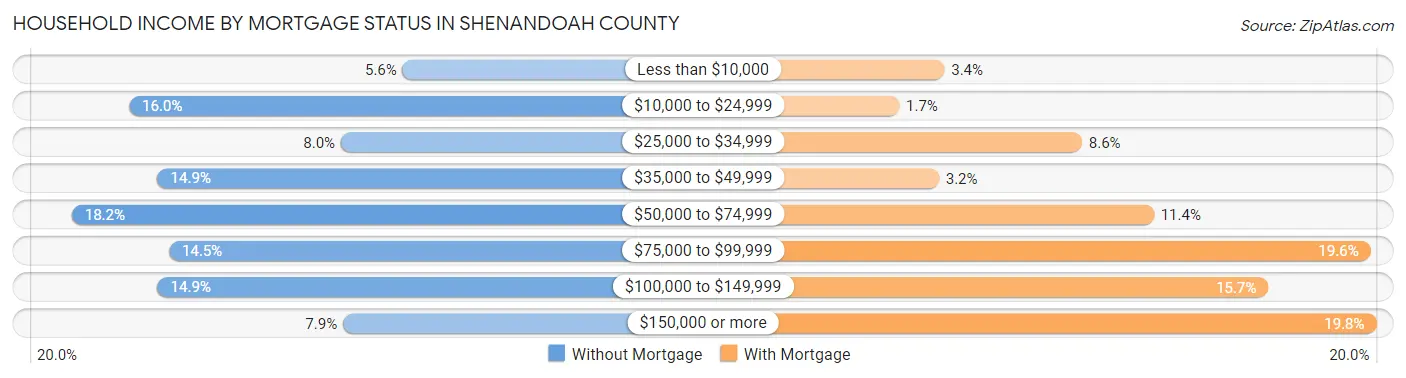
| Household Income | Without Mortgage | With Mortgage |
| Less than $10,000 | 286 (5.6%) | 259 (3.4%) |
| $10,000 to $24,999 | 818 (16.0%) | 127 (1.7%) |
| $25,000 to $34,999 | 406 (8.0%) | 660 (8.6%) |
| $35,000 to $49,999 | 762 (14.9%) | 243 (3.2%) |
| $50,000 to $74,999 | 929 (18.2%) | 870 (11.4%) |
| $75,000 to $99,999 | 740 (14.5%) | 1,503 (19.6%) |
| $100,000 to $149,999 | 762 (14.9%) | 1,204 (15.7%) |
| $150,000 or more | 402 (7.9%) | 1,520 (19.8%) |
| Total | 5,105 (100.0%) | 7,660 (100.0%) |
Property Value to Household Income Ratio in Shenandoah County
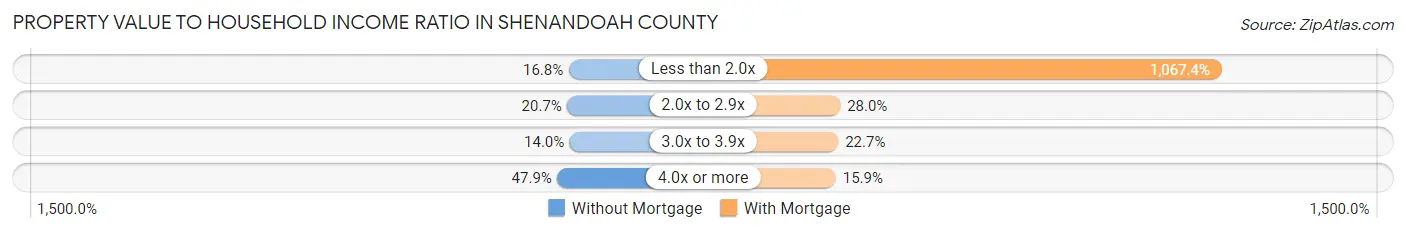
| Value-to-Income Ratio | Without Mortgage | With Mortgage |
| Less than 2.0x | 859 (16.8%) | 81,766 (1,067.4%) |
| 2.0x to 2.9x | 1,056 (20.7%) | 2,147 (28.0%) |
| 3.0x to 3.9x | 713 (14.0%) | 1,735 (22.7%) |
| 4.0x or more | 2,443 (47.9%) | 1,220 (15.9%) |
| Total | 5,105 (100.0%) | 7,660 (100.0%) |
Real Estate Taxes by Mortgage Status in Shenandoah County
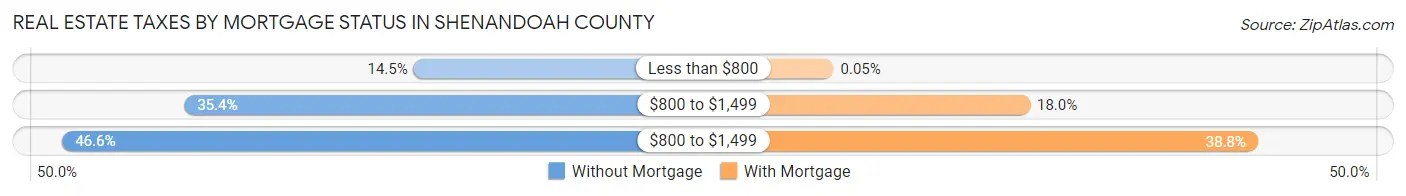
| Property Taxes | Without Mortgage | With Mortgage |
| Less than $800 | 739 (14.5%) | 4 (0.1%) |
| $800 to $1,499 | 1,808 (35.4%) | 1,378 (18.0%) |
| $800 to $1,499 | 2,377 (46.6%) | 2,971 (38.8%) |
| Total | 5,105 (100.0%) | 7,660 (100.0%) |
Health & Disability in Shenandoah County
Health Insurance Coverage by Age in Shenandoah County
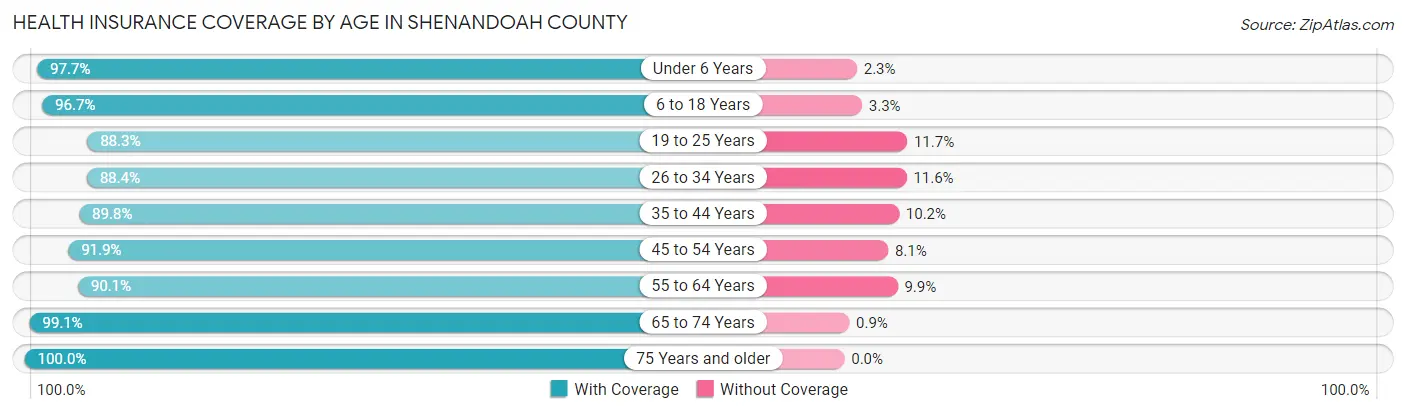
| Age Bracket | With Coverage | Without Coverage |
| Under 6 Years | 3,063 (97.7%) | 73 (2.3%) |
| 6 to 18 Years | 6,662 (96.7%) | 226 (3.3%) |
| 19 to 25 Years | 2,879 (88.3%) | 381 (11.7%) |
| 26 to 34 Years | 3,820 (88.4%) | 501 (11.6%) |
| 35 to 44 Years | 4,512 (89.8%) | 511 (10.2%) |
| 45 to 54 Years | 5,102 (91.9%) | 452 (8.1%) |
| 55 to 64 Years | 5,747 (90.1%) | 633 (9.9%) |
| 65 to 74 Years | 5,312 (99.1%) | 48 (0.9%) |
| 75 Years and older | 4,028 (100.0%) | 0 (0.0%) |
| Total | 41,125 (93.6%) | 2,825 (6.4%) |
Health Insurance Coverage by Citizenship Status in Shenandoah County
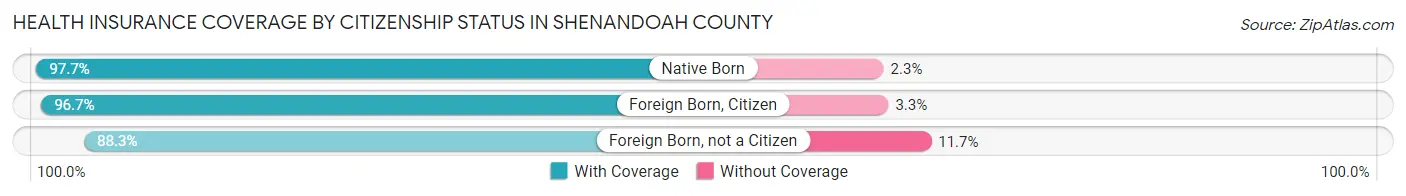
| Citizenship Status | With Coverage | Without Coverage |
| Native Born | 3,063 (97.7%) | 73 (2.3%) |
| Foreign Born, Citizen | 6,662 (96.7%) | 226 (3.3%) |
| Foreign Born, not a Citizen | 2,879 (88.3%) | 381 (11.7%) |
Health Insurance Coverage by Household Income in Shenandoah County
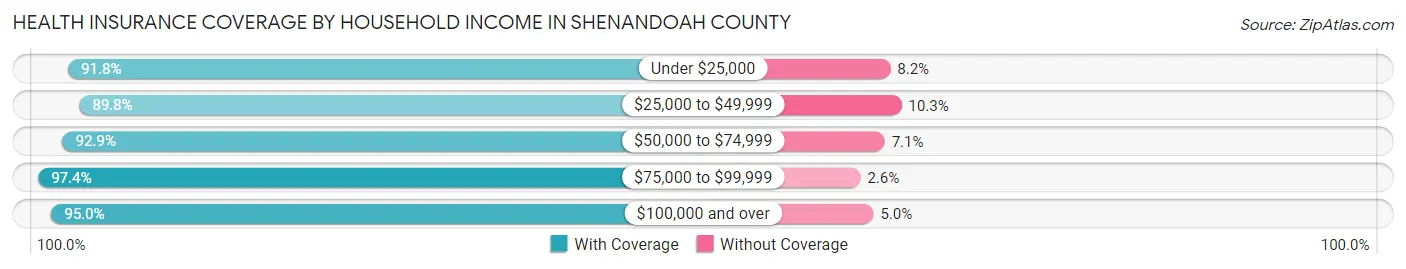
| Household Income | With Coverage | Without Coverage |
| Under $25,000 | 5,006 (91.8%) | 445 (8.2%) |
| $25,000 to $49,999 | 7,569 (89.7%) | 864 (10.2%) |
| $50,000 to $74,999 | 6,728 (92.9%) | 515 (7.1%) |
| $75,000 to $99,999 | 6,800 (97.4%) | 179 (2.6%) |
| $100,000 and over | 14,960 (95.0%) | 789 (5.0%) |
Public vs Private Health Insurance Coverage by Age in Shenandoah County
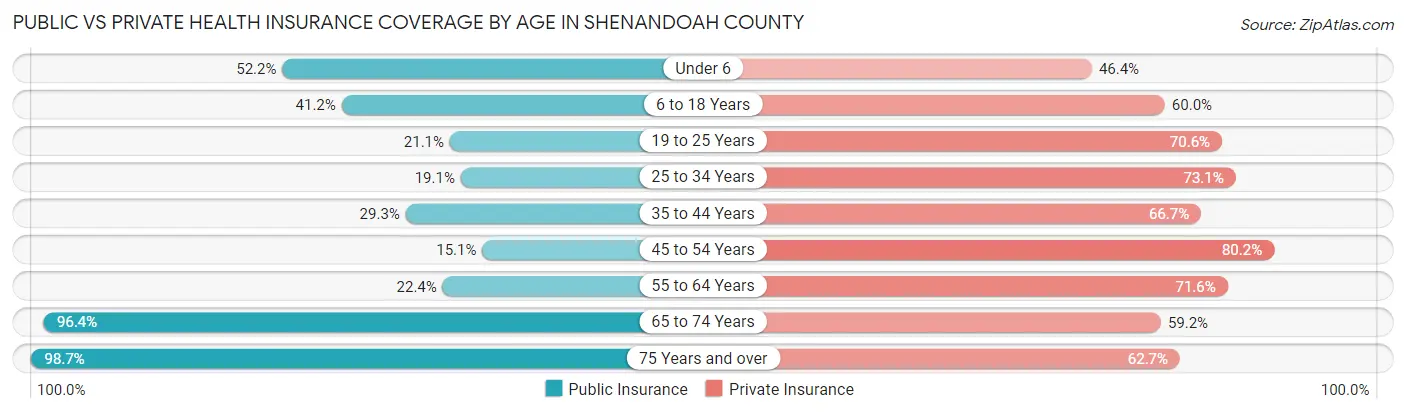
| Age Bracket | Public Insurance | Private Insurance |
| Under 6 | 1,636 (52.2%) | 1,456 (46.4%) |
| 6 to 18 Years | 2,835 (41.2%) | 4,131 (60.0%) |
| 19 to 25 Years | 687 (21.1%) | 2,300 (70.6%) |
| 25 to 34 Years | 823 (19.1%) | 3,158 (73.1%) |
| 35 to 44 Years | 1,470 (29.3%) | 3,349 (66.7%) |
| 45 to 54 Years | 836 (15.0%) | 4,455 (80.2%) |
| 55 to 64 Years | 1,430 (22.4%) | 4,568 (71.6%) |
| 65 to 74 Years | 5,168 (96.4%) | 3,175 (59.2%) |
| 75 Years and over | 3,977 (98.7%) | 2,527 (62.7%) |
| Total | 18,862 (42.9%) | 29,119 (66.2%) |
Disability Status by Sex by Age in Shenandoah County
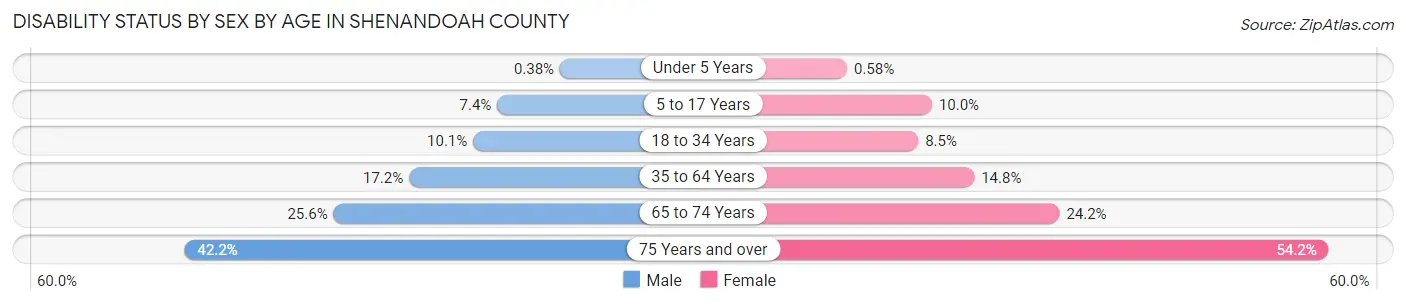
| Age Bracket | Male | Female |
| Under 5 Years | 5 (0.4%) | 7 (0.6%) |
| 5 to 17 Years | 260 (7.4%) | 341 (10.0%) |
| 18 to 34 Years | 417 (10.1%) | 342 (8.5%) |
| 35 to 64 Years | 1,448 (17.2%) | 1,258 (14.7%) |
| 65 to 74 Years | 674 (25.6%) | 661 (24.2%) |
| 75 Years and over | 747 (42.2%) | 1,224 (54.2%) |
Disability Class by Sex by Age in Shenandoah County
Disability Class: Hearing Difficulty
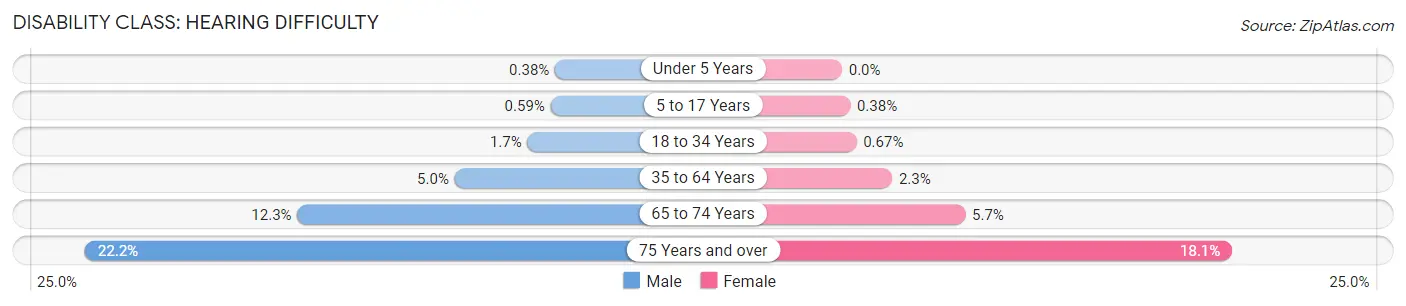
| Age Bracket | Male | Female |
| Under 5 Years | 5 (0.4%) | 0 (0.0%) |
| 5 to 17 Years | 21 (0.6%) | 13 (0.4%) |
| 18 to 34 Years | 69 (1.7%) | 27 (0.7%) |
| 35 to 64 Years | 425 (5.0%) | 199 (2.3%) |
| 65 to 74 Years | 325 (12.3%) | 156 (5.7%) |
| 75 Years and over | 393 (22.2%) | 409 (18.1%) |
Disability Class: Vision Difficulty
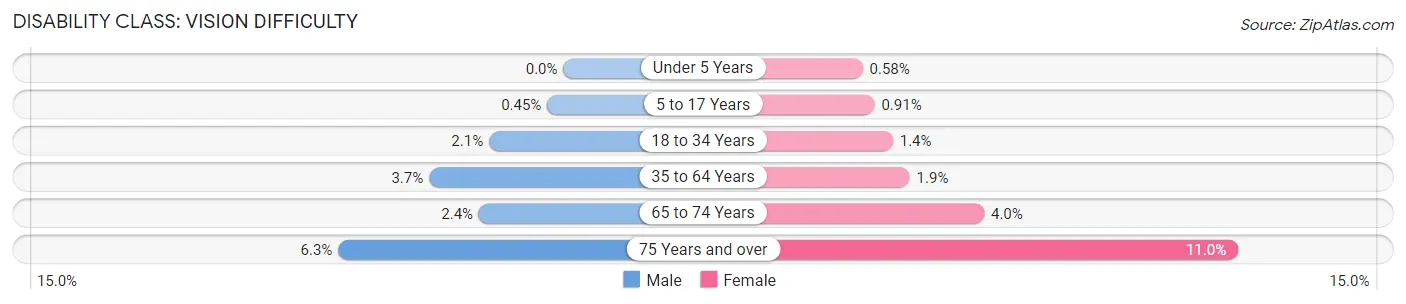
| Age Bracket | Male | Female |
| Under 5 Years | 0 (0.0%) | 7 (0.6%) |
| 5 to 17 Years | 16 (0.4%) | 31 (0.9%) |
| 18 to 34 Years | 86 (2.1%) | 57 (1.4%) |
| 35 to 64 Years | 315 (3.7%) | 161 (1.9%) |
| 65 to 74 Years | 62 (2.4%) | 108 (4.0%) |
| 75 Years and over | 111 (6.3%) | 249 (11.0%) |
Disability Class: Cognitive Difficulty
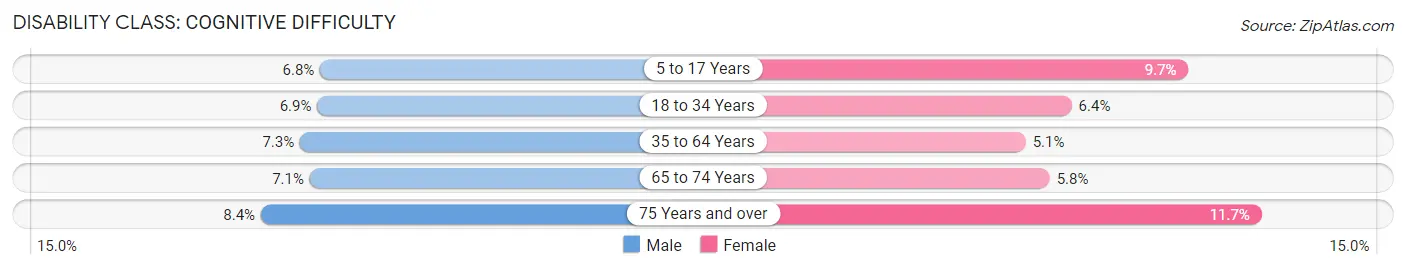
| Age Bracket | Male | Female |
| 5 to 17 Years | 239 (6.8%) | 328 (9.7%) |
| 18 to 34 Years | 284 (6.9%) | 257 (6.4%) |
| 35 to 64 Years | 618 (7.3%) | 437 (5.1%) |
| 65 to 74 Years | 186 (7.1%) | 158 (5.8%) |
| 75 Years and over | 149 (8.4%) | 264 (11.7%) |
Disability Class: Ambulatory Difficulty
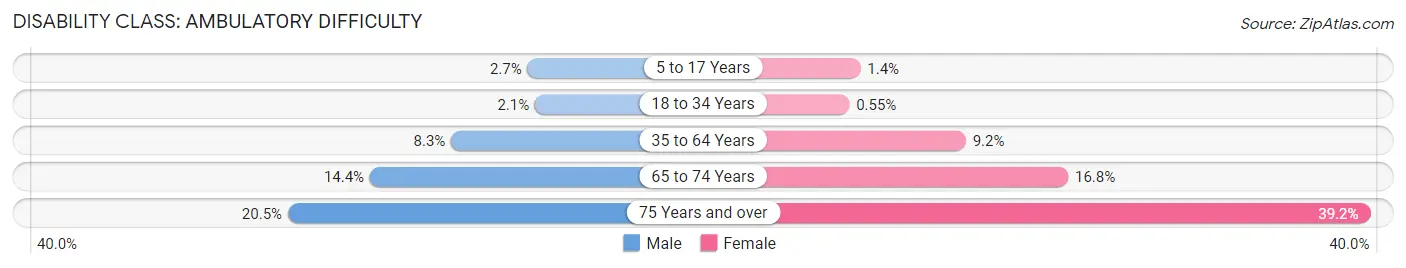
| Age Bracket | Male | Female |
| 5 to 17 Years | 94 (2.7%) | 47 (1.4%) |
| 18 to 34 Years | 87 (2.1%) | 22 (0.5%) |
| 35 to 64 Years | 702 (8.3%) | 785 (9.2%) |
| 65 to 74 Years | 378 (14.4%) | 458 (16.8%) |
| 75 Years and over | 362 (20.4%) | 886 (39.2%) |
Disability Class: Self-Care Difficulty
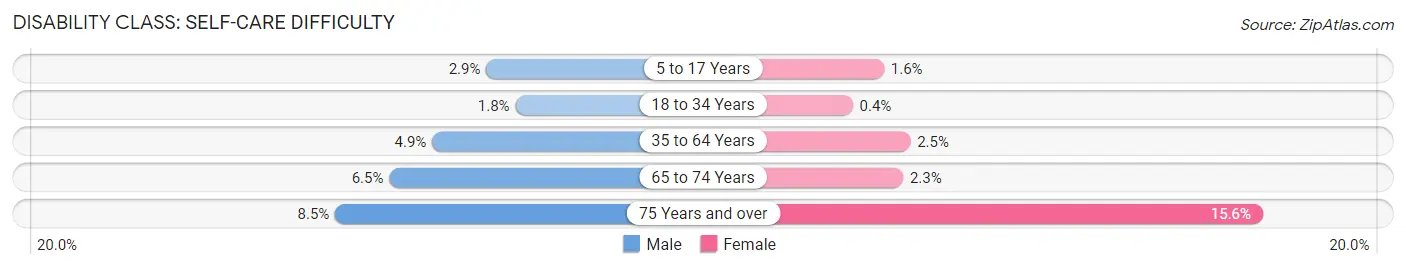
| Age Bracket | Male | Female |
| 5 to 17 Years | 101 (2.9%) | 53 (1.6%) |
| 18 to 34 Years | 74 (1.8%) | 16 (0.4%) |
| 35 to 64 Years | 410 (4.9%) | 217 (2.5%) |
| 65 to 74 Years | 170 (6.5%) | 62 (2.3%) |
| 75 Years and over | 150 (8.5%) | 353 (15.6%) |
Technology Access in Shenandoah County
Computing Device Access in Shenandoah County
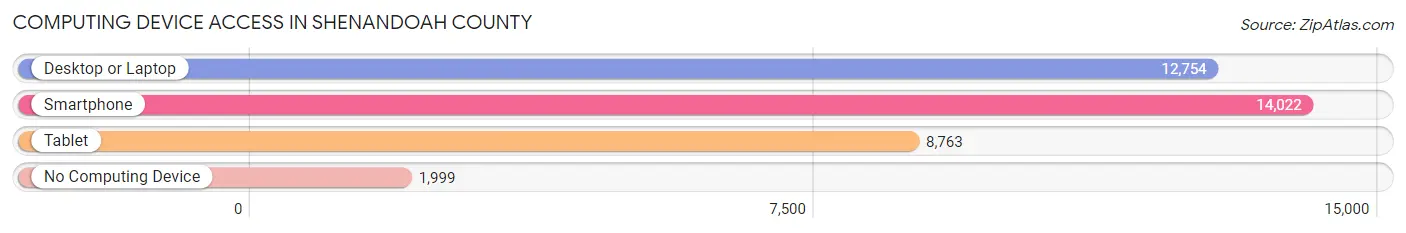
| Device Type | # Households | % Households |
| Desktop or Laptop | 12,754 | 72.7% |
| Smartphone | 14,022 | 79.9% |
| Tablet | 8,763 | 49.9% |
| No Computing Device | 1,999 | 11.4% |
| Total | 17,542 | 100.0% |
Internet Access in Shenandoah County
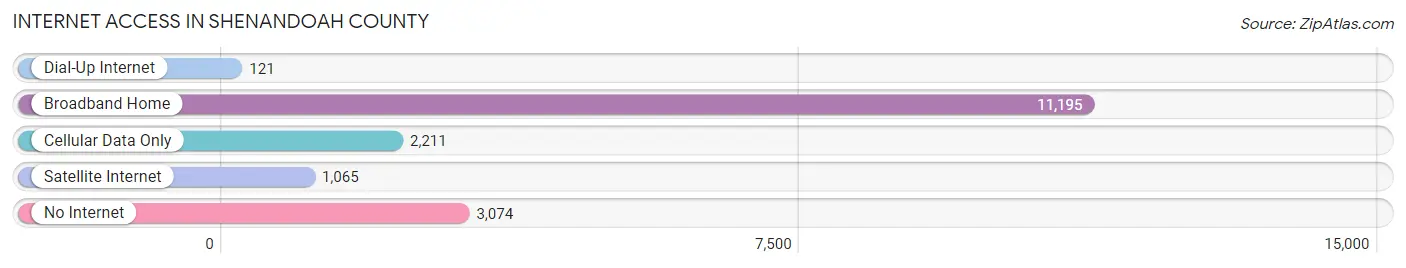
| Internet Type | # Households | % Households |
| Dial-Up Internet | 121 | 0.7% |
| Broadband Home | 11,195 | 63.8% |
| Cellular Data Only | 2,211 | 12.6% |
| Satellite Internet | 1,065 | 6.1% |
| No Internet | 3,074 | 17.5% |
| Total | 17,542 | 100.0% |
Shenandoah County Summary
Shenandoah County is a county located in the Commonwealth of Virginia. It is part of the Shenandoah Valley region of Virginia and is located in the northwestern part of the state. As of the 2010 census, the population was 41,993. The county seat is Woodstock.
History
Shenandoah County was established in 1772 from Frederick County. It was named for the Shenandoah River, which in turn was named for the Senedo Native American tribe who lived in the area. The county was originally part of Frederick County, Virginia, but was split off in 1772.
The county was the site of several battles during the Civil War, including the Battle of New Market in 1864. The county was also the site of the Battle of Cedar Creek in October 1864.
Geography
Shenandoah County is located in the northwestern part of Virginia, in the Shenandoah Valley region. It is bordered by Frederick County to the north, Warren County to the east, Page County to the south, and Clarke County to the west. The county is located in the Blue Ridge Mountains and is home to the Shenandoah National Park.
The county has a total area of 517 square miles, of which 514 square miles is land and 3.2 square miles (0.6%) is water. The highest point in the county is Hawksbill Mountain, at 4,051 feet.
Economy
Shenandoah County has a diverse economy, with a mix of agriculture, manufacturing, and tourism. Agriculture is the largest sector of the county's economy, with livestock, poultry, and dairy products being the main products. Manufacturing is also an important part of the economy, with products such as furniture, textiles, and wood products being produced in the county. Tourism is also an important part of the economy, with the Shenandoah National Park and the Skyline Drive being popular attractions.
Demographics
As of the 2010 census, there were 41,993 people, 16,845 households, and 11,845 families living in the county. The population density was 82.2 people per square mile. There were 18,845 housing units at an average density of 36.8 per square mile. The racial makeup of the county was 94.2% White, 2.7% Black or African American, 0.3% Native American, 0.5% Asian, 0.1% Pacific Islander, 0.7% from other races, and 1.5% from two or more races. Hispanic or Latino of any race were 2.3% of the population.
The median income for a household in the county was $41,945, and the median income for a family was $50,845. The per capita income for the county was $21,845. About 8.7% of families and 11.7% of the population were below the poverty line, including 15.2% of those under age 18 and 9.2% of those age 65 or over.
Common Questions
What is Per Capita Income in Shenandoah County?
Per Capita income in Shenandoah County is $34,170.
What is the Median Family Income in Shenandoah County?
Median Family Income in Shenandoah County is $76,699.
What is the Median Household income in Shenandoah County?
Median Household Income in Shenandoah County is $62,149.
What is Income or Wage Gap in Shenandoah County?
Income or Wage Gap in Shenandoah County is 33.4%.
Women in Shenandoah County earn 66.6 cents for every dollar earned by a man.
What is Family Income Deficit in Shenandoah County?
Family Income Deficit in Shenandoah County is $10,905.
Families that are below poverty line in Shenandoah County earn $10,905 less on average than the poverty threshold level.
What is Inequality or Gini Index in Shenandoah County?
Inequality or Gini Index in Shenandoah County is 0.45.
What is the Total Population of Shenandoah County?
Total Population of Shenandoah County is 44,337.
What is the Total Male Population of Shenandoah County?
Total Male Population of Shenandoah County is 21,907.
What is the Total Female Population of Shenandoah County?
Total Female Population of Shenandoah County is 22,430.
What is the Ratio of Males per 100 Females in Shenandoah County?
There are 97.67 Males per 100 Females in Shenandoah County.
What is the Ratio of Females per 100 Males in Shenandoah County?
There are 102.39 Females per 100 Males in Shenandoah County.
What is the Median Population Age in Shenandoah County?
Median Population Age in Shenandoah County is 43.6 Years.
What is the Average Family Size in Shenandoah County
Average Family Size in Shenandoah County is 3.1 People.
What is the Average Household Size in Shenandoah County
Average Household Size in Shenandoah County is 2.5 People.
How Large is the Labor Force in Shenandoah County?
There are 21,620 People in the Labor Forcein in Shenandoah County.
What is the Percentage of People in the Labor Force in Shenandoah County?
59.9% of People are in the Labor Force in Shenandoah County.
What is the Unemployment Rate in Shenandoah County?
Unemployment Rate in Shenandoah County is 4.2%.