Scott County, VA Map & Demographics
Scott County Map
Scott County Overview
$26,681
PER CAPITA INCOME
$62,072
AVG FAMILY INCOME
$44,535
AVG HOUSEHOLD INCOME
35.7%
WAGE / INCOME GAP [ % ]
64.3¢/ $1
WAGE / INCOME GAP [ $ ]
0.47
INEQUALITY / GINI INDEX
21,536
TOTAL POPULATION
10,954
MALE POPULATION
10,582
FEMALE POPULATION
103.52
MALES / 100 FEMALES
96.60
FEMALES / 100 MALES
47.7
MEDIAN AGE
3.0
AVG FAMILY SIZE
2.4
AVG HOUSEHOLD SIZE
8,215
LABOR FORCE [ PEOPLE ]
45.4%
PERCENT IN LABOR FORCE
3.4%
UNEMPLOYMENT RATE
Scott County Area Codes
Income in Scott County
Income Overview in Scott County
Per Capita Income in Scott County is $26,681, while median incomes of families and households are $62,072 and $44,535 respectively.
| Characteristic | Number | Measure |
| Per Capita Income | 21,536 | $26,681 |
| Median Family Income | 5,452 | $62,072 |
| Mean Family Income | 5,452 | $78,075 |
| Median Household Income | 8,838 | $44,535 |
| Mean Household Income | 8,838 | $60,731 |
| Income Deficit | 5,452 | $0 |
| Wage / Income Gap (%) | 21,536 | 35.66% |
| Wage / Income Gap ($) | 21,536 | 64.34¢ per $1 |
| Gini / Inequality Index | 21,536 | 0.47 |
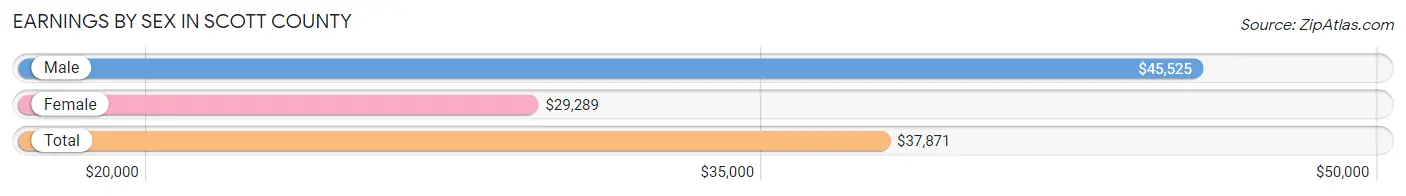
Earnings by Sex in Scott County
Average Earnings in Scott County are $37,871, $45,525 for men and $29,289 for women, a difference of 35.7%.
| Sex | Number | Average Earnings |
| Male | 4,906 (55.4%) | $45,525 |
| Female | 3,944 (44.6%) | $29,289 |
| Total | 8,850 (100.0%) | $37,871 |
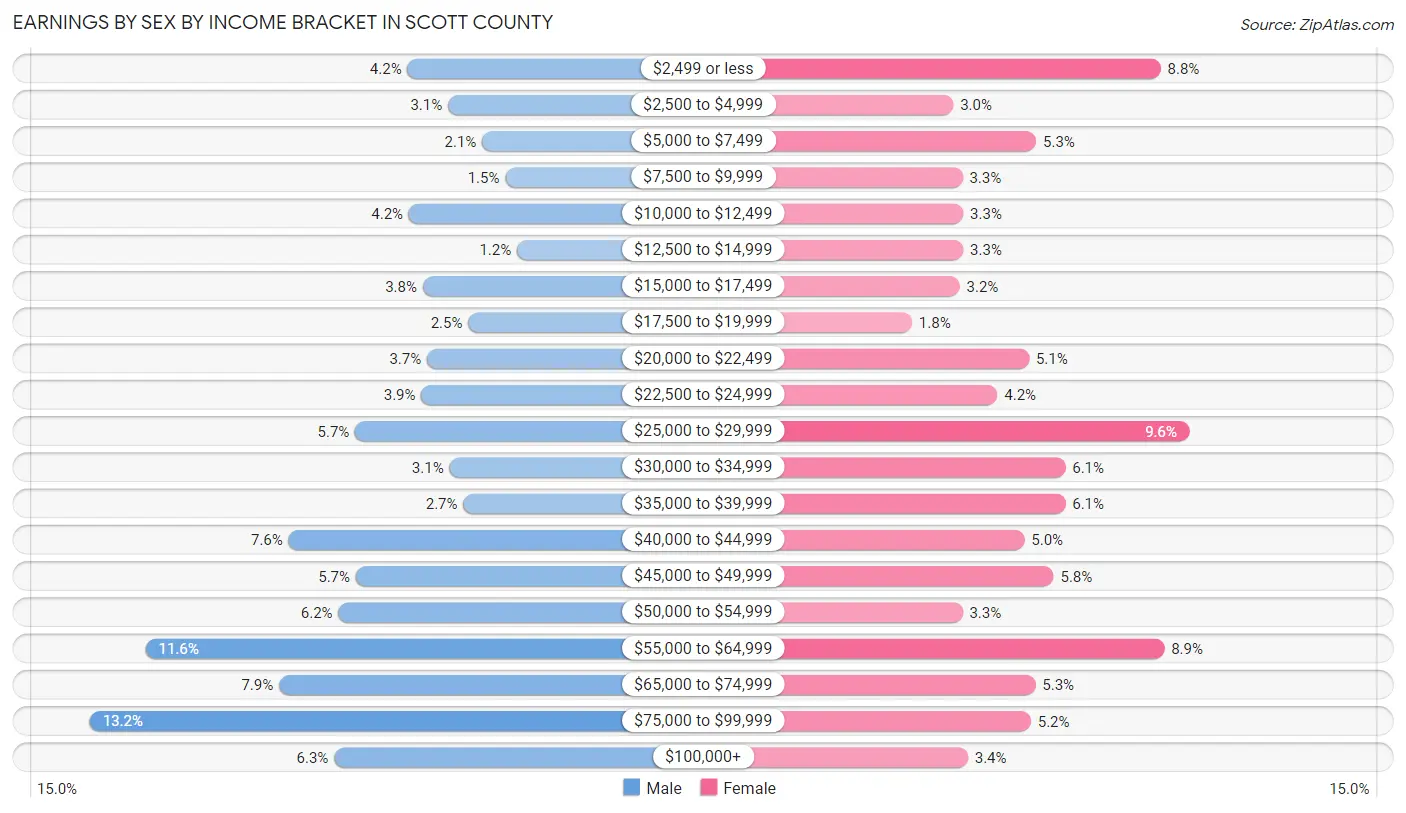
Earnings by Sex by Income Bracket in Scott County
The most common earnings brackets in Scott County are $75,000 to $99,999 for men (646 | 13.2%) and $25,000 to $29,999 for women (379 | 9.6%).
| Income | Male | Female |
| $2,499 or less | 208 (4.2%) | 348 (8.8%) |
| $2,500 to $4,999 | 152 (3.1%) | 118 (3.0%) |
| $5,000 to $7,499 | 105 (2.1%) | 210 (5.3%) |
| $7,500 to $9,999 | 73 (1.5%) | 128 (3.3%) |
| $10,000 to $12,499 | 206 (4.2%) | 129 (3.3%) |
| $12,500 to $14,999 | 57 (1.2%) | 129 (3.3%) |
| $15,000 to $17,499 | 187 (3.8%) | 125 (3.2%) |
| $17,500 to $19,999 | 124 (2.5%) | 72 (1.8%) |
| $20,000 to $22,499 | 181 (3.7%) | 202 (5.1%) |
| $22,500 to $24,999 | 189 (3.8%) | 167 (4.2%) |
| $25,000 to $29,999 | 280 (5.7%) | 379 (9.6%) |
| $30,000 to $34,999 | 150 (3.1%) | 242 (6.1%) |
| $35,000 to $39,999 | 131 (2.7%) | 242 (6.1%) |
| $40,000 to $44,999 | 372 (7.6%) | 197 (5.0%) |
| $45,000 to $49,999 | 279 (5.7%) | 229 (5.8%) |
| $50,000 to $54,999 | 303 (6.2%) | 128 (3.3%) |
| $55,000 to $64,999 | 569 (11.6%) | 352 (8.9%) |
| $65,000 to $74,999 | 385 (7.9%) | 209 (5.3%) |
| $75,000 to $99,999 | 646 (13.2%) | 204 (5.2%) |
| $100,000+ | 309 (6.3%) | 134 (3.4%) |
| Total | 4,906 (100.0%) | 3,944 (100.0%) |
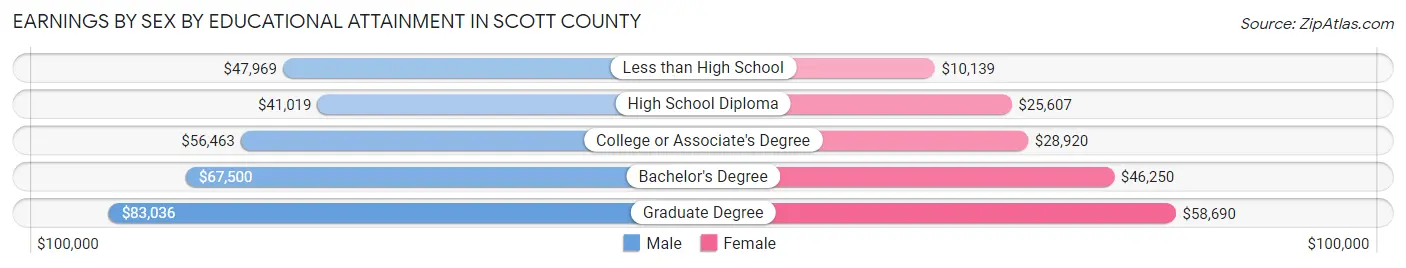
Earnings by Sex by Educational Attainment in Scott County
Average earnings in Scott County are $51,259 for men and $33,691 for women, a difference of 34.3%. Men with an educational attainment of graduate degree enjoy the highest average annual earnings of $83,036, while those with high school diploma education earn the least with $41,019. Women with an educational attainment of graduate degree earn the most with the average annual earnings of $58,690, while those with less than high school education have the smallest earnings of $10,139.
| Educational Attainment | Male Income | Female Income |
| Less than High School | $47,969 | $10,139 |
| High School Diploma | $41,019 | $25,607 |
| College or Associate's Degree | $56,463 | $28,920 |
| Bachelor's Degree | $67,500 | $46,250 |
| Graduate Degree | $83,036 | $58,690 |
| Total | $51,259 | $33,691 |
Family Income in Scott County
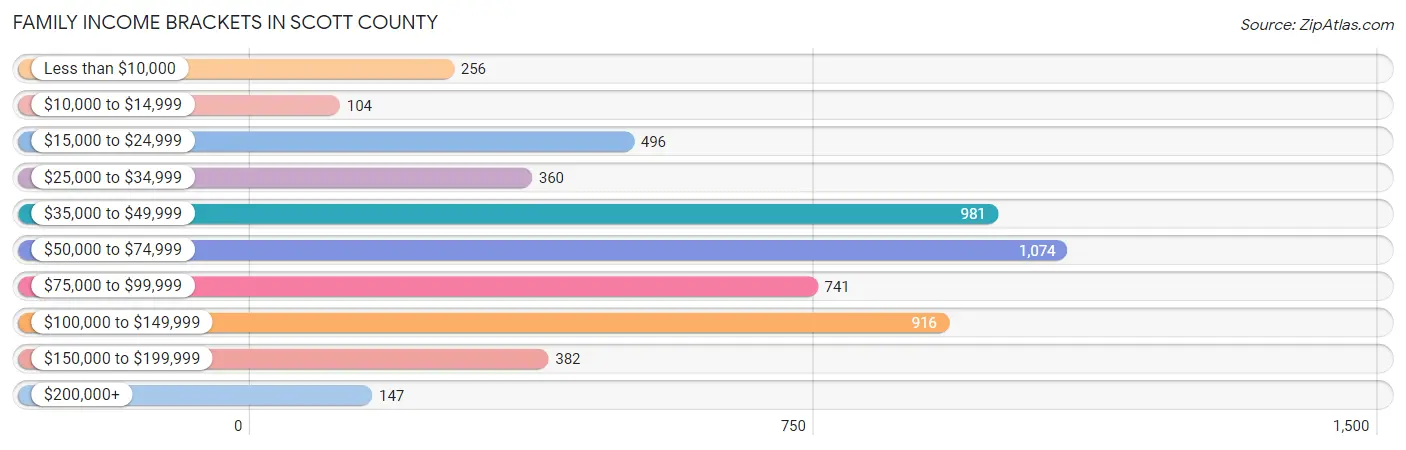
Family Income Brackets in Scott County
According to the Scott County family income data, there are 1,074 families falling into the $50,000 to $74,999 income range, which is the most common income bracket and makes up 19.7% of all families. Conversely, the $10,000 to $14,999 income bracket is the least frequent group with only 104 families (1.9%) belonging to this category.
| Income Bracket | # Families | % Families |
| Less than $10,000 | 256 | 4.7% |
| $10,000 to $14,999 | 104 | 1.9% |
| $15,000 to $24,999 | 496 | 9.1% |
| $25,000 to $34,999 | 360 | 6.6% |
| $35,000 to $49,999 | 981 | 18.0% |
| $50,000 to $74,999 | 1,074 | 19.7% |
| $75,000 to $99,999 | 741 | 13.6% |
| $100,000 to $149,999 | 916 | 16.8% |
| $150,000 to $199,999 | 382 | 7.0% |
| $200,000+ | 147 | 2.7% |
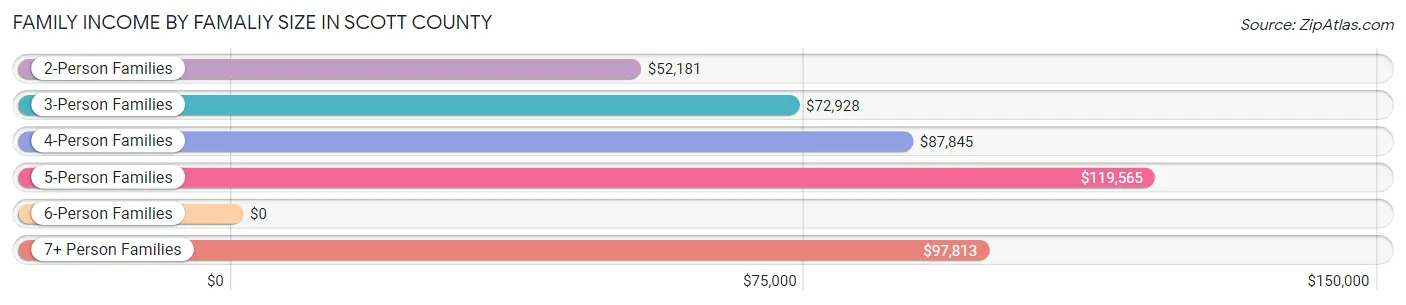
Family Income by Famaliy Size in Scott County
5-person families (296 | 5.4%) account for the highest median family income in Scott County with $119,565 per family, while 2-person families (3,141 | 57.6%) have the highest median income of $26,090 per family member.
| Income Bracket | # Families | Median Income |
| 2-Person Families | 3,141 (57.6%) | $52,181 |
| 3-Person Families | 1,009 (18.5%) | $72,928 |
| 4-Person Families | 838 (15.4%) | $87,845 |
| 5-Person Families | 296 (5.4%) | $119,565 |
| 6-Person Families | 90 (1.7%) | $0 |
| 7+ Person Families | 78 (1.4%) | $97,813 |
| Total | 5,452 (100.0%) | $62,072 |
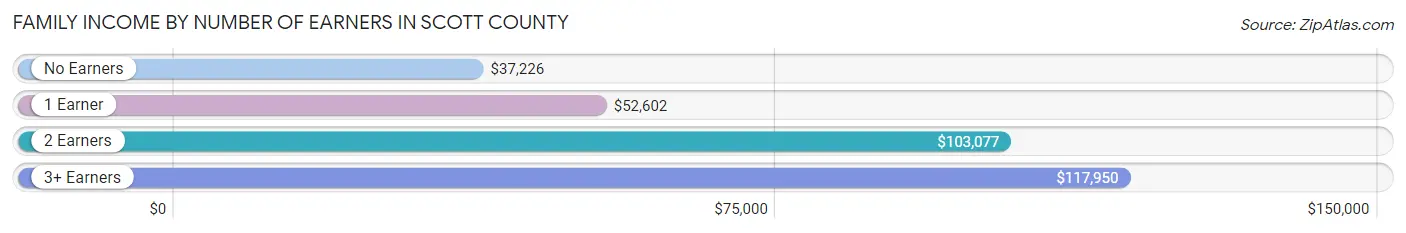
Family Income by Number of Earners in Scott County
The median family income in Scott County is $62,072, with families comprising 3+ earners (453) having the highest median family income of $117,950, while families with no earners (1,576) have the lowest median family income of $37,226, accounting for 8.3% and 28.9% of families, respectively.
| Number of Earners | # Families | Median Income |
| No Earners | 1,576 (28.9%) | $37,226 |
| 1 Earner | 1,729 (31.7%) | $52,602 |
| 2 Earners | 1,694 (31.1%) | $103,077 |
| 3+ Earners | 453 (8.3%) | $117,950 |
| Total | 5,452 (100.0%) | $62,072 |
Household Income in Scott County
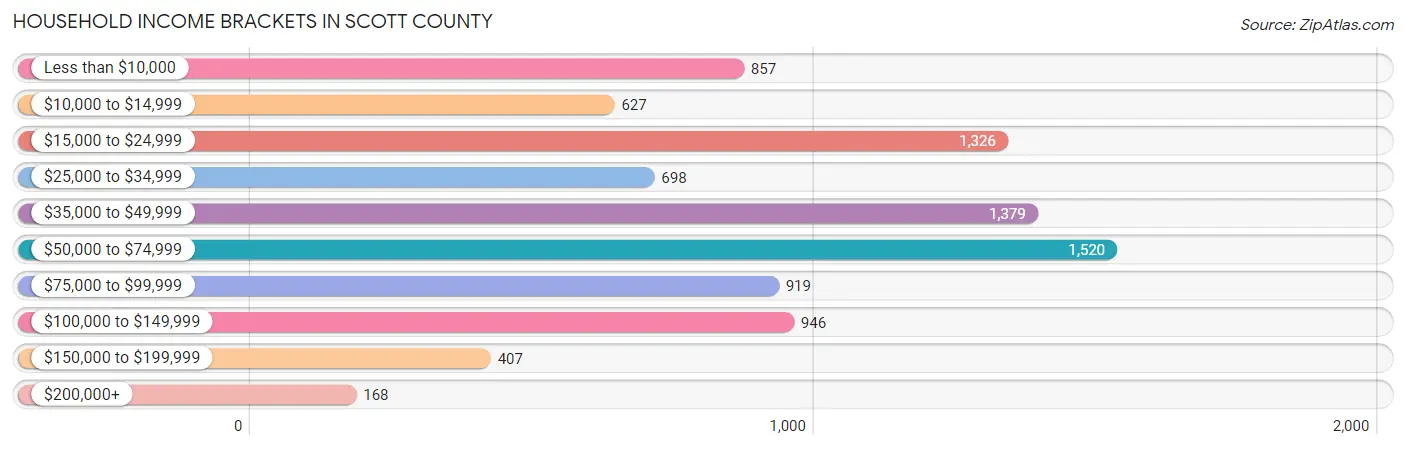
Household Income Brackets in Scott County
With 1,520 households falling in the category, the $50,000 to $74,999 income range is the most frequent in Scott County, accounting for 17.2% of all households. In contrast, only 168 households (1.9%) fall into the $200,000+ income bracket, making it the least populous group.
| Income Bracket | # Households | % Households |
| Less than $10,000 | 857 | 9.7% |
| $10,000 to $14,999 | 627 | 7.1% |
| $15,000 to $24,999 | 1,326 | 15.0% |
| $25,000 to $34,999 | 698 | 7.9% |
| $35,000 to $49,999 | 1,379 | 15.6% |
| $50,000 to $74,999 | 1,520 | 17.2% |
| $75,000 to $99,999 | 919 | 10.4% |
| $100,000 to $149,999 | 946 | 10.7% |
| $150,000 to $199,999 | 407 | 4.6% |
| $200,000+ | 168 | 1.9% |
Household Income by Householder Age in Scott County
The median household income in Scott County is $44,535, with the highest median household income of $60,417 found in the 25 to 44 years age bracket for the primary householder. A total of 1,839 households (20.8%) fall into this category. Meanwhile, the 65+ years age bracket for the primary householder has the lowest median household income of $31,852, with 3,490 households (39.5%) in this group.
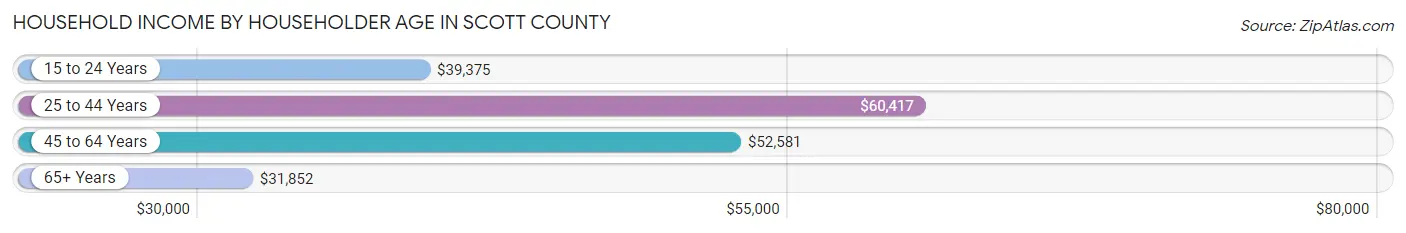
| Income Bracket | # Households | Median Income |
| 15 to 24 Years | 129 (1.5%) | $39,375 |
| 25 to 44 Years | 1,839 (20.8%) | $60,417 |
| 45 to 64 Years | 3,380 (38.2%) | $52,581 |
| 65+ Years | 3,490 (39.5%) | $31,852 |
| Total | 8,838 (100.0%) | $44,535 |
Poverty in Scott County
Income Below Poverty by Sex and Age in Scott County
With 15.2% poverty level for males and 18.8% for females among the residents of Scott County, 5 year old males and 16 and 17 year old females are the most vulnerable to poverty, with 28 males (39.4%) and 83 females (40.7%) in their respective age groups living below the poverty level.
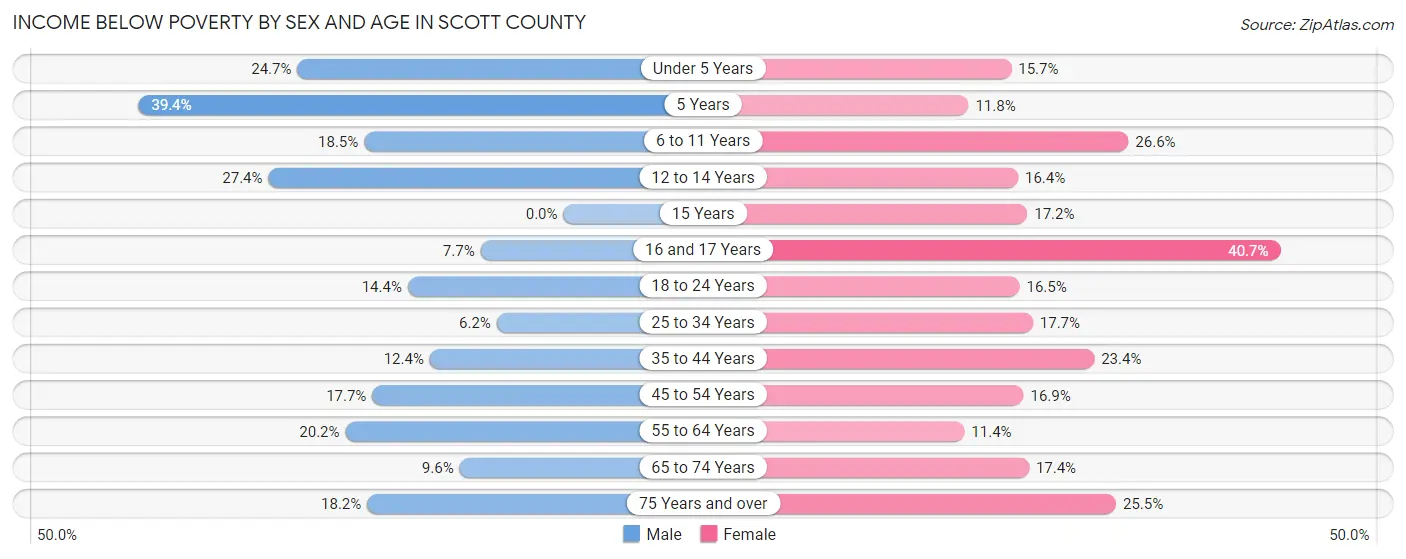
| Age Bracket | Male | Female |
| Under 5 Years | 101 (24.7%) | 59 (15.7%) |
| 5 Years | 28 (39.4%) | 10 (11.8%) |
| 6 to 11 Years | 130 (18.5%) | 154 (26.6%) |
| 12 to 14 Years | 89 (27.4%) | 70 (16.4%) |
| 15 Years | 0 (0.0%) | 26 (17.2%) |
| 16 and 17 Years | 17 (7.7%) | 83 (40.7%) |
| 18 to 24 Years | 109 (14.4%) | 117 (16.5%) |
| 25 to 34 Years | 71 (6.2%) | 170 (17.7%) |
| 35 to 44 Years | 138 (12.4%) | 257 (23.4%) |
| 45 to 54 Years | 245 (17.7%) | 225 (16.9%) |
| 55 to 64 Years | 338 (20.2%) | 179 (11.4%) |
| 65 to 74 Years | 131 (9.6%) | 271 (17.4%) |
| 75 Years and over | 193 (18.2%) | 312 (25.5%) |
| Total | 1,590 (15.2%) | 1,933 (18.8%) |
Income Above Poverty by Sex and Age in Scott County
According to the poverty statistics in Scott County, males aged 15 years and females aged 55 to 64 years are the age groups that are most secure financially, with 100.0% of males and 88.6% of females in these age groups living above the poverty line.
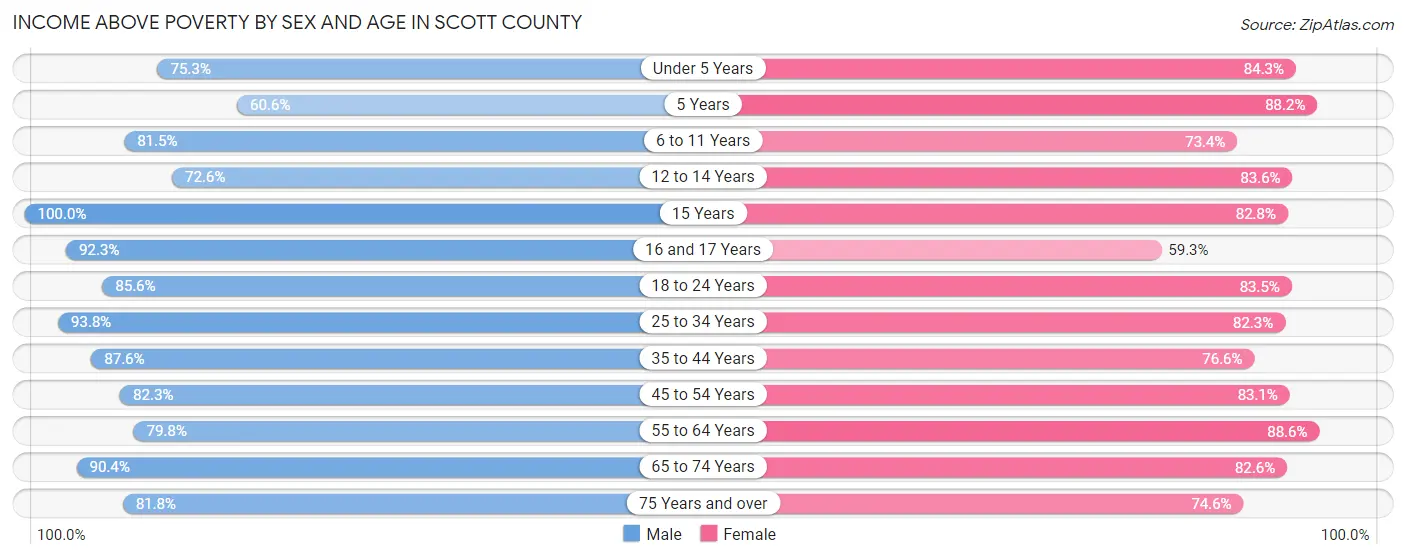
| Age Bracket | Male | Female |
| Under 5 Years | 308 (75.3%) | 316 (84.3%) |
| 5 Years | 43 (60.6%) | 75 (88.2%) |
| 6 to 11 Years | 573 (81.5%) | 425 (73.4%) |
| 12 to 14 Years | 236 (72.6%) | 358 (83.6%) |
| 15 Years | 234 (100.0%) | 125 (82.8%) |
| 16 and 17 Years | 204 (92.3%) | 121 (59.3%) |
| 18 to 24 Years | 646 (85.6%) | 592 (83.5%) |
| 25 to 34 Years | 1,076 (93.8%) | 789 (82.3%) |
| 35 to 44 Years | 975 (87.6%) | 840 (76.6%) |
| 45 to 54 Years | 1,136 (82.3%) | 1,109 (83.1%) |
| 55 to 64 Years | 1,333 (79.8%) | 1,394 (88.6%) |
| 65 to 74 Years | 1,228 (90.4%) | 1,289 (82.6%) |
| 75 Years and over | 867 (81.8%) | 914 (74.6%) |
| Total | 8,859 (84.8%) | 8,347 (81.2%) |
Income Below Poverty Among Married-Couple Families in Scott County
The poverty statistics for married-couple families in Scott County show that 7.4% or 314 of the total 4,236 families live below the poverty line. Families with 5 or more children have the highest poverty rate of 9.1%, comprising of 1 families. On the other hand, families with 1 or 2 children have the lowest poverty rate of 5.7%, which includes 60 families.
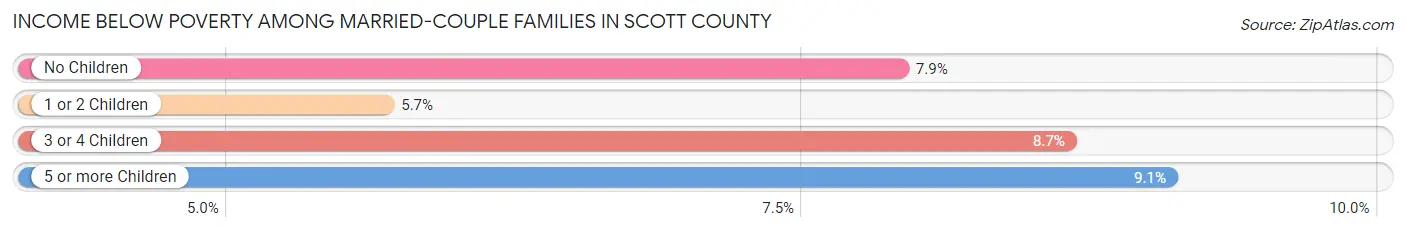
| Children | Above Poverty | Below Poverty |
| No Children | 2,652 (92.1%) | 228 (7.9%) |
| 1 or 2 Children | 996 (94.3%) | 60 (5.7%) |
| 3 or 4 Children | 264 (91.3%) | 25 (8.6%) |
| 5 or more Children | 10 (90.9%) | 1 (9.1%) |
| Total | 3,922 (92.6%) | 314 (7.4%) |
Income Below Poverty Among Single-Parent Households in Scott County
According to the poverty data in Scott County, 10.1% or 23 single-father households and 32.0% or 316 single-mother households are living below the poverty line. Among single-father households, those with 3 or 4 children have the highest poverty rate, with 4 households (100.0%) experiencing poverty. Likewise, among single-mother households, those with 3 or 4 children have the highest poverty rate, with 68 households (55.3%) falling below the poverty line.
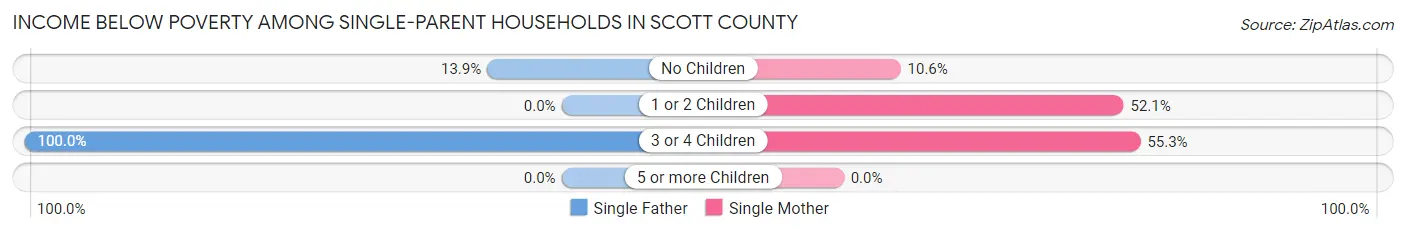
| Children | Single Father | Single Mother |
| No Children | 19 (13.9%) | 52 (10.6%) |
| 1 or 2 Children | 0 (0.0%) | 196 (52.1%) |
| 3 or 4 Children | 4 (100.0%) | 68 (55.3%) |
| 5 or more Children | 0 (0.0%) | 0 (0.0%) |
| Total | 23 (10.1%) | 316 (32.0%) |
Income Below Poverty Among Married-Couple vs Single-Parent Households in Scott County
The poverty data for Scott County shows that 314 of the married-couple family households (7.4%) and 339 of the single-parent households (27.9%) are living below the poverty level. Within the married-couple family households, those with 5 or more children have the highest poverty rate, with 1 households (9.1%) falling below the poverty line. Among the single-parent households, those with 3 or 4 children have the highest poverty rate, with 72 household (56.7%) living below poverty.
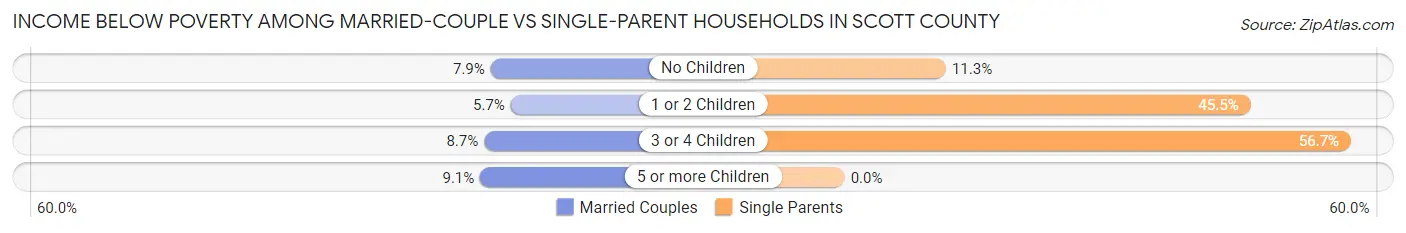
| Children | Married-Couple Families | Single-Parent Households |
| No Children | 228 (7.9%) | 71 (11.3%) |
| 1 or 2 Children | 60 (5.7%) | 196 (45.5%) |
| 3 or 4 Children | 25 (8.6%) | 72 (56.7%) |
| 5 or more Children | 1 (9.1%) | 0 (0.0%) |
| Total | 314 (7.4%) | 339 (27.9%) |
Race in Scott County
The most populous races in Scott County are White / Caucasian (20,899 | 97.0%), Hispanic or Latino (323 | 1.5%), and Two or more Races (293 | 1.4%).
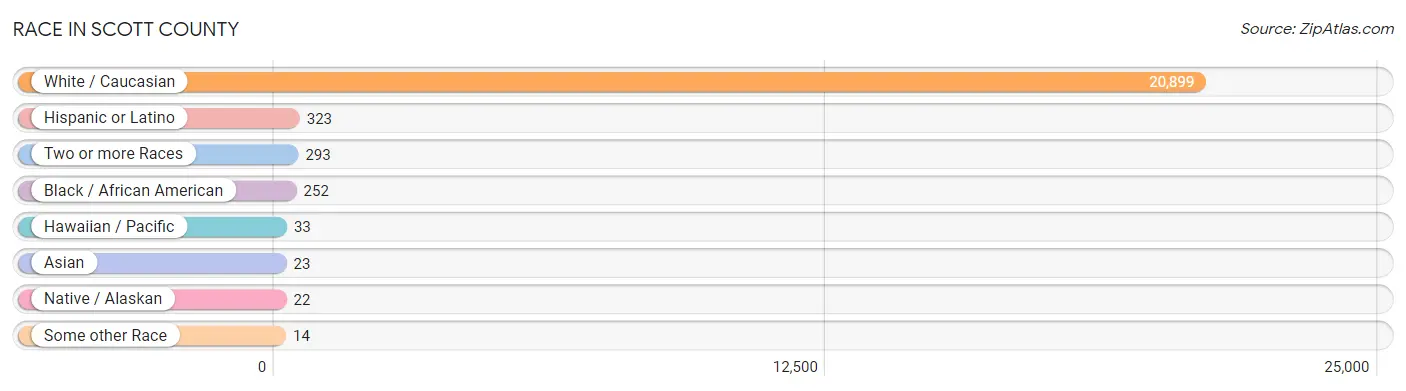
| Race | # Population | % Population |
| Asian | 23 | 0.1% |
| Black / African American | 252 | 1.2% |
| Hawaiian / Pacific | 33 | 0.2% |
| Hispanic or Latino | 323 | 1.5% |
| Native / Alaskan | 22 | 0.1% |
| White / Caucasian | 20,899 | 97.0% |
| Two or more Races | 293 | 1.4% |
| Some other Race | 14 | 0.1% |
| Total | 21,536 | 100.0% |
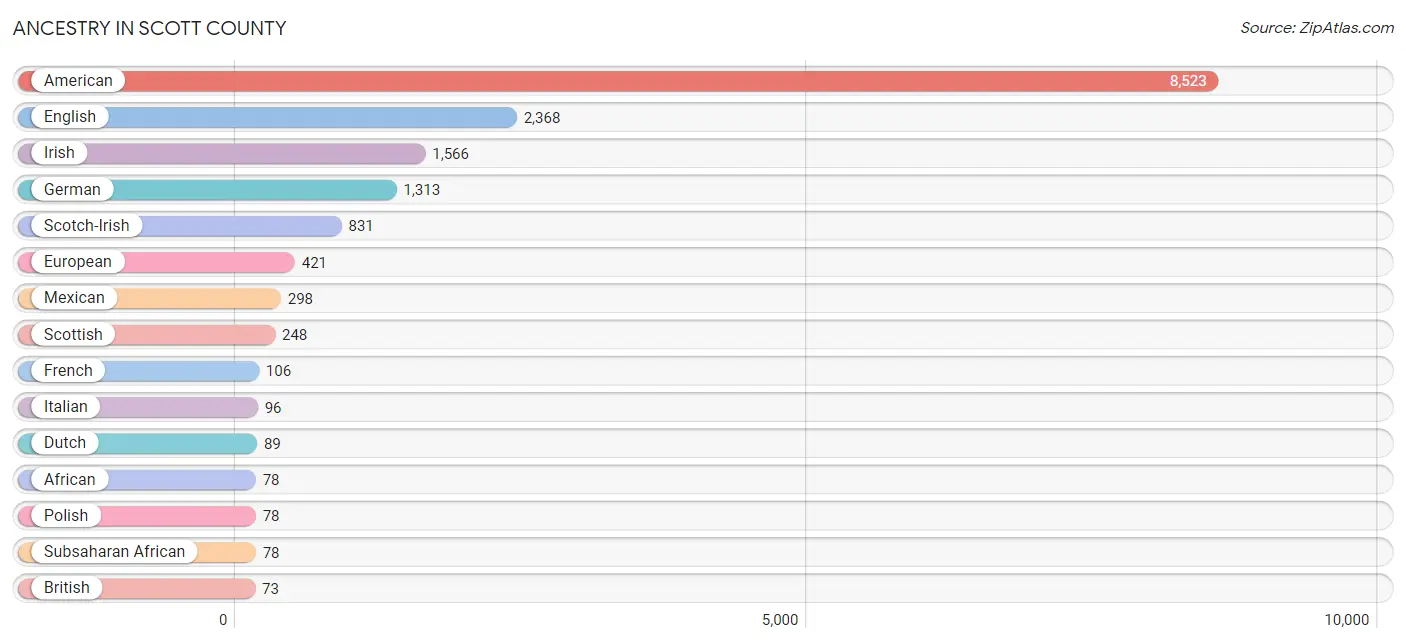
Ancestry in Scott County
The most populous ancestries reported in Scott County are American (8,523 | 39.6%), English (2,368 | 11.0%), Irish (1,566 | 7.3%), German (1,313 | 6.1%), and Scotch-Irish (831 | 3.9%), together accounting for 67.8% of all Scott County residents.
| Ancestry | # Population | % Population |
| African | 78 | 0.4% |
| American | 8,523 | 39.6% |
| Austrian | 38 | 0.2% |
| Bhutanese | 2 | 0.0% |
| British | 73 | 0.3% |
| Burmese | 24 | 0.1% |
| Canadian | 11 | 0.1% |
| Central American | 8 | 0.0% |
| Cherokee | 55 | 0.3% |
| Dutch | 89 | 0.4% |
| Eastern European | 34 | 0.2% |
| English | 2,368 | 11.0% |
| European | 421 | 1.9% |
| Finnish | 3 | 0.0% |
| French | 106 | 0.5% |
| French Canadian | 16 | 0.1% |
| German | 1,313 | 6.1% |
| Greek | 8 | 0.0% |
| Guamanian / Chamorro | 33 | 0.2% |
| Guatemalan | 8 | 0.0% |
| Haitian | 4 | 0.0% |
| Hungarian | 10 | 0.1% |
| Irish | 1,566 | 7.3% |
| Italian | 96 | 0.4% |
| Korean | 26 | 0.1% |
| Mexican | 298 | 1.4% |
| Northern European | 49 | 0.2% |
| Norwegian | 13 | 0.1% |
| Polish | 78 | 0.4% |
| Portuguese | 3 | 0.0% |
| Puerto Rican | 17 | 0.1% |
| Russian | 59 | 0.3% |
| Scandinavian | 13 | 0.1% |
| Scotch-Irish | 831 | 3.9% |
| Scottish | 248 | 1.1% |
| Slovak | 4 | 0.0% |
| Subsaharan African | 78 | 0.4% |
| Swedish | 18 | 0.1% |
| Swiss | 9 | 0.0% |
| Turkish | 10 | 0.1% |
| Ukrainian | 12 | 0.1% |
| Welsh | 37 | 0.2% | View All 42 Rows |
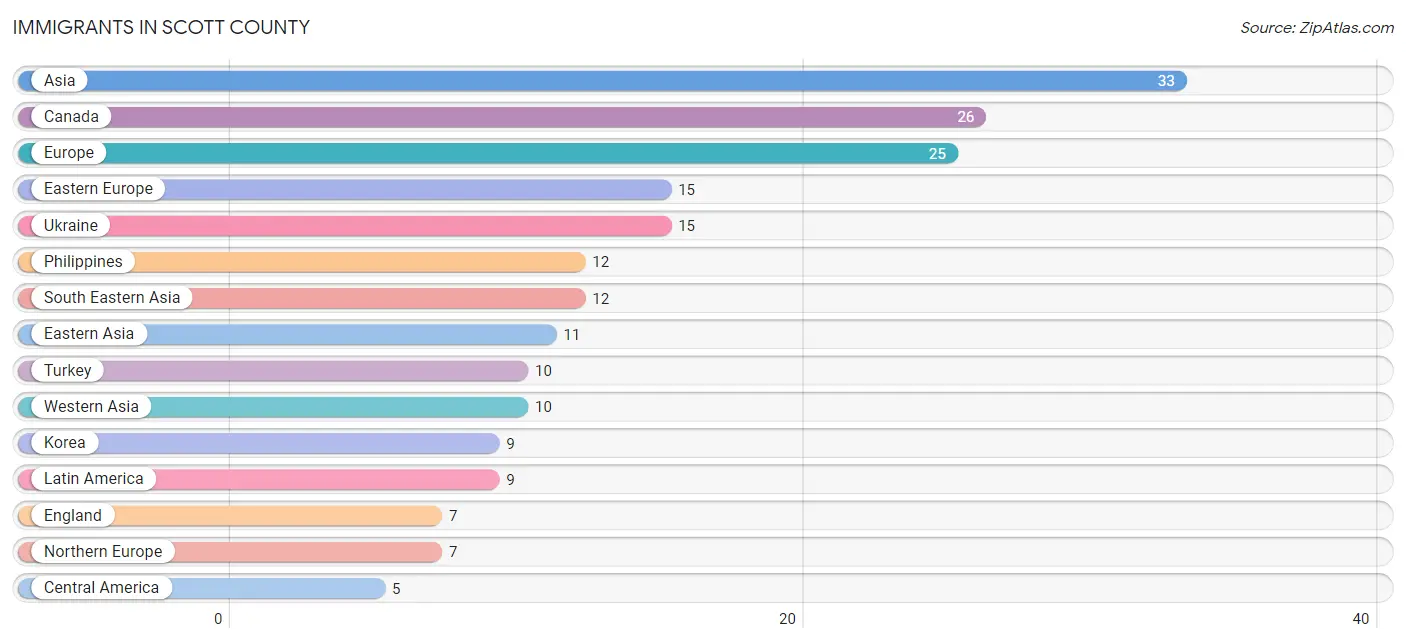
Immigrants in Scott County
The most numerous immigrant groups reported in Scott County came from Asia (33 | 0.2%), Canada (26 | 0.1%), Europe (25 | 0.1%), Eastern Europe (15 | 0.1%), and Ukraine (15 | 0.1%), together accounting for 0.5% of all Scott County residents.
| Immigration Origin | # Population | % Population |
| Asia | 33 | 0.2% |
| Canada | 26 | 0.1% |
| Caribbean | 4 | 0.0% |
| Central America | 5 | 0.0% |
| Eastern Asia | 11 | 0.1% |
| Eastern Europe | 15 | 0.1% |
| England | 7 | 0.0% |
| Europe | 25 | 0.1% |
| Guatemala | 3 | 0.0% |
| Haiti | 4 | 0.0% |
| Japan | 2 | 0.0% |
| Korea | 9 | 0.0% |
| Latin America | 9 | 0.0% |
| Mexico | 2 | 0.0% |
| Netherlands | 3 | 0.0% |
| Northern Europe | 7 | 0.0% |
| Philippines | 12 | 0.1% |
| South Eastern Asia | 12 | 0.1% |
| Turkey | 10 | 0.1% |
| Ukraine | 15 | 0.1% |
| Western Asia | 10 | 0.1% |
| Western Europe | 3 | 0.0% | View All 22 Rows |
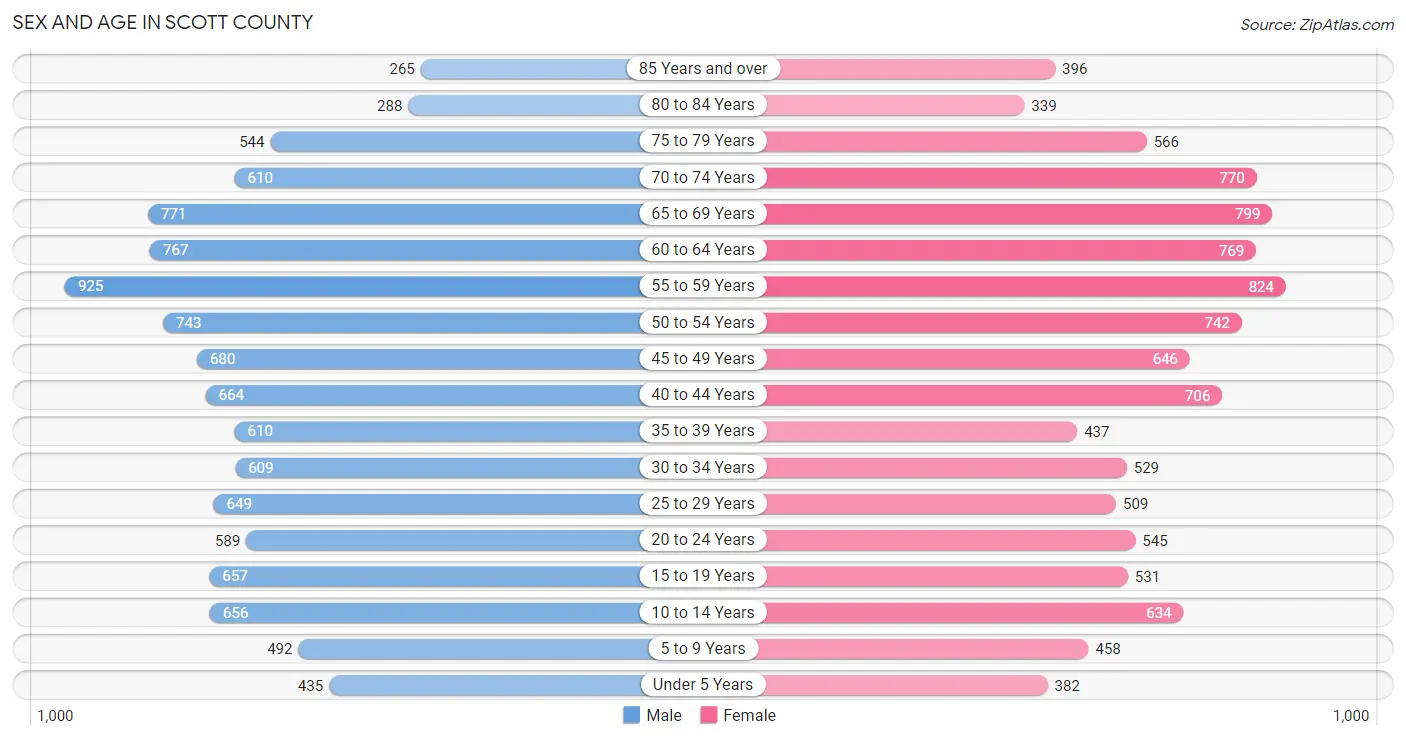
Sex and Age in Scott County
Sex and Age in Scott County
The most populous age groups in Scott County are 55 to 59 Years (925 | 8.4%) for men and 55 to 59 Years (824 | 7.8%) for women.
| Age Bracket | Male | Female |
| Under 5 Years | 435 (4.0%) | 382 (3.6%) |
| 5 to 9 Years | 492 (4.5%) | 458 (4.3%) |
| 10 to 14 Years | 656 (6.0%) | 634 (6.0%) |
| 15 to 19 Years | 657 (6.0%) | 531 (5.0%) |
| 20 to 24 Years | 589 (5.4%) | 545 (5.1%) |
| 25 to 29 Years | 649 (5.9%) | 509 (4.8%) |
| 30 to 34 Years | 609 (5.6%) | 529 (5.0%) |
| 35 to 39 Years | 610 (5.6%) | 437 (4.1%) |
| 40 to 44 Years | 664 (6.1%) | 706 (6.7%) |
| 45 to 49 Years | 680 (6.2%) | 646 (6.1%) |
| 50 to 54 Years | 743 (6.8%) | 742 (7.0%) |
| 55 to 59 Years | 925 (8.4%) | 824 (7.8%) |
| 60 to 64 Years | 767 (7.0%) | 769 (7.3%) |
| 65 to 69 Years | 771 (7.0%) | 799 (7.5%) |
| 70 to 74 Years | 610 (5.6%) | 770 (7.3%) |
| 75 to 79 Years | 544 (5.0%) | 566 (5.3%) |
| 80 to 84 Years | 288 (2.6%) | 339 (3.2%) |
| 85 Years and over | 265 (2.4%) | 396 (3.7%) |
| Total | 10,954 (100.0%) | 10,582 (100.0%) |
Families and Households in Scott County
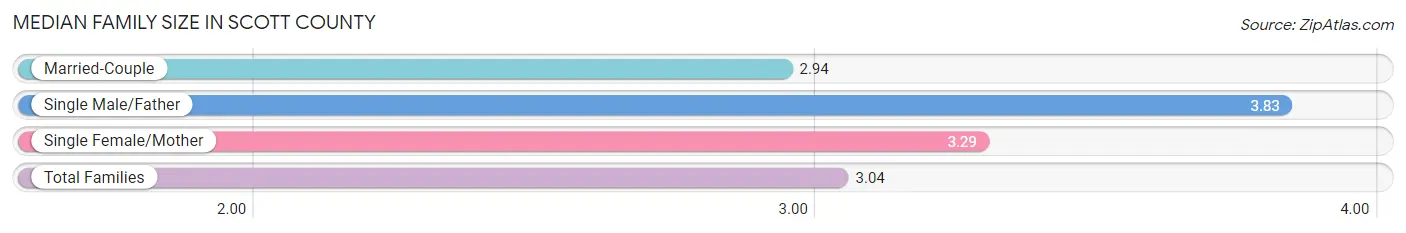
Median Family Size in Scott County
The median family size in Scott County is 3.04 persons per family, with single male/father families (227 | 4.2%) accounting for the largest median family size of 3.83 persons per family. On the other hand, married-couple families (4,236 | 77.7%) represent the smallest median family size with 2.94 persons per family.
| Family Type | # Families | Family Size |
| Married-Couple | 4,236 (77.7%) | 2.94 |
| Single Male/Father | 227 (4.2%) | 3.83 |
| Single Female/Mother | 989 (18.1%) | 3.29 |
| Total Families | 5,452 (100.0%) | 3.04 |
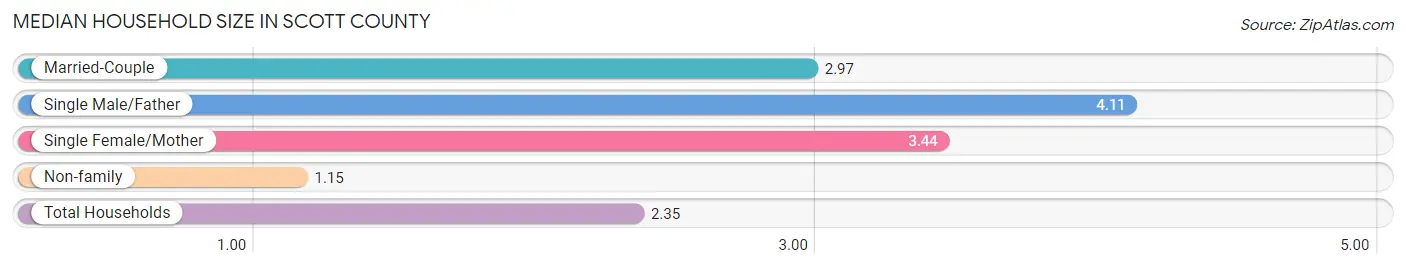
Median Household Size in Scott County
The median household size in Scott County is 2.35 persons per household, with single male/father households (227 | 2.6%) accounting for the largest median household size of 4.11 persons per household. non-family households (3,386 | 38.3%) represent the smallest median household size with 1.15 persons per household.
| Household Type | # Households | Household Size |
| Married-Couple | 4,236 (47.9%) | 2.97 |
| Single Male/Father | 227 (2.6%) | 4.11 |
| Single Female/Mother | 989 (11.2%) | 3.44 |
| Non-family | 3,386 (38.3%) | 1.15 |
| Total Households | 8,838 (100.0%) | 2.35 |
Household Size by Marriage Status in Scott County
Out of a total of 8,838 households in Scott County, 5,452 (61.7%) are family households, while 3,386 (38.3%) are nonfamily households. The most numerous type of family households are 2-person households, comprising 3,093, and the most common type of nonfamily households are 1-person households, comprising 3,075.
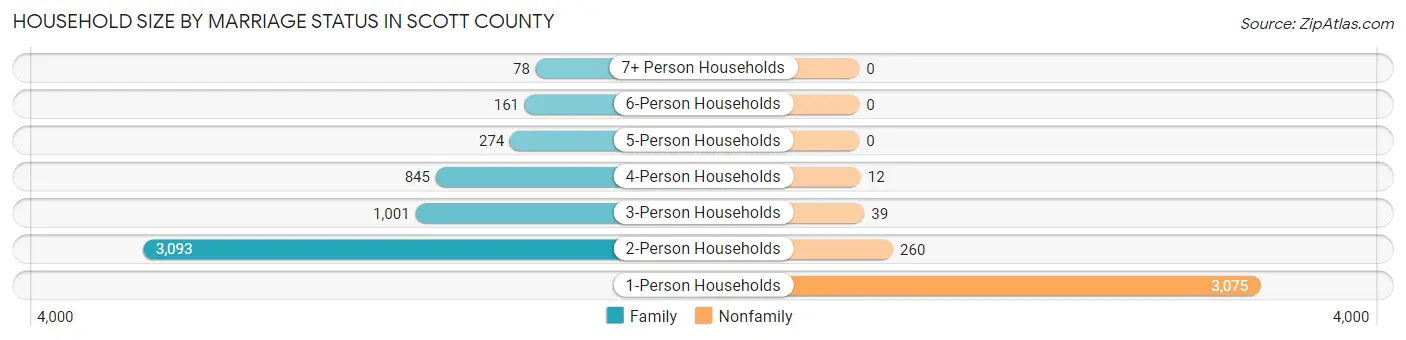
| Household Size | Family Households | Nonfamily Households |
| 1-Person Households | - | 3,075 (34.8%) |
| 2-Person Households | 3,093 (35.0%) | 260 (2.9%) |
| 3-Person Households | 1,001 (11.3%) | 39 (0.4%) |
| 4-Person Households | 845 (9.6%) | 12 (0.1%) |
| 5-Person Households | 274 (3.1%) | 0 (0.0%) |
| 6-Person Households | 161 (1.8%) | 0 (0.0%) |
| 7+ Person Households | 78 (0.9%) | 0 (0.0%) |
| Total | 5,452 (61.7%) | 3,386 (38.3%) |
Female Fertility in Scott County
Fertility by Age in Scott County
Average fertility rate in Scott County is 77.0 births per 1,000 women. Women in the age bracket of 20 to 34 years have the highest fertility rate with 128.0 births per 1,000 women. Women in the age bracket of 20 to 34 years acount for 65.7% of all women with births.
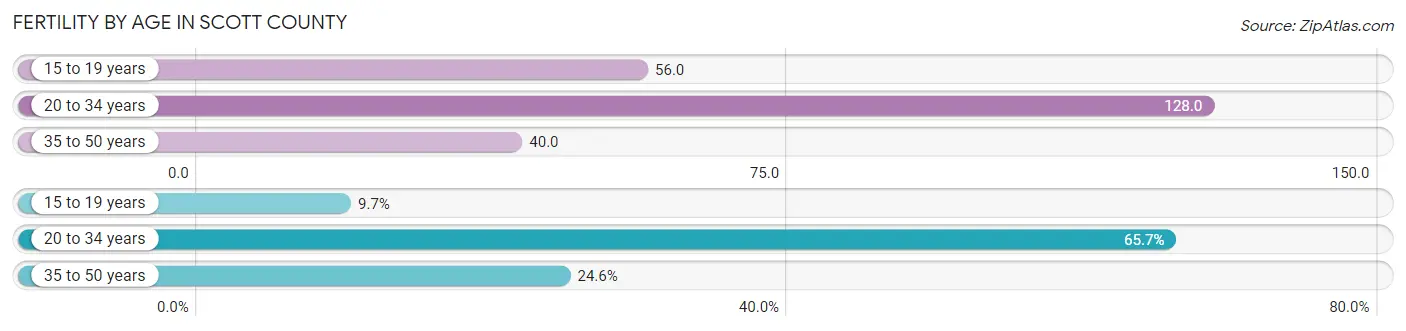
| Age Bracket | Women with Births | Births / 1,000 Women |
| 15 to 19 years | 30 (9.7%) | 56.0 |
| 20 to 34 years | 203 (65.7%) | 128.0 |
| 35 to 50 years | 76 (24.6%) | 40.0 |
| Total | 309 (100.0%) | 77.0 |
Fertility by Age by Marriage Status in Scott County
57.9% of women with births (309) in Scott County are married. The highest percentage of unmarried women with births falls into 15 to 19 years age bracket with 100.0% of them unmarried at the time of birth, while the lowest percentage of unmarried women with births belong to 35 to 50 years age bracket with 6.6% of them unmarried.
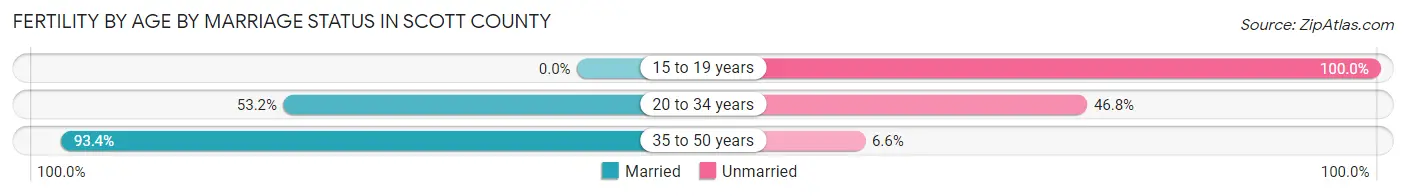
| Age Bracket | Married | Unmarried |
| 15 to 19 years | 0 (0.0%) | 30 (100.0%) |
| 20 to 34 years | 108 (53.2%) | 95 (46.8%) |
| 35 to 50 years | 71 (93.4%) | 5 (6.6%) |
| Total | 179 (57.9%) | 130 (42.1%) |
Fertility by Education in Scott County
Average fertility rate in Scott County is 77.0 births per 1,000 women. Women with the education attainment of high school diploma have the highest fertility rate of 120.0 births per 1,000 women, while women with the education attainment of graduate degree have the lowest fertility at 19.0 births per 1,000 women. Women with the education attainment of high school diploma represent 44.7% of all women with births.
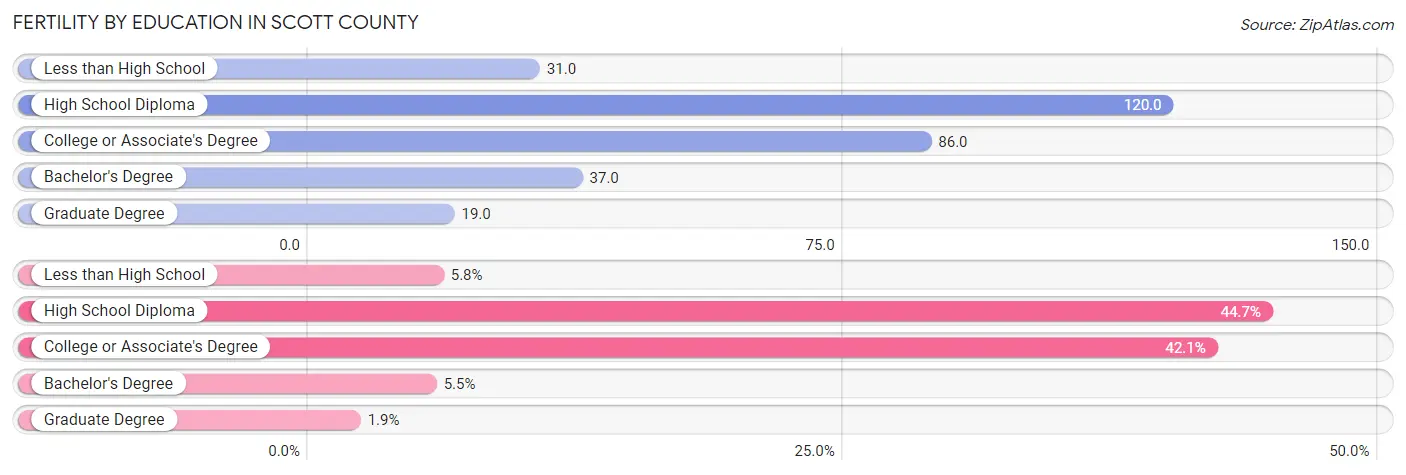
| Educational Attainment | Women with Births | Births / 1,000 Women |
| Less than High School | 18 (5.8%) | 31.0 |
| High School Diploma | 138 (44.7%) | 120.0 |
| College or Associate's Degree | 130 (42.1%) | 86.0 |
| Bachelor's Degree | 17 (5.5%) | 37.0 |
| Graduate Degree | 6 (1.9%) | 19.0 |
| Total | 309 (100.0%) | 77.0 |
Fertility by Education by Marriage Status in Scott County
42.1% of women with births in Scott County are unmarried. Women with the educational attainment of bachelor's degree are most likely to be married with 100.0% of them married at childbirth, while women with the educational attainment of college or associate's degree are least likely to be married with 55.4% of them unmarried at childbirth.
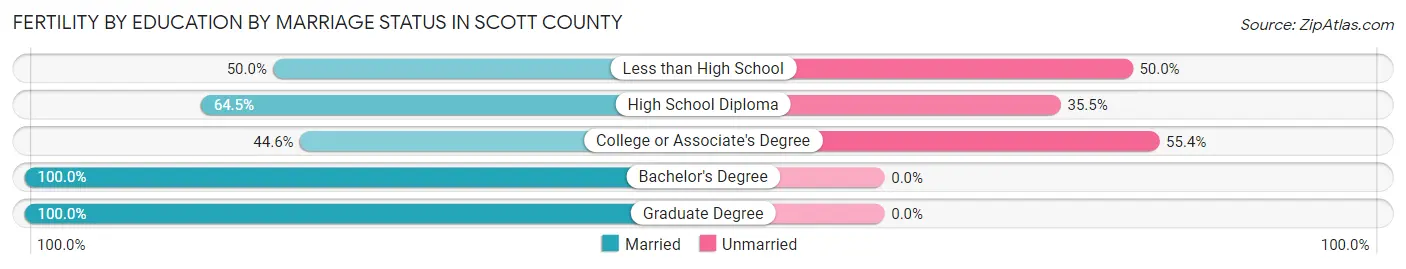
| Educational Attainment | Married | Unmarried |
| Less than High School | 9 (50.0%) | 9 (50.0%) |
| High School Diploma | 89 (64.5%) | 49 (35.5%) |
| College or Associate's Degree | 58 (44.6%) | 72 (55.4%) |
| Bachelor's Degree | 17 (100.0%) | 0 (0.0%) |
| Graduate Degree | 6 (100.0%) | 0 (0.0%) |
| Total | 179 (57.9%) | 130 (42.1%) |
Employment Characteristics in Scott County
Employment by Class of Employer in Scott County
Among the 7,808 employed individuals in Scott County, private company employees (5,457 | 69.9%), local government employees (746 | 9.6%), and not-for-profit organizations (587 | 7.5%) make up the most common classes of employment.
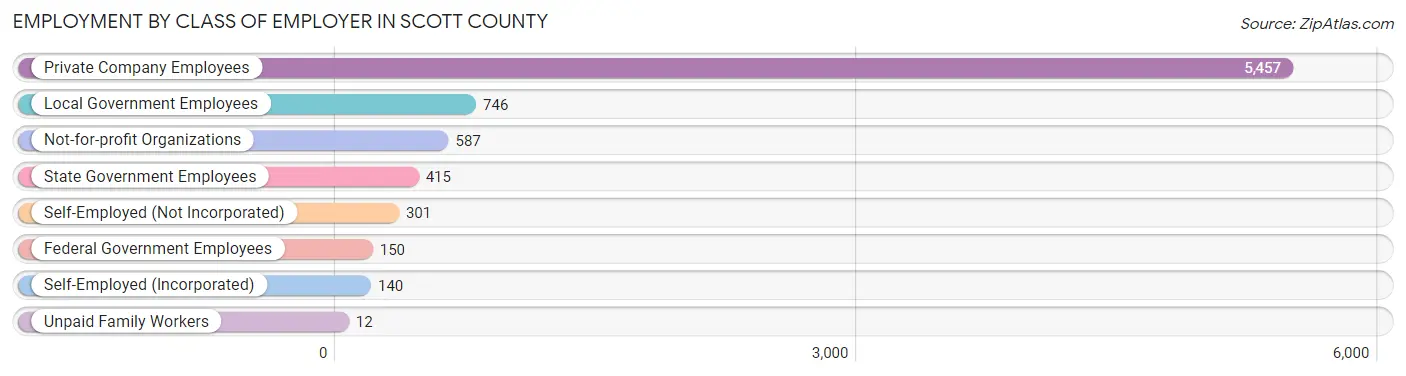
| Employer Class | # Employees | % Employees |
| Private Company Employees | 5,457 | 69.9% |
| Self-Employed (Incorporated) | 140 | 1.8% |
| Self-Employed (Not Incorporated) | 301 | 3.9% |
| Not-for-profit Organizations | 587 | 7.5% |
| Local Government Employees | 746 | 9.6% |
| State Government Employees | 415 | 5.3% |
| Federal Government Employees | 150 | 1.9% |
| Unpaid Family Workers | 12 | 0.2% |
| Total | 7,808 | 100.0% |
Employment Status by Age in Scott County
According to the labor force statistics for Scott County, out of the total population over 16 years of age (18,094), 45.4% or 8,215 individuals are in the labor force, with 3.4% or 279 of them unemployed. The age group with the highest labor force participation rate is 25 to 29 years, with 70.1% or 812 individuals in the labor force. Within the labor force, the 16 to 19 years age range has the highest percentage of unemployed individuals, with 12.8% or 36 of them being unemployed.
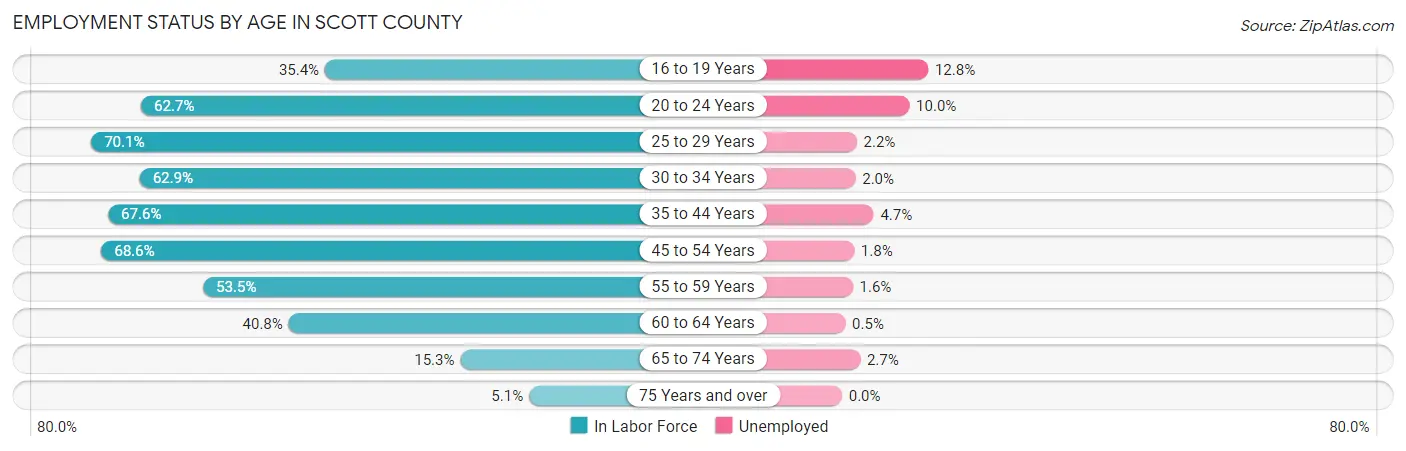
| Age Bracket | In Labor Force | Unemployed |
| 16 to 19 Years | 284 (35.4%) | 36 (12.8%) |
| 20 to 24 Years | 711 (62.7%) | 71 (10.0%) |
| 25 to 29 Years | 812 (70.1%) | 18 (2.2%) |
| 30 to 34 Years | 716 (62.9%) | 14 (2.0%) |
| 35 to 44 Years | 1,634 (67.6%) | 77 (4.7%) |
| 45 to 54 Years | 1,928 (68.6%) | 35 (1.8%) |
| 55 to 59 Years | 936 (53.5%) | 15 (1.6%) |
| 60 to 64 Years | 627 (40.8%) | 3 (0.5%) |
| 65 to 74 Years | 451 (15.3%) | 12 (2.7%) |
| 75 Years and over | 122 (5.1%) | 0 (0.0%) |
| Total | 8,215 (45.4%) | 279 (3.4%) |
Employment Status by Educational Attainment in Scott County
According to labor force statistics for Scott County, 61.5% of individuals (6,648) out of the total population between 25 and 64 years of age (10,809) are in the labor force, with 2.4% or 160 of them being unemployed. The group with the highest labor force participation rate are those with the educational attainment of bachelor's degree or higher, with 78.7% or 1,286 individuals in the labor force. Within the labor force, individuals with college / associate degree education have the highest percentage of unemployment, with 3.5% or 100 of them being unemployed.
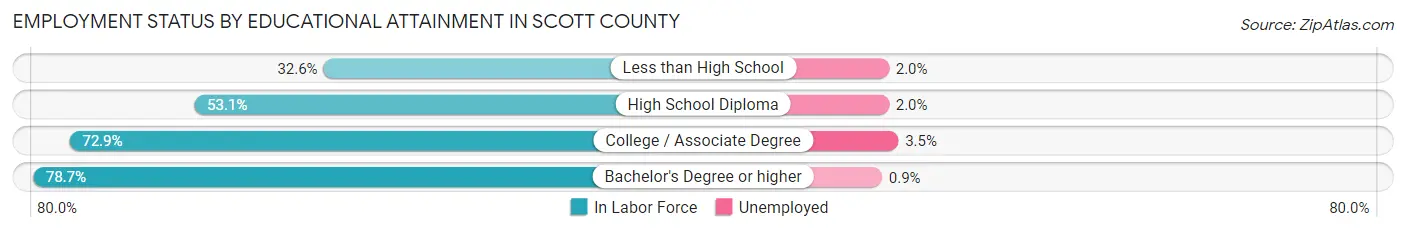
| Educational Attainment | In Labor Force | Unemployed |
| Less than High School | 453 (32.6%) | 28 (2.0%) |
| High School Diploma | 2,054 (53.1%) | 77 (2.0%) |
| College / Associate Degree | 2,855 (72.9%) | 137 (3.5%) |
| Bachelor's Degree or higher | 1,286 (78.7%) | 15 (0.9%) |
| Total | 6,648 (61.5%) | 259 (2.4%) |
Employment Occupations by Sex in Scott County
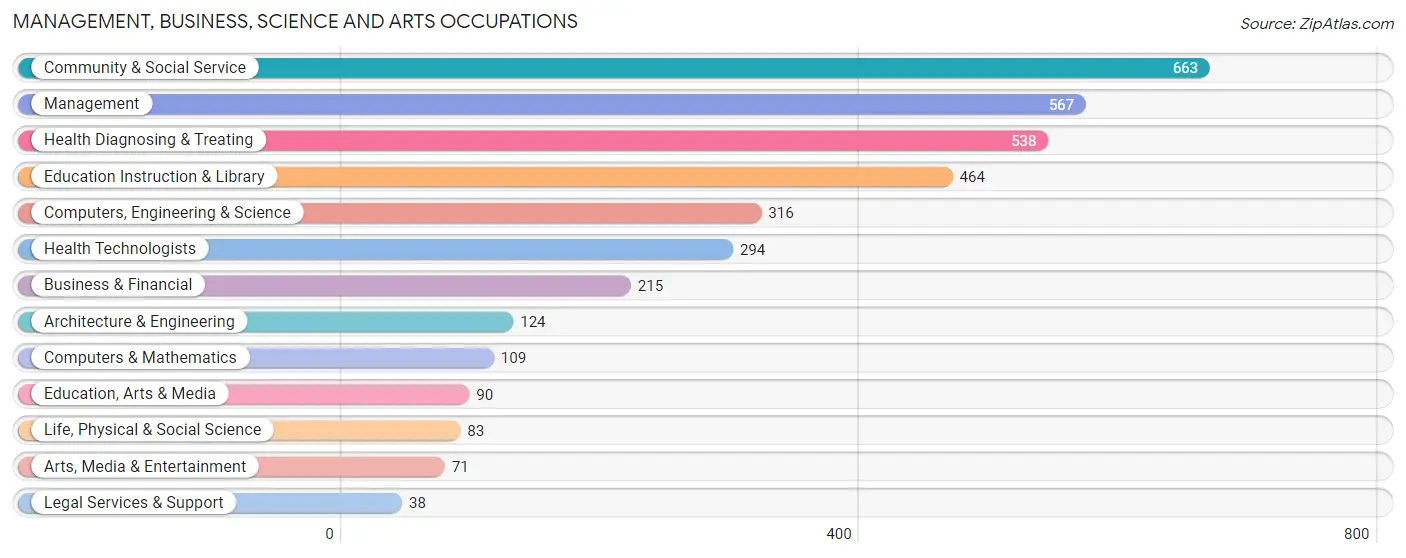
Management, Business, Science and Arts Occupations
The most common Management, Business, Science and Arts occupations in Scott County are Community & Social Service (663 | 8.4%), Management (567 | 7.2%), Health Diagnosing & Treating (538 | 6.8%), Education Instruction & Library (464 | 5.9%), and Computers, Engineering & Science (316 | 4.0%).
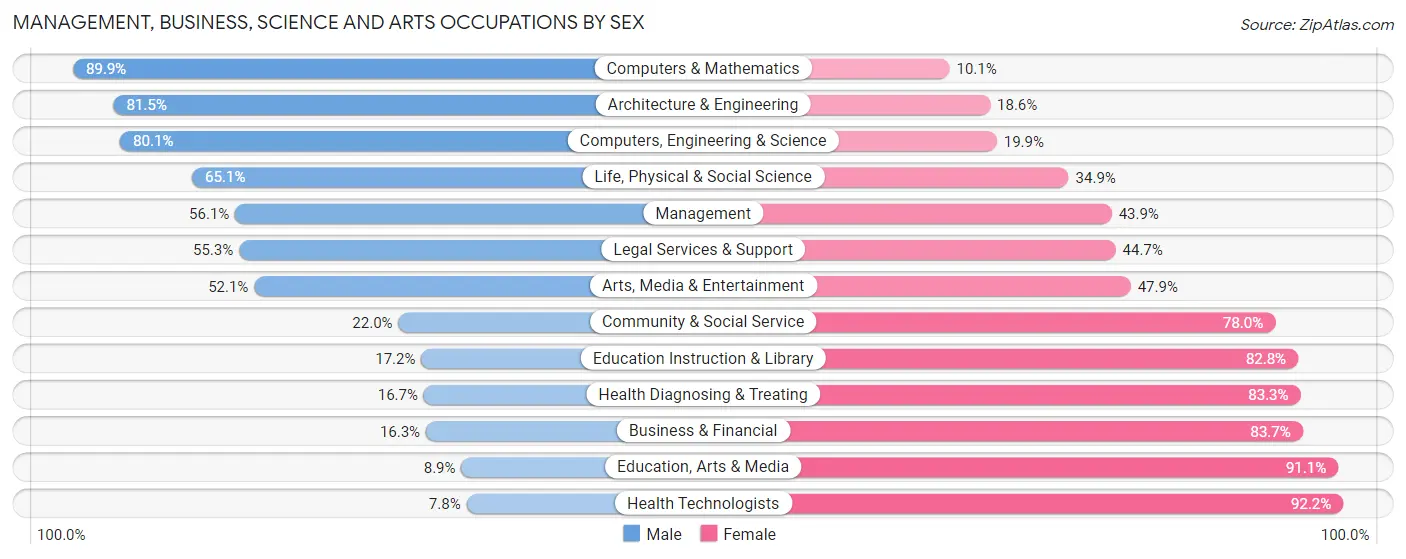
Management, Business, Science and Arts Occupations by Sex
Within the Management, Business, Science and Arts occupations in Scott County, the most male-oriented occupations are Computers & Mathematics (89.9%), Architecture & Engineering (81.5%), and Computers, Engineering & Science (80.1%), while the most female-oriented occupations are Health Technologists (92.2%), Education, Arts & Media (91.1%), and Business & Financial (83.7%).
| Occupation | Male | Female |
| Management | 318 (56.1%) | 249 (43.9%) |
| Business & Financial | 35 (16.3%) | 180 (83.7%) |
| Computers, Engineering & Science | 253 (80.1%) | 63 (19.9%) |
| Computers & Mathematics | 98 (89.9%) | 11 (10.1%) |
| Architecture & Engineering | 101 (81.5%) | 23 (18.5%) |
| Life, Physical & Social Science | 54 (65.1%) | 29 (34.9%) |
| Community & Social Service | 146 (22.0%) | 517 (78.0%) |
| Education, Arts & Media | 8 (8.9%) | 82 (91.1%) |
| Legal Services & Support | 21 (55.3%) | 17 (44.7%) |
| Education Instruction & Library | 80 (17.2%) | 384 (82.8%) |
| Arts, Media & Entertainment | 37 (52.1%) | 34 (47.9%) |
| Health Diagnosing & Treating | 90 (16.7%) | 448 (83.3%) |
| Health Technologists | 23 (7.8%) | 271 (92.2%) |
| Total (Category) | 842 (36.6%) | 1,457 (63.4%) |
| Total (Overall) | 4,343 (55.1%) | 3,543 (44.9%) |
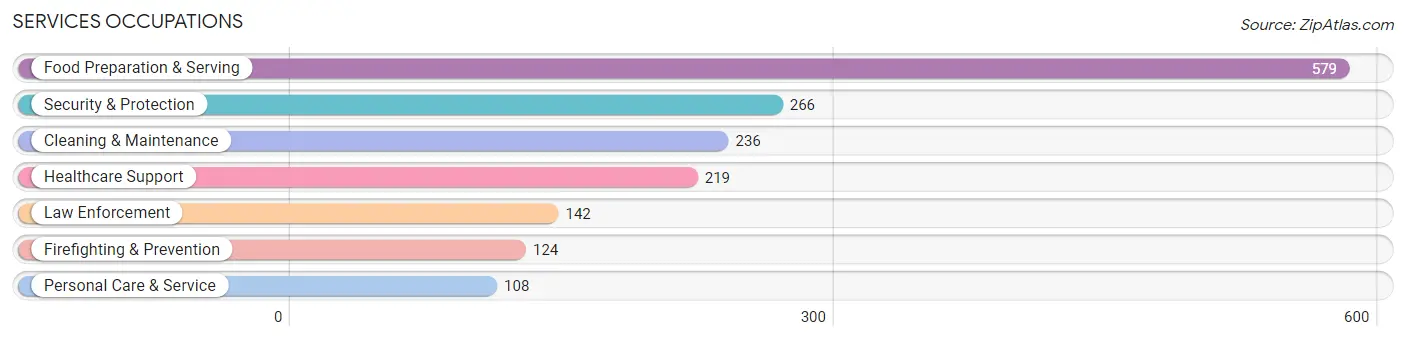
Services Occupations
The most common Services occupations in Scott County are Food Preparation & Serving (579 | 7.3%), Security & Protection (266 | 3.4%), Cleaning & Maintenance (236 | 3.0%), Healthcare Support (219 | 2.8%), and Law Enforcement (142 | 1.8%).
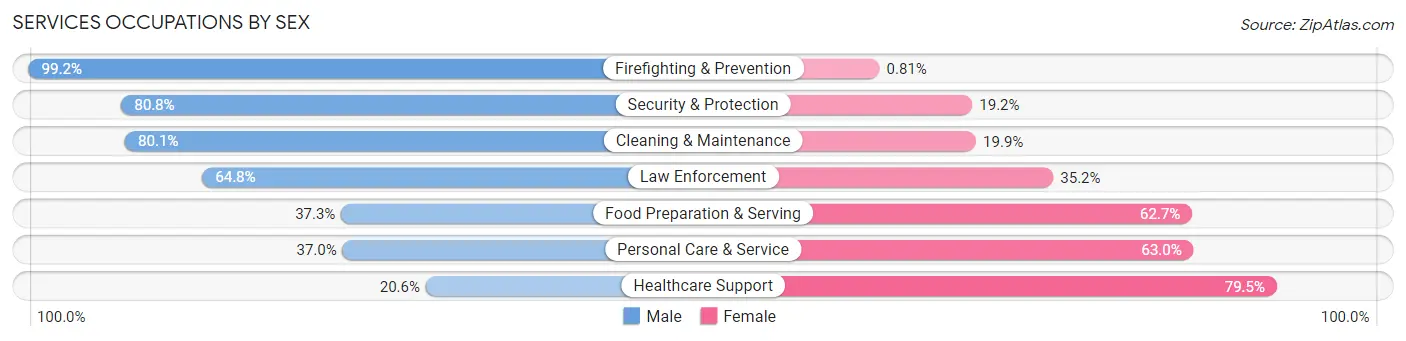
Services Occupations by Sex
Within the Services occupations in Scott County, the most male-oriented occupations are Firefighting & Prevention (99.2%), Security & Protection (80.8%), and Cleaning & Maintenance (80.1%), while the most female-oriented occupations are Healthcare Support (79.4%), Personal Care & Service (63.0%), and Food Preparation & Serving (62.7%).
| Occupation | Male | Female |
| Healthcare Support | 45 (20.5%) | 174 (79.4%) |
| Security & Protection | 215 (80.8%) | 51 (19.2%) |
| Firefighting & Prevention | 123 (99.2%) | 1 (0.8%) |
| Law Enforcement | 92 (64.8%) | 50 (35.2%) |
| Food Preparation & Serving | 216 (37.3%) | 363 (62.7%) |
| Cleaning & Maintenance | 189 (80.1%) | 47 (19.9%) |
| Personal Care & Service | 40 (37.0%) | 68 (63.0%) |
| Total (Category) | 705 (50.1%) | 703 (49.9%) |
| Total (Overall) | 4,343 (55.1%) | 3,543 (44.9%) |
Sales and Office Occupations
The most common Sales and Office occupations in Scott County are Office & Administration (805 | 10.2%), and Sales & Related (681 | 8.6%).

Sales and Office Occupations by Sex
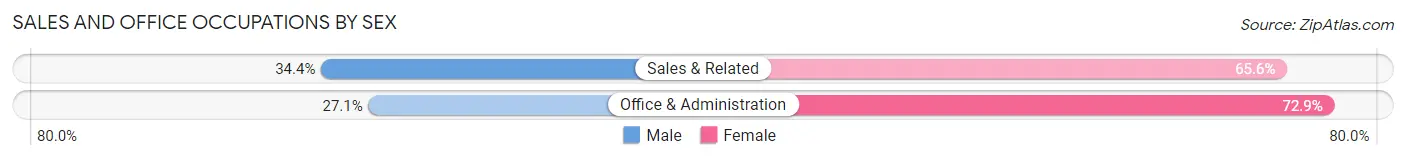
| Occupation | Male | Female |
| Sales & Related | 234 (34.4%) | 447 (65.6%) |
| Office & Administration | 218 (27.1%) | 587 (72.9%) |
| Total (Category) | 452 (30.4%) | 1,034 (69.6%) |
| Total (Overall) | 4,343 (55.1%) | 3,543 (44.9%) |
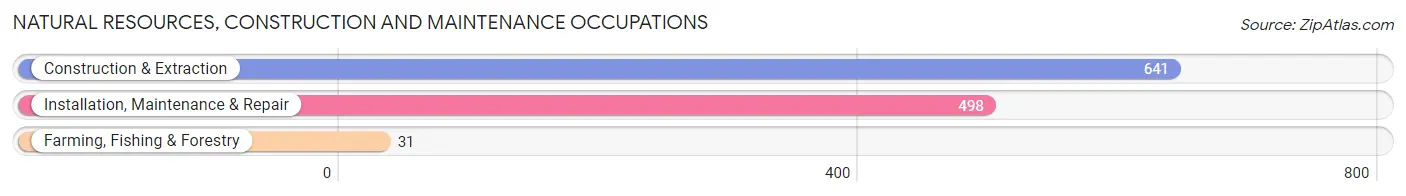
Natural Resources, Construction and Maintenance Occupations
The most common Natural Resources, Construction and Maintenance occupations in Scott County are Construction & Extraction (641 | 8.1%), Installation, Maintenance & Repair (498 | 6.3%), and Farming, Fishing & Forestry (31 | 0.4%).
Natural Resources, Construction and Maintenance Occupations by Sex
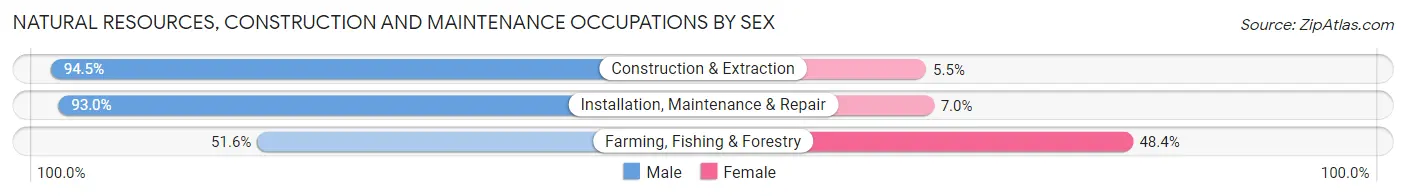
| Occupation | Male | Female |
| Farming, Fishing & Forestry | 16 (51.6%) | 15 (48.4%) |
| Construction & Extraction | 606 (94.5%) | 35 (5.5%) |
| Installation, Maintenance & Repair | 463 (93.0%) | 35 (7.0%) |
| Total (Category) | 1,085 (92.7%) | 85 (7.3%) |
| Total (Overall) | 4,343 (55.1%) | 3,543 (44.9%) |
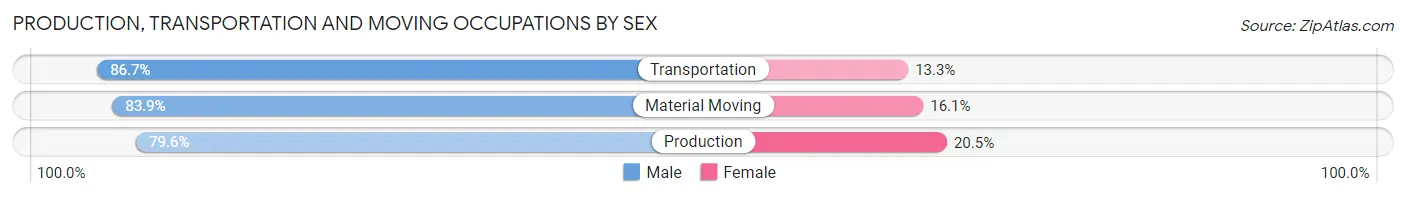
Production, Transportation and Moving Occupations
The most common Production, Transportation and Moving occupations in Scott County are Production (660 | 8.4%), Material Moving (503 | 6.4%), and Transportation (360 | 4.6%).
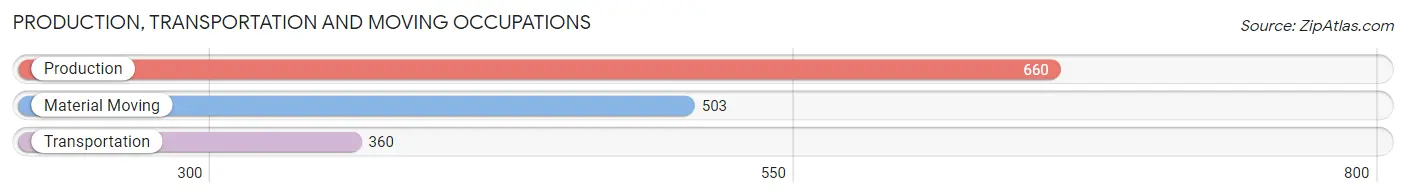
Production, Transportation and Moving Occupations by Sex
| Occupation | Male | Female |
| Production | 525 (79.5%) | 135 (20.4%) |
| Transportation | 312 (86.7%) | 48 (13.3%) |
| Material Moving | 422 (83.9%) | 81 (16.1%) |
| Total (Category) | 1,259 (82.7%) | 264 (17.3%) |
| Total (Overall) | 4,343 (55.1%) | 3,543 (44.9%) |
Employment Industries by Sex in Scott County
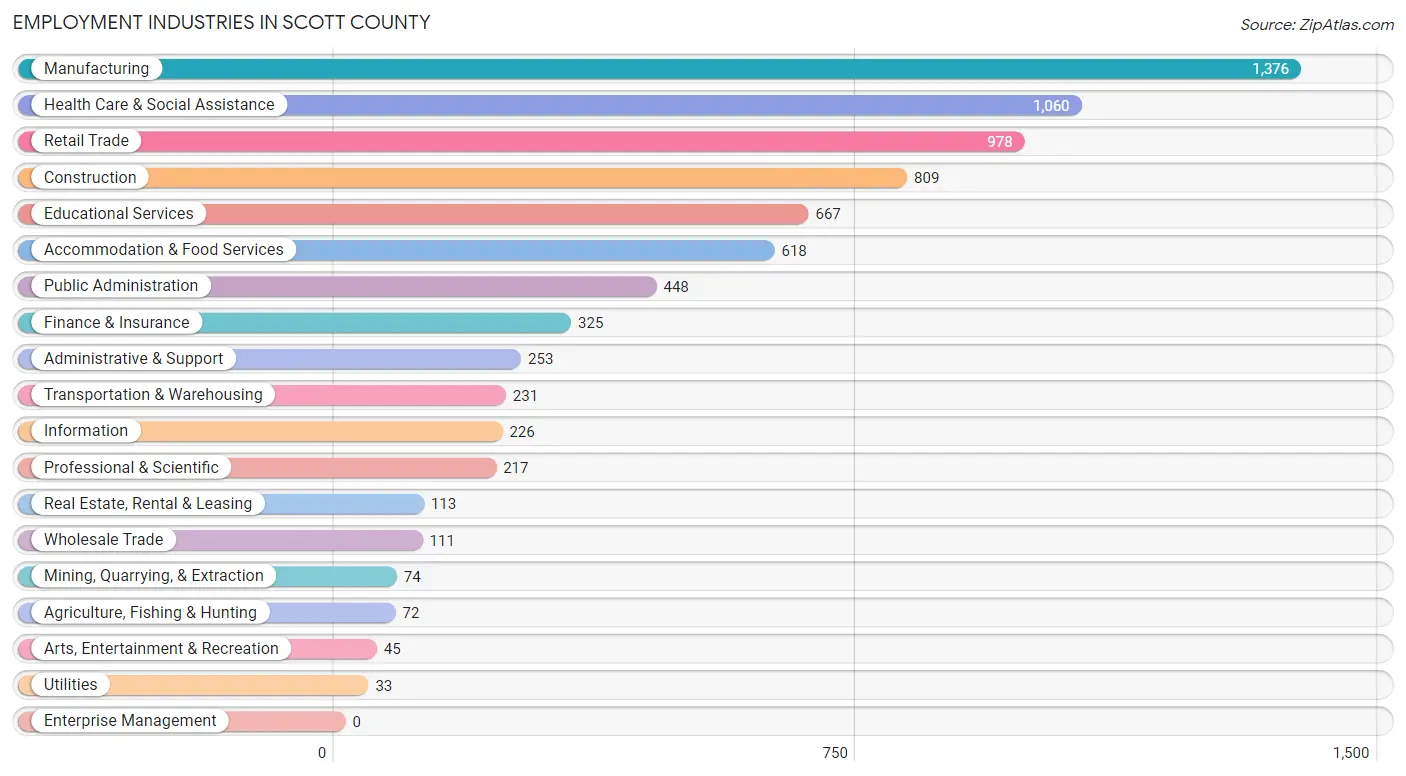
Employment Industries in Scott County
The major employment industries in Scott County include Manufacturing (1,376 | 17.4%), Health Care & Social Assistance (1,060 | 13.4%), Retail Trade (978 | 12.4%), Construction (809 | 10.3%), and Educational Services (667 | 8.5%).
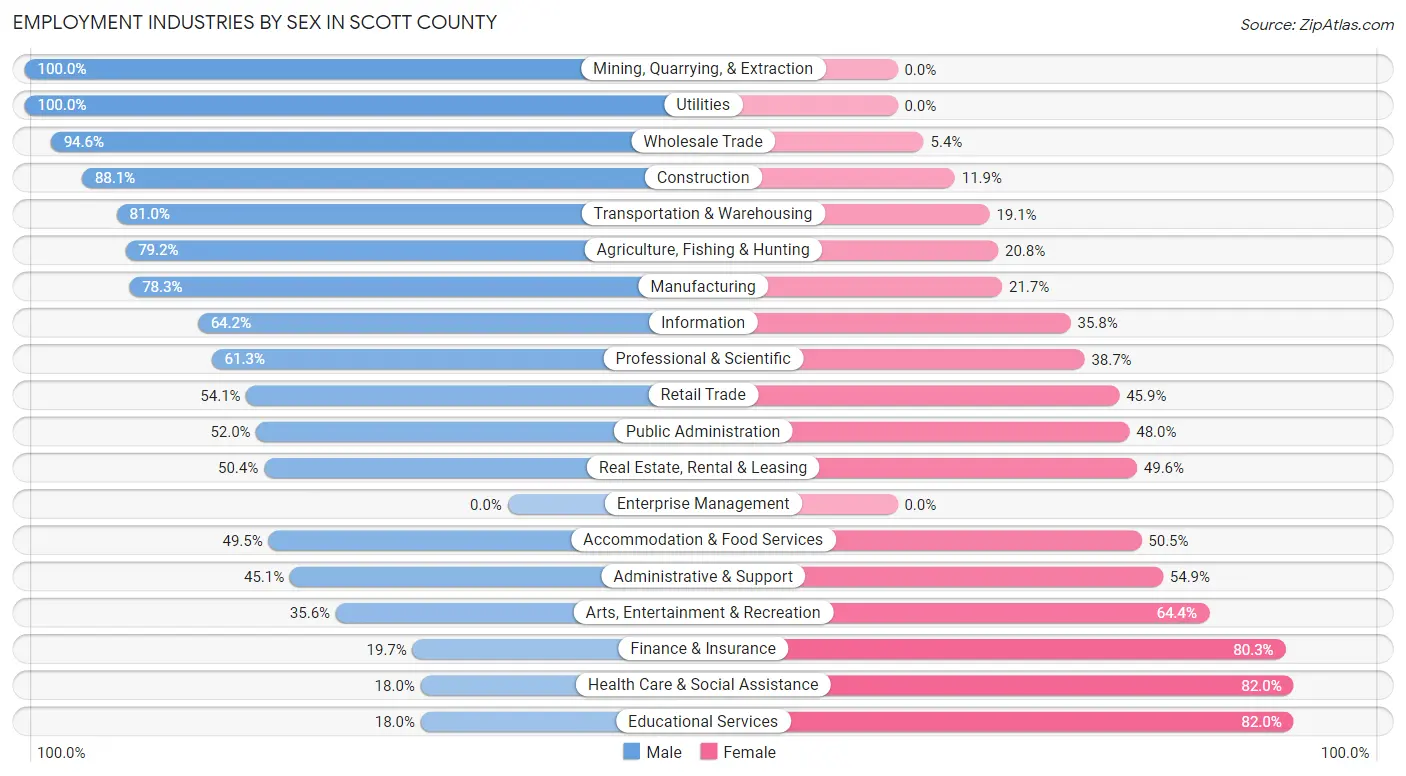
Employment Industries by Sex in Scott County
The Scott County industries that see more men than women are Mining, Quarrying, & Extraction (100.0%), Utilities (100.0%), and Wholesale Trade (94.6%), whereas the industries that tend to have a higher number of women are Educational Services (82.0%), Health Care & Social Assistance (82.0%), and Finance & Insurance (80.3%).
| Industry | Male | Female |
| Agriculture, Fishing & Hunting | 57 (79.2%) | 15 (20.8%) |
| Mining, Quarrying, & Extraction | 74 (100.0%) | 0 (0.0%) |
| Construction | 713 (88.1%) | 96 (11.9%) |
| Manufacturing | 1,078 (78.3%) | 298 (21.7%) |
| Wholesale Trade | 105 (94.6%) | 6 (5.4%) |
| Retail Trade | 529 (54.1%) | 449 (45.9%) |
| Transportation & Warehousing | 187 (80.9%) | 44 (19.1%) |
| Utilities | 33 (100.0%) | 0 (0.0%) |
| Information | 145 (64.2%) | 81 (35.8%) |
| Finance & Insurance | 64 (19.7%) | 261 (80.3%) |
| Real Estate, Rental & Leasing | 57 (50.4%) | 56 (49.6%) |
| Professional & Scientific | 133 (61.3%) | 84 (38.7%) |
| Enterprise Management | 0 (0.0%) | 0 (0.0%) |
| Administrative & Support | 114 (45.1%) | 139 (54.9%) |
| Educational Services | 120 (18.0%) | 547 (82.0%) |
| Health Care & Social Assistance | 191 (18.0%) | 869 (82.0%) |
| Arts, Entertainment & Recreation | 16 (35.6%) | 29 (64.4%) |
| Accommodation & Food Services | 306 (49.5%) | 312 (50.5%) |
| Public Administration | 233 (52.0%) | 215 (48.0%) |
| Total | 4,343 (55.1%) | 3,543 (44.9%) |
Education in Scott County
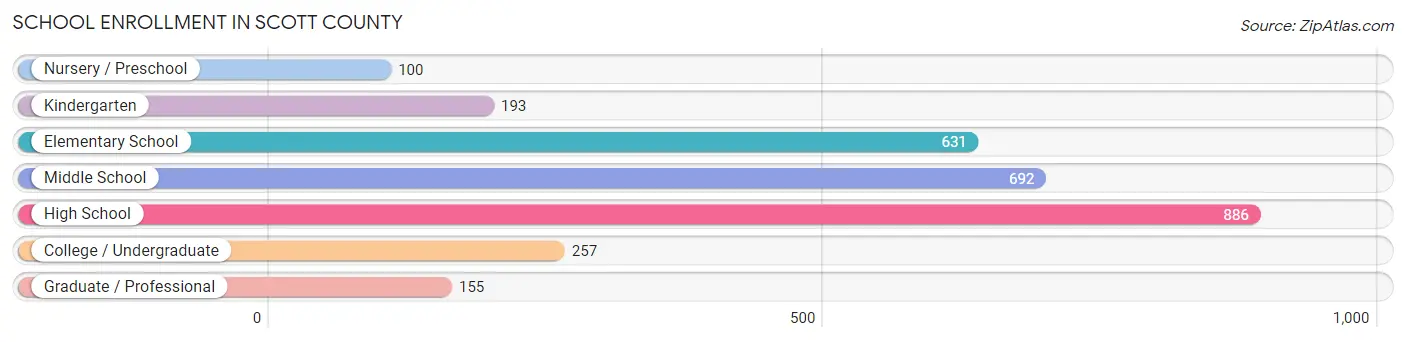
School Enrollment in Scott County
The most common levels of schooling among the 2,914 students in Scott County are high school (886 | 30.4%), middle school (692 | 23.7%), and elementary school (631 | 21.6%).
| School Level | # Students | % Students |
| Nursery / Preschool | 100 | 3.4% |
| Kindergarten | 193 | 6.6% |
| Elementary School | 631 | 21.6% |
| Middle School | 692 | 23.7% |
| High School | 886 | 30.4% |
| College / Undergraduate | 257 | 8.8% |
| Graduate / Professional | 155 | 5.3% |
| Total | 2,914 | 100.0% |
School Enrollment by Age by Funding Source in Scott County
Out of a total of 2,914 students who are enrolled in schools in Scott County, 286 (9.8%) attend a private institution, while the remaining 2,628 (90.2%) are enrolled in public schools. The age group of 35 years and over has the highest likelihood of being enrolled in private schools, with 66 (46.8% in the age bracket) enrolled. Conversely, the age group of 10 to 14 year olds has the lowest likelihood of being enrolled in a private school, with 882 (97.7% in the age bracket) attending a public institution.
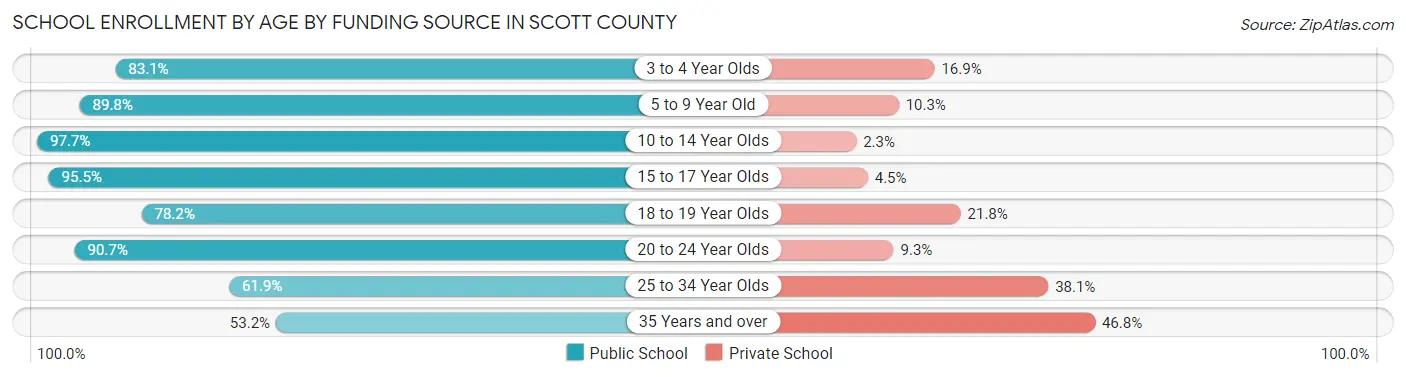
| Age Bracket | Public School | Private School |
| 3 to 4 Year Olds | 54 (83.1%) | 11 (16.9%) |
| 5 to 9 Year Old | 648 (89.7%) | 74 (10.2%) |
| 10 to 14 Year Olds | 882 (97.7%) | 21 (2.3%) |
| 15 to 17 Year Olds | 617 (95.5%) | 29 (4.5%) |
| 18 to 19 Year Olds | 158 (78.2%) | 44 (21.8%) |
| 20 to 24 Year Olds | 156 (90.7%) | 16 (9.3%) |
| 25 to 34 Year Olds | 39 (61.9%) | 24 (38.1%) |
| 35 Years and over | 75 (53.2%) | 66 (46.8%) |
| Total | 2,628 (90.2%) | 286 (9.8%) |
Educational Attainment by Field of Study in Scott County
Business (560 | 23.3%), education (533 | 22.2%), science & technology (225 | 9.4%), psychology (176 | 7.3%), and arts & humanities (132 | 5.5%) are the most common fields of study among 2,403 individuals in Scott County who have obtained a bachelor's degree or higher.
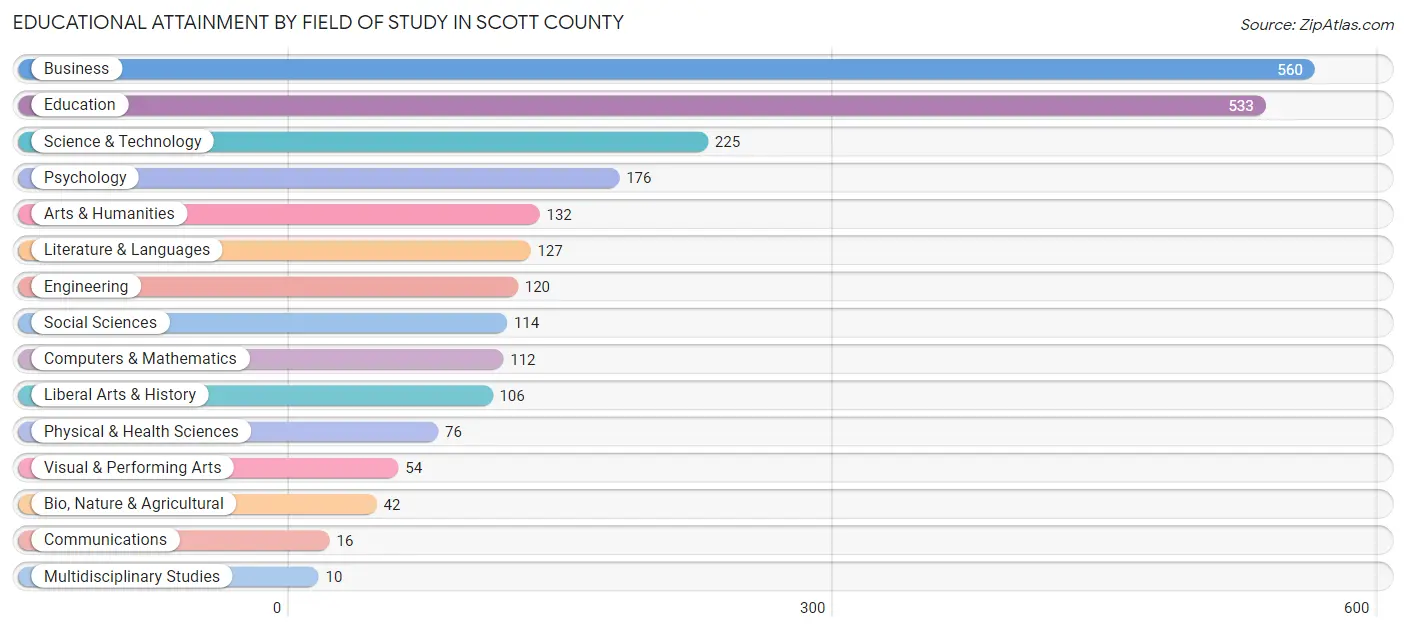
| Field of Study | # Graduates | % Graduates |
| Computers & Mathematics | 112 | 4.7% |
| Bio, Nature & Agricultural | 42 | 1.8% |
| Physical & Health Sciences | 76 | 3.2% |
| Psychology | 176 | 7.3% |
| Social Sciences | 114 | 4.7% |
| Engineering | 120 | 5.0% |
| Multidisciplinary Studies | 10 | 0.4% |
| Science & Technology | 225 | 9.4% |
| Business | 560 | 23.3% |
| Education | 533 | 22.2% |
| Literature & Languages | 127 | 5.3% |
| Liberal Arts & History | 106 | 4.4% |
| Visual & Performing Arts | 54 | 2.2% |
| Communications | 16 | 0.7% |
| Arts & Humanities | 132 | 5.5% |
| Total | 2,403 | 100.0% |
Transportation & Commute in Scott County
Vehicle Availability by Sex in Scott County
The most prevalent vehicle ownership categories in Scott County are males with 2 vehicles (1,597, accounting for 36.7%) and females with 2 vehicles (1,247, making up 46.2%).
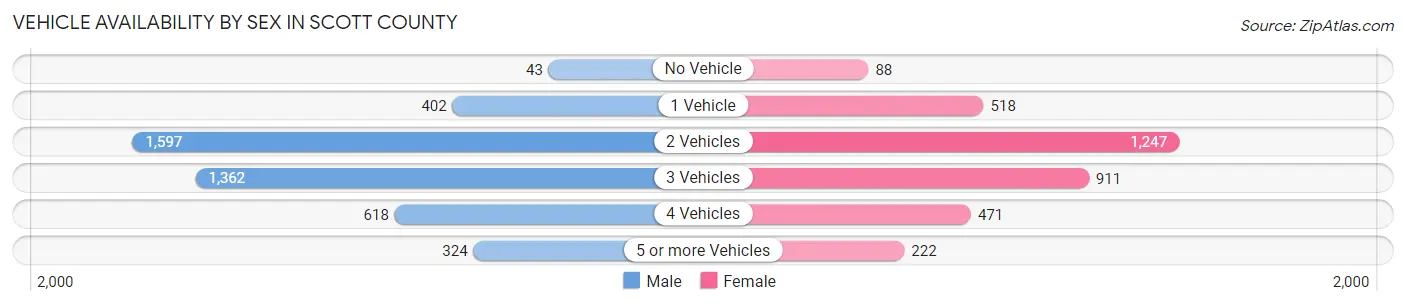
| Vehicles Available | Male | Female |
| No Vehicle | 43 (1.0%) | 88 (2.5%) |
| 1 Vehicle | 402 (9.2%) | 518 (15.0%) |
| 2 Vehicles | 1,597 (36.7%) | 1,247 (36.1%) |
| 3 Vehicles | 1,362 (31.3%) | 911 (26.4%) |
| 4 Vehicles | 618 (14.2%) | 471 (13.6%) |
| 5 or more Vehicles | 324 (7.5%) | 222 (6.4%) |
| Total | 4,346 (100.0%) | 3,457 (100.0%) |
Commute Time in Scott County
The most frequently occuring commute durations in Scott County are 30 to 34 minutes (1,367 commuters, 18.4%), 45 to 59 minutes (1,131 commuters, 15.2%), and 20 to 24 minutes (1,088 commuters, 14.7%).
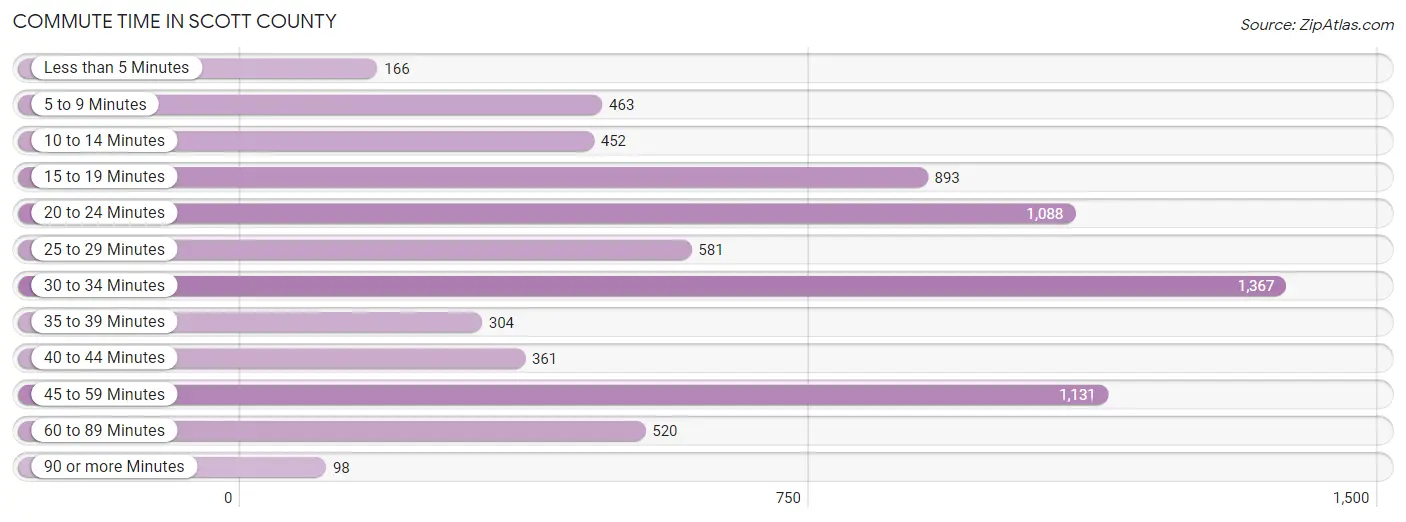
| Commute Time | # Commuters | % Commuters |
| Less than 5 Minutes | 166 | 2.2% |
| 5 to 9 Minutes | 463 | 6.2% |
| 10 to 14 Minutes | 452 | 6.1% |
| 15 to 19 Minutes | 893 | 12.0% |
| 20 to 24 Minutes | 1,088 | 14.7% |
| 25 to 29 Minutes | 581 | 7.8% |
| 30 to 34 Minutes | 1,367 | 18.4% |
| 35 to 39 Minutes | 304 | 4.1% |
| 40 to 44 Minutes | 361 | 4.9% |
| 45 to 59 Minutes | 1,131 | 15.2% |
| 60 to 89 Minutes | 520 | 7.0% |
| 90 or more Minutes | 98 | 1.3% |
Commute Time by Sex in Scott County
The most common commute times in Scott County are 30 to 34 minutes (808 commuters, 19.1%) for males and 30 to 34 minutes (559 commuters, 17.5%) for females.
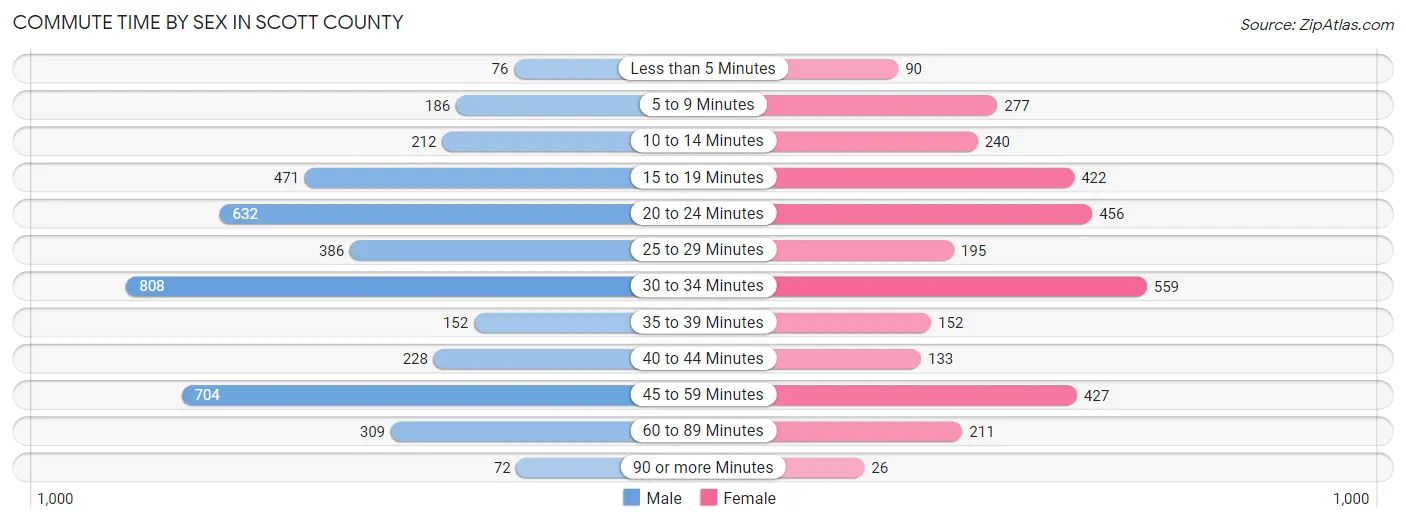
| Commute Time | Male | Female |
| Less than 5 Minutes | 76 (1.8%) | 90 (2.8%) |
| 5 to 9 Minutes | 186 (4.4%) | 277 (8.7%) |
| 10 to 14 Minutes | 212 (5.0%) | 240 (7.5%) |
| 15 to 19 Minutes | 471 (11.1%) | 422 (13.2%) |
| 20 to 24 Minutes | 632 (14.9%) | 456 (14.3%) |
| 25 to 29 Minutes | 386 (9.1%) | 195 (6.1%) |
| 30 to 34 Minutes | 808 (19.1%) | 559 (17.5%) |
| 35 to 39 Minutes | 152 (3.6%) | 152 (4.8%) |
| 40 to 44 Minutes | 228 (5.4%) | 133 (4.2%) |
| 45 to 59 Minutes | 704 (16.6%) | 427 (13.4%) |
| 60 to 89 Minutes | 309 (7.3%) | 211 (6.6%) |
| 90 or more Minutes | 72 (1.7%) | 26 (0.8%) |
Time of Departure to Work by Sex in Scott County
The most frequent times of departure to work in Scott County are 5:30 AM to 5:59 AM (544, 12.8%) for males and 7:30 AM to 7:59 AM (536, 16.8%) for females.
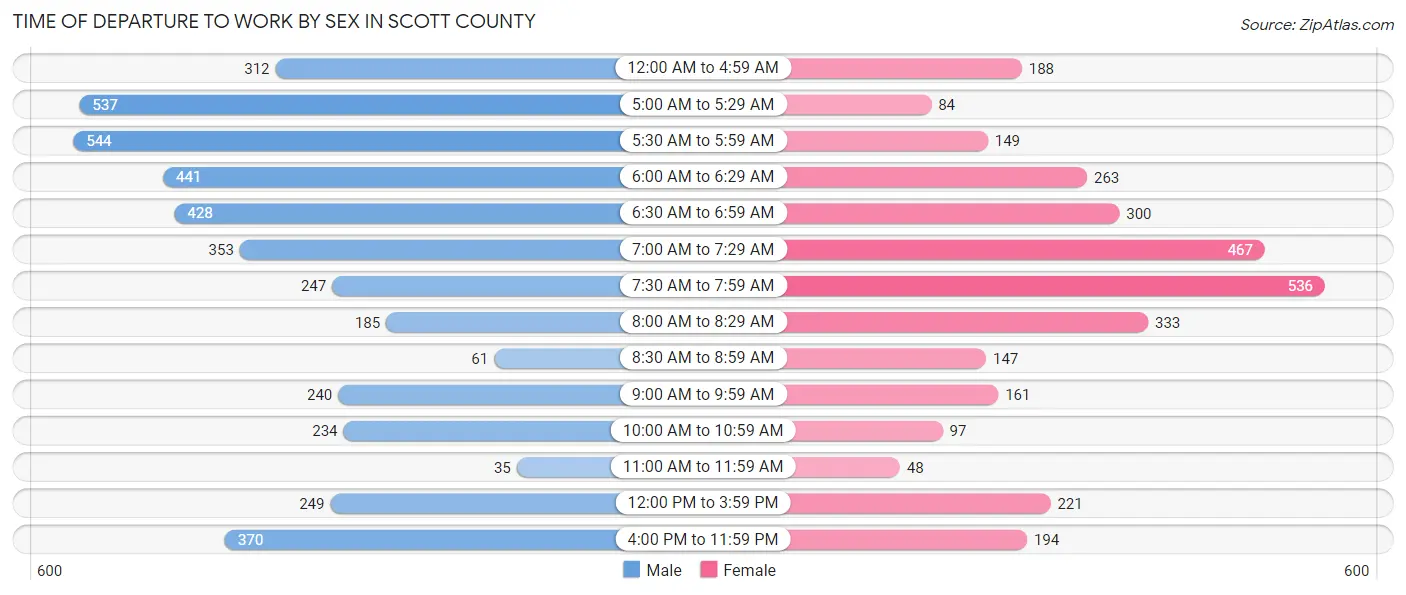
| Time of Departure | Male | Female |
| 12:00 AM to 4:59 AM | 312 (7.4%) | 188 (5.9%) |
| 5:00 AM to 5:29 AM | 537 (12.7%) | 84 (2.6%) |
| 5:30 AM to 5:59 AM | 544 (12.8%) | 149 (4.7%) |
| 6:00 AM to 6:29 AM | 441 (10.4%) | 263 (8.3%) |
| 6:30 AM to 6:59 AM | 428 (10.1%) | 300 (9.4%) |
| 7:00 AM to 7:29 AM | 353 (8.3%) | 467 (14.6%) |
| 7:30 AM to 7:59 AM | 247 (5.8%) | 536 (16.8%) |
| 8:00 AM to 8:29 AM | 185 (4.4%) | 333 (10.4%) |
| 8:30 AM to 8:59 AM | 61 (1.4%) | 147 (4.6%) |
| 9:00 AM to 9:59 AM | 240 (5.7%) | 161 (5.1%) |
| 10:00 AM to 10:59 AM | 234 (5.5%) | 97 (3.0%) |
| 11:00 AM to 11:59 AM | 35 (0.8%) | 48 (1.5%) |
| 12:00 PM to 3:59 PM | 249 (5.9%) | 221 (6.9%) |
| 4:00 PM to 11:59 PM | 370 (8.7%) | 194 (6.1%) |
| Total | 4,236 (100.0%) | 3,188 (100.0%) |
Housing Occupancy in Scott County
Occupancy by Ownership in Scott County
Of the total 8,838 dwellings in Scott County, owner-occupied units account for 6,941 (78.5%), while renter-occupied units make up 1,897 (21.5%).
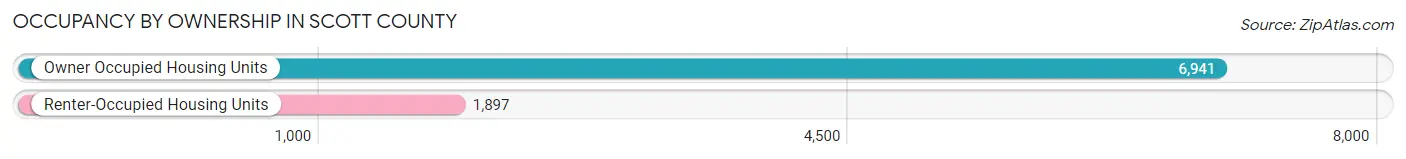
| Occupancy | # Housing Units | % Housing Units |
| Owner Occupied Housing Units | 6,941 | 78.5% |
| Renter-Occupied Housing Units | 1,897 | 21.5% |
| Total Occupied Housing Units | 8,838 | 100.0% |
Occupancy by Household Size in Scott County
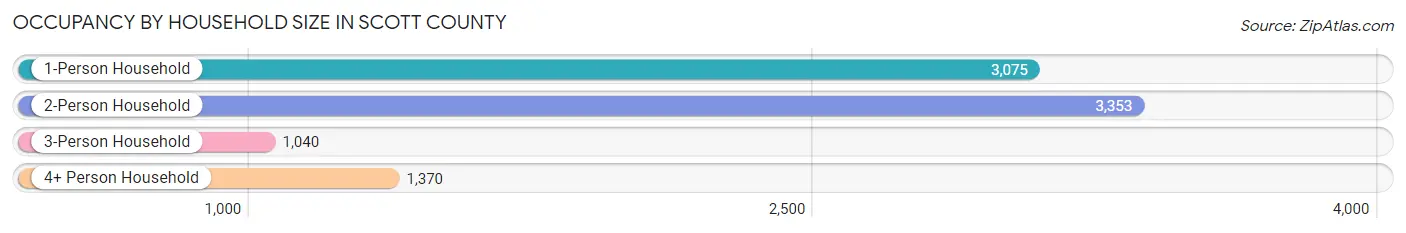
| Household Size | # Housing Units | % Housing Units |
| 1-Person Household | 3,075 | 34.8% |
| 2-Person Household | 3,353 | 37.9% |
| 3-Person Household | 1,040 | 11.8% |
| 4+ Person Household | 1,370 | 15.5% |
| Total Housing Units | 8,838 | 100.0% |
Occupancy by Ownership by Household Size in Scott County
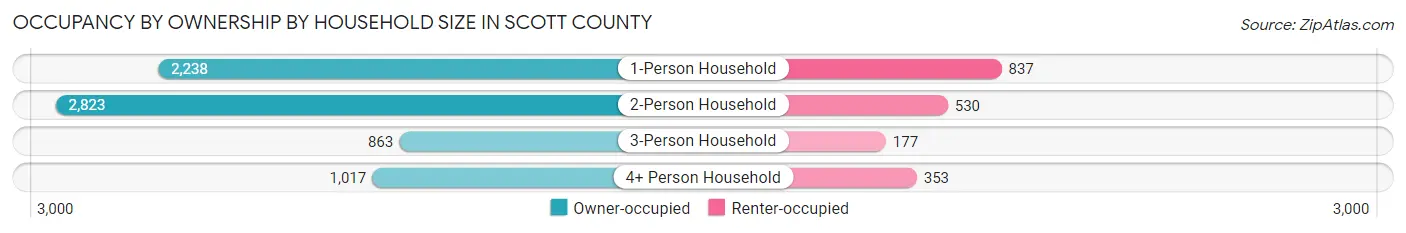
| Household Size | Owner-occupied | Renter-occupied |
| 1-Person Household | 2,238 (72.8%) | 837 (27.2%) |
| 2-Person Household | 2,823 (84.2%) | 530 (15.8%) |
| 3-Person Household | 863 (83.0%) | 177 (17.0%) |
| 4+ Person Household | 1,017 (74.2%) | 353 (25.8%) |
| Total Housing Units | 6,941 (78.5%) | 1,897 (21.5%) |
Occupancy by Educational Attainment in Scott County
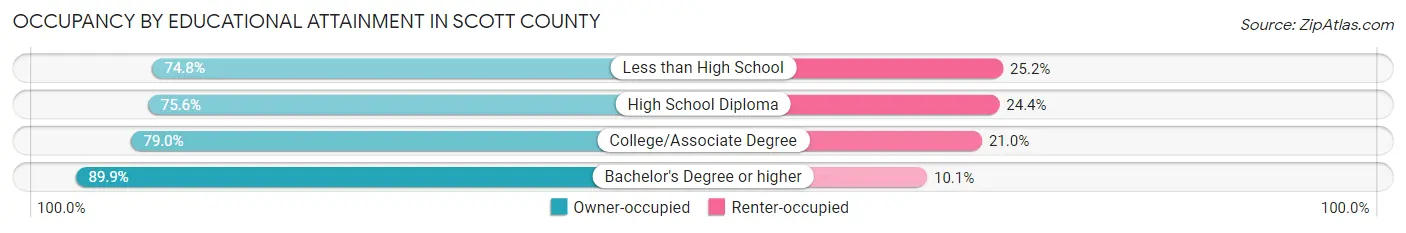
| Household Size | Owner-occupied | Renter-occupied |
| Less than High School | 1,165 (74.8%) | 392 (25.2%) |
| High School Diploma | 2,367 (75.6%) | 765 (24.4%) |
| College/Associate Degree | 2,331 (79.0%) | 619 (21.0%) |
| Bachelor's Degree or higher | 1,078 (89.9%) | 121 (10.1%) |
Occupancy by Age of Householder in Scott County
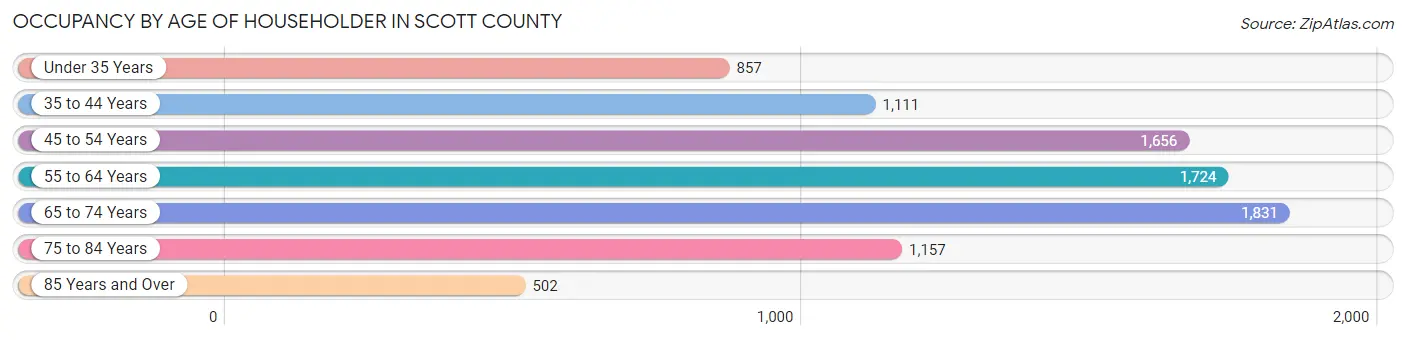
| Age Bracket | # Households | % Households |
| Under 35 Years | 857 | 9.7% |
| 35 to 44 Years | 1,111 | 12.6% |
| 45 to 54 Years | 1,656 | 18.7% |
| 55 to 64 Years | 1,724 | 19.5% |
| 65 to 74 Years | 1,831 | 20.7% |
| 75 to 84 Years | 1,157 | 13.1% |
| 85 Years and Over | 502 | 5.7% |
| Total | 8,838 | 100.0% |
Housing Finances in Scott County
Median Income by Occupancy in Scott County
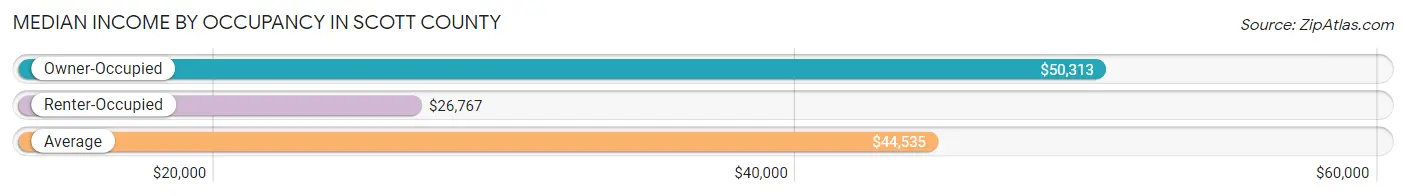
| Occupancy Type | # Households | Median Income |
| Owner-Occupied | 6,941 (78.5%) | $50,313 |
| Renter-Occupied | 1,897 (21.5%) | $26,767 |
| Average | 8,838 (100.0%) | $44,535 |
Occupancy by Householder Income Bracket in Scott County
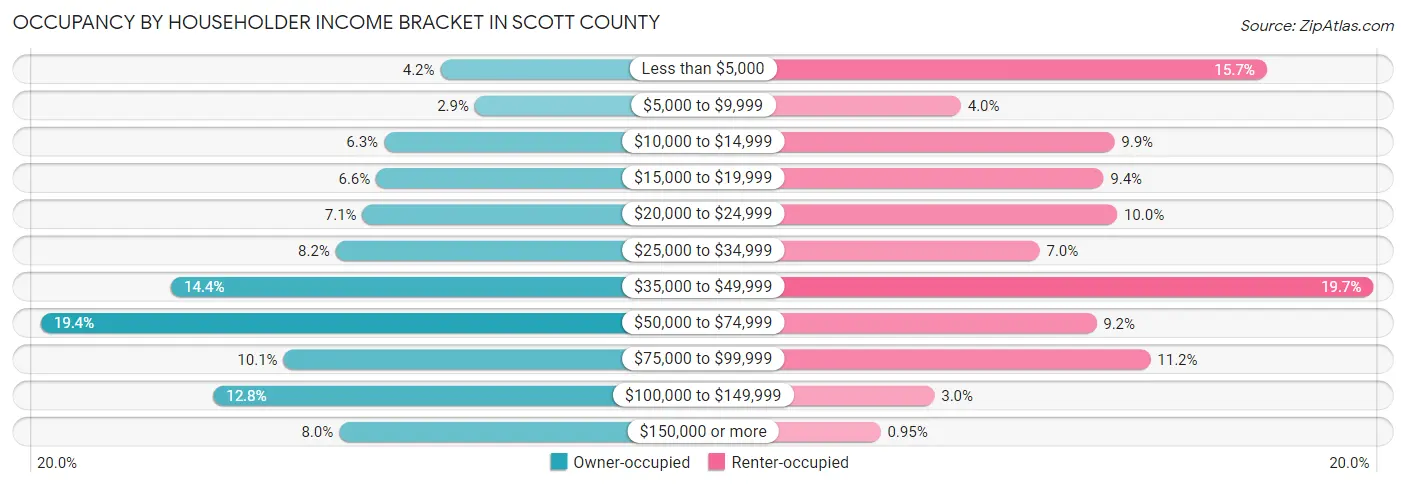
| Income Bracket | Owner-occupied | Renter-occupied |
| Less than $5,000 | 289 (4.2%) | 297 (15.7%) |
| $5,000 to $9,999 | 198 (2.9%) | 76 (4.0%) |
| $10,000 to $14,999 | 438 (6.3%) | 187 (9.9%) |
| $15,000 to $19,999 | 459 (6.6%) | 179 (9.4%) |
| $20,000 to $24,999 | 495 (7.1%) | 189 (10.0%) |
| $25,000 to $34,999 | 566 (8.2%) | 133 (7.0%) |
| $35,000 to $49,999 | 1,001 (14.4%) | 374 (19.7%) |
| $50,000 to $74,999 | 1,345 (19.4%) | 174 (9.2%) |
| $75,000 to $99,999 | 704 (10.1%) | 213 (11.2%) |
| $100,000 to $149,999 | 889 (12.8%) | 57 (3.0%) |
| $150,000 or more | 557 (8.0%) | 18 (0.9%) |
| Total | 6,941 (100.0%) | 1,897 (100.0%) |
Monthly Housing Cost Tiers in Scott County
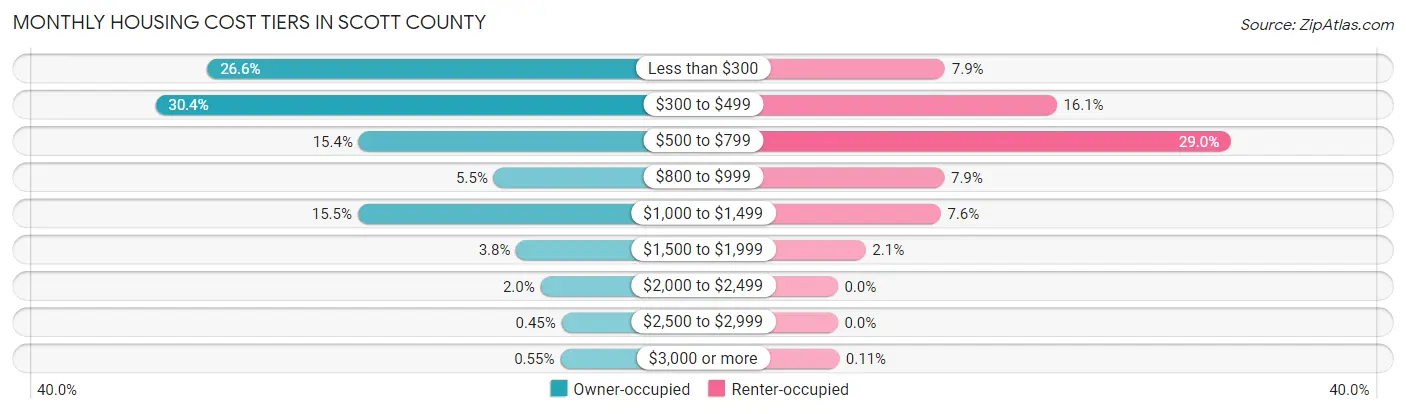
| Monthly Cost | Owner-occupied | Renter-occupied |
| Less than $300 | 1,843 (26.6%) | 150 (7.9%) |
| $300 to $499 | 2,108 (30.4%) | 306 (16.1%) |
| $500 to $799 | 1,068 (15.4%) | 550 (29.0%) |
| $800 to $999 | 378 (5.4%) | 149 (7.9%) |
| $1,000 to $1,499 | 1,073 (15.5%) | 144 (7.6%) |
| $1,500 to $1,999 | 263 (3.8%) | 39 (2.1%) |
| $2,000 to $2,499 | 139 (2.0%) | 0 (0.0%) |
| $2,500 to $2,999 | 31 (0.4%) | 0 (0.0%) |
| $3,000 or more | 38 (0.5%) | 2 (0.1%) |
| Total | 6,941 (100.0%) | 1,897 (100.0%) |
Physical Housing Characteristics in Scott County
Housing Structures in Scott County
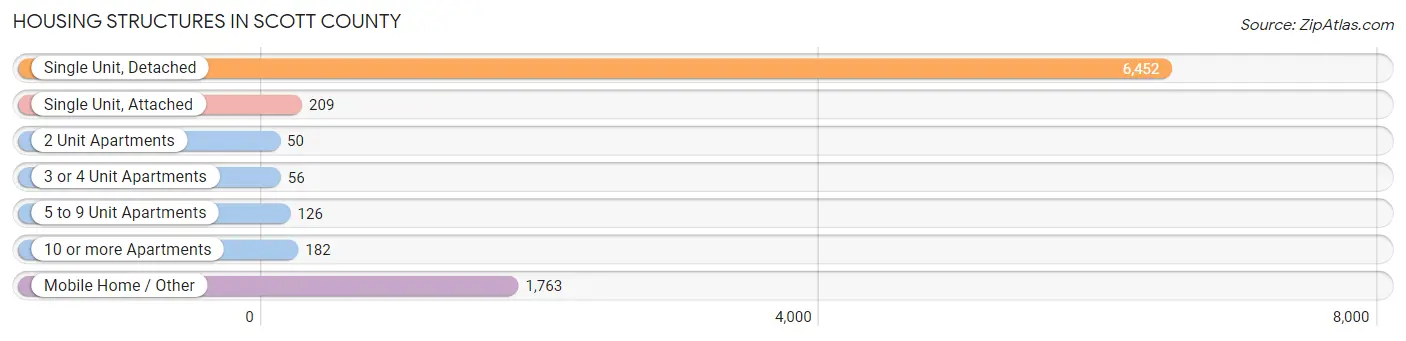
| Structure Type | # Housing Units | % Housing Units |
| Single Unit, Detached | 6,452 | 73.0% |
| Single Unit, Attached | 209 | 2.4% |
| 2 Unit Apartments | 50 | 0.6% |
| 3 or 4 Unit Apartments | 56 | 0.6% |
| 5 to 9 Unit Apartments | 126 | 1.4% |
| 10 or more Apartments | 182 | 2.1% |
| Mobile Home / Other | 1,763 | 20.0% |
| Total | 8,838 | 100.0% |
Housing Structures by Occupancy in Scott County
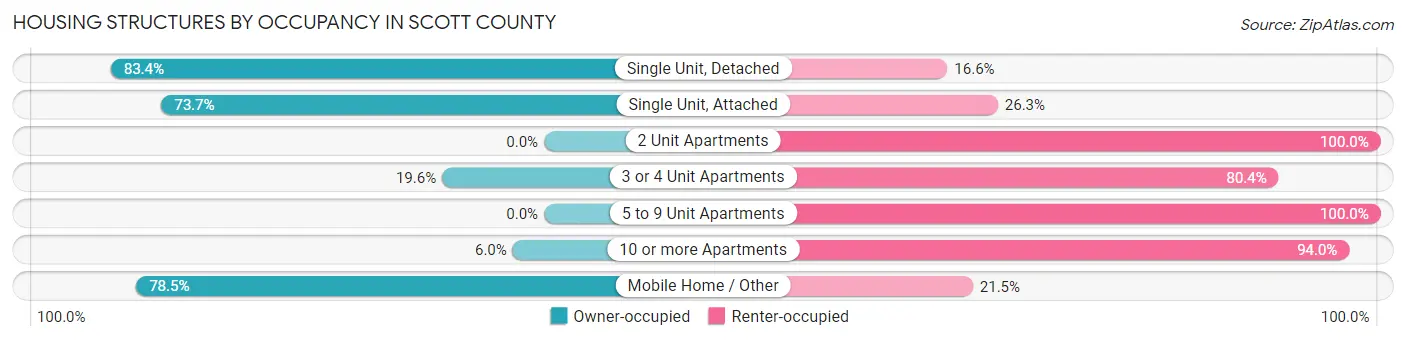
| Structure Type | Owner-occupied | Renter-occupied |
| Single Unit, Detached | 5,381 (83.4%) | 1,071 (16.6%) |
| Single Unit, Attached | 154 (73.7%) | 55 (26.3%) |
| 2 Unit Apartments | 0 (0.0%) | 50 (100.0%) |
| 3 or 4 Unit Apartments | 11 (19.6%) | 45 (80.4%) |
| 5 to 9 Unit Apartments | 0 (0.0%) | 126 (100.0%) |
| 10 or more Apartments | 11 (6.0%) | 171 (94.0%) |
| Mobile Home / Other | 1,384 (78.5%) | 379 (21.5%) |
| Total | 6,941 (78.5%) | 1,897 (21.5%) |
Housing Structures by Number of Rooms in Scott County
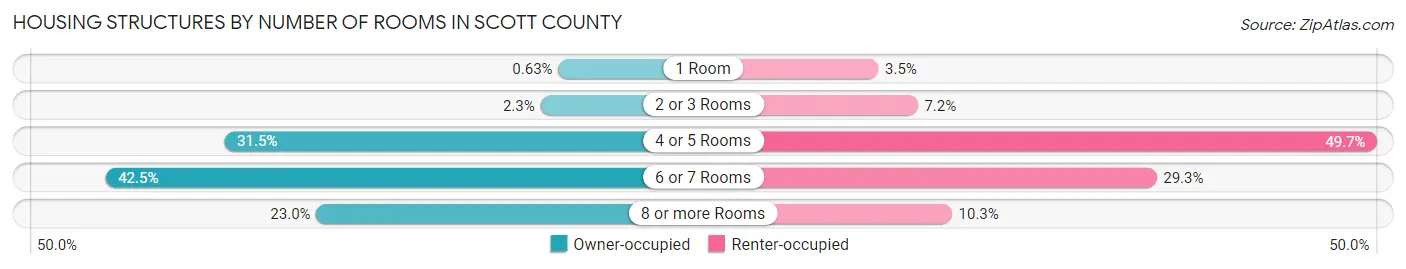
| Number of Rooms | Owner-occupied | Renter-occupied |
| 1 Room | 44 (0.6%) | 67 (3.5%) |
| 2 or 3 Rooms | 158 (2.3%) | 136 (7.2%) |
| 4 or 5 Rooms | 2,189 (31.5%) | 943 (49.7%) |
| 6 or 7 Rooms | 2,953 (42.5%) | 555 (29.3%) |
| 8 or more Rooms | 1,597 (23.0%) | 196 (10.3%) |
| Total | 6,941 (100.0%) | 1,897 (100.0%) |
Housing Structure by Heating Type in Scott County
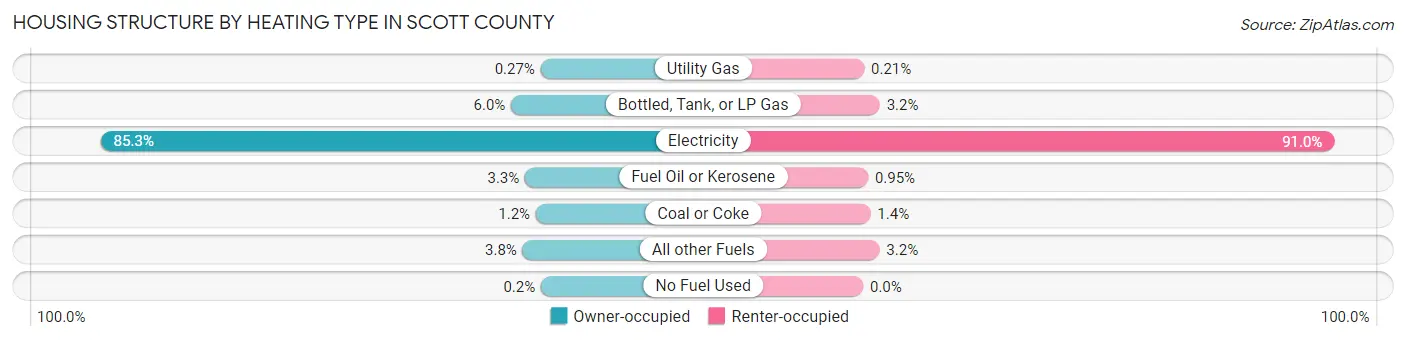
| Heating Type | Owner-occupied | Renter-occupied |
| Utility Gas | 19 (0.3%) | 4 (0.2%) |
| Bottled, Tank, or LP Gas | 415 (6.0%) | 61 (3.2%) |
| Electricity | 5,922 (85.3%) | 1,727 (91.0%) |
| Fuel Oil or Kerosene | 228 (3.3%) | 18 (0.9%) |
| Coal or Coke | 83 (1.2%) | 27 (1.4%) |
| All other Fuels | 260 (3.7%) | 60 (3.2%) |
| No Fuel Used | 14 (0.2%) | 0 (0.0%) |
| Total | 6,941 (100.0%) | 1,897 (100.0%) |
Household Vehicle Usage in Scott County
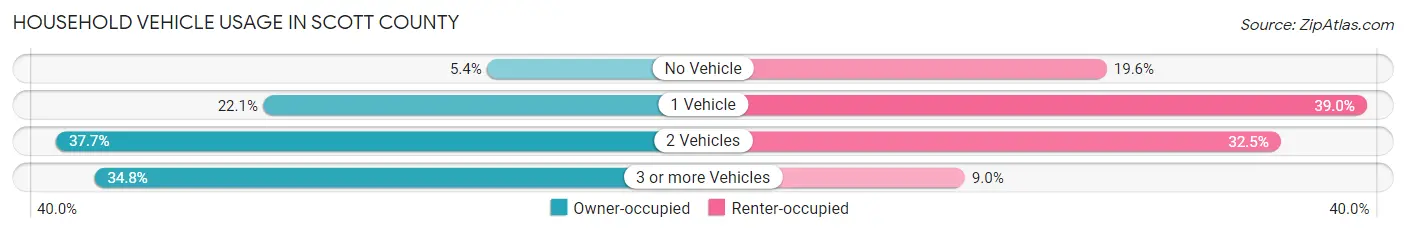
| Vehicles per Household | Owner-occupied | Renter-occupied |
| No Vehicle | 377 (5.4%) | 371 (19.6%) |
| 1 Vehicle | 1,537 (22.1%) | 739 (39.0%) |
| 2 Vehicles | 2,613 (37.7%) | 617 (32.5%) |
| 3 or more Vehicles | 2,414 (34.8%) | 170 (9.0%) |
| Total | 6,941 (100.0%) | 1,897 (100.0%) |
Real Estate & Mortgages in Scott County
Real Estate and Mortgage Overview in Scott County
| Characteristic | Without Mortgage | With Mortgage |
| Housing Units | 4,661 | 2,280 |
| Median Property Value | $114,300 | $145,200 |
| Median Household Income | $41,549 | $303 |
| Monthly Housing Costs | $333 | $26 |
| Real Estate Taxes | $746 | $102 |
Property Value by Mortgage Status in Scott County
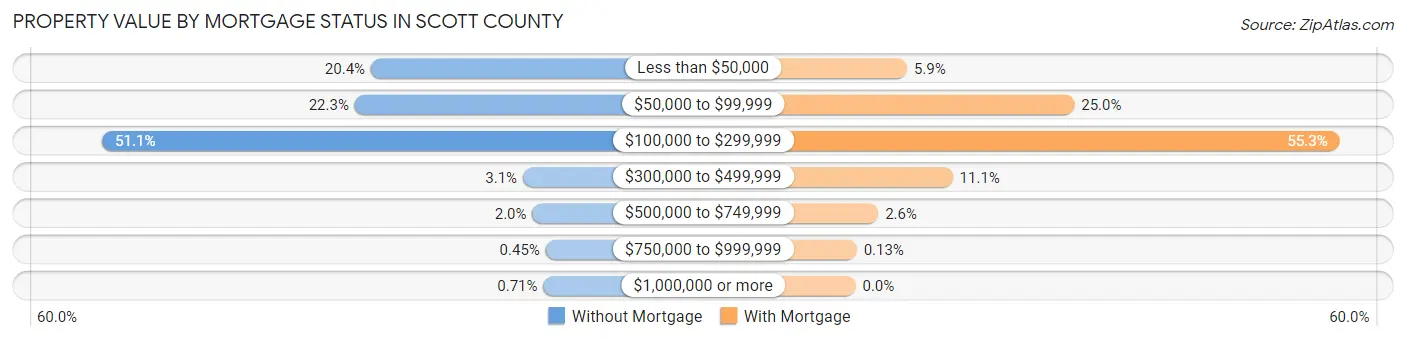
| Property Value | Without Mortgage | With Mortgage |
| Less than $50,000 | 952 (20.4%) | 134 (5.9%) |
| $50,000 to $99,999 | 1,038 (22.3%) | 570 (25.0%) |
| $100,000 to $299,999 | 2,383 (51.1%) | 1,261 (55.3%) |
| $300,000 to $499,999 | 142 (3.0%) | 253 (11.1%) |
| $500,000 to $749,999 | 92 (2.0%) | 59 (2.6%) |
| $750,000 to $999,999 | 21 (0.4%) | 3 (0.1%) |
| $1,000,000 or more | 33 (0.7%) | 0 (0.0%) |
| Total | 4,661 (100.0%) | 2,280 (100.0%) |
Household Income by Mortgage Status in Scott County
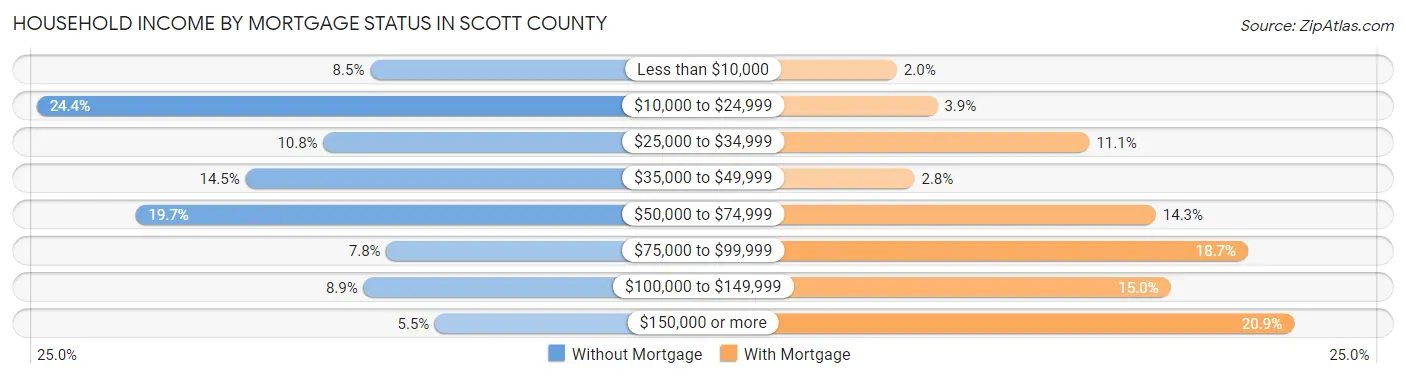
| Household Income | Without Mortgage | With Mortgage |
| Less than $10,000 | 398 (8.5%) | 45 (2.0%) |
| $10,000 to $24,999 | 1,138 (24.4%) | 89 (3.9%) |
| $25,000 to $34,999 | 502 (10.8%) | 254 (11.1%) |
| $35,000 to $49,999 | 675 (14.5%) | 64 (2.8%) |
| $50,000 to $74,999 | 919 (19.7%) | 326 (14.3%) |
| $75,000 to $99,999 | 362 (7.8%) | 426 (18.7%) |
| $100,000 to $149,999 | 413 (8.9%) | 342 (15.0%) |
| $150,000 or more | 254 (5.4%) | 476 (20.9%) |
| Total | 4,661 (100.0%) | 2,280 (100.0%) |
Property Value to Household Income Ratio in Scott County
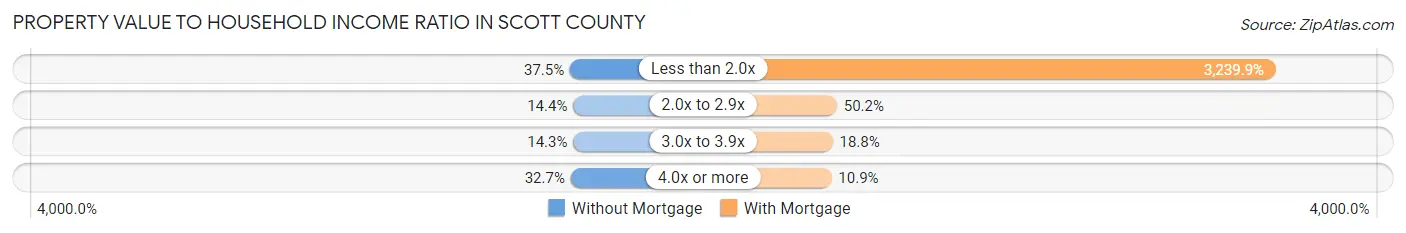
| Value-to-Income Ratio | Without Mortgage | With Mortgage |
| Less than 2.0x | 1,748 (37.5%) | 73,869 (3,239.9%) |
| 2.0x to 2.9x | 673 (14.4%) | 1,144 (50.2%) |
| 3.0x to 3.9x | 668 (14.3%) | 429 (18.8%) |
| 4.0x or more | 1,522 (32.7%) | 248 (10.9%) |
| Total | 4,661 (100.0%) | 2,280 (100.0%) |
Real Estate Taxes by Mortgage Status in Scott County
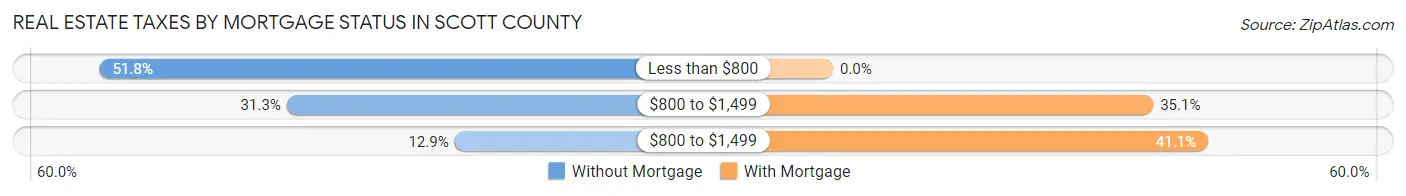
| Property Taxes | Without Mortgage | With Mortgage |
| Less than $800 | 2,414 (51.8%) | 0 (0.0%) |
| $800 to $1,499 | 1,458 (31.3%) | 800 (35.1%) |
| $800 to $1,499 | 601 (12.9%) | 937 (41.1%) |
| Total | 4,661 (100.0%) | 2,280 (100.0%) |
Health & Disability in Scott County
Health Insurance Coverage by Age in Scott County
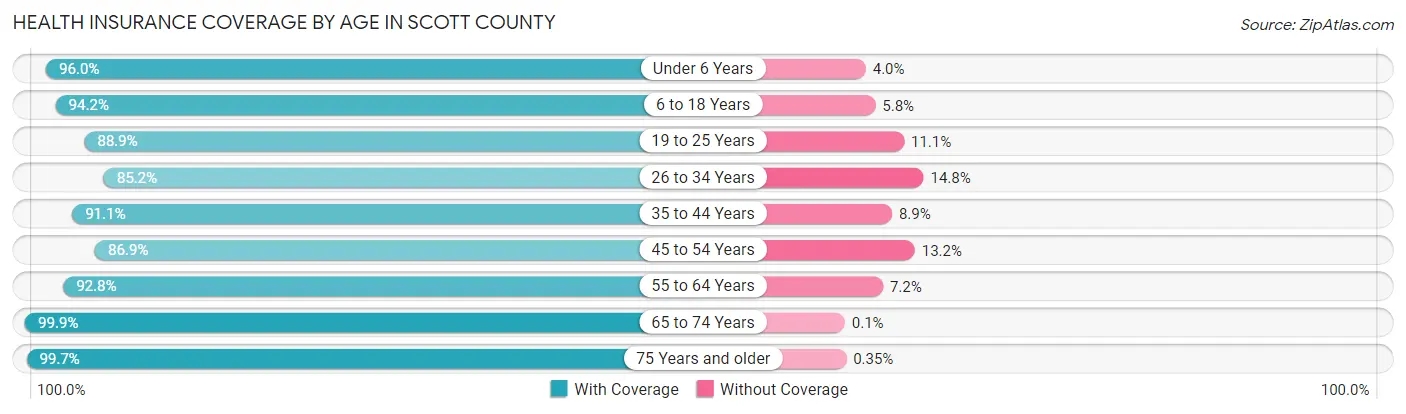
| Age Bracket | With Coverage | Without Coverage |
| Under 6 Years | 934 (96.0%) | 39 (4.0%) |
| 6 to 18 Years | 2,879 (94.2%) | 177 (5.8%) |
| 19 to 25 Years | 1,276 (88.9%) | 160 (11.1%) |
| 26 to 34 Years | 1,678 (85.2%) | 291 (14.8%) |
| 35 to 44 Years | 1,988 (91.1%) | 194 (8.9%) |
| 45 to 54 Years | 2,337 (86.9%) | 354 (13.2%) |
| 55 to 64 Years | 3,010 (92.8%) | 234 (7.2%) |
| 65 to 74 Years | 2,916 (99.9%) | 3 (0.1%) |
| 75 Years and older | 2,278 (99.7%) | 8 (0.4%) |
| Total | 19,296 (93.0%) | 1,460 (7.0%) |
Health Insurance Coverage by Citizenship Status in Scott County
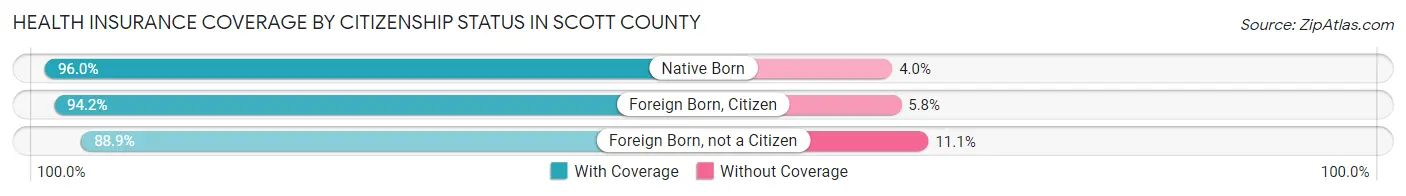
| Citizenship Status | With Coverage | Without Coverage |
| Native Born | 934 (96.0%) | 39 (4.0%) |
| Foreign Born, Citizen | 2,879 (94.2%) | 177 (5.8%) |
| Foreign Born, not a Citizen | 1,276 (88.9%) | 160 (11.1%) |
Health Insurance Coverage by Household Income in Scott County
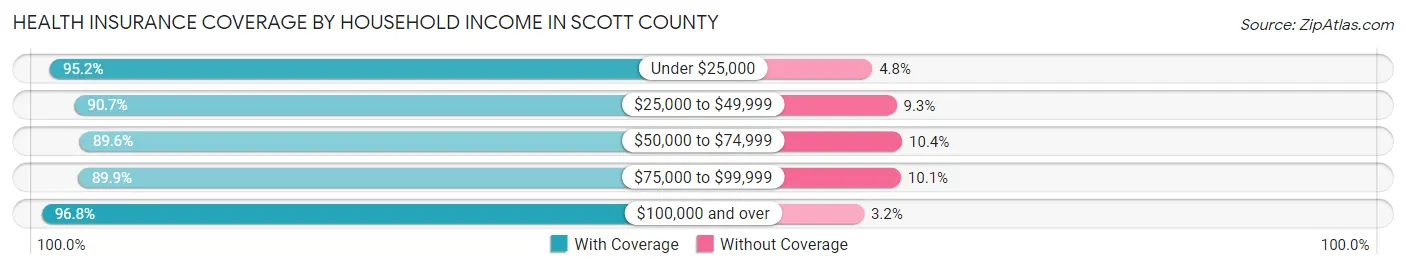
| Household Income | With Coverage | Without Coverage |
| Under $25,000 | 4,222 (95.2%) | 211 (4.8%) |
| $25,000 to $49,999 | 4,126 (90.7%) | 424 (9.3%) |
| $50,000 to $74,999 | 3,333 (89.6%) | 385 (10.4%) |
| $75,000 to $99,999 | 2,366 (89.9%) | 267 (10.1%) |
| $100,000 and over | 5,222 (96.8%) | 173 (3.2%) |
Public vs Private Health Insurance Coverage by Age in Scott County
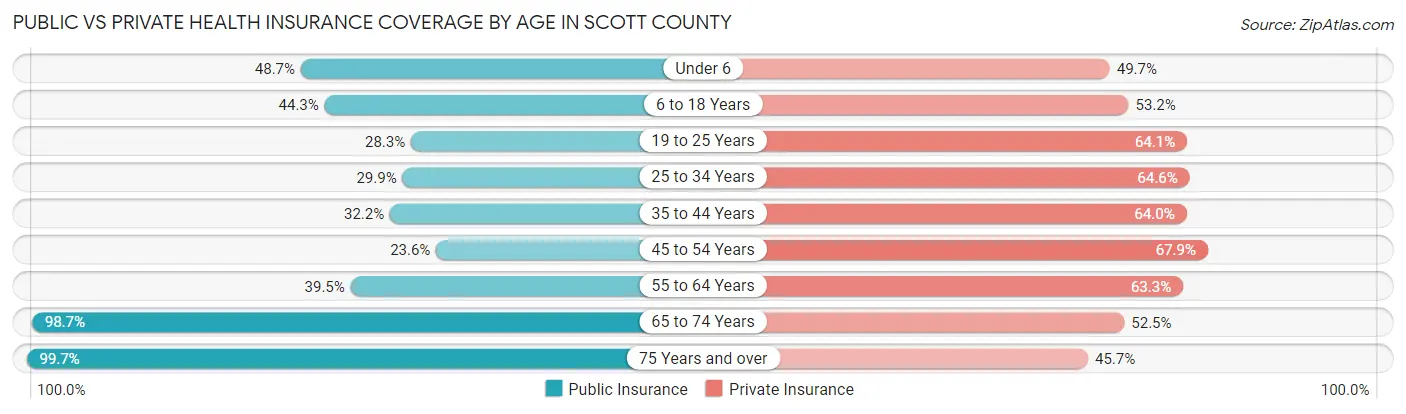
| Age Bracket | Public Insurance | Private Insurance |
| Under 6 | 474 (48.7%) | 484 (49.7%) |
| 6 to 18 Years | 1,354 (44.3%) | 1,627 (53.2%) |
| 19 to 25 Years | 406 (28.3%) | 920 (64.1%) |
| 25 to 34 Years | 588 (29.9%) | 1,271 (64.5%) |
| 35 to 44 Years | 702 (32.2%) | 1,396 (64.0%) |
| 45 to 54 Years | 635 (23.6%) | 1,828 (67.9%) |
| 55 to 64 Years | 1,281 (39.5%) | 2,054 (63.3%) |
| 65 to 74 Years | 2,880 (98.7%) | 1,531 (52.4%) |
| 75 Years and over | 2,278 (99.7%) | 1,045 (45.7%) |
| Total | 10,598 (51.1%) | 12,156 (58.6%) |
Disability Status by Sex by Age in Scott County
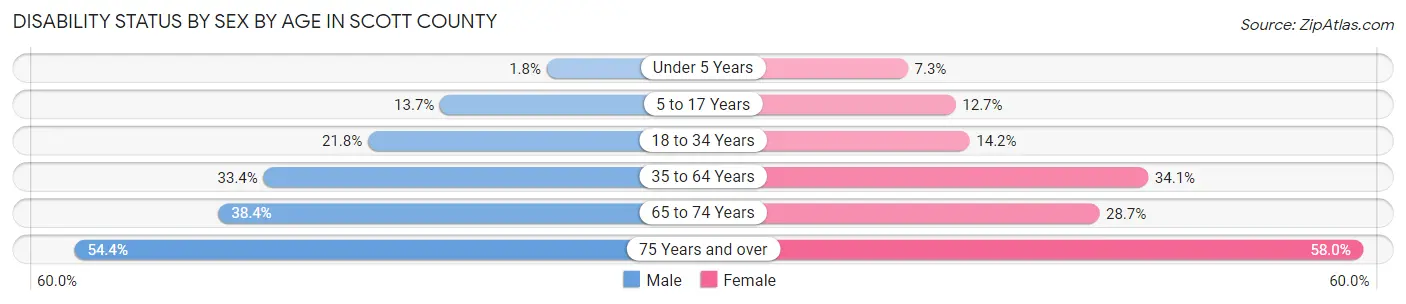
| Age Bracket | Male | Female |
| Under 5 Years | 8 (1.8%) | 28 (7.3%) |
| 5 to 17 Years | 220 (13.7%) | 183 (12.7%) |
| 18 to 34 Years | 413 (21.7%) | 237 (14.2%) |
| 35 to 64 Years | 1,373 (33.4%) | 1,365 (34.1%) |
| 65 to 74 Years | 522 (38.4%) | 447 (28.6%) |
| 75 Years and over | 577 (54.4%) | 711 (58.0%) |
Disability Class by Sex by Age in Scott County
Disability Class: Hearing Difficulty
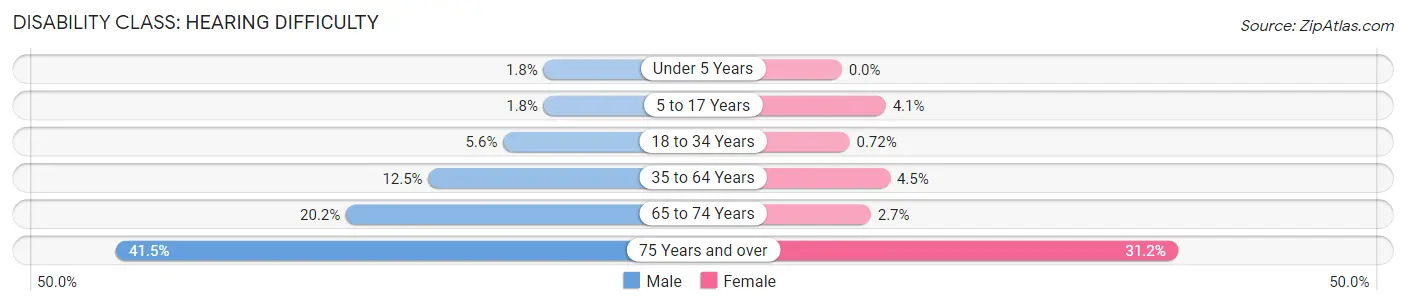
| Age Bracket | Male | Female |
| Under 5 Years | 8 (1.8%) | 0 (0.0%) |
| 5 to 17 Years | 29 (1.8%) | 59 (4.1%) |
| 18 to 34 Years | 106 (5.6%) | 12 (0.7%) |
| 35 to 64 Years | 515 (12.5%) | 179 (4.5%) |
| 65 to 74 Years | 274 (20.2%) | 42 (2.7%) |
| 75 Years and over | 440 (41.5%) | 382 (31.2%) |
Disability Class: Vision Difficulty
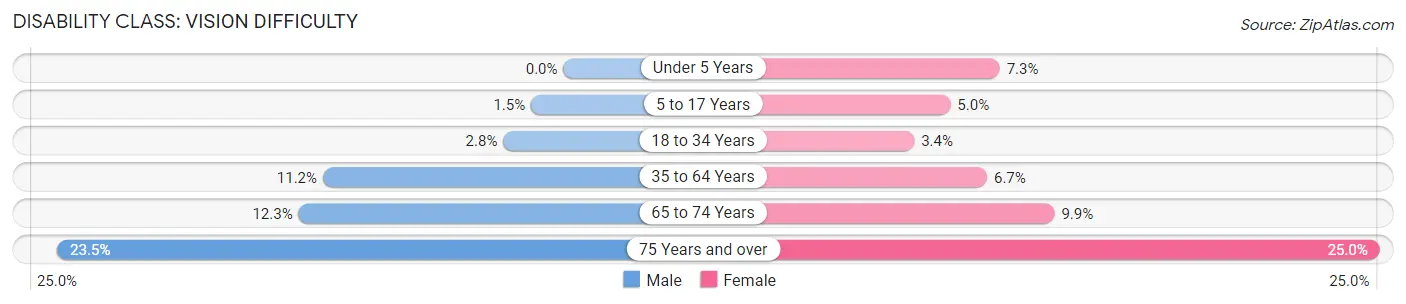
| Age Bracket | Male | Female |
| Under 5 Years | 0 (0.0%) | 28 (7.3%) |
| 5 to 17 Years | 24 (1.5%) | 73 (5.0%) |
| 18 to 34 Years | 53 (2.8%) | 56 (3.4%) |
| 35 to 64 Years | 459 (11.2%) | 270 (6.7%) |
| 65 to 74 Years | 167 (12.3%) | 154 (9.9%) |
| 75 Years and over | 249 (23.5%) | 306 (25.0%) |
Disability Class: Cognitive Difficulty
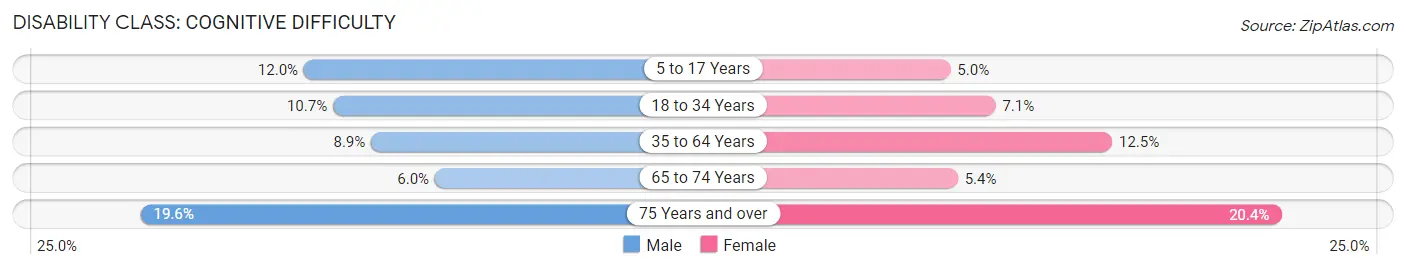
| Age Bracket | Male | Female |
| 5 to 17 Years | 193 (12.0%) | 73 (5.0%) |
| 18 to 34 Years | 203 (10.7%) | 119 (7.1%) |
| 35 to 64 Years | 367 (8.9%) | 502 (12.5%) |
| 65 to 74 Years | 81 (6.0%) | 84 (5.4%) |
| 75 Years and over | 208 (19.6%) | 250 (20.4%) |
Disability Class: Ambulatory Difficulty
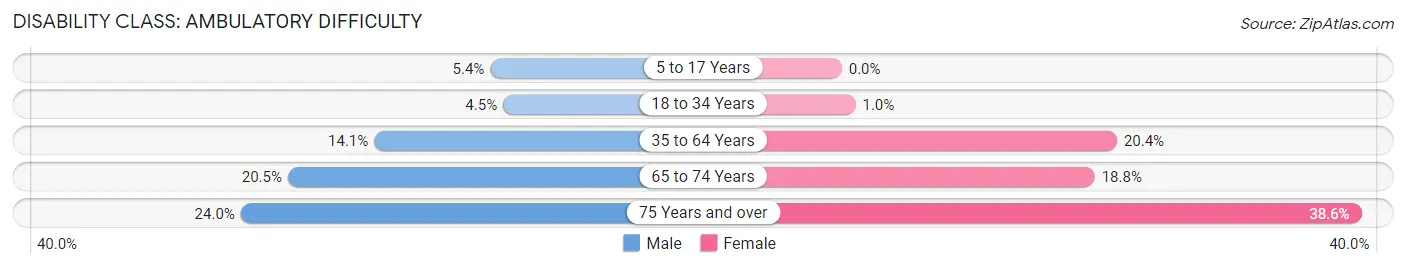
| Age Bracket | Male | Female |
| 5 to 17 Years | 87 (5.4%) | 0 (0.0%) |
| 18 to 34 Years | 85 (4.5%) | 17 (1.0%) |
| 35 to 64 Years | 578 (14.1%) | 818 (20.4%) |
| 65 to 74 Years | 278 (20.5%) | 293 (18.8%) |
| 75 Years and over | 254 (24.0%) | 473 (38.6%) |
Disability Class: Self-Care Difficulty
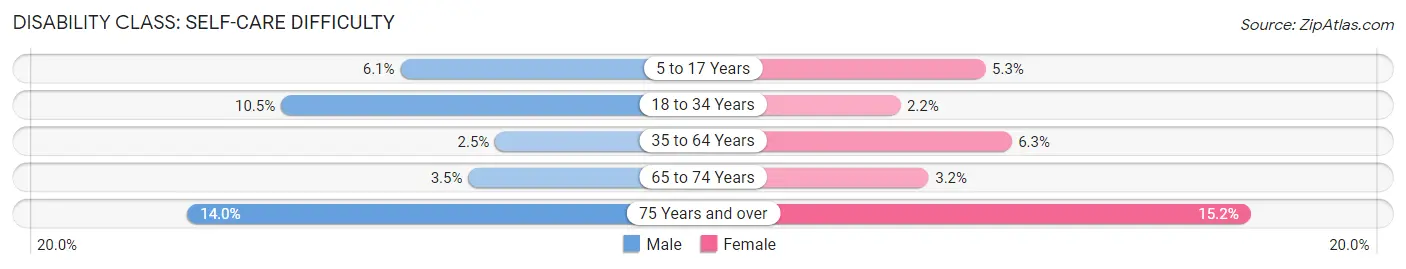
| Age Bracket | Male | Female |
| 5 to 17 Years | 97 (6.0%) | 77 (5.3%) |
| 18 to 34 Years | 199 (10.5%) | 36 (2.2%) |
| 35 to 64 Years | 104 (2.5%) | 252 (6.3%) |
| 65 to 74 Years | 48 (3.5%) | 50 (3.2%) |
| 75 Years and over | 148 (14.0%) | 186 (15.2%) |
Technology Access in Scott County
Computing Device Access in Scott County
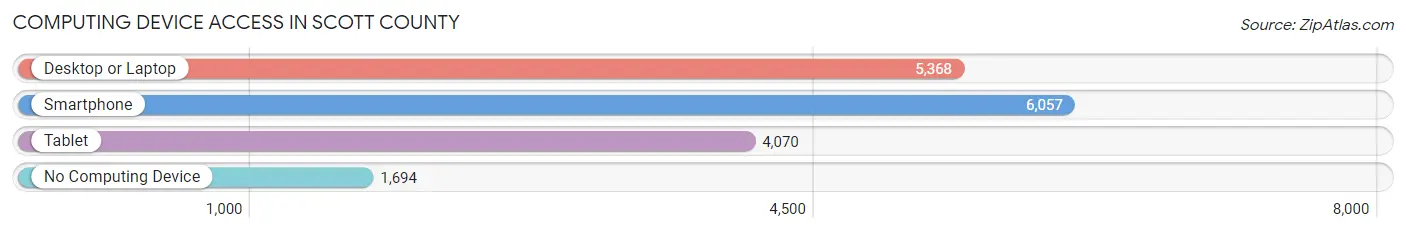
| Device Type | # Households | % Households |
| Desktop or Laptop | 5,368 | 60.7% |
| Smartphone | 6,057 | 68.5% |
| Tablet | 4,070 | 46.1% |
| No Computing Device | 1,694 | 19.2% |
| Total | 8,838 | 100.0% |
Internet Access in Scott County
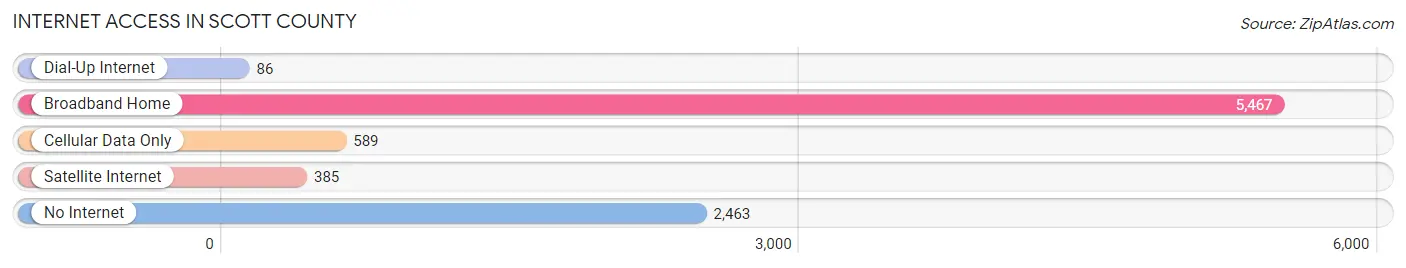
| Internet Type | # Households | % Households |
| Dial-Up Internet | 86 | 1.0% |
| Broadband Home | 5,467 | 61.9% |
| Cellular Data Only | 589 | 6.7% |
| Satellite Internet | 385 | 4.4% |
| No Internet | 2,463 | 27.9% |
| Total | 8,838 | 100.0% |
Scott County Summary
Scott County is a county located in the southwestern part of the Commonwealth of Virginia. It is part of the Kingsport–Bristol–Bristol, TN–VA Metropolitan Statistical Area. As of the 2010 census, the population was 23,177. Its county seat is Gate City.
History
Scott County was formed in 1814 from parts of Washington, Lee, and Russell Counties. It was named for General Winfield Scott, a hero of the War of 1812. The county was the site of the Battle of Gate City during the Civil War.
Geography
Scott County is located in the southwestern part of Virginia, and is bordered by Lee County to the north, Wise County to the east, Tennessee to the south, and Hawkins County, Tennessee to the west. The county has a total area of 437 square miles, of which 434 square miles is land and 3.2 square miles (0.7%) is water. The county is located in the Appalachian Mountains and is part of the Ridge and Valley physiographic province. The Clinch River forms the county's northern border.
Economy
The economy of Scott County is largely based on agriculture and manufacturing. The county is home to several large industrial plants, including a paper mill, a steel mill, and a chemical plant. Agriculture is also important to the county's economy, with corn, soybeans, and hay being the main crops. Livestock, including cattle, hogs, and poultry, are also raised in the county.
Demographics
As of the 2010 census, there were 23,177 people, 9,541 households, and 6,845 families living in the county. The population density was 53 people per square mile. The racial makeup of the county was 95.3% White, 2.3% Black or African American, 0.3% Native American, 0.3% Asian, 0.2% Pacific Islander, 0.6% from other races, and 1.2% from two or more races. 1.7% of the population were Hispanic or Latino of any race.
The median income for a household in the county was $35,945, and the median income for a family was $43,945. The per capita income for the county was $18,945. About 15.2% of families and 19.2% of the population were below the poverty line, including 25.2% of those under age 18 and 14.2% of those age 65 or over.
Conclusion
Scott County is a rural county located in the southwestern part of Virginia. It has a long history, and its economy is largely based on agriculture and manufacturing. The population of the county is largely white, with a small percentage of other races. The median income for a household in the county is lower than the national average, and the poverty rate is higher than the national average.
Common Questions
What is Per Capita Income in Scott County?
Per Capita income in Scott County is $26,681.
What is the Median Family Income in Scott County?
Median Family Income in Scott County is $62,072.
What is the Median Household income in Scott County?
Median Household Income in Scott County is $44,535.
What is Income or Wage Gap in Scott County?
Income or Wage Gap in Scott County is 35.7%.
Women in Scott County earn 64.3 cents for every dollar earned by a man.
What is Inequality or Gini Index in Scott County?
Inequality or Gini Index in Scott County is 0.47.
What is the Total Population of Scott County?
Total Population of Scott County is 21,536.
What is the Total Male Population of Scott County?
Total Male Population of Scott County is 10,954.
What is the Total Female Population of Scott County?
Total Female Population of Scott County is 10,582.
What is the Ratio of Males per 100 Females in Scott County?
There are 103.52 Males per 100 Females in Scott County.
What is the Ratio of Females per 100 Males in Scott County?
There are 96.60 Females per 100 Males in Scott County.
What is the Median Population Age in Scott County?
Median Population Age in Scott County is 47.7 Years.
What is the Average Family Size in Scott County
Average Family Size in Scott County is 3.0 People.
What is the Average Household Size in Scott County
Average Household Size in Scott County is 2.4 People.
How Large is the Labor Force in Scott County?
There are 8,215 People in the Labor Forcein in Scott County.
What is the Percentage of People in the Labor Force in Scott County?
45.4% of People are in the Labor Force in Scott County.
What is the Unemployment Rate in Scott County?
Unemployment Rate in Scott County is 3.4%.