Salem city, VA Map & Demographics
Salem city Map
Salem city Overview
$37,991
PER CAPITA INCOME
$87,333
AVG FAMILY INCOME
$68,402
AVG HOUSEHOLD INCOME
33.8%
WAGE / INCOME GAP [ % ]
66.2¢/ $1
WAGE / INCOME GAP [ $ ]
$14,086
FAMILY INCOME DEFICIT
0.46
INEQUALITY / GINI INDEX
25,372
TOTAL POPULATION
12,187
MALE POPULATION
13,185
FEMALE POPULATION
92.43
MALES / 100 FEMALES
108.19
FEMALES / 100 MALES
40.8
MEDIAN AGE
2.8
AVG FAMILY SIZE
2.3
AVG HOUSEHOLD SIZE
13,011
LABOR FORCE [ PEOPLE ]
61.1%
PERCENT IN LABOR FORCE
3.5%
UNEMPLOYMENT RATE
Salem city Area Codes
Income in Salem city
Income Overview in Salem city
Per Capita Income in Salem city is $37,991, while median incomes of families and households are $87,333 and $68,402 respectively.
| Characteristic | Number | Measure |
| Per Capita Income | 25,372 | $37,991 |
| Median Family Income | 6,248 | $87,333 |
| Mean Family Income | 6,248 | $108,524 |
| Median Household Income | 10,045 | $68,402 |
| Mean Household Income | 10,045 | $93,744 |
| Income Deficit | 6,248 | $14,086 |
| Wage / Income Gap (%) | 25,372 | 33.82% |
| Wage / Income Gap ($) | 25,372 | 66.18¢ per $1 |
| Gini / Inequality Index | 25,372 | 0.46 |
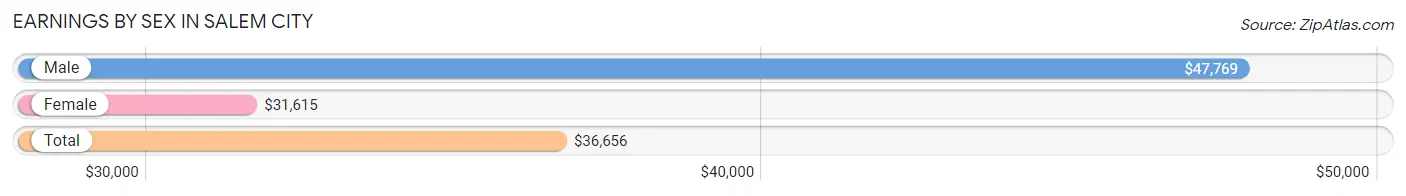
Earnings by Sex in Salem city
Average Earnings in Salem city are $36,656, $47,769 for men and $31,615 for women, a difference of 33.8%.
| Sex | Number | Average Earnings |
| Male | 7,355 (51.0%) | $47,769 |
| Female | 7,054 (49.0%) | $31,615 |
| Total | 14,409 (100.0%) | $36,656 |
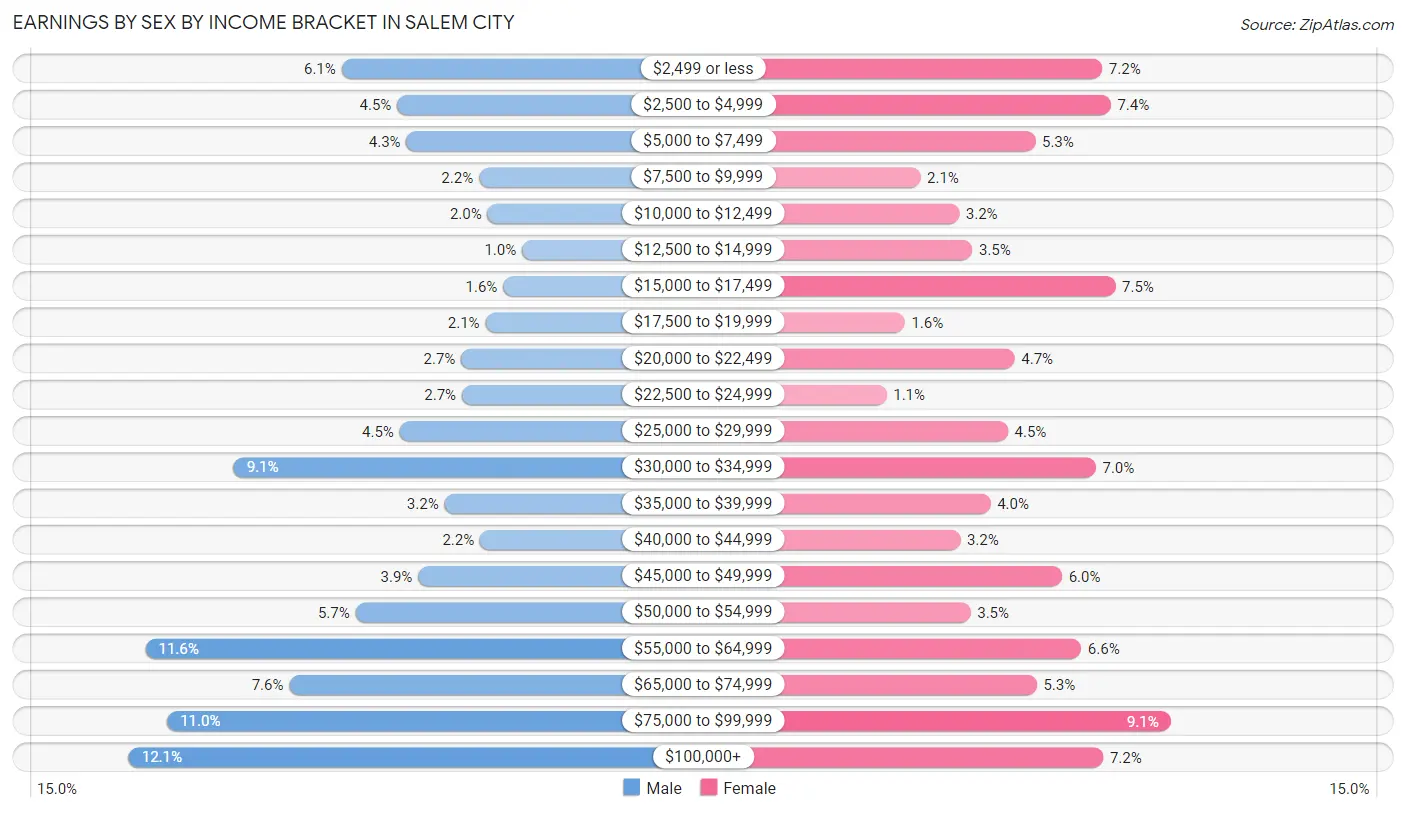
Earnings by Sex by Income Bracket in Salem city
The most common earnings brackets in Salem city are $100,000+ for men (888 | 12.1%) and $75,000 to $99,999 for women (642 | 9.1%).
| Income | Male | Female |
| $2,499 or less | 448 (6.1%) | 506 (7.2%) |
| $2,500 to $4,999 | 333 (4.5%) | 523 (7.4%) |
| $5,000 to $7,499 | 314 (4.3%) | 373 (5.3%) |
| $7,500 to $9,999 | 164 (2.2%) | 145 (2.1%) |
| $10,000 to $12,499 | 146 (2.0%) | 222 (3.2%) |
| $12,500 to $14,999 | 75 (1.0%) | 248 (3.5%) |
| $15,000 to $17,499 | 114 (1.5%) | 532 (7.5%) |
| $17,500 to $19,999 | 151 (2.1%) | 114 (1.6%) |
| $20,000 to $22,499 | 201 (2.7%) | 332 (4.7%) |
| $22,500 to $24,999 | 199 (2.7%) | 78 (1.1%) |
| $25,000 to $29,999 | 328 (4.5%) | 319 (4.5%) |
| $30,000 to $34,999 | 671 (9.1%) | 493 (7.0%) |
| $35,000 to $39,999 | 235 (3.2%) | 284 (4.0%) |
| $40,000 to $44,999 | 162 (2.2%) | 224 (3.2%) |
| $45,000 to $49,999 | 290 (3.9%) | 426 (6.0%) |
| $50,000 to $54,999 | 419 (5.7%) | 245 (3.5%) |
| $55,000 to $64,999 | 853 (11.6%) | 464 (6.6%) |
| $65,000 to $74,999 | 556 (7.6%) | 376 (5.3%) |
| $75,000 to $99,999 | 808 (11.0%) | 642 (9.1%) |
| $100,000+ | 888 (12.1%) | 508 (7.2%) |
| Total | 7,355 (100.0%) | 7,054 (100.0%) |
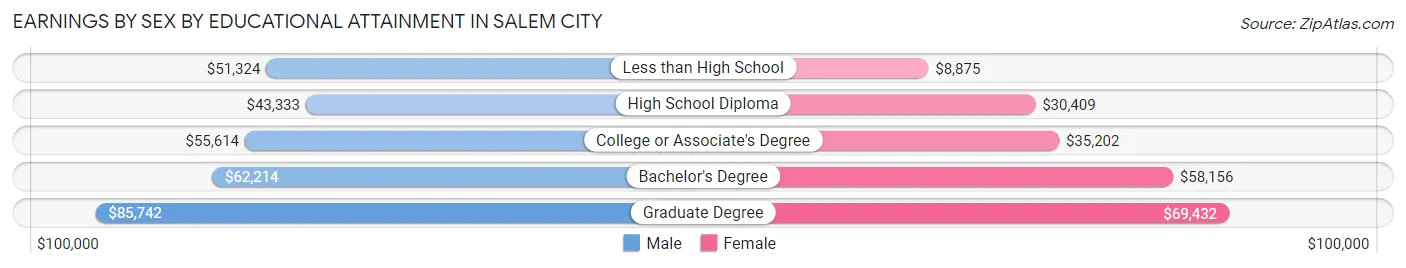
Earnings by Sex by Educational Attainment in Salem city
Average earnings in Salem city are $55,936 for men and $41,618 for women, a difference of 25.6%. Men with an educational attainment of graduate degree enjoy the highest average annual earnings of $85,742, while those with high school diploma education earn the least with $43,333. Women with an educational attainment of graduate degree earn the most with the average annual earnings of $69,432, while those with less than high school education have the smallest earnings of $8,875.
| Educational Attainment | Male Income | Female Income |
| Less than High School | $51,324 | $8,875 |
| High School Diploma | $43,333 | $30,409 |
| College or Associate's Degree | $55,614 | $35,202 |
| Bachelor's Degree | $62,214 | $58,156 |
| Graduate Degree | $85,742 | $69,432 |
| Total | $55,936 | $41,618 |
Family Income in Salem city
Family Income Brackets in Salem city
According to the Salem city family income data, there are 1,375 families falling into the $100,000 to $149,999 income range, which is the most common income bracket and makes up 22.0% of all families. Conversely, the $10,000 to $14,999 income bracket is the least frequent group with only 87 families (1.4%) belonging to this category.
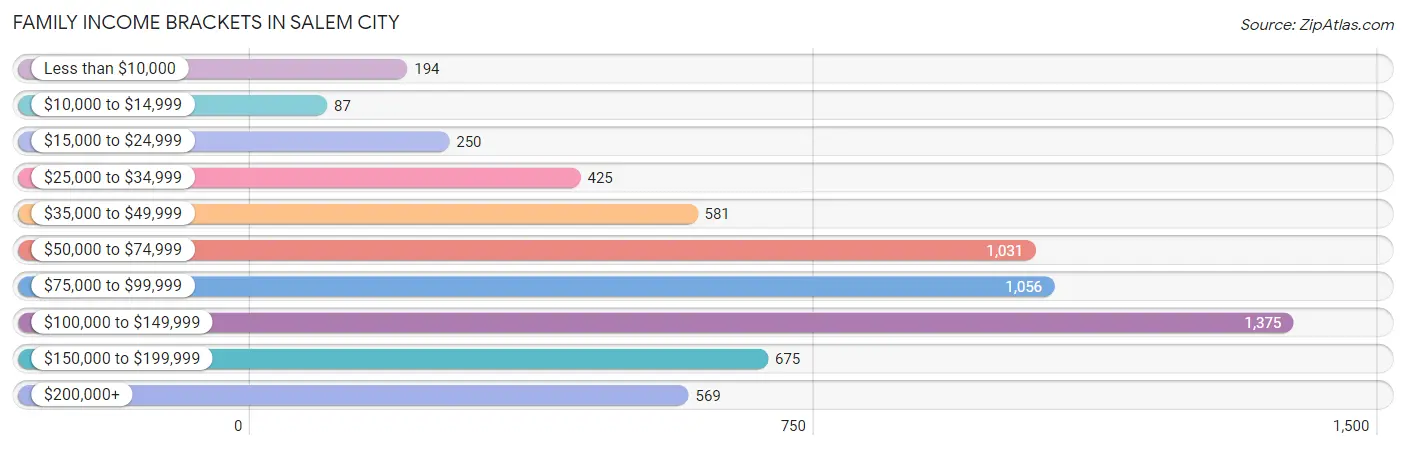
| Income Bracket | # Families | % Families |
| Less than $10,000 | 194 | 3.1% |
| $10,000 to $14,999 | 87 | 1.4% |
| $15,000 to $24,999 | 250 | 4.0% |
| $25,000 to $34,999 | 425 | 6.8% |
| $35,000 to $49,999 | 581 | 9.3% |
| $50,000 to $74,999 | 1,031 | 16.5% |
| $75,000 to $99,999 | 1,056 | 16.9% |
| $100,000 to $149,999 | 1,375 | 22.0% |
| $150,000 to $199,999 | 675 | 10.8% |
| $200,000+ | 569 | 9.1% |
Family Income by Famaliy Size in Salem city
6-person families (85 | 1.4%) account for the highest median family income in Salem city with $126,528 per family, while 2-person families (3,449 | 55.2%) have the highest median income of $35,908 per family member.
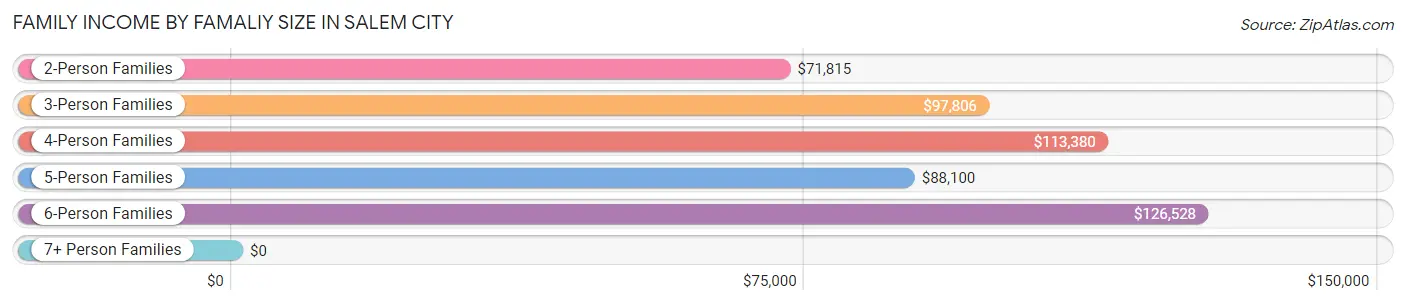
| Income Bracket | # Families | Median Income |
| 2-Person Families | 3,449 (55.2%) | $71,815 |
| 3-Person Families | 1,390 (22.3%) | $97,806 |
| 4-Person Families | 856 (13.7%) | $113,380 |
| 5-Person Families | 390 (6.2%) | $88,100 |
| 6-Person Families | 85 (1.4%) | $126,528 |
| 7+ Person Families | 78 (1.3%) | $0 |
| Total | 6,248 (100.0%) | $87,333 |
Family Income by Number of Earners in Salem city
The median family income in Salem city is $87,333, with families comprising 3+ earners (595) having the highest median family income of $121,799, while families with no earners (939) have the lowest median family income of $44,188, accounting for 9.5% and 15.0% of families, respectively.
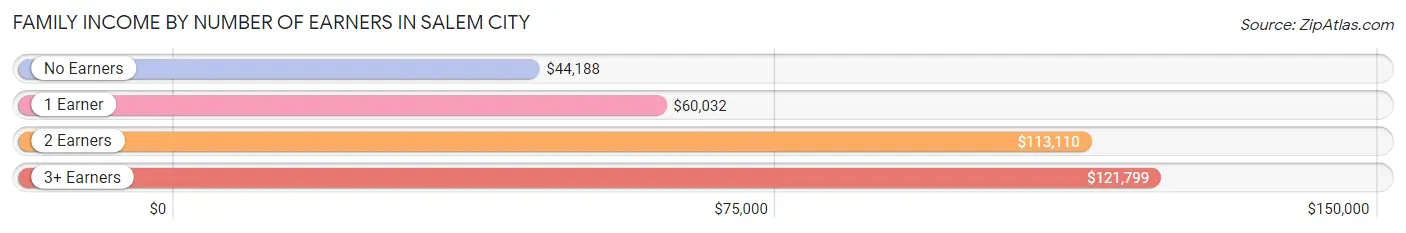
| Number of Earners | # Families | Median Income |
| No Earners | 939 (15.0%) | $44,188 |
| 1 Earner | 2,039 (32.6%) | $60,032 |
| 2 Earners | 2,675 (42.8%) | $113,110 |
| 3+ Earners | 595 (9.5%) | $121,799 |
| Total | 6,248 (100.0%) | $87,333 |
Household Income in Salem city
Household Income Brackets in Salem city
With 1,919 households falling in the category, the $50,000 to $74,999 income range is the most frequent in Salem city, accounting for 19.1% of all households. In contrast, only 301 households (3.0%) fall into the $10,000 to $14,999 income bracket, making it the least populous group.
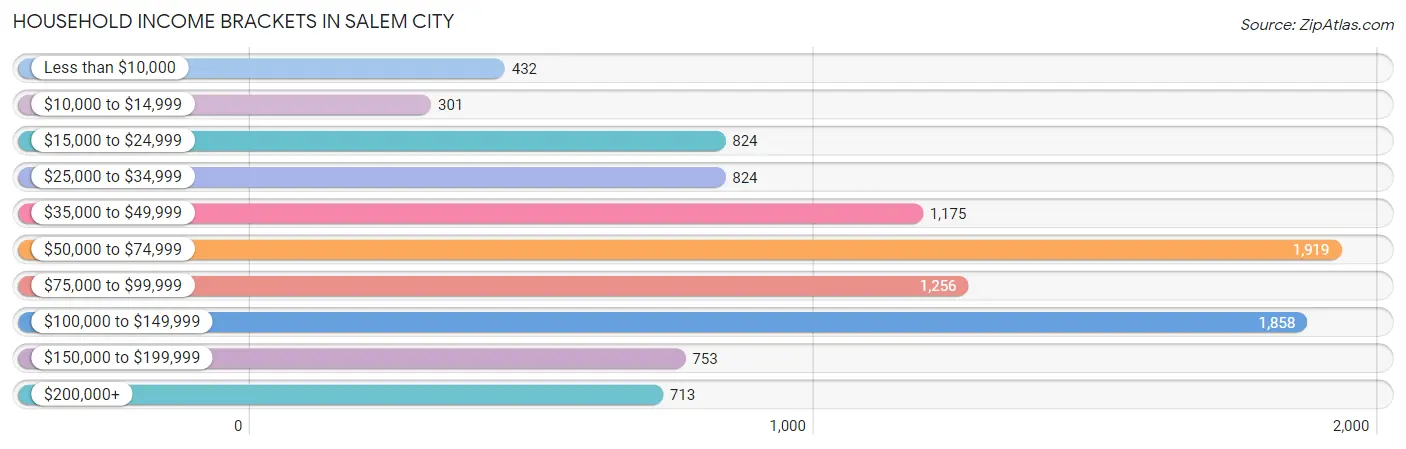
| Income Bracket | # Households | % Households |
| Less than $10,000 | 432 | 4.3% |
| $10,000 to $14,999 | 301 | 3.0% |
| $15,000 to $24,999 | 824 | 8.2% |
| $25,000 to $34,999 | 824 | 8.2% |
| $35,000 to $49,999 | 1,175 | 11.7% |
| $50,000 to $74,999 | 1,919 | 19.1% |
| $75,000 to $99,999 | 1,256 | 12.5% |
| $100,000 to $149,999 | 1,858 | 18.5% |
| $150,000 to $199,999 | 753 | 7.5% |
| $200,000+ | 713 | 7.1% |
Household Income by Householder Age in Salem city
The median household income in Salem city is $68,402, with the highest median household income of $87,544 found in the 45 to 64 years age bracket for the primary householder. A total of 3,669 households (36.5%) fall into this category. Meanwhile, the 65+ years age bracket for the primary householder has the lowest median household income of $49,243, with 3,003 households (29.9%) in this group.
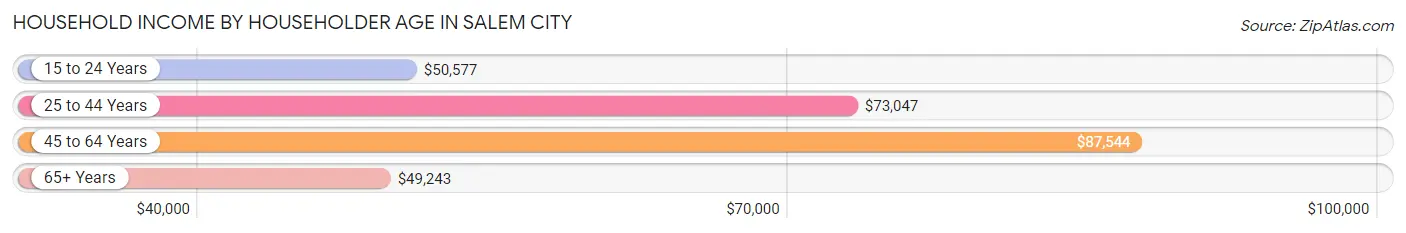
| Income Bracket | # Households | Median Income |
| 15 to 24 Years | 430 (4.3%) | $50,577 |
| 25 to 44 Years | 2,943 (29.3%) | $73,047 |
| 45 to 64 Years | 3,669 (36.5%) | $87,544 |
| 65+ Years | 3,003 (29.9%) | $49,243 |
| Total | 10,045 (100.0%) | $68,402 |
Poverty in Salem city
Income Below Poverty by Sex and Age in Salem city
With 7.6% poverty level for males and 11.5% for females among the residents of Salem city, 5 year old males and 5 year old females are the most vulnerable to poverty, with 50 males (34.0%) and 21 females (23.3%) in their respective age groups living below the poverty level.
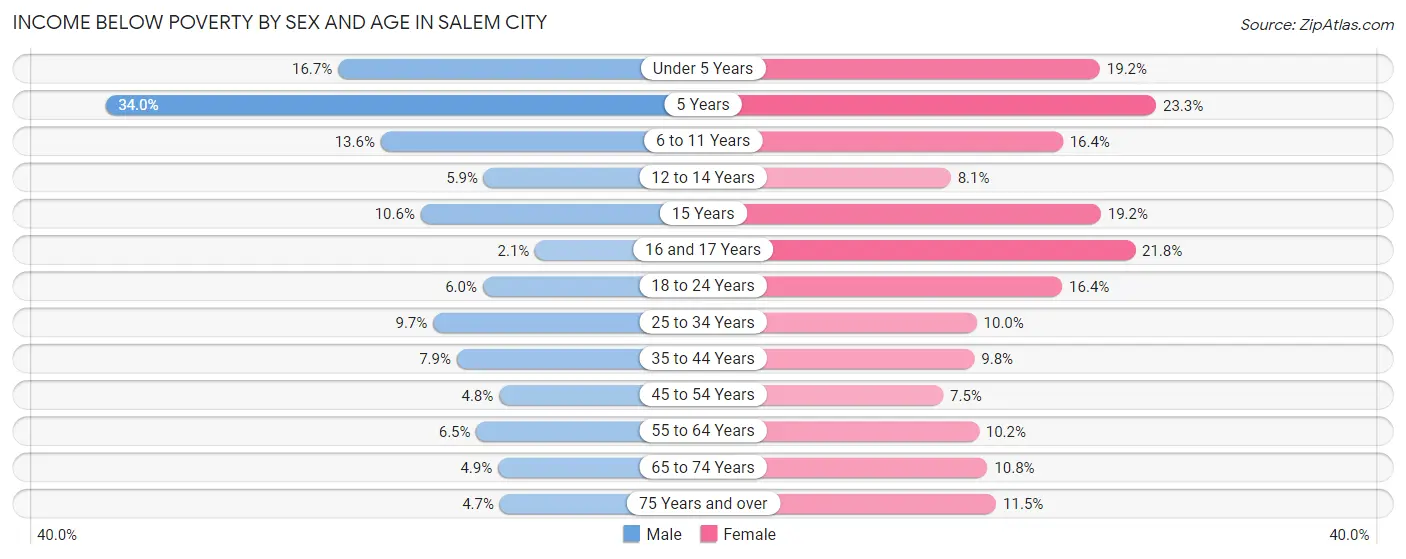
| Age Bracket | Male | Female |
| Under 5 Years | 87 (16.7%) | 87 (19.2%) |
| 5 Years | 50 (34.0%) | 21 (23.3%) |
| 6 to 11 Years | 72 (13.6%) | 135 (16.4%) |
| 12 to 14 Years | 44 (5.9%) | 39 (8.1%) |
| 15 Years | 9 (10.6%) | 25 (19.2%) |
| 16 and 17 Years | 8 (2.1%) | 54 (21.8%) |
| 18 to 24 Years | 52 (6.0%) | 133 (16.4%) |
| 25 to 34 Years | 136 (9.7%) | 137 (10.0%) |
| 35 to 44 Years | 111 (7.9%) | 152 (9.8%) |
| 45 to 54 Years | 67 (4.8%) | 124 (7.5%) |
| 55 to 64 Years | 103 (6.5%) | 177 (10.2%) |
| 65 to 74 Years | 54 (4.9%) | 156 (10.8%) |
| 75 Years and over | 33 (4.7%) | 120 (11.5%) |
| Total | 826 (7.6%) | 1,360 (11.5%) |
Income Above Poverty by Sex and Age in Salem city
According to the poverty statistics in Salem city, males aged 16 and 17 years and females aged 45 to 54 years are the age groups that are most secure financially, with 97.9% of males and 92.5% of females in these age groups living above the poverty line.
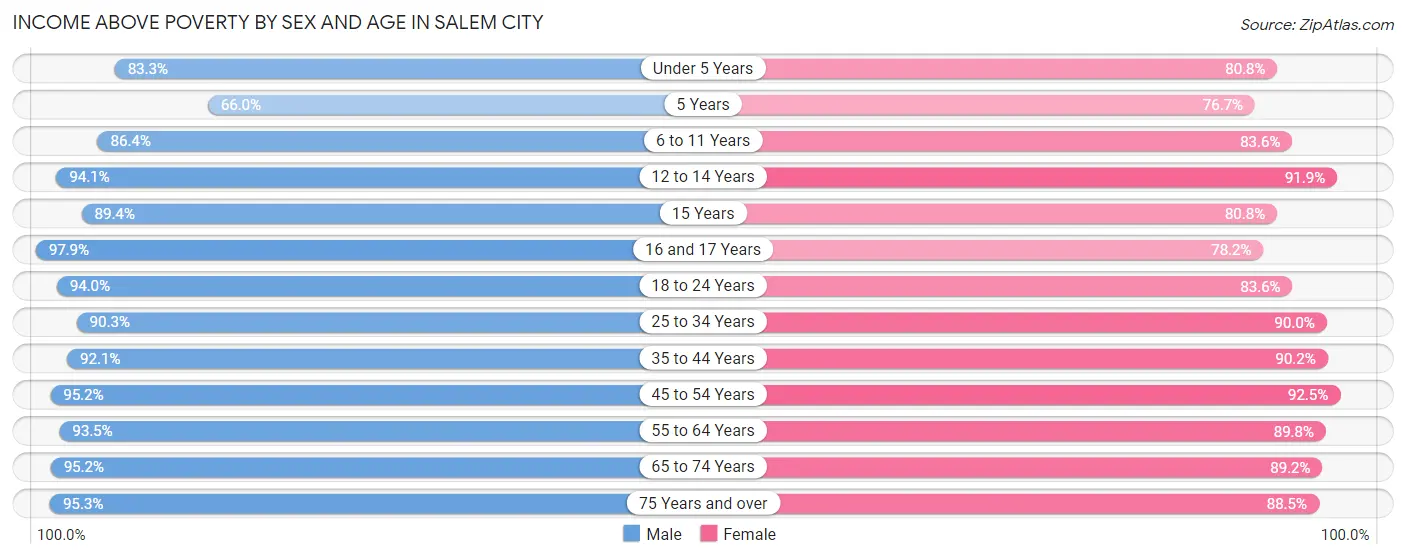
| Age Bracket | Male | Female |
| Under 5 Years | 433 (83.3%) | 367 (80.8%) |
| 5 Years | 97 (66.0%) | 69 (76.7%) |
| 6 to 11 Years | 459 (86.4%) | 688 (83.6%) |
| 12 to 14 Years | 702 (94.1%) | 443 (91.9%) |
| 15 Years | 76 (89.4%) | 105 (80.8%) |
| 16 and 17 Years | 375 (97.9%) | 194 (78.2%) |
| 18 to 24 Years | 817 (94.0%) | 680 (83.6%) |
| 25 to 34 Years | 1,270 (90.3%) | 1,231 (90.0%) |
| 35 to 44 Years | 1,293 (92.1%) | 1,392 (90.2%) |
| 45 to 54 Years | 1,338 (95.2%) | 1,526 (92.5%) |
| 55 to 64 Years | 1,491 (93.5%) | 1,564 (89.8%) |
| 65 to 74 Years | 1,059 (95.2%) | 1,287 (89.2%) |
| 75 Years and over | 666 (95.3%) | 927 (88.5%) |
| Total | 10,076 (92.4%) | 10,473 (88.5%) |
Income Below Poverty Among Married-Couple Families in Salem city
The poverty statistics for married-couple families in Salem city show that 2.7% or 121 of the total 4,453 families live below the poverty line. Families with 1 or 2 children have the highest poverty rate of 5.3%, comprising of 74 families. On the other hand, families with 5 or more children have the lowest poverty rate of 0.0%, which includes 0 families.
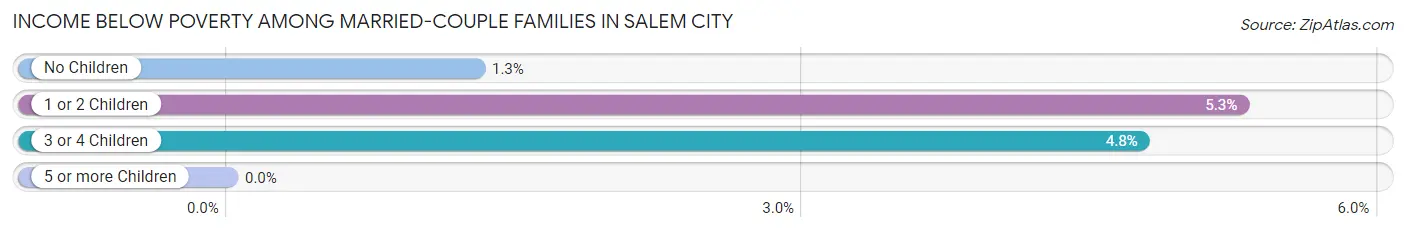
| Children | Above Poverty | Below Poverty |
| No Children | 2,759 (98.7%) | 36 (1.3%) |
| 1 or 2 Children | 1,327 (94.7%) | 74 (5.3%) |
| 3 or 4 Children | 220 (95.2%) | 11 (4.8%) |
| 5 or more Children | 26 (100.0%) | 0 (0.0%) |
| Total | 4,332 (97.3%) | 121 (2.7%) |
Income Below Poverty Among Single-Parent Households in Salem city
According to the poverty data in Salem city, 18.1% or 99 single-father households and 13.0% or 162 single-mother households are living below the poverty line. Among single-father households, those with 3 or 4 children have the highest poverty rate, with 28 households (41.2%) experiencing poverty. Likewise, among single-mother households, those with 3 or 4 children have the highest poverty rate, with 49 households (89.1%) falling below the poverty line.
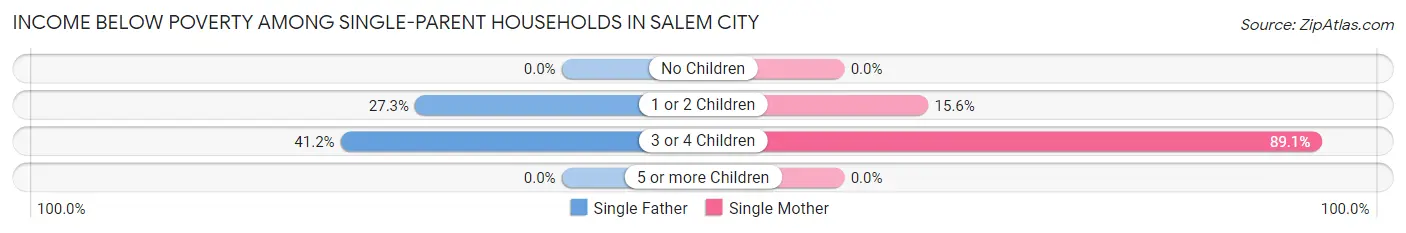
| Children | Single Father | Single Mother |
| No Children | 0 (0.0%) | 0 (0.0%) |
| 1 or 2 Children | 71 (27.3%) | 113 (15.6%) |
| 3 or 4 Children | 28 (41.2%) | 49 (89.1%) |
| 5 or more Children | 0 (0.0%) | 0 (0.0%) |
| Total | 99 (18.1%) | 162 (13.0%) |
Income Below Poverty Among Married-Couple vs Single-Parent Households in Salem city
The poverty data for Salem city shows that 121 of the married-couple family households (2.7%) and 261 of the single-parent households (14.5%) are living below the poverty level. Within the married-couple family households, those with 1 or 2 children have the highest poverty rate, with 74 households (5.3%) falling below the poverty line. Among the single-parent households, those with 3 or 4 children have the highest poverty rate, with 77 household (62.6%) living below poverty.
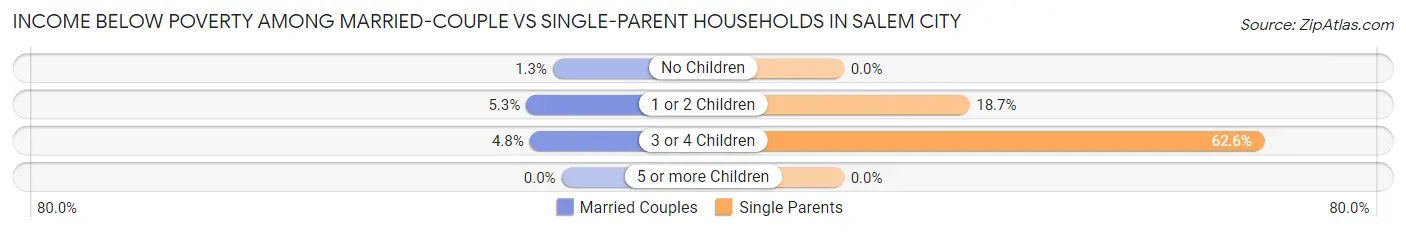
| Children | Married-Couple Families | Single-Parent Households |
| No Children | 36 (1.3%) | 0 (0.0%) |
| 1 or 2 Children | 74 (5.3%) | 184 (18.7%) |
| 3 or 4 Children | 11 (4.8%) | 77 (62.6%) |
| 5 or more Children | 0 (0.0%) | 0 (0.0%) |
| Total | 121 (2.7%) | 261 (14.5%) |
Race in Salem city
The most populous races in Salem city are White / Caucasian (21,591 | 85.1%), Black / African American (2,003 | 7.9%), and Hispanic or Latino (957 | 3.8%).
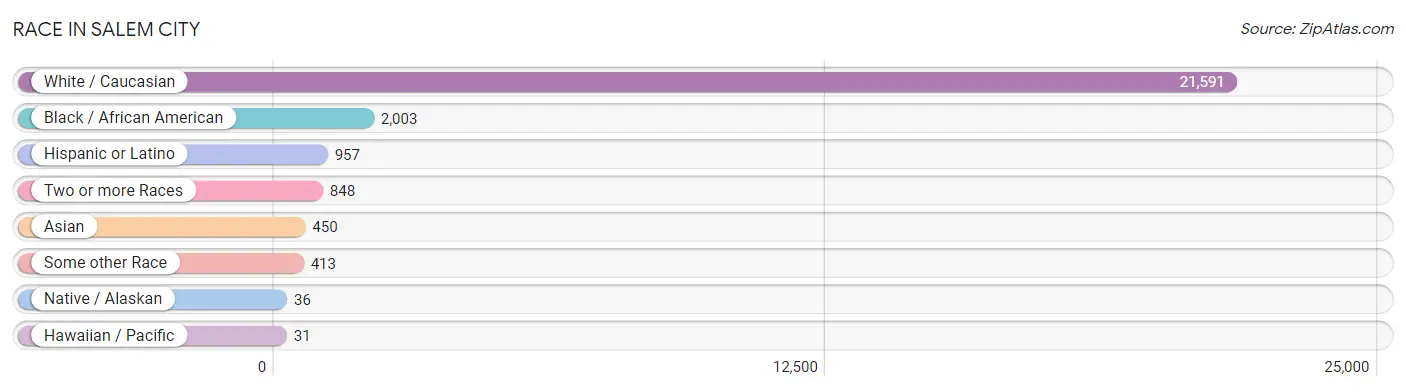
| Race | # Population | % Population |
| Asian | 450 | 1.8% |
| Black / African American | 2,003 | 7.9% |
| Hawaiian / Pacific | 31 | 0.1% |
| Hispanic or Latino | 957 | 3.8% |
| Native / Alaskan | 36 | 0.1% |
| White / Caucasian | 21,591 | 85.1% |
| Two or more Races | 848 | 3.3% |
| Some other Race | 413 | 1.6% |
| Total | 25,372 | 100.0% |
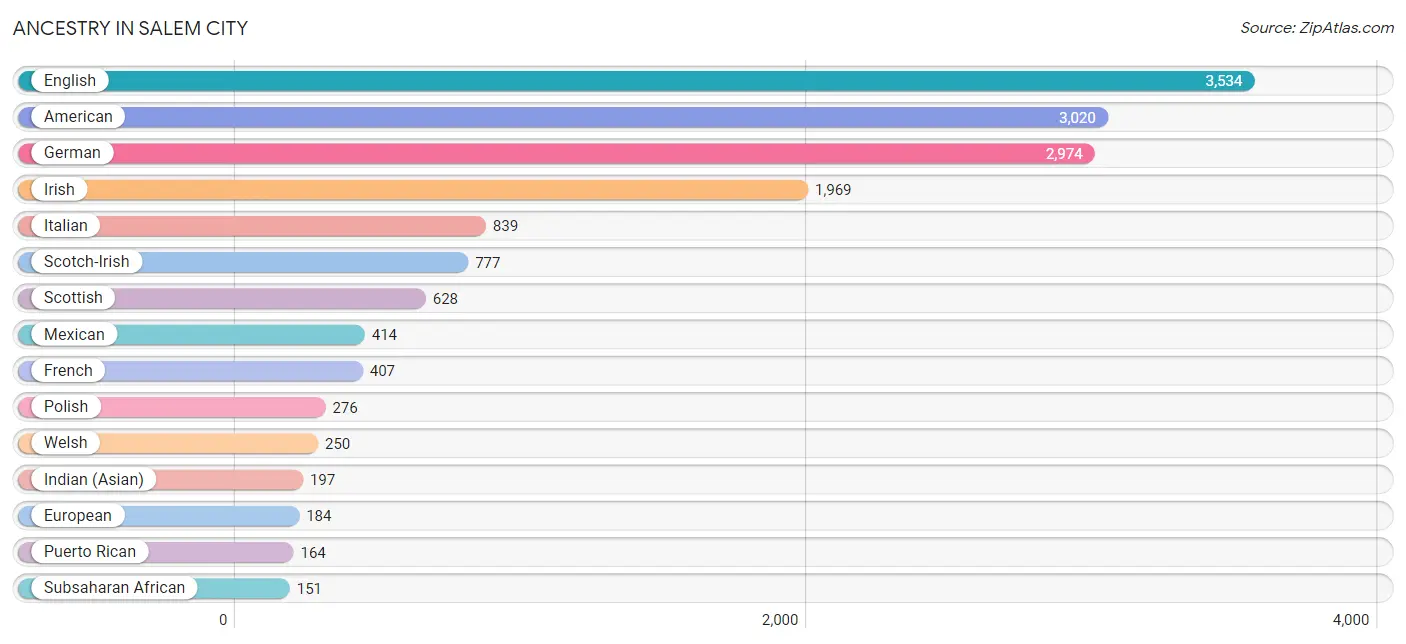
Ancestry in Salem city
The most populous ancestries reported in Salem city are English (3,534 | 13.9%), American (3,020 | 11.9%), German (2,974 | 11.7%), Irish (1,969 | 7.8%), and Italian (839 | 3.3%), together accounting for 48.6% of all Salem city residents.
| Ancestry | # Population | % Population |
| African | 134 | 0.5% |
| American | 3,020 | 11.9% |
| Apache | 9 | 0.0% |
| Arab | 88 | 0.4% |
| Argentinean | 4 | 0.0% |
| Australian | 22 | 0.1% |
| Austrian | 23 | 0.1% |
| Bhutanese | 38 | 0.2% |
| Blackfeet | 30 | 0.1% |
| Bolivian | 6 | 0.0% |
| Brazilian | 21 | 0.1% |
| British | 83 | 0.3% |
| Burmese | 57 | 0.2% |
| Cajun | 13 | 0.1% |
| Canadian | 33 | 0.1% |
| Central American | 138 | 0.5% |
| Central American Indian | 13 | 0.1% |
| Cherokee | 48 | 0.2% |
| Colombian | 18 | 0.1% |
| Croatian | 34 | 0.1% |
| Cuban | 36 | 0.1% |
| Czech | 32 | 0.1% |
| Danish | 41 | 0.2% |
| Dutch | 120 | 0.5% |
| Eastern European | 30 | 0.1% |
| Ecuadorian | 29 | 0.1% |
| English | 3,534 | 13.9% |
| European | 184 | 0.7% |
| French | 407 | 1.6% |
| French American Indian | 1 | 0.0% |
| French Canadian | 58 | 0.2% |
| German | 2,974 | 11.7% |
| Ghanaian | 7 | 0.0% |
| Greek | 71 | 0.3% |
| Guatemalan | 5 | 0.0% |
| Haitian | 19 | 0.1% |
| Honduran | 88 | 0.4% |
| Hungarian | 35 | 0.1% |
| Indian (Asian) | 197 | 0.8% |
| Irish | 1,969 | 7.8% |
| Italian | 839 | 3.3% |
| Jamaican | 46 | 0.2% |
| Korean | 120 | 0.5% |
| Latvian | 14 | 0.1% |
| Lebanese | 43 | 0.2% |
| Lithuanian | 22 | 0.1% |
| Macedonian | 10 | 0.0% |
| Mexican | 414 | 1.6% |
| Native Hawaiian | 20 | 0.1% |
| Northern European | 54 | 0.2% |
| Norwegian | 71 | 0.3% |
| Panamanian | 28 | 0.1% |
| Polish | 276 | 1.1% |
| Portuguese | 14 | 0.1% |
| Puerto Rican | 164 | 0.6% |
| Romanian | 10 | 0.0% |
| Russian | 20 | 0.1% |
| Salvadoran | 17 | 0.1% |
| Scandinavian | 41 | 0.2% |
| Scotch-Irish | 777 | 3.1% |
| Scottish | 628 | 2.5% |
| Slavic | 12 | 0.1% |
| Slovak | 8 | 0.0% |
| South American | 64 | 0.3% |
| South American Indian | 6 | 0.0% |
| Spaniard | 54 | 0.2% |
| Spanish | 68 | 0.3% |
| Sri Lankan | 4 | 0.0% |
| Subsaharan African | 151 | 0.6% |
| Swedish | 98 | 0.4% |
| Swiss | 71 | 0.3% |
| Thai | 109 | 0.4% |
| Trinidadian and Tobagonian | 13 | 0.1% |
| Ukrainian | 29 | 0.1% |
| Venezuelan | 7 | 0.0% |
| Welsh | 250 | 1.0% | View All 76 Rows |
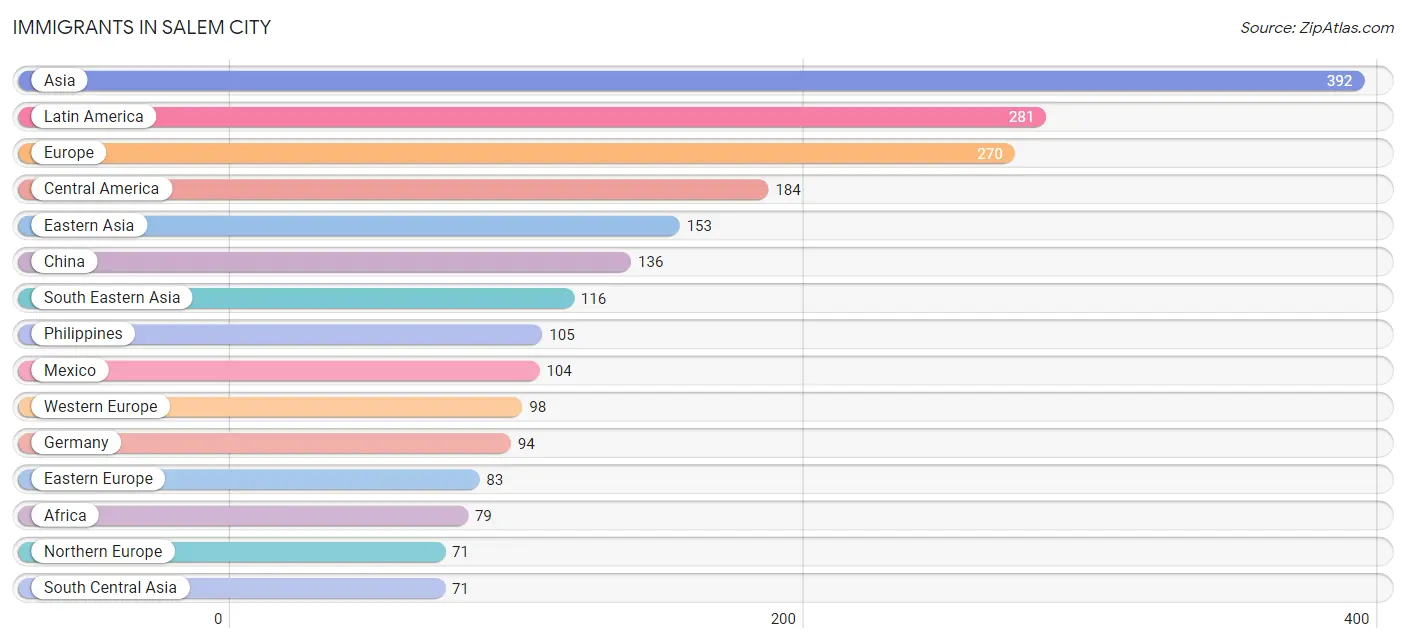
Immigrants in Salem city
The most numerous immigrant groups reported in Salem city came from Asia (392 | 1.5%), Latin America (281 | 1.1%), Europe (270 | 1.1%), Central America (184 | 0.7%), and Eastern Asia (153 | 0.6%), together accounting for 5.0% of all Salem city residents.
| Immigration Origin | # Population | % Population |
| Africa | 79 | 0.3% |
| Asia | 392 | 1.5% |
| Australia | 12 | 0.1% |
| Bolivia | 3 | 0.0% |
| Bosnia and Herzegovina | 58 | 0.2% |
| Brazil | 22 | 0.1% |
| Canada | 20 | 0.1% |
| Caribbean | 46 | 0.2% |
| Central America | 184 | 0.7% |
| China | 136 | 0.5% |
| Colombia | 5 | 0.0% |
| Congo | 5 | 0.0% |
| Cuba | 11 | 0.0% |
| Denmark | 12 | 0.1% |
| Eastern Africa | 10 | 0.0% |
| Eastern Asia | 153 | 0.6% |
| Eastern Europe | 83 | 0.3% |
| El Salvador | 10 | 0.0% |
| England | 34 | 0.1% |
| Ethiopia | 5 | 0.0% |
| Europe | 270 | 1.1% |
| Germany | 94 | 0.4% |
| Ghana | 7 | 0.0% |
| Greece | 9 | 0.0% |
| Guatemala | 5 | 0.0% |
| Haiti | 9 | 0.0% |
| Honduras | 65 | 0.3% |
| India | 49 | 0.2% |
| Jamaica | 19 | 0.1% |
| Korea | 17 | 0.1% |
| Latin America | 281 | 1.1% |
| Malaysia | 11 | 0.0% |
| Mexico | 104 | 0.4% |
| Middle Africa | 5 | 0.0% |
| Northern Europe | 71 | 0.3% |
| Oceania | 12 | 0.1% |
| Pakistan | 19 | 0.1% |
| Philippines | 105 | 0.4% |
| Poland | 9 | 0.0% |
| Romania | 11 | 0.0% |
| Russia | 5 | 0.0% |
| Saudi Arabia | 23 | 0.1% |
| Scotland | 7 | 0.0% |
| Senegal | 11 | 0.0% |
| South Africa | 46 | 0.2% |
| South America | 51 | 0.2% |
| South Central Asia | 71 | 0.3% |
| South Eastern Asia | 116 | 0.5% |
| Southern Europe | 18 | 0.1% |
| Spain | 9 | 0.0% |
| Switzerland | 4 | 0.0% |
| Trinidad and Tobago | 7 | 0.0% |
| Venezuela | 21 | 0.1% |
| Western Africa | 18 | 0.1% |
| Western Asia | 30 | 0.1% |
| Western Europe | 98 | 0.4% | View All 56 Rows |
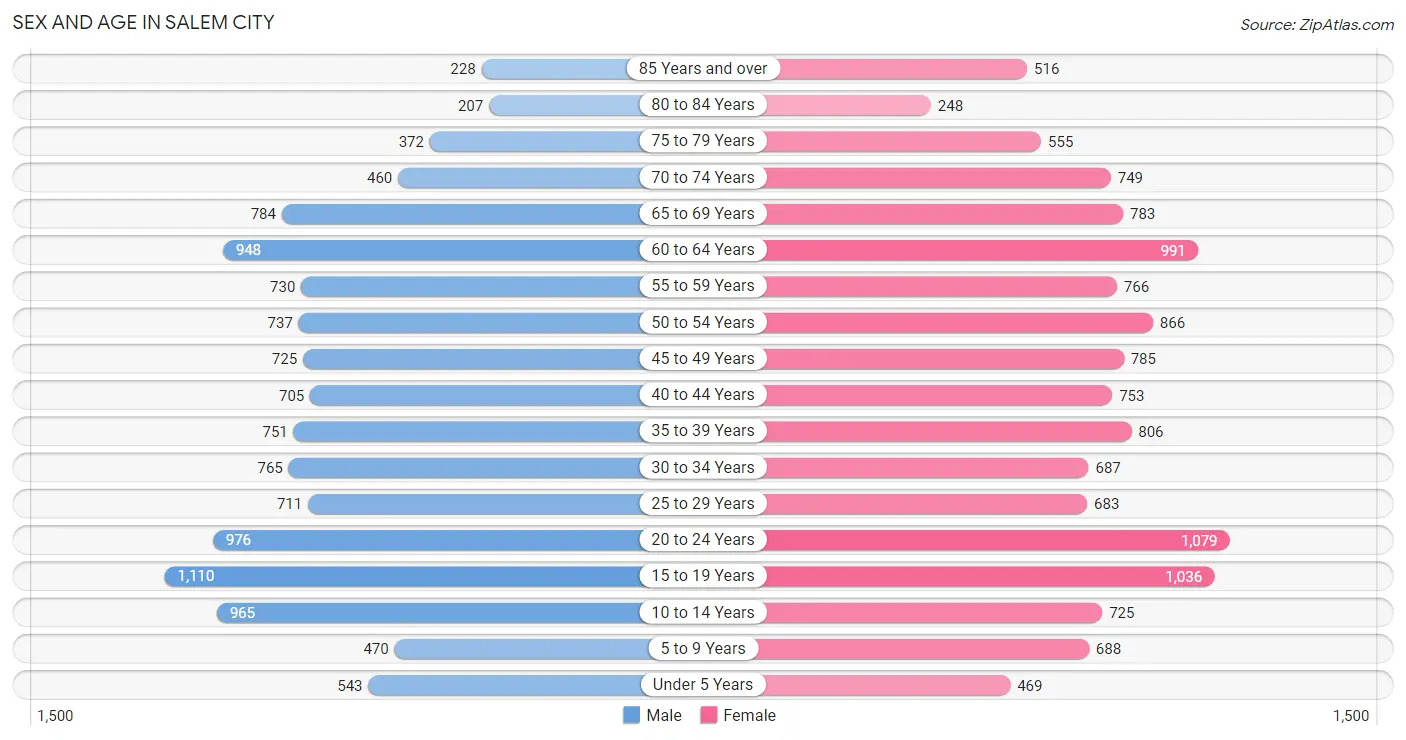
Sex and Age in Salem city
Sex and Age in Salem city
The most populous age groups in Salem city are 15 to 19 Years (1,110 | 9.1%) for men and 20 to 24 Years (1,079 | 8.2%) for women.
| Age Bracket | Male | Female |
| Under 5 Years | 543 (4.5%) | 469 (3.6%) |
| 5 to 9 Years | 470 (3.9%) | 688 (5.2%) |
| 10 to 14 Years | 965 (7.9%) | 725 (5.5%) |
| 15 to 19 Years | 1,110 (9.1%) | 1,036 (7.9%) |
| 20 to 24 Years | 976 (8.0%) | 1,079 (8.2%) |
| 25 to 29 Years | 711 (5.8%) | 683 (5.2%) |
| 30 to 34 Years | 765 (6.3%) | 687 (5.2%) |
| 35 to 39 Years | 751 (6.2%) | 806 (6.1%) |
| 40 to 44 Years | 705 (5.8%) | 753 (5.7%) |
| 45 to 49 Years | 725 (5.9%) | 785 (5.9%) |
| 50 to 54 Years | 737 (6.0%) | 866 (6.6%) |
| 55 to 59 Years | 730 (6.0%) | 766 (5.8%) |
| 60 to 64 Years | 948 (7.8%) | 991 (7.5%) |
| 65 to 69 Years | 784 (6.4%) | 783 (5.9%) |
| 70 to 74 Years | 460 (3.8%) | 749 (5.7%) |
| 75 to 79 Years | 372 (3.0%) | 555 (4.2%) |
| 80 to 84 Years | 207 (1.7%) | 248 (1.9%) |
| 85 Years and over | 228 (1.9%) | 516 (3.9%) |
| Total | 12,187 (100.0%) | 13,185 (100.0%) |
Families and Households in Salem city
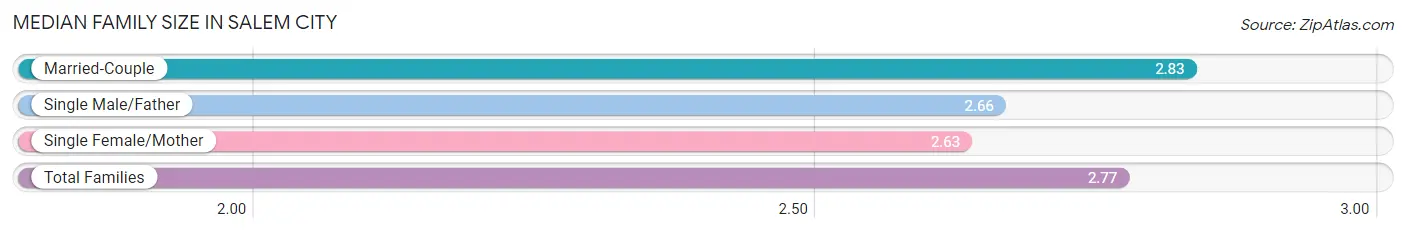
Median Family Size in Salem city
The median family size in Salem city is 2.77 persons per family, with married-couple families (4,453 | 71.3%) accounting for the largest median family size of 2.83 persons per family. On the other hand, single female/mother families (1,249 | 20.0%) represent the smallest median family size with 2.63 persons per family.
| Family Type | # Families | Family Size |
| Married-Couple | 4,453 (71.3%) | 2.83 |
| Single Male/Father | 546 (8.7%) | 2.66 |
| Single Female/Mother | 1,249 (20.0%) | 2.63 |
| Total Families | 6,248 (100.0%) | 2.77 |
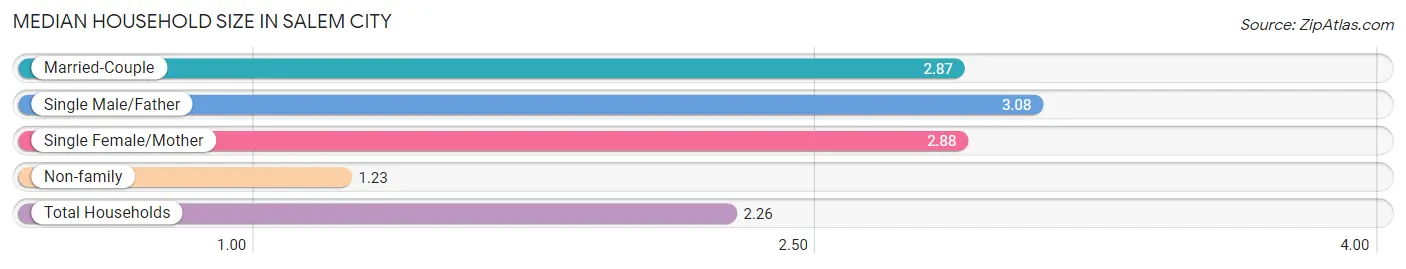
Median Household Size in Salem city
The median household size in Salem city is 2.26 persons per household, with single male/father households (546 | 5.4%) accounting for the largest median household size of 3.08 persons per household. non-family households (3,797 | 37.8%) represent the smallest median household size with 1.23 persons per household.
| Household Type | # Households | Household Size |
| Married-Couple | 4,453 (44.3%) | 2.87 |
| Single Male/Father | 546 (5.4%) | 3.08 |
| Single Female/Mother | 1,249 (12.4%) | 2.88 |
| Non-family | 3,797 (37.8%) | 1.23 |
| Total Households | 10,045 (100.0%) | 2.26 |
Household Size by Marriage Status in Salem city
Out of a total of 10,045 households in Salem city, 6,248 (62.2%) are family households, while 3,797 (37.8%) are nonfamily households. The most numerous type of family households are 2-person households, comprising 3,199, and the most common type of nonfamily households are 1-person households, comprising 3,038.
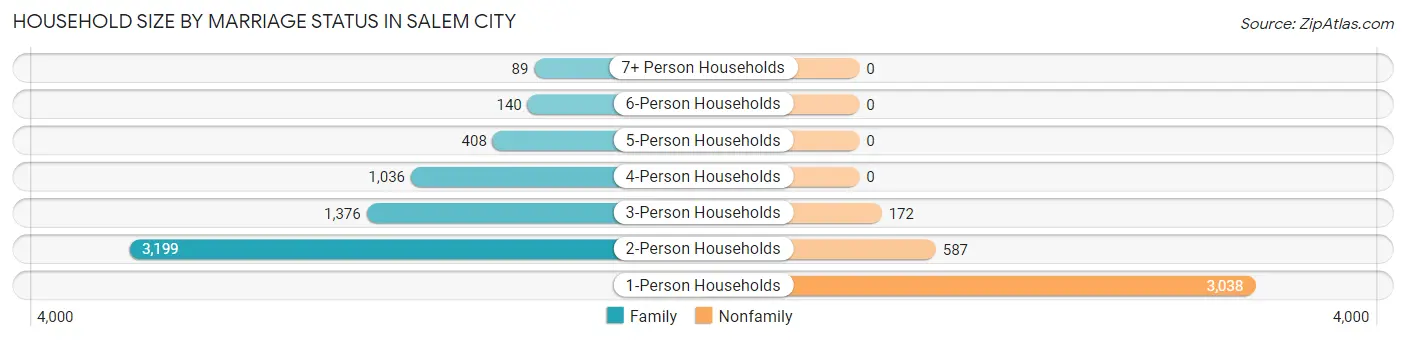
| Household Size | Family Households | Nonfamily Households |
| 1-Person Households | - | 3,038 (30.2%) |
| 2-Person Households | 3,199 (31.9%) | 587 (5.8%) |
| 3-Person Households | 1,376 (13.7%) | 172 (1.7%) |
| 4-Person Households | 1,036 (10.3%) | 0 (0.0%) |
| 5-Person Households | 408 (4.1%) | 0 (0.0%) |
| 6-Person Households | 140 (1.4%) | 0 (0.0%) |
| 7+ Person Households | 89 (0.9%) | 0 (0.0%) |
| Total | 6,248 (62.2%) | 3,797 (37.8%) |
Female Fertility in Salem city
Fertility by Age in Salem city
Average fertility rate in Salem city is 42.0 births per 1,000 women. Women in the age bracket of 20 to 34 years have the highest fertility rate with 87.0 births per 1,000 women. Women in the age bracket of 20 to 34 years acount for 84.5% of all women with births.
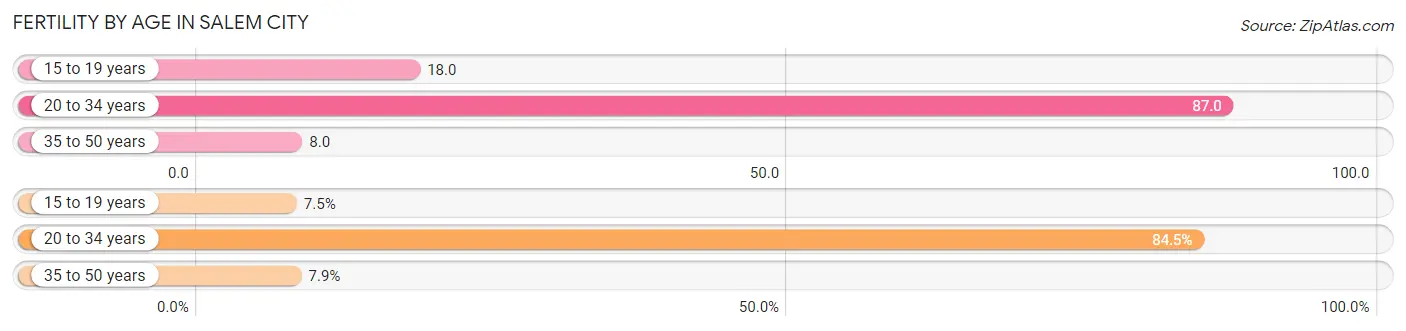
| Age Bracket | Women with Births | Births / 1,000 Women |
| 15 to 19 years | 19 (7.5%) | 18.0 |
| 20 to 34 years | 213 (84.5%) | 87.0 |
| 35 to 50 years | 20 (7.9%) | 8.0 |
| Total | 252 (100.0%) | 42.0 |
Fertility by Age by Marriage Status in Salem city
49.2% of women with births (252) in Salem city are married. The highest percentage of unmarried women with births falls into 15 to 19 years age bracket with 100.0% of them unmarried at the time of birth, while the lowest percentage of unmarried women with births belong to 35 to 50 years age bracket with 0.0% of them unmarried.
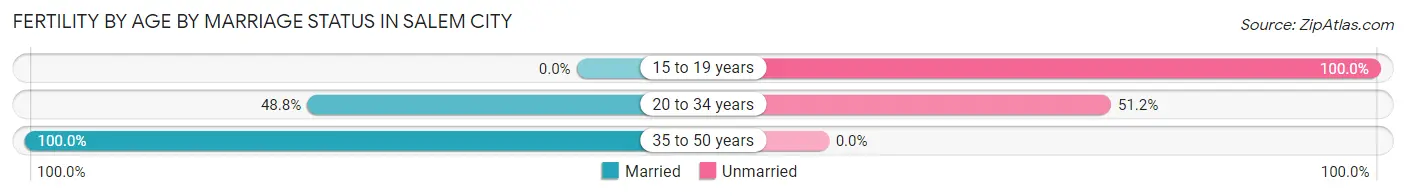
| Age Bracket | Married | Unmarried |
| 15 to 19 years | 0 (0.0%) | 19 (100.0%) |
| 20 to 34 years | 104 (48.8%) | 109 (51.2%) |
| 35 to 50 years | 20 (100.0%) | 0 (0.0%) |
| Total | 124 (49.2%) | 128 (50.8%) |
Fertility by Education in Salem city
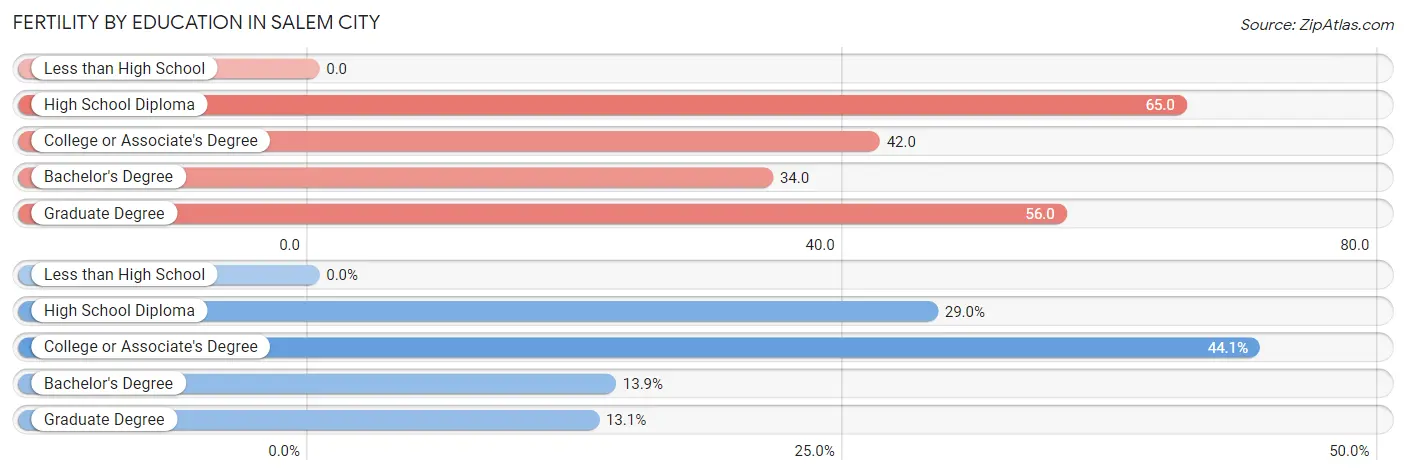
| Educational Attainment | Women with Births | Births / 1,000 Women |
| Less than High School | 0 (0.0%) | 0.0 |
| High School Diploma | 73 (29.0%) | 65.0 |
| College or Associate's Degree | 111 (44.1%) | 42.0 |
| Bachelor's Degree | 35 (13.9%) | 34.0 |
| Graduate Degree | 33 (13.1%) | 56.0 |
| Total | 252 (100.0%) | 42.0 |
Fertility by Education by Marriage Status in Salem city
50.8% of women with births in Salem city are unmarried. Women with the educational attainment of bachelor's degree are most likely to be married with 100.0% of them married at childbirth, while women with the educational attainment of high school diploma are least likely to be married with 79.4% of them unmarried at childbirth.
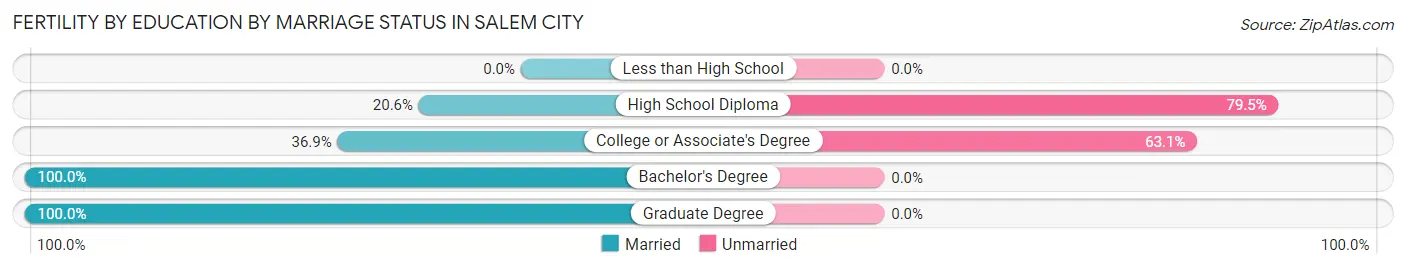
| Educational Attainment | Married | Unmarried |
| Less than High School | 0 (0.0%) | 0 (0.0%) |
| High School Diploma | 15 (20.5%) | 58 (79.4%) |
| College or Associate's Degree | 41 (36.9%) | 70 (63.1%) |
| Bachelor's Degree | 35 (100.0%) | 0 (0.0%) |
| Graduate Degree | 33 (100.0%) | 0 (0.0%) |
| Total | 124 (49.2%) | 128 (50.8%) |
Employment Characteristics in Salem city
Employment by Class of Employer in Salem city
Among the 12,358 employed individuals in Salem city, private company employees (8,363 | 67.7%), not-for-profit organizations (1,255 | 10.2%), and local government employees (787 | 6.4%) make up the most common classes of employment.
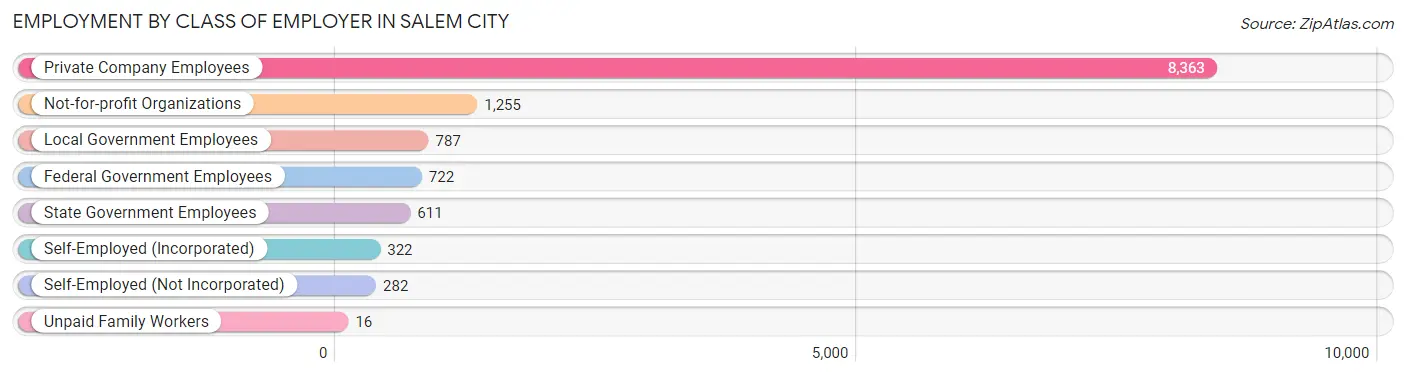
| Employer Class | # Employees | % Employees |
| Private Company Employees | 8,363 | 67.7% |
| Self-Employed (Incorporated) | 322 | 2.6% |
| Self-Employed (Not Incorporated) | 282 | 2.3% |
| Not-for-profit Organizations | 1,255 | 10.2% |
| Local Government Employees | 787 | 6.4% |
| State Government Employees | 611 | 4.9% |
| Federal Government Employees | 722 | 5.8% |
| Unpaid Family Workers | 16 | 0.1% |
| Total | 12,358 | 100.0% |
Employment Status by Age in Salem city
According to the labor force statistics for Salem city, out of the total population over 16 years of age (21,295), 61.1% or 13,011 individuals are in the labor force, with 3.5% or 455 of them unemployed. The age group with the highest labor force participation rate is 30 to 34 years, with 89.5% or 1,300 individuals in the labor force. Within the labor force, the 25 to 29 years age range has the highest percentage of unemployed individuals, with 10.9% or 121 of them being unemployed.
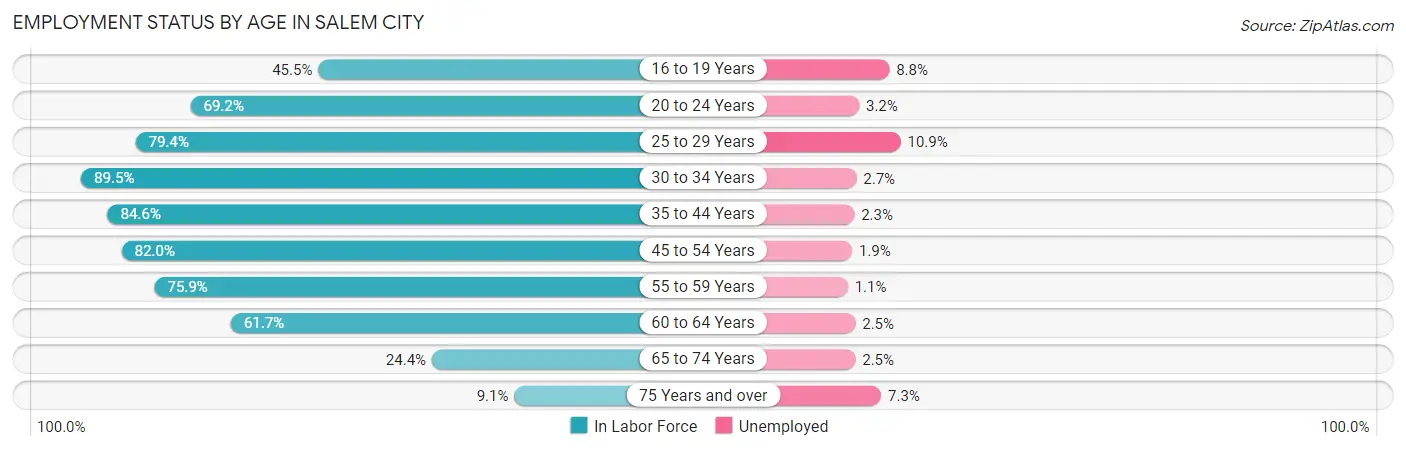
| Age Bracket | In Labor Force | Unemployed |
| 16 to 19 Years | 878 (45.5%) | 77 (8.8%) |
| 20 to 24 Years | 1,422 (69.2%) | 46 (3.2%) |
| 25 to 29 Years | 1,107 (79.4%) | 121 (10.9%) |
| 30 to 34 Years | 1,300 (89.5%) | 35 (2.7%) |
| 35 to 44 Years | 2,551 (84.6%) | 59 (2.3%) |
| 45 to 54 Years | 2,553 (82.0%) | 49 (1.9%) |
| 55 to 59 Years | 1,135 (75.9%) | 12 (1.1%) |
| 60 to 64 Years | 1,196 (61.7%) | 30 (2.5%) |
| 65 to 74 Years | 677 (24.4%) | 17 (2.5%) |
| 75 Years and over | 193 (9.1%) | 14 (7.3%) |
| Total | 13,011 (61.1%) | 455 (3.5%) |
Employment Status by Educational Attainment in Salem city
According to labor force statistics for Salem city, 79.3% of individuals (9,840) out of the total population between 25 and 64 years of age (12,409) are in the labor force, with 3.1% or 305 of them being unemployed. The group with the highest labor force participation rate are those with the educational attainment of bachelor's degree or higher, with 89.7% or 3,720 individuals in the labor force. Within the labor force, individuals with less than high school education have the highest percentage of unemployment, with 9.5% or 29 of them being unemployed.
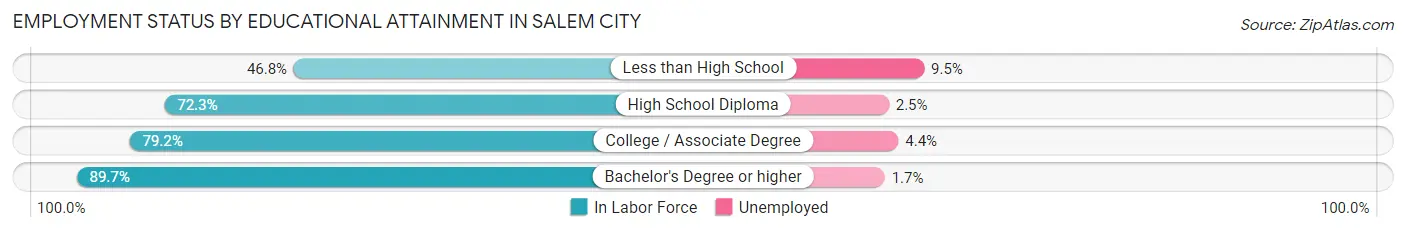
| Educational Attainment | In Labor Force | Unemployed |
| Less than High School | 305 (46.8%) | 62 (9.5%) |
| High School Diploma | 2,229 (72.3%) | 77 (2.5%) |
| College / Associate Degree | 3,585 (79.2%) | 199 (4.4%) |
| Bachelor's Degree or higher | 3,720 (89.7%) | 70 (1.7%) |
| Total | 9,840 (79.3%) | 385 (3.1%) |
Employment Occupations by Sex in Salem city
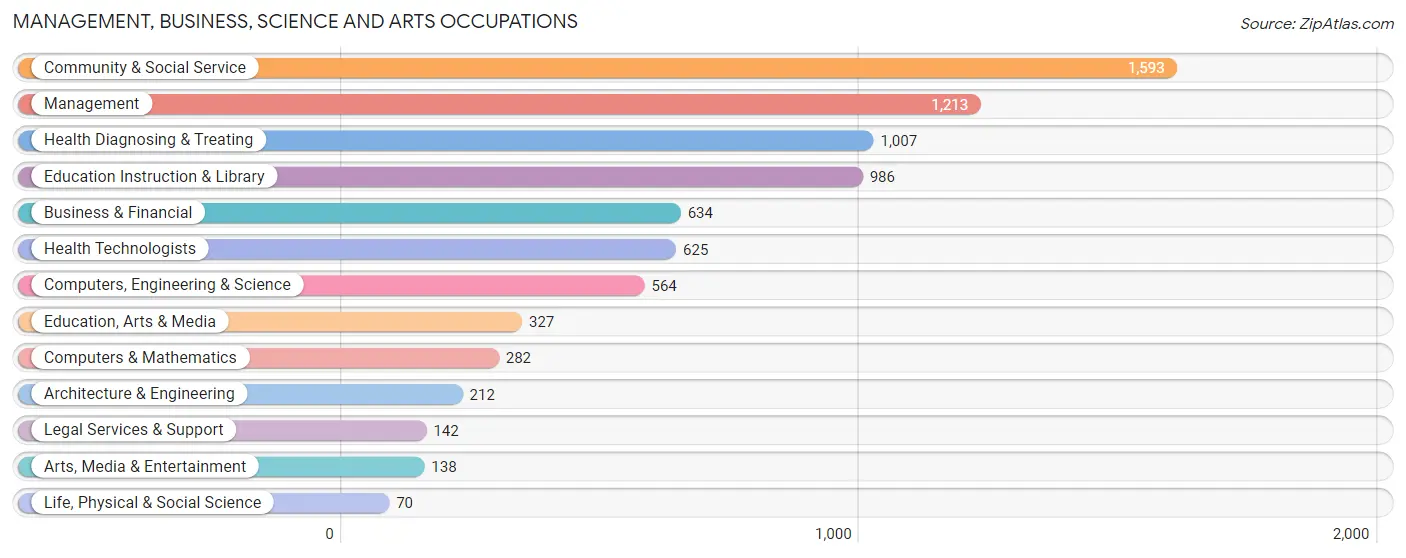
Management, Business, Science and Arts Occupations
The most common Management, Business, Science and Arts occupations in Salem city are Community & Social Service (1,593 | 12.8%), Management (1,213 | 9.7%), Health Diagnosing & Treating (1,007 | 8.1%), Education Instruction & Library (986 | 7.9%), and Business & Financial (634 | 5.1%).
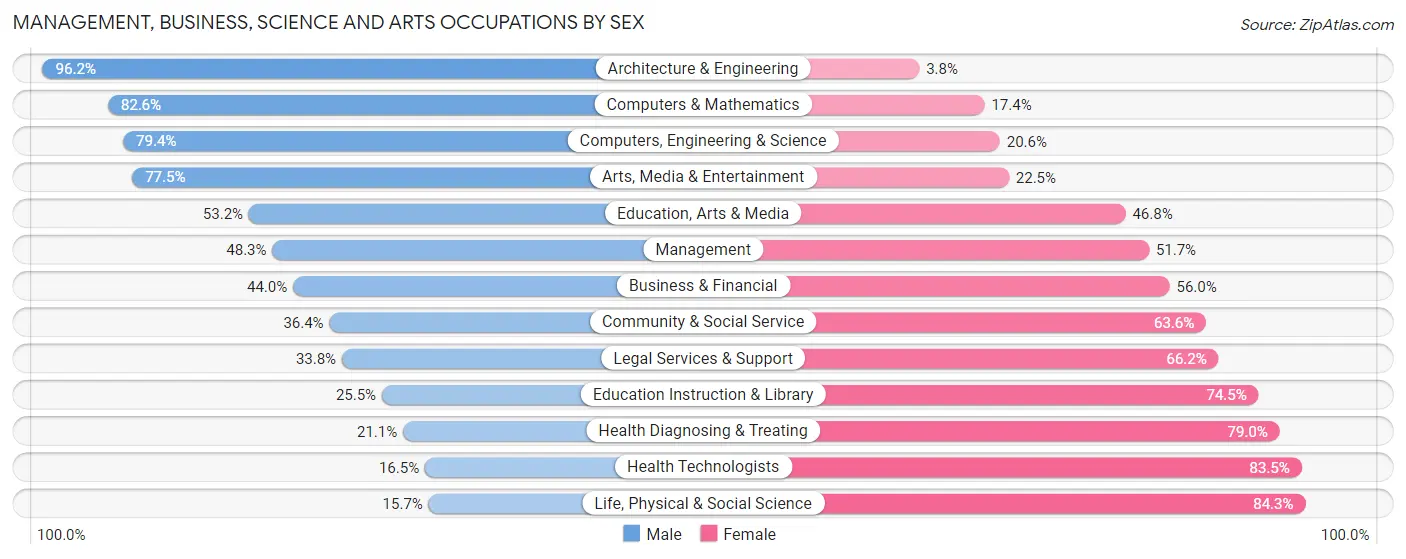
Management, Business, Science and Arts Occupations by Sex
Within the Management, Business, Science and Arts occupations in Salem city, the most male-oriented occupations are Architecture & Engineering (96.2%), Computers & Mathematics (82.6%), and Computers, Engineering & Science (79.4%), while the most female-oriented occupations are Life, Physical & Social Science (84.3%), Health Technologists (83.5%), and Health Diagnosing & Treating (78.9%).
| Occupation | Male | Female |
| Management | 586 (48.3%) | 627 (51.7%) |
| Business & Financial | 279 (44.0%) | 355 (56.0%) |
| Computers, Engineering & Science | 448 (79.4%) | 116 (20.6%) |
| Computers & Mathematics | 233 (82.6%) | 49 (17.4%) |
| Architecture & Engineering | 204 (96.2%) | 8 (3.8%) |
| Life, Physical & Social Science | 11 (15.7%) | 59 (84.3%) |
| Community & Social Service | 580 (36.4%) | 1,013 (63.6%) |
| Education, Arts & Media | 174 (53.2%) | 153 (46.8%) |
| Legal Services & Support | 48 (33.8%) | 94 (66.2%) |
| Education Instruction & Library | 251 (25.5%) | 735 (74.5%) |
| Arts, Media & Entertainment | 107 (77.5%) | 31 (22.5%) |
| Health Diagnosing & Treating | 212 (21.0%) | 795 (78.9%) |
| Health Technologists | 103 (16.5%) | 522 (83.5%) |
| Total (Category) | 2,105 (42.0%) | 2,906 (58.0%) |
| Total (Overall) | 6,583 (52.7%) | 5,900 (47.3%) |
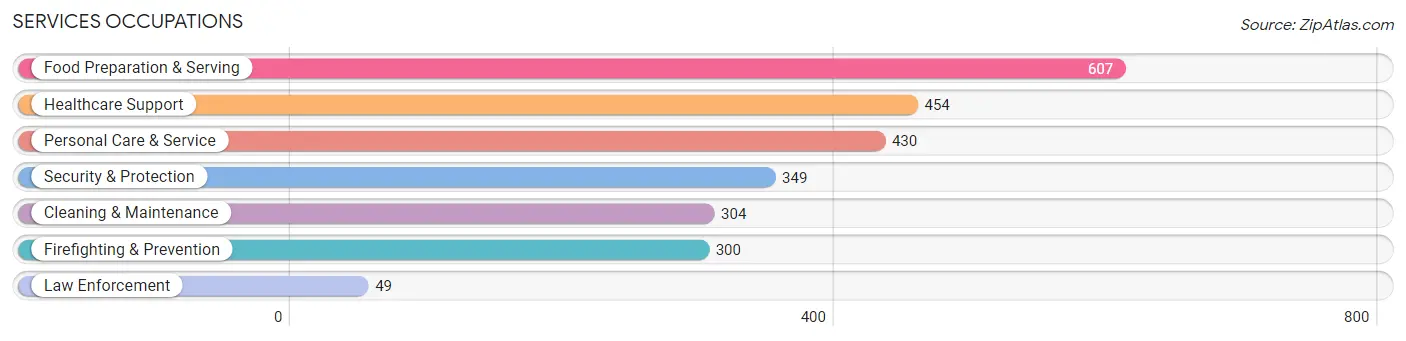
Services Occupations
The most common Services occupations in Salem city are Food Preparation & Serving (607 | 4.9%), Healthcare Support (454 | 3.6%), Personal Care & Service (430 | 3.4%), Security & Protection (349 | 2.8%), and Cleaning & Maintenance (304 | 2.4%).
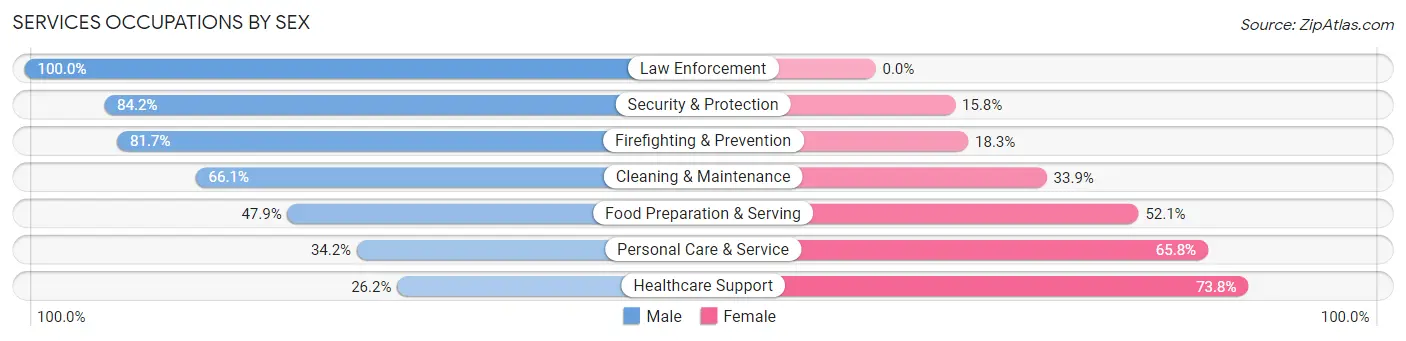
Services Occupations by Sex
Within the Services occupations in Salem city, the most male-oriented occupations are Law Enforcement (100.0%), Security & Protection (84.2%), and Firefighting & Prevention (81.7%), while the most female-oriented occupations are Healthcare Support (73.8%), Personal Care & Service (65.8%), and Food Preparation & Serving (52.1%).
| Occupation | Male | Female |
| Healthcare Support | 119 (26.2%) | 335 (73.8%) |
| Security & Protection | 294 (84.2%) | 55 (15.8%) |
| Firefighting & Prevention | 245 (81.7%) | 55 (18.3%) |
| Law Enforcement | 49 (100.0%) | 0 (0.0%) |
| Food Preparation & Serving | 291 (47.9%) | 316 (52.1%) |
| Cleaning & Maintenance | 201 (66.1%) | 103 (33.9%) |
| Personal Care & Service | 147 (34.2%) | 283 (65.8%) |
| Total (Category) | 1,052 (49.1%) | 1,092 (50.9%) |
| Total (Overall) | 6,583 (52.7%) | 5,900 (47.3%) |
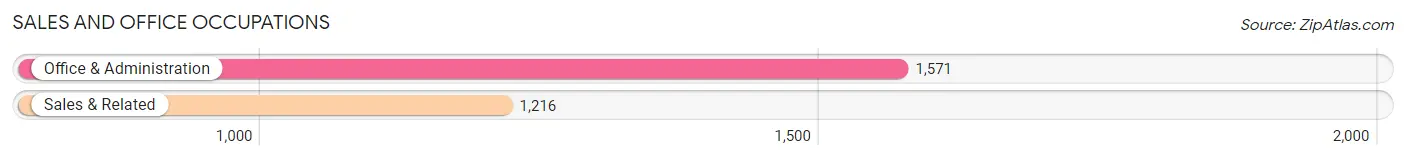
Sales and Office Occupations
The most common Sales and Office occupations in Salem city are Office & Administration (1,571 | 12.6%), and Sales & Related (1,216 | 9.7%).
Sales and Office Occupations by Sex
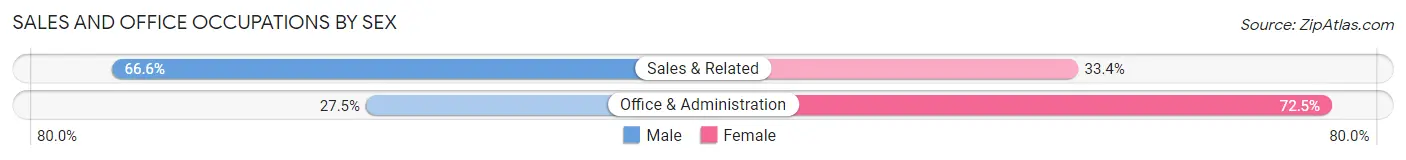
| Occupation | Male | Female |
| Sales & Related | 810 (66.6%) | 406 (33.4%) |
| Office & Administration | 432 (27.5%) | 1,139 (72.5%) |
| Total (Category) | 1,242 (44.6%) | 1,545 (55.4%) |
| Total (Overall) | 6,583 (52.7%) | 5,900 (47.3%) |
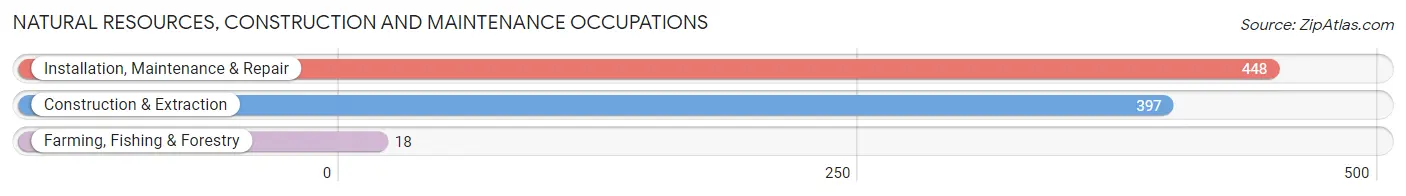
Natural Resources, Construction and Maintenance Occupations
The most common Natural Resources, Construction and Maintenance occupations in Salem city are Installation, Maintenance & Repair (448 | 3.6%), Construction & Extraction (397 | 3.2%), and Farming, Fishing & Forestry (18 | 0.1%).
Natural Resources, Construction and Maintenance Occupations by Sex
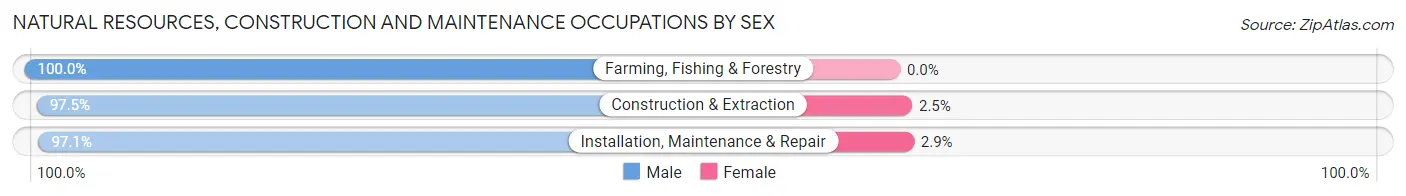
| Occupation | Male | Female |
| Farming, Fishing & Forestry | 18 (100.0%) | 0 (0.0%) |
| Construction & Extraction | 387 (97.5%) | 10 (2.5%) |
| Installation, Maintenance & Repair | 435 (97.1%) | 13 (2.9%) |
| Total (Category) | 840 (97.3%) | 23 (2.7%) |
| Total (Overall) | 6,583 (52.7%) | 5,900 (47.3%) |
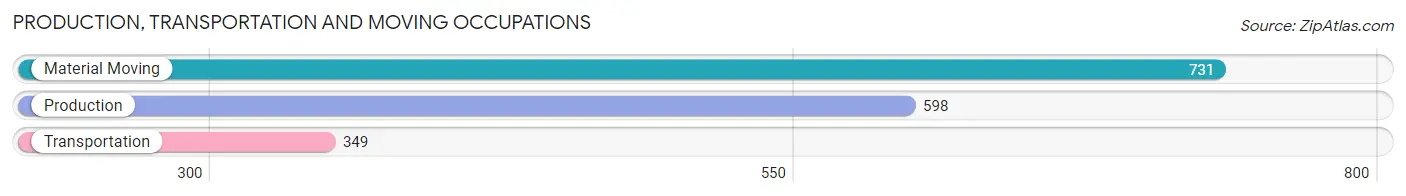
Production, Transportation and Moving Occupations
The most common Production, Transportation and Moving occupations in Salem city are Material Moving (731 | 5.9%), Production (598 | 4.8%), and Transportation (349 | 2.8%).
Production, Transportation and Moving Occupations by Sex
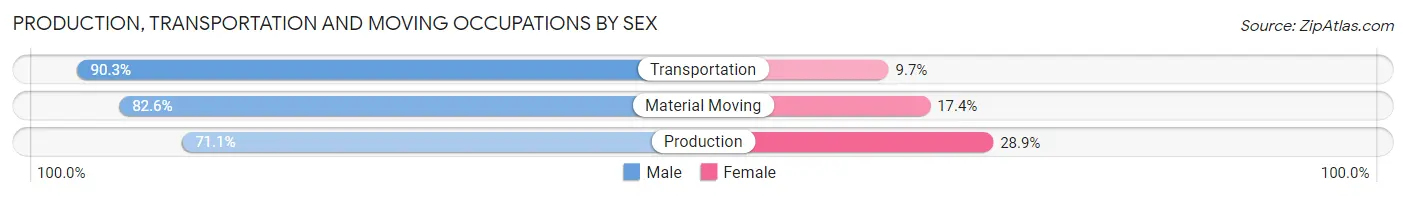
| Occupation | Male | Female |
| Production | 425 (71.1%) | 173 (28.9%) |
| Transportation | 315 (90.3%) | 34 (9.7%) |
| Material Moving | 604 (82.6%) | 127 (17.4%) |
| Total (Category) | 1,344 (80.1%) | 334 (19.9%) |
| Total (Overall) | 6,583 (52.7%) | 5,900 (47.3%) |
Employment Industries by Sex in Salem city
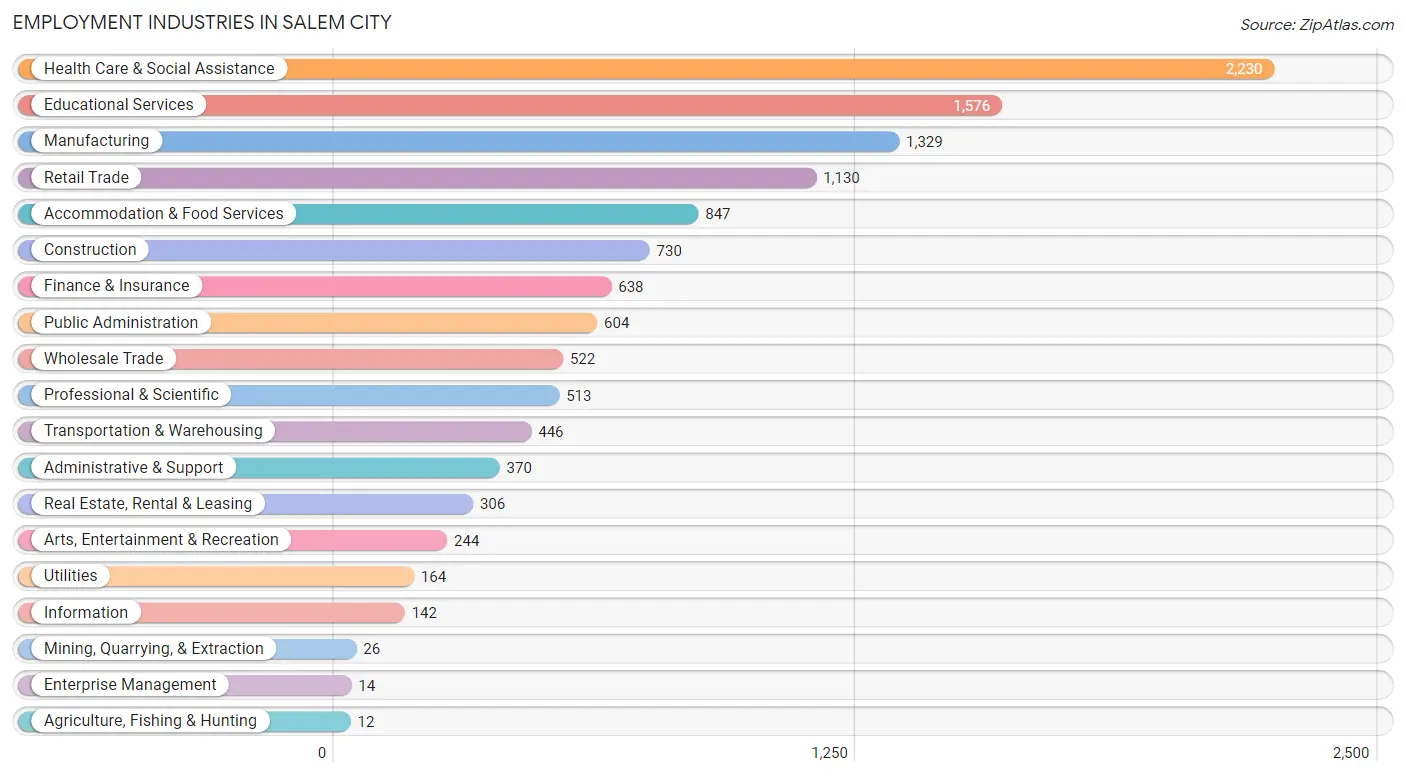
Employment Industries in Salem city
The major employment industries in Salem city include Health Care & Social Assistance (2,230 | 17.9%), Educational Services (1,576 | 12.6%), Manufacturing (1,329 | 10.6%), Retail Trade (1,130 | 9.0%), and Accommodation & Food Services (847 | 6.8%).
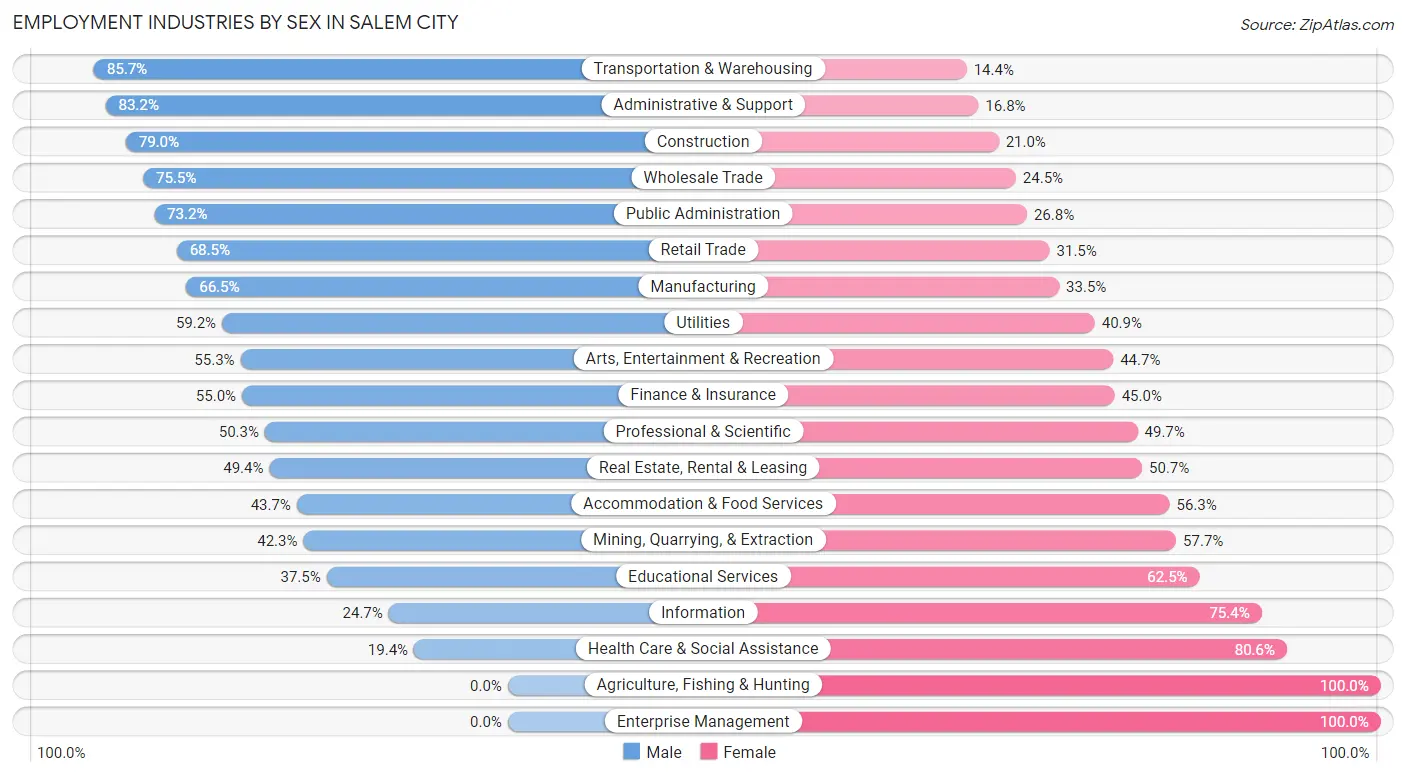
Employment Industries by Sex in Salem city
The Salem city industries that see more men than women are Transportation & Warehousing (85.7%), Administrative & Support (83.2%), and Construction (79.0%), whereas the industries that tend to have a higher number of women are Agriculture, Fishing & Hunting (100.0%), Enterprise Management (100.0%), and Health Care & Social Assistance (80.6%).
| Industry | Male | Female |
| Agriculture, Fishing & Hunting | 0 (0.0%) | 12 (100.0%) |
| Mining, Quarrying, & Extraction | 11 (42.3%) | 15 (57.7%) |
| Construction | 577 (79.0%) | 153 (21.0%) |
| Manufacturing | 884 (66.5%) | 445 (33.5%) |
| Wholesale Trade | 394 (75.5%) | 128 (24.5%) |
| Retail Trade | 774 (68.5%) | 356 (31.5%) |
| Transportation & Warehousing | 382 (85.7%) | 64 (14.3%) |
| Utilities | 97 (59.2%) | 67 (40.8%) |
| Information | 35 (24.6%) | 107 (75.3%) |
| Finance & Insurance | 351 (55.0%) | 287 (45.0%) |
| Real Estate, Rental & Leasing | 151 (49.3%) | 155 (50.6%) |
| Professional & Scientific | 258 (50.3%) | 255 (49.7%) |
| Enterprise Management | 0 (0.0%) | 14 (100.0%) |
| Administrative & Support | 308 (83.2%) | 62 (16.8%) |
| Educational Services | 591 (37.5%) | 985 (62.5%) |
| Health Care & Social Assistance | 433 (19.4%) | 1,797 (80.6%) |
| Arts, Entertainment & Recreation | 135 (55.3%) | 109 (44.7%) |
| Accommodation & Food Services | 370 (43.7%) | 477 (56.3%) |
| Public Administration | 442 (73.2%) | 162 (26.8%) |
| Total | 6,583 (52.7%) | 5,900 (47.3%) |
Education in Salem city
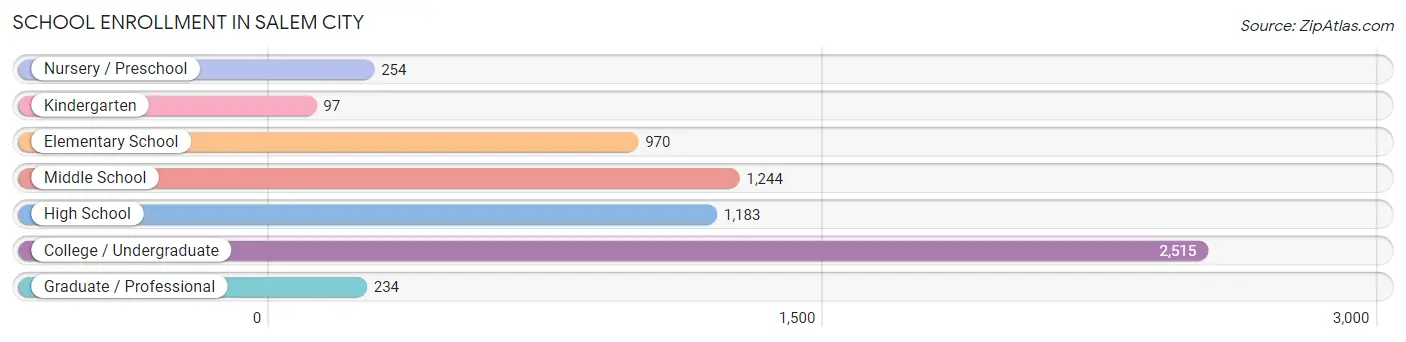
School Enrollment in Salem city
The most common levels of schooling among the 6,497 students in Salem city are college / undergraduate (2,515 | 38.7%), middle school (1,244 | 19.2%), and high school (1,183 | 18.2%).
| School Level | # Students | % Students |
| Nursery / Preschool | 254 | 3.9% |
| Kindergarten | 97 | 1.5% |
| Elementary School | 970 | 14.9% |
| Middle School | 1,244 | 19.2% |
| High School | 1,183 | 18.2% |
| College / Undergraduate | 2,515 | 38.7% |
| Graduate / Professional | 234 | 3.6% |
| Total | 6,497 | 100.0% |
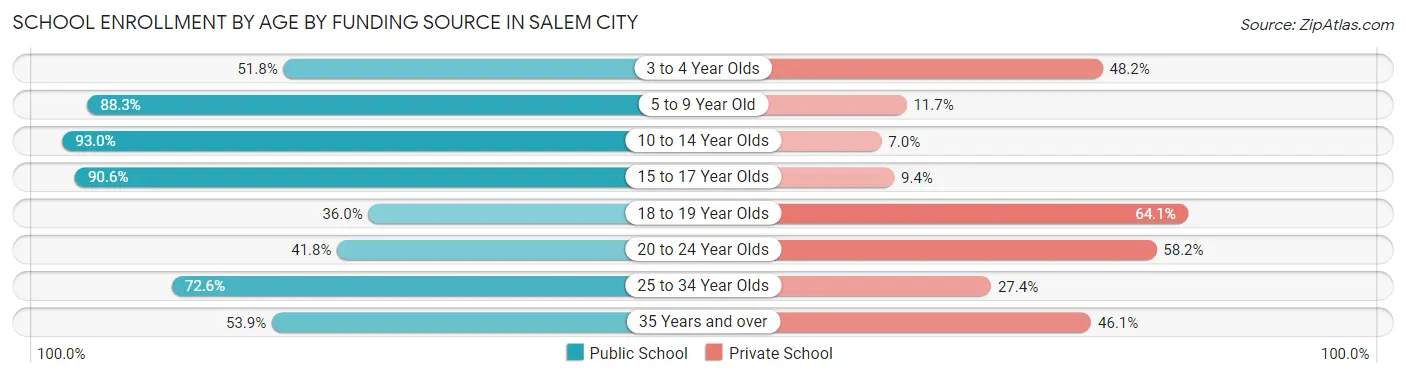
School Enrollment by Age by Funding Source in Salem city
Out of a total of 6,497 students who are enrolled in schools in Salem city, 1,975 (30.4%) attend a private institution, while the remaining 4,522 (69.6%) are enrolled in public schools. The age group of 18 to 19 year olds has the highest likelihood of being enrolled in private schools, with 693 (64.0% in the age bracket) enrolled. Conversely, the age group of 10 to 14 year olds has the lowest likelihood of being enrolled in a private school, with 1,534 (93.0% in the age bracket) attending a public institution.
| Age Bracket | Public School | Private School |
| 3 to 4 Year Olds | 102 (51.8%) | 95 (48.2%) |
| 5 to 9 Year Old | 928 (88.3%) | 123 (11.7%) |
| 10 to 14 Year Olds | 1,534 (93.0%) | 116 (7.0%) |
| 15 to 17 Year Olds | 724 (90.6%) | 75 (9.4%) |
| 18 to 19 Year Olds | 389 (35.9%) | 693 (64.0%) |
| 20 to 24 Year Olds | 489 (41.8%) | 682 (58.2%) |
| 25 to 34 Year Olds | 230 (72.6%) | 87 (27.4%) |
| 35 Years and over | 124 (53.9%) | 106 (46.1%) |
| Total | 4,522 (69.6%) | 1,975 (30.4%) |
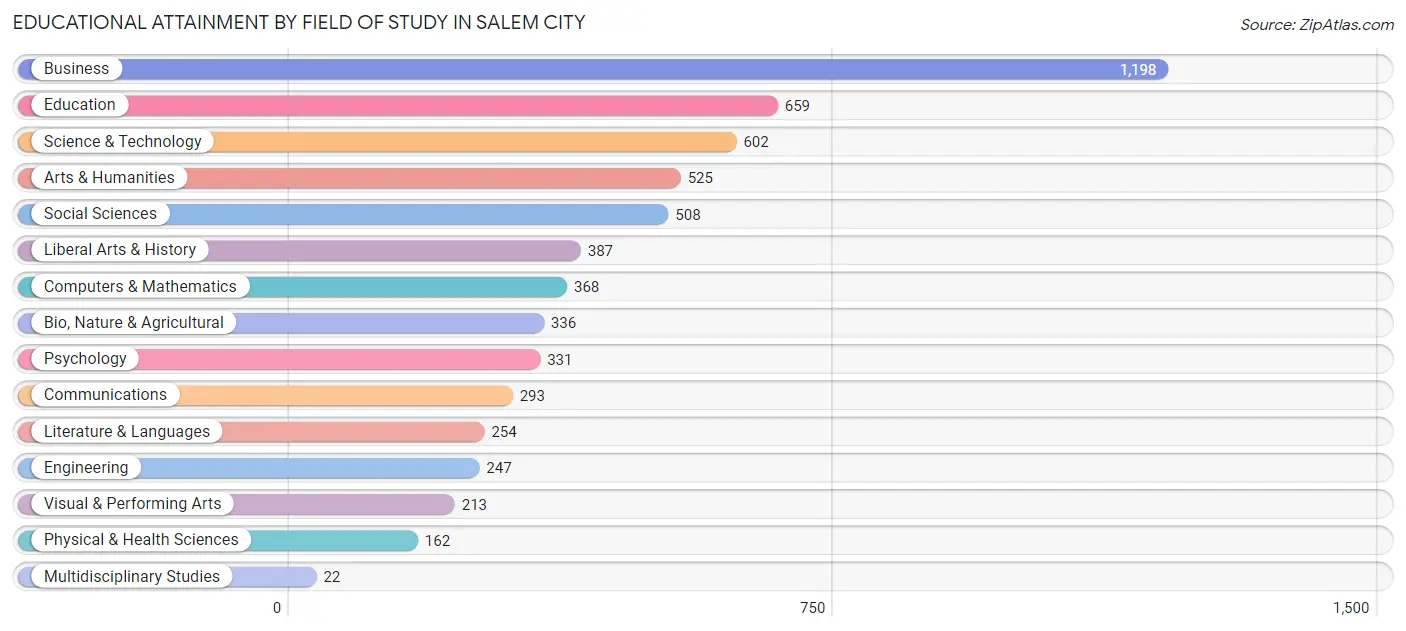
Educational Attainment by Field of Study in Salem city
Business (1,198 | 19.6%), education (659 | 10.8%), science & technology (602 | 9.9%), arts & humanities (525 | 8.6%), and social sciences (508 | 8.3%) are the most common fields of study among 6,105 individuals in Salem city who have obtained a bachelor's degree or higher.
| Field of Study | # Graduates | % Graduates |
| Computers & Mathematics | 368 | 6.0% |
| Bio, Nature & Agricultural | 336 | 5.5% |
| Physical & Health Sciences | 162 | 2.6% |
| Psychology | 331 | 5.4% |
| Social Sciences | 508 | 8.3% |
| Engineering | 247 | 4.1% |
| Multidisciplinary Studies | 22 | 0.4% |
| Science & Technology | 602 | 9.9% |
| Business | 1,198 | 19.6% |
| Education | 659 | 10.8% |
| Literature & Languages | 254 | 4.2% |
| Liberal Arts & History | 387 | 6.3% |
| Visual & Performing Arts | 213 | 3.5% |
| Communications | 293 | 4.8% |
| Arts & Humanities | 525 | 8.6% |
| Total | 6,105 | 100.0% |
Transportation & Commute in Salem city
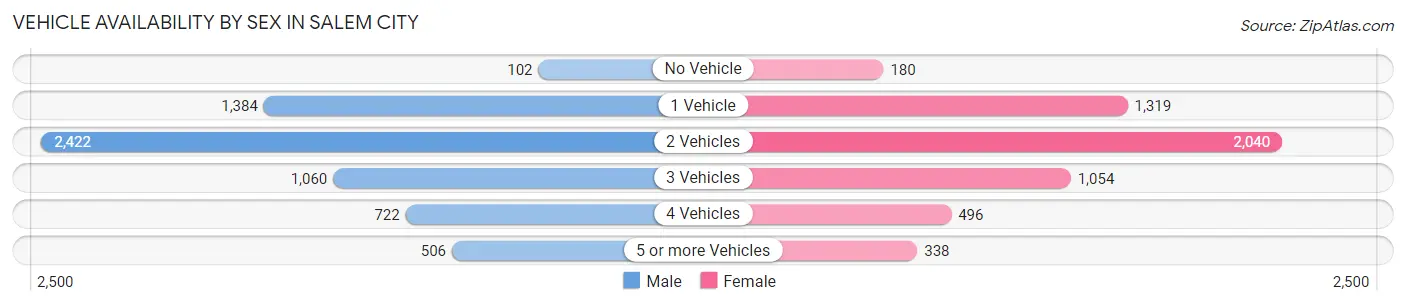
Vehicle Availability by Sex in Salem city
The most prevalent vehicle ownership categories in Salem city are males with 2 vehicles (2,422, accounting for 39.1%) and females with 2 vehicles (2,040, making up 44.6%).
| Vehicles Available | Male | Female |
| No Vehicle | 102 (1.7%) | 180 (3.3%) |
| 1 Vehicle | 1,384 (22.3%) | 1,319 (24.3%) |
| 2 Vehicles | 2,422 (39.1%) | 2,040 (37.6%) |
| 3 Vehicles | 1,060 (17.1%) | 1,054 (19.4%) |
| 4 Vehicles | 722 (11.7%) | 496 (9.1%) |
| 5 or more Vehicles | 506 (8.2%) | 338 (6.2%) |
| Total | 6,196 (100.0%) | 5,427 (100.0%) |
Commute Time in Salem city
The most frequently occuring commute durations in Salem city are 15 to 19 minutes (2,199 commuters, 19.5%), 5 to 9 minutes (1,994 commuters, 17.6%), and 20 to 24 minutes (1,978 commuters, 17.5%).
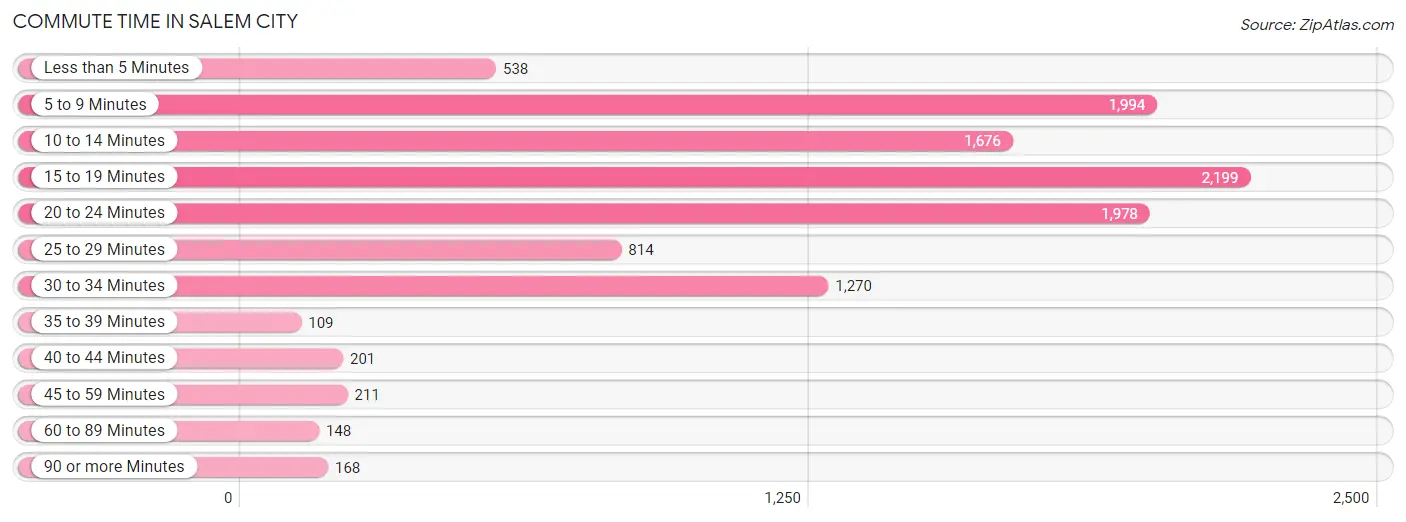
| Commute Time | # Commuters | % Commuters |
| Less than 5 Minutes | 538 | 4.8% |
| 5 to 9 Minutes | 1,994 | 17.6% |
| 10 to 14 Minutes | 1,676 | 14.8% |
| 15 to 19 Minutes | 2,199 | 19.5% |
| 20 to 24 Minutes | 1,978 | 17.5% |
| 25 to 29 Minutes | 814 | 7.2% |
| 30 to 34 Minutes | 1,270 | 11.2% |
| 35 to 39 Minutes | 109 | 1.0% |
| 40 to 44 Minutes | 201 | 1.8% |
| 45 to 59 Minutes | 211 | 1.9% |
| 60 to 89 Minutes | 148 | 1.3% |
| 90 or more Minutes | 168 | 1.5% |
Commute Time by Sex in Salem city
The most common commute times in Salem city are 20 to 24 minutes (1,192 commuters, 19.9%) for males and 5 to 9 minutes (1,110 commuters, 20.9%) for females.
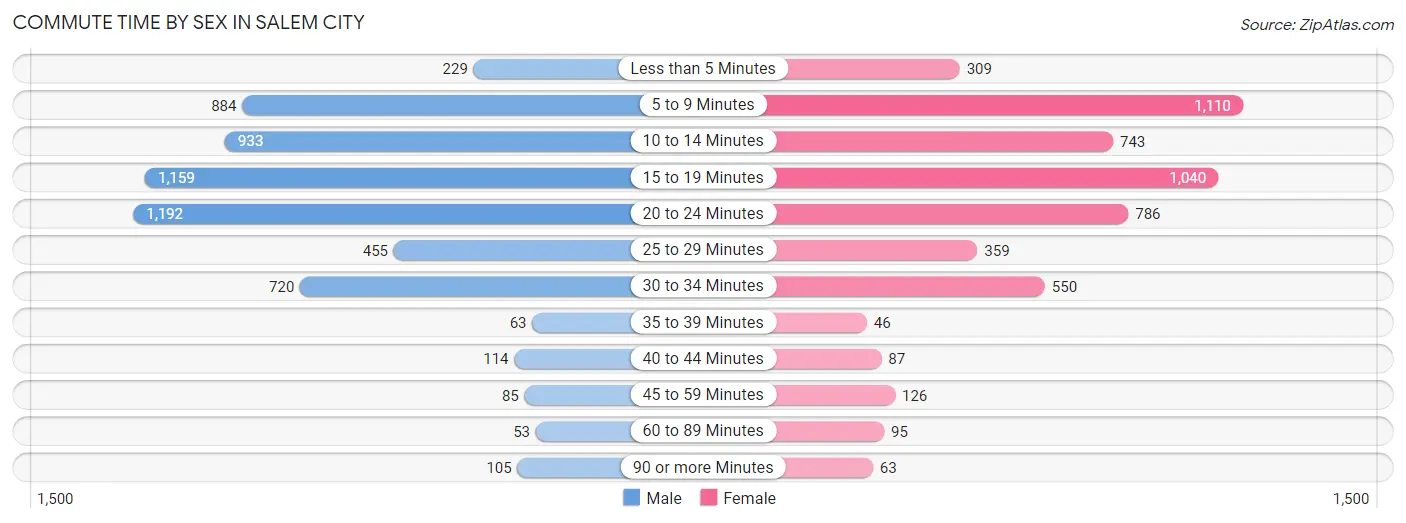
| Commute Time | Male | Female |
| Less than 5 Minutes | 229 (3.8%) | 309 (5.8%) |
| 5 to 9 Minutes | 884 (14.7%) | 1,110 (20.9%) |
| 10 to 14 Minutes | 933 (15.6%) | 743 (14.0%) |
| 15 to 19 Minutes | 1,159 (19.3%) | 1,040 (19.6%) |
| 20 to 24 Minutes | 1,192 (19.9%) | 786 (14.8%) |
| 25 to 29 Minutes | 455 (7.6%) | 359 (6.8%) |
| 30 to 34 Minutes | 720 (12.0%) | 550 (10.3%) |
| 35 to 39 Minutes | 63 (1.1%) | 46 (0.9%) |
| 40 to 44 Minutes | 114 (1.9%) | 87 (1.6%) |
| 45 to 59 Minutes | 85 (1.4%) | 126 (2.4%) |
| 60 to 89 Minutes | 53 (0.9%) | 95 (1.8%) |
| 90 or more Minutes | 105 (1.8%) | 63 (1.2%) |
Time of Departure to Work by Sex in Salem city
The most frequent times of departure to work in Salem city are 7:30 AM to 7:59 AM (972, 16.2%) for males and 7:30 AM to 7:59 AM (1,153, 21.7%) for females.
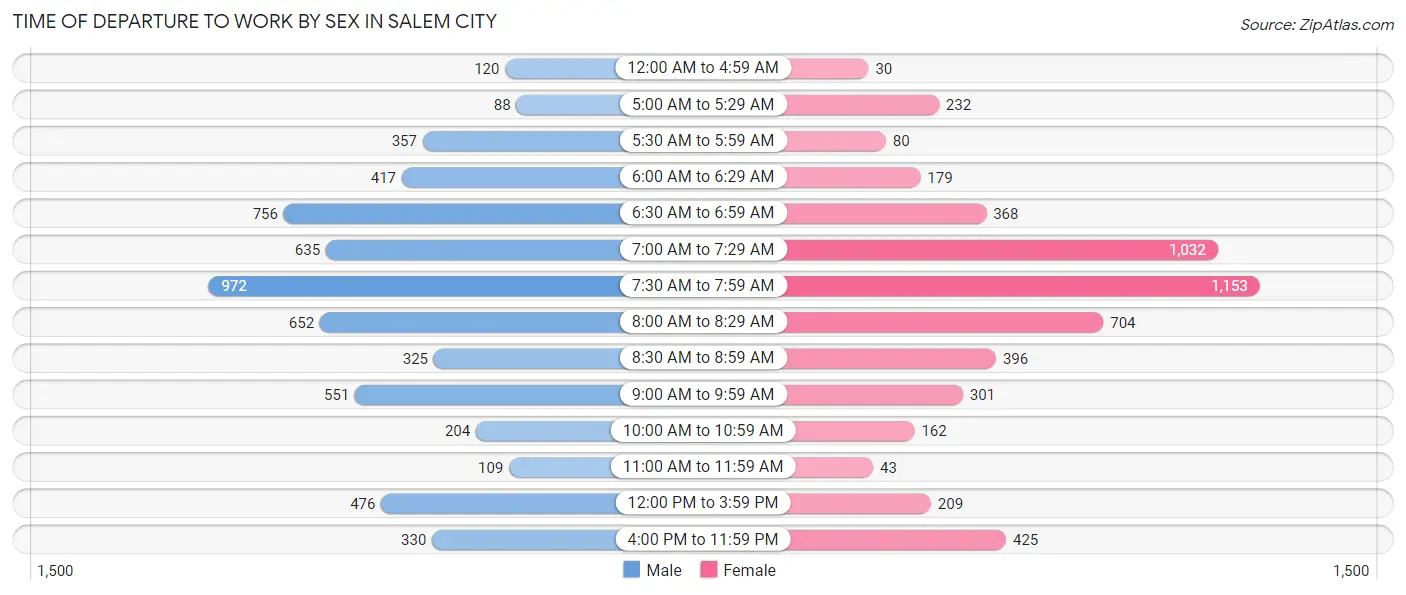
| Time of Departure | Male | Female |
| 12:00 AM to 4:59 AM | 120 (2.0%) | 30 (0.6%) |
| 5:00 AM to 5:29 AM | 88 (1.5%) | 232 (4.4%) |
| 5:30 AM to 5:59 AM | 357 (6.0%) | 80 (1.5%) |
| 6:00 AM to 6:29 AM | 417 (7.0%) | 179 (3.4%) |
| 6:30 AM to 6:59 AM | 756 (12.6%) | 368 (6.9%) |
| 7:00 AM to 7:29 AM | 635 (10.6%) | 1,032 (19.4%) |
| 7:30 AM to 7:59 AM | 972 (16.2%) | 1,153 (21.7%) |
| 8:00 AM to 8:29 AM | 652 (10.9%) | 704 (13.3%) |
| 8:30 AM to 8:59 AM | 325 (5.4%) | 396 (7.4%) |
| 9:00 AM to 9:59 AM | 551 (9.2%) | 301 (5.7%) |
| 10:00 AM to 10:59 AM | 204 (3.4%) | 162 (3.0%) |
| 11:00 AM to 11:59 AM | 109 (1.8%) | 43 (0.8%) |
| 12:00 PM to 3:59 PM | 476 (7.9%) | 209 (3.9%) |
| 4:00 PM to 11:59 PM | 330 (5.5%) | 425 (8.0%) |
| Total | 5,992 (100.0%) | 5,314 (100.0%) |
Housing Occupancy in Salem city
Occupancy by Ownership in Salem city
Of the total 10,045 dwellings in Salem city, owner-occupied units account for 6,426 (64.0%), while renter-occupied units make up 3,619 (36.0%).
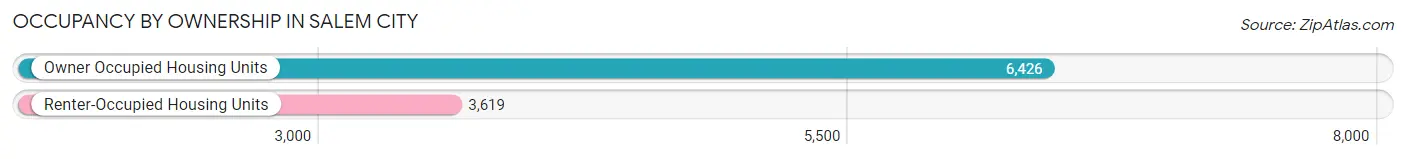
| Occupancy | # Housing Units | % Housing Units |
| Owner Occupied Housing Units | 6,426 | 64.0% |
| Renter-Occupied Housing Units | 3,619 | 36.0% |
| Total Occupied Housing Units | 10,045 | 100.0% |
Occupancy by Household Size in Salem city
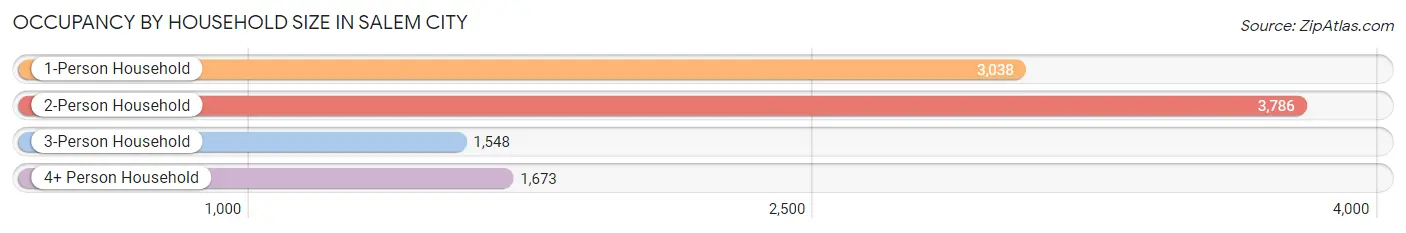
| Household Size | # Housing Units | % Housing Units |
| 1-Person Household | 3,038 | 30.2% |
| 2-Person Household | 3,786 | 37.7% |
| 3-Person Household | 1,548 | 15.4% |
| 4+ Person Household | 1,673 | 16.7% |
| Total Housing Units | 10,045 | 100.0% |
Occupancy by Ownership by Household Size in Salem city
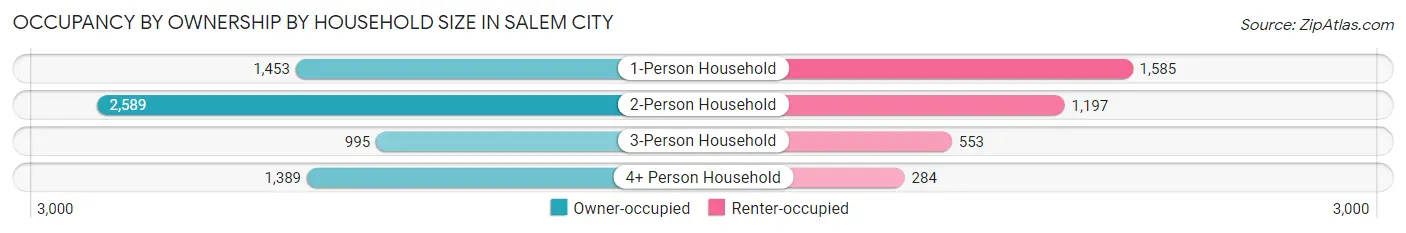
| Household Size | Owner-occupied | Renter-occupied |
| 1-Person Household | 1,453 (47.8%) | 1,585 (52.2%) |
| 2-Person Household | 2,589 (68.4%) | 1,197 (31.6%) |
| 3-Person Household | 995 (64.3%) | 553 (35.7%) |
| 4+ Person Household | 1,389 (83.0%) | 284 (17.0%) |
| Total Housing Units | 6,426 (64.0%) | 3,619 (36.0%) |
Occupancy by Educational Attainment in Salem city
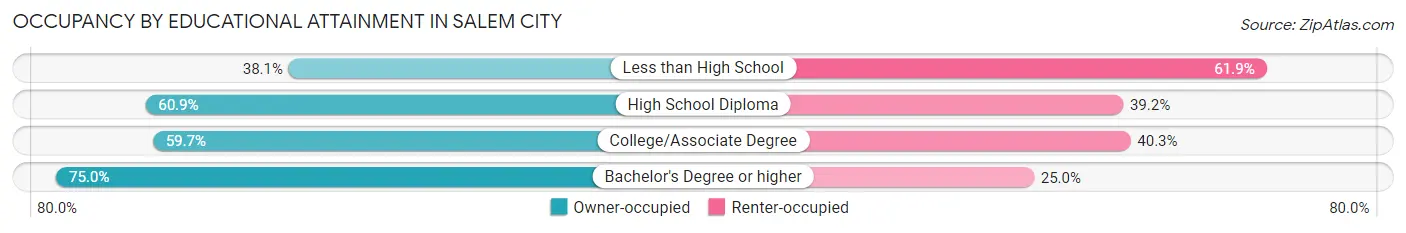
| Household Size | Owner-occupied | Renter-occupied |
| Less than High School | 197 (38.1%) | 320 (61.9%) |
| High School Diploma | 1,416 (60.9%) | 911 (39.2%) |
| College/Associate Degree | 2,290 (59.7%) | 1,547 (40.3%) |
| Bachelor's Degree or higher | 2,523 (75.0%) | 841 (25.0%) |
Occupancy by Age of Householder in Salem city
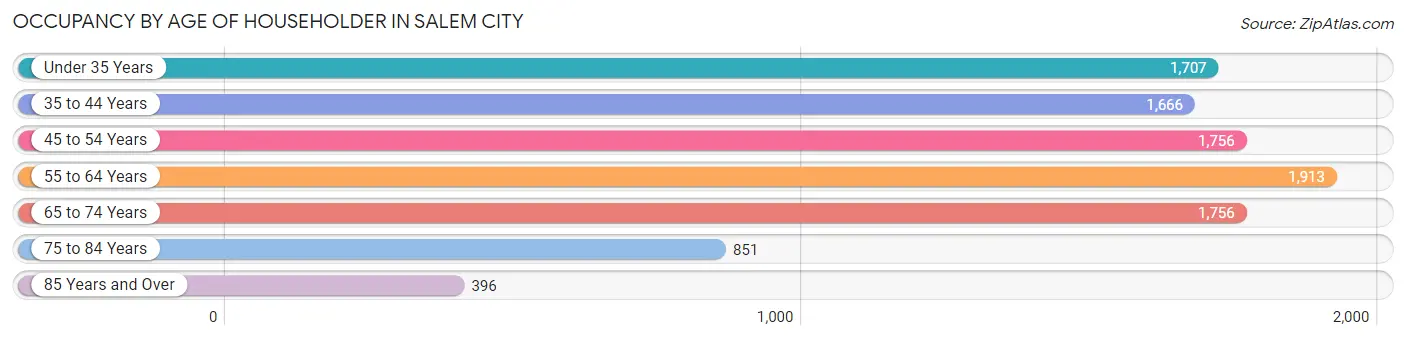
| Age Bracket | # Households | % Households |
| Under 35 Years | 1,707 | 17.0% |
| 35 to 44 Years | 1,666 | 16.6% |
| 45 to 54 Years | 1,756 | 17.5% |
| 55 to 64 Years | 1,913 | 19.0% |
| 65 to 74 Years | 1,756 | 17.5% |
| 75 to 84 Years | 851 | 8.5% |
| 85 Years and Over | 396 | 3.9% |
| Total | 10,045 | 100.0% |
Housing Finances in Salem city
Median Income by Occupancy in Salem city
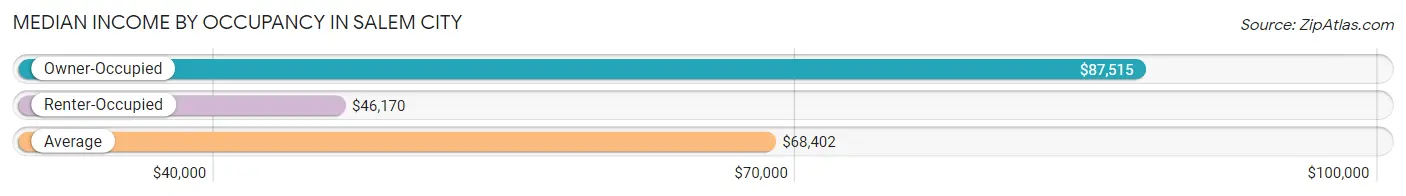
| Occupancy Type | # Households | Median Income |
| Owner-Occupied | 6,426 (64.0%) | $87,515 |
| Renter-Occupied | 3,619 (36.0%) | $46,170 |
| Average | 10,045 (100.0%) | $68,402 |
Occupancy by Householder Income Bracket in Salem city
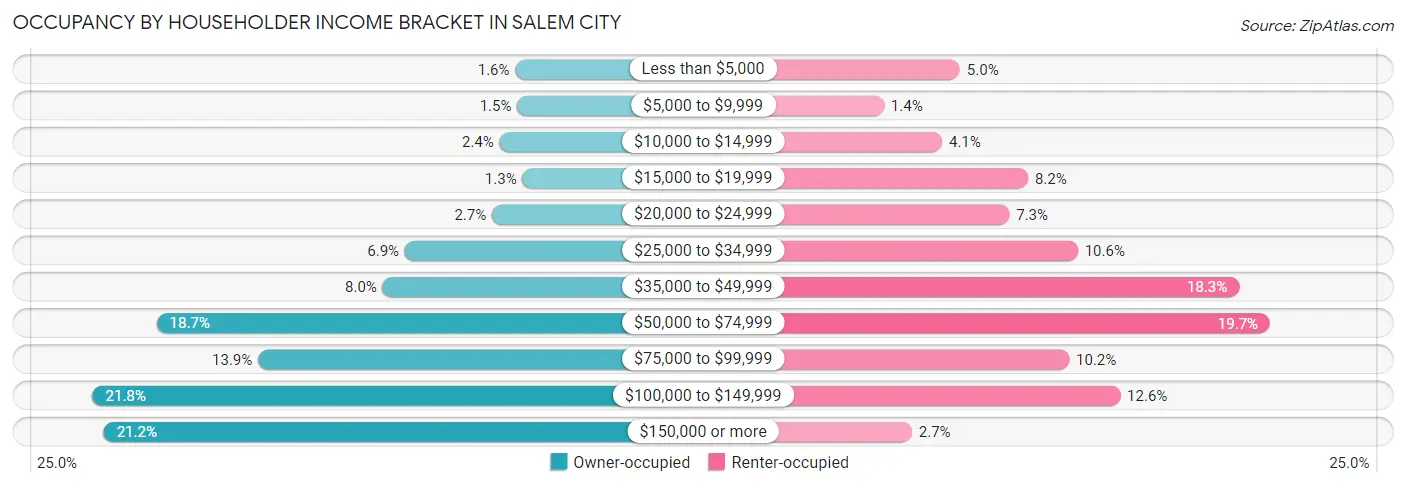
| Income Bracket | Owner-occupied | Renter-occupied |
| Less than $5,000 | 105 (1.6%) | 180 (5.0%) |
| $5,000 to $9,999 | 99 (1.5%) | 49 (1.3%) |
| $10,000 to $14,999 | 153 (2.4%) | 149 (4.1%) |
| $15,000 to $19,999 | 83 (1.3%) | 297 (8.2%) |
| $20,000 to $24,999 | 176 (2.7%) | 265 (7.3%) |
| $25,000 to $34,999 | 443 (6.9%) | 383 (10.6%) |
| $35,000 to $49,999 | 511 (8.0%) | 661 (18.3%) |
| $50,000 to $74,999 | 1,202 (18.7%) | 714 (19.7%) |
| $75,000 to $99,999 | 892 (13.9%) | 368 (10.2%) |
| $100,000 to $149,999 | 1,398 (21.8%) | 456 (12.6%) |
| $150,000 or more | 1,364 (21.2%) | 97 (2.7%) |
| Total | 6,426 (100.0%) | 3,619 (100.0%) |
Monthly Housing Cost Tiers in Salem city
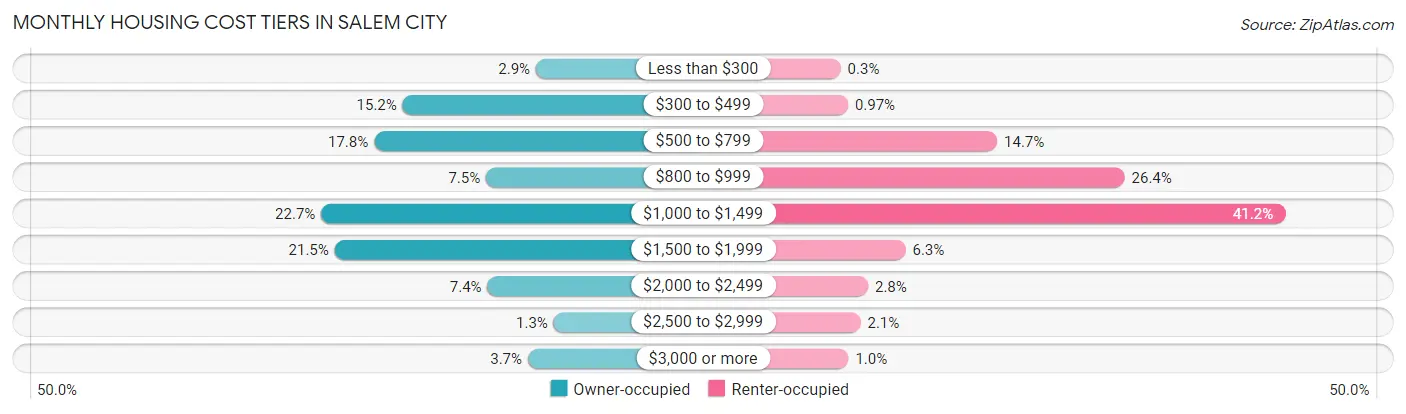
| Monthly Cost | Owner-occupied | Renter-occupied |
| Less than $300 | 188 (2.9%) | 11 (0.3%) |
| $300 to $499 | 977 (15.2%) | 35 (1.0%) |
| $500 to $799 | 1,146 (17.8%) | 532 (14.7%) |
| $800 to $999 | 483 (7.5%) | 957 (26.4%) |
| $1,000 to $1,499 | 1,459 (22.7%) | 1,491 (41.2%) |
| $1,500 to $1,999 | 1,379 (21.5%) | 227 (6.3%) |
| $2,000 to $2,499 | 475 (7.4%) | 102 (2.8%) |
| $2,500 to $2,999 | 83 (1.3%) | 77 (2.1%) |
| $3,000 or more | 236 (3.7%) | 37 (1.0%) |
| Total | 6,426 (100.0%) | 3,619 (100.0%) |
Physical Housing Characteristics in Salem city
Housing Structures in Salem city
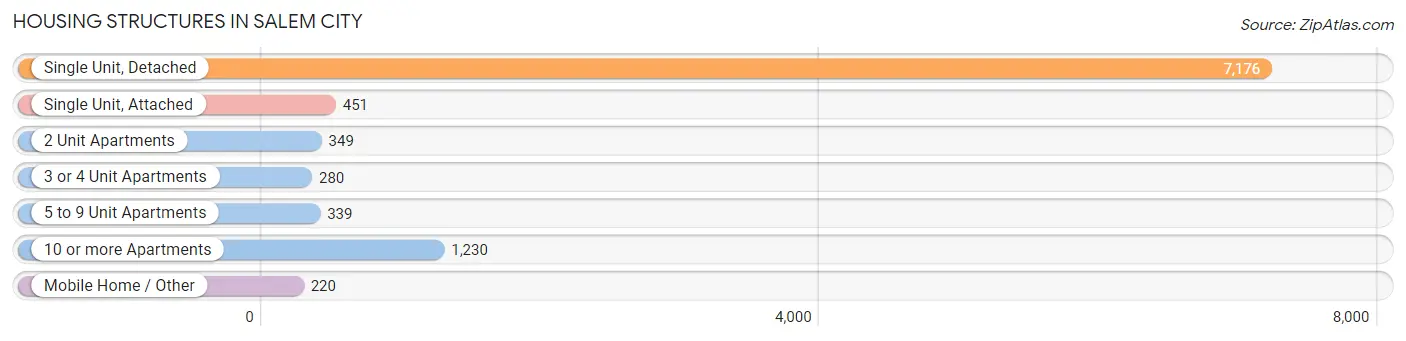
| Structure Type | # Housing Units | % Housing Units |
| Single Unit, Detached | 7,176 | 71.4% |
| Single Unit, Attached | 451 | 4.5% |
| 2 Unit Apartments | 349 | 3.5% |
| 3 or 4 Unit Apartments | 280 | 2.8% |
| 5 to 9 Unit Apartments | 339 | 3.4% |
| 10 or more Apartments | 1,230 | 12.2% |
| Mobile Home / Other | 220 | 2.2% |
| Total | 10,045 | 100.0% |
Housing Structures by Occupancy in Salem city
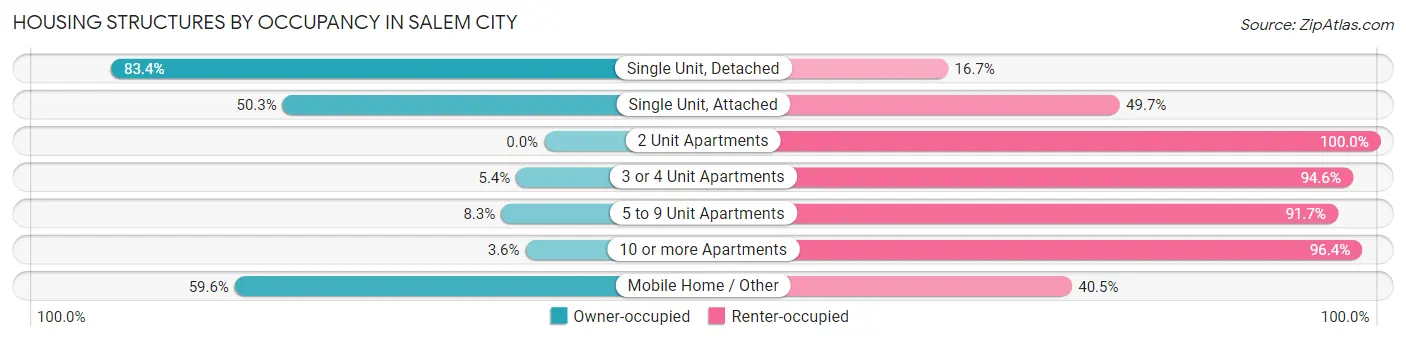
| Structure Type | Owner-occupied | Renter-occupied |
| Single Unit, Detached | 5,981 (83.4%) | 1,195 (16.7%) |
| Single Unit, Attached | 227 (50.3%) | 224 (49.7%) |
| 2 Unit Apartments | 0 (0.0%) | 349 (100.0%) |
| 3 or 4 Unit Apartments | 15 (5.4%) | 265 (94.6%) |
| 5 to 9 Unit Apartments | 28 (8.3%) | 311 (91.7%) |
| 10 or more Apartments | 44 (3.6%) | 1,186 (96.4%) |
| Mobile Home / Other | 131 (59.6%) | 89 (40.5%) |
| Total | 6,426 (64.0%) | 3,619 (36.0%) |
Housing Structures by Number of Rooms in Salem city
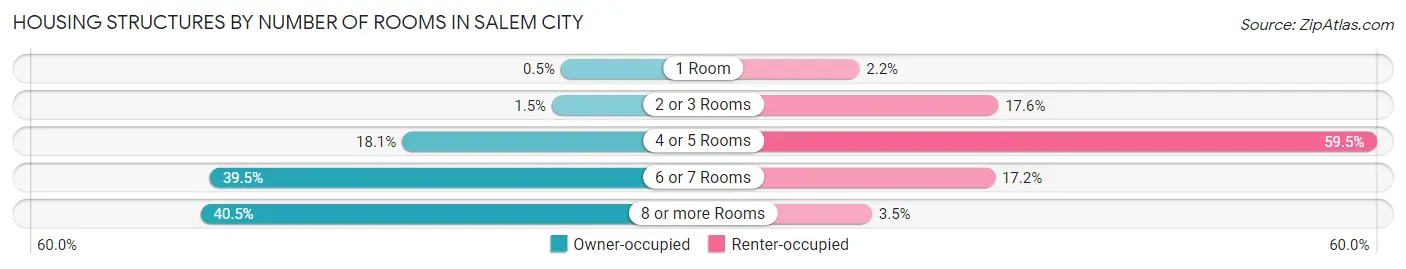
| Number of Rooms | Owner-occupied | Renter-occupied |
| 1 Room | 32 (0.5%) | 78 (2.2%) |
| 2 or 3 Rooms | 95 (1.5%) | 636 (17.6%) |
| 4 or 5 Rooms | 1,163 (18.1%) | 2,154 (59.5%) |
| 6 or 7 Rooms | 2,535 (39.5%) | 623 (17.2%) |
| 8 or more Rooms | 2,601 (40.5%) | 128 (3.5%) |
| Total | 6,426 (100.0%) | 3,619 (100.0%) |
Housing Structure by Heating Type in Salem city
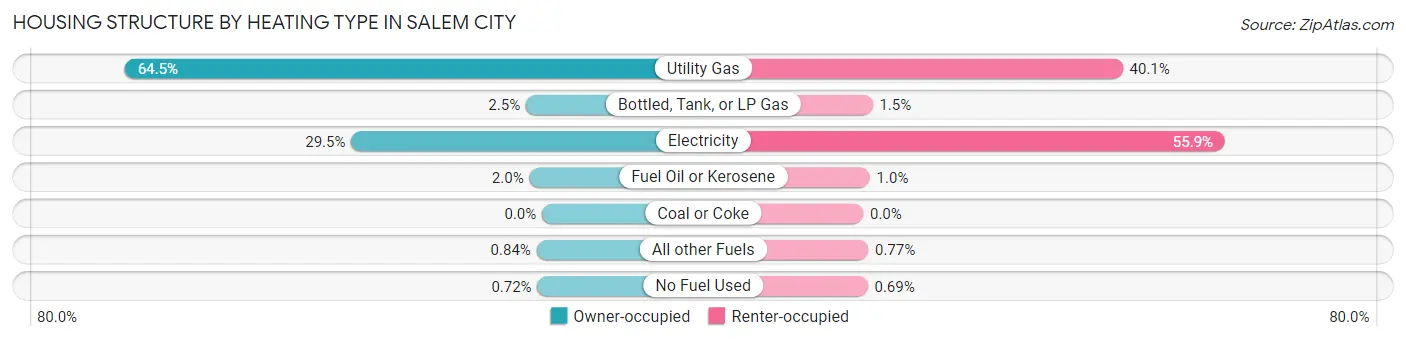
| Heating Type | Owner-occupied | Renter-occupied |
| Utility Gas | 4,146 (64.5%) | 1,452 (40.1%) |
| Bottled, Tank, or LP Gas | 160 (2.5%) | 53 (1.5%) |
| Electricity | 1,895 (29.5%) | 2,024 (55.9%) |
| Fuel Oil or Kerosene | 125 (1.9%) | 37 (1.0%) |
| Coal or Coke | 0 (0.0%) | 0 (0.0%) |
| All other Fuels | 54 (0.8%) | 28 (0.8%) |
| No Fuel Used | 46 (0.7%) | 25 (0.7%) |
| Total | 6,426 (100.0%) | 3,619 (100.0%) |
Household Vehicle Usage in Salem city
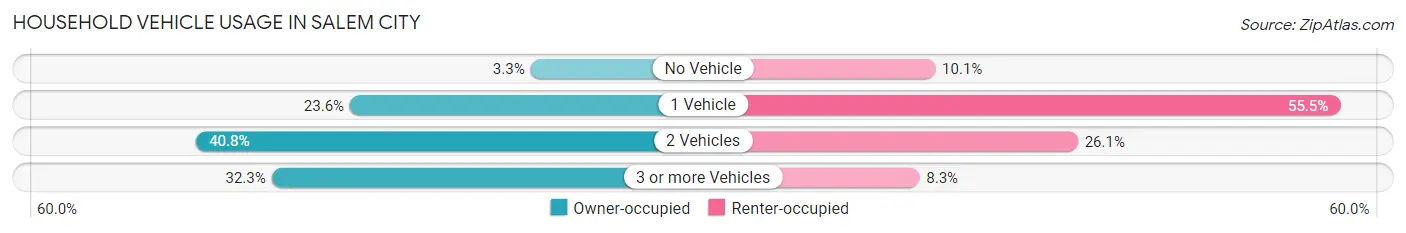
| Vehicles per Household | Owner-occupied | Renter-occupied |
| No Vehicle | 214 (3.3%) | 366 (10.1%) |
| 1 Vehicle | 1,514 (23.6%) | 2,007 (55.5%) |
| 2 Vehicles | 2,620 (40.8%) | 944 (26.1%) |
| 3 or more Vehicles | 2,078 (32.3%) | 302 (8.3%) |
| Total | 6,426 (100.0%) | 3,619 (100.0%) |
Real Estate & Mortgages in Salem city
Real Estate and Mortgage Overview in Salem city
| Characteristic | Without Mortgage | With Mortgage |
| Housing Units | 2,553 | 3,873 |
| Median Property Value | $225,800 | $234,200 |
| Median Household Income | $66,014 | $855 |
| Monthly Housing Costs | $544 | $219 |
| Real Estate Taxes | $2,240 | $50 |
Property Value by Mortgage Status in Salem city
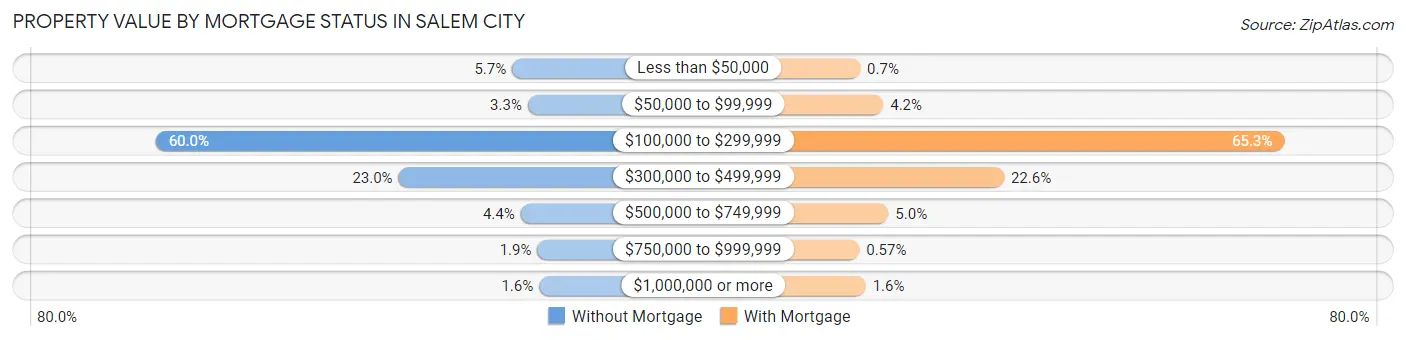
| Property Value | Without Mortgage | With Mortgage |
| Less than $50,000 | 146 (5.7%) | 27 (0.7%) |
| $50,000 to $99,999 | 85 (3.3%) | 164 (4.2%) |
| $100,000 to $299,999 | 1,532 (60.0%) | 2,530 (65.3%) |
| $300,000 to $499,999 | 588 (23.0%) | 876 (22.6%) |
| $500,000 to $749,999 | 113 (4.4%) | 194 (5.0%) |
| $750,000 to $999,999 | 48 (1.9%) | 22 (0.6%) |
| $1,000,000 or more | 41 (1.6%) | 60 (1.5%) |
| Total | 2,553 (100.0%) | 3,873 (100.0%) |
Household Income by Mortgage Status in Salem city
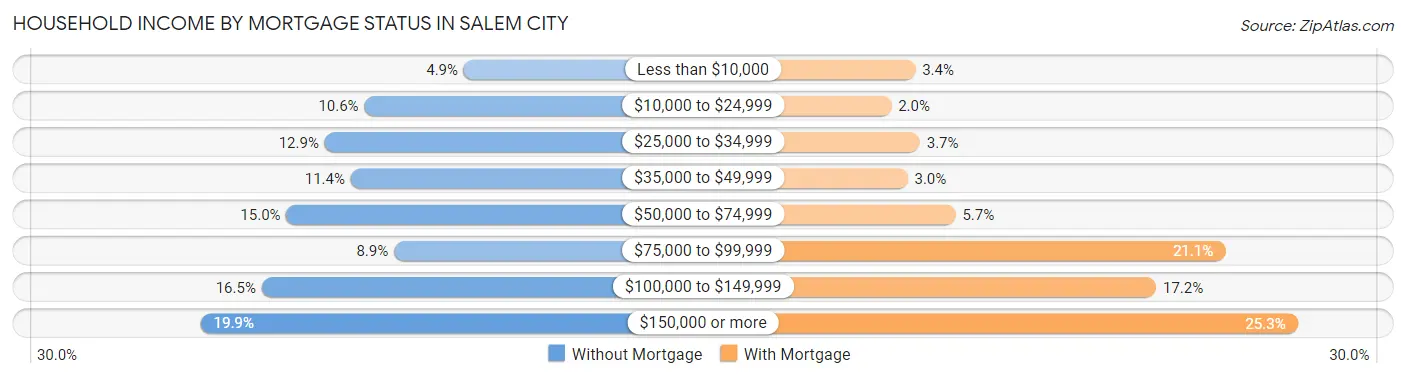
| Household Income | Without Mortgage | With Mortgage |
| Less than $10,000 | 125 (4.9%) | 132 (3.4%) |
| $10,000 to $24,999 | 270 (10.6%) | 79 (2.0%) |
| $25,000 to $34,999 | 328 (12.9%) | 142 (3.7%) |
| $35,000 to $49,999 | 290 (11.4%) | 115 (3.0%) |
| $50,000 to $74,999 | 384 (15.0%) | 221 (5.7%) |
| $75,000 to $99,999 | 227 (8.9%) | 818 (21.1%) |
| $100,000 to $149,999 | 420 (16.5%) | 665 (17.2%) |
| $150,000 or more | 509 (19.9%) | 978 (25.3%) |
| Total | 2,553 (100.0%) | 3,873 (100.0%) |
Property Value to Household Income Ratio in Salem city
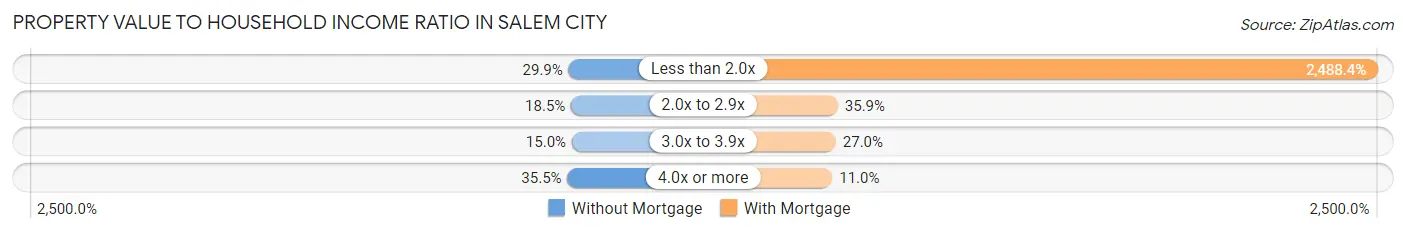
| Value-to-Income Ratio | Without Mortgage | With Mortgage |
| Less than 2.0x | 763 (29.9%) | 96,377 (2,488.4%) |
| 2.0x to 2.9x | 471 (18.4%) | 1,391 (35.9%) |
| 3.0x to 3.9x | 383 (15.0%) | 1,046 (27.0%) |
| 4.0x or more | 907 (35.5%) | 424 (11.0%) |
| Total | 2,553 (100.0%) | 3,873 (100.0%) |
Real Estate Taxes by Mortgage Status in Salem city
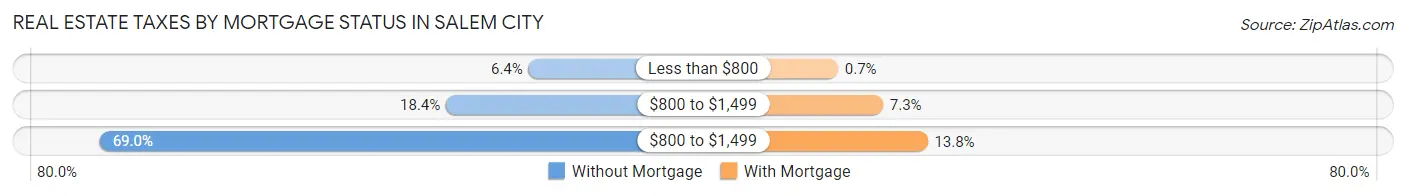
| Property Taxes | Without Mortgage | With Mortgage |
| Less than $800 | 162 (6.4%) | 27 (0.7%) |
| $800 to $1,499 | 470 (18.4%) | 282 (7.3%) |
| $800 to $1,499 | 1,762 (69.0%) | 534 (13.8%) |
| Total | 2,553 (100.0%) | 3,873 (100.0%) |
Health & Disability in Salem city
Health Insurance Coverage by Age in Salem city
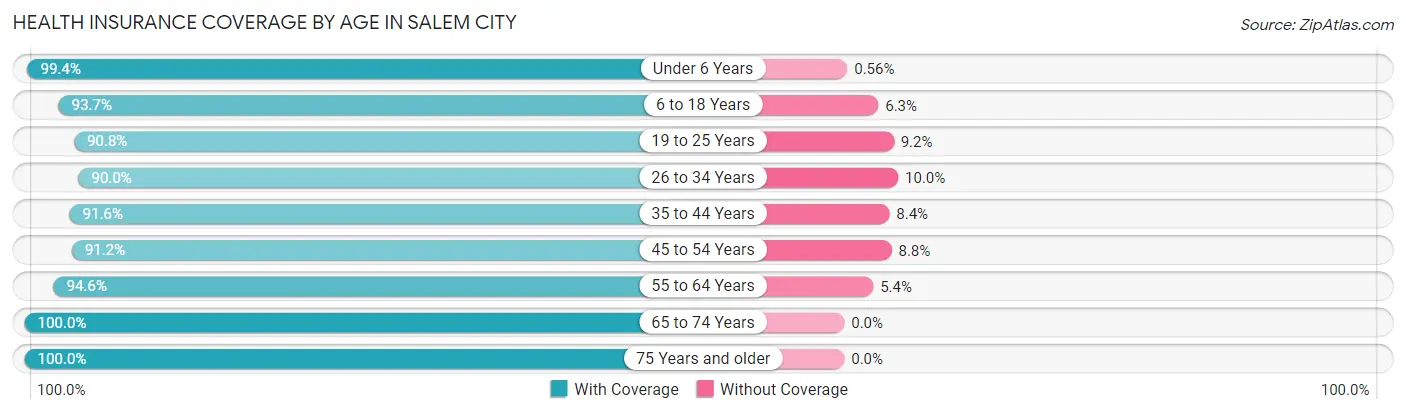
| Age Bracket | With Coverage | Without Coverage |
| Under 6 Years | 1,251 (99.4%) | 7 (0.6%) |
| 6 to 18 Years | 3,723 (93.7%) | 252 (6.3%) |
| 19 to 25 Years | 2,691 (90.8%) | 273 (9.2%) |
| 26 to 34 Years | 2,329 (90.0%) | 260 (10.0%) |
| 35 to 44 Years | 2,670 (91.6%) | 245 (8.4%) |
| 45 to 54 Years | 2,786 (91.2%) | 269 (8.8%) |
| 55 to 64 Years | 3,155 (94.6%) | 180 (5.4%) |
| 65 to 74 Years | 2,556 (100.0%) | 0 (0.0%) |
| 75 Years and older | 1,746 (100.0%) | 0 (0.0%) |
| Total | 22,907 (93.9%) | 1,486 (6.1%) |
Health Insurance Coverage by Citizenship Status in Salem city
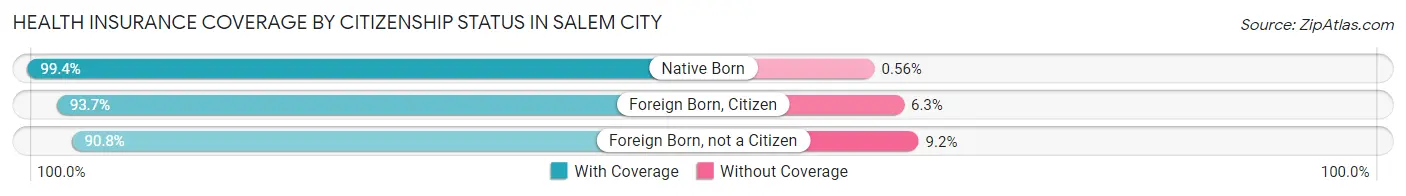
| Citizenship Status | With Coverage | Without Coverage |
| Native Born | 1,251 (99.4%) | 7 (0.6%) |
| Foreign Born, Citizen | 3,723 (93.7%) | 252 (6.3%) |
| Foreign Born, not a Citizen | 2,691 (90.8%) | 273 (9.2%) |
Health Insurance Coverage by Household Income in Salem city
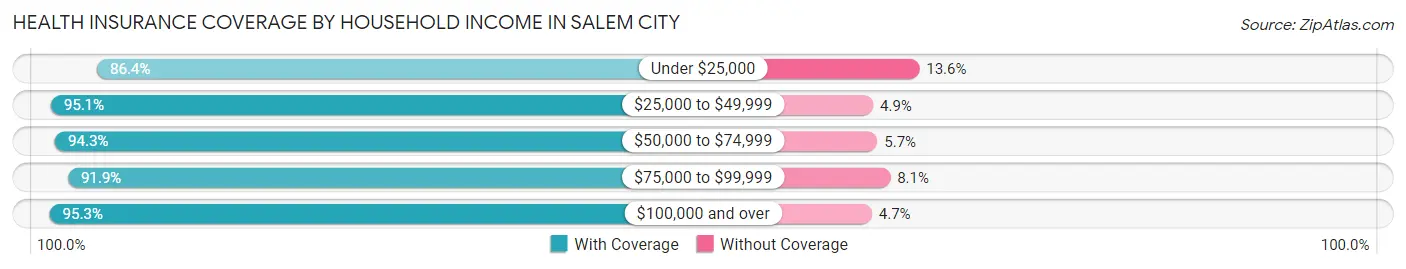
| Household Income | With Coverage | Without Coverage |
| Under $25,000 | 1,801 (86.4%) | 283 (13.6%) |
| $25,000 to $49,999 | 3,218 (95.1%) | 167 (4.9%) |
| $50,000 to $74,999 | 3,633 (94.3%) | 221 (5.7%) |
| $75,000 to $99,999 | 3,493 (91.9%) | 309 (8.1%) |
| $100,000 and over | 9,089 (95.3%) | 447 (4.7%) |
Public vs Private Health Insurance Coverage by Age in Salem city
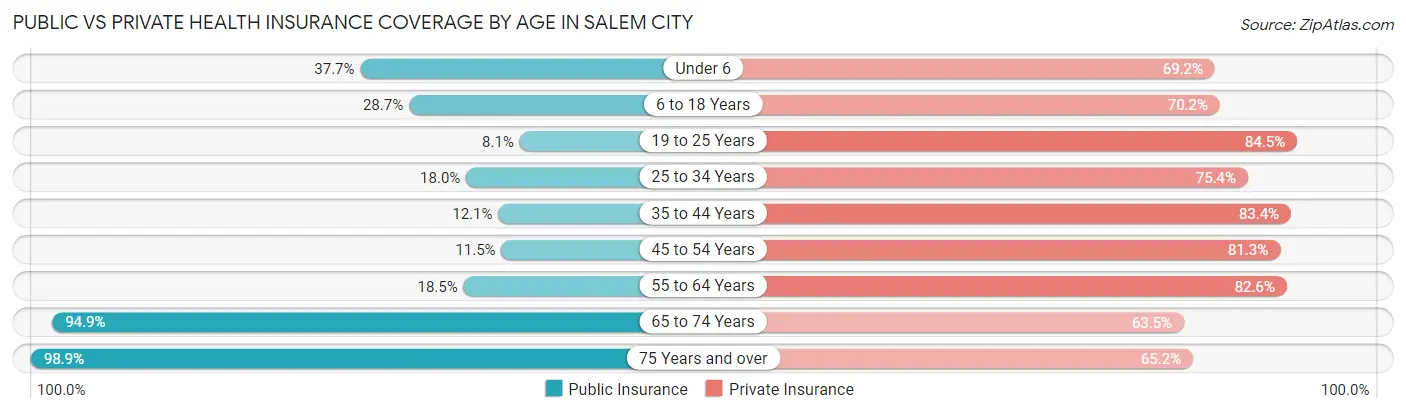
| Age Bracket | Public Insurance | Private Insurance |
| Under 6 | 474 (37.7%) | 871 (69.2%) |
| 6 to 18 Years | 1,139 (28.6%) | 2,789 (70.2%) |
| 19 to 25 Years | 240 (8.1%) | 2,505 (84.5%) |
| 25 to 34 Years | 467 (18.0%) | 1,951 (75.4%) |
| 35 to 44 Years | 352 (12.1%) | 2,430 (83.4%) |
| 45 to 54 Years | 351 (11.5%) | 2,485 (81.3%) |
| 55 to 64 Years | 618 (18.5%) | 2,754 (82.6%) |
| 65 to 74 Years | 2,425 (94.9%) | 1,623 (63.5%) |
| 75 Years and over | 1,726 (98.9%) | 1,138 (65.2%) |
| Total | 7,792 (31.9%) | 18,546 (76.0%) |
Disability Status by Sex by Age in Salem city
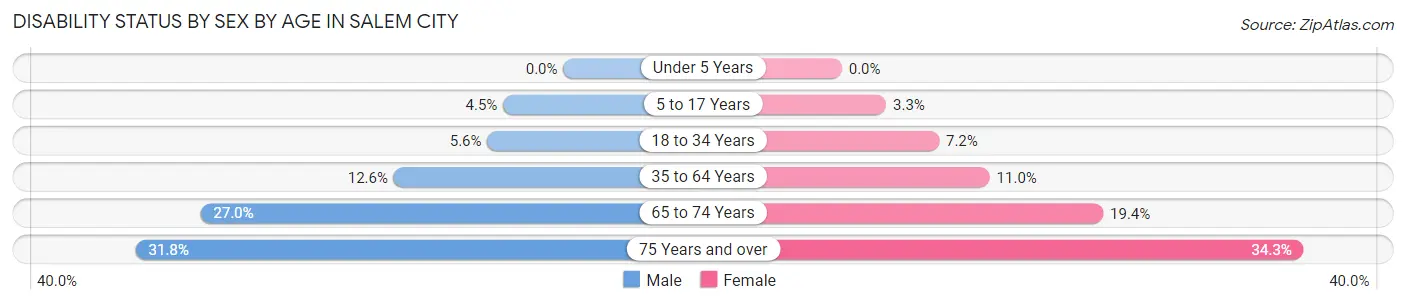
| Age Bracket | Male | Female |
| Under 5 Years | 0 (0.0%) | 0 (0.0%) |
| 5 to 17 Years | 85 (4.5%) | 59 (3.3%) |
| 18 to 34 Years | 170 (5.6%) | 221 (7.2%) |
| 35 to 64 Years | 550 (12.6%) | 542 (11.0%) |
| 65 to 74 Years | 300 (27.0%) | 280 (19.4%) |
| 75 Years and over | 222 (31.8%) | 359 (34.3%) |
Disability Class by Sex by Age in Salem city
Disability Class: Hearing Difficulty
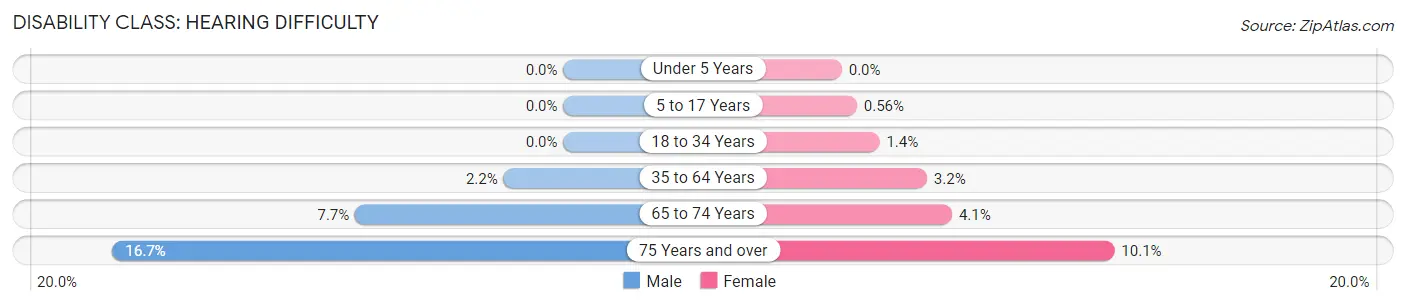
| Age Bracket | Male | Female |
| Under 5 Years | 0 (0.0%) | 0 (0.0%) |
| 5 to 17 Years | 0 (0.0%) | 10 (0.6%) |
| 18 to 34 Years | 0 (0.0%) | 43 (1.4%) |
| 35 to 64 Years | 97 (2.2%) | 156 (3.2%) |
| 65 to 74 Years | 86 (7.7%) | 59 (4.1%) |
| 75 Years and over | 117 (16.7%) | 106 (10.1%) |
Disability Class: Vision Difficulty
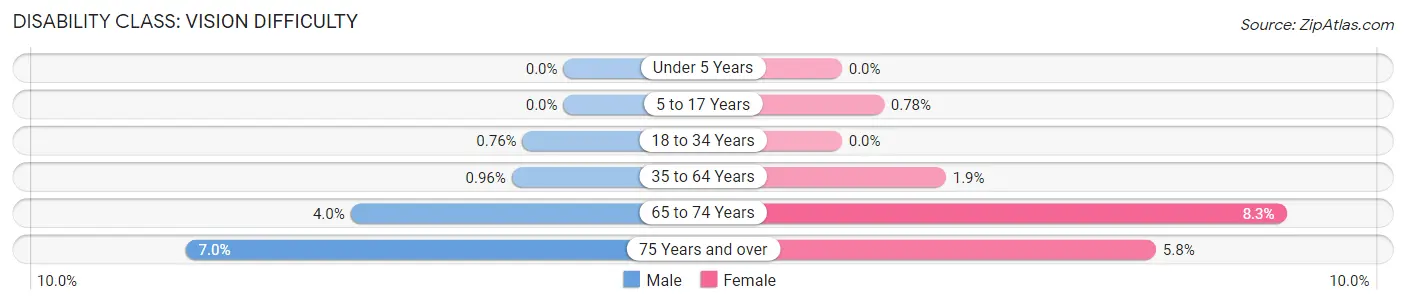
| Age Bracket | Male | Female |
| Under 5 Years | 0 (0.0%) | 0 (0.0%) |
| 5 to 17 Years | 0 (0.0%) | 14 (0.8%) |
| 18 to 34 Years | 23 (0.8%) | 0 (0.0%) |
| 35 to 64 Years | 42 (1.0%) | 95 (1.9%) |
| 65 to 74 Years | 44 (4.0%) | 119 (8.3%) |
| 75 Years and over | 49 (7.0%) | 61 (5.8%) |
Disability Class: Cognitive Difficulty
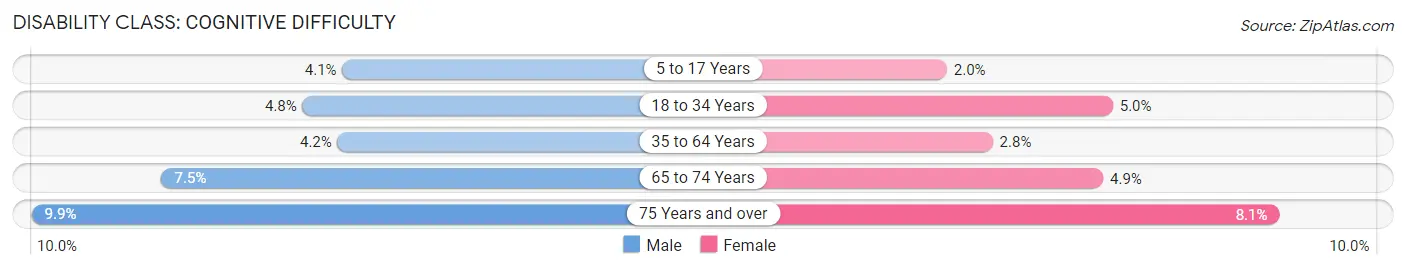
| Age Bracket | Male | Female |
| 5 to 17 Years | 78 (4.1%) | 35 (1.9%) |
| 18 to 34 Years | 146 (4.8%) | 154 (5.0%) |
| 35 to 64 Years | 183 (4.2%) | 138 (2.8%) |
| 65 to 74 Years | 83 (7.5%) | 70 (4.9%) |
| 75 Years and over | 69 (9.9%) | 85 (8.1%) |
Disability Class: Ambulatory Difficulty
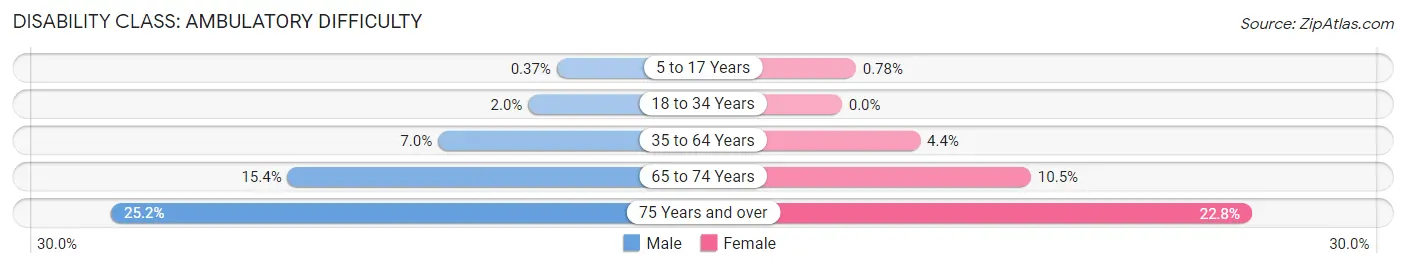
| Age Bracket | Male | Female |
| 5 to 17 Years | 7 (0.4%) | 14 (0.8%) |
| 18 to 34 Years | 59 (2.0%) | 0 (0.0%) |
| 35 to 64 Years | 305 (7.0%) | 215 (4.4%) |
| 65 to 74 Years | 171 (15.4%) | 152 (10.5%) |
| 75 Years and over | 176 (25.2%) | 239 (22.8%) |
Disability Class: Self-Care Difficulty
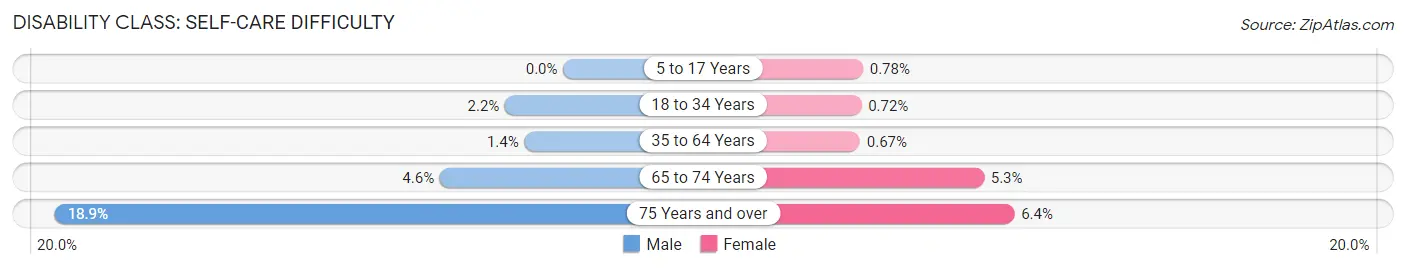
| Age Bracket | Male | Female |
| 5 to 17 Years | 0 (0.0%) | 14 (0.8%) |
| 18 to 34 Years | 65 (2.2%) | 22 (0.7%) |
| 35 to 64 Years | 63 (1.4%) | 33 (0.7%) |
| 65 to 74 Years | 51 (4.6%) | 76 (5.3%) |
| 75 Years and over | 132 (18.9%) | 67 (6.4%) |
Technology Access in Salem city
Computing Device Access in Salem city
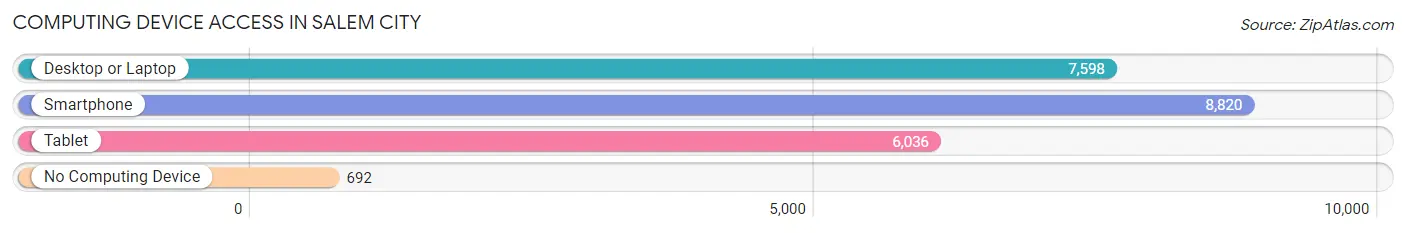
| Device Type | # Households | % Households |
| Desktop or Laptop | 7,598 | 75.6% |
| Smartphone | 8,820 | 87.8% |
| Tablet | 6,036 | 60.1% |
| No Computing Device | 692 | 6.9% |
| Total | 10,045 | 100.0% |
Internet Access in Salem city
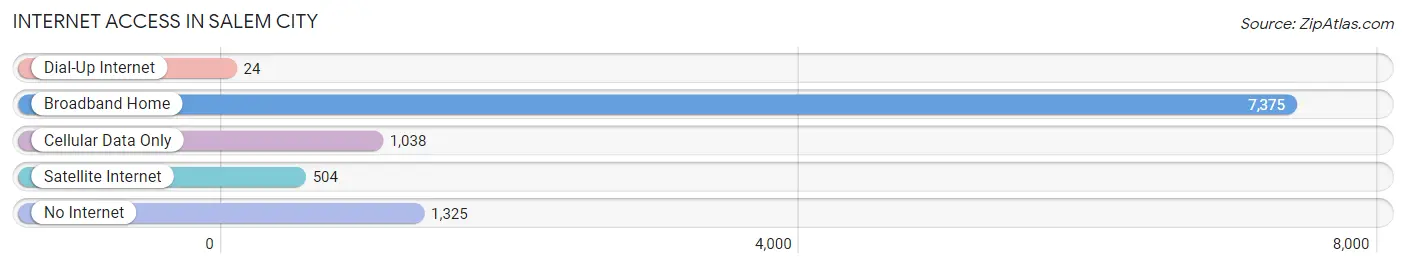
| Internet Type | # Households | % Households |
| Dial-Up Internet | 24 | 0.2% |
| Broadband Home | 7,375 | 73.4% |
| Cellular Data Only | 1,038 | 10.3% |
| Satellite Internet | 504 | 5.0% |
| No Internet | 1,325 | 13.2% |
| Total | 10,045 | 100.0% |
Salem city Summary
Salem City, Virginia is a small city located in the Roanoke Valley in the Blue Ridge Mountains of western Virginia. It is the county seat of Roanoke County and is part of the Roanoke Metropolitan Statistical Area. The city has a population of 24,802 as of the 2010 census and is the fifth largest city in the state.
History
The area that is now Salem City was first settled in the late 1700s by German and Scots-Irish immigrants. The town was originally known as Big Lick, named for a large salt lick located nearby. In 1802, the town was renamed Salem after the Hebrew word for peace. The town was officially incorporated in 1806 and was designated as the county seat of Roanoke County in 1838.
In the late 1800s, Salem City became a major railroad hub, with the Norfolk and Western Railway and the Shenandoah Valley Railroad both running through the city. This allowed the city to become a major center for manufacturing and industry. The city also became a major center for education, with the founding of Roanoke College in 1842 and the Virginia School for the Deaf and Blind in 1854.
In the early 1900s, Salem City experienced a period of growth and prosperity. The city was home to several large factories, including the Salem Iron Works, the Salem Woolen Mills, and the Salem Car Works. The city also became a major center for education, with the founding of the Roanoke College School of Medicine in 1909 and the Roanoke College School of Law in 1911.
Geography
Salem City is located in the Roanoke Valley in the Blue Ridge Mountains of western Virginia. The city is situated at the confluence of the Roanoke River and the Shenandoah River. The city is surrounded by the George Washington and Jefferson National Forests and is located approximately 25 miles south of Roanoke and 100 miles west of Richmond.
The city has a total area of 8.3 square miles, all of which is land. The city is located at an elevation of 1,400 feet above sea level. The climate is humid subtropical, with hot, humid summers and mild winters.
Economy
Salem City is a major center for manufacturing and industry. The city is home to several large factories, including the Salem Iron Works, the Salem Woolen Mills, and the Salem Car Works. The city is also home to several large companies, including Advance Auto Parts, Carilion Clinic, and the Roanoke Times.
The city is also a major center for education, with the Roanoke College School of Medicine, the Roanoke College School of Law, and the Virginia School for the Deaf and Blind all located in the city.
Demographics
As of the 2010 census, Salem City had a population of 24,802. The racial makeup of the city was 79.2% White, 14.3% African American, 0.5% Native American, 1.7% Asian, 0.1% Pacific Islander, 1.7% from other races, and 2.5% from two or more races. Hispanic or Latino of any race were 4.2% of the population.
The median household income in the city was $41,945 and the median family income was $50,945. The per capita income in the city was $21,945. About 11.2% of families and 14.3% of the population were below the poverty line, including 19.2% of those under age 18 and 8.2% of those age 65 or over.
Common Questions
What is Per Capita Income in Salem city?
Per Capita income in Salem city is $37,991.
What is the Median Family Income in Salem city?
Median Family Income in Salem city is $87,333.
What is the Median Household income in Salem city?
Median Household Income in Salem city is $68,402.
What is Income or Wage Gap in Salem city?
Income or Wage Gap in Salem city is 33.8%.
Women in Salem city earn 66.2 cents for every dollar earned by a man.
What is Family Income Deficit in Salem city?
Family Income Deficit in Salem city is $14,086.
Families that are below poverty line in Salem city earn $14,086 less on average than the poverty threshold level.
What is Inequality or Gini Index in Salem city?
Inequality or Gini Index in Salem city is 0.46.
What is the Total Population of Salem city?
Total Population of Salem city is 25,372.
What is the Total Male Population of Salem city?
Total Male Population of Salem city is 12,187.
What is the Total Female Population of Salem city?
Total Female Population of Salem city is 13,185.
What is the Ratio of Males per 100 Females in Salem city?
There are 92.43 Males per 100 Females in Salem city.
What is the Ratio of Females per 100 Males in Salem city?
There are 108.19 Females per 100 Males in Salem city.
What is the Median Population Age in Salem city?
Median Population Age in Salem city is 40.8 Years.
What is the Average Family Size in Salem city
Average Family Size in Salem city is 2.8 People.
What is the Average Household Size in Salem city
Average Household Size in Salem city is 2.3 People.
How Large is the Labor Force in Salem city?
There are 13,011 People in the Labor Forcein in Salem city.
What is the Percentage of People in the Labor Force in Salem city?
61.1% of People are in the Labor Force in Salem city.
What is the Unemployment Rate in Salem city?
Unemployment Rate in Salem city is 3.5%.