Rockingham County, VA Map & Demographics
Rockingham County Map
Rockingham County Overview
$37,180
PER CAPITA INCOME
$88,389
AVG FAMILY INCOME
$73,232
AVG HOUSEHOLD INCOME
33.9%
WAGE / INCOME GAP [ % ]
66.1¢/ $1
WAGE / INCOME GAP [ $ ]
$8,464
FAMILY INCOME DEFICIT
0.43
INEQUALITY / GINI INDEX
83,905
TOTAL POPULATION
41,490
MALE POPULATION
42,415
FEMALE POPULATION
97.82
MALES / 100 FEMALES
102.23
FEMALES / 100 MALES
40.5
MEDIAN AGE
3.1
AVG FAMILY SIZE
2.6
AVG HOUSEHOLD SIZE
43,109
LABOR FORCE [ PEOPLE ]
63.5%
PERCENT IN LABOR FORCE
2.8%
UNEMPLOYMENT RATE
Rockingham County Area Codes
Income in Rockingham County
Income Overview in Rockingham County
Per Capita Income in Rockingham County is $37,180, while median incomes of families and households are $88,389 and $73,232 respectively.
| Characteristic | Number | Measure |
| Per Capita Income | 83,905 | $37,180 |
| Median Family Income | 22,065 | $88,389 |
| Mean Family Income | 22,065 | $107,264 |
| Median Household Income | 31,612 | $73,232 |
| Mean Household Income | 31,612 | $95,210 |
| Income Deficit | 22,065 | $8,464 |
| Wage / Income Gap (%) | 83,905 | 33.93% |
| Wage / Income Gap ($) | 83,905 | 66.07¢ per $1 |
| Gini / Inequality Index | 83,905 | 0.43 |
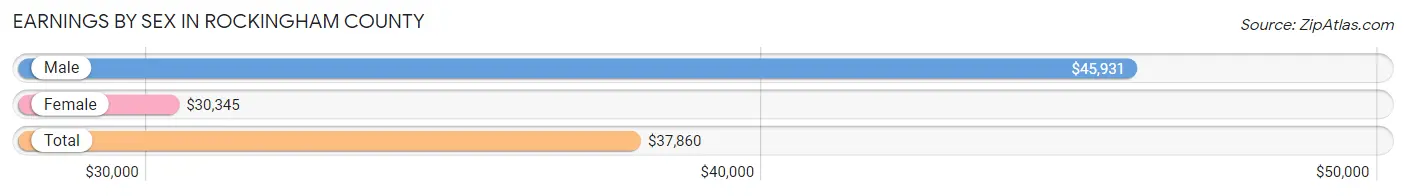
Earnings by Sex in Rockingham County
Average Earnings in Rockingham County are $37,860, $45,931 for men and $30,345 for women, a difference of 33.9%.
| Sex | Number | Average Earnings |
| Male | 24,456 (52.5%) | $45,931 |
| Female | 22,098 (47.5%) | $30,345 |
| Total | 46,554 (100.0%) | $37,860 |
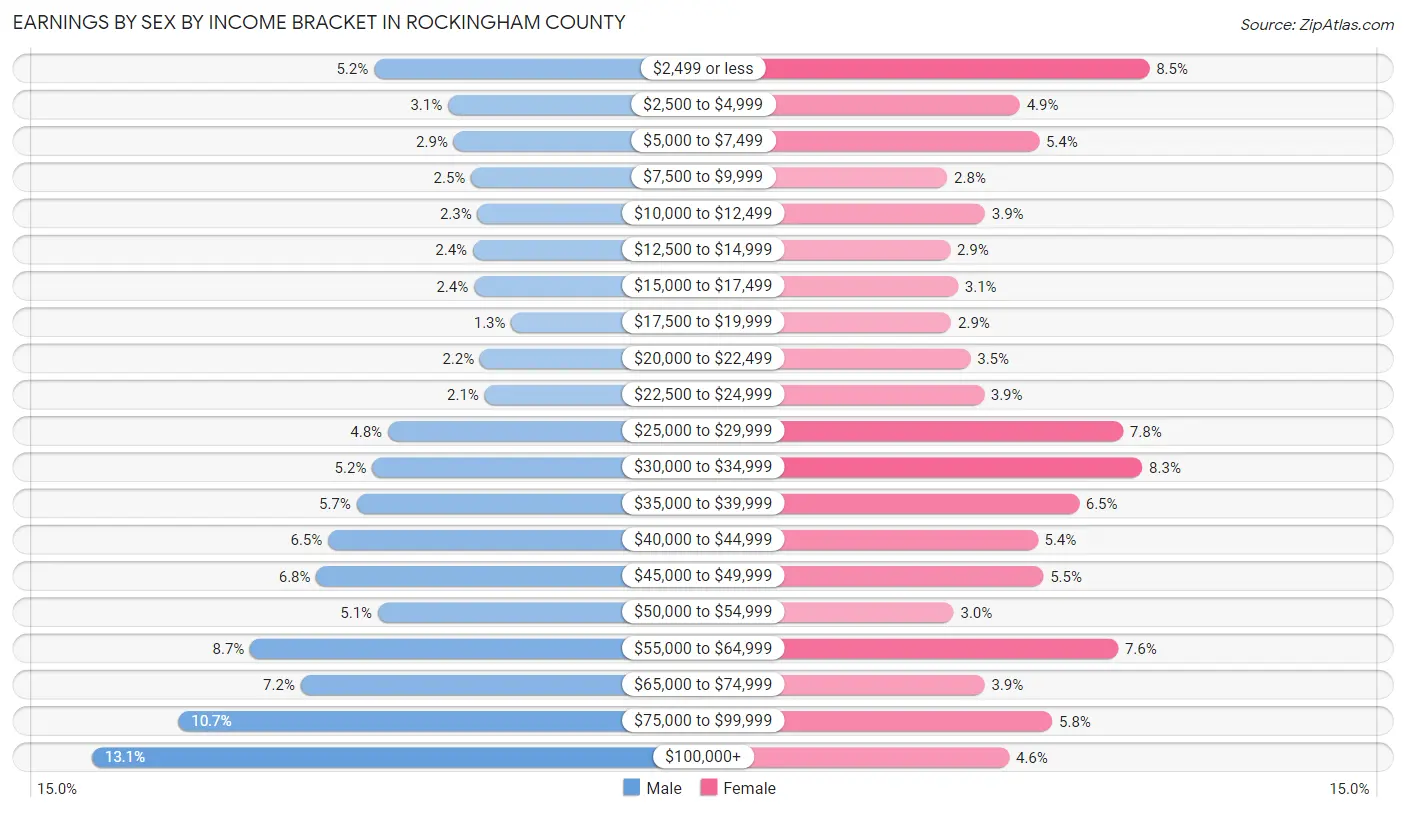
Earnings by Sex by Income Bracket in Rockingham County
The most common earnings brackets in Rockingham County are $100,000+ for men (3,205 | 13.1%) and $2,499 or less for women (1,879 | 8.5%).
| Income | Male | Female |
| $2,499 or less | 1,268 (5.2%) | 1,879 (8.5%) |
| $2,500 to $4,999 | 758 (3.1%) | 1,075 (4.9%) |
| $5,000 to $7,499 | 718 (2.9%) | 1,193 (5.4%) |
| $7,500 to $9,999 | 599 (2.5%) | 624 (2.8%) |
| $10,000 to $12,499 | 556 (2.3%) | 858 (3.9%) |
| $12,500 to $14,999 | 586 (2.4%) | 640 (2.9%) |
| $15,000 to $17,499 | 579 (2.4%) | 690 (3.1%) |
| $17,500 to $19,999 | 322 (1.3%) | 647 (2.9%) |
| $20,000 to $22,499 | 537 (2.2%) | 766 (3.5%) |
| $22,500 to $24,999 | 506 (2.1%) | 851 (3.8%) |
| $25,000 to $29,999 | 1,171 (4.8%) | 1,714 (7.8%) |
| $30,000 to $34,999 | 1,278 (5.2%) | 1,834 (8.3%) |
| $35,000 to $39,999 | 1,387 (5.7%) | 1,440 (6.5%) |
| $40,000 to $44,999 | 1,582 (6.5%) | 1,185 (5.4%) |
| $45,000 to $49,999 | 1,664 (6.8%) | 1,219 (5.5%) |
| $50,000 to $54,999 | 1,241 (5.1%) | 664 (3.0%) |
| $55,000 to $64,999 | 2,118 (8.7%) | 1,683 (7.6%) |
| $65,000 to $74,999 | 1,770 (7.2%) | 855 (3.9%) |
| $75,000 to $99,999 | 2,611 (10.7%) | 1,274 (5.8%) |
| $100,000+ | 3,205 (13.1%) | 1,007 (4.6%) |
| Total | 24,456 (100.0%) | 22,098 (100.0%) |
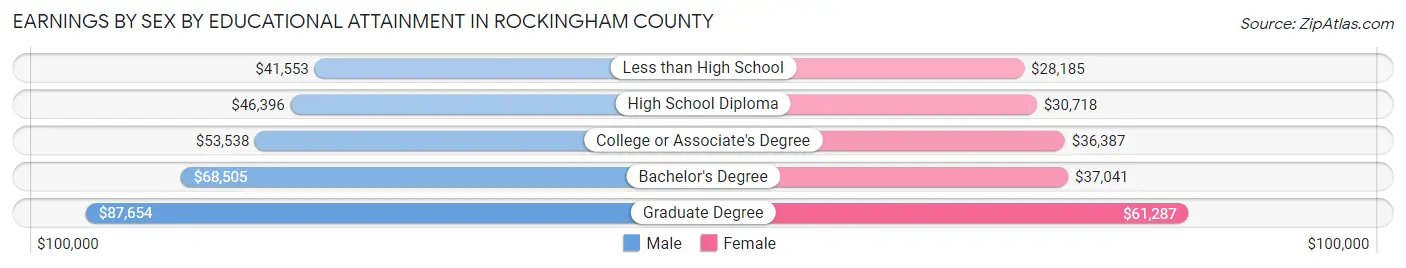
Earnings by Sex by Educational Attainment in Rockingham County
Average earnings in Rockingham County are $52,837 for men and $35,060 for women, a difference of 33.6%. Men with an educational attainment of graduate degree enjoy the highest average annual earnings of $87,654, while those with less than high school education earn the least with $41,553. Women with an educational attainment of graduate degree earn the most with the average annual earnings of $61,287, while those with less than high school education have the smallest earnings of $28,185.
| Educational Attainment | Male Income | Female Income |
| Less than High School | $41,553 | $28,185 |
| High School Diploma | $46,396 | $30,718 |
| College or Associate's Degree | $53,538 | $36,387 |
| Bachelor's Degree | $68,505 | $37,041 |
| Graduate Degree | $87,654 | $61,287 |
| Total | $52,837 | $35,060 |
Family Income in Rockingham County
Family Income Brackets in Rockingham County
According to the Rockingham County family income data, there are 5,318 families falling into the $100,000 to $149,999 income range, which is the most common income bracket and makes up 24.1% of all families. Conversely, the $10,000 to $14,999 income bracket is the least frequent group with only 221 families (1.0%) belonging to this category.
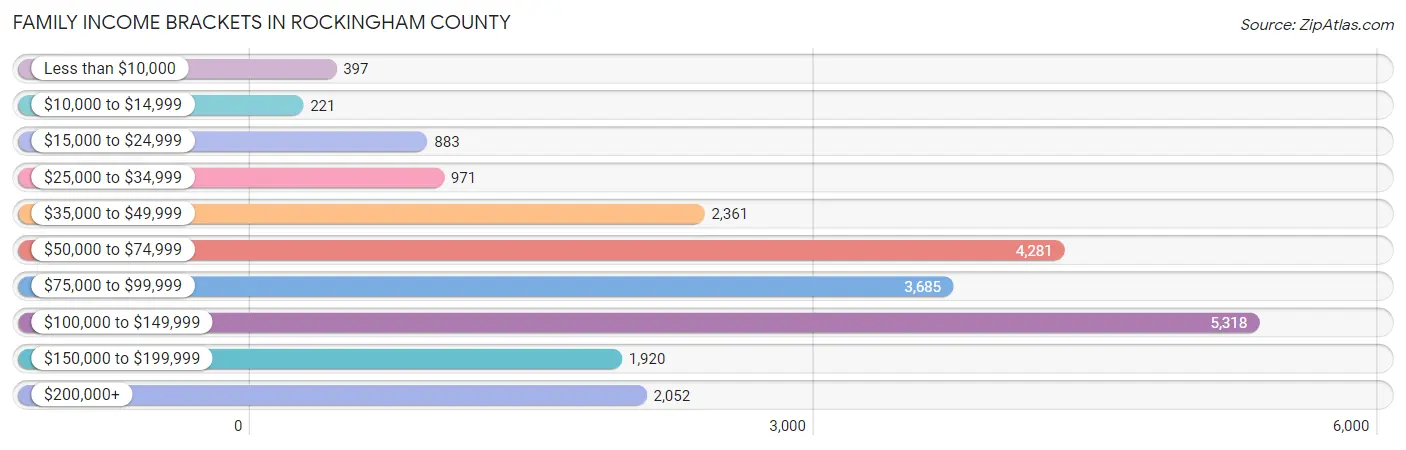
| Income Bracket | # Families | % Families |
| Less than $10,000 | 397 | 1.8% |
| $10,000 to $14,999 | 221 | 1.0% |
| $15,000 to $24,999 | 883 | 4.0% |
| $25,000 to $34,999 | 971 | 4.4% |
| $35,000 to $49,999 | 2,361 | 10.7% |
| $50,000 to $74,999 | 4,281 | 19.4% |
| $75,000 to $99,999 | 3,685 | 16.7% |
| $100,000 to $149,999 | 5,318 | 24.1% |
| $150,000 to $199,999 | 1,920 | 8.7% |
| $200,000+ | 2,052 | 9.3% |
Family Income by Famaliy Size in Rockingham County
5-person families (1,380 | 6.2%) account for the highest median family income in Rockingham County with $109,318 per family, while 2-person families (10,820 | 49.0%) have the highest median income of $37,803 per family member.
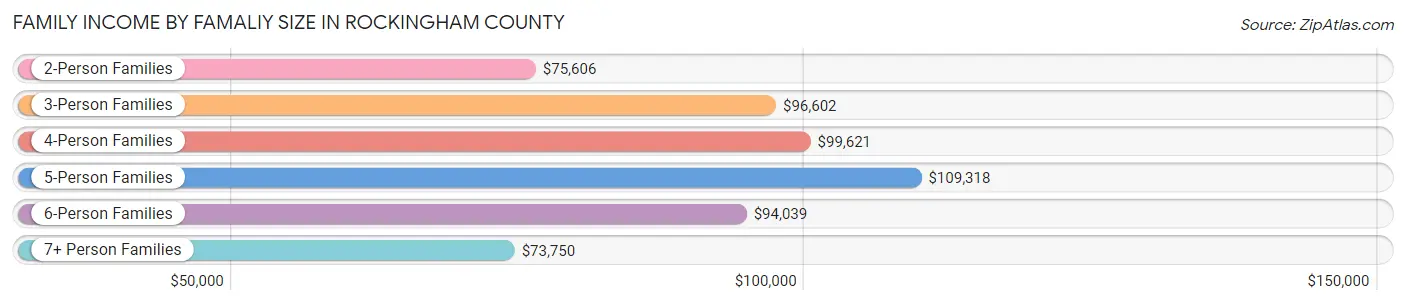
| Income Bracket | # Families | Median Income |
| 2-Person Families | 10,820 (49.0%) | $75,606 |
| 3-Person Families | 5,161 (23.4%) | $96,602 |
| 4-Person Families | 3,747 (17.0%) | $99,621 |
| 5-Person Families | 1,380 (6.2%) | $109,318 |
| 6-Person Families | 605 (2.7%) | $94,039 |
| 7+ Person Families | 352 (1.6%) | $73,750 |
| Total | 22,065 (100.0%) | $88,389 |
Family Income by Number of Earners in Rockingham County
The median family income in Rockingham County is $88,389, with families comprising 3+ earners (2,855) having the highest median family income of $125,950, while families with no earners (3,273) have the lowest median family income of $58,090, accounting for 12.9% and 14.8% of families, respectively.
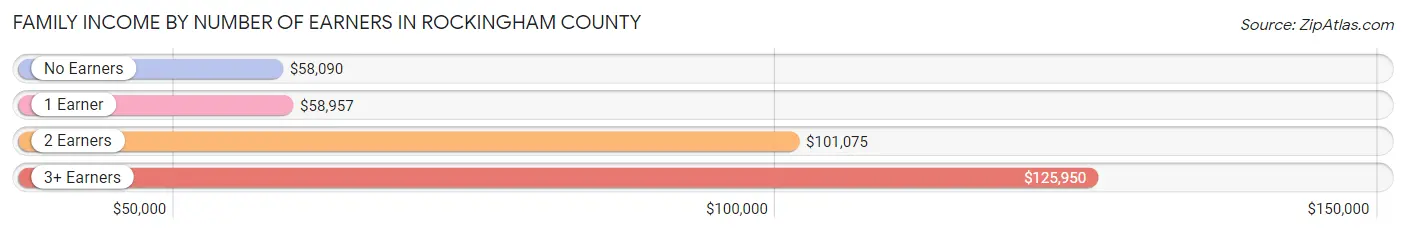
| Number of Earners | # Families | Median Income |
| No Earners | 3,273 (14.8%) | $58,090 |
| 1 Earner | 6,287 (28.5%) | $58,957 |
| 2 Earners | 9,650 (43.7%) | $101,075 |
| 3+ Earners | 2,855 (12.9%) | $125,950 |
| Total | 22,065 (100.0%) | $88,389 |
Household Income in Rockingham County
Household Income Brackets in Rockingham County
With 6,006 households falling in the category, the $50,000 to $74,999 income range is the most frequent in Rockingham County, accounting for 19.0% of all households. In contrast, only 790 households (2.5%) fall into the $10,000 to $14,999 income bracket, making it the least populous group.
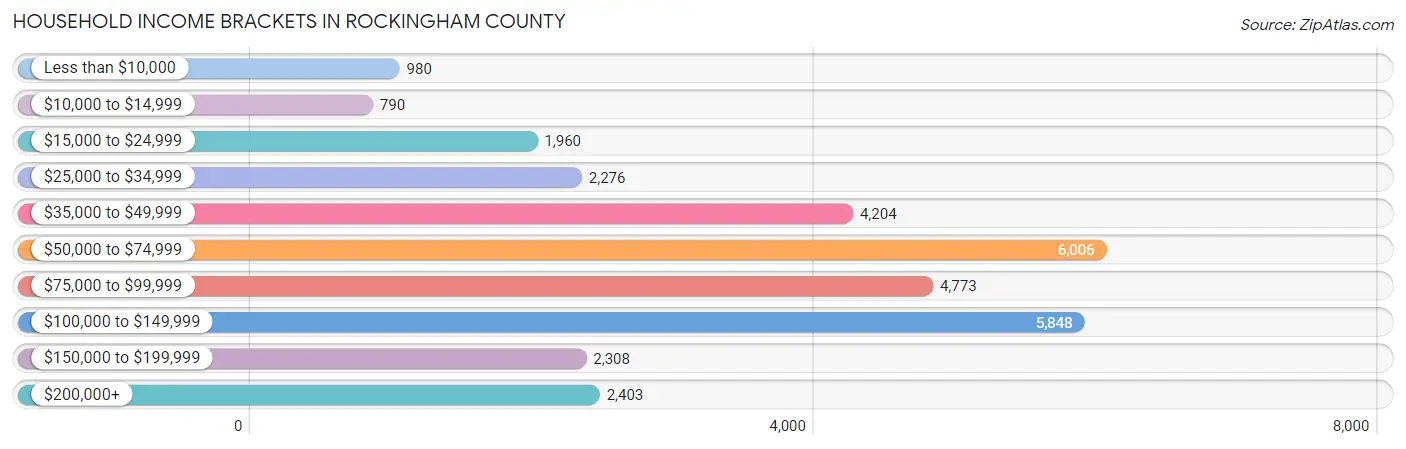
| Income Bracket | # Households | % Households |
| Less than $10,000 | 980 | 3.1% |
| $10,000 to $14,999 | 790 | 2.5% |
| $15,000 to $24,999 | 1,960 | 6.2% |
| $25,000 to $34,999 | 2,276 | 7.2% |
| $35,000 to $49,999 | 4,204 | 13.3% |
| $50,000 to $74,999 | 6,006 | 19.0% |
| $75,000 to $99,999 | 4,773 | 15.1% |
| $100,000 to $149,999 | 5,848 | 18.5% |
| $150,000 to $199,999 | 2,308 | 7.3% |
| $200,000+ | 2,403 | 7.6% |
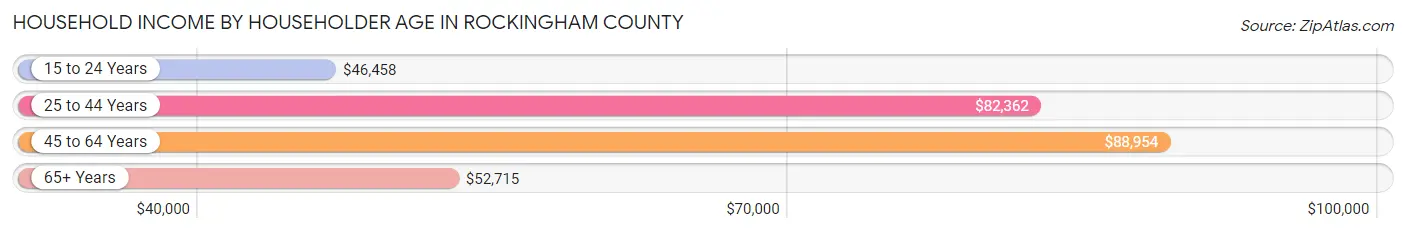
Household Income by Householder Age in Rockingham County
The median household income in Rockingham County is $73,232, with the highest median household income of $88,954 found in the 45 to 64 years age bracket for the primary householder. A total of 11,387 households (36.0%) fall into this category. Meanwhile, the 15 to 24 years age bracket for the primary householder has the lowest median household income of $46,458, with 1,044 households (3.3%) in this group.
| Income Bracket | # Households | Median Income |
| 15 to 24 Years | 1,044 (3.3%) | $46,458 |
| 25 to 44 Years | 8,931 (28.2%) | $82,362 |
| 45 to 64 Years | 11,387 (36.0%) | $88,954 |
| 65+ Years | 10,250 (32.4%) | $52,715 |
| Total | 31,612 (100.0%) | $73,232 |
Poverty in Rockingham County
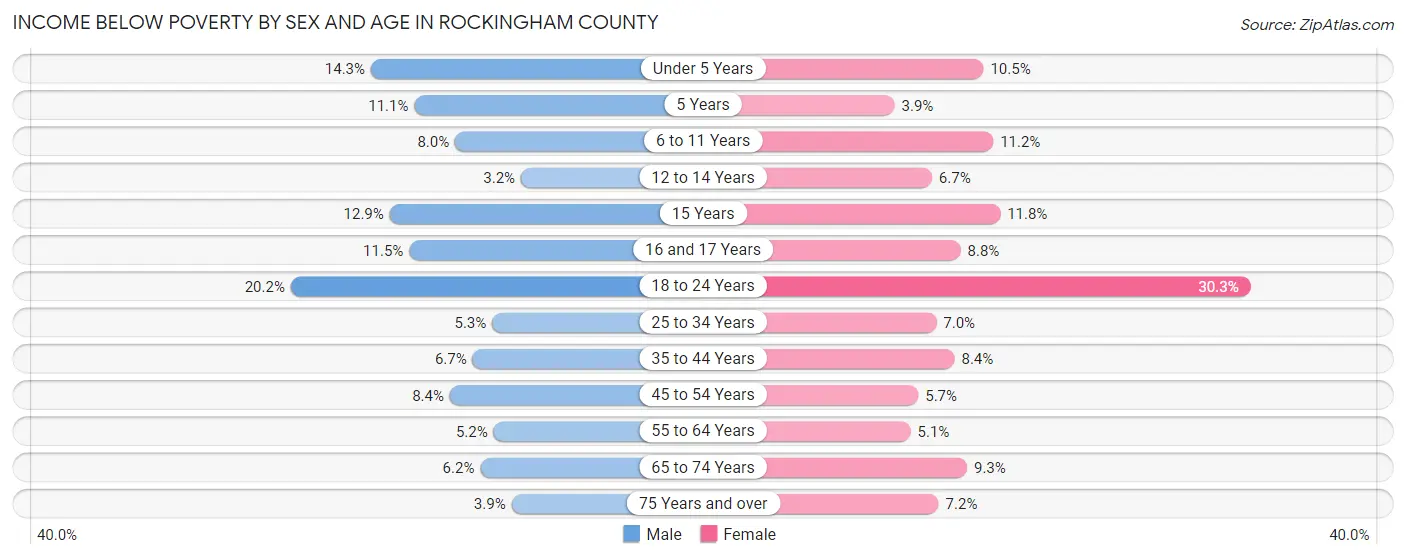
Income Below Poverty by Sex and Age in Rockingham County
With 8.1% poverty level for males and 9.4% for females among the residents of Rockingham County, 18 to 24 year old males and 18 to 24 year old females are the most vulnerable to poverty, with 682 males (20.2%) and 1,008 females (30.3%) in their respective age groups living below the poverty level.
| Age Bracket | Male | Female |
| Under 5 Years | 348 (14.3%) | 230 (10.5%) |
| 5 Years | 34 (11.1%) | 20 (3.9%) |
| 6 to 11 Years | 264 (8.0%) | 312 (11.2%) |
| 12 to 14 Years | 52 (3.2%) | 113 (6.7%) |
| 15 Years | 61 (12.9%) | 56 (11.8%) |
| 16 and 17 Years | 137 (11.5%) | 99 (8.8%) |
| 18 to 24 Years | 682 (20.2%) | 1,008 (30.3%) |
| 25 to 34 Years | 254 (5.3%) | 334 (7.0%) |
| 35 to 44 Years | 329 (6.7%) | 416 (8.4%) |
| 45 to 54 Years | 426 (8.4%) | 281 (5.7%) |
| 55 to 64 Years | 297 (5.2%) | 294 (5.1%) |
| 65 to 74 Years | 273 (6.2%) | 436 (9.3%) |
| 75 Years and over | 115 (3.8%) | 290 (7.2%) |
| Total | 3,272 (8.1%) | 3,889 (9.4%) |
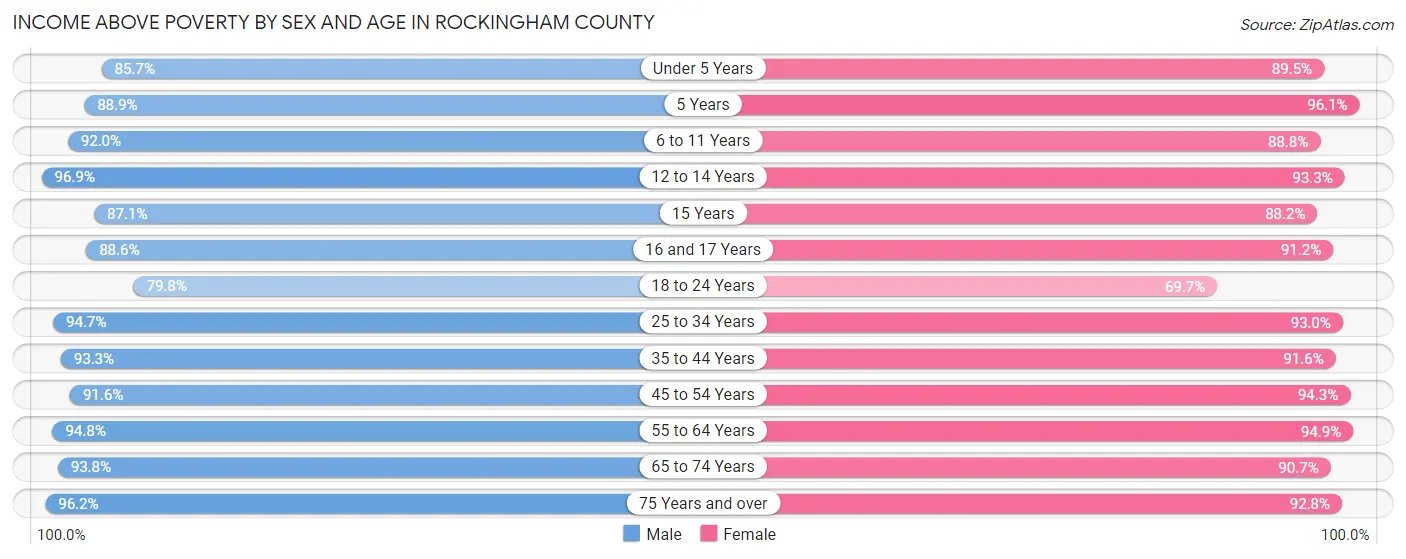
Income Above Poverty by Sex and Age in Rockingham County
According to the poverty statistics in Rockingham County, males aged 12 to 14 years and females aged 5 years are the age groups that are most secure financially, with 96.9% of males and 96.1% of females in these age groups living above the poverty line.
| Age Bracket | Male | Female |
| Under 5 Years | 2,087 (85.7%) | 1,957 (89.5%) |
| 5 Years | 273 (88.9%) | 490 (96.1%) |
| 6 to 11 Years | 3,018 (92.0%) | 2,464 (88.8%) |
| 12 to 14 Years | 1,599 (96.9%) | 1,576 (93.3%) |
| 15 Years | 412 (87.1%) | 420 (88.2%) |
| 16 and 17 Years | 1,059 (88.5%) | 1,023 (91.2%) |
| 18 to 24 Years | 2,687 (79.8%) | 2,314 (69.7%) |
| 25 to 34 Years | 4,549 (94.7%) | 4,422 (93.0%) |
| 35 to 44 Years | 4,553 (93.3%) | 4,553 (91.6%) |
| 45 to 54 Years | 4,628 (91.6%) | 4,664 (94.3%) |
| 55 to 64 Years | 5,437 (94.8%) | 5,458 (94.9%) |
| 65 to 74 Years | 4,155 (93.8%) | 4,253 (90.7%) |
| 75 Years and over | 2,869 (96.2%) | 3,746 (92.8%) |
| Total | 37,326 (91.9%) | 37,340 (90.6%) |
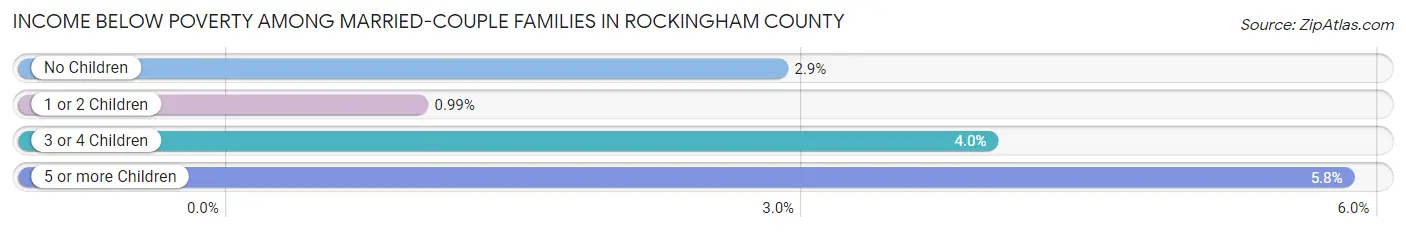
Income Below Poverty Among Married-Couple Families in Rockingham County
The poverty statistics for married-couple families in Rockingham County show that 2.4% or 430 of the total 17,825 families live below the poverty line. Families with 5 or more children have the highest poverty rate of 5.8%, comprising of 14 families. On the other hand, families with 1 or 2 children have the lowest poverty rate of 1.0%, which includes 54 families.
| Children | Above Poverty | Below Poverty |
| No Children | 10,510 (97.1%) | 310 (2.9%) |
| 1 or 2 Children | 5,400 (99.0%) | 54 (1.0%) |
| 3 or 4 Children | 1,259 (96.0%) | 52 (4.0%) |
| 5 or more Children | 226 (94.2%) | 14 (5.8%) |
| Total | 17,395 (97.6%) | 430 (2.4%) |
Income Below Poverty Among Single-Parent Households in Rockingham County
According to the poverty data in Rockingham County, 18.5% or 305 single-father households and 22.3% or 580 single-mother households are living below the poverty line. Among single-father households, those with 3 or 4 children have the highest poverty rate, with 66 households (42.9%) experiencing poverty. Likewise, among single-mother households, those with 5 or more children have the highest poverty rate, with 14 households (100.0%) falling below the poverty line.
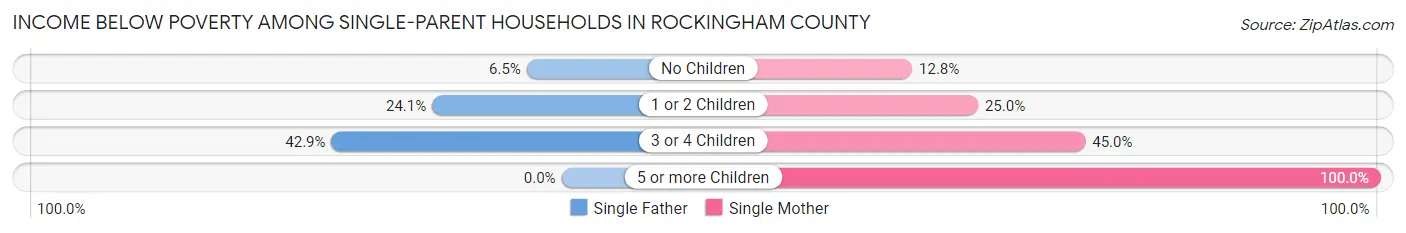
| Children | Single Father | Single Mother |
| No Children | 43 (6.5%) | 133 (12.8%) |
| 1 or 2 Children | 196 (24.1%) | 325 (25.0%) |
| 3 or 4 Children | 66 (42.9%) | 108 (45.0%) |
| 5 or more Children | 0 (0.0%) | 14 (100.0%) |
| Total | 305 (18.5%) | 580 (22.3%) |
Income Below Poverty Among Married-Couple vs Single-Parent Households in Rockingham County
The poverty data for Rockingham County shows that 430 of the married-couple family households (2.4%) and 885 of the single-parent households (20.9%) are living below the poverty level. Within the married-couple family households, those with 5 or more children have the highest poverty rate, with 14 households (5.8%) falling below the poverty line. Among the single-parent households, those with 5 or more children have the highest poverty rate, with 14 household (51.8%) living below poverty.
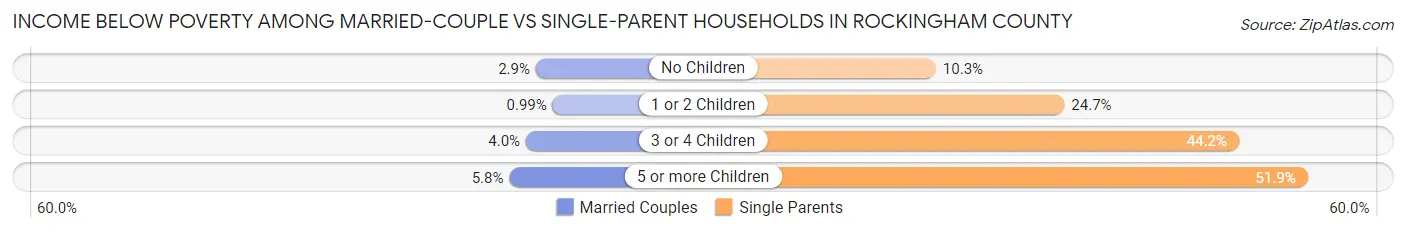
| Children | Married-Couple Families | Single-Parent Households |
| No Children | 310 (2.9%) | 176 (10.3%) |
| 1 or 2 Children | 54 (1.0%) | 521 (24.7%) |
| 3 or 4 Children | 52 (4.0%) | 174 (44.2%) |
| 5 or more Children | 14 (5.8%) | 14 (51.8%) |
| Total | 430 (2.4%) | 885 (20.9%) |
Race in Rockingham County
The most populous races in Rockingham County are White / Caucasian (75,412 | 89.9%), Hispanic or Latino (6,561 | 7.8%), and Two or more Races (4,148 | 4.9%).
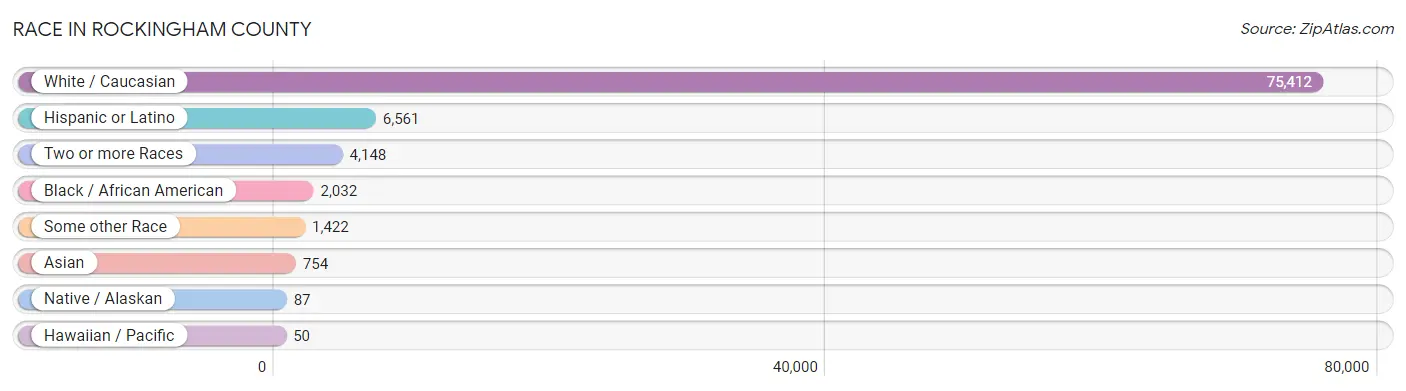
| Race | # Population | % Population |
| Asian | 754 | 0.9% |
| Black / African American | 2,032 | 2.4% |
| Hawaiian / Pacific | 50 | 0.1% |
| Hispanic or Latino | 6,561 | 7.8% |
| Native / Alaskan | 87 | 0.1% |
| White / Caucasian | 75,412 | 89.9% |
| Two or more Races | 4,148 | 4.9% |
| Some other Race | 1,422 | 1.7% |
| Total | 83,905 | 100.0% |
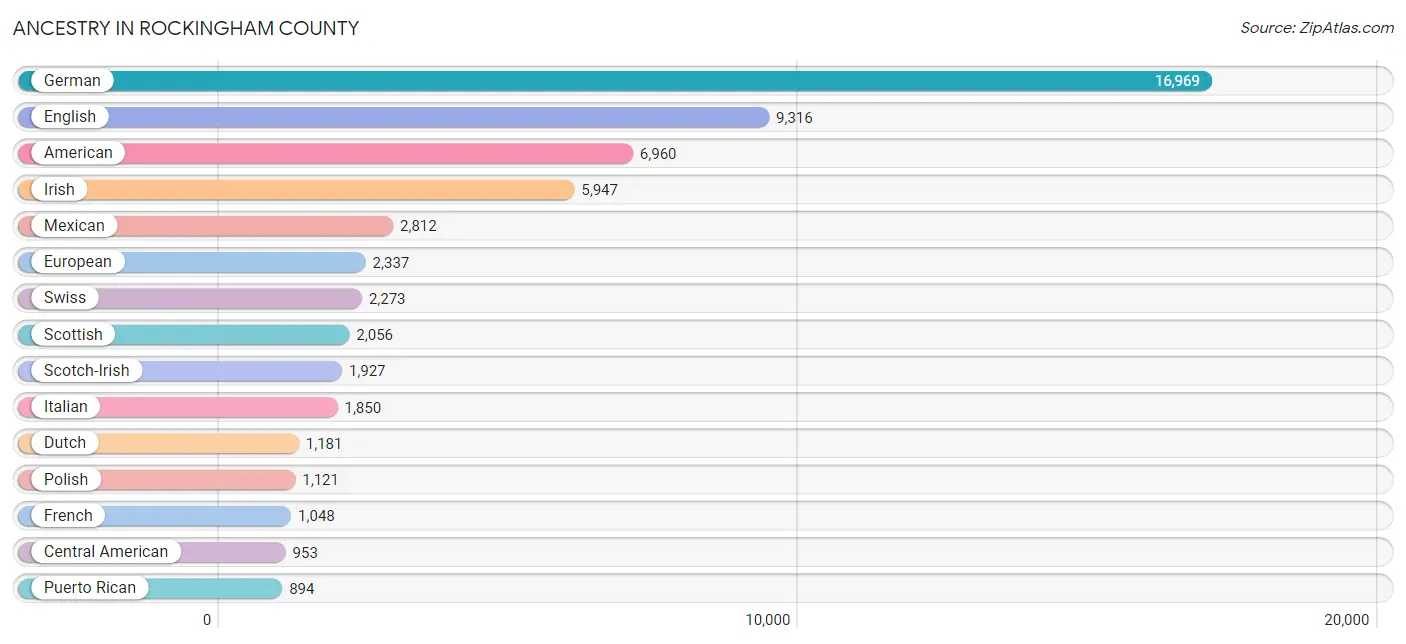
Ancestry in Rockingham County
The most populous ancestries reported in Rockingham County are German (16,969 | 20.2%), English (9,316 | 11.1%), American (6,960 | 8.3%), Irish (5,947 | 7.1%), and Mexican (2,812 | 3.4%), together accounting for 50.1% of all Rockingham County residents.
| Ancestry | # Population | % Population |
| African | 211 | 0.3% |
| Aleut | 7 | 0.0% |
| American | 6,960 | 8.3% |
| Apache | 5 | 0.0% |
| Arab | 595 | 0.7% |
| Argentinean | 47 | 0.1% |
| Armenian | 4 | 0.0% |
| Austrian | 151 | 0.2% |
| Belgian | 63 | 0.1% |
| Bhutanese | 17 | 0.0% |
| Blackfeet | 4 | 0.0% |
| Bolivian | 72 | 0.1% |
| Brazilian | 20 | 0.0% |
| British | 723 | 0.9% |
| British West Indian | 10 | 0.0% |
| Burmese | 83 | 0.1% |
| Canadian | 69 | 0.1% |
| Celtic | 8 | 0.0% |
| Central American | 953 | 1.1% |
| Central American Indian | 27 | 0.0% |
| Cherokee | 201 | 0.2% |
| Choctaw | 3 | 0.0% |
| Colombian | 39 | 0.1% |
| Costa Rican | 5 | 0.0% |
| Croatian | 55 | 0.1% |
| Crow | 8 | 0.0% |
| Cuban | 222 | 0.3% |
| Czech | 24 | 0.0% |
| Czechoslovakian | 27 | 0.0% |
| Danish | 99 | 0.1% |
| Dominican | 409 | 0.5% |
| Dutch | 1,181 | 1.4% |
| Eastern European | 79 | 0.1% |
| Ecuadorian | 18 | 0.0% |
| English | 9,316 | 11.1% |
| Estonian | 4 | 0.0% |
| European | 2,337 | 2.8% |
| Finnish | 49 | 0.1% |
| French | 1,048 | 1.3% |
| French Canadian | 208 | 0.3% |
| German | 16,969 | 20.2% |
| Greek | 122 | 0.2% |
| Guamanian / Chamorro | 14 | 0.0% |
| Guatemalan | 99 | 0.1% |
| Haitian | 18 | 0.0% |
| Honduran | 265 | 0.3% |
| Hungarian | 395 | 0.5% |
| Indian (Asian) | 46 | 0.1% |
| Iranian | 68 | 0.1% |
| Iraqi | 64 | 0.1% |
| Irish | 5,947 | 7.1% |
| Iroquois | 12 | 0.0% |
| Israeli | 18 | 0.0% |
| Italian | 1,850 | 2.2% |
| Jamaican | 20 | 0.0% |
| Japanese | 13 | 0.0% |
| Jordanian | 65 | 0.1% |
| Korean | 284 | 0.3% |
| Lebanese | 20 | 0.0% |
| Lithuanian | 26 | 0.0% |
| Lumbee | 6 | 0.0% |
| Malaysian | 79 | 0.1% |
| Mexican | 2,812 | 3.4% |
| Mexican American Indian | 161 | 0.2% |
| Native Hawaiian | 60 | 0.1% |
| Nicaraguan | 20 | 0.0% |
| Northern European | 53 | 0.1% |
| Norwegian | 314 | 0.4% |
| Pakistani | 86 | 0.1% |
| Palestinian | 12 | 0.0% |
| Pennsylvania German | 126 | 0.2% |
| Peruvian | 4 | 0.0% |
| Polish | 1,121 | 1.3% |
| Portuguese | 39 | 0.1% |
| Puerto Rican | 894 | 1.1% |
| Romanian | 29 | 0.0% |
| Russian | 581 | 0.7% |
| Salvadoran | 564 | 0.7% |
| Scandinavian | 221 | 0.3% |
| Scotch-Irish | 1,927 | 2.3% |
| Scottish | 2,056 | 2.5% |
| Serbian | 34 | 0.0% |
| Sioux | 18 | 0.0% |
| Slavic | 80 | 0.1% |
| Slovak | 133 | 0.2% |
| Slovene | 23 | 0.0% |
| South African | 15 | 0.0% |
| South American | 500 | 0.6% |
| Spaniard | 346 | 0.4% |
| Spanish | 70 | 0.1% |
| Spanish American | 10 | 0.0% |
| Sri Lankan | 265 | 0.3% |
| Subsaharan African | 483 | 0.6% |
| Swedish | 329 | 0.4% |
| Swiss | 2,273 | 2.7% |
| Syrian | 115 | 0.1% |
| Thai | 105 | 0.1% |
| Tongan | 30 | 0.0% |
| Trinidadian and Tobagonian | 4 | 0.0% |
| Ukrainian | 442 | 0.5% |
| Uruguayan | 44 | 0.1% |
| Venezuelan | 276 | 0.3% |
| Vietnamese | 91 | 0.1% |
| Welsh | 671 | 0.8% |
| West Indian | 15 | 0.0% |
| Yugoslavian | 22 | 0.0% | View All 106 Rows |
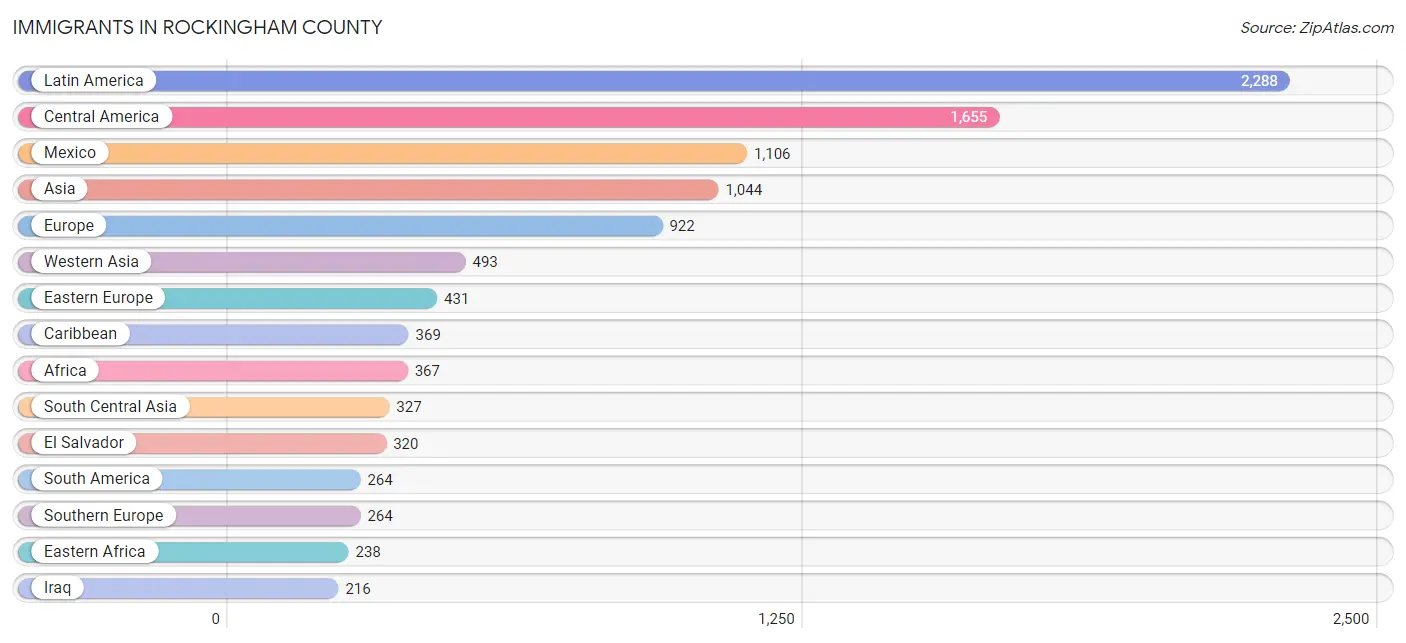
Immigrants in Rockingham County
The most numerous immigrant groups reported in Rockingham County came from Latin America (2,288 | 2.7%), Central America (1,655 | 2.0%), Mexico (1,106 | 1.3%), Asia (1,044 | 1.2%), and Europe (922 | 1.1%), together accounting for 8.4% of all Rockingham County residents.
| Immigration Origin | # Population | % Population |
| Africa | 367 | 0.4% |
| Asia | 1,044 | 1.2% |
| Australia | 5 | 0.0% |
| Austria | 30 | 0.0% |
| Bangladesh | 47 | 0.1% |
| Belarus | 139 | 0.2% |
| Belize | 44 | 0.1% |
| Bolivia | 61 | 0.1% |
| Brazil | 35 | 0.0% |
| Cambodia | 1 | 0.0% |
| Cameroon | 6 | 0.0% |
| Canada | 68 | 0.1% |
| Caribbean | 369 | 0.4% |
| Central America | 1,655 | 2.0% |
| China | 40 | 0.1% |
| Colombia | 39 | 0.1% |
| Costa Rica | 18 | 0.0% |
| Cuba | 175 | 0.2% |
| Czechoslovakia | 15 | 0.0% |
| Dominican Republic | 167 | 0.2% |
| Eastern Africa | 238 | 0.3% |
| Eastern Asia | 75 | 0.1% |
| Eastern Europe | 431 | 0.5% |
| El Salvador | 320 | 0.4% |
| England | 15 | 0.0% |
| Eritrea | 32 | 0.0% |
| Europe | 922 | 1.1% |
| France | 22 | 0.0% |
| Germany | 114 | 0.1% |
| Greece | 43 | 0.1% |
| Grenada | 7 | 0.0% |
| Guatemala | 6 | 0.0% |
| Honduras | 154 | 0.2% |
| Hungary | 20 | 0.0% |
| India | 45 | 0.1% |
| Iran | 68 | 0.1% |
| Iraq | 216 | 0.3% |
| Ireland | 2 | 0.0% |
| Israel | 18 | 0.0% |
| Italy | 10 | 0.0% |
| Jamaica | 20 | 0.0% |
| Japan | 5 | 0.0% |
| Jordan | 65 | 0.1% |
| Kazakhstan | 37 | 0.0% |
| Korea | 30 | 0.0% |
| Laos | 7 | 0.0% |
| Latin America | 2,288 | 2.7% |
| Latvia | 42 | 0.1% |
| Lebanon | 7 | 0.0% |
| Mexico | 1,106 | 1.3% |
| Micronesia | 5 | 0.0% |
| Middle Africa | 108 | 0.1% |
| Netherlands | 39 | 0.1% |
| Nicaragua | 7 | 0.0% |
| Nigeria | 16 | 0.0% |
| Northern Europe | 22 | 0.0% |
| Oceania | 28 | 0.0% |
| Pakistan | 109 | 0.1% |
| Peru | 4 | 0.0% |
| Philippines | 35 | 0.0% |
| Poland | 68 | 0.1% |
| Russia | 52 | 0.1% |
| Saudi Arabia | 58 | 0.1% |
| South Africa | 5 | 0.0% |
| South America | 264 | 0.3% |
| South Central Asia | 327 | 0.4% |
| South Eastern Asia | 87 | 0.1% |
| Southern Europe | 264 | 0.3% |
| Spain | 211 | 0.3% |
| Syria | 115 | 0.1% |
| Thailand | 2 | 0.0% |
| Uganda | 137 | 0.2% |
| Ukraine | 73 | 0.1% |
| Uruguay | 17 | 0.0% |
| Uzbekistan | 21 | 0.0% |
| Venezuela | 108 | 0.1% |
| Vietnam | 42 | 0.1% |
| Western Africa | 16 | 0.0% |
| Western Asia | 493 | 0.6% |
| Western Europe | 205 | 0.2% |
| Zaire | 102 | 0.1% |
| Zimbabwe | 69 | 0.1% | View All 82 Rows |
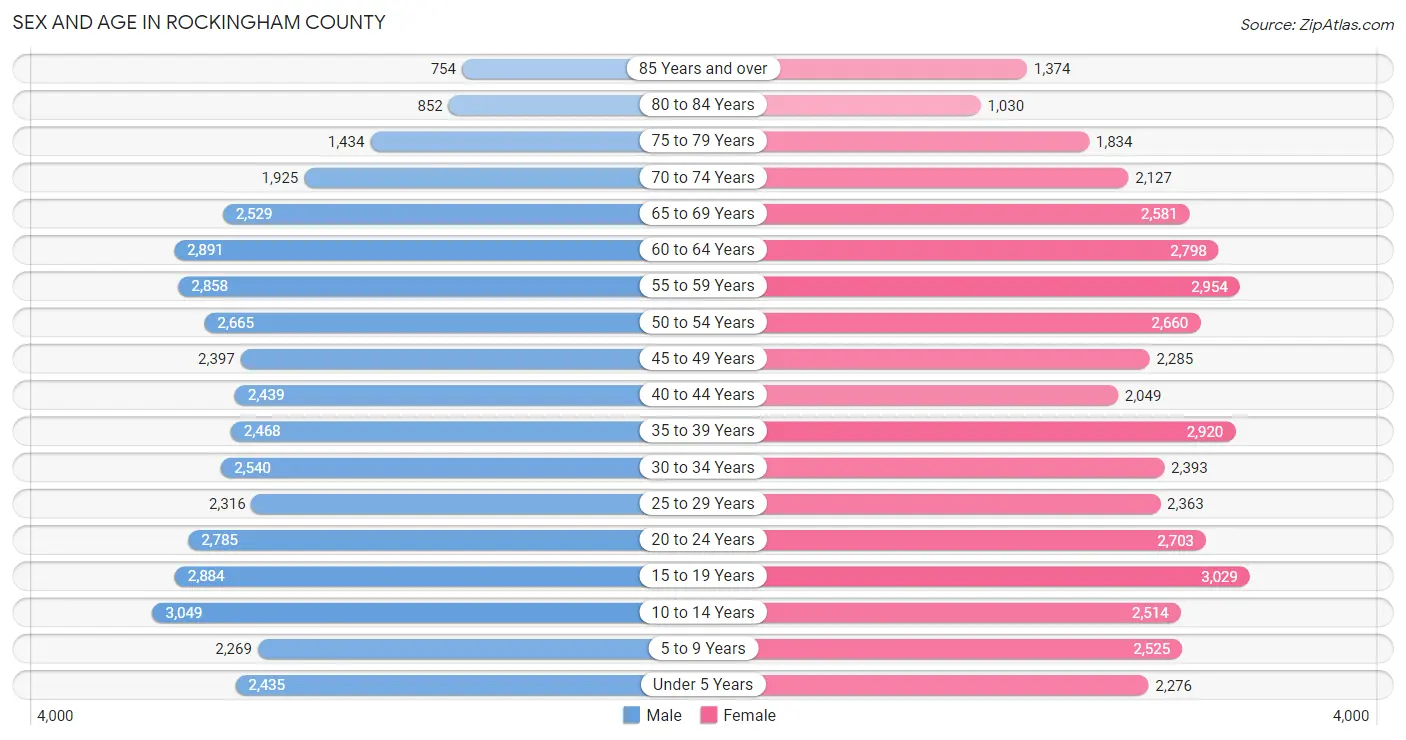
Sex and Age in Rockingham County
Sex and Age in Rockingham County
The most populous age groups in Rockingham County are 10 to 14 Years (3,049 | 7.3%) for men and 15 to 19 Years (3,029 | 7.1%) for women.
| Age Bracket | Male | Female |
| Under 5 Years | 2,435 (5.9%) | 2,276 (5.4%) |
| 5 to 9 Years | 2,269 (5.5%) | 2,525 (5.9%) |
| 10 to 14 Years | 3,049 (7.3%) | 2,514 (5.9%) |
| 15 to 19 Years | 2,884 (7.0%) | 3,029 (7.1%) |
| 20 to 24 Years | 2,785 (6.7%) | 2,703 (6.4%) |
| 25 to 29 Years | 2,316 (5.6%) | 2,363 (5.6%) |
| 30 to 34 Years | 2,540 (6.1%) | 2,393 (5.6%) |
| 35 to 39 Years | 2,468 (5.9%) | 2,920 (6.9%) |
| 40 to 44 Years | 2,439 (5.9%) | 2,049 (4.8%) |
| 45 to 49 Years | 2,397 (5.8%) | 2,285 (5.4%) |
| 50 to 54 Years | 2,665 (6.4%) | 2,660 (6.3%) |
| 55 to 59 Years | 2,858 (6.9%) | 2,954 (7.0%) |
| 60 to 64 Years | 2,891 (7.0%) | 2,798 (6.6%) |
| 65 to 69 Years | 2,529 (6.1%) | 2,581 (6.1%) |
| 70 to 74 Years | 1,925 (4.6%) | 2,127 (5.0%) |
| 75 to 79 Years | 1,434 (3.5%) | 1,834 (4.3%) |
| 80 to 84 Years | 852 (2.1%) | 1,030 (2.4%) |
| 85 Years and over | 754 (1.8%) | 1,374 (3.2%) |
| Total | 41,490 (100.0%) | 42,415 (100.0%) |
Families and Households in Rockingham County
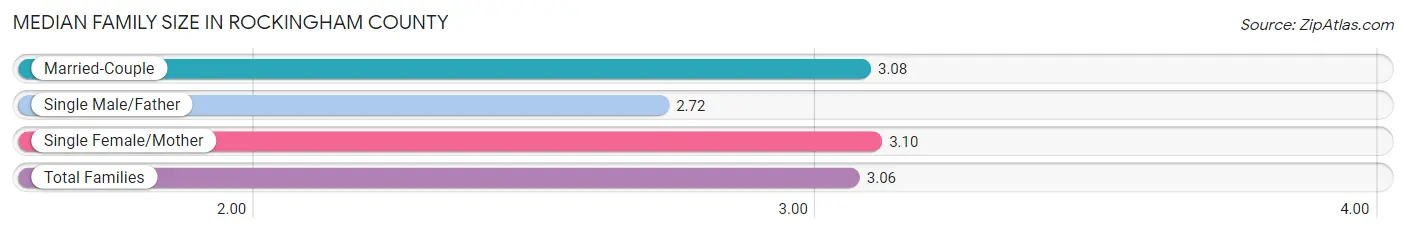
Median Family Size in Rockingham County
The median family size in Rockingham County is 3.06 persons per family, with single female/mother families (2,596 | 11.8%) accounting for the largest median family size of 3.1 persons per family. On the other hand, single male/father families (1,644 | 7.4%) represent the smallest median family size with 2.72 persons per family.
| Family Type | # Families | Family Size |
| Married-Couple | 17,825 (80.8%) | 3.08 |
| Single Male/Father | 1,644 (7.4%) | 2.72 |
| Single Female/Mother | 2,596 (11.8%) | 3.10 |
| Total Families | 22,065 (100.0%) | 3.06 |
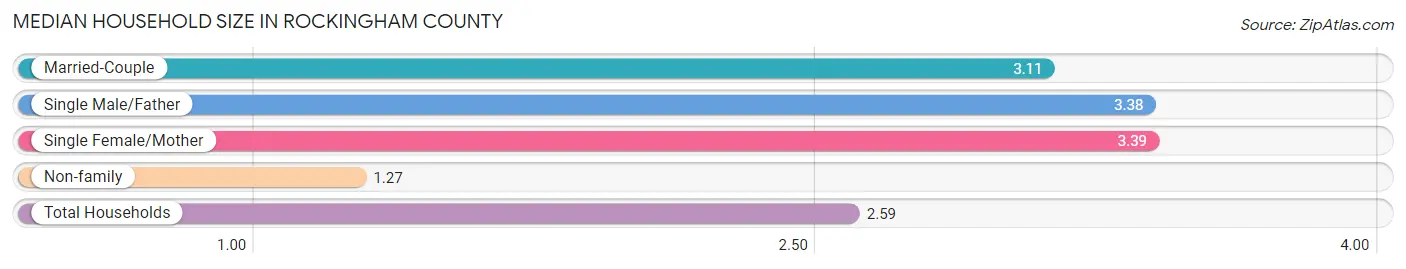
Median Household Size in Rockingham County
The median household size in Rockingham County is 2.59 persons per household, with single female/mother households (2,596 | 8.2%) accounting for the largest median household size of 3.39 persons per household. non-family households (9,547 | 30.2%) represent the smallest median household size with 1.27 persons per household.
| Household Type | # Households | Household Size |
| Married-Couple | 17,825 (56.4%) | 3.11 |
| Single Male/Father | 1,644 (5.2%) | 3.38 |
| Single Female/Mother | 2,596 (8.2%) | 3.39 |
| Non-family | 9,547 (30.2%) | 1.27 |
| Total Households | 31,612 (100.0%) | 2.59 |
Household Size by Marriage Status in Rockingham County
Out of a total of 31,612 households in Rockingham County, 22,065 (69.8%) are family households, while 9,547 (30.2%) are nonfamily households. The most numerous type of family households are 2-person households, comprising 10,102, and the most common type of nonfamily households are 1-person households, comprising 7,922.
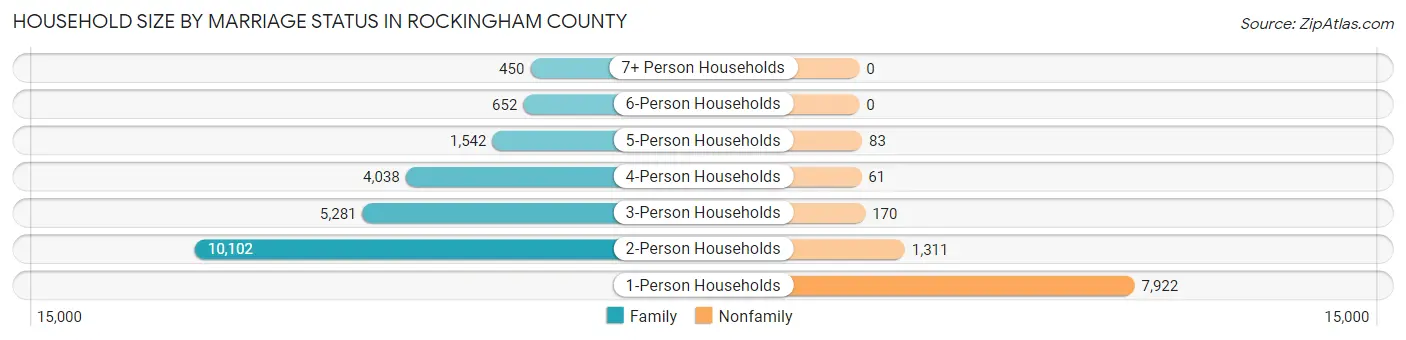
| Household Size | Family Households | Nonfamily Households |
| 1-Person Households | - | 7,922 (25.1%) |
| 2-Person Households | 10,102 (32.0%) | 1,311 (4.2%) |
| 3-Person Households | 5,281 (16.7%) | 170 (0.5%) |
| 4-Person Households | 4,038 (12.8%) | 61 (0.2%) |
| 5-Person Households | 1,542 (4.9%) | 83 (0.3%) |
| 6-Person Households | 652 (2.1%) | 0 (0.0%) |
| 7+ Person Households | 450 (1.4%) | 0 (0.0%) |
| Total | 22,065 (69.8%) | 9,547 (30.2%) |
Female Fertility in Rockingham County
Fertility by Age in Rockingham County
Average fertility rate in Rockingham County is 41.0 births per 1,000 women. Women in the age bracket of 20 to 34 years have the highest fertility rate with 78.0 births per 1,000 women. Women in the age bracket of 20 to 34 years acount for 77.7% of all women with births.
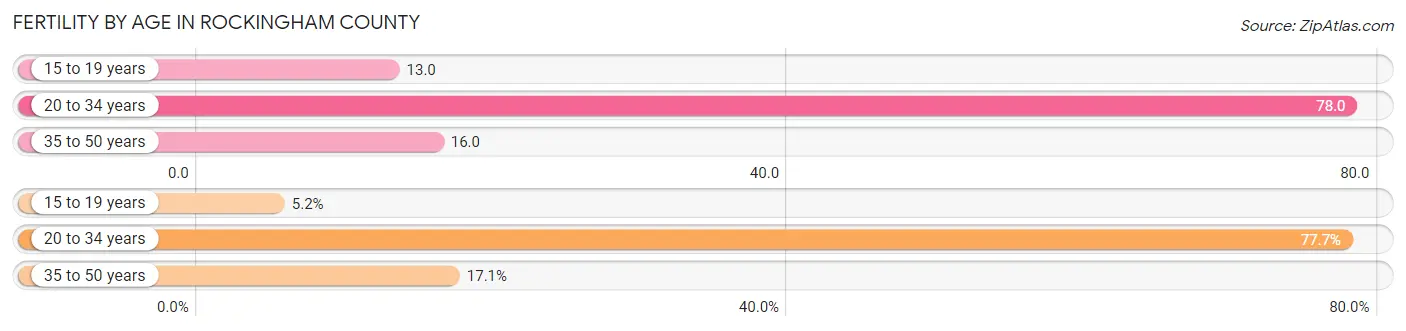
| Age Bracket | Women with Births | Births / 1,000 Women |
| 15 to 19 years | 39 (5.2%) | 13.0 |
| 20 to 34 years | 582 (77.7%) | 78.0 |
| 35 to 50 years | 128 (17.1%) | 16.0 |
| Total | 749 (100.0%) | 41.0 |
Fertility by Age by Marriage Status in Rockingham County
74.1% of women with births (749) in Rockingham County are married. The highest percentage of unmarried women with births falls into 15 to 19 years age bracket with 100.0% of them unmarried at the time of birth, while the lowest percentage of unmarried women with births belong to 35 to 50 years age bracket with 5.5% of them unmarried.
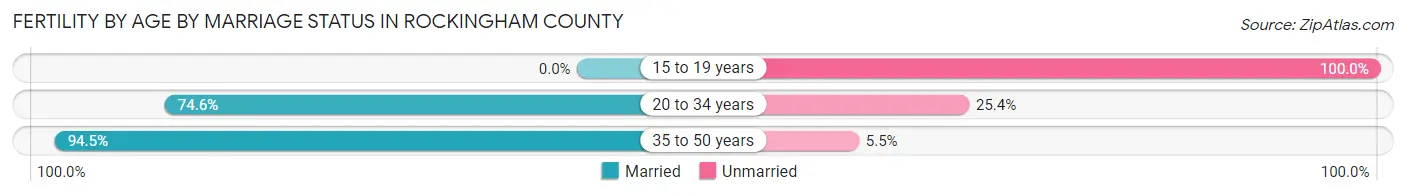
| Age Bracket | Married | Unmarried |
| 15 to 19 years | 0 (0.0%) | 39 (100.0%) |
| 20 to 34 years | 434 (74.6%) | 148 (25.4%) |
| 35 to 50 years | 121 (94.5%) | 7 (5.5%) |
| Total | 555 (74.1%) | 194 (25.9%) |
Fertility by Education in Rockingham County
Average fertility rate in Rockingham County is 41.0 births per 1,000 women. Women with the education attainment of bachelor's degree have the highest fertility rate of 70.0 births per 1,000 women, while women with the education attainment of less than high school have the lowest fertility at 15.0 births per 1,000 women. Women with the education attainment of bachelor's degree represent 29.8% of all women with births.
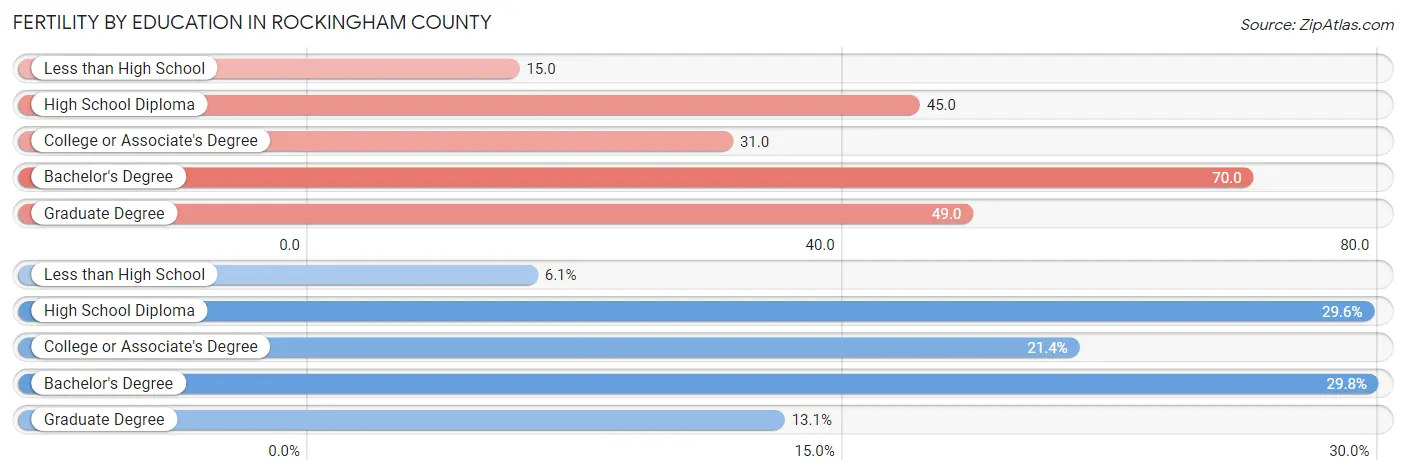
| Educational Attainment | Women with Births | Births / 1,000 Women |
| Less than High School | 46 (6.1%) | 15.0 |
| High School Diploma | 222 (29.6%) | 45.0 |
| College or Associate's Degree | 160 (21.4%) | 31.0 |
| Bachelor's Degree | 223 (29.8%) | 70.0 |
| Graduate Degree | 98 (13.1%) | 49.0 |
| Total | 749 (100.0%) | 41.0 |
Fertility by Education by Marriage Status in Rockingham County
25.9% of women with births in Rockingham County are unmarried. Women with the educational attainment of graduate degree are most likely to be married with 100.0% of them married at childbirth, while women with the educational attainment of high school diploma are least likely to be married with 55.9% of them unmarried at childbirth.
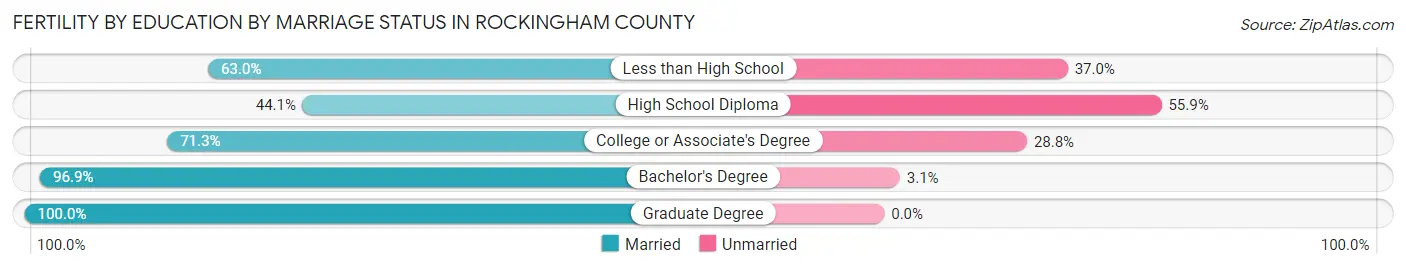
| Educational Attainment | Married | Unmarried |
| Less than High School | 29 (63.0%) | 17 (37.0%) |
| High School Diploma | 98 (44.1%) | 124 (55.9%) |
| College or Associate's Degree | 114 (71.3%) | 46 (28.7%) |
| Bachelor's Degree | 216 (96.9%) | 7 (3.1%) |
| Graduate Degree | 98 (100.0%) | 0 (0.0%) |
| Total | 555 (74.1%) | 194 (25.9%) |
Employment Characteristics in Rockingham County
Employment by Class of Employer in Rockingham County
Among the 41,338 employed individuals in Rockingham County, private company employees (26,480 | 64.1%), local government employees (3,686 | 8.9%), and not-for-profit organizations (3,623 | 8.8%) make up the most common classes of employment.
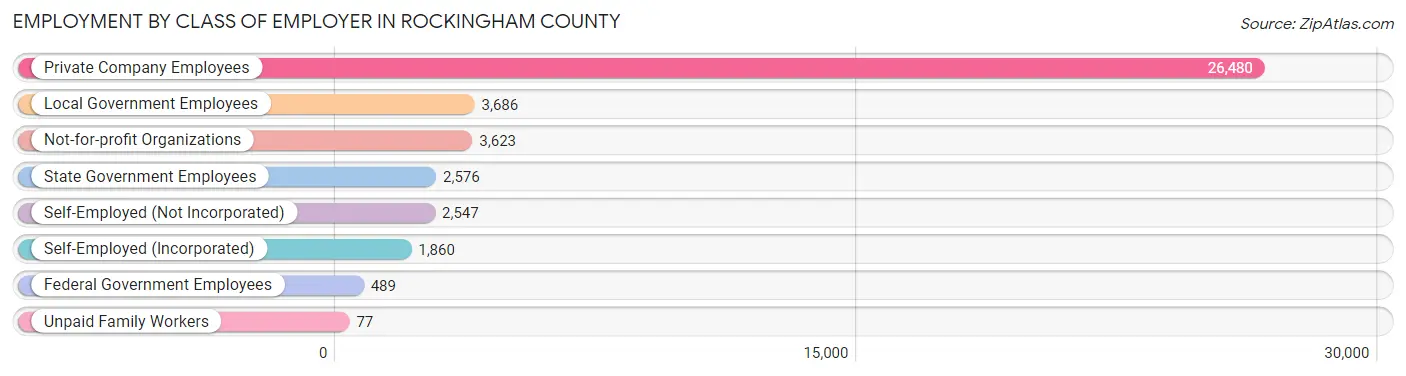
| Employer Class | # Employees | % Employees |
| Private Company Employees | 26,480 | 64.1% |
| Self-Employed (Incorporated) | 1,860 | 4.5% |
| Self-Employed (Not Incorporated) | 2,547 | 6.2% |
| Not-for-profit Organizations | 3,623 | 8.8% |
| Local Government Employees | 3,686 | 8.9% |
| State Government Employees | 2,576 | 6.2% |
| Federal Government Employees | 489 | 1.2% |
| Unpaid Family Workers | 77 | 0.2% |
| Total | 41,338 | 100.0% |
Employment Status by Age in Rockingham County
According to the labor force statistics for Rockingham County, out of the total population over 16 years of age (67,888), 63.5% or 43,109 individuals are in the labor force, with 2.8% or 1,207 of them unemployed. The age group with the highest labor force participation rate is 35 to 44 years, with 86.5% or 8,543 individuals in the labor force. Within the labor force, the 25 to 29 years age range has the highest percentage of unemployed individuals, with 7.5% or 299 of them being unemployed.
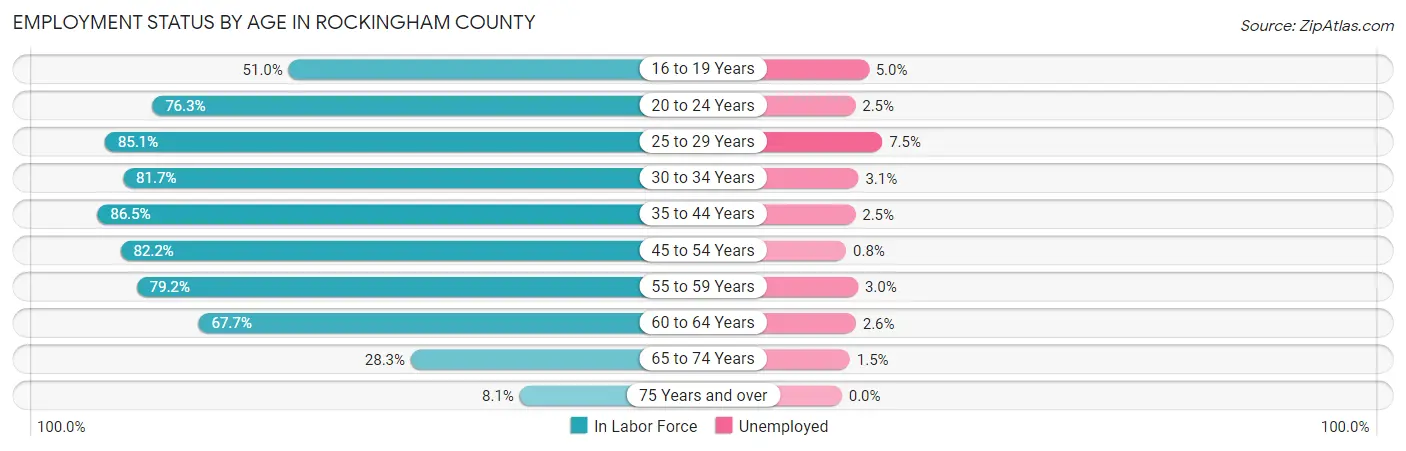
| Age Bracket | In Labor Force | Unemployed |
| 16 to 19 Years | 2,532 (51.0%) | 127 (5.0%) |
| 20 to 24 Years | 4,187 (76.3%) | 105 (2.5%) |
| 25 to 29 Years | 3,982 (85.1%) | 299 (7.5%) |
| 30 to 34 Years | 4,030 (81.7%) | 125 (3.1%) |
| 35 to 44 Years | 8,543 (86.5%) | 214 (2.5%) |
| 45 to 54 Years | 8,226 (82.2%) | 66 (0.8%) |
| 55 to 59 Years | 4,603 (79.2%) | 138 (3.0%) |
| 60 to 64 Years | 3,851 (67.7%) | 100 (2.6%) |
| 65 to 74 Years | 2,593 (28.3%) | 39 (1.5%) |
| 75 Years and over | 590 (8.1%) | 0 (0.0%) |
| Total | 43,109 (63.5%) | 1,207 (2.8%) |
Employment Status by Educational Attainment in Rockingham County
According to labor force statistics for Rockingham County, 81.1% of individuals (33,248) out of the total population between 25 and 64 years of age (40,996) are in the labor force, with 2.8% or 931 of them being unemployed. The group with the highest labor force participation rate are those with the educational attainment of bachelor's degree or higher, with 88.2% or 10,883 individuals in the labor force. Within the labor force, individuals with bachelor's degree or higher education have the highest percentage of unemployment, with 3.6% or 392 of them being unemployed.
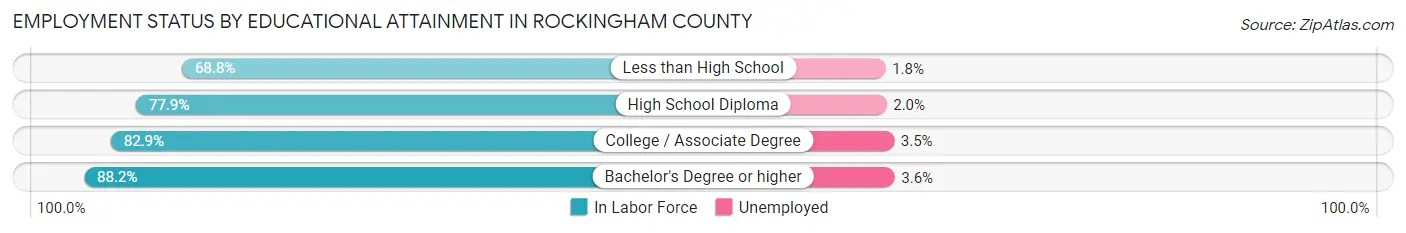
| Educational Attainment | In Labor Force | Unemployed |
| Less than High School | 3,212 (68.8%) | 84 (1.8%) |
| High School Diploma | 11,539 (77.9%) | 296 (2.0%) |
| College / Associate Degree | 7,606 (82.9%) | 321 (3.5%) |
| Bachelor's Degree or higher | 10,883 (88.2%) | 444 (3.6%) |
| Total | 33,248 (81.1%) | 1,148 (2.8%) |
Employment Occupations by Sex in Rockingham County
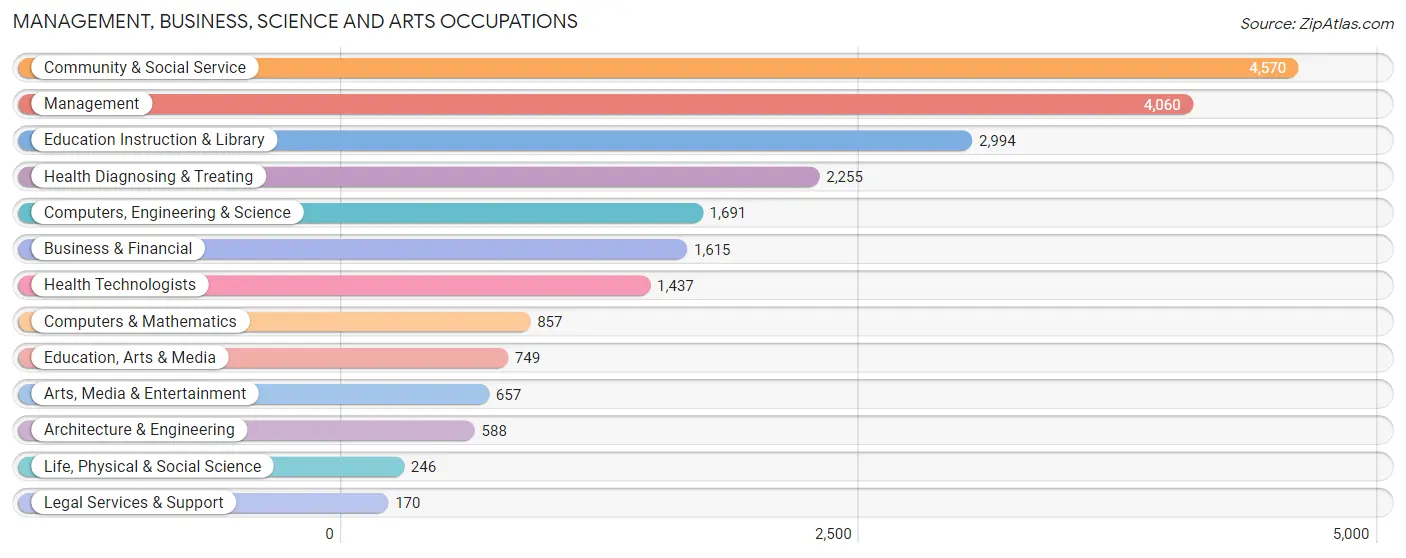
Management, Business, Science and Arts Occupations
The most common Management, Business, Science and Arts occupations in Rockingham County are Community & Social Service (4,570 | 10.9%), Management (4,060 | 9.7%), Education Instruction & Library (2,994 | 7.1%), Health Diagnosing & Treating (2,255 | 5.4%), and Computers, Engineering & Science (1,691 | 4.0%).
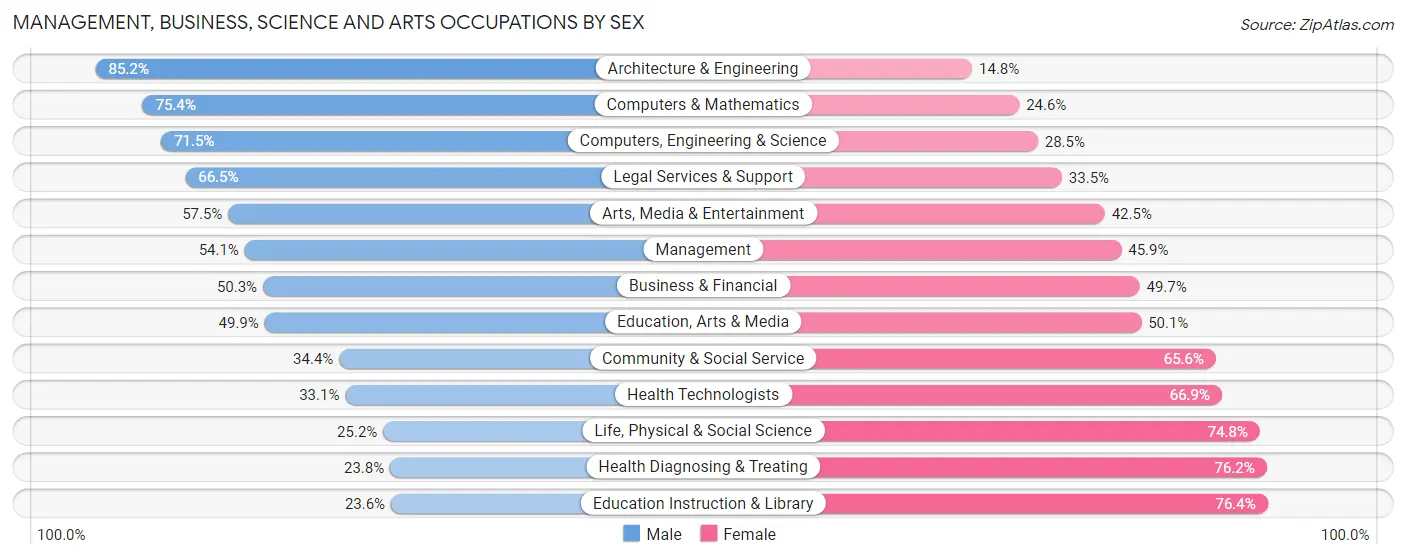
Management, Business, Science and Arts Occupations by Sex
Within the Management, Business, Science and Arts occupations in Rockingham County, the most male-oriented occupations are Architecture & Engineering (85.2%), Computers & Mathematics (75.4%), and Computers, Engineering & Science (71.5%), while the most female-oriented occupations are Education Instruction & Library (76.4%), Health Diagnosing & Treating (76.2%), and Life, Physical & Social Science (74.8%).
| Occupation | Male | Female |
| Management | 2,196 (54.1%) | 1,864 (45.9%) |
| Business & Financial | 812 (50.3%) | 803 (49.7%) |
| Computers, Engineering & Science | 1,209 (71.5%) | 482 (28.5%) |
| Computers & Mathematics | 646 (75.4%) | 211 (24.6%) |
| Architecture & Engineering | 501 (85.2%) | 87 (14.8%) |
| Life, Physical & Social Science | 62 (25.2%) | 184 (74.8%) |
| Community & Social Service | 1,571 (34.4%) | 2,999 (65.6%) |
| Education, Arts & Media | 374 (49.9%) | 375 (50.1%) |
| Legal Services & Support | 113 (66.5%) | 57 (33.5%) |
| Education Instruction & Library | 706 (23.6%) | 2,288 (76.4%) |
| Arts, Media & Entertainment | 378 (57.5%) | 279 (42.5%) |
| Health Diagnosing & Treating | 536 (23.8%) | 1,719 (76.2%) |
| Health Technologists | 476 (33.1%) | 961 (66.9%) |
| Total (Category) | 6,324 (44.6%) | 7,867 (55.4%) |
| Total (Overall) | 22,053 (52.7%) | 19,809 (47.3%) |
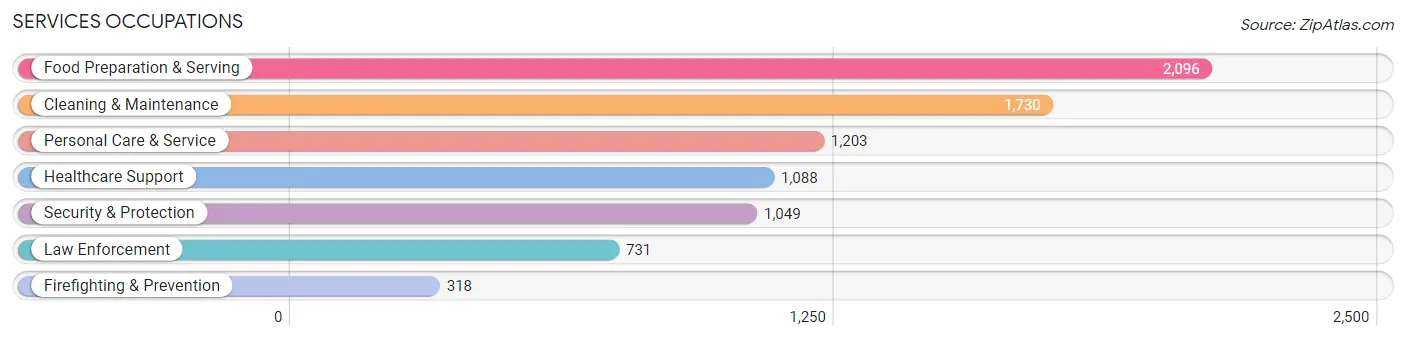
Services Occupations
The most common Services occupations in Rockingham County are Food Preparation & Serving (2,096 | 5.0%), Cleaning & Maintenance (1,730 | 4.1%), Personal Care & Service (1,203 | 2.9%), Healthcare Support (1,088 | 2.6%), and Security & Protection (1,049 | 2.5%).
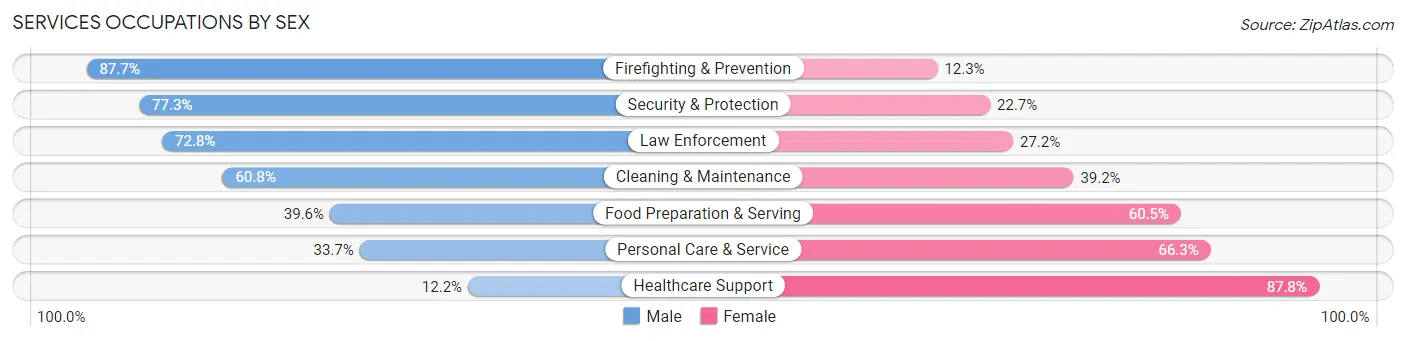
Services Occupations by Sex
Within the Services occupations in Rockingham County, the most male-oriented occupations are Firefighting & Prevention (87.7%), Security & Protection (77.3%), and Law Enforcement (72.8%), while the most female-oriented occupations are Healthcare Support (87.8%), Personal Care & Service (66.3%), and Food Preparation & Serving (60.5%).
| Occupation | Male | Female |
| Healthcare Support | 133 (12.2%) | 955 (87.8%) |
| Security & Protection | 811 (77.3%) | 238 (22.7%) |
| Firefighting & Prevention | 279 (87.7%) | 39 (12.3%) |
| Law Enforcement | 532 (72.8%) | 199 (27.2%) |
| Food Preparation & Serving | 829 (39.6%) | 1,267 (60.5%) |
| Cleaning & Maintenance | 1,052 (60.8%) | 678 (39.2%) |
| Personal Care & Service | 405 (33.7%) | 798 (66.3%) |
| Total (Category) | 3,230 (45.1%) | 3,936 (54.9%) |
| Total (Overall) | 22,053 (52.7%) | 19,809 (47.3%) |
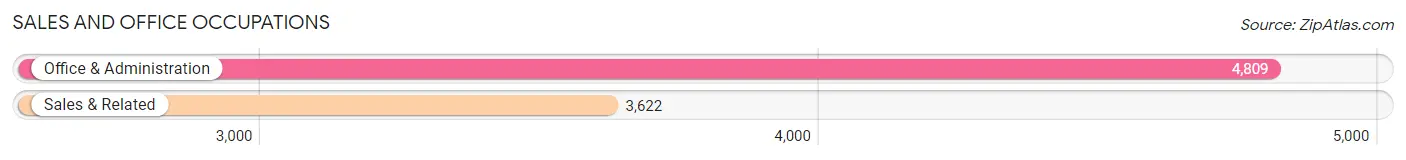
Sales and Office Occupations
The most common Sales and Office occupations in Rockingham County are Office & Administration (4,809 | 11.5%), and Sales & Related (3,622 | 8.6%).
Sales and Office Occupations by Sex
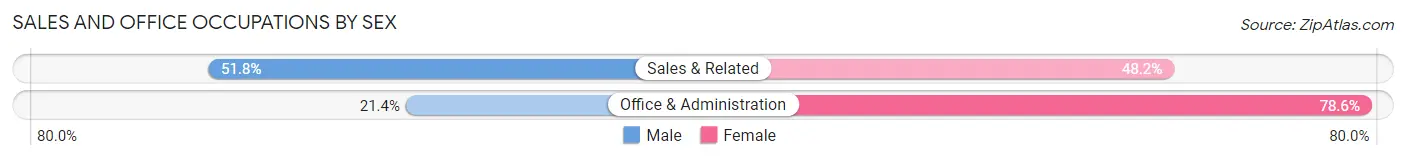
| Occupation | Male | Female |
| Sales & Related | 1,875 (51.8%) | 1,747 (48.2%) |
| Office & Administration | 1,027 (21.4%) | 3,782 (78.6%) |
| Total (Category) | 2,902 (34.4%) | 5,529 (65.6%) |
| Total (Overall) | 22,053 (52.7%) | 19,809 (47.3%) |
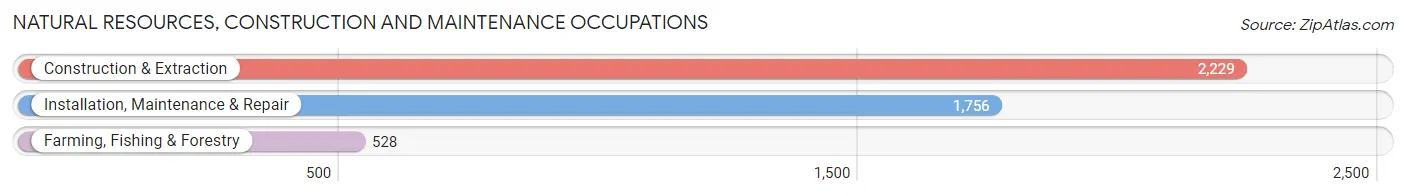
Natural Resources, Construction and Maintenance Occupations
The most common Natural Resources, Construction and Maintenance occupations in Rockingham County are Construction & Extraction (2,229 | 5.3%), Installation, Maintenance & Repair (1,756 | 4.2%), and Farming, Fishing & Forestry (528 | 1.3%).
Natural Resources, Construction and Maintenance Occupations by Sex
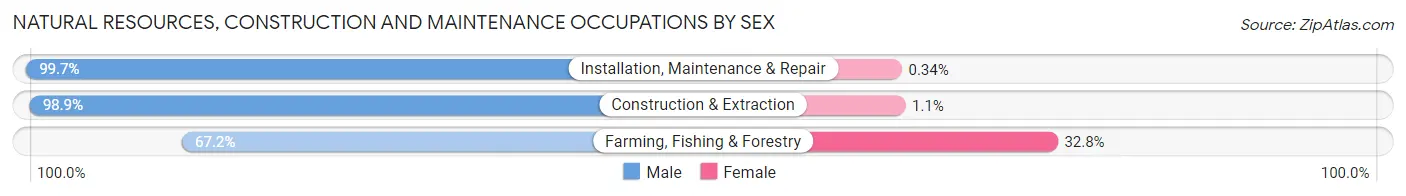
| Occupation | Male | Female |
| Farming, Fishing & Forestry | 355 (67.2%) | 173 (32.8%) |
| Construction & Extraction | 2,205 (98.9%) | 24 (1.1%) |
| Installation, Maintenance & Repair | 1,750 (99.7%) | 6 (0.3%) |
| Total (Category) | 4,310 (95.5%) | 203 (4.5%) |
| Total (Overall) | 22,053 (52.7%) | 19,809 (47.3%) |
Production, Transportation and Moving Occupations
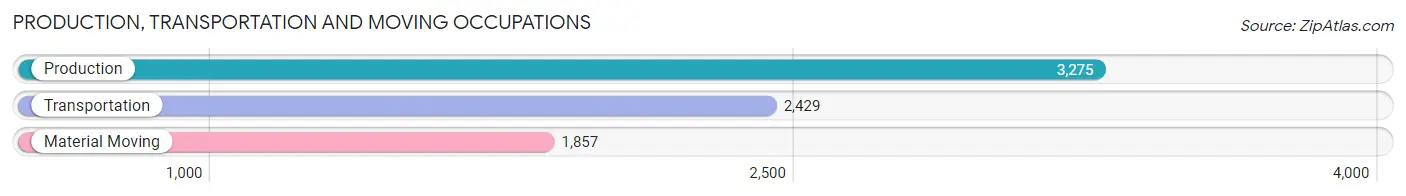
The most common Production, Transportation and Moving occupations in Rockingham County are Production (3,275 | 7.8%), Transportation (2,429 | 5.8%), and Material Moving (1,857 | 4.4%).
Production, Transportation and Moving Occupations by Sex
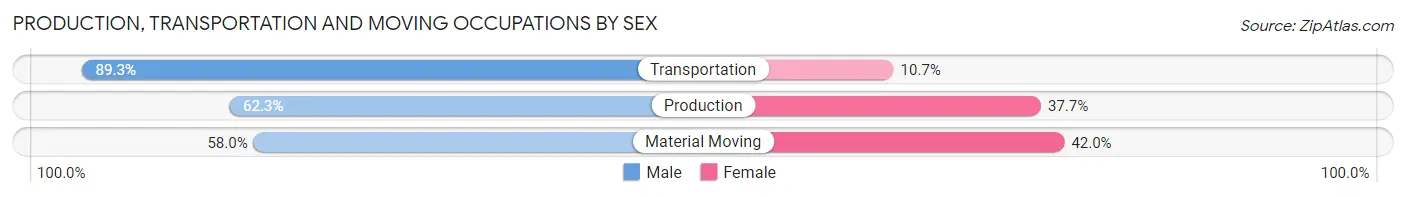
| Occupation | Male | Female |
| Production | 2,040 (62.3%) | 1,235 (37.7%) |
| Transportation | 2,170 (89.3%) | 259 (10.7%) |
| Material Moving | 1,077 (58.0%) | 780 (42.0%) |
| Total (Category) | 5,287 (69.9%) | 2,274 (30.1%) |
| Total (Overall) | 22,053 (52.7%) | 19,809 (47.3%) |
Employment Industries by Sex in Rockingham County
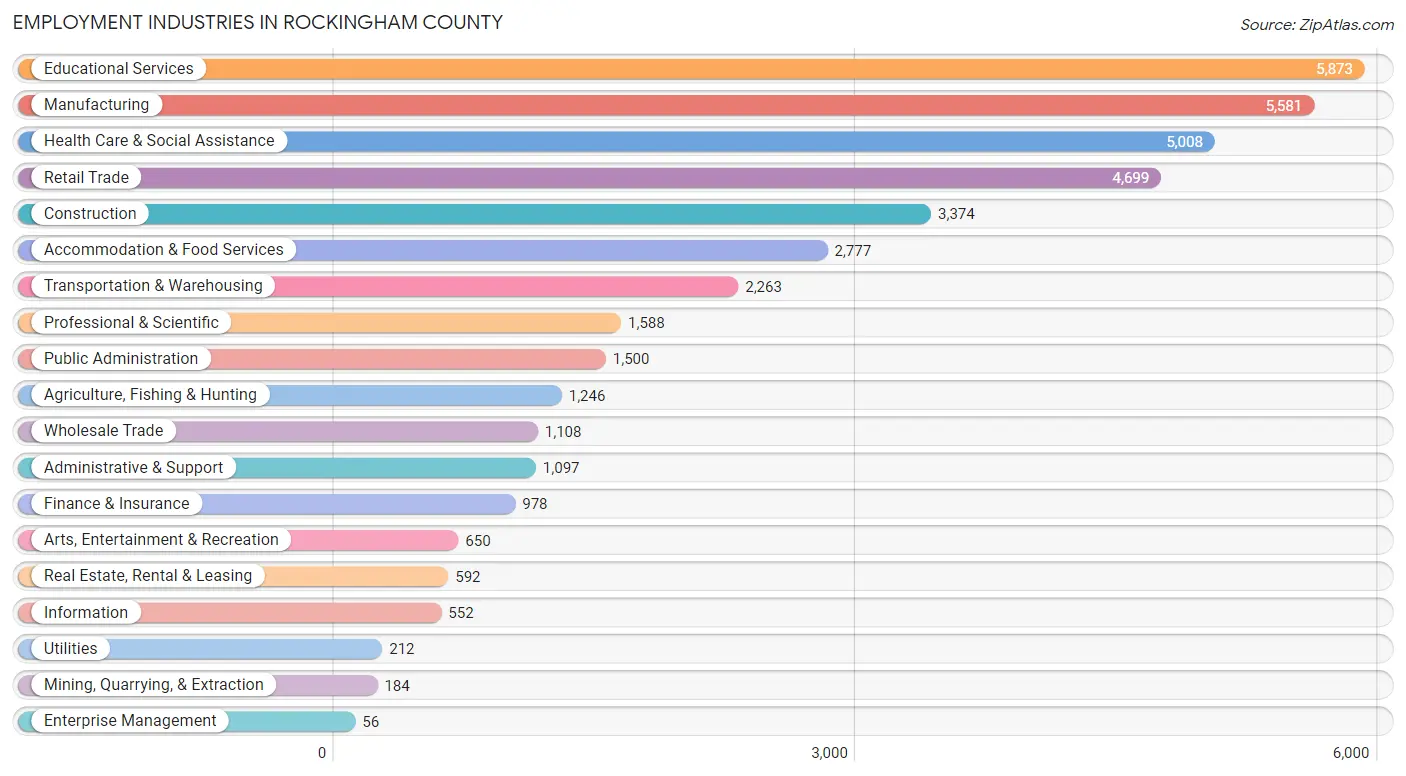
Employment Industries in Rockingham County
The major employment industries in Rockingham County include Educational Services (5,873 | 14.0%), Manufacturing (5,581 | 13.3%), Health Care & Social Assistance (5,008 | 12.0%), Retail Trade (4,699 | 11.2%), and Construction (3,374 | 8.1%).
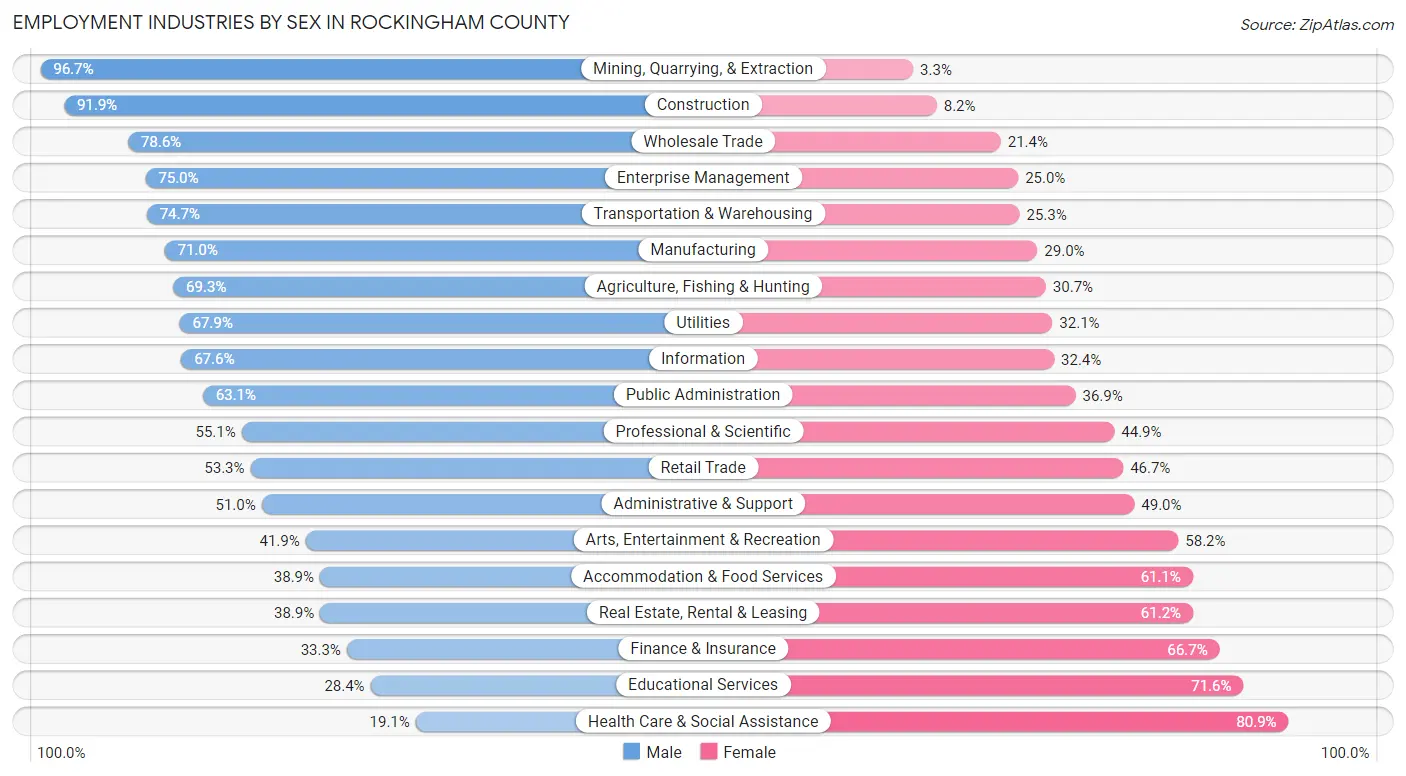
Employment Industries by Sex in Rockingham County
The Rockingham County industries that see more men than women are Mining, Quarrying, & Extraction (96.7%), Construction (91.8%), and Wholesale Trade (78.6%), whereas the industries that tend to have a higher number of women are Health Care & Social Assistance (80.9%), Educational Services (71.6%), and Finance & Insurance (66.7%).
| Industry | Male | Female |
| Agriculture, Fishing & Hunting | 863 (69.3%) | 383 (30.7%) |
| Mining, Quarrying, & Extraction | 178 (96.7%) | 6 (3.3%) |
| Construction | 3,099 (91.8%) | 275 (8.2%) |
| Manufacturing | 3,964 (71.0%) | 1,617 (29.0%) |
| Wholesale Trade | 871 (78.6%) | 237 (21.4%) |
| Retail Trade | 2,503 (53.3%) | 2,196 (46.7%) |
| Transportation & Warehousing | 1,691 (74.7%) | 572 (25.3%) |
| Utilities | 144 (67.9%) | 68 (32.1%) |
| Information | 373 (67.6%) | 179 (32.4%) |
| Finance & Insurance | 326 (33.3%) | 652 (66.7%) |
| Real Estate, Rental & Leasing | 230 (38.9%) | 362 (61.2%) |
| Professional & Scientific | 875 (55.1%) | 713 (44.9%) |
| Enterprise Management | 42 (75.0%) | 14 (25.0%) |
| Administrative & Support | 559 (51.0%) | 538 (49.0%) |
| Educational Services | 1,669 (28.4%) | 4,204 (71.6%) |
| Health Care & Social Assistance | 955 (19.1%) | 4,053 (80.9%) |
| Arts, Entertainment & Recreation | 272 (41.8%) | 378 (58.2%) |
| Accommodation & Food Services | 1,080 (38.9%) | 1,697 (61.1%) |
| Public Administration | 947 (63.1%) | 553 (36.9%) |
| Total | 22,053 (52.7%) | 19,809 (47.3%) |
Education in Rockingham County
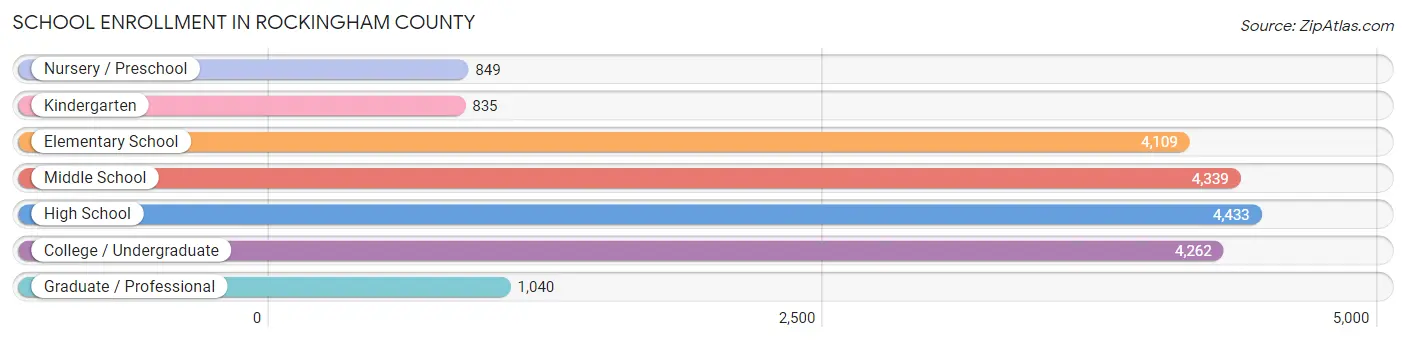
School Enrollment in Rockingham County
The most common levels of schooling among the 19,867 students in Rockingham County are high school (4,433 | 22.3%), middle school (4,339 | 21.8%), and college / undergraduate (4,262 | 21.4%).
| School Level | # Students | % Students |
| Nursery / Preschool | 849 | 4.3% |
| Kindergarten | 835 | 4.2% |
| Elementary School | 4,109 | 20.7% |
| Middle School | 4,339 | 21.8% |
| High School | 4,433 | 22.3% |
| College / Undergraduate | 4,262 | 21.4% |
| Graduate / Professional | 1,040 | 5.2% |
| Total | 19,867 | 100.0% |
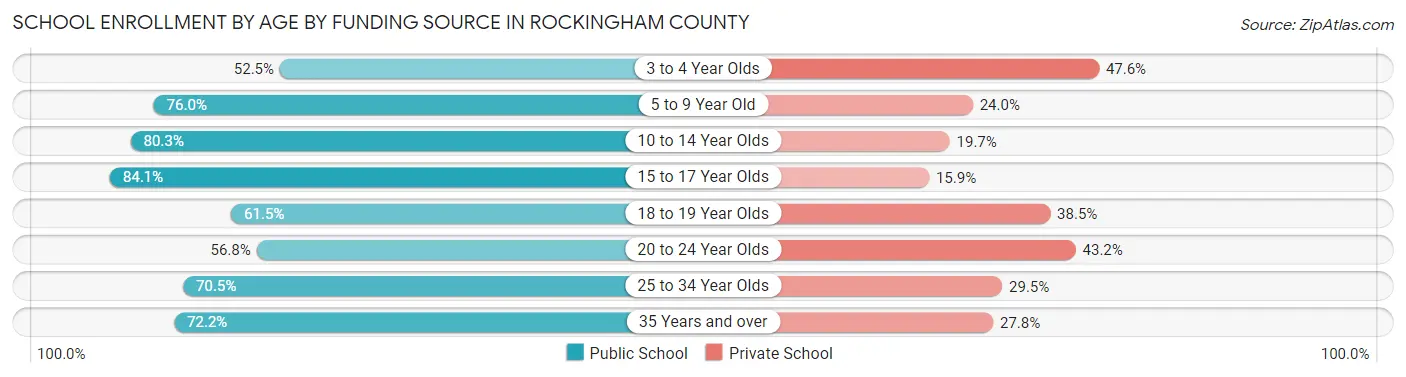
School Enrollment by Age by Funding Source in Rockingham County
Out of a total of 19,867 students who are enrolled in schools in Rockingham County, 5,265 (26.5%) attend a private institution, while the remaining 14,602 (73.5%) are enrolled in public schools. The age group of 3 to 4 year olds has the highest likelihood of being enrolled in private schools, with 311 (47.5% in the age bracket) enrolled. Conversely, the age group of 15 to 17 year olds has the lowest likelihood of being enrolled in a private school, with 2,721 (84.1% in the age bracket) attending a public institution.
| Age Bracket | Public School | Private School |
| 3 to 4 Year Olds | 343 (52.4%) | 311 (47.5%) |
| 5 to 9 Year Old | 3,464 (76.0%) | 1,096 (24.0%) |
| 10 to 14 Year Olds | 4,344 (80.3%) | 1,068 (19.7%) |
| 15 to 17 Year Olds | 2,721 (84.1%) | 514 (15.9%) |
| 18 to 19 Year Olds | 1,101 (61.5%) | 688 (38.5%) |
| 20 to 24 Year Olds | 1,496 (56.8%) | 1,138 (43.2%) |
| 25 to 34 Year Olds | 609 (70.5%) | 255 (29.5%) |
| 35 Years and over | 519 (72.2%) | 200 (27.8%) |
| Total | 14,602 (73.5%) | 5,265 (26.5%) |
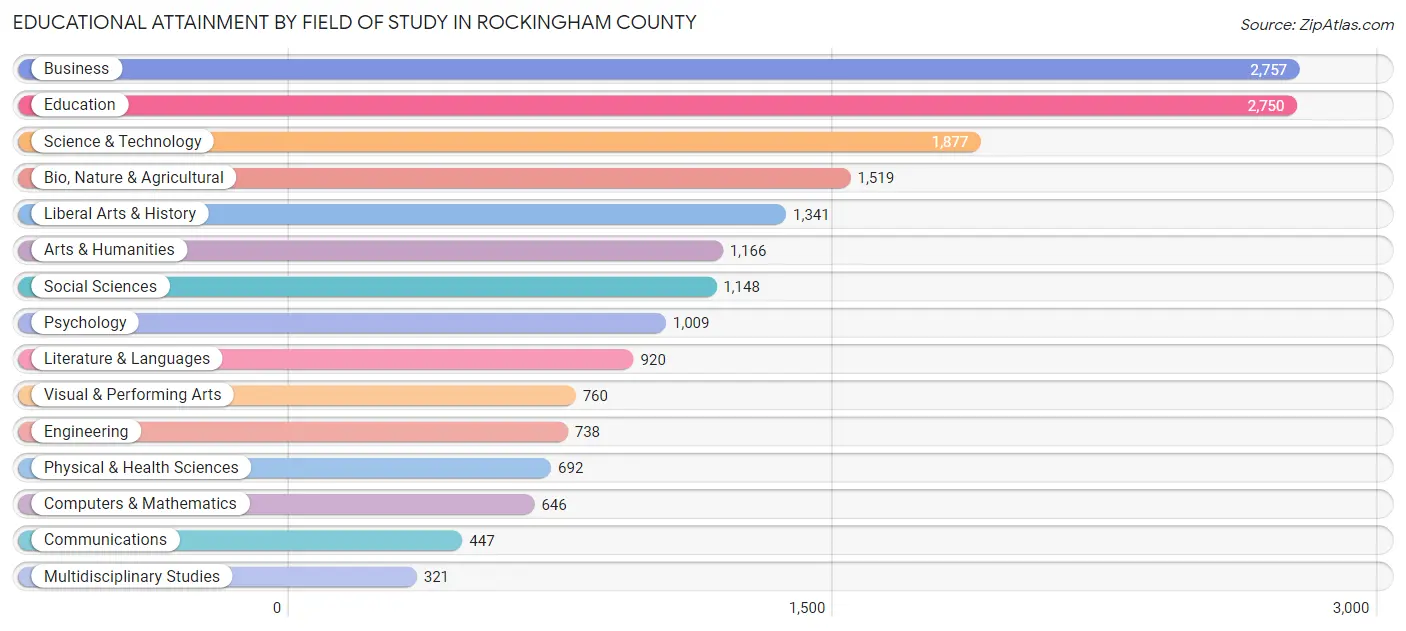
Educational Attainment by Field of Study in Rockingham County
Business (2,757 | 15.2%), education (2,750 | 15.2%), science & technology (1,877 | 10.4%), bio, nature & agricultural (1,519 | 8.4%), and liberal arts & history (1,341 | 7.4%) are the most common fields of study among 18,091 individuals in Rockingham County who have obtained a bachelor's degree or higher.
| Field of Study | # Graduates | % Graduates |
| Computers & Mathematics | 646 | 3.6% |
| Bio, Nature & Agricultural | 1,519 | 8.4% |
| Physical & Health Sciences | 692 | 3.8% |
| Psychology | 1,009 | 5.6% |
| Social Sciences | 1,148 | 6.4% |
| Engineering | 738 | 4.1% |
| Multidisciplinary Studies | 321 | 1.8% |
| Science & Technology | 1,877 | 10.4% |
| Business | 2,757 | 15.2% |
| Education | 2,750 | 15.2% |
| Literature & Languages | 920 | 5.1% |
| Liberal Arts & History | 1,341 | 7.4% |
| Visual & Performing Arts | 760 | 4.2% |
| Communications | 447 | 2.5% |
| Arts & Humanities | 1,166 | 6.5% |
| Total | 18,091 | 100.0% |
Transportation & Commute in Rockingham County
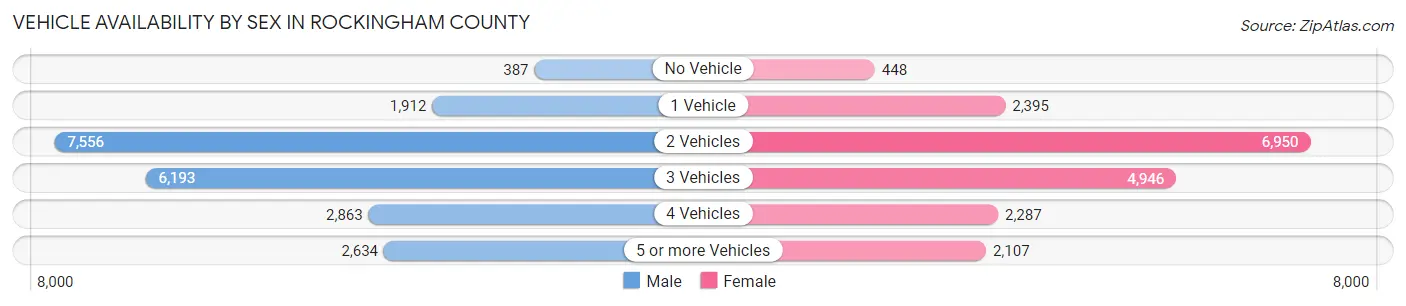
Vehicle Availability by Sex in Rockingham County
The most prevalent vehicle ownership categories in Rockingham County are males with 2 vehicles (7,556, accounting for 35.1%) and females with 2 vehicles (6,950, making up 39.5%).
| Vehicles Available | Male | Female |
| No Vehicle | 387 (1.8%) | 448 (2.3%) |
| 1 Vehicle | 1,912 (8.9%) | 2,395 (12.5%) |
| 2 Vehicles | 7,556 (35.1%) | 6,950 (36.3%) |
| 3 Vehicles | 6,193 (28.7%) | 4,946 (25.9%) |
| 4 Vehicles | 2,863 (13.3%) | 2,287 (11.9%) |
| 5 or more Vehicles | 2,634 (12.2%) | 2,107 (11.0%) |
| Total | 21,545 (100.0%) | 19,133 (100.0%) |
Commute Time in Rockingham County
The most frequently occuring commute durations in Rockingham County are 15 to 19 minutes (6,742 commuters, 17.5%), 20 to 24 minutes (6,133 commuters, 15.9%), and 10 to 14 minutes (5,653 commuters, 14.7%).
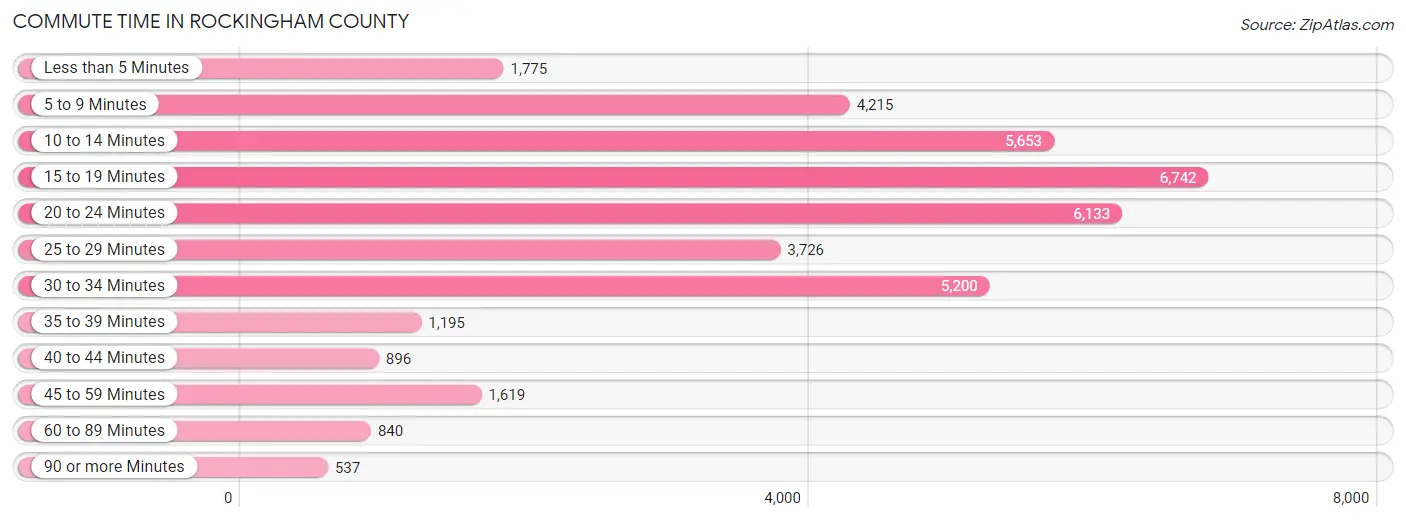
| Commute Time | # Commuters | % Commuters |
| Less than 5 Minutes | 1,775 | 4.6% |
| 5 to 9 Minutes | 4,215 | 10.9% |
| 10 to 14 Minutes | 5,653 | 14.7% |
| 15 to 19 Minutes | 6,742 | 17.5% |
| 20 to 24 Minutes | 6,133 | 15.9% |
| 25 to 29 Minutes | 3,726 | 9.7% |
| 30 to 34 Minutes | 5,200 | 13.5% |
| 35 to 39 Minutes | 1,195 | 3.1% |
| 40 to 44 Minutes | 896 | 2.3% |
| 45 to 59 Minutes | 1,619 | 4.2% |
| 60 to 89 Minutes | 840 | 2.2% |
| 90 or more Minutes | 537 | 1.4% |
Commute Time by Sex in Rockingham County
The most common commute times in Rockingham County are 15 to 19 minutes (3,379 commuters, 16.4%) for males and 15 to 19 minutes (3,363 commuters, 18.8%) for females.
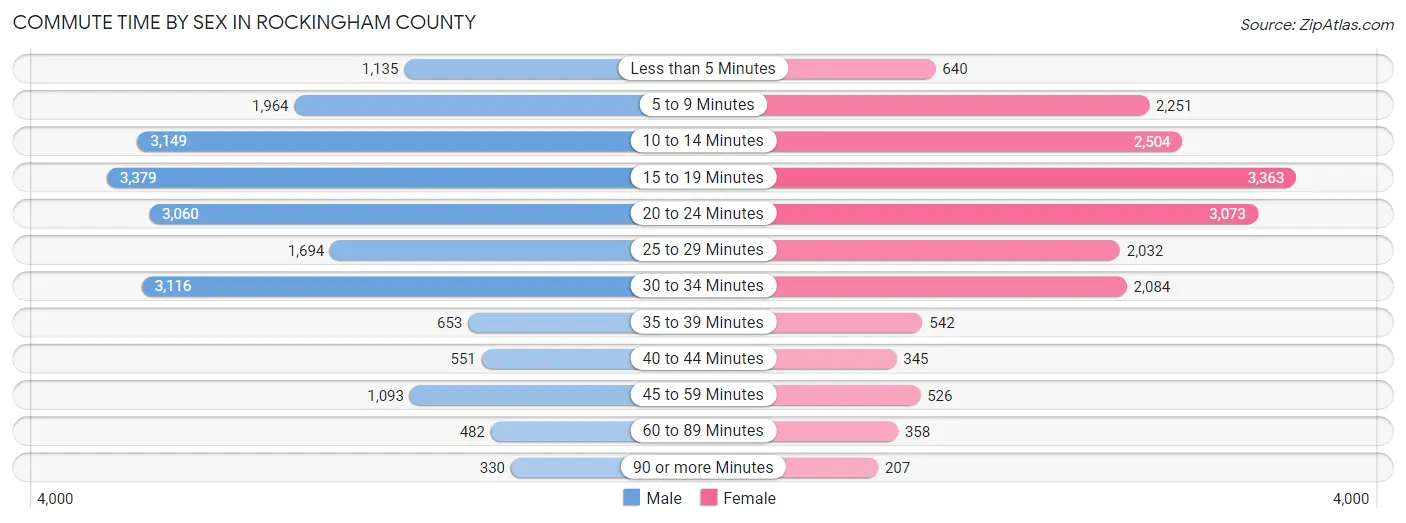
| Commute Time | Male | Female |
| Less than 5 Minutes | 1,135 (5.5%) | 640 (3.6%) |
| 5 to 9 Minutes | 1,964 (9.5%) | 2,251 (12.6%) |
| 10 to 14 Minutes | 3,149 (15.3%) | 2,504 (14.0%) |
| 15 to 19 Minutes | 3,379 (16.4%) | 3,363 (18.8%) |
| 20 to 24 Minutes | 3,060 (14.8%) | 3,073 (17.1%) |
| 25 to 29 Minutes | 1,694 (8.2%) | 2,032 (11.3%) |
| 30 to 34 Minutes | 3,116 (15.1%) | 2,084 (11.6%) |
| 35 to 39 Minutes | 653 (3.2%) | 542 (3.0%) |
| 40 to 44 Minutes | 551 (2.7%) | 345 (1.9%) |
| 45 to 59 Minutes | 1,093 (5.3%) | 526 (2.9%) |
| 60 to 89 Minutes | 482 (2.3%) | 358 (2.0%) |
| 90 or more Minutes | 330 (1.6%) | 207 (1.1%) |
Time of Departure to Work by Sex in Rockingham County
The most frequent times of departure to work in Rockingham County are 7:00 AM to 7:29 AM (2,879, 14.0%) for males and 7:30 AM to 7:59 AM (3,646, 20.3%) for females.
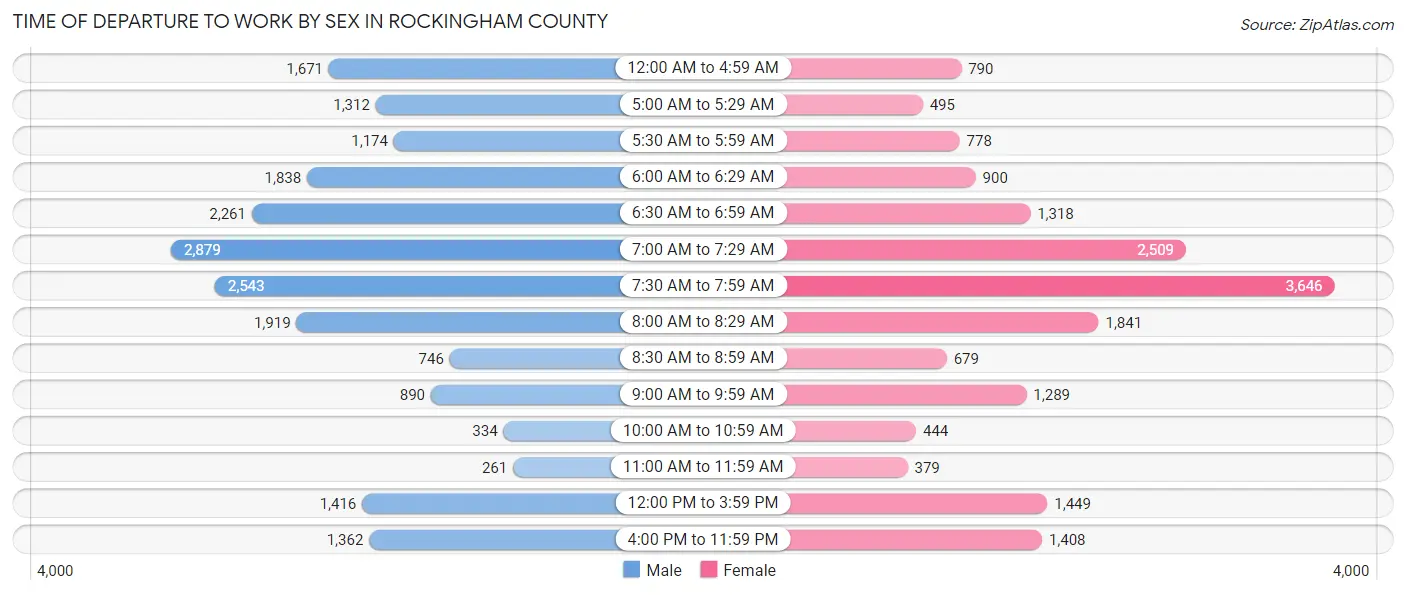
| Time of Departure | Male | Female |
| 12:00 AM to 4:59 AM | 1,671 (8.1%) | 790 (4.4%) |
| 5:00 AM to 5:29 AM | 1,312 (6.4%) | 495 (2.8%) |
| 5:30 AM to 5:59 AM | 1,174 (5.7%) | 778 (4.3%) |
| 6:00 AM to 6:29 AM | 1,838 (8.9%) | 900 (5.0%) |
| 6:30 AM to 6:59 AM | 2,261 (11.0%) | 1,318 (7.3%) |
| 7:00 AM to 7:29 AM | 2,879 (14.0%) | 2,509 (14.0%) |
| 7:30 AM to 7:59 AM | 2,543 (12.3%) | 3,646 (20.3%) |
| 8:00 AM to 8:29 AM | 1,919 (9.3%) | 1,841 (10.3%) |
| 8:30 AM to 8:59 AM | 746 (3.6%) | 679 (3.8%) |
| 9:00 AM to 9:59 AM | 890 (4.3%) | 1,289 (7.2%) |
| 10:00 AM to 10:59 AM | 334 (1.6%) | 444 (2.5%) |
| 11:00 AM to 11:59 AM | 261 (1.3%) | 379 (2.1%) |
| 12:00 PM to 3:59 PM | 1,416 (6.9%) | 1,449 (8.1%) |
| 4:00 PM to 11:59 PM | 1,362 (6.6%) | 1,408 (7.9%) |
| Total | 20,606 (100.0%) | 17,925 (100.0%) |
Housing Occupancy in Rockingham County
Occupancy by Ownership in Rockingham County
Of the total 31,612 dwellings in Rockingham County, owner-occupied units account for 23,785 (75.2%), while renter-occupied units make up 7,827 (24.8%).
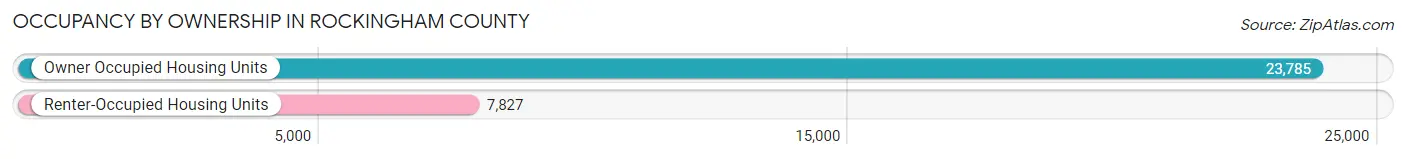
| Occupancy | # Housing Units | % Housing Units |
| Owner Occupied Housing Units | 23,785 | 75.2% |
| Renter-Occupied Housing Units | 7,827 | 24.8% |
| Total Occupied Housing Units | 31,612 | 100.0% |
Occupancy by Household Size in Rockingham County
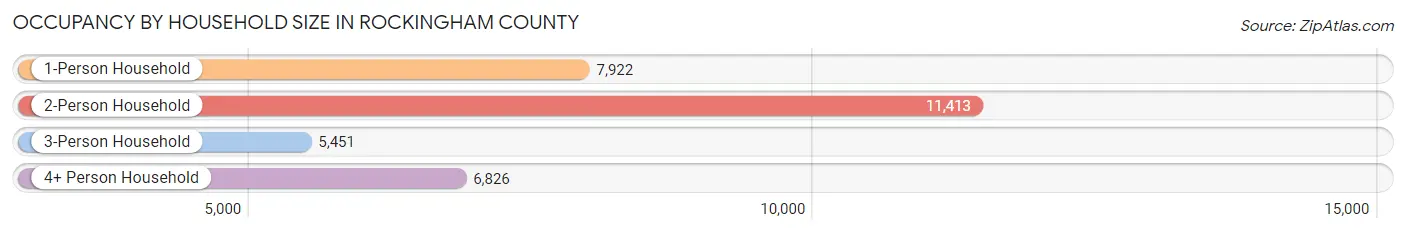
| Household Size | # Housing Units | % Housing Units |
| 1-Person Household | 7,922 | 25.1% |
| 2-Person Household | 11,413 | 36.1% |
| 3-Person Household | 5,451 | 17.2% |
| 4+ Person Household | 6,826 | 21.6% |
| Total Housing Units | 31,612 | 100.0% |
Occupancy by Ownership by Household Size in Rockingham County
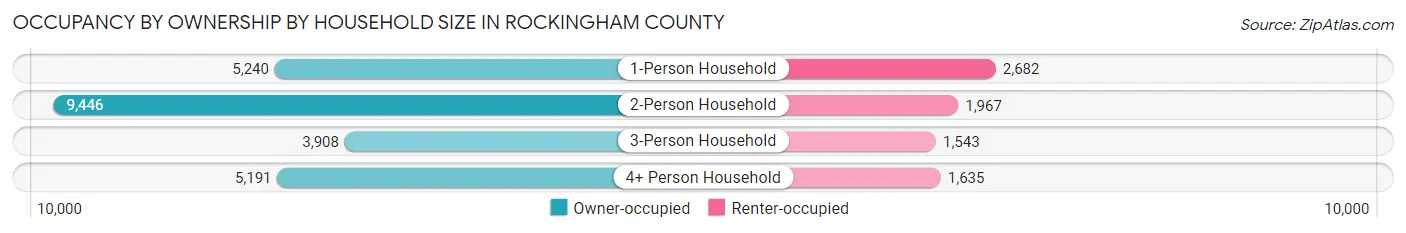
| Household Size | Owner-occupied | Renter-occupied |
| 1-Person Household | 5,240 (66.1%) | 2,682 (33.9%) |
| 2-Person Household | 9,446 (82.8%) | 1,967 (17.2%) |
| 3-Person Household | 3,908 (71.7%) | 1,543 (28.3%) |
| 4+ Person Household | 5,191 (76.0%) | 1,635 (23.9%) |
| Total Housing Units | 23,785 (75.2%) | 7,827 (24.8%) |
Occupancy by Educational Attainment in Rockingham County
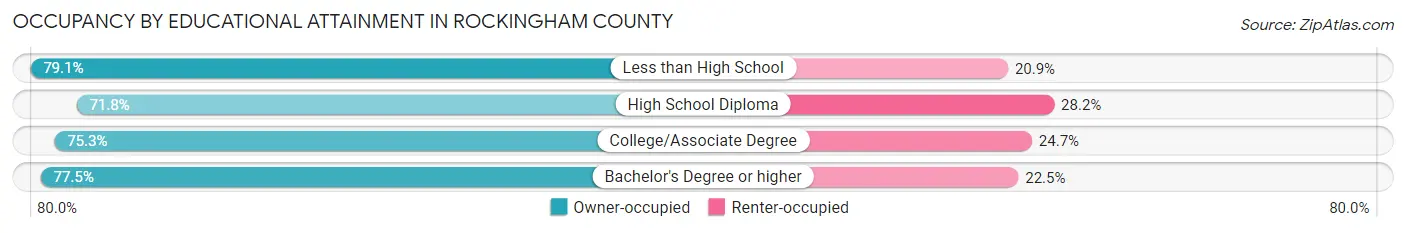
| Household Size | Owner-occupied | Renter-occupied |
| Less than High School | 2,691 (79.1%) | 711 (20.9%) |
| High School Diploma | 7,366 (71.8%) | 2,897 (28.2%) |
| College/Associate Degree | 6,041 (75.3%) | 1,982 (24.7%) |
| Bachelor's Degree or higher | 7,687 (77.5%) | 2,237 (22.5%) |
Occupancy by Age of Householder in Rockingham County
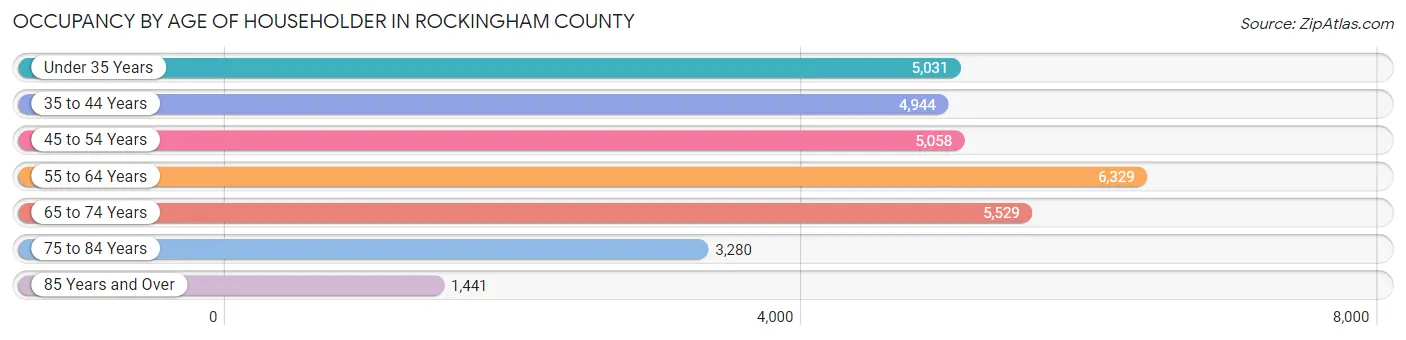
| Age Bracket | # Households | % Households |
| Under 35 Years | 5,031 | 15.9% |
| 35 to 44 Years | 4,944 | 15.6% |
| 45 to 54 Years | 5,058 | 16.0% |
| 55 to 64 Years | 6,329 | 20.0% |
| 65 to 74 Years | 5,529 | 17.5% |
| 75 to 84 Years | 3,280 | 10.4% |
| 85 Years and Over | 1,441 | 4.6% |
| Total | 31,612 | 100.0% |
Housing Finances in Rockingham County
Median Income by Occupancy in Rockingham County
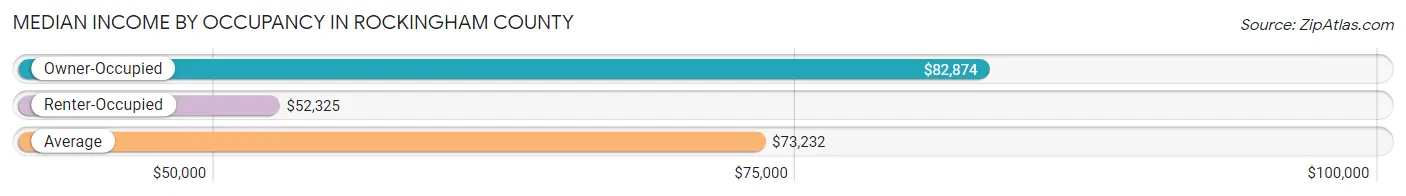
| Occupancy Type | # Households | Median Income |
| Owner-Occupied | 23,785 (75.2%) | $82,874 |
| Renter-Occupied | 7,827 (24.8%) | $52,325 |
| Average | 31,612 (100.0%) | $73,232 |
Occupancy by Householder Income Bracket in Rockingham County
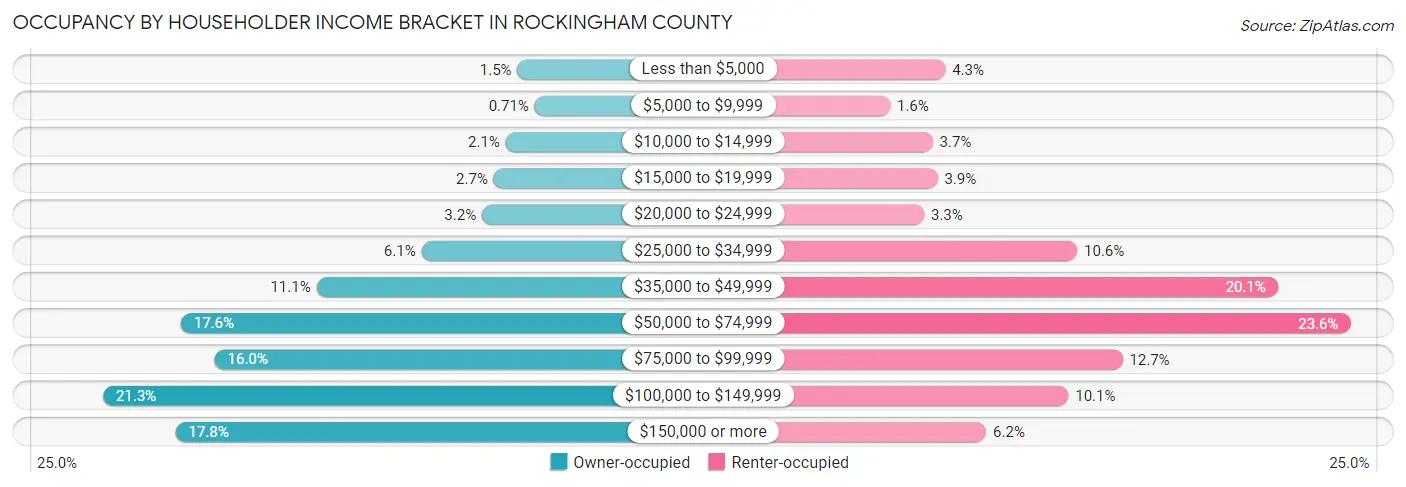
| Income Bracket | Owner-occupied | Renter-occupied |
| Less than $5,000 | 364 (1.5%) | 334 (4.3%) |
| $5,000 to $9,999 | 168 (0.7%) | 128 (1.6%) |
| $10,000 to $14,999 | 497 (2.1%) | 287 (3.7%) |
| $15,000 to $19,999 | 632 (2.7%) | 305 (3.9%) |
| $20,000 to $24,999 | 766 (3.2%) | 255 (3.3%) |
| $25,000 to $34,999 | 1,451 (6.1%) | 826 (10.5%) |
| $35,000 to $49,999 | 2,641 (11.1%) | 1,573 (20.1%) |
| $50,000 to $74,999 | 4,177 (17.6%) | 1,844 (23.6%) |
| $75,000 to $99,999 | 3,794 (16.0%) | 995 (12.7%) |
| $100,000 to $149,999 | 5,058 (21.3%) | 793 (10.1%) |
| $150,000 or more | 4,237 (17.8%) | 487 (6.2%) |
| Total | 23,785 (100.0%) | 7,827 (100.0%) |
Monthly Housing Cost Tiers in Rockingham County
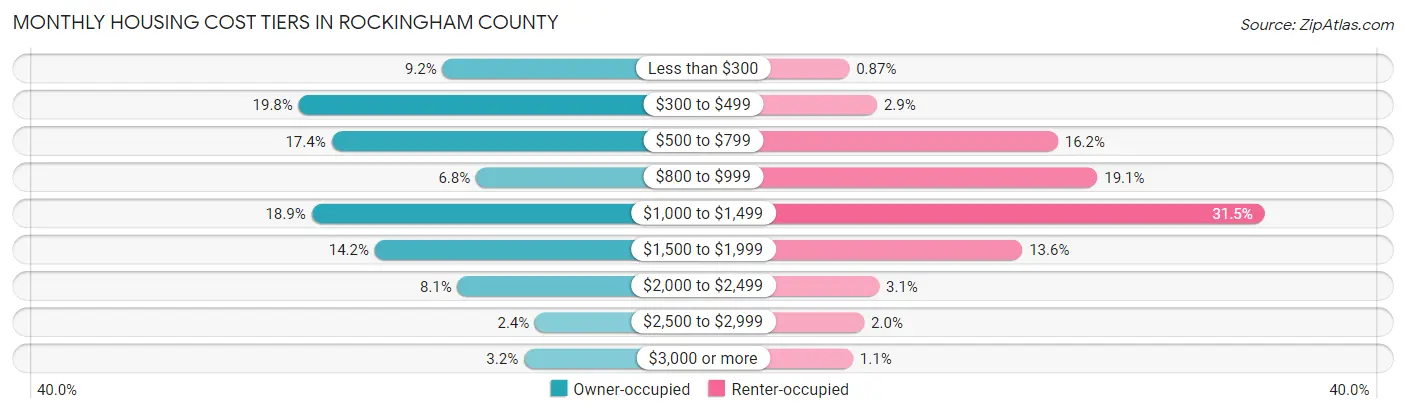
| Monthly Cost | Owner-occupied | Renter-occupied |
| Less than $300 | 2,194 (9.2%) | 68 (0.9%) |
| $300 to $499 | 4,715 (19.8%) | 228 (2.9%) |
| $500 to $799 | 4,138 (17.4%) | 1,270 (16.2%) |
| $800 to $999 | 1,606 (6.8%) | 1,498 (19.1%) |
| $1,000 to $1,499 | 4,488 (18.9%) | 2,462 (31.5%) |
| $1,500 to $1,999 | 3,380 (14.2%) | 1,065 (13.6%) |
| $2,000 to $2,499 | 1,928 (8.1%) | 240 (3.1%) |
| $2,500 to $2,999 | 571 (2.4%) | 154 (2.0%) |
| $3,000 or more | 765 (3.2%) | 89 (1.1%) |
| Total | 23,785 (100.0%) | 7,827 (100.0%) |
Physical Housing Characteristics in Rockingham County
Housing Structures in Rockingham County
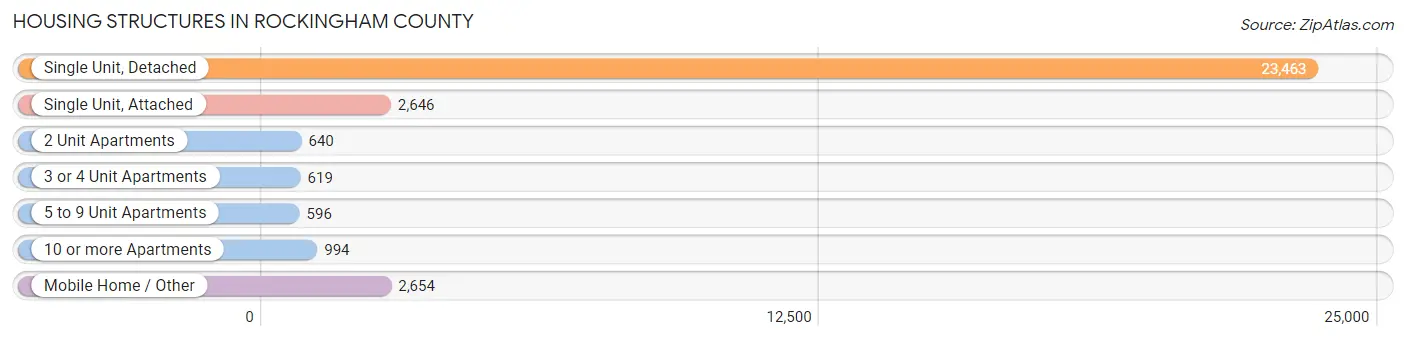
| Structure Type | # Housing Units | % Housing Units |
| Single Unit, Detached | 23,463 | 74.2% |
| Single Unit, Attached | 2,646 | 8.4% |
| 2 Unit Apartments | 640 | 2.0% |
| 3 or 4 Unit Apartments | 619 | 2.0% |
| 5 to 9 Unit Apartments | 596 | 1.9% |
| 10 or more Apartments | 994 | 3.1% |
| Mobile Home / Other | 2,654 | 8.4% |
| Total | 31,612 | 100.0% |
Housing Structures by Occupancy in Rockingham County
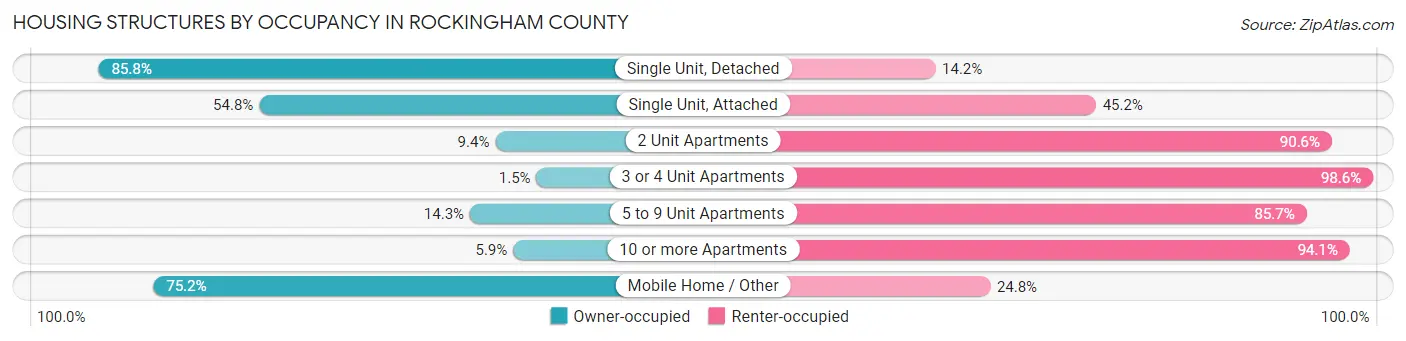
| Structure Type | Owner-occupied | Renter-occupied |
| Single Unit, Detached | 20,125 (85.8%) | 3,338 (14.2%) |
| Single Unit, Attached | 1,451 (54.8%) | 1,195 (45.2%) |
| 2 Unit Apartments | 60 (9.4%) | 580 (90.6%) |
| 3 or 4 Unit Apartments | 9 (1.5%) | 610 (98.6%) |
| 5 to 9 Unit Apartments | 85 (14.3%) | 511 (85.7%) |
| 10 or more Apartments | 59 (5.9%) | 935 (94.1%) |
| Mobile Home / Other | 1,996 (75.2%) | 658 (24.8%) |
| Total | 23,785 (75.2%) | 7,827 (24.8%) |
Housing Structures by Number of Rooms in Rockingham County
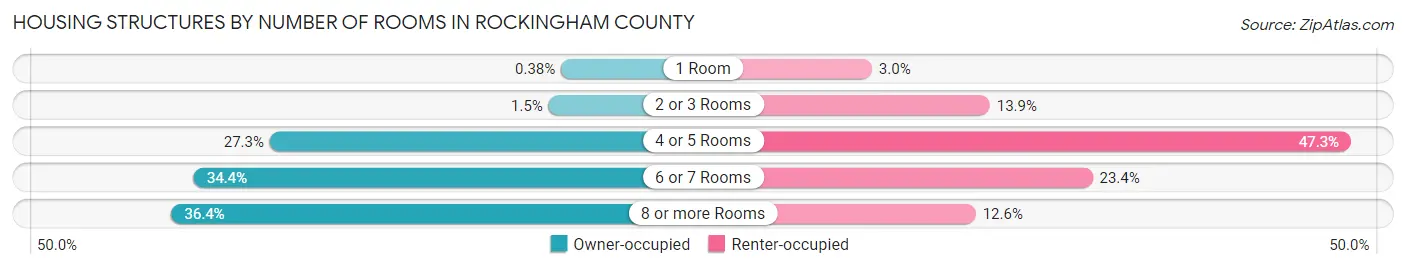
| Number of Rooms | Owner-occupied | Renter-occupied |
| 1 Room | 90 (0.4%) | 232 (3.0%) |
| 2 or 3 Rooms | 363 (1.5%) | 1,085 (13.9%) |
| 4 or 5 Rooms | 6,498 (27.3%) | 3,699 (47.3%) |
| 6 or 7 Rooms | 8,171 (34.4%) | 1,828 (23.4%) |
| 8 or more Rooms | 8,663 (36.4%) | 983 (12.6%) |
| Total | 23,785 (100.0%) | 7,827 (100.0%) |
Housing Structure by Heating Type in Rockingham County
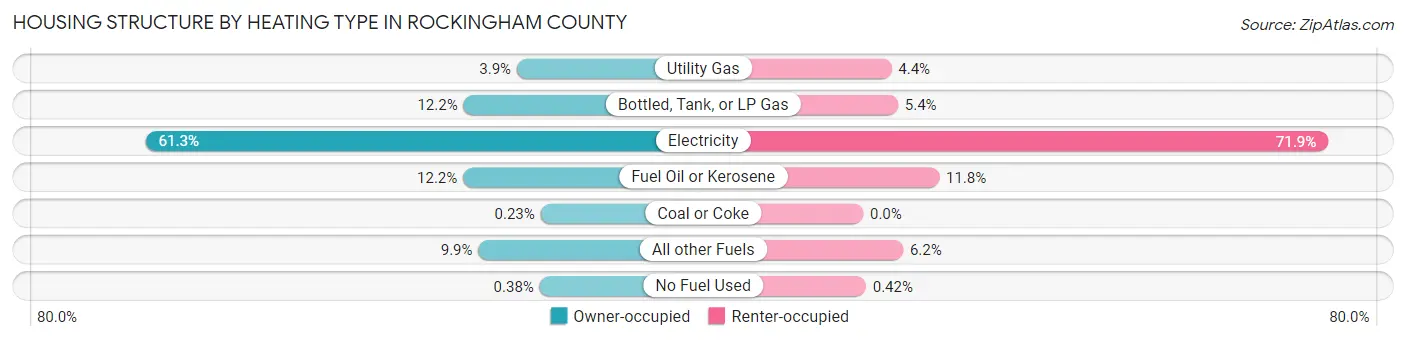
| Heating Type | Owner-occupied | Renter-occupied |
| Utility Gas | 925 (3.9%) | 343 (4.4%) |
| Bottled, Tank, or LP Gas | 2,890 (12.1%) | 421 (5.4%) |
| Electricity | 14,576 (61.3%) | 5,627 (71.9%) |
| Fuel Oil or Kerosene | 2,905 (12.2%) | 920 (11.7%) |
| Coal or Coke | 54 (0.2%) | 0 (0.0%) |
| All other Fuels | 2,344 (9.9%) | 483 (6.2%) |
| No Fuel Used | 91 (0.4%) | 33 (0.4%) |
| Total | 23,785 (100.0%) | 7,827 (100.0%) |
Household Vehicle Usage in Rockingham County
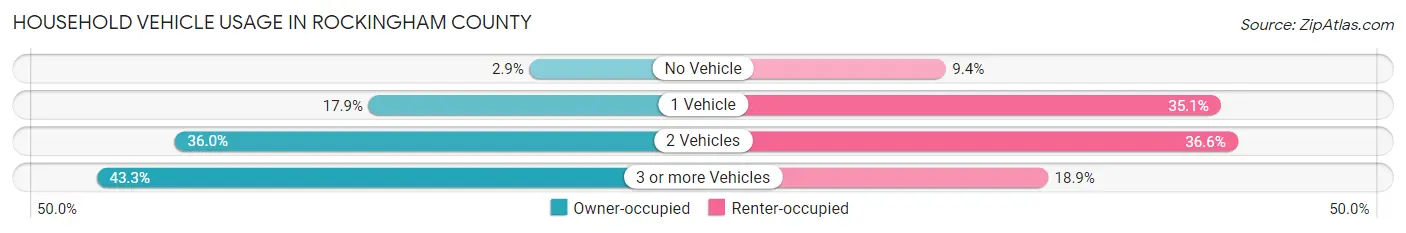
| Vehicles per Household | Owner-occupied | Renter-occupied |
| No Vehicle | 681 (2.9%) | 734 (9.4%) |
| 1 Vehicle | 4,251 (17.9%) | 2,744 (35.1%) |
| 2 Vehicles | 8,560 (36.0%) | 2,868 (36.6%) |
| 3 or more Vehicles | 10,293 (43.3%) | 1,481 (18.9%) |
| Total | 23,785 (100.0%) | 7,827 (100.0%) |
Real Estate & Mortgages in Rockingham County
Real Estate and Mortgage Overview in Rockingham County
| Characteristic | Without Mortgage | With Mortgage |
| Housing Units | 10,726 | 13,059 |
| Median Property Value | $246,900 | $279,500 |
| Median Household Income | $57,275 | $2,859 |
| Monthly Housing Costs | $443 | $762 |
| Real Estate Taxes | $1,435 | $171 |
Property Value by Mortgage Status in Rockingham County
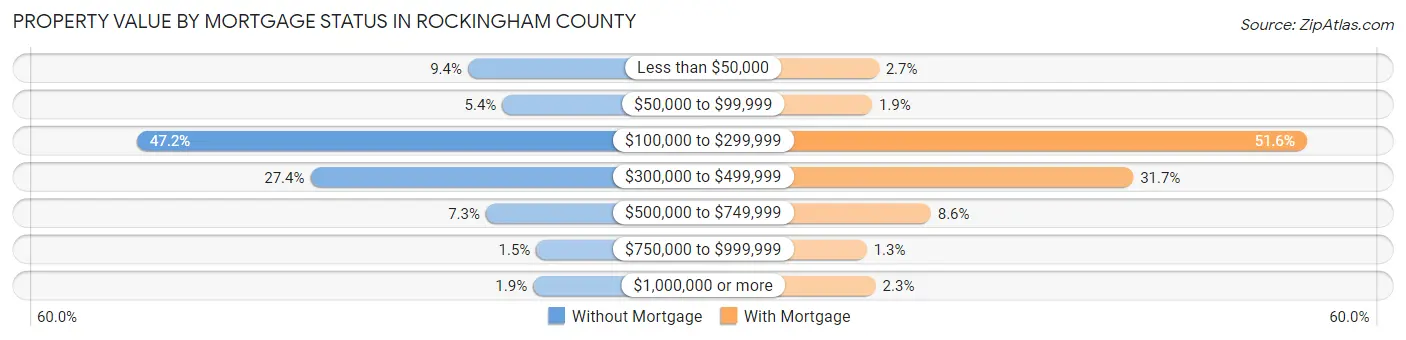
| Property Value | Without Mortgage | With Mortgage |
| Less than $50,000 | 1,003 (9.3%) | 346 (2.6%) |
| $50,000 to $99,999 | 581 (5.4%) | 245 (1.9%) |
| $100,000 to $299,999 | 5,058 (47.2%) | 6,734 (51.6%) |
| $300,000 to $499,999 | 2,934 (27.4%) | 4,144 (31.7%) |
| $500,000 to $749,999 | 782 (7.3%) | 1,123 (8.6%) |
| $750,000 to $999,999 | 164 (1.5%) | 167 (1.3%) |
| $1,000,000 or more | 204 (1.9%) | 300 (2.3%) |
| Total | 10,726 (100.0%) | 13,059 (100.0%) |
Household Income by Mortgage Status in Rockingham County
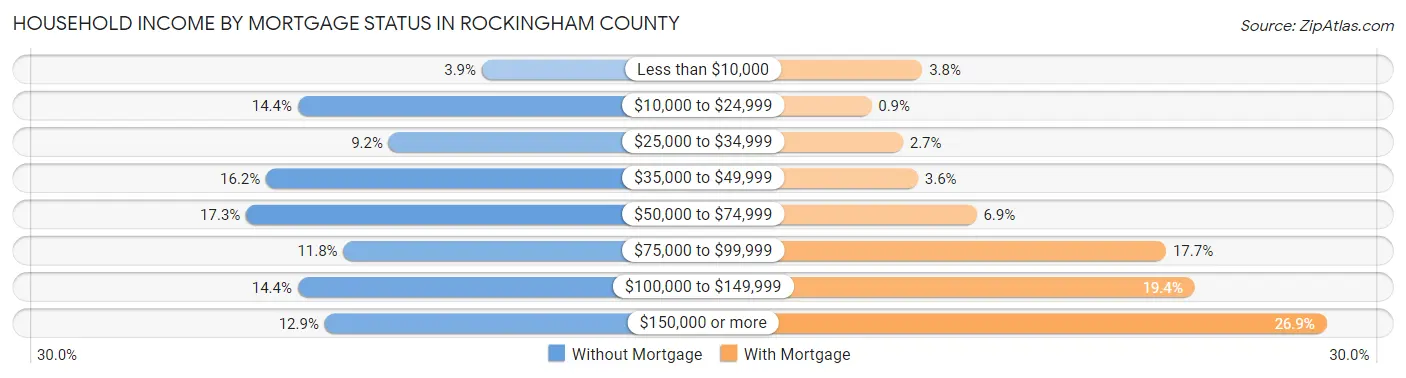
| Household Income | Without Mortgage | With Mortgage |
| Less than $10,000 | 415 (3.9%) | 497 (3.8%) |
| $10,000 to $24,999 | 1,543 (14.4%) | 117 (0.9%) |
| $25,000 to $34,999 | 986 (9.2%) | 352 (2.7%) |
| $35,000 to $49,999 | 1,738 (16.2%) | 465 (3.6%) |
| $50,000 to $74,999 | 1,860 (17.3%) | 903 (6.9%) |
| $75,000 to $99,999 | 1,263 (11.8%) | 2,317 (17.7%) |
| $100,000 to $149,999 | 1,543 (14.4%) | 2,531 (19.4%) |
| $150,000 or more | 1,378 (12.9%) | 3,515 (26.9%) |
| Total | 10,726 (100.0%) | 13,059 (100.0%) |
Property Value to Household Income Ratio in Rockingham County
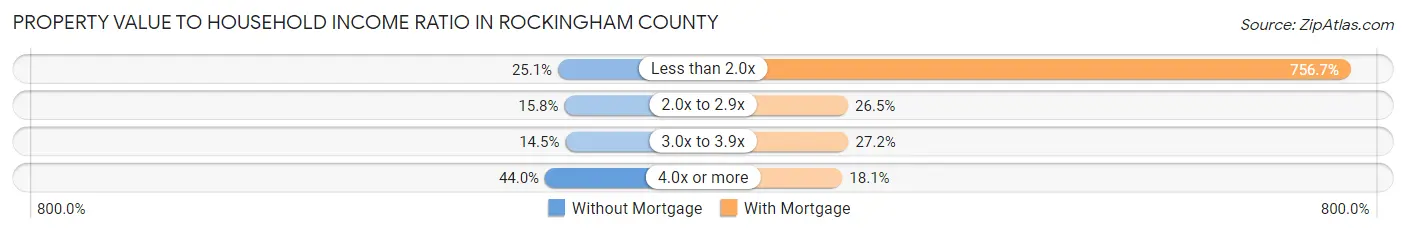
| Value-to-Income Ratio | Without Mortgage | With Mortgage |
| Less than 2.0x | 2,696 (25.1%) | 98,811 (756.6%) |
| 2.0x to 2.9x | 1,694 (15.8%) | 3,461 (26.5%) |
| 3.0x to 3.9x | 1,555 (14.5%) | 3,554 (27.2%) |
| 4.0x or more | 4,715 (44.0%) | 2,366 (18.1%) |
| Total | 10,726 (100.0%) | 13,059 (100.0%) |
Real Estate Taxes by Mortgage Status in Rockingham County
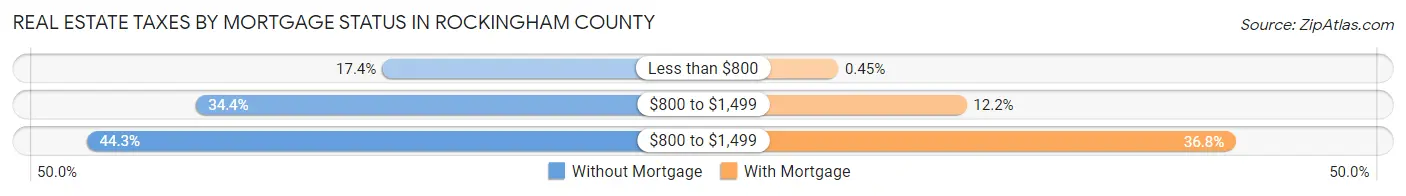
| Property Taxes | Without Mortgage | With Mortgage |
| Less than $800 | 1,861 (17.3%) | 59 (0.4%) |
| $800 to $1,499 | 3,690 (34.4%) | 1,591 (12.2%) |
| $800 to $1,499 | 4,755 (44.3%) | 4,806 (36.8%) |
| Total | 10,726 (100.0%) | 13,059 (100.0%) |
Health & Disability in Rockingham County
Health Insurance Coverage by Age in Rockingham County
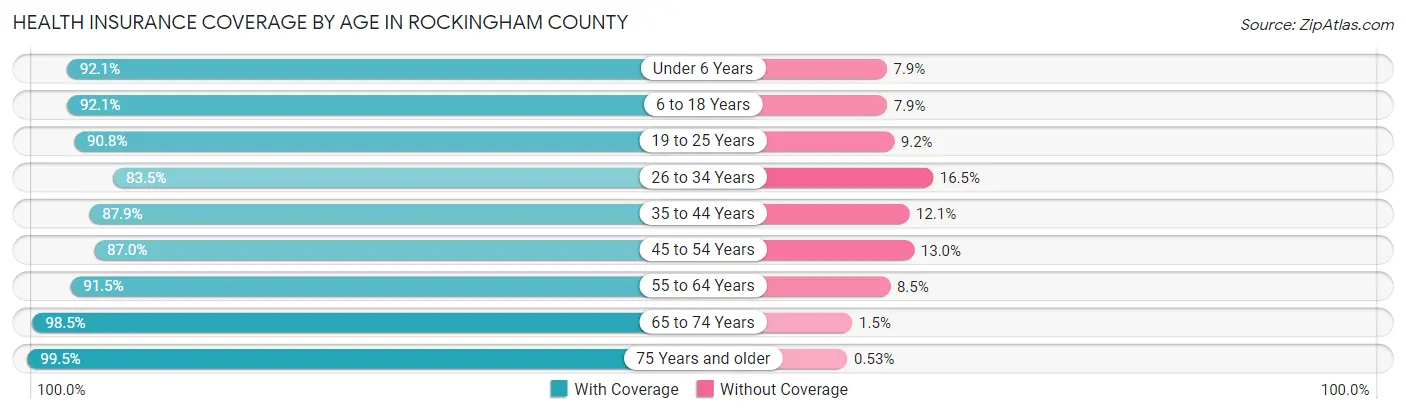
| Age Bracket | With Coverage | Without Coverage |
| Under 6 Years | 5,099 (92.1%) | 436 (7.9%) |
| 6 to 18 Years | 12,952 (92.1%) | 1,114 (7.9%) |
| 19 to 25 Years | 7,080 (90.8%) | 721 (9.2%) |
| 26 to 34 Years | 7,202 (83.5%) | 1,424 (16.5%) |
| 35 to 44 Years | 8,600 (87.9%) | 1,181 (12.1%) |
| 45 to 54 Years | 8,702 (87.0%) | 1,297 (13.0%) |
| 55 to 64 Years | 10,507 (91.5%) | 979 (8.5%) |
| 65 to 74 Years | 8,983 (98.5%) | 134 (1.5%) |
| 75 Years and older | 6,983 (99.5%) | 37 (0.5%) |
| Total | 76,108 (91.2%) | 7,323 (8.8%) |
Health Insurance Coverage by Citizenship Status in Rockingham County
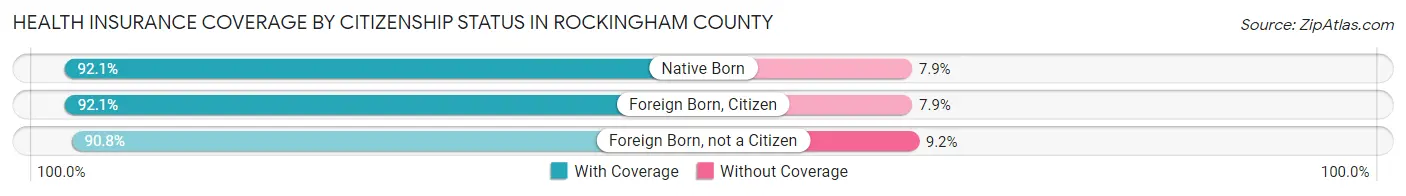
| Citizenship Status | With Coverage | Without Coverage |
| Native Born | 5,099 (92.1%) | 436 (7.9%) |
| Foreign Born, Citizen | 12,952 (92.1%) | 1,114 (7.9%) |
| Foreign Born, not a Citizen | 7,080 (90.8%) | 721 (9.2%) |
Health Insurance Coverage by Household Income in Rockingham County
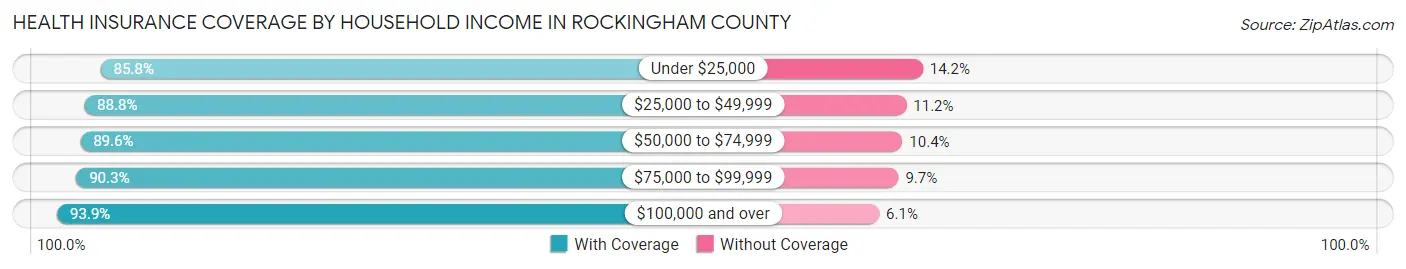
| Household Income | With Coverage | Without Coverage |
| Under $25,000 | 5,054 (85.8%) | 839 (14.2%) |
| $25,000 to $49,999 | 11,754 (88.8%) | 1,477 (11.2%) |
| $50,000 to $74,999 | 14,137 (89.6%) | 1,644 (10.4%) |
| $75,000 to $99,999 | 12,173 (90.3%) | 1,305 (9.7%) |
| $100,000 and over | 31,462 (93.9%) | 2,028 (6.1%) |
Public vs Private Health Insurance Coverage by Age in Rockingham County
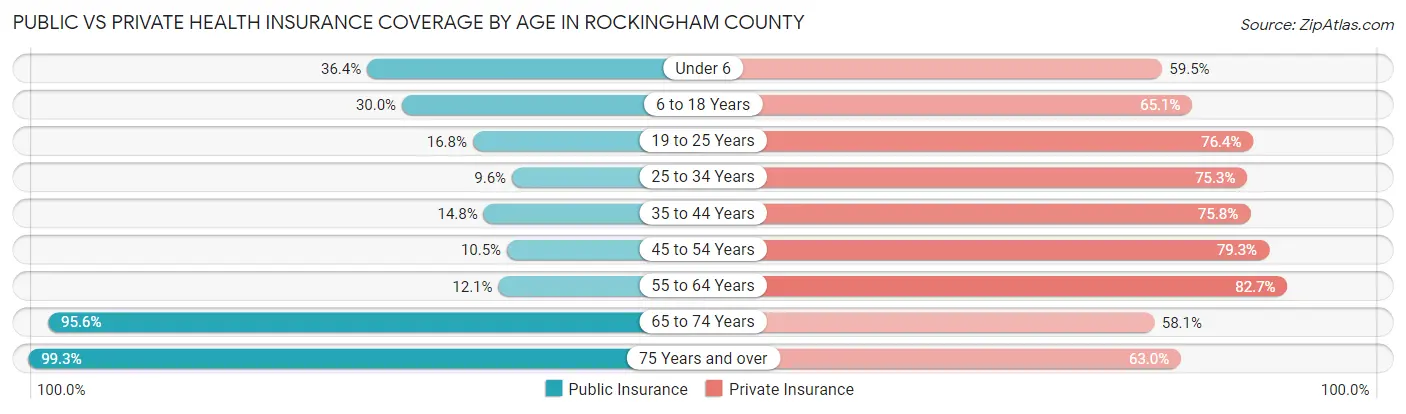
| Age Bracket | Public Insurance | Private Insurance |
| Under 6 | 2,017 (36.4%) | 3,294 (59.5%) |
| 6 to 18 Years | 4,214 (30.0%) | 9,150 (65.0%) |
| 19 to 25 Years | 1,311 (16.8%) | 5,958 (76.4%) |
| 25 to 34 Years | 824 (9.6%) | 6,491 (75.2%) |
| 35 to 44 Years | 1,449 (14.8%) | 7,412 (75.8%) |
| 45 to 54 Years | 1,047 (10.5%) | 7,927 (79.3%) |
| 55 to 64 Years | 1,385 (12.1%) | 9,500 (82.7%) |
| 65 to 74 Years | 8,719 (95.6%) | 5,297 (58.1%) |
| 75 Years and over | 6,972 (99.3%) | 4,420 (63.0%) |
| Total | 27,938 (33.5%) | 59,449 (71.3%) |
Disability Status by Sex by Age in Rockingham County
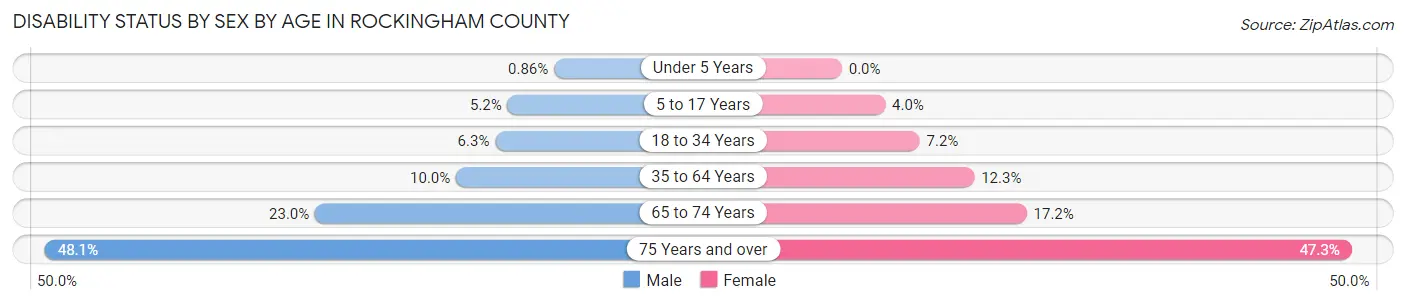
| Age Bracket | Male | Female |
| Under 5 Years | 21 (0.9%) | 0 (0.0%) |
| 5 to 17 Years | 361 (5.2%) | 268 (4.0%) |
| 18 to 34 Years | 556 (6.3%) | 640 (7.2%) |
| 35 to 64 Years | 1,552 (10.0%) | 1,926 (12.3%) |
| 65 to 74 Years | 1,020 (23.0%) | 804 (17.2%) |
| 75 Years and over | 1,436 (48.1%) | 1,910 (47.3%) |
Disability Class by Sex by Age in Rockingham County
Disability Class: Hearing Difficulty
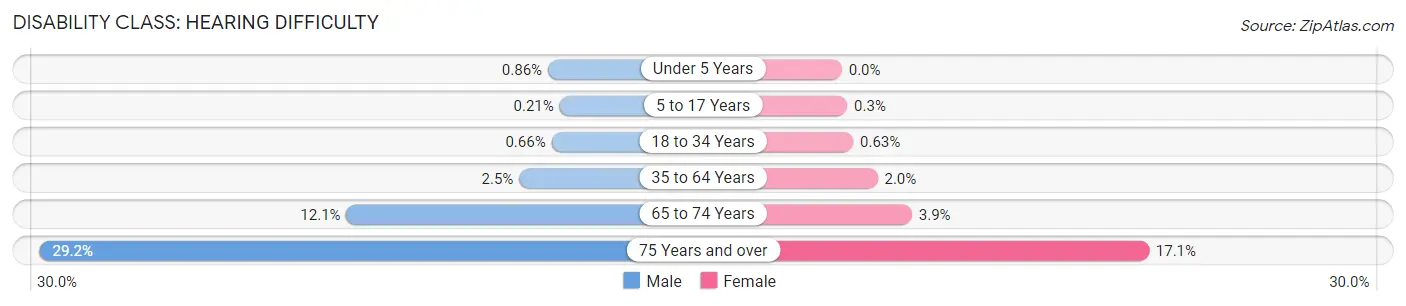
| Age Bracket | Male | Female |
| Under 5 Years | 21 (0.9%) | 0 (0.0%) |
| 5 to 17 Years | 15 (0.2%) | 20 (0.3%) |
| 18 to 34 Years | 58 (0.7%) | 56 (0.6%) |
| 35 to 64 Years | 384 (2.5%) | 311 (2.0%) |
| 65 to 74 Years | 535 (12.1%) | 183 (3.9%) |
| 75 Years and over | 870 (29.2%) | 690 (17.1%) |
Disability Class: Vision Difficulty
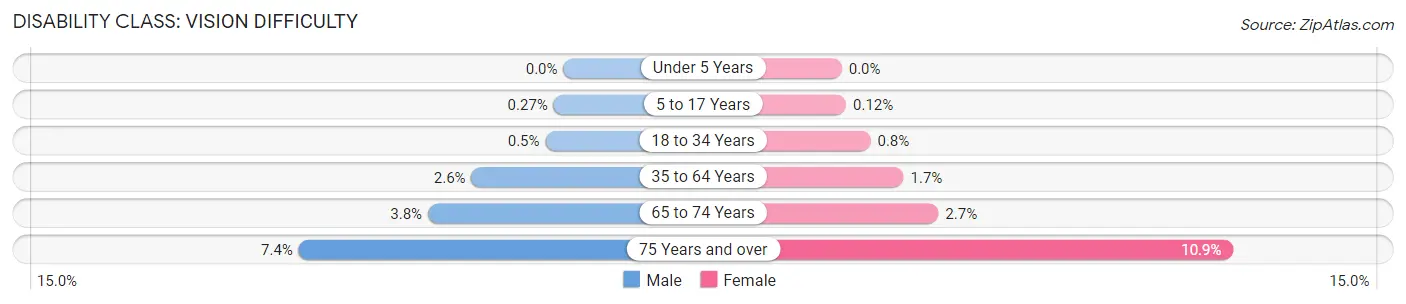
| Age Bracket | Male | Female |
| Under 5 Years | 0 (0.0%) | 0 (0.0%) |
| 5 to 17 Years | 19 (0.3%) | 8 (0.1%) |
| 18 to 34 Years | 44 (0.5%) | 71 (0.8%) |
| 35 to 64 Years | 399 (2.6%) | 269 (1.7%) |
| 65 to 74 Years | 167 (3.8%) | 126 (2.7%) |
| 75 Years and over | 220 (7.4%) | 440 (10.9%) |
Disability Class: Cognitive Difficulty
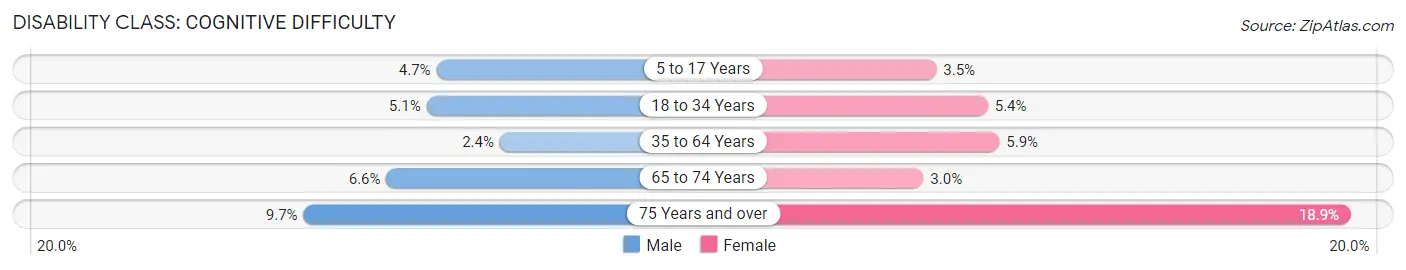
| Age Bracket | Male | Female |
| 5 to 17 Years | 329 (4.7%) | 234 (3.5%) |
| 18 to 34 Years | 447 (5.1%) | 480 (5.4%) |
| 35 to 64 Years | 368 (2.4%) | 917 (5.9%) |
| 65 to 74 Years | 291 (6.6%) | 142 (3.0%) |
| 75 Years and over | 288 (9.7%) | 763 (18.9%) |
Disability Class: Ambulatory Difficulty
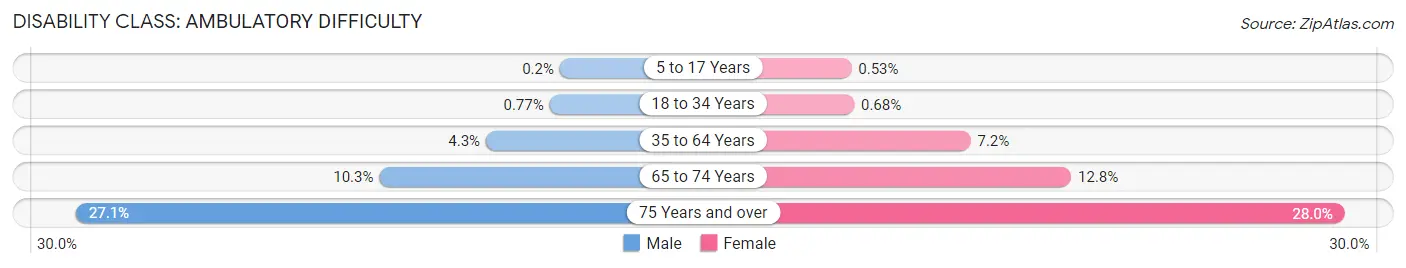
| Age Bracket | Male | Female |
| 5 to 17 Years | 14 (0.2%) | 35 (0.5%) |
| 18 to 34 Years | 68 (0.8%) | 60 (0.7%) |
| 35 to 64 Years | 672 (4.3%) | 1,124 (7.2%) |
| 65 to 74 Years | 454 (10.2%) | 599 (12.8%) |
| 75 Years and over | 810 (27.1%) | 1,130 (28.0%) |
Disability Class: Self-Care Difficulty
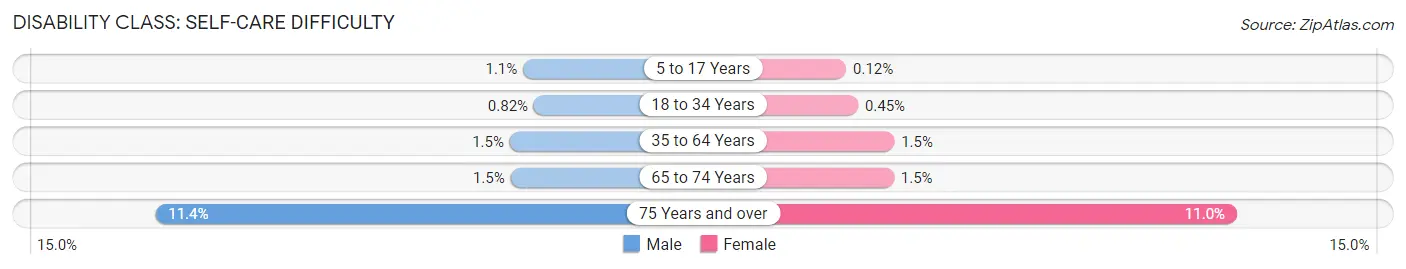
| Age Bracket | Male | Female |
| 5 to 17 Years | 78 (1.1%) | 8 (0.1%) |
| 18 to 34 Years | 72 (0.8%) | 40 (0.4%) |
| 35 to 64 Years | 232 (1.5%) | 228 (1.5%) |
| 65 to 74 Years | 65 (1.5%) | 68 (1.5%) |
| 75 Years and over | 339 (11.4%) | 444 (11.0%) |
Technology Access in Rockingham County
Computing Device Access in Rockingham County
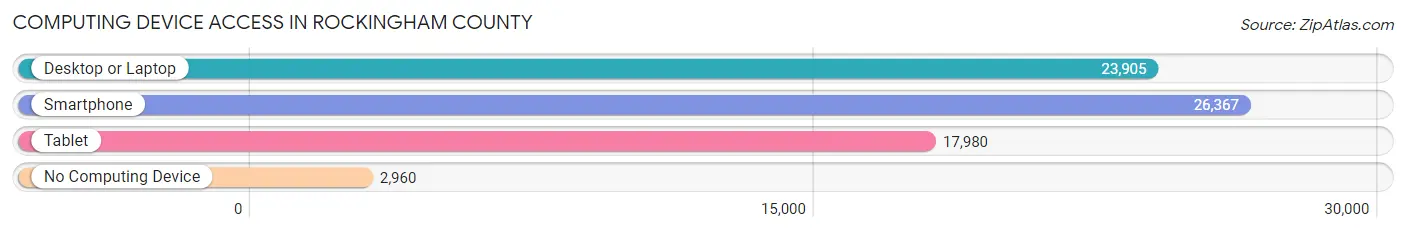
| Device Type | # Households | % Households |
| Desktop or Laptop | 23,905 | 75.6% |
| Smartphone | 26,367 | 83.4% |
| Tablet | 17,980 | 56.9% |
| No Computing Device | 2,960 | 9.4% |
| Total | 31,612 | 100.0% |
Internet Access in Rockingham County
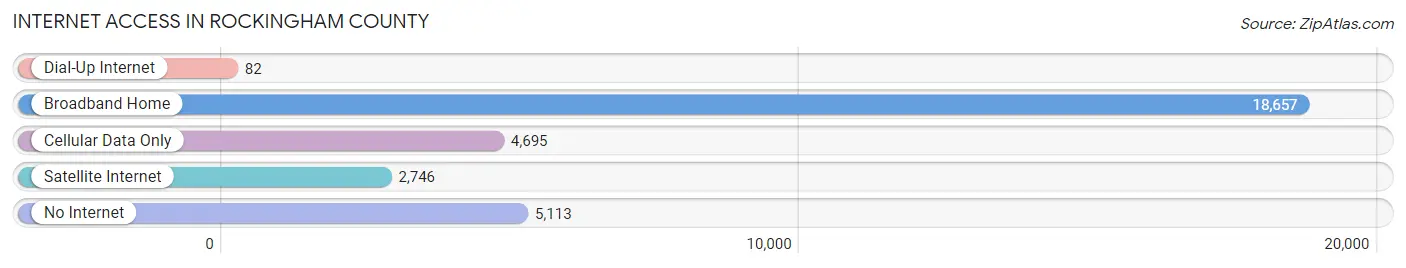
| Internet Type | # Households | % Households |
| Dial-Up Internet | 82 | 0.3% |
| Broadband Home | 18,657 | 59.0% |
| Cellular Data Only | 4,695 | 14.8% |
| Satellite Internet | 2,746 | 8.7% |
| No Internet | 5,113 | 16.2% |
| Total | 31,612 | 100.0% |
Rockingham County Summary
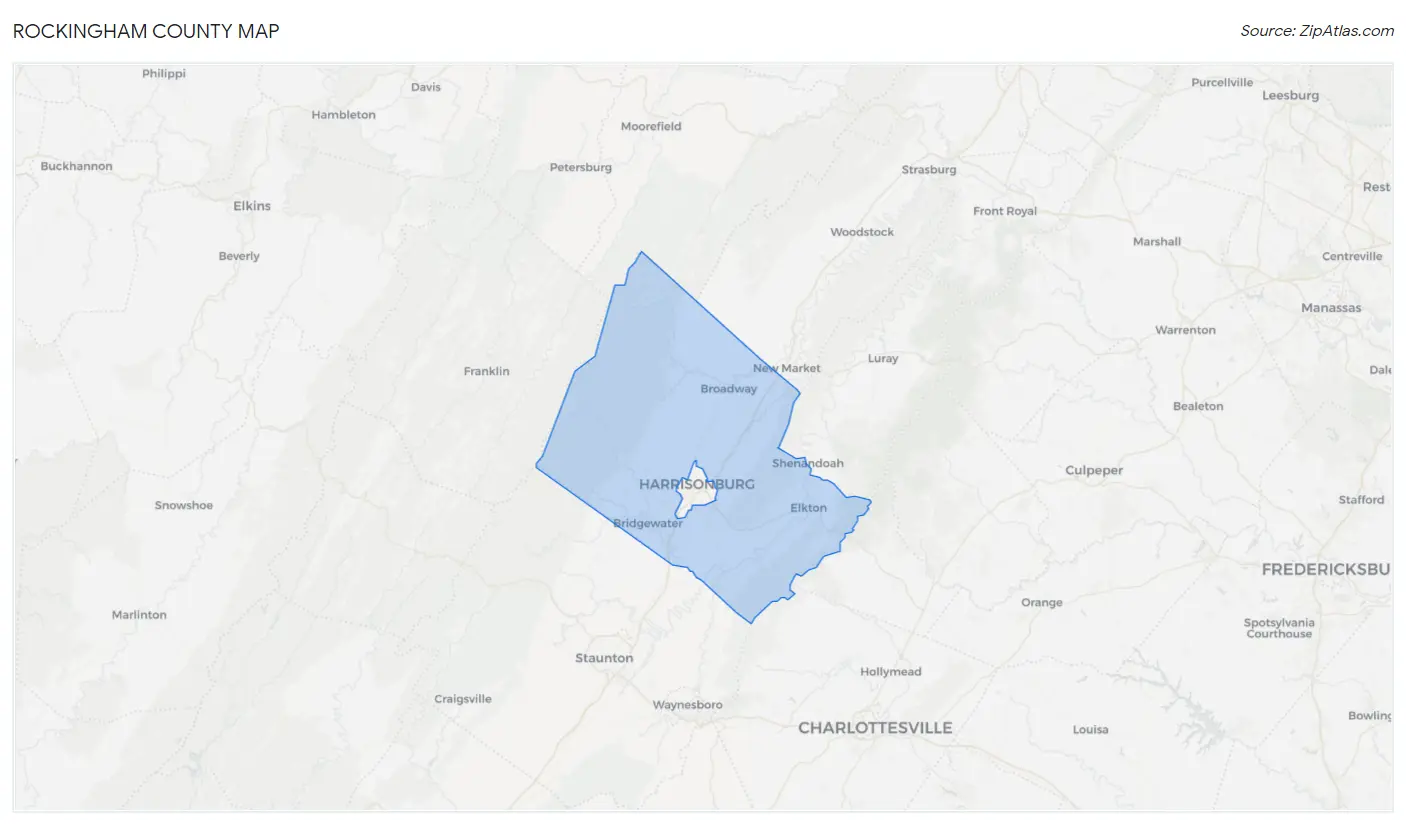
Rockingham County is located in the Shenandoah Valley region of Virginia, and is part of the Harrisonburg Metropolitan Statistical Area. It is bordered by Augusta County to the north, Page County to the east, Shenandoah County to the south, and the West Virginia border to the west. The county seat is the town of Harrisonburg, which is also the largest city in the county.
History
Rockingham County was formed in 1778 from Augusta County. It was named for Charles Watson-Wentworth, 2nd Marquess of Rockingham, who was Prime Minister of Great Britain at the time. The county was originally part of the Shenandoah Valley, and was home to many Native American tribes, including the Iroquois, Shawnee, and Cherokee.
The county was the site of several battles during the Civil War, including the Battle of Cross Keys and the Battle of Port Republic. After the war, the county experienced a period of economic growth, with the development of the railroad and the establishment of several factories.
Geography
Rockingham County covers an area of 837 square miles, making it the second-largest county in Virginia. The terrain is mostly hilly, with the Blue Ridge Mountains to the east and the Massanutten Mountain range to the west. The Shenandoah River runs through the county, and there are several smaller rivers and streams.
The climate is humid subtropical, with hot, humid summers and mild winters. The average annual temperature is 54°F, and the average annual precipitation is 40 inches.
Economy
Rockingham County has a diverse economy, with a mix of agriculture, manufacturing, and services. The county is home to several large employers, including James Madison University, Rockingham Memorial Hospital, and the City of Harrisonburg.
Agriculture is an important part of the economy, with the county producing a variety of crops, including corn, soybeans, wheat, hay, and apples. Livestock production is also important, with the county raising beef cattle, dairy cows, and sheep.
Manufacturing is also an important part of the economy, with the county home to several factories that produce furniture, textiles, and other products. The county is also home to several technology companies, including software and web development firms.
Demographics
As of the 2010 census, the population of Rockingham County was 76,314. The population is mostly white (90.2%), with small percentages of African Americans (4.2%), Hispanics (2.7%), and Asians (1.7%). The median household income is $50,837, and the median home value is $179,400.
The county is home to several colleges and universities, including James Madison University, Eastern Mennonite University, and Bridgewater College. The county is also home to several museums, including the Harrisonburg-Rockingham Historical Society Museum and the Virginia Quilt Museum.
Conclusion
Rockingham County is a diverse and vibrant county located in the Shenandoah Valley region of Virginia. It has a rich history, and is home to a variety of industries, including agriculture, manufacturing, and services. The county is also home to several colleges and universities, as well as several museums. The population is mostly white, with small percentages of African Americans, Hispanics, and Asians. The median household income is $50,837, and the median home value is $179,400.
Common Questions
What is Per Capita Income in Rockingham County?
Per Capita income in Rockingham County is $37,180.
What is the Median Family Income in Rockingham County?
Median Family Income in Rockingham County is $88,389.
What is the Median Household income in Rockingham County?
Median Household Income in Rockingham County is $73,232.
What is Income or Wage Gap in Rockingham County?
Income or Wage Gap in Rockingham County is 33.9%.
Women in Rockingham County earn 66.1 cents for every dollar earned by a man.
What is Family Income Deficit in Rockingham County?
Family Income Deficit in Rockingham County is $8,464.
Families that are below poverty line in Rockingham County earn $8,464 less on average than the poverty threshold level.
What is Inequality or Gini Index in Rockingham County?
Inequality or Gini Index in Rockingham County is 0.43.
What is the Total Population of Rockingham County?
Total Population of Rockingham County is 83,905.
What is the Total Male Population of Rockingham County?
Total Male Population of Rockingham County is 41,490.
What is the Total Female Population of Rockingham County?
Total Female Population of Rockingham County is 42,415.
What is the Ratio of Males per 100 Females in Rockingham County?
There are 97.82 Males per 100 Females in Rockingham County.
What is the Ratio of Females per 100 Males in Rockingham County?
There are 102.23 Females per 100 Males in Rockingham County.
What is the Median Population Age in Rockingham County?
Median Population Age in Rockingham County is 40.5 Years.
What is the Average Family Size in Rockingham County
Average Family Size in Rockingham County is 3.1 People.
What is the Average Household Size in Rockingham County
Average Household Size in Rockingham County is 2.6 People.
How Large is the Labor Force in Rockingham County?
There are 43,109 People in the Labor Forcein in Rockingham County.
What is the Percentage of People in the Labor Force in Rockingham County?
63.5% of People are in the Labor Force in Rockingham County.
What is the Unemployment Rate in Rockingham County?
Unemployment Rate in Rockingham County is 2.8%.