Rockbridge County, VA Map & Demographics
Rockbridge County Map
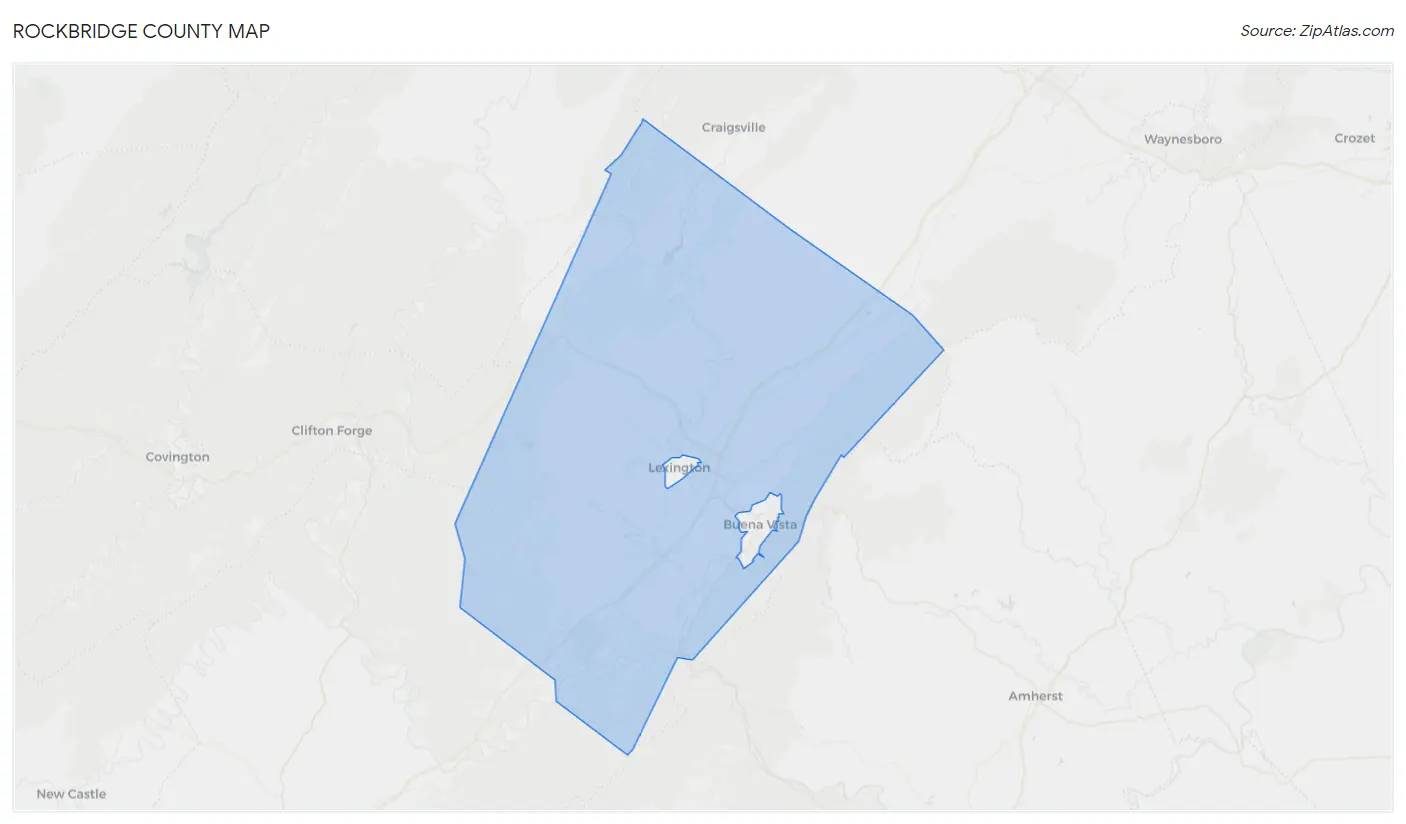
Rockbridge County Overview
$37,087
PER CAPITA INCOME
$76,835
AVG FAMILY INCOME
$61,903
AVG HOUSEHOLD INCOME
18.8%
WAGE / INCOME GAP [ % ]
81.2¢/ $1
WAGE / INCOME GAP [ $ ]
$10,825
FAMILY INCOME DEFICIT
0.45
INEQUALITY / GINI INDEX
22,673
TOTAL POPULATION
11,175
MALE POPULATION
11,498
FEMALE POPULATION
97.19
MALES / 100 FEMALES
102.89
FEMALES / 100 MALES
49.4
MEDIAN AGE
2.9
AVG FAMILY SIZE
2.4
AVG HOUSEHOLD SIZE
10,635
LABOR FORCE [ PEOPLE ]
55.3%
PERCENT IN LABOR FORCE
3.9%
UNEMPLOYMENT RATE
Rockbridge County Area Codes
Income in Rockbridge County
Income Overview in Rockbridge County
Per Capita Income in Rockbridge County is $37,087, while median incomes of families and households are $76,835 and $61,903 respectively.
| Characteristic | Number | Measure |
| Per Capita Income | 22,673 | $37,087 |
| Median Family Income | 6,314 | $76,835 |
| Mean Family Income | 6,314 | $101,848 |
| Median Household Income | 9,368 | $61,903 |
| Mean Household Income | 9,368 | $85,003 |
| Income Deficit | 6,314 | $10,825 |
| Wage / Income Gap (%) | 22,673 | 18.76% |
| Wage / Income Gap ($) | 22,673 | 81.24¢ per $1 |
| Gini / Inequality Index | 22,673 | 0.45 |
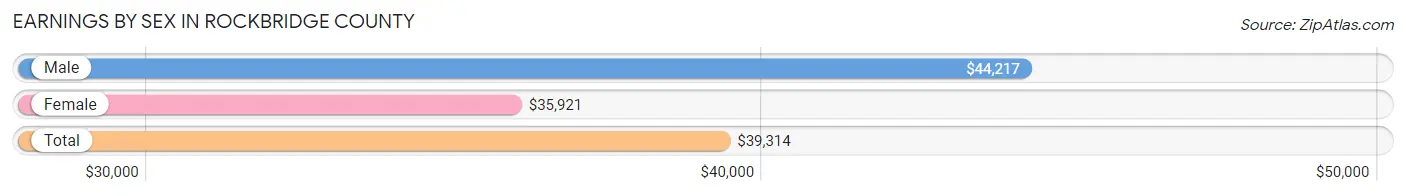
Earnings by Sex in Rockbridge County
Average Earnings in Rockbridge County are $39,314, $44,217 for men and $35,921 for women, a difference of 18.8%.
| Sex | Number | Average Earnings |
| Male | 5,949 (52.3%) | $44,217 |
| Female | 5,420 (47.7%) | $35,921 |
| Total | 11,369 (100.0%) | $39,314 |
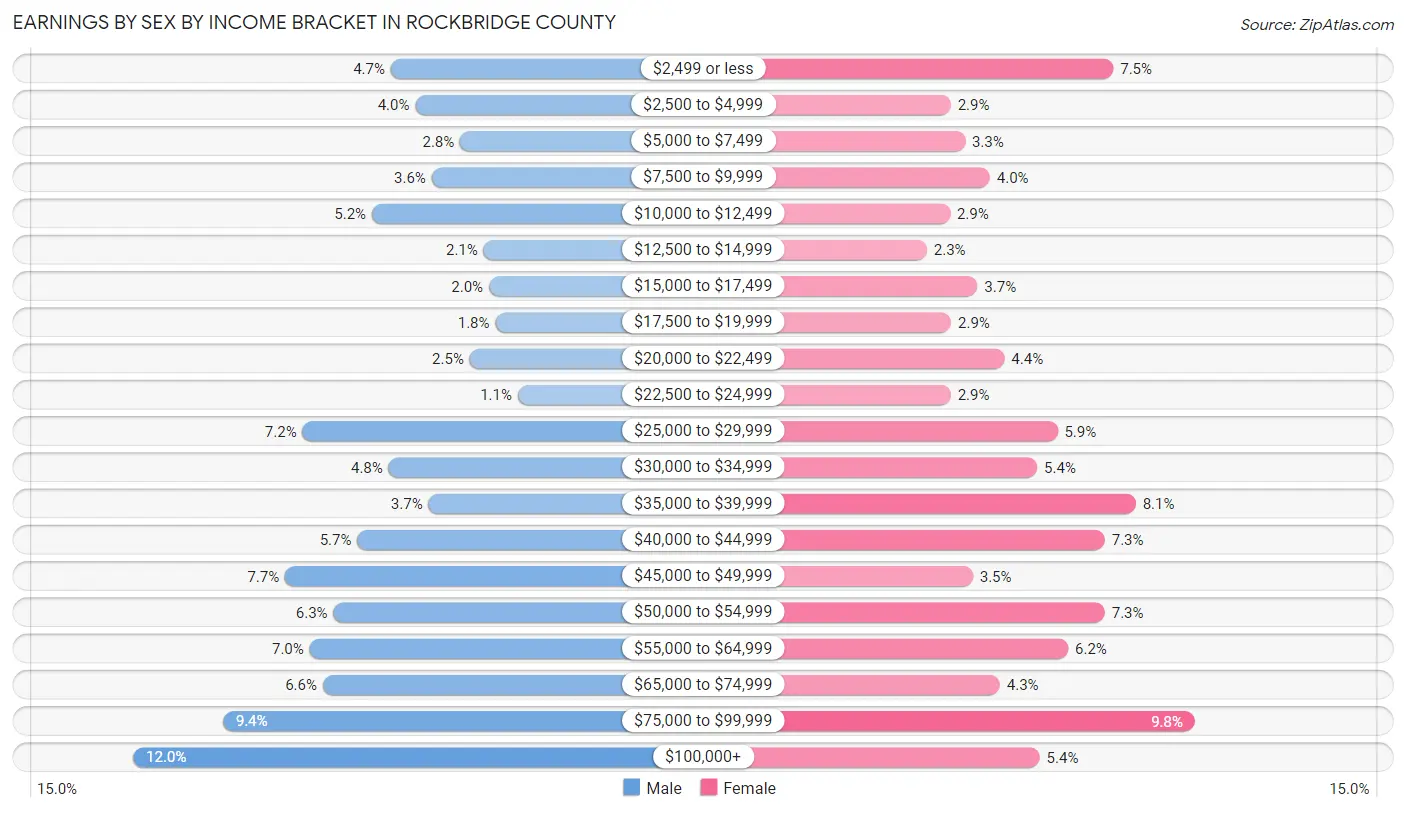
Earnings by Sex by Income Bracket in Rockbridge County
The most common earnings brackets in Rockbridge County are $100,000+ for men (711 | 11.9%) and $75,000 to $99,999 for women (530 | 9.8%).
| Income | Male | Female |
| $2,499 or less | 280 (4.7%) | 406 (7.5%) |
| $2,500 to $4,999 | 239 (4.0%) | 158 (2.9%) |
| $5,000 to $7,499 | 164 (2.8%) | 180 (3.3%) |
| $7,500 to $9,999 | 212 (3.6%) | 218 (4.0%) |
| $10,000 to $12,499 | 312 (5.2%) | 157 (2.9%) |
| $12,500 to $14,999 | 125 (2.1%) | 122 (2.2%) |
| $15,000 to $17,499 | 116 (1.9%) | 199 (3.7%) |
| $17,500 to $19,999 | 105 (1.8%) | 159 (2.9%) |
| $20,000 to $22,499 | 148 (2.5%) | 240 (4.4%) |
| $22,500 to $24,999 | 68 (1.1%) | 158 (2.9%) |
| $25,000 to $29,999 | 428 (7.2%) | 321 (5.9%) |
| $30,000 to $34,999 | 284 (4.8%) | 290 (5.3%) |
| $35,000 to $39,999 | 217 (3.6%) | 440 (8.1%) |
| $40,000 to $44,999 | 336 (5.7%) | 393 (7.2%) |
| $45,000 to $49,999 | 457 (7.7%) | 192 (3.5%) |
| $50,000 to $54,999 | 376 (6.3%) | 393 (7.2%) |
| $55,000 to $64,999 | 416 (7.0%) | 337 (6.2%) |
| $65,000 to $74,999 | 394 (6.6%) | 233 (4.3%) |
| $75,000 to $99,999 | 561 (9.4%) | 530 (9.8%) |
| $100,000+ | 711 (11.9%) | 294 (5.4%) |
| Total | 5,949 (100.0%) | 5,420 (100.0%) |
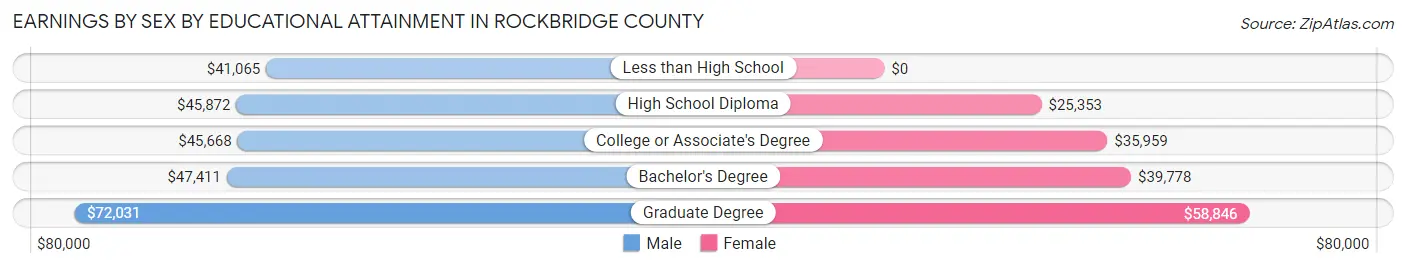
Earnings by Sex by Educational Attainment in Rockbridge County
Average earnings in Rockbridge County are $46,488 for men and $37,799 for women, a difference of 18.7%. Men with an educational attainment of graduate degree enjoy the highest average annual earnings of $72,031, while those with less than high school education earn the least with $41,065. Women with an educational attainment of graduate degree earn the most with the average annual earnings of $58,846, while those with high school diploma education have the smallest earnings of $25,353.
| Educational Attainment | Male Income | Female Income |
| Less than High School | $41,065 | $0 |
| High School Diploma | $45,872 | $25,353 |
| College or Associate's Degree | $45,668 | $35,959 |
| Bachelor's Degree | $47,411 | $39,778 |
| Graduate Degree | $72,031 | $58,846 |
| Total | $46,488 | $37,799 |
Family Income in Rockbridge County
Family Income Brackets in Rockbridge County
According to the Rockbridge County family income data, there are 1,143 families falling into the $50,000 to $74,999 income range, which is the most common income bracket and makes up 18.1% of all families. Conversely, the $10,000 to $14,999 income bracket is the least frequent group with only 88 families (1.4%) belonging to this category.
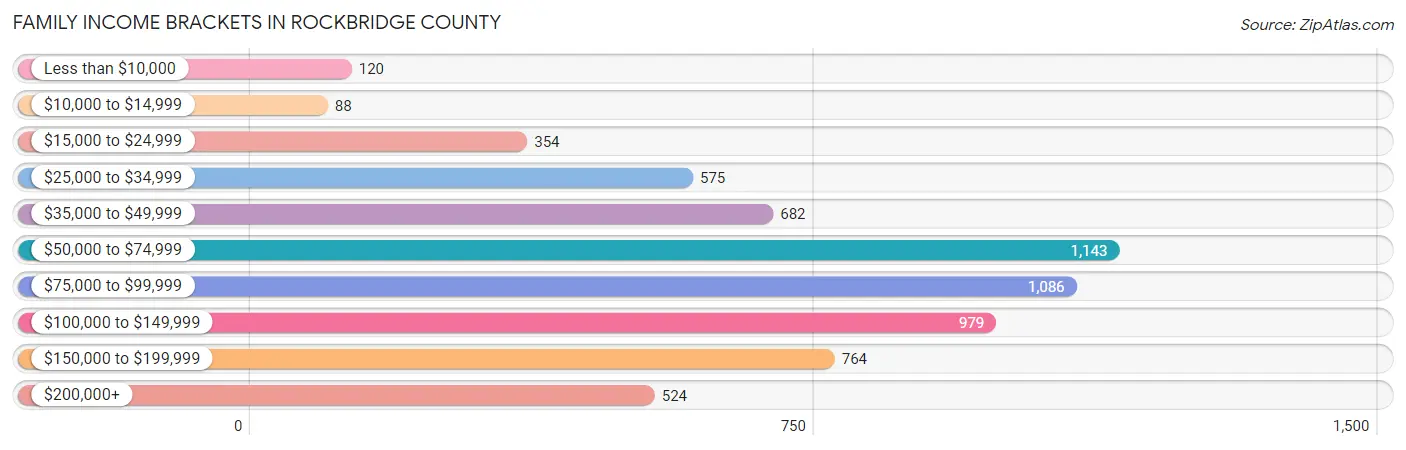
| Income Bracket | # Families | % Families |
| Less than $10,000 | 120 | 1.9% |
| $10,000 to $14,999 | 88 | 1.4% |
| $15,000 to $24,999 | 354 | 5.6% |
| $25,000 to $34,999 | 575 | 9.1% |
| $35,000 to $49,999 | 682 | 10.8% |
| $50,000 to $74,999 | 1,143 | 18.1% |
| $75,000 to $99,999 | 1,086 | 17.2% |
| $100,000 to $149,999 | 979 | 15.5% |
| $150,000 to $199,999 | 764 | 12.1% |
| $200,000+ | 524 | 8.3% |
Family Income by Famaliy Size in Rockbridge County
4-person families (752 | 11.9%) account for the highest median family income in Rockbridge County with $108,571 per family, while 2-person families (3,930 | 62.2%) have the highest median income of $35,100 per family member.
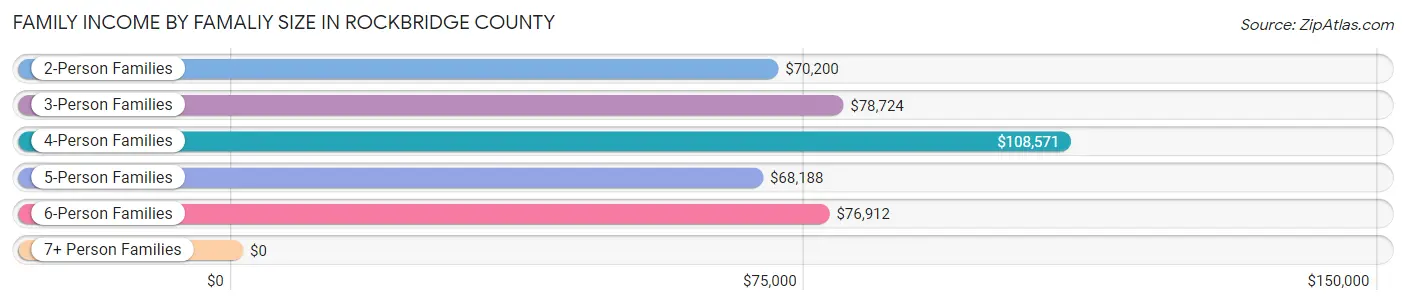
| Income Bracket | # Families | Median Income |
| 2-Person Families | 3,930 (62.2%) | $70,200 |
| 3-Person Families | 1,291 (20.4%) | $78,724 |
| 4-Person Families | 752 (11.9%) | $108,571 |
| 5-Person Families | 253 (4.0%) | $68,188 |
| 6-Person Families | 88 (1.4%) | $76,912 |
| 7+ Person Families | 0 (0.0%) | $0 |
| Total | 6,314 (100.0%) | $76,835 |
Family Income by Number of Earners in Rockbridge County
The median family income in Rockbridge County is $76,835, with families comprising 3+ earners (502) having the highest median family income of $140,326, while families with no earners (1,363) have the lowest median family income of $49,743, accounting for 8.0% and 21.6% of families, respectively.
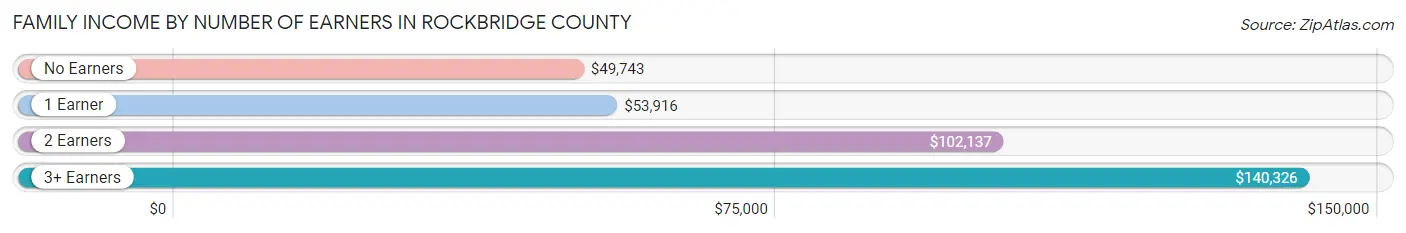
| Number of Earners | # Families | Median Income |
| No Earners | 1,363 (21.6%) | $49,743 |
| 1 Earner | 1,955 (31.0%) | $53,916 |
| 2 Earners | 2,494 (39.5%) | $102,137 |
| 3+ Earners | 502 (8.0%) | $140,326 |
| Total | 6,314 (100.0%) | $76,835 |
Household Income in Rockbridge County
Household Income Brackets in Rockbridge County
With 1,705 households falling in the category, the $50,000 to $74,999 income range is the most frequent in Rockbridge County, accounting for 18.2% of all households. In contrast, only 290 households (3.1%) fall into the $10,000 to $14,999 income bracket, making it the least populous group.
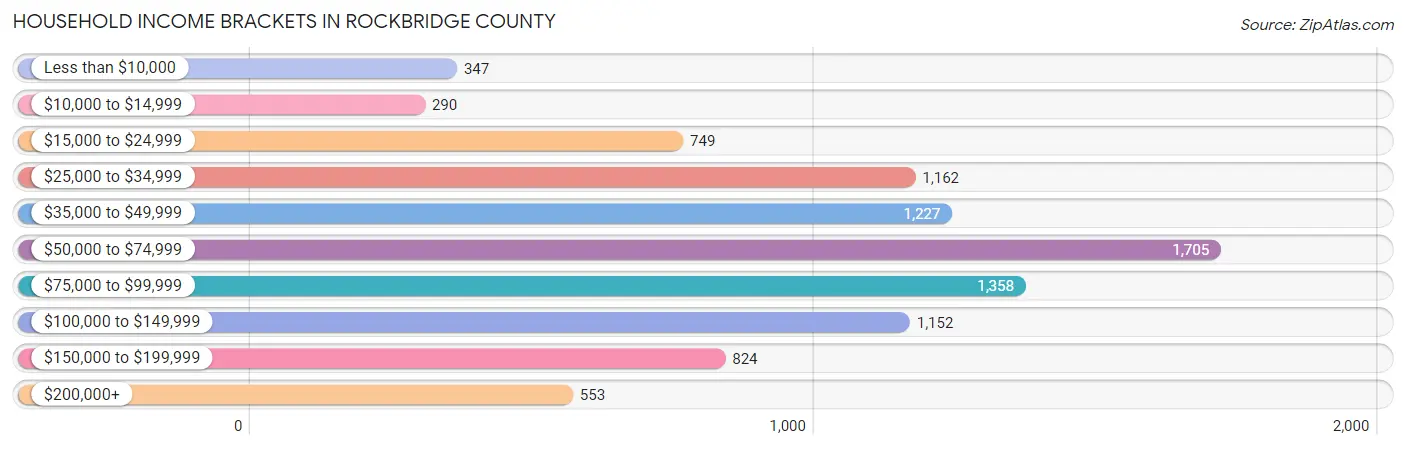
| Income Bracket | # Households | % Households |
| Less than $10,000 | 347 | 3.7% |
| $10,000 to $14,999 | 290 | 3.1% |
| $15,000 to $24,999 | 749 | 8.0% |
| $25,000 to $34,999 | 1,162 | 12.4% |
| $35,000 to $49,999 | 1,227 | 13.1% |
| $50,000 to $74,999 | 1,705 | 18.2% |
| $75,000 to $99,999 | 1,358 | 14.5% |
| $100,000 to $149,999 | 1,152 | 12.3% |
| $150,000 to $199,999 | 824 | 8.8% |
| $200,000+ | 553 | 5.9% |
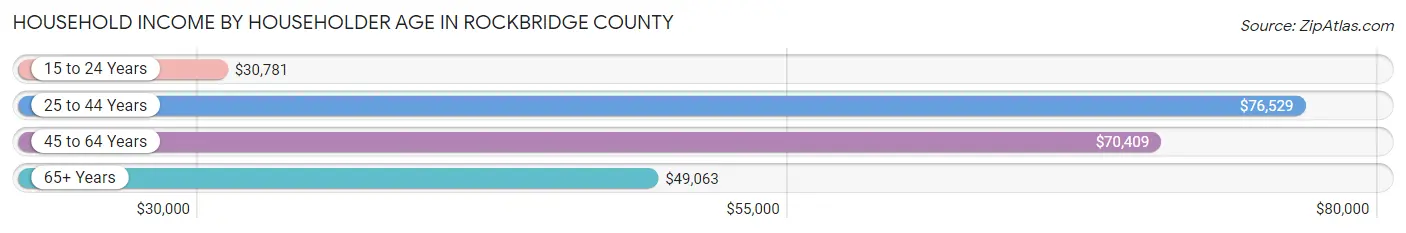
Household Income by Householder Age in Rockbridge County
The median household income in Rockbridge County is $61,903, with the highest median household income of $76,529 found in the 25 to 44 years age bracket for the primary householder. A total of 1,760 households (18.8%) fall into this category. Meanwhile, the 15 to 24 years age bracket for the primary householder has the lowest median household income of $30,781, with 153 households (1.6%) in this group.
| Income Bracket | # Households | Median Income |
| 15 to 24 Years | 153 (1.6%) | $30,781 |
| 25 to 44 Years | 1,760 (18.8%) | $76,529 |
| 45 to 64 Years | 3,463 (37.0%) | $70,409 |
| 65+ Years | 3,992 (42.6%) | $49,063 |
| Total | 9,368 (100.0%) | $61,903 |
Poverty in Rockbridge County
Income Below Poverty by Sex and Age in Rockbridge County
With 10.1% poverty level for males and 7.7% for females among the residents of Rockbridge County, 5 year old males and 16 and 17 year old females are the most vulnerable to poverty, with 43 males (33.1%) and 59 females (23.5%) in their respective age groups living below the poverty level.
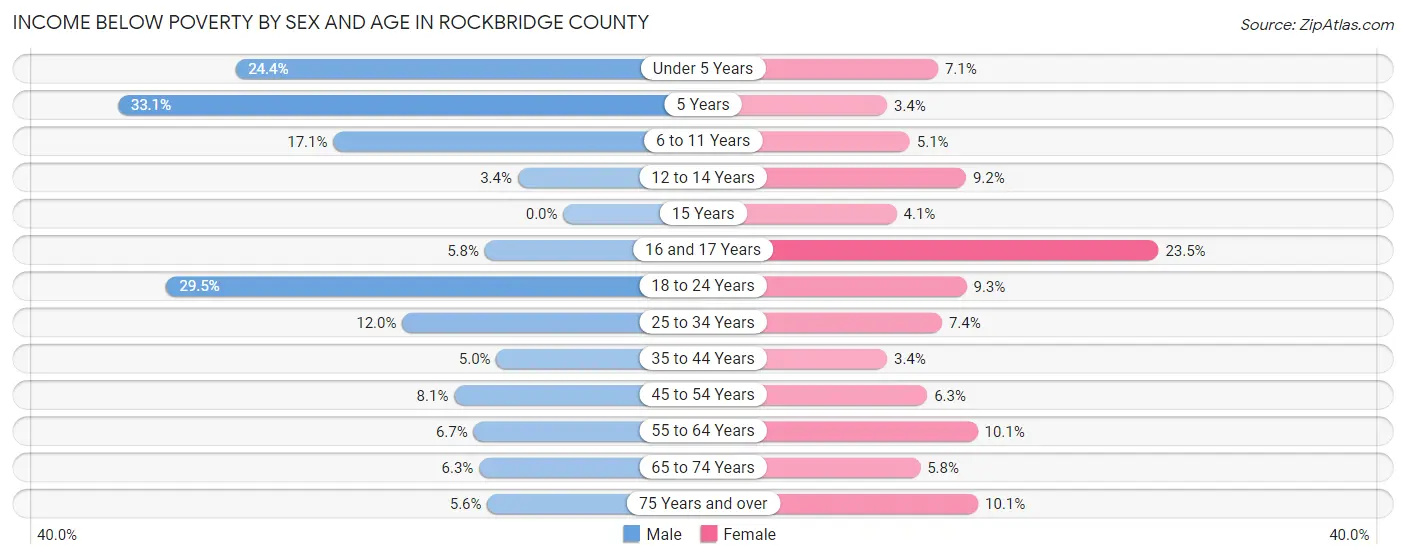
| Age Bracket | Male | Female |
| Under 5 Years | 115 (24.4%) | 29 (7.1%) |
| 5 Years | 43 (33.1%) | 4 (3.4%) |
| 6 to 11 Years | 117 (17.1%) | 40 (5.1%) |
| 12 to 14 Years | 11 (3.4%) | 19 (9.2%) |
| 15 Years | 0 (0.0%) | 7 (4.1%) |
| 16 and 17 Years | 20 (5.8%) | 59 (23.5%) |
| 18 to 24 Years | 216 (29.5%) | 71 (9.3%) |
| 25 to 34 Years | 133 (12.0%) | 85 (7.4%) |
| 35 to 44 Years | 60 (5.0%) | 37 (3.4%) |
| 45 to 54 Years | 108 (8.1%) | 86 (6.3%) |
| 55 to 64 Years | 121 (6.7%) | 188 (10.1%) |
| 65 to 74 Years | 106 (6.2%) | 95 (5.8%) |
| 75 Years and over | 63 (5.6%) | 150 (10.1%) |
| Total | 1,113 (10.1%) | 870 (7.7%) |
Income Above Poverty by Sex and Age in Rockbridge County
According to the poverty statistics in Rockbridge County, males aged 15 years and females aged 5 years are the age groups that are most secure financially, with 100.0% of males and 96.6% of females in these age groups living above the poverty line.
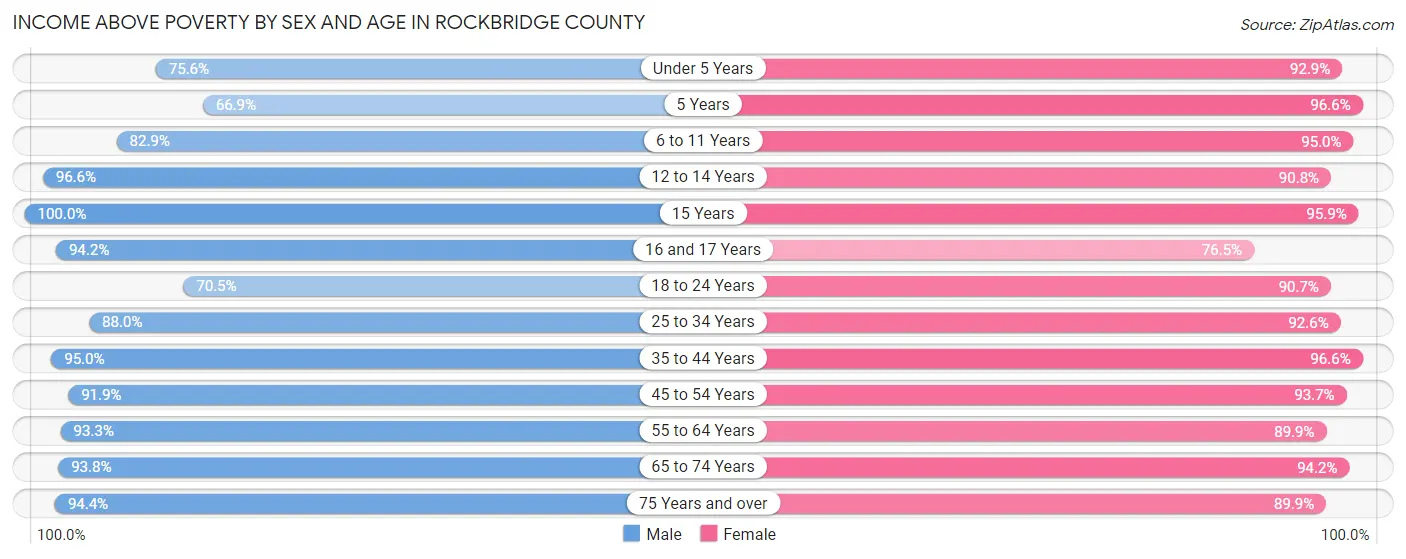
| Age Bracket | Male | Female |
| Under 5 Years | 357 (75.6%) | 377 (92.9%) |
| 5 Years | 87 (66.9%) | 115 (96.6%) |
| 6 to 11 Years | 568 (82.9%) | 752 (95.0%) |
| 12 to 14 Years | 314 (96.6%) | 187 (90.8%) |
| 15 Years | 38 (100.0%) | 165 (95.9%) |
| 16 and 17 Years | 323 (94.2%) | 192 (76.5%) |
| 18 to 24 Years | 517 (70.5%) | 696 (90.7%) |
| 25 to 34 Years | 979 (88.0%) | 1,058 (92.6%) |
| 35 to 44 Years | 1,148 (95.0%) | 1,065 (96.6%) |
| 45 to 54 Years | 1,225 (91.9%) | 1,270 (93.7%) |
| 55 to 64 Years | 1,692 (93.3%) | 1,678 (89.9%) |
| 65 to 74 Years | 1,589 (93.8%) | 1,538 (94.2%) |
| 75 Years and over | 1,054 (94.4%) | 1,332 (89.9%) |
| Total | 9,891 (89.9%) | 10,425 (92.3%) |
Income Below Poverty Among Married-Couple Families in Rockbridge County
The poverty statistics for married-couple families in Rockbridge County show that 2.8% or 134 of the total 4,836 families live below the poverty line. Families with 3 or 4 children have the highest poverty rate of 12.0%, comprising of 25 families. On the other hand, families with 1 or 2 children have the lowest poverty rate of 1.2%, which includes 12 families.
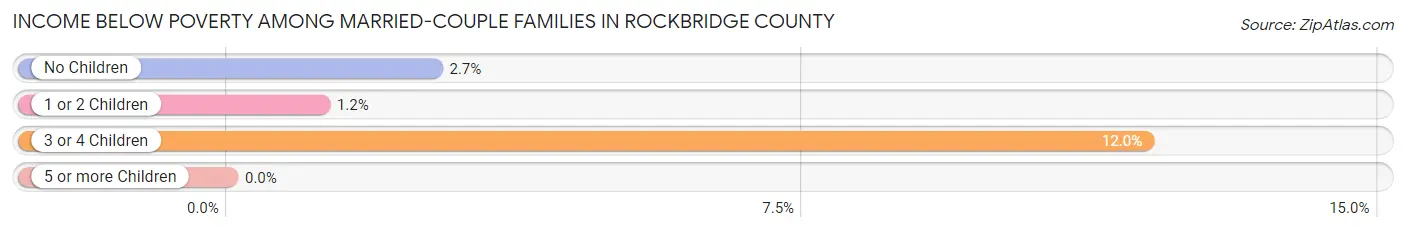
| Children | Above Poverty | Below Poverty |
| No Children | 3,533 (97.3%) | 97 (2.7%) |
| 1 or 2 Children | 985 (98.8%) | 12 (1.2%) |
| 3 or 4 Children | 184 (88.0%) | 25 (12.0%) |
| 5 or more Children | 0 (0.0%) | 0 (0.0%) |
| Total | 4,702 (97.2%) | 134 (2.8%) |
Income Below Poverty Among Single-Parent Households in Rockbridge County
According to the poverty data in Rockbridge County, 13.6% or 51 single-father households and 10.8% or 119 single-mother households are living below the poverty line. Among single-father households, those with 1 or 2 children have the highest poverty rate, with 36 households (20.8%) experiencing poverty. Likewise, among single-mother households, those with 3 or 4 children have the highest poverty rate, with 26 households (36.1%) falling below the poverty line.
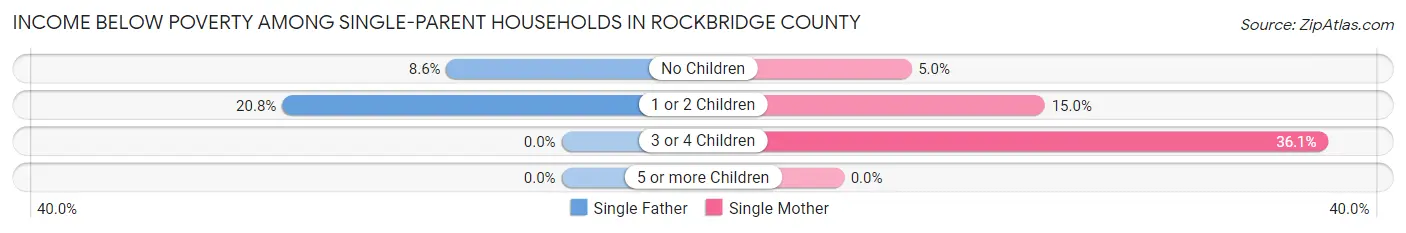
| Children | Single Father | Single Mother |
| No Children | 15 (8.6%) | 31 (5.0%) |
| 1 or 2 Children | 36 (20.8%) | 62 (15.0%) |
| 3 or 4 Children | 0 (0.0%) | 26 (36.1%) |
| 5 or more Children | 0 (0.0%) | 0 (0.0%) |
| Total | 51 (13.6%) | 119 (10.8%) |
Income Below Poverty Among Married-Couple vs Single-Parent Households in Rockbridge County
The poverty data for Rockbridge County shows that 134 of the married-couple family households (2.8%) and 170 of the single-parent households (11.5%) are living below the poverty level. Within the married-couple family households, those with 3 or 4 children have the highest poverty rate, with 25 households (12.0%) falling below the poverty line. Among the single-parent households, those with 3 or 4 children have the highest poverty rate, with 26 household (26.0%) living below poverty.
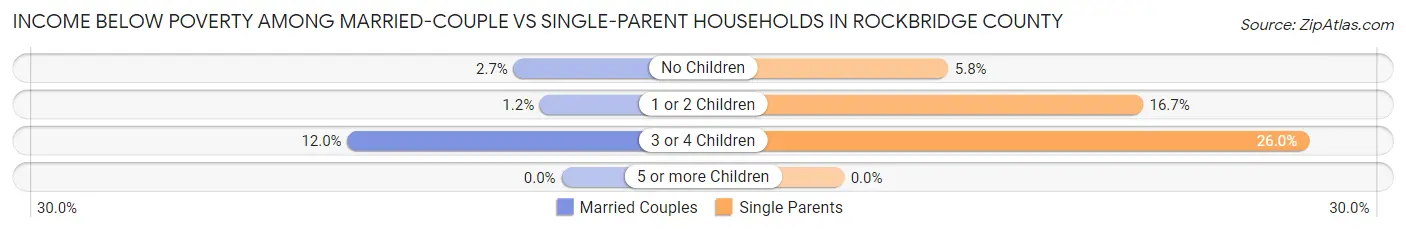
| Children | Married-Couple Families | Single-Parent Households |
| No Children | 97 (2.7%) | 46 (5.8%) |
| 1 or 2 Children | 12 (1.2%) | 98 (16.7%) |
| 3 or 4 Children | 25 (12.0%) | 26 (26.0%) |
| 5 or more Children | 0 (0.0%) | 0 (0.0%) |
| Total | 134 (2.8%) | 170 (11.5%) |
Race in Rockbridge County
The most populous races in Rockbridge County are White / Caucasian (20,712 | 91.3%), Black / African American (987 | 4.3%), and Two or more Races (509 | 2.2%).
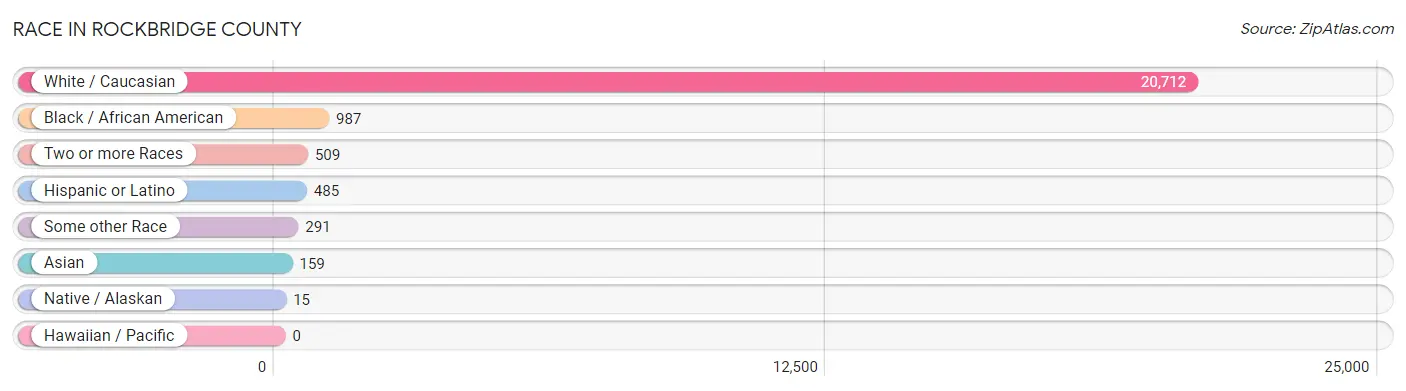
| Race | # Population | % Population |
| Asian | 159 | 0.7% |
| Black / African American | 987 | 4.3% |
| Hawaiian / Pacific | 0 | 0.0% |
| Hispanic or Latino | 485 | 2.1% |
| Native / Alaskan | 15 | 0.1% |
| White / Caucasian | 20,712 | 91.3% |
| Two or more Races | 509 | 2.2% |
| Some other Race | 291 | 1.3% |
| Total | 22,673 | 100.0% |
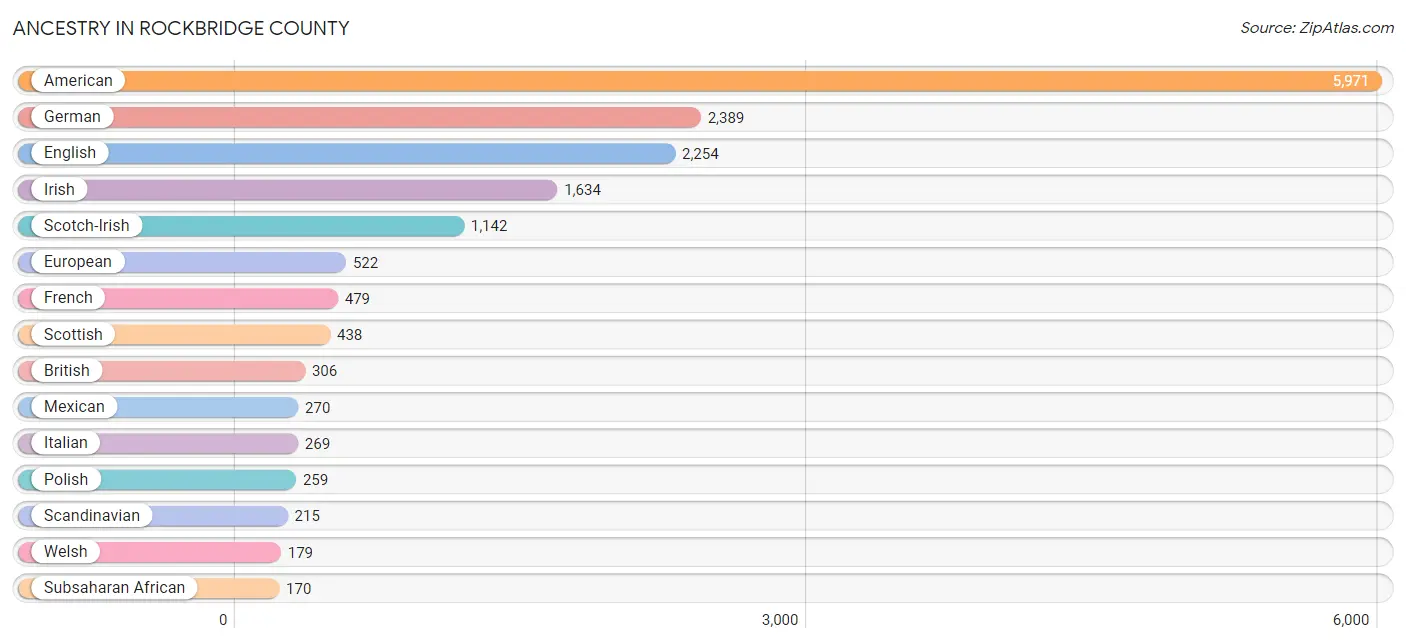
Ancestry in Rockbridge County
The most populous ancestries reported in Rockbridge County are American (5,971 | 26.3%), German (2,389 | 10.5%), English (2,254 | 9.9%), Irish (1,634 | 7.2%), and Scotch-Irish (1,142 | 5.0%), together accounting for 59.1% of all Rockbridge County residents.
| Ancestry | # Population | % Population |
| African | 65 | 0.3% |
| American | 5,971 | 26.3% |
| Arab | 10 | 0.0% |
| Armenian | 5 | 0.0% |
| Austrian | 91 | 0.4% |
| Bhutanese | 23 | 0.1% |
| Bolivian | 6 | 0.0% |
| British | 306 | 1.3% |
| Burmese | 73 | 0.3% |
| Central American | 28 | 0.1% |
| Cherokee | 33 | 0.2% |
| Chilean | 36 | 0.2% |
| Colombian | 32 | 0.1% |
| Croatian | 36 | 0.2% |
| Czech | 24 | 0.1% |
| Danish | 33 | 0.2% |
| Dutch | 112 | 0.5% |
| Eastern European | 101 | 0.4% |
| English | 2,254 | 9.9% |
| Ethiopian | 3 | 0.0% |
| European | 522 | 2.3% |
| French | 479 | 2.1% |
| French Canadian | 34 | 0.2% |
| German | 2,389 | 10.5% |
| Greek | 59 | 0.3% |
| Honduran | 1 | 0.0% |
| Hungarian | 11 | 0.1% |
| Indian (Asian) | 70 | 0.3% |
| Irish | 1,634 | 7.2% |
| Italian | 269 | 1.2% |
| Jamaican | 7 | 0.0% |
| Korean | 60 | 0.3% |
| Lithuanian | 5 | 0.0% |
| Mexican | 270 | 1.2% |
| Native Hawaiian | 15 | 0.1% |
| Nigerian | 102 | 0.4% |
| Northern European | 15 | 0.1% |
| Norwegian | 79 | 0.4% |
| Pakistani | 15 | 0.1% |
| Palestinian | 10 | 0.0% |
| Pennsylvania German | 4 | 0.0% |
| Peruvian | 56 | 0.3% |
| Polish | 259 | 1.1% |
| Puerto Rican | 45 | 0.2% |
| Russian | 99 | 0.4% |
| Salvadoran | 27 | 0.1% |
| Scandinavian | 215 | 0.9% |
| Scotch-Irish | 1,142 | 5.0% |
| Scottish | 438 | 1.9% |
| Seminole | 3 | 0.0% |
| Slavic | 52 | 0.2% |
| Slovak | 13 | 0.1% |
| South American | 130 | 0.6% |
| Spanish | 12 | 0.1% |
| Sri Lankan | 27 | 0.1% |
| Subsaharan African | 170 | 0.7% |
| Swedish | 16 | 0.1% |
| Swiss | 22 | 0.1% |
| Welsh | 179 | 0.8% | View All 59 Rows |
Immigrants in Rockbridge County
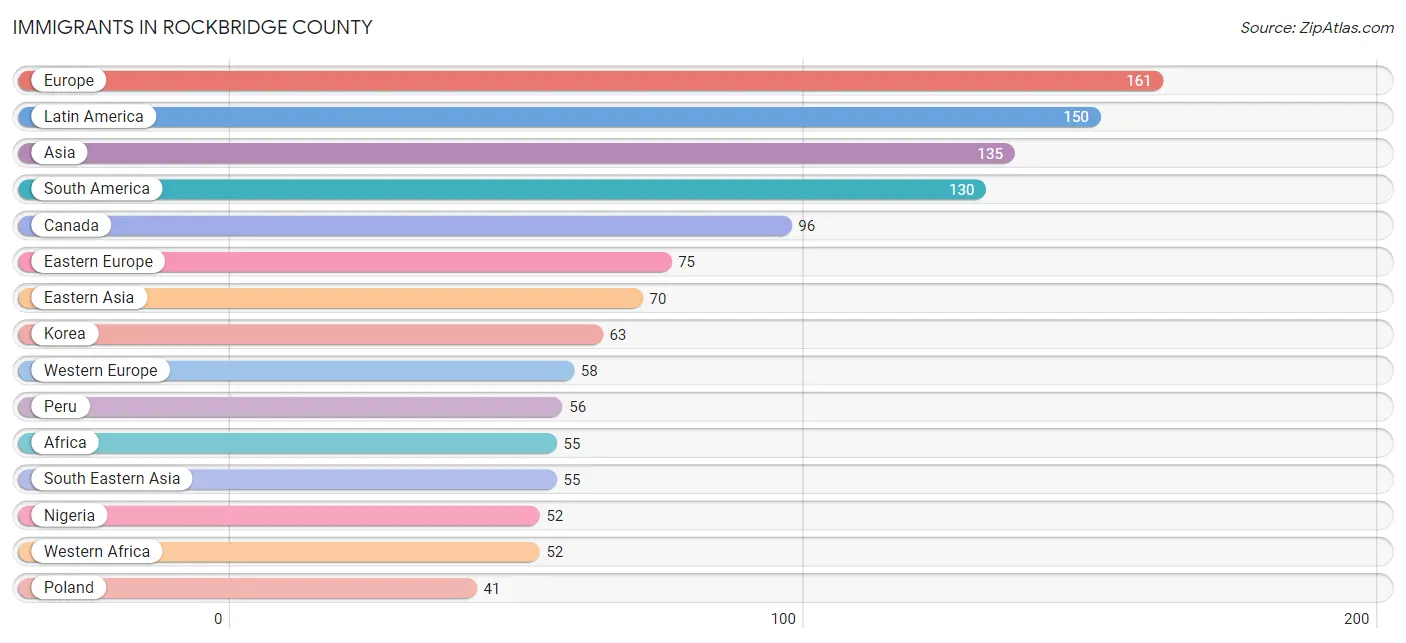
The most numerous immigrant groups reported in Rockbridge County came from Europe (161 | 0.7%), Latin America (150 | 0.7%), Asia (135 | 0.6%), South America (130 | 0.6%), and Canada (96 | 0.4%), together accounting for 3.0% of all Rockbridge County residents.
| Immigration Origin | # Population | % Population |
| Africa | 55 | 0.2% |
| Asia | 135 | 0.6% |
| Bolivia | 6 | 0.0% |
| Canada | 96 | 0.4% |
| Central America | 20 | 0.1% |
| Chile | 36 | 0.2% |
| China | 7 | 0.0% |
| Colombia | 32 | 0.1% |
| Czechoslovakia | 8 | 0.0% |
| Eastern Africa | 3 | 0.0% |
| Eastern Asia | 70 | 0.3% |
| Eastern Europe | 75 | 0.3% |
| England | 28 | 0.1% |
| Ethiopia | 3 | 0.0% |
| Europe | 161 | 0.7% |
| France | 15 | 0.1% |
| Germany | 27 | 0.1% |
| Honduras | 1 | 0.0% |
| Hong Kong | 7 | 0.0% |
| Korea | 63 | 0.3% |
| Latin America | 150 | 0.7% |
| Mexico | 19 | 0.1% |
| Netherlands | 16 | 0.1% |
| Nigeria | 52 | 0.2% |
| Northern Europe | 28 | 0.1% |
| Peru | 56 | 0.3% |
| Philippines | 28 | 0.1% |
| Poland | 41 | 0.2% |
| Russia | 26 | 0.1% |
| South America | 130 | 0.6% |
| South Eastern Asia | 55 | 0.2% |
| Vietnam | 27 | 0.1% |
| Western Africa | 52 | 0.2% |
| Western Europe | 58 | 0.3% | View All 34 Rows |
Sex and Age in Rockbridge County
Sex and Age in Rockbridge County
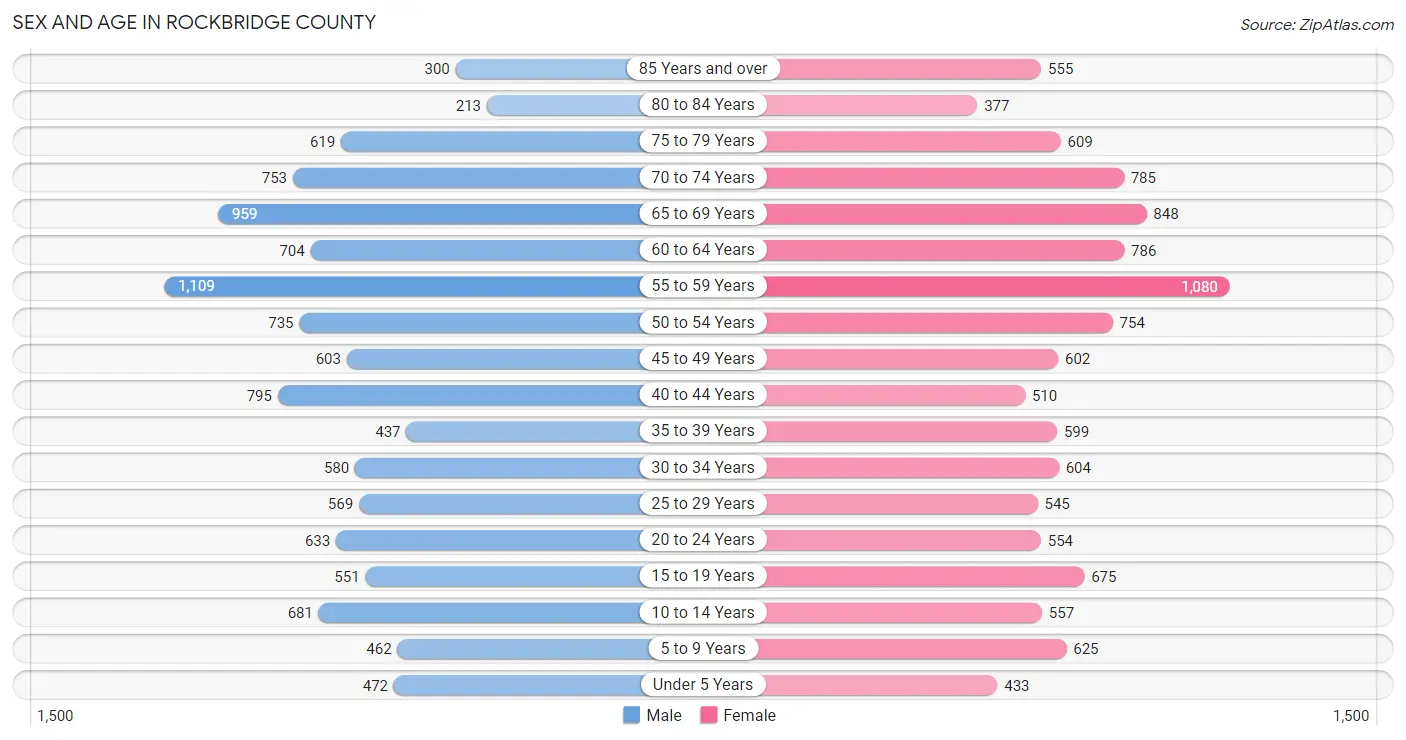
The most populous age groups in Rockbridge County are 55 to 59 Years (1,109 | 9.9%) for men and 55 to 59 Years (1,080 | 9.4%) for women.
| Age Bracket | Male | Female |
| Under 5 Years | 472 (4.2%) | 433 (3.8%) |
| 5 to 9 Years | 462 (4.1%) | 625 (5.4%) |
| 10 to 14 Years | 681 (6.1%) | 557 (4.8%) |
| 15 to 19 Years | 551 (4.9%) | 675 (5.9%) |
| 20 to 24 Years | 633 (5.7%) | 554 (4.8%) |
| 25 to 29 Years | 569 (5.1%) | 545 (4.7%) |
| 30 to 34 Years | 580 (5.2%) | 604 (5.2%) |
| 35 to 39 Years | 437 (3.9%) | 599 (5.2%) |
| 40 to 44 Years | 795 (7.1%) | 510 (4.4%) |
| 45 to 49 Years | 603 (5.4%) | 602 (5.2%) |
| 50 to 54 Years | 735 (6.6%) | 754 (6.6%) |
| 55 to 59 Years | 1,109 (9.9%) | 1,080 (9.4%) |
| 60 to 64 Years | 704 (6.3%) | 786 (6.8%) |
| 65 to 69 Years | 959 (8.6%) | 848 (7.4%) |
| 70 to 74 Years | 753 (6.7%) | 785 (6.8%) |
| 75 to 79 Years | 619 (5.5%) | 609 (5.3%) |
| 80 to 84 Years | 213 (1.9%) | 377 (3.3%) |
| 85 Years and over | 300 (2.7%) | 555 (4.8%) |
| Total | 11,175 (100.0%) | 11,498 (100.0%) |
Families and Households in Rockbridge County
Median Family Size in Rockbridge County
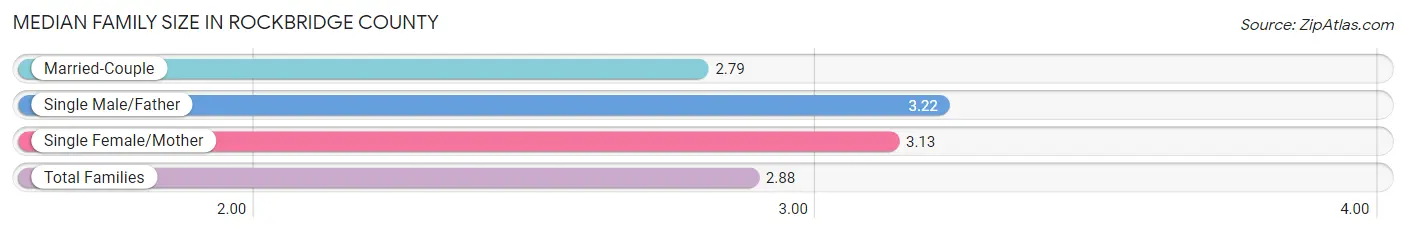
The median family size in Rockbridge County is 2.88 persons per family, with single male/father families (376 | 6.0%) accounting for the largest median family size of 3.22 persons per family. On the other hand, married-couple families (4,836 | 76.6%) represent the smallest median family size with 2.79 persons per family.
| Family Type | # Families | Family Size |
| Married-Couple | 4,836 (76.6%) | 2.79 |
| Single Male/Father | 376 (6.0%) | 3.22 |
| Single Female/Mother | 1,102 (17.4%) | 3.13 |
| Total Families | 6,314 (100.0%) | 2.88 |
Median Household Size in Rockbridge County
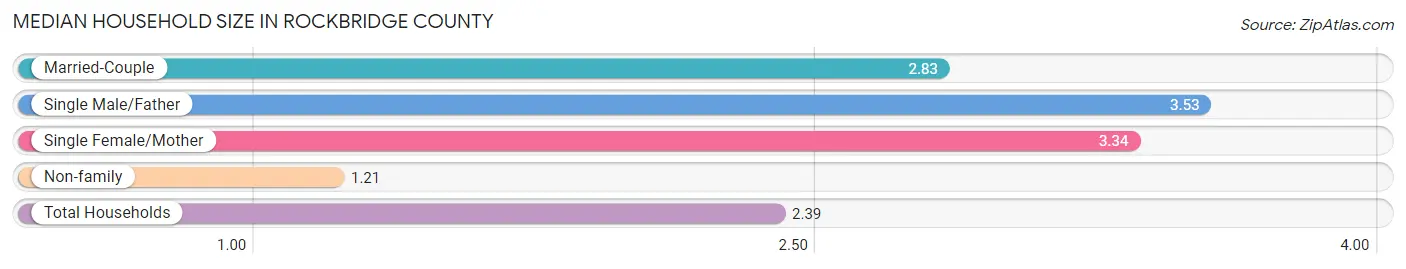
The median household size in Rockbridge County is 2.39 persons per household, with single male/father households (376 | 4.0%) accounting for the largest median household size of 3.53 persons per household. non-family households (3,054 | 32.6%) represent the smallest median household size with 1.21 persons per household.
| Household Type | # Households | Household Size |
| Married-Couple | 4,836 (51.6%) | 2.83 |
| Single Male/Father | 376 (4.0%) | 3.53 |
| Single Female/Mother | 1,102 (11.8%) | 3.34 |
| Non-family | 3,054 (32.6%) | 1.21 |
| Total Households | 9,368 (100.0%) | 2.39 |
Household Size by Marriage Status in Rockbridge County
Out of a total of 9,368 households in Rockbridge County, 6,314 (67.4%) are family households, while 3,054 (32.6%) are nonfamily households. The most numerous type of family households are 2-person households, comprising 3,793, and the most common type of nonfamily households are 1-person households, comprising 2,665.
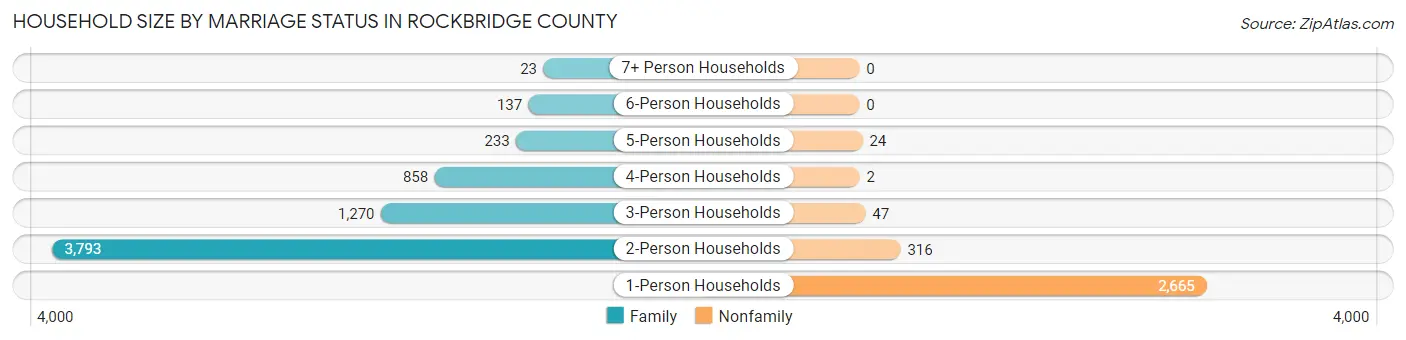
| Household Size | Family Households | Nonfamily Households |
| 1-Person Households | - | 2,665 (28.4%) |
| 2-Person Households | 3,793 (40.5%) | 316 (3.4%) |
| 3-Person Households | 1,270 (13.6%) | 47 (0.5%) |
| 4-Person Households | 858 (9.2%) | 2 (0.0%) |
| 5-Person Households | 233 (2.5%) | 24 (0.3%) |
| 6-Person Households | 137 (1.5%) | 0 (0.0%) |
| 7+ Person Households | 23 (0.3%) | 0 (0.0%) |
| Total | 6,314 (67.4%) | 3,054 (32.6%) |
Female Fertility in Rockbridge County
Fertility by Age in Rockbridge County
Average fertility rate in Rockbridge County is 40.0 births per 1,000 women. Women in the age bracket of 20 to 34 years have the highest fertility rate with 66.0 births per 1,000 women. Women in the age bracket of 20 to 34 years acount for 67.1% of all women with births.
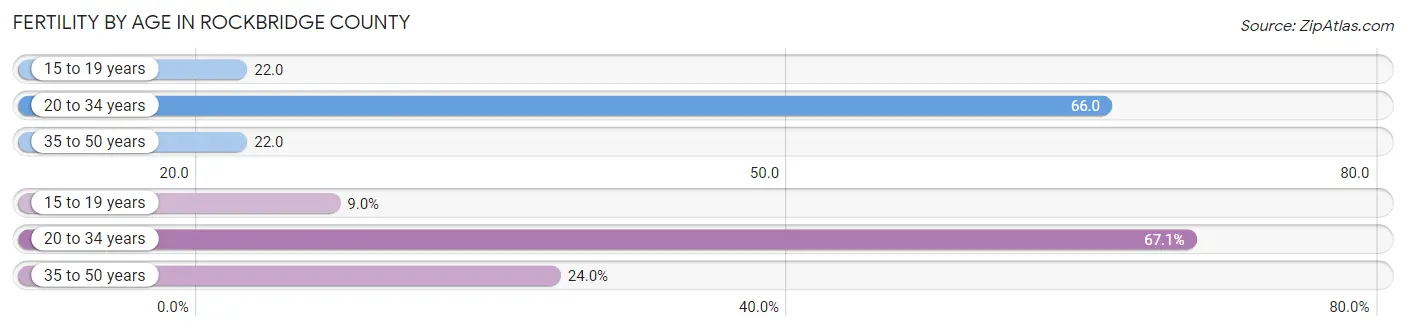
| Age Bracket | Women with Births | Births / 1,000 Women |
| 15 to 19 years | 15 (9.0%) | 22.0 |
| 20 to 34 years | 112 (67.1%) | 66.0 |
| 35 to 50 years | 40 (23.9%) | 22.0 |
| Total | 167 (100.0%) | 40.0 |
Fertility by Age by Marriage Status in Rockbridge County
68.9% of women with births (167) in Rockbridge County are married. The highest percentage of unmarried women with births falls into 15 to 19 years age bracket with 100.0% of them unmarried at the time of birth, while the lowest percentage of unmarried women with births belong to 35 to 50 years age bracket with 0.0% of them unmarried.
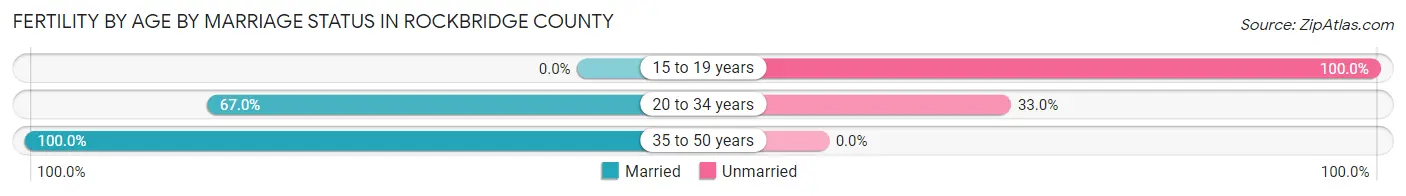
| Age Bracket | Married | Unmarried |
| 15 to 19 years | 0 (0.0%) | 15 (100.0%) |
| 20 to 34 years | 75 (67.0%) | 37 (33.0%) |
| 35 to 50 years | 40 (100.0%) | 0 (0.0%) |
| Total | 115 (68.9%) | 52 (31.1%) |
Fertility by Education in Rockbridge County
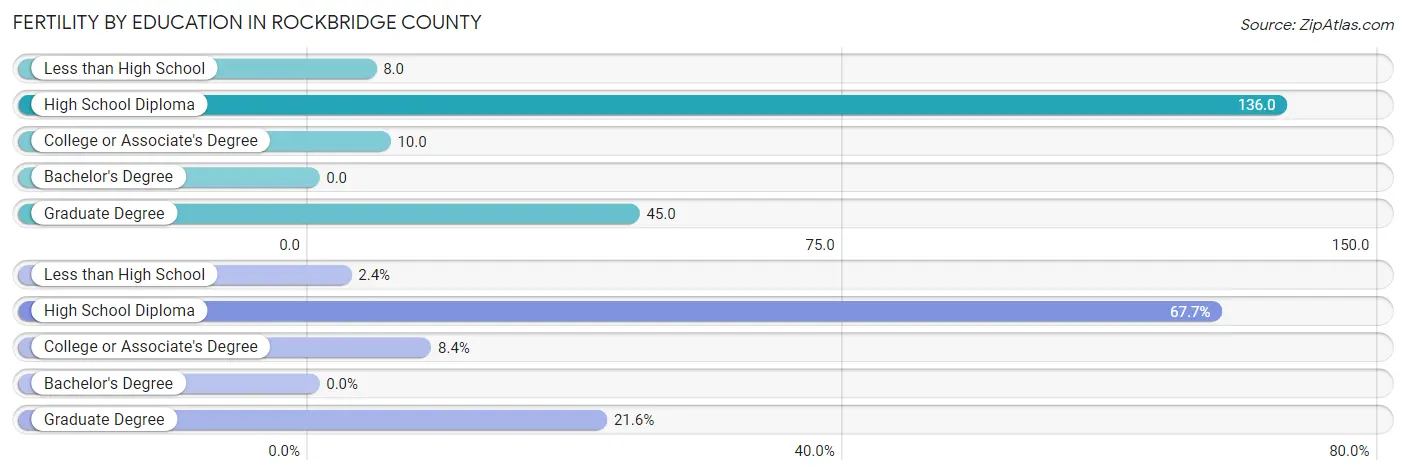
| Educational Attainment | Women with Births | Births / 1,000 Women |
| Less than High School | 4 (2.4%) | 8.0 |
| High School Diploma | 113 (67.7%) | 136.0 |
| College or Associate's Degree | 14 (8.4%) | 10.0 |
| Bachelor's Degree | 0 (0.0%) | 0.0 |
| Graduate Degree | 36 (21.6%) | 45.0 |
| Total | 167 (100.0%) | 40.0 |
Fertility by Education by Marriage Status in Rockbridge County
31.1% of women with births in Rockbridge County are unmarried. Women with the educational attainment of graduate degree are most likely to be married with 100.0% of them married at childbirth, while women with the educational attainment of less than high school are least likely to be married with 100.0% of them unmarried at childbirth.
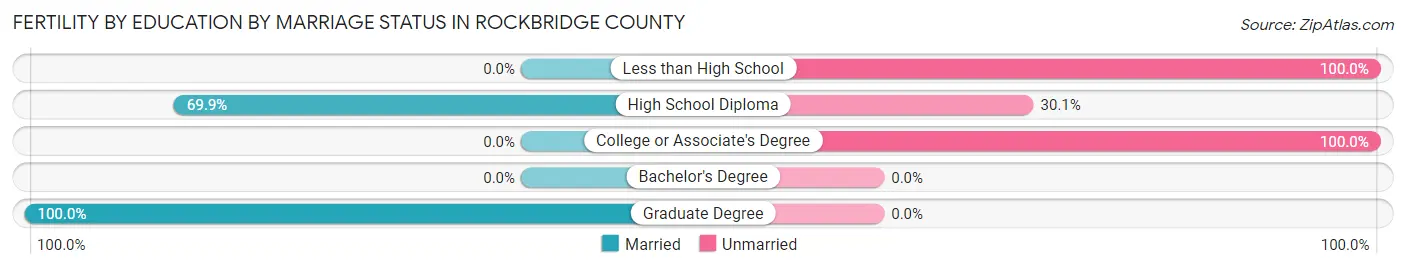
| Educational Attainment | Married | Unmarried |
| Less than High School | 0 (0.0%) | 4 (100.0%) |
| High School Diploma | 79 (69.9%) | 34 (30.1%) |
| College or Associate's Degree | 0 (0.0%) | 14 (100.0%) |
| Bachelor's Degree | 0 (0.0%) | 0 (0.0%) |
| Graduate Degree | 36 (100.0%) | 0 (0.0%) |
| Total | 115 (68.9%) | 52 (31.1%) |
Employment Characteristics in Rockbridge County
Employment by Class of Employer in Rockbridge County
Among the 9,969 employed individuals in Rockbridge County, private company employees (5,806 | 58.2%), not-for-profit organizations (960 | 9.6%), and local government employees (952 | 9.6%) make up the most common classes of employment.
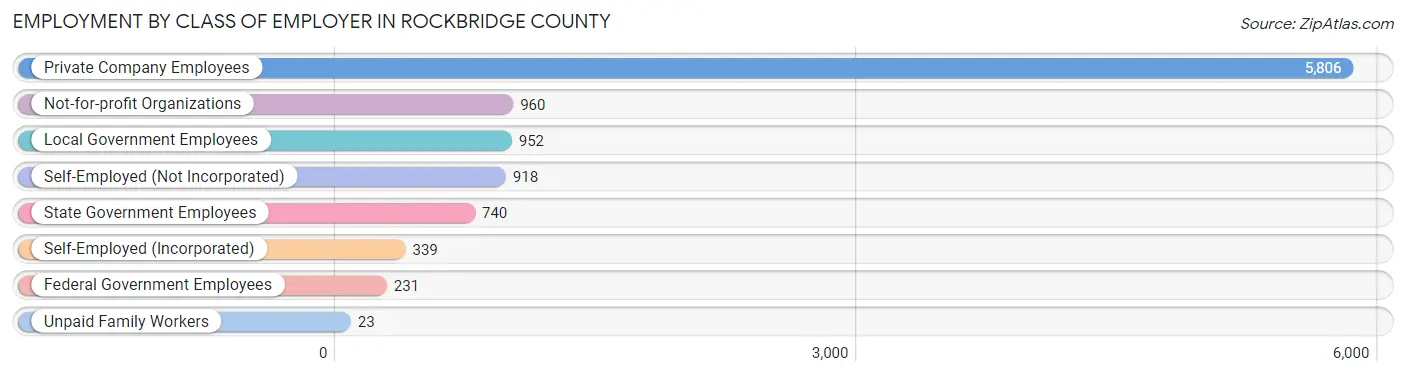
| Employer Class | # Employees | % Employees |
| Private Company Employees | 5,806 | 58.2% |
| Self-Employed (Incorporated) | 339 | 3.4% |
| Self-Employed (Not Incorporated) | 918 | 9.2% |
| Not-for-profit Organizations | 960 | 9.6% |
| Local Government Employees | 952 | 9.6% |
| State Government Employees | 740 | 7.4% |
| Federal Government Employees | 231 | 2.3% |
| Unpaid Family Workers | 23 | 0.2% |
| Total | 9,969 | 100.0% |
Employment Status by Age in Rockbridge County
According to the labor force statistics for Rockbridge County, out of the total population over 16 years of age (19,232), 55.3% or 10,635 individuals are in the labor force, with 3.9% or 415 of them unemployed. The age group with the highest labor force participation rate is 30 to 34 years, with 87.8% or 1,040 individuals in the labor force. Within the labor force, the 16 to 19 years age range has the highest percentage of unemployed individuals, with 15.8% or 56 of them being unemployed.
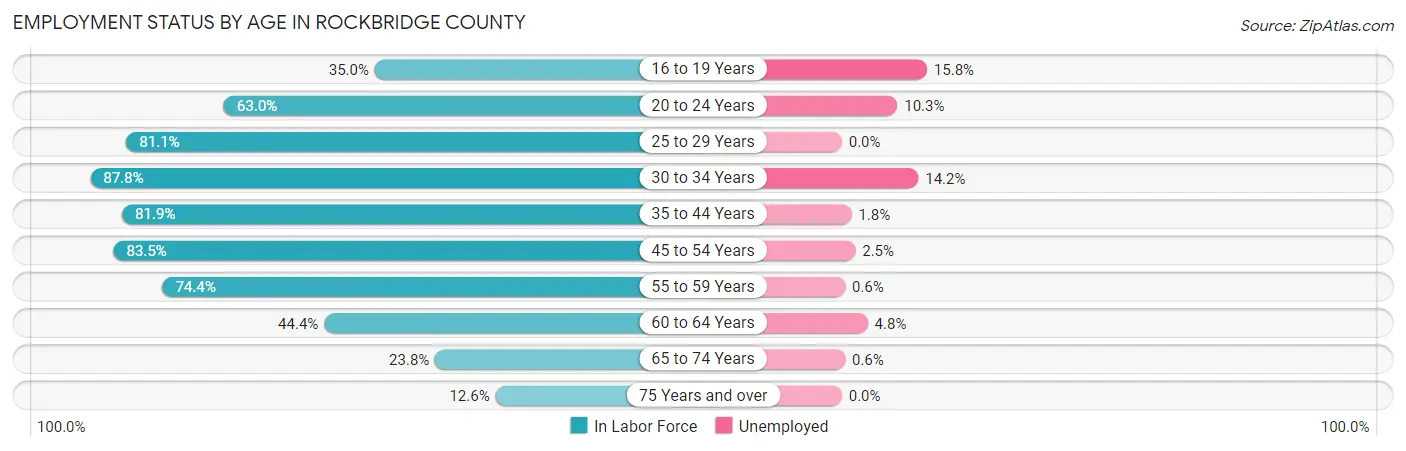
| Age Bracket | In Labor Force | Unemployed |
| 16 to 19 Years | 355 (35.0%) | 56 (15.8%) |
| 20 to 24 Years | 748 (63.0%) | 77 (10.3%) |
| 25 to 29 Years | 903 (81.1%) | 0 (0.0%) |
| 30 to 34 Years | 1,040 (87.8%) | 148 (14.2%) |
| 35 to 44 Years | 1,917 (81.9%) | 35 (1.8%) |
| 45 to 54 Years | 2,249 (83.5%) | 56 (2.5%) |
| 55 to 59 Years | 1,629 (74.4%) | 10 (0.6%) |
| 60 to 64 Years | 662 (44.4%) | 32 (4.8%) |
| 65 to 74 Years | 796 (23.8%) | 5 (0.6%) |
| 75 Years and over | 337 (12.6%) | 0 (0.0%) |
| Total | 10,635 (55.3%) | 415 (3.9%) |
Employment Status by Educational Attainment in Rockbridge County
According to labor force statistics for Rockbridge County, 76.3% of individuals (8,402) out of the total population between 25 and 64 years of age (11,012) are in the labor force, with 3.3% or 277 of them being unemployed. The group with the highest labor force participation rate are those with the educational attainment of college / associate degree, with 85.9% or 2,526 individuals in the labor force. Within the labor force, individuals with less than high school education have the highest percentage of unemployment, with 8.6% or 30 of them being unemployed.
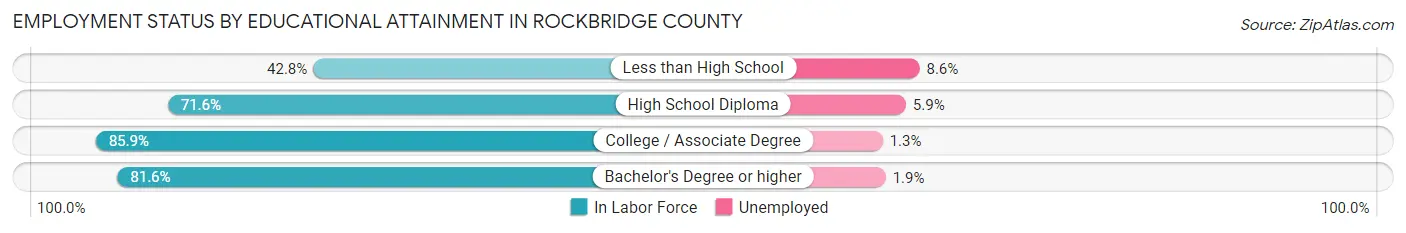
| Educational Attainment | In Labor Force | Unemployed |
| Less than High School | 348 (42.8%) | 70 (8.6%) |
| High School Diploma | 2,838 (71.6%) | 234 (5.9%) |
| College / Associate Degree | 2,526 (85.9%) | 38 (1.3%) |
| Bachelor's Degree or higher | 2,689 (81.6%) | 63 (1.9%) |
| Total | 8,402 (76.3%) | 363 (3.3%) |
Employment Occupations by Sex in Rockbridge County
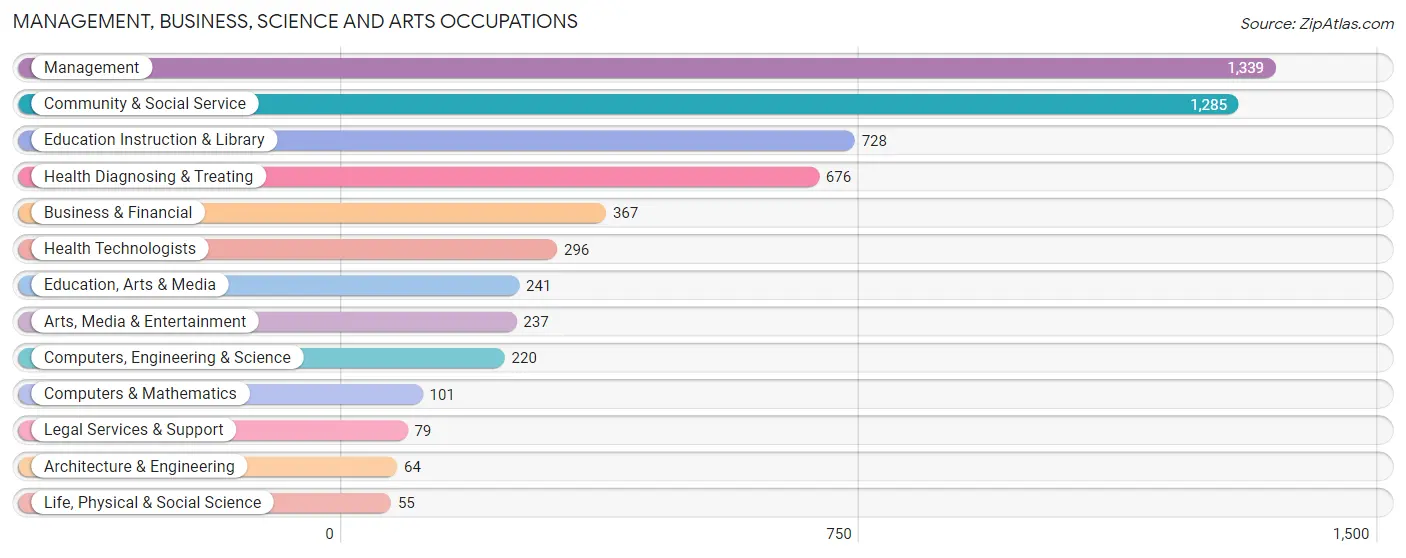
Management, Business, Science and Arts Occupations
The most common Management, Business, Science and Arts occupations in Rockbridge County are Management (1,339 | 13.2%), Community & Social Service (1,285 | 12.6%), Education Instruction & Library (728 | 7.1%), Health Diagnosing & Treating (676 | 6.6%), and Business & Financial (367 | 3.6%).
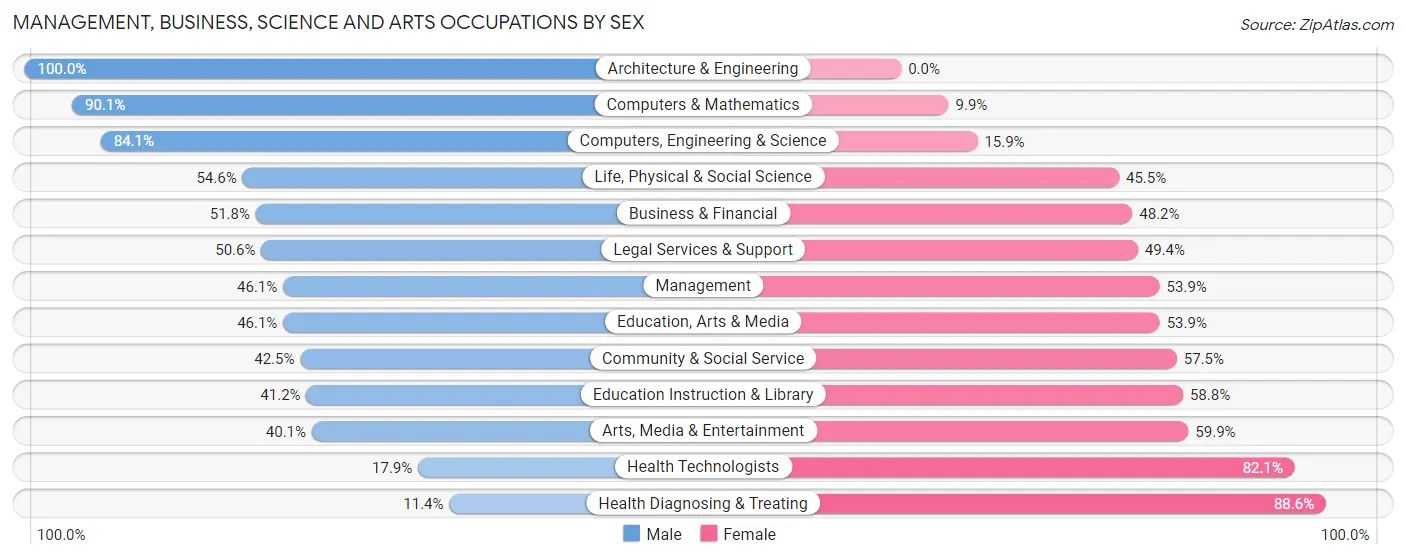
Management, Business, Science and Arts Occupations by Sex
Within the Management, Business, Science and Arts occupations in Rockbridge County, the most male-oriented occupations are Architecture & Engineering (100.0%), Computers & Mathematics (90.1%), and Computers, Engineering & Science (84.1%), while the most female-oriented occupations are Health Diagnosing & Treating (88.6%), Health Technologists (82.1%), and Arts, Media & Entertainment (59.9%).
| Occupation | Male | Female |
| Management | 617 (46.1%) | 722 (53.9%) |
| Business & Financial | 190 (51.8%) | 177 (48.2%) |
| Computers, Engineering & Science | 185 (84.1%) | 35 (15.9%) |
| Computers & Mathematics | 91 (90.1%) | 10 (9.9%) |
| Architecture & Engineering | 64 (100.0%) | 0 (0.0%) |
| Life, Physical & Social Science | 30 (54.5%) | 25 (45.5%) |
| Community & Social Service | 546 (42.5%) | 739 (57.5%) |
| Education, Arts & Media | 111 (46.1%) | 130 (53.9%) |
| Legal Services & Support | 40 (50.6%) | 39 (49.4%) |
| Education Instruction & Library | 300 (41.2%) | 428 (58.8%) |
| Arts, Media & Entertainment | 95 (40.1%) | 142 (59.9%) |
| Health Diagnosing & Treating | 77 (11.4%) | 599 (88.6%) |
| Health Technologists | 53 (17.9%) | 243 (82.1%) |
| Total (Category) | 1,615 (41.5%) | 2,272 (58.5%) |
| Total (Overall) | 5,300 (52.1%) | 4,881 (47.9%) |
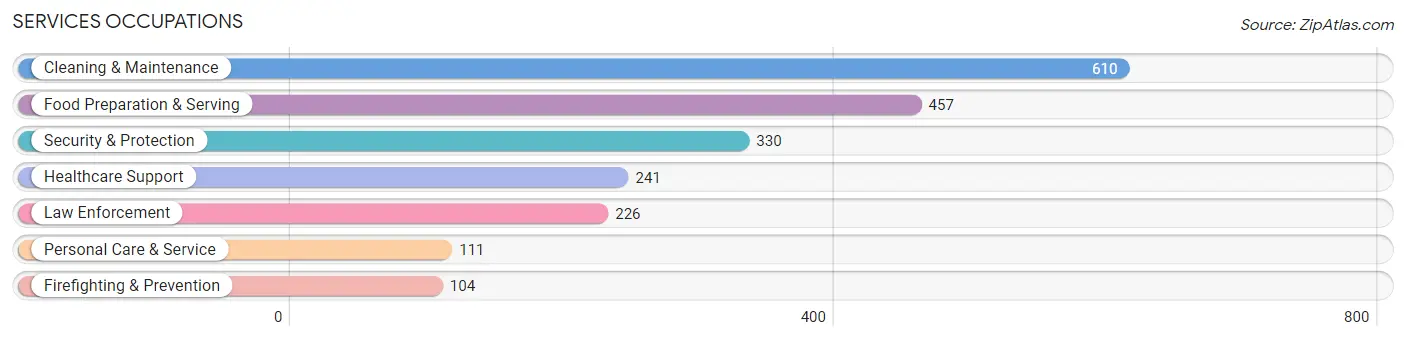
Services Occupations
The most common Services occupations in Rockbridge County are Cleaning & Maintenance (610 | 6.0%), Food Preparation & Serving (457 | 4.5%), Security & Protection (330 | 3.2%), Healthcare Support (241 | 2.4%), and Law Enforcement (226 | 2.2%).
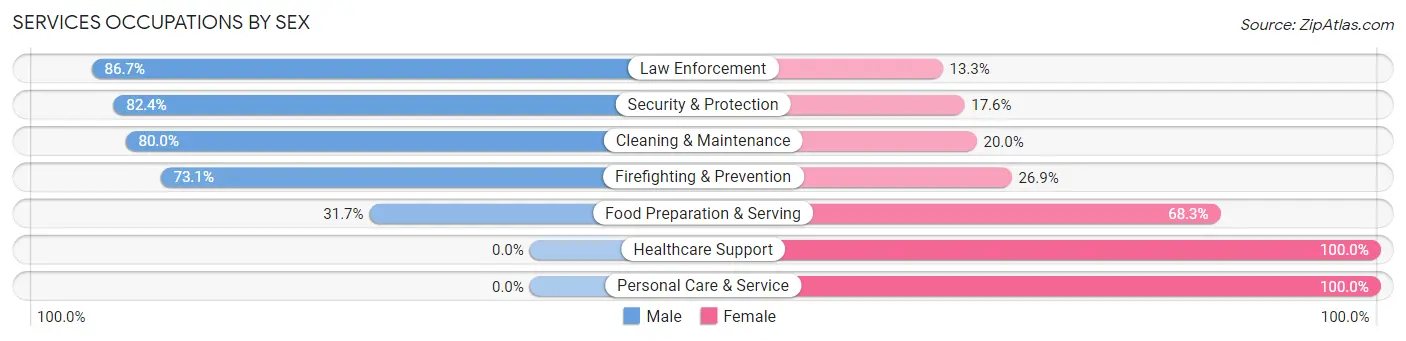
Services Occupations by Sex
Within the Services occupations in Rockbridge County, the most male-oriented occupations are Law Enforcement (86.7%), Security & Protection (82.4%), and Cleaning & Maintenance (80.0%), while the most female-oriented occupations are Healthcare Support (100.0%), Personal Care & Service (100.0%), and Food Preparation & Serving (68.3%).
| Occupation | Male | Female |
| Healthcare Support | 0 (0.0%) | 241 (100.0%) |
| Security & Protection | 272 (82.4%) | 58 (17.6%) |
| Firefighting & Prevention | 76 (73.1%) | 28 (26.9%) |
| Law Enforcement | 196 (86.7%) | 30 (13.3%) |
| Food Preparation & Serving | 145 (31.7%) | 312 (68.3%) |
| Cleaning & Maintenance | 488 (80.0%) | 122 (20.0%) |
| Personal Care & Service | 0 (0.0%) | 111 (100.0%) |
| Total (Category) | 905 (51.7%) | 844 (48.3%) |
| Total (Overall) | 5,300 (52.1%) | 4,881 (47.9%) |
Sales and Office Occupations
The most common Sales and Office occupations in Rockbridge County are Sales & Related (918 | 9.0%), and Office & Administration (854 | 8.4%).

Sales and Office Occupations by Sex

| Occupation | Male | Female |
| Sales & Related | 437 (47.6%) | 481 (52.4%) |
| Office & Administration | 60 (7.0%) | 794 (93.0%) |
| Total (Category) | 497 (28.1%) | 1,275 (72.0%) |
| Total (Overall) | 5,300 (52.1%) | 4,881 (47.9%) |
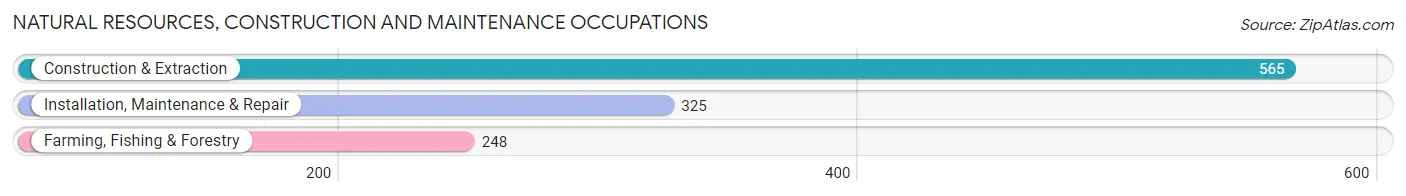
Natural Resources, Construction and Maintenance Occupations
The most common Natural Resources, Construction and Maintenance occupations in Rockbridge County are Construction & Extraction (565 | 5.6%), Installation, Maintenance & Repair (325 | 3.2%), and Farming, Fishing & Forestry (248 | 2.4%).
Natural Resources, Construction and Maintenance Occupations by Sex
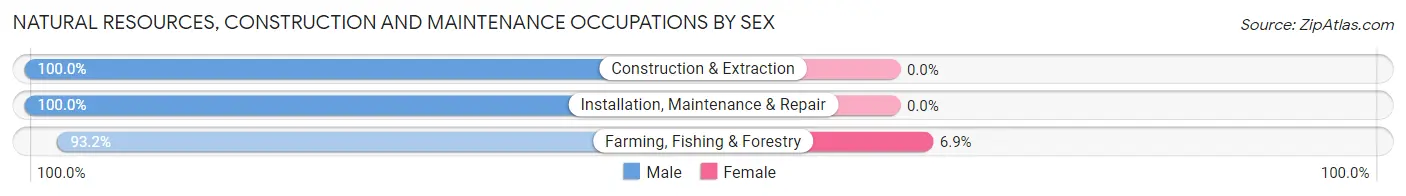
| Occupation | Male | Female |
| Farming, Fishing & Forestry | 231 (93.1%) | 17 (6.9%) |
| Construction & Extraction | 565 (100.0%) | 0 (0.0%) |
| Installation, Maintenance & Repair | 325 (100.0%) | 0 (0.0%) |
| Total (Category) | 1,121 (98.5%) | 17 (1.5%) |
| Total (Overall) | 5,300 (52.1%) | 4,881 (47.9%) |
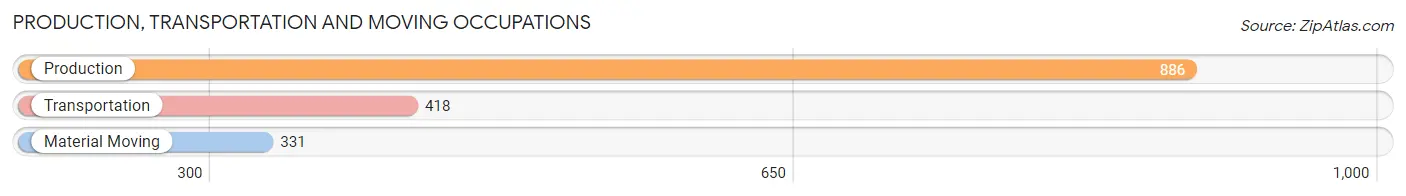
Production, Transportation and Moving Occupations
The most common Production, Transportation and Moving occupations in Rockbridge County are Production (886 | 8.7%), Transportation (418 | 4.1%), and Material Moving (331 | 3.3%).
Production, Transportation and Moving Occupations by Sex

| Occupation | Male | Female |
| Production | 603 (68.1%) | 283 (31.9%) |
| Transportation | 335 (80.1%) | 83 (19.9%) |
| Material Moving | 224 (67.7%) | 107 (32.3%) |
| Total (Category) | 1,162 (71.1%) | 473 (28.9%) |
| Total (Overall) | 5,300 (52.1%) | 4,881 (47.9%) |
Employment Industries by Sex in Rockbridge County
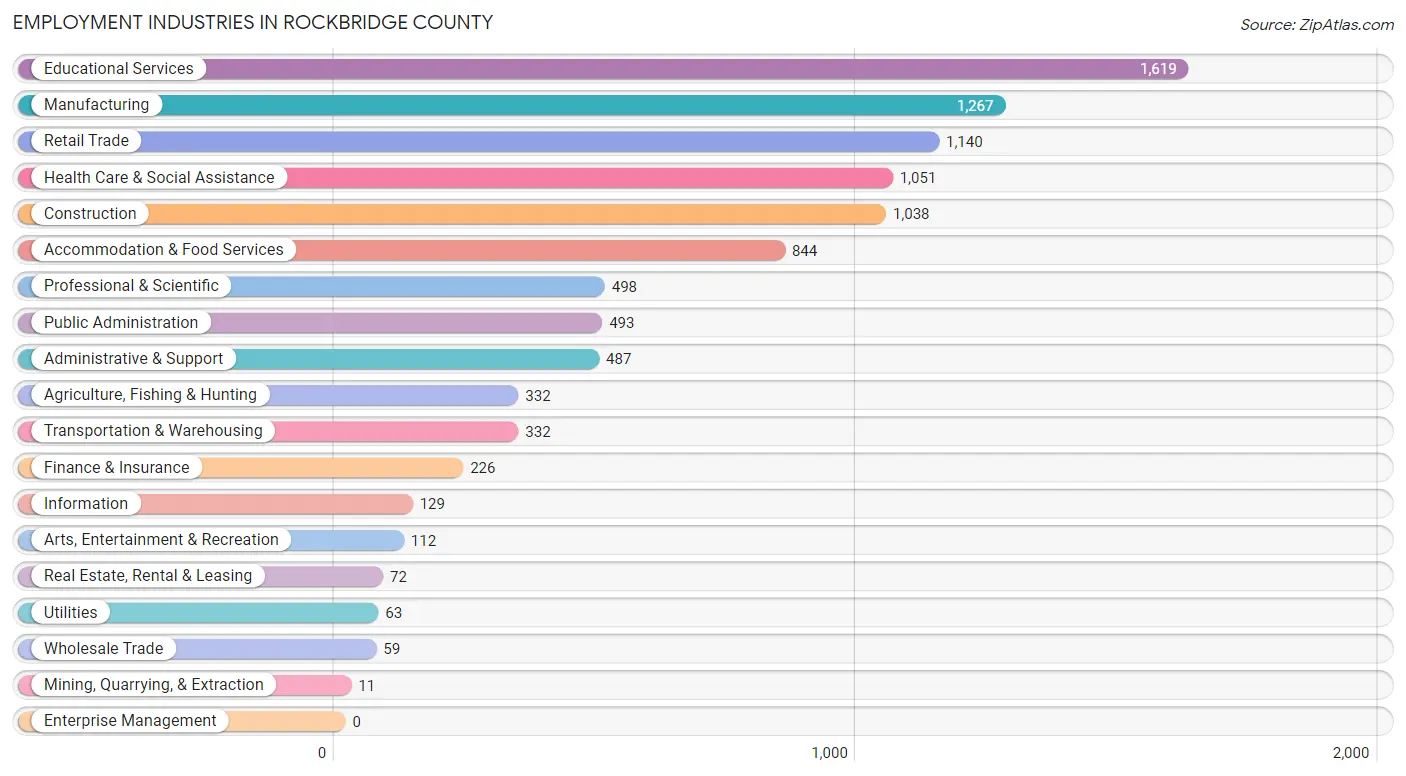
Employment Industries in Rockbridge County
The major employment industries in Rockbridge County include Educational Services (1,619 | 15.9%), Manufacturing (1,267 | 12.4%), Retail Trade (1,140 | 11.2%), Health Care & Social Assistance (1,051 | 10.3%), and Construction (1,038 | 10.2%).
Employment Industries by Sex in Rockbridge County
The Rockbridge County industries that see more men than women are Mining, Quarrying, & Extraction (100.0%), Utilities (100.0%), and Wholesale Trade (96.6%), whereas the industries that tend to have a higher number of women are Health Care & Social Assistance (91.5%), Real Estate, Rental & Leasing (90.3%), and Accommodation & Food Services (71.3%).
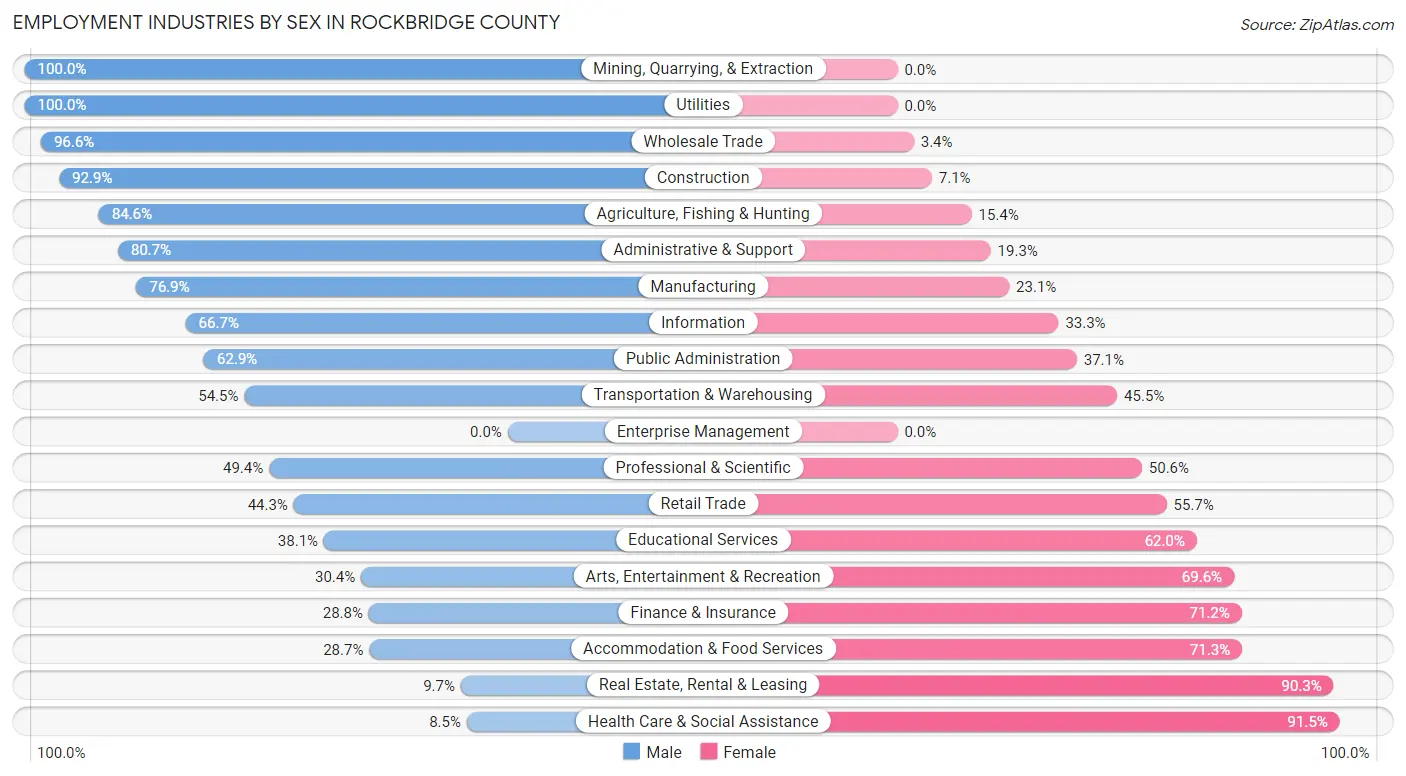
| Industry | Male | Female |
| Agriculture, Fishing & Hunting | 281 (84.6%) | 51 (15.4%) |
| Mining, Quarrying, & Extraction | 11 (100.0%) | 0 (0.0%) |
| Construction | 964 (92.9%) | 74 (7.1%) |
| Manufacturing | 974 (76.9%) | 293 (23.1%) |
| Wholesale Trade | 57 (96.6%) | 2 (3.4%) |
| Retail Trade | 505 (44.3%) | 635 (55.7%) |
| Transportation & Warehousing | 181 (54.5%) | 151 (45.5%) |
| Utilities | 63 (100.0%) | 0 (0.0%) |
| Information | 86 (66.7%) | 43 (33.3%) |
| Finance & Insurance | 65 (28.8%) | 161 (71.2%) |
| Real Estate, Rental & Leasing | 7 (9.7%) | 65 (90.3%) |
| Professional & Scientific | 246 (49.4%) | 252 (50.6%) |
| Enterprise Management | 0 (0.0%) | 0 (0.0%) |
| Administrative & Support | 393 (80.7%) | 94 (19.3%) |
| Educational Services | 616 (38.1%) | 1,003 (62.0%) |
| Health Care & Social Assistance | 89 (8.5%) | 962 (91.5%) |
| Arts, Entertainment & Recreation | 34 (30.4%) | 78 (69.6%) |
| Accommodation & Food Services | 242 (28.7%) | 602 (71.3%) |
| Public Administration | 310 (62.9%) | 183 (37.1%) |
| Total | 5,300 (52.1%) | 4,881 (47.9%) |
Education in Rockbridge County
School Enrollment in Rockbridge County
The most common levels of schooling among the 4,507 students in Rockbridge County are middle school (976 | 21.7%), high school (936 | 20.8%), and college / undergraduate (924 | 20.5%).
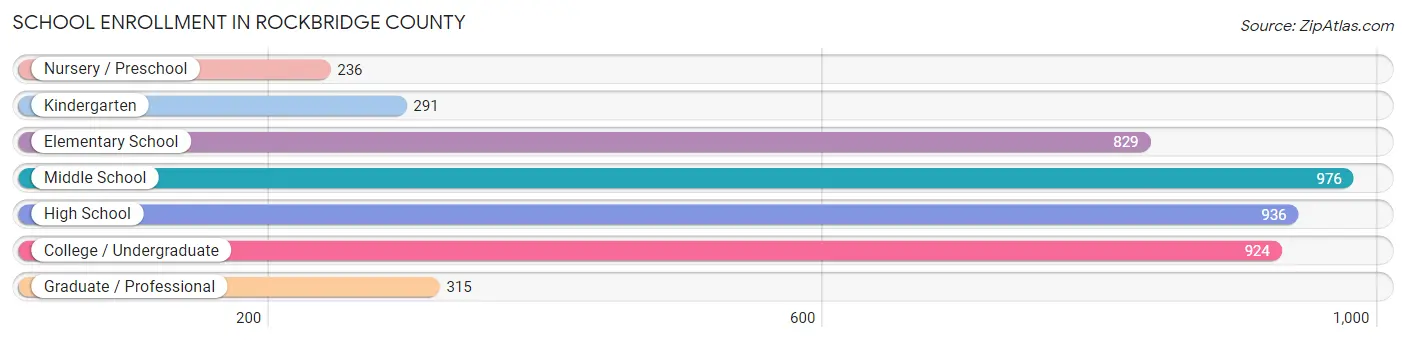
| School Level | # Students | % Students |
| Nursery / Preschool | 236 | 5.2% |
| Kindergarten | 291 | 6.5% |
| Elementary School | 829 | 18.4% |
| Middle School | 976 | 21.7% |
| High School | 936 | 20.8% |
| College / Undergraduate | 924 | 20.5% |
| Graduate / Professional | 315 | 7.0% |
| Total | 4,507 | 100.0% |
School Enrollment by Age by Funding Source in Rockbridge County
Out of a total of 4,507 students who are enrolled in schools in Rockbridge County, 1,059 (23.5%) attend a private institution, while the remaining 3,448 (76.5%) are enrolled in public schools. The age group of 20 to 24 year olds has the highest likelihood of being enrolled in private schools, with 359 (63.5% in the age bracket) enrolled. Conversely, the age group of 10 to 14 year olds has the lowest likelihood of being enrolled in a private school, with 1,104 (94.9% in the age bracket) attending a public institution.
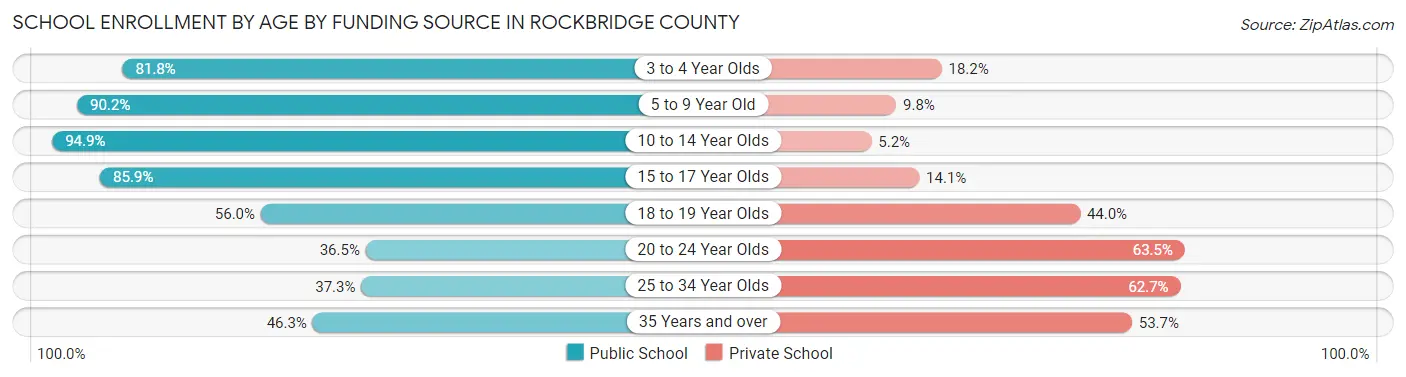
| Age Bracket | Public School | Private School |
| 3 to 4 Year Olds | 148 (81.8%) | 33 (18.2%) |
| 5 to 9 Year Old | 942 (90.2%) | 102 (9.8%) |
| 10 to 14 Year Olds | 1,104 (94.9%) | 60 (5.1%) |
| 15 to 17 Year Olds | 697 (85.9%) | 114 (14.1%) |
| 18 to 19 Year Olds | 173 (56.0%) | 136 (44.0%) |
| 20 to 24 Year Olds | 206 (36.5%) | 359 (63.5%) |
| 25 to 34 Year Olds | 85 (37.3%) | 143 (62.7%) |
| 35 Years and over | 95 (46.3%) | 110 (53.7%) |
| Total | 3,448 (76.5%) | 1,059 (23.5%) |
Educational Attainment by Field of Study in Rockbridge County
Business (707 | 12.7%), social sciences (647 | 11.6%), science & technology (633 | 11.3%), education (627 | 11.2%), and bio, nature & agricultural (485 | 8.7%) are the most common fields of study among 5,584 individuals in Rockbridge County who have obtained a bachelor's degree or higher.
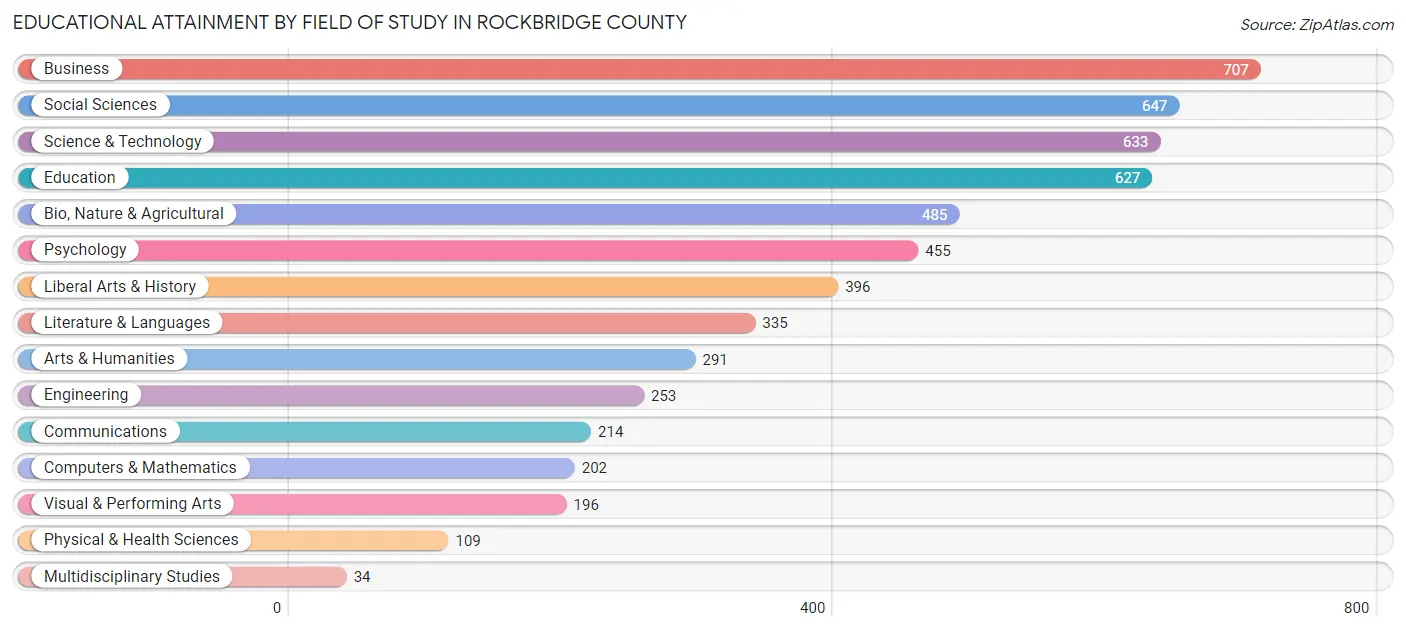
| Field of Study | # Graduates | % Graduates |
| Computers & Mathematics | 202 | 3.6% |
| Bio, Nature & Agricultural | 485 | 8.7% |
| Physical & Health Sciences | 109 | 1.9% |
| Psychology | 455 | 8.2% |
| Social Sciences | 647 | 11.6% |
| Engineering | 253 | 4.5% |
| Multidisciplinary Studies | 34 | 0.6% |
| Science & Technology | 633 | 11.3% |
| Business | 707 | 12.7% |
| Education | 627 | 11.2% |
| Literature & Languages | 335 | 6.0% |
| Liberal Arts & History | 396 | 7.1% |
| Visual & Performing Arts | 196 | 3.5% |
| Communications | 214 | 3.8% |
| Arts & Humanities | 291 | 5.2% |
| Total | 5,584 | 100.0% |
Transportation & Commute in Rockbridge County
Vehicle Availability by Sex in Rockbridge County
The most prevalent vehicle ownership categories in Rockbridge County are males with 2 vehicles (1,540, accounting for 29.8%) and females with 2 vehicles (1,460, making up 32.3%).
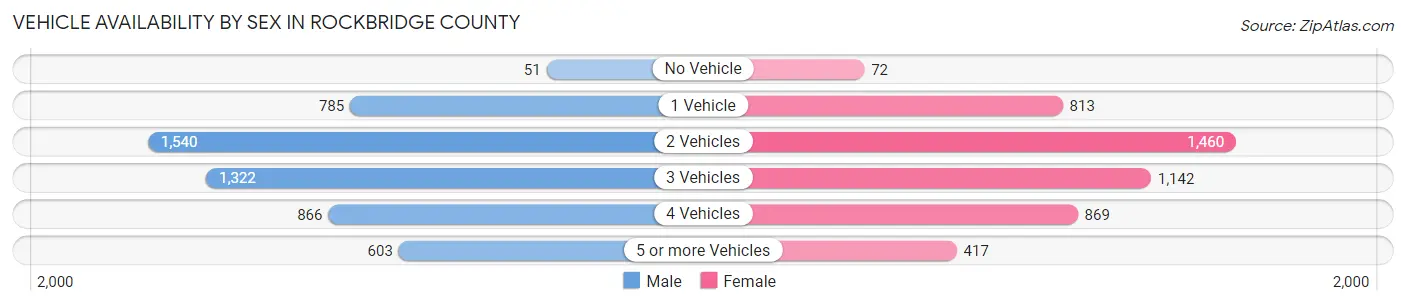
| Vehicles Available | Male | Female |
| No Vehicle | 51 (1.0%) | 72 (1.5%) |
| 1 Vehicle | 785 (15.2%) | 813 (17.0%) |
| 2 Vehicles | 1,540 (29.8%) | 1,460 (30.6%) |
| 3 Vehicles | 1,322 (25.6%) | 1,142 (23.9%) |
| 4 Vehicles | 866 (16.8%) | 869 (18.2%) |
| 5 or more Vehicles | 603 (11.7%) | 417 (8.7%) |
| Total | 5,167 (100.0%) | 4,773 (100.0%) |
Commute Time in Rockbridge County
The most frequently occuring commute durations in Rockbridge County are 10 to 14 minutes (1,789 commuters, 19.7%), 30 to 34 minutes (1,455 commuters, 16.0%), and 15 to 19 minutes (1,077 commuters, 11.8%).
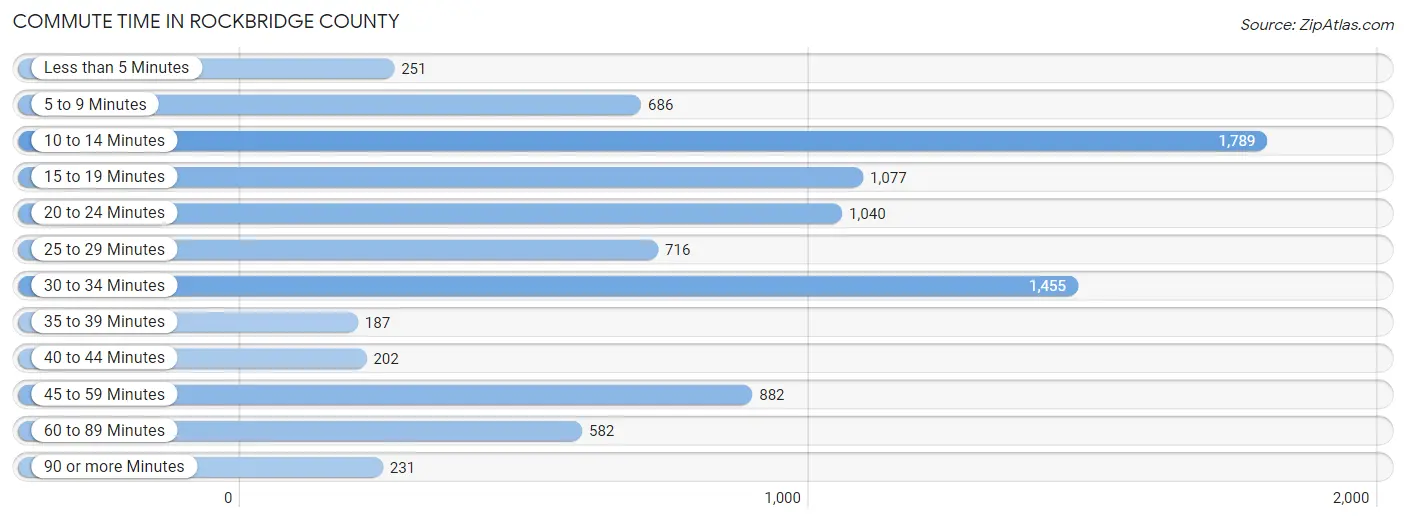
| Commute Time | # Commuters | % Commuters |
| Less than 5 Minutes | 251 | 2.8% |
| 5 to 9 Minutes | 686 | 7.5% |
| 10 to 14 Minutes | 1,789 | 19.7% |
| 15 to 19 Minutes | 1,077 | 11.8% |
| 20 to 24 Minutes | 1,040 | 11.4% |
| 25 to 29 Minutes | 716 | 7.9% |
| 30 to 34 Minutes | 1,455 | 16.0% |
| 35 to 39 Minutes | 187 | 2.1% |
| 40 to 44 Minutes | 202 | 2.2% |
| 45 to 59 Minutes | 882 | 9.7% |
| 60 to 89 Minutes | 582 | 6.4% |
| 90 or more Minutes | 231 | 2.5% |
Commute Time by Sex in Rockbridge County
The most common commute times in Rockbridge County are 10 to 14 minutes (945 commuters, 20.2%) for males and 30 to 34 minutes (849 commuters, 19.2%) for females.
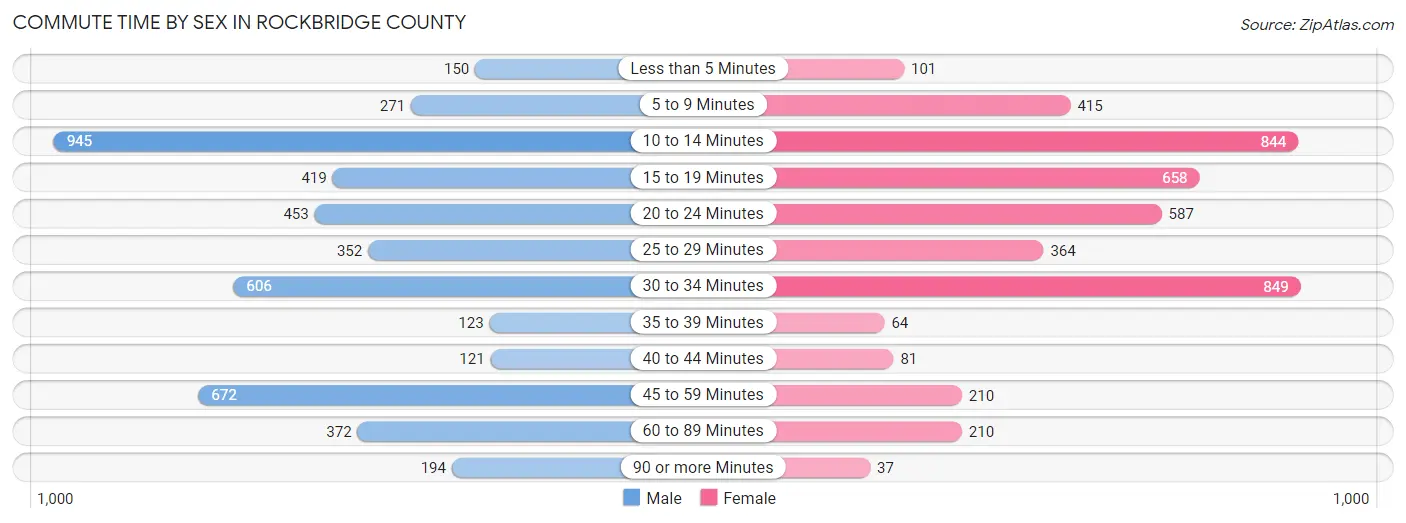
| Commute Time | Male | Female |
| Less than 5 Minutes | 150 (3.2%) | 101 (2.3%) |
| 5 to 9 Minutes | 271 (5.8%) | 415 (9.4%) |
| 10 to 14 Minutes | 945 (20.2%) | 844 (19.1%) |
| 15 to 19 Minutes | 419 (9.0%) | 658 (14.9%) |
| 20 to 24 Minutes | 453 (9.7%) | 587 (13.3%) |
| 25 to 29 Minutes | 352 (7.5%) | 364 (8.2%) |
| 30 to 34 Minutes | 606 (13.0%) | 849 (19.2%) |
| 35 to 39 Minutes | 123 (2.6%) | 64 (1.5%) |
| 40 to 44 Minutes | 121 (2.6%) | 81 (1.8%) |
| 45 to 59 Minutes | 672 (14.4%) | 210 (4.8%) |
| 60 to 89 Minutes | 372 (8.0%) | 210 (4.8%) |
| 90 or more Minutes | 194 (4.2%) | 37 (0.8%) |
Time of Departure to Work by Sex in Rockbridge County
The most frequent times of departure to work in Rockbridge County are 7:00 AM to 7:29 AM (709, 15.2%) for males and 7:30 AM to 7:59 AM (993, 22.5%) for females.
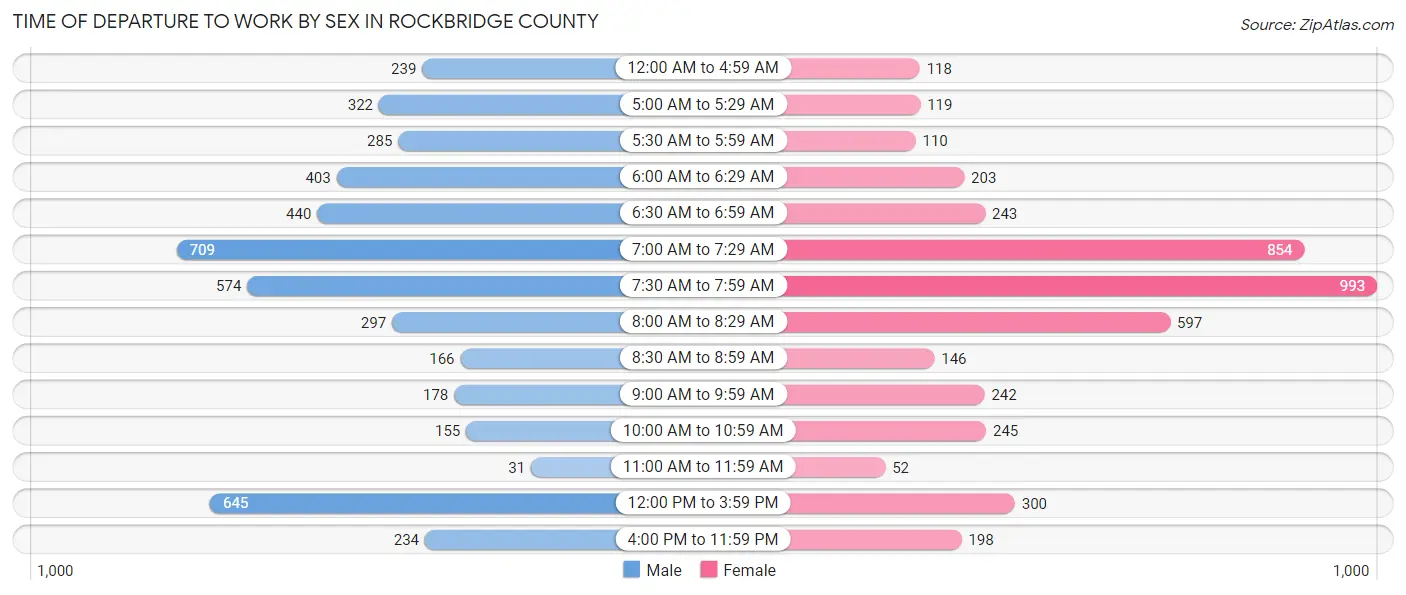
| Time of Departure | Male | Female |
| 12:00 AM to 4:59 AM | 239 (5.1%) | 118 (2.7%) |
| 5:00 AM to 5:29 AM | 322 (6.9%) | 119 (2.7%) |
| 5:30 AM to 5:59 AM | 285 (6.1%) | 110 (2.5%) |
| 6:00 AM to 6:29 AM | 403 (8.6%) | 203 (4.6%) |
| 6:30 AM to 6:59 AM | 440 (9.4%) | 243 (5.5%) |
| 7:00 AM to 7:29 AM | 709 (15.2%) | 854 (19.3%) |
| 7:30 AM to 7:59 AM | 574 (12.3%) | 993 (22.5%) |
| 8:00 AM to 8:29 AM | 297 (6.4%) | 597 (13.5%) |
| 8:30 AM to 8:59 AM | 166 (3.5%) | 146 (3.3%) |
| 9:00 AM to 9:59 AM | 178 (3.8%) | 242 (5.5%) |
| 10:00 AM to 10:59 AM | 155 (3.3%) | 245 (5.5%) |
| 11:00 AM to 11:59 AM | 31 (0.7%) | 52 (1.2%) |
| 12:00 PM to 3:59 PM | 645 (13.8%) | 300 (6.8%) |
| 4:00 PM to 11:59 PM | 234 (5.0%) | 198 (4.5%) |
| Total | 4,678 (100.0%) | 4,420 (100.0%) |
Housing Occupancy in Rockbridge County
Occupancy by Ownership in Rockbridge County
Of the total 9,368 dwellings in Rockbridge County, owner-occupied units account for 7,326 (78.2%), while renter-occupied units make up 2,042 (21.8%).
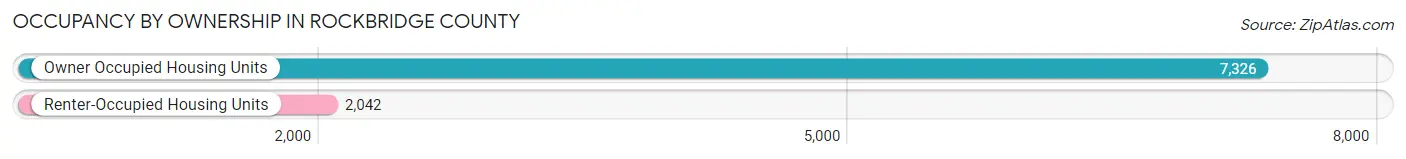
| Occupancy | # Housing Units | % Housing Units |
| Owner Occupied Housing Units | 7,326 | 78.2% |
| Renter-Occupied Housing Units | 2,042 | 21.8% |
| Total Occupied Housing Units | 9,368 | 100.0% |
Occupancy by Household Size in Rockbridge County
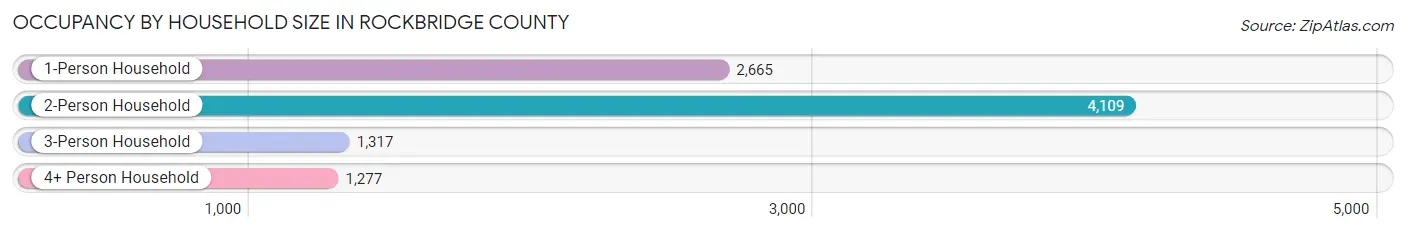
| Household Size | # Housing Units | % Housing Units |
| 1-Person Household | 2,665 | 28.4% |
| 2-Person Household | 4,109 | 43.9% |
| 3-Person Household | 1,317 | 14.1% |
| 4+ Person Household | 1,277 | 13.6% |
| Total Housing Units | 9,368 | 100.0% |
Occupancy by Ownership by Household Size in Rockbridge County
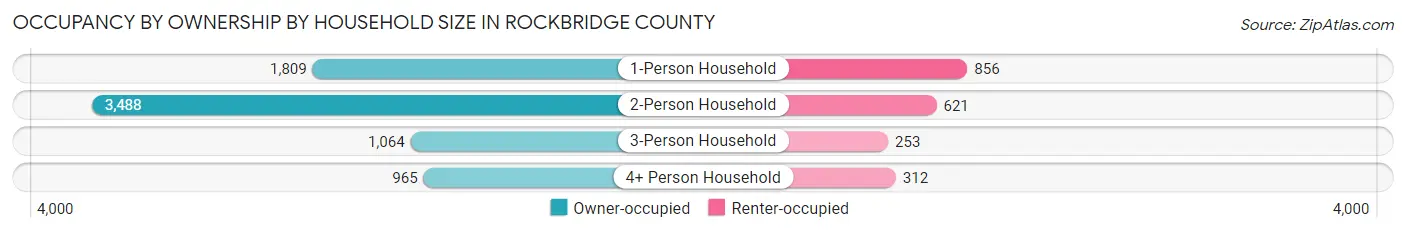
| Household Size | Owner-occupied | Renter-occupied |
| 1-Person Household | 1,809 (67.9%) | 856 (32.1%) |
| 2-Person Household | 3,488 (84.9%) | 621 (15.1%) |
| 3-Person Household | 1,064 (80.8%) | 253 (19.2%) |
| 4+ Person Household | 965 (75.6%) | 312 (24.4%) |
| Total Housing Units | 7,326 (78.2%) | 2,042 (21.8%) |
Occupancy by Educational Attainment in Rockbridge County
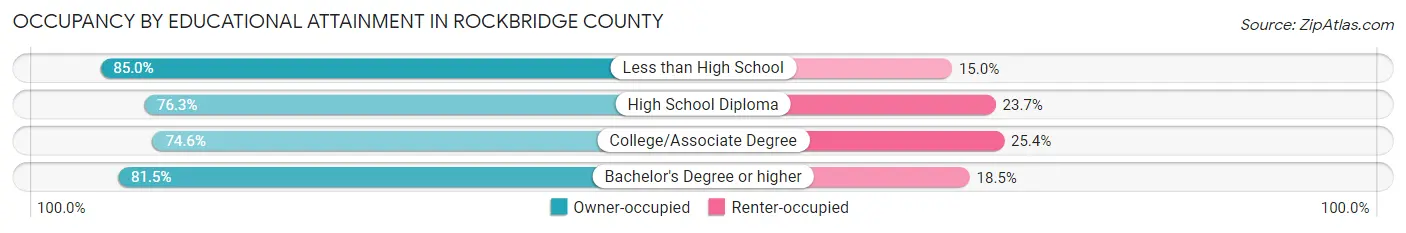
| Household Size | Owner-occupied | Renter-occupied |
| Less than High School | 763 (85.0%) | 135 (15.0%) |
| High School Diploma | 2,220 (76.3%) | 689 (23.7%) |
| College/Associate Degree | 2,049 (74.6%) | 696 (25.4%) |
| Bachelor's Degree or higher | 2,294 (81.5%) | 522 (18.5%) |
Occupancy by Age of Householder in Rockbridge County
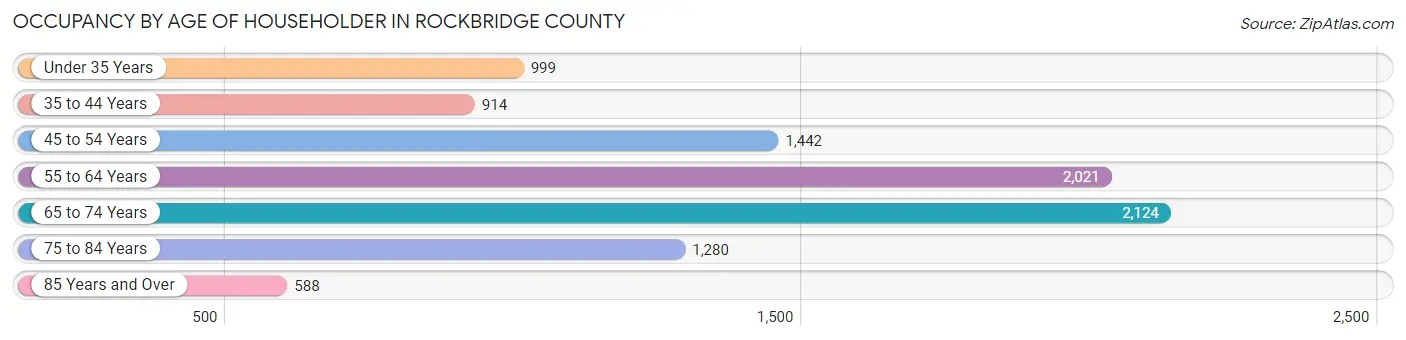
| Age Bracket | # Households | % Households |
| Under 35 Years | 999 | 10.7% |
| 35 to 44 Years | 914 | 9.8% |
| 45 to 54 Years | 1,442 | 15.4% |
| 55 to 64 Years | 2,021 | 21.6% |
| 65 to 74 Years | 2,124 | 22.7% |
| 75 to 84 Years | 1,280 | 13.7% |
| 85 Years and Over | 588 | 6.3% |
| Total | 9,368 | 100.0% |
Housing Finances in Rockbridge County
Median Income by Occupancy in Rockbridge County
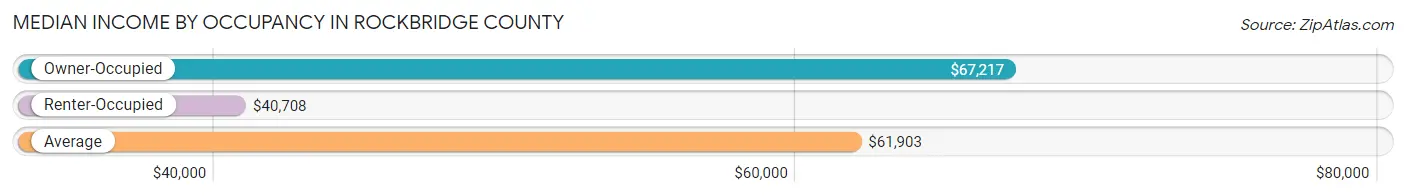
| Occupancy Type | # Households | Median Income |
| Owner-Occupied | 7,326 (78.2%) | $67,217 |
| Renter-Occupied | 2,042 (21.8%) | $40,708 |
| Average | 9,368 (100.0%) | $61,903 |
Occupancy by Householder Income Bracket in Rockbridge County
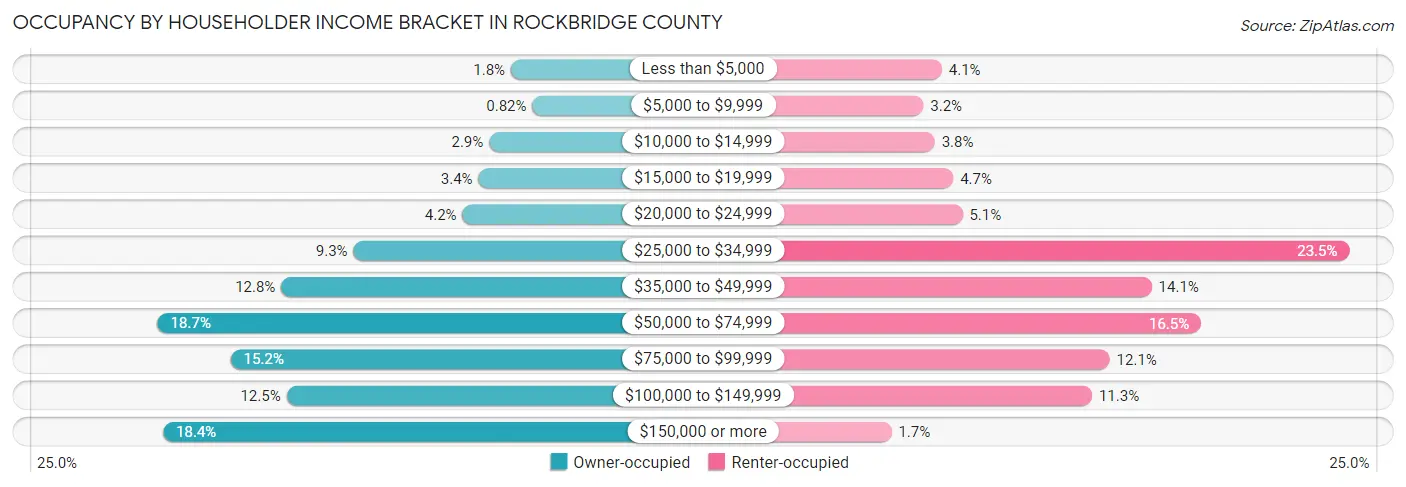
| Income Bracket | Owner-occupied | Renter-occupied |
| Less than $5,000 | 135 (1.8%) | 84 (4.1%) |
| $5,000 to $9,999 | 60 (0.8%) | 66 (3.2%) |
| $10,000 to $14,999 | 211 (2.9%) | 77 (3.8%) |
| $15,000 to $19,999 | 248 (3.4%) | 95 (4.6%) |
| $20,000 to $24,999 | 304 (4.2%) | 104 (5.1%) |
| $25,000 to $34,999 | 684 (9.3%) | 480 (23.5%) |
| $35,000 to $49,999 | 936 (12.8%) | 288 (14.1%) |
| $50,000 to $74,999 | 1,368 (18.7%) | 336 (16.5%) |
| $75,000 to $99,999 | 1,113 (15.2%) | 247 (12.1%) |
| $100,000 to $149,999 | 918 (12.5%) | 230 (11.3%) |
| $150,000 or more | 1,349 (18.4%) | 35 (1.7%) |
| Total | 7,326 (100.0%) | 2,042 (100.0%) |
Monthly Housing Cost Tiers in Rockbridge County
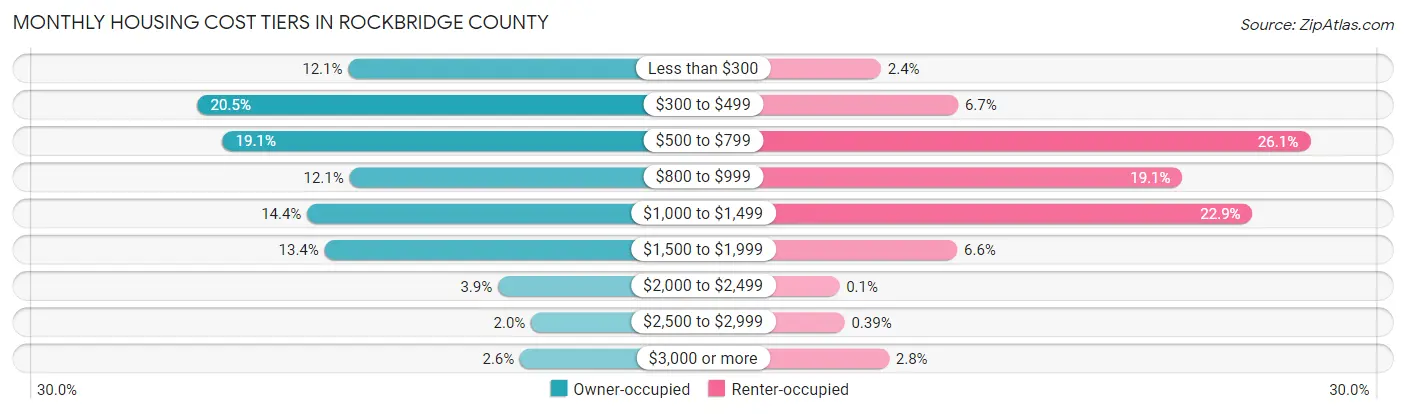
| Monthly Cost | Owner-occupied | Renter-occupied |
| Less than $300 | 888 (12.1%) | 49 (2.4%) |
| $300 to $499 | 1,498 (20.4%) | 136 (6.7%) |
| $500 to $799 | 1,396 (19.1%) | 533 (26.1%) |
| $800 to $999 | 883 (12.0%) | 389 (19.1%) |
| $1,000 to $1,499 | 1,054 (14.4%) | 468 (22.9%) |
| $1,500 to $1,999 | 984 (13.4%) | 135 (6.6%) |
| $2,000 to $2,499 | 282 (3.8%) | 2 (0.1%) |
| $2,500 to $2,999 | 148 (2.0%) | 8 (0.4%) |
| $3,000 or more | 193 (2.6%) | 58 (2.8%) |
| Total | 7,326 (100.0%) | 2,042 (100.0%) |
Physical Housing Characteristics in Rockbridge County
Housing Structures in Rockbridge County
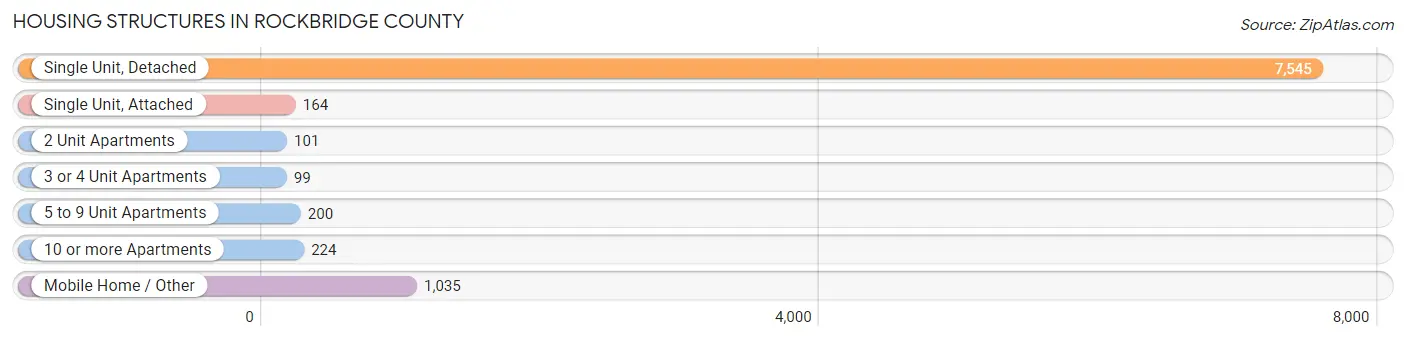
| Structure Type | # Housing Units | % Housing Units |
| Single Unit, Detached | 7,545 | 80.5% |
| Single Unit, Attached | 164 | 1.8% |
| 2 Unit Apartments | 101 | 1.1% |
| 3 or 4 Unit Apartments | 99 | 1.1% |
| 5 to 9 Unit Apartments | 200 | 2.1% |
| 10 or more Apartments | 224 | 2.4% |
| Mobile Home / Other | 1,035 | 11.1% |
| Total | 9,368 | 100.0% |
Housing Structures by Occupancy in Rockbridge County
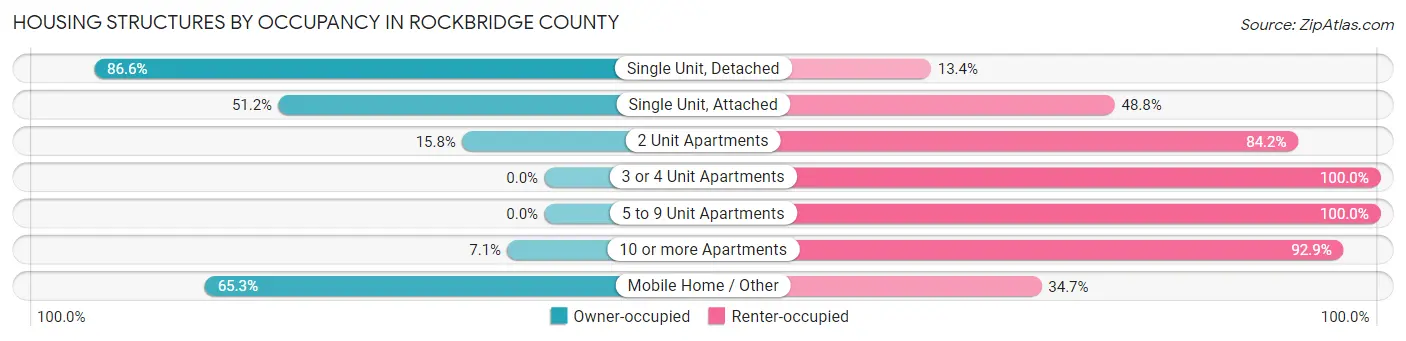
| Structure Type | Owner-occupied | Renter-occupied |
| Single Unit, Detached | 6,534 (86.6%) | 1,011 (13.4%) |
| Single Unit, Attached | 84 (51.2%) | 80 (48.8%) |
| 2 Unit Apartments | 16 (15.8%) | 85 (84.2%) |
| 3 or 4 Unit Apartments | 0 (0.0%) | 99 (100.0%) |
| 5 to 9 Unit Apartments | 0 (0.0%) | 200 (100.0%) |
| 10 or more Apartments | 16 (7.1%) | 208 (92.9%) |
| Mobile Home / Other | 676 (65.3%) | 359 (34.7%) |
| Total | 7,326 (78.2%) | 2,042 (21.8%) |
Housing Structures by Number of Rooms in Rockbridge County
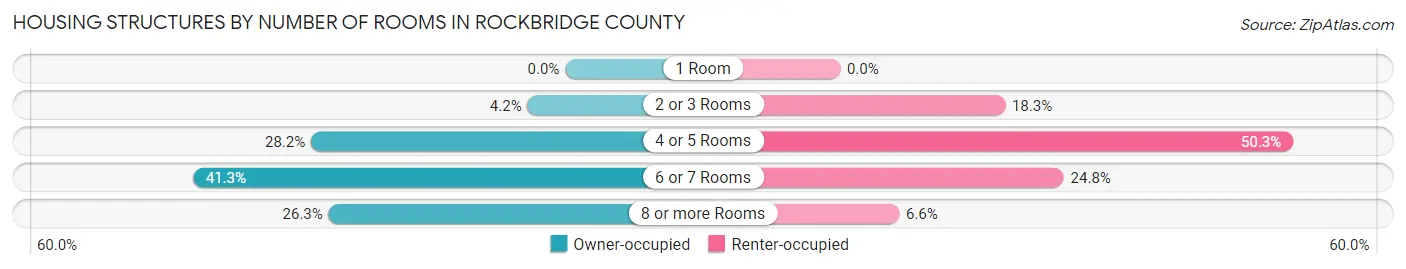
| Number of Rooms | Owner-occupied | Renter-occupied |
| 1 Room | 0 (0.0%) | 0 (0.0%) |
| 2 or 3 Rooms | 307 (4.2%) | 374 (18.3%) |
| 4 or 5 Rooms | 2,067 (28.2%) | 1,027 (50.3%) |
| 6 or 7 Rooms | 3,028 (41.3%) | 507 (24.8%) |
| 8 or more Rooms | 1,924 (26.3%) | 134 (6.6%) |
| Total | 7,326 (100.0%) | 2,042 (100.0%) |
Housing Structure by Heating Type in Rockbridge County
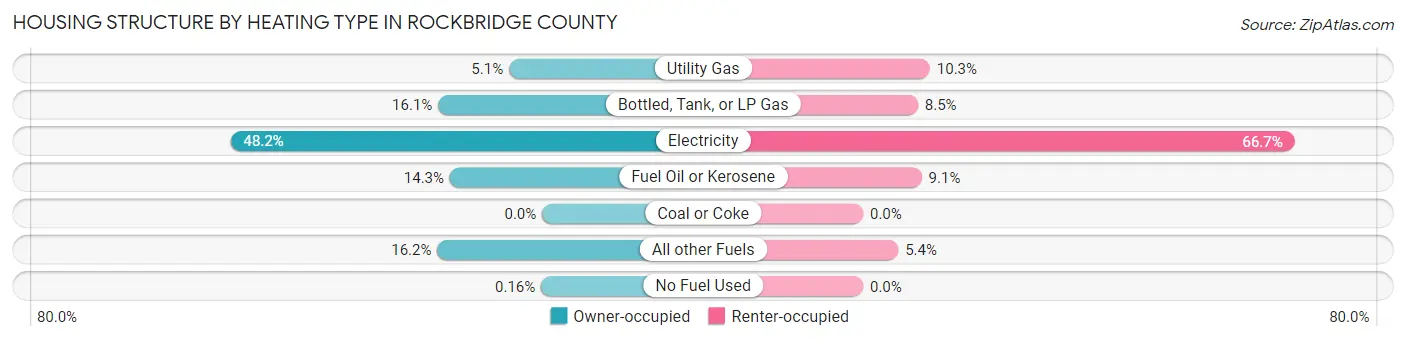
| Heating Type | Owner-occupied | Renter-occupied |
| Utility Gas | 375 (5.1%) | 211 (10.3%) |
| Bottled, Tank, or LP Gas | 1,177 (16.1%) | 173 (8.5%) |
| Electricity | 3,530 (48.2%) | 1,362 (66.7%) |
| Fuel Oil or Kerosene | 1,045 (14.3%) | 185 (9.1%) |
| Coal or Coke | 0 (0.0%) | 0 (0.0%) |
| All other Fuels | 1,187 (16.2%) | 111 (5.4%) |
| No Fuel Used | 12 (0.2%) | 0 (0.0%) |
| Total | 7,326 (100.0%) | 2,042 (100.0%) |
Household Vehicle Usage in Rockbridge County
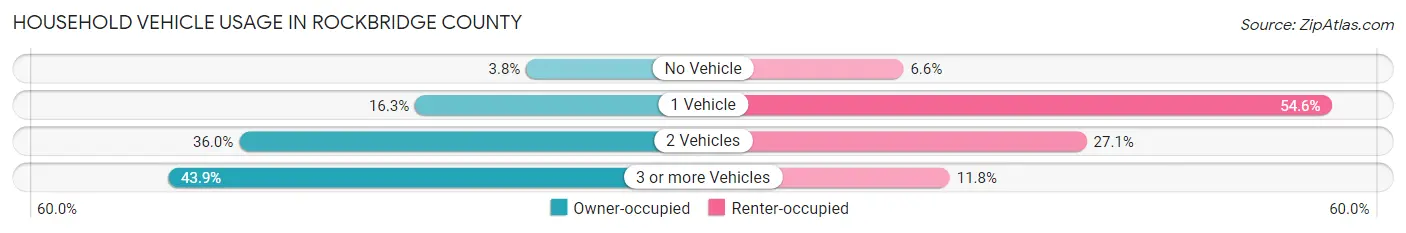
| Vehicles per Household | Owner-occupied | Renter-occupied |
| No Vehicle | 279 (3.8%) | 134 (6.6%) |
| 1 Vehicle | 1,192 (16.3%) | 1,115 (54.6%) |
| 2 Vehicles | 2,636 (36.0%) | 553 (27.1%) |
| 3 or more Vehicles | 3,219 (43.9%) | 240 (11.7%) |
| Total | 7,326 (100.0%) | 2,042 (100.0%) |
Real Estate & Mortgages in Rockbridge County
Real Estate and Mortgage Overview in Rockbridge County
| Characteristic | Without Mortgage | With Mortgage |
| Housing Units | 3,766 | 3,560 |
| Median Property Value | $219,400 | $246,600 |
| Median Household Income | $51,304 | $820 |
| Monthly Housing Costs | $448 | $193 |
| Real Estate Taxes | $1,281 | $95 |
Property Value by Mortgage Status in Rockbridge County
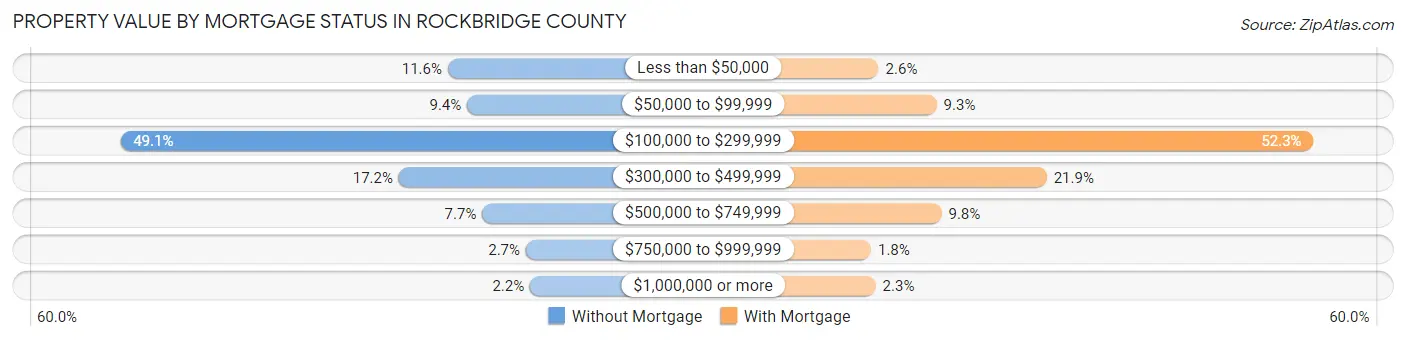
| Property Value | Without Mortgage | With Mortgage |
| Less than $50,000 | 438 (11.6%) | 94 (2.6%) |
| $50,000 to $99,999 | 355 (9.4%) | 330 (9.3%) |
| $100,000 to $299,999 | 1,848 (49.1%) | 1,863 (52.3%) |
| $300,000 to $499,999 | 649 (17.2%) | 778 (21.8%) |
| $500,000 to $749,999 | 290 (7.7%) | 350 (9.8%) |
| $750,000 to $999,999 | 102 (2.7%) | 63 (1.8%) |
| $1,000,000 or more | 84 (2.2%) | 82 (2.3%) |
| Total | 3,766 (100.0%) | 3,560 (100.0%) |
Household Income by Mortgage Status in Rockbridge County
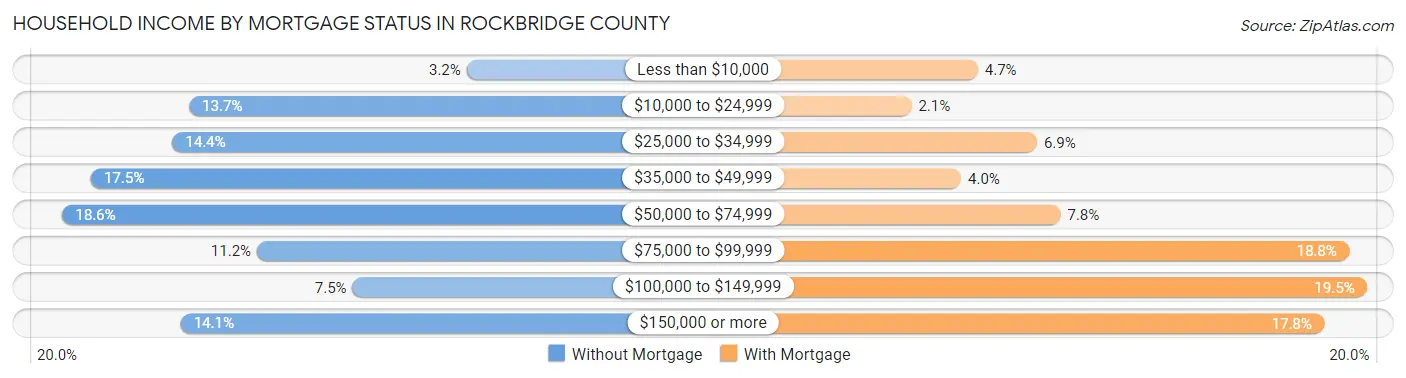
| Household Income | Without Mortgage | With Mortgage |
| Less than $10,000 | 119 (3.2%) | 166 (4.7%) |
| $10,000 to $24,999 | 517 (13.7%) | 76 (2.1%) |
| $25,000 to $34,999 | 541 (14.4%) | 246 (6.9%) |
| $35,000 to $49,999 | 658 (17.5%) | 143 (4.0%) |
| $50,000 to $74,999 | 699 (18.6%) | 278 (7.8%) |
| $75,000 to $99,999 | 420 (11.2%) | 669 (18.8%) |
| $100,000 to $149,999 | 283 (7.5%) | 693 (19.5%) |
| $150,000 or more | 529 (14.1%) | 635 (17.8%) |
| Total | 3,766 (100.0%) | 3,560 (100.0%) |
Property Value to Household Income Ratio in Rockbridge County
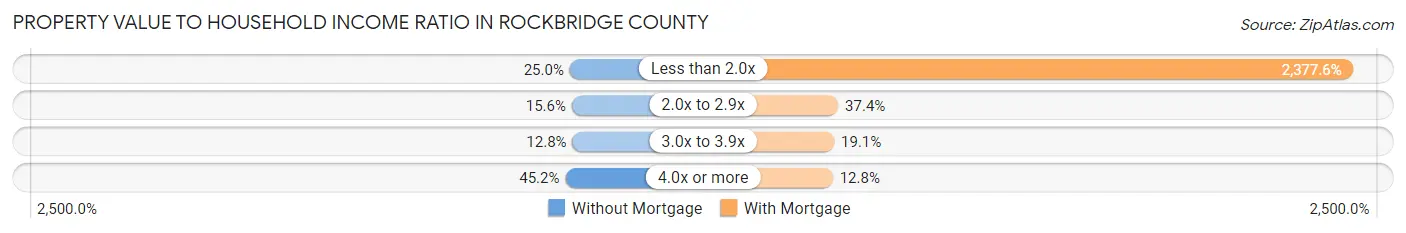
| Value-to-Income Ratio | Without Mortgage | With Mortgage |
| Less than 2.0x | 941 (25.0%) | 84,643 (2,377.6%) |
| 2.0x to 2.9x | 588 (15.6%) | 1,330 (37.4%) |
| 3.0x to 3.9x | 480 (12.8%) | 681 (19.1%) |
| 4.0x or more | 1,702 (45.2%) | 454 (12.8%) |
| Total | 3,766 (100.0%) | 3,560 (100.0%) |
Real Estate Taxes by Mortgage Status in Rockbridge County
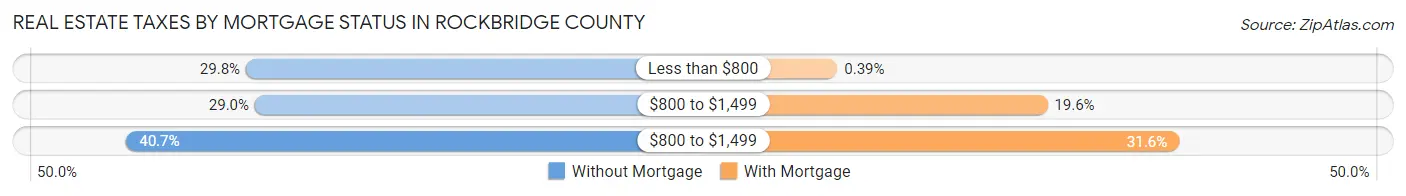
| Property Taxes | Without Mortgage | With Mortgage |
| Less than $800 | 1,122 (29.8%) | 14 (0.4%) |
| $800 to $1,499 | 1,091 (29.0%) | 697 (19.6%) |
| $800 to $1,499 | 1,533 (40.7%) | 1,125 (31.6%) |
| Total | 3,766 (100.0%) | 3,560 (100.0%) |
Health & Disability in Rockbridge County
Health Insurance Coverage by Age in Rockbridge County
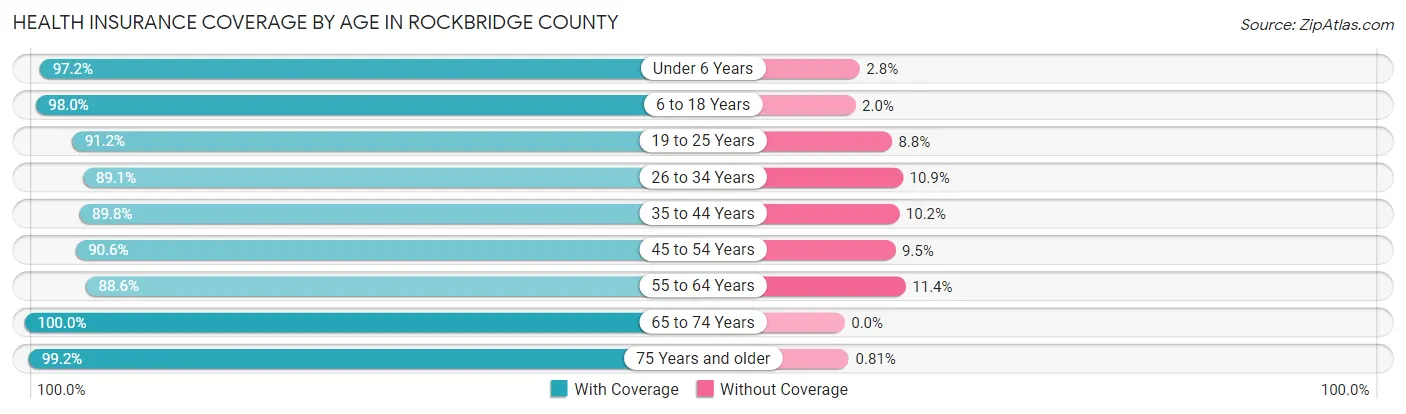
| Age Bracket | With Coverage | Without Coverage |
| Under 6 Years | 1,172 (97.2%) | 34 (2.8%) |
| 6 to 18 Years | 2,912 (98.0%) | 60 (2.0%) |
| 19 to 25 Years | 1,556 (91.2%) | 150 (8.8%) |
| 26 to 34 Years | 1,732 (89.1%) | 211 (10.9%) |
| 35 to 44 Years | 2,075 (89.8%) | 235 (10.2%) |
| 45 to 54 Years | 2,435 (90.5%) | 254 (9.5%) |
| 55 to 64 Years | 3,260 (88.6%) | 419 (11.4%) |
| 65 to 74 Years | 3,328 (100.0%) | 0 (0.0%) |
| 75 Years and older | 2,578 (99.2%) | 21 (0.8%) |
| Total | 21,048 (93.8%) | 1,384 (6.2%) |
Health Insurance Coverage by Citizenship Status in Rockbridge County
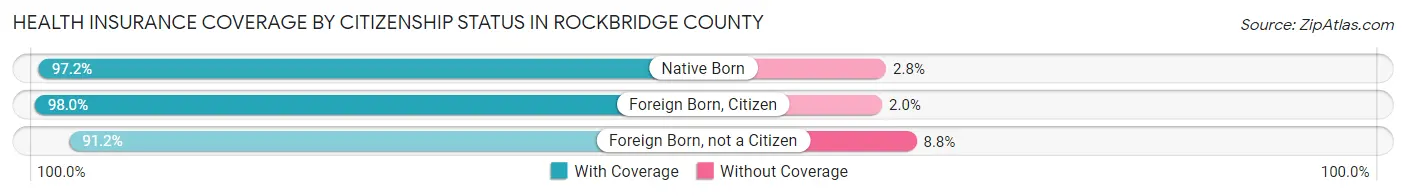
| Citizenship Status | With Coverage | Without Coverage |
| Native Born | 1,172 (97.2%) | 34 (2.8%) |
| Foreign Born, Citizen | 2,912 (98.0%) | 60 (2.0%) |
| Foreign Born, not a Citizen | 1,556 (91.2%) | 150 (8.8%) |
Health Insurance Coverage by Household Income in Rockbridge County
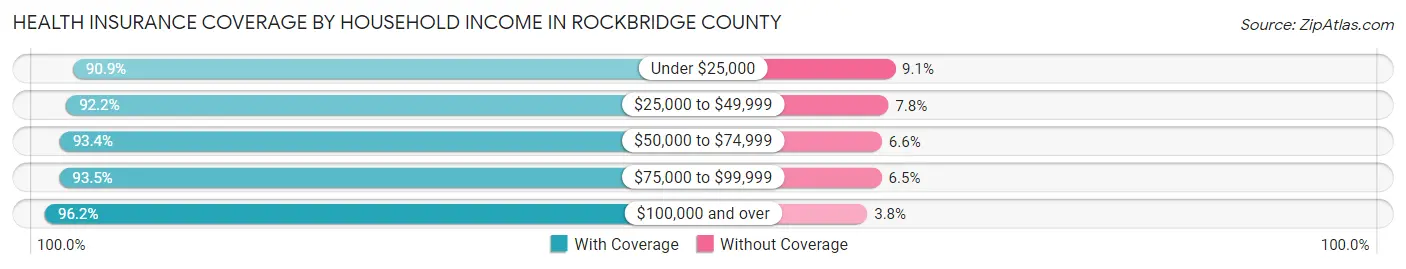
| Household Income | With Coverage | Without Coverage |
| Under $25,000 | 2,278 (90.9%) | 227 (9.1%) |
| $25,000 to $49,999 | 4,250 (92.2%) | 360 (7.8%) |
| $50,000 to $74,999 | 3,646 (93.4%) | 257 (6.6%) |
| $75,000 to $99,999 | 3,363 (93.5%) | 235 (6.5%) |
| $100,000 and over | 7,414 (96.2%) | 296 (3.8%) |
Public vs Private Health Insurance Coverage by Age in Rockbridge County
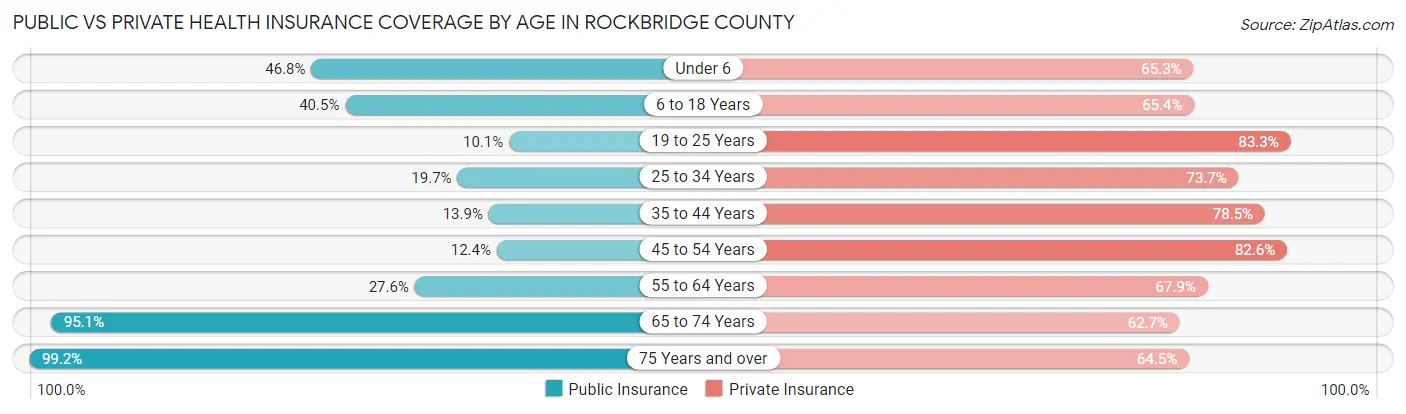
| Age Bracket | Public Insurance | Private Insurance |
| Under 6 | 564 (46.8%) | 787 (65.3%) |
| 6 to 18 Years | 1,203 (40.5%) | 1,944 (65.4%) |
| 19 to 25 Years | 172 (10.1%) | 1,421 (83.3%) |
| 25 to 34 Years | 382 (19.7%) | 1,431 (73.7%) |
| 35 to 44 Years | 320 (13.9%) | 1,814 (78.5%) |
| 45 to 54 Years | 332 (12.3%) | 2,222 (82.6%) |
| 55 to 64 Years | 1,015 (27.6%) | 2,498 (67.9%) |
| 65 to 74 Years | 3,166 (95.1%) | 2,088 (62.7%) |
| 75 Years and over | 2,578 (99.2%) | 1,675 (64.4%) |
| Total | 9,732 (43.4%) | 15,880 (70.8%) |
Disability Status by Sex by Age in Rockbridge County
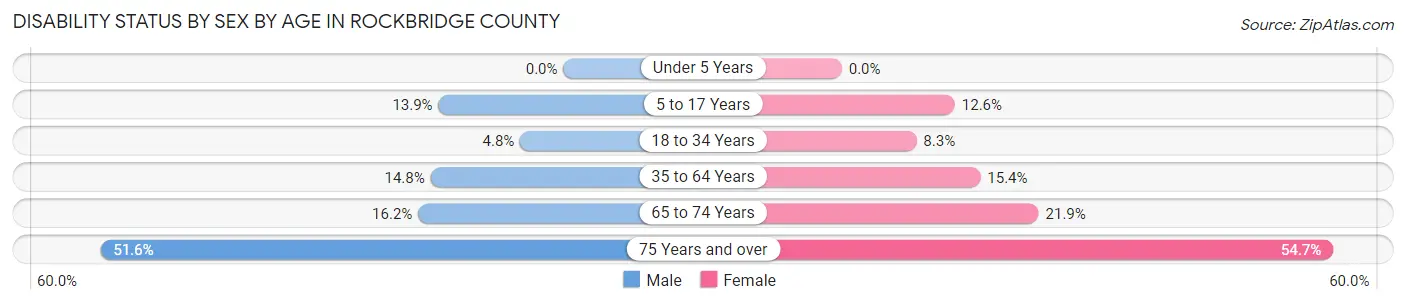
| Age Bracket | Male | Female |
| Under 5 Years | 0 (0.0%) | 0 (0.0%) |
| 5 to 17 Years | 212 (13.9%) | 202 (12.6%) |
| 18 to 34 Years | 91 (4.8%) | 158 (8.3%) |
| 35 to 64 Years | 644 (14.8%) | 667 (15.4%) |
| 65 to 74 Years | 274 (16.2%) | 358 (21.9%) |
| 75 Years and over | 576 (51.6%) | 811 (54.7%) |
Disability Class by Sex by Age in Rockbridge County
Disability Class: Hearing Difficulty
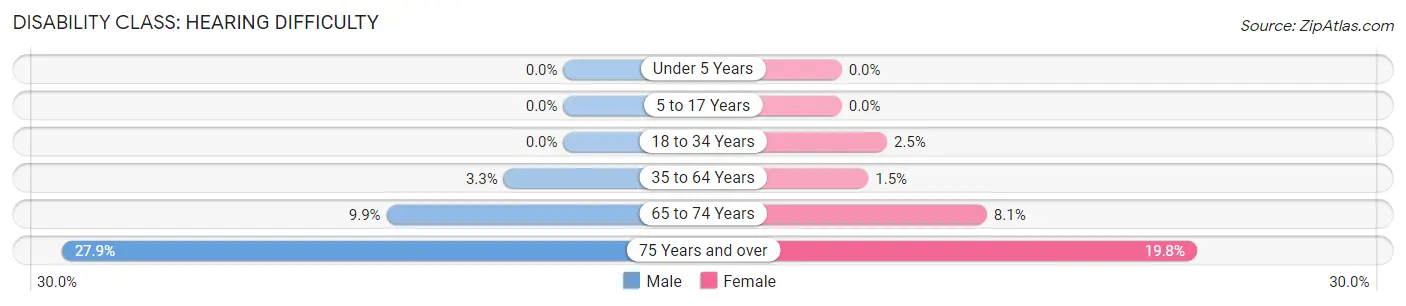
| Age Bracket | Male | Female |
| Under 5 Years | 0 (0.0%) | 0 (0.0%) |
| 5 to 17 Years | 0 (0.0%) | 0 (0.0%) |
| 18 to 34 Years | 0 (0.0%) | 48 (2.5%) |
| 35 to 64 Years | 145 (3.3%) | 64 (1.5%) |
| 65 to 74 Years | 167 (9.9%) | 132 (8.1%) |
| 75 Years and over | 312 (27.9%) | 293 (19.8%) |
Disability Class: Vision Difficulty
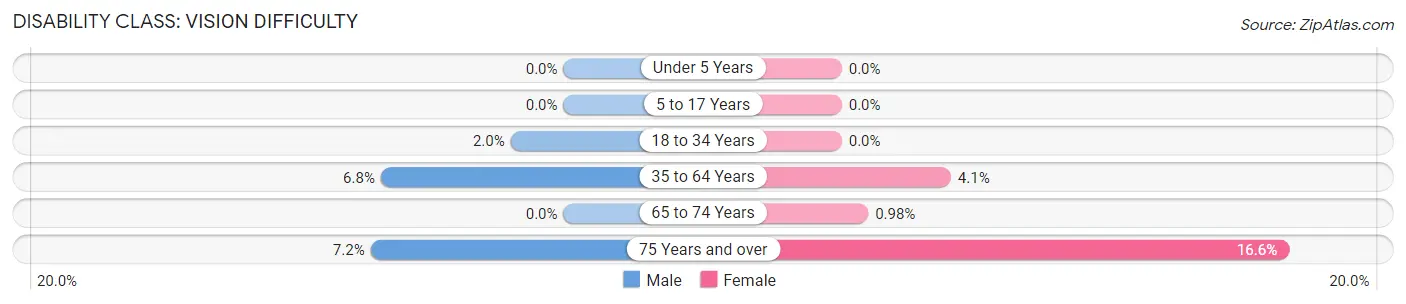
| Age Bracket | Male | Female |
| Under 5 Years | 0 (0.0%) | 0 (0.0%) |
| 5 to 17 Years | 0 (0.0%) | 0 (0.0%) |
| 18 to 34 Years | 37 (2.0%) | 0 (0.0%) |
| 35 to 64 Years | 295 (6.8%) | 175 (4.1%) |
| 65 to 74 Years | 0 (0.0%) | 16 (1.0%) |
| 75 Years and over | 80 (7.2%) | 246 (16.6%) |
Disability Class: Cognitive Difficulty
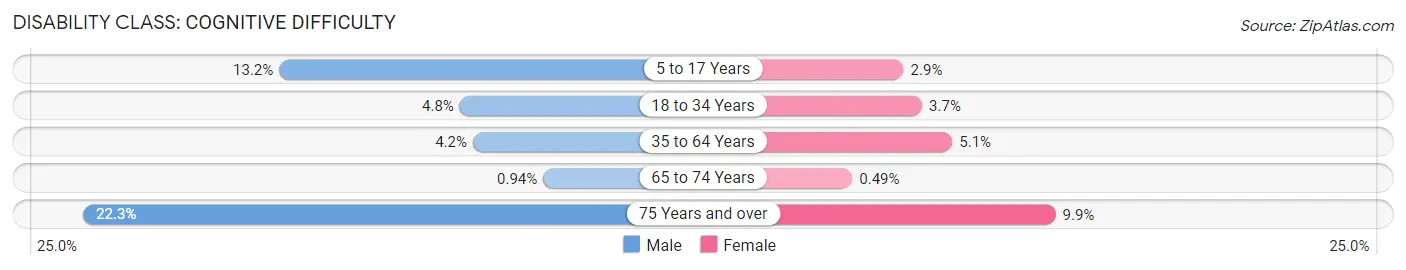
| Age Bracket | Male | Female |
| 5 to 17 Years | 201 (13.2%) | 46 (2.9%) |
| 18 to 34 Years | 91 (4.8%) | 71 (3.7%) |
| 35 to 64 Years | 183 (4.2%) | 222 (5.1%) |
| 65 to 74 Years | 16 (0.9%) | 8 (0.5%) |
| 75 Years and over | 249 (22.3%) | 147 (9.9%) |
Disability Class: Ambulatory Difficulty
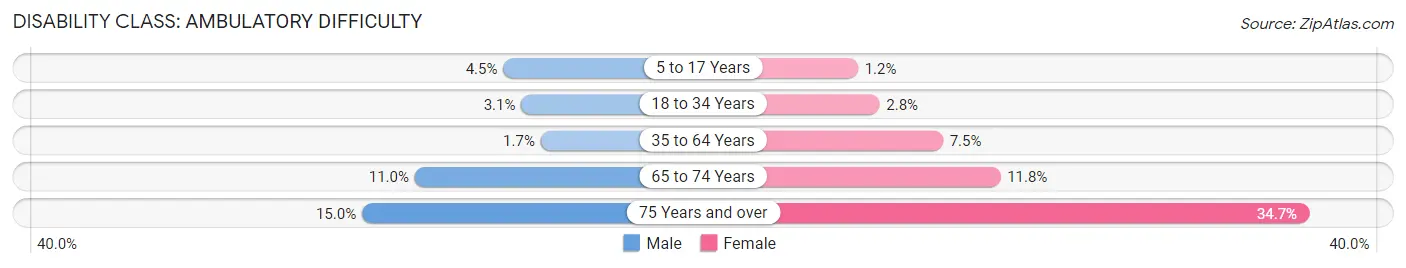
| Age Bracket | Male | Female |
| 5 to 17 Years | 68 (4.5%) | 19 (1.2%) |
| 18 to 34 Years | 59 (3.1%) | 53 (2.8%) |
| 35 to 64 Years | 73 (1.7%) | 324 (7.5%) |
| 65 to 74 Years | 187 (11.0%) | 192 (11.8%) |
| 75 Years and over | 167 (14.9%) | 514 (34.7%) |
Disability Class: Self-Care Difficulty
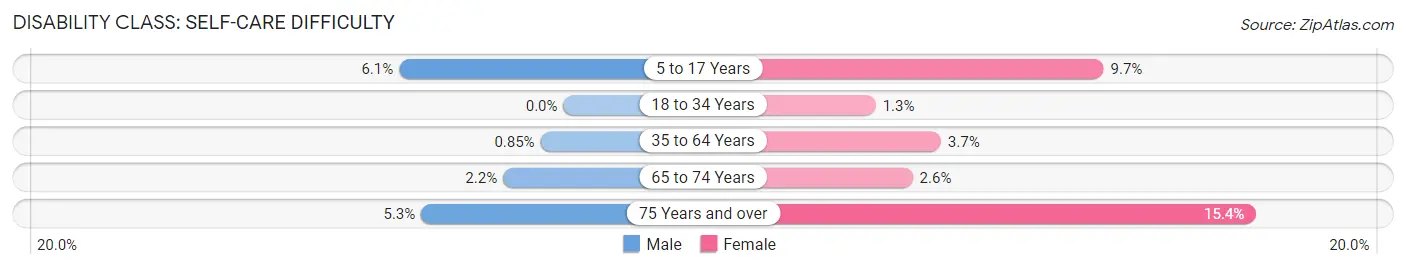
| Age Bracket | Male | Female |
| 5 to 17 Years | 93 (6.1%) | 156 (9.7%) |
| 18 to 34 Years | 0 (0.0%) | 24 (1.3%) |
| 35 to 64 Years | 37 (0.9%) | 159 (3.7%) |
| 65 to 74 Years | 38 (2.2%) | 43 (2.6%) |
| 75 Years and over | 59 (5.3%) | 228 (15.4%) |
Technology Access in Rockbridge County
Computing Device Access in Rockbridge County
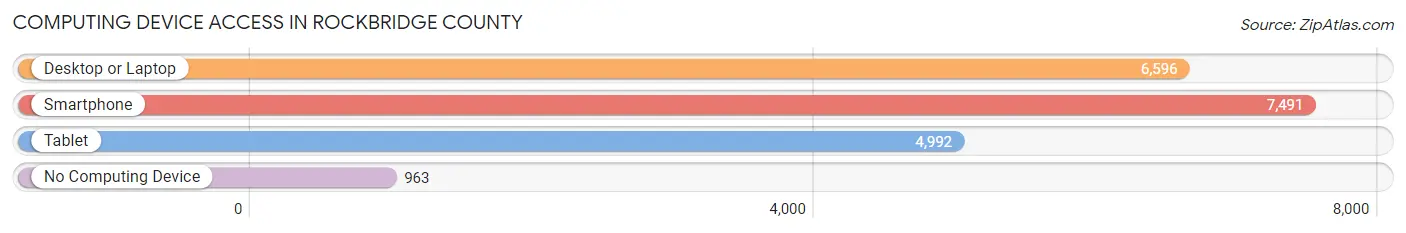
| Device Type | # Households | % Households |
| Desktop or Laptop | 6,596 | 70.4% |
| Smartphone | 7,491 | 80.0% |
| Tablet | 4,992 | 53.3% |
| No Computing Device | 963 | 10.3% |
| Total | 9,368 | 100.0% |
Internet Access in Rockbridge County
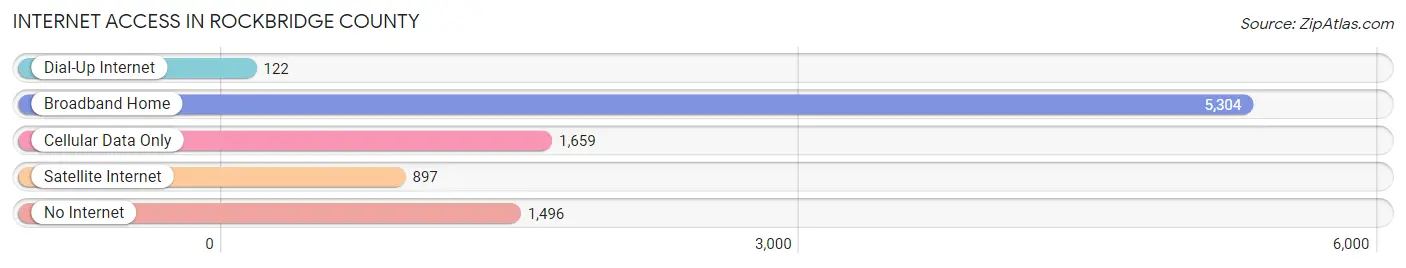
| Internet Type | # Households | % Households |
| Dial-Up Internet | 122 | 1.3% |
| Broadband Home | 5,304 | 56.6% |
| Cellular Data Only | 1,659 | 17.7% |
| Satellite Internet | 897 | 9.6% |
| No Internet | 1,496 | 16.0% |
| Total | 9,368 | 100.0% |
Rockbridge County Summary
Rockbridge County, Virginia is located in the Shenandoah Valley region of the Commonwealth of Virginia. It is bordered by the counties of Augusta, Bath, Botetourt, and Alleghany to the north, Amherst to the east, and Rockingham to the south. The county seat is Lexington, and the county is home to the cities of Buena Vista and Lexington.
History
Rockbridge County was formed in 1778 from parts of Augusta and Botetourt counties. It was named for Natural Bridge, a limestone arch located in the county. The bridge was a popular tourist attraction in the 18th and 19th centuries, and was visited by Thomas Jefferson, George Washington, and James Madison.
The county was home to several prominent figures in American history, including Robert E. Lee, Stonewall Jackson, and George C. Marshall. The county was also the site of several Civil War battles, including the Battle of Lexington and the Battle of Natural Bridge.
Geography
Rockbridge County is located in the Shenandoah Valley region of Virginia. It is bordered by the counties of Augusta, Bath, Botetourt, and Alleghany to the north, Amherst to the east, and Rockingham to the south. The county is home to the cities of Buena Vista and Lexington, as well as the towns of Glasgow, Brownsburg, and Fairfield.
The county is home to several mountain ranges, including the Blue Ridge Mountains, the Allegheny Mountains, and the Massanutten Mountains. The county is also home to several rivers, including the Maury River, the James River, and the Cowpasture River.
Economy
Rockbridge County has a diverse economy, with a mix of agriculture, manufacturing, and tourism. Agriculture is the largest sector of the county’s economy, with livestock, dairy, and poultry production being the primary sources of income. The county is also home to several manufacturing companies, including a paper mill, a furniture factory, and a plastics plant.
Tourism is also an important part of the county’s economy, with the Natural Bridge being the most popular tourist attraction. The county is also home to several wineries, as well as the Virginia Horse Center, which hosts several equestrian events each year.
Demographics
As of the 2010 census, Rockbridge County had a population of 22,307. The population is predominantly white (90.3%), with African Americans making up 6.2% of the population. The median household income is $45,845, and the median home value is $164,400.
The county is home to several colleges and universities, including Washington and Lee University, Virginia Military Institute, and Southern Virginia University. The county is also home to several public schools, including Rockbridge County High School, Buena Vista High School, and Lexington High School.
Conclusion
Rockbridge County, Virginia is a diverse county located in the Shenandoah Valley region of the Commonwealth of Virginia. It is home to several prominent figures in American history, and is the site of several Civil War battles. The county has a diverse economy, with agriculture, manufacturing, and tourism being the primary sources of income. The population is predominantly white, with African Americans making up 6.2% of the population. The county is home to several colleges and universities, as well as several public schools.
Common Questions
What is Per Capita Income in Rockbridge County?
Per Capita income in Rockbridge County is $37,087.
What is the Median Family Income in Rockbridge County?
Median Family Income in Rockbridge County is $76,835.
What is the Median Household income in Rockbridge County?
Median Household Income in Rockbridge County is $61,903.
What is Income or Wage Gap in Rockbridge County?
Income or Wage Gap in Rockbridge County is 18.8%.
Women in Rockbridge County earn 81.2 cents for every dollar earned by a man.
What is Family Income Deficit in Rockbridge County?
Family Income Deficit in Rockbridge County is $10,825.
Families that are below poverty line in Rockbridge County earn $10,825 less on average than the poverty threshold level.
What is Inequality or Gini Index in Rockbridge County?
Inequality or Gini Index in Rockbridge County is 0.45.
What is the Total Population of Rockbridge County?
Total Population of Rockbridge County is 22,673.
What is the Total Male Population of Rockbridge County?
Total Male Population of Rockbridge County is 11,175.
What is the Total Female Population of Rockbridge County?
Total Female Population of Rockbridge County is 11,498.
What is the Ratio of Males per 100 Females in Rockbridge County?
There are 97.19 Males per 100 Females in Rockbridge County.
What is the Ratio of Females per 100 Males in Rockbridge County?
There are 102.89 Females per 100 Males in Rockbridge County.
What is the Median Population Age in Rockbridge County?
Median Population Age in Rockbridge County is 49.4 Years.
What is the Average Family Size in Rockbridge County
Average Family Size in Rockbridge County is 2.9 People.
What is the Average Household Size in Rockbridge County
Average Household Size in Rockbridge County is 2.4 People.
How Large is the Labor Force in Rockbridge County?
There are 10,635 People in the Labor Forcein in Rockbridge County.
What is the Percentage of People in the Labor Force in Rockbridge County?
55.3% of People are in the Labor Force in Rockbridge County.
What is the Unemployment Rate in Rockbridge County?
Unemployment Rate in Rockbridge County is 3.9%.