Roanoke County, VA Map & Demographics
Roanoke County Map
Roanoke County Overview
$43,125
PER CAPITA INCOME
$100,192
AVG FAMILY INCOME
$80,872
AVG HOUSEHOLD INCOME
23.6%
WAGE / INCOME GAP [ % ]
76.4¢/ $1
WAGE / INCOME GAP [ $ ]
$11,679
FAMILY INCOME DEFICIT
0.44
INEQUALITY / GINI INDEX
96,653
TOTAL POPULATION
46,725
MALE POPULATION
49,928
FEMALE POPULATION
93.58
MALES / 100 FEMALES
106.86
FEMALES / 100 MALES
43.6
MEDIAN AGE
3.0
AVG FAMILY SIZE
2.4
AVG HOUSEHOLD SIZE
48,645
LABOR FORCE [ PEOPLE ]
61.1%
PERCENT IN LABOR FORCE
2.6%
UNEMPLOYMENT RATE
Roanoke County Area Codes
Income in Roanoke County
Income Overview in Roanoke County
Per Capita Income in Roanoke County is $43,125, while median incomes of families and households are $100,192 and $80,872 respectively.
| Characteristic | Number | Measure |
| Per Capita Income | 96,653 | $43,125 |
| Median Family Income | 25,304 | $100,192 |
| Mean Family Income | 25,304 | $126,139 |
| Median Household Income | 39,156 | $80,872 |
| Mean Household Income | 39,156 | $103,662 |
| Income Deficit | 25,304 | $11,679 |
| Wage / Income Gap (%) | 96,653 | 23.64% |
| Wage / Income Gap ($) | 96,653 | 76.36¢ per $1 |
| Gini / Inequality Index | 96,653 | 0.44 |
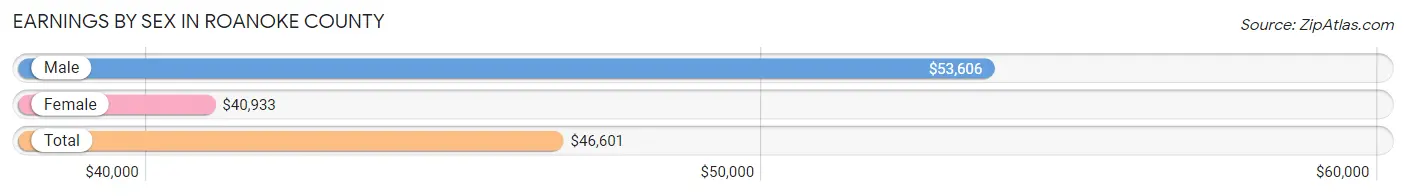
Earnings by Sex in Roanoke County
Average Earnings in Roanoke County are $46,601, $53,606 for men and $40,933 for women, a difference of 23.6%.
| Sex | Number | Average Earnings |
| Male | 26,754 (52.5%) | $53,606 |
| Female | 24,233 (47.5%) | $40,933 |
| Total | 50,987 (100.0%) | $46,601 |
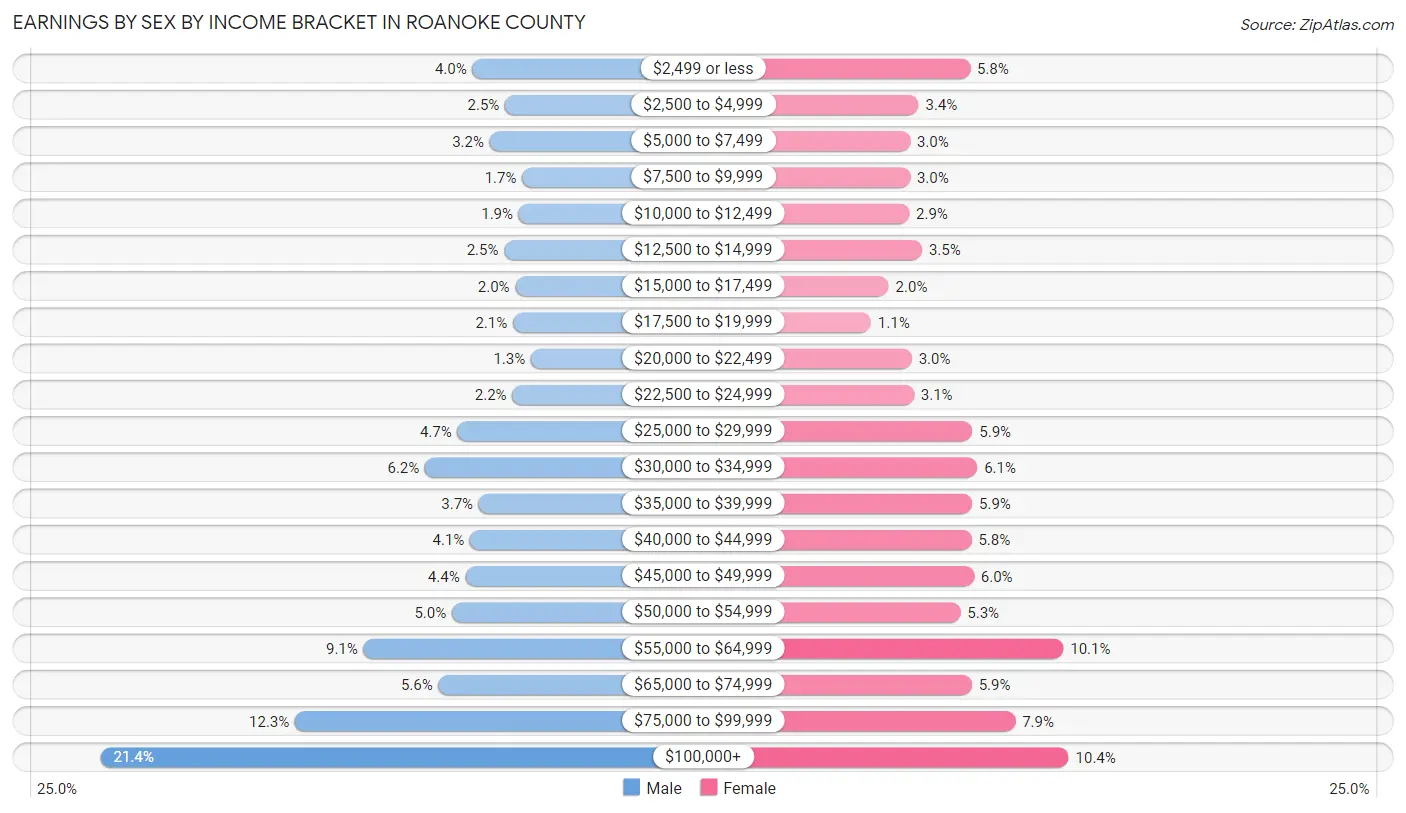
Earnings by Sex by Income Bracket in Roanoke County
The most common earnings brackets in Roanoke County are $100,000+ for men (5,735 | 21.4%) and $100,000+ for women (2,517 | 10.4%).
| Income | Male | Female |
| $2,499 or less | 1,075 (4.0%) | 1,398 (5.8%) |
| $2,500 to $4,999 | 667 (2.5%) | 815 (3.4%) |
| $5,000 to $7,499 | 860 (3.2%) | 717 (3.0%) |
| $7,500 to $9,999 | 451 (1.7%) | 717 (3.0%) |
| $10,000 to $12,499 | 495 (1.8%) | 708 (2.9%) |
| $12,500 to $14,999 | 677 (2.5%) | 852 (3.5%) |
| $15,000 to $17,499 | 539 (2.0%) | 474 (2.0%) |
| $17,500 to $19,999 | 567 (2.1%) | 275 (1.1%) |
| $20,000 to $22,499 | 342 (1.3%) | 736 (3.0%) |
| $22,500 to $24,999 | 574 (2.1%) | 762 (3.1%) |
| $25,000 to $29,999 | 1,263 (4.7%) | 1,425 (5.9%) |
| $30,000 to $34,999 | 1,670 (6.2%) | 1,480 (6.1%) |
| $35,000 to $39,999 | 996 (3.7%) | 1,423 (5.9%) |
| $40,000 to $44,999 | 1,104 (4.1%) | 1,415 (5.8%) |
| $45,000 to $49,999 | 1,165 (4.3%) | 1,441 (5.9%) |
| $50,000 to $54,999 | 1,333 (5.0%) | 1,290 (5.3%) |
| $55,000 to $64,999 | 2,441 (9.1%) | 2,457 (10.1%) |
| $65,000 to $74,999 | 1,501 (5.6%) | 1,418 (5.9%) |
| $75,000 to $99,999 | 3,299 (12.3%) | 1,913 (7.9%) |
| $100,000+ | 5,735 (21.4%) | 2,517 (10.4%) |
| Total | 26,754 (100.0%) | 24,233 (100.0%) |
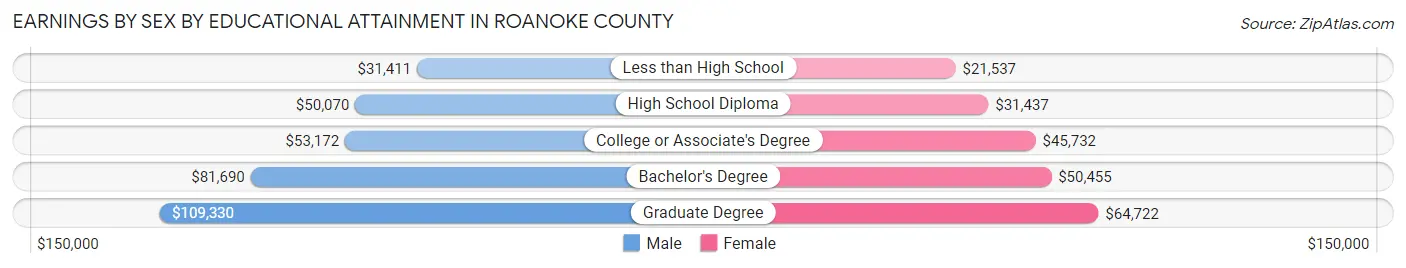
Earnings by Sex by Educational Attainment in Roanoke County
Average earnings in Roanoke County are $60,125 for men and $46,199 for women, a difference of 23.2%. Men with an educational attainment of graduate degree enjoy the highest average annual earnings of $109,330, while those with less than high school education earn the least with $31,411. Women with an educational attainment of graduate degree earn the most with the average annual earnings of $64,722, while those with less than high school education have the smallest earnings of $21,537.
| Educational Attainment | Male Income | Female Income |
| Less than High School | $31,411 | $21,537 |
| High School Diploma | $50,070 | $31,437 |
| College or Associate's Degree | $53,172 | $45,732 |
| Bachelor's Degree | $81,690 | $50,455 |
| Graduate Degree | $109,330 | $64,722 |
| Total | $60,125 | $46,199 |
Family Income in Roanoke County
Family Income Brackets in Roanoke County
According to the Roanoke County family income data, there are 6,326 families falling into the $100,000 to $149,999 income range, which is the most common income bracket and makes up 25.0% of all families. Conversely, the $10,000 to $14,999 income bracket is the least frequent group with only 177 families (0.7%) belonging to this category.
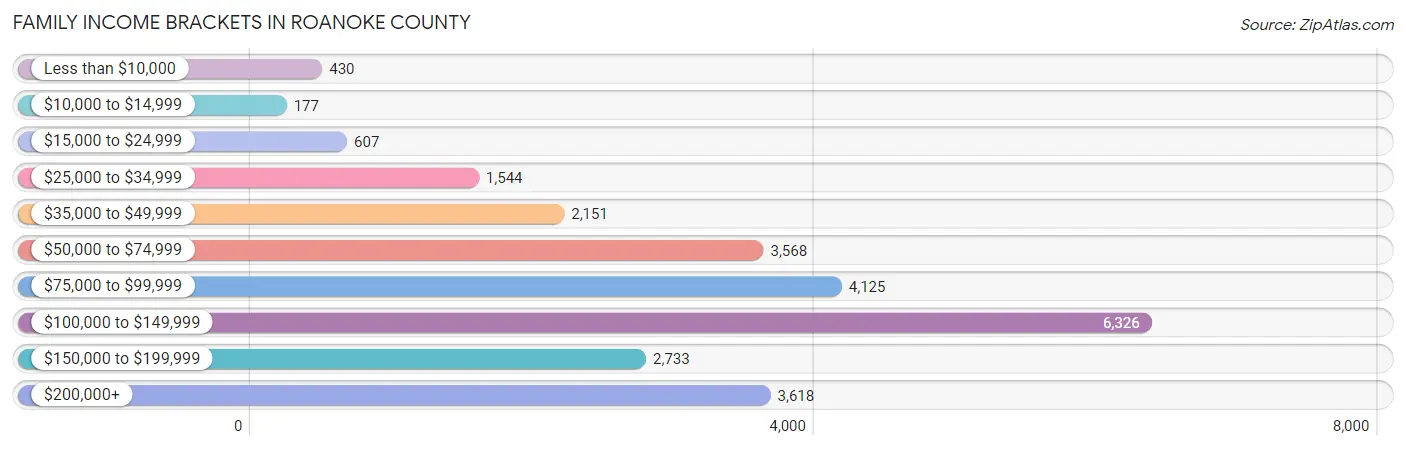
| Income Bracket | # Families | % Families |
| Less than $10,000 | 430 | 1.7% |
| $10,000 to $14,999 | 177 | 0.7% |
| $15,000 to $24,999 | 607 | 2.4% |
| $25,000 to $34,999 | 1,544 | 6.1% |
| $35,000 to $49,999 | 2,151 | 8.5% |
| $50,000 to $74,999 | 3,568 | 14.1% |
| $75,000 to $99,999 | 4,125 | 16.3% |
| $100,000 to $149,999 | 6,326 | 25.0% |
| $150,000 to $199,999 | 2,733 | 10.8% |
| $200,000+ | 3,618 | 14.3% |
Family Income by Famaliy Size in Roanoke County
5-person families (1,899 | 7.5%) account for the highest median family income in Roanoke County with $123,299 per family, while 2-person families (13,096 | 51.7%) have the highest median income of $41,893 per family member.
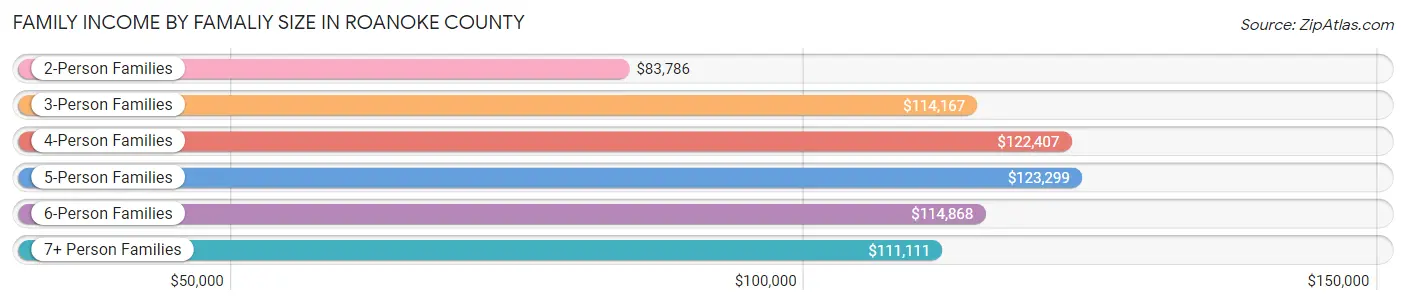
| Income Bracket | # Families | Median Income |
| 2-Person Families | 13,096 (51.7%) | $83,786 |
| 3-Person Families | 5,448 (21.5%) | $114,167 |
| 4-Person Families | 4,025 (15.9%) | $122,407 |
| 5-Person Families | 1,899 (7.5%) | $123,299 |
| 6-Person Families | 716 (2.8%) | $114,868 |
| 7+ Person Families | 120 (0.5%) | $111,111 |
| Total | 25,304 (100.0%) | $100,192 |
Family Income by Number of Earners in Roanoke County
The median family income in Roanoke County is $100,192, with families comprising 3+ earners (3,031) having the highest median family income of $144,985, while families with no earners (4,739) have the lowest median family income of $51,146, accounting for 12.0% and 18.7% of families, respectively.
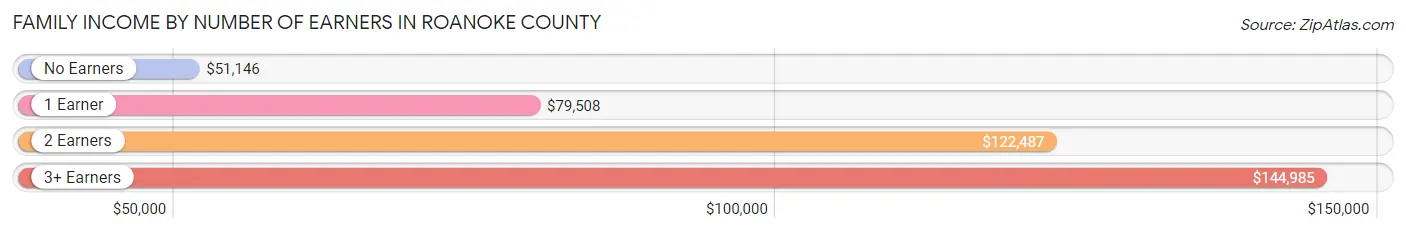
| Number of Earners | # Families | Median Income |
| No Earners | 4,739 (18.7%) | $51,146 |
| 1 Earner | 7,188 (28.4%) | $79,508 |
| 2 Earners | 10,346 (40.9%) | $122,487 |
| 3+ Earners | 3,031 (12.0%) | $144,985 |
| Total | 25,304 (100.0%) | $100,192 |
Household Income in Roanoke County
Household Income Brackets in Roanoke County
With 7,910 households falling in the category, the $100,000 to $149,999 income range is the most frequent in Roanoke County, accounting for 20.2% of all households. In contrast, only 1,175 households (3.0%) fall into the less than $10,000 income bracket, making it the least populous group.
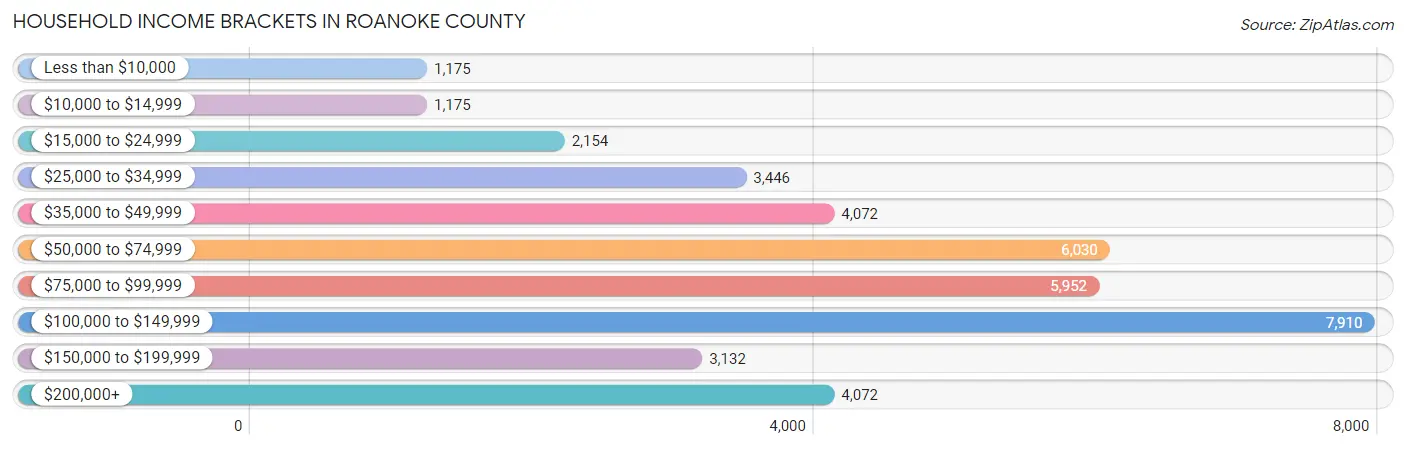
| Income Bracket | # Households | % Households |
| Less than $10,000 | 1,175 | 3.0% |
| $10,000 to $14,999 | 1,175 | 3.0% |
| $15,000 to $24,999 | 2,154 | 5.5% |
| $25,000 to $34,999 | 3,446 | 8.8% |
| $35,000 to $49,999 | 4,072 | 10.4% |
| $50,000 to $74,999 | 6,030 | 15.4% |
| $75,000 to $99,999 | 5,952 | 15.2% |
| $100,000 to $149,999 | 7,910 | 20.2% |
| $150,000 to $199,999 | 3,132 | 8.0% |
| $200,000+ | 4,072 | 10.4% |
Household Income by Householder Age in Roanoke County
The median household income in Roanoke County is $80,872, with the highest median household income of $105,176 found in the 45 to 64 years age bracket for the primary householder. A total of 14,438 households (36.9%) fall into this category. Meanwhile, the 15 to 24 years age bracket for the primary householder has the lowest median household income of $48,429, with 1,089 households (2.8%) in this group.
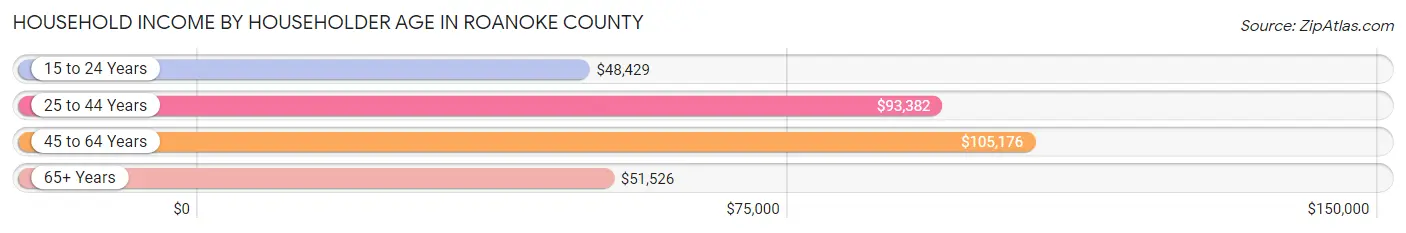
| Income Bracket | # Households | Median Income |
| 15 to 24 Years | 1,089 (2.8%) | $48,429 |
| 25 to 44 Years | 10,194 (26.0%) | $93,382 |
| 45 to 64 Years | 14,438 (36.9%) | $105,176 |
| 65+ Years | 13,435 (34.3%) | $51,526 |
| Total | 39,156 (100.0%) | $80,872 |
Poverty in Roanoke County
Income Below Poverty by Sex and Age in Roanoke County
With 6.4% poverty level for males and 7.8% for females among the residents of Roanoke County, 16 and 17 year old males and 16 and 17 year old females are the most vulnerable to poverty, with 205 males (17.7%) and 222 females (21.6%) in their respective age groups living below the poverty level.
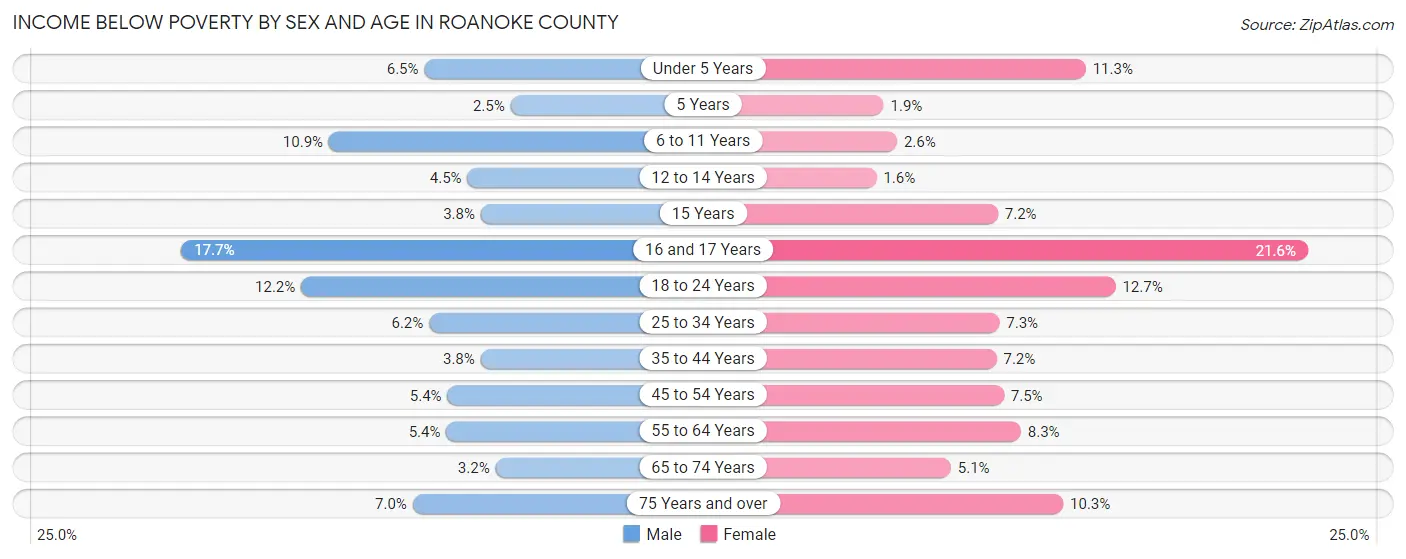
| Age Bracket | Male | Female |
| Under 5 Years | 145 (6.5%) | 221 (11.3%) |
| 5 Years | 15 (2.5%) | 11 (1.9%) |
| 6 to 11 Years | 361 (10.9%) | 85 (2.6%) |
| 12 to 14 Years | 81 (4.4%) | 23 (1.6%) |
| 15 Years | 24 (3.8%) | 64 (7.2%) |
| 16 and 17 Years | 205 (17.7%) | 222 (21.6%) |
| 18 to 24 Years | 430 (12.2%) | 419 (12.7%) |
| 25 to 34 Years | 350 (6.2%) | 389 (7.3%) |
| 35 to 44 Years | 212 (3.8%) | 422 (7.2%) |
| 45 to 54 Years | 330 (5.4%) | 476 (7.5%) |
| 55 to 64 Years | 347 (5.4%) | 573 (8.3%) |
| 65 to 74 Years | 171 (3.2%) | 321 (5.1%) |
| 75 Years and over | 234 (7.0%) | 534 (10.3%) |
| Total | 2,905 (6.4%) | 3,760 (7.8%) |
Income Above Poverty by Sex and Age in Roanoke County
According to the poverty statistics in Roanoke County, males aged 5 years and females aged 12 to 14 years are the age groups that are most secure financially, with 97.6% of males and 98.4% of females in these age groups living above the poverty line.
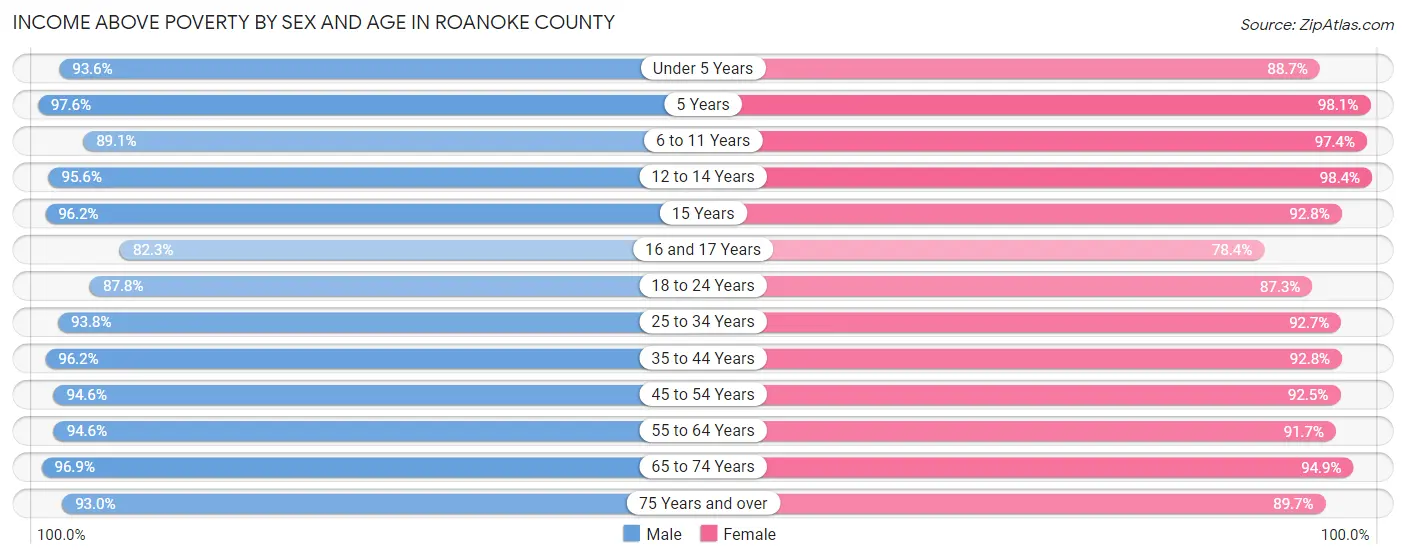
| Age Bracket | Male | Female |
| Under 5 Years | 2,103 (93.5%) | 1,731 (88.7%) |
| 5 Years | 597 (97.6%) | 556 (98.1%) |
| 6 to 11 Years | 2,957 (89.1%) | 3,236 (97.4%) |
| 12 to 14 Years | 1,738 (95.6%) | 1,404 (98.4%) |
| 15 Years | 602 (96.2%) | 820 (92.8%) |
| 16 and 17 Years | 951 (82.3%) | 805 (78.4%) |
| 18 to 24 Years | 3,104 (87.8%) | 2,881 (87.3%) |
| 25 to 34 Years | 5,271 (93.8%) | 4,935 (92.7%) |
| 35 to 44 Years | 5,305 (96.2%) | 5,454 (92.8%) |
| 45 to 54 Years | 5,807 (94.6%) | 5,850 (92.5%) |
| 55 to 64 Years | 6,044 (94.6%) | 6,325 (91.7%) |
| 65 to 74 Years | 5,258 (96.9%) | 6,024 (94.9%) |
| 75 Years and over | 3,112 (93.0%) | 4,664 (89.7%) |
| Total | 42,849 (93.6%) | 44,685 (92.2%) |
Income Below Poverty Among Married-Couple Families in Roanoke County
The poverty statistics for married-couple families in Roanoke County show that 1.6% or 307 of the total 19,490 families live below the poverty line. Families with 1 or 2 children have the highest poverty rate of 2.7%, comprising of 152 families. On the other hand, families with 5 or more children have the lowest poverty rate of 0.0%, which includes 0 families.
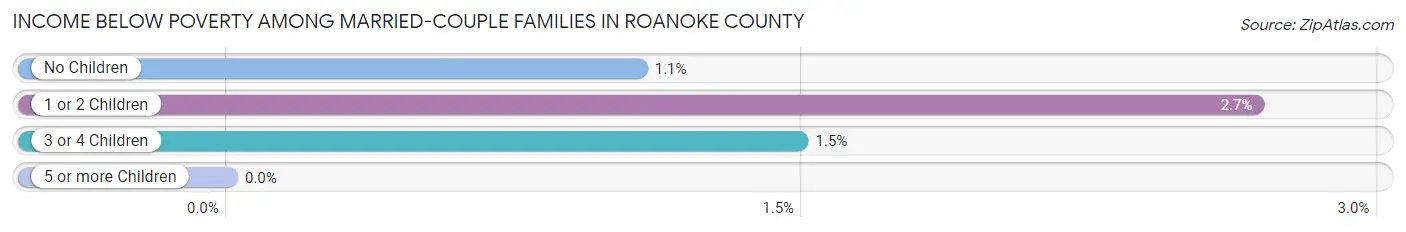
| Children | Above Poverty | Below Poverty |
| No Children | 12,080 (98.9%) | 131 (1.1%) |
| 1 or 2 Children | 5,510 (97.3%) | 152 (2.7%) |
| 3 or 4 Children | 1,584 (98.5%) | 24 (1.5%) |
| 5 or more Children | 9 (100.0%) | 0 (0.0%) |
| Total | 19,183 (98.4%) | 307 (1.6%) |
Income Below Poverty Among Single-Parent Households in Roanoke County
According to the poverty data in Roanoke County, 8.5% or 154 single-father households and 12.9% or 518 single-mother households are living below the poverty line. Among single-father households, those with no children have the highest poverty rate, with 80 households (10.8%) experiencing poverty. Likewise, among single-mother households, those with 1 or 2 children have the highest poverty rate, with 342 households (19.9%) falling below the poverty line.
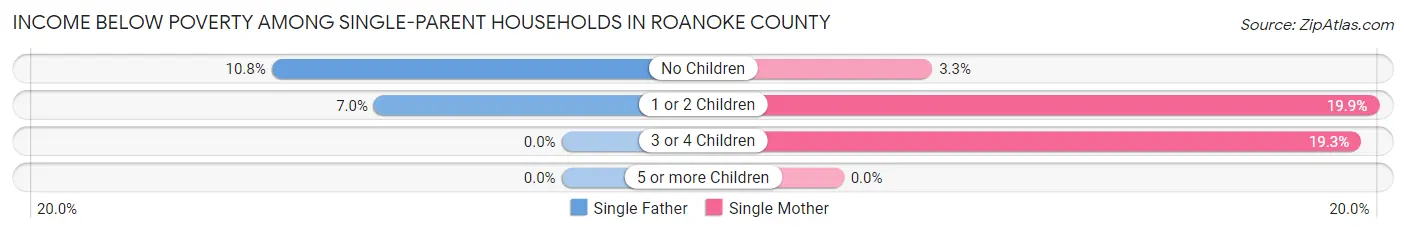
| Children | Single Father | Single Mother |
| No Children | 80 (10.8%) | 55 (3.3%) |
| 1 or 2 Children | 74 (7.0%) | 342 (19.9%) |
| 3 or 4 Children | 0 (0.0%) | 121 (19.3%) |
| 5 or more Children | 0 (0.0%) | 0 (0.0%) |
| Total | 154 (8.5%) | 518 (12.9%) |
Income Below Poverty Among Married-Couple vs Single-Parent Households in Roanoke County
The poverty data for Roanoke County shows that 307 of the married-couple family households (1.6%) and 672 of the single-parent households (11.6%) are living below the poverty level. Within the married-couple family households, those with 1 or 2 children have the highest poverty rate, with 152 households (2.7%) falling below the poverty line. Among the single-parent households, those with 3 or 4 children have the highest poverty rate, with 121 household (19.1%) living below poverty.
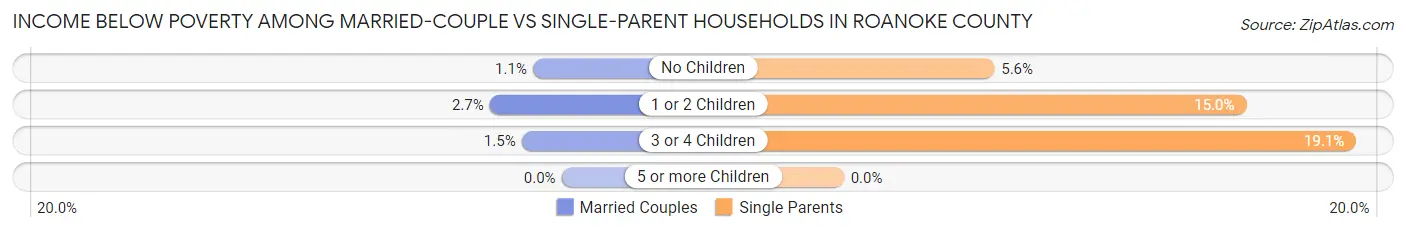
| Children | Married-Couple Families | Single-Parent Households |
| No Children | 131 (1.1%) | 135 (5.6%) |
| 1 or 2 Children | 152 (2.7%) | 416 (15.0%) |
| 3 or 4 Children | 24 (1.5%) | 121 (19.1%) |
| 5 or more Children | 0 (0.0%) | 0 (0.0%) |
| Total | 307 (1.6%) | 672 (11.6%) |
Race in Roanoke County
The most populous races in Roanoke County are White / Caucasian (82,697 | 85.6%), Black / African American (5,905 | 6.1%), and Asian (3,471 | 3.6%).
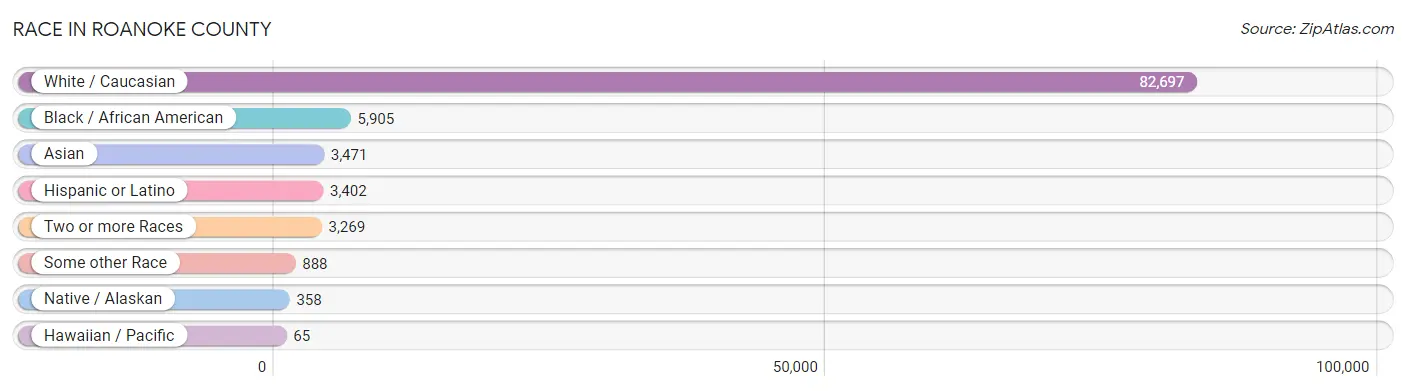
| Race | # Population | % Population |
| Asian | 3,471 | 3.6% |
| Black / African American | 5,905 | 6.1% |
| Hawaiian / Pacific | 65 | 0.1% |
| Hispanic or Latino | 3,402 | 3.5% |
| Native / Alaskan | 358 | 0.4% |
| White / Caucasian | 82,697 | 85.6% |
| Two or more Races | 3,269 | 3.4% |
| Some other Race | 888 | 0.9% |
| Total | 96,653 | 100.0% |
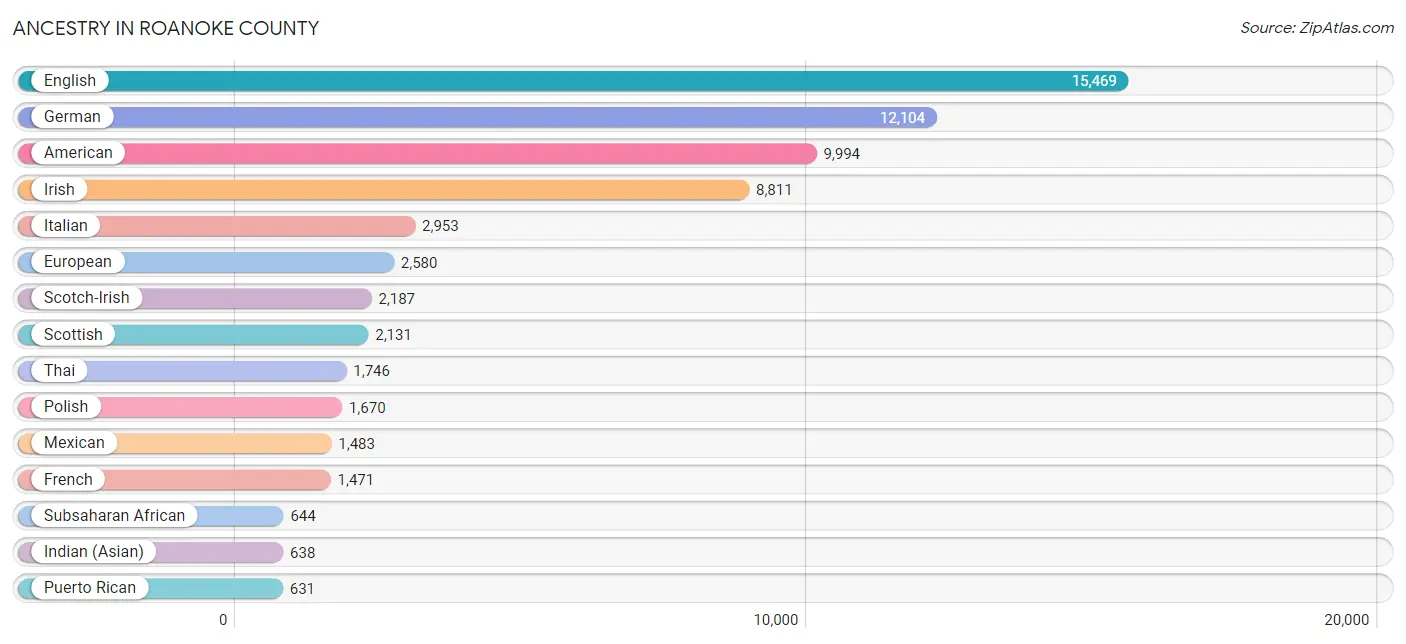
Ancestry in Roanoke County
The most populous ancestries reported in Roanoke County are English (15,469 | 16.0%), German (12,104 | 12.5%), American (9,994 | 10.3%), Irish (8,811 | 9.1%), and Italian (2,953 | 3.1%), together accounting for 51.0% of all Roanoke County residents.
| Ancestry | # Population | % Population |
| African | 519 | 0.5% |
| American | 9,994 | 10.3% |
| Apache | 5 | 0.0% |
| Arab | 380 | 0.4% |
| Austrian | 45 | 0.1% |
| Barbadian | 23 | 0.0% |
| Belgian | 58 | 0.1% |
| Bhutanese | 82 | 0.1% |
| Blackfeet | 25 | 0.0% |
| Bolivian | 55 | 0.1% |
| Brazilian | 113 | 0.1% |
| British | 608 | 0.6% |
| Burmese | 131 | 0.1% |
| Canadian | 226 | 0.2% |
| Central American | 171 | 0.2% |
| Cherokee | 166 | 0.2% |
| Chippewa | 16 | 0.0% |
| Choctaw | 7 | 0.0% |
| Colombian | 123 | 0.1% |
| Costa Rican | 55 | 0.1% |
| Creek | 15 | 0.0% |
| Croatian | 21 | 0.0% |
| Crow | 4 | 0.0% |
| Cuban | 143 | 0.2% |
| Czech | 192 | 0.2% |
| Czechoslovakian | 60 | 0.1% |
| Danish | 302 | 0.3% |
| Dominican | 118 | 0.1% |
| Dutch | 549 | 0.6% |
| Eastern European | 141 | 0.2% |
| Ecuadorian | 89 | 0.1% |
| Egyptian | 14 | 0.0% |
| English | 15,469 | 16.0% |
| Ethiopian | 11 | 0.0% |
| European | 2,580 | 2.7% |
| Filipino | 27 | 0.0% |
| Finnish | 52 | 0.1% |
| French | 1,471 | 1.5% |
| French Canadian | 169 | 0.2% |
| German | 12,104 | 12.5% |
| Ghanaian | 22 | 0.0% |
| Greek | 332 | 0.3% |
| Guamanian / Chamorro | 104 | 0.1% |
| Guatemalan | 64 | 0.1% |
| Haitian | 62 | 0.1% |
| Hungarian | 379 | 0.4% |
| Indian (Asian) | 638 | 0.7% |
| Iranian | 64 | 0.1% |
| Iraqi | 57 | 0.1% |
| Irish | 8,811 | 9.1% |
| Iroquois | 2 | 0.0% |
| Israeli | 85 | 0.1% |
| Italian | 2,953 | 3.1% |
| Jamaican | 16 | 0.0% |
| Japanese | 195 | 0.2% |
| Jordanian | 20 | 0.0% |
| Kenyan | 23 | 0.0% |
| Korean | 240 | 0.3% |
| Laotian | 22 | 0.0% |
| Lebanese | 243 | 0.3% |
| Lithuanian | 170 | 0.2% |
| Lumbee | 34 | 0.0% |
| Maltese | 35 | 0.0% |
| Mexican | 1,483 | 1.5% |
| Moroccan | 2 | 0.0% |
| Native Hawaiian | 72 | 0.1% |
| Navajo | 24 | 0.0% |
| Nigerian | 55 | 0.1% |
| Northern European | 187 | 0.2% |
| Norwegian | 538 | 0.6% |
| Osage | 16 | 0.0% |
| Pakistani | 152 | 0.2% |
| Palestinian | 8 | 0.0% |
| Pennsylvania German | 18 | 0.0% |
| Peruvian | 115 | 0.1% |
| Polish | 1,670 | 1.7% |
| Portuguese | 53 | 0.1% |
| Puerto Rican | 631 | 0.6% |
| Romanian | 69 | 0.1% |
| Russian | 193 | 0.2% |
| Salvadoran | 52 | 0.1% |
| Samoan | 24 | 0.0% |
| Scandinavian | 227 | 0.2% |
| Scotch-Irish | 2,187 | 2.3% |
| Scottish | 2,131 | 2.2% |
| Seminole | 21 | 0.0% |
| Serbian | 31 | 0.0% |
| Sierra Leonean | 6 | 0.0% |
| Sioux | 2 | 0.0% |
| Slavic | 9 | 0.0% |
| Slovak | 159 | 0.2% |
| Slovene | 5 | 0.0% |
| South African | 12 | 0.0% |
| South American | 405 | 0.4% |
| Spaniard | 237 | 0.3% |
| Spanish | 27 | 0.0% |
| Sri Lankan | 561 | 0.6% |
| Subsaharan African | 644 | 0.7% |
| Swedish | 391 | 0.4% |
| Swiss | 153 | 0.2% |
| Syrian | 5 | 0.0% |
| Thai | 1,746 | 1.8% |
| Turkish | 102 | 0.1% |
| Ukrainian | 142 | 0.2% |
| Uruguayan | 23 | 0.0% |
| Welsh | 594 | 0.6% |
| Yugoslavian | 309 | 0.3% |
| Zimbabwean | 21 | 0.0% | View All 108 Rows |
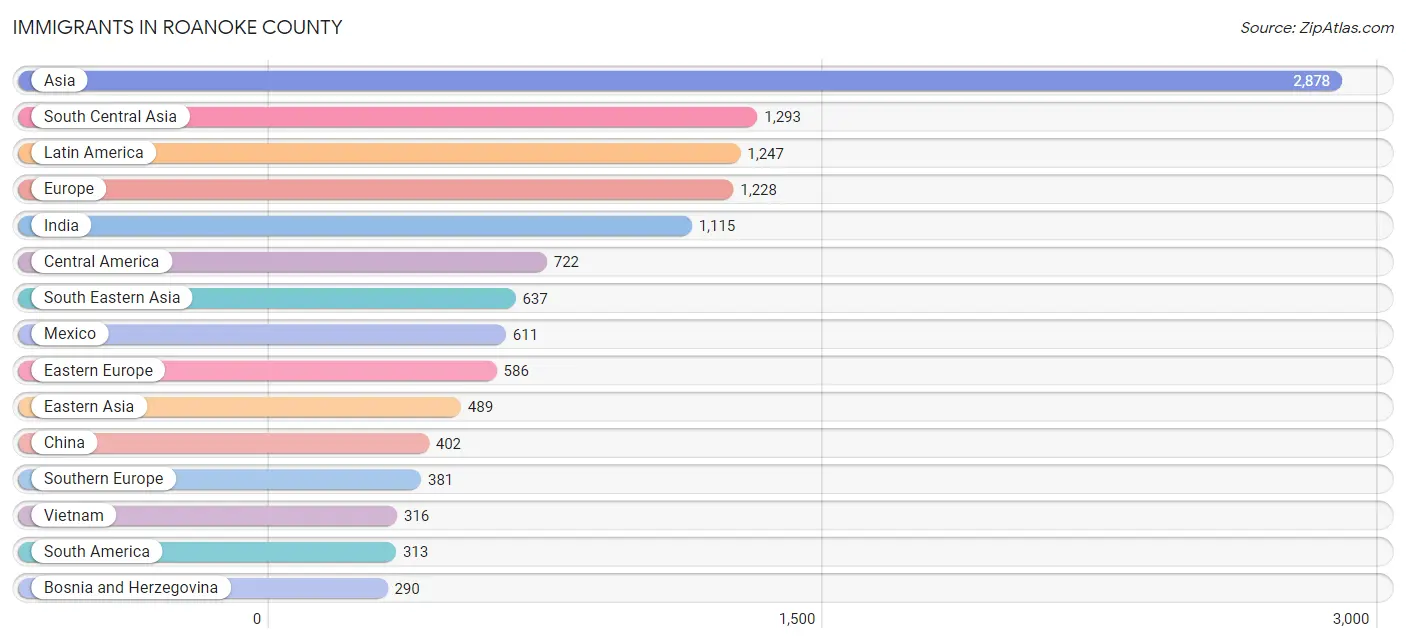
Immigrants in Roanoke County
The most numerous immigrant groups reported in Roanoke County came from Asia (2,878 | 3.0%), South Central Asia (1,293 | 1.3%), Latin America (1,247 | 1.3%), Europe (1,228 | 1.3%), and India (1,115 | 1.1%), together accounting for 8.0% of all Roanoke County residents.
| Immigration Origin | # Population | % Population |
| Africa | 159 | 0.2% |
| Asia | 2,878 | 3.0% |
| Australia | 48 | 0.1% |
| Bangladesh | 32 | 0.0% |
| Barbados | 23 | 0.0% |
| Bolivia | 10 | 0.0% |
| Bosnia and Herzegovina | 290 | 0.3% |
| Brazil | 113 | 0.1% |
| Cambodia | 187 | 0.2% |
| Canada | 244 | 0.3% |
| Caribbean | 212 | 0.2% |
| Central America | 722 | 0.7% |
| China | 402 | 0.4% |
| Colombia | 79 | 0.1% |
| Costa Rica | 47 | 0.1% |
| Croatia | 32 | 0.0% |
| Cuba | 67 | 0.1% |
| Czechoslovakia | 29 | 0.0% |
| Denmark | 16 | 0.0% |
| Dominican Republic | 73 | 0.1% |
| Eastern Africa | 71 | 0.1% |
| Eastern Asia | 489 | 0.5% |
| Eastern Europe | 586 | 0.6% |
| Ecuador | 49 | 0.1% |
| Egypt | 14 | 0.0% |
| England | 64 | 0.1% |
| Ethiopia | 11 | 0.0% |
| Europe | 1,228 | 1.3% |
| Fiji | 20 | 0.0% |
| Germany | 93 | 0.1% |
| Greece | 207 | 0.2% |
| Guatemala | 64 | 0.1% |
| Haiti | 33 | 0.0% |
| Hong Kong | 3 | 0.0% |
| Hungary | 28 | 0.0% |
| India | 1,115 | 1.1% |
| Indonesia | 22 | 0.0% |
| Iran | 22 | 0.0% |
| Iraq | 27 | 0.0% |
| Ireland | 20 | 0.0% |
| Israel | 32 | 0.0% |
| Italy | 52 | 0.1% |
| Jamaica | 16 | 0.0% |
| Japan | 7 | 0.0% |
| Kazakhstan | 29 | 0.0% |
| Kenya | 23 | 0.0% |
| Korea | 80 | 0.1% |
| Latin America | 1,247 | 1.3% |
| Lebanon | 49 | 0.1% |
| Mexico | 611 | 0.6% |
| Morocco | 2 | 0.0% |
| Nepal | 12 | 0.0% |
| Netherlands | 13 | 0.0% |
| Nigeria | 26 | 0.0% |
| Northern Africa | 38 | 0.0% |
| Northern Europe | 155 | 0.2% |
| Oceania | 68 | 0.1% |
| Pakistan | 83 | 0.1% |
| Peru | 62 | 0.1% |
| Philippines | 53 | 0.1% |
| Poland | 40 | 0.0% |
| Romania | 49 | 0.1% |
| Russia | 42 | 0.0% |
| Scotland | 14 | 0.0% |
| Sierra Leone | 6 | 0.0% |
| South Africa | 17 | 0.0% |
| South America | 313 | 0.3% |
| South Central Asia | 1,293 | 1.3% |
| South Eastern Asia | 637 | 0.7% |
| Southern Europe | 381 | 0.4% |
| Spain | 122 | 0.1% |
| Sweden | 15 | 0.0% |
| Taiwan | 36 | 0.0% |
| Thailand | 59 | 0.1% |
| Turkey | 97 | 0.1% |
| Ukraine | 76 | 0.1% |
| Vietnam | 316 | 0.3% |
| Western Africa | 33 | 0.0% |
| Western Asia | 214 | 0.2% |
| Western Europe | 106 | 0.1% |
| Zimbabwe | 36 | 0.0% | View All 81 Rows |
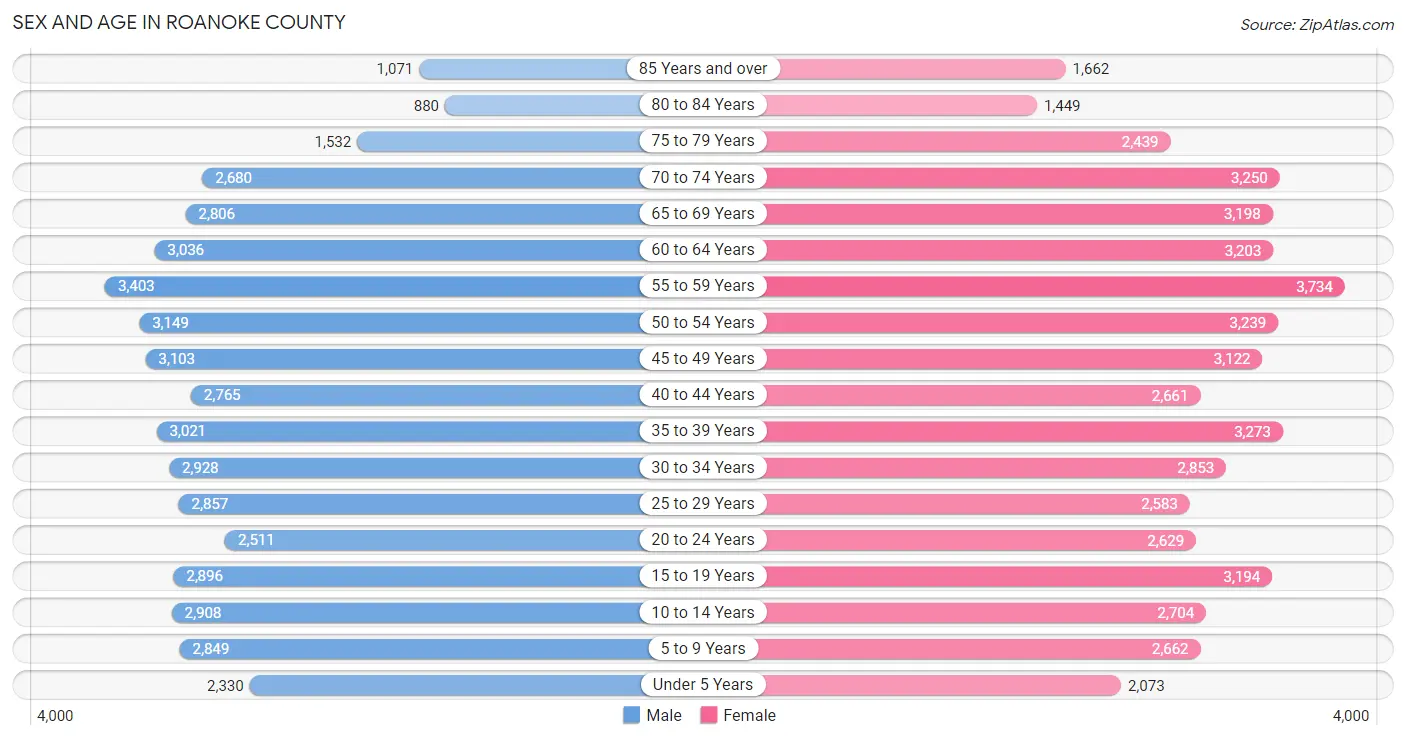
Sex and Age in Roanoke County
Sex and Age in Roanoke County
The most populous age groups in Roanoke County are 55 to 59 Years (3,403 | 7.3%) for men and 55 to 59 Years (3,734 | 7.5%) for women.
| Age Bracket | Male | Female |
| Under 5 Years | 2,330 (5.0%) | 2,073 (4.2%) |
| 5 to 9 Years | 2,849 (6.1%) | 2,662 (5.3%) |
| 10 to 14 Years | 2,908 (6.2%) | 2,704 (5.4%) |
| 15 to 19 Years | 2,896 (6.2%) | 3,194 (6.4%) |
| 20 to 24 Years | 2,511 (5.4%) | 2,629 (5.3%) |
| 25 to 29 Years | 2,857 (6.1%) | 2,583 (5.2%) |
| 30 to 34 Years | 2,928 (6.3%) | 2,853 (5.7%) |
| 35 to 39 Years | 3,021 (6.5%) | 3,273 (6.6%) |
| 40 to 44 Years | 2,765 (5.9%) | 2,661 (5.3%) |
| 45 to 49 Years | 3,103 (6.6%) | 3,122 (6.2%) |
| 50 to 54 Years | 3,149 (6.7%) | 3,239 (6.5%) |
| 55 to 59 Years | 3,403 (7.3%) | 3,734 (7.5%) |
| 60 to 64 Years | 3,036 (6.5%) | 3,203 (6.4%) |
| 65 to 69 Years | 2,806 (6.0%) | 3,198 (6.4%) |
| 70 to 74 Years | 2,680 (5.7%) | 3,250 (6.5%) |
| 75 to 79 Years | 1,532 (3.3%) | 2,439 (4.9%) |
| 80 to 84 Years | 880 (1.9%) | 1,449 (2.9%) |
| 85 Years and over | 1,071 (2.3%) | 1,662 (3.3%) |
| Total | 46,725 (100.0%) | 49,928 (100.0%) |
Families and Households in Roanoke County
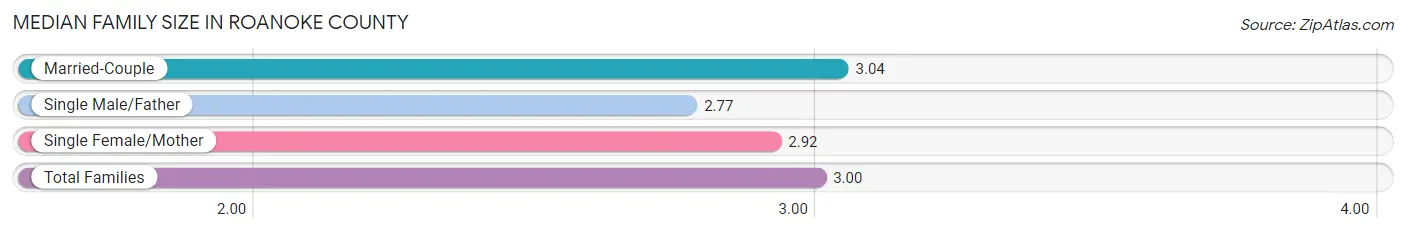
Median Family Size in Roanoke County
The median family size in Roanoke County is 3.00 persons per family, with married-couple families (19,490 | 77.0%) accounting for the largest median family size of 3.04 persons per family. On the other hand, single male/father families (1,806 | 7.1%) represent the smallest median family size with 2.77 persons per family.
| Family Type | # Families | Family Size |
| Married-Couple | 19,490 (77.0%) | 3.04 |
| Single Male/Father | 1,806 (7.1%) | 2.77 |
| Single Female/Mother | 4,008 (15.8%) | 2.92 |
| Total Families | 25,304 (100.0%) | 3.00 |
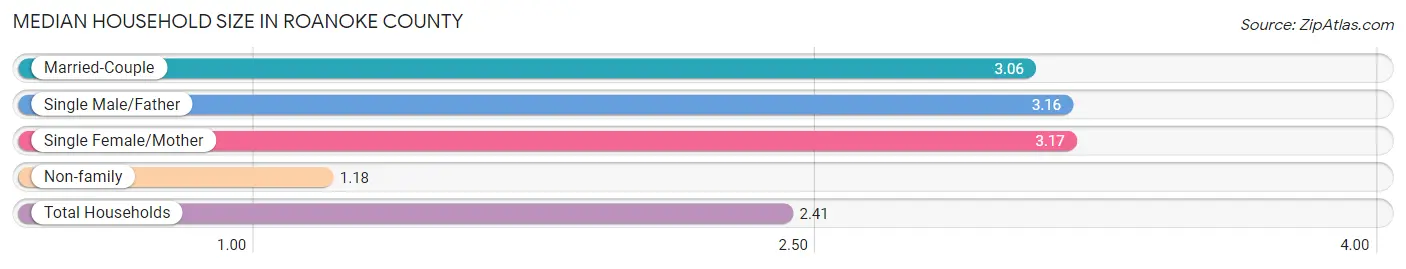
Median Household Size in Roanoke County
The median household size in Roanoke County is 2.41 persons per household, with single female/mother households (4,008 | 10.2%) accounting for the largest median household size of 3.17 persons per household. non-family households (13,852 | 35.4%) represent the smallest median household size with 1.18 persons per household.
| Household Type | # Households | Household Size |
| Married-Couple | 19,490 (49.8%) | 3.06 |
| Single Male/Father | 1,806 (4.6%) | 3.16 |
| Single Female/Mother | 4,008 (10.2%) | 3.17 |
| Non-family | 13,852 (35.4%) | 1.18 |
| Total Households | 39,156 (100.0%) | 2.41 |
Household Size by Marriage Status in Roanoke County
Out of a total of 39,156 households in Roanoke County, 25,304 (64.6%) are family households, while 13,852 (35.4%) are nonfamily households. The most numerous type of family households are 2-person households, comprising 12,111, and the most common type of nonfamily households are 1-person households, comprising 12,041.
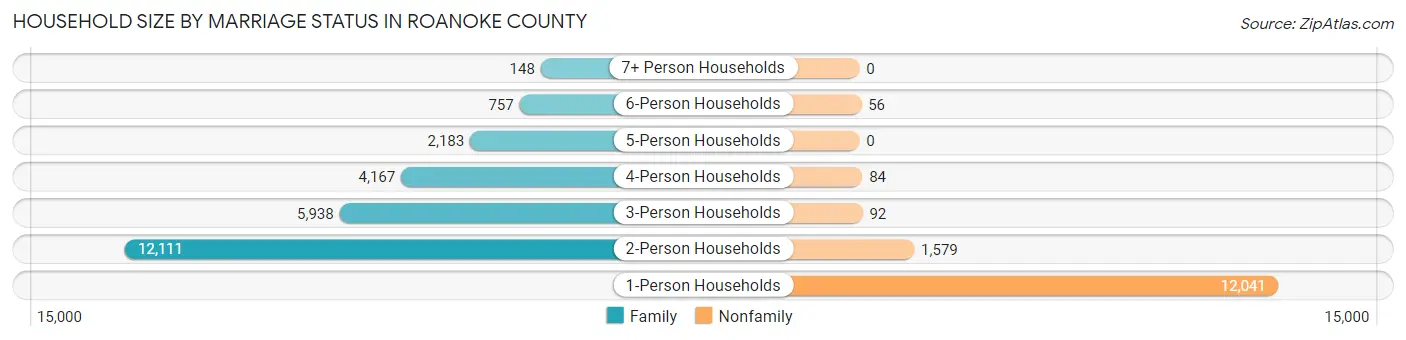
| Household Size | Family Households | Nonfamily Households |
| 1-Person Households | - | 12,041 (30.7%) |
| 2-Person Households | 12,111 (30.9%) | 1,579 (4.0%) |
| 3-Person Households | 5,938 (15.2%) | 92 (0.2%) |
| 4-Person Households | 4,167 (10.6%) | 84 (0.2%) |
| 5-Person Households | 2,183 (5.6%) | 0 (0.0%) |
| 6-Person Households | 757 (1.9%) | 56 (0.1%) |
| 7+ Person Households | 148 (0.4%) | 0 (0.0%) |
| Total | 25,304 (64.6%) | 13,852 (35.4%) |
Female Fertility in Roanoke County
Fertility by Age in Roanoke County
Average fertility rate in Roanoke County is 35.0 births per 1,000 women. Women in the age bracket of 20 to 34 years have the highest fertility rate with 74.0 births per 1,000 women. Women in the age bracket of 20 to 34 years acount for 80.6% of all women with births.
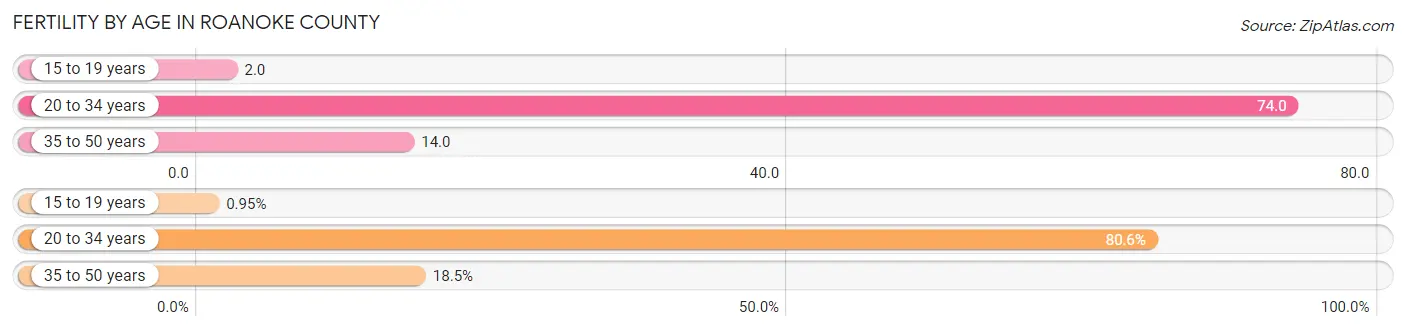
| Age Bracket | Women with Births | Births / 1,000 Women |
| 15 to 19 years | 7 (0.9%) | 2.0 |
| 20 to 34 years | 593 (80.6%) | 74.0 |
| 35 to 50 years | 136 (18.5%) | 14.0 |
| Total | 736 (100.0%) | 35.0 |
Fertility by Age by Marriage Status in Roanoke County
74.6% of women with births (736) in Roanoke County are married. The highest percentage of unmarried women with births falls into 15 to 19 years age bracket with 100.0% of them unmarried at the time of birth, while the lowest percentage of unmarried women with births belong to 35 to 50 years age bracket with 0.0% of them unmarried.
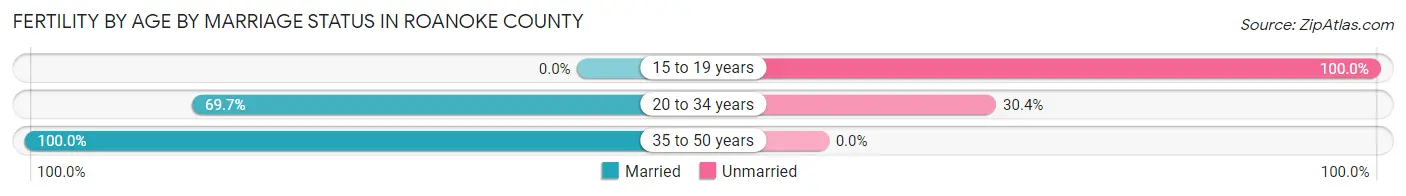
| Age Bracket | Married | Unmarried |
| 15 to 19 years | 0 (0.0%) | 7 (100.0%) |
| 20 to 34 years | 413 (69.7%) | 180 (30.3%) |
| 35 to 50 years | 136 (100.0%) | 0 (0.0%) |
| Total | 549 (74.6%) | 187 (25.4%) |
Fertility by Education in Roanoke County
Average fertility rate in Roanoke County is 35.0 births per 1,000 women. Women with the education attainment of graduate degree have the highest fertility rate of 60.0 births per 1,000 women, while women with the education attainment of less than high school have the lowest fertility at 8.0 births per 1,000 women. Women with the education attainment of bachelor's degree represent 37.0% of all women with births.
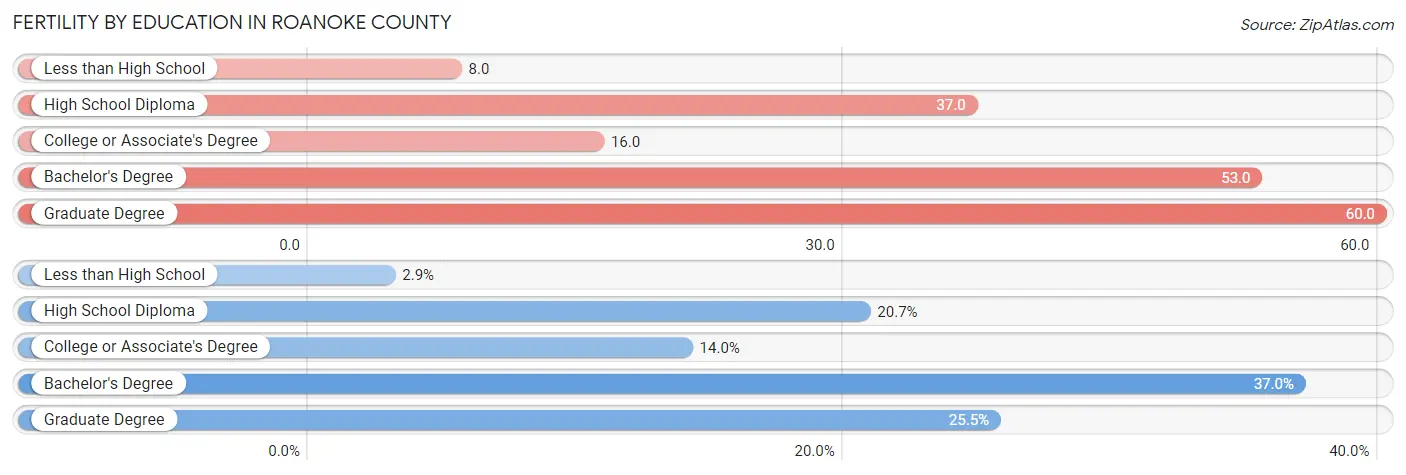
| Educational Attainment | Women with Births | Births / 1,000 Women |
| Less than High School | 21 (2.9%) | 8.0 |
| High School Diploma | 152 (20.6%) | 37.0 |
| College or Associate's Degree | 103 (14.0%) | 16.0 |
| Bachelor's Degree | 272 (37.0%) | 53.0 |
| Graduate Degree | 188 (25.5%) | 60.0 |
| Total | 736 (100.0%) | 35.0 |
Fertility by Education by Marriage Status in Roanoke County
25.4% of women with births in Roanoke County are unmarried. Women with the educational attainment of graduate degree are most likely to be married with 100.0% of them married at childbirth, while women with the educational attainment of less than high school are least likely to be married with 100.0% of them unmarried at childbirth.
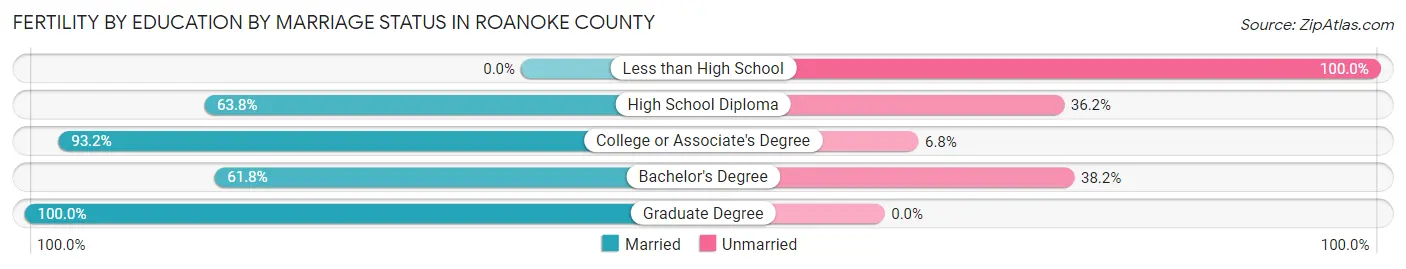
| Educational Attainment | Married | Unmarried |
| Less than High School | 0 (0.0%) | 21 (100.0%) |
| High School Diploma | 97 (63.8%) | 55 (36.2%) |
| College or Associate's Degree | 96 (93.2%) | 7 (6.8%) |
| Bachelor's Degree | 168 (61.8%) | 104 (38.2%) |
| Graduate Degree | 188 (100.0%) | 0 (0.0%) |
| Total | 549 (74.6%) | 187 (25.4%) |
Employment Characteristics in Roanoke County
Employment by Class of Employer in Roanoke County
Among the 46,477 employed individuals in Roanoke County, private company employees (30,231 | 65.0%), not-for-profit organizations (5,265 | 11.3%), and local government employees (3,220 | 6.9%) make up the most common classes of employment.
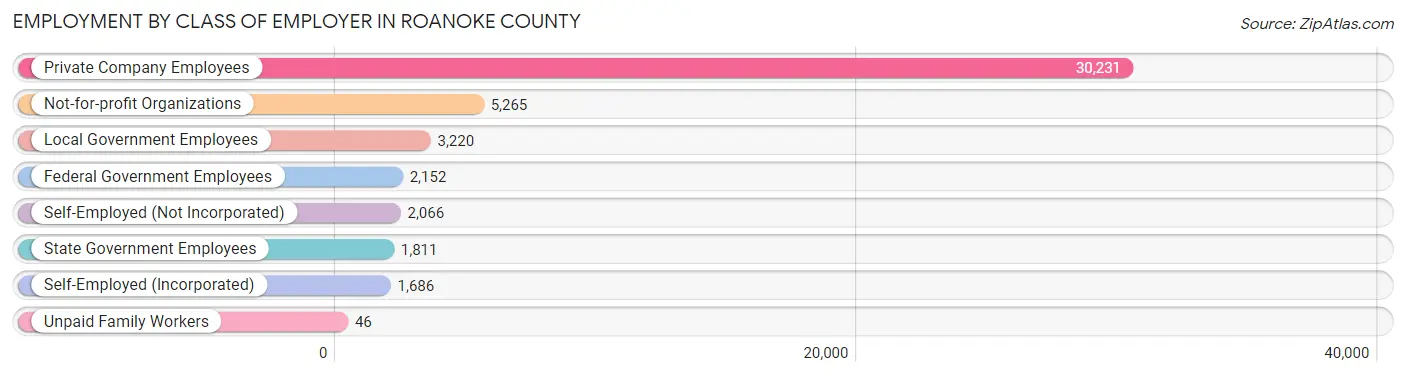
| Employer Class | # Employees | % Employees |
| Private Company Employees | 30,231 | 65.0% |
| Self-Employed (Incorporated) | 1,686 | 3.6% |
| Self-Employed (Not Incorporated) | 2,066 | 4.4% |
| Not-for-profit Organizations | 5,265 | 11.3% |
| Local Government Employees | 3,220 | 6.9% |
| State Government Employees | 1,811 | 3.9% |
| Federal Government Employees | 2,152 | 4.6% |
| Unpaid Family Workers | 46 | 0.1% |
| Total | 46,477 | 100.0% |
Employment Status by Age in Roanoke County
According to the labor force statistics for Roanoke County, out of the total population over 16 years of age (79,616), 61.1% or 48,645 individuals are in the labor force, with 2.6% or 1,265 of them unemployed. The age group with the highest labor force participation rate is 25 to 29 years, with 86.7% or 4,716 individuals in the labor force. Within the labor force, the 16 to 19 years age range has the highest percentage of unemployed individuals, with 11.1% or 233 of them being unemployed.
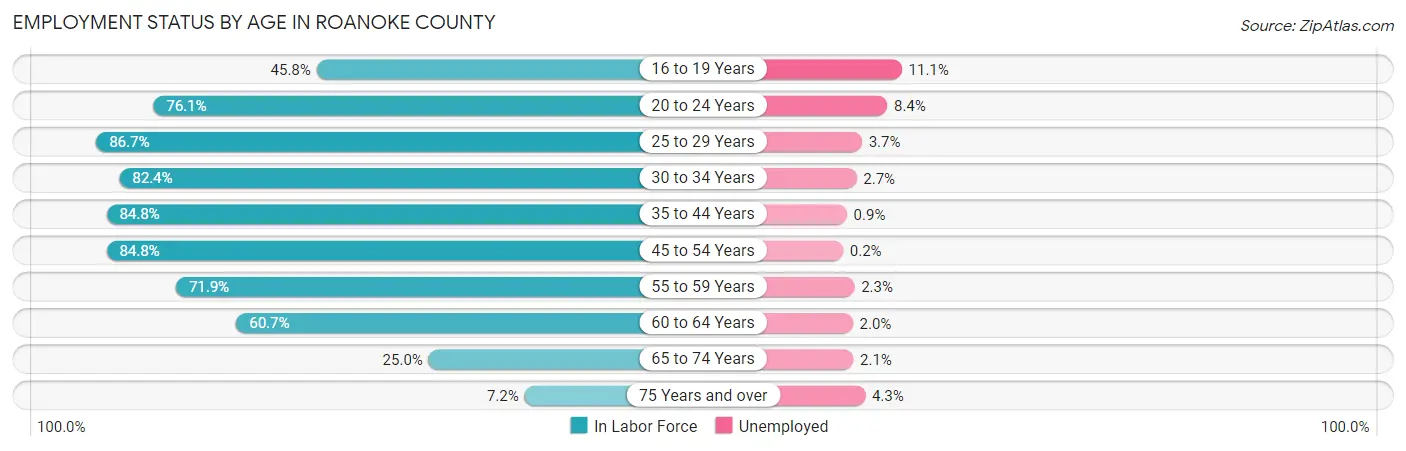
| Age Bracket | In Labor Force | Unemployed |
| 16 to 19 Years | 2,097 (45.8%) | 233 (11.1%) |
| 20 to 24 Years | 3,912 (76.1%) | 329 (8.4%) |
| 25 to 29 Years | 4,716 (86.7%) | 174 (3.7%) |
| 30 to 34 Years | 4,764 (82.4%) | 129 (2.7%) |
| 35 to 44 Years | 9,939 (84.8%) | 89 (0.9%) |
| 45 to 54 Years | 10,696 (84.8%) | 21 (0.2%) |
| 55 to 59 Years | 5,132 (71.9%) | 118 (2.3%) |
| 60 to 64 Years | 3,787 (60.7%) | 76 (2.0%) |
| 65 to 74 Years | 2,984 (25.0%) | 63 (2.1%) |
| 75 Years and over | 650 (7.2%) | 28 (4.3%) |
| Total | 48,645 (61.1%) | 1,265 (2.6%) |
Employment Status by Educational Attainment in Roanoke County
According to labor force statistics for Roanoke County, 79.8% of individuals (39,046) out of the total population between 25 and 64 years of age (48,930) are in the labor force, with 1.6% or 625 of them being unemployed. The group with the highest labor force participation rate are those with the educational attainment of bachelor's degree or higher, with 85.1% or 17,052 individuals in the labor force. Within the labor force, individuals with college / associate degree education have the highest percentage of unemployment, with 2.8% or 331 of them being unemployed.
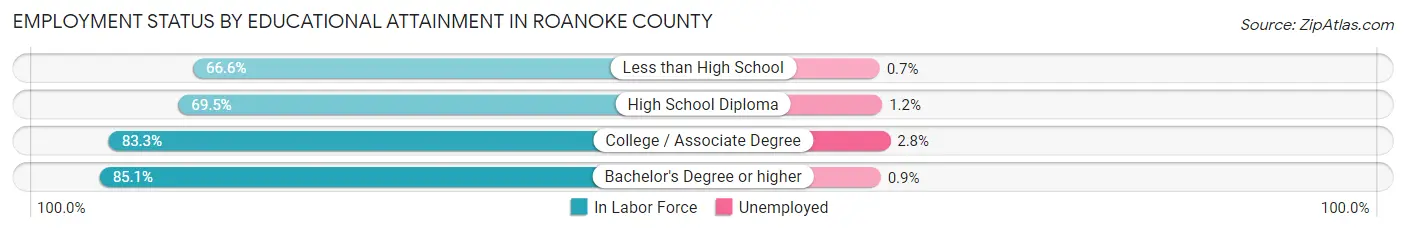
| Educational Attainment | In Labor Force | Unemployed |
| Less than High School | 1,600 (66.6%) | 17 (0.7%) |
| High School Diploma | 8,534 (69.5%) | 147 (1.2%) |
| College / Associate Degree | 11,837 (83.3%) | 398 (2.8%) |
| Bachelor's Degree or higher | 17,052 (85.1%) | 180 (0.9%) |
| Total | 39,046 (79.8%) | 783 (1.6%) |
Employment Occupations by Sex in Roanoke County
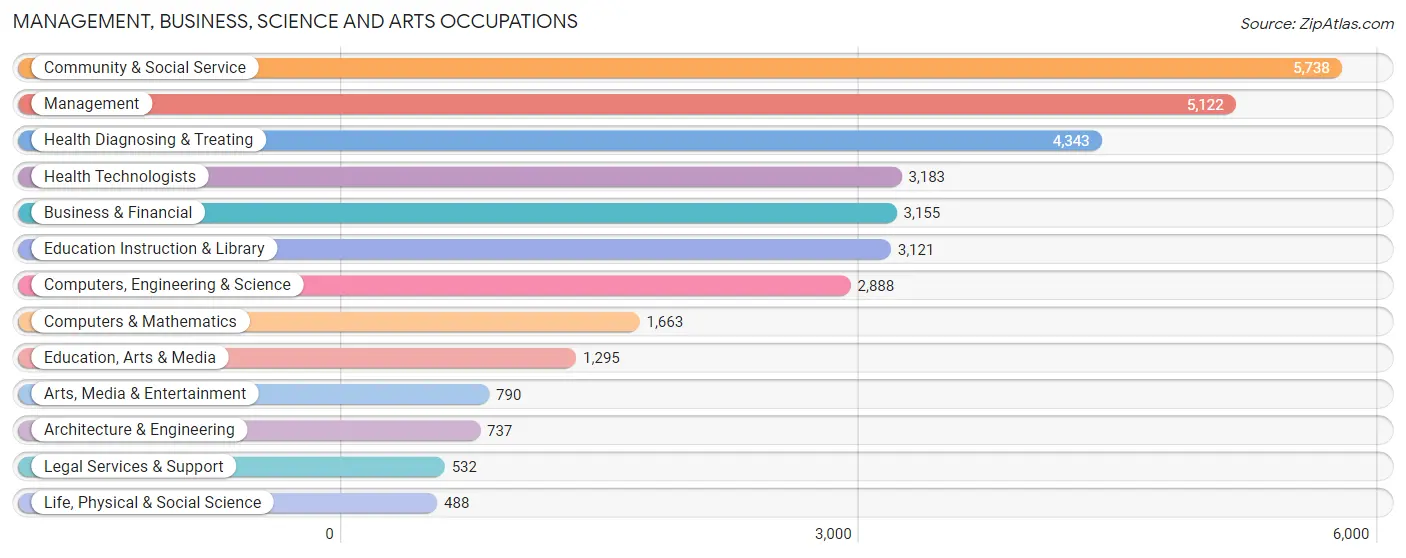
Management, Business, Science and Arts Occupations
The most common Management, Business, Science and Arts occupations in Roanoke County are Community & Social Service (5,738 | 12.2%), Management (5,122 | 10.9%), Health Diagnosing & Treating (4,343 | 9.2%), Health Technologists (3,183 | 6.8%), and Business & Financial (3,155 | 6.7%).
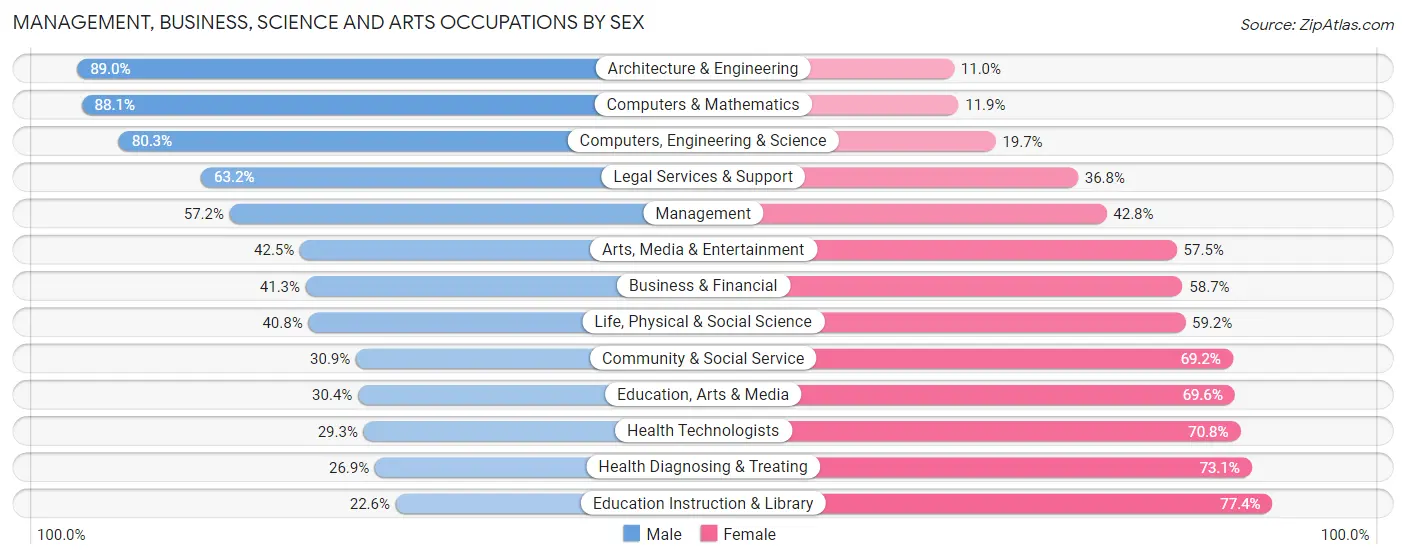
Management, Business, Science and Arts Occupations by Sex
Within the Management, Business, Science and Arts occupations in Roanoke County, the most male-oriented occupations are Architecture & Engineering (89.0%), Computers & Mathematics (88.1%), and Computers, Engineering & Science (80.3%), while the most female-oriented occupations are Education Instruction & Library (77.4%), Health Diagnosing & Treating (73.1%), and Health Technologists (70.8%).
| Occupation | Male | Female |
| Management | 2,930 (57.2%) | 2,192 (42.8%) |
| Business & Financial | 1,304 (41.3%) | 1,851 (58.7%) |
| Computers, Engineering & Science | 2,320 (80.3%) | 568 (19.7%) |
| Computers & Mathematics | 1,465 (88.1%) | 198 (11.9%) |
| Architecture & Engineering | 656 (89.0%) | 81 (11.0%) |
| Life, Physical & Social Science | 199 (40.8%) | 289 (59.2%) |
| Community & Social Service | 1,770 (30.8%) | 3,968 (69.2%) |
| Education, Arts & Media | 394 (30.4%) | 901 (69.6%) |
| Legal Services & Support | 336 (63.2%) | 196 (36.8%) |
| Education Instruction & Library | 704 (22.6%) | 2,417 (77.4%) |
| Arts, Media & Entertainment | 336 (42.5%) | 454 (57.5%) |
| Health Diagnosing & Treating | 1,168 (26.9%) | 3,175 (73.1%) |
| Health Technologists | 931 (29.2%) | 2,252 (70.8%) |
| Total (Category) | 9,492 (44.7%) | 11,754 (55.3%) |
| Total (Overall) | 24,495 (52.1%) | 22,556 (47.9%) |
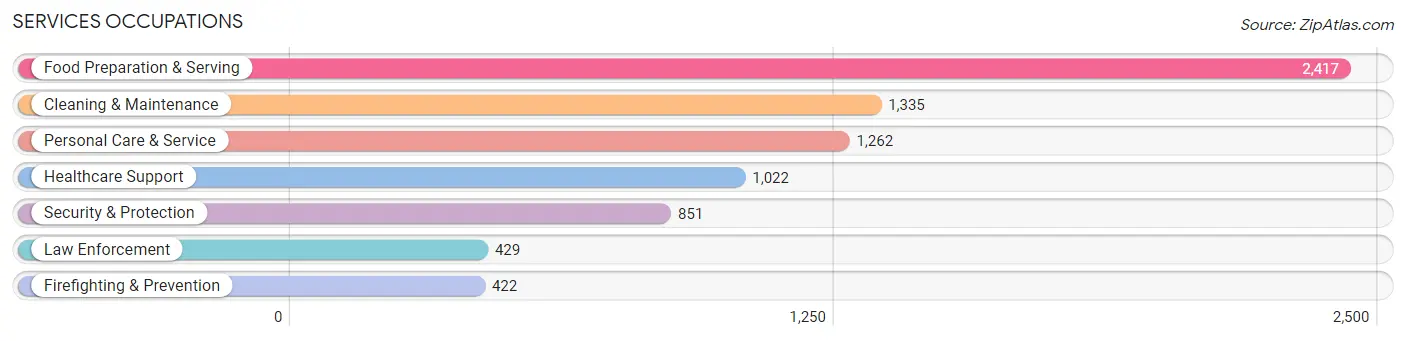
Services Occupations
The most common Services occupations in Roanoke County are Food Preparation & Serving (2,417 | 5.1%), Cleaning & Maintenance (1,335 | 2.8%), Personal Care & Service (1,262 | 2.7%), Healthcare Support (1,022 | 2.2%), and Security & Protection (851 | 1.8%).
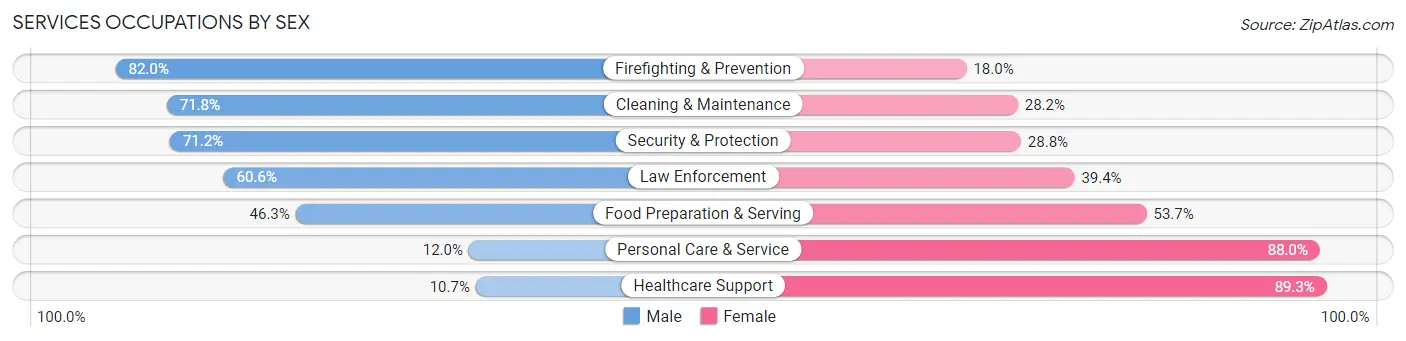
Services Occupations by Sex
Within the Services occupations in Roanoke County, the most male-oriented occupations are Firefighting & Prevention (82.0%), Cleaning & Maintenance (71.8%), and Security & Protection (71.2%), while the most female-oriented occupations are Healthcare Support (89.3%), Personal Care & Service (88.0%), and Food Preparation & Serving (53.7%).
| Occupation | Male | Female |
| Healthcare Support | 109 (10.7%) | 913 (89.3%) |
| Security & Protection | 606 (71.2%) | 245 (28.8%) |
| Firefighting & Prevention | 346 (82.0%) | 76 (18.0%) |
| Law Enforcement | 260 (60.6%) | 169 (39.4%) |
| Food Preparation & Serving | 1,120 (46.3%) | 1,297 (53.7%) |
| Cleaning & Maintenance | 959 (71.8%) | 376 (28.2%) |
| Personal Care & Service | 152 (12.0%) | 1,110 (88.0%) |
| Total (Category) | 2,946 (42.8%) | 3,941 (57.2%) |
| Total (Overall) | 24,495 (52.1%) | 22,556 (47.9%) |
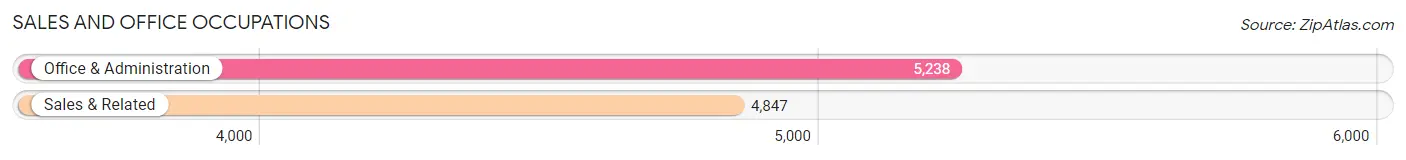
Sales and Office Occupations
The most common Sales and Office occupations in Roanoke County are Office & Administration (5,238 | 11.1%), and Sales & Related (4,847 | 10.3%).
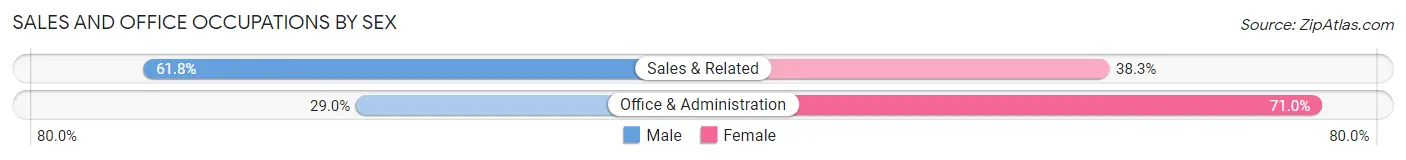
Sales and Office Occupations by Sex
| Occupation | Male | Female |
| Sales & Related | 2,993 (61.8%) | 1,854 (38.3%) |
| Office & Administration | 1,519 (29.0%) | 3,719 (71.0%) |
| Total (Category) | 4,512 (44.7%) | 5,573 (55.3%) |
| Total (Overall) | 24,495 (52.1%) | 22,556 (47.9%) |
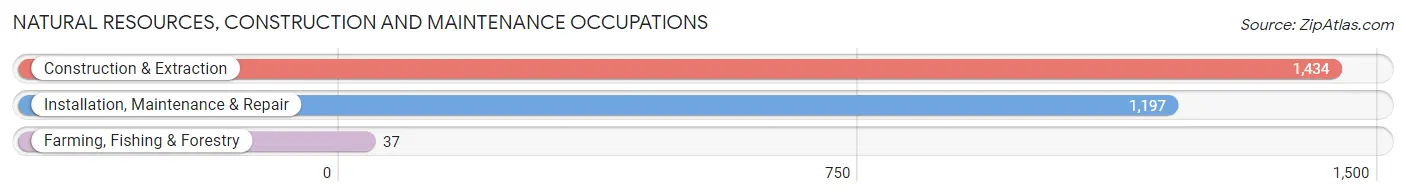
Natural Resources, Construction and Maintenance Occupations
The most common Natural Resources, Construction and Maintenance occupations in Roanoke County are Construction & Extraction (1,434 | 3.0%), Installation, Maintenance & Repair (1,197 | 2.5%), and Farming, Fishing & Forestry (37 | 0.1%).
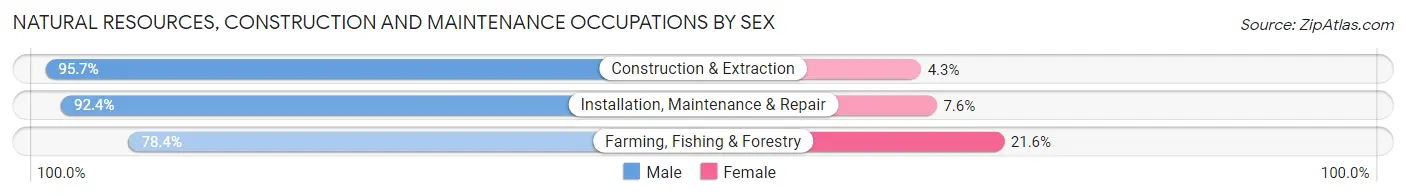
Natural Resources, Construction and Maintenance Occupations by Sex
| Occupation | Male | Female |
| Farming, Fishing & Forestry | 29 (78.4%) | 8 (21.6%) |
| Construction & Extraction | 1,372 (95.7%) | 62 (4.3%) |
| Installation, Maintenance & Repair | 1,106 (92.4%) | 91 (7.6%) |
| Total (Category) | 2,507 (94.0%) | 161 (6.0%) |
| Total (Overall) | 24,495 (52.1%) | 22,556 (47.9%) |
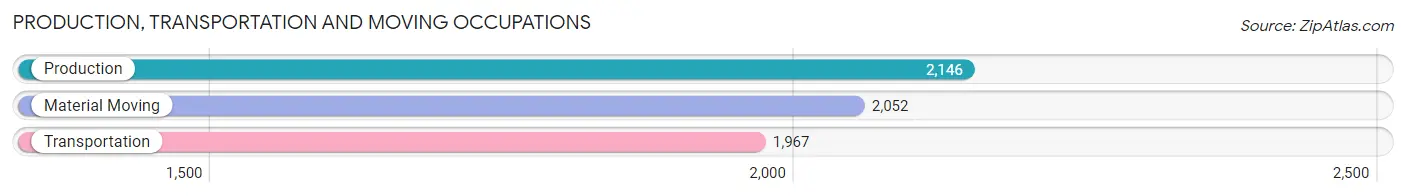
Production, Transportation and Moving Occupations
The most common Production, Transportation and Moving occupations in Roanoke County are Production (2,146 | 4.6%), Material Moving (2,052 | 4.4%), and Transportation (1,967 | 4.2%).
Production, Transportation and Moving Occupations by Sex
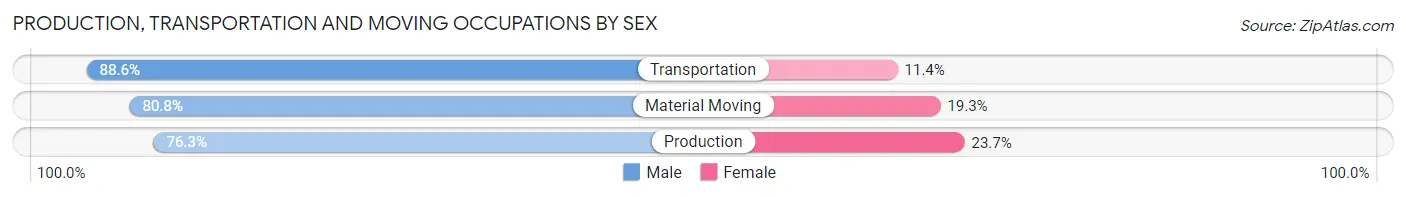
| Occupation | Male | Female |
| Production | 1,638 (76.3%) | 508 (23.7%) |
| Transportation | 1,743 (88.6%) | 224 (11.4%) |
| Material Moving | 1,657 (80.7%) | 395 (19.3%) |
| Total (Category) | 5,038 (81.7%) | 1,127 (18.3%) |
| Total (Overall) | 24,495 (52.1%) | 22,556 (47.9%) |
Employment Industries by Sex in Roanoke County
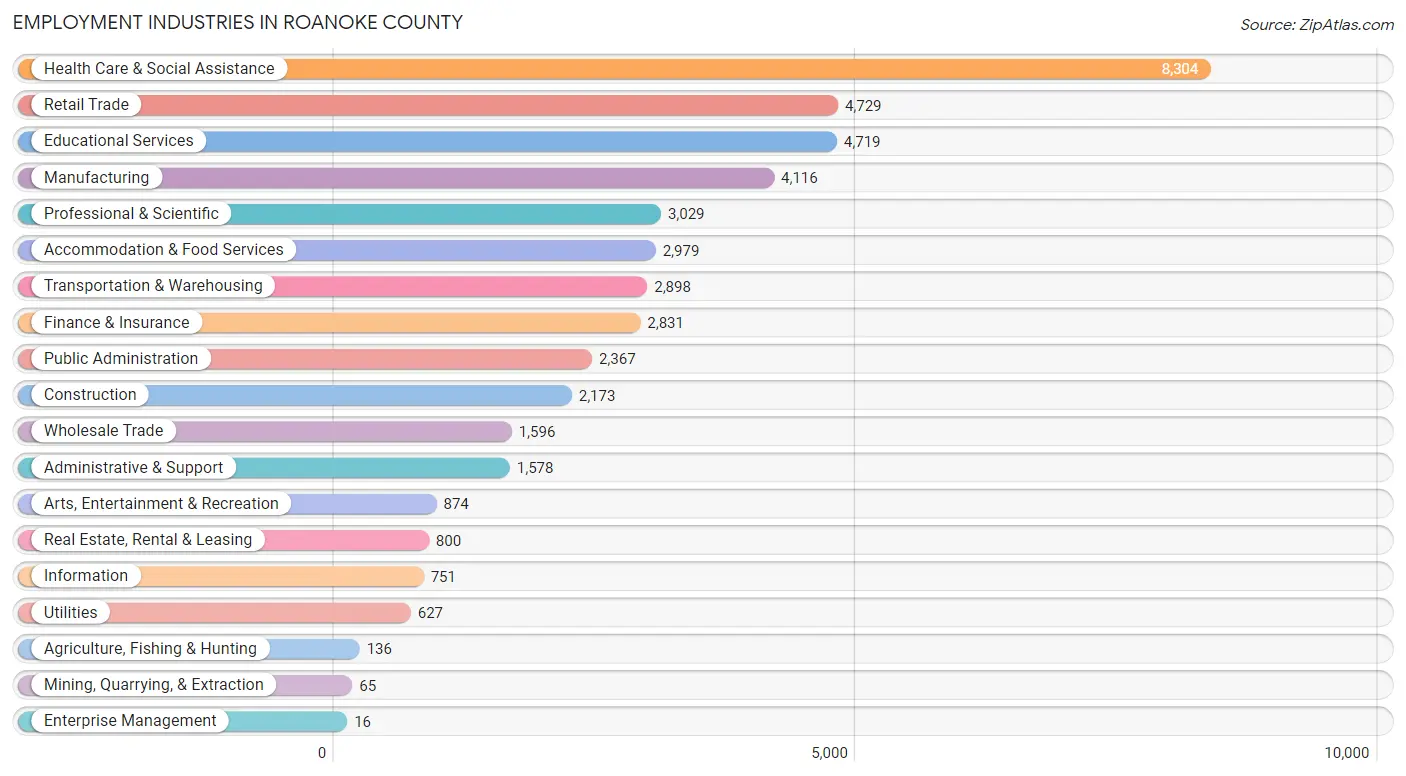
Employment Industries in Roanoke County
The major employment industries in Roanoke County include Health Care & Social Assistance (8,304 | 17.6%), Retail Trade (4,729 | 10.1%), Educational Services (4,719 | 10.0%), Manufacturing (4,116 | 8.7%), and Professional & Scientific (3,029 | 6.4%).
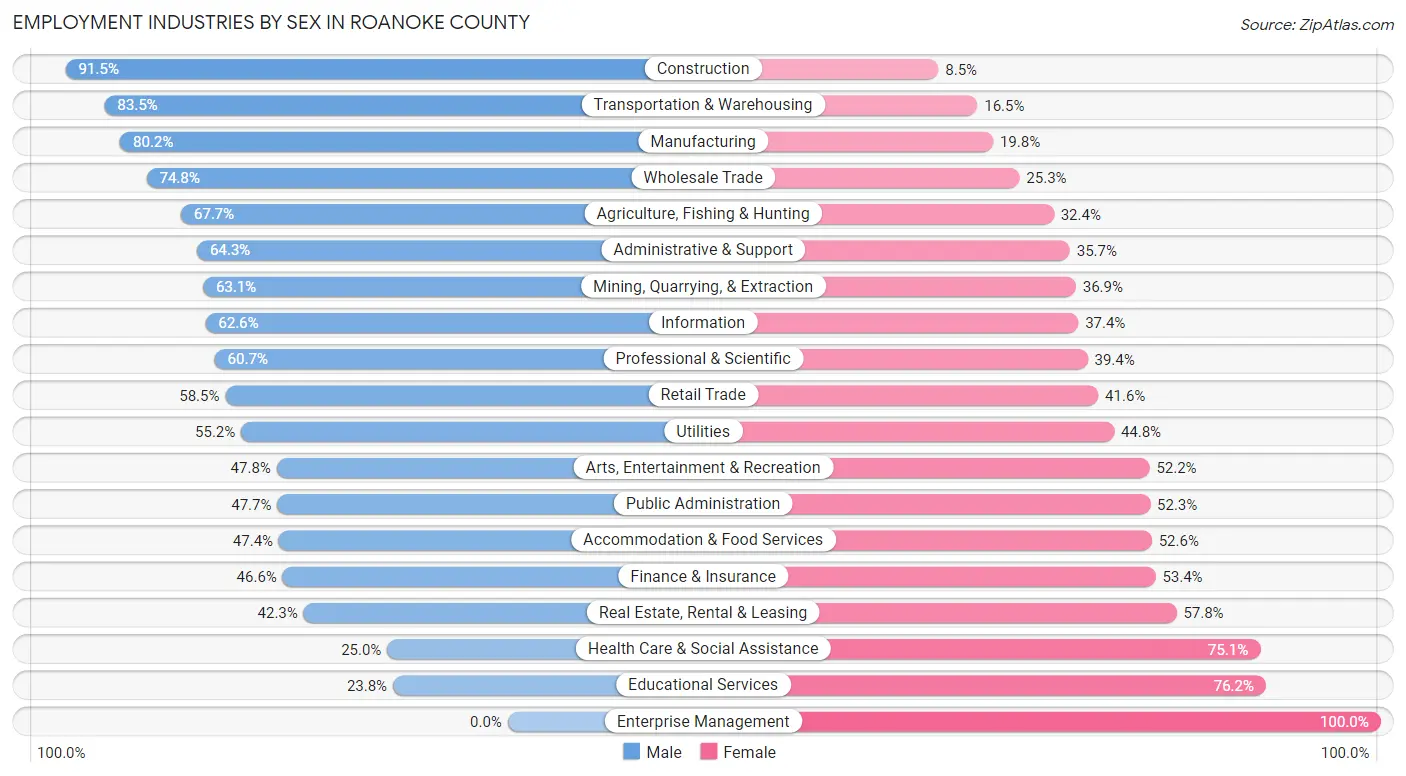
Employment Industries by Sex in Roanoke County
The Roanoke County industries that see more men than women are Construction (91.5%), Transportation & Warehousing (83.5%), and Manufacturing (80.2%), whereas the industries that tend to have a higher number of women are Enterprise Management (100.0%), Educational Services (76.2%), and Health Care & Social Assistance (75.0%).
| Industry | Male | Female |
| Agriculture, Fishing & Hunting | 92 (67.6%) | 44 (32.4%) |
| Mining, Quarrying, & Extraction | 41 (63.1%) | 24 (36.9%) |
| Construction | 1,989 (91.5%) | 184 (8.5%) |
| Manufacturing | 3,302 (80.2%) | 814 (19.8%) |
| Wholesale Trade | 1,193 (74.8%) | 403 (25.3%) |
| Retail Trade | 2,764 (58.5%) | 1,965 (41.5%) |
| Transportation & Warehousing | 2,419 (83.5%) | 479 (16.5%) |
| Utilities | 346 (55.2%) | 281 (44.8%) |
| Information | 470 (62.6%) | 281 (37.4%) |
| Finance & Insurance | 1,319 (46.6%) | 1,512 (53.4%) |
| Real Estate, Rental & Leasing | 338 (42.2%) | 462 (57.8%) |
| Professional & Scientific | 1,837 (60.7%) | 1,192 (39.4%) |
| Enterprise Management | 0 (0.0%) | 16 (100.0%) |
| Administrative & Support | 1,015 (64.3%) | 563 (35.7%) |
| Educational Services | 1,121 (23.8%) | 3,598 (76.2%) |
| Health Care & Social Assistance | 2,072 (24.9%) | 6,232 (75.0%) |
| Arts, Entertainment & Recreation | 418 (47.8%) | 456 (52.2%) |
| Accommodation & Food Services | 1,411 (47.4%) | 1,568 (52.6%) |
| Public Administration | 1,129 (47.7%) | 1,238 (52.3%) |
| Total | 24,495 (52.1%) | 22,556 (47.9%) |
Education in Roanoke County
School Enrollment in Roanoke County
The most common levels of schooling among the 20,589 students in Roanoke County are high school (4,823 | 23.4%), elementary school (4,580 | 22.2%), and middle school (4,092 | 19.9%).
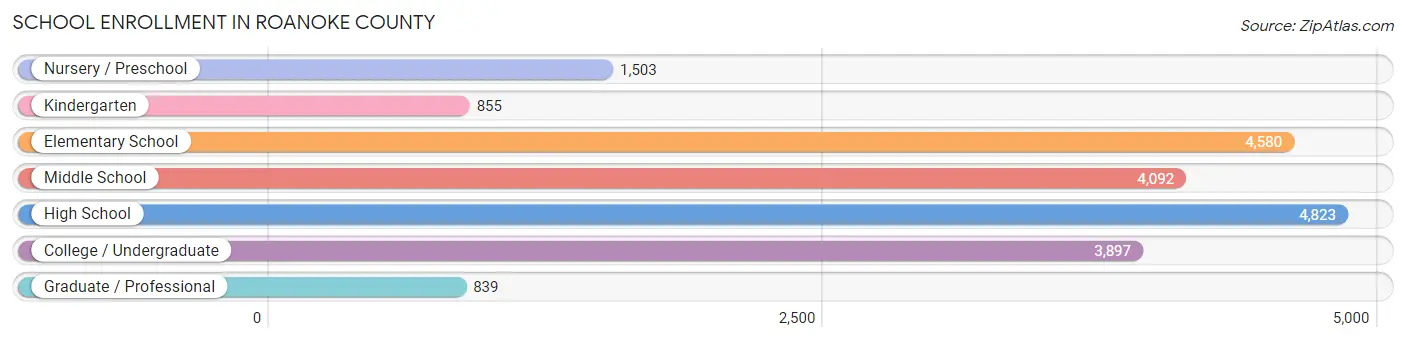
| School Level | # Students | % Students |
| Nursery / Preschool | 1,503 | 7.3% |
| Kindergarten | 855 | 4.2% |
| Elementary School | 4,580 | 22.2% |
| Middle School | 4,092 | 19.9% |
| High School | 4,823 | 23.4% |
| College / Undergraduate | 3,897 | 18.9% |
| Graduate / Professional | 839 | 4.1% |
| Total | 20,589 | 100.0% |
School Enrollment by Age by Funding Source in Roanoke County
Out of a total of 20,589 students who are enrolled in schools in Roanoke County, 3,830 (18.6%) attend a private institution, while the remaining 16,759 (81.4%) are enrolled in public schools. The age group of 3 to 4 year olds has the highest likelihood of being enrolled in private schools, with 527 (45.8% in the age bracket) enrolled. Conversely, the age group of 15 to 17 year olds has the lowest likelihood of being enrolled in a private school, with 3,218 (90.5% in the age bracket) attending a public institution.
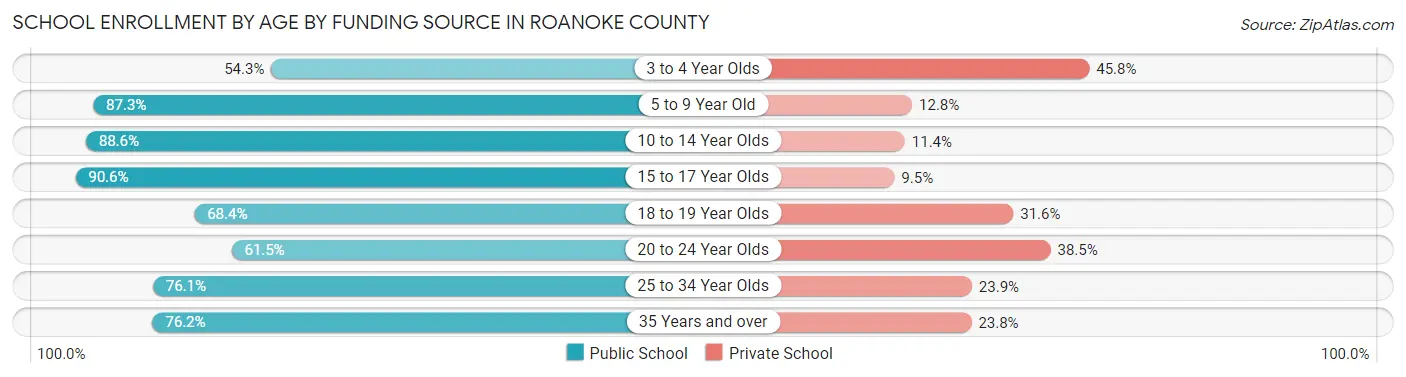
| Age Bracket | Public School | Private School |
| 3 to 4 Year Olds | 625 (54.2%) | 527 (45.8%) |
| 5 to 9 Year Old | 4,392 (87.3%) | 642 (12.8%) |
| 10 to 14 Year Olds | 4,873 (88.6%) | 627 (11.4%) |
| 15 to 17 Year Olds | 3,218 (90.5%) | 336 (9.5%) |
| 18 to 19 Year Olds | 1,184 (68.4%) | 547 (31.6%) |
| 20 to 24 Year Olds | 1,211 (61.5%) | 759 (38.5%) |
| 25 to 34 Year Olds | 669 (76.1%) | 210 (23.9%) |
| 35 Years and over | 586 (76.2%) | 183 (23.8%) |
| Total | 16,759 (81.4%) | 3,830 (18.6%) |
Educational Attainment by Field of Study in Roanoke County
Business (5,503 | 19.6%), education (3,312 | 11.8%), science & technology (3,039 | 10.8%), social sciences (2,013 | 7.2%), and bio, nature & agricultural (1,992 | 7.1%) are the most common fields of study among 28,098 individuals in Roanoke County who have obtained a bachelor's degree or higher.
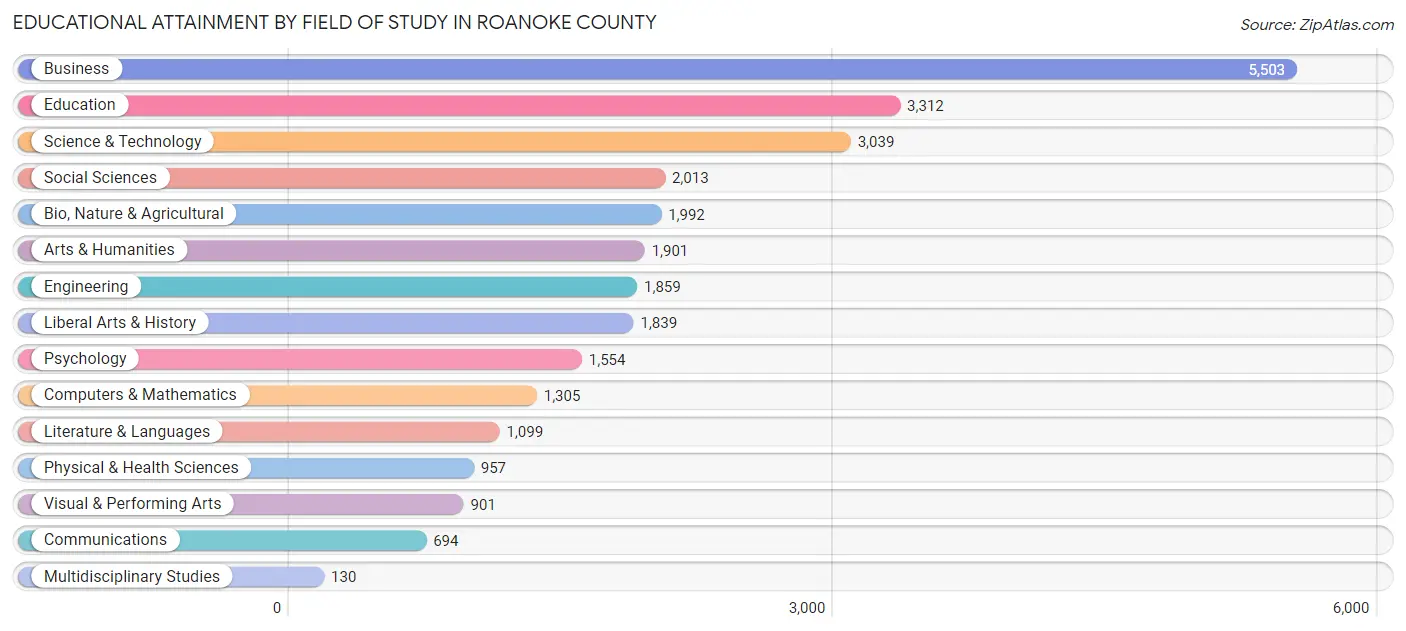
| Field of Study | # Graduates | % Graduates |
| Computers & Mathematics | 1,305 | 4.6% |
| Bio, Nature & Agricultural | 1,992 | 7.1% |
| Physical & Health Sciences | 957 | 3.4% |
| Psychology | 1,554 | 5.5% |
| Social Sciences | 2,013 | 7.2% |
| Engineering | 1,859 | 6.6% |
| Multidisciplinary Studies | 130 | 0.5% |
| Science & Technology | 3,039 | 10.8% |
| Business | 5,503 | 19.6% |
| Education | 3,312 | 11.8% |
| Literature & Languages | 1,099 | 3.9% |
| Liberal Arts & History | 1,839 | 6.5% |
| Visual & Performing Arts | 901 | 3.2% |
| Communications | 694 | 2.5% |
| Arts & Humanities | 1,901 | 6.8% |
| Total | 28,098 | 100.0% |
Transportation & Commute in Roanoke County
Vehicle Availability by Sex in Roanoke County
The most prevalent vehicle ownership categories in Roanoke County are males with 2 vehicles (9,879, accounting for 40.5%) and females with 2 vehicles (8,324, making up 44.9%).
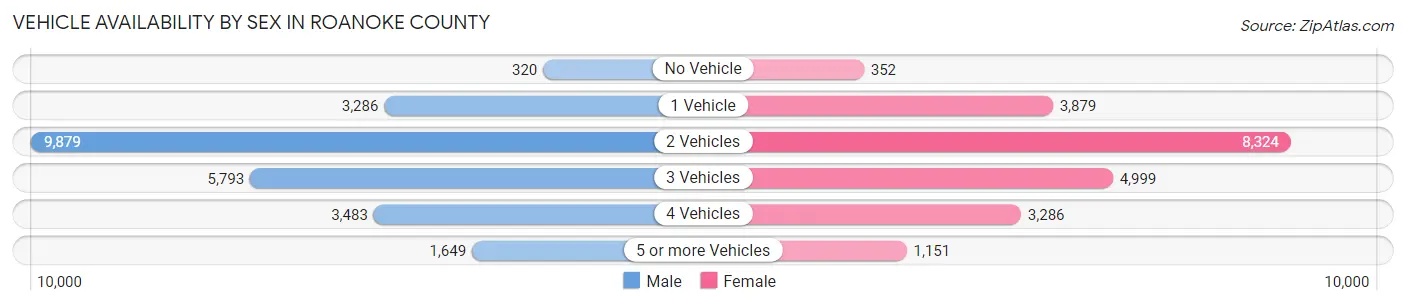
| Vehicles Available | Male | Female |
| No Vehicle | 320 (1.3%) | 352 (1.6%) |
| 1 Vehicle | 3,286 (13.5%) | 3,879 (17.6%) |
| 2 Vehicles | 9,879 (40.5%) | 8,324 (37.9%) |
| 3 Vehicles | 5,793 (23.7%) | 4,999 (22.7%) |
| 4 Vehicles | 3,483 (14.3%) | 3,286 (14.9%) |
| 5 or more Vehicles | 1,649 (6.8%) | 1,151 (5.2%) |
| Total | 24,410 (100.0%) | 21,991 (100.0%) |
Commute Time in Roanoke County
The most frequently occuring commute durations in Roanoke County are 15 to 19 minutes (9,181 commuters, 22.6%), 20 to 24 minutes (7,668 commuters, 18.9%), and 30 to 34 minutes (7,091 commuters, 17.4%).
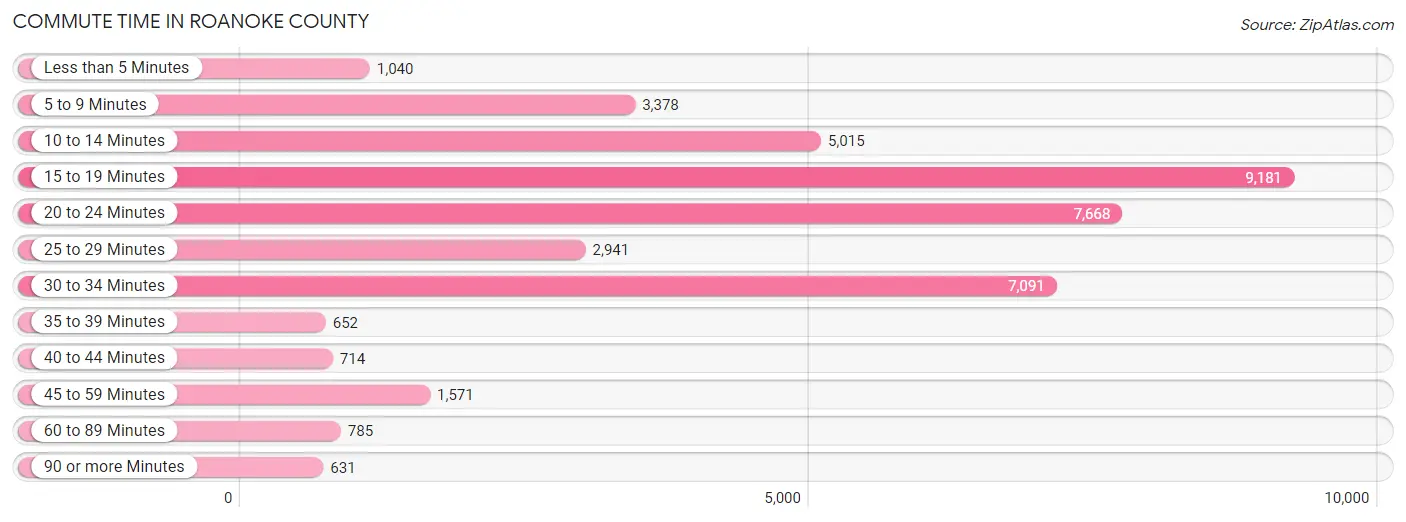
| Commute Time | # Commuters | % Commuters |
| Less than 5 Minutes | 1,040 | 2.6% |
| 5 to 9 Minutes | 3,378 | 8.3% |
| 10 to 14 Minutes | 5,015 | 12.3% |
| 15 to 19 Minutes | 9,181 | 22.6% |
| 20 to 24 Minutes | 7,668 | 18.9% |
| 25 to 29 Minutes | 2,941 | 7.2% |
| 30 to 34 Minutes | 7,091 | 17.4% |
| 35 to 39 Minutes | 652 | 1.6% |
| 40 to 44 Minutes | 714 | 1.8% |
| 45 to 59 Minutes | 1,571 | 3.9% |
| 60 to 89 Minutes | 785 | 1.9% |
| 90 or more Minutes | 631 | 1.5% |
Commute Time by Sex in Roanoke County
The most common commute times in Roanoke County are 15 to 19 minutes (5,001 commuters, 23.3%) for males and 15 to 19 minutes (4,180 commuters, 21.8%) for females.
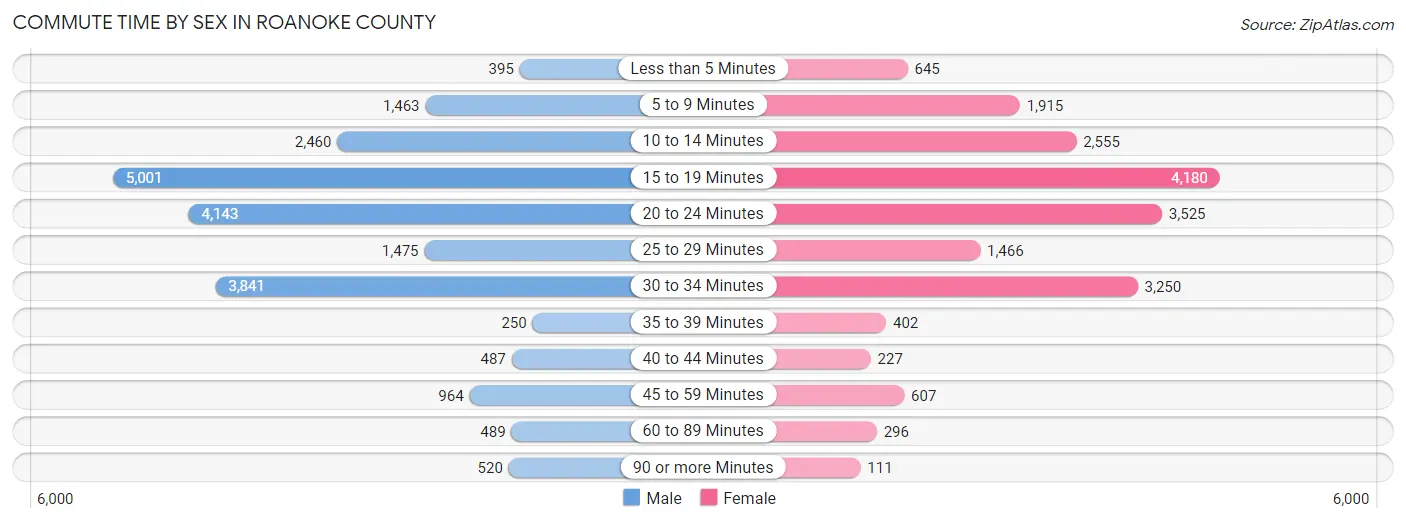
| Commute Time | Male | Female |
| Less than 5 Minutes | 395 (1.8%) | 645 (3.4%) |
| 5 to 9 Minutes | 1,463 (6.8%) | 1,915 (10.0%) |
| 10 to 14 Minutes | 2,460 (11.5%) | 2,555 (13.3%) |
| 15 to 19 Minutes | 5,001 (23.3%) | 4,180 (21.8%) |
| 20 to 24 Minutes | 4,143 (19.3%) | 3,525 (18.4%) |
| 25 to 29 Minutes | 1,475 (6.9%) | 1,466 (7.6%) |
| 30 to 34 Minutes | 3,841 (17.9%) | 3,250 (17.0%) |
| 35 to 39 Minutes | 250 (1.2%) | 402 (2.1%) |
| 40 to 44 Minutes | 487 (2.3%) | 227 (1.2%) |
| 45 to 59 Minutes | 964 (4.5%) | 607 (3.2%) |
| 60 to 89 Minutes | 489 (2.3%) | 296 (1.5%) |
| 90 or more Minutes | 520 (2.4%) | 111 (0.6%) |
Time of Departure to Work by Sex in Roanoke County
The most frequent times of departure to work in Roanoke County are 7:00 AM to 7:29 AM (3,353, 15.6%) for males and 7:30 AM to 7:59 AM (3,644, 19.0%) for females.
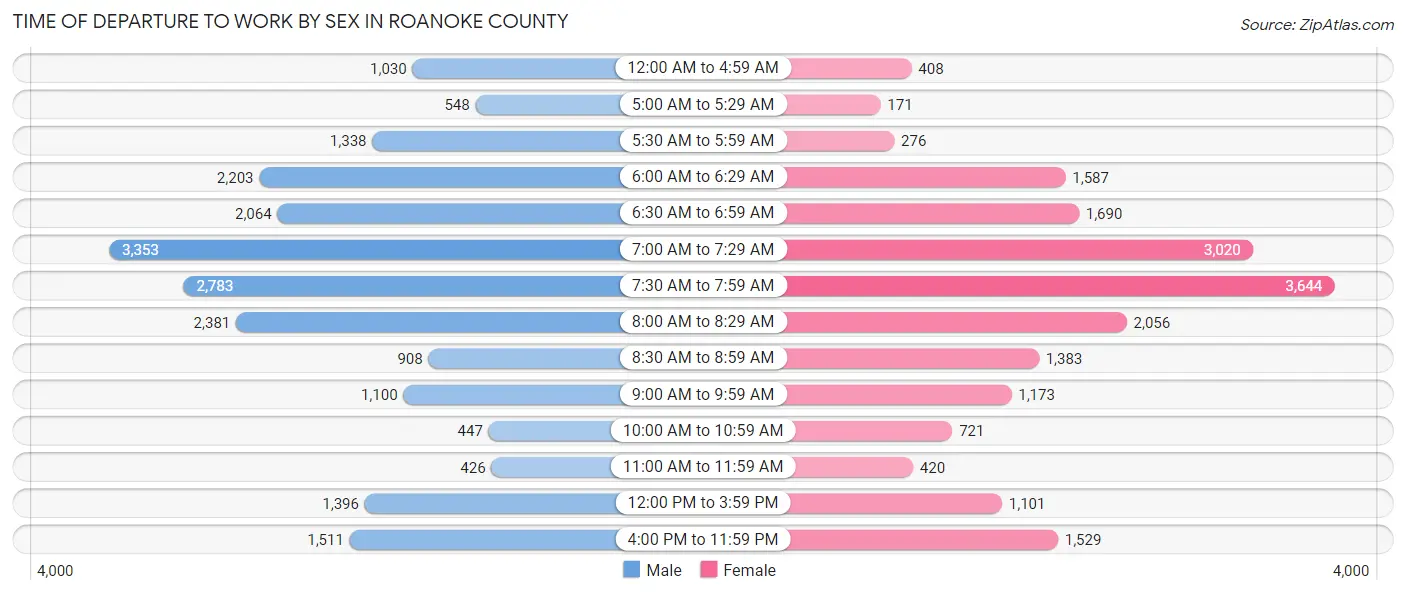
| Time of Departure | Male | Female |
| 12:00 AM to 4:59 AM | 1,030 (4.8%) | 408 (2.1%) |
| 5:00 AM to 5:29 AM | 548 (2.5%) | 171 (0.9%) |
| 5:30 AM to 5:59 AM | 1,338 (6.2%) | 276 (1.4%) |
| 6:00 AM to 6:29 AM | 2,203 (10.2%) | 1,587 (8.3%) |
| 6:30 AM to 6:59 AM | 2,064 (9.6%) | 1,690 (8.8%) |
| 7:00 AM to 7:29 AM | 3,353 (15.6%) | 3,020 (15.8%) |
| 7:30 AM to 7:59 AM | 2,783 (13.0%) | 3,644 (19.0%) |
| 8:00 AM to 8:29 AM | 2,381 (11.1%) | 2,056 (10.7%) |
| 8:30 AM to 8:59 AM | 908 (4.2%) | 1,383 (7.2%) |
| 9:00 AM to 9:59 AM | 1,100 (5.1%) | 1,173 (6.1%) |
| 10:00 AM to 10:59 AM | 447 (2.1%) | 721 (3.8%) |
| 11:00 AM to 11:59 AM | 426 (2.0%) | 420 (2.2%) |
| 12:00 PM to 3:59 PM | 1,396 (6.5%) | 1,101 (5.7%) |
| 4:00 PM to 11:59 PM | 1,511 (7.0%) | 1,529 (8.0%) |
| Total | 21,488 (100.0%) | 19,179 (100.0%) |
Housing Occupancy in Roanoke County
Occupancy by Ownership in Roanoke County
Of the total 39,156 dwellings in Roanoke County, owner-occupied units account for 29,642 (75.7%), while renter-occupied units make up 9,514 (24.3%).
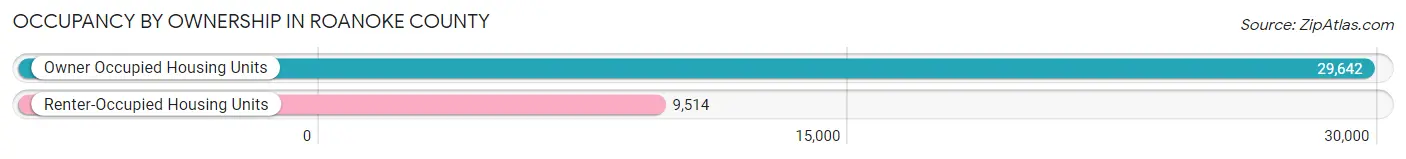
| Occupancy | # Housing Units | % Housing Units |
| Owner Occupied Housing Units | 29,642 | 75.7% |
| Renter-Occupied Housing Units | 9,514 | 24.3% |
| Total Occupied Housing Units | 39,156 | 100.0% |
Occupancy by Household Size in Roanoke County
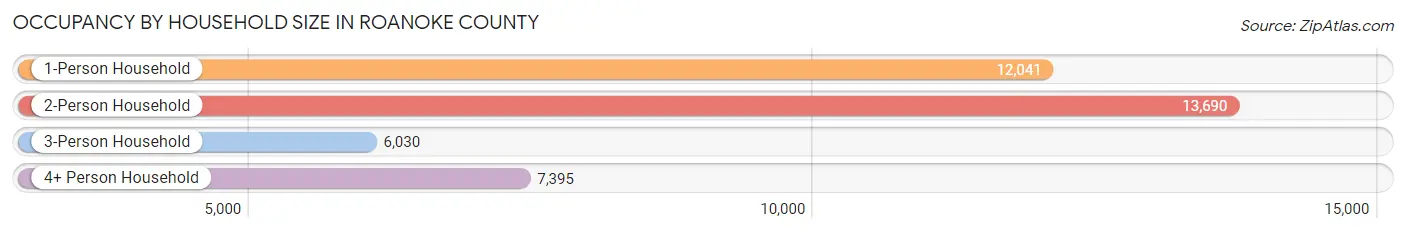
| Household Size | # Housing Units | % Housing Units |
| 1-Person Household | 12,041 | 30.7% |
| 2-Person Household | 13,690 | 35.0% |
| 3-Person Household | 6,030 | 15.4% |
| 4+ Person Household | 7,395 | 18.9% |
| Total Housing Units | 39,156 | 100.0% |
Occupancy by Ownership by Household Size in Roanoke County
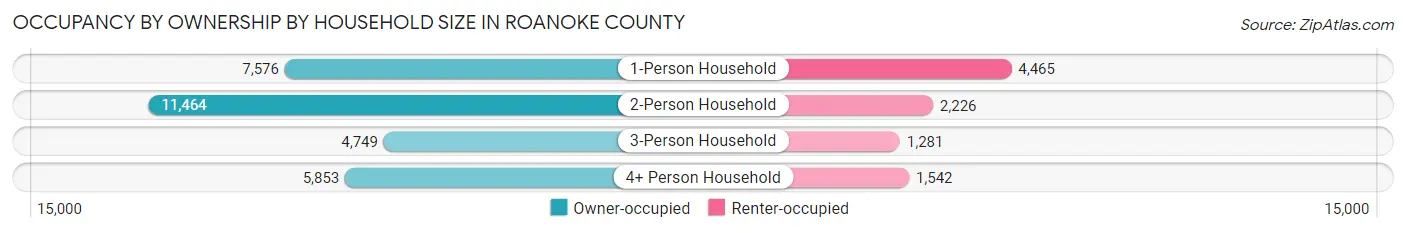
| Household Size | Owner-occupied | Renter-occupied |
| 1-Person Household | 7,576 (62.9%) | 4,465 (37.1%) |
| 2-Person Household | 11,464 (83.7%) | 2,226 (16.3%) |
| 3-Person Household | 4,749 (78.8%) | 1,281 (21.2%) |
| 4+ Person Household | 5,853 (79.1%) | 1,542 (20.8%) |
| Total Housing Units | 29,642 (75.7%) | 9,514 (24.3%) |
Occupancy by Educational Attainment in Roanoke County
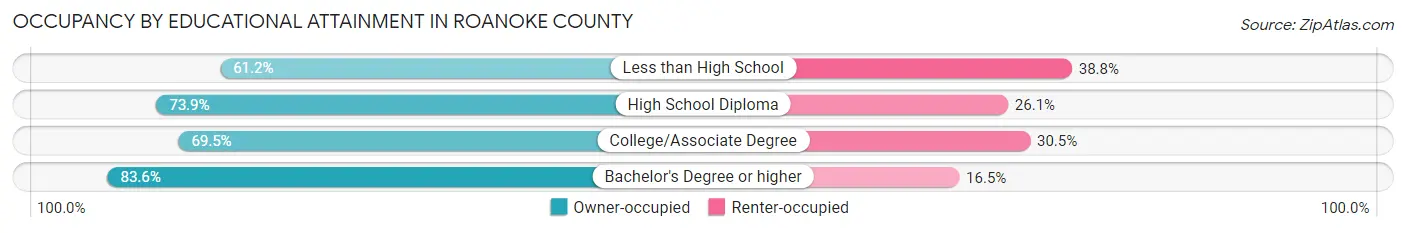
| Household Size | Owner-occupied | Renter-occupied |
| Less than High School | 1,452 (61.2%) | 920 (38.8%) |
| High School Diploma | 6,982 (73.9%) | 2,469 (26.1%) |
| College/Associate Degree | 8,048 (69.5%) | 3,534 (30.5%) |
| Bachelor's Degree or higher | 13,160 (83.6%) | 2,591 (16.5%) |
Occupancy by Age of Householder in Roanoke County
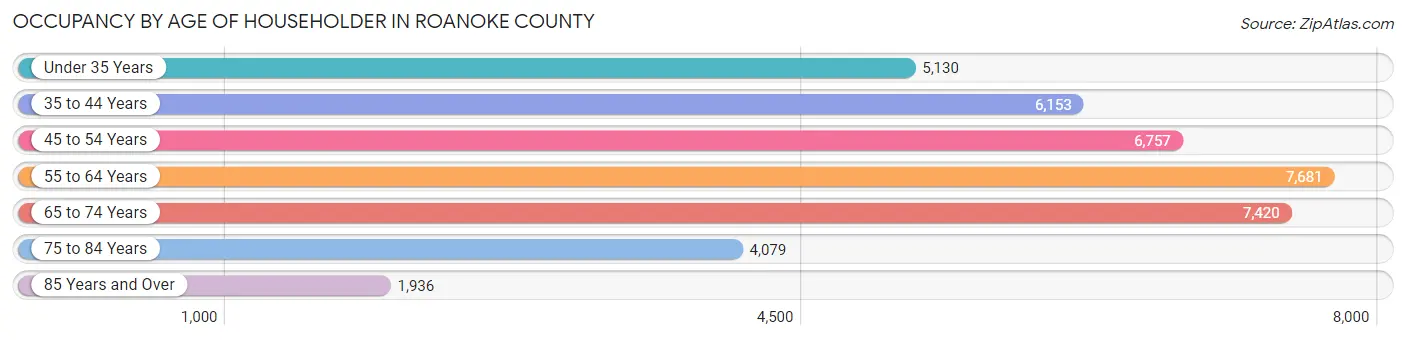
| Age Bracket | # Households | % Households |
| Under 35 Years | 5,130 | 13.1% |
| 35 to 44 Years | 6,153 | 15.7% |
| 45 to 54 Years | 6,757 | 17.3% |
| 55 to 64 Years | 7,681 | 19.6% |
| 65 to 74 Years | 7,420 | 19.0% |
| 75 to 84 Years | 4,079 | 10.4% |
| 85 Years and Over | 1,936 | 4.9% |
| Total | 39,156 | 100.0% |
Housing Finances in Roanoke County
Median Income by Occupancy in Roanoke County
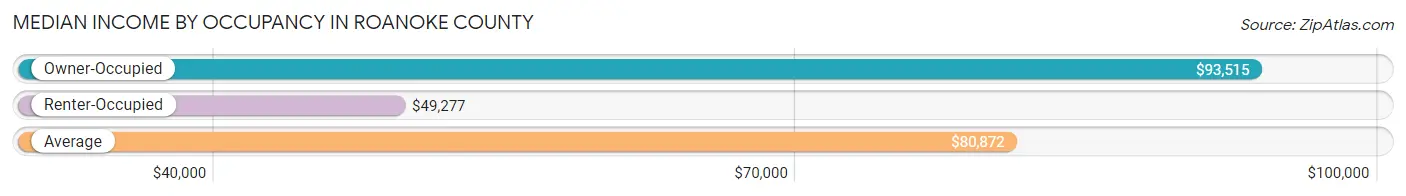
| Occupancy Type | # Households | Median Income |
| Owner-Occupied | 29,642 (75.7%) | $93,515 |
| Renter-Occupied | 9,514 (24.3%) | $49,277 |
| Average | 39,156 (100.0%) | $80,872 |
Occupancy by Householder Income Bracket in Roanoke County
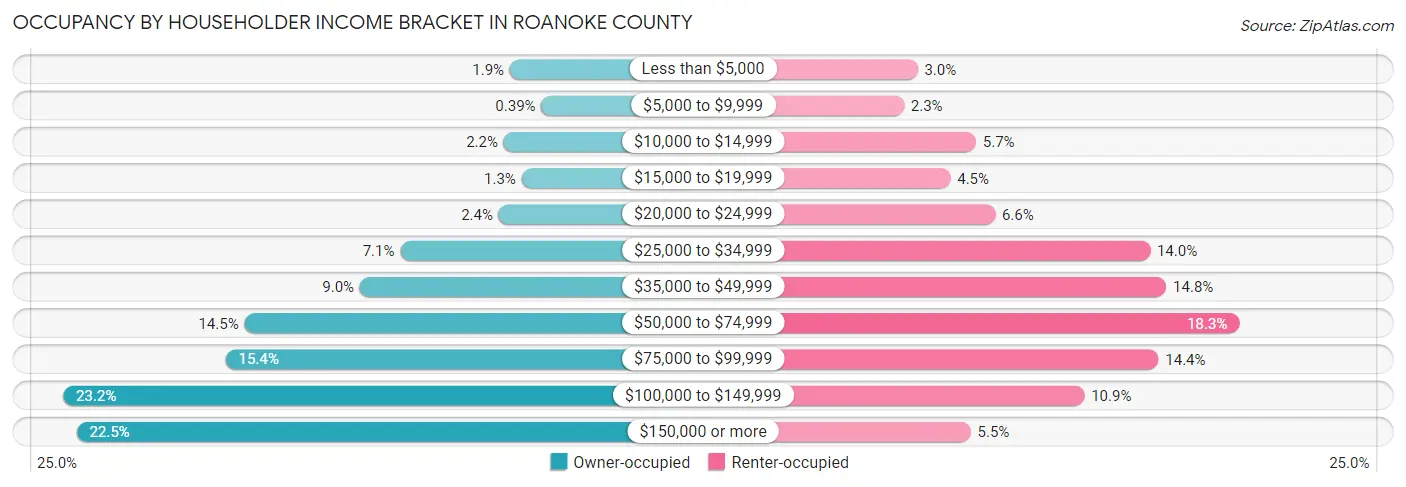
| Income Bracket | Owner-occupied | Renter-occupied |
| Less than $5,000 | 560 (1.9%) | 281 (2.9%) |
| $5,000 to $9,999 | 117 (0.4%) | 219 (2.3%) |
| $10,000 to $14,999 | 645 (2.2%) | 545 (5.7%) |
| $15,000 to $19,999 | 393 (1.3%) | 429 (4.5%) |
| $20,000 to $24,999 | 717 (2.4%) | 632 (6.6%) |
| $25,000 to $34,999 | 2,107 (7.1%) | 1,334 (14.0%) |
| $35,000 to $49,999 | 2,677 (9.0%) | 1,407 (14.8%) |
| $50,000 to $74,999 | 4,306 (14.5%) | 1,738 (18.3%) |
| $75,000 to $99,999 | 4,574 (15.4%) | 1,372 (14.4%) |
| $100,000 to $149,999 | 6,868 (23.2%) | 1,036 (10.9%) |
| $150,000 or more | 6,678 (22.5%) | 521 (5.5%) |
| Total | 29,642 (100.0%) | 9,514 (100.0%) |
Monthly Housing Cost Tiers in Roanoke County
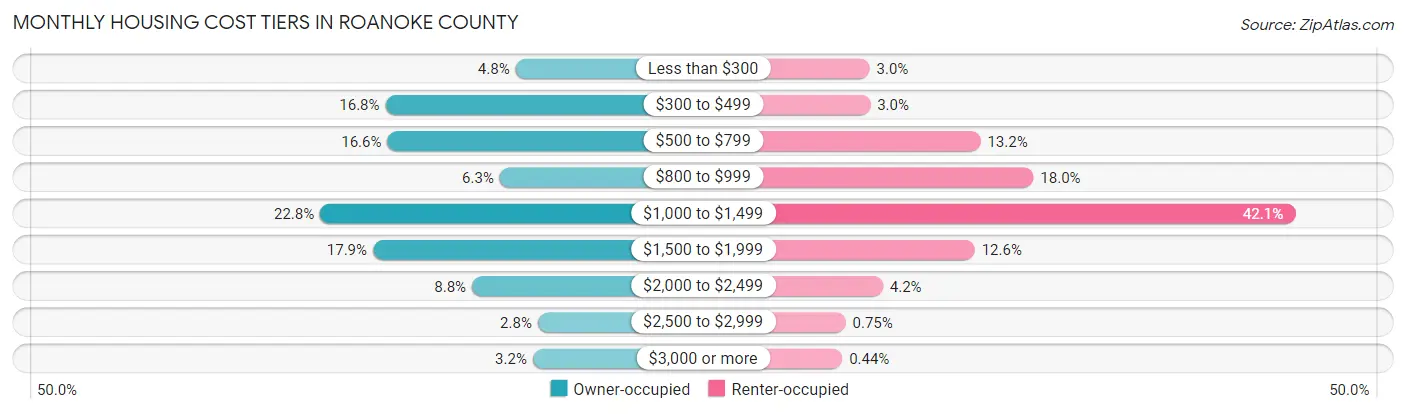
| Monthly Cost | Owner-occupied | Renter-occupied |
| Less than $300 | 1,426 (4.8%) | 282 (3.0%) |
| $300 to $499 | 4,977 (16.8%) | 287 (3.0%) |
| $500 to $799 | 4,923 (16.6%) | 1,253 (13.2%) |
| $800 to $999 | 1,855 (6.3%) | 1,716 (18.0%) |
| $1,000 to $1,499 | 6,758 (22.8%) | 4,007 (42.1%) |
| $1,500 to $1,999 | 5,317 (17.9%) | 1,203 (12.6%) |
| $2,000 to $2,499 | 2,614 (8.8%) | 398 (4.2%) |
| $2,500 to $2,999 | 817 (2.8%) | 71 (0.7%) |
| $3,000 or more | 955 (3.2%) | 42 (0.4%) |
| Total | 29,642 (100.0%) | 9,514 (100.0%) |
Physical Housing Characteristics in Roanoke County
Housing Structures in Roanoke County
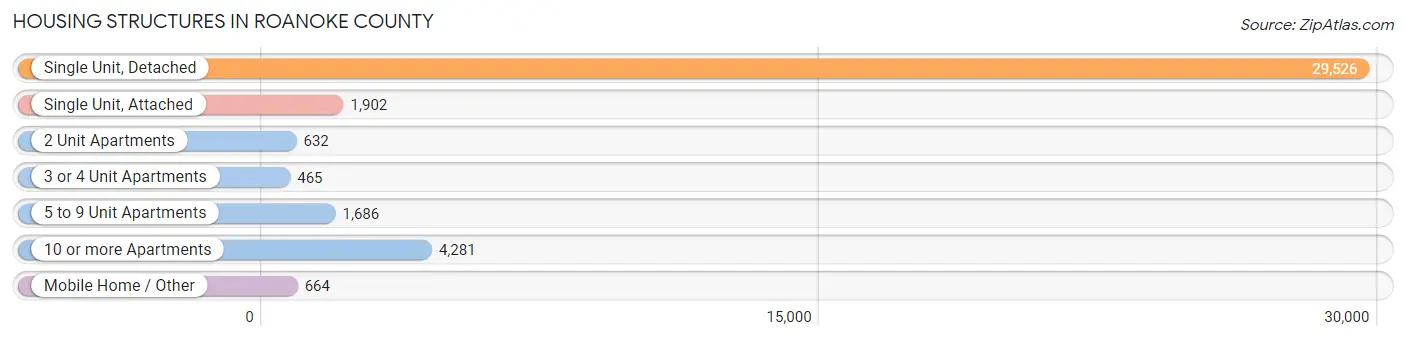
| Structure Type | # Housing Units | % Housing Units |
| Single Unit, Detached | 29,526 | 75.4% |
| Single Unit, Attached | 1,902 | 4.9% |
| 2 Unit Apartments | 632 | 1.6% |
| 3 or 4 Unit Apartments | 465 | 1.2% |
| 5 to 9 Unit Apartments | 1,686 | 4.3% |
| 10 or more Apartments | 4,281 | 10.9% |
| Mobile Home / Other | 664 | 1.7% |
| Total | 39,156 | 100.0% |
Housing Structures by Occupancy in Roanoke County
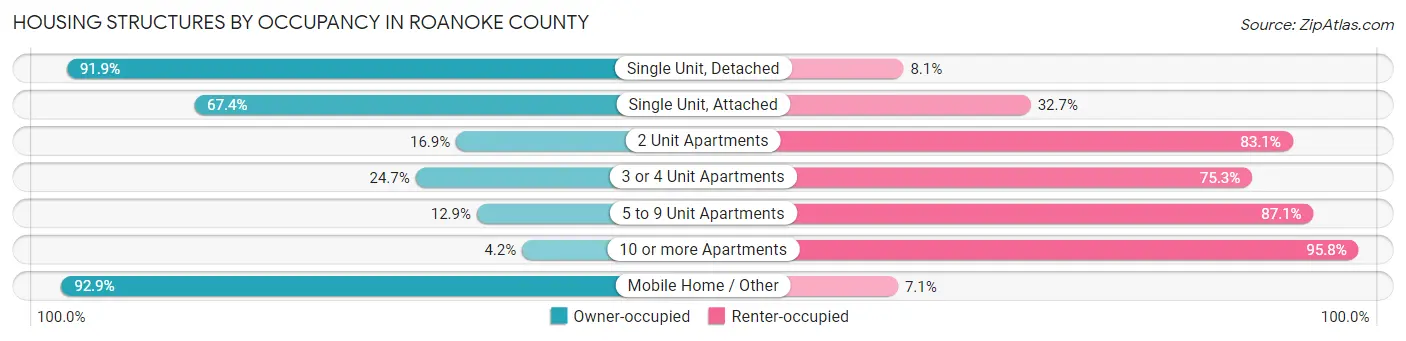
| Structure Type | Owner-occupied | Renter-occupied |
| Single Unit, Detached | 27,123 (91.9%) | 2,403 (8.1%) |
| Single Unit, Attached | 1,281 (67.3%) | 621 (32.7%) |
| 2 Unit Apartments | 107 (16.9%) | 525 (83.1%) |
| 3 or 4 Unit Apartments | 115 (24.7%) | 350 (75.3%) |
| 5 to 9 Unit Apartments | 218 (12.9%) | 1,468 (87.1%) |
| 10 or more Apartments | 181 (4.2%) | 4,100 (95.8%) |
| Mobile Home / Other | 617 (92.9%) | 47 (7.1%) |
| Total | 29,642 (75.7%) | 9,514 (24.3%) |
Housing Structures by Number of Rooms in Roanoke County
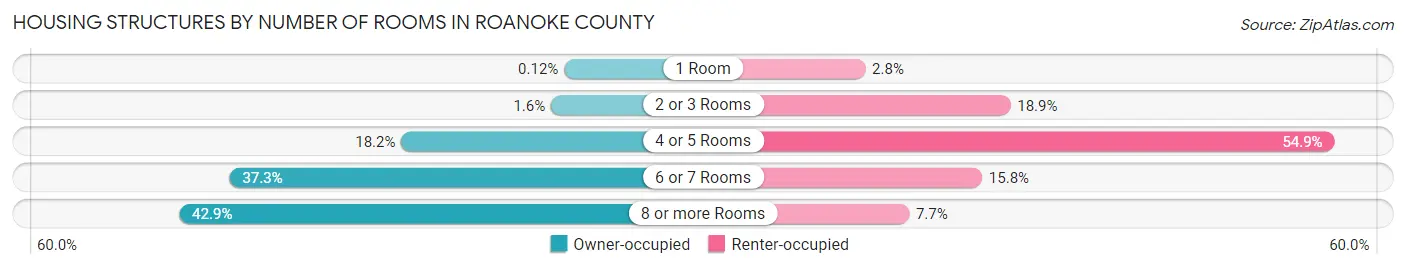
| Number of Rooms | Owner-occupied | Renter-occupied |
| 1 Room | 36 (0.1%) | 266 (2.8%) |
| 2 or 3 Rooms | 465 (1.6%) | 1,799 (18.9%) |
| 4 or 5 Rooms | 5,393 (18.2%) | 5,221 (54.9%) |
| 6 or 7 Rooms | 11,047 (37.3%) | 1,499 (15.8%) |
| 8 or more Rooms | 12,701 (42.8%) | 729 (7.7%) |
| Total | 29,642 (100.0%) | 9,514 (100.0%) |
Housing Structure by Heating Type in Roanoke County
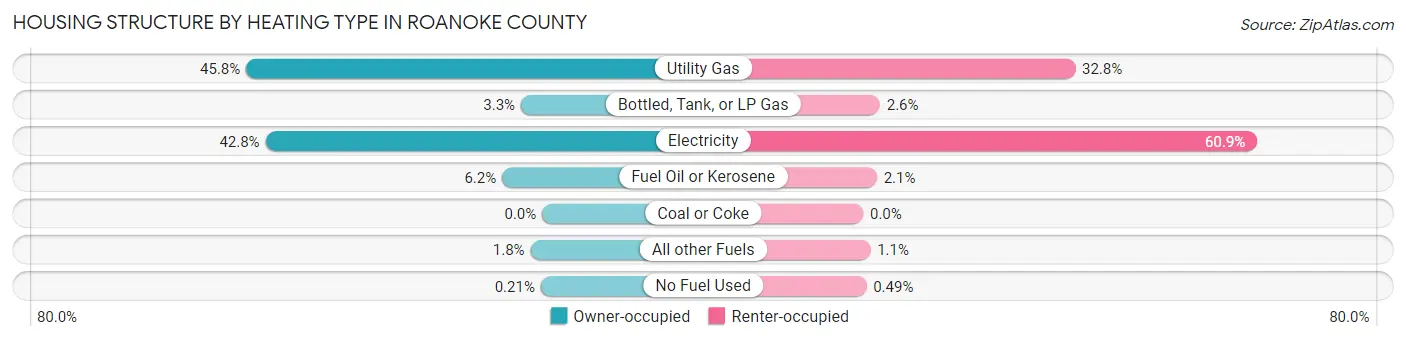
| Heating Type | Owner-occupied | Renter-occupied |
| Utility Gas | 13,564 (45.8%) | 3,118 (32.8%) |
| Bottled, Tank, or LP Gas | 969 (3.3%) | 246 (2.6%) |
| Electricity | 12,677 (42.8%) | 5,796 (60.9%) |
| Fuel Oil or Kerosene | 1,835 (6.2%) | 201 (2.1%) |
| Coal or Coke | 0 (0.0%) | 0 (0.0%) |
| All other Fuels | 534 (1.8%) | 106 (1.1%) |
| No Fuel Used | 63 (0.2%) | 47 (0.5%) |
| Total | 29,642 (100.0%) | 9,514 (100.0%) |
Household Vehicle Usage in Roanoke County
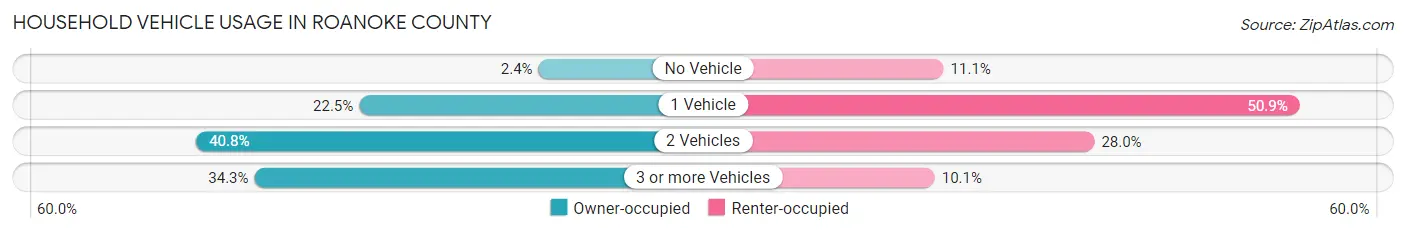
| Vehicles per Household | Owner-occupied | Renter-occupied |
| No Vehicle | 722 (2.4%) | 1,052 (11.1%) |
| 1 Vehicle | 6,678 (22.5%) | 4,845 (50.9%) |
| 2 Vehicles | 12,086 (40.8%) | 2,659 (28.0%) |
| 3 or more Vehicles | 10,156 (34.3%) | 958 (10.1%) |
| Total | 29,642 (100.0%) | 9,514 (100.0%) |
Real Estate & Mortgages in Roanoke County
Real Estate and Mortgage Overview in Roanoke County
| Characteristic | Without Mortgage | With Mortgage |
| Housing Units | 11,465 | 18,177 |
| Median Property Value | $241,300 | $248,100 |
| Median Household Income | $65,779 | $4,998 |
| Monthly Housing Costs | $482 | $955 |
| Real Estate Taxes | $2,246 | $188 |
Property Value by Mortgage Status in Roanoke County
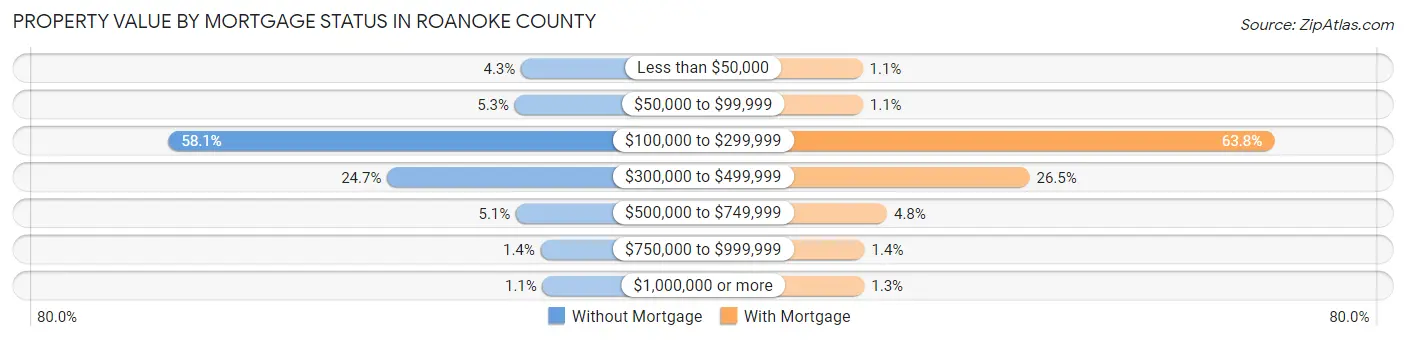
| Property Value | Without Mortgage | With Mortgage |
| Less than $50,000 | 498 (4.3%) | 196 (1.1%) |
| $50,000 to $99,999 | 607 (5.3%) | 202 (1.1%) |
| $100,000 to $299,999 | 6,659 (58.1%) | 11,589 (63.8%) |
| $300,000 to $499,999 | 2,837 (24.7%) | 4,821 (26.5%) |
| $500,000 to $749,999 | 585 (5.1%) | 873 (4.8%) |
| $750,000 to $999,999 | 157 (1.4%) | 253 (1.4%) |
| $1,000,000 or more | 122 (1.1%) | 243 (1.3%) |
| Total | 11,465 (100.0%) | 18,177 (100.0%) |
Household Income by Mortgage Status in Roanoke County
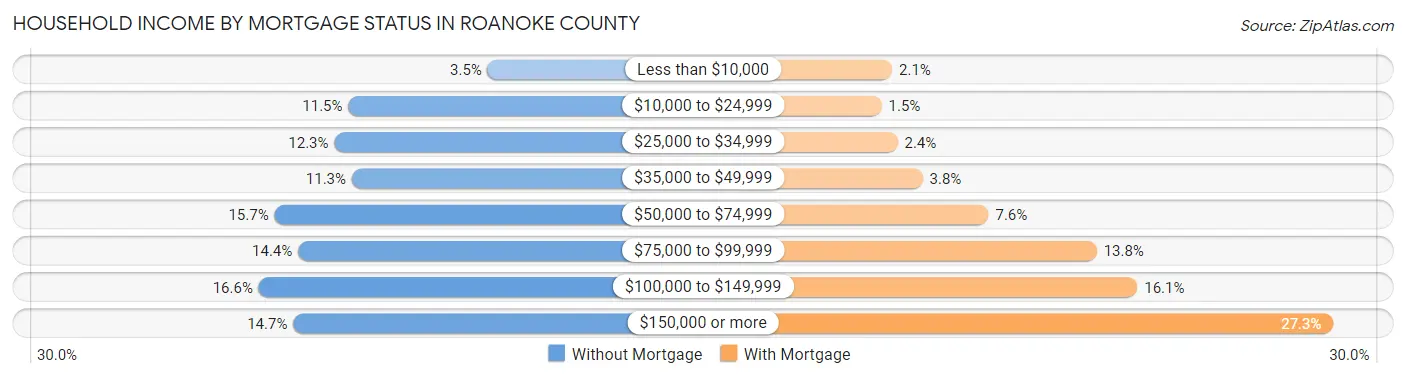
| Household Income | Without Mortgage | With Mortgage |
| Less than $10,000 | 406 (3.5%) | 379 (2.1%) |
| $10,000 to $24,999 | 1,319 (11.5%) | 271 (1.5%) |
| $25,000 to $34,999 | 1,410 (12.3%) | 436 (2.4%) |
| $35,000 to $49,999 | 1,295 (11.3%) | 697 (3.8%) |
| $50,000 to $74,999 | 1,802 (15.7%) | 1,382 (7.6%) |
| $75,000 to $99,999 | 1,647 (14.4%) | 2,504 (13.8%) |
| $100,000 to $149,999 | 1,906 (16.6%) | 2,927 (16.1%) |
| $150,000 or more | 1,680 (14.6%) | 4,962 (27.3%) |
| Total | 11,465 (100.0%) | 18,177 (100.0%) |
Property Value to Household Income Ratio in Roanoke County
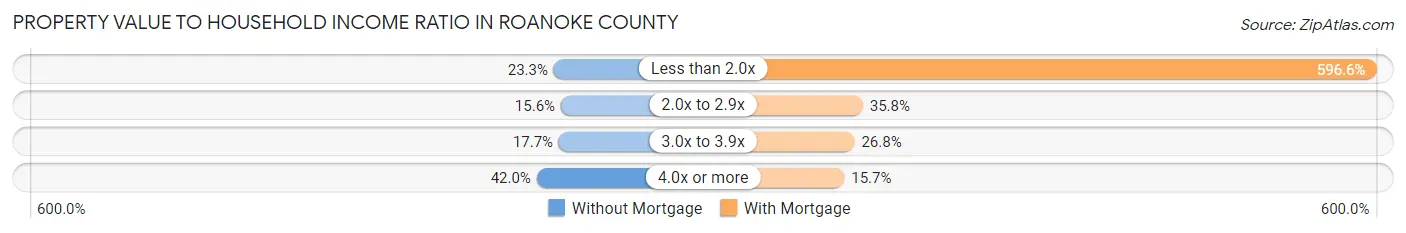
| Value-to-Income Ratio | Without Mortgage | With Mortgage |
| Less than 2.0x | 2,675 (23.3%) | 108,438 (596.6%) |
| 2.0x to 2.9x | 1,788 (15.6%) | 6,508 (35.8%) |
| 3.0x to 3.9x | 2,033 (17.7%) | 4,865 (26.8%) |
| 4.0x or more | 4,815 (42.0%) | 2,849 (15.7%) |
| Total | 11,465 (100.0%) | 18,177 (100.0%) |
Real Estate Taxes by Mortgage Status in Roanoke County
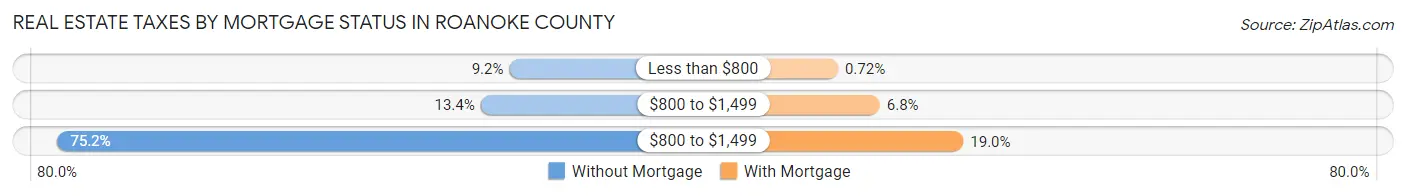
| Property Taxes | Without Mortgage | With Mortgage |
| Less than $800 | 1,053 (9.2%) | 130 (0.7%) |
| $800 to $1,499 | 1,534 (13.4%) | 1,243 (6.8%) |
| $800 to $1,499 | 8,623 (75.2%) | 3,461 (19.0%) |
| Total | 11,465 (100.0%) | 18,177 (100.0%) |
Health & Disability in Roanoke County
Health Insurance Coverage by Age in Roanoke County
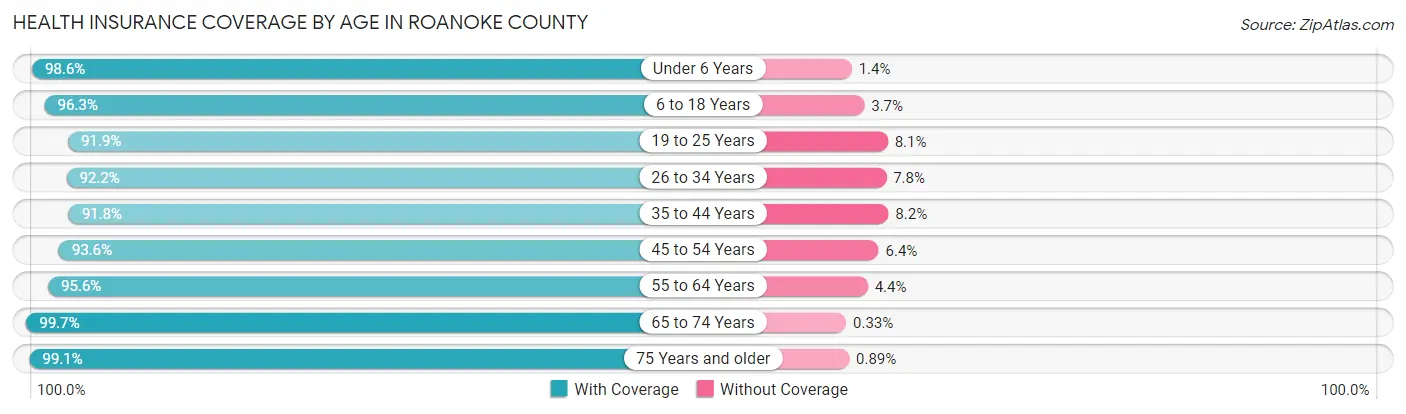
| Age Bracket | With Coverage | Without Coverage |
| Under 6 Years | 5,505 (98.6%) | 77 (1.4%) |
| 6 to 18 Years | 14,558 (96.3%) | 564 (3.7%) |
| 19 to 25 Years | 6,501 (91.9%) | 573 (8.1%) |
| 26 to 34 Years | 9,047 (92.2%) | 766 (7.8%) |
| 35 to 44 Years | 10,237 (91.8%) | 918 (8.2%) |
| 45 to 54 Years | 11,583 (93.6%) | 791 (6.4%) |
| 55 to 64 Years | 12,709 (95.6%) | 580 (4.4%) |
| 65 to 74 Years | 11,735 (99.7%) | 39 (0.3%) |
| 75 Years and older | 8,468 (99.1%) | 76 (0.9%) |
| Total | 90,343 (95.4%) | 4,384 (4.6%) |
Health Insurance Coverage by Citizenship Status in Roanoke County
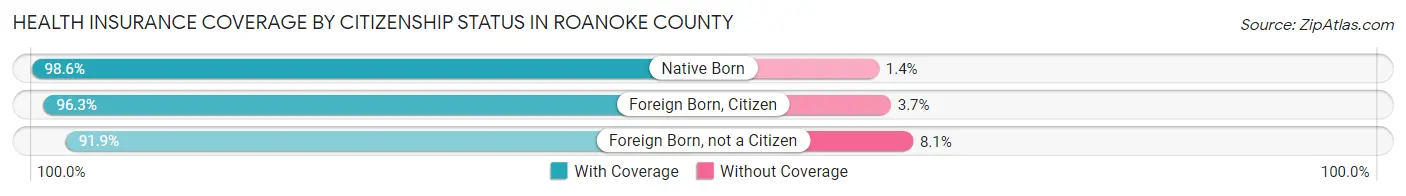
| Citizenship Status | With Coverage | Without Coverage |
| Native Born | 5,505 (98.6%) | 77 (1.4%) |
| Foreign Born, Citizen | 14,558 (96.3%) | 564 (3.7%) |
| Foreign Born, not a Citizen | 6,501 (91.9%) | 573 (8.1%) |
Health Insurance Coverage by Household Income in Roanoke County
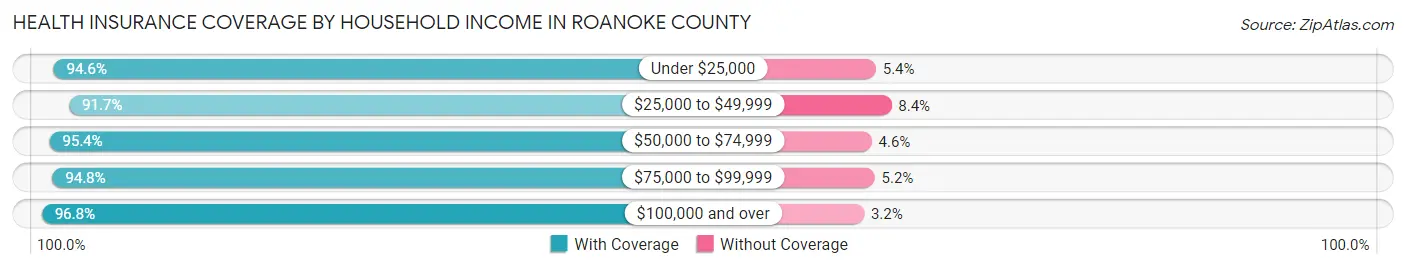
| Household Income | With Coverage | Without Coverage |
| Under $25,000 | 6,188 (94.6%) | 355 (5.4%) |
| $25,000 to $49,999 | 12,144 (91.6%) | 1,106 (8.4%) |
| $50,000 to $74,999 | 12,321 (95.4%) | 599 (4.6%) |
| $75,000 to $99,999 | 14,840 (94.8%) | 815 (5.2%) |
| $100,000 and over | 44,185 (96.8%) | 1,468 (3.2%) |
Public vs Private Health Insurance Coverage by Age in Roanoke County

| Age Bracket | Public Insurance | Private Insurance |
| Under 6 | 1,573 (28.2%) | 4,065 (72.8%) |
| 6 to 18 Years | 3,426 (22.7%) | 11,957 (79.1%) |
| 19 to 25 Years | 588 (8.3%) | 6,037 (85.3%) |
| 25 to 34 Years | 1,354 (13.8%) | 7,975 (81.3%) |
| 35 to 44 Years | 1,493 (13.4%) | 9,002 (80.7%) |
| 45 to 54 Years | 1,324 (10.7%) | 10,758 (86.9%) |
| 55 to 64 Years | 2,721 (20.5%) | 11,233 (84.5%) |
| 65 to 74 Years | 11,252 (95.6%) | 7,213 (61.3%) |
| 75 Years and over | 8,398 (98.3%) | 5,468 (64.0%) |
| Total | 32,129 (33.9%) | 73,708 (77.8%) |
Disability Status by Sex by Age in Roanoke County
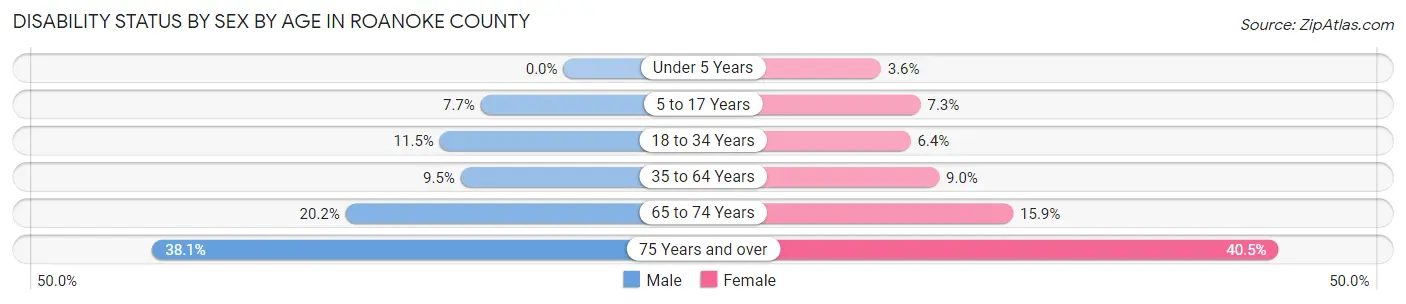
| Age Bracket | Male | Female |
| Under 5 Years | 0 (0.0%) | 75 (3.6%) |
| 5 to 17 Years | 579 (7.7%) | 532 (7.3%) |
| 18 to 34 Years | 1,051 (11.5%) | 587 (6.4%) |
| 35 to 64 Years | 1,689 (9.5%) | 1,725 (9.0%) |
| 65 to 74 Years | 1,097 (20.2%) | 1,009 (15.9%) |
| 75 Years and over | 1,276 (38.1%) | 2,106 (40.5%) |
Disability Class by Sex by Age in Roanoke County
Disability Class: Hearing Difficulty
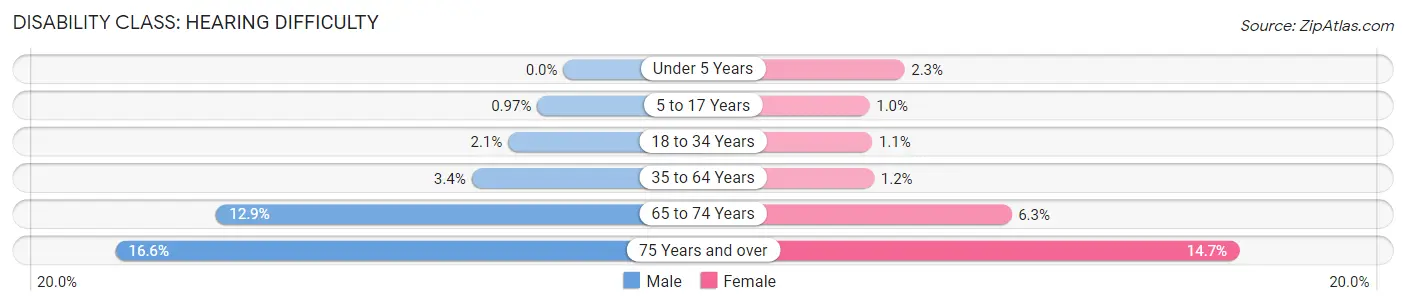
| Age Bracket | Male | Female |
| Under 5 Years | 0 (0.0%) | 48 (2.3%) |
| 5 to 17 Years | 73 (1.0%) | 74 (1.0%) |
| 18 to 34 Years | 188 (2.1%) | 103 (1.1%) |
| 35 to 64 Years | 604 (3.4%) | 228 (1.2%) |
| 65 to 74 Years | 699 (12.9%) | 399 (6.3%) |
| 75 Years and over | 556 (16.6%) | 766 (14.7%) |
Disability Class: Vision Difficulty
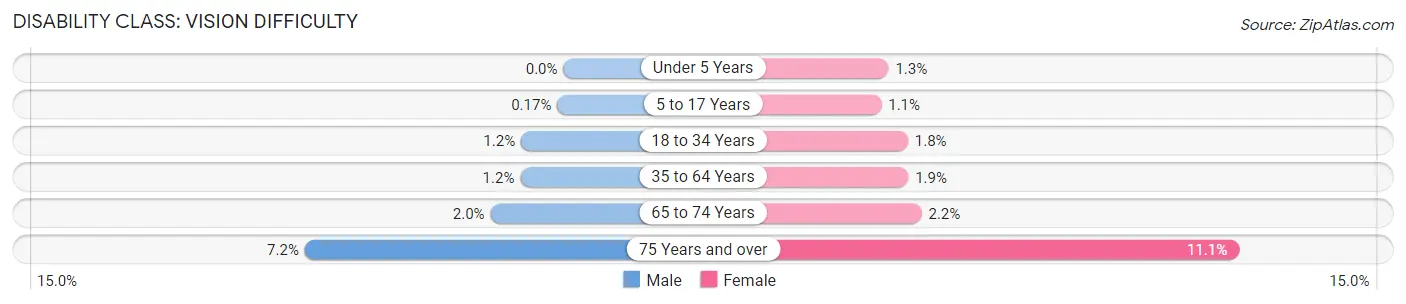
| Age Bracket | Male | Female |
| Under 5 Years | 0 (0.0%) | 27 (1.3%) |
| 5 to 17 Years | 13 (0.2%) | 80 (1.1%) |
| 18 to 34 Years | 108 (1.2%) | 170 (1.8%) |
| 35 to 64 Years | 213 (1.2%) | 354 (1.8%) |
| 65 to 74 Years | 110 (2.0%) | 141 (2.2%) |
| 75 Years and over | 241 (7.2%) | 575 (11.1%) |
Disability Class: Cognitive Difficulty
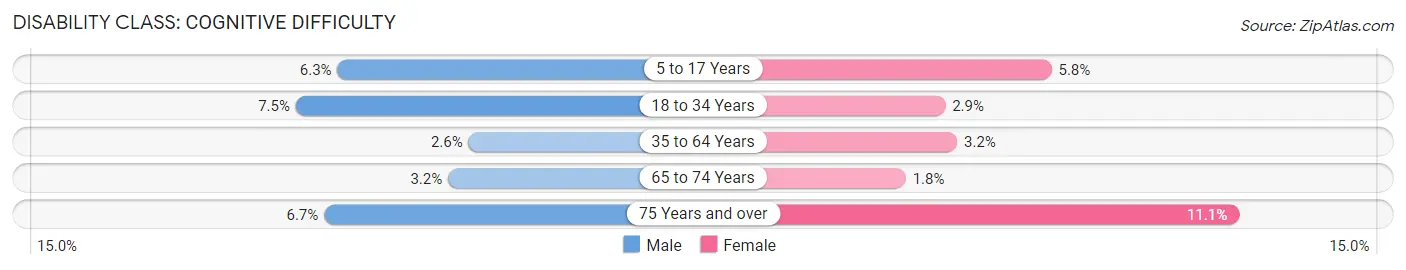
| Age Bracket | Male | Female |
| 5 to 17 Years | 474 (6.3%) | 425 (5.8%) |
| 18 to 34 Years | 682 (7.4%) | 266 (2.9%) |
| 35 to 64 Years | 467 (2.6%) | 613 (3.2%) |
| 65 to 74 Years | 174 (3.2%) | 113 (1.8%) |
| 75 Years and over | 223 (6.7%) | 575 (11.1%) |
Disability Class: Ambulatory Difficulty
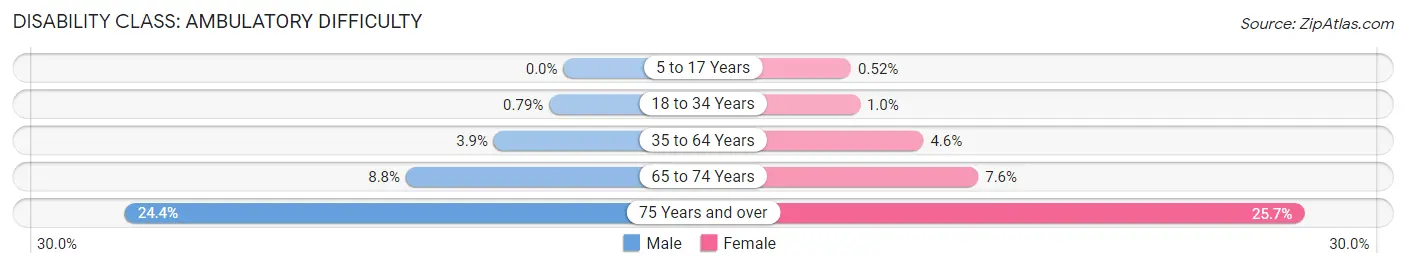
| Age Bracket | Male | Female |
| 5 to 17 Years | 0 (0.0%) | 38 (0.5%) |
| 18 to 34 Years | 72 (0.8%) | 93 (1.0%) |
| 35 to 64 Years | 685 (3.9%) | 869 (4.5%) |
| 65 to 74 Years | 476 (8.8%) | 482 (7.6%) |
| 75 Years and over | 817 (24.4%) | 1,338 (25.7%) |
Disability Class: Self-Care Difficulty
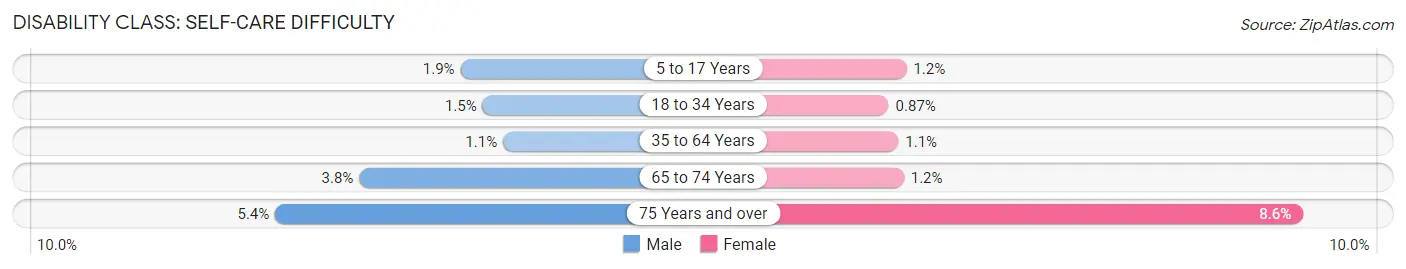
| Age Bracket | Male | Female |
| 5 to 17 Years | 144 (1.9%) | 87 (1.2%) |
| 18 to 34 Years | 137 (1.5%) | 80 (0.9%) |
| 35 to 64 Years | 198 (1.1%) | 201 (1.1%) |
| 65 to 74 Years | 206 (3.8%) | 73 (1.1%) |
| 75 Years and over | 179 (5.3%) | 445 (8.6%) |
Technology Access in Roanoke County
Computing Device Access in Roanoke County
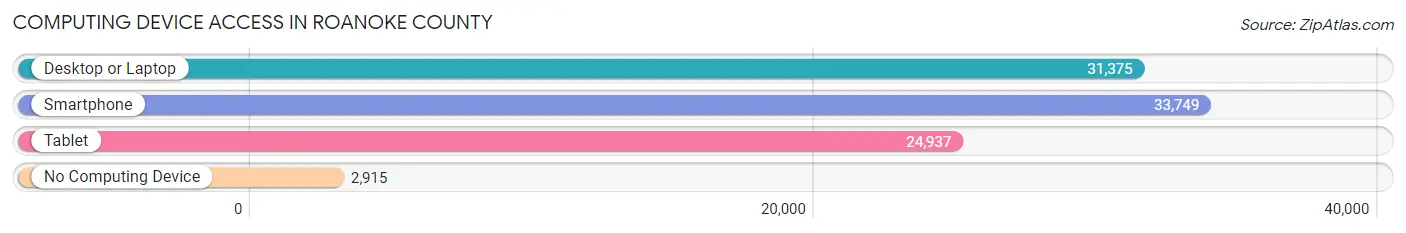
| Device Type | # Households | % Households |
| Desktop or Laptop | 31,375 | 80.1% |
| Smartphone | 33,749 | 86.2% |
| Tablet | 24,937 | 63.7% |
| No Computing Device | 2,915 | 7.4% |
| Total | 39,156 | 100.0% |
Internet Access in Roanoke County
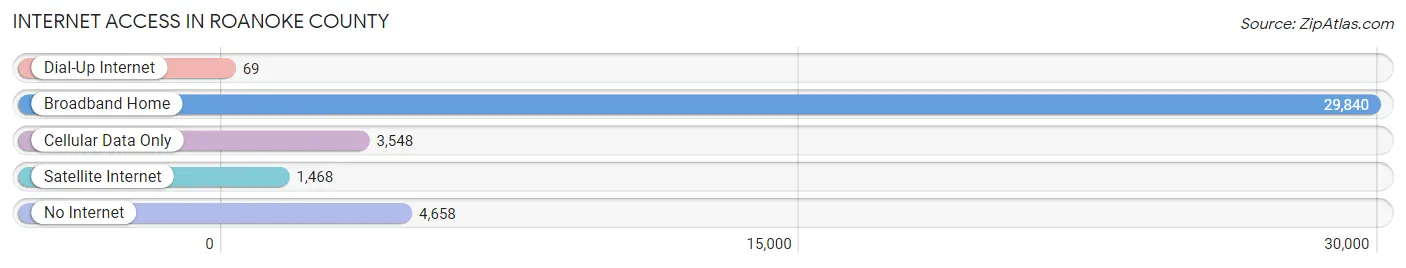
| Internet Type | # Households | % Households |
| Dial-Up Internet | 69 | 0.2% |
| Broadband Home | 29,840 | 76.2% |
| Cellular Data Only | 3,548 | 9.1% |
| Satellite Internet | 1,468 | 3.7% |
| No Internet | 4,658 | 11.9% |
| Total | 39,156 | 100.0% |
Roanoke County Summary
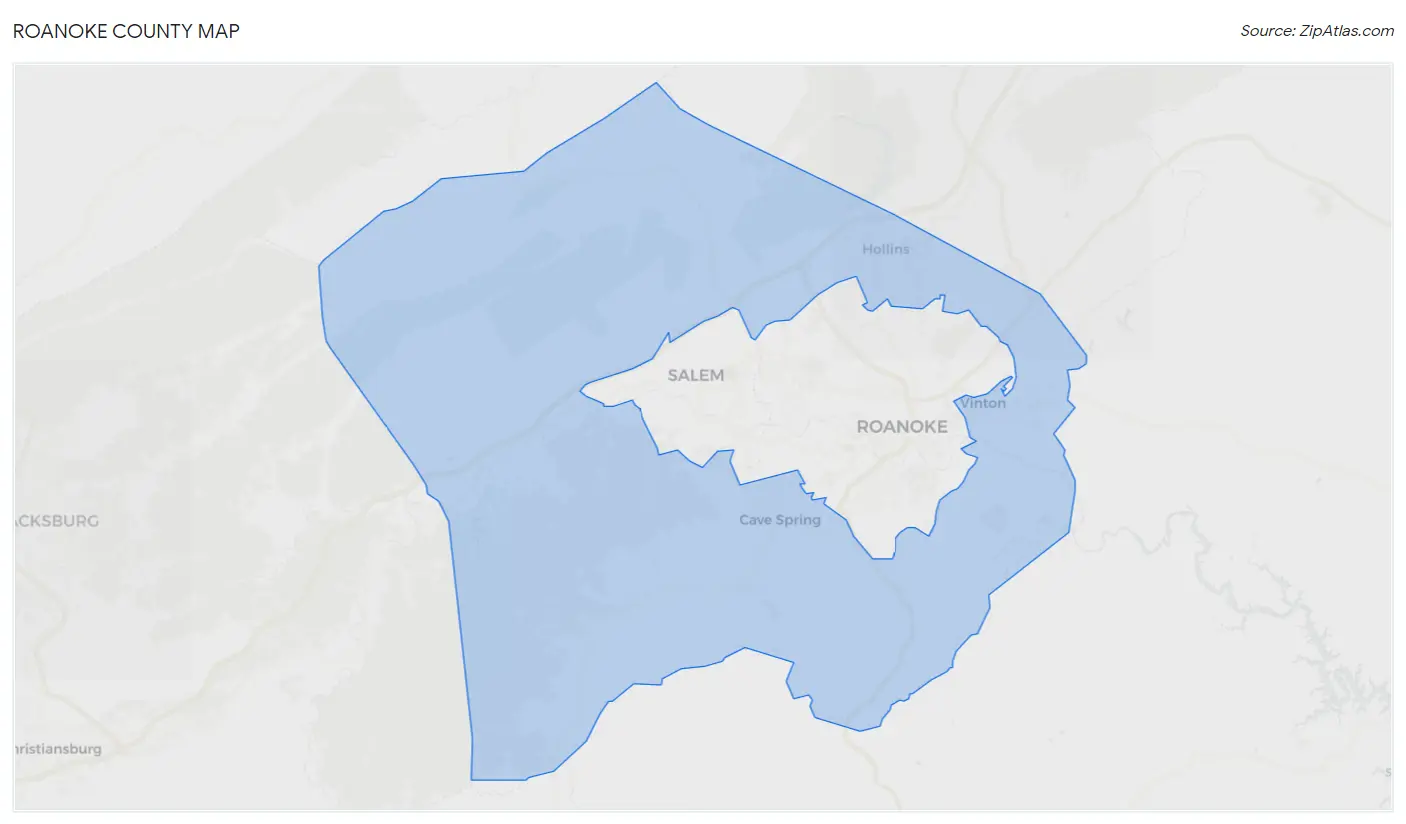
Roanoke County is located in the Blue Ridge Mountains of Virginia, and is part of the Roanoke Metropolitan Statistical Area. It is bordered by the City of Roanoke, Botetourt County, Craig County, Franklin County, and Bedford County. The county seat is the City of Roanoke, and the county is home to over 92,000 people.
Geography
Roanoke County is located in the Blue Ridge Mountains of Virginia, and is part of the Roanoke Metropolitan Statistical Area. It is bordered by the City of Roanoke, Botetourt County, Craig County, Franklin County, and Bedford County. The county is home to the Blue Ridge Parkway, the Appalachian Trail, and the George Washington and Jefferson National Forests. The county is also home to the Roanoke River, which flows through the county and is a major source of recreation and economic activity.
The county is divided into two distinct geographic regions. The western portion of the county is characterized by rolling hills and valleys, while the eastern portion is more mountainous. The highest point in the county is Mill Mountain, which rises to an elevation of 3,197 feet.
Climate
Roanoke County has a humid subtropical climate, with hot, humid summers and mild winters. The average annual temperature is 57°F, and the average annual precipitation is 43 inches.
Demographics
As of the 2010 census, Roanoke County had a population of 92,376. The racial makeup of the county was 79.3% White, 15.2% African American, 0.4% Native American, 1.7% Asian, 0.1% Pacific Islander, 1.3% from other races, and 2.0% from two or more races. Hispanic or Latino of any race were 3.7% of the population.
The median income for a household in the county was $45,945, and the median income for a family was $54,945. The per capita income for the county was $25,845. About 8.7% of families and 11.2% of the population were below the poverty line, including 15.2% of those under age 18 and 8.2% of those age 65 or over.
Economy
Roanoke County is home to a diverse economy, with a mix of manufacturing, retail, and service industries. The county is home to several major employers, including Carilion Roanoke Memorial Hospital, Roanoke City Public Schools, and the City of Roanoke. The county is also home to several major manufacturing companies, including Volvo Trucks, Advance Auto Parts, and Eastman Chemical.
The county is also home to several major tourist attractions, including the Blue Ridge Parkway, the Appalachian Trail, and the George Washington and Jefferson National Forests. Tourism is a major source of economic activity in the county, and the county is home to several popular attractions, including the Roanoke Valley Greenway, the Roanoke River, and the Mill Mountain Zoo.
Conclusion
Roanoke County is a vibrant and diverse county located in the Blue Ridge Mountains of Virginia. It is home to a diverse economy, with a mix of manufacturing, retail, and service industries. The county is also home to several major tourist attractions, including the Blue Ridge Parkway, the Appalachian Trail, and the George Washington and Jefferson National Forests. Roanoke County is a great place to live, work, and visit, and is sure to continue to be a great place to call home for many years to come.
Common Questions
What is Per Capita Income in Roanoke County?
Per Capita income in Roanoke County is $43,125.
What is the Median Family Income in Roanoke County?
Median Family Income in Roanoke County is $100,192.
What is the Median Household income in Roanoke County?
Median Household Income in Roanoke County is $80,872.
What is Income or Wage Gap in Roanoke County?
Income or Wage Gap in Roanoke County is 23.6%.
Women in Roanoke County earn 76.4 cents for every dollar earned by a man.
What is Family Income Deficit in Roanoke County?
Family Income Deficit in Roanoke County is $11,679.
Families that are below poverty line in Roanoke County earn $11,679 less on average than the poverty threshold level.
What is Inequality or Gini Index in Roanoke County?
Inequality or Gini Index in Roanoke County is 0.44.
What is the Total Population of Roanoke County?
Total Population of Roanoke County is 96,653.
What is the Total Male Population of Roanoke County?
Total Male Population of Roanoke County is 46,725.
What is the Total Female Population of Roanoke County?
Total Female Population of Roanoke County is 49,928.
What is the Ratio of Males per 100 Females in Roanoke County?
There are 93.58 Males per 100 Females in Roanoke County.
What is the Ratio of Females per 100 Males in Roanoke County?
There are 106.86 Females per 100 Males in Roanoke County.
What is the Median Population Age in Roanoke County?
Median Population Age in Roanoke County is 43.6 Years.
What is the Average Family Size in Roanoke County
Average Family Size in Roanoke County is 3.0 People.
What is the Average Household Size in Roanoke County
Average Household Size in Roanoke County is 2.4 People.
How Large is the Labor Force in Roanoke County?
There are 48,645 People in the Labor Forcein in Roanoke County.
What is the Percentage of People in the Labor Force in Roanoke County?
61.1% of People are in the Labor Force in Roanoke County.
What is the Unemployment Rate in Roanoke County?
Unemployment Rate in Roanoke County is 2.6%.