Richmond County, VA Map & Demographics
Richmond County Overview
$27,620
PER CAPITA INCOME
$81,125
AVG FAMILY INCOME
$62,708
AVG HOUSEHOLD INCOME
20.5%
WAGE / INCOME GAP [ % ]
79.5¢/ $1
WAGE / INCOME GAP [ $ ]
0.40
INEQUALITY / GINI INDEX
8,968
TOTAL POPULATION
5,035
MALE POPULATION
3,933
FEMALE POPULATION
128.02
MALES / 100 FEMALES
78.11
FEMALES / 100 MALES
46.1
MEDIAN AGE
3.2
AVG FAMILY SIZE
2.6
AVG HOUSEHOLD SIZE
3,377
LABOR FORCE [ PEOPLE ]
44.8%
PERCENT IN LABOR FORCE
4.0%
UNEMPLOYMENT RATE
Richmond County Area Codes
Income in Richmond County
Income Overview in Richmond County
Per Capita Income in Richmond County is $27,620, while median incomes of families and households are $81,125 and $62,708 respectively.
| Characteristic | Number | Measure |
| Per Capita Income | 8,968 | $27,620 |
| Median Family Income | 1,898 | $81,125 |
| Mean Family Income | 1,898 | $90,780 |
| Median Household Income | 2,834 | $62,708 |
| Mean Household Income | 2,834 | $82,387 |
| Income Deficit | 1,898 | $0 |
| Wage / Income Gap (%) | 8,968 | 20.53% |
| Wage / Income Gap ($) | 8,968 | 79.47¢ per $1 |
| Gini / Inequality Index | 8,968 | 0.40 |
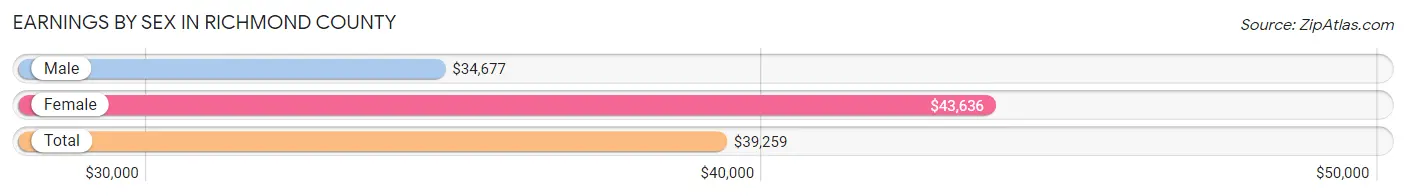
Earnings by Sex in Richmond County
Average Earnings in Richmond County are $39,259, $34,677 for men and $43,636 for women, a difference of 20.5%.
| Sex | Number | Average Earnings |
| Male | 2,334 (58.0%) | $34,677 |
| Female | 1,690 (42.0%) | $43,636 |
| Total | 4,024 (100.0%) | $39,259 |
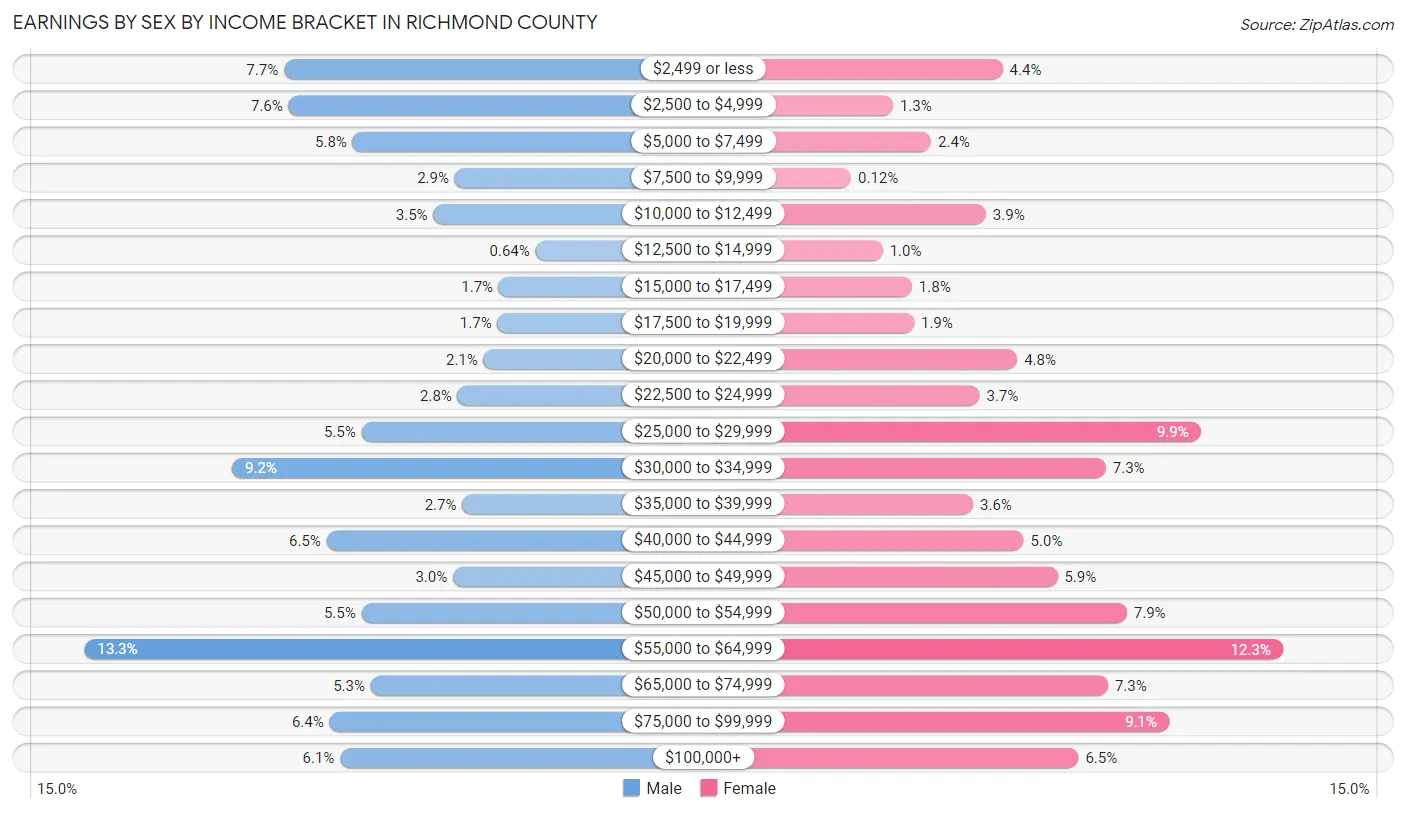
Earnings by Sex by Income Bracket in Richmond County
The most common earnings brackets in Richmond County are $55,000 to $64,999 for men (311 | 13.3%) and $55,000 to $64,999 for women (207 | 12.2%).
| Income | Male | Female |
| $2,499 or less | 180 (7.7%) | 74 (4.4%) |
| $2,500 to $4,999 | 177 (7.6%) | 22 (1.3%) |
| $5,000 to $7,499 | 135 (5.8%) | 40 (2.4%) |
| $7,500 to $9,999 | 68 (2.9%) | 2 (0.1%) |
| $10,000 to $12,499 | 82 (3.5%) | 66 (3.9%) |
| $12,500 to $14,999 | 15 (0.6%) | 17 (1.0%) |
| $15,000 to $17,499 | 39 (1.7%) | 31 (1.8%) |
| $17,500 to $19,999 | 40 (1.7%) | 32 (1.9%) |
| $20,000 to $22,499 | 49 (2.1%) | 81 (4.8%) |
| $22,500 to $24,999 | 66 (2.8%) | 63 (3.7%) |
| $25,000 to $29,999 | 129 (5.5%) | 168 (9.9%) |
| $30,000 to $34,999 | 214 (9.2%) | 123 (7.3%) |
| $35,000 to $39,999 | 63 (2.7%) | 60 (3.5%) |
| $40,000 to $44,999 | 152 (6.5%) | 84 (5.0%) |
| $45,000 to $49,999 | 69 (3.0%) | 100 (5.9%) |
| $50,000 to $54,999 | 129 (5.5%) | 133 (7.9%) |
| $55,000 to $64,999 | 311 (13.3%) | 207 (12.2%) |
| $65,000 to $74,999 | 123 (5.3%) | 124 (7.3%) |
| $75,000 to $99,999 | 150 (6.4%) | 153 (9.0%) |
| $100,000+ | 143 (6.1%) | 110 (6.5%) |
| Total | 2,334 (100.0%) | 1,690 (100.0%) |
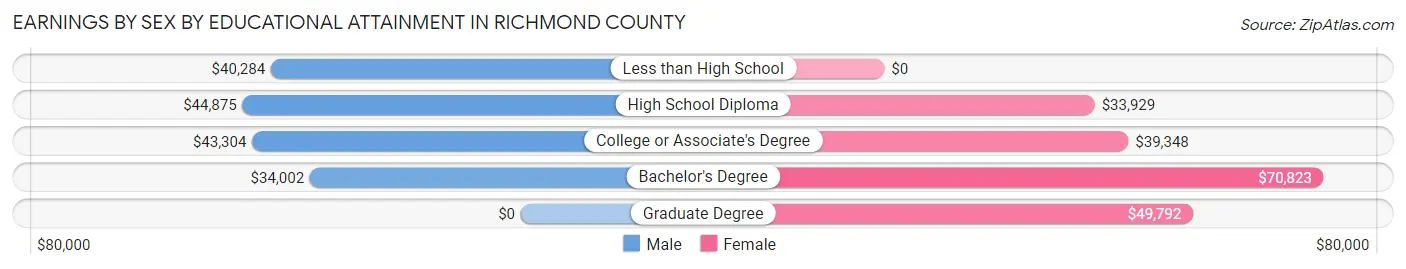
Earnings by Sex by Educational Attainment in Richmond County
Average earnings in Richmond County are $40,158 for men and $47,500 for women, a difference of 15.5%. Men with an educational attainment of high school diploma enjoy the highest average annual earnings of $44,875, while those with bachelor's degree education earn the least with $34,002. Women with an educational attainment of bachelor's degree earn the most with the average annual earnings of $70,823, while those with high school diploma education have the smallest earnings of $33,929.
| Educational Attainment | Male Income | Female Income |
| Less than High School | $40,284 | $0 |
| High School Diploma | $44,875 | $33,929 |
| College or Associate's Degree | $43,304 | $39,348 |
| Bachelor's Degree | $34,002 | $70,823 |
| Graduate Degree | - | - |
| Total | $40,158 | $47,500 |
Family Income in Richmond County
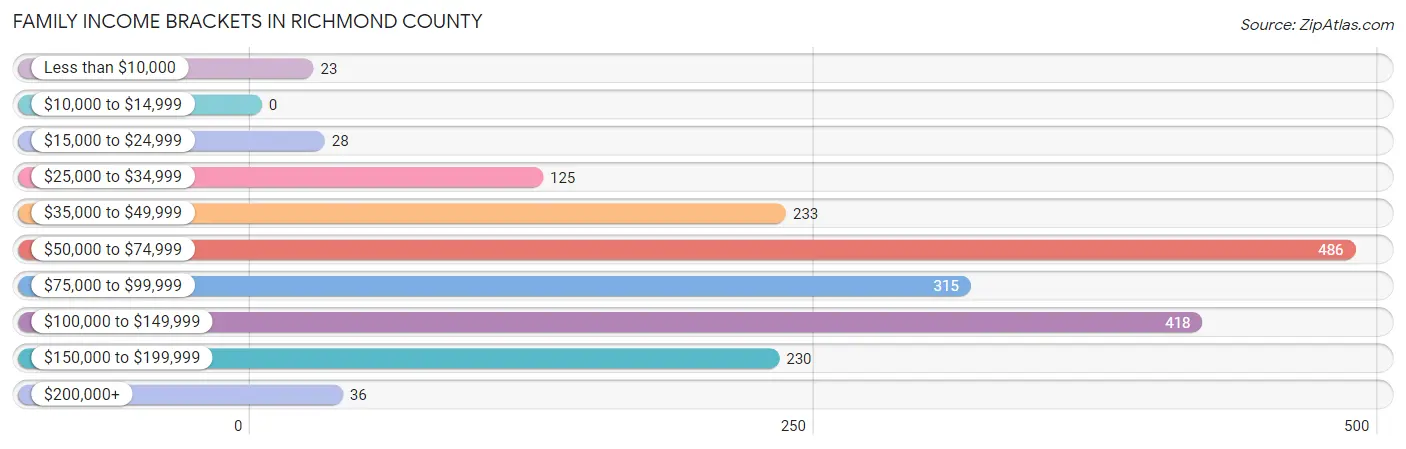
Family Income Brackets in Richmond County
According to the Richmond County family income data, there are 486 families falling into the $50,000 to $74,999 income range, which is the most common income bracket and makes up 25.6% of all families.
| Income Bracket | # Families | % Families |
| Less than $10,000 | 23 | 1.2% |
| $10,000 to $14,999 | 0 | 0.0% |
| $15,000 to $24,999 | 28 | 1.5% |
| $25,000 to $34,999 | 125 | 6.6% |
| $35,000 to $49,999 | 233 | 12.3% |
| $50,000 to $74,999 | 486 | 25.6% |
| $75,000 to $99,999 | 315 | 16.6% |
| $100,000 to $149,999 | 418 | 22.0% |
| $150,000 to $199,999 | 230 | 12.1% |
| $200,000+ | 36 | 1.9% |
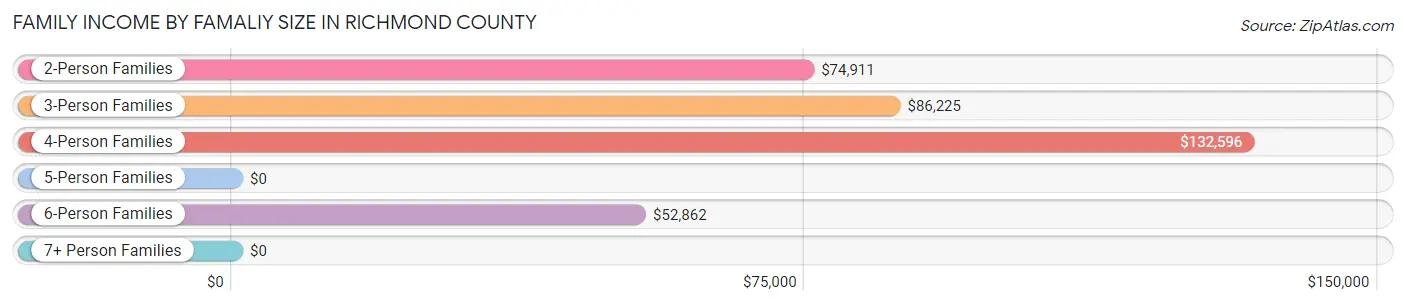
Family Income by Famaliy Size in Richmond County
4-person families (329 | 17.3%) account for the highest median family income in Richmond County with $132,596 per family, while 2-person families (995 | 52.4%) have the highest median income of $37,456 per family member.
| Income Bracket | # Families | Median Income |
| 2-Person Families | 995 (52.4%) | $74,911 |
| 3-Person Families | 472 (24.9%) | $86,225 |
| 4-Person Families | 329 (17.3%) | $132,596 |
| 5-Person Families | 0 (0.0%) | $0 |
| 6-Person Families | 99 (5.2%) | $52,862 |
| 7+ Person Families | 3 (0.2%) | $0 |
| Total | 1,898 (100.0%) | $81,125 |
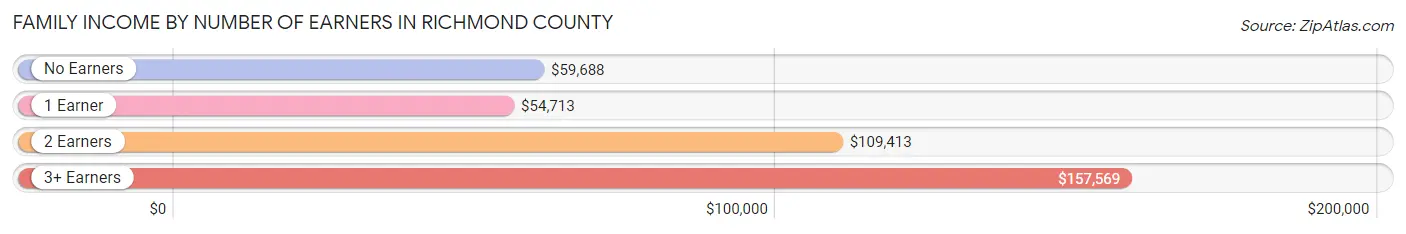
Family Income by Number of Earners in Richmond County
The median family income in Richmond County is $81,125, with families comprising 3+ earners (184) having the highest median family income of $157,569, while families with 1 earner (759) have the lowest median family income of $54,713, accounting for 9.7% and 40.0% of families, respectively.
| Number of Earners | # Families | Median Income |
| No Earners | 304 (16.0%) | $59,688 |
| 1 Earner | 759 (40.0%) | $54,713 |
| 2 Earners | 651 (34.3%) | $109,413 |
| 3+ Earners | 184 (9.7%) | $157,569 |
| Total | 1,898 (100.0%) | $81,125 |
Household Income in Richmond County
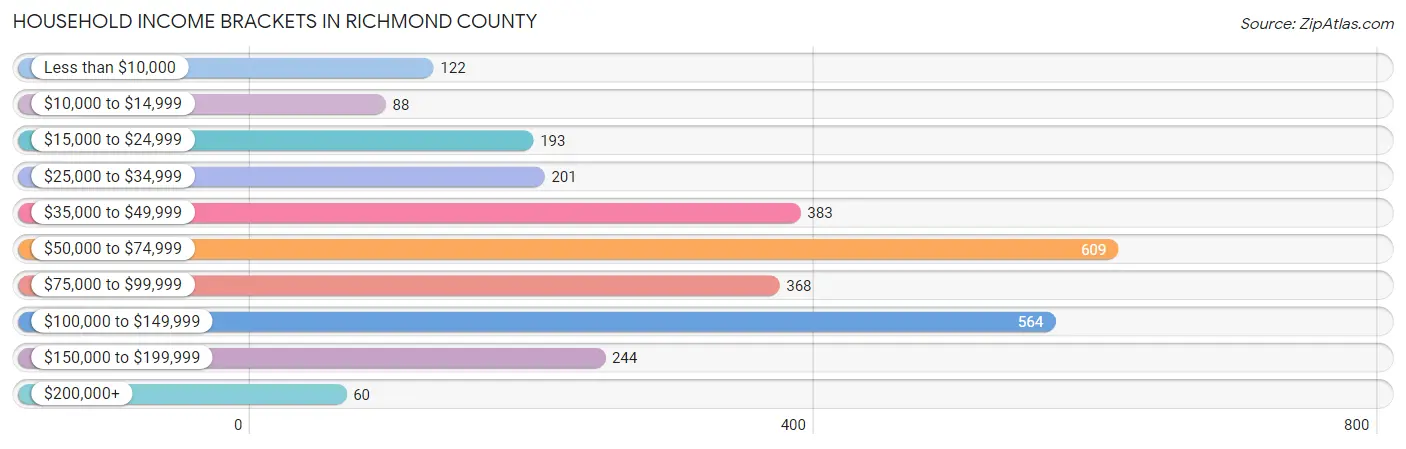
Household Income Brackets in Richmond County
With 609 households falling in the category, the $50,000 to $74,999 income range is the most frequent in Richmond County, accounting for 21.5% of all households. In contrast, only 60 households (2.1%) fall into the $200,000+ income bracket, making it the least populous group.
| Income Bracket | # Households | % Households |
| Less than $10,000 | 122 | 4.3% |
| $10,000 to $14,999 | 88 | 3.1% |
| $15,000 to $24,999 | 193 | 6.8% |
| $25,000 to $34,999 | 201 | 7.1% |
| $35,000 to $49,999 | 383 | 13.5% |
| $50,000 to $74,999 | 609 | 21.5% |
| $75,000 to $99,999 | 368 | 13.0% |
| $100,000 to $149,999 | 564 | 19.9% |
| $150,000 to $199,999 | 244 | 8.6% |
| $200,000+ | 60 | 2.1% |
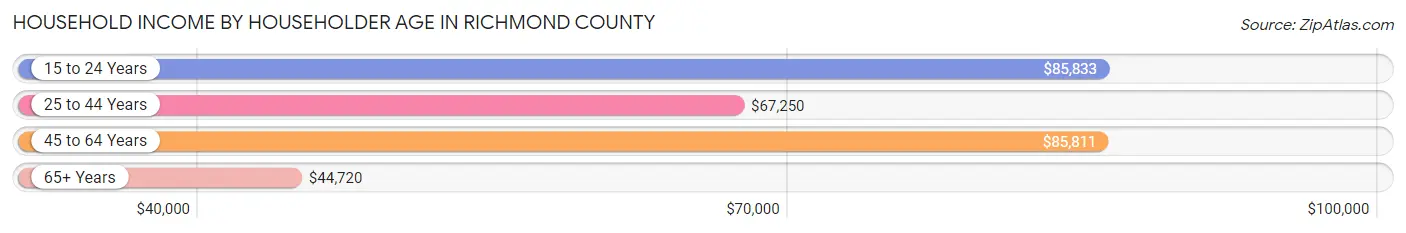
Household Income by Householder Age in Richmond County
The median household income in Richmond County is $62,708, with the highest median household income of $85,833 found in the 15 to 24 years age bracket for the primary householder. A total of 66 households (2.3%) fall into this category. Meanwhile, the 65+ years age bracket for the primary householder has the lowest median household income of $44,720, with 1,065 households (37.6%) in this group.
| Income Bracket | # Households | Median Income |
| 15 to 24 Years | 66 (2.3%) | $85,833 |
| 25 to 44 Years | 448 (15.8%) | $67,250 |
| 45 to 64 Years | 1,255 (44.3%) | $85,811 |
| 65+ Years | 1,065 (37.6%) | $44,720 |
| Total | 2,834 (100.0%) | $62,708 |
Poverty in Richmond County
Income Below Poverty by Sex and Age in Richmond County
With 9.5% poverty level for males and 5.6% for females among the residents of Richmond County, 25 to 34 year old males and 16 and 17 year old females are the most vulnerable to poverty, with 55 males (17.9%) and 5 females (35.7%) in their respective age groups living below the poverty level.
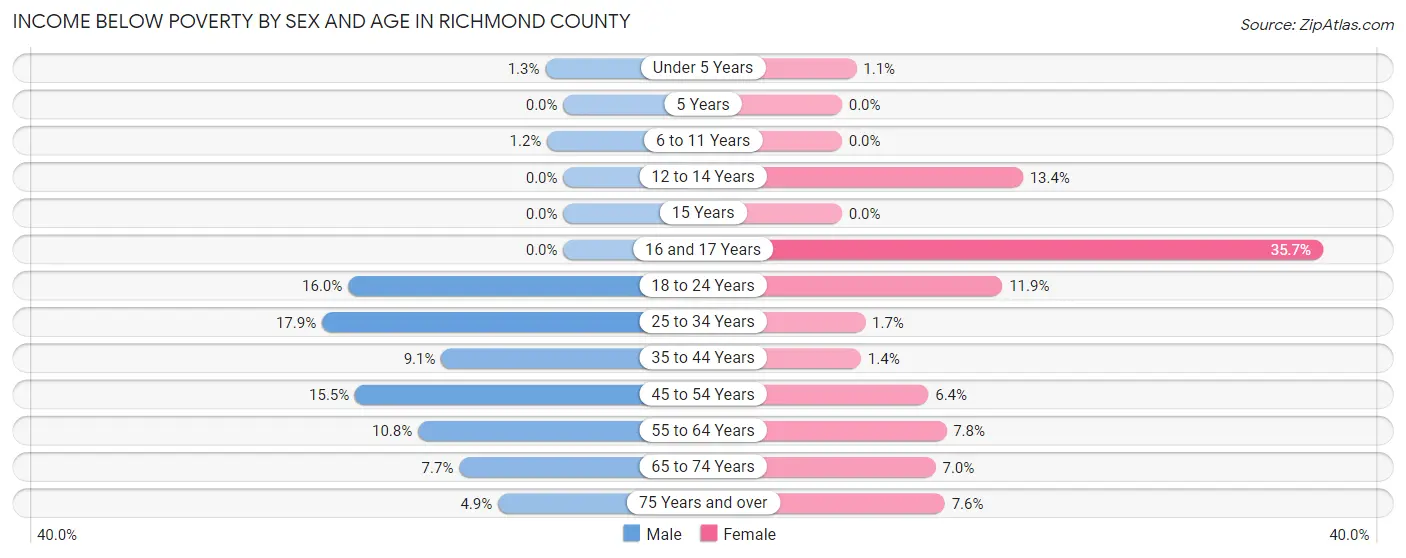
| Age Bracket | Male | Female |
| Under 5 Years | 3 (1.3%) | 3 (1.1%) |
| 5 Years | 0 (0.0%) | 0 (0.0%) |
| 6 to 11 Years | 4 (1.2%) | 0 (0.0%) |
| 12 to 14 Years | 0 (0.0%) | 18 (13.4%) |
| 15 Years | 0 (0.0%) | 0 (0.0%) |
| 16 and 17 Years | 0 (0.0%) | 5 (35.7%) |
| 18 to 24 Years | 54 (16.0%) | 28 (11.9%) |
| 25 to 34 Years | 55 (17.9%) | 6 (1.7%) |
| 35 to 44 Years | 23 (9.1%) | 6 (1.4%) |
| 45 to 54 Years | 98 (15.5%) | 28 (6.4%) |
| 55 to 64 Years | 63 (10.8%) | 49 (7.7%) |
| 65 to 74 Years | 29 (7.7%) | 33 (7.0%) |
| 75 Years and over | 15 (4.9%) | 36 (7.6%) |
| Total | 344 (9.5%) | 212 (5.6%) |
Income Above Poverty by Sex and Age in Richmond County
According to the poverty statistics in Richmond County, males aged 5 years and females aged 5 years are the age groups that are most secure financially, with 100.0% of males and 100.0% of females in these age groups living above the poverty line.
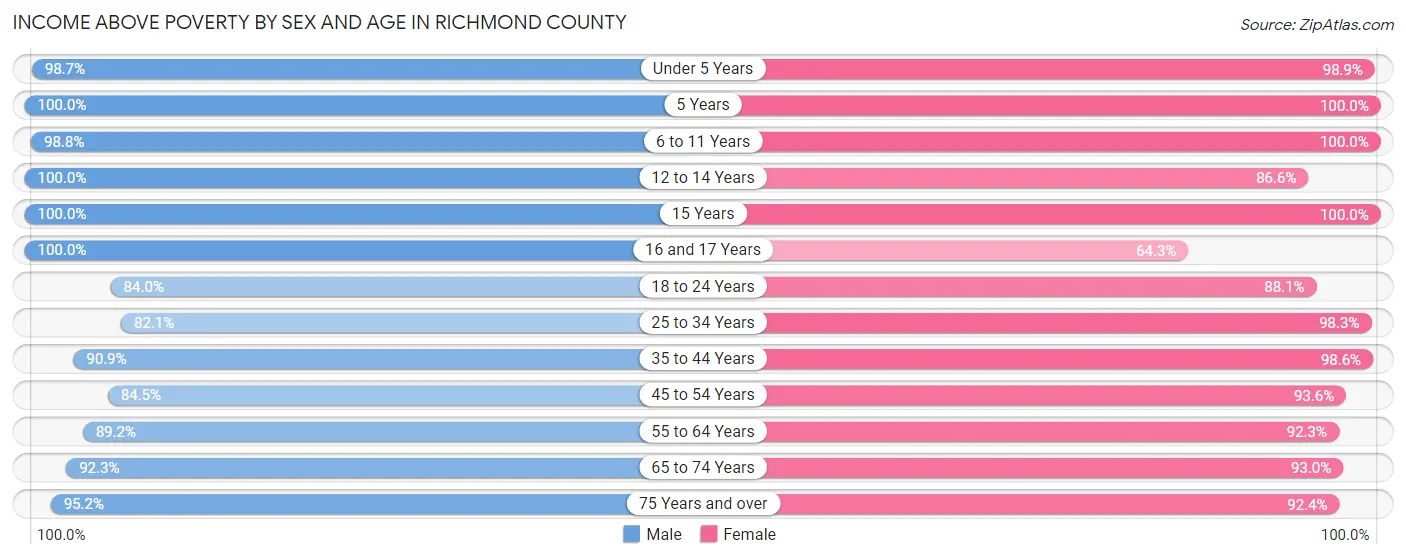
| Age Bracket | Male | Female |
| Under 5 Years | 221 (98.7%) | 274 (98.9%) |
| 5 Years | 3 (100.0%) | 52 (100.0%) |
| 6 to 11 Years | 330 (98.8%) | 255 (100.0%) |
| 12 to 14 Years | 98 (100.0%) | 116 (86.6%) |
| 15 Years | 40 (100.0%) | 12 (100.0%) |
| 16 and 17 Years | 105 (100.0%) | 9 (64.3%) |
| 18 to 24 Years | 284 (84.0%) | 207 (88.1%) |
| 25 to 34 Years | 252 (82.1%) | 341 (98.3%) |
| 35 to 44 Years | 231 (90.9%) | 417 (98.6%) |
| 45 to 54 Years | 536 (84.5%) | 408 (93.6%) |
| 55 to 64 Years | 521 (89.2%) | 583 (92.2%) |
| 65 to 74 Years | 346 (92.3%) | 441 (93.0%) |
| 75 Years and over | 294 (95.2%) | 435 (92.4%) |
| Total | 3,261 (90.5%) | 3,550 (94.4%) |
Income Below Poverty Among Married-Couple Families in Richmond County
The poverty statistics for married-couple families in Richmond County show that 2.6% or 41 of the total 1,569 families live below the poverty line. Families with no children have the highest poverty rate of 3.3%, comprising of 34 families. On the other hand, families with 3 or 4 children have the lowest poverty rate of 0.0%, which includes 0 families.
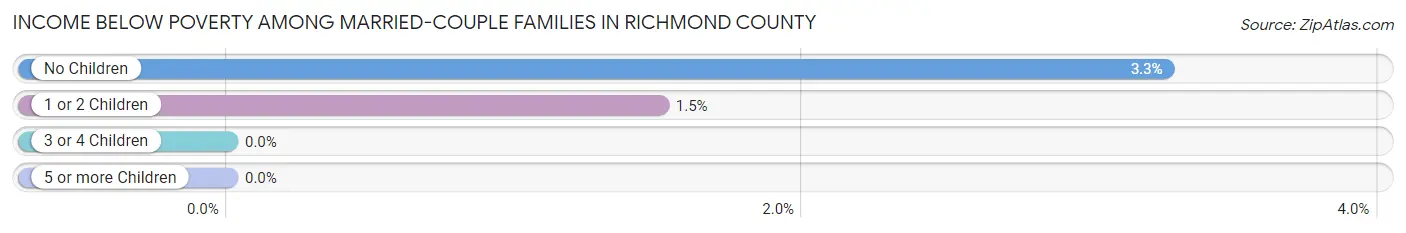
| Children | Above Poverty | Below Poverty |
| No Children | 1,008 (96.7%) | 34 (3.3%) |
| 1 or 2 Children | 460 (98.5%) | 7 (1.5%) |
| 3 or 4 Children | 60 (100.0%) | 0 (0.0%) |
| 5 or more Children | 0 (0.0%) | 0 (0.0%) |
| Total | 1,528 (97.4%) | 41 (2.6%) |
Income Below Poverty Among Single-Parent Households in Richmond County
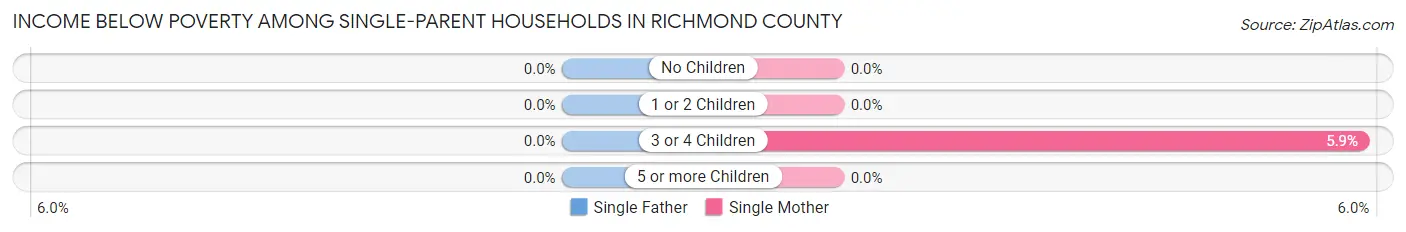
| Children | Single Father | Single Mother |
| No Children | 0 (0.0%) | 0 (0.0%) |
| 1 or 2 Children | 0 (0.0%) | 0 (0.0%) |
| 3 or 4 Children | 0 (0.0%) | 3 (5.9%) |
| 5 or more Children | 0 (0.0%) | 0 (0.0%) |
| Total | 0 (0.0%) | 3 (1.1%) |
Income Below Poverty Among Married-Couple vs Single-Parent Households in Richmond County
The poverty data for Richmond County shows that 41 of the married-couple family households (2.6%) and 3 of the single-parent households (0.9%) are living below the poverty level. Within the married-couple family households, those with no children have the highest poverty rate, with 34 households (3.3%) falling below the poverty line. Among the single-parent households, those with 3 or 4 children have the highest poverty rate, with 3 household (5.9%) living below poverty.
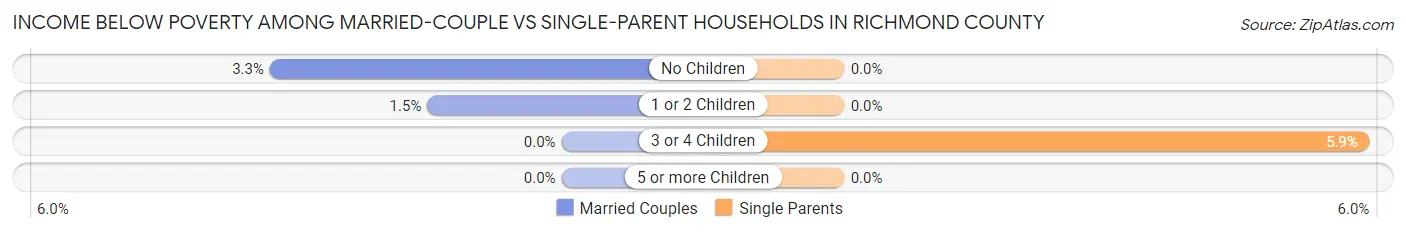
| Children | Married-Couple Families | Single-Parent Households |
| No Children | 34 (3.3%) | 0 (0.0%) |
| 1 or 2 Children | 7 (1.5%) | 0 (0.0%) |
| 3 or 4 Children | 0 (0.0%) | 3 (5.9%) |
| 5 or more Children | 0 (0.0%) | 0 (0.0%) |
| Total | 41 (2.6%) | 3 (0.9%) |
Race in Richmond County
The most populous races in Richmond County are White / Caucasian (5,456 | 60.8%), Black / African American (2,441 | 27.2%), and Two or more Races (731 | 8.2%).
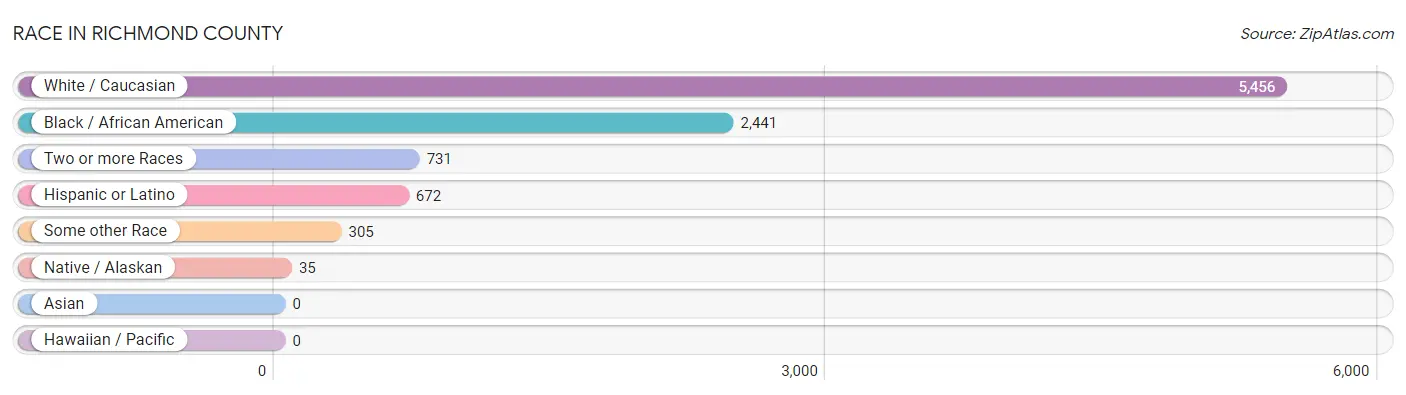
| Race | # Population | % Population |
| Asian | 0 | 0.0% |
| Black / African American | 2,441 | 27.2% |
| Hawaiian / Pacific | 0 | 0.0% |
| Hispanic or Latino | 672 | 7.5% |
| Native / Alaskan | 35 | 0.4% |
| White / Caucasian | 5,456 | 60.8% |
| Two or more Races | 731 | 8.2% |
| Some other Race | 305 | 3.4% |
| Total | 8,968 | 100.0% |
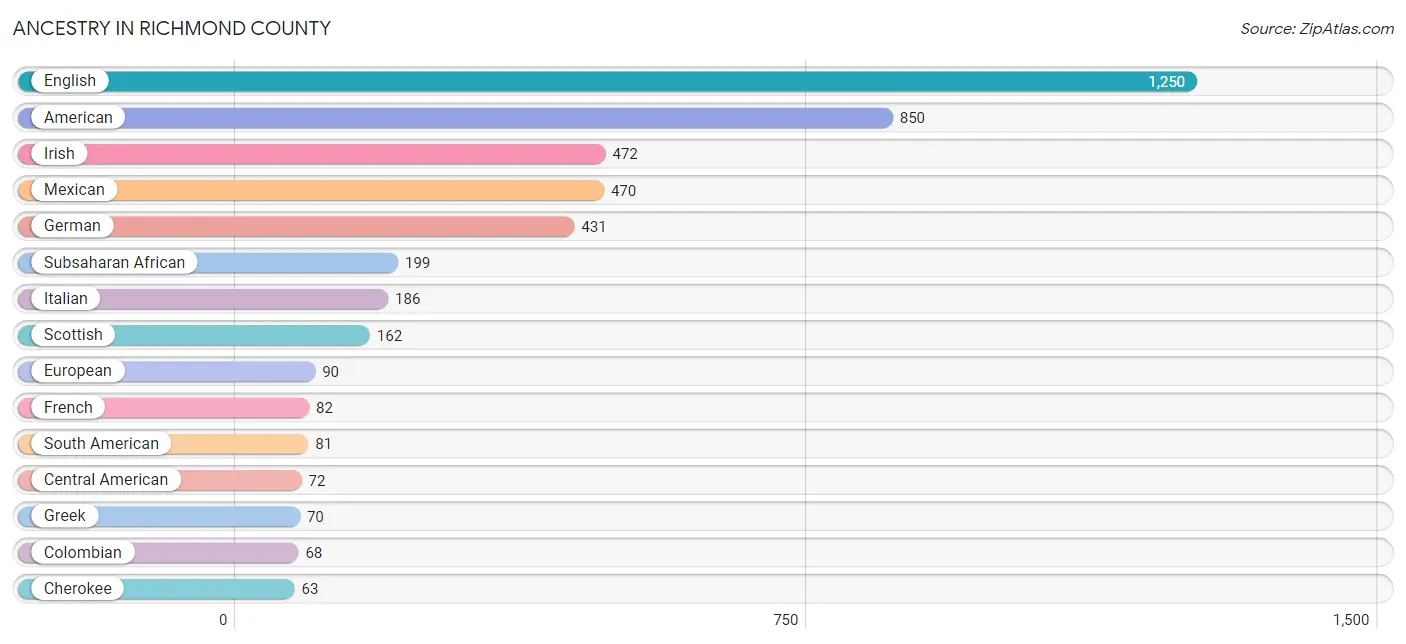
Ancestry in Richmond County
The most populous ancestries reported in Richmond County are English (1,250 | 13.9%), American (850 | 9.5%), Irish (472 | 5.3%), Mexican (470 | 5.2%), and German (431 | 4.8%), together accounting for 38.7% of all Richmond County residents.
| Ancestry | # Population | % Population |
| African | 35 | 0.4% |
| American | 850 | 9.5% |
| Arab | 8 | 0.1% |
| Austrian | 8 | 0.1% |
| British | 24 | 0.3% |
| Burmese | 3 | 0.0% |
| Canadian | 21 | 0.2% |
| Central American | 72 | 0.8% |
| Cherokee | 63 | 0.7% |
| Choctaw | 13 | 0.1% |
| Colombian | 68 | 0.8% |
| Czechoslovakian | 7 | 0.1% |
| Dutch | 7 | 0.1% |
| English | 1,250 | 13.9% |
| European | 90 | 1.0% |
| French | 82 | 0.9% |
| German | 431 | 4.8% |
| Greek | 70 | 0.8% |
| Guatemalan | 7 | 0.1% |
| Honduran | 10 | 0.1% |
| Hungarian | 8 | 0.1% |
| Irish | 472 | 5.3% |
| Italian | 186 | 2.1% |
| Korean | 2 | 0.0% |
| Liberian | 10 | 0.1% |
| Mexican | 470 | 5.2% |
| Mexican American Indian | 1 | 0.0% |
| Moroccan | 3 | 0.0% |
| Navajo | 5 | 0.1% |
| Nicaraguan | 4 | 0.0% |
| Norwegian | 11 | 0.1% |
| Pakistani | 4 | 0.0% |
| Peruvian | 13 | 0.1% |
| Polish | 17 | 0.2% |
| Portuguese | 7 | 0.1% |
| Puerto Rican | 45 | 0.5% |
| Salvadoran | 51 | 0.6% |
| Scandinavian | 29 | 0.3% |
| Scotch-Irish | 44 | 0.5% |
| Scottish | 162 | 1.8% |
| Sioux | 2 | 0.0% |
| Slovak | 3 | 0.0% |
| South American | 81 | 0.9% |
| Subsaharan African | 199 | 2.2% |
| Swedish | 50 | 0.6% |
| Thai | 7 | 0.1% |
| Turkish | 5 | 0.1% |
| Ukrainian | 37 | 0.4% |
| Welsh | 8 | 0.1% | View All 49 Rows |
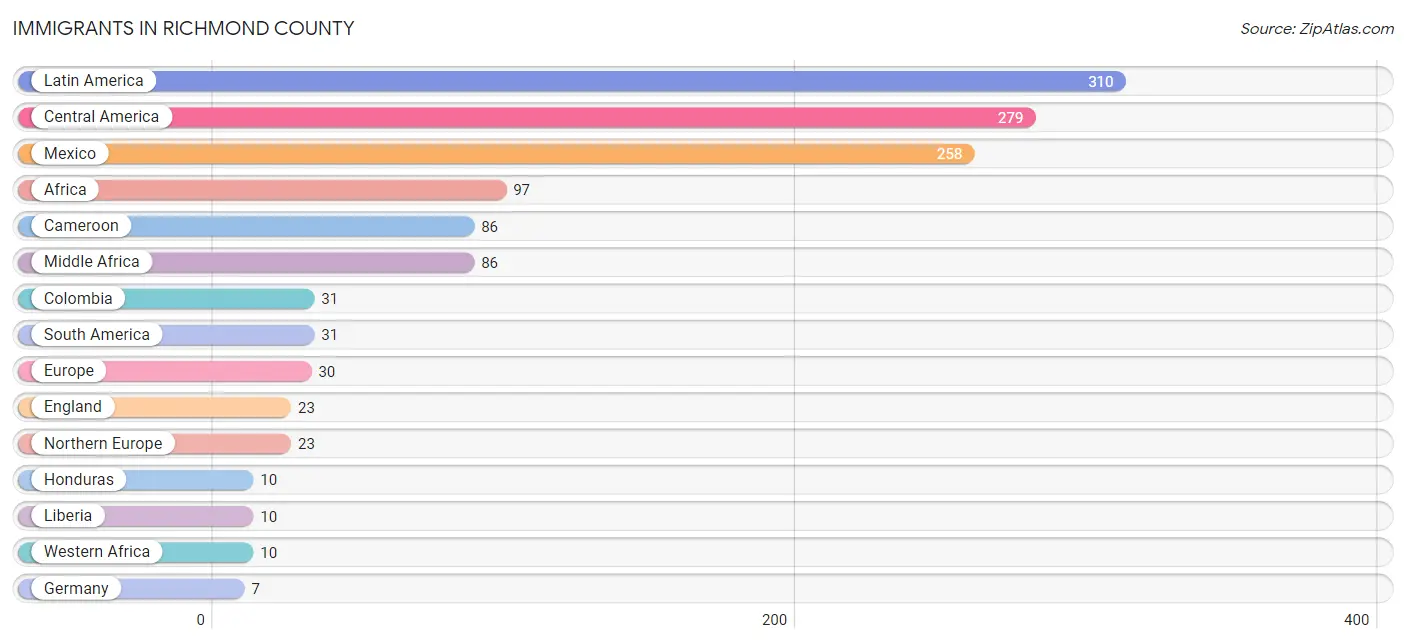
Immigrants in Richmond County
The most numerous immigrant groups reported in Richmond County came from Latin America (310 | 3.5%), Central America (279 | 3.1%), Mexico (258 | 2.9%), Africa (97 | 1.1%), and Cameroon (86 | 1.0%), together accounting for 11.5% of all Richmond County residents.
| Immigration Origin | # Population | % Population |
| Africa | 97 | 1.1% |
| Asia | 2 | 0.0% |
| Cameroon | 86 | 1.0% |
| Central America | 279 | 3.1% |
| Colombia | 31 | 0.4% |
| Eastern Africa | 1 | 0.0% |
| El Salvador | 5 | 0.1% |
| England | 23 | 0.3% |
| Europe | 30 | 0.3% |
| Germany | 7 | 0.1% |
| Honduras | 10 | 0.1% |
| Iraq | 2 | 0.0% |
| Latin America | 310 | 3.5% |
| Liberia | 10 | 0.1% |
| Mexico | 258 | 2.9% |
| Middle Africa | 86 | 1.0% |
| Nicaragua | 4 | 0.0% |
| Northern Europe | 23 | 0.3% |
| South America | 31 | 0.4% |
| Western Africa | 10 | 0.1% |
| Western Asia | 2 | 0.0% |
| Western Europe | 7 | 0.1% | View All 22 Rows |
Sex and Age in Richmond County
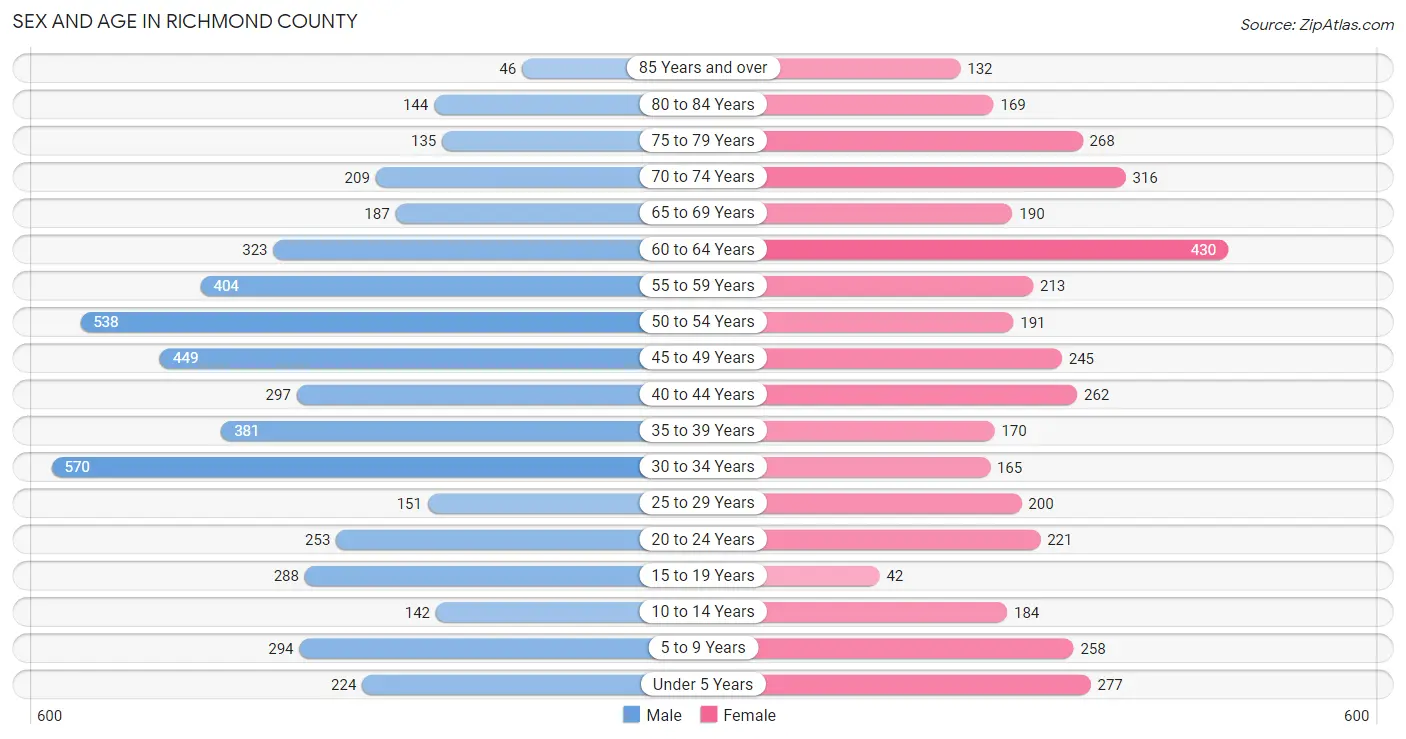
Sex and Age in Richmond County
The most populous age groups in Richmond County are 30 to 34 Years (570 | 11.3%) for men and 60 to 64 Years (430 | 10.9%) for women.
| Age Bracket | Male | Female |
| Under 5 Years | 224 (4.4%) | 277 (7.0%) |
| 5 to 9 Years | 294 (5.8%) | 258 (6.6%) |
| 10 to 14 Years | 142 (2.8%) | 184 (4.7%) |
| 15 to 19 Years | 288 (5.7%) | 42 (1.1%) |
| 20 to 24 Years | 253 (5.0%) | 221 (5.6%) |
| 25 to 29 Years | 151 (3.0%) | 200 (5.1%) |
| 30 to 34 Years | 570 (11.3%) | 165 (4.2%) |
| 35 to 39 Years | 381 (7.6%) | 170 (4.3%) |
| 40 to 44 Years | 297 (5.9%) | 262 (6.7%) |
| 45 to 49 Years | 449 (8.9%) | 245 (6.2%) |
| 50 to 54 Years | 538 (10.7%) | 191 (4.9%) |
| 55 to 59 Years | 404 (8.0%) | 213 (5.4%) |
| 60 to 64 Years | 323 (6.4%) | 430 (10.9%) |
| 65 to 69 Years | 187 (3.7%) | 190 (4.8%) |
| 70 to 74 Years | 209 (4.2%) | 316 (8.0%) |
| 75 to 79 Years | 135 (2.7%) | 268 (6.8%) |
| 80 to 84 Years | 144 (2.9%) | 169 (4.3%) |
| 85 Years and over | 46 (0.9%) | 132 (3.4%) |
| Total | 5,035 (100.0%) | 3,933 (100.0%) |
Families and Households in Richmond County
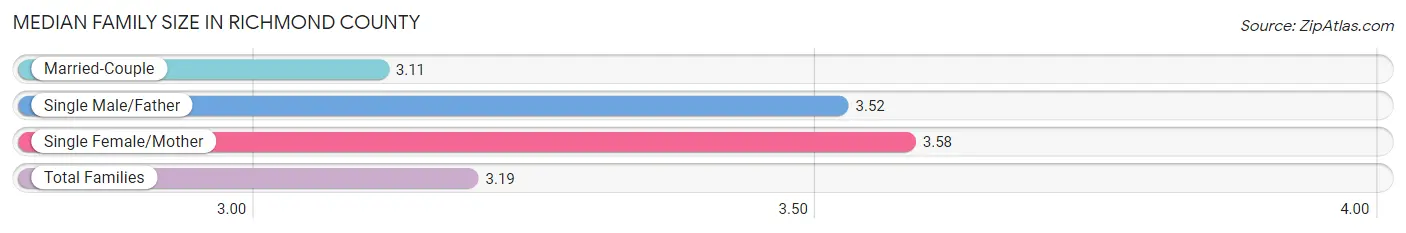
Median Family Size in Richmond County
The median family size in Richmond County is 3.19 persons per family, with single female/mother families (266 | 14.0%) accounting for the largest median family size of 3.58 persons per family. On the other hand, married-couple families (1,569 | 82.7%) represent the smallest median family size with 3.11 persons per family.
| Family Type | # Families | Family Size |
| Married-Couple | 1,569 (82.7%) | 3.11 |
| Single Male/Father | 63 (3.3%) | 3.52 |
| Single Female/Mother | 266 (14.0%) | 3.58 |
| Total Families | 1,898 (100.0%) | 3.19 |
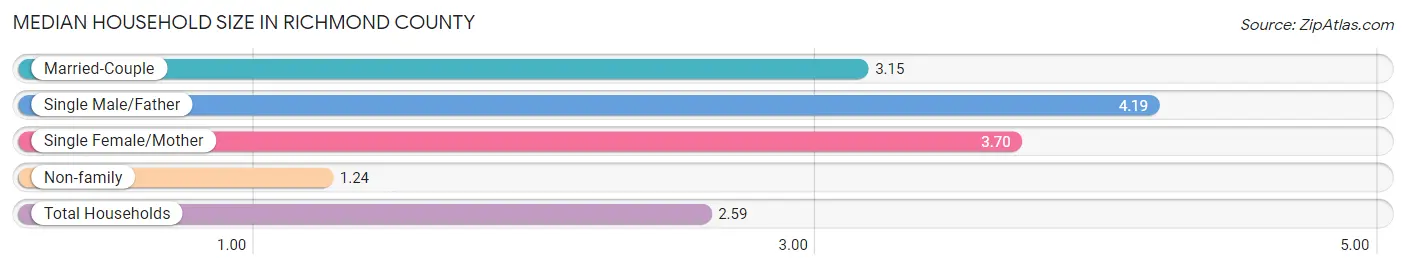
Median Household Size in Richmond County
The median household size in Richmond County is 2.59 persons per household, with single male/father households (63 | 2.2%) accounting for the largest median household size of 4.19 persons per household. non-family households (936 | 33.0%) represent the smallest median household size with 1.24 persons per household.
| Household Type | # Households | Household Size |
| Married-Couple | 1,569 (55.4%) | 3.15 |
| Single Male/Father | 63 (2.2%) | 4.19 |
| Single Female/Mother | 266 (9.4%) | 3.70 |
| Non-family | 936 (33.0%) | 1.24 |
| Total Households | 2,834 (100.0%) | 2.59 |
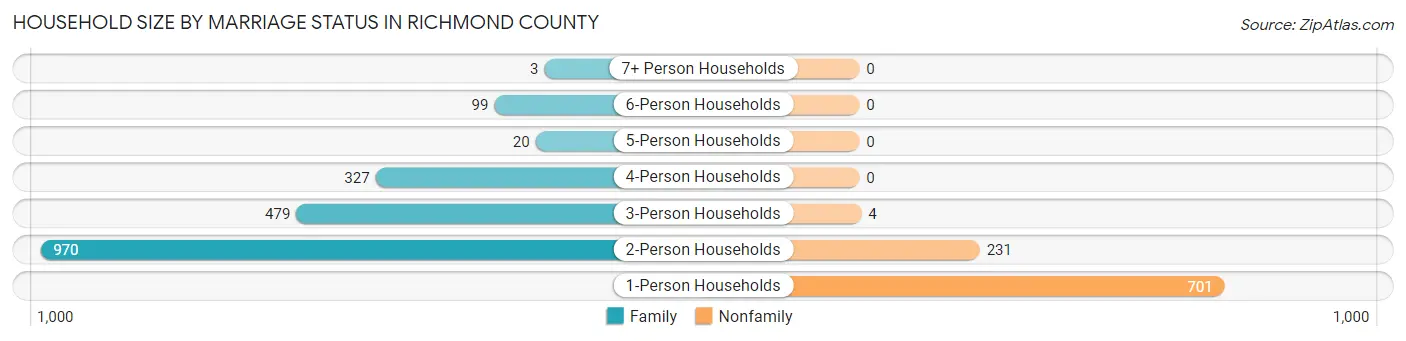
Household Size by Marriage Status in Richmond County
Out of a total of 2,834 households in Richmond County, 1,898 (67.0%) are family households, while 936 (33.0%) are nonfamily households. The most numerous type of family households are 2-person households, comprising 970, and the most common type of nonfamily households are 1-person households, comprising 701.
| Household Size | Family Households | Nonfamily Households |
| 1-Person Households | - | 701 (24.7%) |
| 2-Person Households | 970 (34.2%) | 231 (8.2%) |
| 3-Person Households | 479 (16.9%) | 4 (0.1%) |
| 4-Person Households | 327 (11.5%) | 0 (0.0%) |
| 5-Person Households | 20 (0.7%) | 0 (0.0%) |
| 6-Person Households | 99 (3.5%) | 0 (0.0%) |
| 7+ Person Households | 3 (0.1%) | 0 (0.0%) |
| Total | 1,898 (67.0%) | 936 (33.0%) |
Female Fertility in Richmond County
Fertility by Age in Richmond County
Average fertility rate in Richmond County is 18.0 births per 1,000 women. Women in the age bracket of 20 to 34 years have the highest fertility rate with 43.0 births per 1,000 women. Women in the age bracket of 20 to 34 years acount for 100.0% of all women with births.
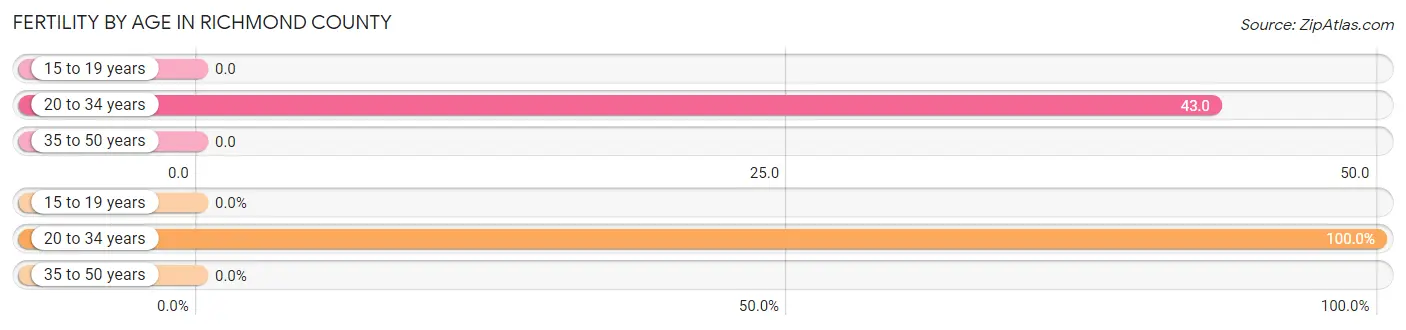
| Age Bracket | Women with Births | Births / 1,000 Women |
| 15 to 19 years | 0 (0.0%) | 0.0 |
| 20 to 34 years | 25 (100.0%) | 43.0 |
| 35 to 50 years | 0 (0.0%) | 0.0 |
| Total | 25 (100.0%) | 18.0 |
Fertility by Age by Marriage Status in Richmond County
84.0% of women with births (25) in Richmond County are married. The highest percentage of unmarried women with births falls into 20 to 34 years age bracket with 16.0% of them unmarried at the time of birth, while the lowest percentage of unmarried women with births belong to 20 to 34 years age bracket with 16.0% of them unmarried.
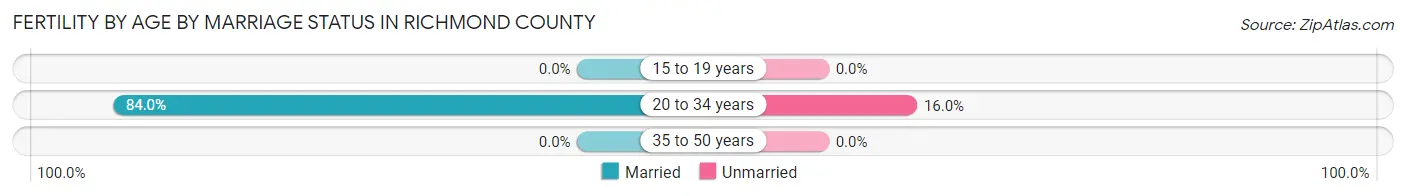
| Age Bracket | Married | Unmarried |
| 15 to 19 years | 0 (0.0%) | 0 (0.0%) |
| 20 to 34 years | 21 (84.0%) | 4 (16.0%) |
| 35 to 50 years | 0 (0.0%) | 0 (0.0%) |
| Total | 21 (84.0%) | 4 (16.0%) |
Fertility by Education in Richmond County
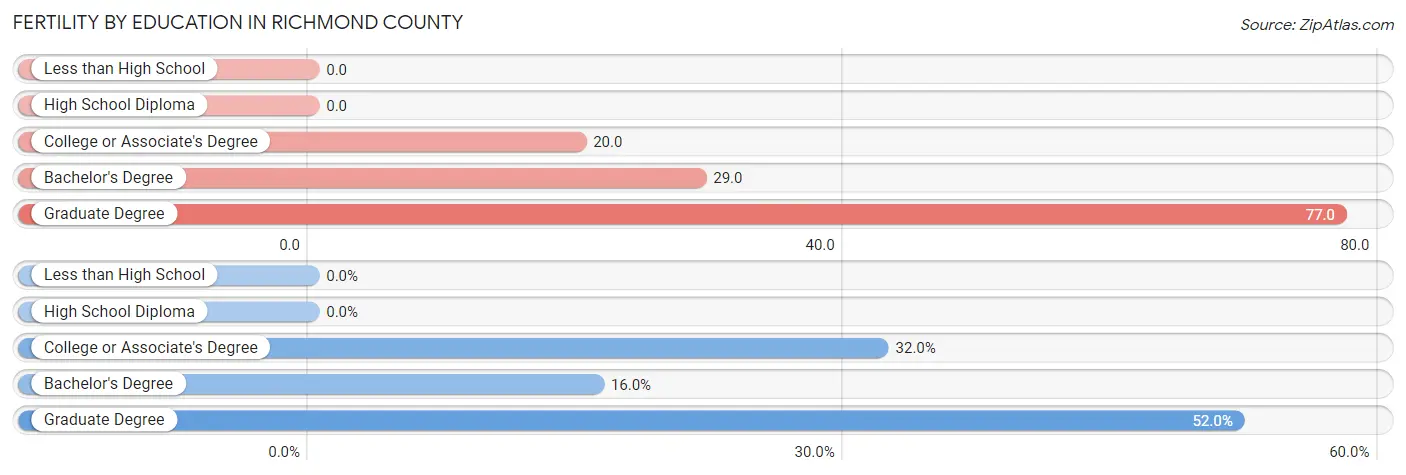
| Educational Attainment | Women with Births | Births / 1,000 Women |
| Less than High School | 0 (0.0%) | 0.0 |
| High School Diploma | 0 (0.0%) | 0.0 |
| College or Associate's Degree | 8 (32.0%) | 20.0 |
| Bachelor's Degree | 4 (16.0%) | 29.0 |
| Graduate Degree | 13 (52.0%) | 77.0 |
| Total | 25 (100.0%) | 18.0 |
Fertility by Education by Marriage Status in Richmond County
16.0% of women with births in Richmond County are unmarried. Women with the educational attainment of college or associate's degree are most likely to be married with 100.0% of them married at childbirth, while women with the educational attainment of bachelor's degree are least likely to be married with 100.0% of them unmarried at childbirth.
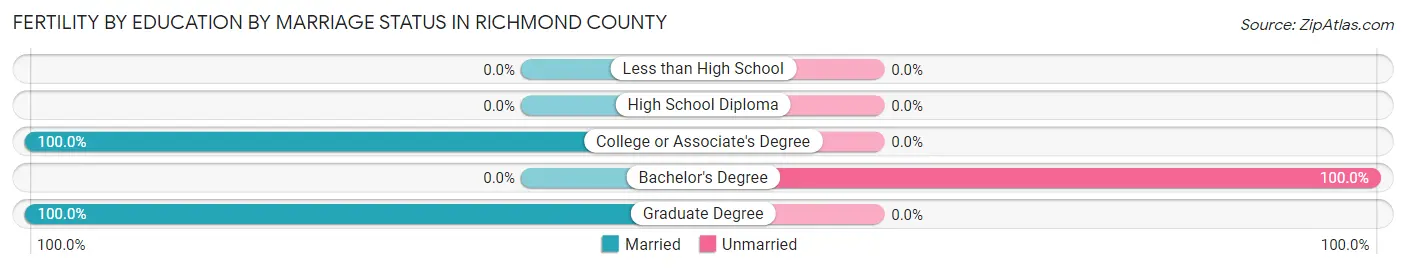
| Educational Attainment | Married | Unmarried |
| Less than High School | 0 (0.0%) | 0 (0.0%) |
| High School Diploma | 0 (0.0%) | 0 (0.0%) |
| College or Associate's Degree | 8 (100.0%) | 0 (0.0%) |
| Bachelor's Degree | 0 (0.0%) | 4 (100.0%) |
| Graduate Degree | 13 (100.0%) | 0 (0.0%) |
| Total | 21 (84.0%) | 4 (16.0%) |
Employment Characteristics in Richmond County
Employment by Class of Employer in Richmond County
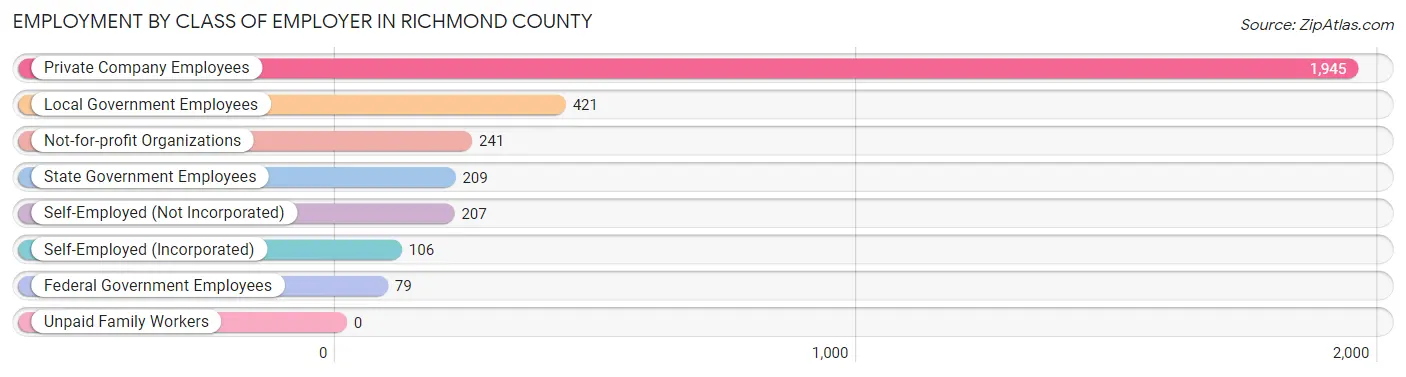
Among the 3,208 employed individuals in Richmond County, private company employees (1,945 | 60.6%), local government employees (421 | 13.1%), and not-for-profit organizations (241 | 7.5%) make up the most common classes of employment.
| Employer Class | # Employees | % Employees |
| Private Company Employees | 1,945 | 60.6% |
| Self-Employed (Incorporated) | 106 | 3.3% |
| Self-Employed (Not Incorporated) | 207 | 6.5% |
| Not-for-profit Organizations | 241 | 7.5% |
| Local Government Employees | 421 | 13.1% |
| State Government Employees | 209 | 6.5% |
| Federal Government Employees | 79 | 2.5% |
| Unpaid Family Workers | 0 | 0.0% |
| Total | 3,208 | 100.0% |
Employment Status by Age in Richmond County
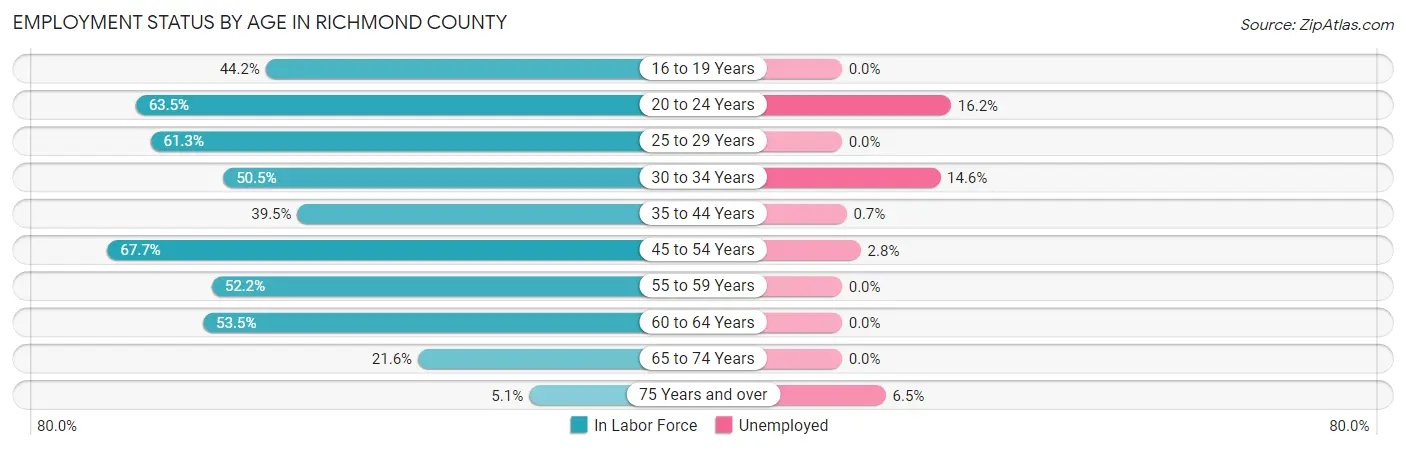
According to the labor force statistics for Richmond County, out of the total population over 16 years of age (7,537), 44.8% or 3,377 individuals are in the labor force, with 4.0% or 135 of them unemployed. The age group with the highest labor force participation rate is 45 to 54 years, with 67.7% or 963 individuals in the labor force. Within the labor force, the 20 to 24 years age range has the highest percentage of unemployed individuals, with 16.2% or 49 of them being unemployed.
| Age Bracket | In Labor Force | Unemployed |
| 16 to 19 Years | 123 (44.2%) | 0 (0.0%) |
| 20 to 24 Years | 301 (63.5%) | 49 (16.2%) |
| 25 to 29 Years | 215 (61.3%) | 0 (0.0%) |
| 30 to 34 Years | 371 (50.5%) | 54 (14.6%) |
| 35 to 44 Years | 438 (39.5%) | 3 (0.7%) |
| 45 to 54 Years | 963 (67.7%) | 27 (2.8%) |
| 55 to 59 Years | 322 (52.2%) | 0 (0.0%) |
| 60 to 64 Years | 403 (53.5%) | 0 (0.0%) |
| 65 to 74 Years | 195 (21.6%) | 0 (0.0%) |
| 75 Years and over | 46 (5.1%) | 3 (6.5%) |
| Total | 3,377 (44.8%) | 135 (4.0%) |
Employment Status by Educational Attainment in Richmond County
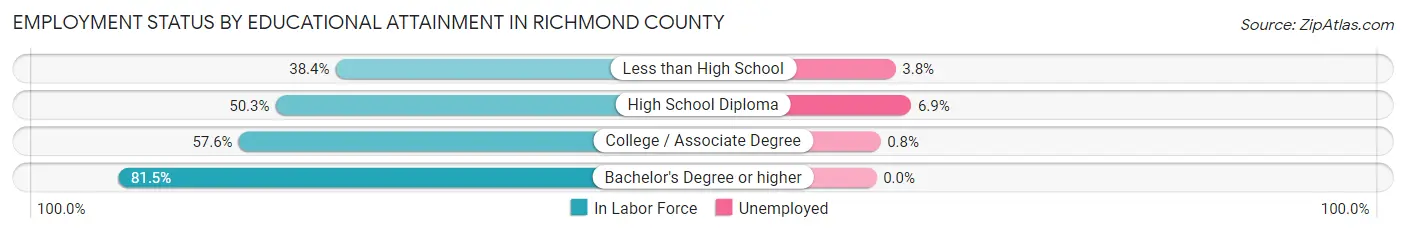
According to labor force statistics for Richmond County, 54.4% of individuals (2,714) out of the total population between 25 and 64 years of age (4,989) are in the labor force, with 3.1% or 84 of them being unemployed. The group with the highest labor force participation rate are those with the educational attainment of bachelor's degree or higher, with 81.5% or 741 individuals in the labor force. Within the labor force, individuals with high school diploma education have the highest percentage of unemployment, with 6.9% or 60 of them being unemployed.
| Educational Attainment | In Labor Force | Unemployed |
| Less than High School | 503 (38.4%) | 50 (3.8%) |
| High School Diploma | 869 (50.3%) | 119 (6.9%) |
| College / Associate Degree | 600 (57.6%) | 8 (0.8%) |
| Bachelor's Degree or higher | 741 (81.5%) | 0 (0.0%) |
| Total | 2,714 (54.4%) | 155 (3.1%) |
Employment Occupations by Sex in Richmond County
Management, Business, Science and Arts Occupations
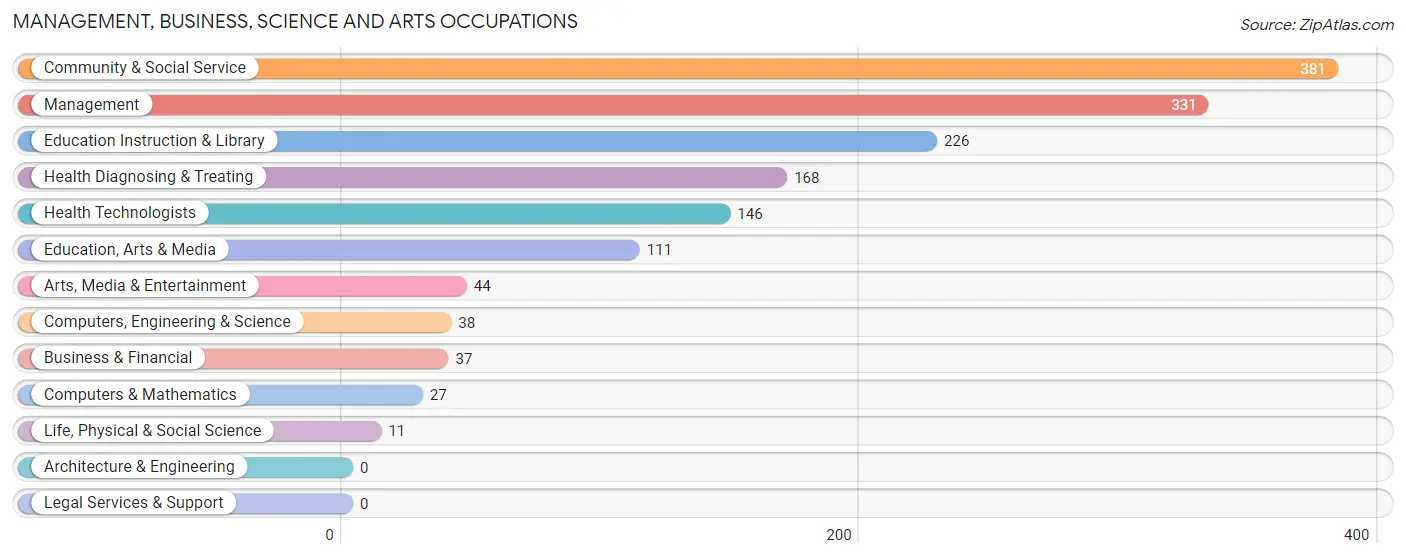
The most common Management, Business, Science and Arts occupations in Richmond County are Community & Social Service (381 | 11.8%), Management (331 | 10.2%), Education Instruction & Library (226 | 7.0%), Health Diagnosing & Treating (168 | 5.2%), and Health Technologists (146 | 4.5%).
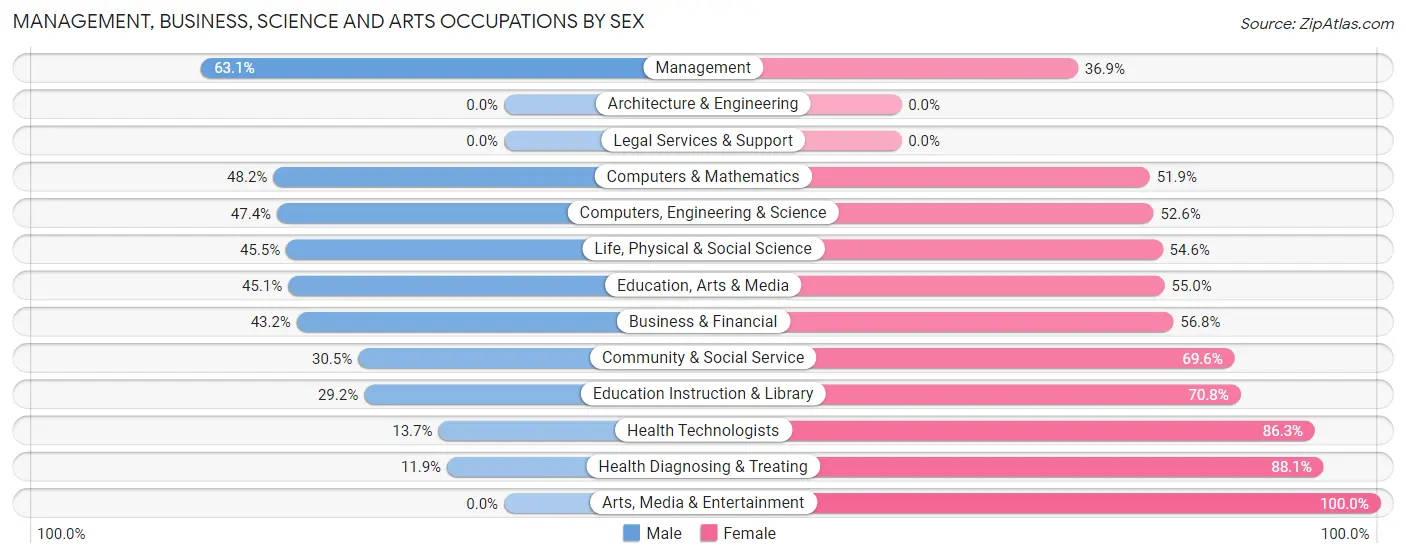
Management, Business, Science and Arts Occupations by Sex
Within the Management, Business, Science and Arts occupations in Richmond County, the most male-oriented occupations are Management (63.1%), Computers & Mathematics (48.1%), and Computers, Engineering & Science (47.4%), while the most female-oriented occupations are Arts, Media & Entertainment (100.0%), Health Diagnosing & Treating (88.1%), and Health Technologists (86.3%).
| Occupation | Male | Female |
| Management | 209 (63.1%) | 122 (36.9%) |
| Business & Financial | 16 (43.2%) | 21 (56.8%) |
| Computers, Engineering & Science | 18 (47.4%) | 20 (52.6%) |
| Computers & Mathematics | 13 (48.1%) | 14 (51.8%) |
| Architecture & Engineering | 0 (0.0%) | 0 (0.0%) |
| Life, Physical & Social Science | 5 (45.5%) | 6 (54.5%) |
| Community & Social Service | 116 (30.4%) | 265 (69.6%) |
| Education, Arts & Media | 50 (45.1%) | 61 (54.9%) |
| Legal Services & Support | 0 (0.0%) | 0 (0.0%) |
| Education Instruction & Library | 66 (29.2%) | 160 (70.8%) |
| Arts, Media & Entertainment | 0 (0.0%) | 44 (100.0%) |
| Health Diagnosing & Treating | 20 (11.9%) | 148 (88.1%) |
| Health Technologists | 20 (13.7%) | 126 (86.3%) |
| Total (Category) | 379 (39.7%) | 576 (60.3%) |
| Total (Overall) | 1,697 (52.4%) | 1,541 (47.6%) |
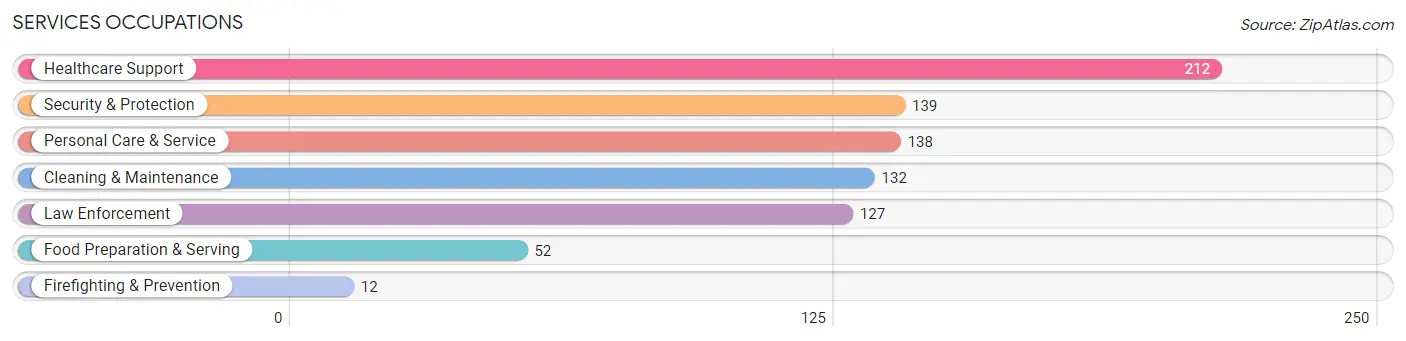
Services Occupations
The most common Services occupations in Richmond County are Healthcare Support (212 | 6.6%), Security & Protection (139 | 4.3%), Personal Care & Service (138 | 4.3%), Cleaning & Maintenance (132 | 4.1%), and Law Enforcement (127 | 3.9%).
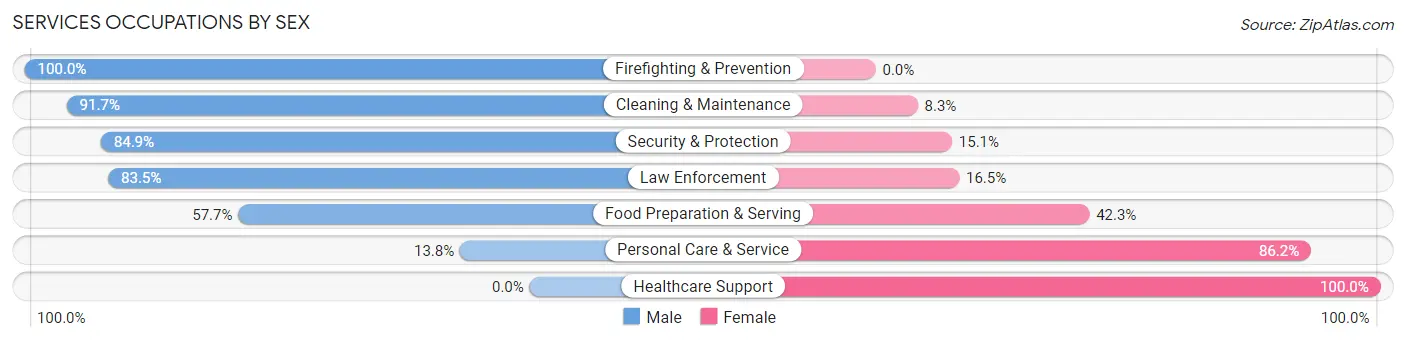
Services Occupations by Sex
Within the Services occupations in Richmond County, the most male-oriented occupations are Firefighting & Prevention (100.0%), Cleaning & Maintenance (91.7%), and Security & Protection (84.9%), while the most female-oriented occupations are Healthcare Support (100.0%), Personal Care & Service (86.2%), and Food Preparation & Serving (42.3%).
| Occupation | Male | Female |
| Healthcare Support | 0 (0.0%) | 212 (100.0%) |
| Security & Protection | 118 (84.9%) | 21 (15.1%) |
| Firefighting & Prevention | 12 (100.0%) | 0 (0.0%) |
| Law Enforcement | 106 (83.5%) | 21 (16.5%) |
| Food Preparation & Serving | 30 (57.7%) | 22 (42.3%) |
| Cleaning & Maintenance | 121 (91.7%) | 11 (8.3%) |
| Personal Care & Service | 19 (13.8%) | 119 (86.2%) |
| Total (Category) | 288 (42.8%) | 385 (57.2%) |
| Total (Overall) | 1,697 (52.4%) | 1,541 (47.6%) |
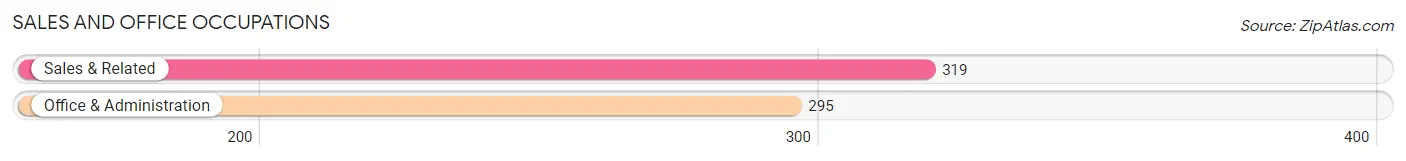
Sales and Office Occupations
The most common Sales and Office occupations in Richmond County are Sales & Related (319 | 9.9%), and Office & Administration (295 | 9.1%).
Sales and Office Occupations by Sex
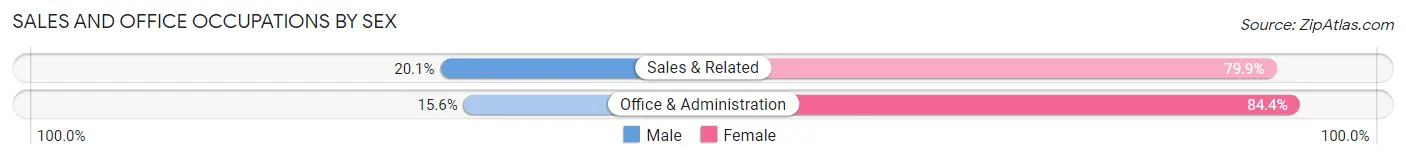
| Occupation | Male | Female |
| Sales & Related | 64 (20.1%) | 255 (79.9%) |
| Office & Administration | 46 (15.6%) | 249 (84.4%) |
| Total (Category) | 110 (17.9%) | 504 (82.1%) |
| Total (Overall) | 1,697 (52.4%) | 1,541 (47.6%) |
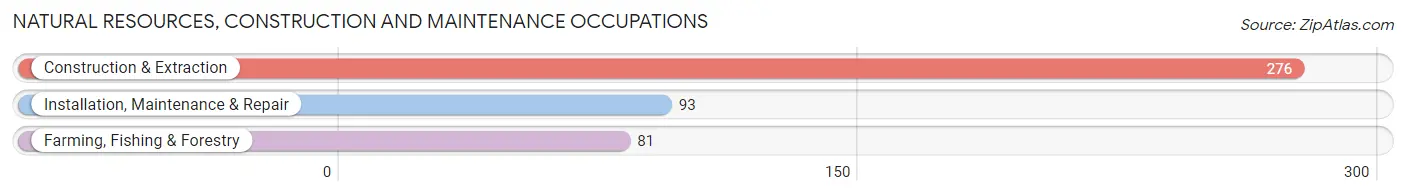
Natural Resources, Construction and Maintenance Occupations
The most common Natural Resources, Construction and Maintenance occupations in Richmond County are Construction & Extraction (276 | 8.5%), Installation, Maintenance & Repair (93 | 2.9%), and Farming, Fishing & Forestry (81 | 2.5%).
Natural Resources, Construction and Maintenance Occupations by Sex
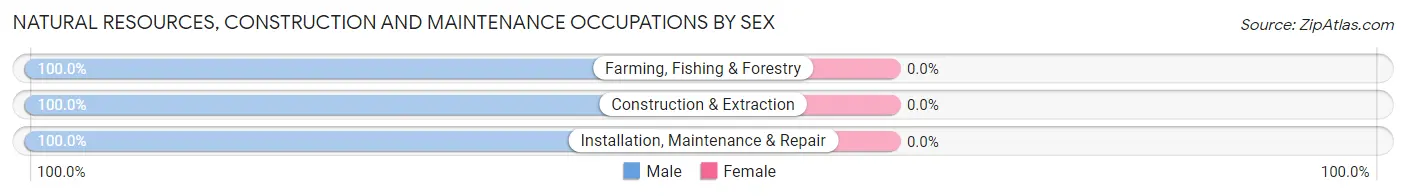
| Occupation | Male | Female |
| Farming, Fishing & Forestry | 81 (100.0%) | 0 (0.0%) |
| Construction & Extraction | 276 (100.0%) | 0 (0.0%) |
| Installation, Maintenance & Repair | 93 (100.0%) | 0 (0.0%) |
| Total (Category) | 450 (100.0%) | 0 (0.0%) |
| Total (Overall) | 1,697 (52.4%) | 1,541 (47.6%) |
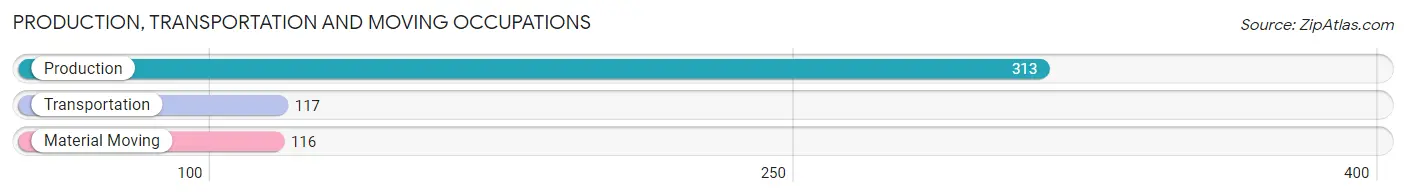
Production, Transportation and Moving Occupations
The most common Production, Transportation and Moving occupations in Richmond County are Production (313 | 9.7%), Transportation (117 | 3.6%), and Material Moving (116 | 3.6%).
Production, Transportation and Moving Occupations by Sex
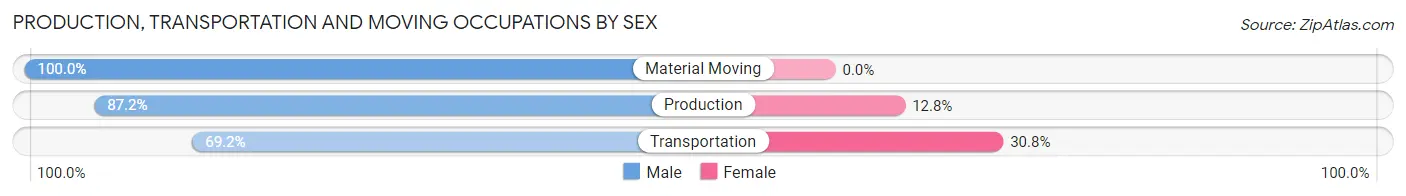
| Occupation | Male | Female |
| Production | 273 (87.2%) | 40 (12.8%) |
| Transportation | 81 (69.2%) | 36 (30.8%) |
| Material Moving | 116 (100.0%) | 0 (0.0%) |
| Total (Category) | 470 (86.1%) | 76 (13.9%) |
| Total (Overall) | 1,697 (52.4%) | 1,541 (47.6%) |
Employment Industries by Sex in Richmond County
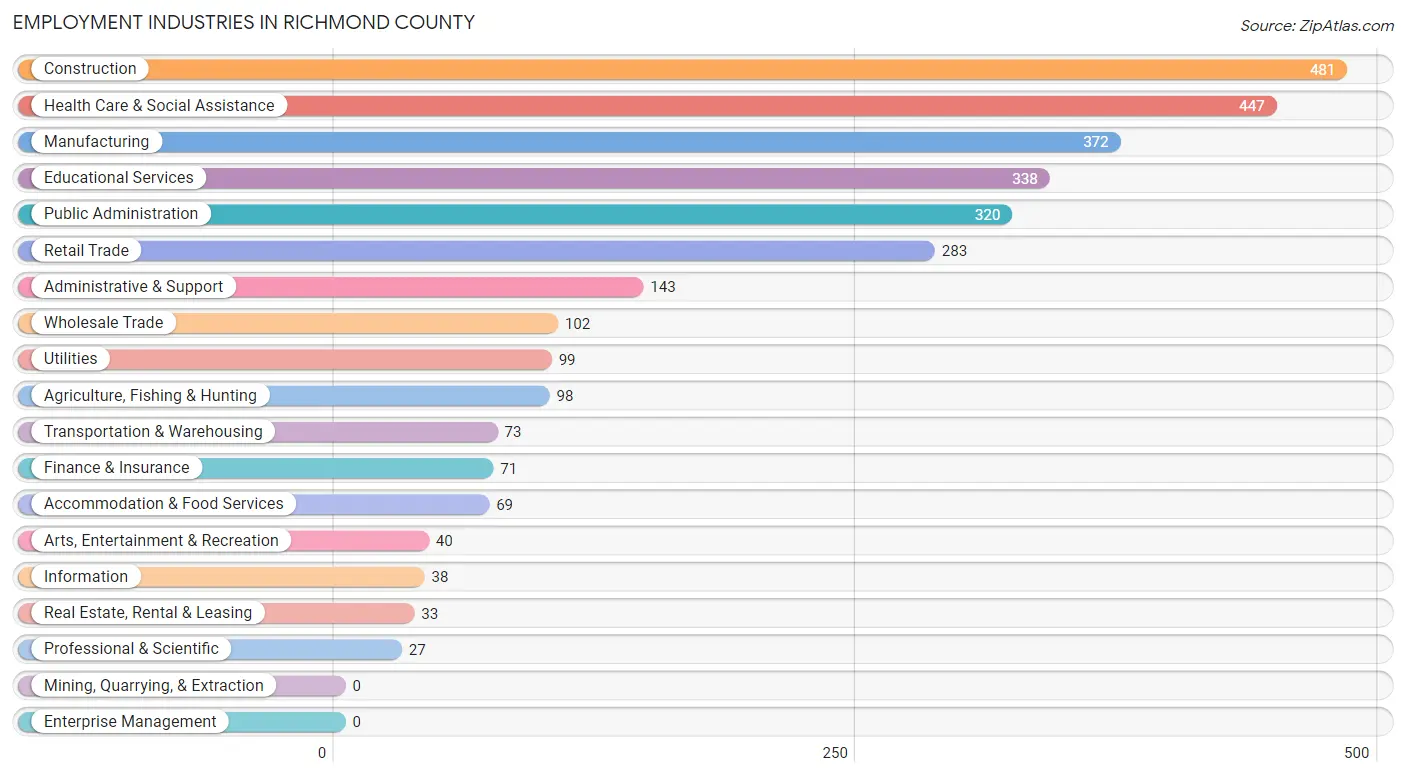
Employment Industries in Richmond County
The major employment industries in Richmond County include Construction (481 | 14.8%), Health Care & Social Assistance (447 | 13.8%), Manufacturing (372 | 11.5%), Educational Services (338 | 10.4%), and Public Administration (320 | 9.9%).
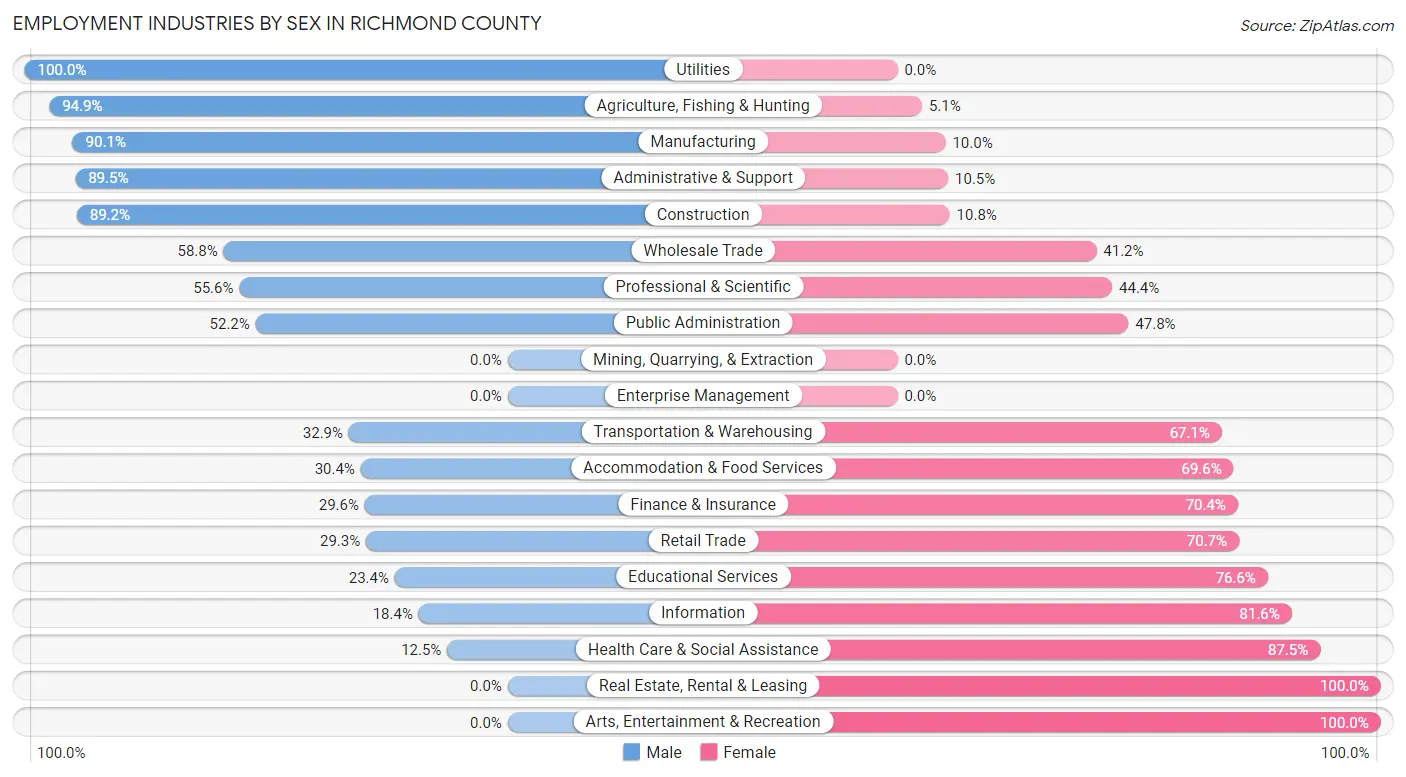
Employment Industries by Sex in Richmond County
The Richmond County industries that see more men than women are Utilities (100.0%), Agriculture, Fishing & Hunting (94.9%), and Manufacturing (90.0%), whereas the industries that tend to have a higher number of women are Real Estate, Rental & Leasing (100.0%), Arts, Entertainment & Recreation (100.0%), and Health Care & Social Assistance (87.5%).
| Industry | Male | Female |
| Agriculture, Fishing & Hunting | 93 (94.9%) | 5 (5.1%) |
| Mining, Quarrying, & Extraction | 0 (0.0%) | 0 (0.0%) |
| Construction | 429 (89.2%) | 52 (10.8%) |
| Manufacturing | 335 (90.0%) | 37 (10.0%) |
| Wholesale Trade | 60 (58.8%) | 42 (41.2%) |
| Retail Trade | 83 (29.3%) | 200 (70.7%) |
| Transportation & Warehousing | 24 (32.9%) | 49 (67.1%) |
| Utilities | 99 (100.0%) | 0 (0.0%) |
| Information | 7 (18.4%) | 31 (81.6%) |
| Finance & Insurance | 21 (29.6%) | 50 (70.4%) |
| Real Estate, Rental & Leasing | 0 (0.0%) | 33 (100.0%) |
| Professional & Scientific | 15 (55.6%) | 12 (44.4%) |
| Enterprise Management | 0 (0.0%) | 0 (0.0%) |
| Administrative & Support | 128 (89.5%) | 15 (10.5%) |
| Educational Services | 79 (23.4%) | 259 (76.6%) |
| Health Care & Social Assistance | 56 (12.5%) | 391 (87.5%) |
| Arts, Entertainment & Recreation | 0 (0.0%) | 40 (100.0%) |
| Accommodation & Food Services | 21 (30.4%) | 48 (69.6%) |
| Public Administration | 167 (52.2%) | 153 (47.8%) |
| Total | 1,697 (52.4%) | 1,541 (47.6%) |
Education in Richmond County
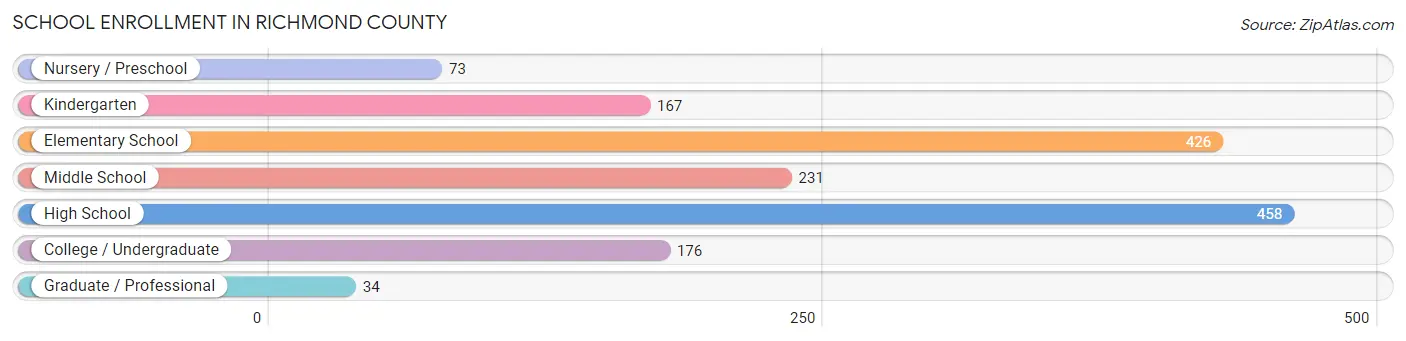
School Enrollment in Richmond County
The most common levels of schooling among the 1,565 students in Richmond County are high school (458 | 29.3%), elementary school (426 | 27.2%), and middle school (231 | 14.8%).
| School Level | # Students | % Students |
| Nursery / Preschool | 73 | 4.7% |
| Kindergarten | 167 | 10.7% |
| Elementary School | 426 | 27.2% |
| Middle School | 231 | 14.8% |
| High School | 458 | 29.3% |
| College / Undergraduate | 176 | 11.3% |
| Graduate / Professional | 34 | 2.2% |
| Total | 1,565 | 100.0% |
School Enrollment by Age by Funding Source in Richmond County
Out of a total of 1,565 students who are enrolled in schools in Richmond County, 315 (20.1%) attend a private institution, while the remaining 1,250 (79.9%) are enrolled in public schools. The age group of 3 to 4 year olds has the highest likelihood of being enrolled in private schools, with 45 (61.6% in the age bracket) enrolled. Conversely, the age group of 15 to 17 year olds has the lowest likelihood of being enrolled in a private school, with 172 (100.0% in the age bracket) attending a public institution.
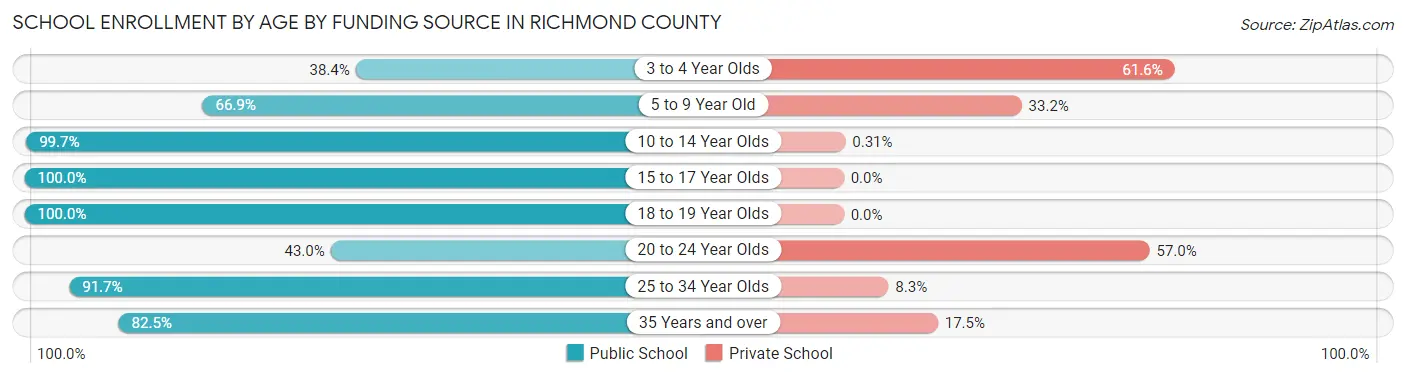
| Age Bracket | Public School | Private School |
| 3 to 4 Year Olds | 28 (38.4%) | 45 (61.6%) |
| 5 to 9 Year Old | 369 (66.8%) | 183 (33.2%) |
| 10 to 14 Year Olds | 325 (99.7%) | 1 (0.3%) |
| 15 to 17 Year Olds | 172 (100.0%) | 0 (0.0%) |
| 18 to 19 Year Olds | 126 (100.0%) | 0 (0.0%) |
| 20 to 24 Year Olds | 37 (43.0%) | 49 (57.0%) |
| 25 to 34 Year Olds | 33 (91.7%) | 3 (8.3%) |
| 35 Years and over | 160 (82.5%) | 34 (17.5%) |
| Total | 1,250 (79.9%) | 315 (20.1%) |
Educational Attainment by Field of Study in Richmond County
Education (199 | 14.3%), social sciences (157 | 11.3%), engineering (156 | 11.3%), liberal arts & history (146 | 10.5%), and business (143 | 10.3%) are the most common fields of study among 1,387 individuals in Richmond County who have obtained a bachelor's degree or higher.
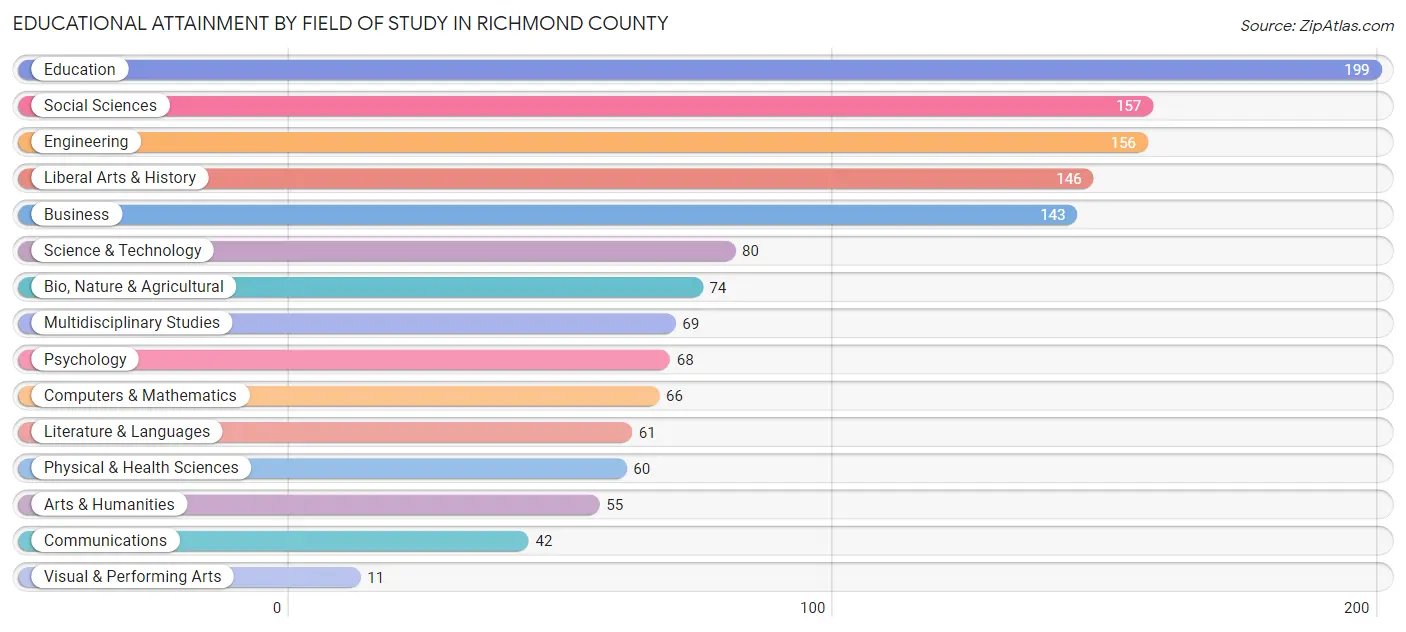
| Field of Study | # Graduates | % Graduates |
| Computers & Mathematics | 66 | 4.8% |
| Bio, Nature & Agricultural | 74 | 5.3% |
| Physical & Health Sciences | 60 | 4.3% |
| Psychology | 68 | 4.9% |
| Social Sciences | 157 | 11.3% |
| Engineering | 156 | 11.3% |
| Multidisciplinary Studies | 69 | 5.0% |
| Science & Technology | 80 | 5.8% |
| Business | 143 | 10.3% |
| Education | 199 | 14.3% |
| Literature & Languages | 61 | 4.4% |
| Liberal Arts & History | 146 | 10.5% |
| Visual & Performing Arts | 11 | 0.8% |
| Communications | 42 | 3.0% |
| Arts & Humanities | 55 | 4.0% |
| Total | 1,387 | 100.0% |
Transportation & Commute in Richmond County
Vehicle Availability by Sex in Richmond County
The most prevalent vehicle ownership categories in Richmond County are males with 3 vehicles (619, accounting for 37.1%) and females with 3 vehicles (378, making up 40.3%).
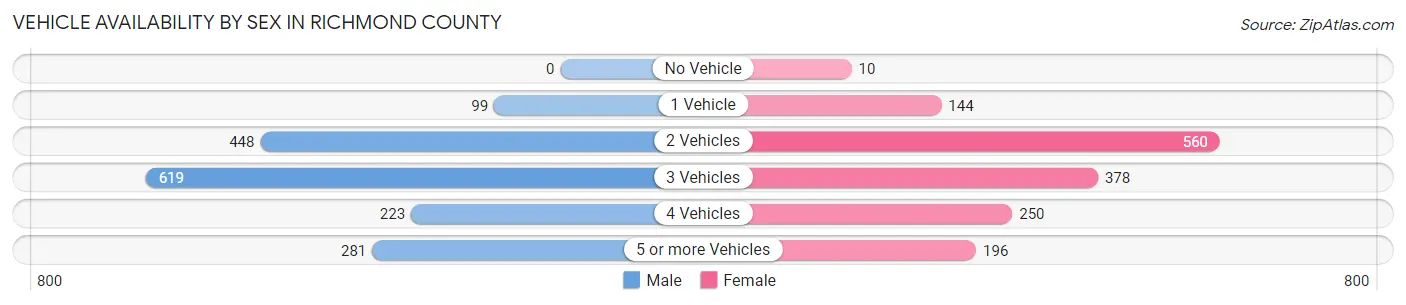
| Vehicles Available | Male | Female |
| No Vehicle | 0 (0.0%) | 10 (0.6%) |
| 1 Vehicle | 99 (5.9%) | 144 (9.4%) |
| 2 Vehicles | 448 (26.8%) | 560 (36.4%) |
| 3 Vehicles | 619 (37.1%) | 378 (24.6%) |
| 4 Vehicles | 223 (13.4%) | 250 (16.3%) |
| 5 or more Vehicles | 281 (16.8%) | 196 (12.7%) |
| Total | 1,670 (100.0%) | 1,538 (100.0%) |
Commute Time in Richmond County
The most frequently occuring commute durations in Richmond County are 15 to 19 minutes (521 commuters, 18.7%), 30 to 34 minutes (371 commuters, 13.3%), and 20 to 24 minutes (368 commuters, 13.2%).
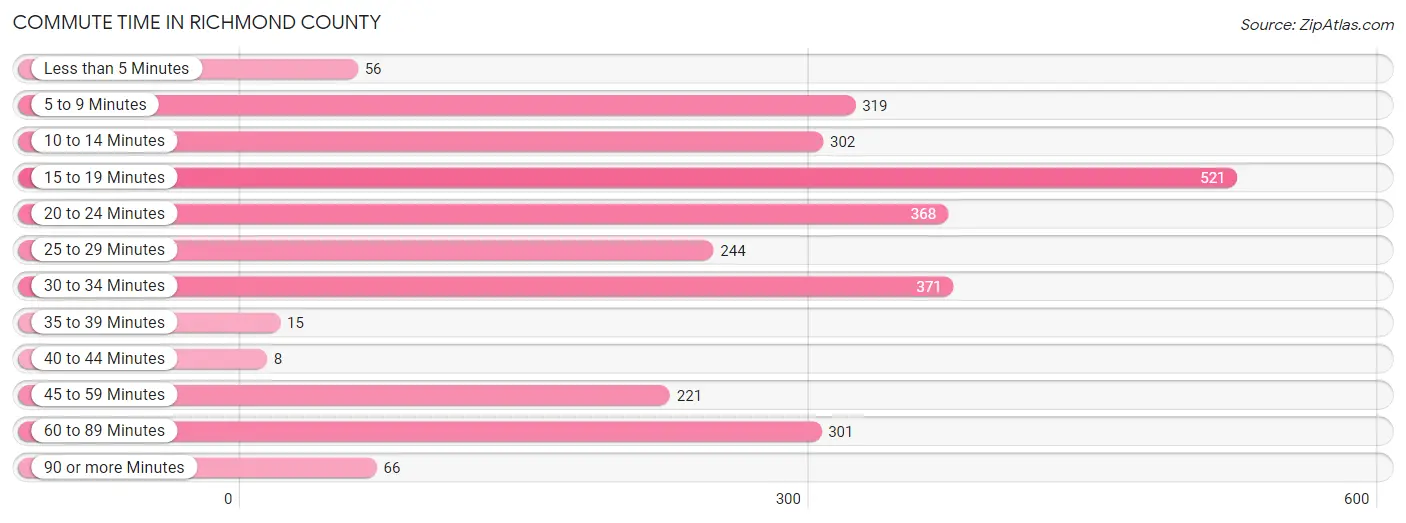
| Commute Time | # Commuters | % Commuters |
| Less than 5 Minutes | 56 | 2.0% |
| 5 to 9 Minutes | 319 | 11.4% |
| 10 to 14 Minutes | 302 | 10.8% |
| 15 to 19 Minutes | 521 | 18.7% |
| 20 to 24 Minutes | 368 | 13.2% |
| 25 to 29 Minutes | 244 | 8.7% |
| 30 to 34 Minutes | 371 | 13.3% |
| 35 to 39 Minutes | 15 | 0.5% |
| 40 to 44 Minutes | 8 | 0.3% |
| 45 to 59 Minutes | 221 | 7.9% |
| 60 to 89 Minutes | 301 | 10.8% |
| 90 or more Minutes | 66 | 2.4% |
Commute Time by Sex in Richmond County
The most common commute times in Richmond County are 30 to 34 minutes (284 commuters, 19.5%) for males and 15 to 19 minutes (299 commuters, 22.5%) for females.
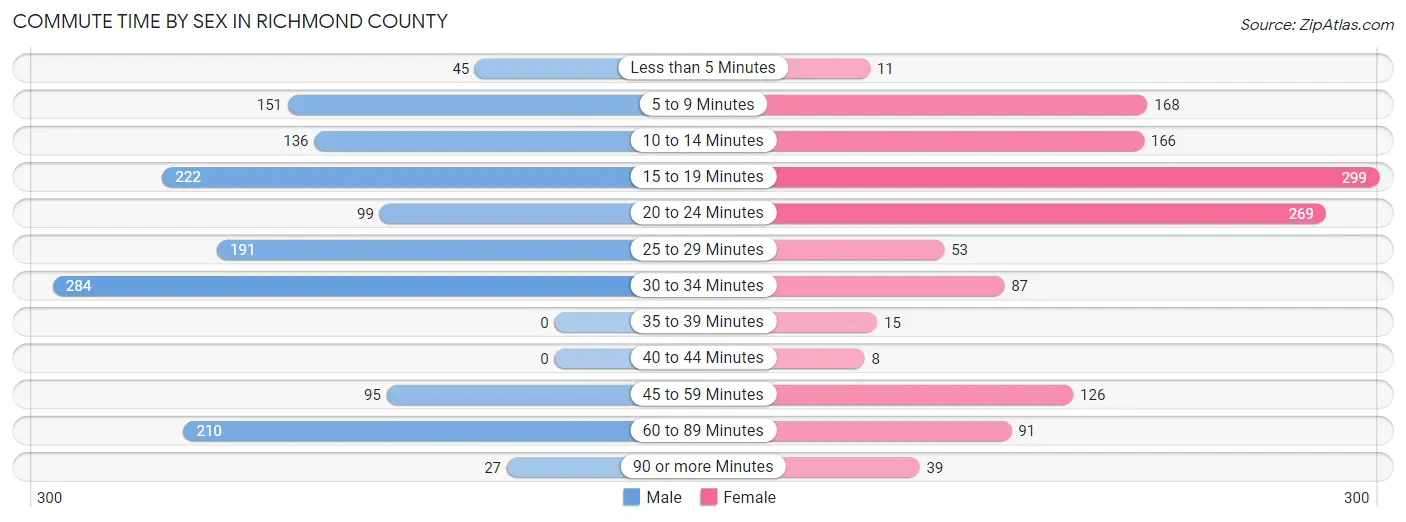
| Commute Time | Male | Female |
| Less than 5 Minutes | 45 (3.1%) | 11 (0.8%) |
| 5 to 9 Minutes | 151 (10.3%) | 168 (12.6%) |
| 10 to 14 Minutes | 136 (9.3%) | 166 (12.5%) |
| 15 to 19 Minutes | 222 (15.2%) | 299 (22.5%) |
| 20 to 24 Minutes | 99 (6.8%) | 269 (20.2%) |
| 25 to 29 Minutes | 191 (13.1%) | 53 (4.0%) |
| 30 to 34 Minutes | 284 (19.5%) | 87 (6.5%) |
| 35 to 39 Minutes | 0 (0.0%) | 15 (1.1%) |
| 40 to 44 Minutes | 0 (0.0%) | 8 (0.6%) |
| 45 to 59 Minutes | 95 (6.5%) | 126 (9.5%) |
| 60 to 89 Minutes | 210 (14.4%) | 91 (6.8%) |
| 90 or more Minutes | 27 (1.8%) | 39 (2.9%) |
Time of Departure to Work by Sex in Richmond County
The most frequent times of departure to work in Richmond County are 6:30 AM to 6:59 AM (472, 32.3%) for males and 8:00 AM to 8:29 AM (304, 22.8%) for females.
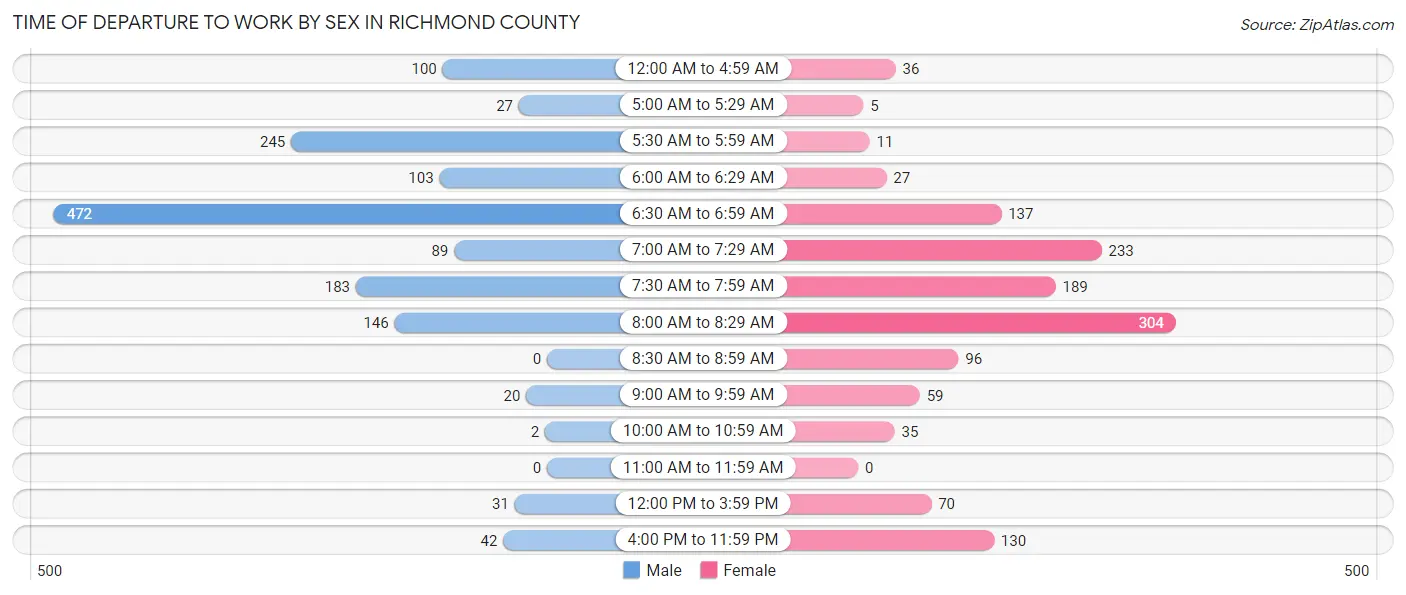
| Time of Departure | Male | Female |
| 12:00 AM to 4:59 AM | 100 (6.9%) | 36 (2.7%) |
| 5:00 AM to 5:29 AM | 27 (1.8%) | 5 (0.4%) |
| 5:30 AM to 5:59 AM | 245 (16.8%) | 11 (0.8%) |
| 6:00 AM to 6:29 AM | 103 (7.0%) | 27 (2.0%) |
| 6:30 AM to 6:59 AM | 472 (32.3%) | 137 (10.3%) |
| 7:00 AM to 7:29 AM | 89 (6.1%) | 233 (17.5%) |
| 7:30 AM to 7:59 AM | 183 (12.5%) | 189 (14.2%) |
| 8:00 AM to 8:29 AM | 146 (10.0%) | 304 (22.8%) |
| 8:30 AM to 8:59 AM | 0 (0.0%) | 96 (7.2%) |
| 9:00 AM to 9:59 AM | 20 (1.4%) | 59 (4.4%) |
| 10:00 AM to 10:59 AM | 2 (0.1%) | 35 (2.6%) |
| 11:00 AM to 11:59 AM | 0 (0.0%) | 0 (0.0%) |
| 12:00 PM to 3:59 PM | 31 (2.1%) | 70 (5.3%) |
| 4:00 PM to 11:59 PM | 42 (2.9%) | 130 (9.8%) |
| Total | 1,460 (100.0%) | 1,332 (100.0%) |
Housing Occupancy in Richmond County
Occupancy by Ownership in Richmond County
Of the total 2,834 dwellings in Richmond County, owner-occupied units account for 1,944 (68.6%), while renter-occupied units make up 890 (31.4%).
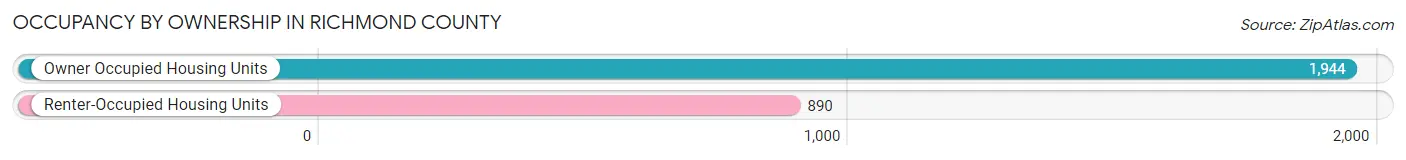
| Occupancy | # Housing Units | % Housing Units |
| Owner Occupied Housing Units | 1,944 | 68.6% |
| Renter-Occupied Housing Units | 890 | 31.4% |
| Total Occupied Housing Units | 2,834 | 100.0% |
Occupancy by Household Size in Richmond County
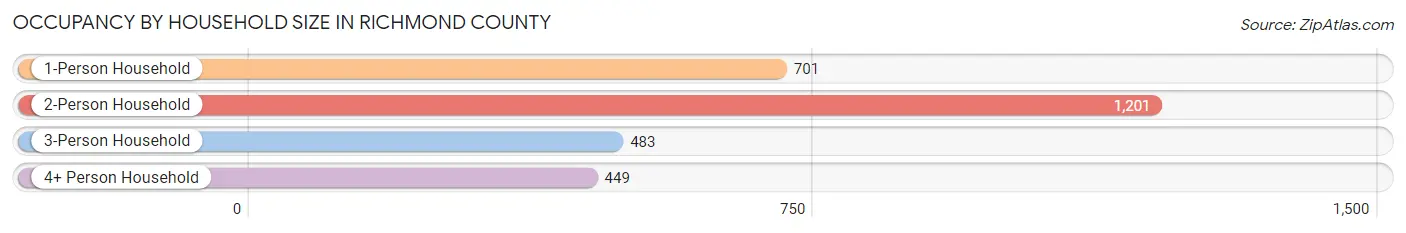
| Household Size | # Housing Units | % Housing Units |
| 1-Person Household | 701 | 24.7% |
| 2-Person Household | 1,201 | 42.4% |
| 3-Person Household | 483 | 17.0% |
| 4+ Person Household | 449 | 15.8% |
| Total Housing Units | 2,834 | 100.0% |
Occupancy by Ownership by Household Size in Richmond County
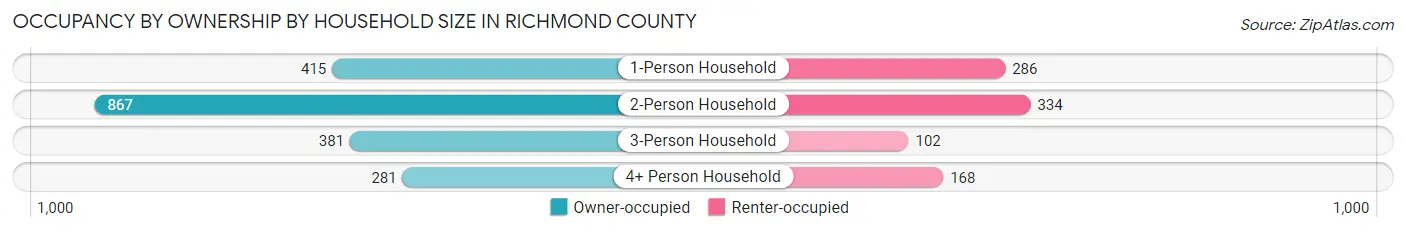
| Household Size | Owner-occupied | Renter-occupied |
| 1-Person Household | 415 (59.2%) | 286 (40.8%) |
| 2-Person Household | 867 (72.2%) | 334 (27.8%) |
| 3-Person Household | 381 (78.9%) | 102 (21.1%) |
| 4+ Person Household | 281 (62.6%) | 168 (37.4%) |
| Total Housing Units | 1,944 (68.6%) | 890 (31.4%) |
Occupancy by Educational Attainment in Richmond County
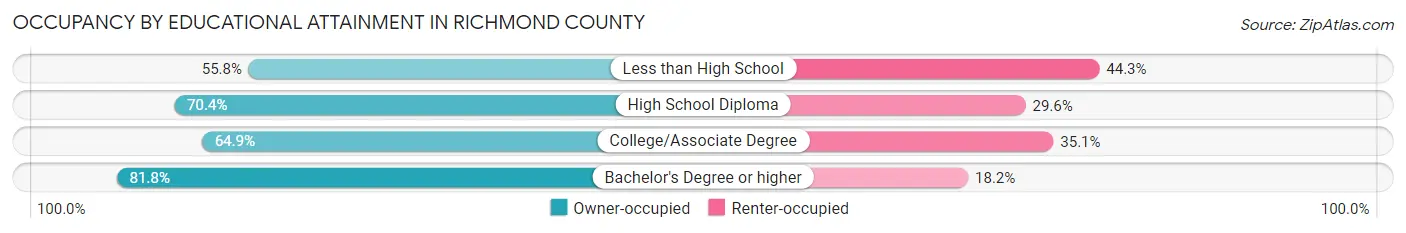
| Household Size | Owner-occupied | Renter-occupied |
| Less than High School | 315 (55.7%) | 250 (44.3%) |
| High School Diploma | 644 (70.4%) | 271 (29.6%) |
| College/Associate Degree | 469 (64.9%) | 254 (35.1%) |
| Bachelor's Degree or higher | 516 (81.8%) | 115 (18.2%) |
Occupancy by Age of Householder in Richmond County
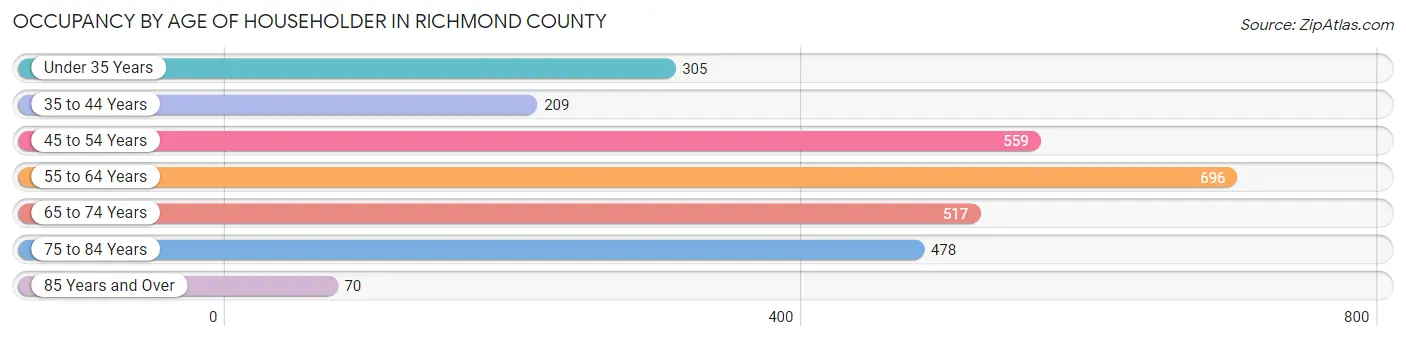
| Age Bracket | # Households | % Households |
| Under 35 Years | 305 | 10.8% |
| 35 to 44 Years | 209 | 7.4% |
| 45 to 54 Years | 559 | 19.7% |
| 55 to 64 Years | 696 | 24.6% |
| 65 to 74 Years | 517 | 18.2% |
| 75 to 84 Years | 478 | 16.9% |
| 85 Years and Over | 70 | 2.5% |
| Total | 2,834 | 100.0% |
Housing Finances in Richmond County
Median Income by Occupancy in Richmond County
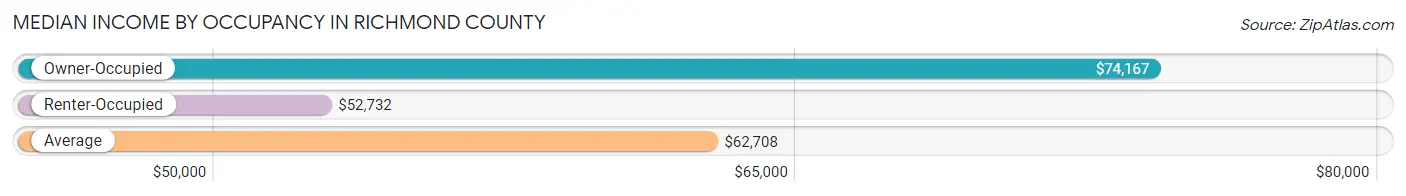
| Occupancy Type | # Households | Median Income |
| Owner-Occupied | 1,944 (68.6%) | $74,167 |
| Renter-Occupied | 890 (31.4%) | $52,732 |
| Average | 2,834 (100.0%) | $62,708 |
Occupancy by Householder Income Bracket in Richmond County
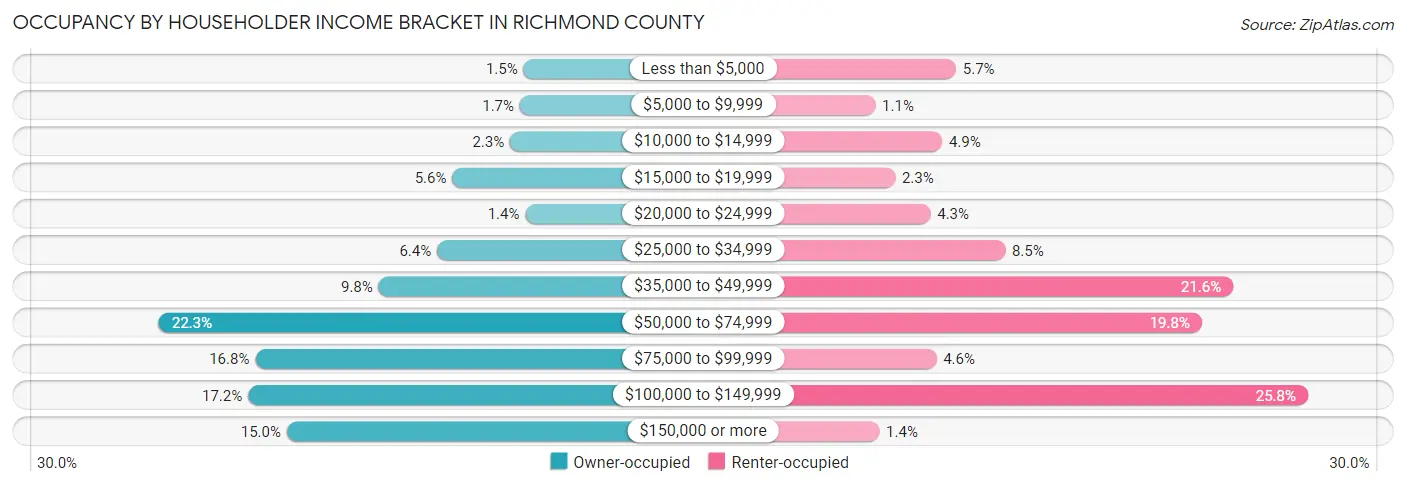
| Income Bracket | Owner-occupied | Renter-occupied |
| Less than $5,000 | 29 (1.5%) | 51 (5.7%) |
| $5,000 to $9,999 | 33 (1.7%) | 10 (1.1%) |
| $10,000 to $14,999 | 44 (2.3%) | 44 (4.9%) |
| $15,000 to $19,999 | 108 (5.6%) | 20 (2.2%) |
| $20,000 to $24,999 | 27 (1.4%) | 38 (4.3%) |
| $25,000 to $34,999 | 125 (6.4%) | 76 (8.5%) |
| $35,000 to $49,999 | 190 (9.8%) | 192 (21.6%) |
| $50,000 to $74,999 | 434 (22.3%) | 176 (19.8%) |
| $75,000 to $99,999 | 327 (16.8%) | 41 (4.6%) |
| $100,000 to $149,999 | 335 (17.2%) | 230 (25.8%) |
| $150,000 or more | 292 (15.0%) | 12 (1.3%) |
| Total | 1,944 (100.0%) | 890 (100.0%) |
Monthly Housing Cost Tiers in Richmond County
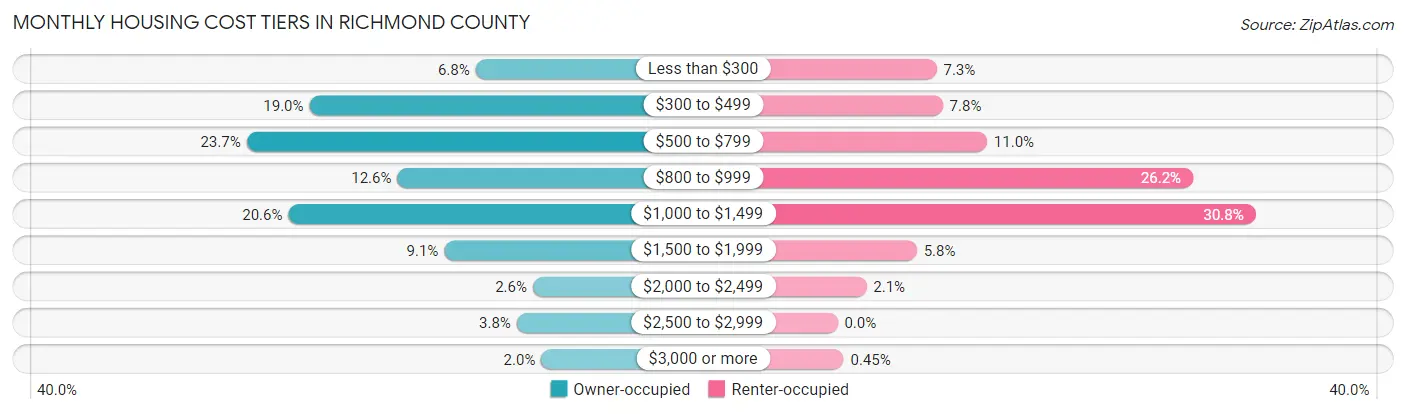
| Monthly Cost | Owner-occupied | Renter-occupied |
| Less than $300 | 132 (6.8%) | 65 (7.3%) |
| $300 to $499 | 370 (19.0%) | 69 (7.7%) |
| $500 to $799 | 460 (23.7%) | 98 (11.0%) |
| $800 to $999 | 244 (12.6%) | 233 (26.2%) |
| $1,000 to $1,499 | 400 (20.6%) | 274 (30.8%) |
| $1,500 to $1,999 | 177 (9.1%) | 52 (5.8%) |
| $2,000 to $2,499 | 50 (2.6%) | 19 (2.1%) |
| $2,500 to $2,999 | 73 (3.8%) | 0 (0.0%) |
| $3,000 or more | 38 (1.9%) | 4 (0.4%) |
| Total | 1,944 (100.0%) | 890 (100.0%) |
Physical Housing Characteristics in Richmond County
Housing Structures in Richmond County
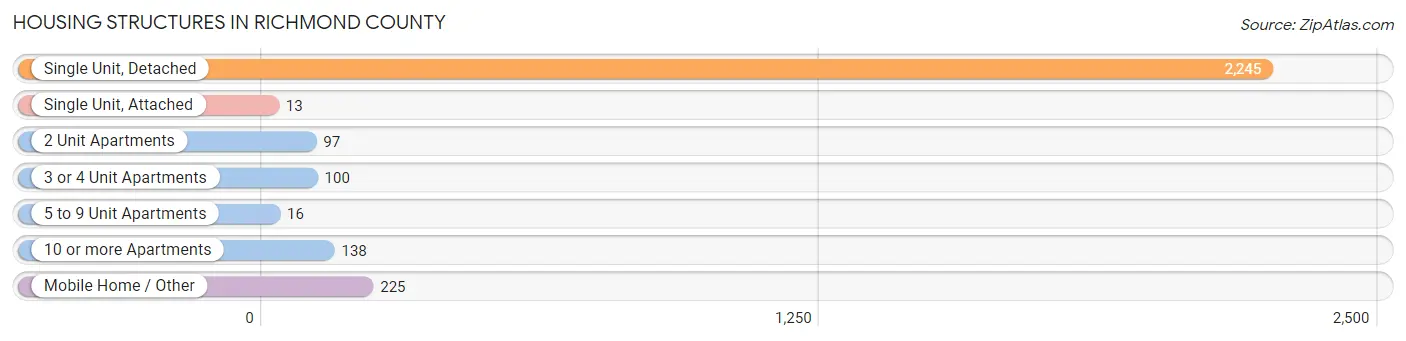
| Structure Type | # Housing Units | % Housing Units |
| Single Unit, Detached | 2,245 | 79.2% |
| Single Unit, Attached | 13 | 0.5% |
| 2 Unit Apartments | 97 | 3.4% |
| 3 or 4 Unit Apartments | 100 | 3.5% |
| 5 to 9 Unit Apartments | 16 | 0.6% |
| 10 or more Apartments | 138 | 4.9% |
| Mobile Home / Other | 225 | 7.9% |
| Total | 2,834 | 100.0% |
Housing Structures by Occupancy in Richmond County
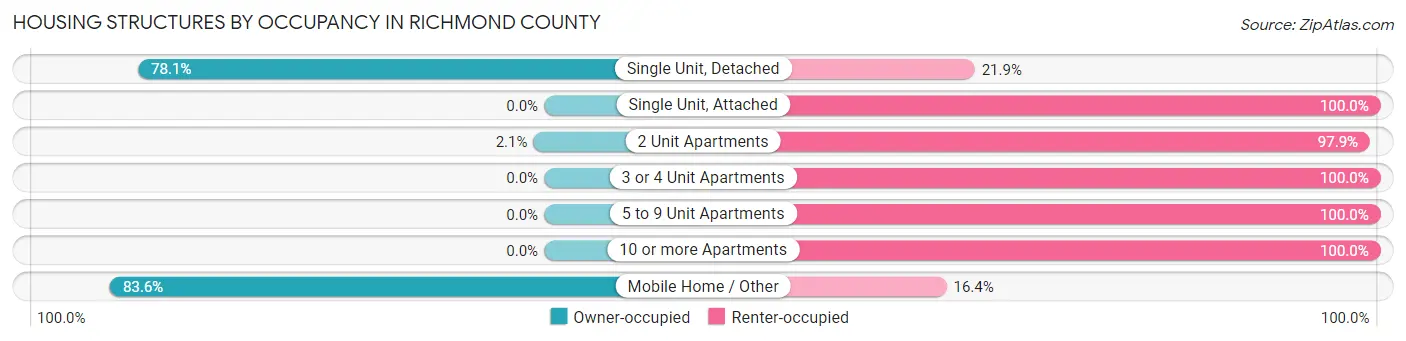
| Structure Type | Owner-occupied | Renter-occupied |
| Single Unit, Detached | 1,754 (78.1%) | 491 (21.9%) |
| Single Unit, Attached | 0 (0.0%) | 13 (100.0%) |
| 2 Unit Apartments | 2 (2.1%) | 95 (97.9%) |
| 3 or 4 Unit Apartments | 0 (0.0%) | 100 (100.0%) |
| 5 to 9 Unit Apartments | 0 (0.0%) | 16 (100.0%) |
| 10 or more Apartments | 0 (0.0%) | 138 (100.0%) |
| Mobile Home / Other | 188 (83.6%) | 37 (16.4%) |
| Total | 1,944 (68.6%) | 890 (31.4%) |
Housing Structures by Number of Rooms in Richmond County
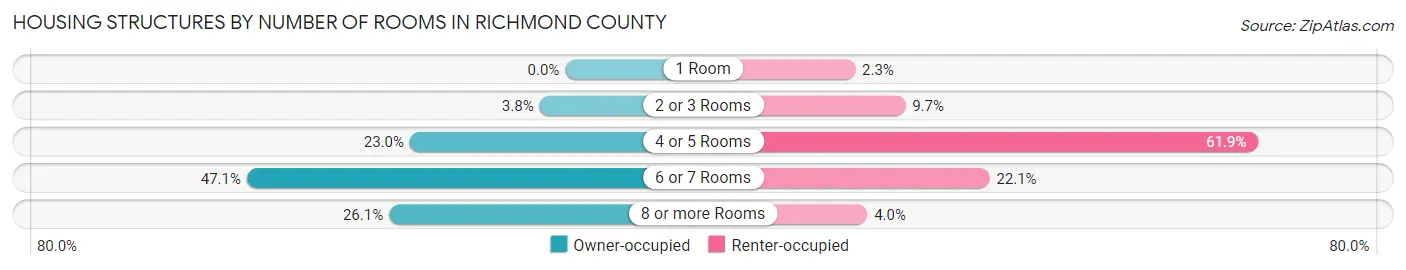
| Number of Rooms | Owner-occupied | Renter-occupied |
| 1 Room | 0 (0.0%) | 20 (2.2%) |
| 2 or 3 Rooms | 74 (3.8%) | 86 (9.7%) |
| 4 or 5 Rooms | 447 (23.0%) | 551 (61.9%) |
| 6 or 7 Rooms | 916 (47.1%) | 197 (22.1%) |
| 8 or more Rooms | 507 (26.1%) | 36 (4.0%) |
| Total | 1,944 (100.0%) | 890 (100.0%) |
Housing Structure by Heating Type in Richmond County
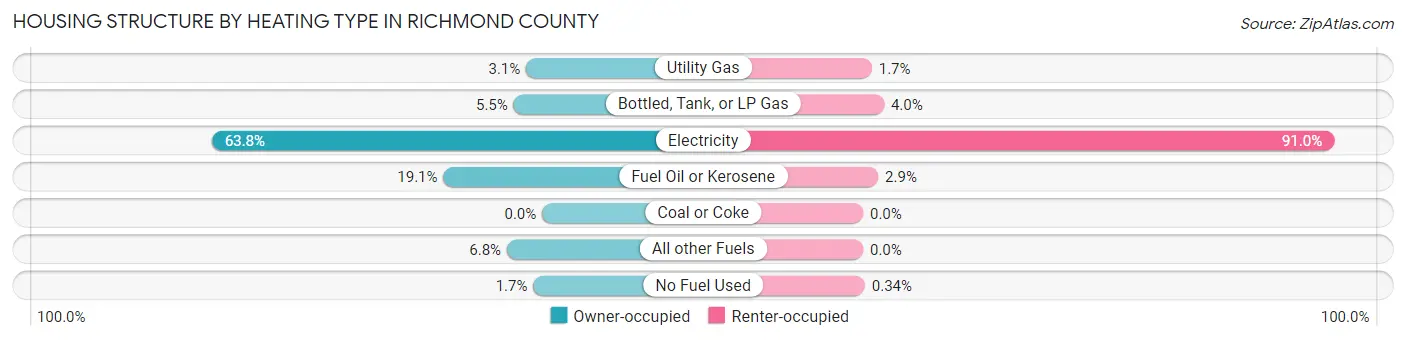
| Heating Type | Owner-occupied | Renter-occupied |
| Utility Gas | 60 (3.1%) | 15 (1.7%) |
| Bottled, Tank, or LP Gas | 107 (5.5%) | 36 (4.0%) |
| Electricity | 1,241 (63.8%) | 810 (91.0%) |
| Fuel Oil or Kerosene | 371 (19.1%) | 26 (2.9%) |
| Coal or Coke | 0 (0.0%) | 0 (0.0%) |
| All other Fuels | 132 (6.8%) | 0 (0.0%) |
| No Fuel Used | 33 (1.7%) | 3 (0.3%) |
| Total | 1,944 (100.0%) | 890 (100.0%) |
Household Vehicle Usage in Richmond County
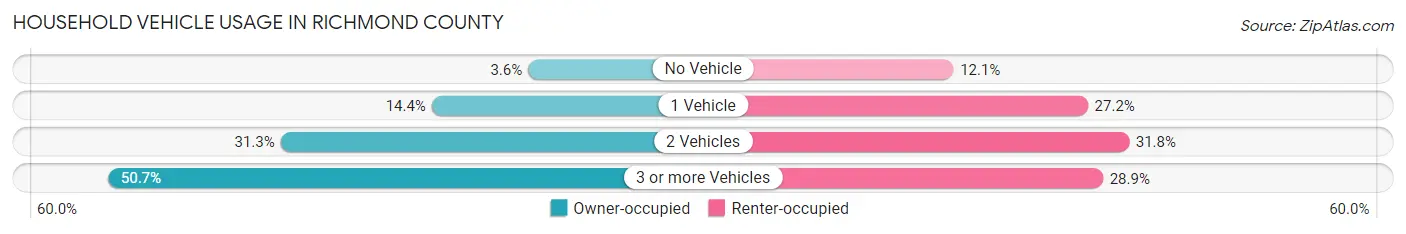
| Vehicles per Household | Owner-occupied | Renter-occupied |
| No Vehicle | 70 (3.6%) | 108 (12.1%) |
| 1 Vehicle | 280 (14.4%) | 242 (27.2%) |
| 2 Vehicles | 609 (31.3%) | 283 (31.8%) |
| 3 or more Vehicles | 985 (50.7%) | 257 (28.9%) |
| Total | 1,944 (100.0%) | 890 (100.0%) |
Real Estate & Mortgages in Richmond County
Real Estate and Mortgage Overview in Richmond County
| Characteristic | Without Mortgage | With Mortgage |
| Housing Units | 967 | 977 |
| Median Property Value | $204,600 | $223,100 |
| Median Household Income | $59,769 | $202 |
| Monthly Housing Costs | $492 | $38 |
| Real Estate Taxes | $1,256 | $0 |
Property Value by Mortgage Status in Richmond County
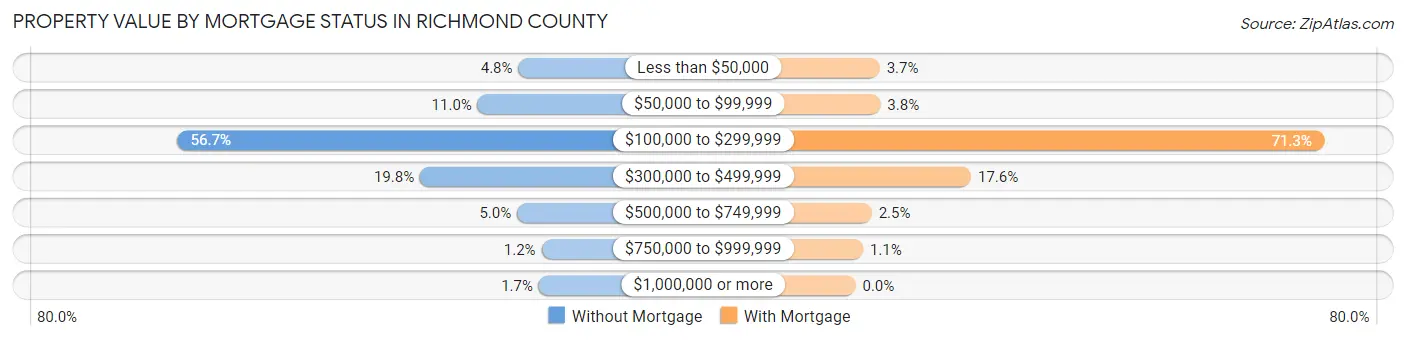
| Property Value | Without Mortgage | With Mortgage |
| Less than $50,000 | 46 (4.8%) | 36 (3.7%) |
| $50,000 to $99,999 | 106 (11.0%) | 37 (3.8%) |
| $100,000 to $299,999 | 548 (56.7%) | 697 (71.3%) |
| $300,000 to $499,999 | 191 (19.8%) | 172 (17.6%) |
| $500,000 to $749,999 | 48 (5.0%) | 24 (2.5%) |
| $750,000 to $999,999 | 12 (1.2%) | 11 (1.1%) |
| $1,000,000 or more | 16 (1.7%) | 0 (0.0%) |
| Total | 967 (100.0%) | 977 (100.0%) |
Household Income by Mortgage Status in Richmond County
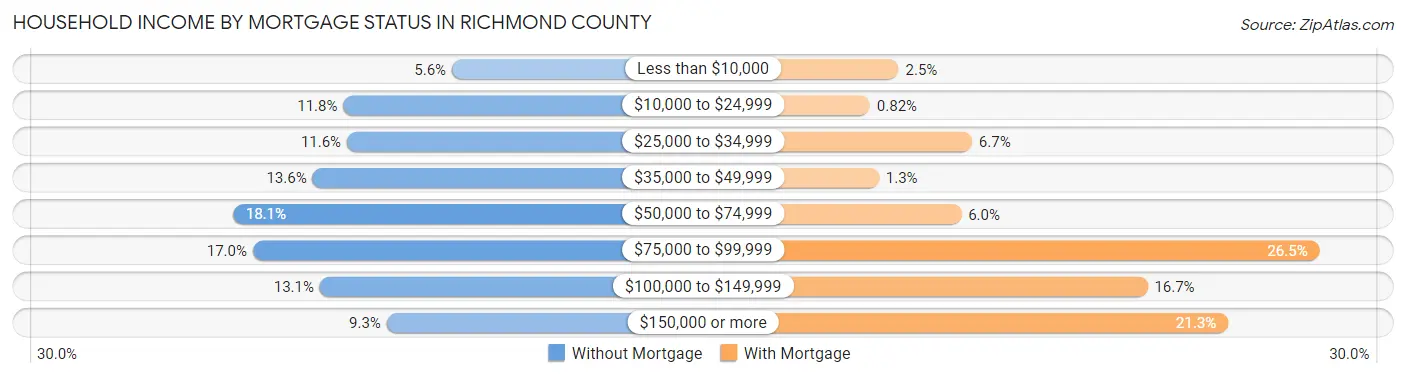
| Household Income | Without Mortgage | With Mortgage |
| Less than $10,000 | 54 (5.6%) | 24 (2.5%) |
| $10,000 to $24,999 | 114 (11.8%) | 8 (0.8%) |
| $25,000 to $34,999 | 112 (11.6%) | 65 (6.7%) |
| $35,000 to $49,999 | 131 (13.6%) | 13 (1.3%) |
| $50,000 to $74,999 | 175 (18.1%) | 59 (6.0%) |
| $75,000 to $99,999 | 164 (17.0%) | 259 (26.5%) |
| $100,000 to $149,999 | 127 (13.1%) | 163 (16.7%) |
| $150,000 or more | 90 (9.3%) | 208 (21.3%) |
| Total | 967 (100.0%) | 977 (100.0%) |
Property Value to Household Income Ratio in Richmond County
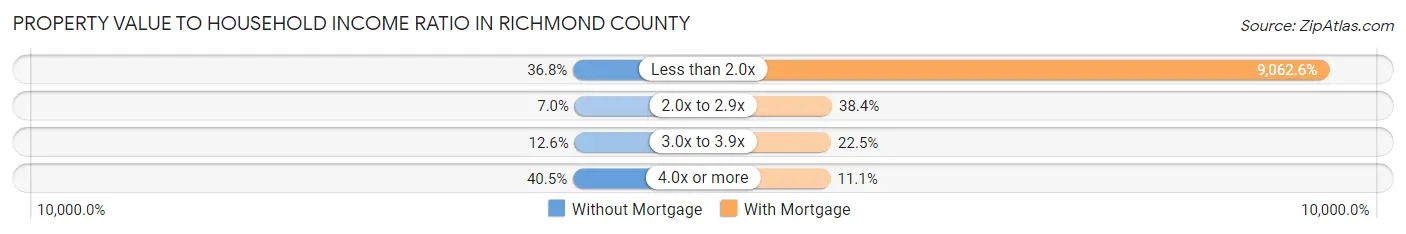
| Value-to-Income Ratio | Without Mortgage | With Mortgage |
| Less than 2.0x | 356 (36.8%) | 88,542 (9,062.6%) |
| 2.0x to 2.9x | 68 (7.0%) | 375 (38.4%) |
| 3.0x to 3.9x | 122 (12.6%) | 220 (22.5%) |
| 4.0x or more | 392 (40.5%) | 108 (11.1%) |
| Total | 967 (100.0%) | 977 (100.0%) |
Real Estate Taxes by Mortgage Status in Richmond County
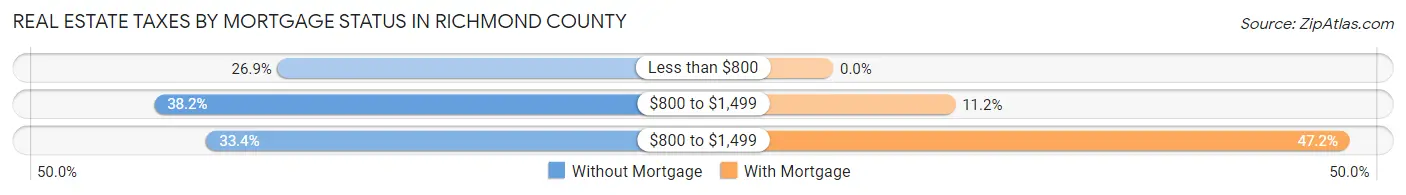
| Property Taxes | Without Mortgage | With Mortgage |
| Less than $800 | 260 (26.9%) | 0 (0.0%) |
| $800 to $1,499 | 369 (38.2%) | 109 (11.2%) |
| $800 to $1,499 | 323 (33.4%) | 461 (47.2%) |
| Total | 967 (100.0%) | 977 (100.0%) |
Health & Disability in Richmond County
Health Insurance Coverage by Age in Richmond County
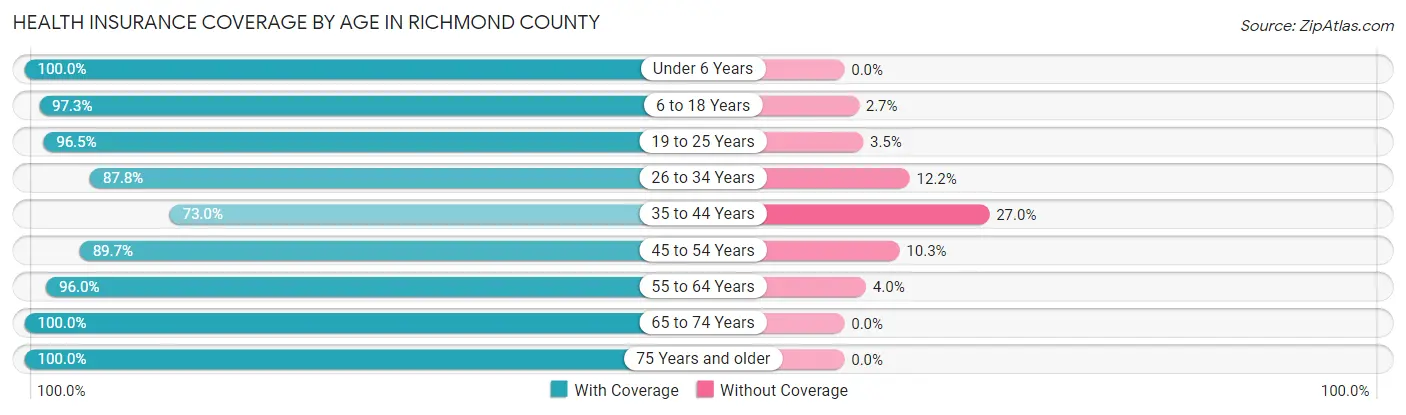
| Age Bracket | With Coverage | Without Coverage |
| Under 6 Years | 556 (100.0%) | 0 (0.0%) |
| 6 to 18 Years | 1,118 (97.3%) | 31 (2.7%) |
| 19 to 25 Years | 496 (96.5%) | 18 (3.5%) |
| 26 to 34 Years | 483 (87.8%) | 67 (12.2%) |
| 35 to 44 Years | 494 (73.0%) | 183 (27.0%) |
| 45 to 54 Years | 960 (89.7%) | 110 (10.3%) |
| 55 to 64 Years | 1,167 (96.0%) | 49 (4.0%) |
| 65 to 74 Years | 849 (100.0%) | 0 (0.0%) |
| 75 Years and older | 780 (100.0%) | 0 (0.0%) |
| Total | 6,903 (93.8%) | 458 (6.2%) |
Health Insurance Coverage by Citizenship Status in Richmond County
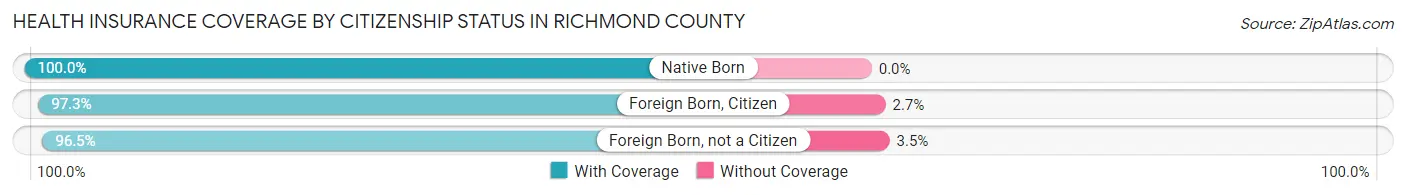
| Citizenship Status | With Coverage | Without Coverage |
| Native Born | 556 (100.0%) | 0 (0.0%) |
| Foreign Born, Citizen | 1,118 (97.3%) | 31 (2.7%) |
| Foreign Born, not a Citizen | 496 (96.5%) | 18 (3.5%) |
Health Insurance Coverage by Household Income in Richmond County
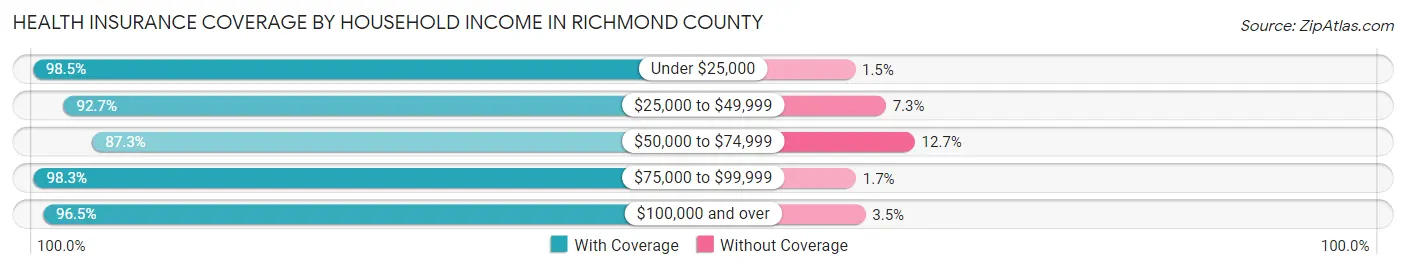
| Household Income | With Coverage | Without Coverage |
| Under $25,000 | 510 (98.5%) | 8 (1.5%) |
| $25,000 to $49,999 | 1,537 (92.7%) | 121 (7.3%) |
| $50,000 to $74,999 | 1,552 (87.3%) | 226 (12.7%) |
| $75,000 to $99,999 | 924 (98.3%) | 16 (1.7%) |
| $100,000 and over | 2,368 (96.5%) | 85 (3.5%) |
Public vs Private Health Insurance Coverage by Age in Richmond County
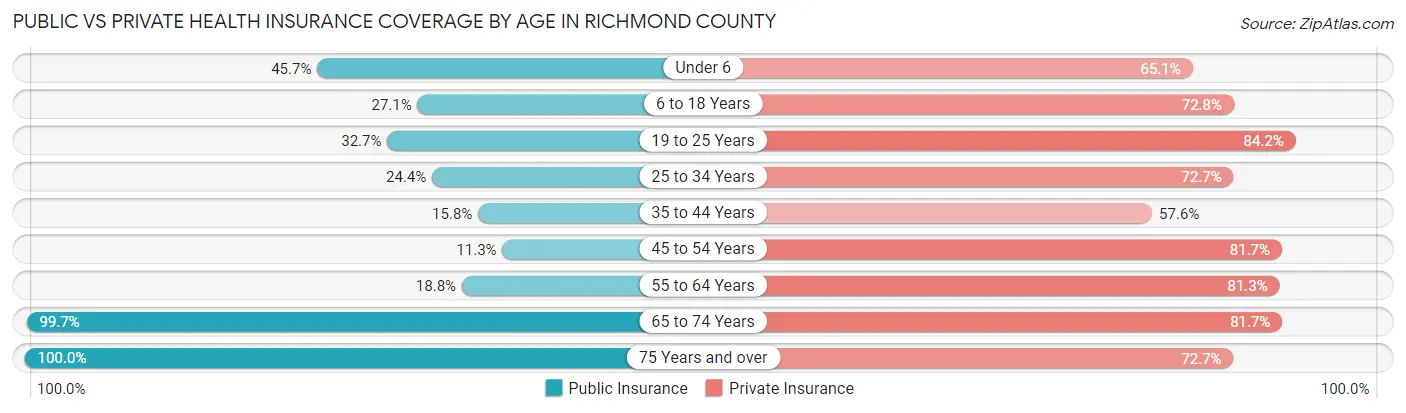
| Age Bracket | Public Insurance | Private Insurance |
| Under 6 | 254 (45.7%) | 362 (65.1%) |
| 6 to 18 Years | 311 (27.1%) | 836 (72.8%) |
| 19 to 25 Years | 168 (32.7%) | 433 (84.2%) |
| 25 to 34 Years | 134 (24.4%) | 400 (72.7%) |
| 35 to 44 Years | 107 (15.8%) | 390 (57.6%) |
| 45 to 54 Years | 121 (11.3%) | 874 (81.7%) |
| 55 to 64 Years | 229 (18.8%) | 988 (81.2%) |
| 65 to 74 Years | 846 (99.7%) | 694 (81.7%) |
| 75 Years and over | 780 (100.0%) | 567 (72.7%) |
| Total | 2,950 (40.1%) | 5,544 (75.3%) |
Disability Status by Sex by Age in Richmond County
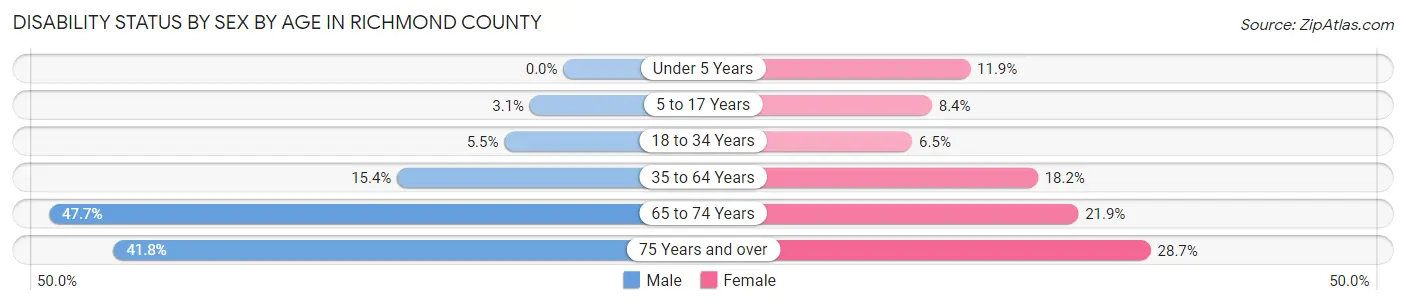
| Age Bracket | Male | Female |
| Under 5 Years | 0 (0.0%) | 33 (11.9%) |
| 5 to 17 Years | 18 (3.1%) | 39 (8.4%) |
| 18 to 34 Years | 35 (5.5%) | 38 (6.5%) |
| 35 to 64 Years | 227 (15.4%) | 271 (18.2%) |
| 65 to 74 Years | 179 (47.7%) | 104 (21.9%) |
| 75 Years and over | 129 (41.7%) | 135 (28.7%) |
Disability Class by Sex by Age in Richmond County
Disability Class: Hearing Difficulty
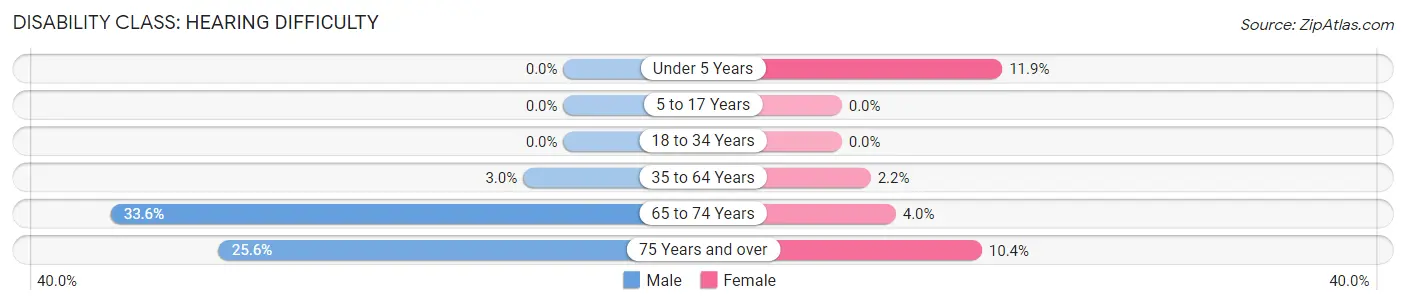
| Age Bracket | Male | Female |
| Under 5 Years | 0 (0.0%) | 33 (11.9%) |
| 5 to 17 Years | 0 (0.0%) | 0 (0.0%) |
| 18 to 34 Years | 0 (0.0%) | 0 (0.0%) |
| 35 to 64 Years | 44 (3.0%) | 32 (2.1%) |
| 65 to 74 Years | 126 (33.6%) | 19 (4.0%) |
| 75 Years and over | 79 (25.6%) | 49 (10.4%) |
Disability Class: Vision Difficulty
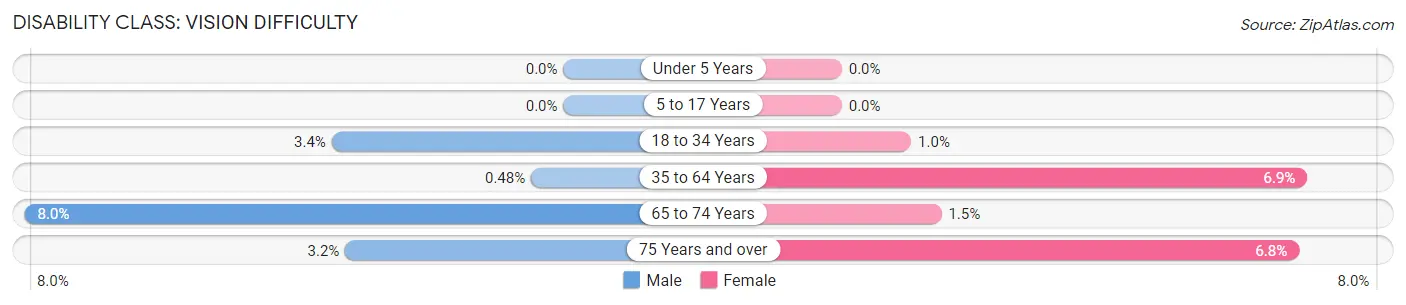
| Age Bracket | Male | Female |
| Under 5 Years | 0 (0.0%) | 0 (0.0%) |
| 5 to 17 Years | 0 (0.0%) | 0 (0.0%) |
| 18 to 34 Years | 22 (3.4%) | 6 (1.0%) |
| 35 to 64 Years | 7 (0.5%) | 103 (6.9%) |
| 65 to 74 Years | 30 (8.0%) | 7 (1.5%) |
| 75 Years and over | 10 (3.2%) | 32 (6.8%) |
Disability Class: Cognitive Difficulty
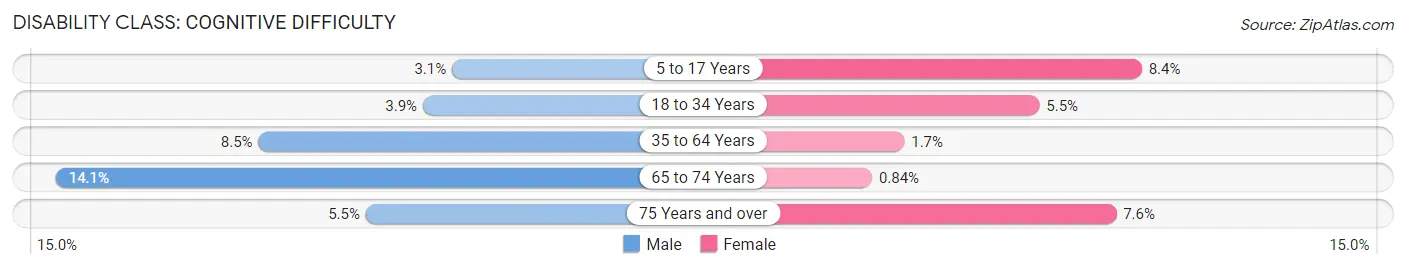
| Age Bracket | Male | Female |
| 5 to 17 Years | 18 (3.1%) | 39 (8.4%) |
| 18 to 34 Years | 25 (3.9%) | 32 (5.5%) |
| 35 to 64 Years | 125 (8.5%) | 26 (1.7%) |
| 65 to 74 Years | 53 (14.1%) | 4 (0.8%) |
| 75 Years and over | 17 (5.5%) | 36 (7.6%) |
Disability Class: Ambulatory Difficulty
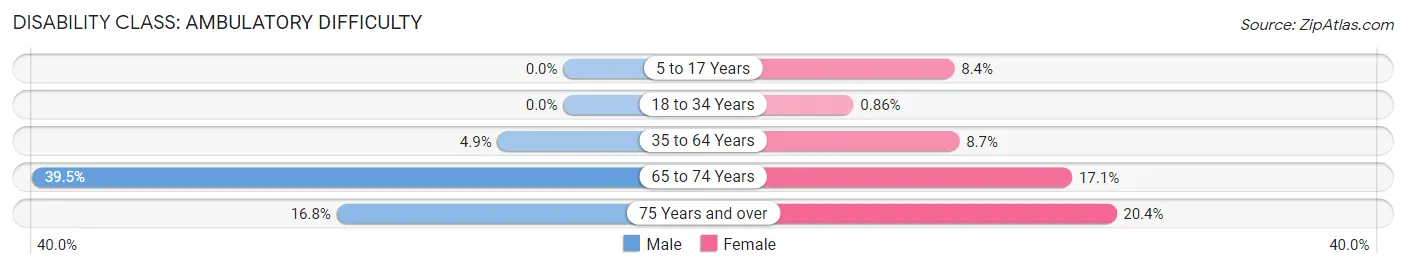
| Age Bracket | Male | Female |
| 5 to 17 Years | 0 (0.0%) | 39 (8.4%) |
| 18 to 34 Years | 0 (0.0%) | 5 (0.9%) |
| 35 to 64 Years | 72 (4.9%) | 130 (8.7%) |
| 65 to 74 Years | 148 (39.5%) | 81 (17.1%) |
| 75 Years and over | 52 (16.8%) | 96 (20.4%) |
Disability Class: Self-Care Difficulty
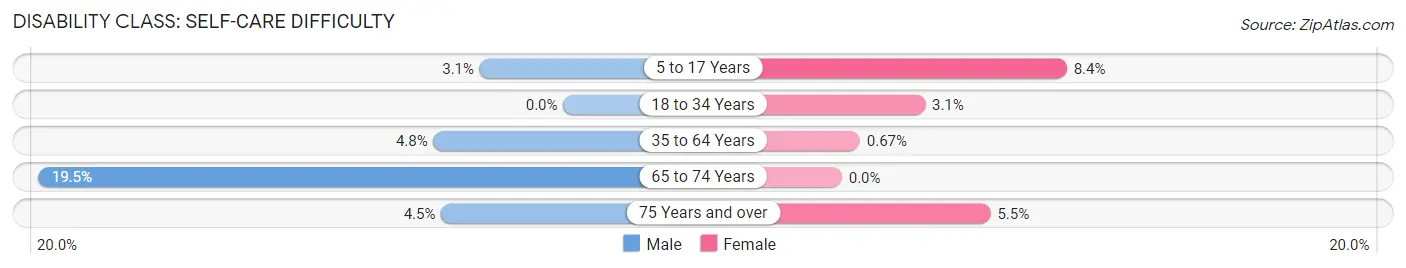
| Age Bracket | Male | Female |
| 5 to 17 Years | 18 (3.1%) | 39 (8.4%) |
| 18 to 34 Years | 0 (0.0%) | 18 (3.1%) |
| 35 to 64 Years | 71 (4.8%) | 10 (0.7%) |
| 65 to 74 Years | 73 (19.5%) | 0 (0.0%) |
| 75 Years and over | 14 (4.5%) | 26 (5.5%) |
Technology Access in Richmond County
Computing Device Access in Richmond County
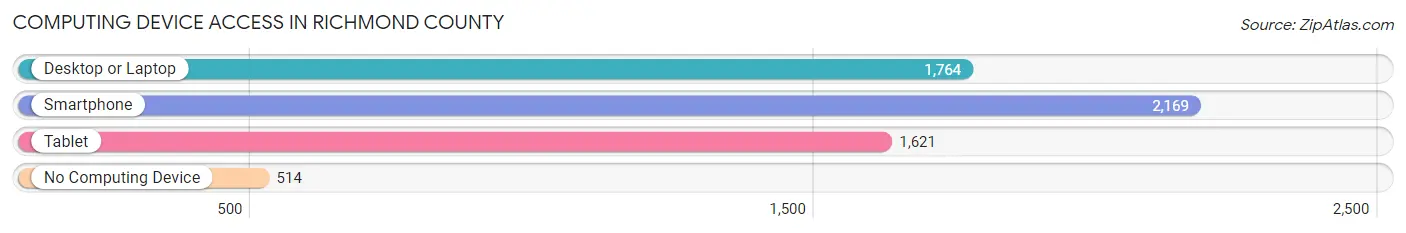
| Device Type | # Households | % Households |
| Desktop or Laptop | 1,764 | 62.2% |
| Smartphone | 2,169 | 76.5% |
| Tablet | 1,621 | 57.2% |
| No Computing Device | 514 | 18.1% |
| Total | 2,834 | 100.0% |
Internet Access in Richmond County
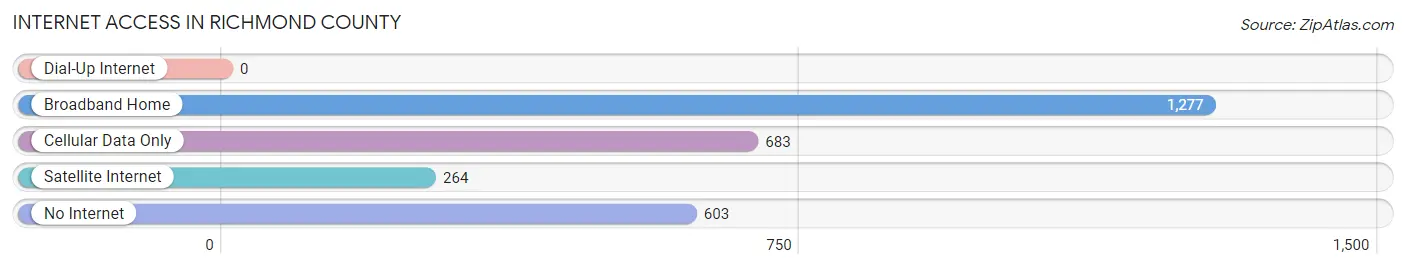
| Internet Type | # Households | % Households |
| Dial-Up Internet | 0 | 0.0% |
| Broadband Home | 1,277 | 45.1% |
| Cellular Data Only | 683 | 24.1% |
| Satellite Internet | 264 | 9.3% |
| No Internet | 603 | 21.3% |
| Total | 2,834 | 100.0% |
Richmond County Summary
Richmond County, Virginia is located in the Northern Neck region of the Commonwealth of Virginia. It is bordered by the Rappahannock River to the north, the Potomac River to the east, and the Chesapeake Bay to the south. The county seat is Warsaw, and the county is home to approximately 9,000 people.
History
Richmond County was established in 1692, and was named for the Duke of Richmond, who was a member of the British Royal Family. The county was originally part of Westmoreland County, and was later divided into Richmond and Westmoreland counties. The county was home to several Native American tribes, including the Rappahannock, Nanzatico, and Piscataway.
The county was home to several prominent families, including the Washington family, who owned a large plantation in the county. George Washington was born in the county in 1732, and his family owned a large portion of the county. The county was also home to the Lee family, who owned a large plantation in the county. Robert E. Lee was born in the county in 1807.
The county was also home to several prominent Civil War battles, including the Battle of Fredericksburg, the Battle of Chancellorsville, and the Battle of the Wilderness.
Geography
Richmond County is located in the Northern Neck region of Virginia. It is bordered by the Rappahannock River to the north, the Potomac River to the east, and the Chesapeake Bay to the south. The county is mostly rural, with rolling hills and forests. The county is home to several state parks, including the Rappahannock River Valley National Wildlife Refuge, the George Washington Birthplace National Monument, and the Chippokes Plantation State Park.
Economy
Richmond County is largely rural, and the economy is largely based on agriculture. The county is home to several large farms, and the main crops grown in the county are corn, soybeans, wheat, and hay. The county is also home to several wineries, and the county is home to the Rappahannock River Valley AVA, which is a designated American Viticultural Area.
The county is also home to several manufacturing companies, including a paper mill, a furniture factory, and a plastics factory. The county is also home to several small businesses, including restaurants, shops, and other services.
Demographics
As of the 2010 census, the population of Richmond County was 8,717. The population is largely white (87.3%), with African Americans making up 8.2% of the population, and Hispanics making up 2.2% of the population. The median household income in the county is $45,813, and the median home value is $179,400. The county is home to several colleges and universities, including the University of Mary Washington, Rappahannock Community College, and Germanna Community College.
Common Questions
What is Per Capita Income in Richmond County?
Per Capita income in Richmond County is $27,620.
What is the Median Family Income in Richmond County?
Median Family Income in Richmond County is $81,125.
What is the Median Household income in Richmond County?
Median Household Income in Richmond County is $62,708.
What is Income or Wage Gap in Richmond County?
Income or Wage Gap in Richmond County is 20.5%.
Women in Richmond County earn 79.5 cents for every dollar earned by a man.
What is Inequality or Gini Index in Richmond County?
Inequality or Gini Index in Richmond County is 0.40.
What is the Total Population of Richmond County?
Total Population of Richmond County is 8,968.
What is the Total Male Population of Richmond County?
Total Male Population of Richmond County is 5,035.
What is the Total Female Population of Richmond County?
Total Female Population of Richmond County is 3,933.
What is the Ratio of Males per 100 Females in Richmond County?
There are 128.02 Males per 100 Females in Richmond County.
What is the Ratio of Females per 100 Males in Richmond County?
There are 78.11 Females per 100 Males in Richmond County.
What is the Median Population Age in Richmond County?
Median Population Age in Richmond County is 46.1 Years.
What is the Average Family Size in Richmond County
Average Family Size in Richmond County is 3.2 People.
What is the Average Household Size in Richmond County
Average Household Size in Richmond County is 2.6 People.
How Large is the Labor Force in Richmond County?
There are 3,377 People in the Labor Forcein in Richmond County.
What is the Percentage of People in the Labor Force in Richmond County?
44.8% of People are in the Labor Force in Richmond County.
What is the Unemployment Rate in Richmond County?
Unemployment Rate in Richmond County is 4.0%.