Richmond city, VA Map & Demographics
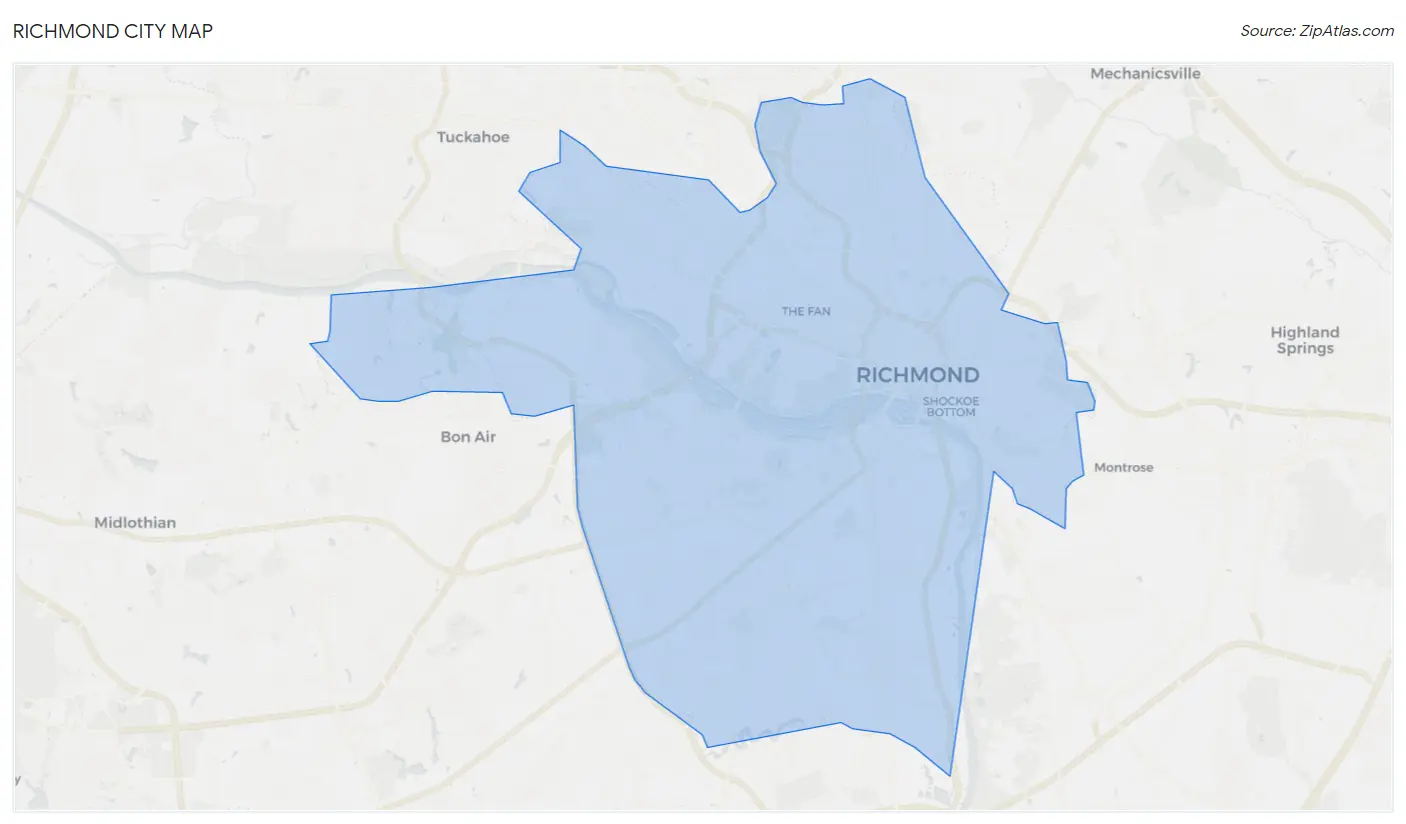
Richmond city Map
Richmond city Overview
$42,132
PER CAPITA INCOME
$79,453
AVG FAMILY INCOME
$59,606
AVG HOUSEHOLD INCOME
16.5%
WAGE / INCOME GAP [ % ]
83.5¢/ $1
WAGE / INCOME GAP [ $ ]
$12,285
FAMILY INCOME DEFICIT
0.52
INEQUALITY / GINI INDEX
227,171
TOTAL POPULATION
108,032
MALE POPULATION
119,139
FEMALE POPULATION
90.68
MALES / 100 FEMALES
110.28
FEMALES / 100 MALES
34.5
MEDIAN AGE
3.0
AVG FAMILY SIZE
2.1
AVG HOUSEHOLD SIZE
130,455
LABOR FORCE [ PEOPLE ]
68.0%
PERCENT IN LABOR FORCE
6.1%
UNEMPLOYMENT RATE
Richmond city Area Codes
Income in Richmond city
Income Overview in Richmond city
Per Capita Income in Richmond city is $42,132, while median incomes of families and households are $79,453 and $59,606 respectively.
| Characteristic | Number | Measure |
| Per Capita Income | 227,171 | $42,132 |
| Median Family Income | 44,283 | $79,453 |
| Mean Family Income | 44,283 | $122,276 |
| Median Household Income | 101,201 | $59,606 |
| Mean Household Income | 101,201 | $90,543 |
| Income Deficit | 44,283 | $12,285 |
| Wage / Income Gap (%) | 227,171 | 16.54% |
| Wage / Income Gap ($) | 227,171 | 83.46¢ per $1 |
| Gini / Inequality Index | 227,171 | 0.52 |
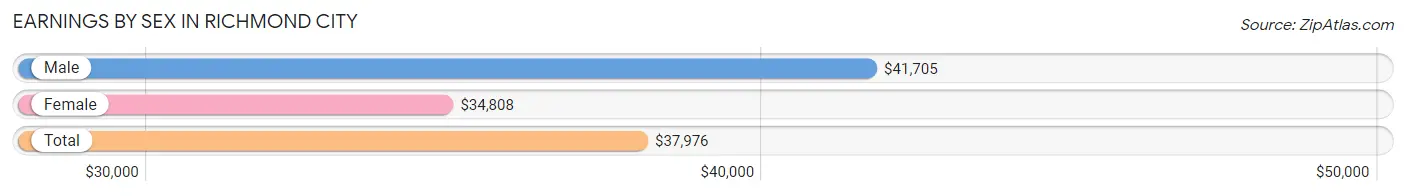
Earnings by Sex in Richmond city
Average Earnings in Richmond city are $37,976, $41,705 for men and $34,808 for women, a difference of 16.5%.
| Sex | Number | Average Earnings |
| Male | 66,281 (48.4%) | $41,705 |
| Female | 70,623 (51.6%) | $34,808 |
| Total | 136,904 (100.0%) | $37,976 |
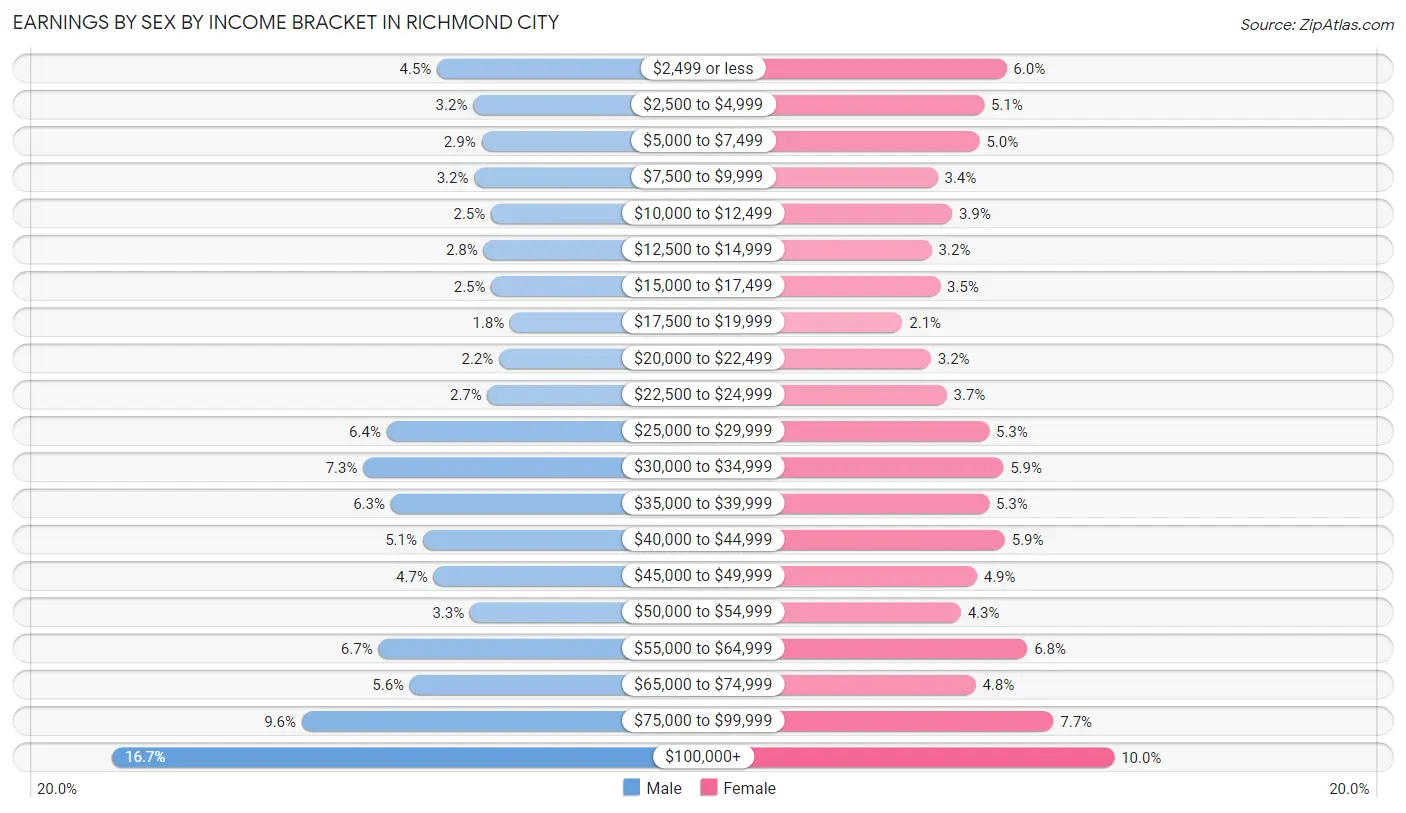
Earnings by Sex by Income Bracket in Richmond city
The most common earnings brackets in Richmond city are $100,000+ for men (11,084 | 16.7%) and $100,000+ for women (7,075 | 10.0%).
| Income | Male | Female |
| $2,499 or less | 3,012 (4.5%) | 4,224 (6.0%) |
| $2,500 to $4,999 | 2,112 (3.2%) | 3,632 (5.1%) |
| $5,000 to $7,499 | 1,911 (2.9%) | 3,512 (5.0%) |
| $7,500 to $9,999 | 2,091 (3.2%) | 2,402 (3.4%) |
| $10,000 to $12,499 | 1,672 (2.5%) | 2,785 (3.9%) |
| $12,500 to $14,999 | 1,855 (2.8%) | 2,249 (3.2%) |
| $15,000 to $17,499 | 1,661 (2.5%) | 2,465 (3.5%) |
| $17,500 to $19,999 | 1,203 (1.8%) | 1,466 (2.1%) |
| $20,000 to $22,499 | 1,473 (2.2%) | 2,227 (3.2%) |
| $22,500 to $24,999 | 1,755 (2.6%) | 2,641 (3.7%) |
| $25,000 to $29,999 | 4,260 (6.4%) | 3,762 (5.3%) |
| $30,000 to $34,999 | 4,848 (7.3%) | 4,137 (5.9%) |
| $35,000 to $39,999 | 4,164 (6.3%) | 3,765 (5.3%) |
| $40,000 to $44,999 | 3,370 (5.1%) | 4,178 (5.9%) |
| $45,000 to $49,999 | 3,094 (4.7%) | 3,440 (4.9%) |
| $50,000 to $54,999 | 2,193 (3.3%) | 3,019 (4.3%) |
| $55,000 to $64,999 | 4,469 (6.7%) | 4,775 (6.8%) |
| $65,000 to $74,999 | 3,684 (5.6%) | 3,404 (4.8%) |
| $75,000 to $99,999 | 6,370 (9.6%) | 5,465 (7.7%) |
| $100,000+ | 11,084 (16.7%) | 7,075 (10.0%) |
| Total | 66,281 (100.0%) | 70,623 (100.0%) |
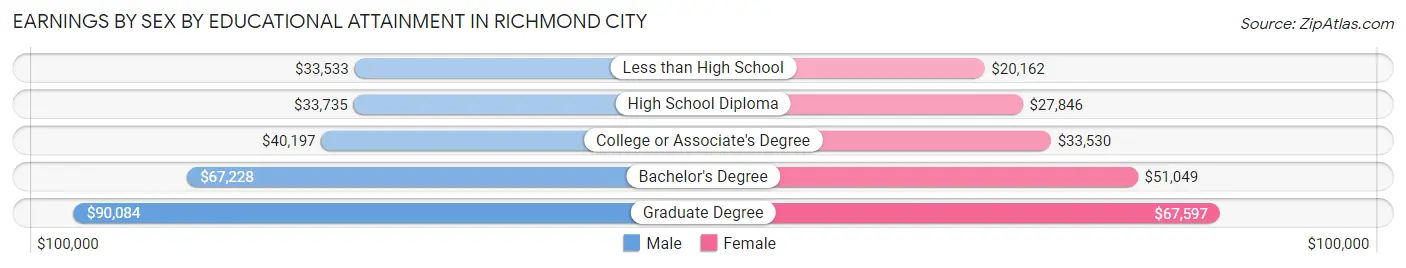
Earnings by Sex by Educational Attainment in Richmond city
Average earnings in Richmond city are $48,427 for men and $41,570 for women, a difference of 14.2%. Men with an educational attainment of graduate degree enjoy the highest average annual earnings of $90,084, while those with less than high school education earn the least with $33,533. Women with an educational attainment of graduate degree earn the most with the average annual earnings of $67,597, while those with less than high school education have the smallest earnings of $20,162.
| Educational Attainment | Male Income | Female Income |
| Less than High School | $33,533 | $20,162 |
| High School Diploma | $33,735 | $27,846 |
| College or Associate's Degree | $40,197 | $33,530 |
| Bachelor's Degree | $67,228 | $51,049 |
| Graduate Degree | $90,084 | $67,597 |
| Total | $48,427 | $41,570 |
Family Income in Richmond city
Family Income Brackets in Richmond city
According to the Richmond city family income data, there are 7,130 families falling into the $200,000+ income range, which is the most common income bracket and makes up 16.1% of all families. Conversely, the $10,000 to $14,999 income bracket is the least frequent group with only 974 families (2.2%) belonging to this category.
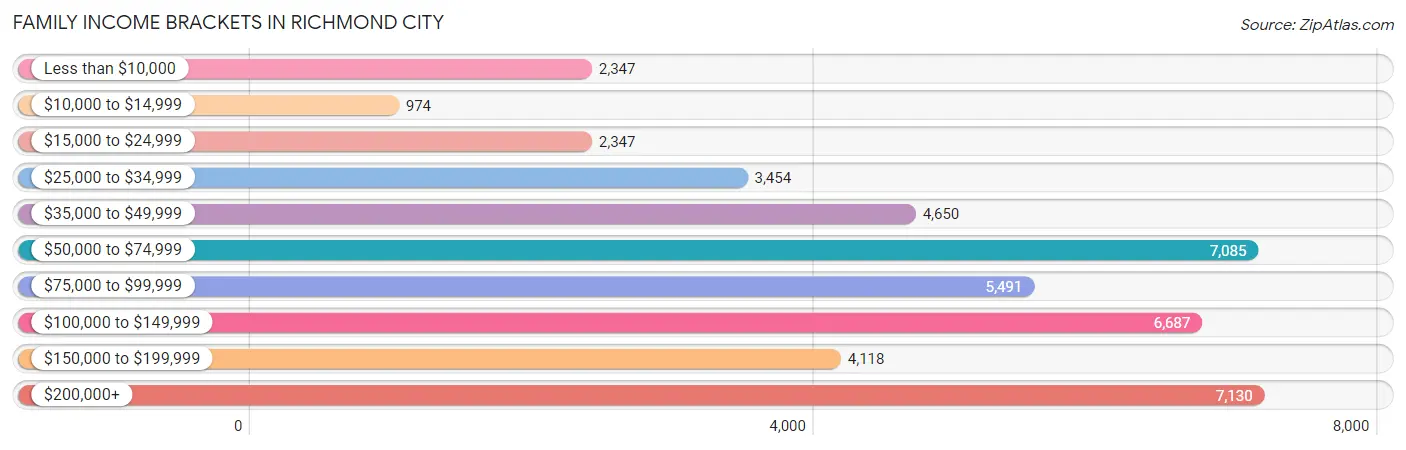
| Income Bracket | # Families | % Families |
| Less than $10,000 | 2,347 | 5.3% |
| $10,000 to $14,999 | 974 | 2.2% |
| $15,000 to $24,999 | 2,347 | 5.3% |
| $25,000 to $34,999 | 3,454 | 7.8% |
| $35,000 to $49,999 | 4,650 | 10.5% |
| $50,000 to $74,999 | 7,085 | 16.0% |
| $75,000 to $99,999 | 5,491 | 12.4% |
| $100,000 to $149,999 | 6,687 | 15.1% |
| $150,000 to $199,999 | 4,118 | 9.3% |
| $200,000+ | 7,130 | 16.1% |
Family Income by Famaliy Size in Richmond city
4-person families (6,311 | 14.2%) account for the highest median family income in Richmond city with $89,161 per family, while 2-person families (24,545 | 55.4%) have the highest median income of $39,920 per family member.
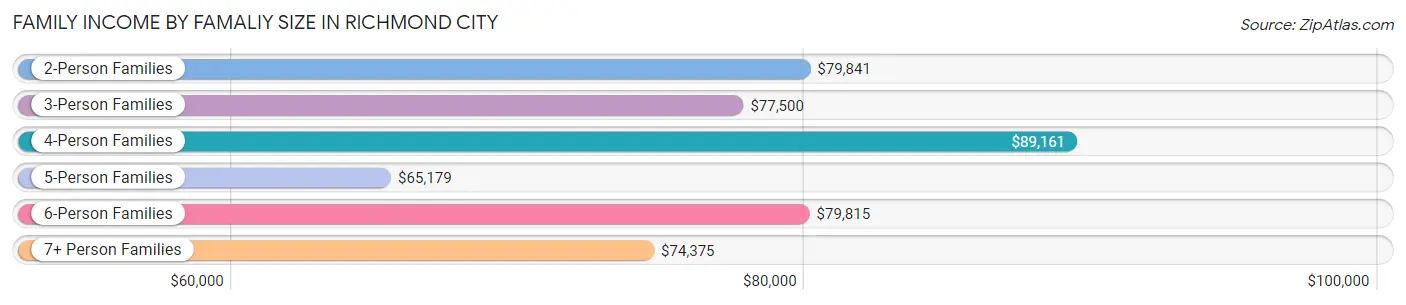
| Income Bracket | # Families | Median Income |
| 2-Person Families | 24,545 (55.4%) | $79,841 |
| 3-Person Families | 9,414 (21.3%) | $77,500 |
| 4-Person Families | 6,311 (14.2%) | $89,161 |
| 5-Person Families | 2,627 (5.9%) | $65,179 |
| 6-Person Families | 822 (1.9%) | $79,815 |
| 7+ Person Families | 564 (1.3%) | $74,375 |
| Total | 44,283 (100.0%) | $79,453 |
Family Income by Number of Earners in Richmond city
The median family income in Richmond city is $79,453, with families comprising 2 earners (19,732) having the highest median family income of $120,730, while families with no earners (5,528) have the lowest median family income of $42,655, accounting for 44.6% and 12.5% of families, respectively.
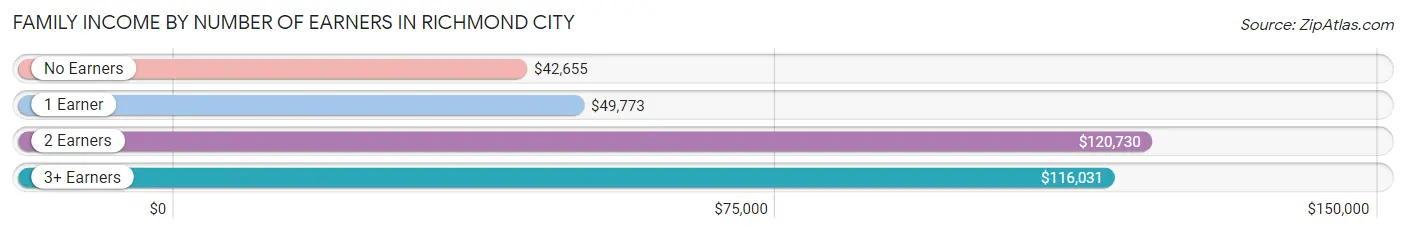
| Number of Earners | # Families | Median Income |
| No Earners | 5,528 (12.5%) | $42,655 |
| 1 Earner | 16,098 (36.3%) | $49,773 |
| 2 Earners | 19,732 (44.6%) | $120,730 |
| 3+ Earners | 2,925 (6.6%) | $116,031 |
| Total | 44,283 (100.0%) | $79,453 |
Household Income in Richmond city
Household Income Brackets in Richmond city
With 16,597 households falling in the category, the $50,000 to $74,999 income range is the most frequent in Richmond city, accounting for 16.4% of all households. In contrast, only 5,768 households (5.7%) fall into the $10,000 to $14,999 income bracket, making it the least populous group.
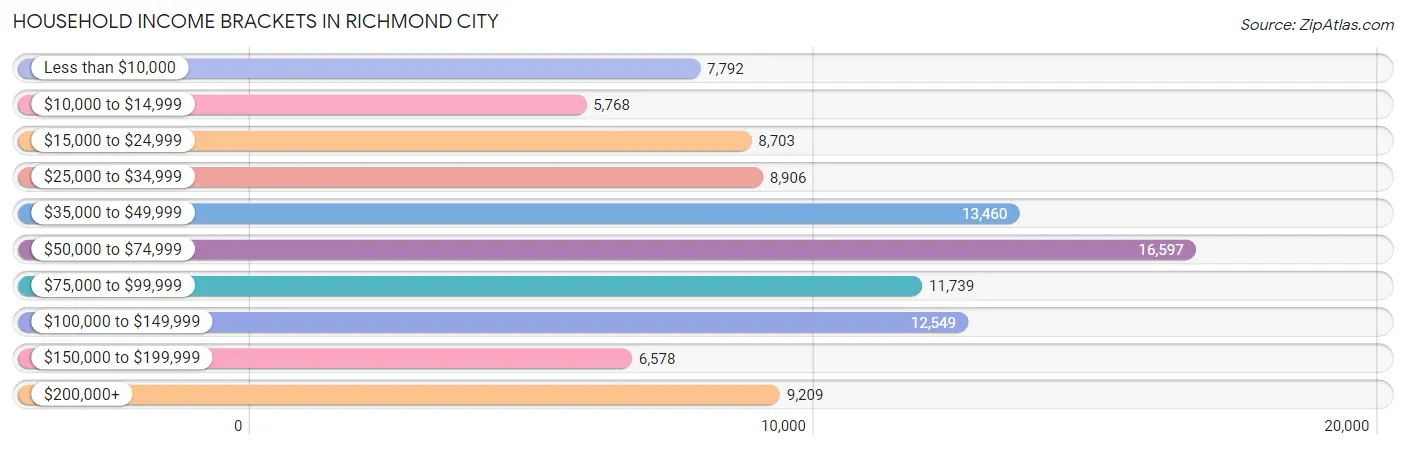
| Income Bracket | # Households | % Households |
| Less than $10,000 | 7,792 | 7.7% |
| $10,000 to $14,999 | 5,768 | 5.7% |
| $15,000 to $24,999 | 8,703 | 8.6% |
| $25,000 to $34,999 | 8,906 | 8.8% |
| $35,000 to $49,999 | 13,460 | 13.3% |
| $50,000 to $74,999 | 16,597 | 16.4% |
| $75,000 to $99,999 | 11,739 | 11.6% |
| $100,000 to $149,999 | 12,549 | 12.4% |
| $150,000 to $199,999 | 6,578 | 6.5% |
| $200,000+ | 9,209 | 9.1% |
Household Income by Householder Age in Richmond city
The median household income in Richmond city is $59,606, with the highest median household income of $68,391 found in the 25 to 44 years age bracket for the primary householder. A total of 41,637 households (41.1%) fall into this category. Meanwhile, the 15 to 24 years age bracket for the primary householder has the lowest median household income of $27,005, with 6,548 households (6.5%) in this group.
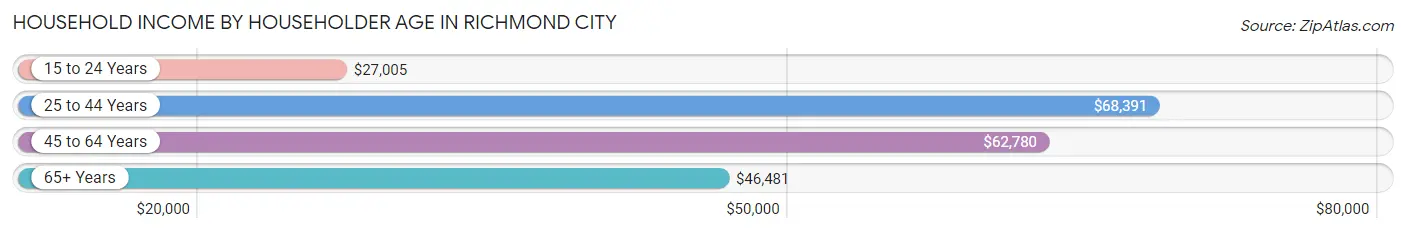
| Income Bracket | # Households | Median Income |
| 15 to 24 Years | 6,548 (6.5%) | $27,005 |
| 25 to 44 Years | 41,637 (41.1%) | $68,391 |
| 45 to 64 Years | 30,764 (30.4%) | $62,780 |
| 65+ Years | 22,252 (22.0%) | $46,481 |
| Total | 101,201 (100.0%) | $59,606 |
Poverty in Richmond city
Income Below Poverty by Sex and Age in Richmond city
With 17.5% poverty level for males and 21.3% for females among the residents of Richmond city, 18 to 24 year old males and 18 to 24 year old females are the most vulnerable to poverty, with 3,308 males (35.3%) and 4,955 females (45.7%) in their respective age groups living below the poverty level.
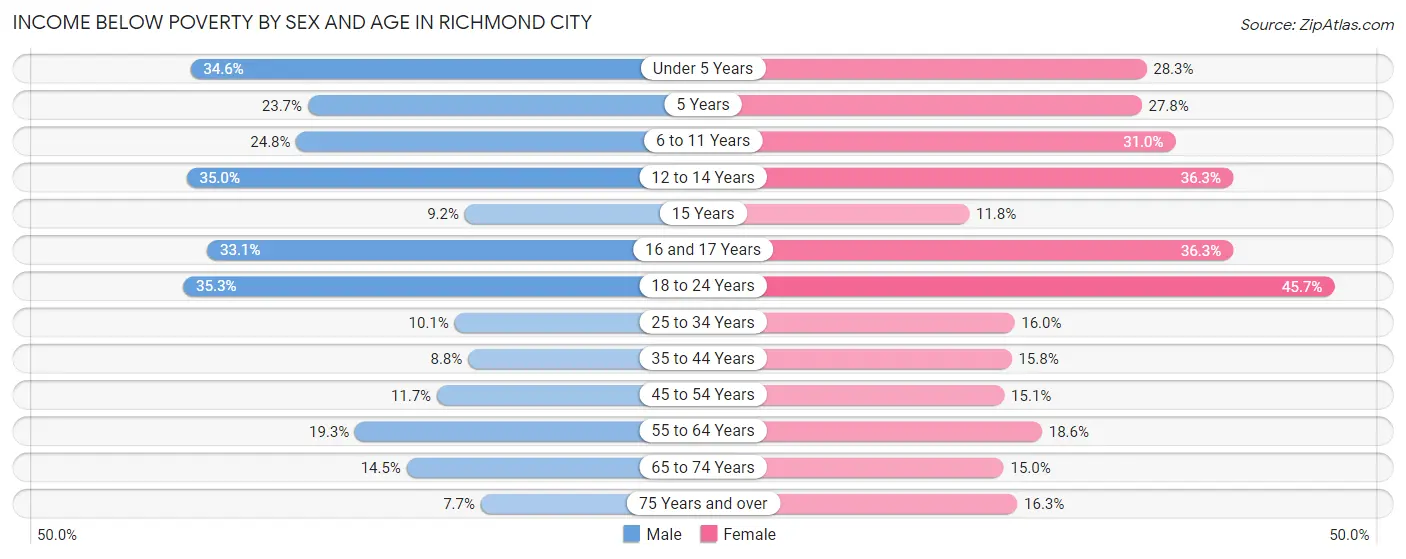
| Age Bracket | Male | Female |
| Under 5 Years | 2,265 (34.6%) | 1,736 (28.3%) |
| 5 Years | 235 (23.7%) | 316 (27.8%) |
| 6 to 11 Years | 1,437 (24.8%) | 1,860 (30.9%) |
| 12 to 14 Years | 1,133 (35.0%) | 1,019 (36.3%) |
| 15 Years | 71 (9.1%) | 113 (11.8%) |
| 16 and 17 Years | 602 (33.1%) | 626 (36.3%) |
| 18 to 24 Years | 3,308 (35.3%) | 4,955 (45.7%) |
| 25 to 34 Years | 2,366 (10.1%) | 4,027 (16.0%) |
| 35 to 44 Years | 1,296 (8.8%) | 2,289 (15.8%) |
| 45 to 54 Years | 1,336 (11.7%) | 1,821 (15.1%) |
| 55 to 64 Years | 2,451 (19.3%) | 2,716 (18.6%) |
| 65 to 74 Years | 1,261 (14.5%) | 1,618 (15.0%) |
| 75 Years and over | 306 (7.7%) | 1,161 (16.3%) |
| Total | 18,067 (17.5%) | 24,257 (21.3%) |
Income Above Poverty by Sex and Age in Richmond city
According to the poverty statistics in Richmond city, males aged 75 years and over and females aged 15 years are the age groups that are most secure financially, with 92.3% of males and 88.2% of females in these age groups living above the poverty line.
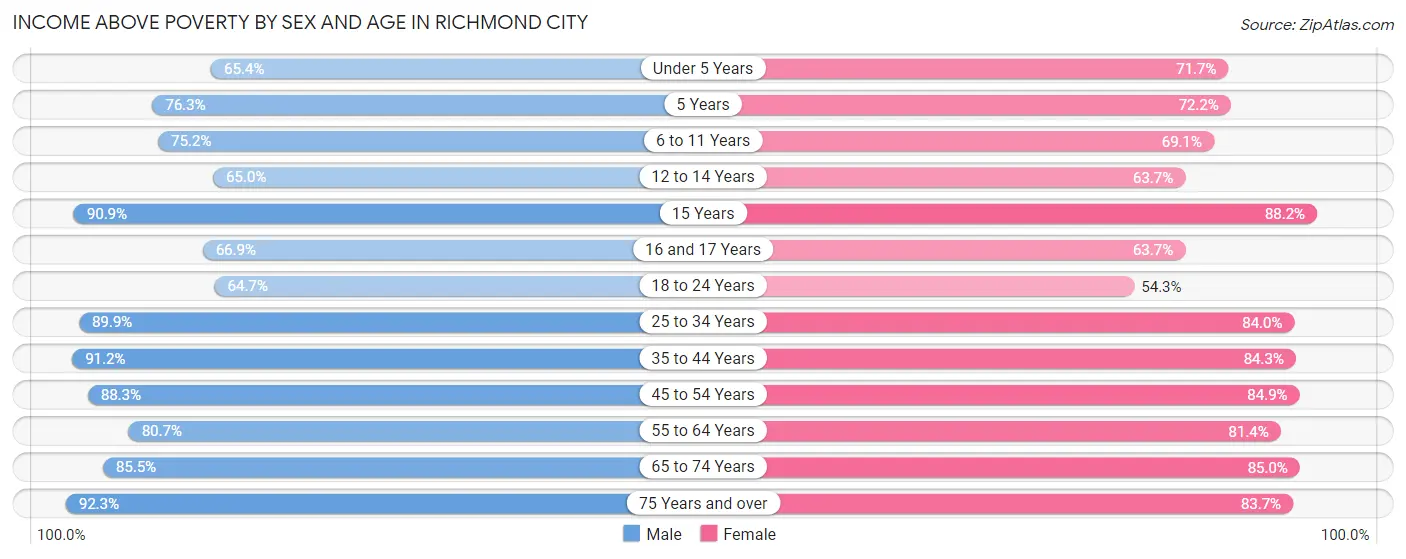
| Age Bracket | Male | Female |
| Under 5 Years | 4,279 (65.4%) | 4,406 (71.7%) |
| 5 Years | 756 (76.3%) | 820 (72.2%) |
| 6 to 11 Years | 4,362 (75.2%) | 4,149 (69.1%) |
| 12 to 14 Years | 2,107 (65.0%) | 1,789 (63.7%) |
| 15 Years | 705 (90.8%) | 844 (88.2%) |
| 16 and 17 Years | 1,219 (66.9%) | 1,098 (63.7%) |
| 18 to 24 Years | 6,069 (64.7%) | 5,889 (54.3%) |
| 25 to 34 Years | 21,081 (89.9%) | 21,129 (84.0%) |
| 35 to 44 Years | 13,365 (91.2%) | 12,244 (84.3%) |
| 45 to 54 Years | 10,054 (88.3%) | 10,266 (84.9%) |
| 55 to 64 Years | 10,230 (80.7%) | 11,916 (81.4%) |
| 65 to 74 Years | 7,412 (85.5%) | 9,158 (85.0%) |
| 75 Years and over | 3,689 (92.3%) | 5,977 (83.7%) |
| Total | 85,328 (82.5%) | 89,685 (78.7%) |
Income Below Poverty Among Married-Couple Families in Richmond city
The poverty statistics for married-couple families in Richmond city show that 4.1% or 1,041 of the total 25,614 families live below the poverty line. Families with 5 or more children have the highest poverty rate of 31.5%, comprising of 29 families. On the other hand, families with no children have the lowest poverty rate of 2.9%, which includes 477 families.
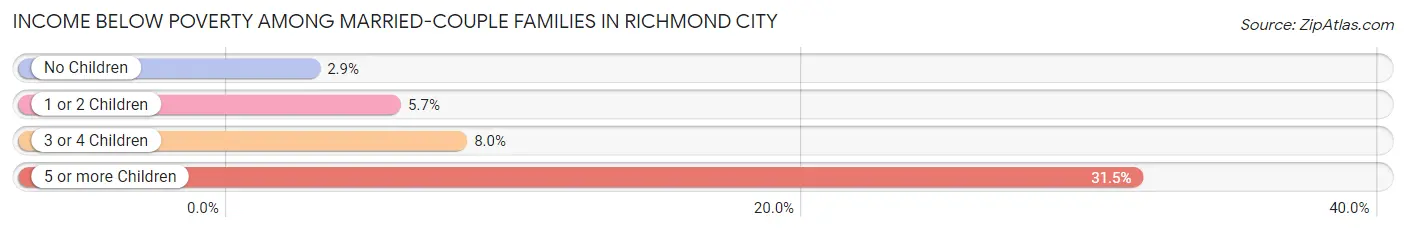
| Children | Above Poverty | Below Poverty |
| No Children | 16,204 (97.1%) | 477 (2.9%) |
| 1 or 2 Children | 6,979 (94.3%) | 420 (5.7%) |
| 3 or 4 Children | 1,327 (92.0%) | 115 (8.0%) |
| 5 or more Children | 63 (68.5%) | 29 (31.5%) |
| Total | 24,573 (95.9%) | 1,041 (4.1%) |
Income Below Poverty Among Single-Parent Households in Richmond city
According to the poverty data in Richmond city, 12.7% or 593 single-father households and 27.4% or 3,845 single-mother households are living below the poverty line. Among single-father households, those with 3 or 4 children have the highest poverty rate, with 154 households (50.5%) experiencing poverty. Likewise, among single-mother households, those with 5 or more children have the highest poverty rate, with 216 households (79.7%) falling below the poverty line.
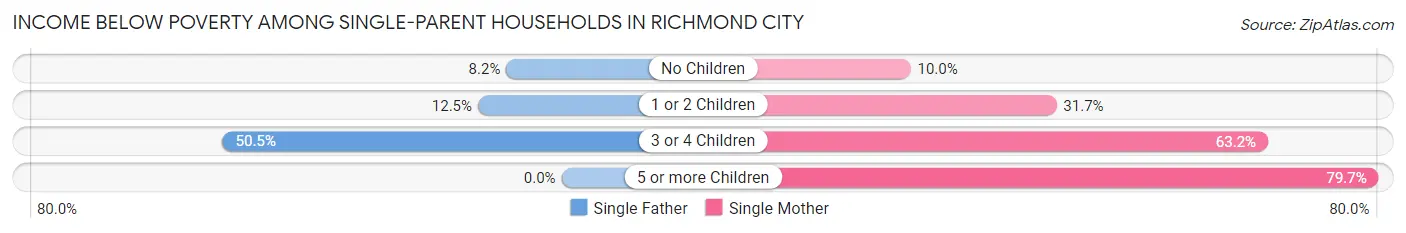
| Children | Single Father | Single Mother |
| No Children | 200 (8.2%) | 564 (10.0%) |
| 1 or 2 Children | 239 (12.5%) | 2,060 (31.7%) |
| 3 or 4 Children | 154 (50.5%) | 1,005 (63.2%) |
| 5 or more Children | 0 (0.0%) | 216 (79.7%) |
| Total | 593 (12.7%) | 3,845 (27.4%) |
Income Below Poverty Among Married-Couple vs Single-Parent Households in Richmond city
The poverty data for Richmond city shows that 1,041 of the married-couple family households (4.1%) and 4,438 of the single-parent households (23.8%) are living below the poverty level. Within the married-couple family households, those with 5 or more children have the highest poverty rate, with 29 households (31.5%) falling below the poverty line. Among the single-parent households, those with 5 or more children have the highest poverty rate, with 216 household (79.7%) living below poverty.
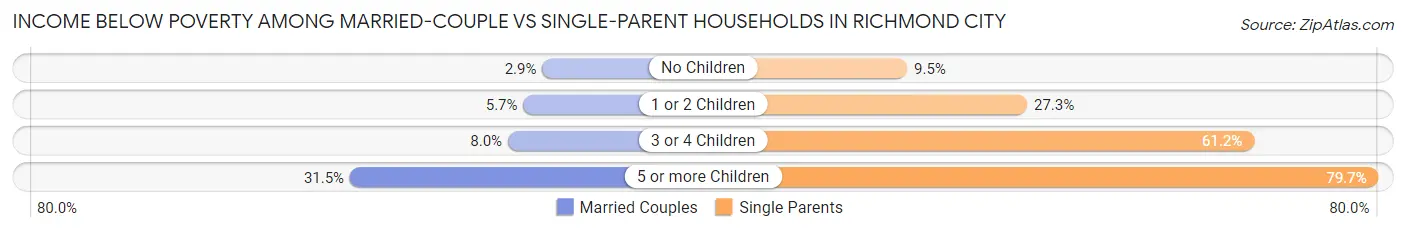
| Children | Married-Couple Families | Single-Parent Households |
| No Children | 477 (2.9%) | 764 (9.5%) |
| 1 or 2 Children | 420 (5.7%) | 2,299 (27.3%) |
| 3 or 4 Children | 115 (8.0%) | 1,159 (61.2%) |
| 5 or more Children | 29 (31.5%) | 216 (79.7%) |
| Total | 1,041 (4.1%) | 4,438 (23.8%) |
Race in Richmond city
The most populous races in Richmond city are White / Caucasian (101,368 | 44.6%), Black / African American (99,855 | 44.0%), and Hispanic or Latino (17,306 | 7.6%).
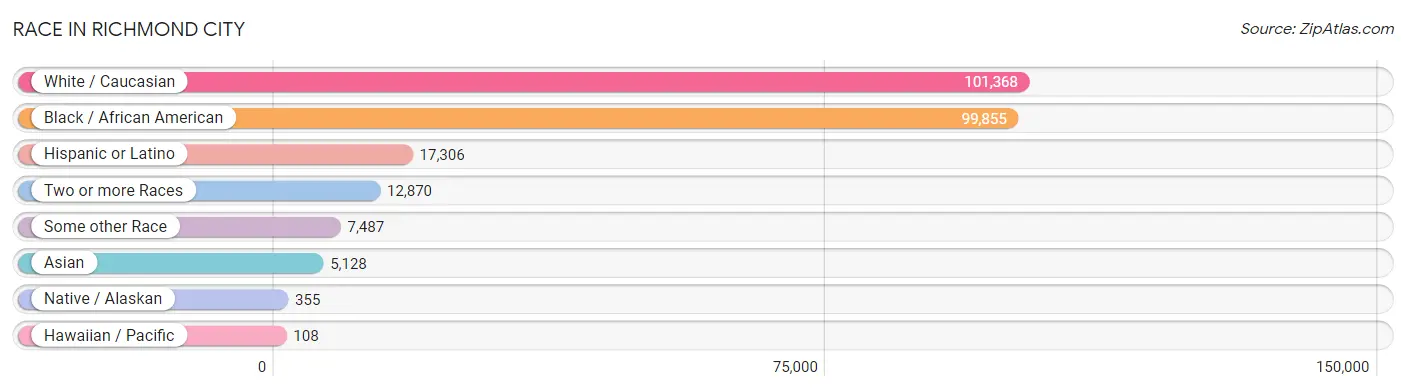
| Race | # Population | % Population |
| Asian | 5,128 | 2.3% |
| Black / African American | 99,855 | 44.0% |
| Hawaiian / Pacific | 108 | 0.1% |
| Hispanic or Latino | 17,306 | 7.6% |
| Native / Alaskan | 355 | 0.2% |
| White / Caucasian | 101,368 | 44.6% |
| Two or more Races | 12,870 | 5.7% |
| Some other Race | 7,487 | 3.3% |
| Total | 227,171 | 100.0% |
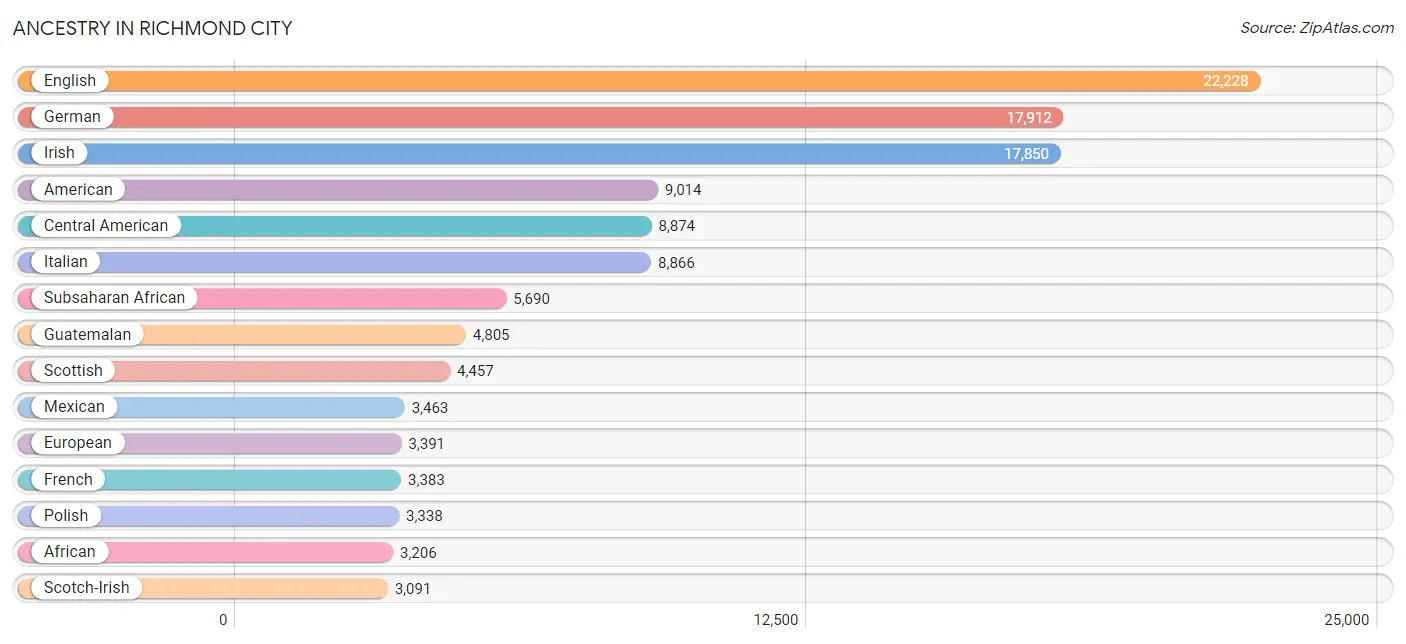
Ancestry in Richmond city
The most populous ancestries reported in Richmond city are English (22,228 | 9.8%), German (17,912 | 7.9%), Irish (17,850 | 7.9%), American (9,014 | 4.0%), and Central American (8,874 | 3.9%), together accounting for 33.4% of all Richmond city residents.
| Ancestry | # Population | % Population |
| Afghan | 399 | 0.2% |
| African | 3,206 | 1.4% |
| Alaskan Athabascan | 17 | 0.0% |
| Albanian | 7 | 0.0% |
| American | 9,014 | 4.0% |
| Arab | 1,366 | 0.6% |
| Argentinean | 144 | 0.1% |
| Armenian | 140 | 0.1% |
| Australian | 34 | 0.0% |
| Austrian | 382 | 0.2% |
| Bahamian | 474 | 0.2% |
| Barbadian | 294 | 0.1% |
| Basque | 7 | 0.0% |
| Belgian | 63 | 0.0% |
| Belizean | 17 | 0.0% |
| Bhutanese | 503 | 0.2% |
| Blackfeet | 323 | 0.1% |
| Bolivian | 169 | 0.1% |
| Brazilian | 473 | 0.2% |
| British | 2,435 | 1.1% |
| British West Indian | 78 | 0.0% |
| Bulgarian | 25 | 0.0% |
| Burmese | 779 | 0.3% |
| Cajun | 53 | 0.0% |
| Cambodian | 29 | 0.0% |
| Canadian | 205 | 0.1% |
| Celtic | 27 | 0.0% |
| Central American | 8,874 | 3.9% |
| Central American Indian | 96 | 0.0% |
| Cherokee | 916 | 0.4% |
| Chilean | 56 | 0.0% |
| Choctaw | 63 | 0.0% |
| Colombian | 308 | 0.1% |
| Costa Rican | 74 | 0.0% |
| Cree | 11 | 0.0% |
| Creek | 13 | 0.0% |
| Croatian | 217 | 0.1% |
| Cuban | 578 | 0.3% |
| Czech | 697 | 0.3% |
| Czechoslovakian | 124 | 0.1% |
| Danish | 545 | 0.2% |
| Dominican | 406 | 0.2% |
| Dutch | 1,135 | 0.5% |
| Dutch West Indian | 29 | 0.0% |
| Eastern European | 698 | 0.3% |
| Ecuadorian | 94 | 0.0% |
| Egyptian | 304 | 0.1% |
| English | 22,228 | 9.8% |
| Estonian | 78 | 0.0% |
| Ethiopian | 816 | 0.4% |
| European | 3,391 | 1.5% |
| Filipino | 214 | 0.1% |
| Finnish | 199 | 0.1% |
| French | 3,383 | 1.5% |
| French American Indian | 10 | 0.0% |
| French Canadian | 571 | 0.3% |
| German | 17,912 | 7.9% |
| Ghanaian | 140 | 0.1% |
| Greek | 955 | 0.4% |
| Guamanian / Chamorro | 41 | 0.0% |
| Guatemalan | 4,805 | 2.1% |
| Guyanese | 342 | 0.2% |
| Haitian | 225 | 0.1% |
| Honduran | 1,277 | 0.6% |
| Hungarian | 611 | 0.3% |
| Icelander | 9 | 0.0% |
| Indian (Asian) | 1,637 | 0.7% |
| Inupiat | 83 | 0.0% |
| Iranian | 229 | 0.1% |
| Iraqi | 34 | 0.0% |
| Irish | 17,850 | 7.9% |
| Iroquois | 22 | 0.0% |
| Israeli | 95 | 0.0% |
| Italian | 8,866 | 3.9% |
| Jamaican | 1,344 | 0.6% |
| Japanese | 136 | 0.1% |
| Jordanian | 55 | 0.0% |
| Korean | 1,287 | 0.6% |
| Laotian | 2 | 0.0% |
| Latvian | 82 | 0.0% |
| Lebanese | 602 | 0.3% |
| Lithuanian | 380 | 0.2% |
| Lumbee | 7 | 0.0% |
| Macedonian | 13 | 0.0% |
| Malaysian | 42 | 0.0% |
| Mexican | 3,463 | 1.5% |
| Mexican American Indian | 13 | 0.0% |
| Mongolian | 9 | 0.0% |
| Moroccan | 108 | 0.1% |
| Native Hawaiian | 105 | 0.1% |
| Navajo | 14 | 0.0% |
| New Zealander | 46 | 0.0% |
| Nicaraguan | 126 | 0.1% |
| Nigerian | 252 | 0.1% |
| Northern European | 256 | 0.1% |
| Norwegian | 935 | 0.4% |
| Osage | 5 | 0.0% |
| Pakistani | 171 | 0.1% |
| Palestinian | 34 | 0.0% |
| Panamanian | 138 | 0.1% |
| Paraguayan | 5 | 0.0% |
| Pennsylvania German | 45 | 0.0% |
| Peruvian | 297 | 0.1% |
| Polish | 3,338 | 1.5% |
| Portuguese | 221 | 0.1% |
| Puerto Rican | 1,630 | 0.7% |
| Romanian | 75 | 0.0% |
| Russian | 1,148 | 0.5% |
| Salvadoran | 2,454 | 1.1% |
| Samoan | 52 | 0.0% |
| Scandinavian | 352 | 0.2% |
| Scotch-Irish | 3,091 | 1.4% |
| Scottish | 4,457 | 2.0% |
| Senegalese | 107 | 0.1% |
| Serbian | 63 | 0.0% |
| Sierra Leonean | 226 | 0.1% |
| Slavic | 55 | 0.0% |
| Slovak | 410 | 0.2% |
| Slovene | 56 | 0.0% |
| Somali | 25 | 0.0% |
| South African | 39 | 0.0% |
| South American | 1,280 | 0.6% |
| South American Indian | 7 | 0.0% |
| Spaniard | 399 | 0.2% |
| Spanish | 328 | 0.1% |
| Spanish American | 5 | 0.0% |
| Sri Lankan | 639 | 0.3% |
| Subsaharan African | 5,690 | 2.5% |
| Sudanese | 320 | 0.1% |
| Swedish | 1,250 | 0.5% |
| Swiss | 751 | 0.3% |
| Syrian | 29 | 0.0% |
| Taiwanese | 1 | 0.0% |
| Thai | 1,190 | 0.5% |
| Tongan | 4 | 0.0% |
| Trinidadian and Tobagonian | 67 | 0.0% |
| Turkish | 158 | 0.1% |
| Ugandan | 25 | 0.0% |
| Ukrainian | 520 | 0.2% |
| Uruguayan | 21 | 0.0% |
| Ute | 6 | 0.0% |
| Venezuelan | 174 | 0.1% |
| Vietnamese | 2 | 0.0% |
| Welsh | 1,204 | 0.5% |
| West Indian | 256 | 0.1% |
| Yaqui | 8 | 0.0% |
| Yugoslavian | 67 | 0.0% |
| Zimbabwean | 23 | 0.0% | View All 148 Rows |
Immigrants in Richmond city
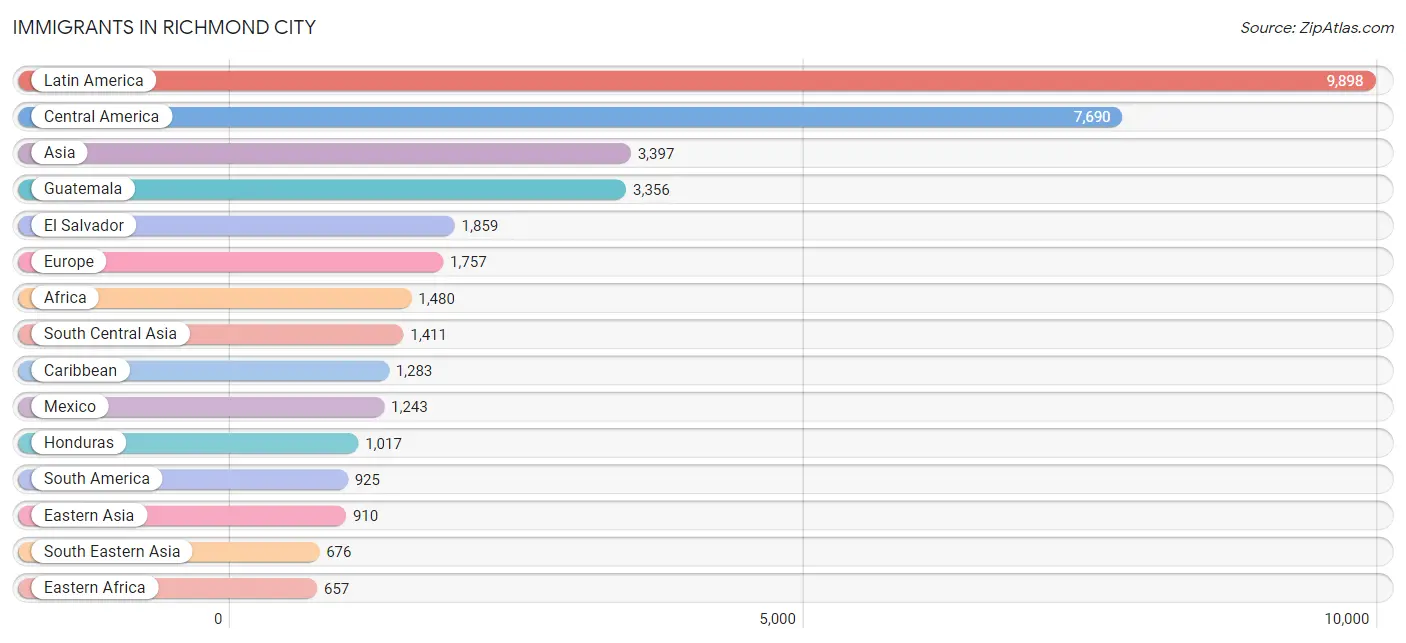
The most numerous immigrant groups reported in Richmond city came from Latin America (9,898 | 4.4%), Central America (7,690 | 3.4%), Asia (3,397 | 1.5%), Guatemala (3,356 | 1.5%), and El Salvador (1,859 | 0.8%), together accounting for 11.6% of all Richmond city residents.
| Immigration Origin | # Population | % Population |
| Afghanistan | 306 | 0.1% |
| Africa | 1,480 | 0.6% |
| Argentina | 43 | 0.0% |
| Armenia | 38 | 0.0% |
| Asia | 3,397 | 1.5% |
| Australia | 50 | 0.0% |
| Austria | 18 | 0.0% |
| Bangladesh | 76 | 0.0% |
| Barbados | 95 | 0.0% |
| Belgium | 13 | 0.0% |
| Bolivia | 11 | 0.0% |
| Bosnia and Herzegovina | 66 | 0.0% |
| Brazil | 236 | 0.1% |
| Bulgaria | 4 | 0.0% |
| Cambodia | 66 | 0.0% |
| Cameroon | 223 | 0.1% |
| Canada | 240 | 0.1% |
| Caribbean | 1,283 | 0.6% |
| Central America | 7,690 | 3.4% |
| Chile | 43 | 0.0% |
| China | 568 | 0.3% |
| Colombia | 113 | 0.1% |
| Congo | 1 | 0.0% |
| Costa Rica | 91 | 0.0% |
| Cuba | 251 | 0.1% |
| Denmark | 9 | 0.0% |
| Dominica | 42 | 0.0% |
| Dominican Republic | 92 | 0.0% |
| Eastern Africa | 657 | 0.3% |
| Eastern Asia | 910 | 0.4% |
| Eastern Europe | 511 | 0.2% |
| Ecuador | 28 | 0.0% |
| Egypt | 140 | 0.1% |
| El Salvador | 1,859 | 0.8% |
| England | 169 | 0.1% |
| Eritrea | 36 | 0.0% |
| Ethiopia | 479 | 0.2% |
| Europe | 1,757 | 0.8% |
| France | 124 | 0.1% |
| Germany | 217 | 0.1% |
| Ghana | 40 | 0.0% |
| Greece | 165 | 0.1% |
| Guatemala | 3,356 | 1.5% |
| Guyana | 130 | 0.1% |
| Haiti | 156 | 0.1% |
| Honduras | 1,017 | 0.4% |
| Hong Kong | 12 | 0.0% |
| Hungary | 5 | 0.0% |
| India | 619 | 0.3% |
| Iran | 241 | 0.1% |
| Iraq | 23 | 0.0% |
| Ireland | 15 | 0.0% |
| Israel | 7 | 0.0% |
| Italy | 147 | 0.1% |
| Jamaica | 349 | 0.2% |
| Japan | 17 | 0.0% |
| Jordan | 26 | 0.0% |
| Kazakhstan | 26 | 0.0% |
| Korea | 307 | 0.1% |
| Kuwait | 2 | 0.0% |
| Laos | 9 | 0.0% |
| Latin America | 9,898 | 4.4% |
| Latvia | 14 | 0.0% |
| Lebanon | 33 | 0.0% |
| Liberia | 2 | 0.0% |
| Lithuania | 36 | 0.0% |
| Malaysia | 23 | 0.0% |
| Mexico | 1,243 | 0.5% |
| Middle Africa | 248 | 0.1% |
| Moldova | 35 | 0.0% |
| Nepal | 26 | 0.0% |
| Netherlands | 38 | 0.0% |
| Nicaragua | 89 | 0.0% |
| Nigeria | 41 | 0.0% |
| Northern Africa | 220 | 0.1% |
| Northern Europe | 445 | 0.2% |
| Oceania | 54 | 0.0% |
| Pakistan | 117 | 0.1% |
| Panama | 35 | 0.0% |
| Peru | 145 | 0.1% |
| Philippines | 156 | 0.1% |
| Poland | 47 | 0.0% |
| Portugal | 25 | 0.0% |
| Romania | 13 | 0.0% |
| Russia | 194 | 0.1% |
| Saudi Arabia | 84 | 0.0% |
| Senegal | 107 | 0.1% |
| Serbia | 17 | 0.0% |
| Sierra Leone | 113 | 0.1% |
| Singapore | 39 | 0.0% |
| South Africa | 32 | 0.0% |
| South America | 925 | 0.4% |
| South Central Asia | 1,411 | 0.6% |
| South Eastern Asia | 676 | 0.3% |
| Southern Europe | 368 | 0.2% |
| Spain | 31 | 0.0% |
| Sudan | 80 | 0.0% |
| Sweden | 8 | 0.0% |
| Switzerland | 14 | 0.0% |
| Taiwan | 97 | 0.0% |
| Thailand | 199 | 0.1% |
| Trinidad and Tobago | 125 | 0.1% |
| Turkey | 97 | 0.0% |
| Ukraine | 26 | 0.0% |
| Uruguay | 21 | 0.0% |
| Venezuela | 150 | 0.1% |
| Vietnam | 170 | 0.1% |
| West Indies | 11 | 0.0% |
| Western Africa | 323 | 0.1% |
| Western Asia | 400 | 0.2% |
| Western Europe | 424 | 0.2% |
| Yemen | 5 | 0.0% |
| Zaire | 24 | 0.0% |
| Zimbabwe | 31 | 0.0% | View All 114 Rows |
Sex and Age in Richmond city
Sex and Age in Richmond city
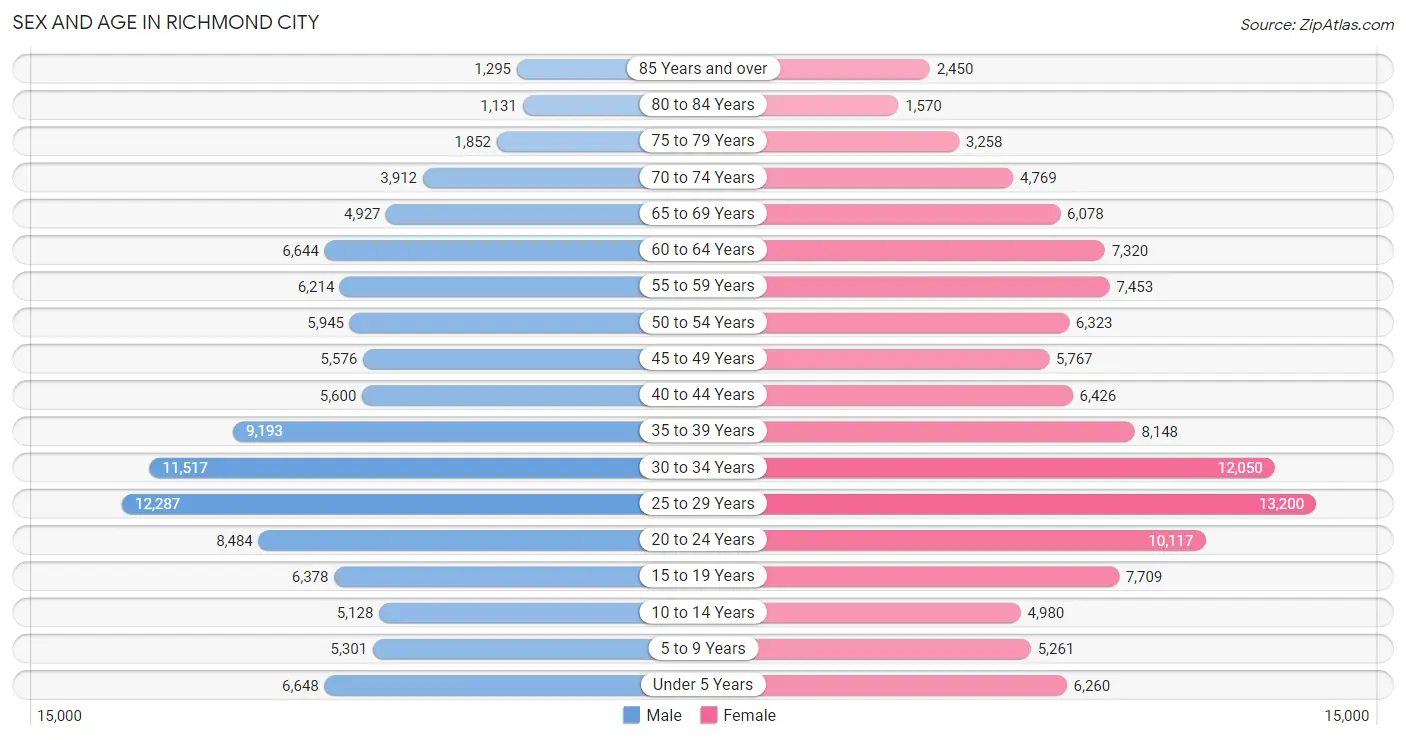
The most populous age groups in Richmond city are 25 to 29 Years (12,287 | 11.4%) for men and 25 to 29 Years (13,200 | 11.1%) for women.
| Age Bracket | Male | Female |
| Under 5 Years | 6,648 (6.1%) | 6,260 (5.2%) |
| 5 to 9 Years | 5,301 (4.9%) | 5,261 (4.4%) |
| 10 to 14 Years | 5,128 (4.8%) | 4,980 (4.2%) |
| 15 to 19 Years | 6,378 (5.9%) | 7,709 (6.5%) |
| 20 to 24 Years | 8,484 (7.9%) | 10,117 (8.5%) |
| 25 to 29 Years | 12,287 (11.4%) | 13,200 (11.1%) |
| 30 to 34 Years | 11,517 (10.7%) | 12,050 (10.1%) |
| 35 to 39 Years | 9,193 (8.5%) | 8,148 (6.8%) |
| 40 to 44 Years | 5,600 (5.2%) | 6,426 (5.4%) |
| 45 to 49 Years | 5,576 (5.2%) | 5,767 (4.8%) |
| 50 to 54 Years | 5,945 (5.5%) | 6,323 (5.3%) |
| 55 to 59 Years | 6,214 (5.8%) | 7,453 (6.3%) |
| 60 to 64 Years | 6,644 (6.1%) | 7,320 (6.1%) |
| 65 to 69 Years | 4,927 (4.6%) | 6,078 (5.1%) |
| 70 to 74 Years | 3,912 (3.6%) | 4,769 (4.0%) |
| 75 to 79 Years | 1,852 (1.7%) | 3,258 (2.7%) |
| 80 to 84 Years | 1,131 (1.1%) | 1,570 (1.3%) |
| 85 Years and over | 1,295 (1.2%) | 2,450 (2.1%) |
| Total | 108,032 (100.0%) | 119,139 (100.0%) |
Families and Households in Richmond city
Median Family Size in Richmond city
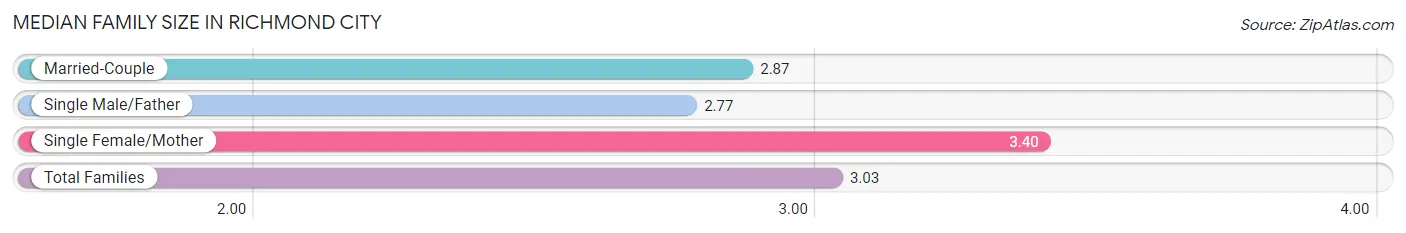
The median family size in Richmond city is 3.03 persons per family, with single female/mother families (14,015 | 31.7%) accounting for the largest median family size of 3.4 persons per family. On the other hand, single male/father families (4,654 | 10.5%) represent the smallest median family size with 2.77 persons per family.
| Family Type | # Families | Family Size |
| Married-Couple | 25,614 (57.8%) | 2.87 |
| Single Male/Father | 4,654 (10.5%) | 2.77 |
| Single Female/Mother | 14,015 (31.7%) | 3.40 |
| Total Families | 44,283 (100.0%) | 3.03 |
Median Household Size in Richmond city
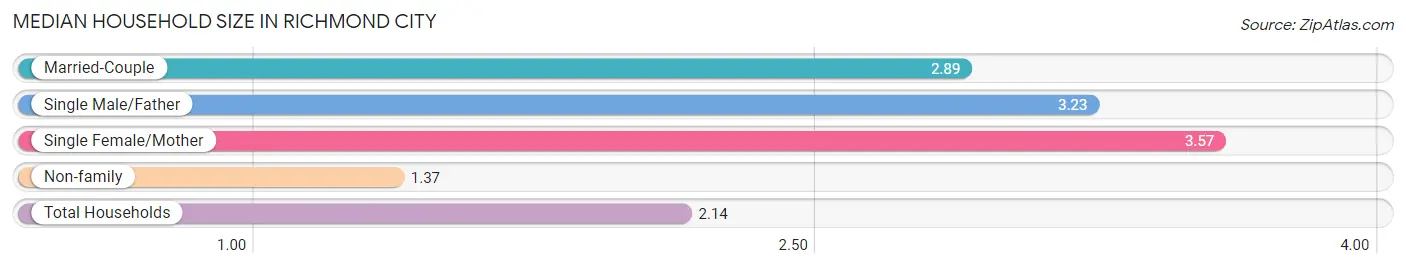
The median household size in Richmond city is 2.14 persons per household, with single female/mother households (14,015 | 13.9%) accounting for the largest median household size of 3.57 persons per household. non-family households (56,918 | 56.2%) represent the smallest median household size with 1.37 persons per household.
| Household Type | # Households | Household Size |
| Married-Couple | 25,614 (25.3%) | 2.89 |
| Single Male/Father | 4,654 (4.6%) | 3.23 |
| Single Female/Mother | 14,015 (13.9%) | 3.57 |
| Non-family | 56,918 (56.2%) | 1.37 |
| Total Households | 101,201 (100.0%) | 2.14 |
Household Size by Marriage Status in Richmond city
Out of a total of 101,201 households in Richmond city, 44,283 (43.8%) are family households, while 56,918 (56.2%) are nonfamily households. The most numerous type of family households are 2-person households, comprising 22,500, and the most common type of nonfamily households are 1-person households, comprising 43,587.
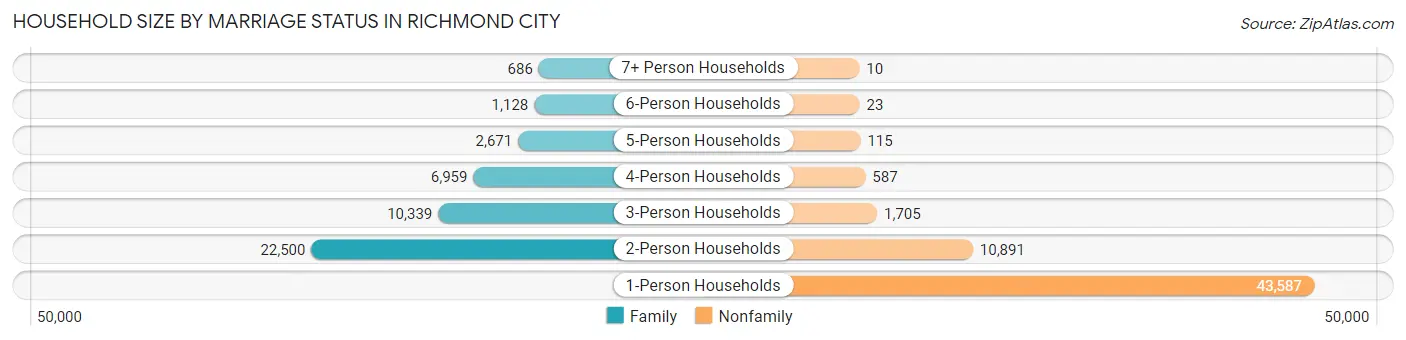
| Household Size | Family Households | Nonfamily Households |
| 1-Person Households | - | 43,587 (43.1%) |
| 2-Person Households | 22,500 (22.2%) | 10,891 (10.8%) |
| 3-Person Households | 10,339 (10.2%) | 1,705 (1.7%) |
| 4-Person Households | 6,959 (6.9%) | 587 (0.6%) |
| 5-Person Households | 2,671 (2.6%) | 115 (0.1%) |
| 6-Person Households | 1,128 (1.1%) | 23 (0.0%) |
| 7+ Person Households | 686 (0.7%) | 10 (0.0%) |
| Total | 44,283 (43.8%) | 56,918 (56.2%) |
Female Fertility in Richmond city
Fertility by Age in Richmond city
Average fertility rate in Richmond city is 43.0 births per 1,000 women. Women in the age bracket of 20 to 34 years have the highest fertility rate with 59.0 births per 1,000 women. Women in the age bracket of 20 to 34 years acount for 74.9% of all women with births.
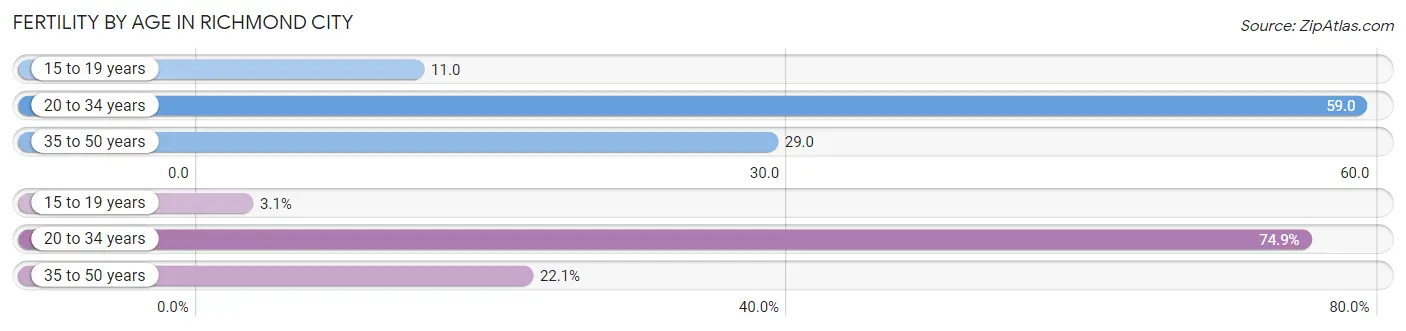
| Age Bracket | Women with Births | Births / 1,000 Women |
| 15 to 19 years | 86 (3.1%) | 11.0 |
| 20 to 34 years | 2,102 (74.9%) | 59.0 |
| 35 to 50 years | 619 (22.1%) | 29.0 |
| Total | 2,807 (100.0%) | 43.0 |
Fertility by Age by Marriage Status in Richmond city
52.5% of women with births (2,807) in Richmond city are married. The highest percentage of unmarried women with births falls into 15 to 19 years age bracket with 100.0% of them unmarried at the time of birth, while the lowest percentage of unmarried women with births belong to 35 to 50 years age bracket with 28.3% of them unmarried.
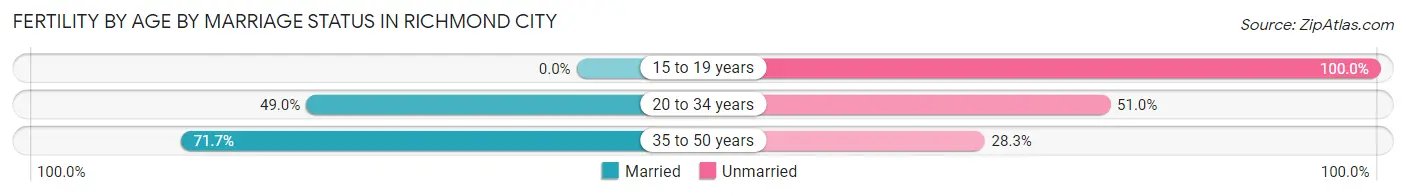
| Age Bracket | Married | Unmarried |
| 15 to 19 years | 0 (0.0%) | 86 (100.0%) |
| 20 to 34 years | 1,030 (49.0%) | 1,072 (51.0%) |
| 35 to 50 years | 444 (71.7%) | 175 (28.3%) |
| Total | 1,474 (52.5%) | 1,333 (47.5%) |
Fertility by Education in Richmond city
Average fertility rate in Richmond city is 43.0 births per 1,000 women. Women with the education attainment of less than high school have the highest fertility rate of 58.0 births per 1,000 women, while women with the education attainment of bachelor's degree have the lowest fertility at 29.0 births per 1,000 women. Women with the education attainment of college or associate's degree represent 28.8% of all women with births.
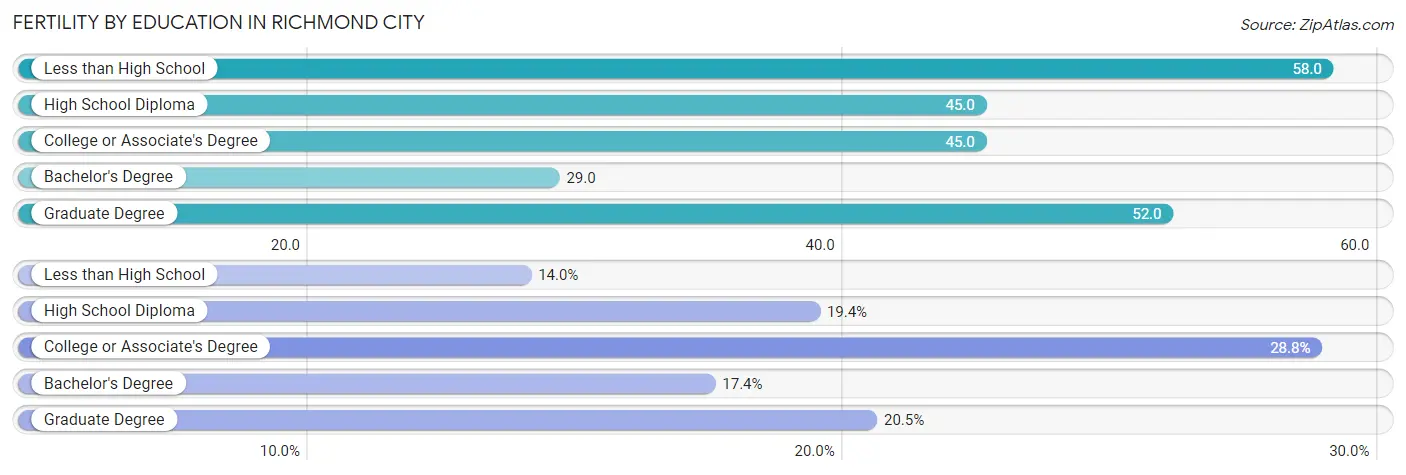
| Educational Attainment | Women with Births | Births / 1,000 Women |
| Less than High School | 392 (14.0%) | 58.0 |
| High School Diploma | 544 (19.4%) | 45.0 |
| College or Associate's Degree | 808 (28.8%) | 45.0 |
| Bachelor's Degree | 489 (17.4%) | 29.0 |
| Graduate Degree | 574 (20.4%) | 52.0 |
| Total | 2,807 (100.0%) | 43.0 |
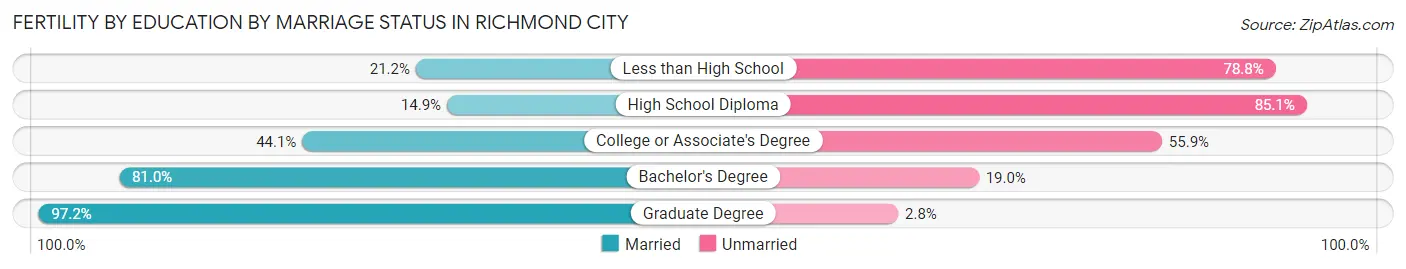
Fertility by Education by Marriage Status in Richmond city
47.5% of women with births in Richmond city are unmarried. Women with the educational attainment of graduate degree are most likely to be married with 97.2% of them married at childbirth, while women with the educational attainment of high school diploma are least likely to be married with 85.1% of them unmarried at childbirth.
| Educational Attainment | Married | Unmarried |
| Less than High School | 83 (21.2%) | 309 (78.8%) |
| High School Diploma | 81 (14.9%) | 463 (85.1%) |
| College or Associate's Degree | 356 (44.1%) | 452 (55.9%) |
| Bachelor's Degree | 396 (81.0%) | 93 (19.0%) |
| Graduate Degree | 558 (97.2%) | 16 (2.8%) |
| Total | 1,474 (52.5%) | 1,333 (47.5%) |
Employment Characteristics in Richmond city
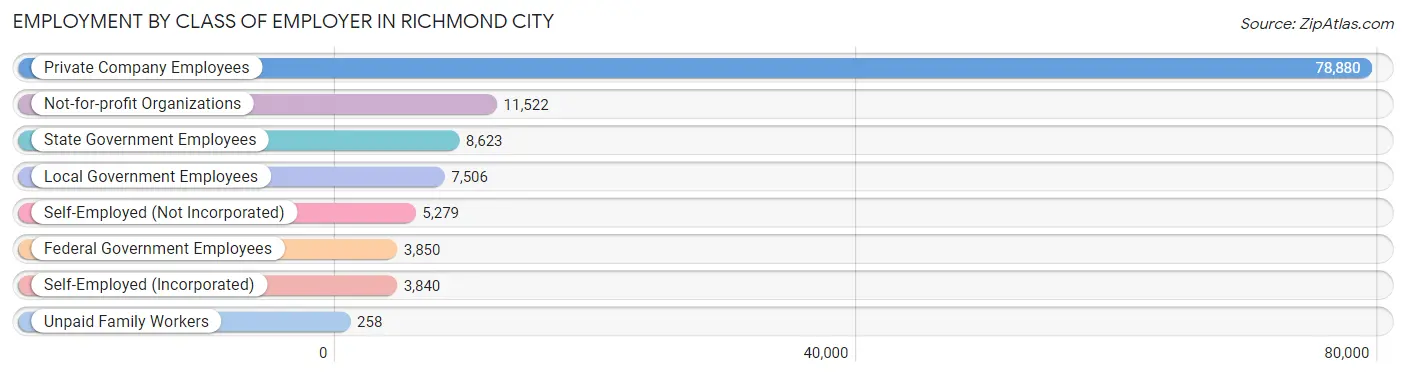
Employment by Class of Employer in Richmond city
Among the 119,758 employed individuals in Richmond city, private company employees (78,880 | 65.9%), not-for-profit organizations (11,522 | 9.6%), and state government employees (8,623 | 7.2%) make up the most common classes of employment.
| Employer Class | # Employees | % Employees |
| Private Company Employees | 78,880 | 65.9% |
| Self-Employed (Incorporated) | 3,840 | 3.2% |
| Self-Employed (Not Incorporated) | 5,279 | 4.4% |
| Not-for-profit Organizations | 11,522 | 9.6% |
| Local Government Employees | 7,506 | 6.3% |
| State Government Employees | 8,623 | 7.2% |
| Federal Government Employees | 3,850 | 3.2% |
| Unpaid Family Workers | 258 | 0.2% |
| Total | 119,758 | 100.0% |
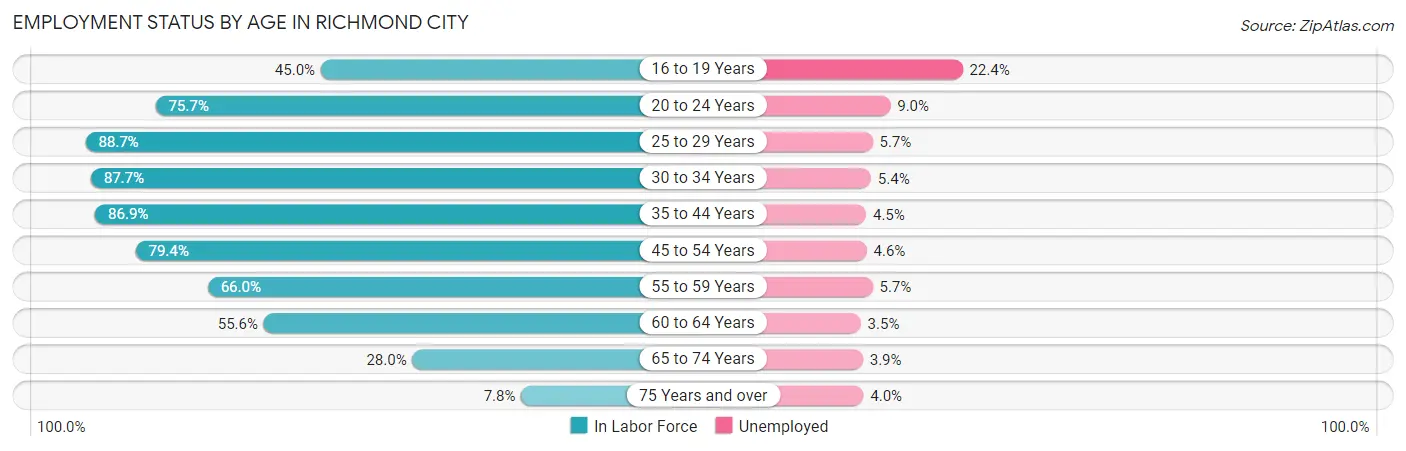
Employment Status by Age in Richmond city
According to the labor force statistics for Richmond city, out of the total population over 16 years of age (191,845), 68.0% or 130,455 individuals are in the labor force, with 6.1% or 7,958 of them unemployed. The age group with the highest labor force participation rate is 25 to 29 years, with 88.7% or 22,607 individuals in the labor force. Within the labor force, the 16 to 19 years age range has the highest percentage of unemployed individuals, with 22.4% or 1,244 of them being unemployed.
| Age Bracket | In Labor Force | Unemployed |
| 16 to 19 Years | 5,553 (45.0%) | 1,244 (22.4%) |
| 20 to 24 Years | 14,081 (75.7%) | 1,267 (9.0%) |
| 25 to 29 Years | 22,607 (88.7%) | 1,289 (5.7%) |
| 30 to 34 Years | 20,668 (87.7%) | 1,116 (5.4%) |
| 35 to 44 Years | 25,520 (86.9%) | 1,148 (4.5%) |
| 45 to 54 Years | 18,747 (79.4%) | 862 (4.6%) |
| 55 to 59 Years | 9,020 (66.0%) | 514 (5.7%) |
| 60 to 64 Years | 7,764 (55.6%) | 272 (3.5%) |
| 65 to 74 Years | 5,512 (28.0%) | 215 (3.9%) |
| 75 Years and over | 901 (7.8%) | 36 (4.0%) |
| Total | 130,455 (68.0%) | 7,958 (6.1%) |
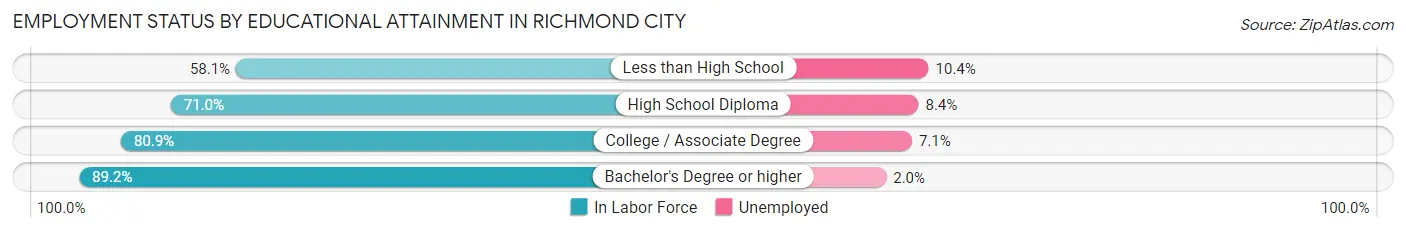
Employment Status by Educational Attainment in Richmond city
According to labor force statistics for Richmond city, 80.5% of individuals (104,379) out of the total population between 25 and 64 years of age (129,663) are in the labor force, with 5.0% or 5,219 of them being unemployed. The group with the highest labor force participation rate are those with the educational attainment of bachelor's degree or higher, with 89.2% or 53,158 individuals in the labor force. Within the labor force, individuals with less than high school education have the highest percentage of unemployment, with 10.4% or 799 of them being unemployed.
| Educational Attainment | In Labor Force | Unemployed |
| Less than High School | 7,678 (58.1%) | 1,374 (10.4%) |
| High School Diploma | 18,205 (71.0%) | 2,154 (8.4%) |
| College / Associate Degree | 25,251 (80.9%) | 2,216 (7.1%) |
| Bachelor's Degree or higher | 53,158 (89.2%) | 1,192 (2.0%) |
| Total | 104,379 (80.5%) | 6,483 (5.0%) |
Employment Occupations by Sex in Richmond city
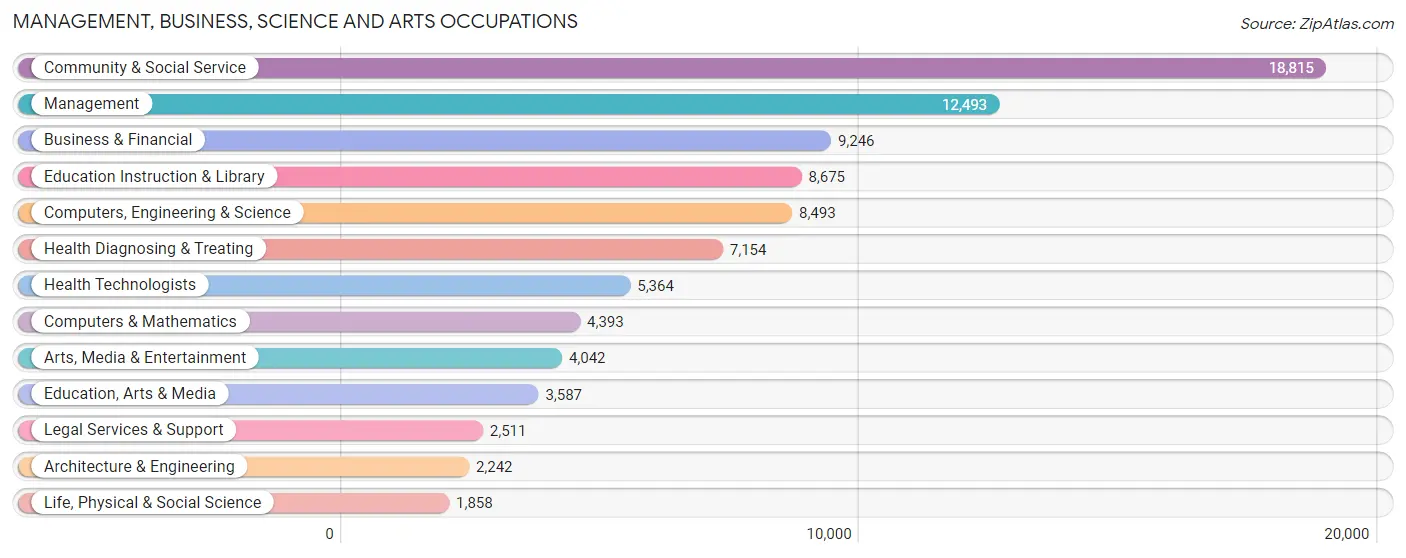
Management, Business, Science and Arts Occupations
The most common Management, Business, Science and Arts occupations in Richmond city are Community & Social Service (18,815 | 15.4%), Management (12,493 | 10.3%), Business & Financial (9,246 | 7.6%), Education Instruction & Library (8,675 | 7.1%), and Computers, Engineering & Science (8,493 | 7.0%).
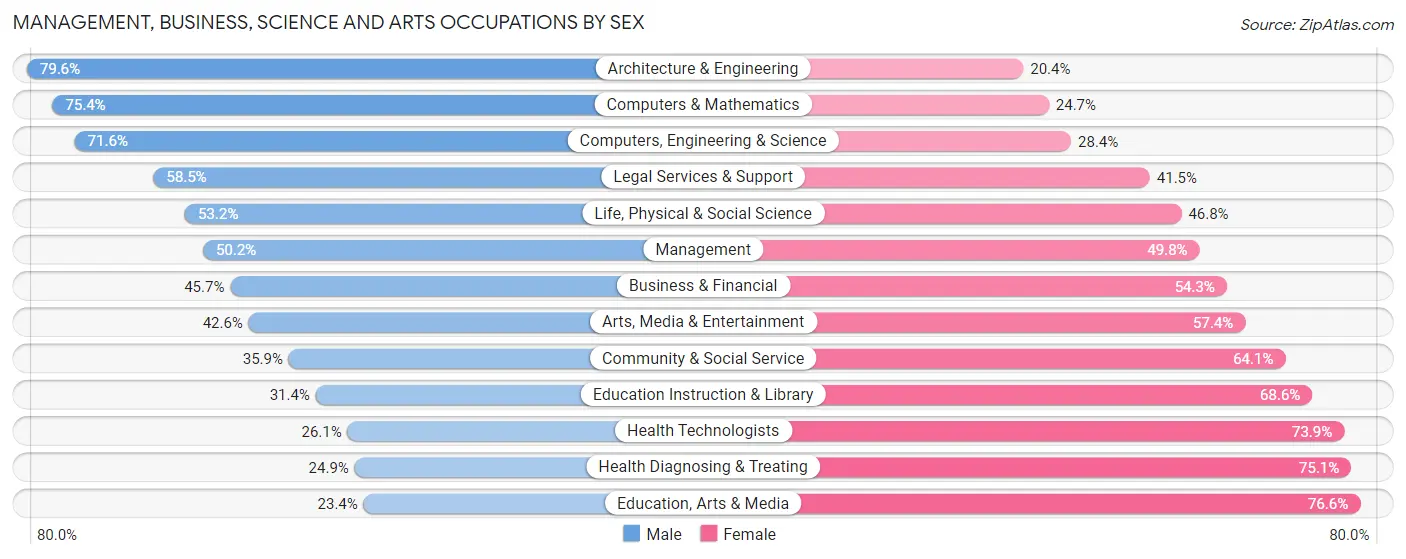
Management, Business, Science and Arts Occupations by Sex
Within the Management, Business, Science and Arts occupations in Richmond city, the most male-oriented occupations are Architecture & Engineering (79.6%), Computers & Mathematics (75.3%), and Computers, Engineering & Science (71.6%), while the most female-oriented occupations are Education, Arts & Media (76.6%), Health Diagnosing & Treating (75.1%), and Health Technologists (73.9%).
| Occupation | Male | Female |
| Management | 6,275 (50.2%) | 6,218 (49.8%) |
| Business & Financial | 4,224 (45.7%) | 5,022 (54.3%) |
| Computers, Engineering & Science | 6,084 (71.6%) | 2,409 (28.4%) |
| Computers & Mathematics | 3,310 (75.3%) | 1,083 (24.6%) |
| Architecture & Engineering | 1,785 (79.6%) | 457 (20.4%) |
| Life, Physical & Social Science | 989 (53.2%) | 869 (46.8%) |
| Community & Social Service | 6,757 (35.9%) | 12,058 (64.1%) |
| Education, Arts & Media | 840 (23.4%) | 2,747 (76.6%) |
| Legal Services & Support | 1,469 (58.5%) | 1,042 (41.5%) |
| Education Instruction & Library | 2,726 (31.4%) | 5,949 (68.6%) |
| Arts, Media & Entertainment | 1,722 (42.6%) | 2,320 (57.4%) |
| Health Diagnosing & Treating | 1,783 (24.9%) | 5,371 (75.1%) |
| Health Technologists | 1,400 (26.1%) | 3,964 (73.9%) |
| Total (Category) | 25,123 (44.7%) | 31,078 (55.3%) |
| Total (Overall) | 58,878 (48.3%) | 62,918 (51.7%) |
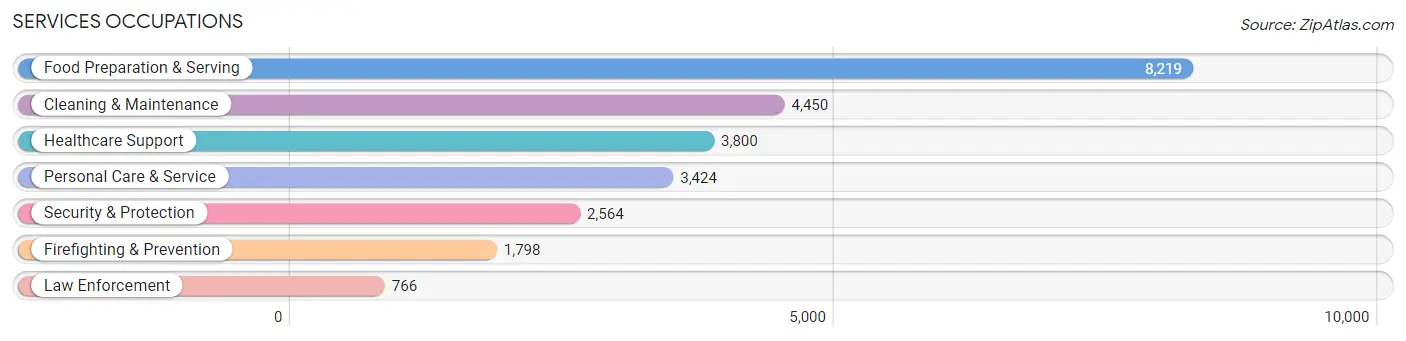
Services Occupations
The most common Services occupations in Richmond city are Food Preparation & Serving (8,219 | 6.8%), Cleaning & Maintenance (4,450 | 3.6%), Healthcare Support (3,800 | 3.1%), Personal Care & Service (3,424 | 2.8%), and Security & Protection (2,564 | 2.1%).
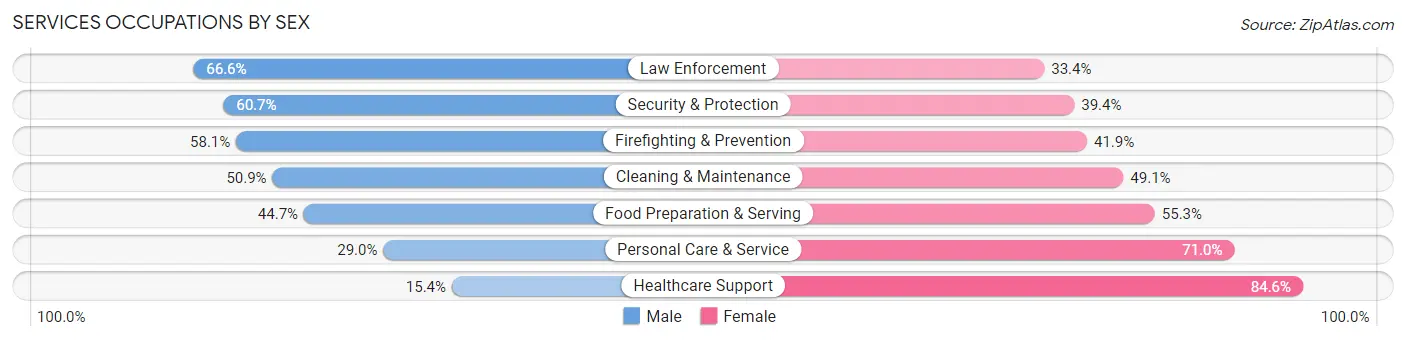
Services Occupations by Sex
Within the Services occupations in Richmond city, the most male-oriented occupations are Law Enforcement (66.6%), Security & Protection (60.7%), and Firefighting & Prevention (58.1%), while the most female-oriented occupations are Healthcare Support (84.6%), Personal Care & Service (71.0%), and Food Preparation & Serving (55.3%).
| Occupation | Male | Female |
| Healthcare Support | 585 (15.4%) | 3,215 (84.6%) |
| Security & Protection | 1,555 (60.7%) | 1,009 (39.4%) |
| Firefighting & Prevention | 1,045 (58.1%) | 753 (41.9%) |
| Law Enforcement | 510 (66.6%) | 256 (33.4%) |
| Food Preparation & Serving | 3,673 (44.7%) | 4,546 (55.3%) |
| Cleaning & Maintenance | 2,266 (50.9%) | 2,184 (49.1%) |
| Personal Care & Service | 992 (29.0%) | 2,432 (71.0%) |
| Total (Category) | 9,071 (40.4%) | 13,386 (59.6%) |
| Total (Overall) | 58,878 (48.3%) | 62,918 (51.7%) |
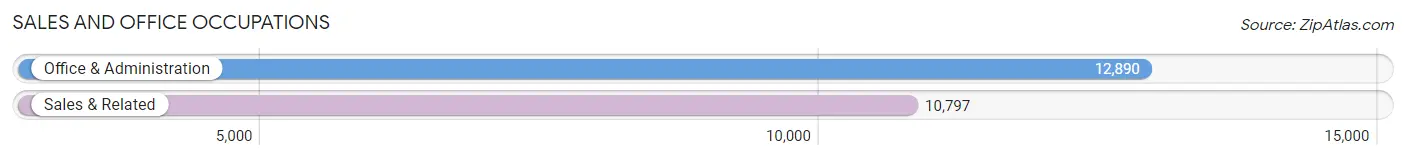
Sales and Office Occupations
The most common Sales and Office occupations in Richmond city are Office & Administration (12,890 | 10.6%), and Sales & Related (10,797 | 8.9%).
Sales and Office Occupations by Sex
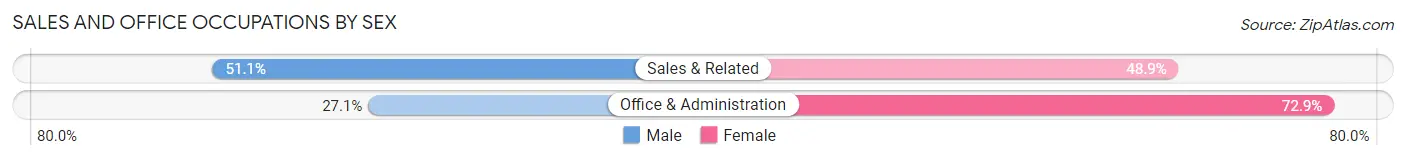
| Occupation | Male | Female |
| Sales & Related | 5,514 (51.1%) | 5,283 (48.9%) |
| Office & Administration | 3,498 (27.1%) | 9,392 (72.9%) |
| Total (Category) | 9,012 (38.1%) | 14,675 (62.0%) |
| Total (Overall) | 58,878 (48.3%) | 62,918 (51.7%) |
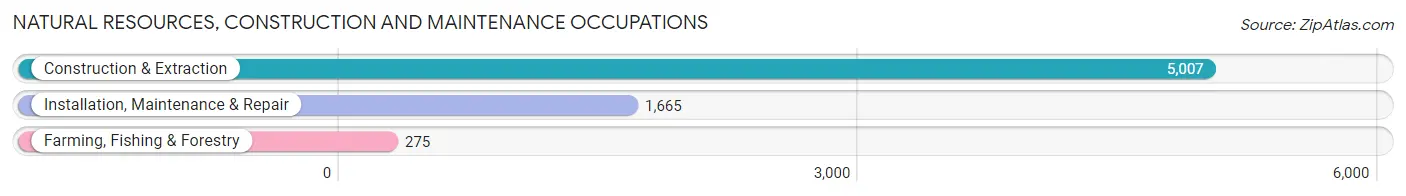
Natural Resources, Construction and Maintenance Occupations
The most common Natural Resources, Construction and Maintenance occupations in Richmond city are Construction & Extraction (5,007 | 4.1%), Installation, Maintenance & Repair (1,665 | 1.4%), and Farming, Fishing & Forestry (275 | 0.2%).
Natural Resources, Construction and Maintenance Occupations by Sex
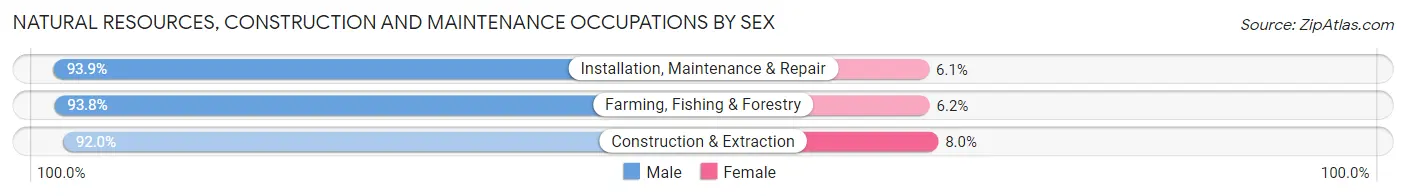
| Occupation | Male | Female |
| Farming, Fishing & Forestry | 258 (93.8%) | 17 (6.2%) |
| Construction & Extraction | 4,608 (92.0%) | 399 (8.0%) |
| Installation, Maintenance & Repair | 1,564 (93.9%) | 101 (6.1%) |
| Total (Category) | 6,430 (92.6%) | 517 (7.4%) |
| Total (Overall) | 58,878 (48.3%) | 62,918 (51.7%) |
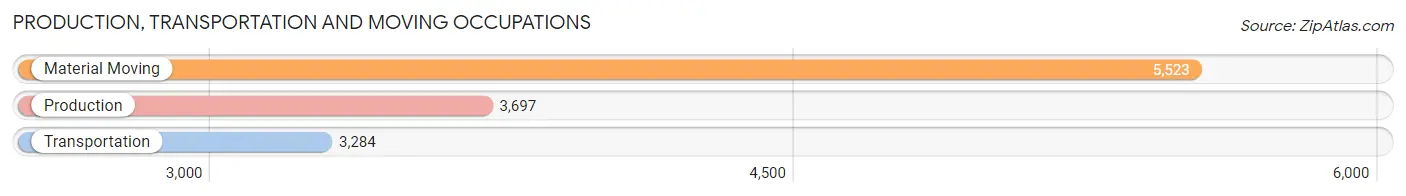
Production, Transportation and Moving Occupations
The most common Production, Transportation and Moving occupations in Richmond city are Material Moving (5,523 | 4.5%), Production (3,697 | 3.0%), and Transportation (3,284 | 2.7%).
Production, Transportation and Moving Occupations by Sex
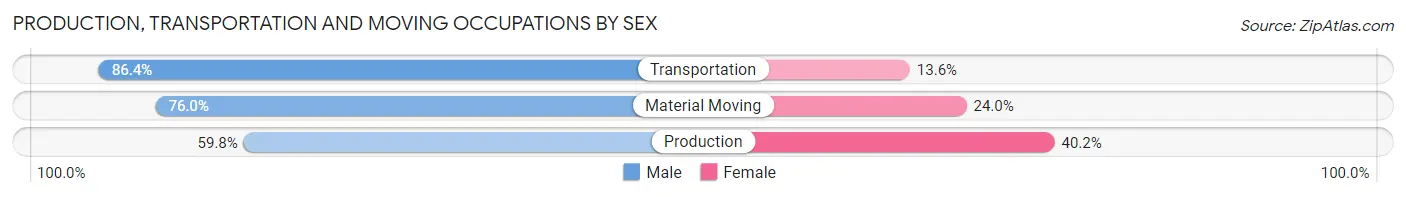
| Occupation | Male | Female |
| Production | 2,211 (59.8%) | 1,486 (40.2%) |
| Transportation | 2,836 (86.4%) | 448 (13.6%) |
| Material Moving | 4,195 (76.0%) | 1,328 (24.0%) |
| Total (Category) | 9,242 (73.9%) | 3,262 (26.1%) |
| Total (Overall) | 58,878 (48.3%) | 62,918 (51.7%) |
Employment Industries by Sex in Richmond city
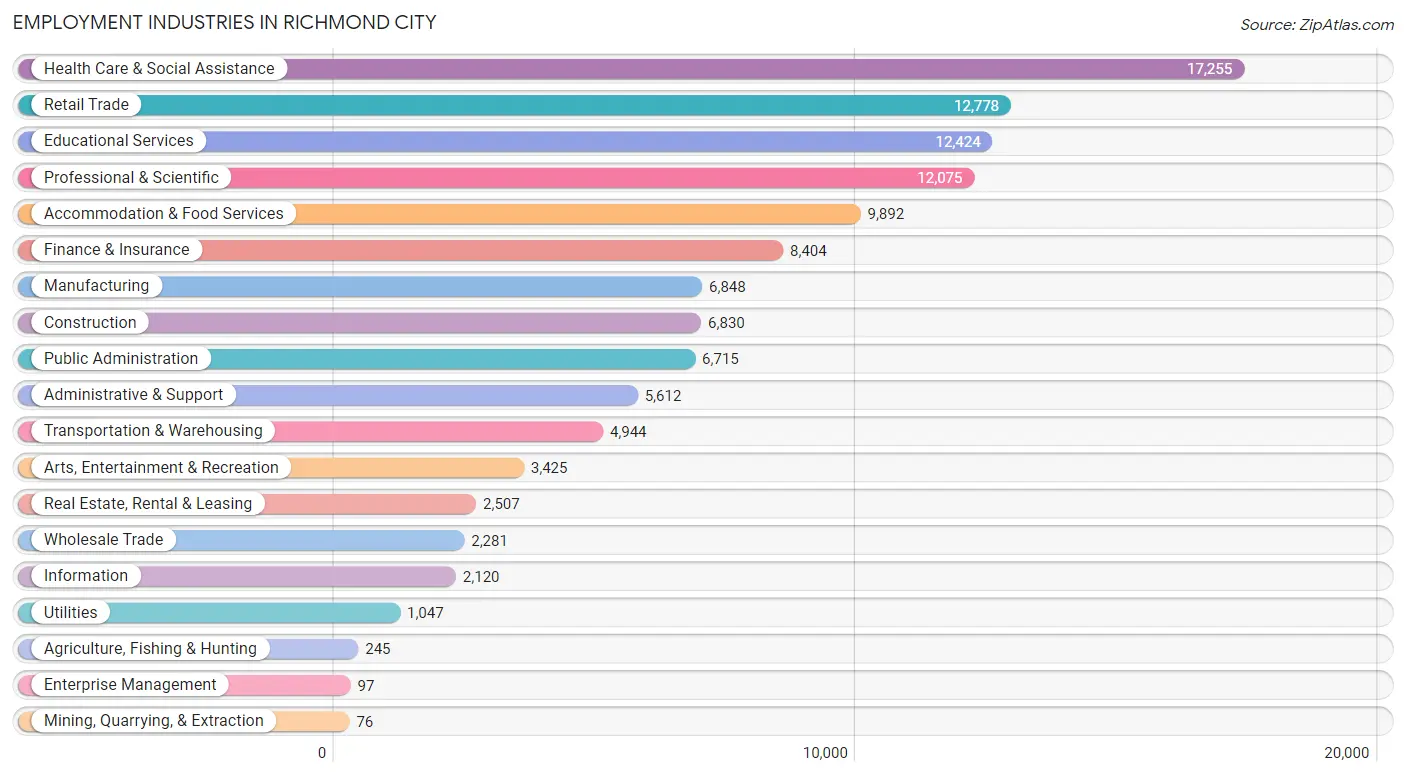
Employment Industries in Richmond city
The major employment industries in Richmond city include Health Care & Social Assistance (17,255 | 14.2%), Retail Trade (12,778 | 10.5%), Educational Services (12,424 | 10.2%), Professional & Scientific (12,075 | 9.9%), and Accommodation & Food Services (9,892 | 8.1%).
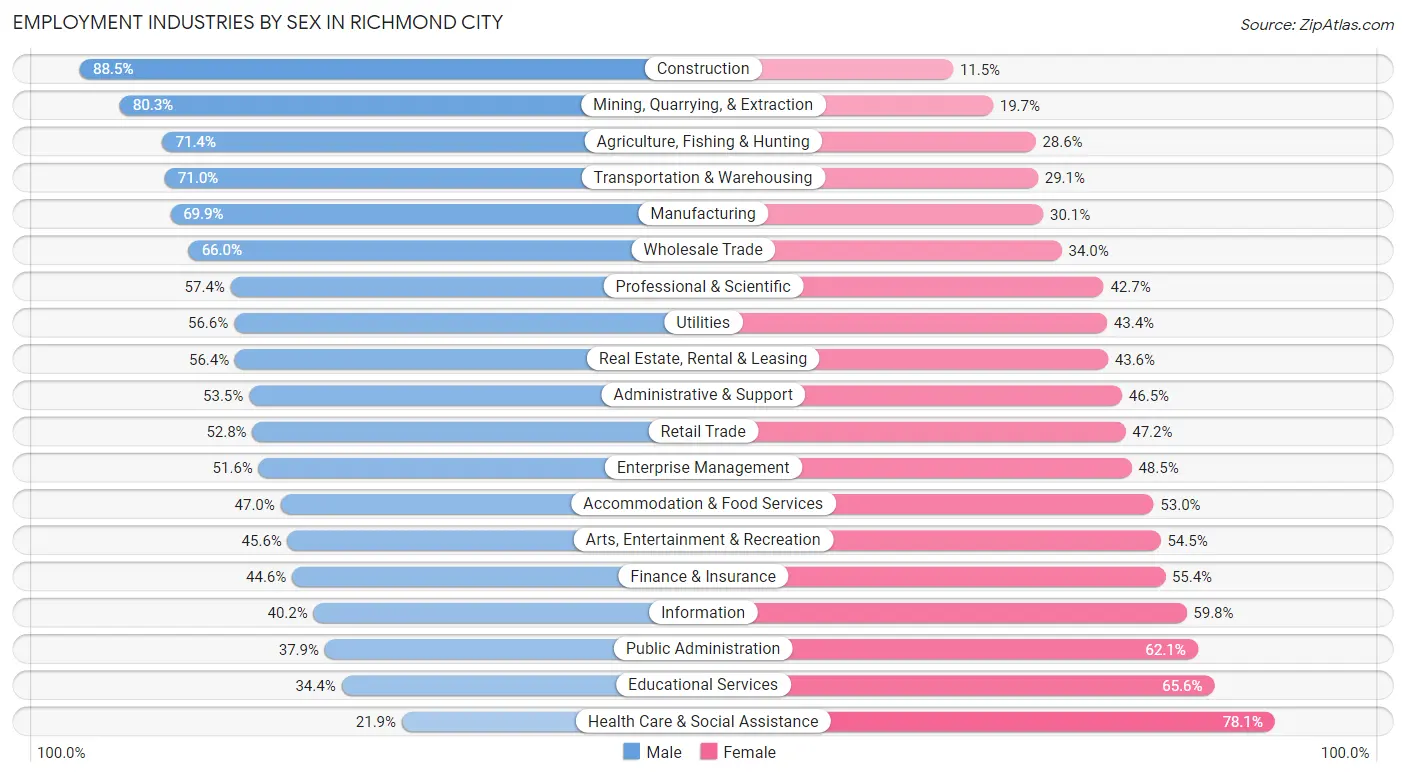
Employment Industries by Sex in Richmond city
The Richmond city industries that see more men than women are Construction (88.5%), Mining, Quarrying, & Extraction (80.3%), and Agriculture, Fishing & Hunting (71.4%), whereas the industries that tend to have a higher number of women are Health Care & Social Assistance (78.1%), Educational Services (65.6%), and Public Administration (62.1%).
| Industry | Male | Female |
| Agriculture, Fishing & Hunting | 175 (71.4%) | 70 (28.6%) |
| Mining, Quarrying, & Extraction | 61 (80.3%) | 15 (19.7%) |
| Construction | 6,045 (88.5%) | 785 (11.5%) |
| Manufacturing | 4,784 (69.9%) | 2,064 (30.1%) |
| Wholesale Trade | 1,506 (66.0%) | 775 (34.0%) |
| Retail Trade | 6,752 (52.8%) | 6,026 (47.2%) |
| Transportation & Warehousing | 3,508 (71.0%) | 1,436 (29.0%) |
| Utilities | 593 (56.6%) | 454 (43.4%) |
| Information | 852 (40.2%) | 1,268 (59.8%) |
| Finance & Insurance | 3,751 (44.6%) | 4,653 (55.4%) |
| Real Estate, Rental & Leasing | 1,415 (56.4%) | 1,092 (43.6%) |
| Professional & Scientific | 6,925 (57.4%) | 5,150 (42.6%) |
| Enterprise Management | 50 (51.5%) | 47 (48.4%) |
| Administrative & Support | 3,004 (53.5%) | 2,608 (46.5%) |
| Educational Services | 4,275 (34.4%) | 8,149 (65.6%) |
| Health Care & Social Assistance | 3,780 (21.9%) | 13,475 (78.1%) |
| Arts, Entertainment & Recreation | 1,560 (45.6%) | 1,865 (54.4%) |
| Accommodation & Food Services | 4,650 (47.0%) | 5,242 (53.0%) |
| Public Administration | 2,542 (37.9%) | 4,173 (62.1%) |
| Total | 58,878 (48.3%) | 62,918 (51.7%) |
Education in Richmond city
School Enrollment in Richmond city
The most common levels of schooling among the 54,078 students in Richmond city are college / undergraduate (20,018 | 37.0%), elementary school (8,125 | 15.0%), and middle school (7,917 | 14.6%).
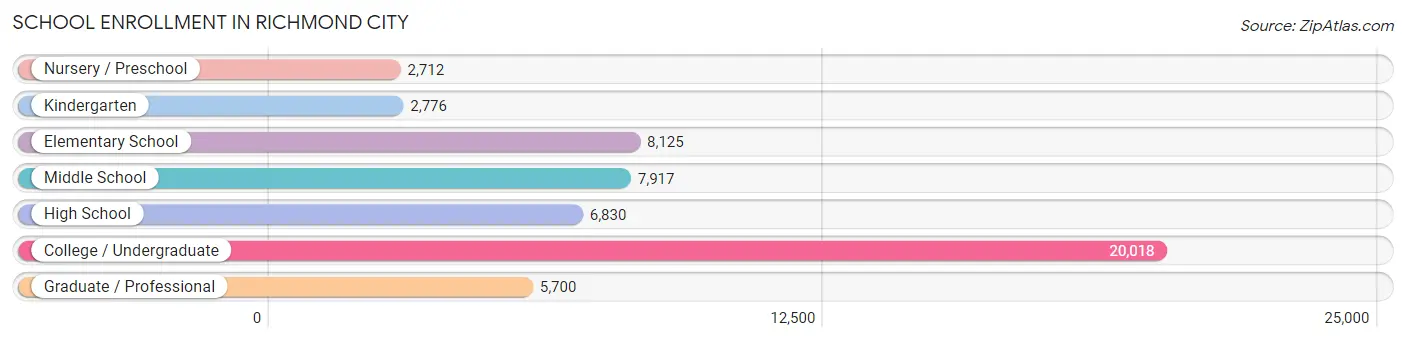
| School Level | # Students | % Students |
| Nursery / Preschool | 2,712 | 5.0% |
| Kindergarten | 2,776 | 5.1% |
| Elementary School | 8,125 | 15.0% |
| Middle School | 7,917 | 14.6% |
| High School | 6,830 | 12.6% |
| College / Undergraduate | 20,018 | 37.0% |
| Graduate / Professional | 5,700 | 10.5% |
| Total | 54,078 | 100.0% |
School Enrollment by Age by Funding Source in Richmond city
Out of a total of 54,078 students who are enrolled in schools in Richmond city, 10,599 (19.6%) attend a private institution, while the remaining 43,479 (80.4%) are enrolled in public schools. The age group of 3 to 4 year olds has the highest likelihood of being enrolled in private schools, with 1,222 (51.2% in the age bracket) enrolled. Conversely, the age group of 5 to 9 year old has the lowest likelihood of being enrolled in a private school, with 8,589 (86.1% in the age bracket) attending a public institution.
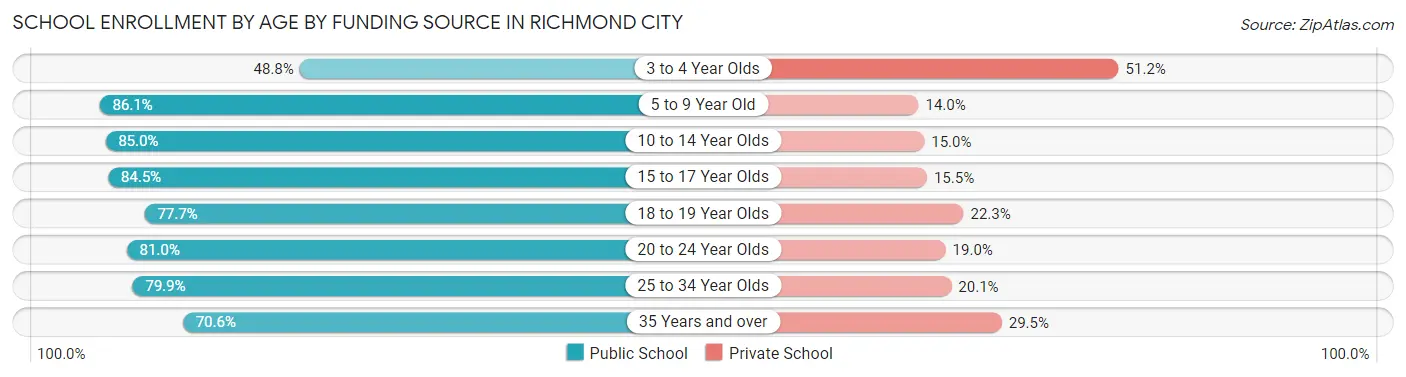
| Age Bracket | Public School | Private School |
| 3 to 4 Year Olds | 1,164 (48.8%) | 1,222 (51.2%) |
| 5 to 9 Year Old | 8,589 (86.1%) | 1,392 (14.0%) |
| 10 to 14 Year Olds | 8,330 (85.0%) | 1,472 (15.0%) |
| 15 to 17 Year Olds | 4,349 (84.5%) | 799 (15.5%) |
| 18 to 19 Year Olds | 5,903 (77.7%) | 1,697 (22.3%) |
| 20 to 24 Year Olds | 7,811 (81.0%) | 1,832 (19.0%) |
| 25 to 34 Year Olds | 5,157 (79.9%) | 1,295 (20.1%) |
| 35 Years and over | 2,163 (70.6%) | 903 (29.4%) |
| Total | 43,479 (80.4%) | 10,599 (19.6%) |
Educational Attainment by Field of Study in Richmond city
Business (11,938 | 15.2%), social sciences (9,256 | 11.8%), visual & performing arts (6,629 | 8.4%), literature & languages (6,134 | 7.8%), and arts & humanities (5,580 | 7.1%) are the most common fields of study among 78,571 individuals in Richmond city who have obtained a bachelor's degree or higher.
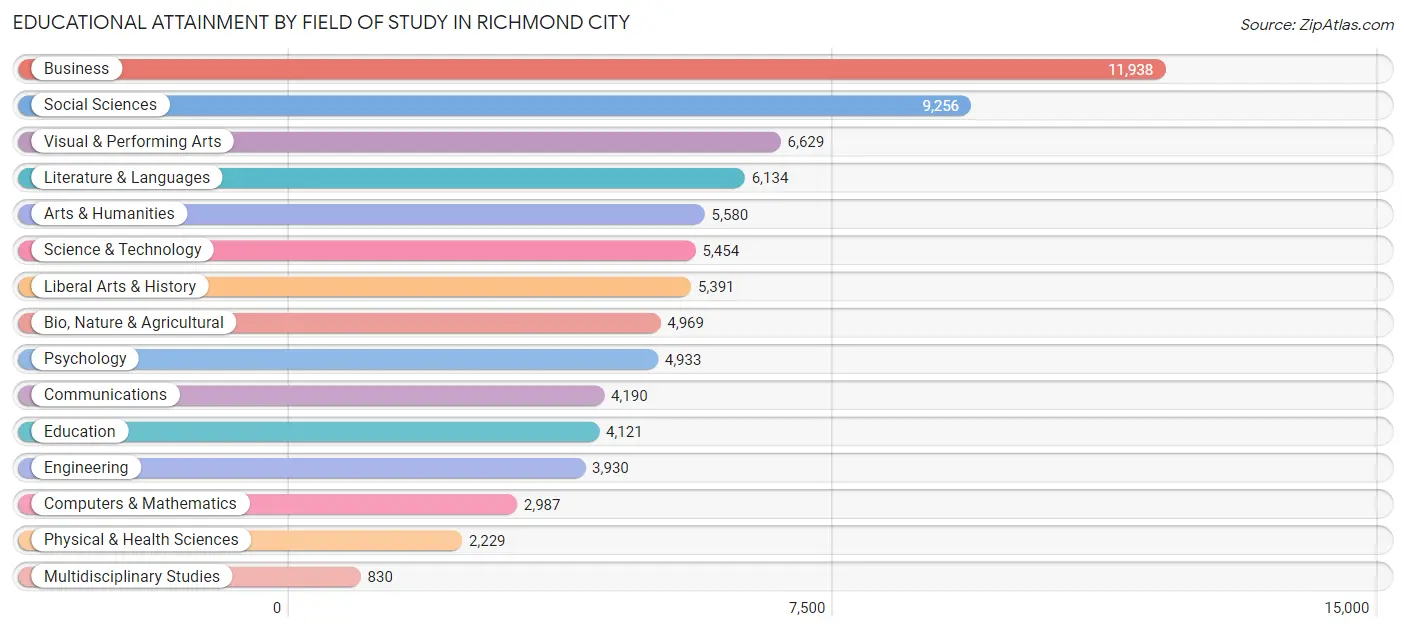
| Field of Study | # Graduates | % Graduates |
| Computers & Mathematics | 2,987 | 3.8% |
| Bio, Nature & Agricultural | 4,969 | 6.3% |
| Physical & Health Sciences | 2,229 | 2.8% |
| Psychology | 4,933 | 6.3% |
| Social Sciences | 9,256 | 11.8% |
| Engineering | 3,930 | 5.0% |
| Multidisciplinary Studies | 830 | 1.1% |
| Science & Technology | 5,454 | 6.9% |
| Business | 11,938 | 15.2% |
| Education | 4,121 | 5.2% |
| Literature & Languages | 6,134 | 7.8% |
| Liberal Arts & History | 5,391 | 6.9% |
| Visual & Performing Arts | 6,629 | 8.4% |
| Communications | 4,190 | 5.3% |
| Arts & Humanities | 5,580 | 7.1% |
| Total | 78,571 | 100.0% |
Transportation & Commute in Richmond city
Vehicle Availability by Sex in Richmond city
The most prevalent vehicle ownership categories in Richmond city are males with 2 vehicles (24,060, accounting for 41.7%) and females with 2 vehicles (23,209, making up 40.5%).
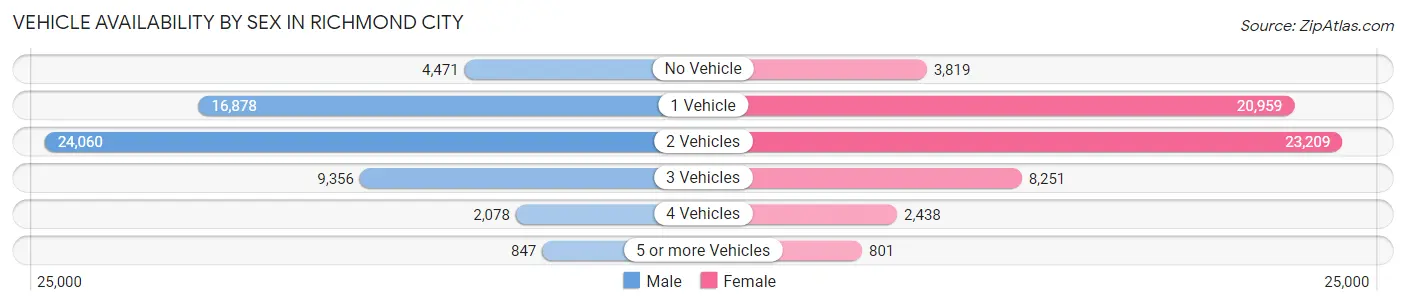
| Vehicles Available | Male | Female |
| No Vehicle | 4,471 (7.7%) | 3,819 (6.4%) |
| 1 Vehicle | 16,878 (29.3%) | 20,959 (35.2%) |
| 2 Vehicles | 24,060 (41.7%) | 23,209 (39.0%) |
| 3 Vehicles | 9,356 (16.2%) | 8,251 (13.9%) |
| 4 Vehicles | 2,078 (3.6%) | 2,438 (4.1%) |
| 5 or more Vehicles | 847 (1.5%) | 801 (1.3%) |
| Total | 57,690 (100.0%) | 59,477 (100.0%) |
Commute Time in Richmond city
The most frequently occuring commute durations in Richmond city are 15 to 19 minutes (23,078 commuters, 22.5%), 20 to 24 minutes (18,630 commuters, 18.1%), and 10 to 14 minutes (16,233 commuters, 15.8%).
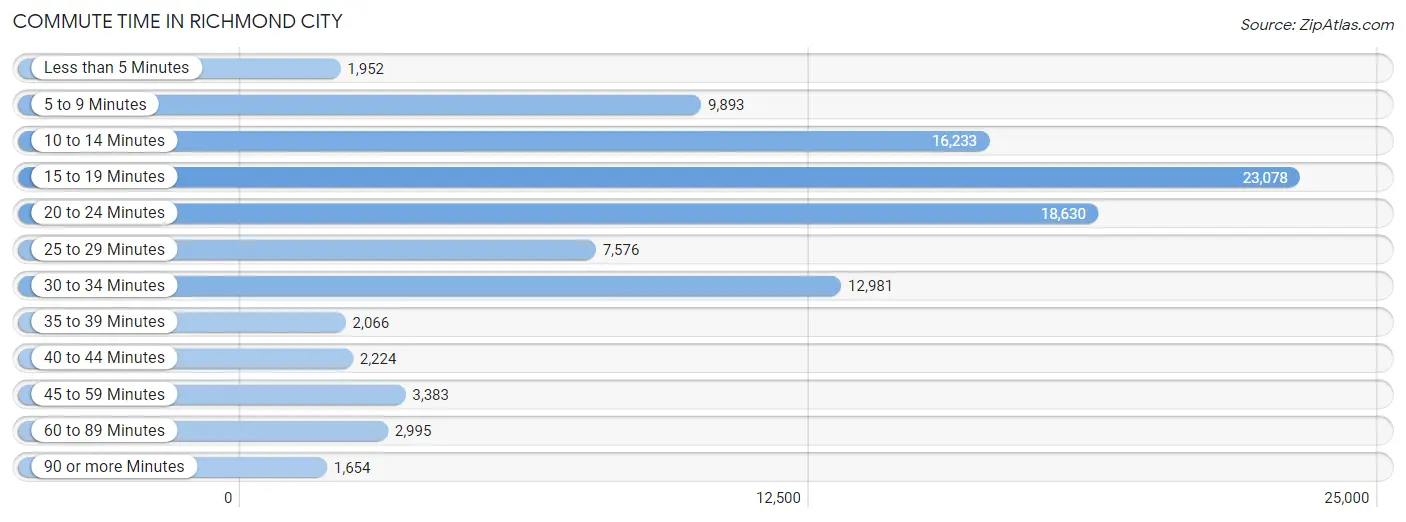
| Commute Time | # Commuters | % Commuters |
| Less than 5 Minutes | 1,952 | 1.9% |
| 5 to 9 Minutes | 9,893 | 9.6% |
| 10 to 14 Minutes | 16,233 | 15.8% |
| 15 to 19 Minutes | 23,078 | 22.5% |
| 20 to 24 Minutes | 18,630 | 18.1% |
| 25 to 29 Minutes | 7,576 | 7.4% |
| 30 to 34 Minutes | 12,981 | 12.6% |
| 35 to 39 Minutes | 2,066 | 2.0% |
| 40 to 44 Minutes | 2,224 | 2.2% |
| 45 to 59 Minutes | 3,383 | 3.3% |
| 60 to 89 Minutes | 2,995 | 2.9% |
| 90 or more Minutes | 1,654 | 1.6% |
Commute Time by Sex in Richmond city
The most common commute times in Richmond city are 15 to 19 minutes (11,287 commuters, 22.5%) for males and 15 to 19 minutes (11,791 commuters, 22.4%) for females.
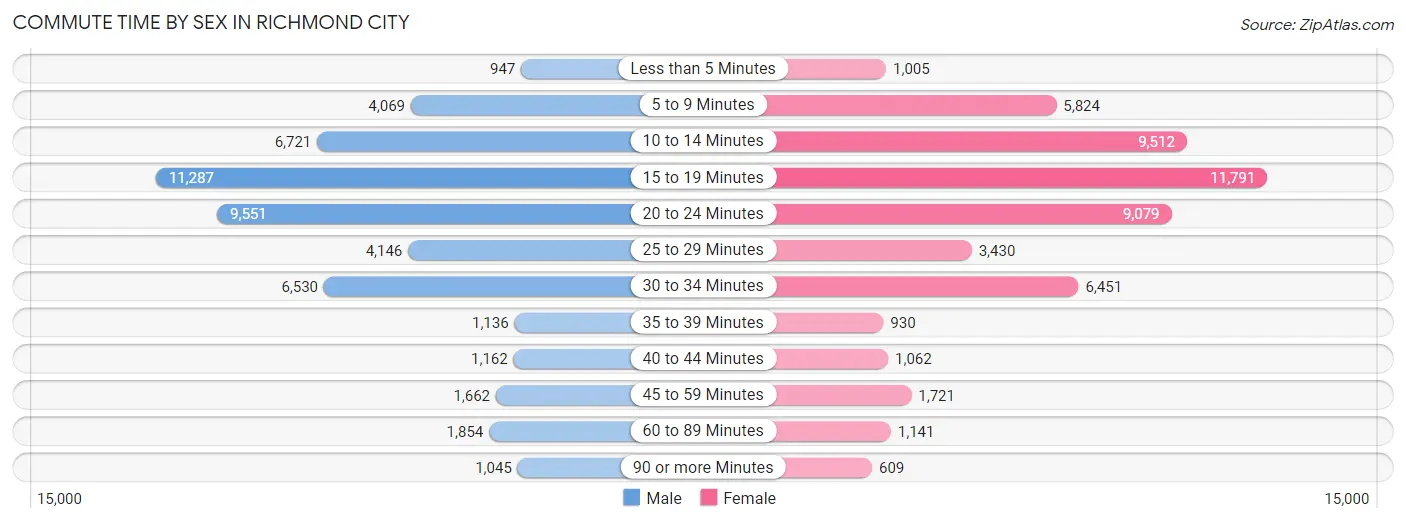
| Commute Time | Male | Female |
| Less than 5 Minutes | 947 (1.9%) | 1,005 (1.9%) |
| 5 to 9 Minutes | 4,069 (8.1%) | 5,824 (11.1%) |
| 10 to 14 Minutes | 6,721 (13.4%) | 9,512 (18.1%) |
| 15 to 19 Minutes | 11,287 (22.5%) | 11,791 (22.4%) |
| 20 to 24 Minutes | 9,551 (19.1%) | 9,079 (17.3%) |
| 25 to 29 Minutes | 4,146 (8.3%) | 3,430 (6.5%) |
| 30 to 34 Minutes | 6,530 (13.0%) | 6,451 (12.3%) |
| 35 to 39 Minutes | 1,136 (2.3%) | 930 (1.8%) |
| 40 to 44 Minutes | 1,162 (2.3%) | 1,062 (2.0%) |
| 45 to 59 Minutes | 1,662 (3.3%) | 1,721 (3.3%) |
| 60 to 89 Minutes | 1,854 (3.7%) | 1,141 (2.2%) |
| 90 or more Minutes | 1,045 (2.1%) | 609 (1.2%) |
Time of Departure to Work by Sex in Richmond city
The most frequent times of departure to work in Richmond city are 8:00 AM to 8:29 AM (7,394, 14.8%) for males and 8:00 AM to 8:29 AM (8,484, 16.1%) for females.
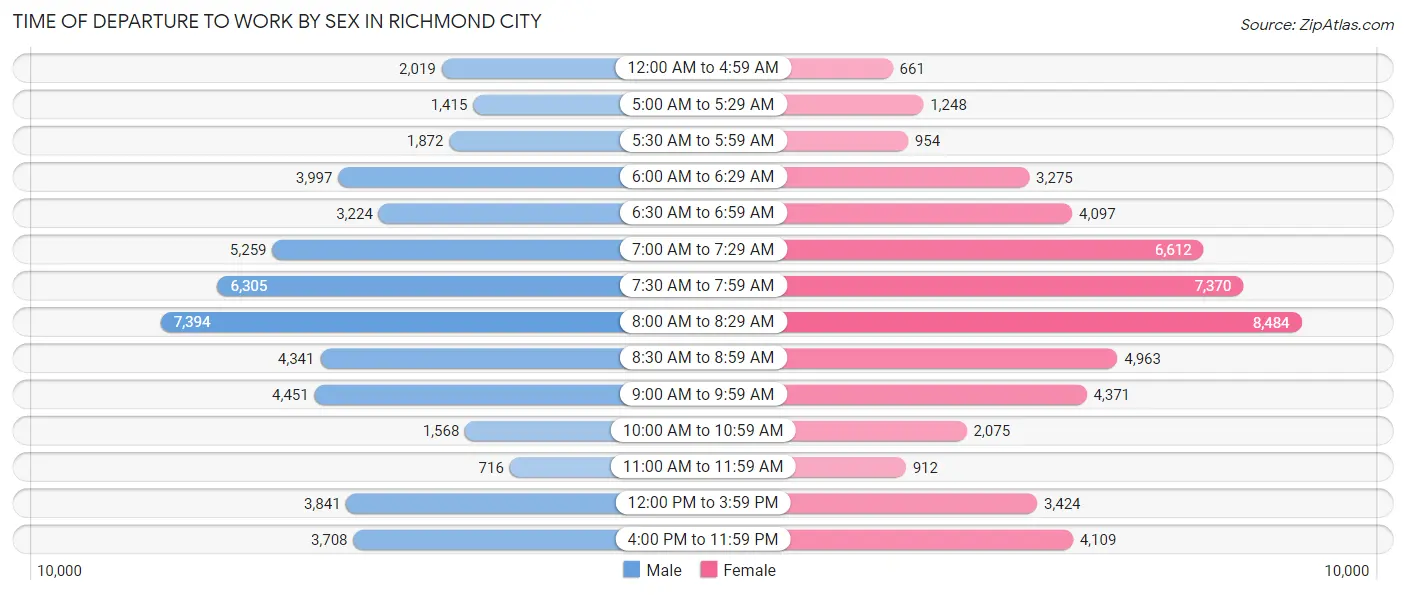
| Time of Departure | Male | Female |
| 12:00 AM to 4:59 AM | 2,019 (4.0%) | 661 (1.3%) |
| 5:00 AM to 5:29 AM | 1,415 (2.8%) | 1,248 (2.4%) |
| 5:30 AM to 5:59 AM | 1,872 (3.7%) | 954 (1.8%) |
| 6:00 AM to 6:29 AM | 3,997 (8.0%) | 3,275 (6.2%) |
| 6:30 AM to 6:59 AM | 3,224 (6.4%) | 4,097 (7.8%) |
| 7:00 AM to 7:29 AM | 5,259 (10.5%) | 6,612 (12.6%) |
| 7:30 AM to 7:59 AM | 6,305 (12.6%) | 7,370 (14.0%) |
| 8:00 AM to 8:29 AM | 7,394 (14.8%) | 8,484 (16.1%) |
| 8:30 AM to 8:59 AM | 4,341 (8.7%) | 4,963 (9.4%) |
| 9:00 AM to 9:59 AM | 4,451 (8.9%) | 4,371 (8.3%) |
| 10:00 AM to 10:59 AM | 1,568 (3.1%) | 2,075 (4.0%) |
| 11:00 AM to 11:59 AM | 716 (1.4%) | 912 (1.7%) |
| 12:00 PM to 3:59 PM | 3,841 (7.7%) | 3,424 (6.5%) |
| 4:00 PM to 11:59 PM | 3,708 (7.4%) | 4,109 (7.8%) |
| Total | 50,110 (100.0%) | 52,555 (100.0%) |
Housing Occupancy in Richmond city
Occupancy by Ownership in Richmond city
Of the total 101,201 dwellings in Richmond city, owner-occupied units account for 43,752 (43.2%), while renter-occupied units make up 57,449 (56.8%).
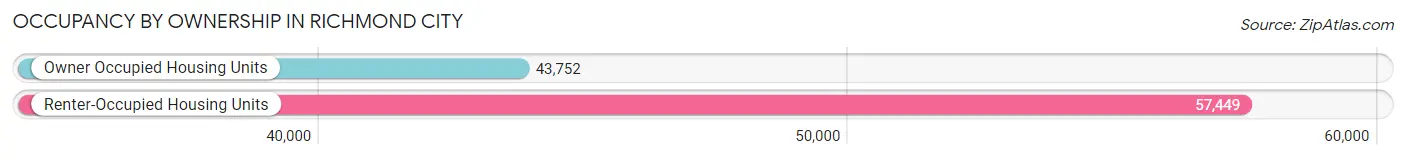
| Occupancy | # Housing Units | % Housing Units |
| Owner Occupied Housing Units | 43,752 | 43.2% |
| Renter-Occupied Housing Units | 57,449 | 56.8% |
| Total Occupied Housing Units | 101,201 | 100.0% |
Occupancy by Household Size in Richmond city
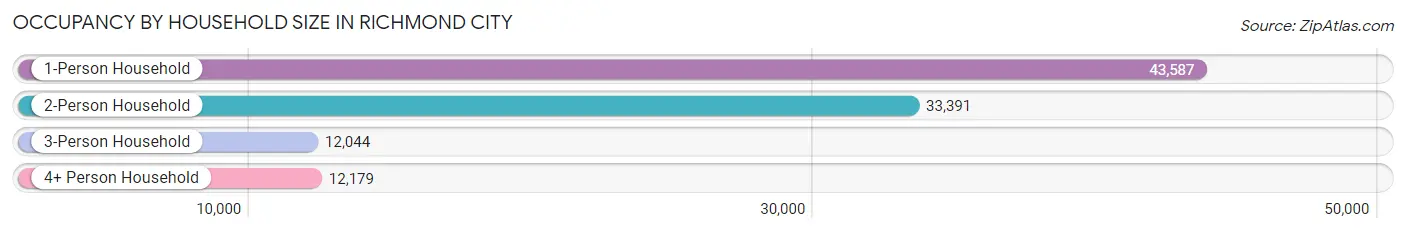
| Household Size | # Housing Units | % Housing Units |
| 1-Person Household | 43,587 | 43.1% |
| 2-Person Household | 33,391 | 33.0% |
| 3-Person Household | 12,044 | 11.9% |
| 4+ Person Household | 12,179 | 12.0% |
| Total Housing Units | 101,201 | 100.0% |
Occupancy by Ownership by Household Size in Richmond city
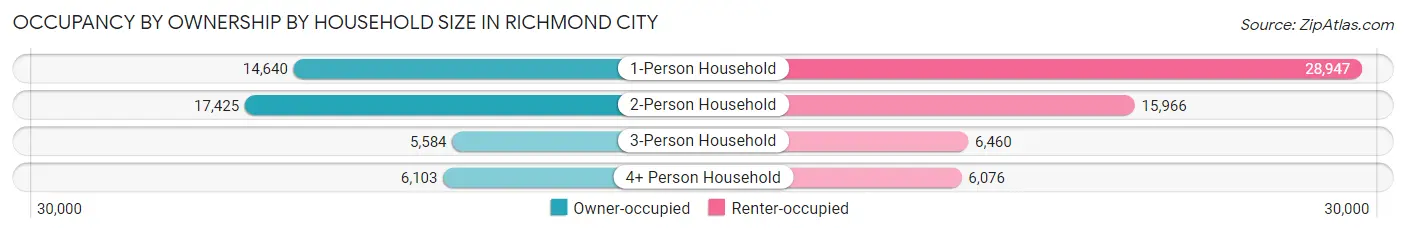
| Household Size | Owner-occupied | Renter-occupied |
| 1-Person Household | 14,640 (33.6%) | 28,947 (66.4%) |
| 2-Person Household | 17,425 (52.2%) | 15,966 (47.8%) |
| 3-Person Household | 5,584 (46.4%) | 6,460 (53.6%) |
| 4+ Person Household | 6,103 (50.1%) | 6,076 (49.9%) |
| Total Housing Units | 43,752 (43.2%) | 57,449 (56.8%) |
Occupancy by Educational Attainment in Richmond city
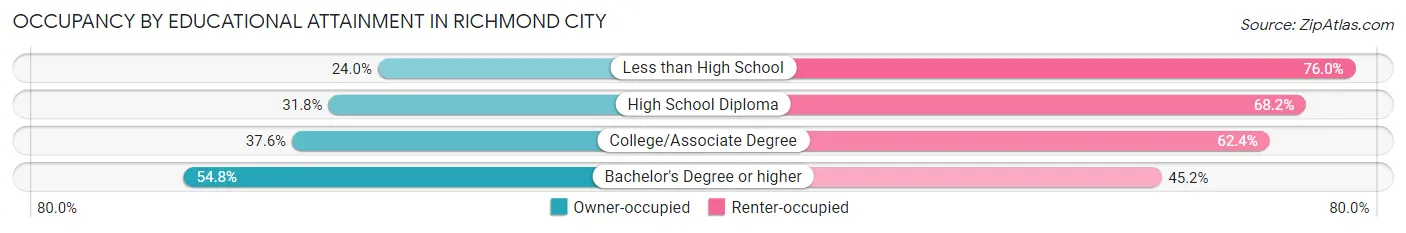
| Household Size | Owner-occupied | Renter-occupied |
| Less than High School | 2,308 (24.0%) | 7,313 (76.0%) |
| High School Diploma | 5,778 (31.8%) | 12,383 (68.2%) |
| College/Associate Degree | 9,956 (37.6%) | 16,522 (62.4%) |
| Bachelor's Degree or higher | 25,710 (54.8%) | 21,231 (45.2%) |
Occupancy by Age of Householder in Richmond city
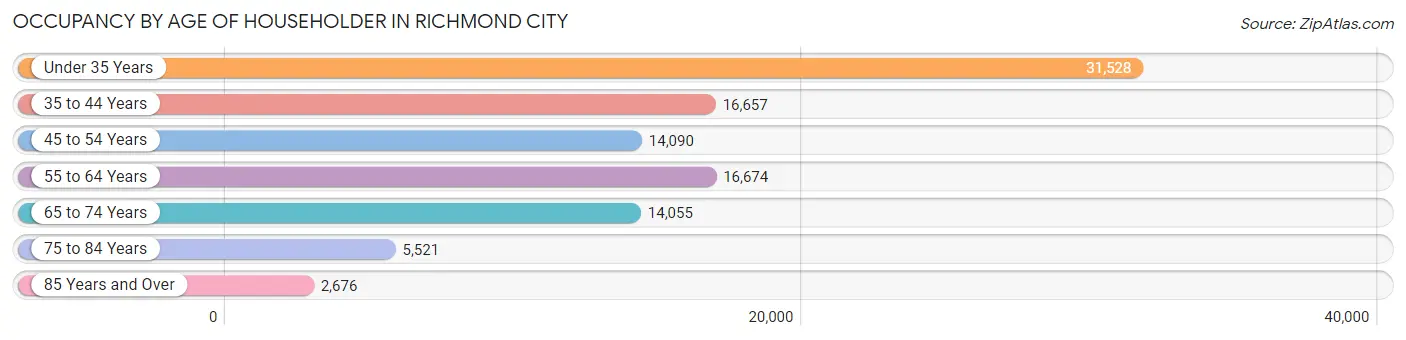
| Age Bracket | # Households | % Households |
| Under 35 Years | 31,528 | 31.1% |
| 35 to 44 Years | 16,657 | 16.5% |
| 45 to 54 Years | 14,090 | 13.9% |
| 55 to 64 Years | 16,674 | 16.5% |
| 65 to 74 Years | 14,055 | 13.9% |
| 75 to 84 Years | 5,521 | 5.5% |
| 85 Years and Over | 2,676 | 2.6% |
| Total | 101,201 | 100.0% |
Housing Finances in Richmond city
Median Income by Occupancy in Richmond city
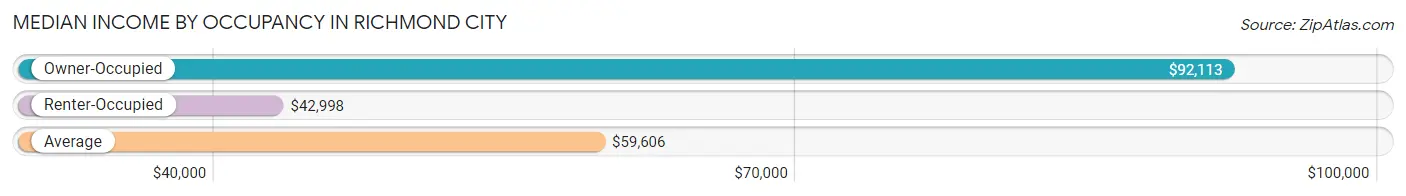
| Occupancy Type | # Households | Median Income |
| Owner-Occupied | 43,752 (43.2%) | $92,113 |
| Renter-Occupied | 57,449 (56.8%) | $42,998 |
| Average | 101,201 (100.0%) | $59,606 |
Occupancy by Householder Income Bracket in Richmond city
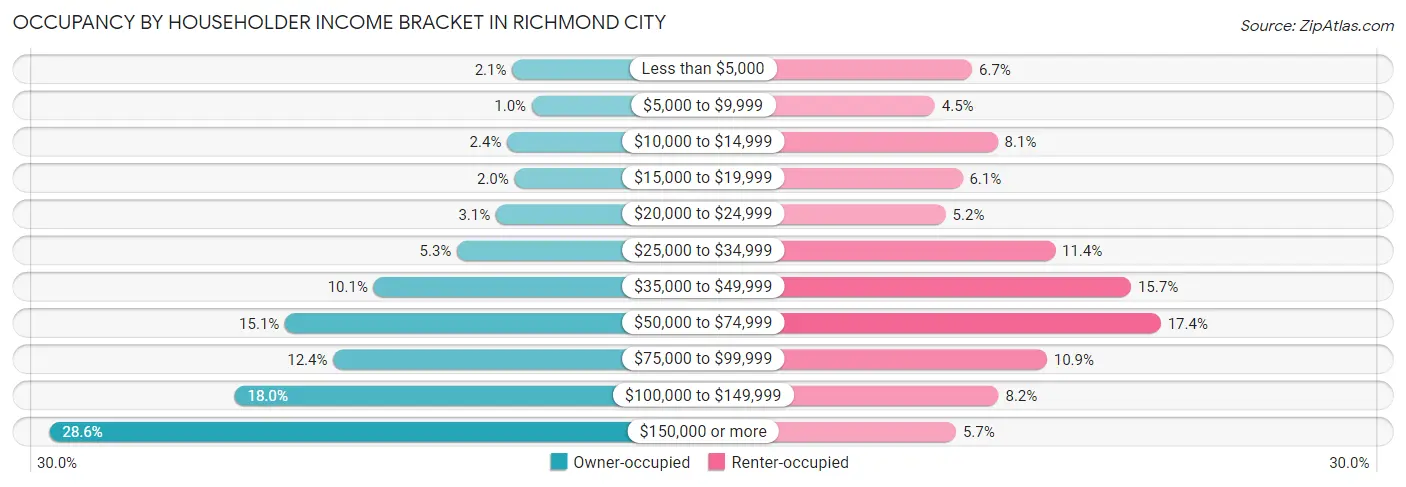
| Income Bracket | Owner-occupied | Renter-occupied |
| Less than $5,000 | 932 (2.1%) | 3,824 (6.7%) |
| $5,000 to $9,999 | 442 (1.0%) | 2,605 (4.5%) |
| $10,000 to $14,999 | 1,059 (2.4%) | 4,667 (8.1%) |
| $15,000 to $19,999 | 874 (2.0%) | 3,513 (6.1%) |
| $20,000 to $24,999 | 1,338 (3.1%) | 2,961 (5.1%) |
| $25,000 to $34,999 | 2,311 (5.3%) | 6,548 (11.4%) |
| $35,000 to $49,999 | 4,395 (10.1%) | 9,043 (15.7%) |
| $50,000 to $74,999 | 6,610 (15.1%) | 10,017 (17.4%) |
| $75,000 to $99,999 | 5,408 (12.4%) | 6,281 (10.9%) |
| $100,000 to $149,999 | 7,877 (18.0%) | 4,694 (8.2%) |
| $150,000 or more | 12,506 (28.6%) | 3,296 (5.7%) |
| Total | 43,752 (100.0%) | 57,449 (100.0%) |
Monthly Housing Cost Tiers in Richmond city
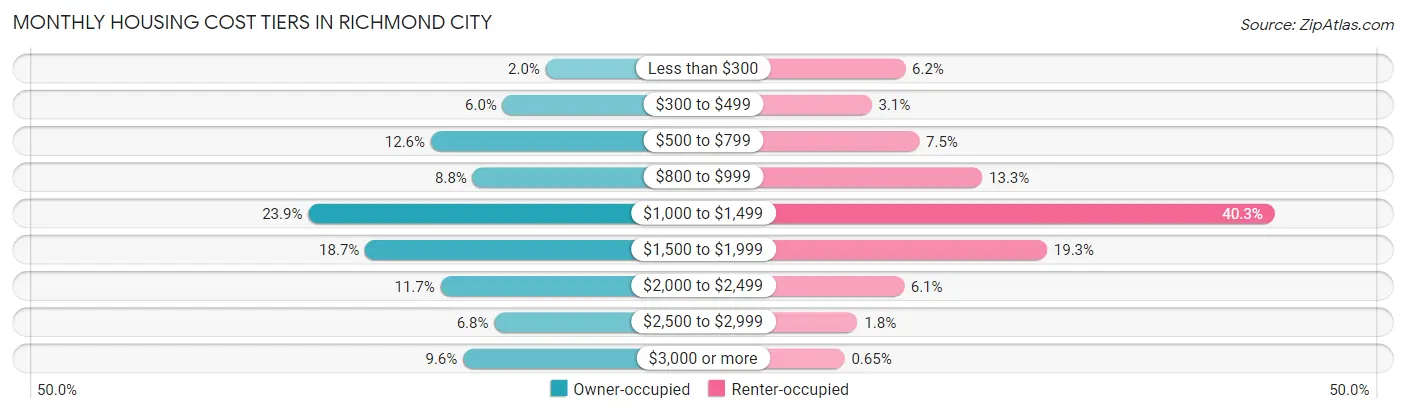
| Monthly Cost | Owner-occupied | Renter-occupied |
| Less than $300 | 889 (2.0%) | 3,577 (6.2%) |
| $300 to $499 | 2,621 (6.0%) | 1,804 (3.1%) |
| $500 to $799 | 5,511 (12.6%) | 4,321 (7.5%) |
| $800 to $999 | 3,828 (8.7%) | 7,650 (13.3%) |
| $1,000 to $1,499 | 10,451 (23.9%) | 23,125 (40.3%) |
| $1,500 to $1,999 | 8,158 (18.6%) | 11,079 (19.3%) |
| $2,000 to $2,499 | 5,123 (11.7%) | 3,509 (6.1%) |
| $2,500 to $2,999 | 2,957 (6.8%) | 1,055 (1.8%) |
| $3,000 or more | 4,214 (9.6%) | 372 (0.6%) |
| Total | 43,752 (100.0%) | 57,449 (100.0%) |
Physical Housing Characteristics in Richmond city
Housing Structures in Richmond city
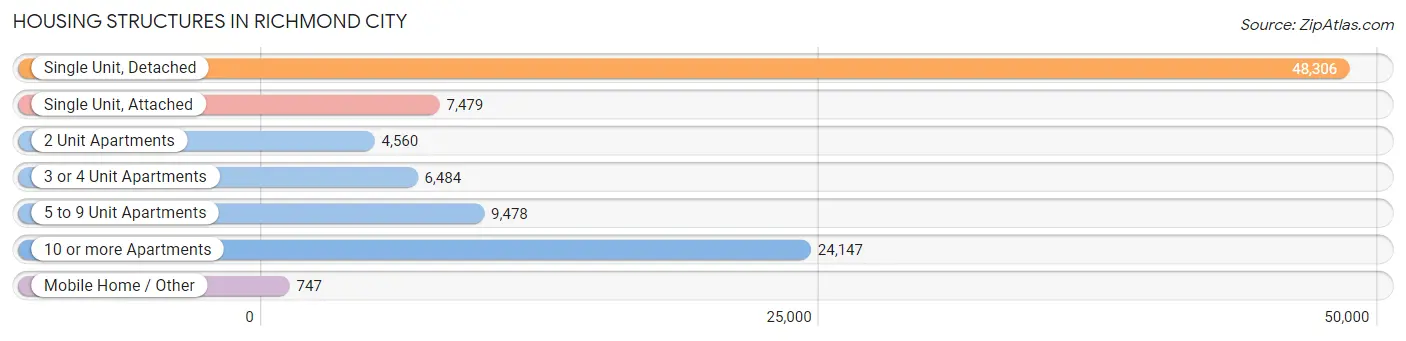
| Structure Type | # Housing Units | % Housing Units |
| Single Unit, Detached | 48,306 | 47.7% |
| Single Unit, Attached | 7,479 | 7.4% |
| 2 Unit Apartments | 4,560 | 4.5% |
| 3 or 4 Unit Apartments | 6,484 | 6.4% |
| 5 to 9 Unit Apartments | 9,478 | 9.4% |
| 10 or more Apartments | 24,147 | 23.9% |
| Mobile Home / Other | 747 | 0.7% |
| Total | 101,201 | 100.0% |
Housing Structures by Occupancy in Richmond city
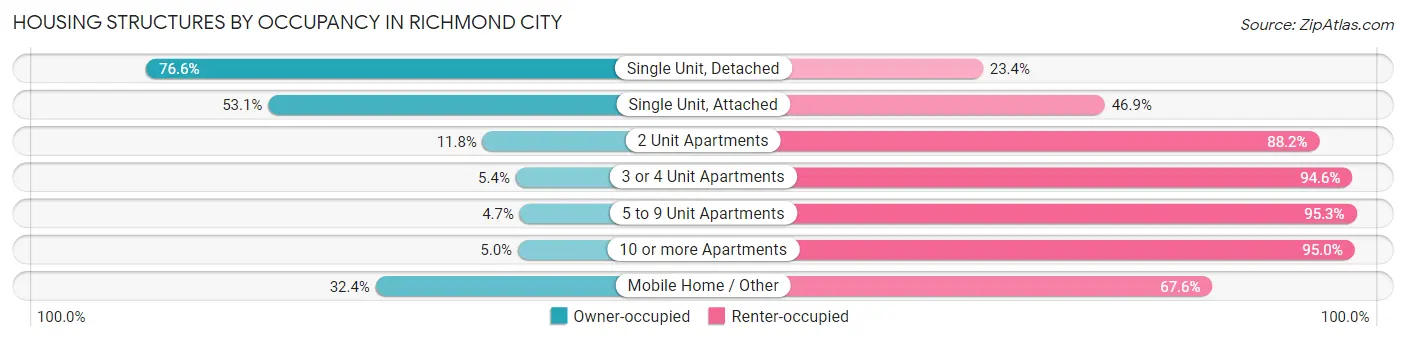
| Structure Type | Owner-occupied | Renter-occupied |
| Single Unit, Detached | 36,996 (76.6%) | 11,310 (23.4%) |
| Single Unit, Attached | 3,971 (53.1%) | 3,508 (46.9%) |
| 2 Unit Apartments | 538 (11.8%) | 4,022 (88.2%) |
| 3 or 4 Unit Apartments | 353 (5.4%) | 6,131 (94.6%) |
| 5 to 9 Unit Apartments | 442 (4.7%) | 9,036 (95.3%) |
| 10 or more Apartments | 1,210 (5.0%) | 22,937 (95.0%) |
| Mobile Home / Other | 242 (32.4%) | 505 (67.6%) |
| Total | 43,752 (43.2%) | 57,449 (56.8%) |
Housing Structures by Number of Rooms in Richmond city
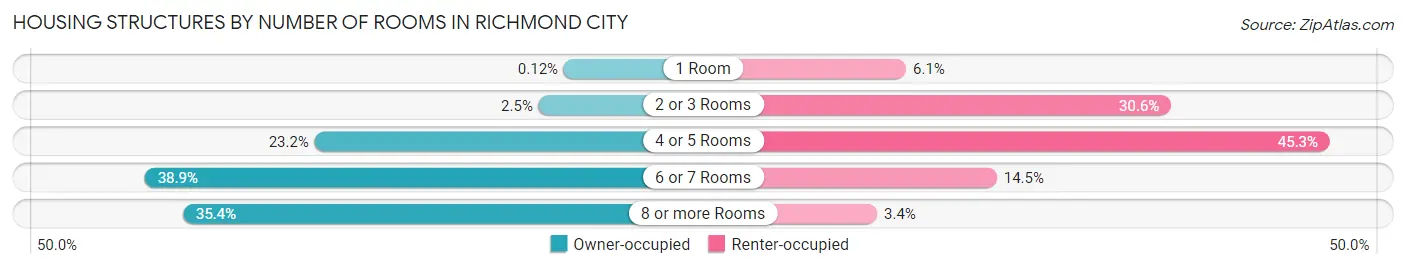
| Number of Rooms | Owner-occupied | Renter-occupied |
| 1 Room | 54 (0.1%) | 3,515 (6.1%) |
| 2 or 3 Rooms | 1,070 (2.5%) | 17,594 (30.6%) |
| 4 or 5 Rooms | 10,138 (23.2%) | 26,031 (45.3%) |
| 6 or 7 Rooms | 17,016 (38.9%) | 8,334 (14.5%) |
| 8 or more Rooms | 15,474 (35.4%) | 1,975 (3.4%) |
| Total | 43,752 (100.0%) | 57,449 (100.0%) |
Housing Structure by Heating Type in Richmond city
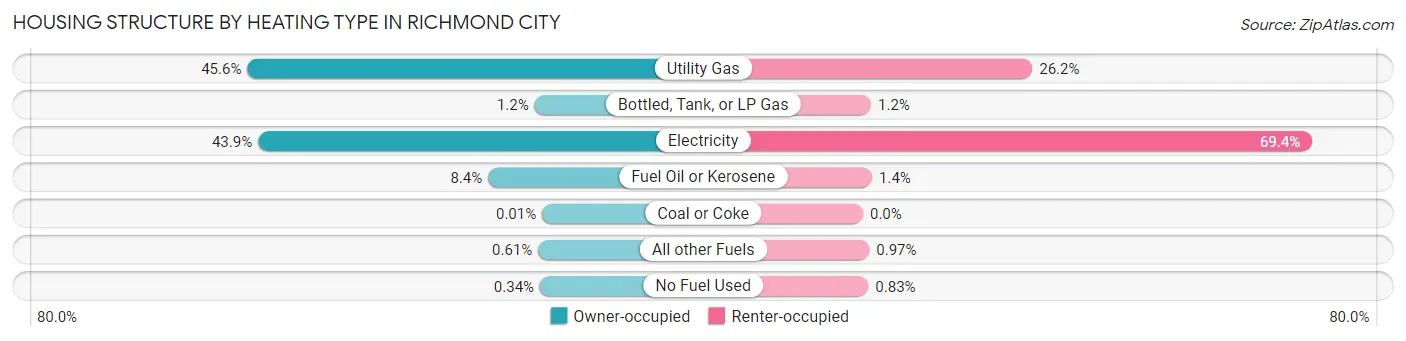
| Heating Type | Owner-occupied | Renter-occupied |
| Utility Gas | 19,943 (45.6%) | 15,032 (26.2%) |
| Bottled, Tank, or LP Gas | 514 (1.2%) | 710 (1.2%) |
| Electricity | 19,218 (43.9%) | 39,870 (69.4%) |
| Fuel Oil or Kerosene | 3,656 (8.4%) | 804 (1.4%) |
| Coal or Coke | 6 (0.0%) | 0 (0.0%) |
| All other Fuels | 266 (0.6%) | 555 (1.0%) |
| No Fuel Used | 149 (0.3%) | 478 (0.8%) |
| Total | 43,752 (100.0%) | 57,449 (100.0%) |
Household Vehicle Usage in Richmond city
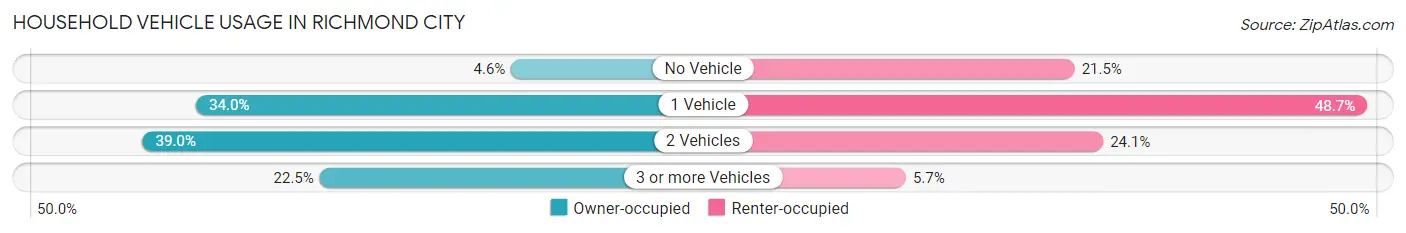
| Vehicles per Household | Owner-occupied | Renter-occupied |
| No Vehicle | 2,006 (4.6%) | 12,324 (21.4%) |
| 1 Vehicle | 14,865 (34.0%) | 27,998 (48.7%) |
| 2 Vehicles | 17,053 (39.0%) | 13,851 (24.1%) |
| 3 or more Vehicles | 9,828 (22.5%) | 3,276 (5.7%) |
| Total | 43,752 (100.0%) | 57,449 (100.0%) |
Real Estate & Mortgages in Richmond city
Real Estate and Mortgage Overview in Richmond city
| Characteristic | Without Mortgage | With Mortgage |
| Housing Units | 12,790 | 30,962 |
| Median Property Value | $294,900 | $313,300 |
| Median Household Income | $69,973 | $9,793 |
| Monthly Housing Costs | $687 | $4,086 |
| Real Estate Taxes | $2,816 | $810 |
Property Value by Mortgage Status in Richmond city
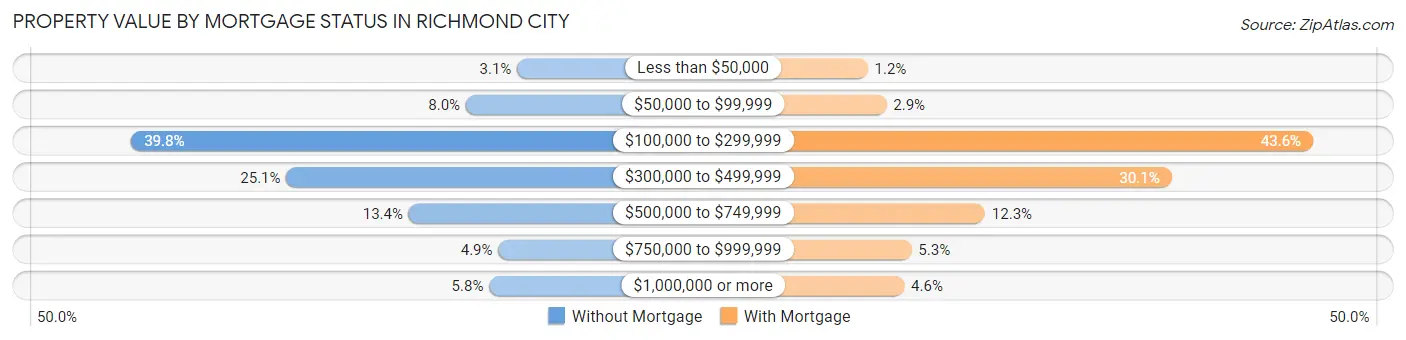
| Property Value | Without Mortgage | With Mortgage |
| Less than $50,000 | 395 (3.1%) | 356 (1.1%) |
| $50,000 to $99,999 | 1,019 (8.0%) | 908 (2.9%) |
| $100,000 to $299,999 | 5,095 (39.8%) | 13,487 (43.6%) |
| $300,000 to $499,999 | 3,207 (25.1%) | 9,317 (30.1%) |
| $500,000 to $749,999 | 1,715 (13.4%) | 3,816 (12.3%) |
| $750,000 to $999,999 | 624 (4.9%) | 1,646 (5.3%) |
| $1,000,000 or more | 735 (5.8%) | 1,432 (4.6%) |
| Total | 12,790 (100.0%) | 30,962 (100.0%) |
Household Income by Mortgage Status in Richmond city
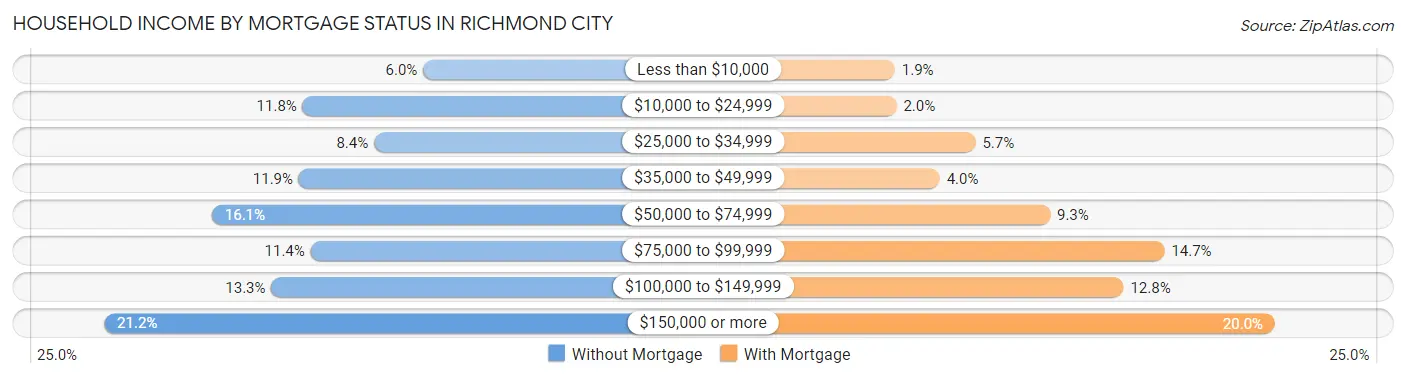
| Household Income | Without Mortgage | With Mortgage |
| Less than $10,000 | 770 (6.0%) | 580 (1.9%) |
| $10,000 to $24,999 | 1,504 (11.8%) | 604 (1.9%) |
| $25,000 to $34,999 | 1,069 (8.4%) | 1,767 (5.7%) |
| $35,000 to $49,999 | 1,527 (11.9%) | 1,242 (4.0%) |
| $50,000 to $74,999 | 2,056 (16.1%) | 2,868 (9.3%) |
| $75,000 to $99,999 | 1,456 (11.4%) | 4,554 (14.7%) |
| $100,000 to $149,999 | 1,695 (13.3%) | 3,952 (12.8%) |
| $150,000 or more | 2,713 (21.2%) | 6,182 (20.0%) |
| Total | 12,790 (100.0%) | 30,962 (100.0%) |
Property Value to Household Income Ratio in Richmond city
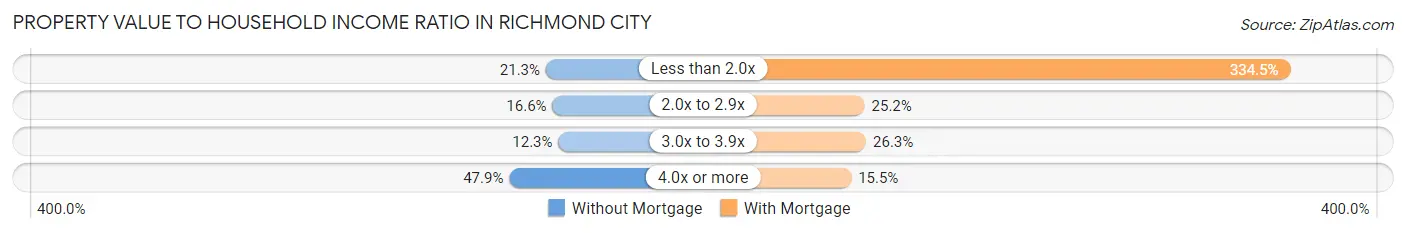
| Value-to-Income Ratio | Without Mortgage | With Mortgage |
| Less than 2.0x | 2,730 (21.3%) | 103,563 (334.5%) |
| 2.0x to 2.9x | 2,119 (16.6%) | 7,805 (25.2%) |
| 3.0x to 3.9x | 1,567 (12.2%) | 8,144 (26.3%) |
| 4.0x or more | 6,130 (47.9%) | 4,784 (15.4%) |
| Total | 12,790 (100.0%) | 30,962 (100.0%) |
Real Estate Taxes by Mortgage Status in Richmond city
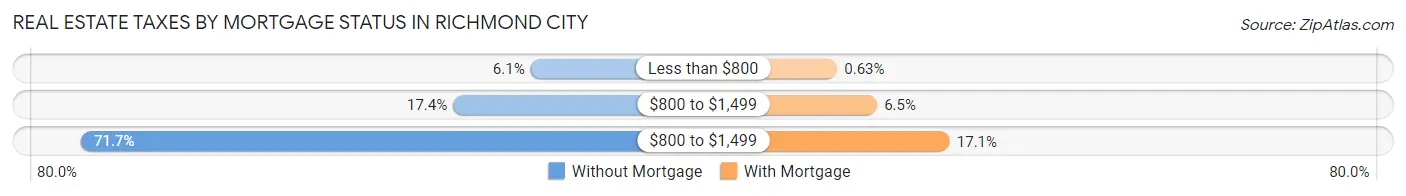
| Property Taxes | Without Mortgage | With Mortgage |
| Less than $800 | 778 (6.1%) | 195 (0.6%) |
| $800 to $1,499 | 2,226 (17.4%) | 1,997 (6.5%) |
| $800 to $1,499 | 9,176 (71.7%) | 5,285 (17.1%) |
| Total | 12,790 (100.0%) | 30,962 (100.0%) |
Health & Disability in Richmond city
Health Insurance Coverage by Age in Richmond city
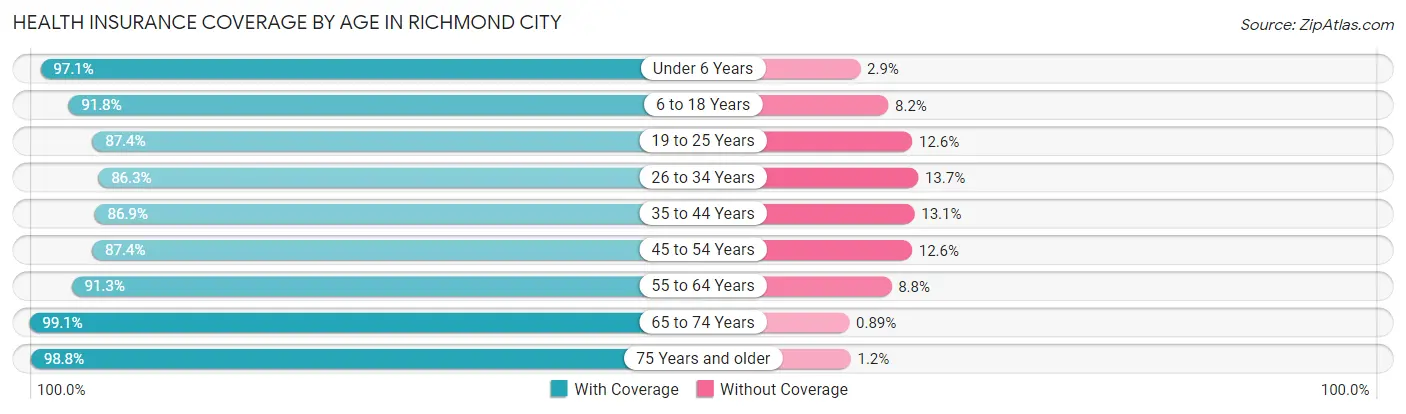
| Age Bracket | With Coverage | Without Coverage |
| Under 6 Years | 14,656 (97.1%) | 444 (2.9%) |
| 6 to 18 Years | 25,145 (91.8%) | 2,236 (8.2%) |
| 19 to 25 Years | 25,356 (87.4%) | 3,665 (12.6%) |
| 26 to 34 Years | 36,866 (86.3%) | 5,871 (13.7%) |
| 35 to 44 Years | 25,233 (86.9%) | 3,791 (13.1%) |
| 45 to 54 Years | 20,494 (87.4%) | 2,952 (12.6%) |
| 55 to 64 Years | 24,924 (91.2%) | 2,389 (8.7%) |
| 65 to 74 Years | 19,276 (99.1%) | 173 (0.9%) |
| 75 Years and older | 11,004 (98.8%) | 129 (1.2%) |
| Total | 202,954 (90.4%) | 21,650 (9.6%) |
Health Insurance Coverage by Citizenship Status in Richmond city
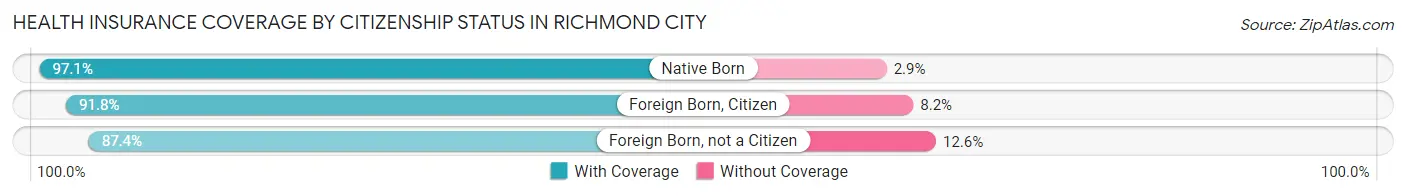
| Citizenship Status | With Coverage | Without Coverage |
| Native Born | 14,656 (97.1%) | 444 (2.9%) |
| Foreign Born, Citizen | 25,145 (91.8%) | 2,236 (8.2%) |
| Foreign Born, not a Citizen | 25,356 (87.4%) | 3,665 (12.6%) |
Health Insurance Coverage by Household Income in Richmond city
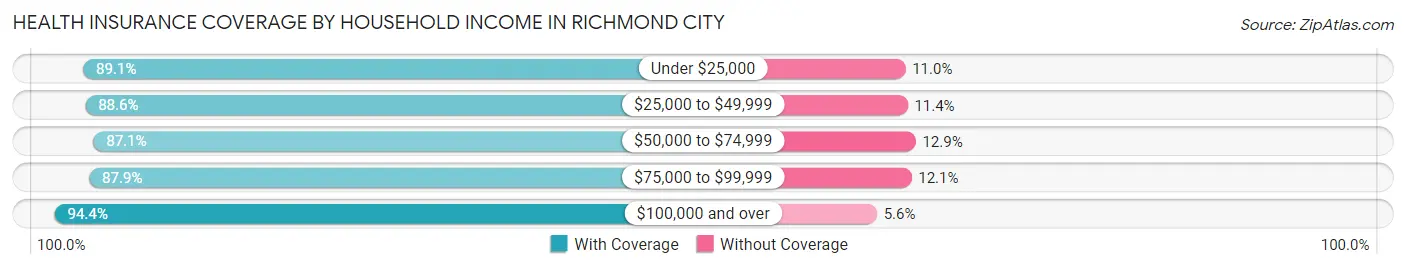
| Household Income | With Coverage | Without Coverage |
| Under $25,000 | 33,206 (89.0%) | 4,085 (11.0%) |
| $25,000 to $49,999 | 37,215 (88.6%) | 4,769 (11.4%) |
| $50,000 to $74,999 | 32,284 (87.1%) | 4,768 (12.9%) |
| $75,000 to $99,999 | 23,288 (87.9%) | 3,203 (12.1%) |
| $100,000 and over | 69,366 (94.4%) | 4,122 (5.6%) |
Public vs Private Health Insurance Coverage by Age in Richmond city
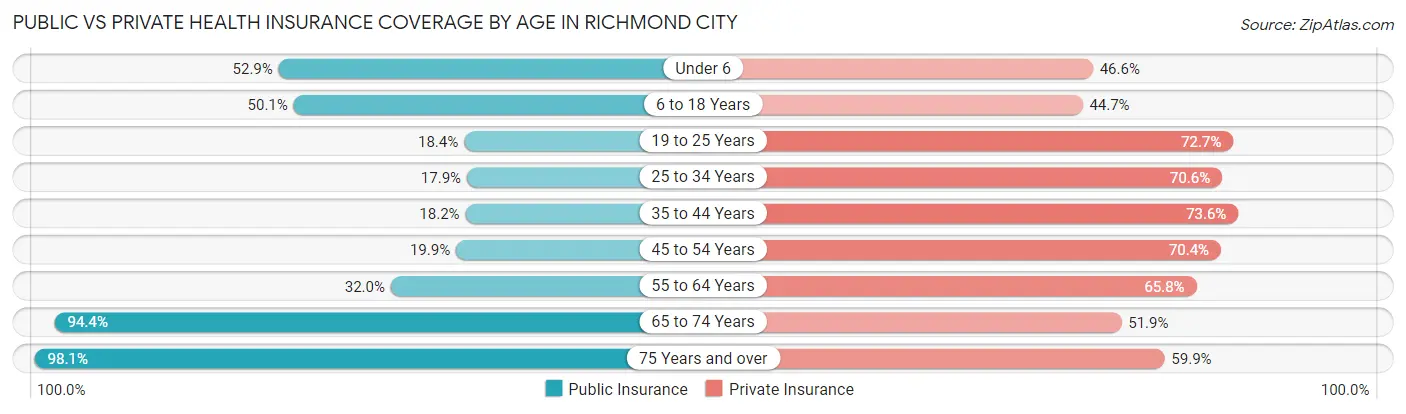
| Age Bracket | Public Insurance | Private Insurance |
| Under 6 | 7,980 (52.8%) | 7,033 (46.6%) |
| 6 to 18 Years | 13,710 (50.1%) | 12,232 (44.7%) |
| 19 to 25 Years | 5,349 (18.4%) | 21,083 (72.7%) |
| 25 to 34 Years | 7,650 (17.9%) | 30,165 (70.6%) |
| 35 to 44 Years | 5,278 (18.2%) | 21,352 (73.6%) |
| 45 to 54 Years | 4,673 (19.9%) | 16,500 (70.4%) |
| 55 to 64 Years | 8,748 (32.0%) | 17,978 (65.8%) |
| 65 to 74 Years | 18,366 (94.4%) | 10,090 (51.9%) |
| 75 Years and over | 10,926 (98.1%) | 6,666 (59.9%) |
| Total | 82,680 (36.8%) | 143,099 (63.7%) |
Disability Status by Sex by Age in Richmond city
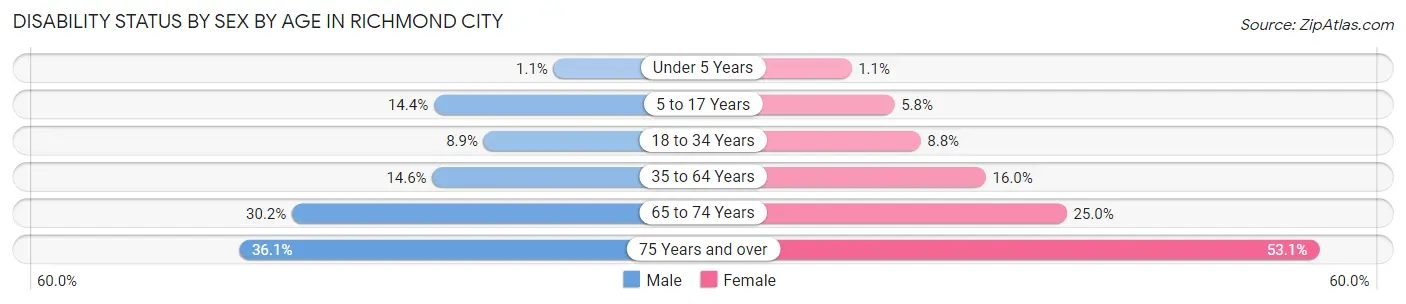
| Age Bracket | Male | Female |
| Under 5 Years | 72 (1.1%) | 66 (1.1%) |
| 5 to 17 Years | 1,876 (14.4%) | 755 (5.8%) |
| 18 to 34 Years | 3,114 (8.9%) | 3,519 (8.7%) |
| 35 to 64 Years | 5,617 (14.6%) | 6,609 (16.0%) |
| 65 to 74 Years | 2,620 (30.2%) | 2,697 (25.0%) |
| 75 Years and over | 1,443 (36.1%) | 3,793 (53.1%) |
Disability Class by Sex by Age in Richmond city
Disability Class: Hearing Difficulty
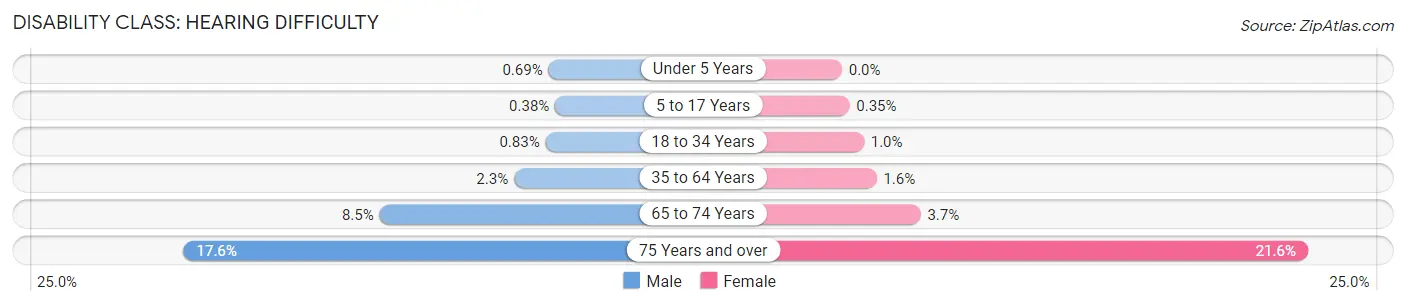
| Age Bracket | Male | Female |
| Under 5 Years | 46 (0.7%) | 0 (0.0%) |
| 5 to 17 Years | 49 (0.4%) | 45 (0.4%) |
| 18 to 34 Years | 293 (0.8%) | 410 (1.0%) |
| 35 to 64 Years | 882 (2.3%) | 666 (1.6%) |
| 65 to 74 Years | 740 (8.5%) | 393 (3.6%) |
| 75 Years and over | 704 (17.6%) | 1,543 (21.6%) |
Disability Class: Vision Difficulty
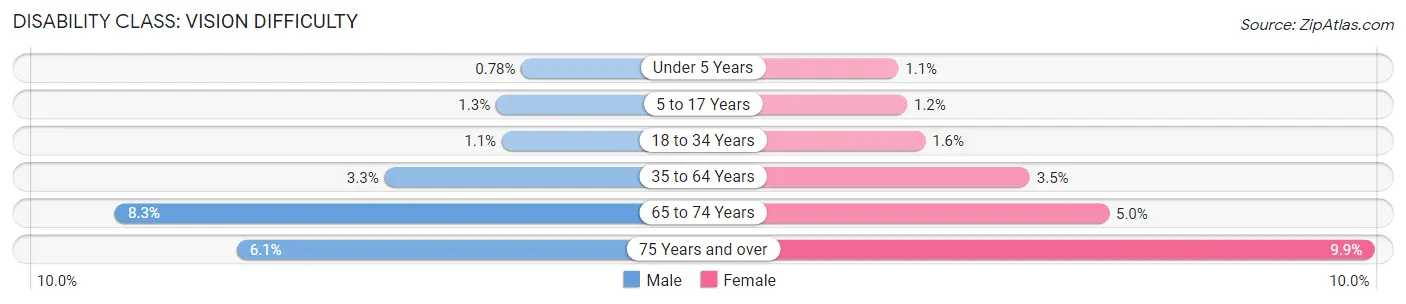
| Age Bracket | Male | Female |
| Under 5 Years | 52 (0.8%) | 66 (1.1%) |
| 5 to 17 Years | 163 (1.3%) | 156 (1.2%) |
| 18 to 34 Years | 400 (1.1%) | 622 (1.5%) |
| 35 to 64 Years | 1,279 (3.3%) | 1,441 (3.5%) |
| 65 to 74 Years | 722 (8.3%) | 534 (5.0%) |
| 75 Years and over | 242 (6.1%) | 705 (9.9%) |
Disability Class: Cognitive Difficulty
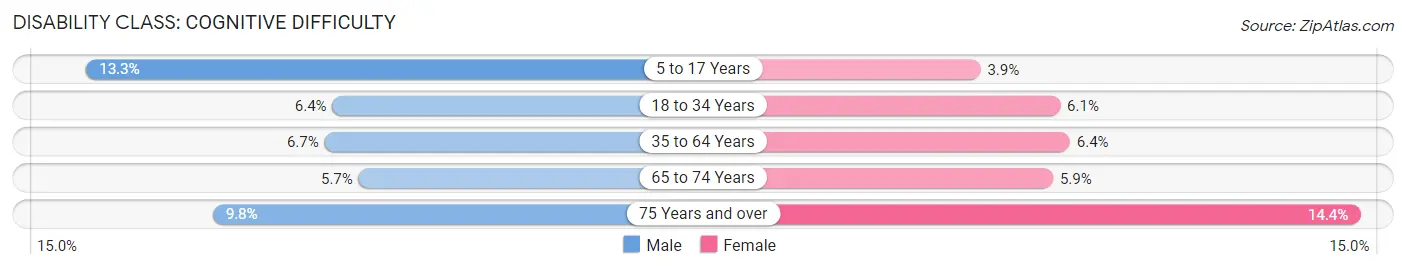
| Age Bracket | Male | Female |
| 5 to 17 Years | 1,730 (13.3%) | 499 (3.9%) |
| 18 to 34 Years | 2,262 (6.4%) | 2,445 (6.1%) |
| 35 to 64 Years | 2,560 (6.7%) | 2,622 (6.4%) |
| 65 to 74 Years | 494 (5.7%) | 634 (5.9%) |
| 75 Years and over | 390 (9.8%) | 1,030 (14.4%) |
Disability Class: Ambulatory Difficulty
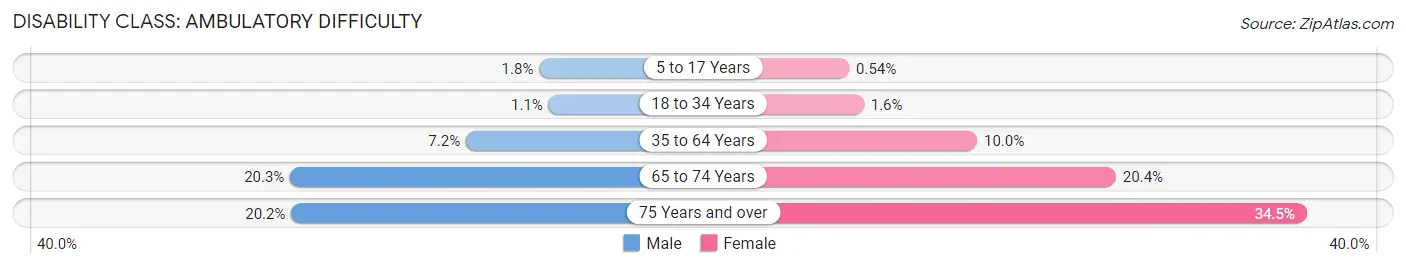
| Age Bracket | Male | Female |
| 5 to 17 Years | 233 (1.8%) | 70 (0.5%) |
| 18 to 34 Years | 384 (1.1%) | 654 (1.6%) |
| 35 to 64 Years | 2,784 (7.2%) | 4,142 (10.0%) |
| 65 to 74 Years | 1,759 (20.3%) | 2,193 (20.3%) |
| 75 Years and over | 807 (20.2%) | 2,464 (34.5%) |
Disability Class: Self-Care Difficulty
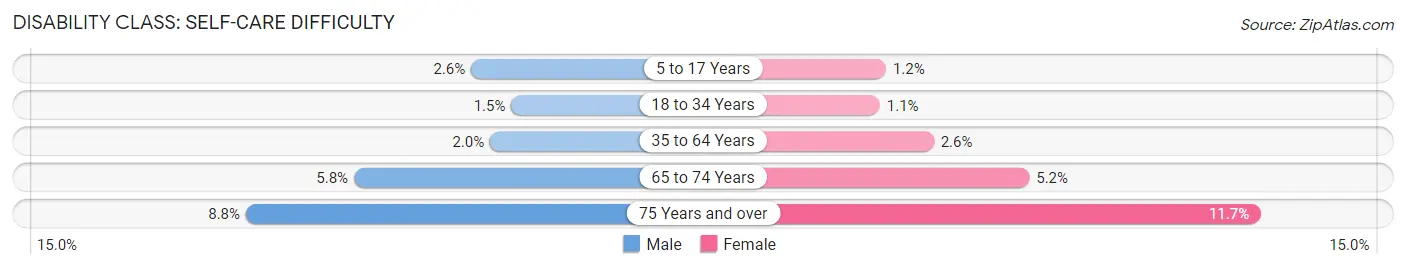
| Age Bracket | Male | Female |
| 5 to 17 Years | 335 (2.6%) | 159 (1.2%) |
| 18 to 34 Years | 510 (1.5%) | 427 (1.1%) |
| 35 to 64 Years | 785 (2.0%) | 1,058 (2.6%) |
| 65 to 74 Years | 506 (5.8%) | 563 (5.2%) |
| 75 Years and over | 353 (8.8%) | 833 (11.7%) |
Technology Access in Richmond city
Computing Device Access in Richmond city
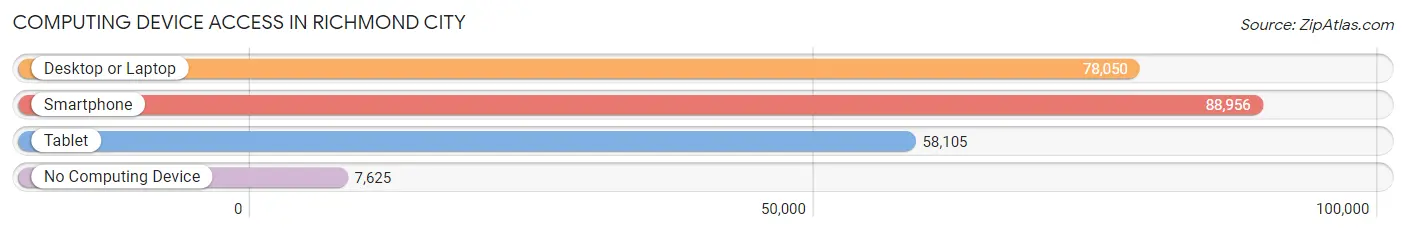
| Device Type | # Households | % Households |
| Desktop or Laptop | 78,050 | 77.1% |
| Smartphone | 88,956 | 87.9% |
| Tablet | 58,105 | 57.4% |
| No Computing Device | 7,625 | 7.5% |
| Total | 101,201 | 100.0% |
Internet Access in Richmond city
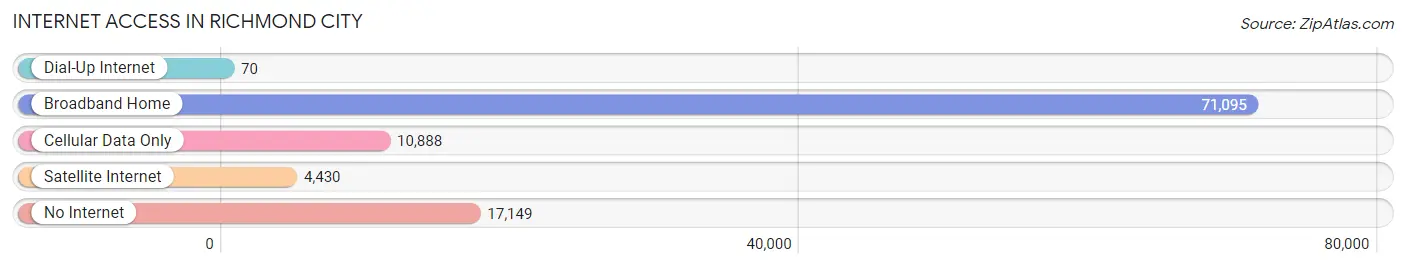
| Internet Type | # Households | % Households |
| Dial-Up Internet | 70 | 0.1% |
| Broadband Home | 71,095 | 70.3% |
| Cellular Data Only | 10,888 | 10.8% |
| Satellite Internet | 4,430 | 4.4% |
| No Internet | 17,149 | 17.0% |
| Total | 101,201 | 100.0% |
Richmond city Summary
Richmond City, Virginia is the capital of the Commonwealth of Virginia and is located in the central part of the state. It is the fourth-largest city in the state and the second-largest city in the Richmond metropolitan area. The city has a population of over 220,000 people and is the center of a metropolitan area of over 1.2 million people.
Richmond City is located on the James River, which is the largest river in Virginia. The city is situated at the fall line of the James River, which is the point where the river drops from the Piedmont Plateau to the Coastal Plain. The city is also located at the intersection of Interstate 95 and Interstate 64, making it a major transportation hub for the region.
Richmond City has a long and rich history. It was founded in 1737 and was the capital of the Colony of Virginia from 1780 to 1788. During the American Revolution, Richmond was the site of several major battles, including the Battle of Richmond in 1781. After the Civil War, Richmond was the capital of the Confederate States of America from 1861 to 1865.
Richmond City has a humid subtropical climate, with hot, humid summers and mild winters. The average annual temperature is around 60 degrees Fahrenheit. The city receives an average of 43 inches of precipitation per year, with most of it falling in the summer months.
Richmond City is a major economic center in the region. It is home to several Fortune 500 companies, including Dominion Energy, CarMax, and Altria. The city is also home to several universities, including the University of Richmond, Virginia Commonwealth University, and Virginia Union University.
Richmond City is also home to a diverse population. According to the 2010 census, the city’s population was 54.3% white, 37.2% African American, 4.2% Hispanic or Latino, and 4.3% Asian. The median household income in the city was $45,890 in 2019.
Richmond City is a vibrant and diverse city with a rich history and a bright future. It is home to a variety of businesses, universities, and cultural attractions. The city is a major economic center in the region and is home to a diverse population. With its rich history, vibrant culture, and strong economy, Richmond City is an ideal place to live, work, and visit.
Common Questions
What is Per Capita Income in Richmond city?
Per Capita income in Richmond city is $42,132.
What is the Median Family Income in Richmond city?
Median Family Income in Richmond city is $79,453.
What is the Median Household income in Richmond city?
Median Household Income in Richmond city is $59,606.
What is Income or Wage Gap in Richmond city?
Income or Wage Gap in Richmond city is 16.5%.
Women in Richmond city earn 83.5 cents for every dollar earned by a man.
What is Family Income Deficit in Richmond city?
Family Income Deficit in Richmond city is $12,285.
Families that are below poverty line in Richmond city earn $12,285 less on average than the poverty threshold level.
What is Inequality or Gini Index in Richmond city?
Inequality or Gini Index in Richmond city is 0.52.
What is the Total Population of Richmond city?
Total Population of Richmond city is 227,171.
What is the Total Male Population of Richmond city?
Total Male Population of Richmond city is 108,032.
What is the Total Female Population of Richmond city?
Total Female Population of Richmond city is 119,139.
What is the Ratio of Males per 100 Females in Richmond city?
There are 90.68 Males per 100 Females in Richmond city.
What is the Ratio of Females per 100 Males in Richmond city?
There are 110.28 Females per 100 Males in Richmond city.
What is the Median Population Age in Richmond city?
Median Population Age in Richmond city is 34.5 Years.
What is the Average Family Size in Richmond city
Average Family Size in Richmond city is 3.0 People.
What is the Average Household Size in Richmond city
Average Household Size in Richmond city is 2.1 People.
How Large is the Labor Force in Richmond city?
There are 130,455 People in the Labor Forcein in Richmond city.
What is the Percentage of People in the Labor Force in Richmond city?
68.0% of People are in the Labor Force in Richmond city.
What is the Unemployment Rate in Richmond city?
Unemployment Rate in Richmond city is 6.1%.