Rappahannock County, VA Map & Demographics
Rappahannock County Map
Rappahannock County Overview
$54,654
PER CAPITA INCOME
$101,797
AVG FAMILY INCOME
$98,663
AVG HOUSEHOLD INCOME
2.4%
WAGE / INCOME GAP [ % ]
97.6¢/ $1
WAGE / INCOME GAP [ $ ]
0.48
INEQUALITY / GINI INDEX
7,422
TOTAL POPULATION
3,746
MALE POPULATION
3,676
FEMALE POPULATION
101.90
MALES / 100 FEMALES
98.13
FEMALES / 100 MALES
50.0
MEDIAN AGE
3.0
AVG FAMILY SIZE
2.6
AVG HOUSEHOLD SIZE
3,821
LABOR FORCE [ PEOPLE ]
61.6%
PERCENT IN LABOR FORCE
6.5%
UNEMPLOYMENT RATE
Rappahannock County Area Codes
Income in Rappahannock County
Income Overview in Rappahannock County
Per Capita Income in Rappahannock County is $54,654, while median incomes of families and households are $101,797 and $98,663 respectively.
| Characteristic | Number | Measure |
| Per Capita Income | 7,422 | $54,654 |
| Median Family Income | 1,974 | $101,797 |
| Mean Family Income | 1,974 | $150,254 |
| Median Household Income | 2,823 | $98,663 |
| Mean Household Income | 2,823 | $138,115 |
| Income Deficit | 1,974 | $0 |
| Wage / Income Gap (%) | 7,422 | 2.37% |
| Wage / Income Gap ($) | 7,422 | 97.63¢ per $1 |
| Gini / Inequality Index | 7,422 | 0.48 |
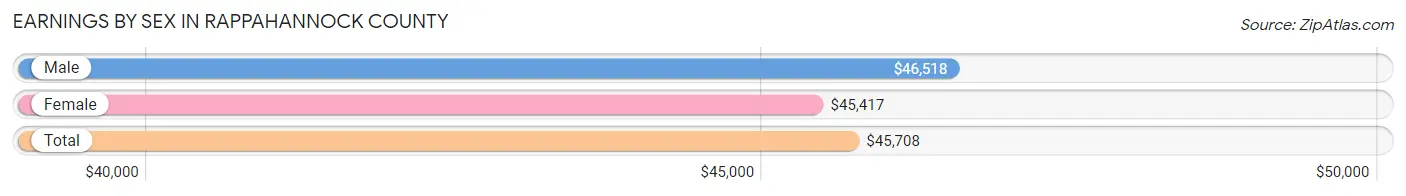
Earnings by Sex in Rappahannock County
Average Earnings in Rappahannock County are $45,708, $46,518 for men and $45,417 for women, a difference of 2.4%.
| Sex | Number | Average Earnings |
| Male | 2,142 (52.7%) | $46,518 |
| Female | 1,924 (47.3%) | $45,417 |
| Total | 4,066 (100.0%) | $45,708 |
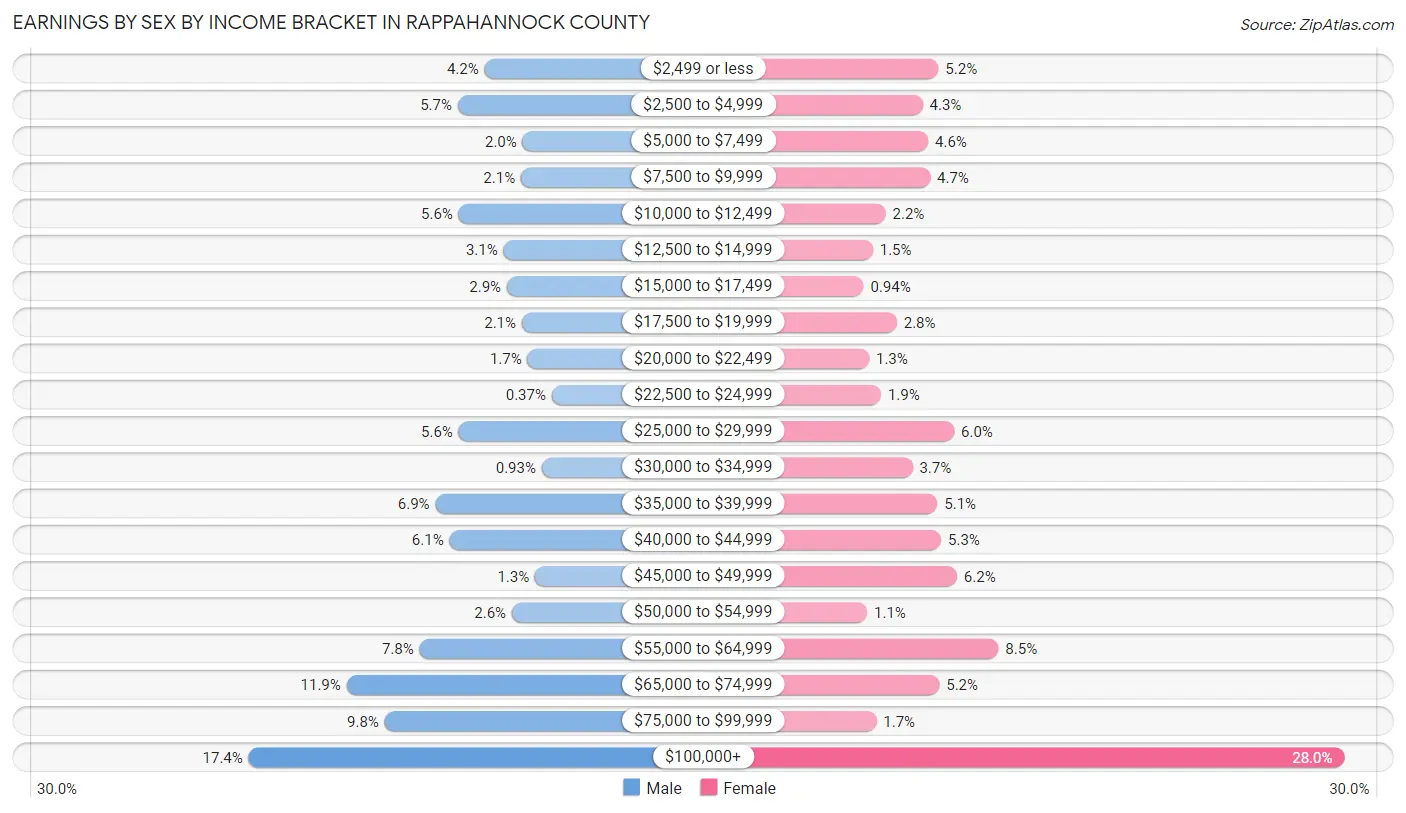
Earnings by Sex by Income Bracket in Rappahannock County
The most common earnings brackets in Rappahannock County are $100,000+ for men (373 | 17.4%) and $100,000+ for women (538 | 28.0%).
| Income | Male | Female |
| $2,499 or less | 89 (4.2%) | 99 (5.1%) |
| $2,500 to $4,999 | 121 (5.7%) | 82 (4.3%) |
| $5,000 to $7,499 | 43 (2.0%) | 88 (4.6%) |
| $7,500 to $9,999 | 45 (2.1%) | 90 (4.7%) |
| $10,000 to $12,499 | 120 (5.6%) | 42 (2.2%) |
| $12,500 to $14,999 | 66 (3.1%) | 28 (1.5%) |
| $15,000 to $17,499 | 62 (2.9%) | 18 (0.9%) |
| $17,500 to $19,999 | 44 (2.1%) | 54 (2.8%) |
| $20,000 to $22,499 | 37 (1.7%) | 24 (1.3%) |
| $22,500 to $24,999 | 8 (0.4%) | 37 (1.9%) |
| $25,000 to $29,999 | 120 (5.6%) | 116 (6.0%) |
| $30,000 to $34,999 | 20 (0.9%) | 71 (3.7%) |
| $35,000 to $39,999 | 148 (6.9%) | 98 (5.1%) |
| $40,000 to $44,999 | 131 (6.1%) | 102 (5.3%) |
| $45,000 to $49,999 | 28 (1.3%) | 119 (6.2%) |
| $50,000 to $54,999 | 56 (2.6%) | 22 (1.1%) |
| $55,000 to $64,999 | 167 (7.8%) | 164 (8.5%) |
| $65,000 to $74,999 | 255 (11.9%) | 100 (5.2%) |
| $75,000 to $99,999 | 209 (9.8%) | 32 (1.7%) |
| $100,000+ | 373 (17.4%) | 538 (28.0%) |
| Total | 2,142 (100.0%) | 1,924 (100.0%) |
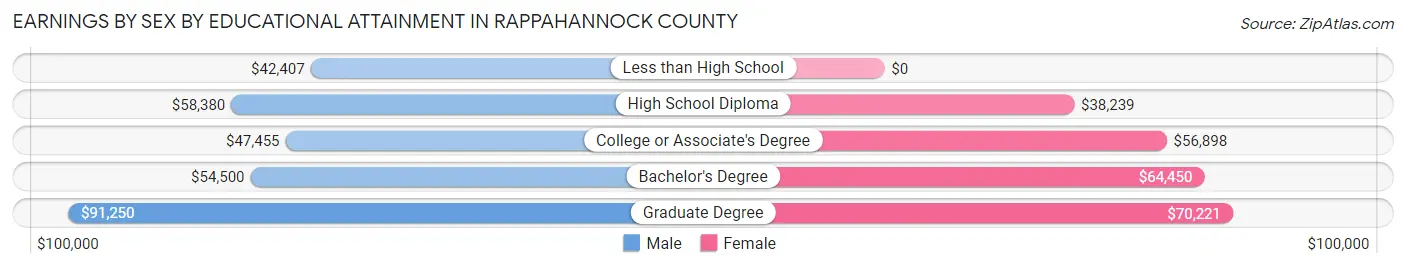
Earnings by Sex by Educational Attainment in Rappahannock County
Average earnings in Rappahannock County are $58,018 for men and $54,444 for women, a difference of 6.2%. Men with an educational attainment of graduate degree enjoy the highest average annual earnings of $91,250, while those with less than high school education earn the least with $42,407. Women with an educational attainment of graduate degree earn the most with the average annual earnings of $70,221, while those with high school diploma education have the smallest earnings of $38,239.
| Educational Attainment | Male Income | Female Income |
| Less than High School | $42,407 | $0 |
| High School Diploma | $58,380 | $38,239 |
| College or Associate's Degree | $47,455 | $56,898 |
| Bachelor's Degree | $54,500 | $64,450 |
| Graduate Degree | $91,250 | $70,221 |
| Total | $58,018 | $54,444 |
Family Income in Rappahannock County
Family Income Brackets in Rappahannock County
According to the Rappahannock County family income data, there are 460 families falling into the $200,000+ income range, which is the most common income bracket and makes up 23.3% of all families. Conversely, the $10,000 to $14,999 income bracket is the least frequent group with only 12 families (0.6%) belonging to this category.
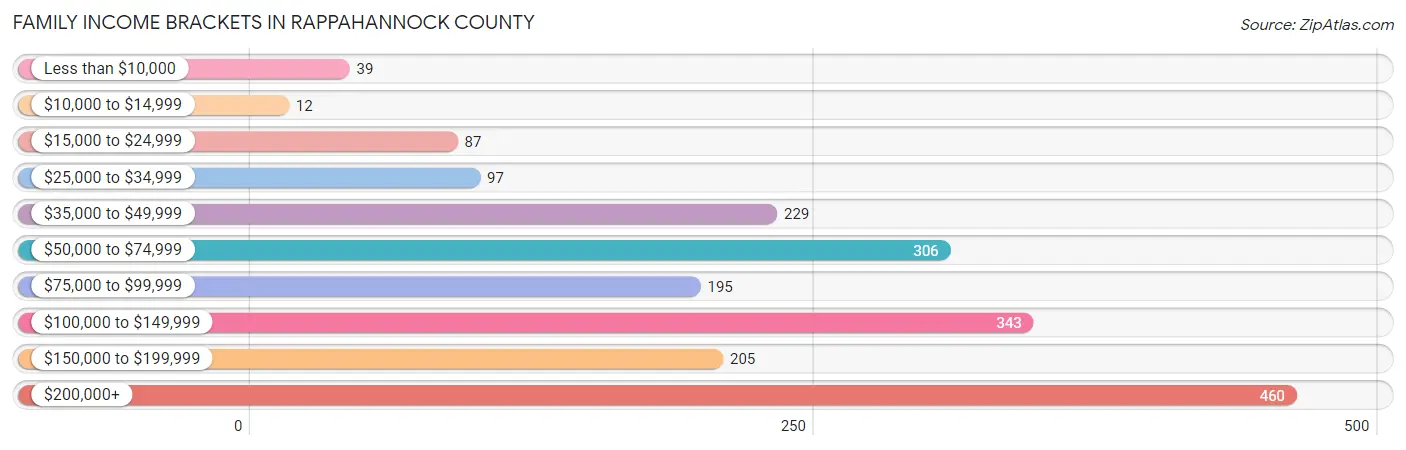
| Income Bracket | # Families | % Families |
| Less than $10,000 | 39 | 2.0% |
| $10,000 to $14,999 | 12 | 0.6% |
| $15,000 to $24,999 | 87 | 4.4% |
| $25,000 to $34,999 | 97 | 4.9% |
| $35,000 to $49,999 | 229 | 11.6% |
| $50,000 to $74,999 | 306 | 15.5% |
| $75,000 to $99,999 | 195 | 9.9% |
| $100,000 to $149,999 | 343 | 17.4% |
| $150,000 to $199,999 | 205 | 10.4% |
| $200,000+ | 460 | 23.3% |
Family Income by Famaliy Size in Rappahannock County
5-person families (118 | 6.0%) account for the highest median family income in Rappahannock County with $159,063 per family, while 2-person families (1,242 | 62.9%) have the highest median income of $51,757 per family member.
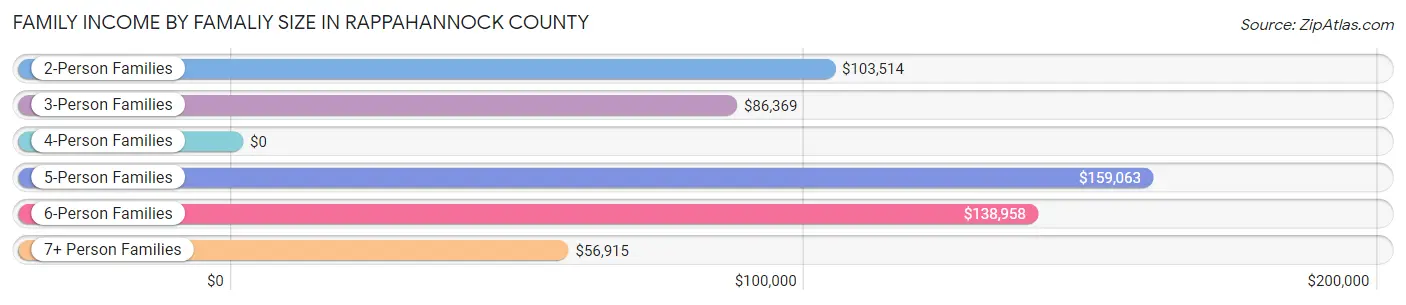
| Income Bracket | # Families | Median Income |
| 2-Person Families | 1,242 (62.9%) | $103,514 |
| 3-Person Families | 339 (17.2%) | $86,369 |
| 4-Person Families | 182 (9.2%) | $0 |
| 5-Person Families | 118 (6.0%) | $159,063 |
| 6-Person Families | 21 (1.1%) | $138,958 |
| 7+ Person Families | 72 (3.6%) | $56,915 |
| Total | 1,974 (100.0%) | $101,797 |
Family Income by Number of Earners in Rappahannock County
The median family income in Rappahannock County is $101,797, with families comprising 3+ earners (154) having the highest median family income of $154,545, while families with 1 earner (728) have the lowest median family income of $68,654, accounting for 7.8% and 36.9% of families, respectively.
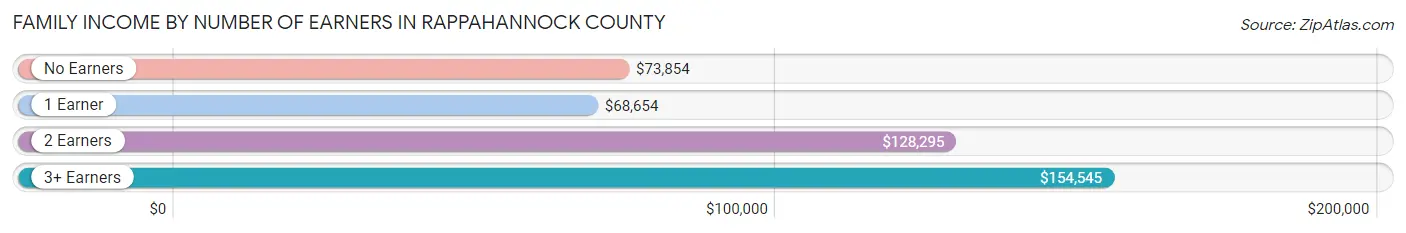
| Number of Earners | # Families | Median Income |
| No Earners | 343 (17.4%) | $73,854 |
| 1 Earner | 728 (36.9%) | $68,654 |
| 2 Earners | 749 (37.9%) | $128,295 |
| 3+ Earners | 154 (7.8%) | $154,545 |
| Total | 1,974 (100.0%) | $101,797 |
Household Income in Rappahannock County
Household Income Brackets in Rappahannock County
With 550 households falling in the category, the $200,000+ income range is the most frequent in Rappahannock County, accounting for 19.5% of all households. In contrast, only 54 households (1.9%) fall into the $10,000 to $14,999 income bracket, making it the least populous group.
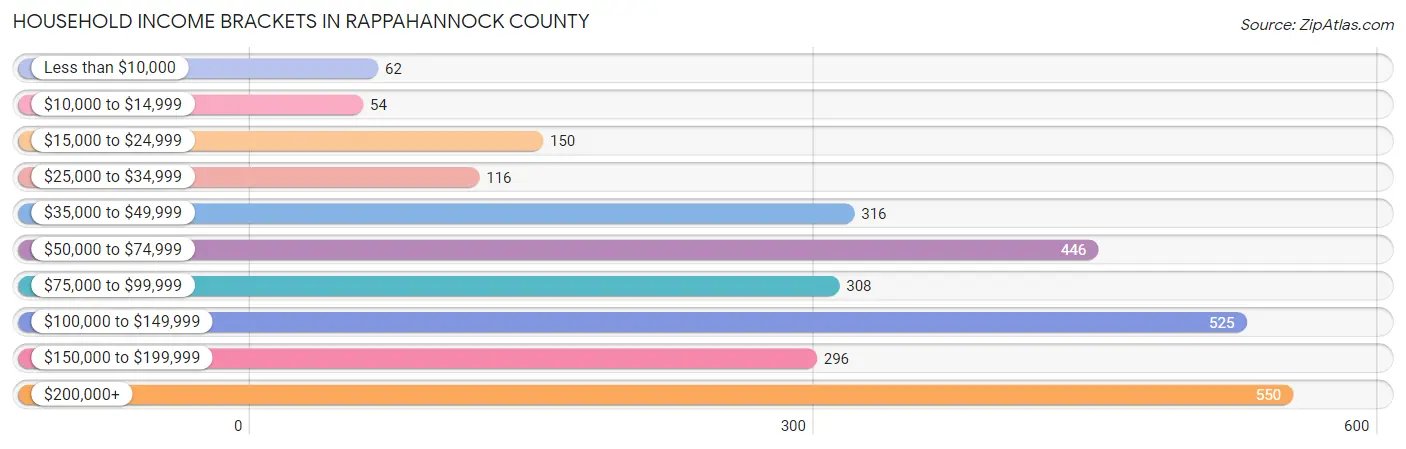
| Income Bracket | # Households | % Households |
| Less than $10,000 | 62 | 2.2% |
| $10,000 to $14,999 | 54 | 1.9% |
| $15,000 to $24,999 | 150 | 5.3% |
| $25,000 to $34,999 | 116 | 4.1% |
| $35,000 to $49,999 | 316 | 11.2% |
| $50,000 to $74,999 | 446 | 15.8% |
| $75,000 to $99,999 | 308 | 10.9% |
| $100,000 to $149,999 | 525 | 18.6% |
| $150,000 to $199,999 | 296 | 10.5% |
| $200,000+ | 550 | 19.5% |
Household Income by Householder Age in Rappahannock County
The median household income in Rappahannock County is $98,663, with the highest median household income of $123,892 found in the 45 to 64 years age bracket for the primary householder. A total of 1,039 households (36.8%) fall into this category. Meanwhile, the 15 to 24 years age bracket for the primary householder has the lowest median household income of $0, with 28 households (1.0%) in this group.
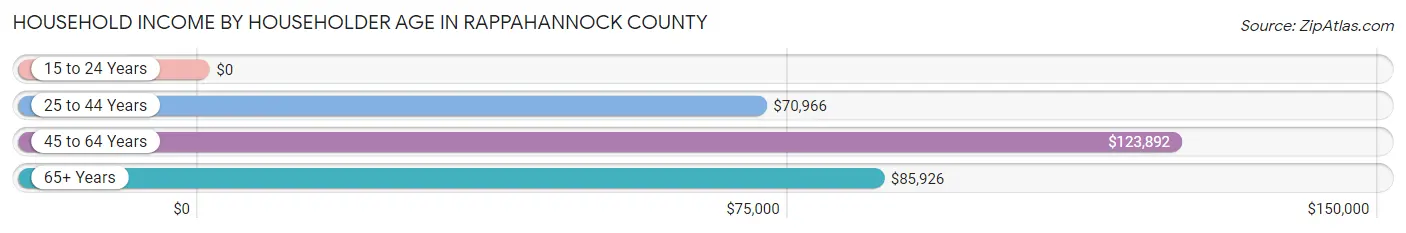
| Income Bracket | # Households | Median Income |
| 15 to 24 Years | 28 (1.0%) | $0 |
| 25 to 44 Years | 552 (19.6%) | $70,966 |
| 45 to 64 Years | 1,039 (36.8%) | $123,892 |
| 65+ Years | 1,204 (42.6%) | $85,926 |
| Total | 2,823 (100.0%) | $98,663 |
Poverty in Rappahannock County
Income Below Poverty by Sex and Age in Rappahannock County
With 5.4% poverty level for males and 10.0% for females among the residents of Rappahannock County, 18 to 24 year old males and 16 and 17 year old females are the most vulnerable to poverty, with 58 males (22.5%) and 30 females (100.0%) in their respective age groups living below the poverty level.
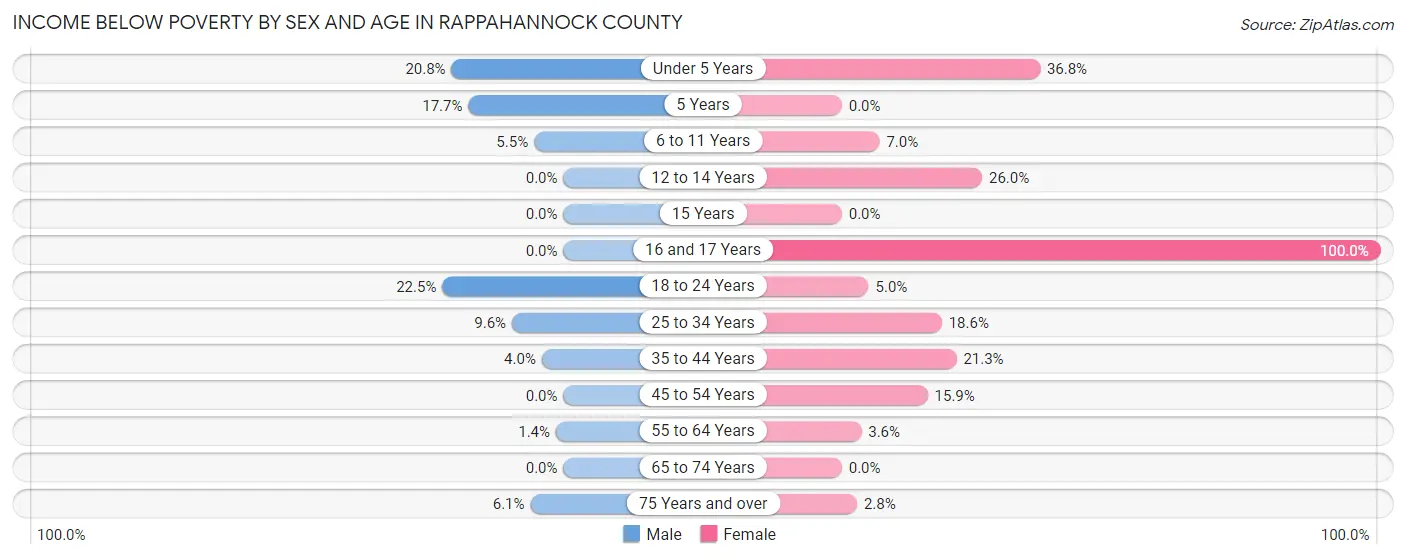
| Age Bracket | Male | Female |
| Under 5 Years | 38 (20.8%) | 32 (36.8%) |
| 5 Years | 9 (17.6%) | 0 (0.0%) |
| 6 to 11 Years | 12 (5.4%) | 19 (7.0%) |
| 12 to 14 Years | 0 (0.0%) | 19 (26.0%) |
| 15 Years | 0 (0.0%) | 0 (0.0%) |
| 16 and 17 Years | 0 (0.0%) | 30 (100.0%) |
| 18 to 24 Years | 58 (22.5%) | 13 (5.0%) |
| 25 to 34 Years | 34 (9.6%) | 59 (18.5%) |
| 35 to 44 Years | 16 (4.0%) | 90 (21.3%) |
| 45 to 54 Years | 0 (0.0%) | 65 (15.9%) |
| 55 to 64 Years | 8 (1.4%) | 25 (3.6%) |
| 65 to 74 Years | 0 (0.0%) | 0 (0.0%) |
| 75 Years and over | 26 (6.1%) | 12 (2.8%) |
| Total | 201 (5.4%) | 364 (10.0%) |
Income Above Poverty by Sex and Age in Rappahannock County
According to the poverty statistics in Rappahannock County, males aged 12 to 14 years and females aged 5 years are the age groups that are most secure financially, with 100.0% of males and 100.0% of females in these age groups living above the poverty line.
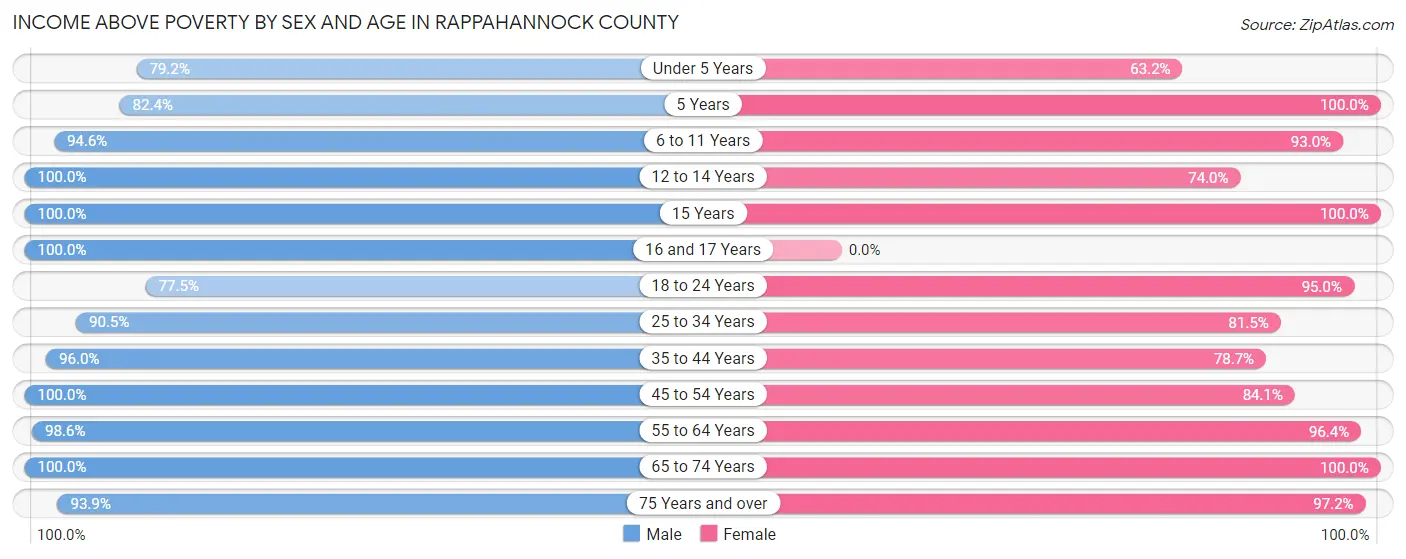
| Age Bracket | Male | Female |
| Under 5 Years | 145 (79.2%) | 55 (63.2%) |
| 5 Years | 42 (82.4%) | 72 (100.0%) |
| 6 to 11 Years | 208 (94.6%) | 253 (93.0%) |
| 12 to 14 Years | 176 (100.0%) | 54 (74.0%) |
| 15 Years | 35 (100.0%) | 24 (100.0%) |
| 16 and 17 Years | 86 (100.0%) | 0 (0.0%) |
| 18 to 24 Years | 200 (77.5%) | 248 (95.0%) |
| 25 to 34 Years | 322 (90.4%) | 259 (81.5%) |
| 35 to 44 Years | 383 (96.0%) | 333 (78.7%) |
| 45 to 54 Years | 429 (100.0%) | 343 (84.1%) |
| 55 to 64 Years | 569 (98.6%) | 665 (96.4%) |
| 65 to 74 Years | 550 (100.0%) | 564 (100.0%) |
| 75 Years and over | 399 (93.9%) | 414 (97.2%) |
| Total | 3,544 (94.6%) | 3,284 (90.0%) |
Income Below Poverty Among Married-Couple Families in Rappahannock County
The poverty statistics for married-couple families in Rappahannock County show that 0.6% or 10 of the total 1,576 families live below the poverty line. Families with no children have the highest poverty rate of 0.8%, comprising of 10 families. On the other hand, families with 1 or 2 children have the lowest poverty rate of 0.0%, which includes 0 families.
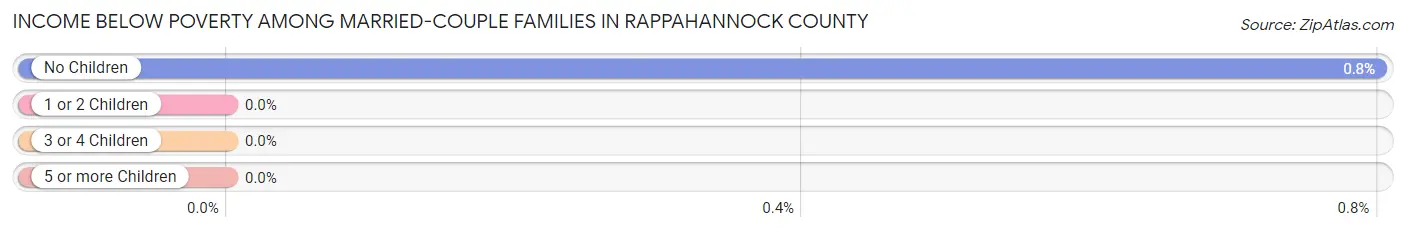
| Children | Above Poverty | Below Poverty |
| No Children | 1,236 (99.2%) | 10 (0.8%) |
| 1 or 2 Children | 224 (100.0%) | 0 (0.0%) |
| 3 or 4 Children | 42 (100.0%) | 0 (0.0%) |
| 5 or more Children | 64 (100.0%) | 0 (0.0%) |
| Total | 1,566 (99.4%) | 10 (0.6%) |
Income Below Poverty Among Single-Parent Households in Rappahannock County
According to the poverty data in Rappahannock County, 2.8% or 5 single-father households and 32.6% or 71 single-mother households are living below the poverty line. Among single-father households, those with 3 or 4 children have the highest poverty rate, with 5 households (100.0%) experiencing poverty. Likewise, among single-mother households, those with 3 or 4 children have the highest poverty rate, with 13 households (100.0%) falling below the poverty line.
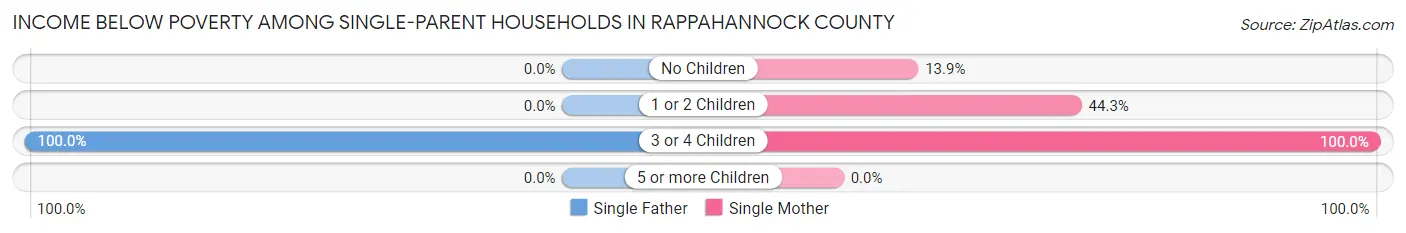
| Children | Single Father | Single Mother |
| No Children | 0 (0.0%) | 15 (13.9%) |
| 1 or 2 Children | 0 (0.0%) | 43 (44.3%) |
| 3 or 4 Children | 5 (100.0%) | 13 (100.0%) |
| 5 or more Children | 0 (0.0%) | 0 (0.0%) |
| Total | 5 (2.8%) | 71 (32.6%) |
Income Below Poverty Among Married-Couple vs Single-Parent Households in Rappahannock County
The poverty data for Rappahannock County shows that 10 of the married-couple family households (0.6%) and 76 of the single-parent households (19.1%) are living below the poverty level. Within the married-couple family households, those with no children have the highest poverty rate, with 10 households (0.8%) falling below the poverty line. Among the single-parent households, those with 3 or 4 children have the highest poverty rate, with 18 household (100.0%) living below poverty.
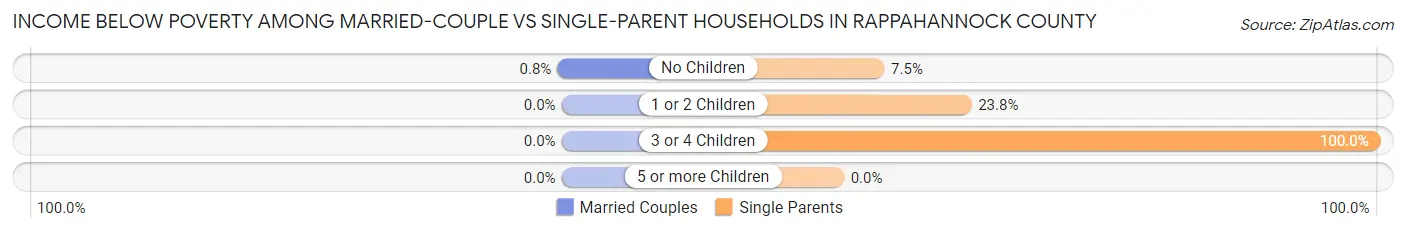
| Children | Married-Couple Families | Single-Parent Households |
| No Children | 10 (0.8%) | 15 (7.5%) |
| 1 or 2 Children | 0 (0.0%) | 43 (23.8%) |
| 3 or 4 Children | 0 (0.0%) | 18 (100.0%) |
| 5 or more Children | 0 (0.0%) | 0 (0.0%) |
| Total | 10 (0.6%) | 76 (19.1%) |
Race in Rappahannock County
The most populous races in Rappahannock County are White / Caucasian (6,479 | 87.3%), Some other Race (335 | 4.5%), and Black / African American (327 | 4.4%).
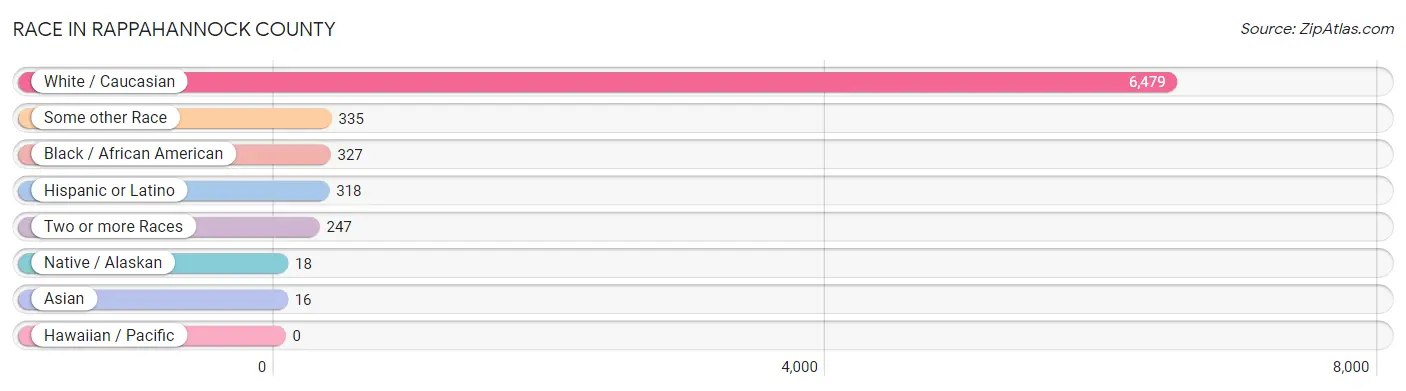
| Race | # Population | % Population |
| Asian | 16 | 0.2% |
| Black / African American | 327 | 4.4% |
| Hawaiian / Pacific | 0 | 0.0% |
| Hispanic or Latino | 318 | 4.3% |
| Native / Alaskan | 18 | 0.2% |
| White / Caucasian | 6,479 | 87.3% |
| Two or more Races | 247 | 3.3% |
| Some other Race | 335 | 4.5% |
| Total | 7,422 | 100.0% |
Ancestry in Rappahannock County
The most populous ancestries reported in Rappahannock County are English (1,391 | 18.7%), Irish (1,258 | 17.0%), German (919 | 12.4%), American (329 | 4.4%), and Italian (312 | 4.2%), together accounting for 56.7% of all Rappahannock County residents.
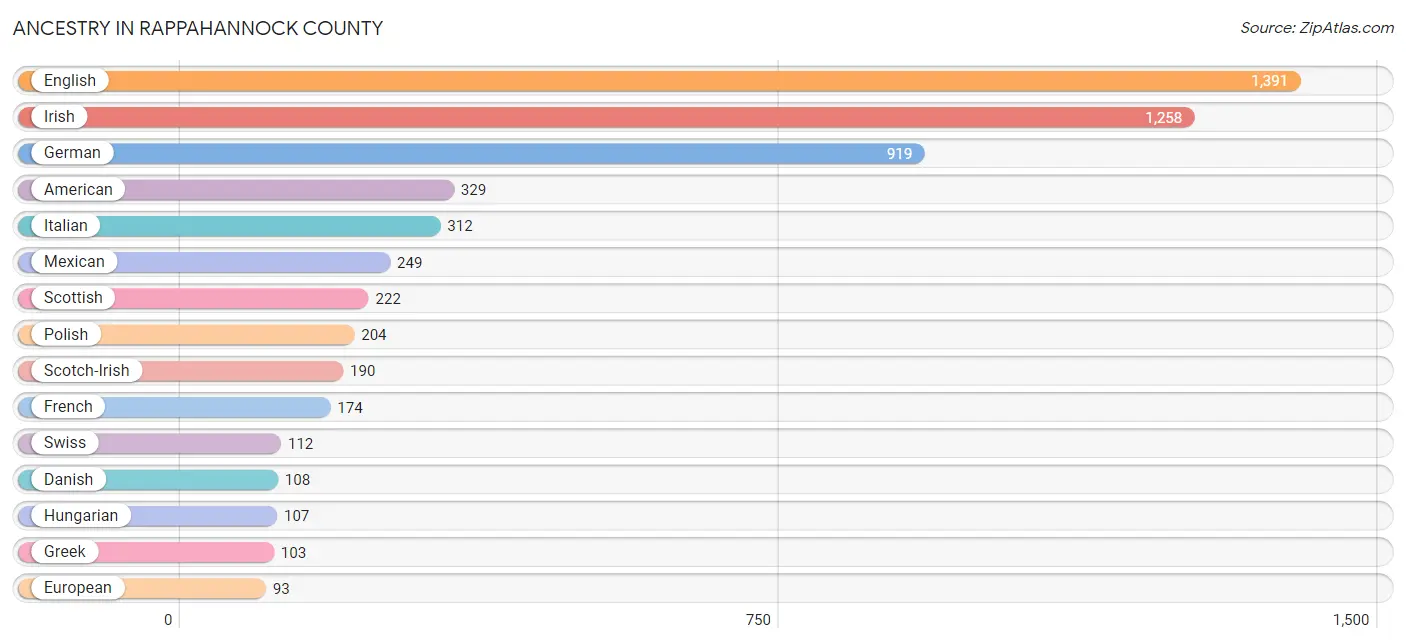
| Ancestry | # Population | % Population |
| African | 44 | 0.6% |
| Aleut | 11 | 0.2% |
| American | 329 | 4.4% |
| Arab | 9 | 0.1% |
| Bhutanese | 31 | 0.4% |
| British | 89 | 1.2% |
| Chickasaw | 13 | 0.2% |
| Choctaw | 13 | 0.2% |
| Colombian | 8 | 0.1% |
| Croatian | 46 | 0.6% |
| Czech | 10 | 0.1% |
| Danish | 108 | 1.5% |
| Dutch | 71 | 1.0% |
| Eastern European | 53 | 0.7% |
| English | 1,391 | 18.7% |
| European | 93 | 1.3% |
| French | 174 | 2.3% |
| French Canadian | 43 | 0.6% |
| German | 919 | 12.4% |
| Greek | 103 | 1.4% |
| Hungarian | 107 | 1.4% |
| Irish | 1,258 | 17.0% |
| Italian | 312 | 4.2% |
| Korean | 10 | 0.1% |
| Laotian | 21 | 0.3% |
| Lebanese | 9 | 0.1% |
| Lithuanian | 51 | 0.7% |
| Mexican | 249 | 3.4% |
| Northern European | 76 | 1.0% |
| Norwegian | 40 | 0.5% |
| Polish | 204 | 2.8% |
| Puerto Rican | 36 | 0.5% |
| Russian | 87 | 1.2% |
| Scotch-Irish | 190 | 2.6% |
| Scottish | 222 | 3.0% |
| Serbian | 7 | 0.1% |
| South African | 38 | 0.5% |
| South American | 8 | 0.1% |
| Subsaharan African | 82 | 1.1% |
| Swedish | 51 | 0.7% |
| Swiss | 112 | 1.5% |
| Welsh | 30 | 0.4% |
| Yugoslavian | 10 | 0.1% | View All 43 Rows |
Immigrants in Rappahannock County
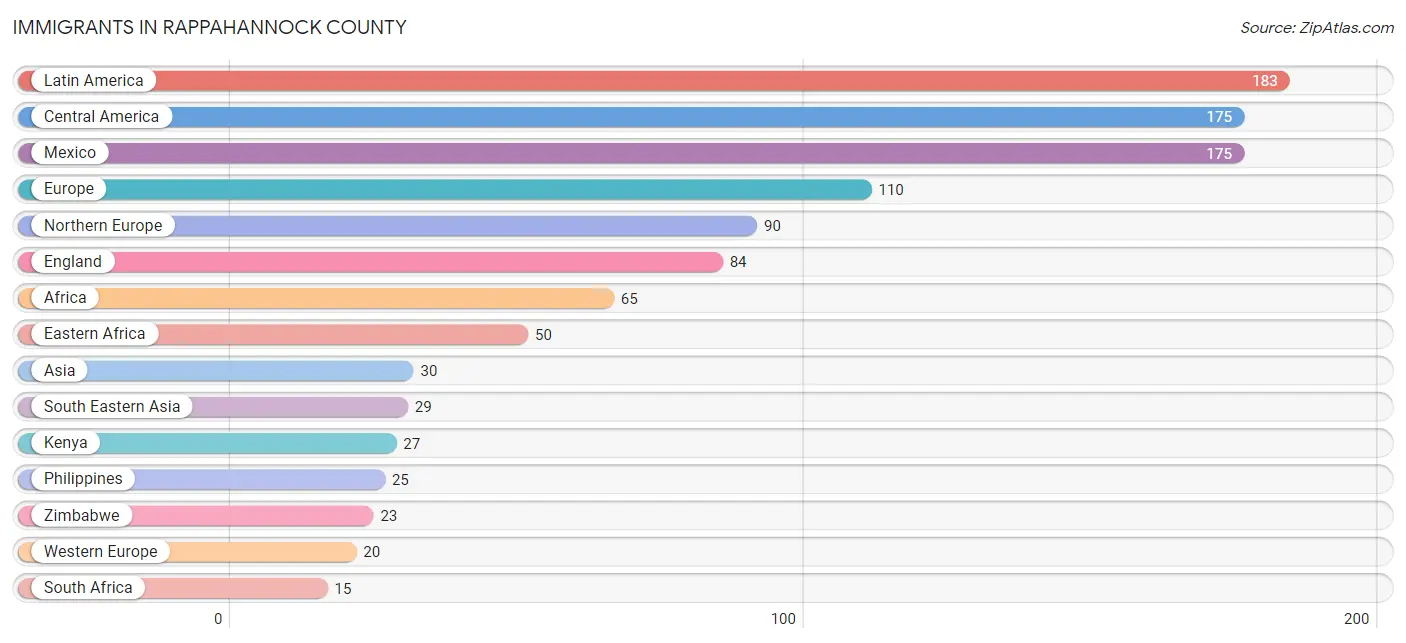
The most numerous immigrant groups reported in Rappahannock County came from Latin America (183 | 2.5%), Central America (175 | 2.4%), Mexico (175 | 2.4%), Europe (110 | 1.5%), and Northern Europe (90 | 1.2%), together accounting for 9.9% of all Rappahannock County residents.
| Immigration Origin | # Population | % Population |
| Africa | 65 | 0.9% |
| Asia | 30 | 0.4% |
| Canada | 4 | 0.1% |
| Central America | 175 | 2.4% |
| Colombia | 8 | 0.1% |
| Eastern Africa | 50 | 0.7% |
| Eastern Asia | 1 | 0.0% |
| England | 84 | 1.1% |
| Europe | 110 | 1.5% |
| France | 7 | 0.1% |
| Germany | 13 | 0.2% |
| Japan | 1 | 0.0% |
| Kenya | 27 | 0.4% |
| Latin America | 183 | 2.5% |
| Mexico | 175 | 2.4% |
| Northern Europe | 90 | 1.2% |
| Philippines | 25 | 0.3% |
| Scotland | 6 | 0.1% |
| South Africa | 15 | 0.2% |
| South America | 8 | 0.1% |
| South Eastern Asia | 29 | 0.4% |
| Thailand | 4 | 0.1% |
| Western Europe | 20 | 0.3% |
| Zimbabwe | 23 | 0.3% | View All 24 Rows |
Sex and Age in Rappahannock County
Sex and Age in Rappahannock County
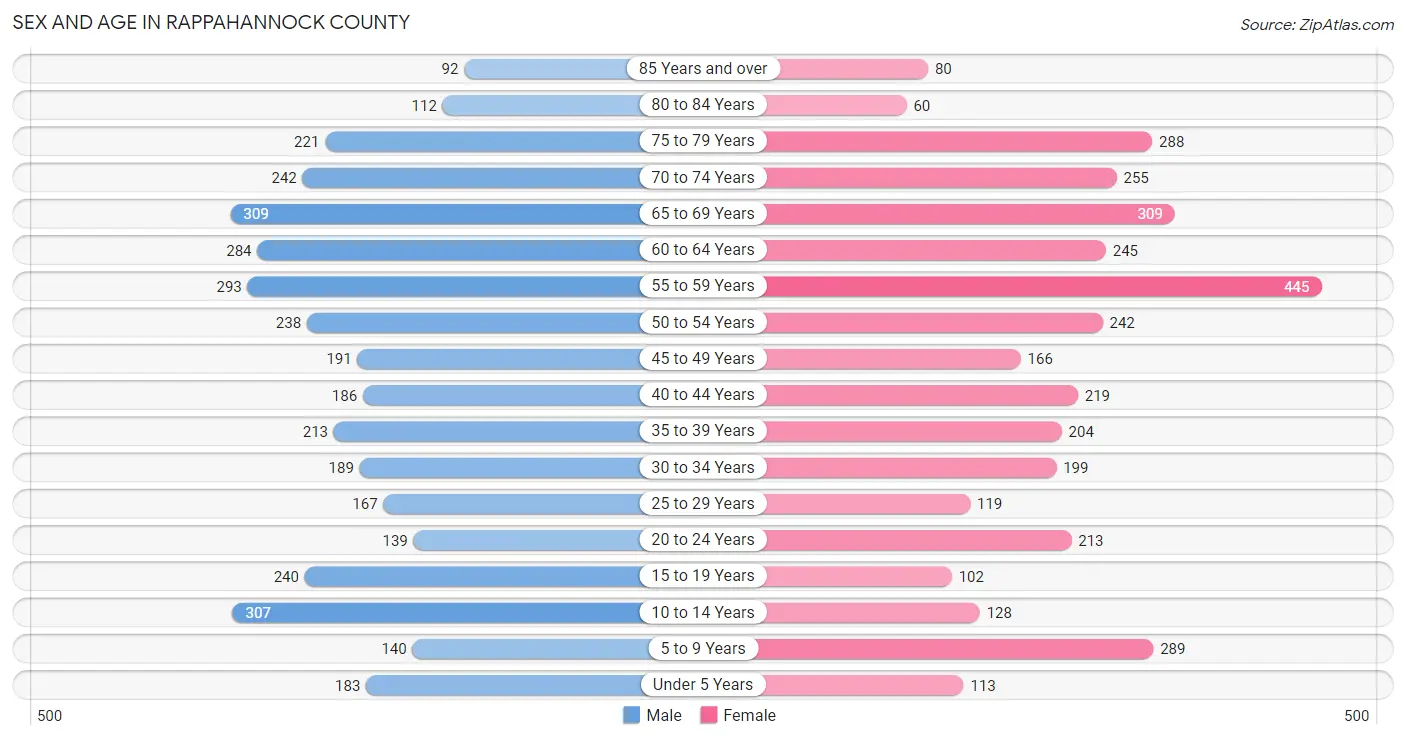
The most populous age groups in Rappahannock County are 65 to 69 Years (309 | 8.3%) for men and 55 to 59 Years (445 | 12.1%) for women.
| Age Bracket | Male | Female |
| Under 5 Years | 183 (4.9%) | 113 (3.1%) |
| 5 to 9 Years | 140 (3.7%) | 289 (7.9%) |
| 10 to 14 Years | 307 (8.2%) | 128 (3.5%) |
| 15 to 19 Years | 240 (6.4%) | 102 (2.8%) |
| 20 to 24 Years | 139 (3.7%) | 213 (5.8%) |
| 25 to 29 Years | 167 (4.5%) | 119 (3.2%) |
| 30 to 34 Years | 189 (5.1%) | 199 (5.4%) |
| 35 to 39 Years | 213 (5.7%) | 204 (5.6%) |
| 40 to 44 Years | 186 (5.0%) | 219 (6.0%) |
| 45 to 49 Years | 191 (5.1%) | 166 (4.5%) |
| 50 to 54 Years | 238 (6.4%) | 242 (6.6%) |
| 55 to 59 Years | 293 (7.8%) | 445 (12.1%) |
| 60 to 64 Years | 284 (7.6%) | 245 (6.7%) |
| 65 to 69 Years | 309 (8.3%) | 309 (8.4%) |
| 70 to 74 Years | 242 (6.5%) | 255 (6.9%) |
| 75 to 79 Years | 221 (5.9%) | 288 (7.8%) |
| 80 to 84 Years | 112 (3.0%) | 60 (1.6%) |
| 85 Years and over | 92 (2.5%) | 80 (2.2%) |
| Total | 3,746 (100.0%) | 3,676 (100.0%) |
Families and Households in Rappahannock County
Median Family Size in Rappahannock County
The median family size in Rappahannock County is 3.04 persons per family, with single female/mother families (218 | 11.0%) accounting for the largest median family size of 3.9 persons per family. On the other hand, married-couple families (1,576 | 79.8%) represent the smallest median family size with 2.87 persons per family.
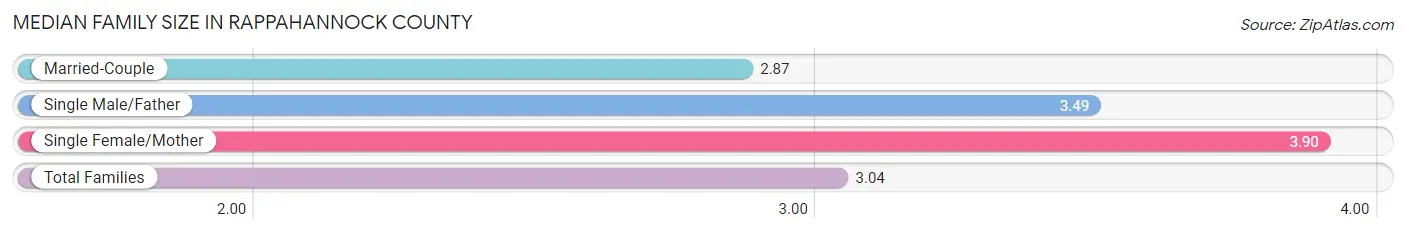
| Family Type | # Families | Family Size |
| Married-Couple | 1,576 (79.8%) | 2.87 |
| Single Male/Father | 180 (9.1%) | 3.49 |
| Single Female/Mother | 218 (11.0%) | 3.90 |
| Total Families | 1,974 (100.0%) | 3.04 |
Median Household Size in Rappahannock County
The median household size in Rappahannock County is 2.63 persons per household, with single female/mother households (218 | 7.7%) accounting for the largest median household size of 4.52 persons per household. non-family households (849 | 30.1%) represent the smallest median household size with 1.29 persons per household.
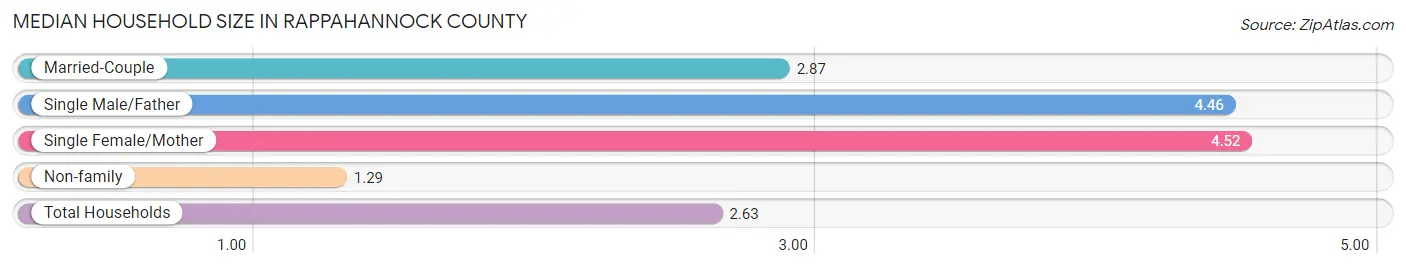
| Household Type | # Households | Household Size |
| Married-Couple | 1,576 (55.8%) | 2.87 |
| Single Male/Father | 180 (6.4%) | 4.46 |
| Single Female/Mother | 218 (7.7%) | 4.52 |
| Non-family | 849 (30.1%) | 1.29 |
| Total Households | 2,823 (100.0%) | 2.63 |
Household Size by Marriage Status in Rappahannock County
Out of a total of 2,823 households in Rappahannock County, 1,974 (69.9%) are family households, while 849 (30.1%) are nonfamily households. The most numerous type of family households are 2-person households, comprising 1,171, and the most common type of nonfamily households are 1-person households, comprising 668.
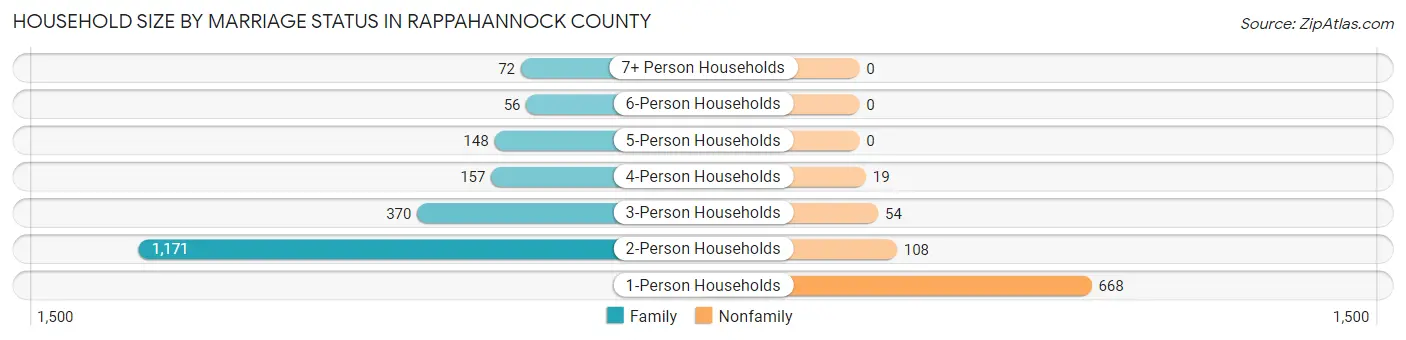
| Household Size | Family Households | Nonfamily Households |
| 1-Person Households | - | 668 (23.7%) |
| 2-Person Households | 1,171 (41.5%) | 108 (3.8%) |
| 3-Person Households | 370 (13.1%) | 54 (1.9%) |
| 4-Person Households | 157 (5.6%) | 19 (0.7%) |
| 5-Person Households | 148 (5.2%) | 0 (0.0%) |
| 6-Person Households | 56 (2.0%) | 0 (0.0%) |
| 7+ Person Households | 72 (2.5%) | 0 (0.0%) |
| Total | 1,974 (69.9%) | 849 (30.1%) |
Female Fertility in Rappahannock County
Fertility by Age in Rappahannock County
Average fertility rate in Rappahannock County is 20.0 births per 1,000 women. Women in the age bracket of 20 to 34 years have the highest fertility rate with 47.0 births per 1,000 women. Women in the age bracket of 20 to 34 years acount for 100.0% of all women with births.
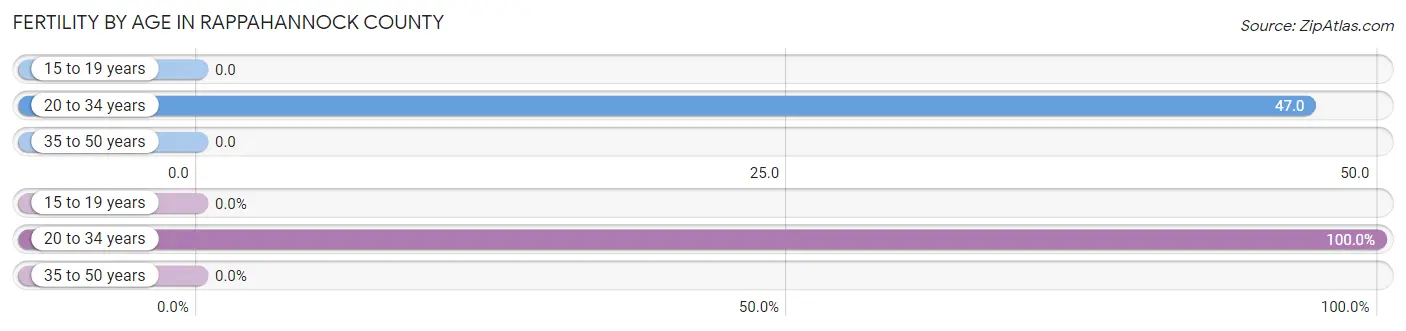
| Age Bracket | Women with Births | Births / 1,000 Women |
| 15 to 19 years | 0 (0.0%) | 0.0 |
| 20 to 34 years | 25 (100.0%) | 47.0 |
| 35 to 50 years | 0 (0.0%) | 0.0 |
| Total | 25 (100.0%) | 20.0 |
Fertility by Age by Marriage Status in Rappahannock County
24.0% of women with births (25) in Rappahannock County are married. The highest percentage of unmarried women with births falls into 20 to 34 years age bracket with 76.0% of them unmarried at the time of birth, while the lowest percentage of unmarried women with births belong to 20 to 34 years age bracket with 76.0% of them unmarried.
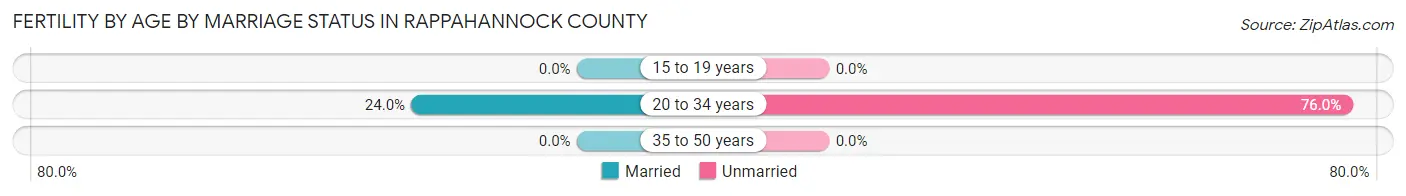
| Age Bracket | Married | Unmarried |
| 15 to 19 years | 0 (0.0%) | 0 (0.0%) |
| 20 to 34 years | 6 (24.0%) | 19 (76.0%) |
| 35 to 50 years | 0 (0.0%) | 0 (0.0%) |
| Total | 6 (24.0%) | 19 (76.0%) |
Fertility by Education in Rappahannock County
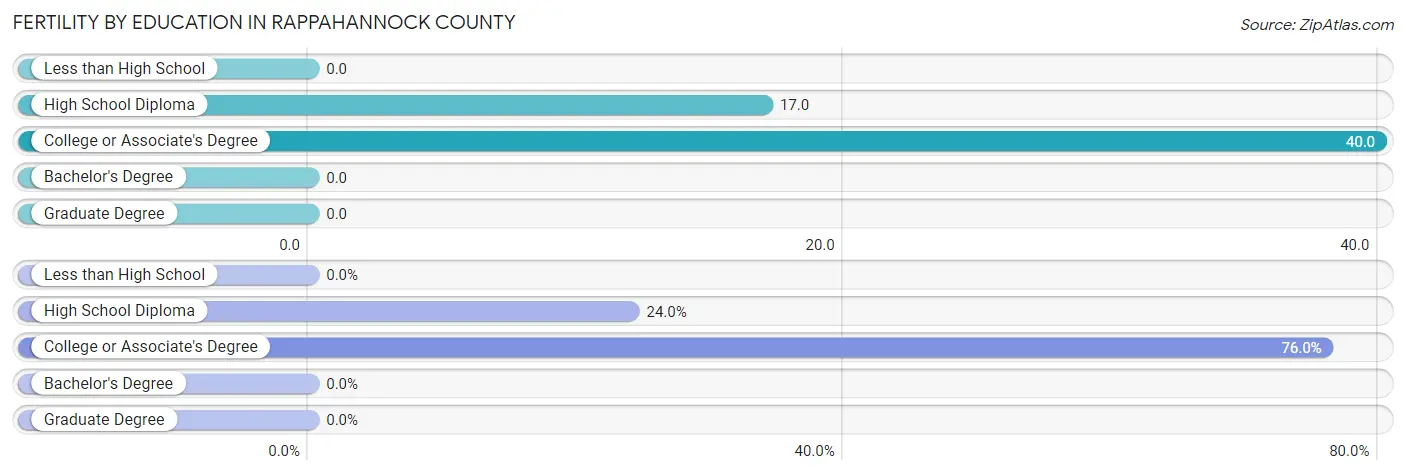
| Educational Attainment | Women with Births | Births / 1,000 Women |
| Less than High School | 0 (0.0%) | 0.0 |
| High School Diploma | 6 (24.0%) | 17.0 |
| College or Associate's Degree | 19 (76.0%) | 40.0 |
| Bachelor's Degree | 0 (0.0%) | 0.0 |
| Graduate Degree | 0 (0.0%) | 0.0 |
| Total | 25 (100.0%) | 20.0 |
Fertility by Education by Marriage Status in Rappahannock County
76.0% of women with births in Rappahannock County are unmarried. Women with the educational attainment of college or associate's degree are most likely to be married with 31.6% of them married at childbirth, while women with the educational attainment of high school diploma are least likely to be married with 100.0% of them unmarried at childbirth.
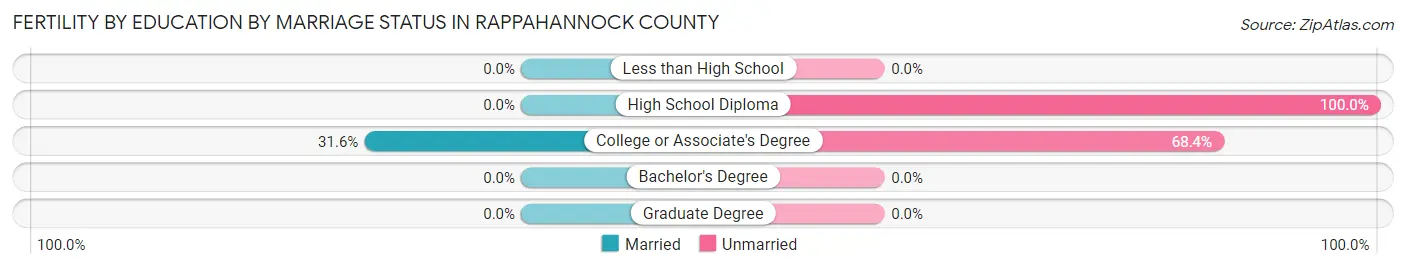
| Educational Attainment | Married | Unmarried |
| Less than High School | 0 (0.0%) | 0 (0.0%) |
| High School Diploma | 0 (0.0%) | 6 (100.0%) |
| College or Associate's Degree | 6 (31.6%) | 13 (68.4%) |
| Bachelor's Degree | 0 (0.0%) | 0 (0.0%) |
| Graduate Degree | 0 (0.0%) | 0 (0.0%) |
| Total | 6 (24.0%) | 19 (76.0%) |
Employment Characteristics in Rappahannock County
Employment by Class of Employer in Rappahannock County
Among the 3,468 employed individuals in Rappahannock County, private company employees (2,116 | 61.0%), self-employed (not incorporated) (330 | 9.5%), and not-for-profit organizations (304 | 8.8%) make up the most common classes of employment.
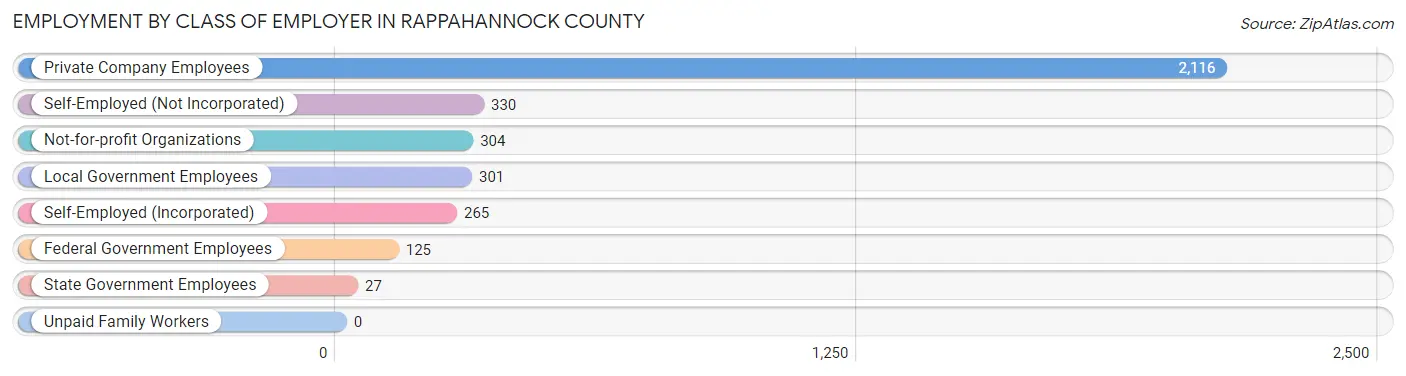
| Employer Class | # Employees | % Employees |
| Private Company Employees | 2,116 | 61.0% |
| Self-Employed (Incorporated) | 265 | 7.6% |
| Self-Employed (Not Incorporated) | 330 | 9.5% |
| Not-for-profit Organizations | 304 | 8.8% |
| Local Government Employees | 301 | 8.7% |
| State Government Employees | 27 | 0.8% |
| Federal Government Employees | 125 | 3.6% |
| Unpaid Family Workers | 0 | 0.0% |
| Total | 3,468 | 100.0% |
Employment Status by Age in Rappahannock County
According to the labor force statistics for Rappahannock County, out of the total population over 16 years of age (6,203), 61.6% or 3,821 individuals are in the labor force, with 6.5% or 248 of them unemployed. The age group with the highest labor force participation rate is 35 to 44 years, with 88.7% or 729 individuals in the labor force. Within the labor force, the 20 to 24 years age range has the highest percentage of unemployed individuals, with 13.8% or 41 of them being unemployed.
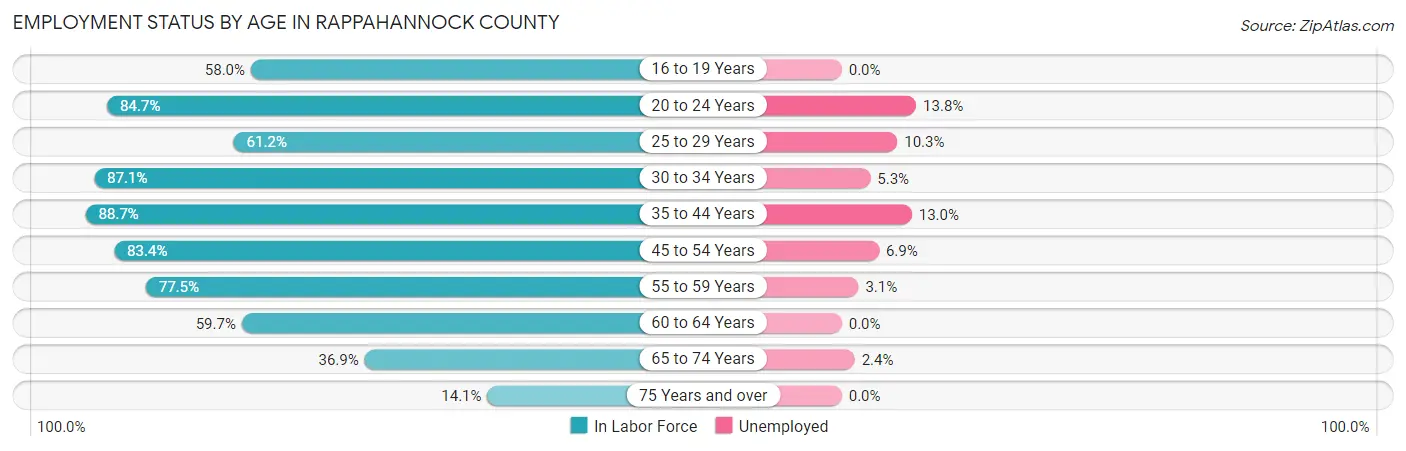
| Age Bracket | In Labor Force | Unemployed |
| 16 to 19 Years | 164 (58.0%) | 0 (0.0%) |
| 20 to 24 Years | 298 (84.7%) | 41 (13.8%) |
| 25 to 29 Years | 175 (61.2%) | 18 (10.3%) |
| 30 to 34 Years | 338 (87.1%) | 18 (5.3%) |
| 35 to 44 Years | 729 (88.7%) | 95 (13.0%) |
| 45 to 54 Years | 698 (83.4%) | 48 (6.9%) |
| 55 to 59 Years | 572 (77.5%) | 18 (3.1%) |
| 60 to 64 Years | 316 (59.7%) | 0 (0.0%) |
| 65 to 74 Years | 411 (36.9%) | 10 (2.4%) |
| 75 Years and over | 120 (14.1%) | 0 (0.0%) |
| Total | 3,821 (61.6%) | 248 (6.5%) |
Employment Status by Educational Attainment in Rappahannock County
According to labor force statistics for Rappahannock County, 78.6% of individuals (2,830) out of the total population between 25 and 64 years of age (3,600) are in the labor force, with 7.0% or 198 of them being unemployed. The group with the highest labor force participation rate are those with the educational attainment of bachelor's degree or higher, with 81.7% or 794 individuals in the labor force. Within the labor force, individuals with high school diploma education have the highest percentage of unemployment, with 10.8% or 95 of them being unemployed.
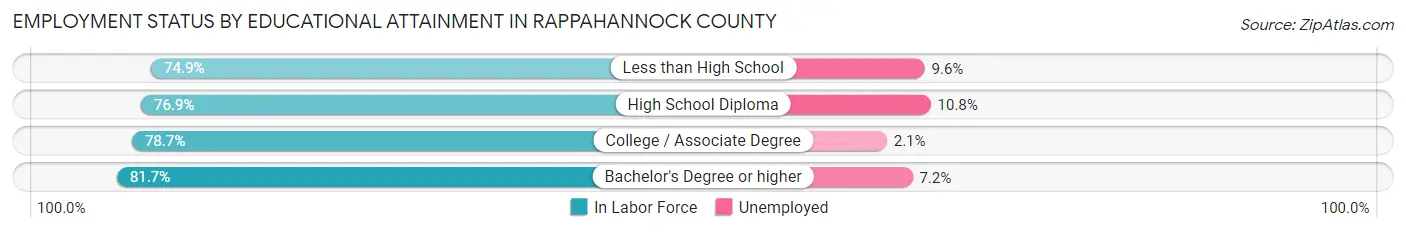
| Educational Attainment | In Labor Force | Unemployed |
| Less than High School | 281 (74.9%) | 36 (9.6%) |
| High School Diploma | 880 (76.9%) | 124 (10.8%) |
| College / Associate Degree | 873 (78.7%) | 23 (2.1%) |
| Bachelor's Degree or higher | 794 (81.7%) | 70 (7.2%) |
| Total | 2,830 (78.6%) | 252 (7.0%) |
Employment Occupations by Sex in Rappahannock County
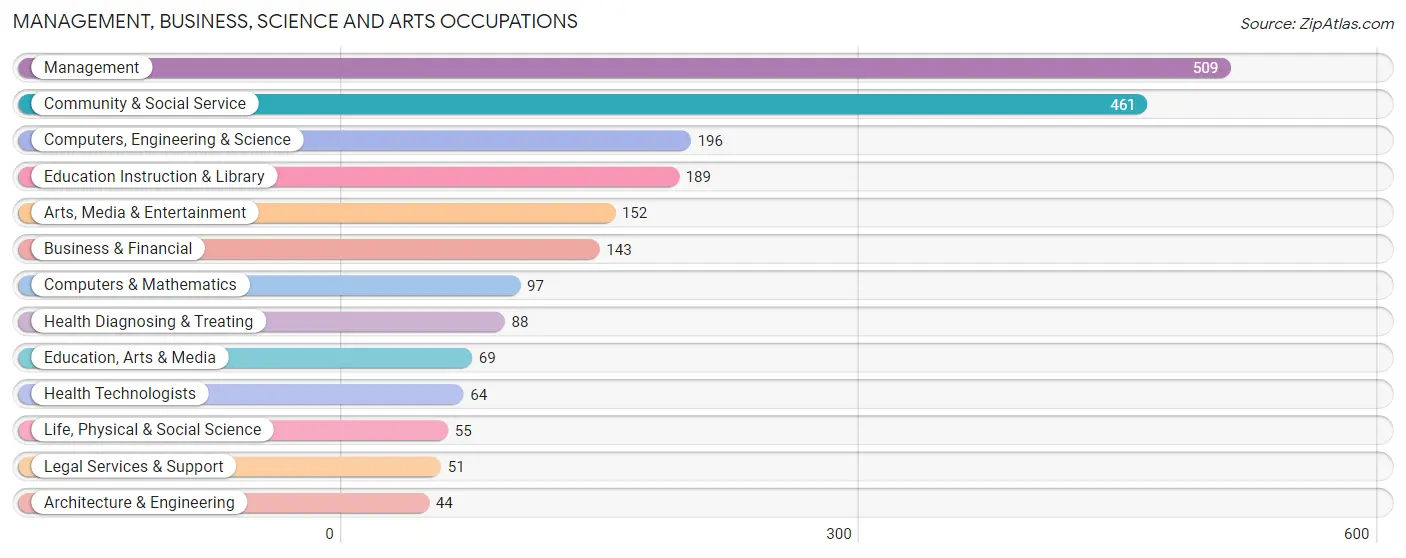
Management, Business, Science and Arts Occupations
The most common Management, Business, Science and Arts occupations in Rappahannock County are Management (509 | 14.2%), Community & Social Service (461 | 12.9%), Computers, Engineering & Science (196 | 5.5%), Education Instruction & Library (189 | 5.3%), and Arts, Media & Entertainment (152 | 4.3%).
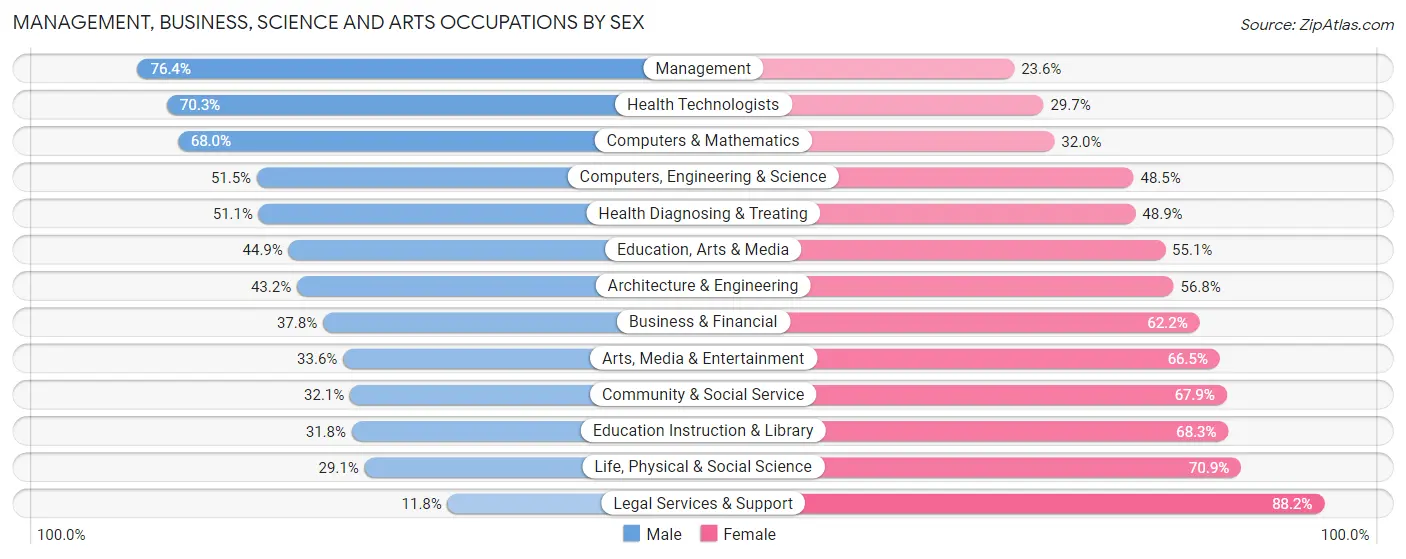
Management, Business, Science and Arts Occupations by Sex
Within the Management, Business, Science and Arts occupations in Rappahannock County, the most male-oriented occupations are Management (76.4%), Health Technologists (70.3%), and Computers & Mathematics (68.0%), while the most female-oriented occupations are Legal Services & Support (88.2%), Life, Physical & Social Science (70.9%), and Education Instruction & Library (68.2%).
| Occupation | Male | Female |
| Management | 389 (76.4%) | 120 (23.6%) |
| Business & Financial | 54 (37.8%) | 89 (62.2%) |
| Computers, Engineering & Science | 101 (51.5%) | 95 (48.5%) |
| Computers & Mathematics | 66 (68.0%) | 31 (32.0%) |
| Architecture & Engineering | 19 (43.2%) | 25 (56.8%) |
| Life, Physical & Social Science | 16 (29.1%) | 39 (70.9%) |
| Community & Social Service | 148 (32.1%) | 313 (67.9%) |
| Education, Arts & Media | 31 (44.9%) | 38 (55.1%) |
| Legal Services & Support | 6 (11.8%) | 45 (88.2%) |
| Education Instruction & Library | 60 (31.8%) | 129 (68.2%) |
| Arts, Media & Entertainment | 51 (33.6%) | 101 (66.4%) |
| Health Diagnosing & Treating | 45 (51.1%) | 43 (48.9%) |
| Health Technologists | 45 (70.3%) | 19 (29.7%) |
| Total (Category) | 737 (52.8%) | 660 (47.2%) |
| Total (Overall) | 1,836 (51.4%) | 1,737 (48.6%) |
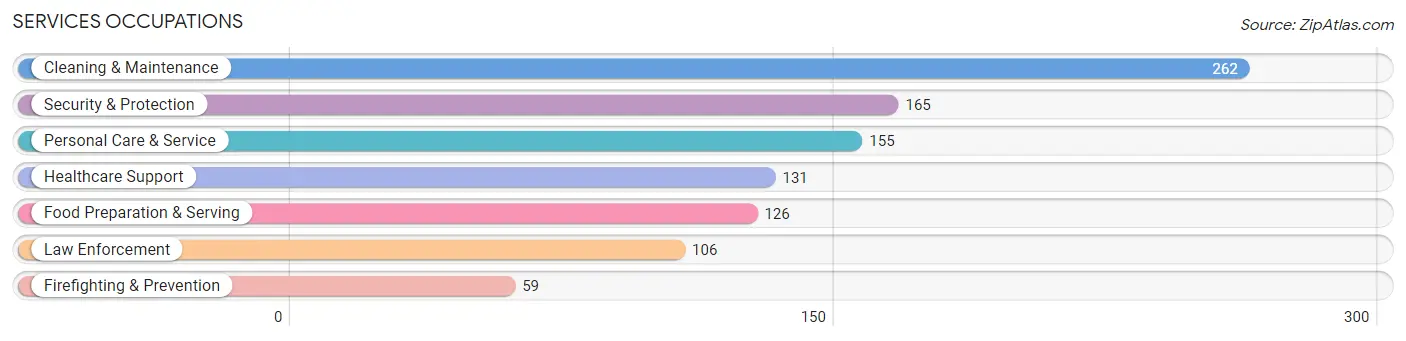
Services Occupations
The most common Services occupations in Rappahannock County are Cleaning & Maintenance (262 | 7.3%), Security & Protection (165 | 4.6%), Personal Care & Service (155 | 4.3%), Healthcare Support (131 | 3.7%), and Food Preparation & Serving (126 | 3.5%).
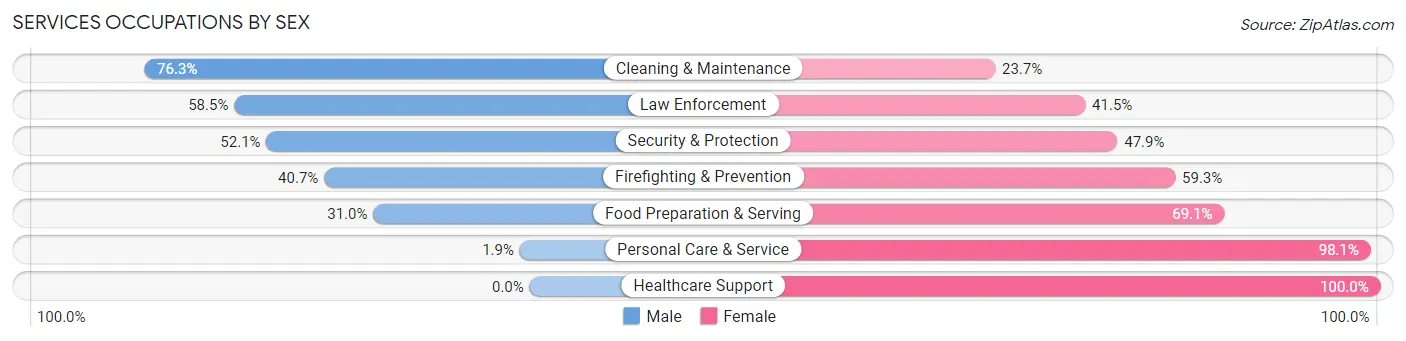
Services Occupations by Sex
Within the Services occupations in Rappahannock County, the most male-oriented occupations are Cleaning & Maintenance (76.3%), Law Enforcement (58.5%), and Security & Protection (52.1%), while the most female-oriented occupations are Healthcare Support (100.0%), Personal Care & Service (98.1%), and Food Preparation & Serving (69.1%).
| Occupation | Male | Female |
| Healthcare Support | 0 (0.0%) | 131 (100.0%) |
| Security & Protection | 86 (52.1%) | 79 (47.9%) |
| Firefighting & Prevention | 24 (40.7%) | 35 (59.3%) |
| Law Enforcement | 62 (58.5%) | 44 (41.5%) |
| Food Preparation & Serving | 39 (30.9%) | 87 (69.1%) |
| Cleaning & Maintenance | 200 (76.3%) | 62 (23.7%) |
| Personal Care & Service | 3 (1.9%) | 152 (98.1%) |
| Total (Category) | 328 (39.1%) | 511 (60.9%) |
| Total (Overall) | 1,836 (51.4%) | 1,737 (48.6%) |
Sales and Office Occupations
The most common Sales and Office occupations in Rappahannock County are Sales & Related (356 | 10.0%), and Office & Administration (179 | 5.0%).

Sales and Office Occupations by Sex
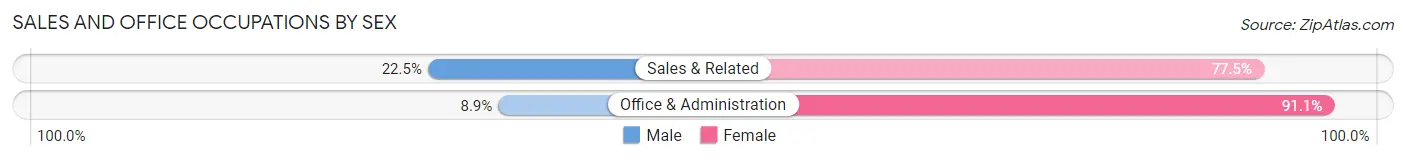
| Occupation | Male | Female |
| Sales & Related | 80 (22.5%) | 276 (77.5%) |
| Office & Administration | 16 (8.9%) | 163 (91.1%) |
| Total (Category) | 96 (17.9%) | 439 (82.1%) |
| Total (Overall) | 1,836 (51.4%) | 1,737 (48.6%) |
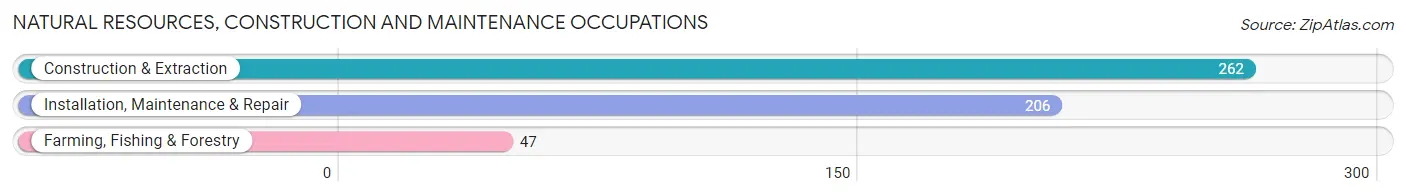
Natural Resources, Construction and Maintenance Occupations
The most common Natural Resources, Construction and Maintenance occupations in Rappahannock County are Construction & Extraction (262 | 7.3%), Installation, Maintenance & Repair (206 | 5.8%), and Farming, Fishing & Forestry (47 | 1.3%).
Natural Resources, Construction and Maintenance Occupations by Sex
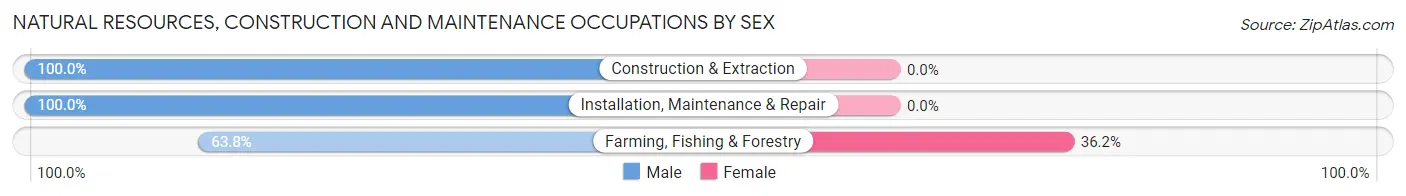
| Occupation | Male | Female |
| Farming, Fishing & Forestry | 30 (63.8%) | 17 (36.2%) |
| Construction & Extraction | 262 (100.0%) | 0 (0.0%) |
| Installation, Maintenance & Repair | 206 (100.0%) | 0 (0.0%) |
| Total (Category) | 498 (96.7%) | 17 (3.3%) |
| Total (Overall) | 1,836 (51.4%) | 1,737 (48.6%) |
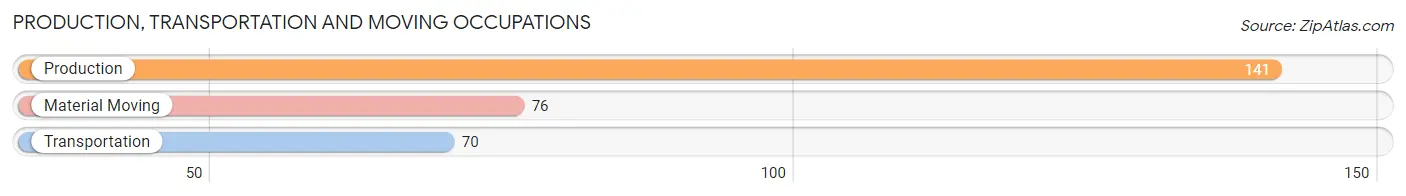
Production, Transportation and Moving Occupations
The most common Production, Transportation and Moving occupations in Rappahannock County are Production (141 | 4.0%), Material Moving (76 | 2.1%), and Transportation (70 | 2.0%).
Production, Transportation and Moving Occupations by Sex
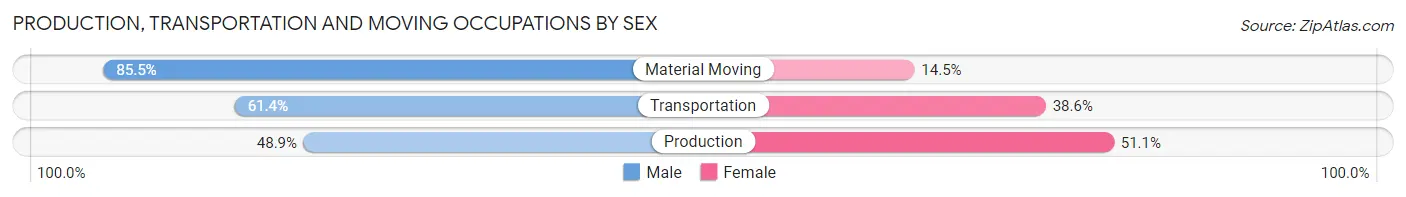
| Occupation | Male | Female |
| Production | 69 (48.9%) | 72 (51.1%) |
| Transportation | 43 (61.4%) | 27 (38.6%) |
| Material Moving | 65 (85.5%) | 11 (14.5%) |
| Total (Category) | 177 (61.7%) | 110 (38.3%) |
| Total (Overall) | 1,836 (51.4%) | 1,737 (48.6%) |
Employment Industries by Sex in Rappahannock County
Employment Industries in Rappahannock County
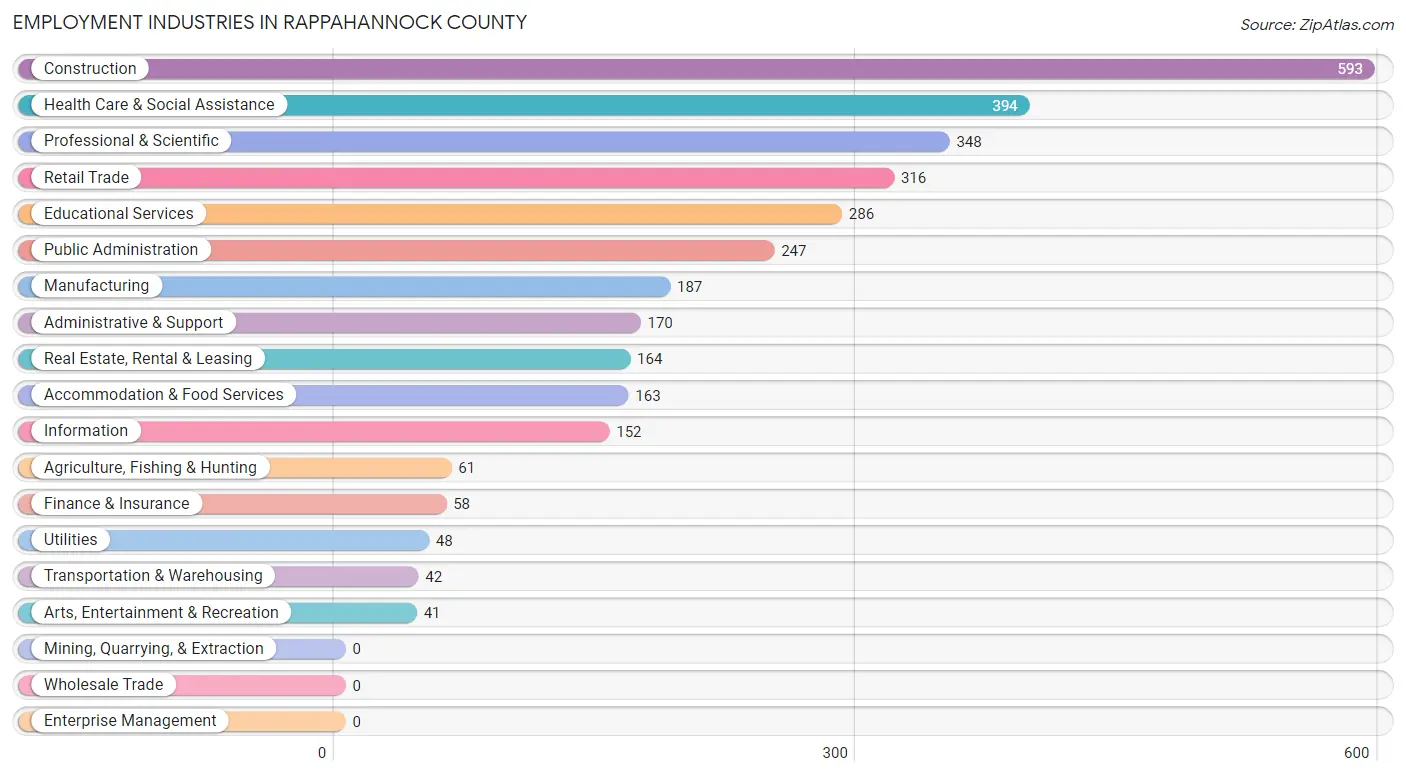
The major employment industries in Rappahannock County include Construction (593 | 16.6%), Health Care & Social Assistance (394 | 11.0%), Professional & Scientific (348 | 9.7%), Retail Trade (316 | 8.8%), and Educational Services (286 | 8.0%).
Employment Industries by Sex in Rappahannock County
The Rappahannock County industries that see more men than women are Real Estate, Rental & Leasing (91.5%), Administrative & Support (82.4%), and Utilities (77.1%), whereas the industries that tend to have a higher number of women are Educational Services (80.1%), Health Care & Social Assistance (78.2%), and Arts, Entertainment & Recreation (78.0%).
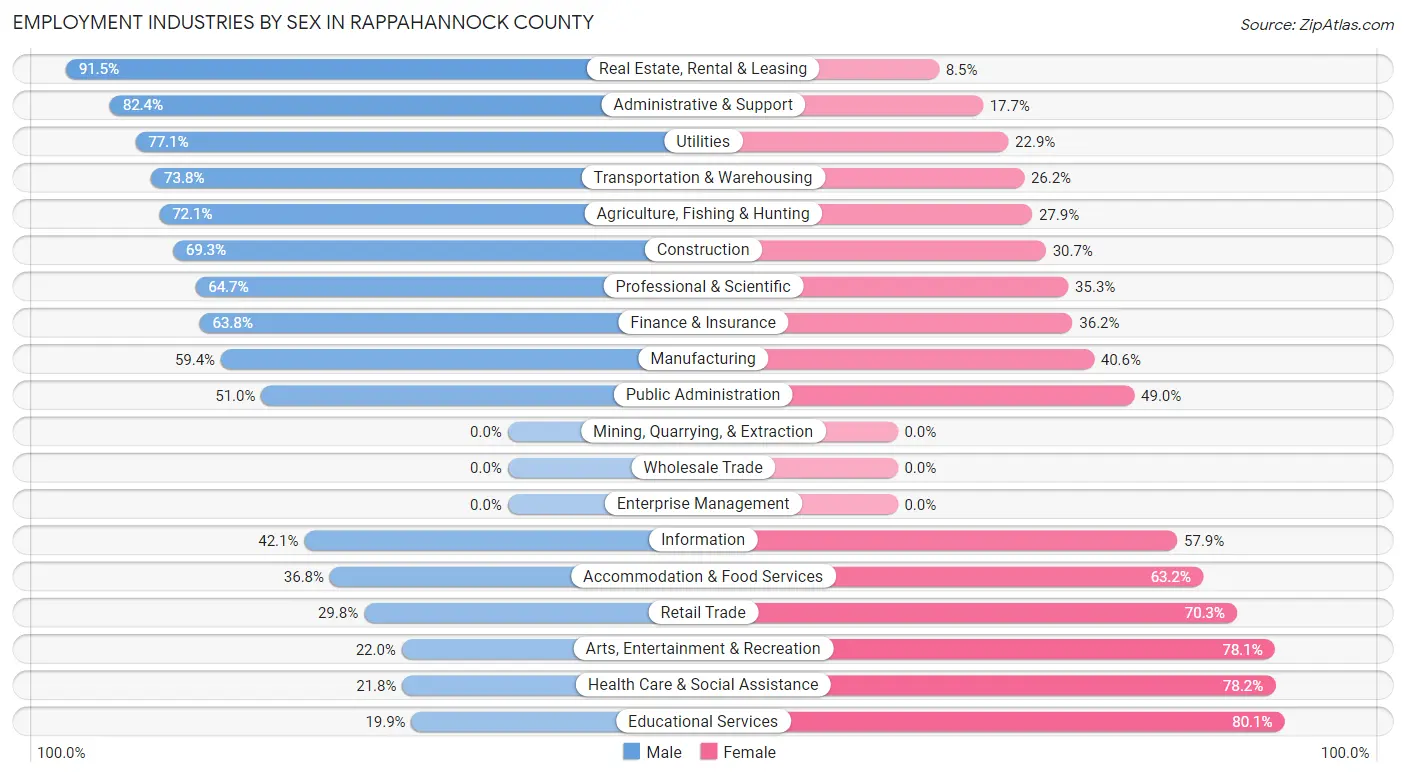
| Industry | Male | Female |
| Agriculture, Fishing & Hunting | 44 (72.1%) | 17 (27.9%) |
| Mining, Quarrying, & Extraction | 0 (0.0%) | 0 (0.0%) |
| Construction | 411 (69.3%) | 182 (30.7%) |
| Manufacturing | 111 (59.4%) | 76 (40.6%) |
| Wholesale Trade | 0 (0.0%) | 0 (0.0%) |
| Retail Trade | 94 (29.7%) | 222 (70.3%) |
| Transportation & Warehousing | 31 (73.8%) | 11 (26.2%) |
| Utilities | 37 (77.1%) | 11 (22.9%) |
| Information | 64 (42.1%) | 88 (57.9%) |
| Finance & Insurance | 37 (63.8%) | 21 (36.2%) |
| Real Estate, Rental & Leasing | 150 (91.5%) | 14 (8.5%) |
| Professional & Scientific | 225 (64.7%) | 123 (35.3%) |
| Enterprise Management | 0 (0.0%) | 0 (0.0%) |
| Administrative & Support | 140 (82.4%) | 30 (17.6%) |
| Educational Services | 57 (19.9%) | 229 (80.1%) |
| Health Care & Social Assistance | 86 (21.8%) | 308 (78.2%) |
| Arts, Entertainment & Recreation | 9 (22.0%) | 32 (78.0%) |
| Accommodation & Food Services | 60 (36.8%) | 103 (63.2%) |
| Public Administration | 126 (51.0%) | 121 (49.0%) |
| Total | 1,836 (51.4%) | 1,737 (48.6%) |
Education in Rappahannock County
School Enrollment in Rappahannock County
The most common levels of schooling among the 1,258 students in Rappahannock County are middle school (375 | 29.8%), elementary school (343 | 27.3%), and high school (242 | 19.2%).
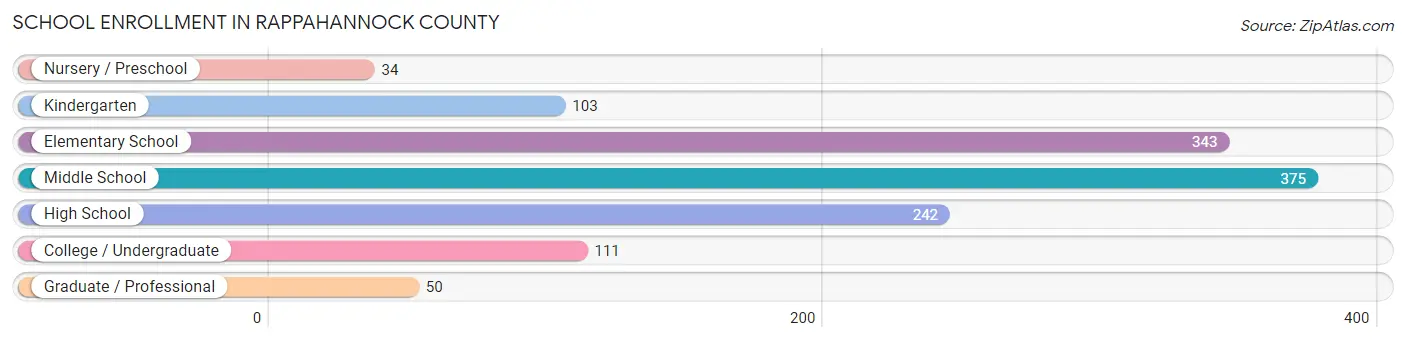
| School Level | # Students | % Students |
| Nursery / Preschool | 34 | 2.7% |
| Kindergarten | 103 | 8.2% |
| Elementary School | 343 | 27.3% |
| Middle School | 375 | 29.8% |
| High School | 242 | 19.2% |
| College / Undergraduate | 111 | 8.8% |
| Graduate / Professional | 50 | 4.0% |
| Total | 1,258 | 100.0% |
School Enrollment by Age by Funding Source in Rappahannock County
Out of a total of 1,258 students who are enrolled in schools in Rappahannock County, 216 (17.2%) attend a private institution, while the remaining 1,042 (82.8%) are enrolled in public schools. The age group of 20 to 24 year olds has the highest likelihood of being enrolled in private schools, with 18 (27.3% in the age bracket) enrolled. Conversely, the age group of 35 years and over has the lowest likelihood of being enrolled in a private school, with 32 (97.0% in the age bracket) attending a public institution.
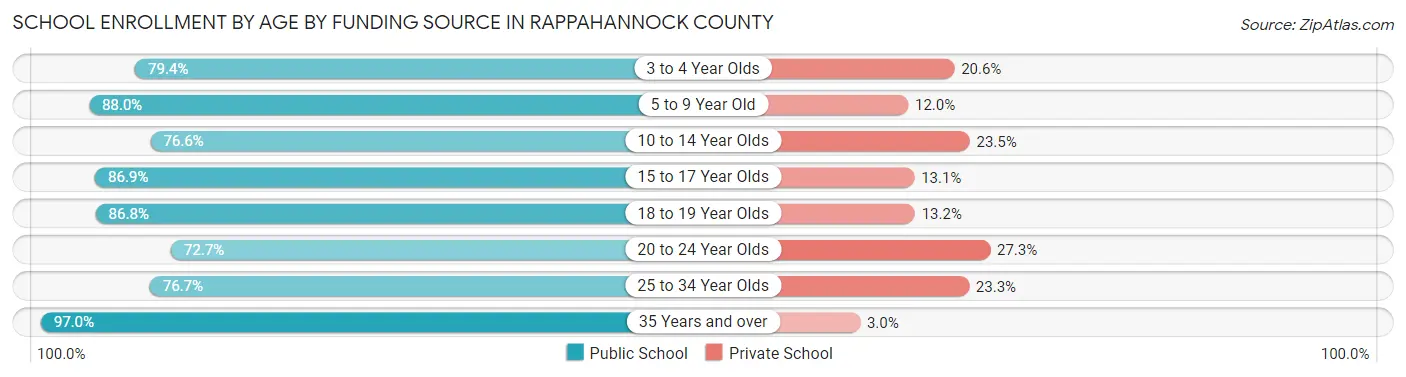
| Age Bracket | Public School | Private School |
| 3 to 4 Year Olds | 27 (79.4%) | 7 (20.6%) |
| 5 to 9 Year Old | 367 (88.0%) | 50 (12.0%) |
| 10 to 14 Year Olds | 333 (76.5%) | 102 (23.4%) |
| 15 to 17 Year Olds | 152 (86.9%) | 23 (13.1%) |
| 18 to 19 Year Olds | 59 (86.8%) | 9 (13.2%) |
| 20 to 24 Year Olds | 48 (72.7%) | 18 (27.3%) |
| 25 to 34 Year Olds | 23 (76.7%) | 7 (23.3%) |
| 35 Years and over | 32 (97.0%) | 1 (3.0%) |
| Total | 1,042 (82.8%) | 216 (17.2%) |
Educational Attainment by Field of Study in Rappahannock County
Business (327 | 16.3%), social sciences (287 | 14.3%), science & technology (241 | 12.0%), liberal arts & history (212 | 10.5%), and visual & performing arts (181 | 9.0%) are the most common fields of study among 2,012 individuals in Rappahannock County who have obtained a bachelor's degree or higher.
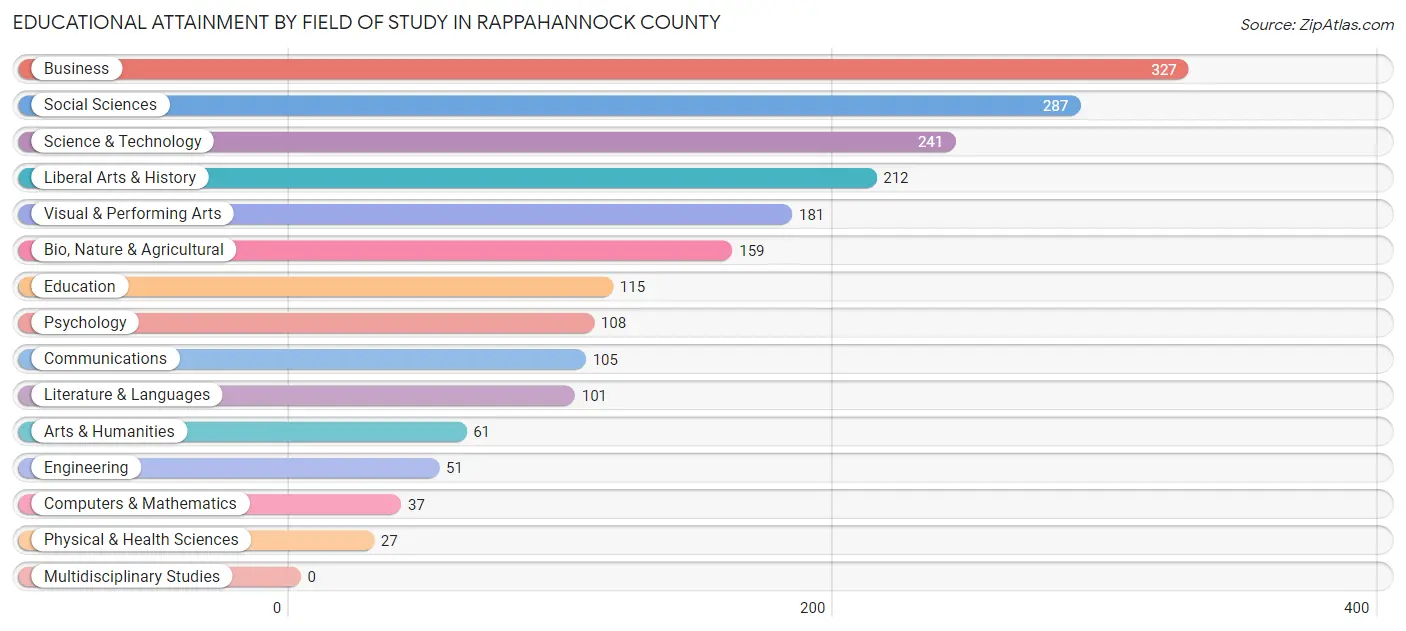
| Field of Study | # Graduates | % Graduates |
| Computers & Mathematics | 37 | 1.8% |
| Bio, Nature & Agricultural | 159 | 7.9% |
| Physical & Health Sciences | 27 | 1.3% |
| Psychology | 108 | 5.4% |
| Social Sciences | 287 | 14.3% |
| Engineering | 51 | 2.5% |
| Multidisciplinary Studies | 0 | 0.0% |
| Science & Technology | 241 | 12.0% |
| Business | 327 | 16.3% |
| Education | 115 | 5.7% |
| Literature & Languages | 101 | 5.0% |
| Liberal Arts & History | 212 | 10.5% |
| Visual & Performing Arts | 181 | 9.0% |
| Communications | 105 | 5.2% |
| Arts & Humanities | 61 | 3.0% |
| Total | 2,012 | 100.0% |
Transportation & Commute in Rappahannock County
Vehicle Availability by Sex in Rappahannock County
The most prevalent vehicle ownership categories in Rappahannock County are males with 2 vehicles (658, accounting for 36.8%) and females with 2 vehicles (537, making up 39.2%).
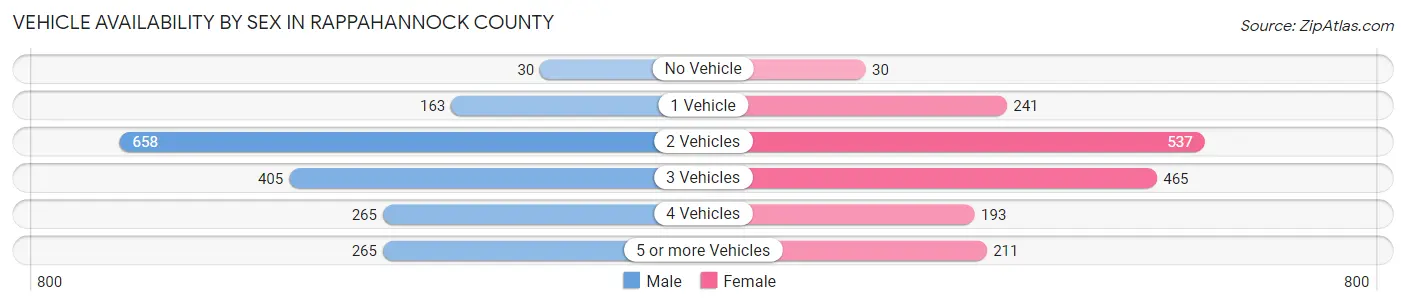
| Vehicles Available | Male | Female |
| No Vehicle | 30 (1.7%) | 30 (1.8%) |
| 1 Vehicle | 163 (9.1%) | 241 (14.4%) |
| 2 Vehicles | 658 (36.8%) | 537 (32.0%) |
| 3 Vehicles | 405 (22.7%) | 465 (27.7%) |
| 4 Vehicles | 265 (14.8%) | 193 (11.5%) |
| 5 or more Vehicles | 265 (14.8%) | 211 (12.6%) |
| Total | 1,786 (100.0%) | 1,677 (100.0%) |
Commute Time in Rappahannock County
The most frequently occuring commute durations in Rappahannock County are 60 to 89 minutes (501 commuters, 17.0%), 90 or more minutes (309 commuters, 10.5%), and 20 to 24 minutes (305 commuters, 10.4%).
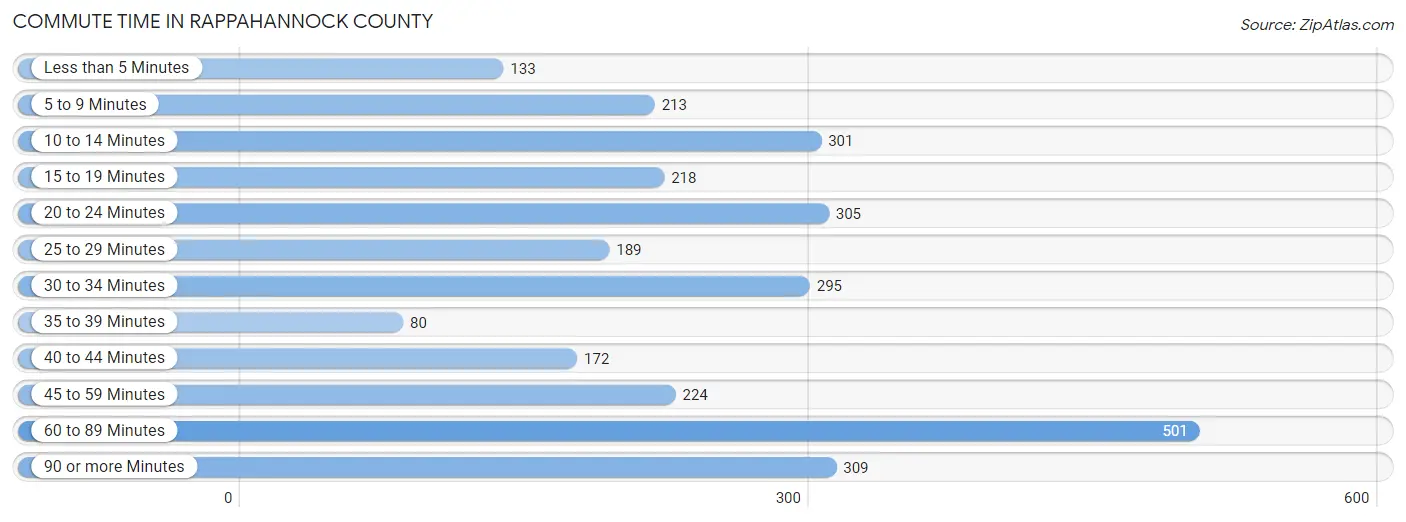
| Commute Time | # Commuters | % Commuters |
| Less than 5 Minutes | 133 | 4.5% |
| 5 to 9 Minutes | 213 | 7.2% |
| 10 to 14 Minutes | 301 | 10.2% |
| 15 to 19 Minutes | 218 | 7.4% |
| 20 to 24 Minutes | 305 | 10.4% |
| 25 to 29 Minutes | 189 | 6.4% |
| 30 to 34 Minutes | 295 | 10.0% |
| 35 to 39 Minutes | 80 | 2.7% |
| 40 to 44 Minutes | 172 | 5.9% |
| 45 to 59 Minutes | 224 | 7.6% |
| 60 to 89 Minutes | 501 | 17.0% |
| 90 or more Minutes | 309 | 10.5% |
Commute Time by Sex in Rappahannock County
The most common commute times in Rappahannock County are 30 to 34 minutes (228 commuters, 14.8%) for males and 60 to 89 minutes (289 commuters, 20.6%) for females.
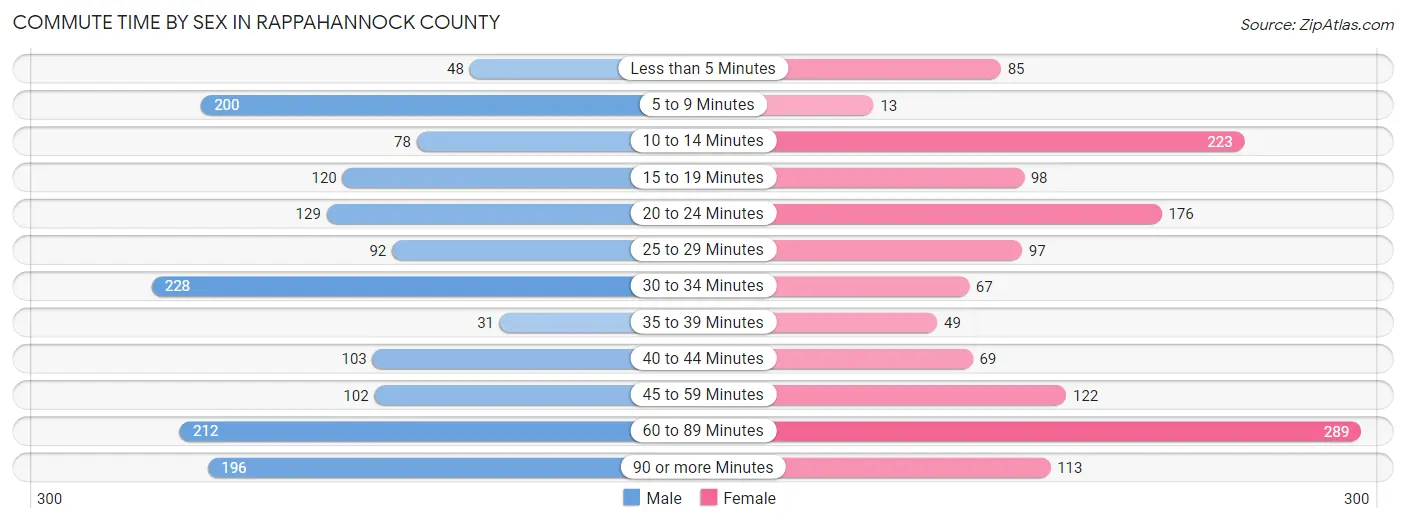
| Commute Time | Male | Female |
| Less than 5 Minutes | 48 (3.1%) | 85 (6.1%) |
| 5 to 9 Minutes | 200 (13.0%) | 13 (0.9%) |
| 10 to 14 Minutes | 78 (5.1%) | 223 (15.9%) |
| 15 to 19 Minutes | 120 (7.8%) | 98 (7.0%) |
| 20 to 24 Minutes | 129 (8.4%) | 176 (12.6%) |
| 25 to 29 Minutes | 92 (6.0%) | 97 (6.9%) |
| 30 to 34 Minutes | 228 (14.8%) | 67 (4.8%) |
| 35 to 39 Minutes | 31 (2.0%) | 49 (3.5%) |
| 40 to 44 Minutes | 103 (6.7%) | 69 (4.9%) |
| 45 to 59 Minutes | 102 (6.6%) | 122 (8.7%) |
| 60 to 89 Minutes | 212 (13.8%) | 289 (20.6%) |
| 90 or more Minutes | 196 (12.7%) | 113 (8.1%) |
Time of Departure to Work by Sex in Rappahannock County
The most frequent times of departure to work in Rappahannock County are 7:00 AM to 7:29 AM (252, 16.4%) for males and 7:00 AM to 7:29 AM (269, 19.2%) for females.
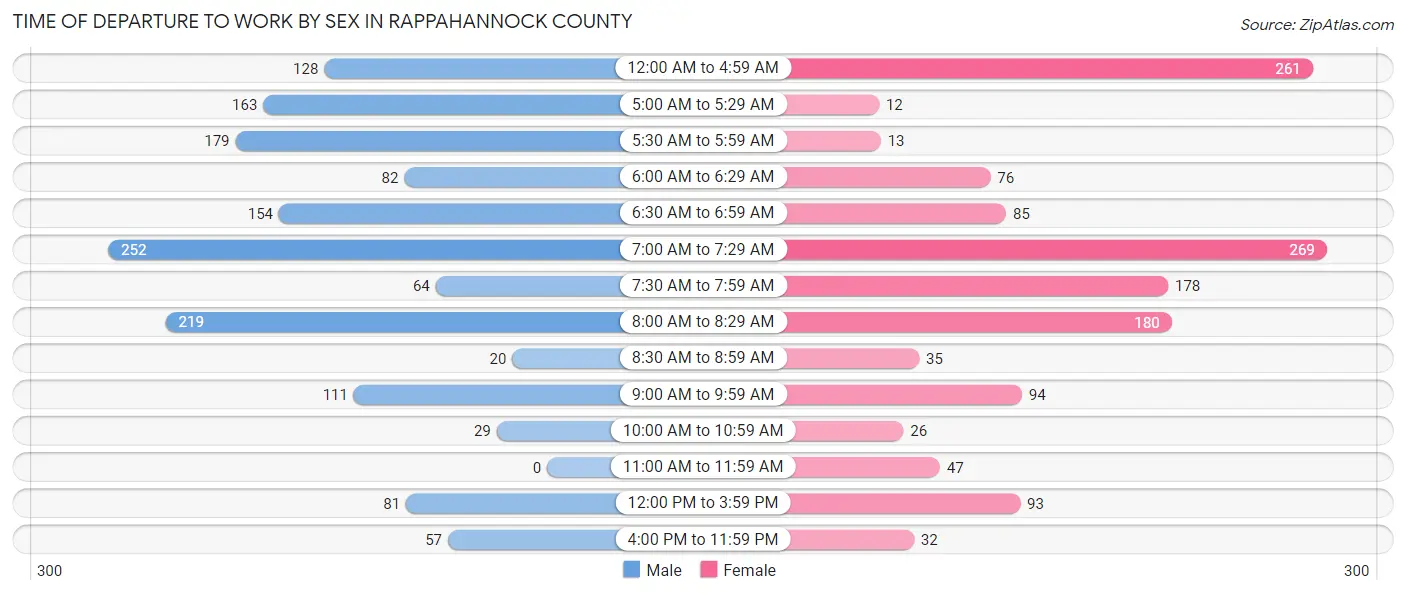
| Time of Departure | Male | Female |
| 12:00 AM to 4:59 AM | 128 (8.3%) | 261 (18.6%) |
| 5:00 AM to 5:29 AM | 163 (10.6%) | 12 (0.9%) |
| 5:30 AM to 5:59 AM | 179 (11.6%) | 13 (0.9%) |
| 6:00 AM to 6:29 AM | 82 (5.3%) | 76 (5.4%) |
| 6:30 AM to 6:59 AM | 154 (10.0%) | 85 (6.1%) |
| 7:00 AM to 7:29 AM | 252 (16.4%) | 269 (19.2%) |
| 7:30 AM to 7:59 AM | 64 (4.2%) | 178 (12.7%) |
| 8:00 AM to 8:29 AM | 219 (14.2%) | 180 (12.9%) |
| 8:30 AM to 8:59 AM | 20 (1.3%) | 35 (2.5%) |
| 9:00 AM to 9:59 AM | 111 (7.2%) | 94 (6.7%) |
| 10:00 AM to 10:59 AM | 29 (1.9%) | 26 (1.9%) |
| 11:00 AM to 11:59 AM | 0 (0.0%) | 47 (3.4%) |
| 12:00 PM to 3:59 PM | 81 (5.3%) | 93 (6.6%) |
| 4:00 PM to 11:59 PM | 57 (3.7%) | 32 (2.3%) |
| Total | 1,539 (100.0%) | 1,401 (100.0%) |
Housing Occupancy in Rappahannock County
Occupancy by Ownership in Rappahannock County
Of the total 2,823 dwellings in Rappahannock County, owner-occupied units account for 2,105 (74.6%), while renter-occupied units make up 718 (25.4%).
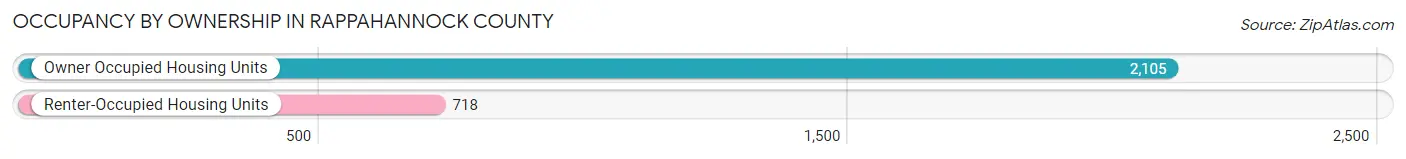
| Occupancy | # Housing Units | % Housing Units |
| Owner Occupied Housing Units | 2,105 | 74.6% |
| Renter-Occupied Housing Units | 718 | 25.4% |
| Total Occupied Housing Units | 2,823 | 100.0% |
Occupancy by Household Size in Rappahannock County
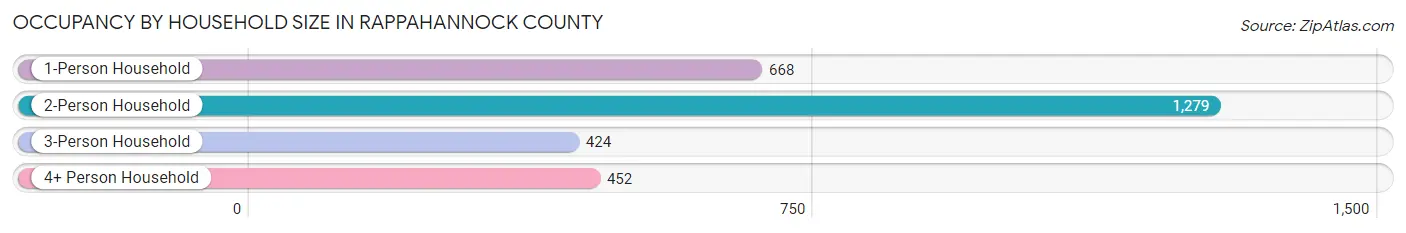
| Household Size | # Housing Units | % Housing Units |
| 1-Person Household | 668 | 23.7% |
| 2-Person Household | 1,279 | 45.3% |
| 3-Person Household | 424 | 15.0% |
| 4+ Person Household | 452 | 16.0% |
| Total Housing Units | 2,823 | 100.0% |
Occupancy by Ownership by Household Size in Rappahannock County
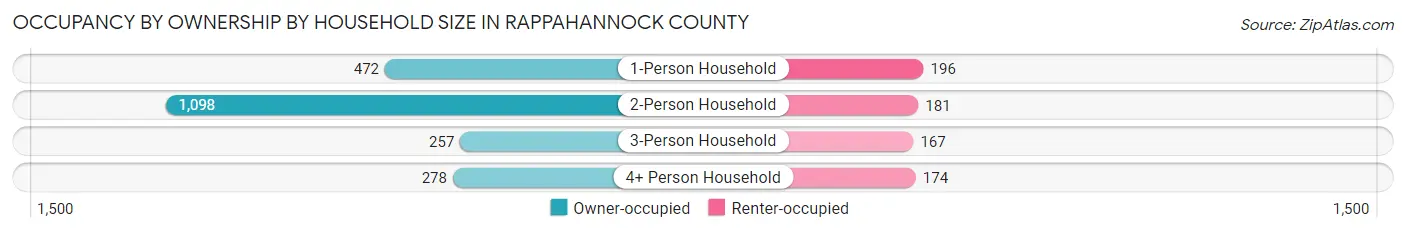
| Household Size | Owner-occupied | Renter-occupied |
| 1-Person Household | 472 (70.7%) | 196 (29.3%) |
| 2-Person Household | 1,098 (85.9%) | 181 (14.1%) |
| 3-Person Household | 257 (60.6%) | 167 (39.4%) |
| 4+ Person Household | 278 (61.5%) | 174 (38.5%) |
| Total Housing Units | 2,105 (74.6%) | 718 (25.4%) |
Occupancy by Educational Attainment in Rappahannock County
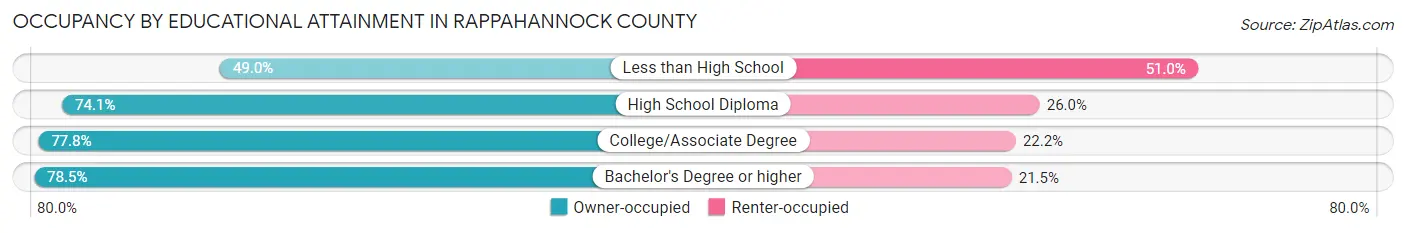
| Household Size | Owner-occupied | Renter-occupied |
| Less than High School | 124 (49.0%) | 129 (51.0%) |
| High School Diploma | 528 (74.1%) | 185 (26.0%) |
| College/Associate Degree | 530 (77.8%) | 151 (22.2%) |
| Bachelor's Degree or higher | 923 (78.5%) | 253 (21.5%) |
Occupancy by Age of Householder in Rappahannock County
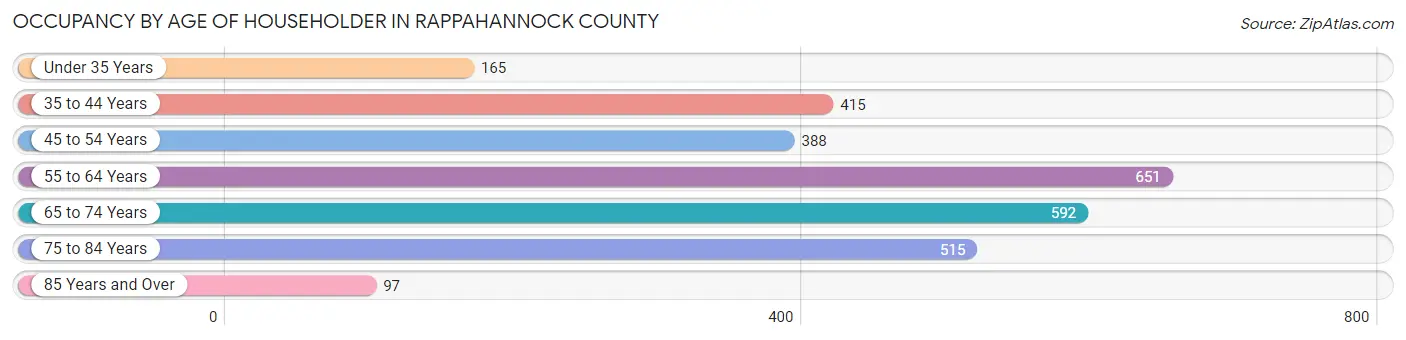
| Age Bracket | # Households | % Households |
| Under 35 Years | 165 | 5.8% |
| 35 to 44 Years | 415 | 14.7% |
| 45 to 54 Years | 388 | 13.7% |
| 55 to 64 Years | 651 | 23.1% |
| 65 to 74 Years | 592 | 21.0% |
| 75 to 84 Years | 515 | 18.2% |
| 85 Years and Over | 97 | 3.4% |
| Total | 2,823 | 100.0% |
Housing Finances in Rappahannock County
Median Income by Occupancy in Rappahannock County
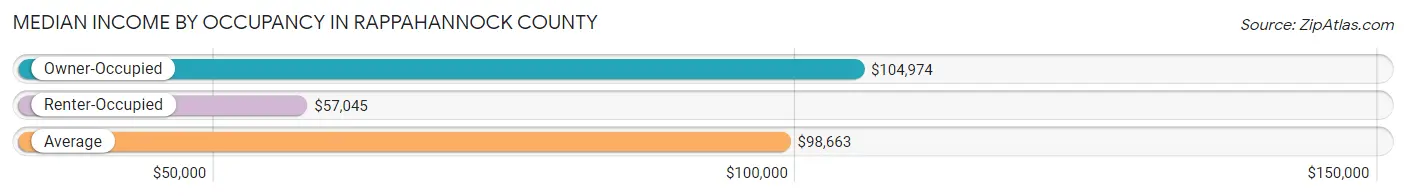
| Occupancy Type | # Households | Median Income |
| Owner-Occupied | 2,105 (74.6%) | $104,974 |
| Renter-Occupied | 718 (25.4%) | $57,045 |
| Average | 2,823 (100.0%) | $98,663 |
Occupancy by Householder Income Bracket in Rappahannock County
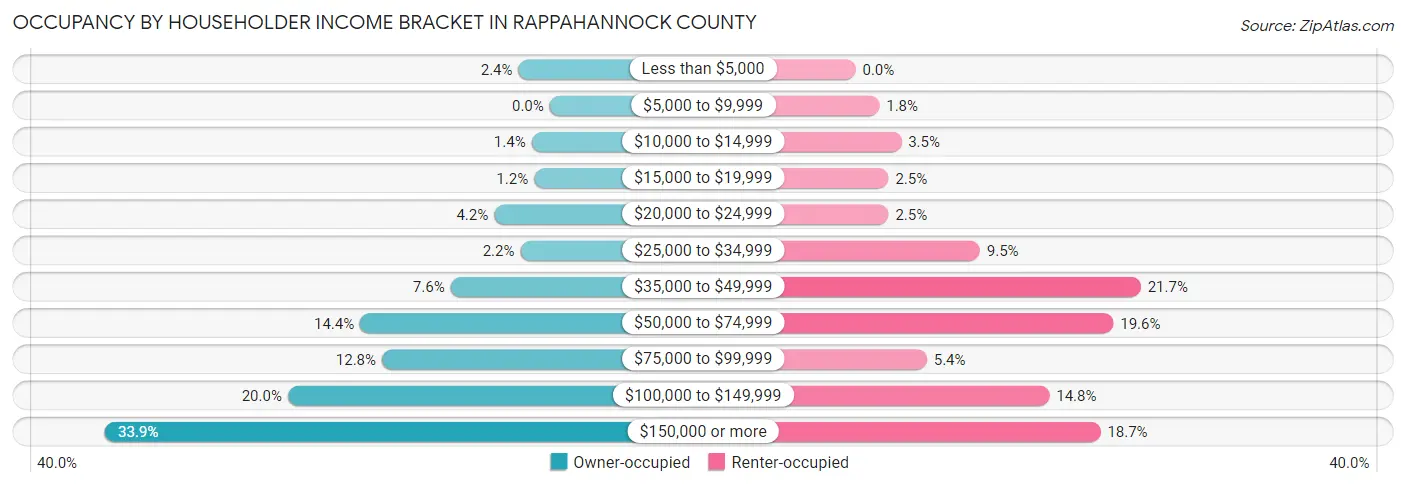
| Income Bracket | Owner-occupied | Renter-occupied |
| Less than $5,000 | 50 (2.4%) | 0 (0.0%) |
| $5,000 to $9,999 | 0 (0.0%) | 13 (1.8%) |
| $10,000 to $14,999 | 29 (1.4%) | 25 (3.5%) |
| $15,000 to $19,999 | 25 (1.2%) | 18 (2.5%) |
| $20,000 to $24,999 | 89 (4.2%) | 18 (2.5%) |
| $25,000 to $34,999 | 47 (2.2%) | 68 (9.5%) |
| $35,000 to $49,999 | 159 (7.5%) | 156 (21.7%) |
| $50,000 to $74,999 | 304 (14.4%) | 141 (19.6%) |
| $75,000 to $99,999 | 269 (12.8%) | 39 (5.4%) |
| $100,000 to $149,999 | 420 (20.0%) | 106 (14.8%) |
| $150,000 or more | 713 (33.9%) | 134 (18.7%) |
| Total | 2,105 (100.0%) | 718 (100.0%) |
Monthly Housing Cost Tiers in Rappahannock County
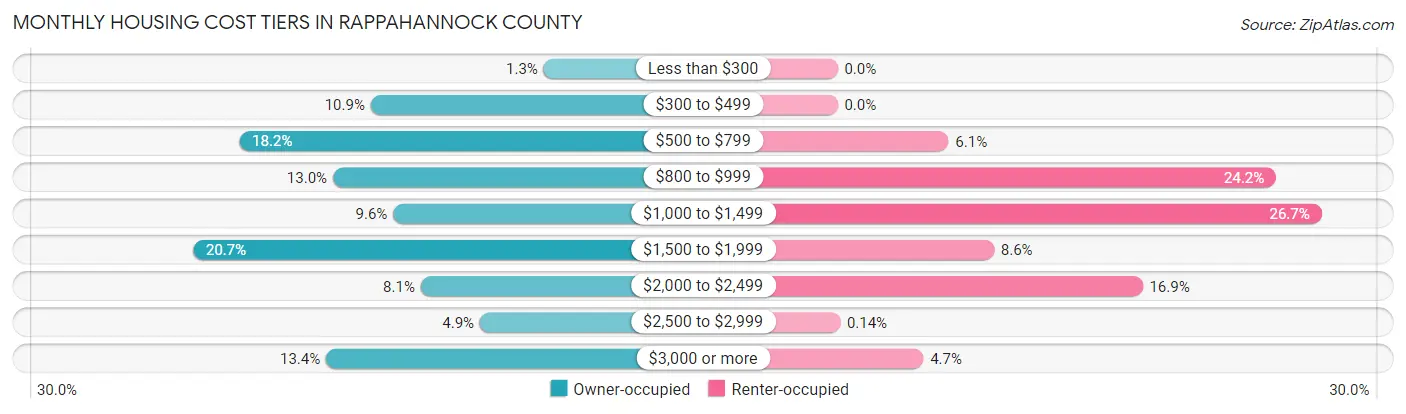
| Monthly Cost | Owner-occupied | Renter-occupied |
| Less than $300 | 28 (1.3%) | 0 (0.0%) |
| $300 to $499 | 229 (10.9%) | 0 (0.0%) |
| $500 to $799 | 382 (18.1%) | 44 (6.1%) |
| $800 to $999 | 273 (13.0%) | 174 (24.2%) |
| $1,000 to $1,499 | 203 (9.6%) | 192 (26.7%) |
| $1,500 to $1,999 | 436 (20.7%) | 62 (8.6%) |
| $2,000 to $2,499 | 171 (8.1%) | 121 (16.9%) |
| $2,500 to $2,999 | 102 (4.9%) | 1 (0.1%) |
| $3,000 or more | 281 (13.4%) | 34 (4.7%) |
| Total | 2,105 (100.0%) | 718 (100.0%) |
Physical Housing Characteristics in Rappahannock County
Housing Structures in Rappahannock County
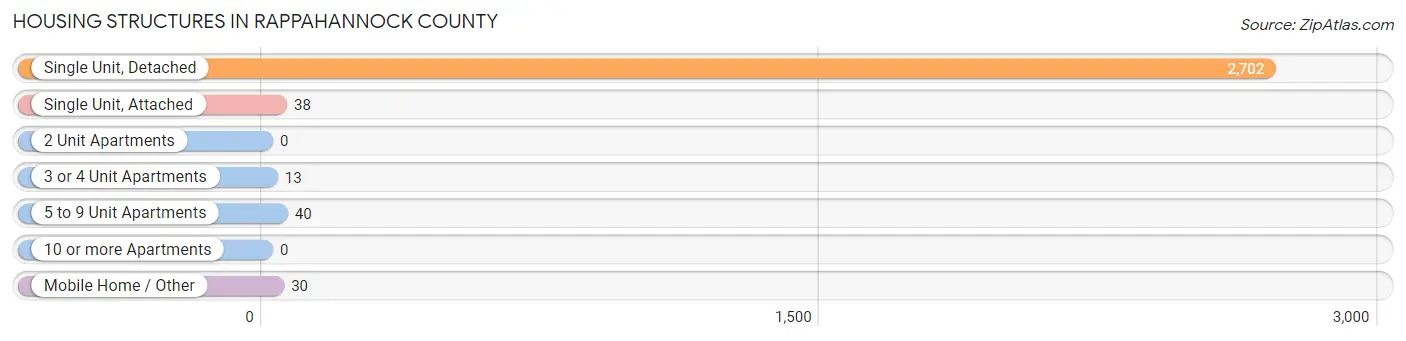
| Structure Type | # Housing Units | % Housing Units |
| Single Unit, Detached | 2,702 | 95.7% |
| Single Unit, Attached | 38 | 1.3% |
| 2 Unit Apartments | 0 | 0.0% |
| 3 or 4 Unit Apartments | 13 | 0.5% |
| 5 to 9 Unit Apartments | 40 | 1.4% |
| 10 or more Apartments | 0 | 0.0% |
| Mobile Home / Other | 30 | 1.1% |
| Total | 2,823 | 100.0% |
Housing Structures by Occupancy in Rappahannock County
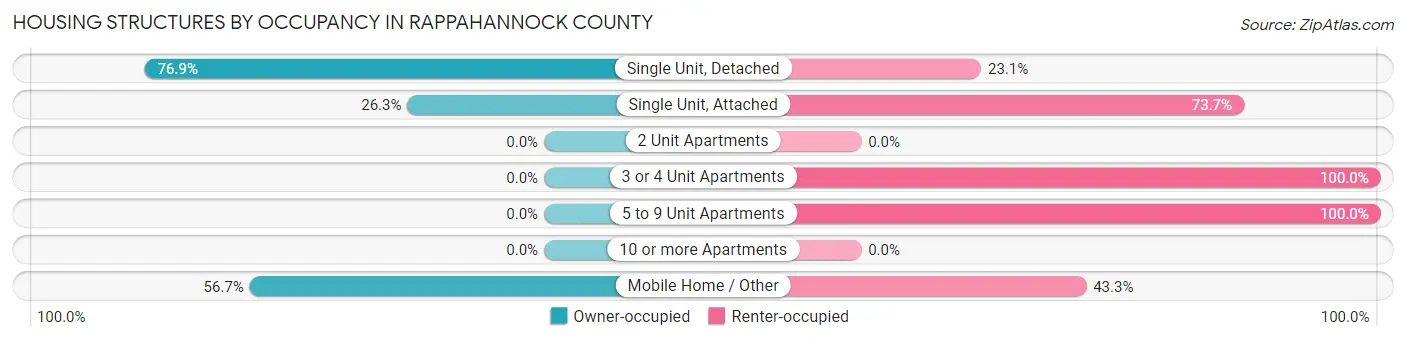
| Structure Type | Owner-occupied | Renter-occupied |
| Single Unit, Detached | 2,078 (76.9%) | 624 (23.1%) |
| Single Unit, Attached | 10 (26.3%) | 28 (73.7%) |
| 2 Unit Apartments | 0 (0.0%) | 0 (0.0%) |
| 3 or 4 Unit Apartments | 0 (0.0%) | 13 (100.0%) |
| 5 to 9 Unit Apartments | 0 (0.0%) | 40 (100.0%) |
| 10 or more Apartments | 0 (0.0%) | 0 (0.0%) |
| Mobile Home / Other | 17 (56.7%) | 13 (43.3%) |
| Total | 2,105 (74.6%) | 718 (25.4%) |
Housing Structures by Number of Rooms in Rappahannock County
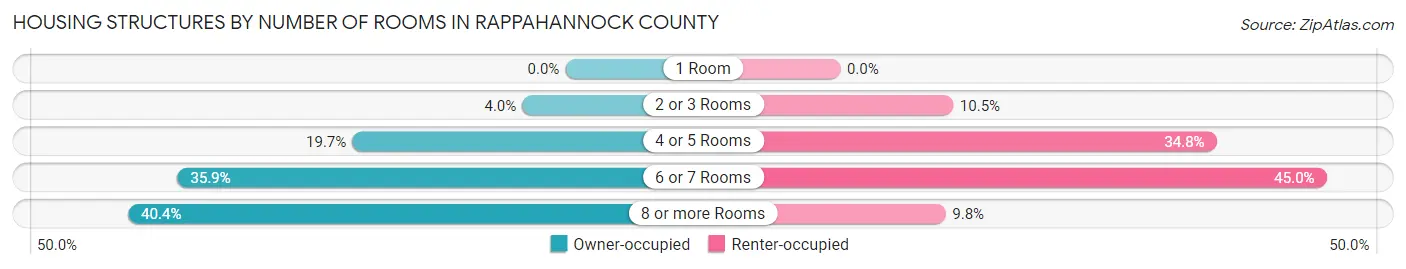
| Number of Rooms | Owner-occupied | Renter-occupied |
| 1 Room | 0 (0.0%) | 0 (0.0%) |
| 2 or 3 Rooms | 84 (4.0%) | 75 (10.4%) |
| 4 or 5 Rooms | 415 (19.7%) | 250 (34.8%) |
| 6 or 7 Rooms | 755 (35.9%) | 323 (45.0%) |
| 8 or more Rooms | 851 (40.4%) | 70 (9.8%) |
| Total | 2,105 (100.0%) | 718 (100.0%) |
Housing Structure by Heating Type in Rappahannock County
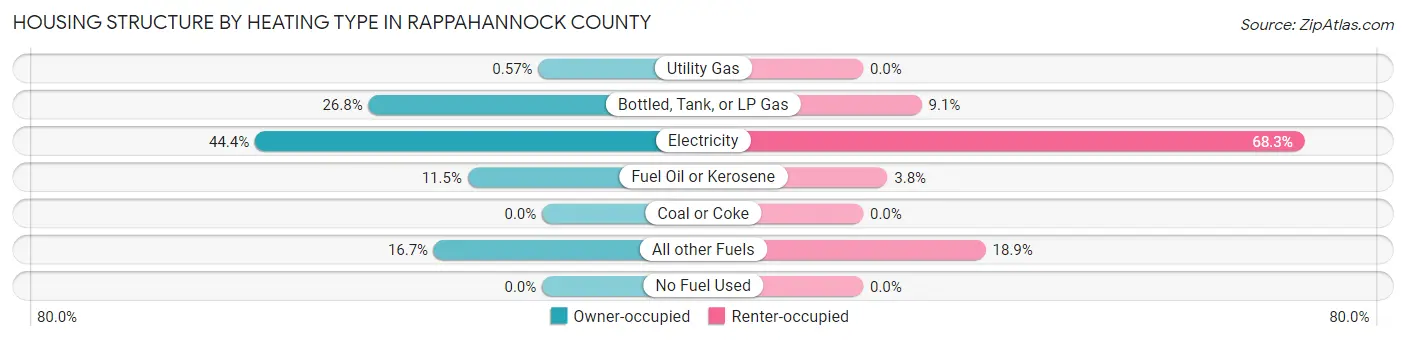
| Heating Type | Owner-occupied | Renter-occupied |
| Utility Gas | 12 (0.6%) | 0 (0.0%) |
| Bottled, Tank, or LP Gas | 565 (26.8%) | 65 (9.0%) |
| Electricity | 934 (44.4%) | 490 (68.2%) |
| Fuel Oil or Kerosene | 242 (11.5%) | 27 (3.8%) |
| Coal or Coke | 0 (0.0%) | 0 (0.0%) |
| All other Fuels | 352 (16.7%) | 136 (18.9%) |
| No Fuel Used | 0 (0.0%) | 0 (0.0%) |
| Total | 2,105 (100.0%) | 718 (100.0%) |
Household Vehicle Usage in Rappahannock County
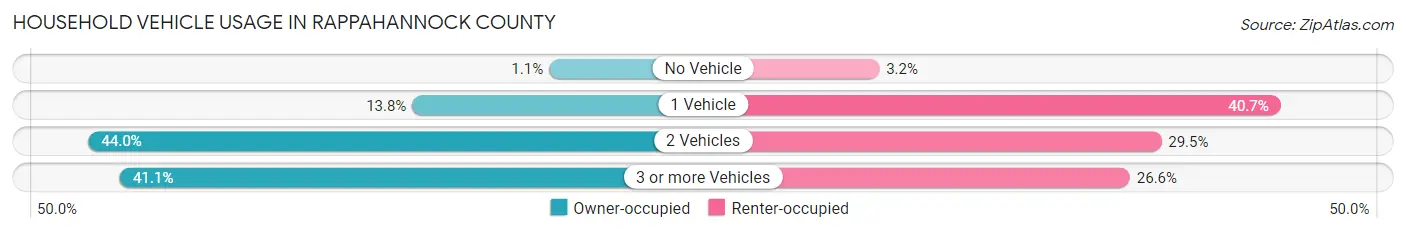
| Vehicles per Household | Owner-occupied | Renter-occupied |
| No Vehicle | 22 (1.1%) | 23 (3.2%) |
| 1 Vehicle | 291 (13.8%) | 292 (40.7%) |
| 2 Vehicles | 927 (44.0%) | 212 (29.5%) |
| 3 or more Vehicles | 865 (41.1%) | 191 (26.6%) |
| Total | 2,105 (100.0%) | 718 (100.0%) |
Real Estate & Mortgages in Rappahannock County
Real Estate and Mortgage Overview in Rappahannock County
| Characteristic | Without Mortgage | With Mortgage |
| Housing Units | 1,035 | 1,070 |
| Median Property Value | $570,900 | $481,900 |
| Median Household Income | $92,868 | $393 |
| Monthly Housing Costs | $655 | $281 |
| Real Estate Taxes | $2,836 | $17 |
Property Value by Mortgage Status in Rappahannock County
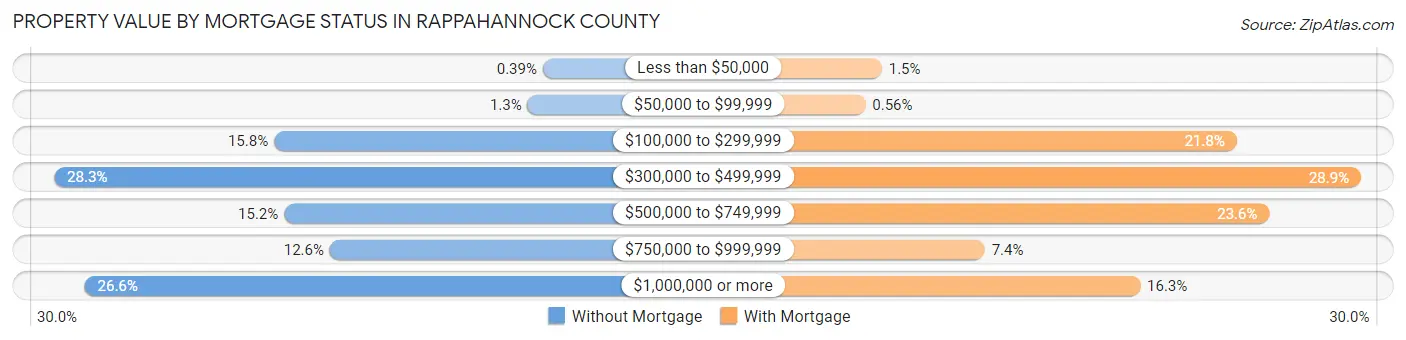
| Property Value | Without Mortgage | With Mortgage |
| Less than $50,000 | 4 (0.4%) | 16 (1.5%) |
| $50,000 to $99,999 | 13 (1.3%) | 6 (0.6%) |
| $100,000 to $299,999 | 163 (15.8%) | 233 (21.8%) |
| $300,000 to $499,999 | 293 (28.3%) | 309 (28.9%) |
| $500,000 to $749,999 | 157 (15.2%) | 253 (23.6%) |
| $750,000 to $999,999 | 130 (12.6%) | 79 (7.4%) |
| $1,000,000 or more | 275 (26.6%) | 174 (16.3%) |
| Total | 1,035 (100.0%) | 1,070 (100.0%) |
Household Income by Mortgage Status in Rappahannock County
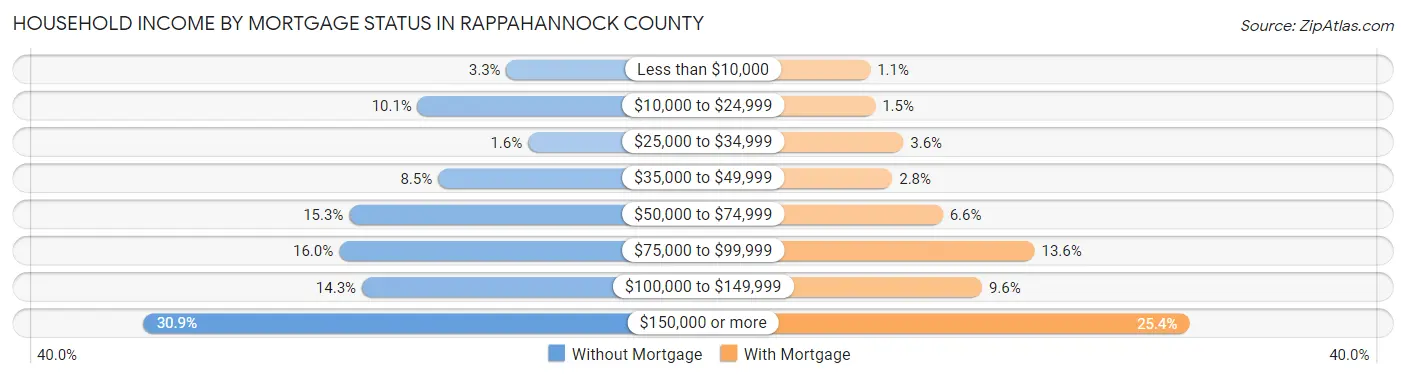
| Household Income | Without Mortgage | With Mortgage |
| Less than $10,000 | 34 (3.3%) | 12 (1.1%) |
| $10,000 to $24,999 | 104 (10.1%) | 16 (1.5%) |
| $25,000 to $34,999 | 17 (1.6%) | 39 (3.6%) |
| $35,000 to $49,999 | 88 (8.5%) | 30 (2.8%) |
| $50,000 to $74,999 | 158 (15.3%) | 71 (6.6%) |
| $75,000 to $99,999 | 166 (16.0%) | 146 (13.6%) |
| $100,000 to $149,999 | 148 (14.3%) | 103 (9.6%) |
| $150,000 or more | 320 (30.9%) | 272 (25.4%) |
| Total | 1,035 (100.0%) | 1,070 (100.0%) |
Property Value to Household Income Ratio in Rappahannock County
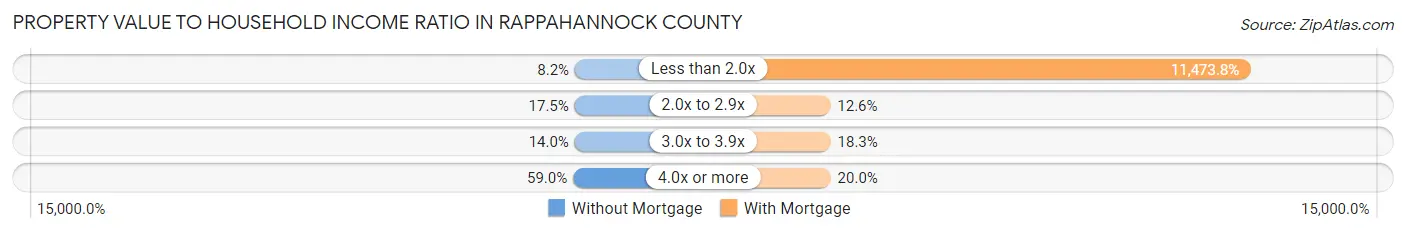
| Value-to-Income Ratio | Without Mortgage | With Mortgage |
| Less than 2.0x | 85 (8.2%) | 122,770 (11,473.8%) |
| 2.0x to 2.9x | 181 (17.5%) | 135 (12.6%) |
| 3.0x to 3.9x | 145 (14.0%) | 196 (18.3%) |
| 4.0x or more | 611 (59.0%) | 214 (20.0%) |
| Total | 1,035 (100.0%) | 1,070 (100.0%) |
Real Estate Taxes by Mortgage Status in Rappahannock County
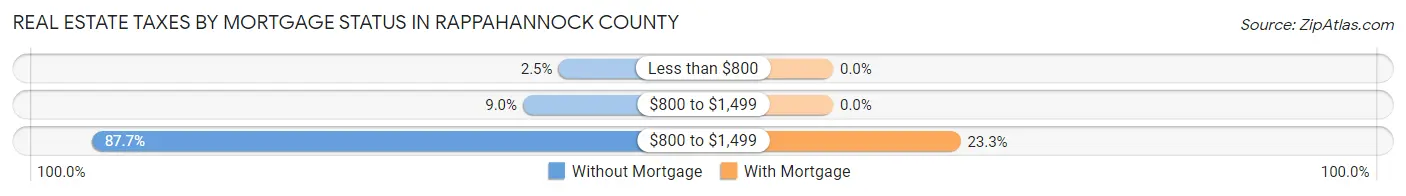
| Property Taxes | Without Mortgage | With Mortgage |
| Less than $800 | 26 (2.5%) | 0 (0.0%) |
| $800 to $1,499 | 93 (9.0%) | 0 (0.0%) |
| $800 to $1,499 | 908 (87.7%) | 249 (23.3%) |
| Total | 1,035 (100.0%) | 1,070 (100.0%) |
Health & Disability in Rappahannock County
Health Insurance Coverage by Age in Rappahannock County
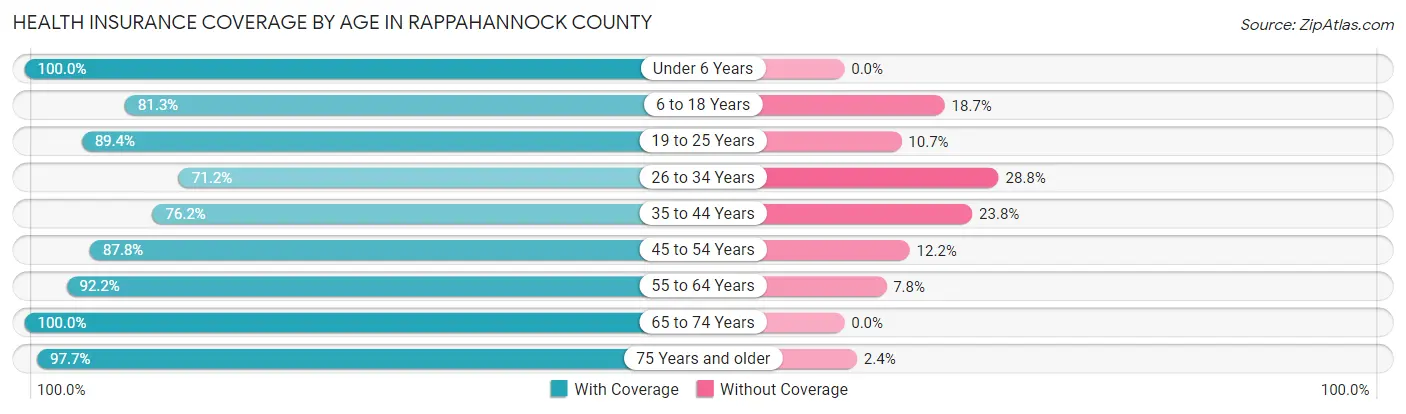
| Age Bracket | With Coverage | Without Coverage |
| Under 6 Years | 419 (100.0%) | 0 (0.0%) |
| 6 to 18 Years | 795 (81.3%) | 183 (18.7%) |
| 19 to 25 Years | 520 (89.3%) | 62 (10.6%) |
| 26 to 34 Years | 391 (71.2%) | 158 (28.8%) |
| 35 to 44 Years | 626 (76.2%) | 196 (23.8%) |
| 45 to 54 Years | 735 (87.8%) | 102 (12.2%) |
| 55 to 64 Years | 1,168 (92.2%) | 99 (7.8%) |
| 65 to 74 Years | 1,114 (100.0%) | 0 (0.0%) |
| 75 Years and older | 831 (97.7%) | 20 (2.4%) |
| Total | 6,599 (88.9%) | 820 (11.1%) |
Health Insurance Coverage by Citizenship Status in Rappahannock County
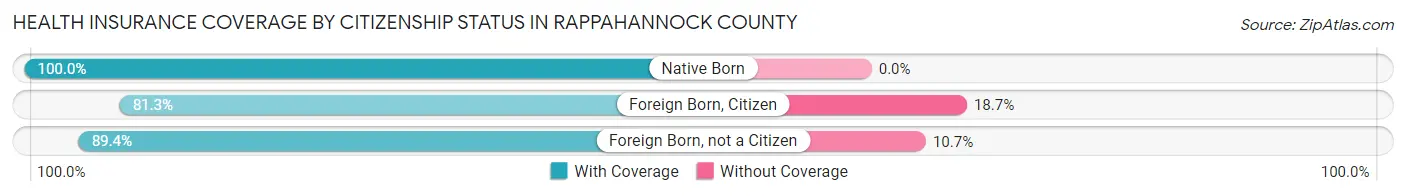
| Citizenship Status | With Coverage | Without Coverage |
| Native Born | 419 (100.0%) | 0 (0.0%) |
| Foreign Born, Citizen | 795 (81.3%) | 183 (18.7%) |
| Foreign Born, not a Citizen | 520 (89.3%) | 62 (10.6%) |
Health Insurance Coverage by Household Income in Rappahannock County
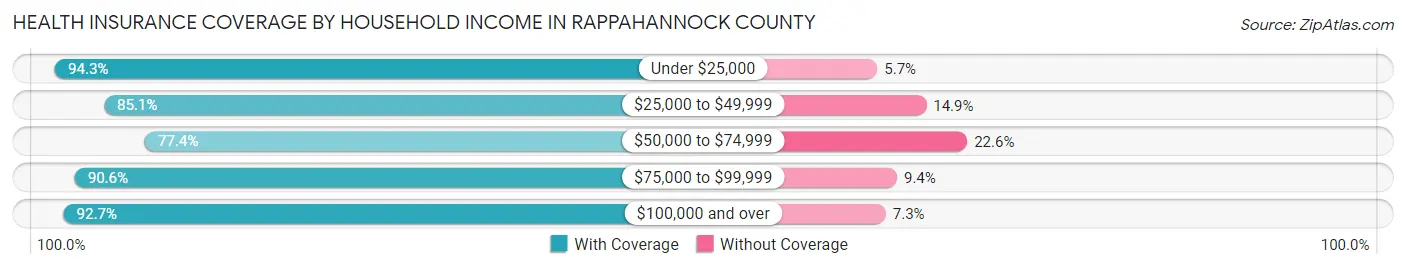
| Household Income | With Coverage | Without Coverage |
| Under $25,000 | 510 (94.3%) | 31 (5.7%) |
| $25,000 to $49,999 | 708 (85.1%) | 124 (14.9%) |
| $50,000 to $74,999 | 1,036 (77.4%) | 302 (22.6%) |
| $75,000 to $99,999 | 597 (90.6%) | 62 (9.4%) |
| $100,000 and over | 3,747 (92.7%) | 296 (7.3%) |
Public vs Private Health Insurance Coverage by Age in Rappahannock County
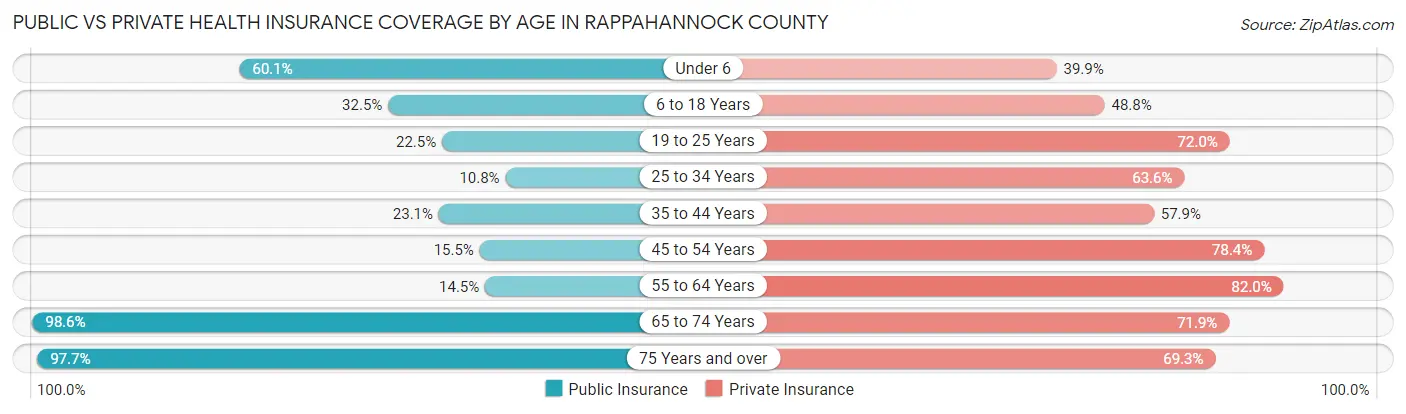
| Age Bracket | Public Insurance | Private Insurance |
| Under 6 | 252 (60.1%) | 167 (39.9%) |
| 6 to 18 Years | 318 (32.5%) | 477 (48.8%) |
| 19 to 25 Years | 131 (22.5%) | 419 (72.0%) |
| 25 to 34 Years | 59 (10.7%) | 349 (63.6%) |
| 35 to 44 Years | 190 (23.1%) | 476 (57.9%) |
| 45 to 54 Years | 130 (15.5%) | 656 (78.4%) |
| 55 to 64 Years | 184 (14.5%) | 1,039 (82.0%) |
| 65 to 74 Years | 1,098 (98.6%) | 801 (71.9%) |
| 75 Years and over | 831 (97.7%) | 590 (69.3%) |
| Total | 3,193 (43.0%) | 4,974 (67.0%) |
Disability Status by Sex by Age in Rappahannock County
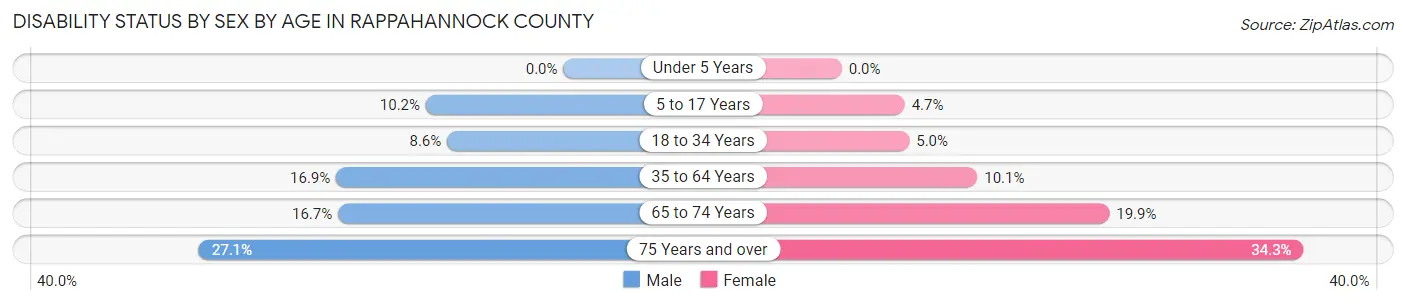
| Age Bracket | Male | Female |
| Under 5 Years | 0 (0.0%) | 0 (0.0%) |
| 5 to 17 Years | 58 (10.2%) | 22 (4.7%) |
| 18 to 34 Years | 53 (8.6%) | 29 (5.0%) |
| 35 to 64 Years | 237 (16.9%) | 153 (10.1%) |
| 65 to 74 Years | 92 (16.7%) | 112 (19.9%) |
| 75 Years and over | 115 (27.1%) | 146 (34.3%) |
Disability Class by Sex by Age in Rappahannock County
Disability Class: Hearing Difficulty
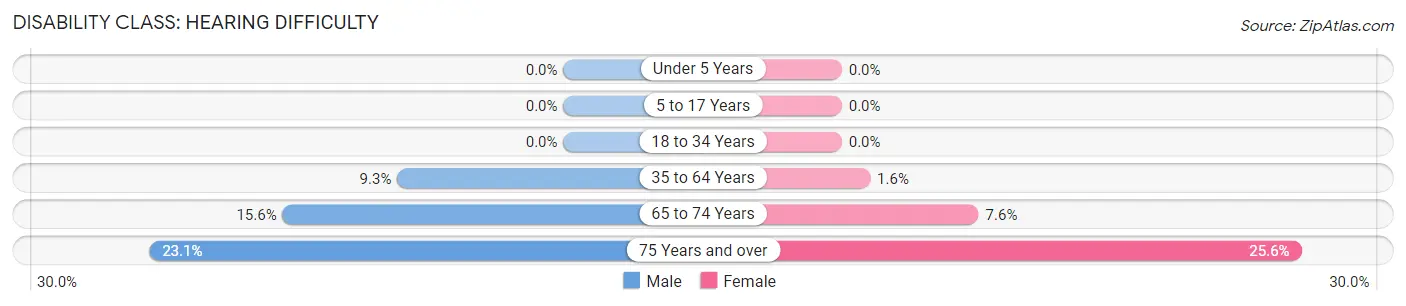
| Age Bracket | Male | Female |
| Under 5 Years | 0 (0.0%) | 0 (0.0%) |
| 5 to 17 Years | 0 (0.0%) | 0 (0.0%) |
| 18 to 34 Years | 0 (0.0%) | 0 (0.0%) |
| 35 to 64 Years | 130 (9.2%) | 24 (1.6%) |
| 65 to 74 Years | 86 (15.6%) | 43 (7.6%) |
| 75 Years and over | 98 (23.1%) | 109 (25.6%) |
Disability Class: Vision Difficulty
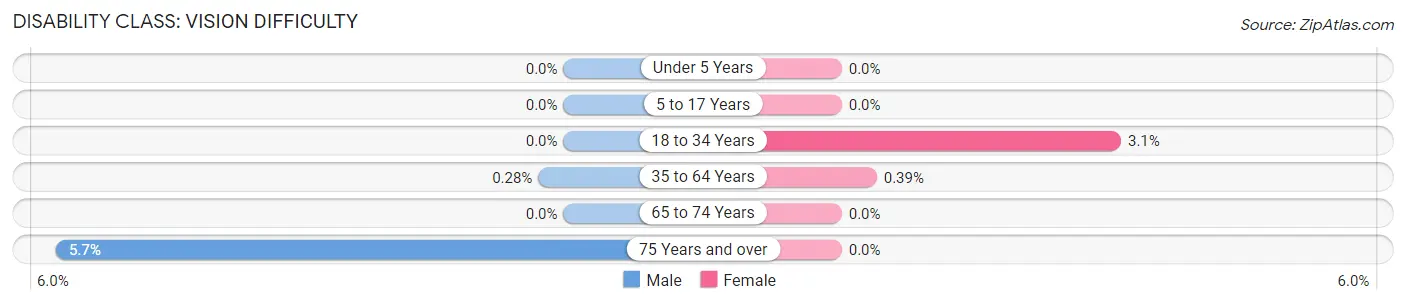
| Age Bracket | Male | Female |
| Under 5 Years | 0 (0.0%) | 0 (0.0%) |
| 5 to 17 Years | 0 (0.0%) | 0 (0.0%) |
| 18 to 34 Years | 0 (0.0%) | 18 (3.1%) |
| 35 to 64 Years | 4 (0.3%) | 6 (0.4%) |
| 65 to 74 Years | 0 (0.0%) | 0 (0.0%) |
| 75 Years and over | 24 (5.7%) | 0 (0.0%) |
Disability Class: Cognitive Difficulty
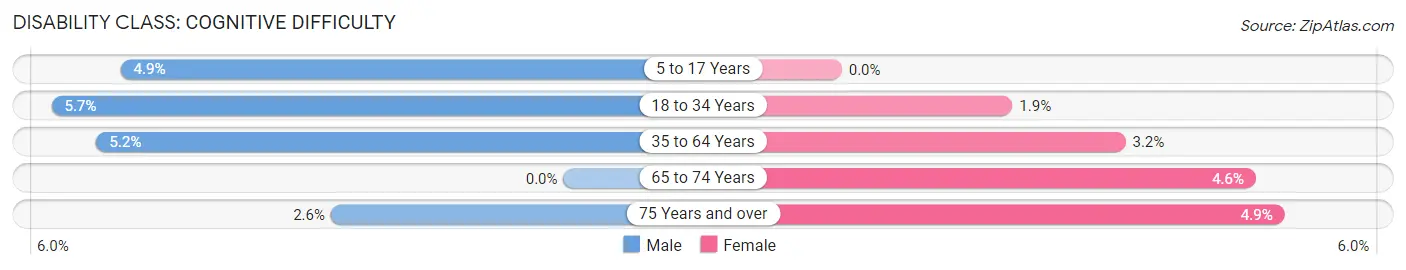
| Age Bracket | Male | Female |
| 5 to 17 Years | 28 (4.9%) | 0 (0.0%) |
| 18 to 34 Years | 35 (5.7%) | 11 (1.9%) |
| 35 to 64 Years | 73 (5.2%) | 48 (3.2%) |
| 65 to 74 Years | 0 (0.0%) | 26 (4.6%) |
| 75 Years and over | 11 (2.6%) | 21 (4.9%) |
Disability Class: Ambulatory Difficulty
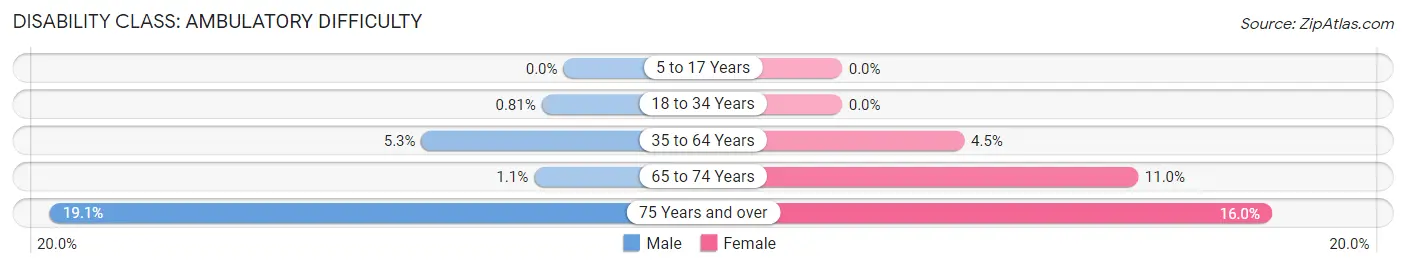
| Age Bracket | Male | Female |
| 5 to 17 Years | 0 (0.0%) | 0 (0.0%) |
| 18 to 34 Years | 5 (0.8%) | 0 (0.0%) |
| 35 to 64 Years | 74 (5.3%) | 69 (4.5%) |
| 65 to 74 Years | 6 (1.1%) | 62 (11.0%) |
| 75 Years and over | 81 (19.1%) | 68 (16.0%) |
Disability Class: Self-Care Difficulty
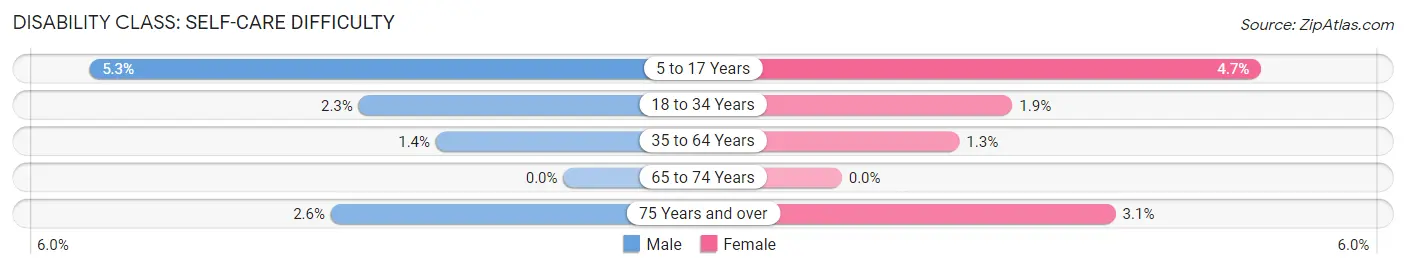
| Age Bracket | Male | Female |
| 5 to 17 Years | 30 (5.3%) | 22 (4.7%) |
| 18 to 34 Years | 14 (2.3%) | 11 (1.9%) |
| 35 to 64 Years | 20 (1.4%) | 20 (1.3%) |
| 65 to 74 Years | 0 (0.0%) | 0 (0.0%) |
| 75 Years and over | 11 (2.6%) | 13 (3.0%) |
Technology Access in Rappahannock County
Computing Device Access in Rappahannock County
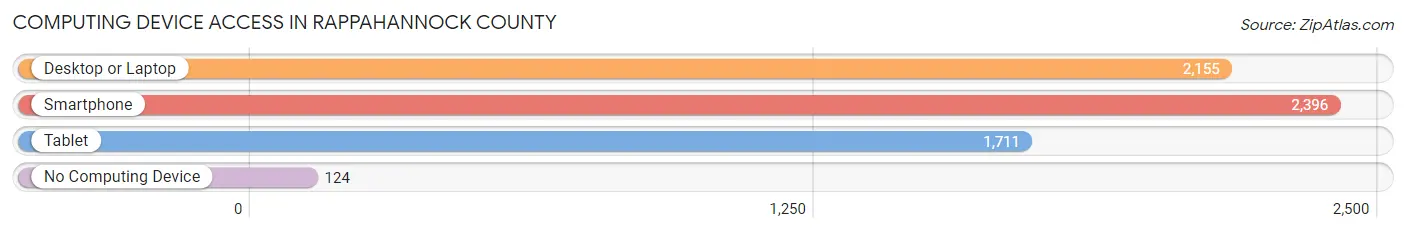
| Device Type | # Households | % Households |
| Desktop or Laptop | 2,155 | 76.3% |
| Smartphone | 2,396 | 84.9% |
| Tablet | 1,711 | 60.6% |
| No Computing Device | 124 | 4.4% |
| Total | 2,823 | 100.0% |
Internet Access in Rappahannock County
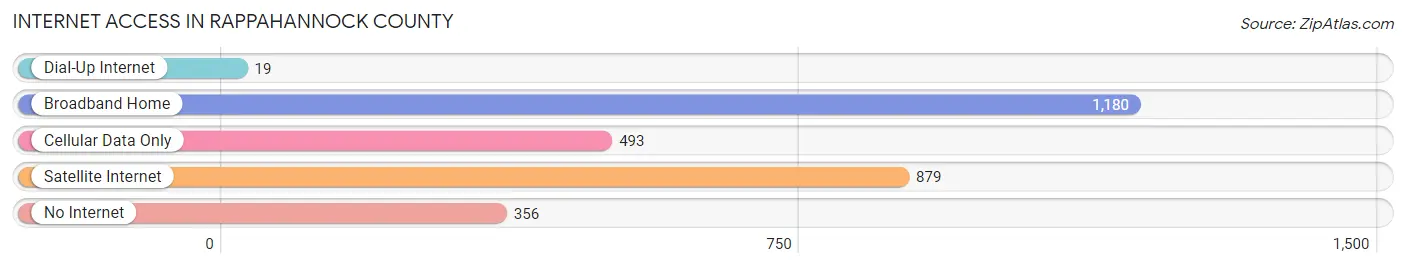
| Internet Type | # Households | % Households |
| Dial-Up Internet | 19 | 0.7% |
| Broadband Home | 1,180 | 41.8% |
| Cellular Data Only | 493 | 17.5% |
| Satellite Internet | 879 | 31.1% |
| No Internet | 356 | 12.6% |
| Total | 2,823 | 100.0% |
Rappahannock County Summary
Rappahannock County is a county located in the Commonwealth of Virginia. It is located in the northern part of the state, and is part of the Shenandoah Valley region. The county seat is the town of Washington. The county was established in 1833 and named for the Rappahannock River, which forms its northern border. As of the 2010 census, the population was 7,373.
History
Rappahannock County was formed in 1833 from Culpeper County. It was named for the Rappahannock River, which forms its northern border. The county was part of the Shenandoah Valley region, and was home to many Native American tribes, including the Monacan, Manahoac, and Iroquois.
The county was home to several prominent families, including the Washington family, who owned a large plantation in the county. George Washington's brother, Charles, was born in the county in 1738.
During the Civil War, the county was the site of several battles, including the Battle of Cedar Mountain and the Battle of Rappahannock Station.
Geography
Rappahannock County is located in the northern part of the Commonwealth of Virginia. It is bordered by Culpeper County to the south, Fauquier County to the west, and the Rappahannock River to the north. The county is part of the Shenandoah Valley region, and is located in the foothills of the Blue Ridge Mountains.
The county has a total area of 276 square miles, of which 274 square miles is land and 2 square miles is water. The county is home to several rivers and streams, including the Rappahannock River, the Hazel River, and the Thornton River.
Economy
Rappahannock County is primarily a rural county, and its economy is largely based on agriculture. The county is home to several wineries, and is known for its production of apples, peaches, and other fruits.
The county is also home to several small businesses, including restaurants, antique stores, and art galleries. The county is home to several historic sites, including the Rappahannock County Courthouse, which was built in 1833.
Demographics
As of the 2010 census, the population of Rappahannock County was 7,373. The racial makeup of the county was 92.3% White, 4.3% Black or African American, 0.3% Native American, 0.5% Asian, 0.1% Pacific Islander, 1.2% from other races, and 1.3% from two or more races. Hispanic or Latino of any race were 3.2% of the population.
The median income for a household in the county was $50,945, and the median income for a family was $60,917. The per capita income for the county was $25,945. About 8.7% of families and 11.2% of the population were below the poverty line, including 15.2% of those under age 18 and 8.2% of those age 65 or over.
Common Questions
What is Per Capita Income in Rappahannock County?
Per Capita income in Rappahannock County is $54,654.
What is the Median Family Income in Rappahannock County?
Median Family Income in Rappahannock County is $101,797.
What is the Median Household income in Rappahannock County?
Median Household Income in Rappahannock County is $98,663.
What is Income or Wage Gap in Rappahannock County?
Income or Wage Gap in Rappahannock County is 2.4%.
Women in Rappahannock County earn 97.6 cents for every dollar earned by a man.
What is Inequality or Gini Index in Rappahannock County?
Inequality or Gini Index in Rappahannock County is 0.48.
What is the Total Population of Rappahannock County?
Total Population of Rappahannock County is 7,422.
What is the Total Male Population of Rappahannock County?
Total Male Population of Rappahannock County is 3,746.
What is the Total Female Population of Rappahannock County?
Total Female Population of Rappahannock County is 3,676.
What is the Ratio of Males per 100 Females in Rappahannock County?
There are 101.90 Males per 100 Females in Rappahannock County.
What is the Ratio of Females per 100 Males in Rappahannock County?
There are 98.13 Females per 100 Males in Rappahannock County.
What is the Median Population Age in Rappahannock County?
Median Population Age in Rappahannock County is 50.0 Years.
What is the Average Family Size in Rappahannock County
Average Family Size in Rappahannock County is 3.0 People.
What is the Average Household Size in Rappahannock County
Average Household Size in Rappahannock County is 2.6 People.
How Large is the Labor Force in Rappahannock County?
There are 3,821 People in the Labor Forcein in Rappahannock County.
What is the Percentage of People in the Labor Force in Rappahannock County?
61.6% of People are in the Labor Force in Rappahannock County.
What is the Unemployment Rate in Rappahannock County?
Unemployment Rate in Rappahannock County is 6.5%.