Radford city, VA Map & Demographics
Radford city Map
Radford city Overview
$24,835
PER CAPITA INCOME
$88,125
AVG FAMILY INCOME
$51,039
AVG HOUSEHOLD INCOME
55.3%
WAGE / INCOME GAP [ % ]
44.7¢/ $1
WAGE / INCOME GAP [ $ ]
0.52
INEQUALITY / GINI INDEX
16,379
TOTAL POPULATION
7,411
MALE POPULATION
8,968
FEMALE POPULATION
82.64
MALES / 100 FEMALES
121.01
FEMALES / 100 MALES
23.3
MEDIAN AGE
3.1
AVG FAMILY SIZE
2.4
AVG HOUSEHOLD SIZE
8,615
LABOR FORCE [ PEOPLE ]
58.9%
PERCENT IN LABOR FORCE
7.2%
UNEMPLOYMENT RATE
Radford city Area Codes
Income in Radford city
Income Overview in Radford city
Per Capita Income in Radford city is $24,835, while median incomes of families and households are $88,125 and $51,039 respectively.
| Characteristic | Number | Measure |
| Per Capita Income | 16,379 | $24,835 |
| Median Family Income | 2,576 | $88,125 |
| Mean Family Income | 2,576 | $103,538 |
| Median Household Income | 5,467 | $51,039 |
| Mean Household Income | 5,467 | $69,105 |
| Income Deficit | 2,576 | $0 |
| Wage / Income Gap (%) | 16,379 | 55.28% |
| Wage / Income Gap ($) | 16,379 | 44.72¢ per $1 |
| Gini / Inequality Index | 16,379 | 0.52 |
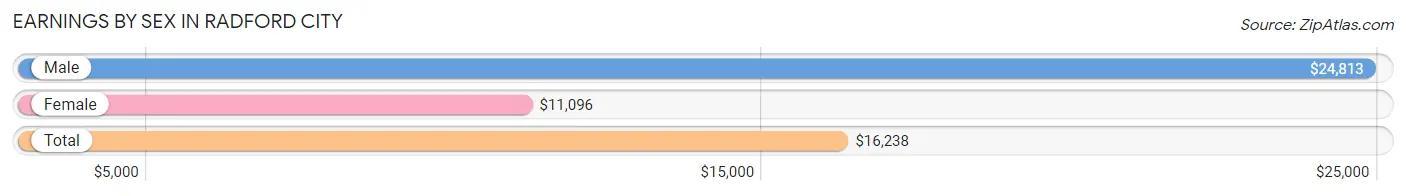
Earnings by Sex in Radford city
Average Earnings in Radford city are $16,238, $24,813 for men and $11,096 for women, a difference of 55.3%.
| Sex | Number | Average Earnings |
| Male | 4,573 (46.0%) | $24,813 |
| Female | 5,376 (54.0%) | $11,096 |
| Total | 9,949 (100.0%) | $16,238 |
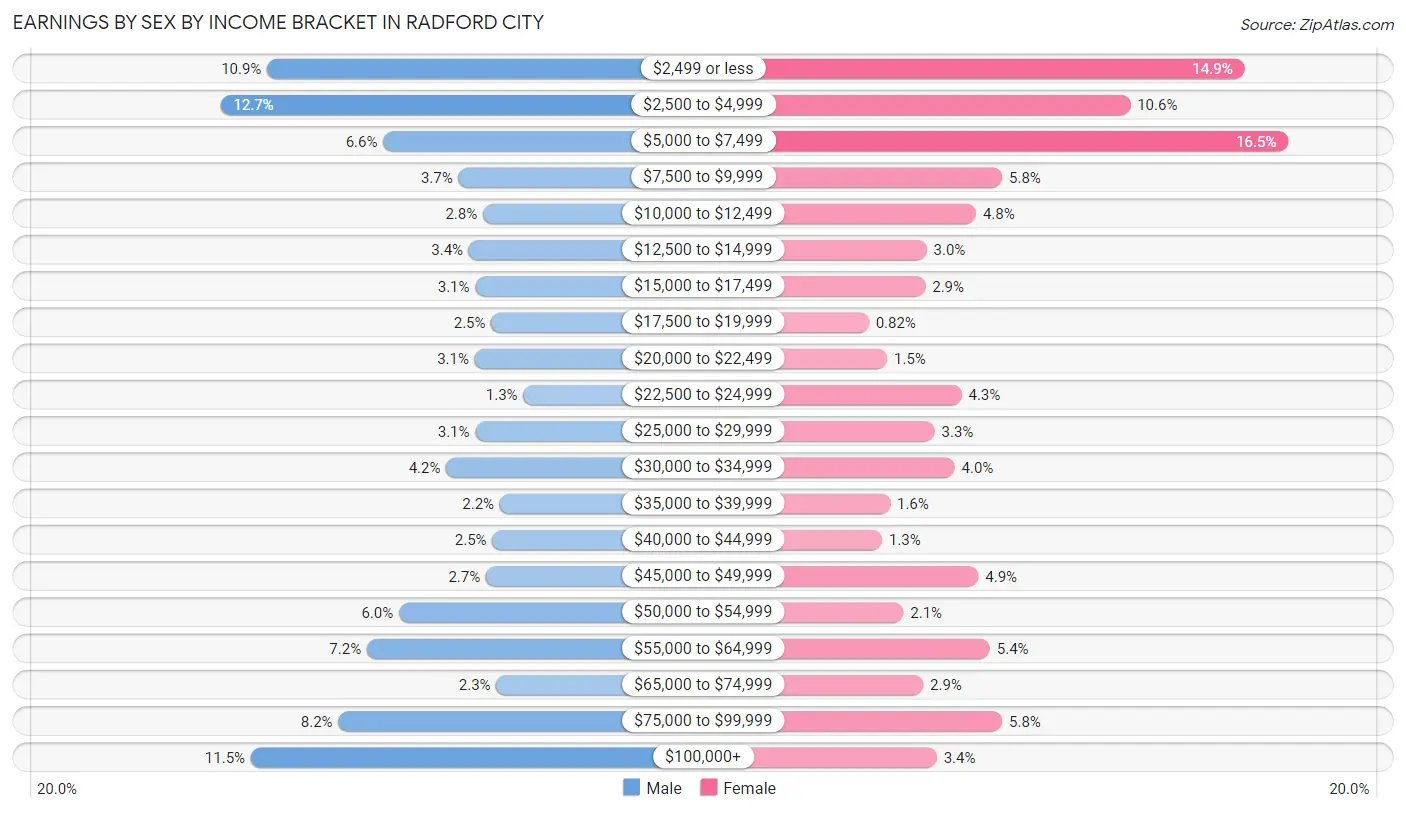
Earnings by Sex by Income Bracket in Radford city
The most common earnings brackets in Radford city are $2,500 to $4,999 for men (579 | 12.7%) and $5,000 to $7,499 for women (889 | 16.5%).
| Income | Male | Female |
| $2,499 or less | 499 (10.9%) | 801 (14.9%) |
| $2,500 to $4,999 | 579 (12.7%) | 571 (10.6%) |
| $5,000 to $7,499 | 300 (6.6%) | 889 (16.5%) |
| $7,500 to $9,999 | 171 (3.7%) | 313 (5.8%) |
| $10,000 to $12,499 | 129 (2.8%) | 260 (4.8%) |
| $12,500 to $14,999 | 153 (3.4%) | 161 (3.0%) |
| $15,000 to $17,499 | 142 (3.1%) | 158 (2.9%) |
| $17,500 to $19,999 | 115 (2.5%) | 44 (0.8%) |
| $20,000 to $22,499 | 143 (3.1%) | 81 (1.5%) |
| $22,500 to $24,999 | 60 (1.3%) | 231 (4.3%) |
| $25,000 to $29,999 | 142 (3.1%) | 177 (3.3%) |
| $30,000 to $34,999 | 192 (4.2%) | 217 (4.0%) |
| $35,000 to $39,999 | 100 (2.2%) | 87 (1.6%) |
| $40,000 to $44,999 | 113 (2.5%) | 71 (1.3%) |
| $45,000 to $49,999 | 124 (2.7%) | 265 (4.9%) |
| $50,000 to $54,999 | 273 (6.0%) | 114 (2.1%) |
| $55,000 to $64,999 | 328 (7.2%) | 288 (5.4%) |
| $65,000 to $74,999 | 106 (2.3%) | 154 (2.9%) |
| $75,000 to $99,999 | 377 (8.2%) | 313 (5.8%) |
| $100,000+ | 527 (11.5%) | 181 (3.4%) |
| Total | 4,573 (100.0%) | 5,376 (100.0%) |
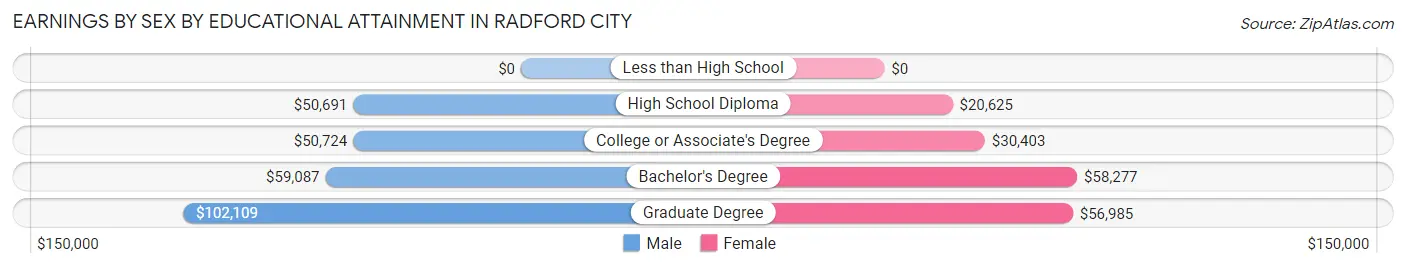
Earnings by Sex by Educational Attainment in Radford city
Average earnings in Radford city are $55,417 for men and $47,438 for women, a difference of 14.4%. Men with an educational attainment of graduate degree enjoy the highest average annual earnings of $102,109, while those with high school diploma education earn the least with $50,691. Women with an educational attainment of bachelor's degree earn the most with the average annual earnings of $58,277, while those with high school diploma education have the smallest earnings of $20,625.
| Educational Attainment | Male Income | Female Income |
| Less than High School | - | - |
| High School Diploma | $50,691 | $20,625 |
| College or Associate's Degree | $50,724 | $30,403 |
| Bachelor's Degree | $59,087 | $58,277 |
| Graduate Degree | $102,109 | $56,985 |
| Total | $55,417 | $47,438 |
Family Income in Radford city
Family Income Brackets in Radford city
According to the Radford city family income data, there are 639 families falling into the $100,000 to $149,999 income range, which is the most common income bracket and makes up 24.8% of all families. Conversely, the $25,000 to $34,999 income bracket is the least frequent group with only 59 families (2.3%) belonging to this category.
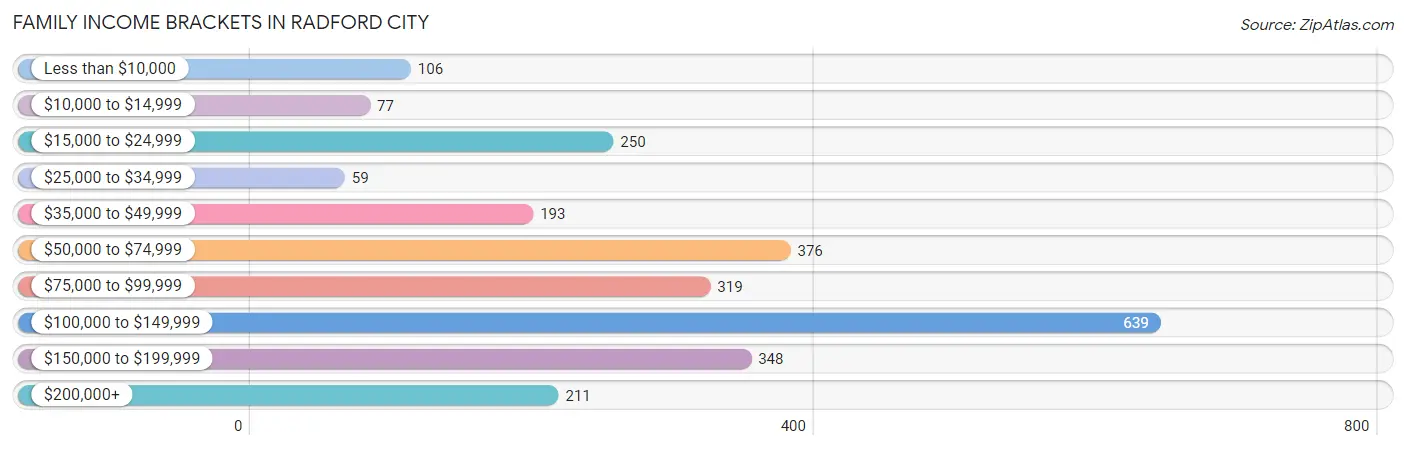
| Income Bracket | # Families | % Families |
| Less than $10,000 | 106 | 4.1% |
| $10,000 to $14,999 | 77 | 3.0% |
| $15,000 to $24,999 | 250 | 9.7% |
| $25,000 to $34,999 | 59 | 2.3% |
| $35,000 to $49,999 | 193 | 7.5% |
| $50,000 to $74,999 | 376 | 14.6% |
| $75,000 to $99,999 | 319 | 12.4% |
| $100,000 to $149,999 | 639 | 24.8% |
| $150,000 to $199,999 | 348 | 13.5% |
| $200,000+ | 211 | 8.2% |
Family Income by Famaliy Size in Radford city
4-person families (639 | 24.8%) account for the highest median family income in Radford city with $127,102 per family, while 2-person families (1,270 | 49.3%) have the highest median income of $33,173 per family member.
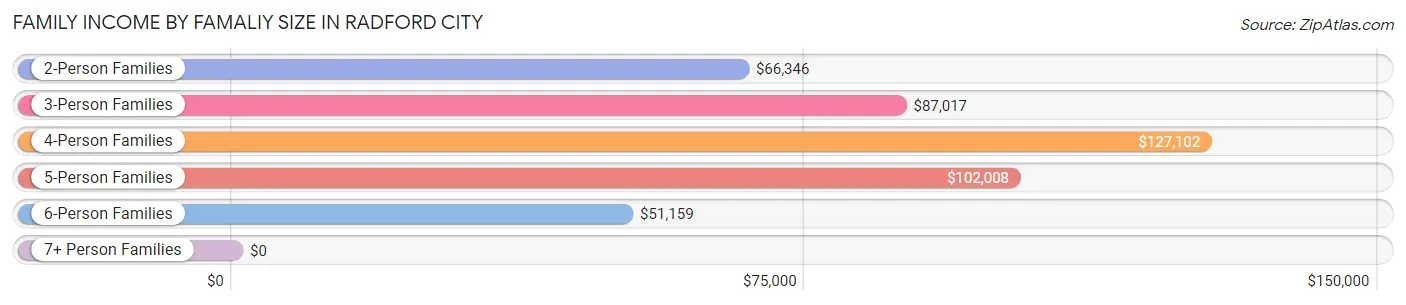
| Income Bracket | # Families | Median Income |
| 2-Person Families | 1,270 (49.3%) | $66,346 |
| 3-Person Families | 395 (15.3%) | $87,017 |
| 4-Person Families | 639 (24.8%) | $127,102 |
| 5-Person Families | 125 (4.9%) | $102,008 |
| 6-Person Families | 147 (5.7%) | $51,159 |
| 7+ Person Families | 0 (0.0%) | $0 |
| Total | 2,576 (100.0%) | $88,125 |
Family Income by Number of Earners in Radford city
The median family income in Radford city is $88,125, with families comprising 3+ earners (331) having the highest median family income of $168,783, while families with no earners (393) have the lowest median family income of $24,313, accounting for 12.9% and 15.3% of families, respectively.
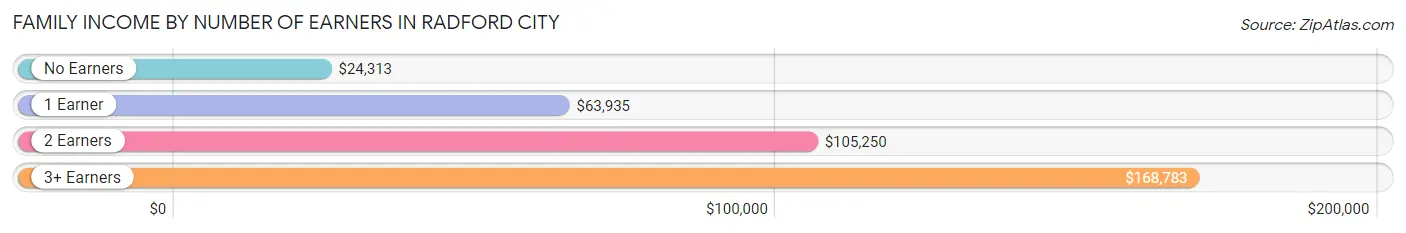
| Number of Earners | # Families | Median Income |
| No Earners | 393 (15.3%) | $24,313 |
| 1 Earner | 627 (24.3%) | $63,935 |
| 2 Earners | 1,225 (47.5%) | $105,250 |
| 3+ Earners | 331 (12.9%) | $168,783 |
| Total | 2,576 (100.0%) | $88,125 |
Household Income in Radford city
Household Income Brackets in Radford city
With 864 households falling in the category, the $50,000 to $74,999 income range is the most frequent in Radford city, accounting for 15.8% of all households. In contrast, only 230 households (4.2%) fall into the $200,000+ income bracket, making it the least populous group.
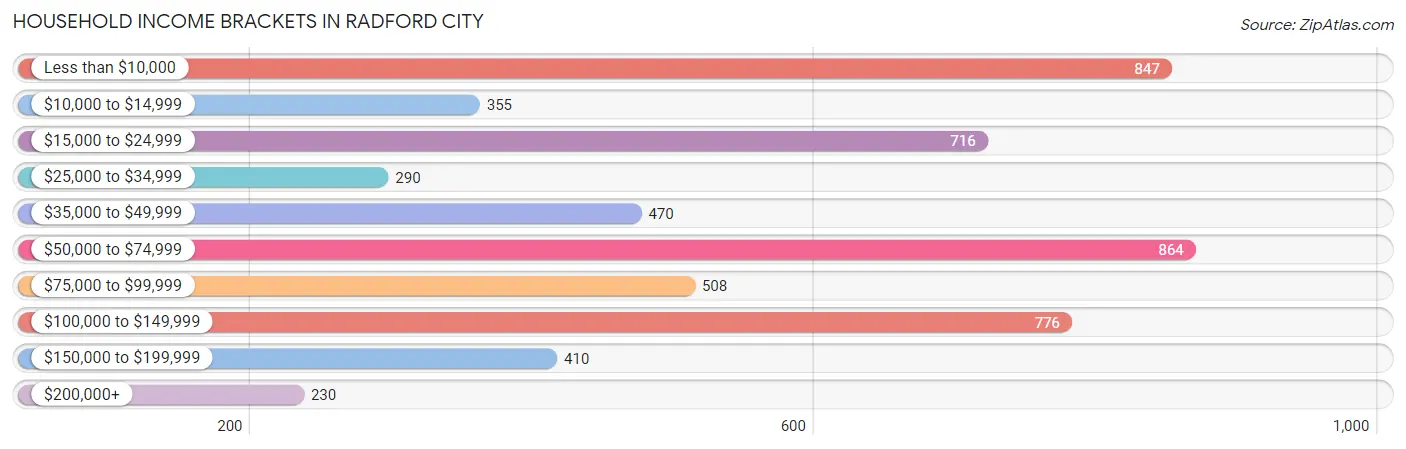
| Income Bracket | # Households | % Households |
| Less than $10,000 | 847 | 15.5% |
| $10,000 to $14,999 | 355 | 6.5% |
| $15,000 to $24,999 | 716 | 13.1% |
| $25,000 to $34,999 | 290 | 5.3% |
| $35,000 to $49,999 | 470 | 8.6% |
| $50,000 to $74,999 | 864 | 15.8% |
| $75,000 to $99,999 | 508 | 9.3% |
| $100,000 to $149,999 | 776 | 14.2% |
| $150,000 to $199,999 | 410 | 7.5% |
| $200,000+ | 230 | 4.2% |
Household Income by Householder Age in Radford city
The median household income in Radford city is $51,039, with the highest median household income of $79,868 found in the 45 to 64 years age bracket for the primary householder. A total of 1,608 households (29.4%) fall into this category. Meanwhile, the 15 to 24 years age bracket for the primary householder has the lowest median household income of $12,148, with 1,218 households (22.3%) in this group.
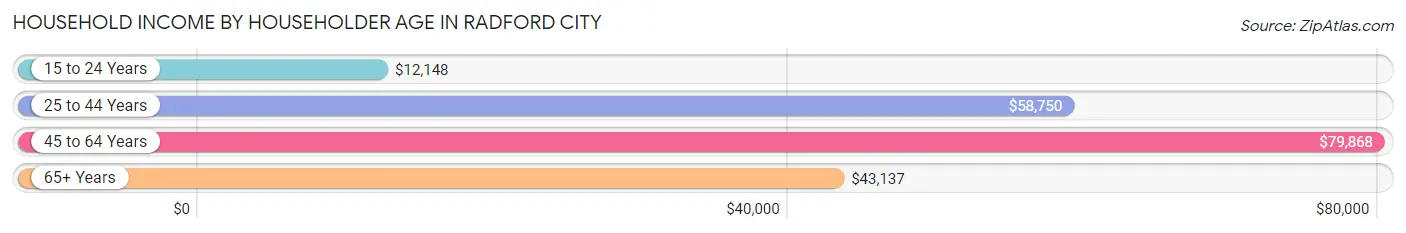
| Income Bracket | # Households | Median Income |
| 15 to 24 Years | 1,218 (22.3%) | $12,148 |
| 25 to 44 Years | 1,731 (31.7%) | $58,750 |
| 45 to 64 Years | 1,608 (29.4%) | $79,868 |
| 65+ Years | 910 (16.7%) | $43,137 |
| Total | 5,467 (100.0%) | $51,039 |
Poverty in Radford city
Income Below Poverty by Sex and Age in Radford city
With 31.6% poverty level for males and 35.7% for females among the residents of Radford city, 18 to 24 year old males and 18 to 24 year old females are the most vulnerable to poverty, with 1,318 males (75.1%) and 1,518 females (62.3%) in their respective age groups living below the poverty level.
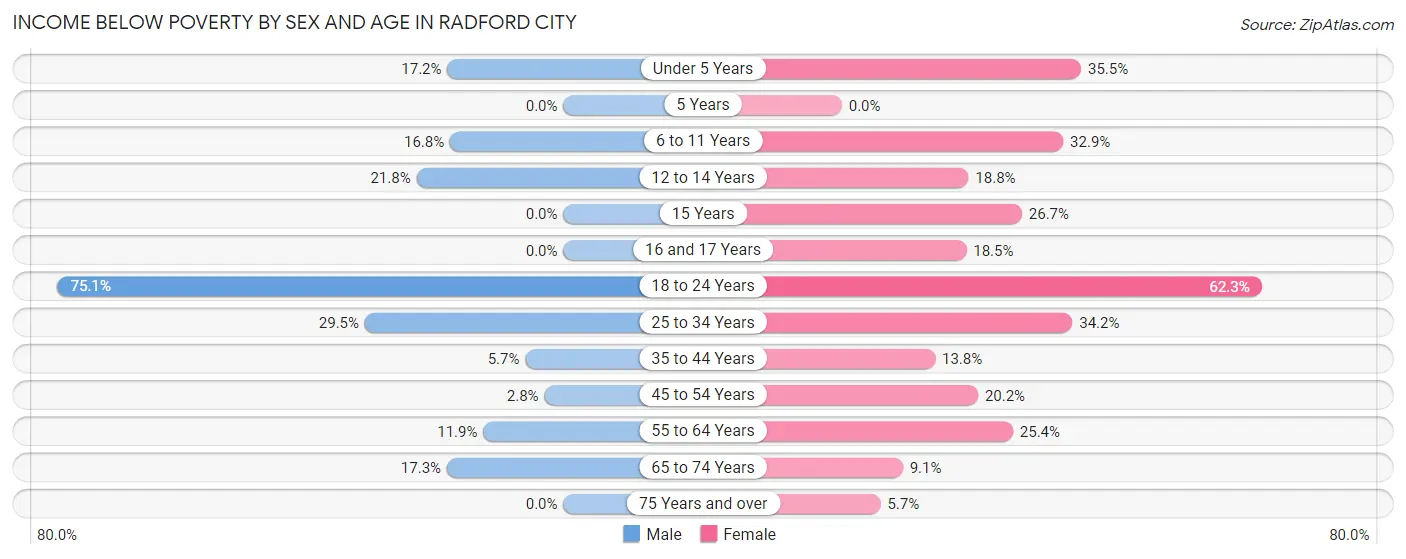
| Age Bracket | Male | Female |
| Under 5 Years | 52 (17.2%) | 108 (35.5%) |
| 5 Years | 0 (0.0%) | 0 (0.0%) |
| 6 to 11 Years | 54 (16.8%) | 117 (32.9%) |
| 12 to 14 Years | 41 (21.8%) | 22 (18.8%) |
| 15 Years | 0 (0.0%) | 23 (26.7%) |
| 16 and 17 Years | 0 (0.0%) | 22 (18.5%) |
| 18 to 24 Years | 1,318 (75.1%) | 1,518 (62.3%) |
| 25 to 34 Years | 259 (29.5%) | 292 (34.2%) |
| 35 to 44 Years | 33 (5.7%) | 111 (13.8%) |
| 45 to 54 Years | 19 (2.8%) | 127 (20.2%) |
| 55 to 64 Years | 78 (11.9%) | 175 (25.4%) |
| 65 to 74 Years | 69 (17.3%) | 42 (9.0%) |
| 75 Years and over | 0 (0.0%) | 21 (5.7%) |
| Total | 1,923 (31.6%) | 2,578 (35.7%) |
Income Above Poverty by Sex and Age in Radford city
According to the poverty statistics in Radford city, males aged 5 years and females aged 5 years are the age groups that are most secure financially, with 100.0% of males and 100.0% of females in these age groups living above the poverty line.
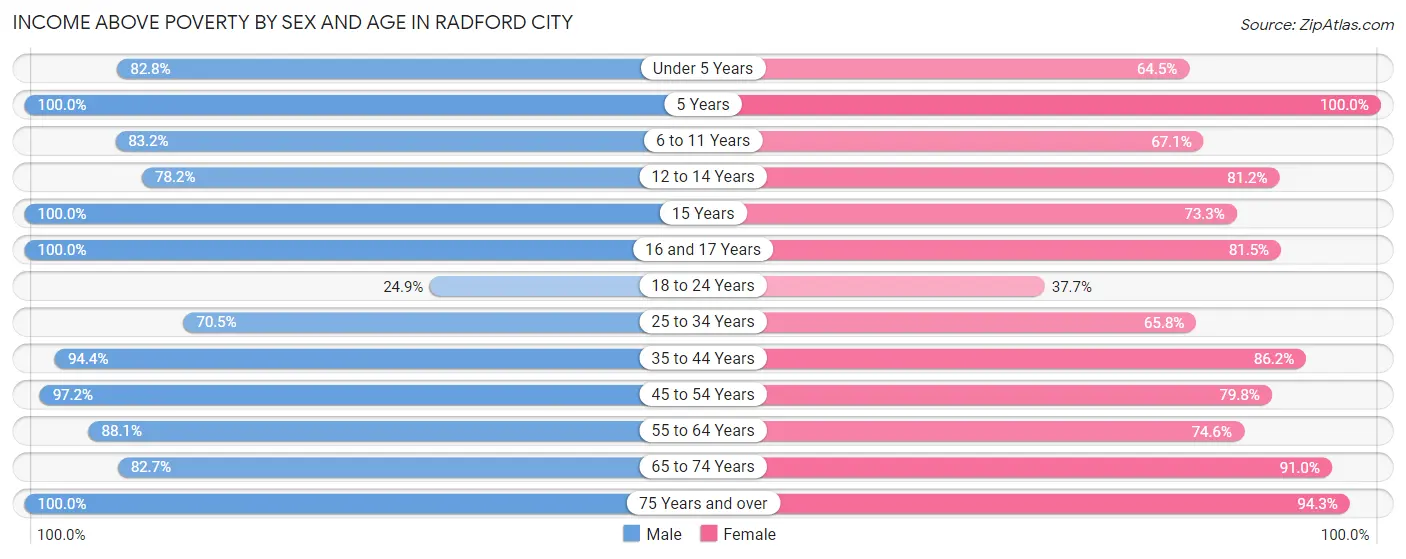
| Age Bracket | Male | Female |
| Under 5 Years | 250 (82.8%) | 196 (64.5%) |
| 5 Years | 19 (100.0%) | 9 (100.0%) |
| 6 to 11 Years | 267 (83.2%) | 239 (67.1%) |
| 12 to 14 Years | 147 (78.2%) | 95 (81.2%) |
| 15 Years | 50 (100.0%) | 63 (73.3%) |
| 16 and 17 Years | 57 (100.0%) | 97 (81.5%) |
| 18 to 24 Years | 437 (24.9%) | 918 (37.7%) |
| 25 to 34 Years | 620 (70.5%) | 561 (65.8%) |
| 35 to 44 Years | 551 (94.4%) | 691 (86.2%) |
| 45 to 54 Years | 657 (97.2%) | 501 (79.8%) |
| 55 to 64 Years | 578 (88.1%) | 514 (74.6%) |
| 65 to 74 Years | 330 (82.7%) | 422 (90.9%) |
| 75 Years and over | 205 (100.0%) | 345 (94.3%) |
| Total | 4,168 (68.4%) | 4,651 (64.3%) |
Income Below Poverty Among Married-Couple Families in Radford city
The poverty statistics for married-couple families in Radford city show that 3.9% or 70 of the total 1,796 families live below the poverty line. Families with 1 or 2 children have the highest poverty rate of 6.4%, comprising of 48 families. On the other hand, families with 3 or 4 children have the lowest poverty rate of 0.0%, which includes 0 families.
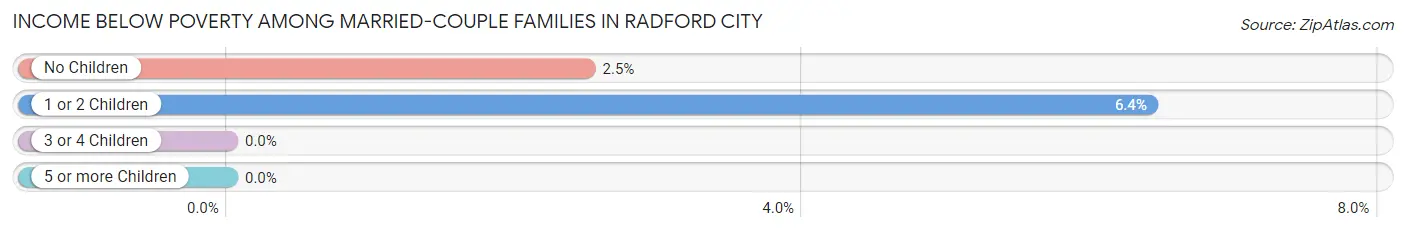
| Children | Above Poverty | Below Poverty |
| No Children | 860 (97.5%) | 22 (2.5%) |
| 1 or 2 Children | 701 (93.6%) | 48 (6.4%) |
| 3 or 4 Children | 165 (100.0%) | 0 (0.0%) |
| 5 or more Children | 0 (0.0%) | 0 (0.0%) |
| Total | 1,726 (96.1%) | 70 (3.9%) |
Income Below Poverty Among Single-Parent Households in Radford city
According to the poverty data in Radford city, 13.3% or 13 single-father households and 43.1% or 294 single-mother households are living below the poverty line. Among single-father households, those with 1 or 2 children have the highest poverty rate, with 13 households (31.7%) experiencing poverty. Likewise, among single-mother households, those with 3 or 4 children have the highest poverty rate, with 24 households (100.0%) falling below the poverty line.
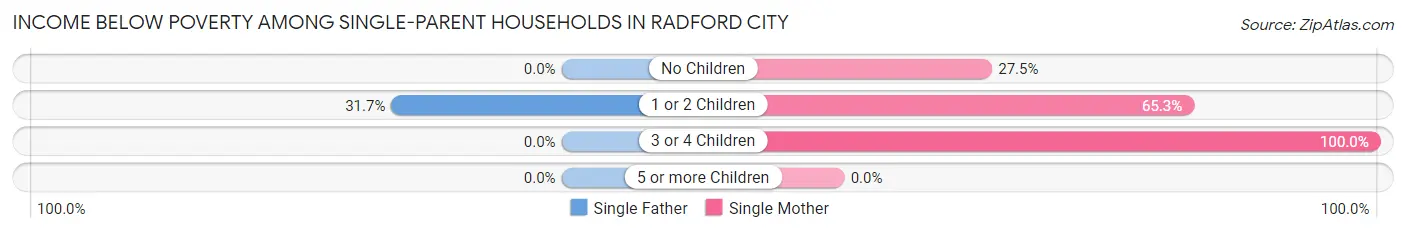
| Children | Single Father | Single Mother |
| No Children | 0 (0.0%) | 116 (27.5%) |
| 1 or 2 Children | 13 (31.7%) | 154 (65.2%) |
| 3 or 4 Children | 0 (0.0%) | 24 (100.0%) |
| 5 or more Children | 0 (0.0%) | 0 (0.0%) |
| Total | 13 (13.3%) | 294 (43.1%) |
Income Below Poverty Among Married-Couple vs Single-Parent Households in Radford city
The poverty data for Radford city shows that 70 of the married-couple family households (3.9%) and 307 of the single-parent households (39.4%) are living below the poverty level. Within the married-couple family households, those with 1 or 2 children have the highest poverty rate, with 48 households (6.4%) falling below the poverty line. Among the single-parent households, those with 3 or 4 children have the highest poverty rate, with 24 household (72.7%) living below poverty.
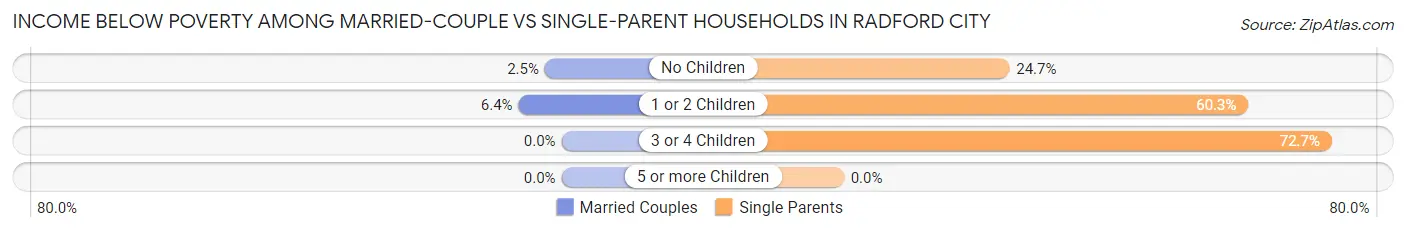
| Children | Married-Couple Families | Single-Parent Households |
| No Children | 22 (2.5%) | 116 (24.7%) |
| 1 or 2 Children | 48 (6.4%) | 167 (60.3%) |
| 3 or 4 Children | 0 (0.0%) | 24 (72.7%) |
| 5 or more Children | 0 (0.0%) | 0 (0.0%) |
| Total | 70 (3.9%) | 307 (39.4%) |
Race in Radford city
The most populous races in Radford city are White / Caucasian (13,804 | 84.3%), Black / African American (1,460 | 8.9%), and Two or more Races (623 | 3.8%).
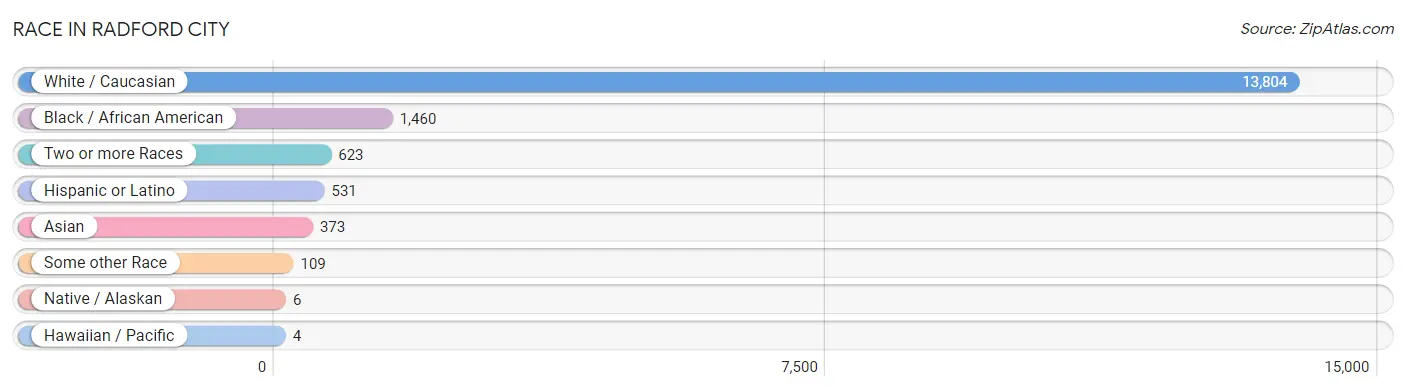
| Race | # Population | % Population |
| Asian | 373 | 2.3% |
| Black / African American | 1,460 | 8.9% |
| Hawaiian / Pacific | 4 | 0.0% |
| Hispanic or Latino | 531 | 3.2% |
| Native / Alaskan | 6 | 0.0% |
| White / Caucasian | 13,804 | 84.3% |
| Two or more Races | 623 | 3.8% |
| Some other Race | 109 | 0.7% |
| Total | 16,379 | 100.0% |
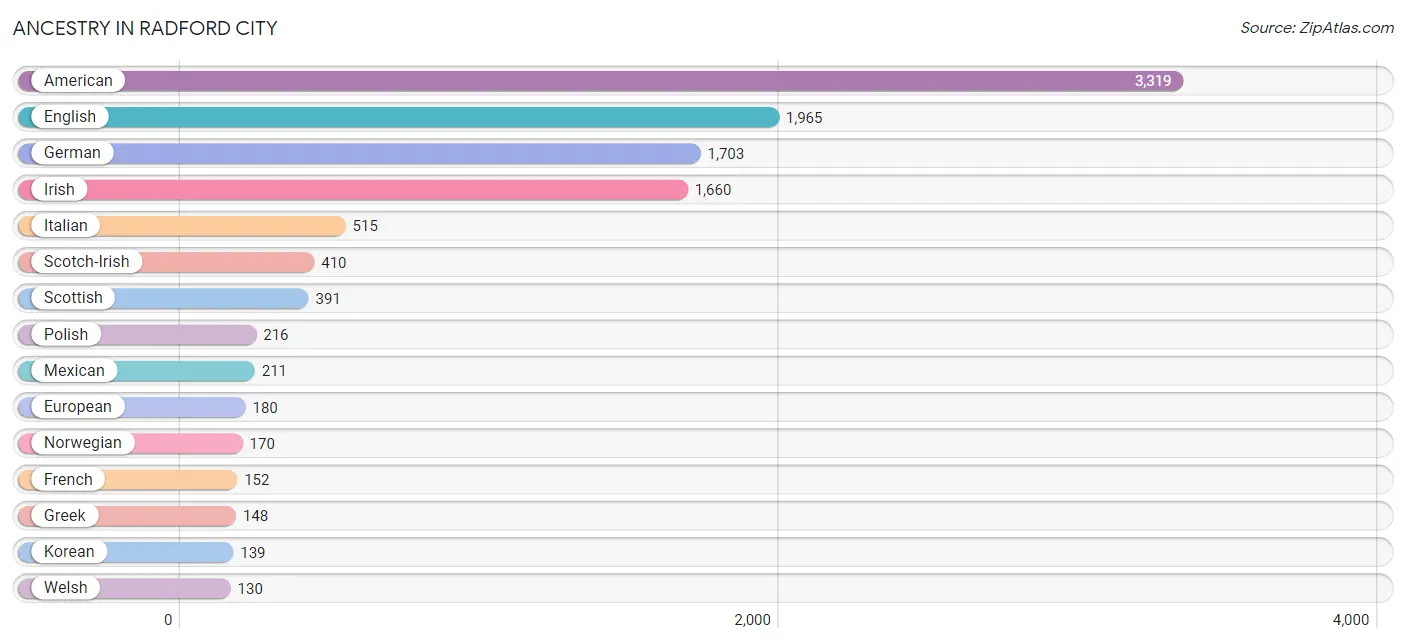
Ancestry in Radford city
The most populous ancestries reported in Radford city are American (3,319 | 20.3%), English (1,965 | 12.0%), German (1,703 | 10.4%), Irish (1,660 | 10.1%), and Italian (515 | 3.1%), together accounting for 55.9% of all Radford city residents.
| Ancestry | # Population | % Population |
| African | 40 | 0.2% |
| American | 3,319 | 20.3% |
| Arab | 71 | 0.4% |
| Argentinean | 38 | 0.2% |
| Armenian | 5 | 0.0% |
| Australian | 5 | 0.0% |
| Austrian | 17 | 0.1% |
| Belgian | 12 | 0.1% |
| Bhutanese | 24 | 0.2% |
| Brazilian | 43 | 0.3% |
| British | 41 | 0.3% |
| Burmese | 25 | 0.2% |
| Canadian | 7 | 0.0% |
| Central American | 49 | 0.3% |
| Cherokee | 21 | 0.1% |
| Colombian | 8 | 0.1% |
| Cuban | 14 | 0.1% |
| Czech | 48 | 0.3% |
| Dominican | 16 | 0.1% |
| Dutch | 116 | 0.7% |
| Ecuadorian | 12 | 0.1% |
| English | 1,965 | 12.0% |
| European | 180 | 1.1% |
| Filipino | 44 | 0.3% |
| Finnish | 27 | 0.2% |
| French | 152 | 0.9% |
| French Canadian | 28 | 0.2% |
| German | 1,703 | 10.4% |
| Ghanaian | 60 | 0.4% |
| Greek | 148 | 0.9% |
| Haitian | 16 | 0.1% |
| Hungarian | 7 | 0.0% |
| Indian (Asian) | 113 | 0.7% |
| Iranian | 47 | 0.3% |
| Irish | 1,660 | 10.1% |
| Israeli | 11 | 0.1% |
| Italian | 515 | 3.1% |
| Jamaican | 14 | 0.1% |
| Japanese | 13 | 0.1% |
| Korean | 139 | 0.9% |
| Lebanese | 10 | 0.1% |
| Lithuanian | 8 | 0.1% |
| Mexican | 211 | 1.3% |
| Native Hawaiian | 4 | 0.0% |
| Nicaraguan | 13 | 0.1% |
| Nigerian | 4 | 0.0% |
| Northern European | 21 | 0.1% |
| Norwegian | 170 | 1.0% |
| Palestinian | 9 | 0.1% |
| Pennsylvania German | 6 | 0.0% |
| Polish | 216 | 1.3% |
| Puerto Rican | 103 | 0.6% |
| Romanian | 8 | 0.1% |
| Russian | 87 | 0.5% |
| Salvadoran | 36 | 0.2% |
| Scandinavian | 17 | 0.1% |
| Scotch-Irish | 410 | 2.5% |
| Scottish | 391 | 2.4% |
| Slovak | 18 | 0.1% |
| South American | 58 | 0.4% |
| Spanish | 5 | 0.0% |
| Sri Lankan | 44 | 0.3% |
| Subsaharan African | 104 | 0.6% |
| Swedish | 33 | 0.2% |
| Swiss | 72 | 0.4% |
| Thai | 54 | 0.3% |
| Welsh | 130 | 0.8% | View All 67 Rows |
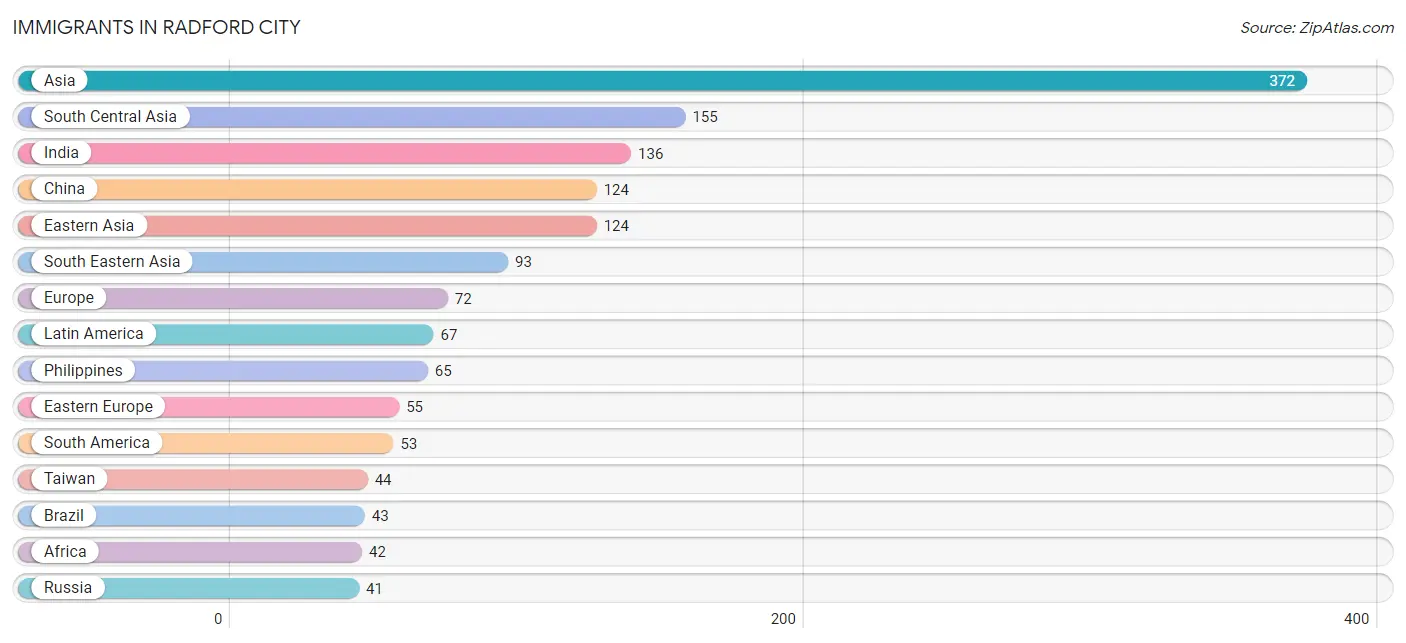
Immigrants in Radford city
The most numerous immigrant groups reported in Radford city came from Asia (372 | 2.3%), South Central Asia (155 | 0.9%), India (136 | 0.8%), China (124 | 0.8%), and Eastern Asia (124 | 0.8%), together accounting for 5.6% of all Radford city residents.
| Immigration Origin | # Population | % Population |
| Africa | 42 | 0.3% |
| Asia | 372 | 2.3% |
| Bolivia | 10 | 0.1% |
| Brazil | 43 | 0.3% |
| Caribbean | 14 | 0.1% |
| China | 124 | 0.8% |
| Dominican Republic | 14 | 0.1% |
| Eastern Asia | 124 | 0.8% |
| Eastern Europe | 55 | 0.3% |
| England | 9 | 0.1% |
| Europe | 72 | 0.4% |
| Ghana | 34 | 0.2% |
| India | 136 | 0.8% |
| Latin America | 67 | 0.4% |
| Nigeria | 4 | 0.0% |
| Northern Europe | 17 | 0.1% |
| Pakistan | 19 | 0.1% |
| Philippines | 65 | 0.4% |
| Romania | 14 | 0.1% |
| Russia | 41 | 0.3% |
| South America | 53 | 0.3% |
| South Central Asia | 155 | 0.9% |
| South Eastern Asia | 93 | 0.6% |
| Taiwan | 44 | 0.3% |
| Vietnam | 28 | 0.2% |
| Western Africa | 38 | 0.2% | View All 26 Rows |
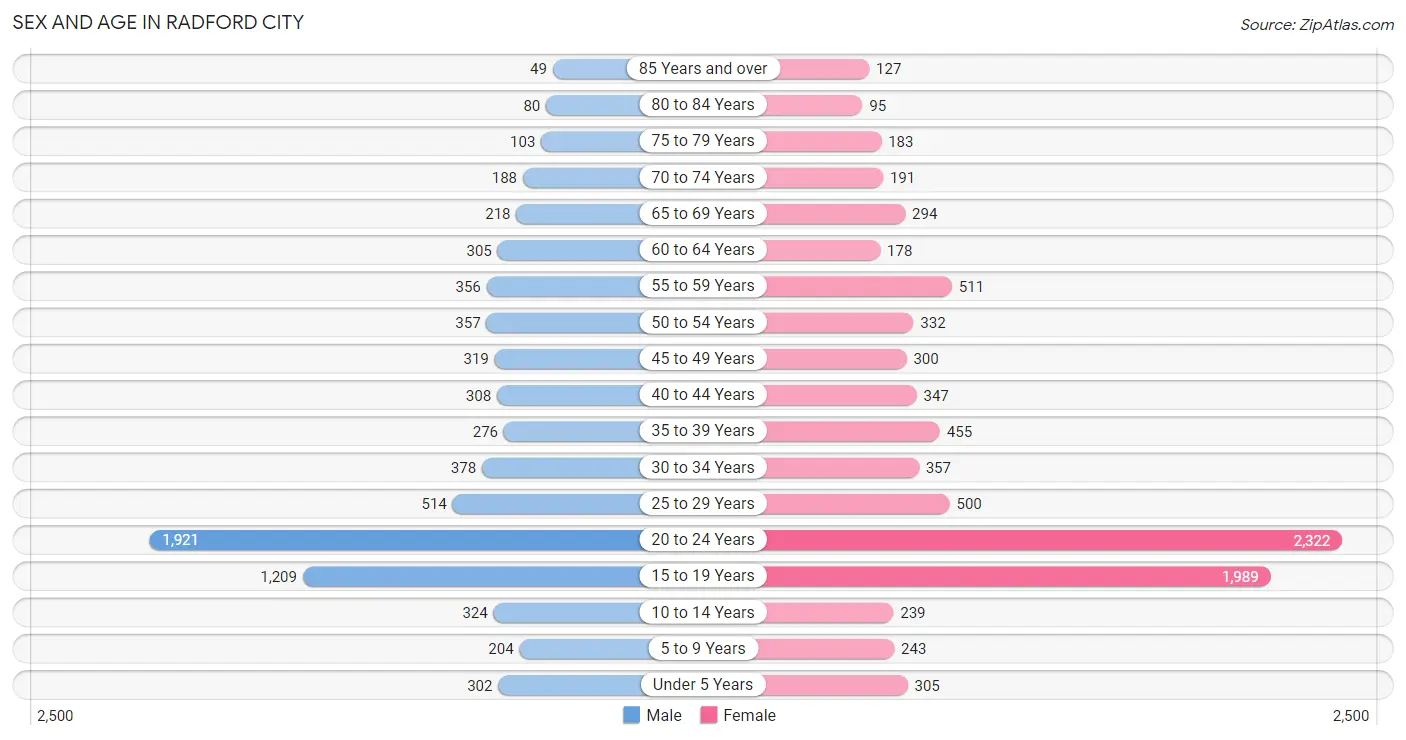
Sex and Age in Radford city
Sex and Age in Radford city
The most populous age groups in Radford city are 20 to 24 Years (1,921 | 25.9%) for men and 20 to 24 Years (2,322 | 25.9%) for women.
| Age Bracket | Male | Female |
| Under 5 Years | 302 (4.1%) | 305 (3.4%) |
| 5 to 9 Years | 204 (2.8%) | 243 (2.7%) |
| 10 to 14 Years | 324 (4.4%) | 239 (2.7%) |
| 15 to 19 Years | 1,209 (16.3%) | 1,989 (22.2%) |
| 20 to 24 Years | 1,921 (25.9%) | 2,322 (25.9%) |
| 25 to 29 Years | 514 (6.9%) | 500 (5.6%) |
| 30 to 34 Years | 378 (5.1%) | 357 (4.0%) |
| 35 to 39 Years | 276 (3.7%) | 455 (5.1%) |
| 40 to 44 Years | 308 (4.2%) | 347 (3.9%) |
| 45 to 49 Years | 319 (4.3%) | 300 (3.4%) |
| 50 to 54 Years | 357 (4.8%) | 332 (3.7%) |
| 55 to 59 Years | 356 (4.8%) | 511 (5.7%) |
| 60 to 64 Years | 305 (4.1%) | 178 (2.0%) |
| 65 to 69 Years | 218 (2.9%) | 294 (3.3%) |
| 70 to 74 Years | 188 (2.5%) | 191 (2.1%) |
| 75 to 79 Years | 103 (1.4%) | 183 (2.0%) |
| 80 to 84 Years | 80 (1.1%) | 95 (1.1%) |
| 85 Years and over | 49 (0.7%) | 127 (1.4%) |
| Total | 7,411 (100.0%) | 8,968 (100.0%) |
Families and Households in Radford city
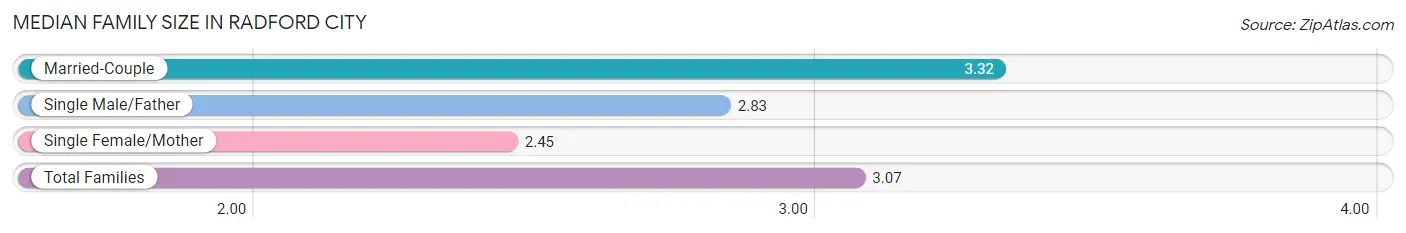
Median Family Size in Radford city
The median family size in Radford city is 3.07 persons per family, with married-couple families (1,796 | 69.7%) accounting for the largest median family size of 3.32 persons per family. On the other hand, single female/mother families (682 | 26.5%) represent the smallest median family size with 2.45 persons per family.
| Family Type | # Families | Family Size |
| Married-Couple | 1,796 (69.7%) | 3.32 |
| Single Male/Father | 98 (3.8%) | 2.83 |
| Single Female/Mother | 682 (26.5%) | 2.45 |
| Total Families | 2,576 (100.0%) | 3.07 |
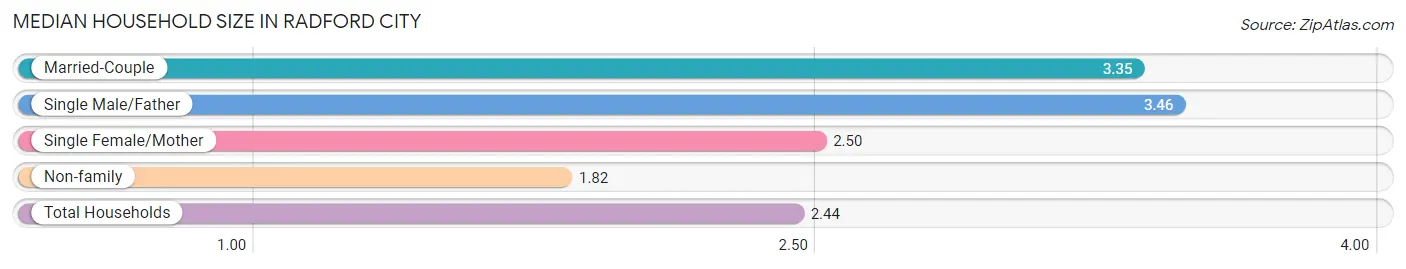
Median Household Size in Radford city
The median household size in Radford city is 2.44 persons per household, with single male/father households (98 | 1.8%) accounting for the largest median household size of 3.46 persons per household. non-family households (2,891 | 52.9%) represent the smallest median household size with 1.82 persons per household.
| Household Type | # Households | Household Size |
| Married-Couple | 1,796 (32.9%) | 3.35 |
| Single Male/Father | 98 (1.8%) | 3.46 |
| Single Female/Mother | 682 (12.5%) | 2.50 |
| Non-family | 2,891 (52.9%) | 1.82 |
| Total Households | 5,467 (100.0%) | 2.44 |
Household Size by Marriage Status in Radford city
Out of a total of 5,467 households in Radford city, 2,576 (47.1%) are family households, while 2,891 (52.9%) are nonfamily households. The most numerous type of family households are 2-person households, comprising 1,202, and the most common type of nonfamily households are 1-person households, comprising 1,656.
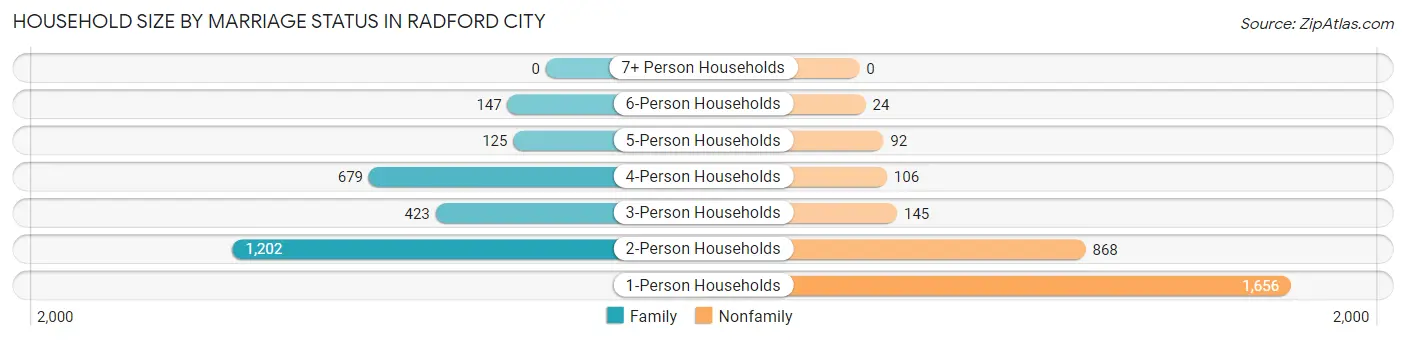
| Household Size | Family Households | Nonfamily Households |
| 1-Person Households | - | 1,656 (30.3%) |
| 2-Person Households | 1,202 (22.0%) | 868 (15.9%) |
| 3-Person Households | 423 (7.7%) | 145 (2.6%) |
| 4-Person Households | 679 (12.4%) | 106 (1.9%) |
| 5-Person Households | 125 (2.3%) | 92 (1.7%) |
| 6-Person Households | 147 (2.7%) | 24 (0.4%) |
| 7+ Person Households | 0 (0.0%) | 0 (0.0%) |
| Total | 2,576 (47.1%) | 2,891 (52.9%) |
Female Fertility in Radford city
Fertility by Age in Radford city
Average fertility rate in Radford city is 30.0 births per 1,000 women. Women in the age bracket of 20 to 34 years have the highest fertility rate with 47.0 births per 1,000 women. Women in the age bracket of 20 to 34 years acount for 78.6% of all women with births.
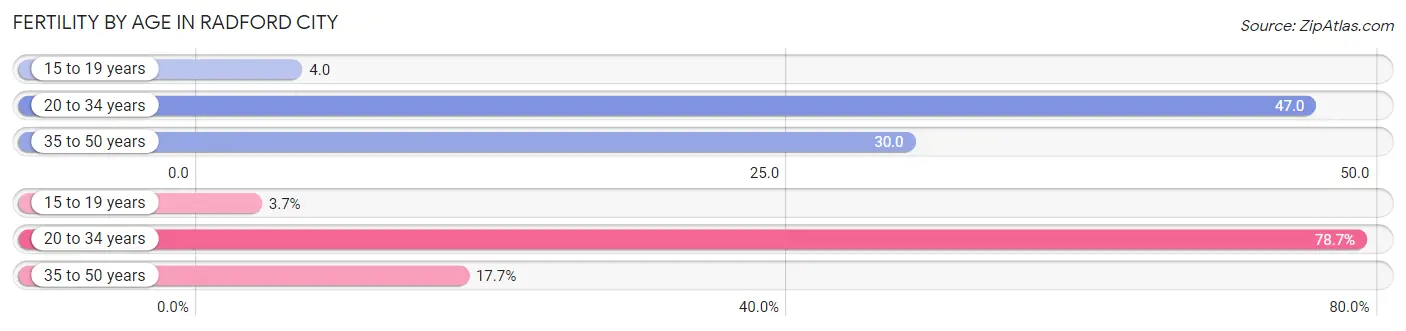
| Age Bracket | Women with Births | Births / 1,000 Women |
| 15 to 19 years | 7 (3.6%) | 4.0 |
| 20 to 34 years | 151 (78.6%) | 47.0 |
| 35 to 50 years | 34 (17.7%) | 30.0 |
| Total | 192 (100.0%) | 30.0 |
Fertility by Age by Marriage Status in Radford city
71.9% of women with births (192) in Radford city are married. The highest percentage of unmarried women with births falls into 15 to 19 years age bracket with 100.0% of them unmarried at the time of birth, while the lowest percentage of unmarried women with births belong to 35 to 50 years age bracket with 0.0% of them unmarried.
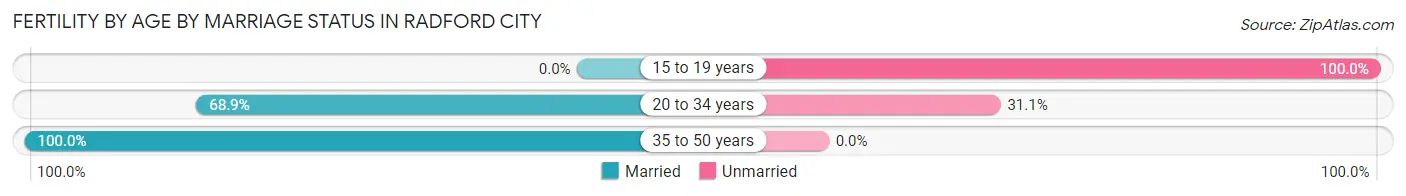
| Age Bracket | Married | Unmarried |
| 15 to 19 years | 0 (0.0%) | 7 (100.0%) |
| 20 to 34 years | 104 (68.9%) | 47 (31.1%) |
| 35 to 50 years | 34 (100.0%) | 0 (0.0%) |
| Total | 138 (71.9%) | 54 (28.1%) |
Fertility by Education in Radford city
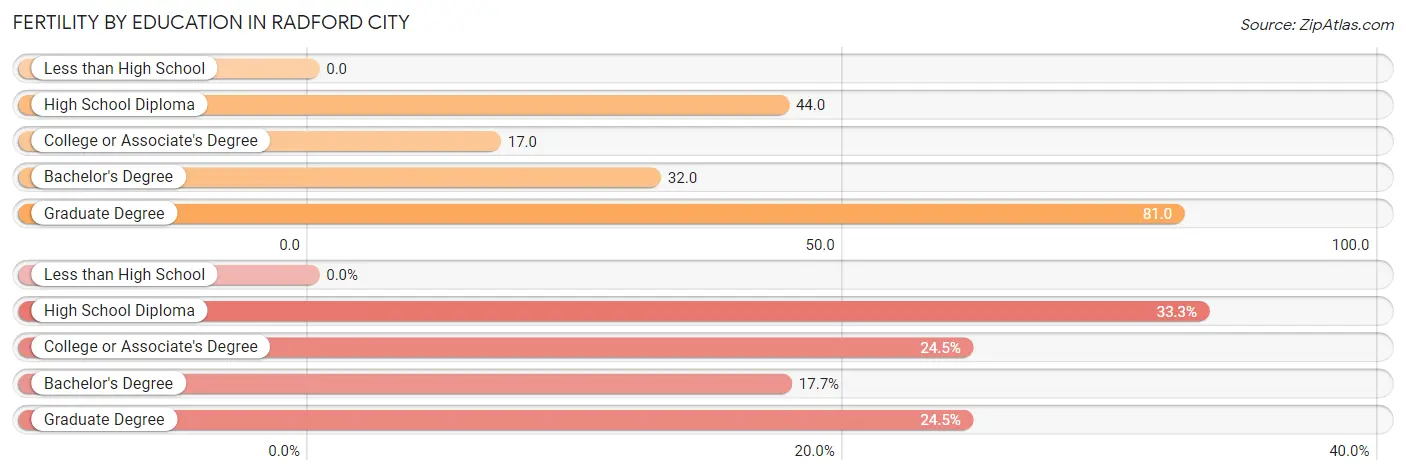
| Educational Attainment | Women with Births | Births / 1,000 Women |
| Less than High School | 0 (0.0%) | 0.0 |
| High School Diploma | 64 (33.3%) | 44.0 |
| College or Associate's Degree | 47 (24.5%) | 17.0 |
| Bachelor's Degree | 34 (17.7%) | 32.0 |
| Graduate Degree | 47 (24.5%) | 81.0 |
| Total | 192 (100.0%) | 30.0 |
Fertility by Education by Marriage Status in Radford city
28.1% of women with births in Radford city are unmarried. Women with the educational attainment of bachelor's degree are most likely to be married with 100.0% of them married at childbirth, while women with the educational attainment of college or associate's degree are least likely to be married with 100.0% of them unmarried at childbirth.
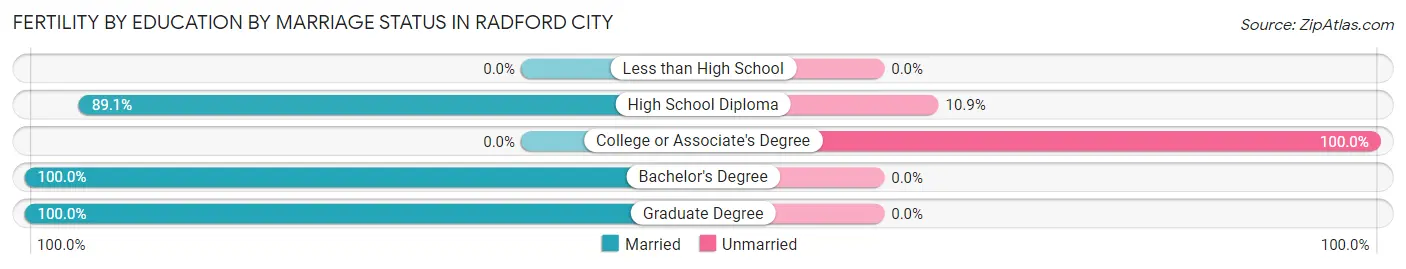
| Educational Attainment | Married | Unmarried |
| Less than High School | 0 (0.0%) | 0 (0.0%) |
| High School Diploma | 57 (89.1%) | 7 (10.9%) |
| College or Associate's Degree | 0 (0.0%) | 47 (100.0%) |
| Bachelor's Degree | 34 (100.0%) | 0 (0.0%) |
| Graduate Degree | 47 (100.0%) | 0 (0.0%) |
| Total | 138 (71.9%) | 54 (28.1%) |
Employment Characteristics in Radford city
Employment by Class of Employer in Radford city
Among the 7,771 employed individuals in Radford city, private company employees (4,992 | 64.2%), state government employees (870 | 11.2%), and local government employees (673 | 8.7%) make up the most common classes of employment.
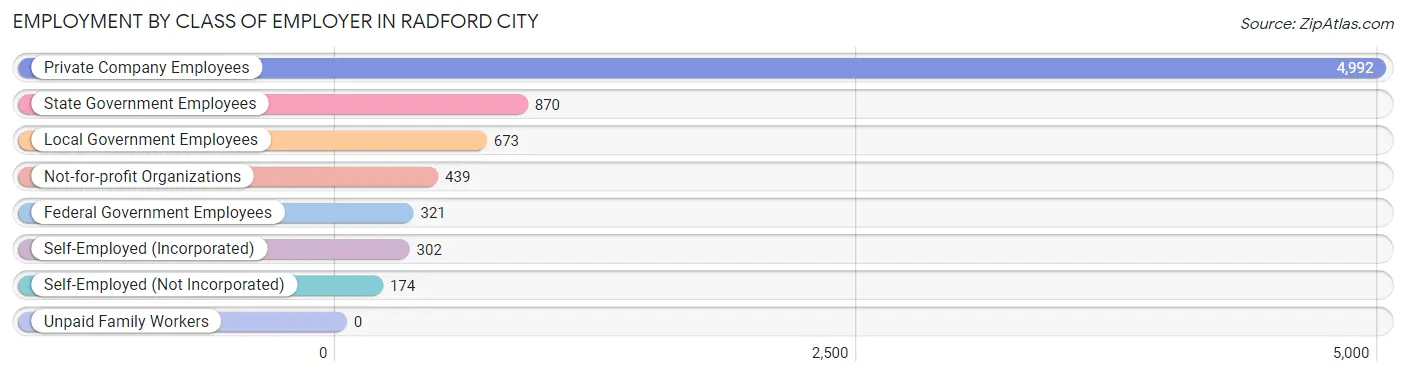
| Employer Class | # Employees | % Employees |
| Private Company Employees | 4,992 | 64.2% |
| Self-Employed (Incorporated) | 302 | 3.9% |
| Self-Employed (Not Incorporated) | 174 | 2.2% |
| Not-for-profit Organizations | 439 | 5.7% |
| Local Government Employees | 673 | 8.7% |
| State Government Employees | 870 | 11.2% |
| Federal Government Employees | 321 | 4.1% |
| Unpaid Family Workers | 0 | 0.0% |
| Total | 7,771 | 100.0% |
Employment Status by Age in Radford city
According to the labor force statistics for Radford city, out of the total population over 16 years of age (14,626), 58.9% or 8,615 individuals are in the labor force, with 7.2% or 620 of them unemployed. The age group with the highest labor force participation rate is 35 to 44 years, with 86.5% or 1,199 individuals in the labor force. Within the labor force, the 25 to 29 years age range has the highest percentage of unemployed individuals, with 28.8% or 245 of them being unemployed.
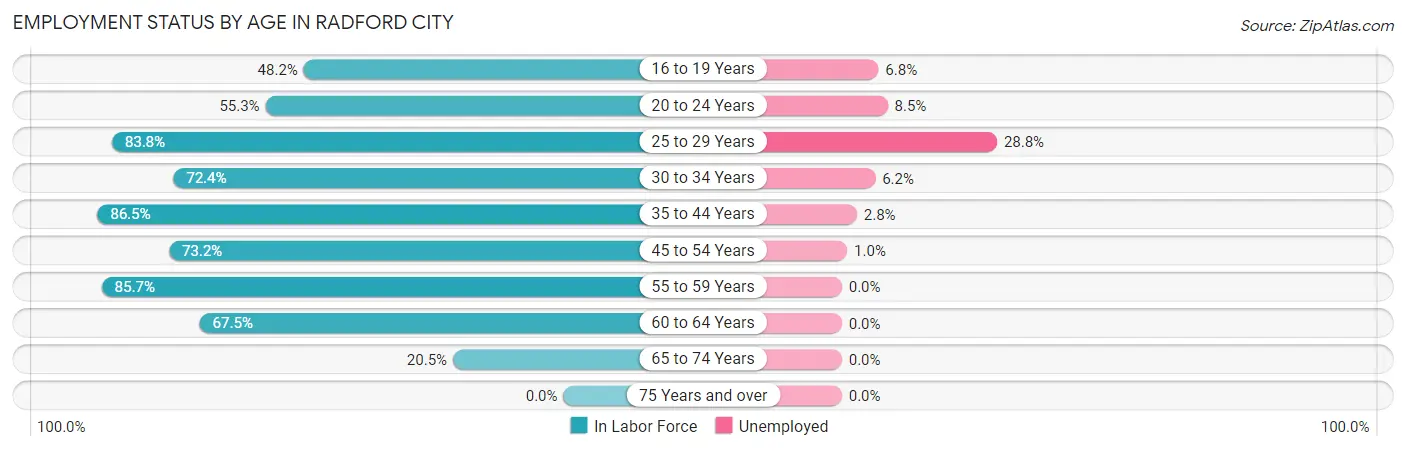
| Age Bracket | In Labor Force | Unemployed |
| 16 to 19 Years | 1,476 (48.2%) | 100 (6.8%) |
| 20 to 24 Years | 2,346 (55.3%) | 199 (8.5%) |
| 25 to 29 Years | 850 (83.8%) | 245 (28.8%) |
| 30 to 34 Years | 532 (72.4%) | 33 (6.2%) |
| 35 to 44 Years | 1,199 (86.5%) | 34 (2.8%) |
| 45 to 54 Years | 957 (73.2%) | 10 (1.0%) |
| 55 to 59 Years | 743 (85.7%) | 0 (0.0%) |
| 60 to 64 Years | 326 (67.5%) | 0 (0.0%) |
| 65 to 74 Years | 183 (20.5%) | 0 (0.0%) |
| 75 Years and over | 0 (0.0%) | 0 (0.0%) |
| Total | 8,615 (58.9%) | 620 (7.2%) |
Employment Status by Educational Attainment in Radford city
According to labor force statistics for Radford city, 79.5% of individuals (4,605) out of the total population between 25 and 64 years of age (5,793) are in the labor force, with 7.0% or 322 of them being unemployed. The group with the highest labor force participation rate are those with the educational attainment of bachelor's degree or higher, with 89.8% or 2,529 individuals in the labor force. Within the labor force, individuals with college / associate degree education have the highest percentage of unemployment, with 12.2% or 166 of them being unemployed.
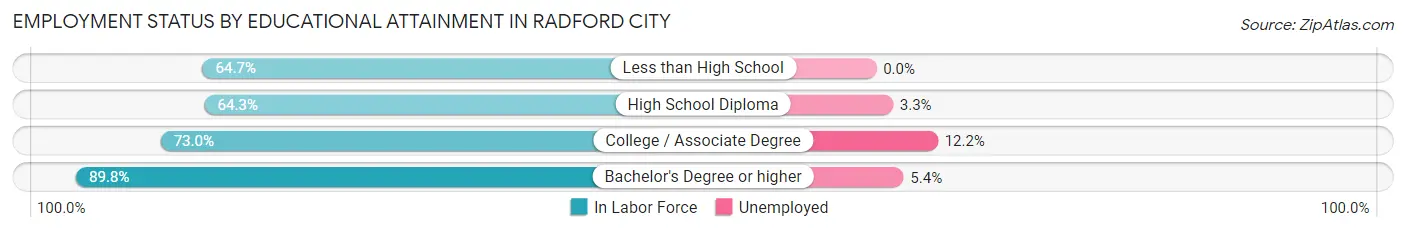
| Educational Attainment | In Labor Force | Unemployed |
| Less than High School | 119 (64.7%) | 0 (0.0%) |
| High School Diploma | 599 (64.3%) | 31 (3.3%) |
| College / Associate Degree | 1,359 (73.0%) | 227 (12.2%) |
| Bachelor's Degree or higher | 2,529 (89.8%) | 152 (5.4%) |
| Total | 4,605 (79.5%) | 406 (7.0%) |
Employment Occupations by Sex in Radford city
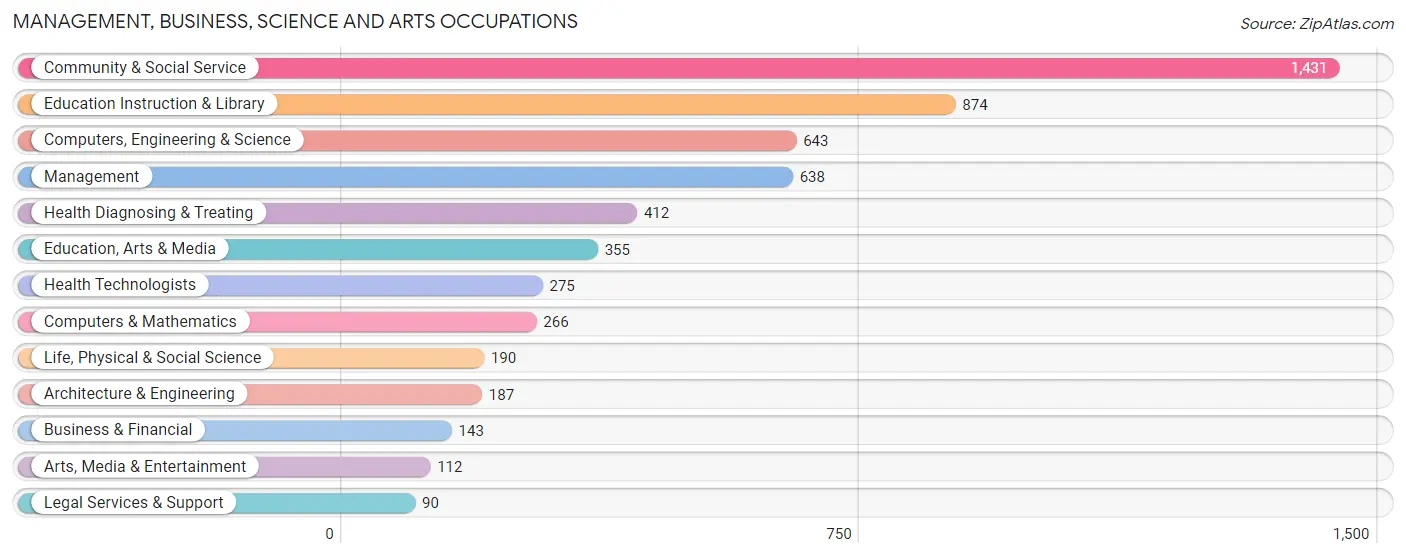
Management, Business, Science and Arts Occupations
The most common Management, Business, Science and Arts occupations in Radford city are Community & Social Service (1,431 | 18.0%), Education Instruction & Library (874 | 11.0%), Computers, Engineering & Science (643 | 8.1%), Management (638 | 8.0%), and Health Diagnosing & Treating (412 | 5.2%).
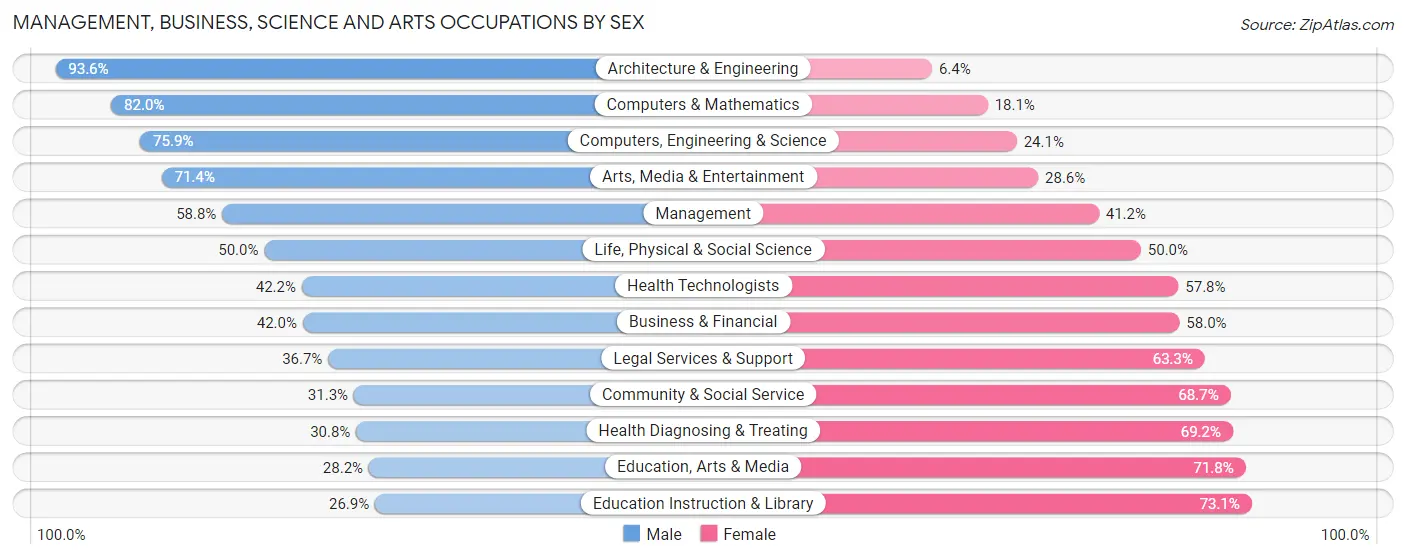
Management, Business, Science and Arts Occupations by Sex
Within the Management, Business, Science and Arts occupations in Radford city, the most male-oriented occupations are Architecture & Engineering (93.6%), Computers & Mathematics (82.0%), and Computers, Engineering & Science (75.9%), while the most female-oriented occupations are Education Instruction & Library (73.1%), Education, Arts & Media (71.8%), and Health Diagnosing & Treating (69.2%).
| Occupation | Male | Female |
| Management | 375 (58.8%) | 263 (41.2%) |
| Business & Financial | 60 (42.0%) | 83 (58.0%) |
| Computers, Engineering & Science | 488 (75.9%) | 155 (24.1%) |
| Computers & Mathematics | 218 (82.0%) | 48 (18.0%) |
| Architecture & Engineering | 175 (93.6%) | 12 (6.4%) |
| Life, Physical & Social Science | 95 (50.0%) | 95 (50.0%) |
| Community & Social Service | 448 (31.3%) | 983 (68.7%) |
| Education, Arts & Media | 100 (28.2%) | 255 (71.8%) |
| Legal Services & Support | 33 (36.7%) | 57 (63.3%) |
| Education Instruction & Library | 235 (26.9%) | 639 (73.1%) |
| Arts, Media & Entertainment | 80 (71.4%) | 32 (28.6%) |
| Health Diagnosing & Treating | 127 (30.8%) | 285 (69.2%) |
| Health Technologists | 116 (42.2%) | 159 (57.8%) |
| Total (Category) | 1,498 (45.9%) | 1,769 (54.1%) |
| Total (Overall) | 3,735 (47.1%) | 4,201 (52.9%) |
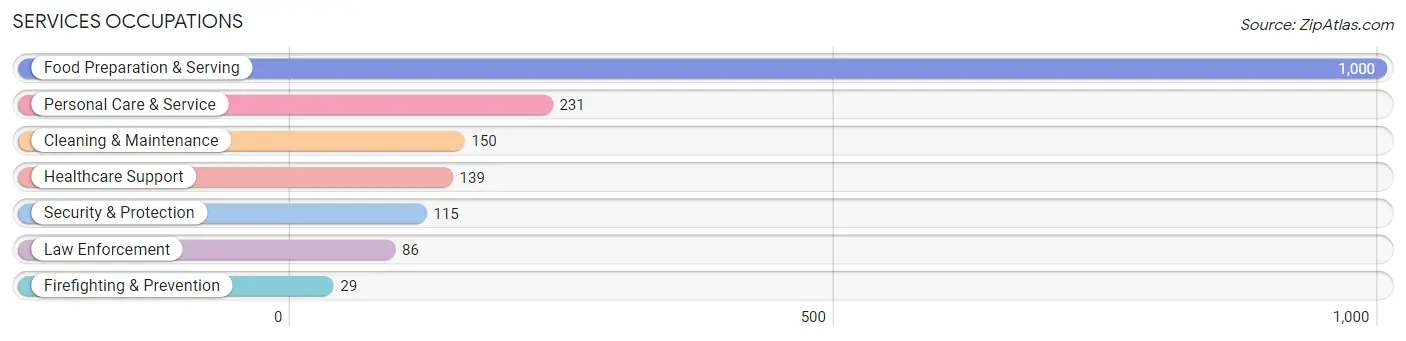
Services Occupations
The most common Services occupations in Radford city are Food Preparation & Serving (1,000 | 12.6%), Personal Care & Service (231 | 2.9%), Cleaning & Maintenance (150 | 1.9%), Healthcare Support (139 | 1.8%), and Security & Protection (115 | 1.5%).
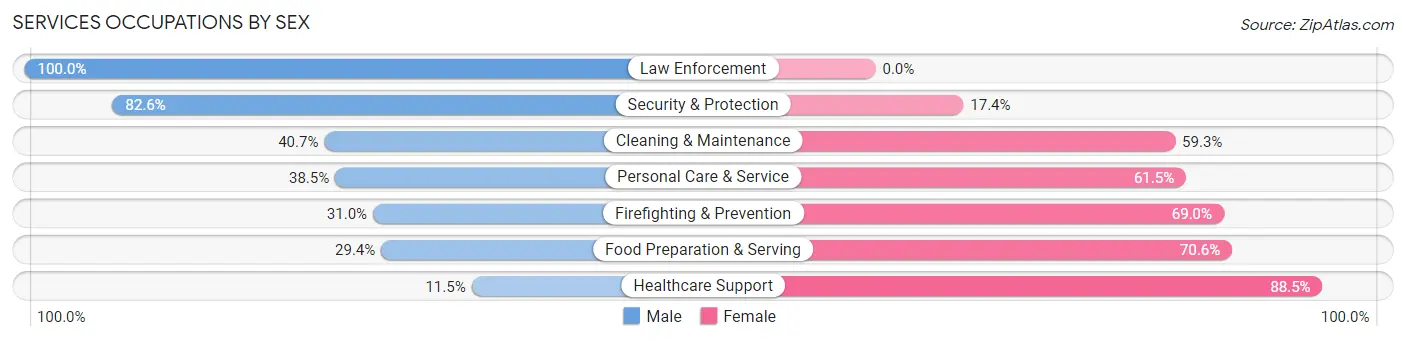
Services Occupations by Sex
Within the Services occupations in Radford city, the most male-oriented occupations are Law Enforcement (100.0%), Security & Protection (82.6%), and Cleaning & Maintenance (40.7%), while the most female-oriented occupations are Healthcare Support (88.5%), Food Preparation & Serving (70.6%), and Firefighting & Prevention (69.0%).
| Occupation | Male | Female |
| Healthcare Support | 16 (11.5%) | 123 (88.5%) |
| Security & Protection | 95 (82.6%) | 20 (17.4%) |
| Firefighting & Prevention | 9 (31.0%) | 20 (69.0%) |
| Law Enforcement | 86 (100.0%) | 0 (0.0%) |
| Food Preparation & Serving | 294 (29.4%) | 706 (70.6%) |
| Cleaning & Maintenance | 61 (40.7%) | 89 (59.3%) |
| Personal Care & Service | 89 (38.5%) | 142 (61.5%) |
| Total (Category) | 555 (33.9%) | 1,080 (66.1%) |
| Total (Overall) | 3,735 (47.1%) | 4,201 (52.9%) |
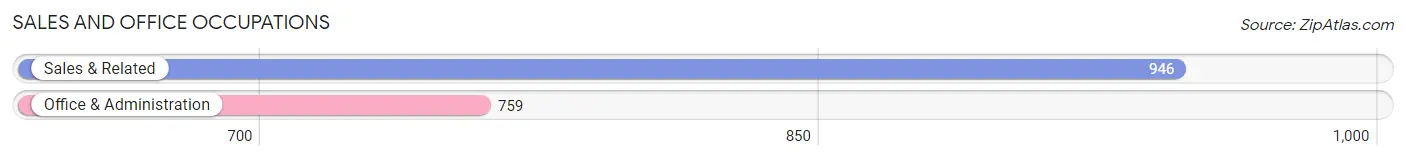
Sales and Office Occupations
The most common Sales and Office occupations in Radford city are Sales & Related (946 | 11.9%), and Office & Administration (759 | 9.6%).
Sales and Office Occupations by Sex
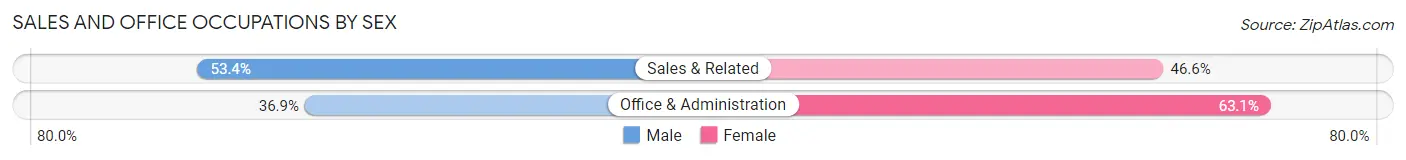
| Occupation | Male | Female |
| Sales & Related | 505 (53.4%) | 441 (46.6%) |
| Office & Administration | 280 (36.9%) | 479 (63.1%) |
| Total (Category) | 785 (46.0%) | 920 (54.0%) |
| Total (Overall) | 3,735 (47.1%) | 4,201 (52.9%) |
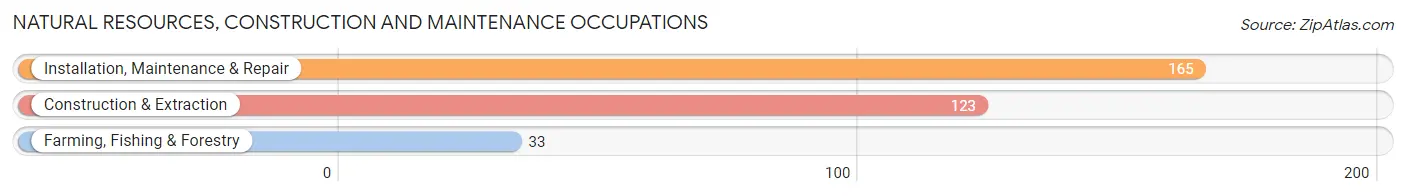
Natural Resources, Construction and Maintenance Occupations
The most common Natural Resources, Construction and Maintenance occupations in Radford city are Installation, Maintenance & Repair (165 | 2.1%), Construction & Extraction (123 | 1.5%), and Farming, Fishing & Forestry (33 | 0.4%).
Natural Resources, Construction and Maintenance Occupations by Sex

| Occupation | Male | Female |
| Farming, Fishing & Forestry | 7 (21.2%) | 26 (78.8%) |
| Construction & Extraction | 118 (95.9%) | 5 (4.1%) |
| Installation, Maintenance & Repair | 155 (93.9%) | 10 (6.1%) |
| Total (Category) | 280 (87.2%) | 41 (12.8%) |
| Total (Overall) | 3,735 (47.1%) | 4,201 (52.9%) |
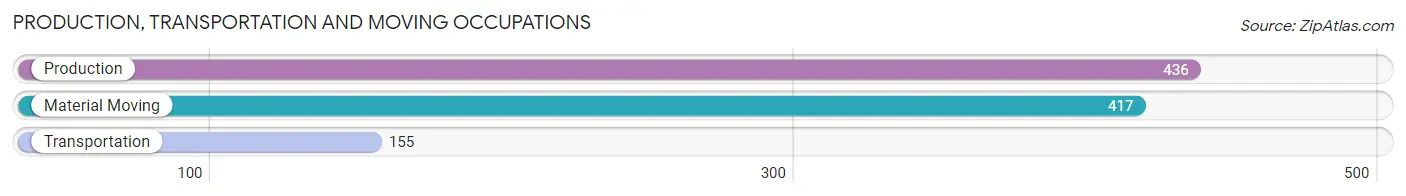
Production, Transportation and Moving Occupations
The most common Production, Transportation and Moving occupations in Radford city are Production (436 | 5.5%), Material Moving (417 | 5.2%), and Transportation (155 | 1.9%).
Production, Transportation and Moving Occupations by Sex
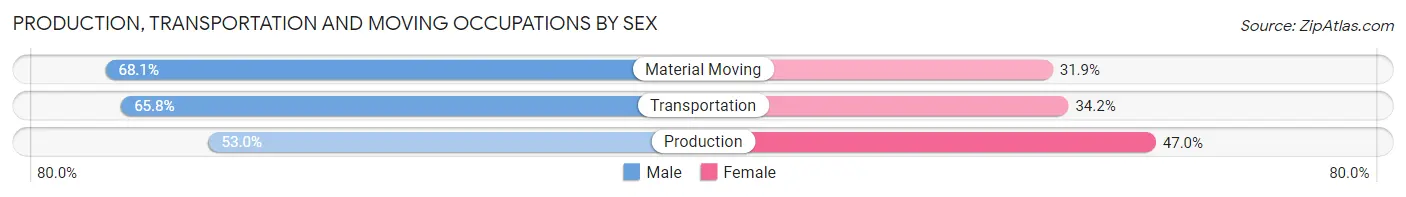
| Occupation | Male | Female |
| Production | 231 (53.0%) | 205 (47.0%) |
| Transportation | 102 (65.8%) | 53 (34.2%) |
| Material Moving | 284 (68.1%) | 133 (31.9%) |
| Total (Category) | 617 (61.2%) | 391 (38.8%) |
| Total (Overall) | 3,735 (47.1%) | 4,201 (52.9%) |
Employment Industries by Sex in Radford city
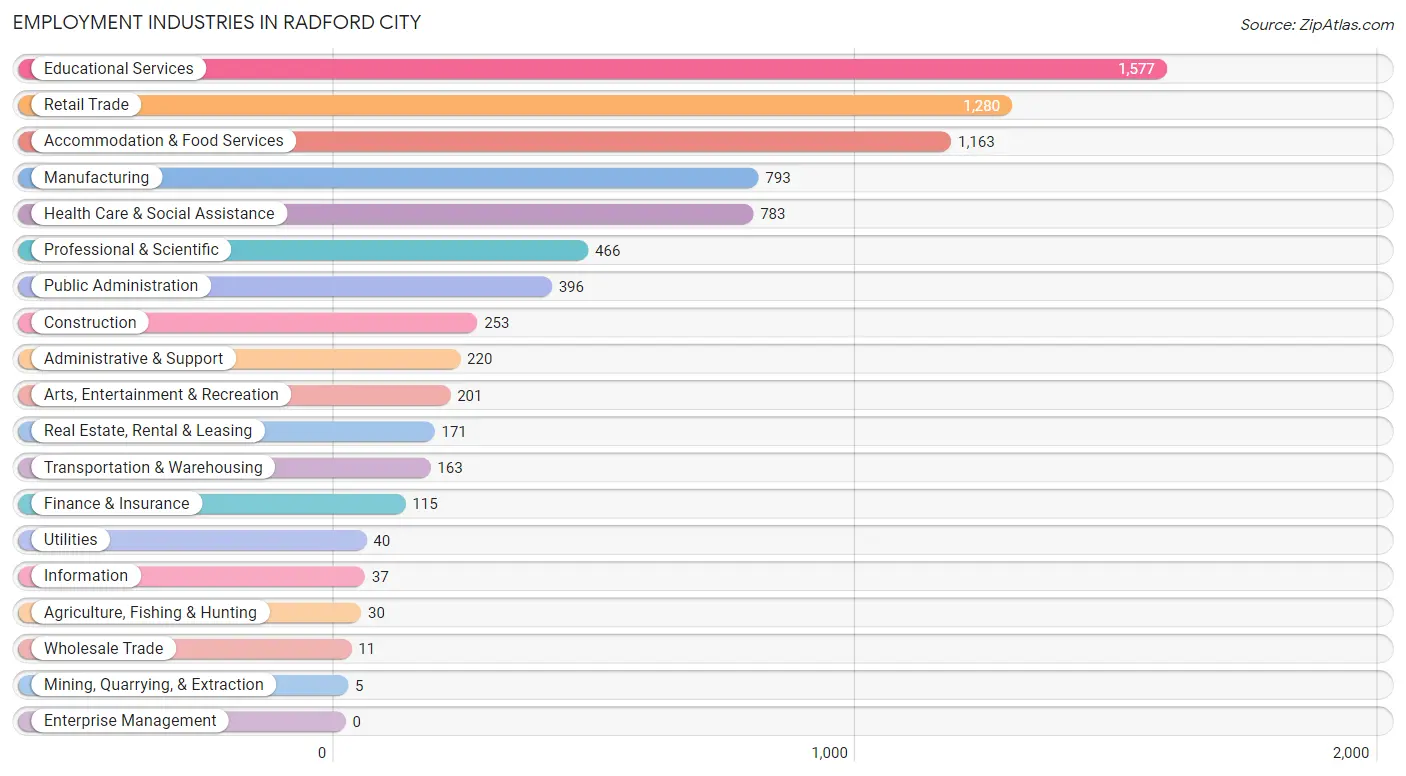
Employment Industries in Radford city
The major employment industries in Radford city include Educational Services (1,577 | 19.9%), Retail Trade (1,280 | 16.1%), Accommodation & Food Services (1,163 | 14.6%), Manufacturing (793 | 10.0%), and Health Care & Social Assistance (783 | 9.9%).
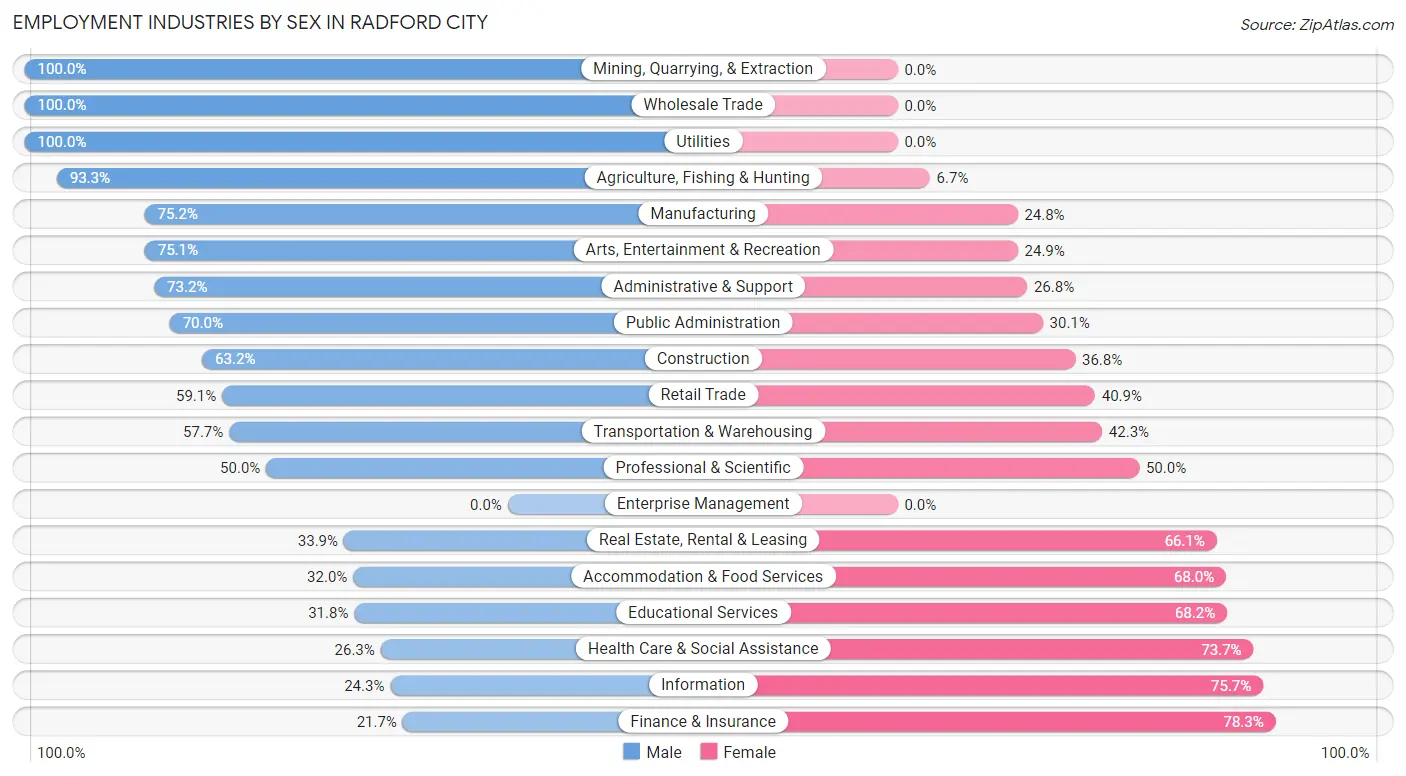
Employment Industries by Sex in Radford city
The Radford city industries that see more men than women are Mining, Quarrying, & Extraction (100.0%), Wholesale Trade (100.0%), and Utilities (100.0%), whereas the industries that tend to have a higher number of women are Finance & Insurance (78.3%), Information (75.7%), and Health Care & Social Assistance (73.7%).
| Industry | Male | Female |
| Agriculture, Fishing & Hunting | 28 (93.3%) | 2 (6.7%) |
| Mining, Quarrying, & Extraction | 5 (100.0%) | 0 (0.0%) |
| Construction | 160 (63.2%) | 93 (36.8%) |
| Manufacturing | 596 (75.2%) | 197 (24.8%) |
| Wholesale Trade | 11 (100.0%) | 0 (0.0%) |
| Retail Trade | 757 (59.1%) | 523 (40.9%) |
| Transportation & Warehousing | 94 (57.7%) | 69 (42.3%) |
| Utilities | 40 (100.0%) | 0 (0.0%) |
| Information | 9 (24.3%) | 28 (75.7%) |
| Finance & Insurance | 25 (21.7%) | 90 (78.3%) |
| Real Estate, Rental & Leasing | 58 (33.9%) | 113 (66.1%) |
| Professional & Scientific | 233 (50.0%) | 233 (50.0%) |
| Enterprise Management | 0 (0.0%) | 0 (0.0%) |
| Administrative & Support | 161 (73.2%) | 59 (26.8%) |
| Educational Services | 501 (31.8%) | 1,076 (68.2%) |
| Health Care & Social Assistance | 206 (26.3%) | 577 (73.7%) |
| Arts, Entertainment & Recreation | 151 (75.1%) | 50 (24.9%) |
| Accommodation & Food Services | 372 (32.0%) | 791 (68.0%) |
| Public Administration | 277 (70.0%) | 119 (30.0%) |
| Total | 3,735 (47.1%) | 4,201 (52.9%) |
Education in Radford city
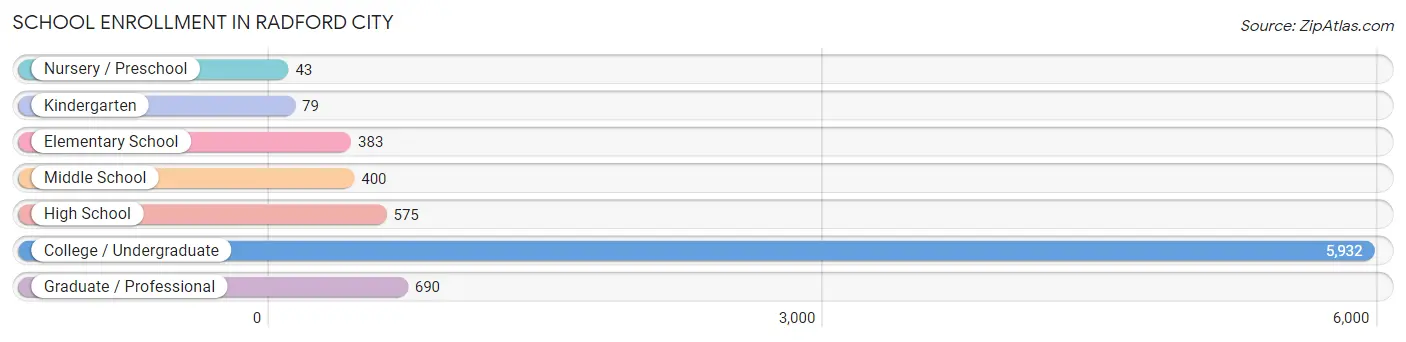
School Enrollment in Radford city
The most common levels of schooling among the 8,102 students in Radford city are college / undergraduate (5,932 | 73.2%), graduate / professional (690 | 8.5%), and high school (575 | 7.1%).
| School Level | # Students | % Students |
| Nursery / Preschool | 43 | 0.5% |
| Kindergarten | 79 | 1.0% |
| Elementary School | 383 | 4.7% |
| Middle School | 400 | 4.9% |
| High School | 575 | 7.1% |
| College / Undergraduate | 5,932 | 73.2% |
| Graduate / Professional | 690 | 8.5% |
| Total | 8,102 | 100.0% |
School Enrollment by Age by Funding Source in Radford city
Out of a total of 8,102 students who are enrolled in schools in Radford city, 932 (11.5%) attend a private institution, while the remaining 7,170 (88.5%) are enrolled in public schools. The age group of 3 to 4 year olds has the highest likelihood of being enrolled in private schools, with 34 (100.0% in the age bracket) enrolled. Conversely, the age group of 15 to 17 year olds has the lowest likelihood of being enrolled in a private school, with 286 (100.0% in the age bracket) attending a public institution.
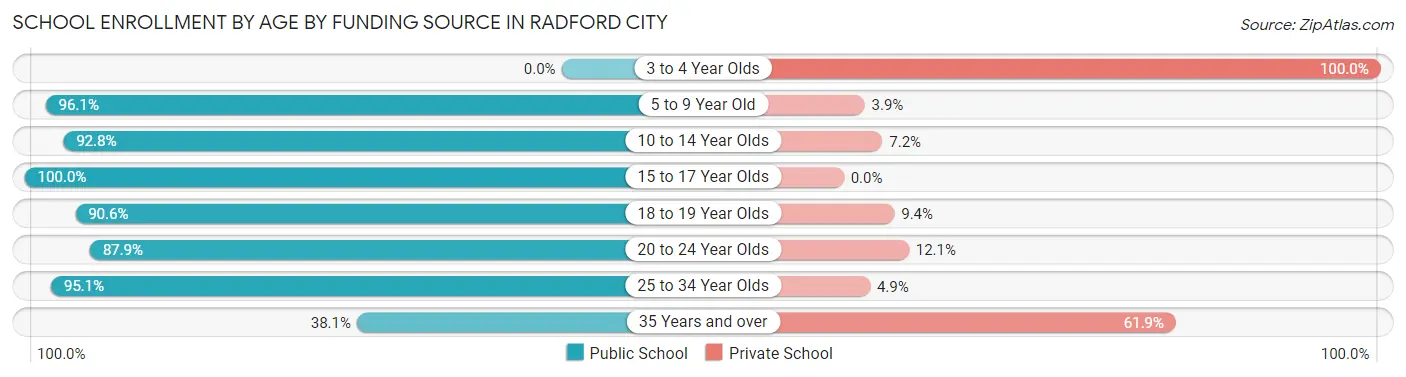
| Age Bracket | Public School | Private School |
| 3 to 4 Year Olds | 0 (0.0%) | 34 (100.0%) |
| 5 to 9 Year Old | 394 (96.1%) | 16 (3.9%) |
| 10 to 14 Year Olds | 464 (92.8%) | 36 (7.2%) |
| 15 to 17 Year Olds | 286 (100.0%) | 0 (0.0%) |
| 18 to 19 Year Olds | 2,467 (90.6%) | 257 (9.4%) |
| 20 to 24 Year Olds | 2,898 (87.9%) | 400 (12.1%) |
| 25 to 34 Year Olds | 564 (95.1%) | 29 (4.9%) |
| 35 Years and over | 98 (38.1%) | 159 (61.9%) |
| Total | 7,170 (88.5%) | 932 (11.5%) |
Educational Attainment by Field of Study in Radford city
Education (503 | 13.9%), arts & humanities (447 | 12.3%), business (418 | 11.5%), science & technology (384 | 10.6%), and psychology (319 | 8.8%) are the most common fields of study among 3,621 individuals in Radford city who have obtained a bachelor's degree or higher.
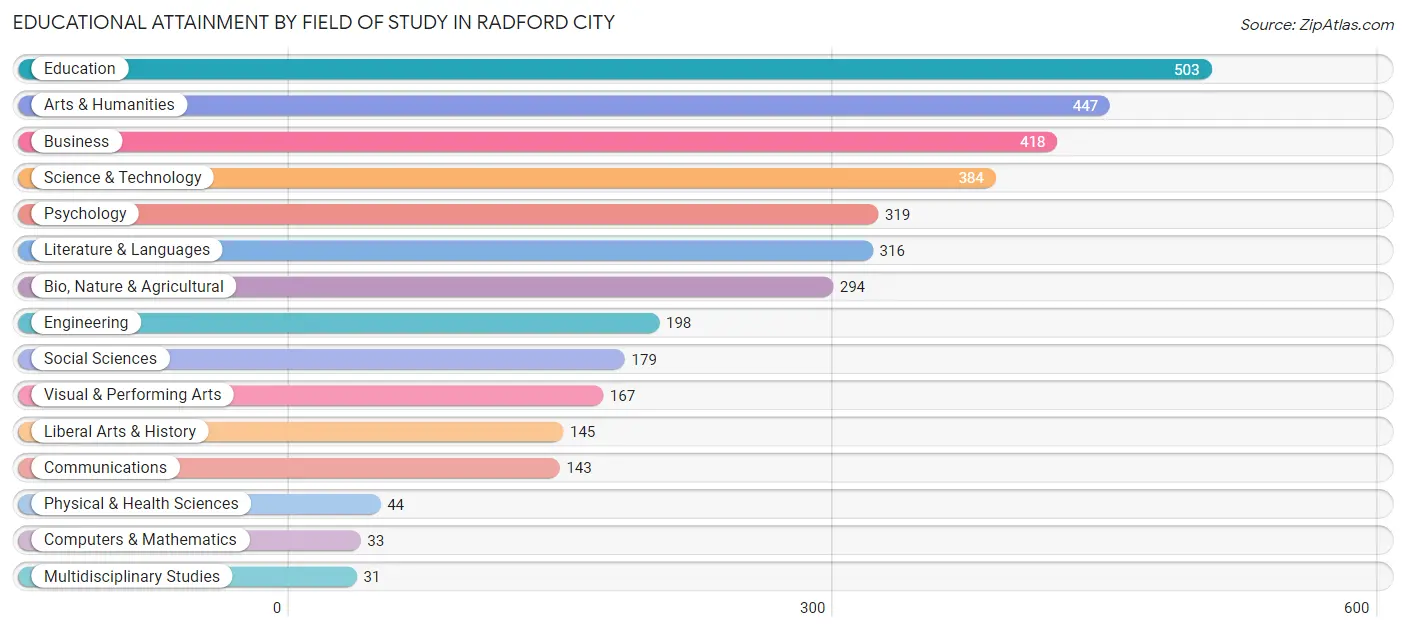
| Field of Study | # Graduates | % Graduates |
| Computers & Mathematics | 33 | 0.9% |
| Bio, Nature & Agricultural | 294 | 8.1% |
| Physical & Health Sciences | 44 | 1.2% |
| Psychology | 319 | 8.8% |
| Social Sciences | 179 | 4.9% |
| Engineering | 198 | 5.5% |
| Multidisciplinary Studies | 31 | 0.9% |
| Science & Technology | 384 | 10.6% |
| Business | 418 | 11.5% |
| Education | 503 | 13.9% |
| Literature & Languages | 316 | 8.7% |
| Liberal Arts & History | 145 | 4.0% |
| Visual & Performing Arts | 167 | 4.6% |
| Communications | 143 | 4.0% |
| Arts & Humanities | 447 | 12.3% |
| Total | 3,621 | 100.0% |
Transportation & Commute in Radford city
Vehicle Availability by Sex in Radford city
The most prevalent vehicle ownership categories in Radford city are males with 2 vehicles (1,305, accounting for 39.9%) and females with 2 vehicles (1,715, making up 36.4%).
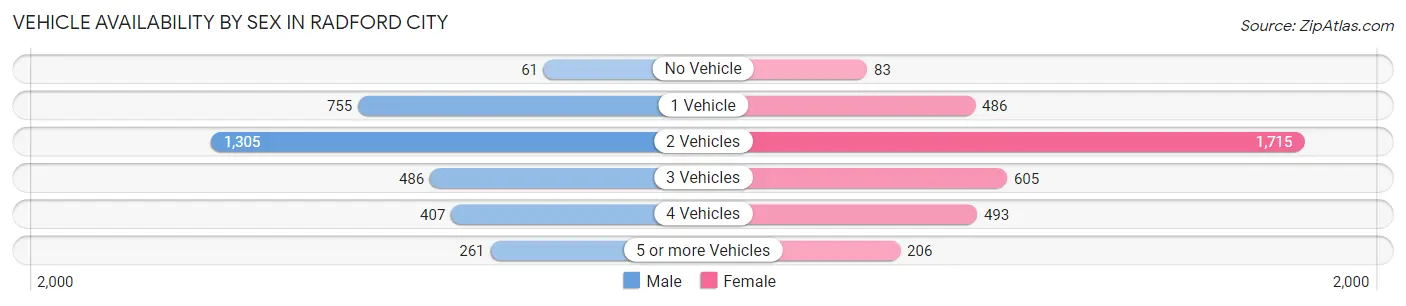
| Vehicles Available | Male | Female |
| No Vehicle | 61 (1.9%) | 83 (2.3%) |
| 1 Vehicle | 755 (23.1%) | 486 (13.6%) |
| 2 Vehicles | 1,305 (39.9%) | 1,715 (47.8%) |
| 3 Vehicles | 486 (14.8%) | 605 (16.9%) |
| 4 Vehicles | 407 (12.4%) | 493 (13.7%) |
| 5 or more Vehicles | 261 (8.0%) | 206 (5.7%) |
| Total | 3,275 (100.0%) | 3,588 (100.0%) |
Commute Time in Radford city
The most frequently occuring commute durations in Radford city are 5 to 9 minutes (1,831 commuters, 24.7%), 15 to 19 minutes (1,255 commuters, 16.9%), and 10 to 14 minutes (1,139 commuters, 15.3%).
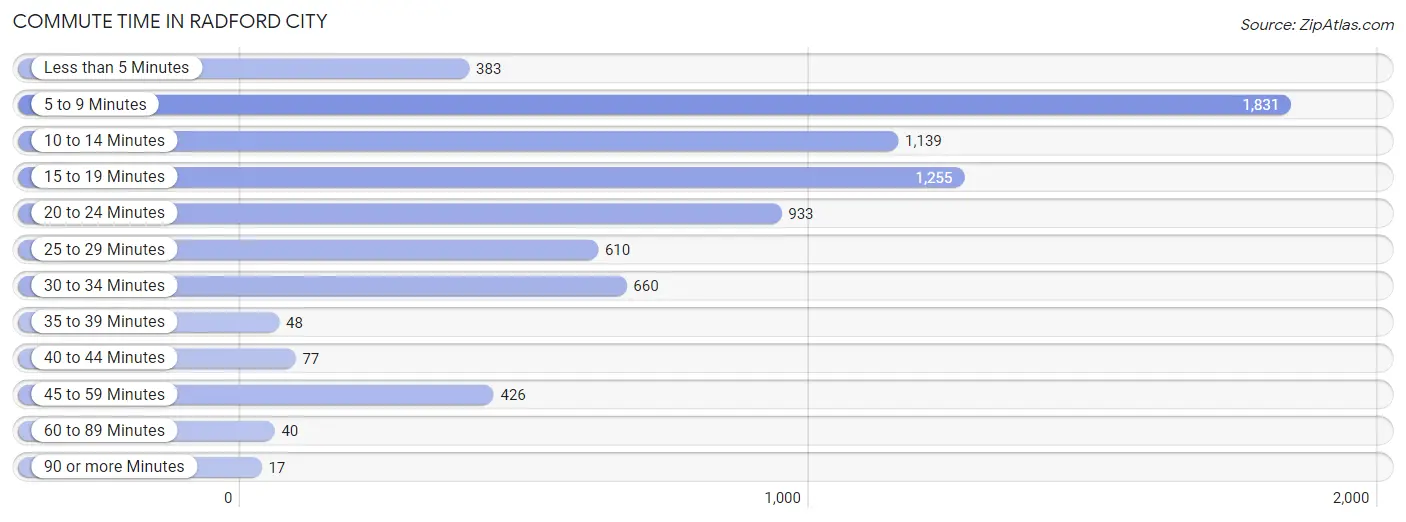
| Commute Time | # Commuters | % Commuters |
| Less than 5 Minutes | 383 | 5.2% |
| 5 to 9 Minutes | 1,831 | 24.7% |
| 10 to 14 Minutes | 1,139 | 15.3% |
| 15 to 19 Minutes | 1,255 | 16.9% |
| 20 to 24 Minutes | 933 | 12.6% |
| 25 to 29 Minutes | 610 | 8.2% |
| 30 to 34 Minutes | 660 | 8.9% |
| 35 to 39 Minutes | 48 | 0.6% |
| 40 to 44 Minutes | 77 | 1.0% |
| 45 to 59 Minutes | 426 | 5.7% |
| 60 to 89 Minutes | 40 | 0.5% |
| 90 or more Minutes | 17 | 0.2% |
Commute Time by Sex in Radford city
The most common commute times in Radford city are 15 to 19 minutes (686 commuters, 19.5%) for males and 5 to 9 minutes (1,222 commuters, 31.3%) for females.
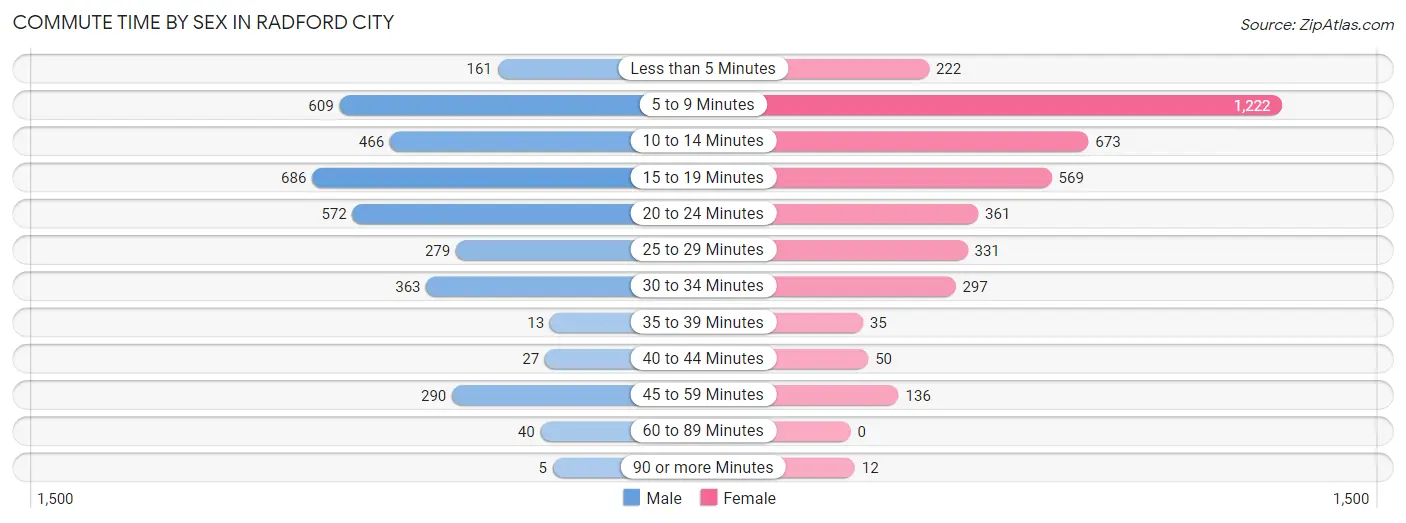
| Commute Time | Male | Female |
| Less than 5 Minutes | 161 (4.6%) | 222 (5.7%) |
| 5 to 9 Minutes | 609 (17.3%) | 1,222 (31.3%) |
| 10 to 14 Minutes | 466 (13.3%) | 673 (17.2%) |
| 15 to 19 Minutes | 686 (19.5%) | 569 (14.6%) |
| 20 to 24 Minutes | 572 (16.3%) | 361 (9.2%) |
| 25 to 29 Minutes | 279 (8.0%) | 331 (8.5%) |
| 30 to 34 Minutes | 363 (10.3%) | 297 (7.6%) |
| 35 to 39 Minutes | 13 (0.4%) | 35 (0.9%) |
| 40 to 44 Minutes | 27 (0.8%) | 50 (1.3%) |
| 45 to 59 Minutes | 290 (8.3%) | 136 (3.5%) |
| 60 to 89 Minutes | 40 (1.1%) | 0 (0.0%) |
| 90 or more Minutes | 5 (0.1%) | 12 (0.3%) |
Time of Departure to Work by Sex in Radford city
The most frequent times of departure to work in Radford city are 8:00 AM to 8:29 AM (458, 13.0%) for males and 12:00 PM to 3:59 PM (635, 16.3%) for females.
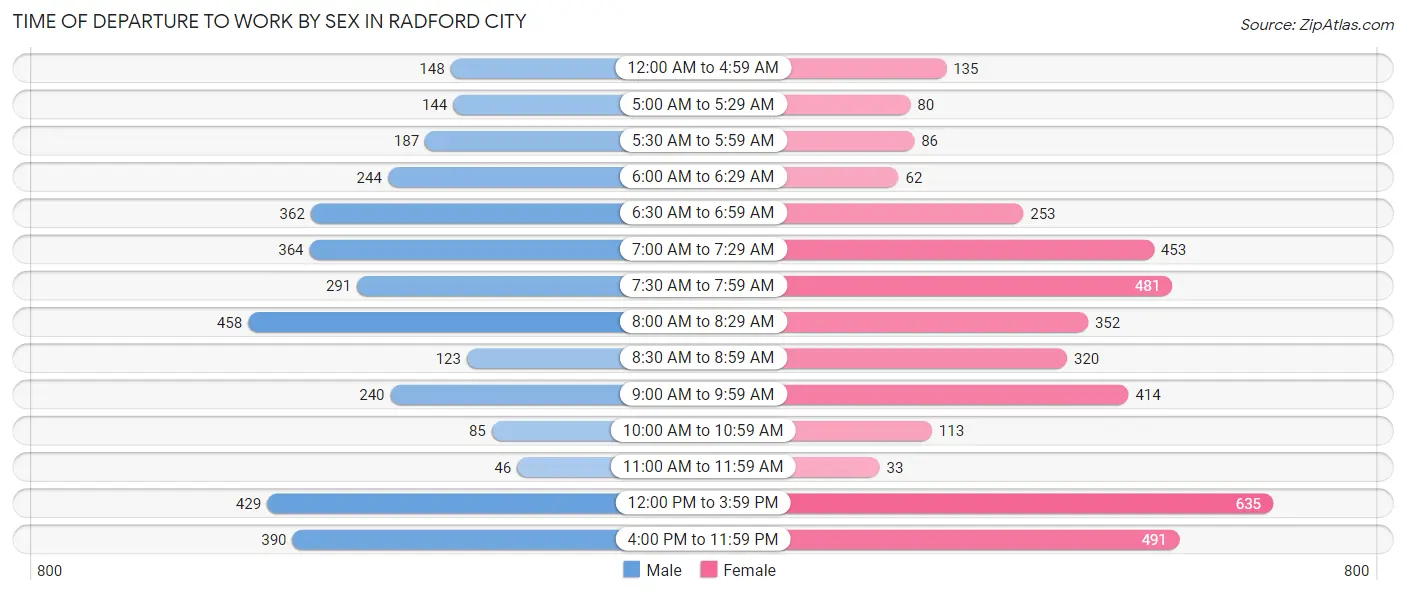
| Time of Departure | Male | Female |
| 12:00 AM to 4:59 AM | 148 (4.2%) | 135 (3.5%) |
| 5:00 AM to 5:29 AM | 144 (4.1%) | 80 (2.1%) |
| 5:30 AM to 5:59 AM | 187 (5.3%) | 86 (2.2%) |
| 6:00 AM to 6:29 AM | 244 (7.0%) | 62 (1.6%) |
| 6:30 AM to 6:59 AM | 362 (10.3%) | 253 (6.5%) |
| 7:00 AM to 7:29 AM | 364 (10.4%) | 453 (11.6%) |
| 7:30 AM to 7:59 AM | 291 (8.3%) | 481 (12.3%) |
| 8:00 AM to 8:29 AM | 458 (13.0%) | 352 (9.0%) |
| 8:30 AM to 8:59 AM | 123 (3.5%) | 320 (8.2%) |
| 9:00 AM to 9:59 AM | 240 (6.8%) | 414 (10.6%) |
| 10:00 AM to 10:59 AM | 85 (2.4%) | 113 (2.9%) |
| 11:00 AM to 11:59 AM | 46 (1.3%) | 33 (0.8%) |
| 12:00 PM to 3:59 PM | 429 (12.2%) | 635 (16.3%) |
| 4:00 PM to 11:59 PM | 390 (11.1%) | 491 (12.6%) |
| Total | 3,511 (100.0%) | 3,908 (100.0%) |
Housing Occupancy in Radford city
Occupancy by Ownership in Radford city
Of the total 5,467 dwellings in Radford city, owner-occupied units account for 2,500 (45.7%), while renter-occupied units make up 2,967 (54.3%).
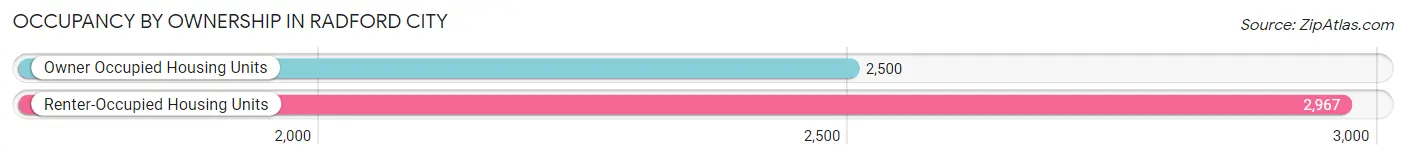
| Occupancy | # Housing Units | % Housing Units |
| Owner Occupied Housing Units | 2,500 | 45.7% |
| Renter-Occupied Housing Units | 2,967 | 54.3% |
| Total Occupied Housing Units | 5,467 | 100.0% |
Occupancy by Household Size in Radford city
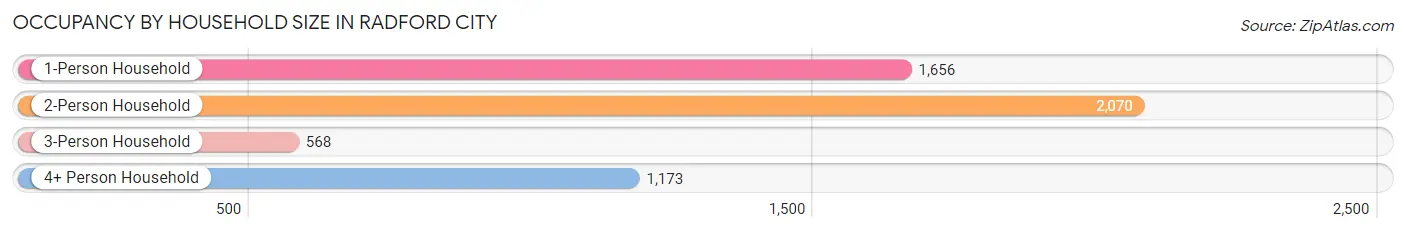
| Household Size | # Housing Units | % Housing Units |
| 1-Person Household | 1,656 | 30.3% |
| 2-Person Household | 2,070 | 37.9% |
| 3-Person Household | 568 | 10.4% |
| 4+ Person Household | 1,173 | 21.5% |
| Total Housing Units | 5,467 | 100.0% |
Occupancy by Ownership by Household Size in Radford city
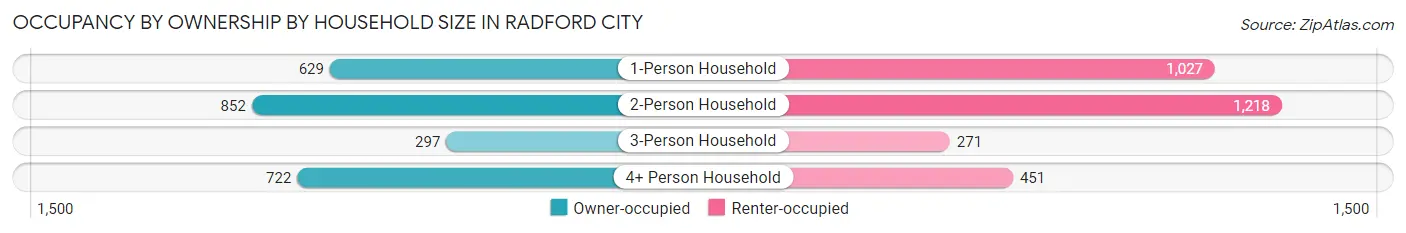
| Household Size | Owner-occupied | Renter-occupied |
| 1-Person Household | 629 (38.0%) | 1,027 (62.0%) |
| 2-Person Household | 852 (41.2%) | 1,218 (58.8%) |
| 3-Person Household | 297 (52.3%) | 271 (47.7%) |
| 4+ Person Household | 722 (61.6%) | 451 (38.5%) |
| Total Housing Units | 2,500 (45.7%) | 2,967 (54.3%) |
Occupancy by Educational Attainment in Radford city
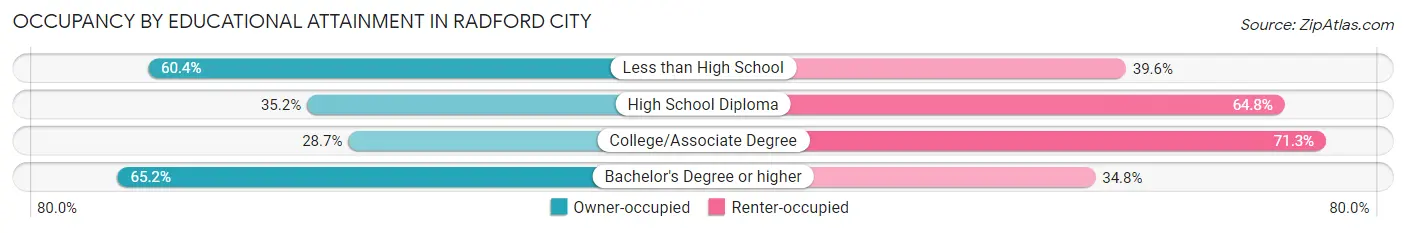
| Household Size | Owner-occupied | Renter-occupied |
| Less than High School | 148 (60.4%) | 97 (39.6%) |
| High School Diploma | 269 (35.2%) | 495 (64.8%) |
| College/Associate Degree | 647 (28.7%) | 1,610 (71.3%) |
| Bachelor's Degree or higher | 1,436 (65.2%) | 765 (34.8%) |
Occupancy by Age of Householder in Radford city
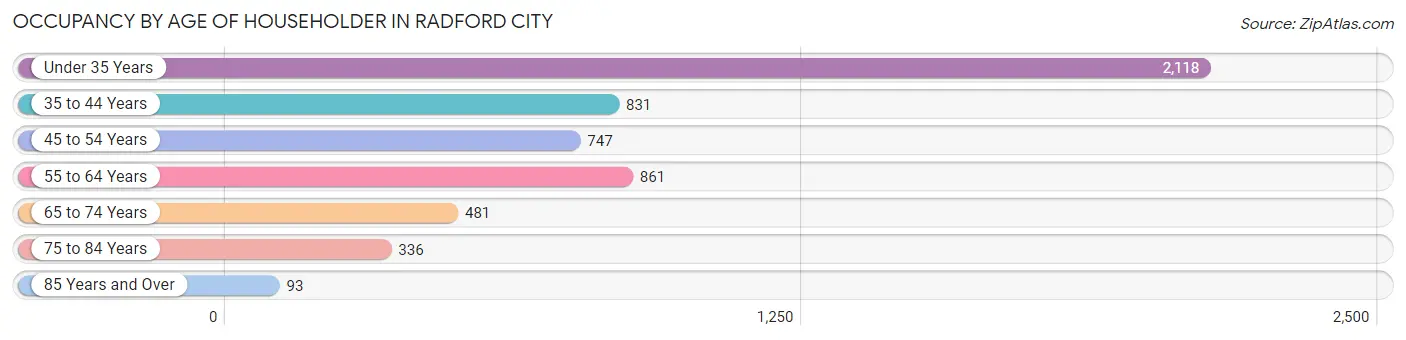
| Age Bracket | # Households | % Households |
| Under 35 Years | 2,118 | 38.7% |
| 35 to 44 Years | 831 | 15.2% |
| 45 to 54 Years | 747 | 13.7% |
| 55 to 64 Years | 861 | 15.8% |
| 65 to 74 Years | 481 | 8.8% |
| 75 to 84 Years | 336 | 6.1% |
| 85 Years and Over | 93 | 1.7% |
| Total | 5,467 | 100.0% |
Housing Finances in Radford city
Median Income by Occupancy in Radford city
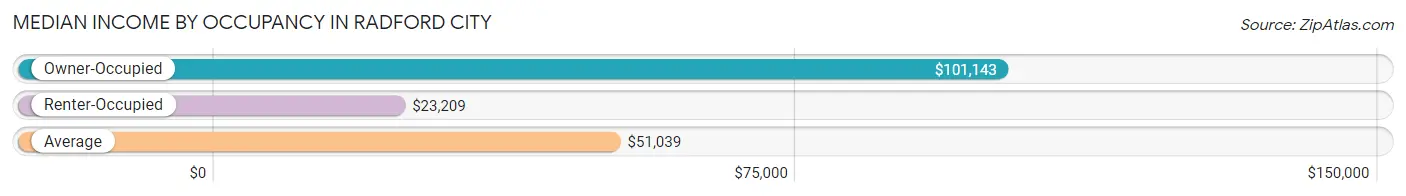
| Occupancy Type | # Households | Median Income |
| Owner-Occupied | 2,500 (45.7%) | $101,143 |
| Renter-Occupied | 2,967 (54.3%) | $23,209 |
| Average | 5,467 (100.0%) | $51,039 |
Occupancy by Householder Income Bracket in Radford city
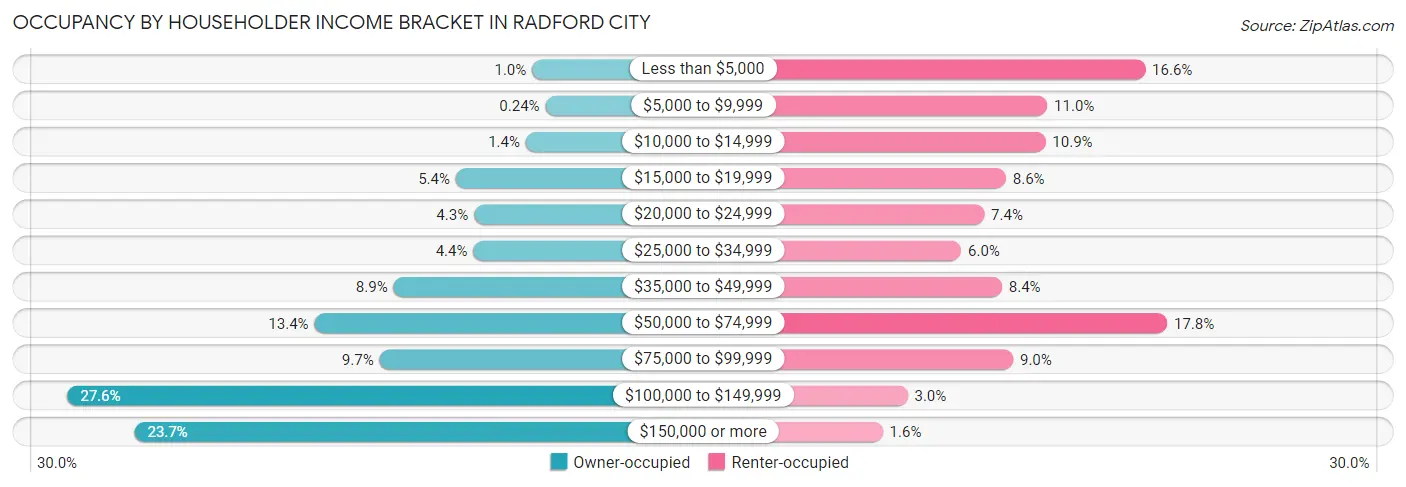
| Income Bracket | Owner-occupied | Renter-occupied |
| Less than $5,000 | 25 (1.0%) | 491 (16.6%) |
| $5,000 to $9,999 | 6 (0.2%) | 325 (11.0%) |
| $10,000 to $14,999 | 34 (1.4%) | 322 (10.8%) |
| $15,000 to $19,999 | 134 (5.4%) | 255 (8.6%) |
| $20,000 to $24,999 | 108 (4.3%) | 218 (7.3%) |
| $25,000 to $34,999 | 109 (4.4%) | 179 (6.0%) |
| $35,000 to $49,999 | 223 (8.9%) | 248 (8.4%) |
| $50,000 to $74,999 | 336 (13.4%) | 528 (17.8%) |
| $75,000 to $99,999 | 243 (9.7%) | 267 (9.0%) |
| $100,000 to $149,999 | 689 (27.6%) | 88 (3.0%) |
| $150,000 or more | 593 (23.7%) | 46 (1.5%) |
| Total | 2,500 (100.0%) | 2,967 (100.0%) |
Monthly Housing Cost Tiers in Radford city
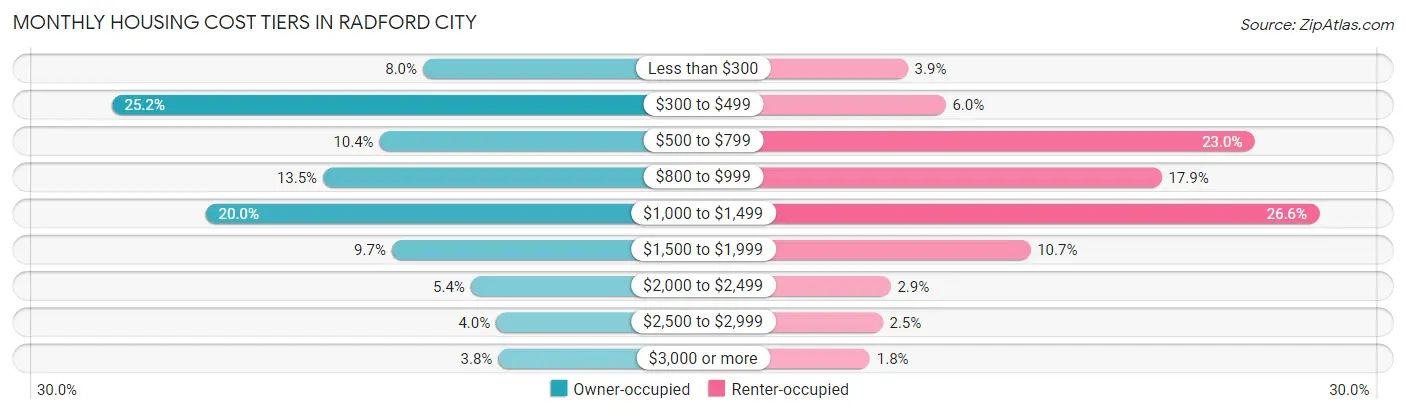
| Monthly Cost | Owner-occupied | Renter-occupied |
| Less than $300 | 200 (8.0%) | 115 (3.9%) |
| $300 to $499 | 630 (25.2%) | 177 (6.0%) |
| $500 to $799 | 260 (10.4%) | 683 (23.0%) |
| $800 to $999 | 338 (13.5%) | 531 (17.9%) |
| $1,000 to $1,499 | 500 (20.0%) | 789 (26.6%) |
| $1,500 to $1,999 | 243 (9.7%) | 316 (10.6%) |
| $2,000 to $2,499 | 134 (5.4%) | 87 (2.9%) |
| $2,500 to $2,999 | 99 (4.0%) | 74 (2.5%) |
| $3,000 or more | 96 (3.8%) | 53 (1.8%) |
| Total | 2,500 (100.0%) | 2,967 (100.0%) |
Physical Housing Characteristics in Radford city
Housing Structures in Radford city
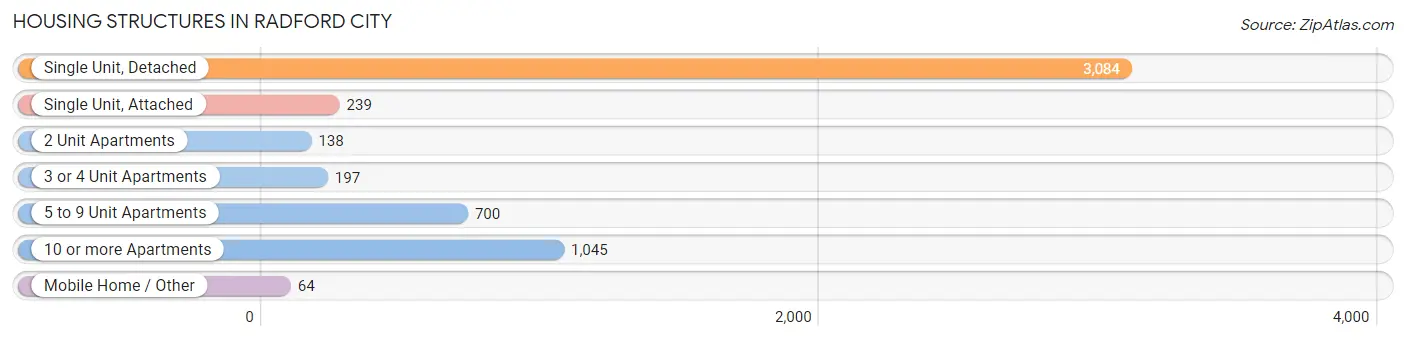
| Structure Type | # Housing Units | % Housing Units |
| Single Unit, Detached | 3,084 | 56.4% |
| Single Unit, Attached | 239 | 4.4% |
| 2 Unit Apartments | 138 | 2.5% |
| 3 or 4 Unit Apartments | 197 | 3.6% |
| 5 to 9 Unit Apartments | 700 | 12.8% |
| 10 or more Apartments | 1,045 | 19.1% |
| Mobile Home / Other | 64 | 1.2% |
| Total | 5,467 | 100.0% |
Housing Structures by Occupancy in Radford city
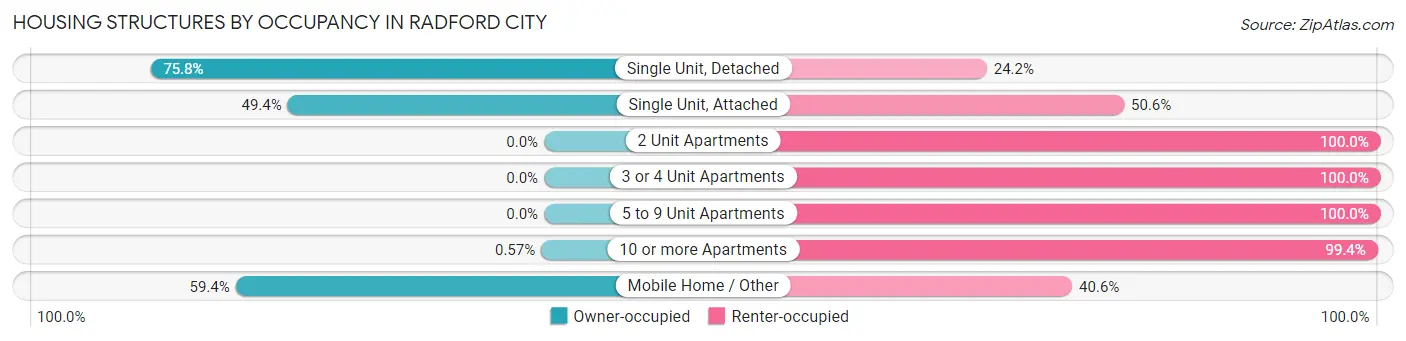
| Structure Type | Owner-occupied | Renter-occupied |
| Single Unit, Detached | 2,338 (75.8%) | 746 (24.2%) |
| Single Unit, Attached | 118 (49.4%) | 121 (50.6%) |
| 2 Unit Apartments | 0 (0.0%) | 138 (100.0%) |
| 3 or 4 Unit Apartments | 0 (0.0%) | 197 (100.0%) |
| 5 to 9 Unit Apartments | 0 (0.0%) | 700 (100.0%) |
| 10 or more Apartments | 6 (0.6%) | 1,039 (99.4%) |
| Mobile Home / Other | 38 (59.4%) | 26 (40.6%) |
| Total | 2,500 (45.7%) | 2,967 (54.3%) |
Housing Structures by Number of Rooms in Radford city
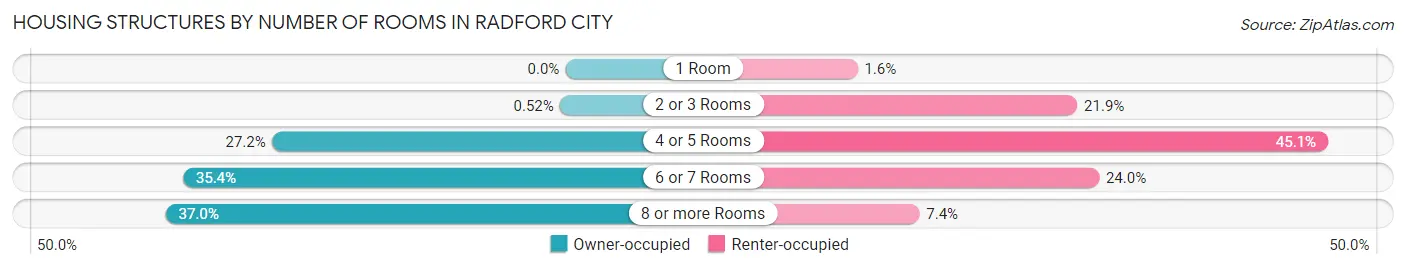
| Number of Rooms | Owner-occupied | Renter-occupied |
| 1 Room | 0 (0.0%) | 48 (1.6%) |
| 2 or 3 Rooms | 13 (0.5%) | 651 (21.9%) |
| 4 or 5 Rooms | 679 (27.2%) | 1,339 (45.1%) |
| 6 or 7 Rooms | 884 (35.4%) | 711 (24.0%) |
| 8 or more Rooms | 924 (37.0%) | 218 (7.3%) |
| Total | 2,500 (100.0%) | 2,967 (100.0%) |
Housing Structure by Heating Type in Radford city
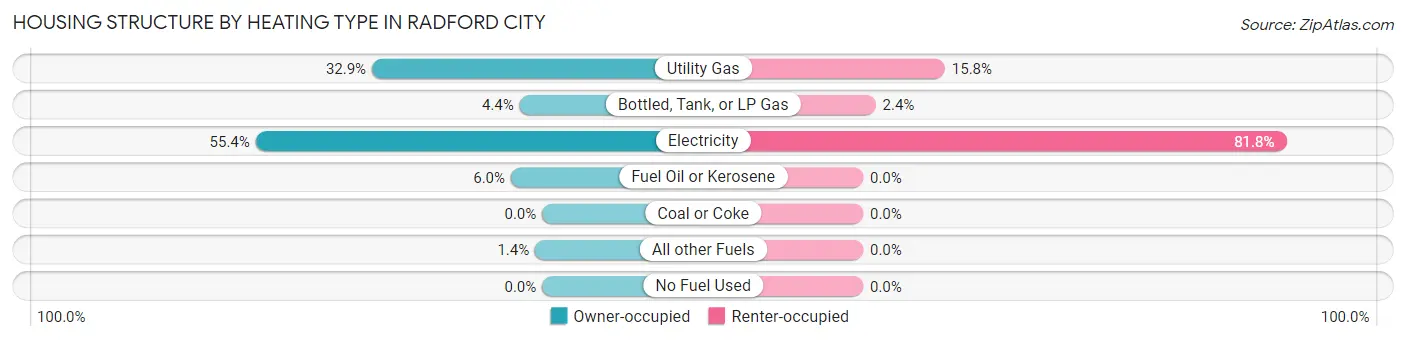
| Heating Type | Owner-occupied | Renter-occupied |
| Utility Gas | 822 (32.9%) | 469 (15.8%) |
| Bottled, Tank, or LP Gas | 109 (4.4%) | 72 (2.4%) |
| Electricity | 1,384 (55.4%) | 2,426 (81.8%) |
| Fuel Oil or Kerosene | 151 (6.0%) | 0 (0.0%) |
| Coal or Coke | 0 (0.0%) | 0 (0.0%) |
| All other Fuels | 34 (1.4%) | 0 (0.0%) |
| No Fuel Used | 0 (0.0%) | 0 (0.0%) |
| Total | 2,500 (100.0%) | 2,967 (100.0%) |
Household Vehicle Usage in Radford city
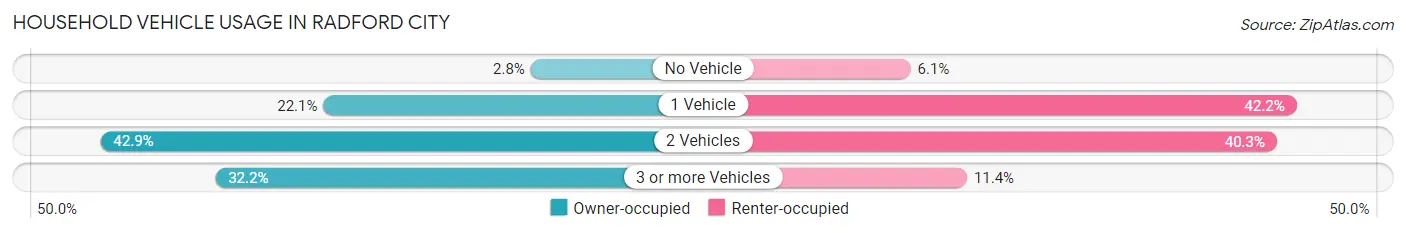
| Vehicles per Household | Owner-occupied | Renter-occupied |
| No Vehicle | 69 (2.8%) | 182 (6.1%) |
| 1 Vehicle | 553 (22.1%) | 1,251 (42.2%) |
| 2 Vehicles | 1,073 (42.9%) | 1,196 (40.3%) |
| 3 or more Vehicles | 805 (32.2%) | 338 (11.4%) |
| Total | 2,500 (100.0%) | 2,967 (100.0%) |
Real Estate & Mortgages in Radford city
Real Estate and Mortgage Overview in Radford city
| Characteristic | Without Mortgage | With Mortgage |
| Housing Units | 1,115 | 1,385 |
| Median Property Value | $183,600 | $219,800 |
| Median Household Income | $69,441 | $352 |
| Monthly Housing Costs | $417 | $96 |
| Real Estate Taxes | $1,380 | $51 |
Property Value by Mortgage Status in Radford city
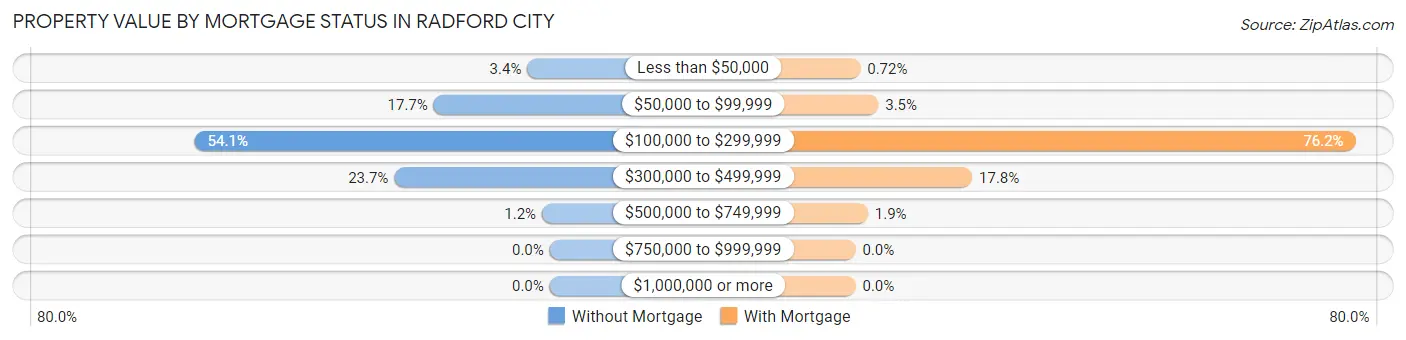
| Property Value | Without Mortgage | With Mortgage |
| Less than $50,000 | 38 (3.4%) | 10 (0.7%) |
| $50,000 to $99,999 | 197 (17.7%) | 48 (3.5%) |
| $100,000 to $299,999 | 603 (54.1%) | 1,055 (76.2%) |
| $300,000 to $499,999 | 264 (23.7%) | 246 (17.8%) |
| $500,000 to $749,999 | 13 (1.2%) | 26 (1.9%) |
| $750,000 to $999,999 | 0 (0.0%) | 0 (0.0%) |
| $1,000,000 or more | 0 (0.0%) | 0 (0.0%) |
| Total | 1,115 (100.0%) | 1,385 (100.0%) |
Household Income by Mortgage Status in Radford city
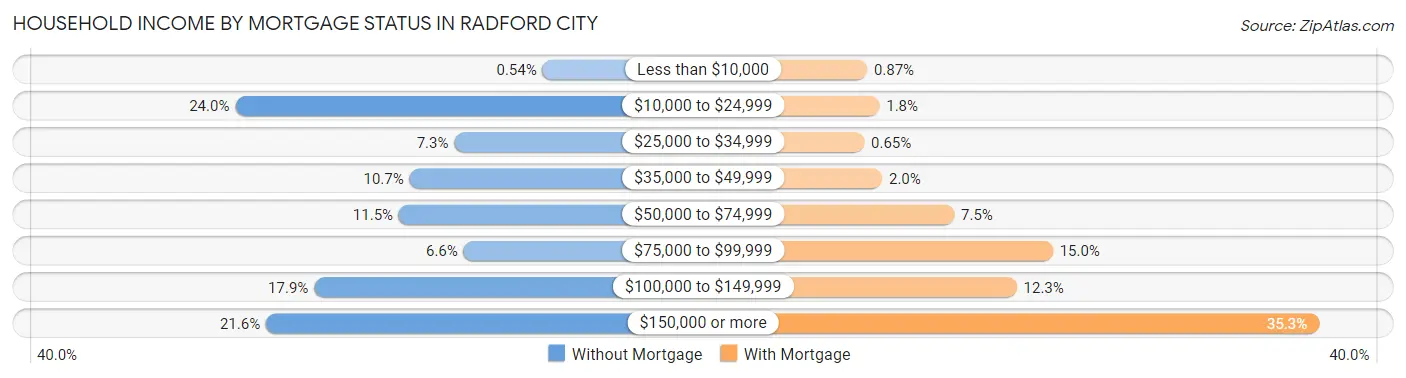
| Household Income | Without Mortgage | With Mortgage |
| Less than $10,000 | 6 (0.5%) | 12 (0.9%) |
| $10,000 to $24,999 | 267 (23.9%) | 25 (1.8%) |
| $25,000 to $34,999 | 81 (7.3%) | 9 (0.6%) |
| $35,000 to $49,999 | 119 (10.7%) | 28 (2.0%) |
| $50,000 to $74,999 | 128 (11.5%) | 104 (7.5%) |
| $75,000 to $99,999 | 73 (6.6%) | 208 (15.0%) |
| $100,000 to $149,999 | 200 (17.9%) | 170 (12.3%) |
| $150,000 or more | 241 (21.6%) | 489 (35.3%) |
| Total | 1,115 (100.0%) | 1,385 (100.0%) |
Property Value to Household Income Ratio in Radford city
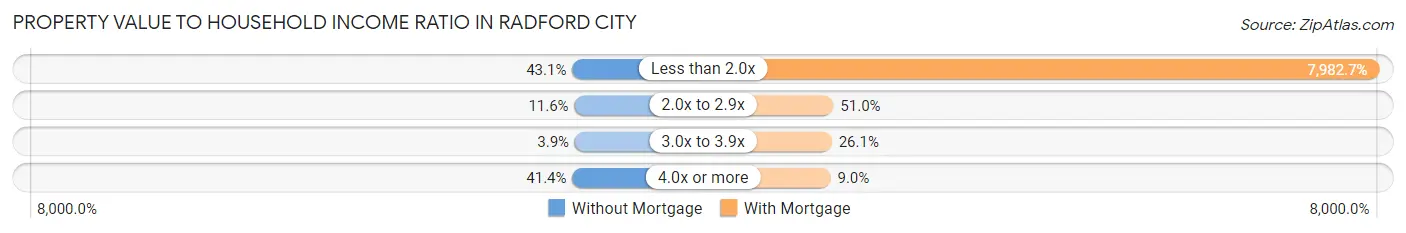
| Value-to-Income Ratio | Without Mortgage | With Mortgage |
| Less than 2.0x | 481 (43.1%) | 110,561 (7,982.7%) |
| 2.0x to 2.9x | 129 (11.6%) | 706 (51.0%) |
| 3.0x to 3.9x | 43 (3.9%) | 362 (26.1%) |
| 4.0x or more | 462 (41.4%) | 124 (8.9%) |
| Total | 1,115 (100.0%) | 1,385 (100.0%) |
Real Estate Taxes by Mortgage Status in Radford city
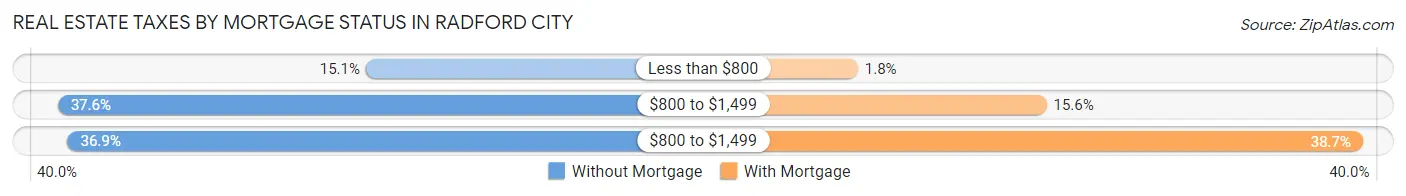
| Property Taxes | Without Mortgage | With Mortgage |
| Less than $800 | 168 (15.1%) | 25 (1.8%) |
| $800 to $1,499 | 419 (37.6%) | 216 (15.6%) |
| $800 to $1,499 | 411 (36.9%) | 536 (38.7%) |
| Total | 1,115 (100.0%) | 1,385 (100.0%) |
Health & Disability in Radford city
Health Insurance Coverage by Age in Radford city
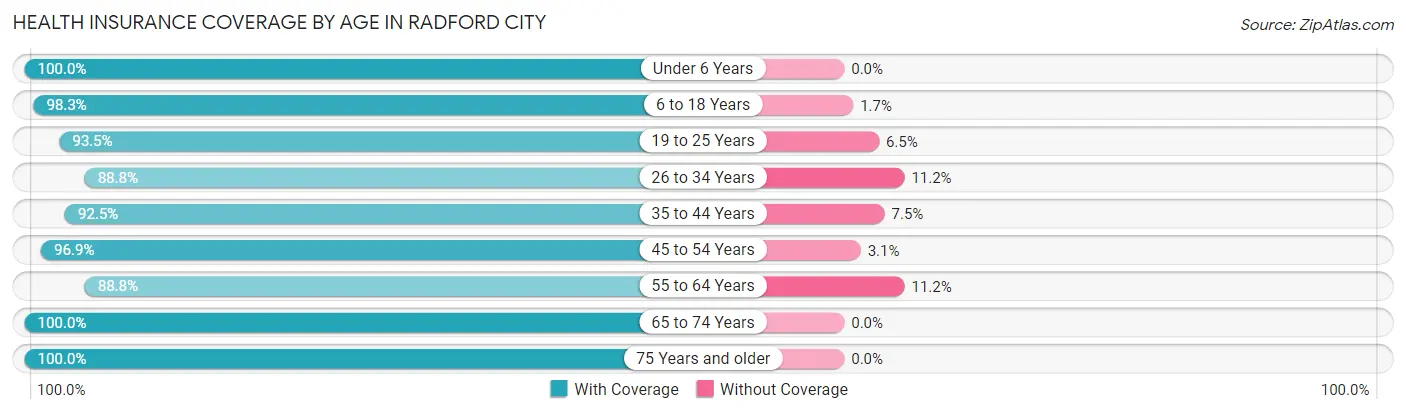
| Age Bracket | With Coverage | Without Coverage |
| Under 6 Years | 635 (100.0%) | 0 (0.0%) |
| 6 to 18 Years | 2,547 (98.3%) | 43 (1.7%) |
| 19 to 25 Years | 5,664 (93.5%) | 392 (6.5%) |
| 26 to 34 Years | 1,314 (88.8%) | 166 (11.2%) |
| 35 to 44 Years | 1,267 (92.5%) | 103 (7.5%) |
| 45 to 54 Years | 1,264 (96.9%) | 40 (3.1%) |
| 55 to 64 Years | 1,194 (88.8%) | 151 (11.2%) |
| 65 to 74 Years | 863 (100.0%) | 0 (0.0%) |
| 75 Years and older | 571 (100.0%) | 0 (0.0%) |
| Total | 15,319 (94.5%) | 895 (5.5%) |
Health Insurance Coverage by Citizenship Status in Radford city
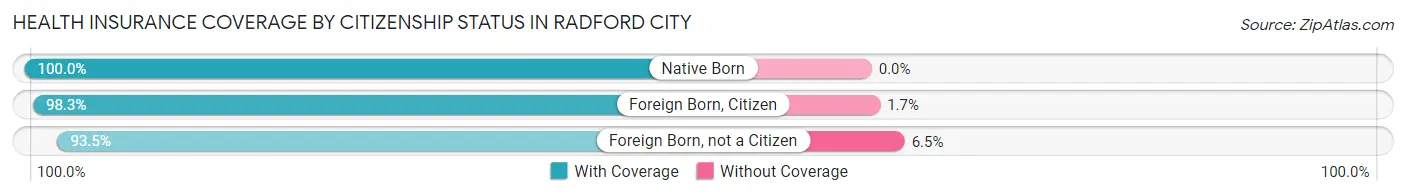
| Citizenship Status | With Coverage | Without Coverage |
| Native Born | 635 (100.0%) | 0 (0.0%) |
| Foreign Born, Citizen | 2,547 (98.3%) | 43 (1.7%) |
| Foreign Born, not a Citizen | 5,664 (93.5%) | 392 (6.5%) |
Health Insurance Coverage by Household Income in Radford city
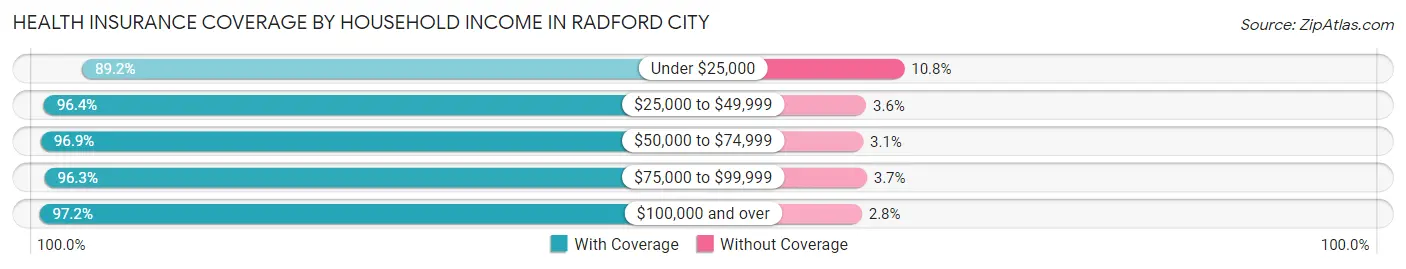
| Household Income | With Coverage | Without Coverage |
| Under $25,000 | 3,613 (89.2%) | 436 (10.8%) |
| $25,000 to $49,999 | 1,652 (96.4%) | 62 (3.6%) |
| $50,000 to $74,999 | 2,029 (96.9%) | 64 (3.1%) |
| $75,000 to $99,999 | 1,286 (96.3%) | 50 (3.7%) |
| $100,000 and over | 3,947 (97.2%) | 114 (2.8%) |
Public vs Private Health Insurance Coverage by Age in Radford city
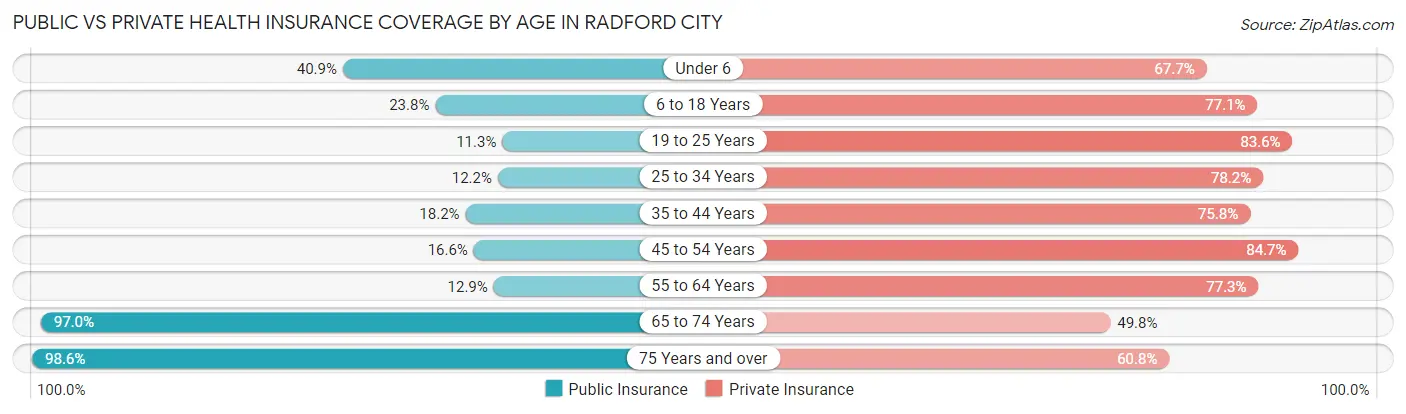
| Age Bracket | Public Insurance | Private Insurance |
| Under 6 | 260 (40.9%) | 430 (67.7%) |
| 6 to 18 Years | 616 (23.8%) | 1,998 (77.1%) |
| 19 to 25 Years | 687 (11.3%) | 5,065 (83.6%) |
| 25 to 34 Years | 180 (12.2%) | 1,157 (78.2%) |
| 35 to 44 Years | 249 (18.2%) | 1,038 (75.8%) |
| 45 to 54 Years | 217 (16.6%) | 1,105 (84.7%) |
| 55 to 64 Years | 174 (12.9%) | 1,040 (77.3%) |
| 65 to 74 Years | 837 (97.0%) | 430 (49.8%) |
| 75 Years and over | 563 (98.6%) | 347 (60.8%) |
| Total | 3,783 (23.3%) | 12,610 (77.8%) |
Disability Status by Sex by Age in Radford city
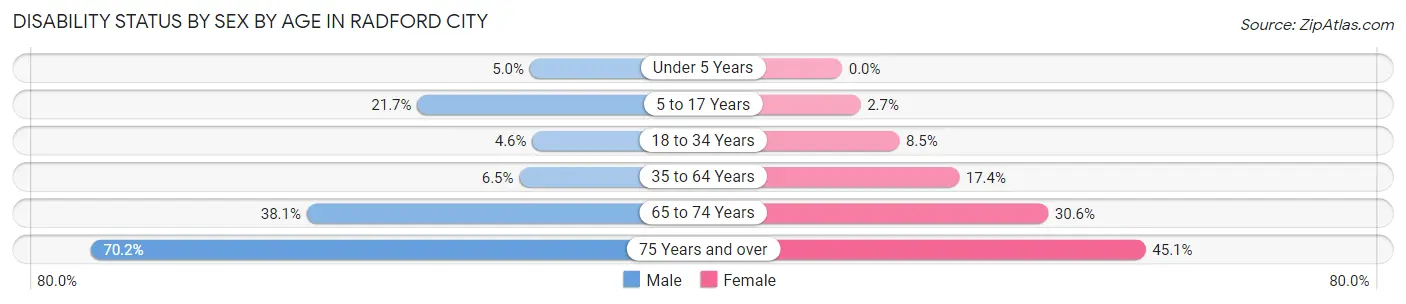
| Age Bracket | Male | Female |
| Under 5 Years | 15 (5.0%) | 0 (0.0%) |
| 5 to 17 Years | 139 (21.7%) | 19 (2.7%) |
| 18 to 34 Years | 178 (4.6%) | 420 (8.5%) |
| 35 to 64 Years | 124 (6.5%) | 368 (17.4%) |
| 65 to 74 Years | 152 (38.1%) | 142 (30.6%) |
| 75 Years and over | 144 (70.2%) | 165 (45.1%) |
Disability Class by Sex by Age in Radford city
Disability Class: Hearing Difficulty
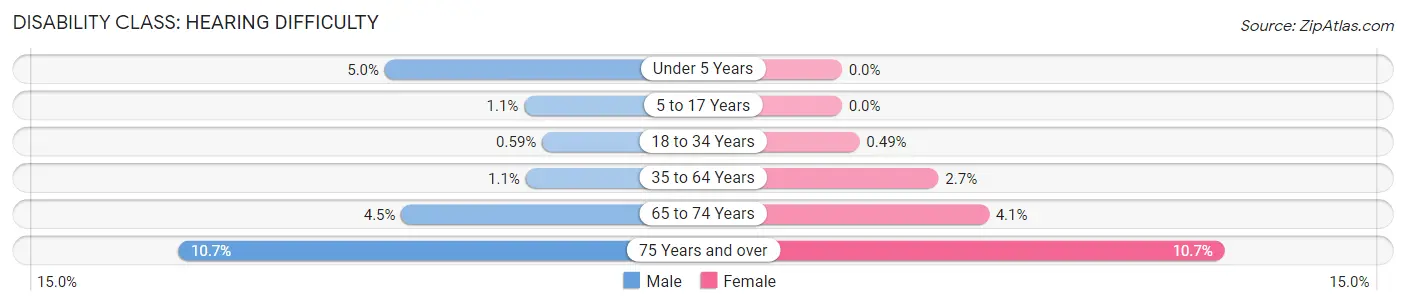
| Age Bracket | Male | Female |
| Under 5 Years | 15 (5.0%) | 0 (0.0%) |
| 5 to 17 Years | 7 (1.1%) | 0 (0.0%) |
| 18 to 34 Years | 23 (0.6%) | 24 (0.5%) |
| 35 to 64 Years | 20 (1.1%) | 57 (2.7%) |
| 65 to 74 Years | 18 (4.5%) | 19 (4.1%) |
| 75 Years and over | 22 (10.7%) | 39 (10.7%) |
Disability Class: Vision Difficulty
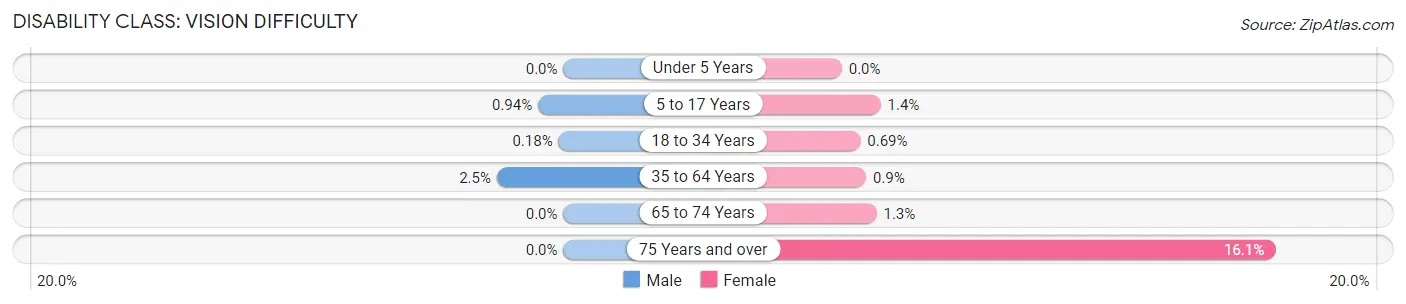
| Age Bracket | Male | Female |
| Under 5 Years | 0 (0.0%) | 0 (0.0%) |
| 5 to 17 Years | 6 (0.9%) | 10 (1.4%) |
| 18 to 34 Years | 7 (0.2%) | 34 (0.7%) |
| 35 to 64 Years | 47 (2.5%) | 19 (0.9%) |
| 65 to 74 Years | 0 (0.0%) | 6 (1.3%) |
| 75 Years and over | 0 (0.0%) | 59 (16.1%) |
Disability Class: Cognitive Difficulty
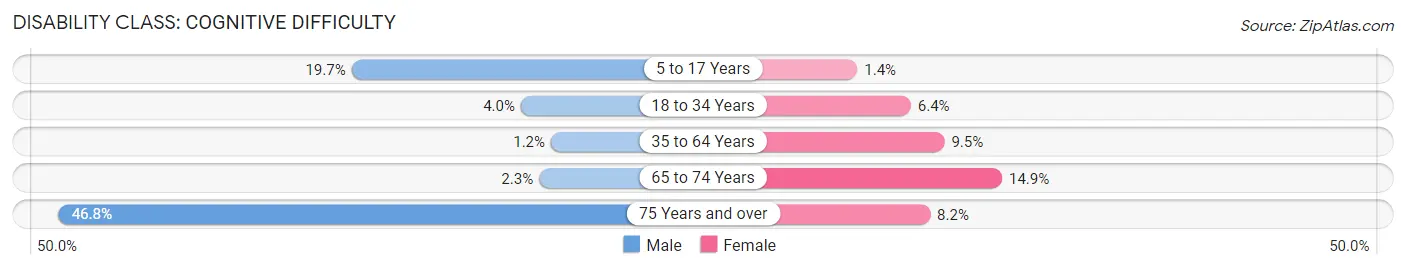
| Age Bracket | Male | Female |
| 5 to 17 Years | 126 (19.7%) | 10 (1.4%) |
| 18 to 34 Years | 153 (4.0%) | 317 (6.4%) |
| 35 to 64 Years | 22 (1.2%) | 202 (9.5%) |
| 65 to 74 Years | 9 (2.3%) | 69 (14.9%) |
| 75 Years and over | 96 (46.8%) | 30 (8.2%) |
Disability Class: Ambulatory Difficulty
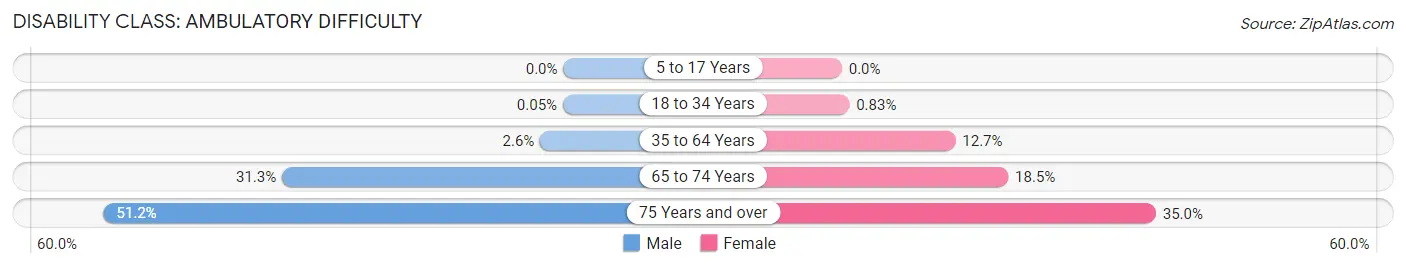
| Age Bracket | Male | Female |
| 5 to 17 Years | 0 (0.0%) | 0 (0.0%) |
| 18 to 34 Years | 2 (0.1%) | 41 (0.8%) |
| 35 to 64 Years | 49 (2.6%) | 268 (12.7%) |
| 65 to 74 Years | 125 (31.3%) | 86 (18.5%) |
| 75 Years and over | 105 (51.2%) | 128 (35.0%) |
Disability Class: Self-Care Difficulty
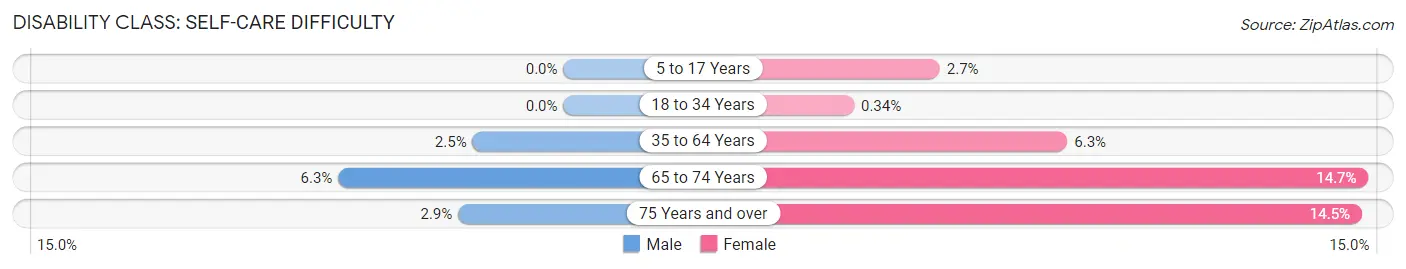
| Age Bracket | Male | Female |
| 5 to 17 Years | 0 (0.0%) | 19 (2.7%) |
| 18 to 34 Years | 0 (0.0%) | 17 (0.3%) |
| 35 to 64 Years | 48 (2.5%) | 133 (6.3%) |
| 65 to 74 Years | 25 (6.3%) | 68 (14.7%) |
| 75 Years and over | 6 (2.9%) | 53 (14.5%) |
Technology Access in Radford city
Computing Device Access in Radford city
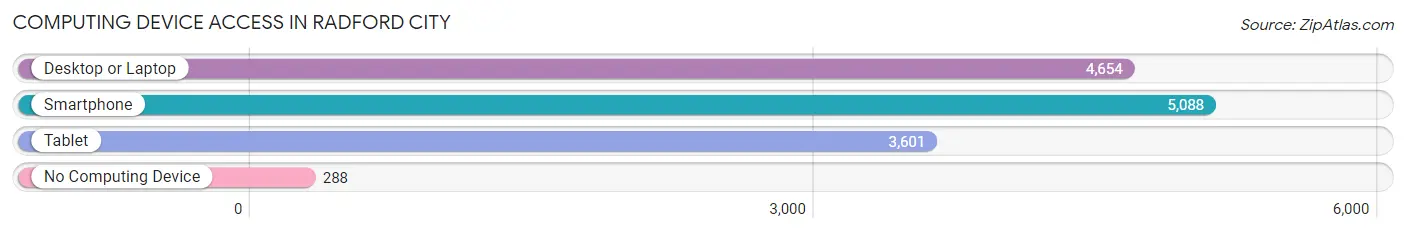
| Device Type | # Households | % Households |
| Desktop or Laptop | 4,654 | 85.1% |
| Smartphone | 5,088 | 93.1% |
| Tablet | 3,601 | 65.9% |
| No Computing Device | 288 | 5.3% |
| Total | 5,467 | 100.0% |
Internet Access in Radford city
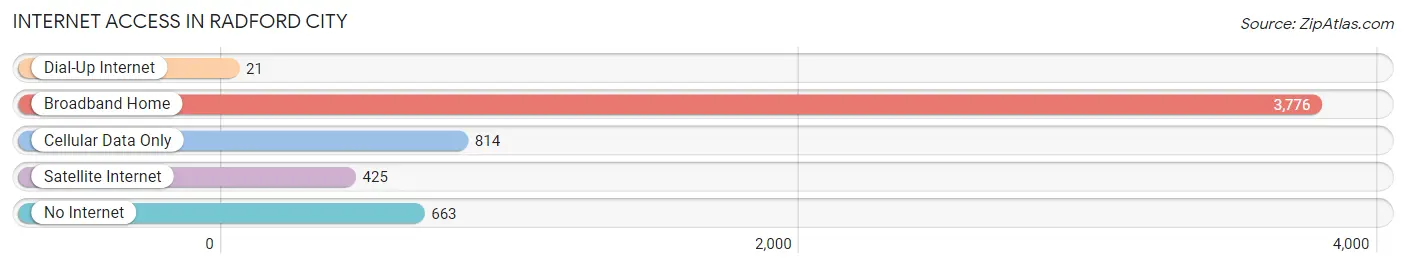
| Internet Type | # Households | % Households |
| Dial-Up Internet | 21 | 0.4% |
| Broadband Home | 3,776 | 69.1% |
| Cellular Data Only | 814 | 14.9% |
| Satellite Internet | 425 | 7.8% |
| No Internet | 663 | 12.1% |
| Total | 5,467 | 100.0% |
Radford city Summary
Radford City, Virginia is a small city located in the New River Valley of Southwest Virginia. It is the county seat of Radford City County and is part of the Blacksburg-Christiansburg-Radford Metropolitan Statistical Area. The city has a population of 16,408 as of the 2010 census, making it the seventh-largest city in the state.
Geography
Radford City is located in the New River Valley of Southwest Virginia, approximately halfway between the cities of Roanoke and Blacksburg. The city is situated along the New River, which is a major tributary of the Roanoke River. The city is surrounded by the Jefferson National Forest and is located at the base of the Blue Ridge Mountains. The city has a total area of 8.3 square miles, all of which is land.
Climate
Radford City has a humid subtropical climate, with hot, humid summers and mild winters. The average annual temperature is 57.2°F, with an average high of 73.2°F in July and an average low of 41.2°F in January. The average annual precipitation is 43.2 inches, with an average of 4.3 inches of snowfall per year.
Demographics
As of the 2010 census, Radford City had a population of 16,408. The racial makeup of the city was 84.3% White, 8.3% African American, 0.3% Native American, 3.2% Asian, 0.1% Pacific Islander, 1.2% from other races, and 2.6% from two or more races. Hispanic or Latino of any race were 3.7% of the population.
The median income for a household in Radford City was $37,945, and the median income for a family was $50,945. The per capita income for the city was $20,845. About 11.2% of families and 16.2% of the population were below the poverty line, including 22.2% of those under age 18 and 8.2% of those age 65 or over.
Economy
Radford City is home to Radford University, which is the largest employer in the city. Other major employers include Carilion New River Valley Medical Center, Radford Army Ammunition Plant, and Radford City Public Schools. The city also has a number of small businesses, including restaurants, retail stores, and professional services.
Radford City is home to a number of manufacturing companies, including Radford Manufacturing, Radford Machine Works, and Radford Foundry. The city is also home to a number of technology companies, including Radford Technology Solutions and Radford Technology Solutions.
History
Radford City was founded in 1887 as a railroad town. The city was named after John Radford, who was a prominent local businessman and the owner of the Radford Iron Works. The city was incorporated in 1892 and has since grown to become the seventh-largest city in the state.
Radford City has a long history of industry and manufacturing. The Radford Iron Works was one of the first industries in the city, and it was followed by the Radford Manufacturing Company, which was founded in 1895. The Radford Army Ammunition Plant was established in 1940 and is still in operation today.
Radford City is also home to Radford University, which was founded in 1910 as the State Normal and Industrial School for Women. The school was renamed Radford College in 1944 and became a coeducational university in 1972. Today, Radford University is a public university with an enrollment of over 9,000 students.
Common Questions
What is Per Capita Income in Radford city?
Per Capita income in Radford city is $24,835.
What is the Median Family Income in Radford city?
Median Family Income in Radford city is $88,125.
What is the Median Household income in Radford city?
Median Household Income in Radford city is $51,039.
What is Income or Wage Gap in Radford city?
Income or Wage Gap in Radford city is 55.3%.
Women in Radford city earn 44.7 cents for every dollar earned by a man.
What is Inequality or Gini Index in Radford city?
Inequality or Gini Index in Radford city is 0.52.
What is the Total Population of Radford city?
Total Population of Radford city is 16,379.
What is the Total Male Population of Radford city?
Total Male Population of Radford city is 7,411.
What is the Total Female Population of Radford city?
Total Female Population of Radford city is 8,968.
What is the Ratio of Males per 100 Females in Radford city?
There are 82.64 Males per 100 Females in Radford city.
What is the Ratio of Females per 100 Males in Radford city?
There are 121.01 Females per 100 Males in Radford city.
What is the Median Population Age in Radford city?
Median Population Age in Radford city is 23.3 Years.
What is the Average Family Size in Radford city
Average Family Size in Radford city is 3.1 People.
What is the Average Household Size in Radford city
Average Household Size in Radford city is 2.4 People.
How Large is the Labor Force in Radford city?
There are 8,615 People in the Labor Forcein in Radford city.
What is the Percentage of People in the Labor Force in Radford city?
58.9% of People are in the Labor Force in Radford city.
What is the Unemployment Rate in Radford city?
Unemployment Rate in Radford city is 7.2%.