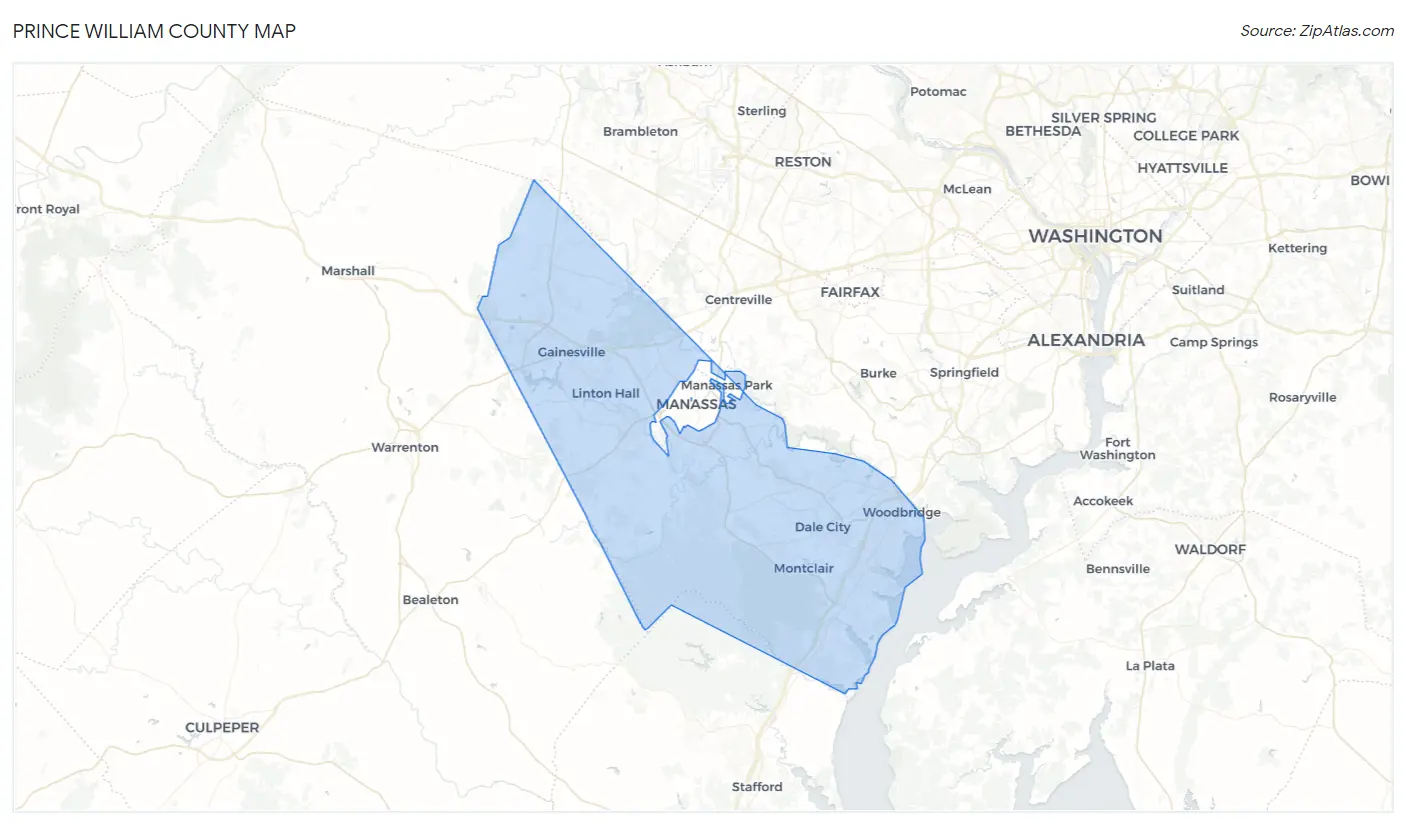
Prince William County, VA Map & Demographics
Prince William County Map
Prince William County Overview
$48,958
PER CAPITA INCOME
$135,196
AVG FAMILY INCOME
$123,193
AVG HOUSEHOLD INCOME
31.9%
WAGE / INCOME GAP [ % ]
68.1¢/ $1
WAGE / INCOME GAP [ $ ]
$12,376
FAMILY INCOME DEFICIT
0.39
INEQUALITY / GINI INDEX
481,114
TOTAL POPULATION
242,456
MALE POPULATION
238,658
FEMALE POPULATION
101.59
MALES / 100 FEMALES
98.43
FEMALES / 100 MALES
35.8
MEDIAN AGE
3.6
AVG FAMILY SIZE
3.1
AVG HOUSEHOLD SIZE
266,209
LABOR FORCE [ PEOPLE ]
72.3%
PERCENT IN LABOR FORCE
4.7%
UNEMPLOYMENT RATE
Income in Prince William County
Income Overview in Prince William County
Per Capita Income in Prince William County is $48,958, while median incomes of families and households are $135,196 and $123,193 respectively.
| Characteristic | Number | Measure |
| Per Capita Income | 481,114 | $48,958 |
| Median Family Income | 116,707 | $135,196 |
| Mean Family Income | 116,707 | $161,697 |
| Median Household Income | 152,616 | $123,193 |
| Mean Household Income | 152,616 | $149,608 |
| Income Deficit | 116,707 | $12,376 |
| Wage / Income Gap (%) | 481,114 | 31.92% |
| Wage / Income Gap ($) | 481,114 | 68.08¢ per $1 |
| Gini / Inequality Index | 481,114 | 0.39 |
Earnings by Sex in Prince William County
Average Earnings in Prince William County are $54,467, $63,765 for men and $43,409 for women, a difference of 31.9%.
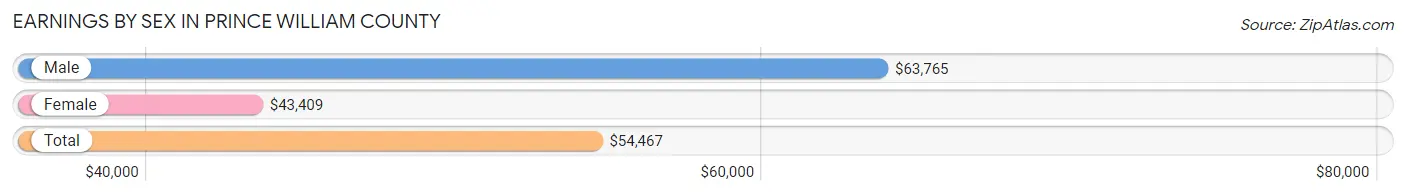
| Sex | Number | Average Earnings |
| Male | 147,528 (54.2%) | $63,765 |
| Female | 124,840 (45.8%) | $43,409 |
| Total | 272,368 (100.0%) | $54,467 |
Earnings by Sex by Income Bracket in Prince William County
The most common earnings brackets in Prince William County are $100,000+ for men (46,456 | 31.5%) and $100,000+ for women (21,171 | 17.0%).
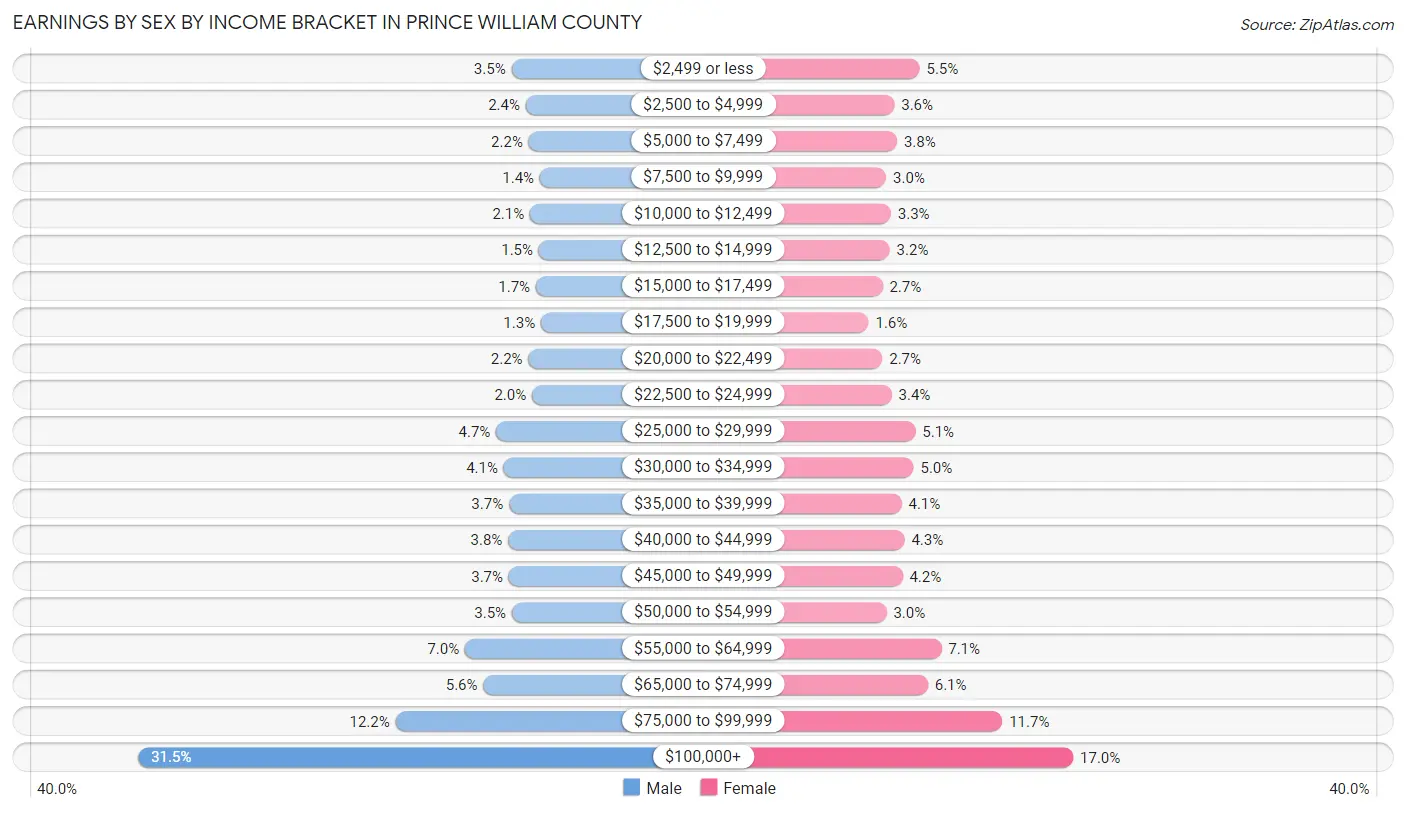
| Income | Male | Female |
| $2,499 or less | 5,175 (3.5%) | 6,799 (5.4%) |
| $2,500 to $4,999 | 3,604 (2.4%) | 4,440 (3.6%) |
| $5,000 to $7,499 | 3,271 (2.2%) | 4,693 (3.8%) |
| $7,500 to $9,999 | 2,034 (1.4%) | 3,689 (2.9%) |
| $10,000 to $12,499 | 3,123 (2.1%) | 4,114 (3.3%) |
| $12,500 to $14,999 | 2,153 (1.5%) | 4,013 (3.2%) |
| $15,000 to $17,499 | 2,481 (1.7%) | 3,338 (2.7%) |
| $17,500 to $19,999 | 1,914 (1.3%) | 2,029 (1.6%) |
| $20,000 to $22,499 | 3,306 (2.2%) | 3,317 (2.7%) |
| $22,500 to $24,999 | 2,903 (2.0%) | 4,192 (3.4%) |
| $25,000 to $29,999 | 6,874 (4.7%) | 6,412 (5.1%) |
| $30,000 to $34,999 | 6,033 (4.1%) | 6,241 (5.0%) |
| $35,000 to $39,999 | 5,465 (3.7%) | 5,113 (4.1%) |
| $40,000 to $44,999 | 5,540 (3.8%) | 5,391 (4.3%) |
| $45,000 to $49,999 | 5,468 (3.7%) | 5,204 (4.2%) |
| $50,000 to $54,999 | 5,133 (3.5%) | 3,710 (3.0%) |
| $55,000 to $64,999 | 10,307 (7.0%) | 8,843 (7.1%) |
| $65,000 to $74,999 | 8,285 (5.6%) | 7,583 (6.1%) |
| $75,000 to $99,999 | 18,003 (12.2%) | 14,548 (11.7%) |
| $100,000+ | 46,456 (31.5%) | 21,171 (17.0%) |
| Total | 147,528 (100.0%) | 124,840 (100.0%) |
Earnings by Sex by Educational Attainment in Prince William County
Average earnings in Prince William County are $75,302 for men and $52,266 for women, a difference of 30.6%. Men with an educational attainment of graduate degree enjoy the highest average annual earnings of $131,282, while those with less than high school education earn the least with $42,442. Women with an educational attainment of graduate degree earn the most with the average annual earnings of $85,499, while those with less than high school education have the smallest earnings of $24,297.
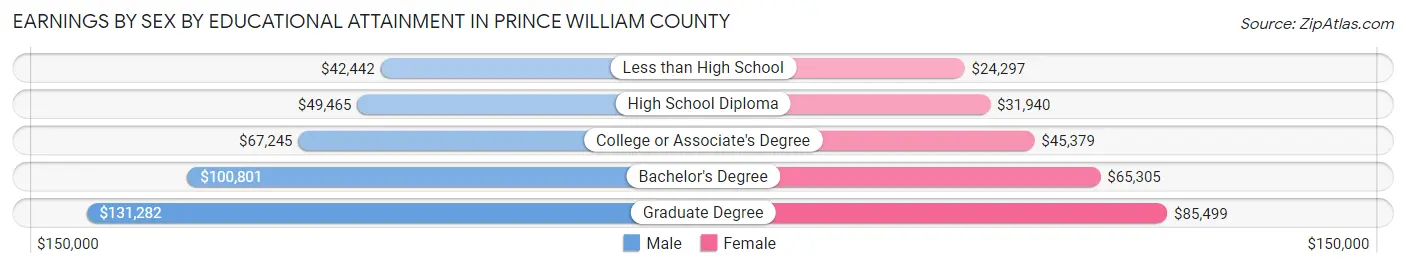
| Educational Attainment | Male Income | Female Income |
| Less than High School | $42,442 | $24,297 |
| High School Diploma | $49,465 | $31,940 |
| College or Associate's Degree | $67,245 | $45,379 |
| Bachelor's Degree | $100,801 | $65,305 |
| Graduate Degree | $131,282 | $85,499 |
| Total | $75,302 | $52,266 |
Family Income in Prince William County
Family Income Brackets in Prince William County
According to the Prince William County family income data, there are 32,211 families falling into the $200,000+ income range, which is the most common income bracket and makes up 27.6% of all families. Conversely, the $10,000 to $14,999 income bracket is the least frequent group with only 817 families (0.7%) belonging to this category.
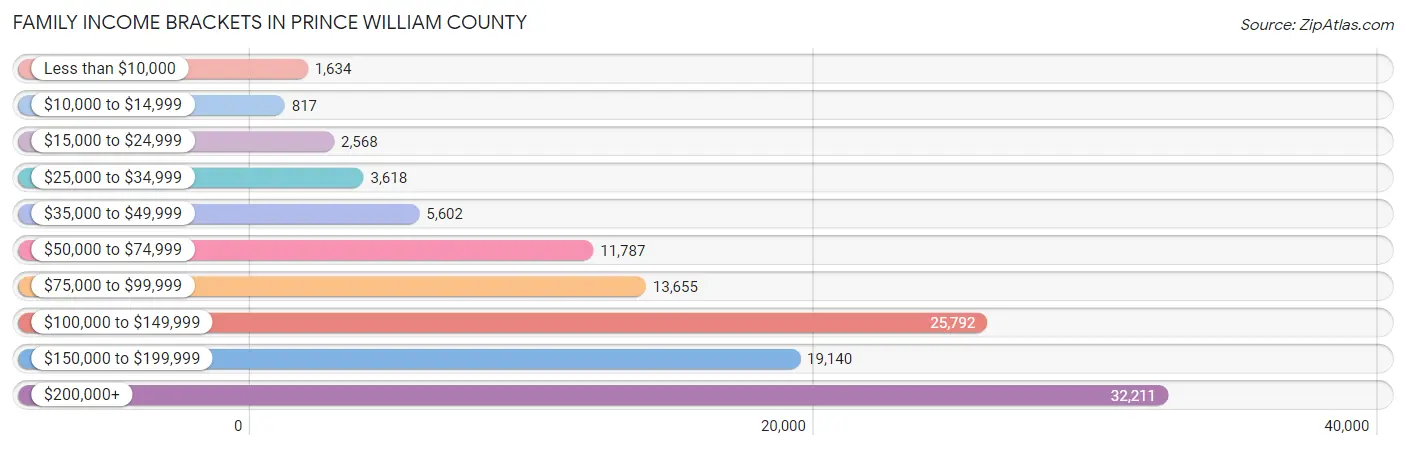
| Income Bracket | # Families | % Families |
| Less than $10,000 | 1,634 | 1.4% |
| $10,000 to $14,999 | 817 | 0.7% |
| $15,000 to $24,999 | 2,568 | 2.2% |
| $25,000 to $34,999 | 3,618 | 3.1% |
| $35,000 to $49,999 | 5,602 | 4.8% |
| $50,000 to $74,999 | 11,787 | 10.1% |
| $75,000 to $99,999 | 13,655 | 11.7% |
| $100,000 to $149,999 | 25,792 | 22.1% |
| $150,000 to $199,999 | 19,140 | 16.4% |
| $200,000+ | 32,211 | 27.6% |
Family Income by Famaliy Size in Prince William County
7+ person families (3,380 | 2.9%) account for the highest median family income in Prince William County with $157,118 per family, while 2-person families (39,541 | 33.9%) have the highest median income of $61,782 per family member.
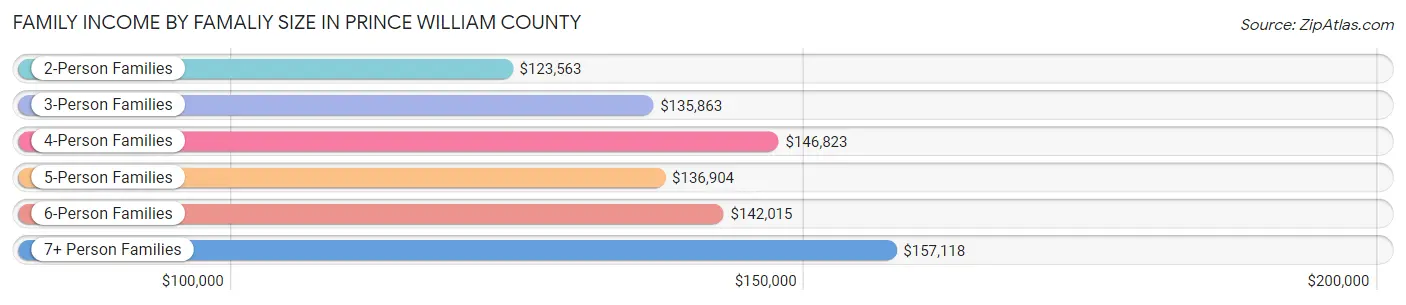
| Income Bracket | # Families | Median Income |
| 2-Person Families | 39,541 (33.9%) | $123,563 |
| 3-Person Families | 25,712 (22.0%) | $135,863 |
| 4-Person Families | 28,104 (24.1%) | $146,823 |
| 5-Person Families | 14,173 (12.1%) | $136,904 |
| 6-Person Families | 5,797 (5.0%) | $142,015 |
| 7+ Person Families | 3,380 (2.9%) | $157,118 |
| Total | 116,707 (100.0%) | $135,196 |
Family Income by Number of Earners in Prince William County
The median family income in Prince William County is $135,196, with families comprising 3+ earners (21,699) having the highest median family income of $180,330, while families with no earners (8,925) have the lowest median family income of $89,733, accounting for 18.6% and 7.6% of families, respectively.
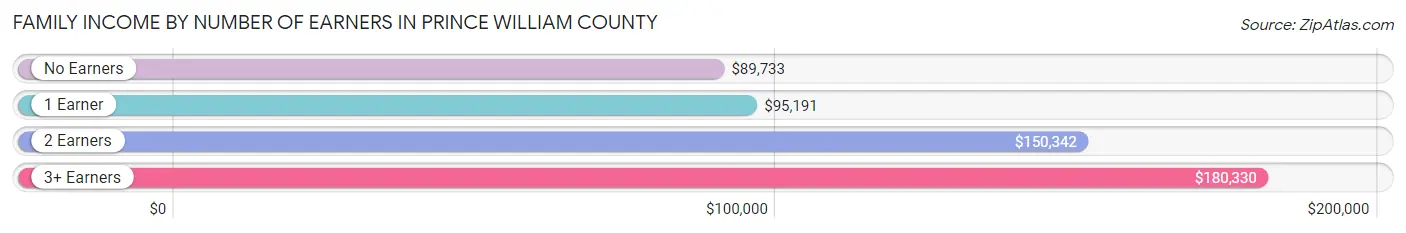
| Number of Earners | # Families | Median Income |
| No Earners | 8,925 (7.6%) | $89,733 |
| 1 Earner | 32,145 (27.5%) | $95,191 |
| 2 Earners | 53,938 (46.2%) | $150,342 |
| 3+ Earners | 21,699 (18.6%) | $180,330 |
| Total | 116,707 (100.0%) | $135,196 |
Household Income in Prince William County
Household Income Brackets in Prince William County
With 36,475 households falling in the category, the $200,000+ income range is the most frequent in Prince William County, accounting for 23.9% of all households. In contrast, only 1,679 households (1.1%) fall into the $10,000 to $14,999 income bracket, making it the least populous group.
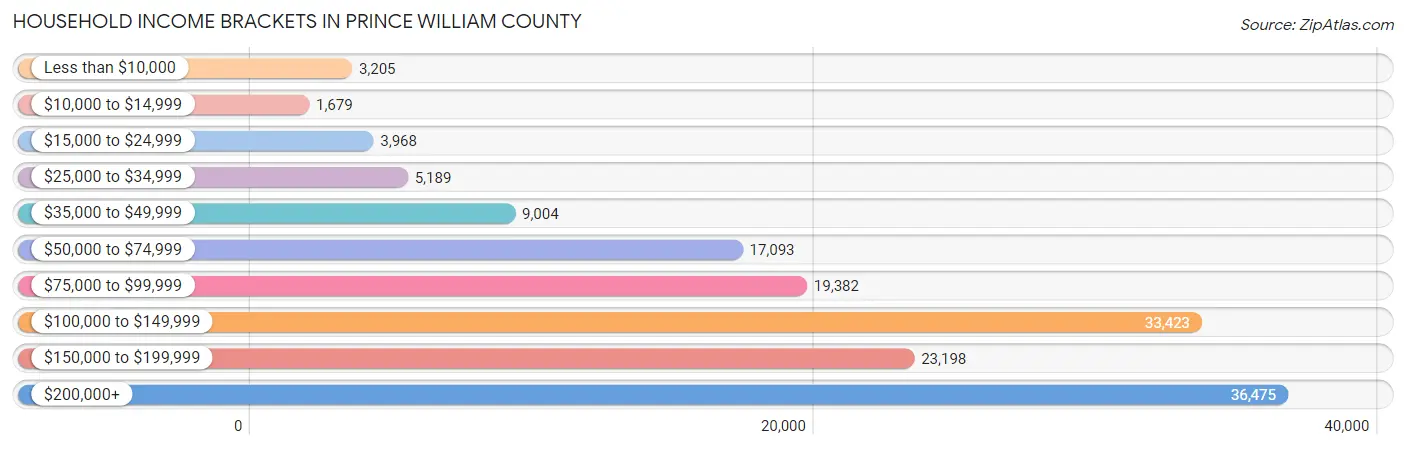
| Income Bracket | # Households | % Households |
| Less than $10,000 | 3,205 | 2.1% |
| $10,000 to $14,999 | 1,679 | 1.1% |
| $15,000 to $24,999 | 3,968 | 2.6% |
| $25,000 to $34,999 | 5,189 | 3.4% |
| $35,000 to $49,999 | 9,004 | 5.9% |
| $50,000 to $74,999 | 17,093 | 11.2% |
| $75,000 to $99,999 | 19,382 | 12.7% |
| $100,000 to $149,999 | 33,423 | 21.9% |
| $150,000 to $199,999 | 23,198 | 15.2% |
| $200,000+ | 36,475 | 23.9% |
Household Income by Householder Age in Prince William County
The median household income in Prince William County is $123,193, with the highest median household income of $145,676 found in the 45 to 64 years age bracket for the primary householder. A total of 65,981 households (43.2%) fall into this category. Meanwhile, the 15 to 24 years age bracket for the primary householder has the lowest median household income of $57,694, with 3,405 households (2.2%) in this group.
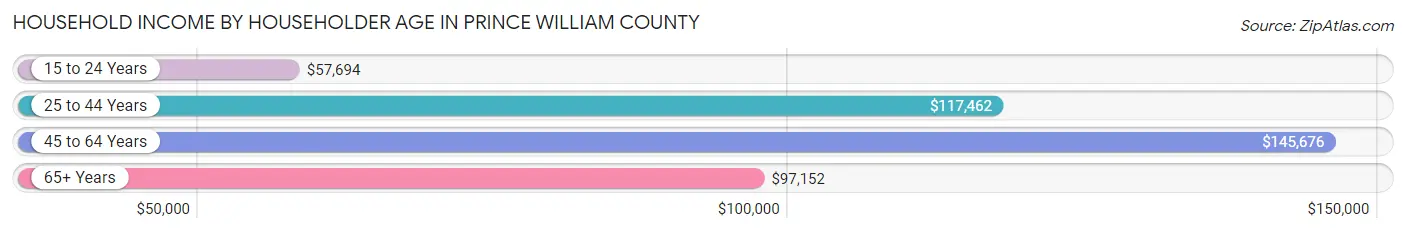
| Income Bracket | # Households | Median Income |
| 15 to 24 Years | 3,405 (2.2%) | $57,694 |
| 25 to 44 Years | 56,301 (36.9%) | $117,462 |
| 45 to 64 Years | 65,981 (43.2%) | $145,676 |
| 65+ Years | 26,929 (17.6%) | $97,152 |
| Total | 152,616 (100.0%) | $123,193 |
Poverty in Prince William County
Income Below Poverty by Sex and Age in Prince William County
With 5.2% poverty level for males and 6.9% for females among the residents of Prince William County, 6 to 11 year old males and 5 year old females are the most vulnerable to poverty, with 1,890 males (8.6%) and 359 females (13.1%) in their respective age groups living below the poverty level.
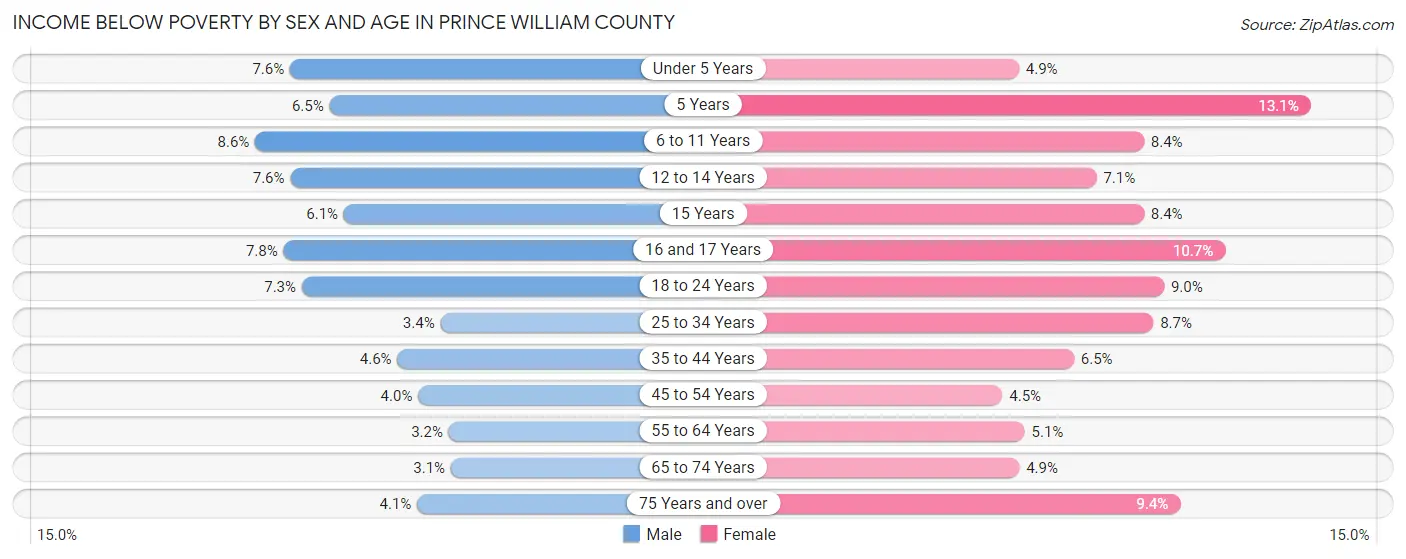
| Age Bracket | Male | Female |
| Under 5 Years | 1,263 (7.6%) | 770 (4.9%) |
| 5 Years | 224 (6.5%) | 359 (13.1%) |
| 6 to 11 Years | 1,890 (8.6%) | 1,751 (8.4%) |
| 12 to 14 Years | 878 (7.6%) | 776 (7.1%) |
| 15 Years | 216 (6.1%) | 298 (8.4%) |
| 16 and 17 Years | 617 (7.8%) | 775 (10.7%) |
| 18 to 24 Years | 1,579 (7.3%) | 1,848 (9.0%) |
| 25 to 34 Years | 1,050 (3.4%) | 2,701 (8.7%) |
| 35 to 44 Years | 1,675 (4.6%) | 2,326 (6.5%) |
| 45 to 54 Years | 1,395 (4.0%) | 1,497 (4.5%) |
| 55 to 64 Years | 891 (3.2%) | 1,388 (5.1%) |
| 65 to 74 Years | 465 (3.1%) | 830 (4.9%) |
| 75 Years and over | 313 (4.1%) | 993 (9.4%) |
| Total | 12,456 (5.2%) | 16,312 (6.9%) |
Income Above Poverty by Sex and Age in Prince William County
According to the poverty statistics in Prince William County, males aged 65 to 74 years and females aged 45 to 54 years are the age groups that are most secure financially, with 96.9% of males and 95.5% of females in these age groups living above the poverty line.
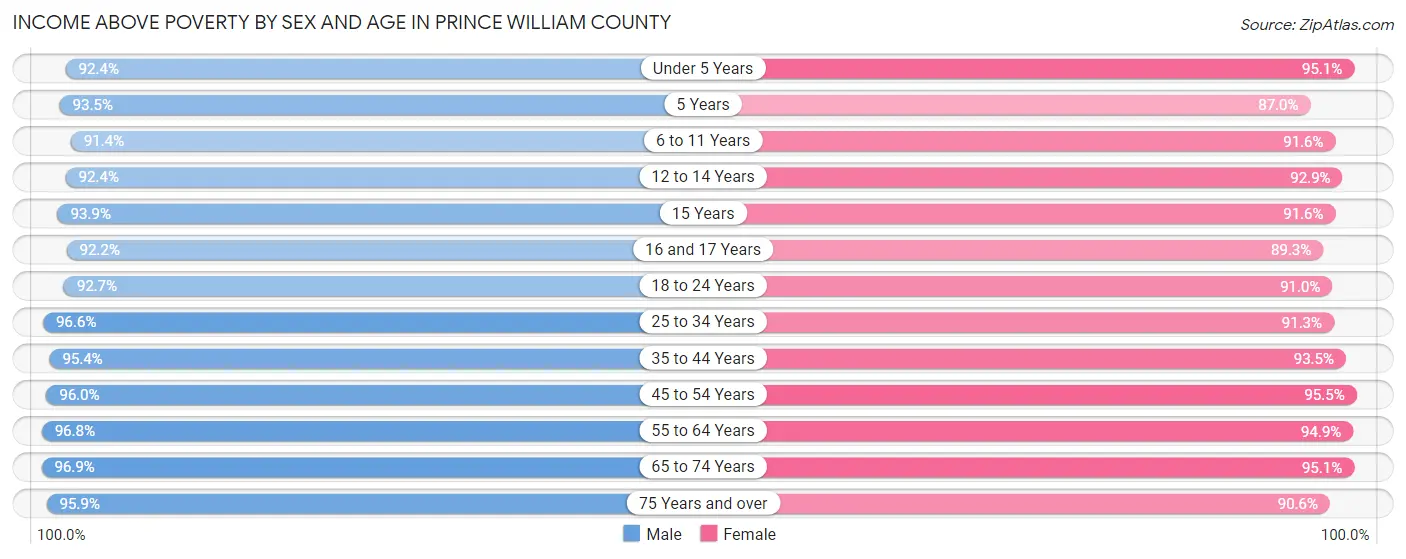
| Age Bracket | Male | Female |
| Under 5 Years | 15,323 (92.4%) | 14,848 (95.1%) |
| 5 Years | 3,216 (93.5%) | 2,392 (87.0%) |
| 6 to 11 Years | 20,130 (91.4%) | 19,078 (91.6%) |
| 12 to 14 Years | 10,671 (92.4%) | 10,172 (92.9%) |
| 15 Years | 3,320 (93.9%) | 3,246 (91.6%) |
| 16 and 17 Years | 7,304 (92.2%) | 6,487 (89.3%) |
| 18 to 24 Years | 20,119 (92.7%) | 18,757 (91.0%) |
| 25 to 34 Years | 29,666 (96.6%) | 28,459 (91.3%) |
| 35 to 44 Years | 34,603 (95.4%) | 33,677 (93.5%) |
| 45 to 54 Years | 33,113 (96.0%) | 31,998 (95.5%) |
| 55 to 64 Years | 27,073 (96.8%) | 25,883 (94.9%) |
| 65 to 74 Years | 14,378 (96.9%) | 15,963 (95.1%) |
| 75 Years and over | 7,377 (95.9%) | 9,547 (90.6%) |
| Total | 226,293 (94.8%) | 220,507 (93.1%) |
Income Below Poverty Among Married-Couple Families in Prince William County
The poverty statistics for married-couple families in Prince William County show that 2.8% or 2,550 of the total 90,737 families live below the poverty line. Families with 5 or more children have the highest poverty rate of 9.9%, comprising of 69 families. On the other hand, families with no children have the lowest poverty rate of 1.7%, which includes 734 families.

| Children | Above Poverty | Below Poverty |
| No Children | 42,010 (98.3%) | 734 (1.7%) |
| 1 or 2 Children | 35,996 (97.1%) | 1,059 (2.9%) |
| 3 or 4 Children | 9,554 (93.3%) | 688 (6.7%) |
| 5 or more Children | 627 (90.1%) | 69 (9.9%) |
| Total | 88,187 (97.2%) | 2,550 (2.8%) |
Income Below Poverty Among Single-Parent Households in Prince William County
According to the poverty data in Prince William County, 4.3% or 381 single-father households and 12.5% or 2,150 single-mother households are living below the poverty line. Among single-father households, those with 5 or more children have the highest poverty rate, with 13 households (100.0%) experiencing poverty. Likewise, among single-mother households, those with 5 or more children have the highest poverty rate, with 41 households (57.8%) falling below the poverty line.
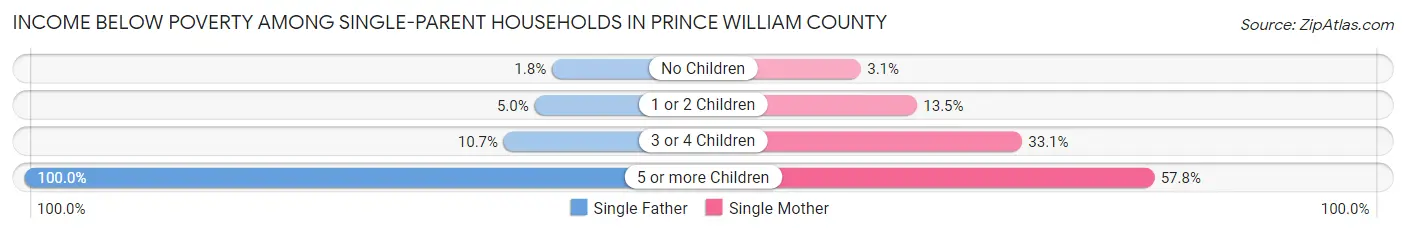
| Children | Single Father | Single Mother |
| No Children | 62 (1.8%) | 196 (3.1%) |
| 1 or 2 Children | 227 (5.0%) | 1,146 (13.5%) |
| 3 or 4 Children | 79 (10.7%) | 767 (33.1%) |
| 5 or more Children | 13 (100.0%) | 41 (57.8%) |
| Total | 381 (4.3%) | 2,150 (12.5%) |
Income Below Poverty Among Married-Couple vs Single-Parent Households in Prince William County
The poverty data for Prince William County shows that 2,550 of the married-couple family households (2.8%) and 2,531 of the single-parent households (9.8%) are living below the poverty level. Within the married-couple family households, those with 5 or more children have the highest poverty rate, with 69 households (9.9%) falling below the poverty line. Among the single-parent households, those with 5 or more children have the highest poverty rate, with 54 household (64.3%) living below poverty.
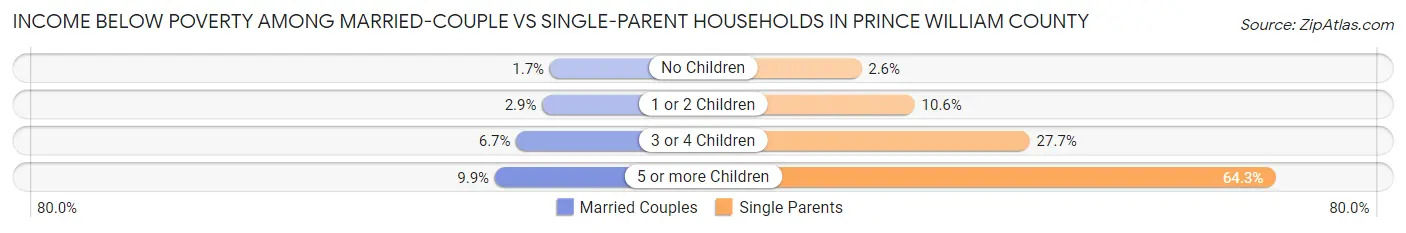
| Children | Married-Couple Families | Single-Parent Households |
| No Children | 734 (1.7%) | 258 (2.6%) |
| 1 or 2 Children | 1,059 (2.9%) | 1,373 (10.6%) |
| 3 or 4 Children | 688 (6.7%) | 846 (27.7%) |
| 5 or more Children | 69 (9.9%) | 54 (64.3%) |
| Total | 2,550 (2.8%) | 2,531 (9.8%) |
Race in Prince William County
The most populous races in Prince William County are White / Caucasian (241,644 | 50.2%), Hispanic or Latino (120,125 | 25.0%), and Black / African American (99,551 | 20.7%).
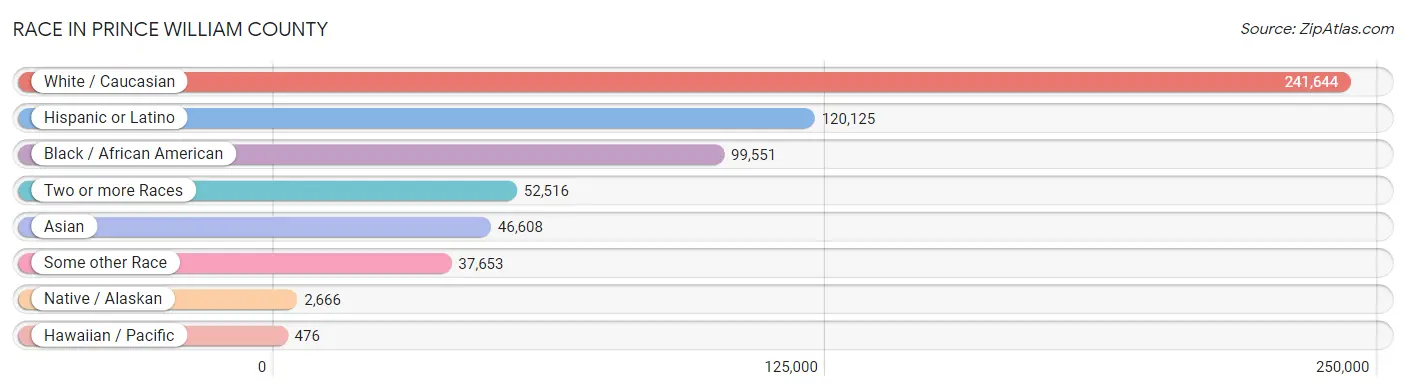
| Race | # Population | % Population |
| Asian | 46,608 | 9.7% |
| Black / African American | 99,551 | 20.7% |
| Hawaiian / Pacific | 476 | 0.1% |
| Hispanic or Latino | 120,125 | 25.0% |
| Native / Alaskan | 2,666 | 0.5% |
| White / Caucasian | 241,644 | 50.2% |
| Two or more Races | 52,516 | 10.9% |
| Some other Race | 37,653 | 7.8% |
| Total | 481,114 | 100.0% |
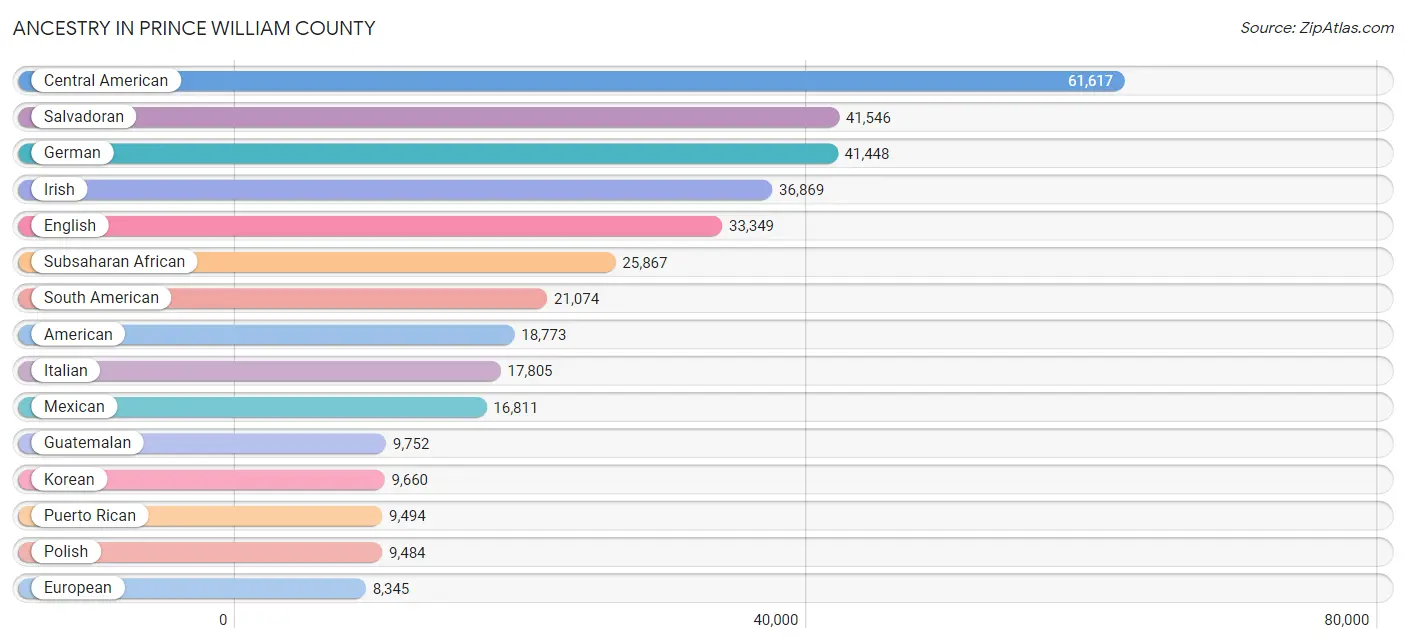
Ancestry in Prince William County
The most populous ancestries reported in Prince William County are Central American (61,617 | 12.8%), Salvadoran (41,546 | 8.6%), German (41,448 | 8.6%), Irish (36,869 | 7.7%), and English (33,349 | 6.9%), together accounting for 44.7% of all Prince William County residents.
| Ancestry | # Population | % Population |
| Afghan | 3,843 | 0.8% |
| African | 5,545 | 1.1% |
| Alaska Native | 34 | 0.0% |
| Albanian | 57 | 0.0% |
| Alsatian | 23 | 0.0% |
| American | 18,773 | 3.9% |
| Arab | 7,611 | 1.6% |
| Argentinean | 1,275 | 0.3% |
| Armenian | 263 | 0.1% |
| Assyrian / Chaldean / Syriac | 24 | 0.0% |
| Australian | 47 | 0.0% |
| Austrian | 603 | 0.1% |
| Bangladeshi | 11 | 0.0% |
| Barbadian | 55 | 0.0% |
| Belgian | 165 | 0.0% |
| Belizean | 49 | 0.0% |
| Bermudan | 12 | 0.0% |
| Bhutanese | 1,956 | 0.4% |
| Blackfeet | 212 | 0.0% |
| Bolivian | 6,382 | 1.3% |
| Brazilian | 514 | 0.1% |
| British | 2,878 | 0.6% |
| British West Indian | 283 | 0.1% |
| Bulgarian | 153 | 0.0% |
| Burmese | 6,581 | 1.4% |
| Cajun | 106 | 0.0% |
| Cambodian | 32 | 0.0% |
| Canadian | 474 | 0.1% |
| Cape Verdean | 25 | 0.0% |
| Celtic | 45 | 0.0% |
| Central American | 61,617 | 12.8% |
| Central American Indian | 1,237 | 0.3% |
| Cherokee | 1,012 | 0.2% |
| Cheyenne | 5 | 0.0% |
| Chickasaw | 50 | 0.0% |
| Chilean | 751 | 0.2% |
| Chippewa | 120 | 0.0% |
| Choctaw | 147 | 0.0% |
| Colombian | 2,387 | 0.5% |
| Comanche | 15 | 0.0% |
| Costa Rican | 282 | 0.1% |
| Creek | 87 | 0.0% |
| Croatian | 511 | 0.1% |
| Crow | 20 | 0.0% |
| Cuban | 945 | 0.2% |
| Czech | 1,122 | 0.2% |
| Czechoslovakian | 356 | 0.1% |
| Danish | 764 | 0.2% |
| Dominican | 1,729 | 0.4% |
| Dutch | 2,268 | 0.5% |
| Eastern European | 1,154 | 0.2% |
| Ecuadorian | 1,029 | 0.2% |
| Egyptian | 720 | 0.2% |
| English | 33,349 | 6.9% |
| Estonian | 57 | 0.0% |
| Ethiopian | 6,448 | 1.3% |
| European | 8,345 | 1.7% |
| Filipino | 61 | 0.0% |
| Finnish | 430 | 0.1% |
| French | 6,722 | 1.4% |
| French American Indian | 34 | 0.0% |
| French Canadian | 1,156 | 0.2% |
| German | 41,448 | 8.6% |
| German Russian | 56 | 0.0% |
| Ghanaian | 7,860 | 1.6% |
| Greek | 1,412 | 0.3% |
| Guamanian / Chamorro | 522 | 0.1% |
| Guatemalan | 9,752 | 2.0% |
| Guyanese | 41 | 0.0% |
| Haitian | 396 | 0.1% |
| Honduran | 6,926 | 1.4% |
| Hungarian | 1,142 | 0.2% |
| Icelander | 32 | 0.0% |
| Indian (Asian) | 3,934 | 0.8% |
| Indonesian | 47 | 0.0% |
| Inupiat | 37 | 0.0% |
| Iranian | 1,040 | 0.2% |
| Iraqi | 1,173 | 0.2% |
| Irish | 36,869 | 7.7% |
| Iroquois | 40 | 0.0% |
| Israeli | 67 | 0.0% |
| Italian | 17,805 | 3.7% |
| Jamaican | 1,684 | 0.4% |
| Japanese | 1,131 | 0.2% |
| Jordanian | 932 | 0.2% |
| Kenyan | 385 | 0.1% |
| Kiowa | 10 | 0.0% |
| Korean | 9,660 | 2.0% |
| Laotian | 728 | 0.2% |
| Latvian | 89 | 0.0% |
| Lebanese | 1,152 | 0.2% |
| Liberian | 669 | 0.1% |
| Lithuanian | 766 | 0.2% |
| Lumbee | 199 | 0.0% |
| Luxembourger | 19 | 0.0% |
| Macedonian | 240 | 0.1% |
| Malaysian | 528 | 0.1% |
| Maltese | 64 | 0.0% |
| Mexican | 16,811 | 3.5% |
| Mexican American Indian | 597 | 0.1% |
| Mongolian | 72 | 0.0% |
| Moroccan | 1,052 | 0.2% |
| Native Hawaiian | 507 | 0.1% |
| Navajo | 69 | 0.0% |
| New Zealander | 21 | 0.0% |
| Nicaraguan | 1,890 | 0.4% |
| Nigerian | 1,345 | 0.3% |
| Northern European | 1,162 | 0.2% |
| Norwegian | 2,518 | 0.5% |
| Osage | 40 | 0.0% |
| Ottawa | 9 | 0.0% |
| Pakistani | 1,219 | 0.3% |
| Palestinian | 223 | 0.1% |
| Panamanian | 1,077 | 0.2% |
| Paraguayan | 185 | 0.0% |
| Pennsylvania German | 100 | 0.0% |
| Peruvian | 7,672 | 1.6% |
| Polish | 9,484 | 2.0% |
| Portuguese | 1,477 | 0.3% |
| Potawatomi | 34 | 0.0% |
| Pueblo | 182 | 0.0% |
| Puerto Rican | 9,494 | 2.0% |
| Romanian | 848 | 0.2% |
| Russian | 2,489 | 0.5% |
| Salvadoran | 41,546 | 8.6% |
| Samoan | 221 | 0.1% |
| Scandinavian | 1,174 | 0.2% |
| Scotch-Irish | 3,426 | 0.7% |
| Scottish | 6,043 | 1.3% |
| Seminole | 105 | 0.0% |
| Serbian | 156 | 0.0% |
| Sierra Leonean | 1,062 | 0.2% |
| Sioux | 110 | 0.0% |
| Slavic | 351 | 0.1% |
| Slovak | 873 | 0.2% |
| Slovene | 221 | 0.1% |
| Somali | 213 | 0.0% |
| South African | 13 | 0.0% |
| South American | 21,074 | 4.4% |
| South American Indian | 383 | 0.1% |
| Spaniard | 1,450 | 0.3% |
| Spanish | 834 | 0.2% |
| Spanish American Indian | 98 | 0.0% |
| Sri Lankan | 5,903 | 1.2% |
| Subsaharan African | 25,867 | 5.4% |
| Sudanese | 542 | 0.1% |
| Swedish | 2,318 | 0.5% |
| Swiss | 698 | 0.2% |
| Syrian | 170 | 0.0% |
| Thai | 7,630 | 1.6% |
| Tongan | 8 | 0.0% |
| Trinidadian and Tobagonian | 797 | 0.2% |
| Turkish | 740 | 0.2% |
| U.S. Virgin Islander | 223 | 0.1% |
| Ugandan | 566 | 0.1% |
| Ukrainian | 1,033 | 0.2% |
| Uruguayan | 184 | 0.0% |
| Venezuelan | 1,106 | 0.2% |
| Vietnamese | 2,699 | 0.6% |
| Welsh | 3,053 | 0.6% |
| West Indian | 1,017 | 0.2% |
| Yaqui | 163 | 0.0% |
| Yugoslavian | 168 | 0.0% |
| Zimbabwean | 21 | 0.0% | View All 164 Rows |
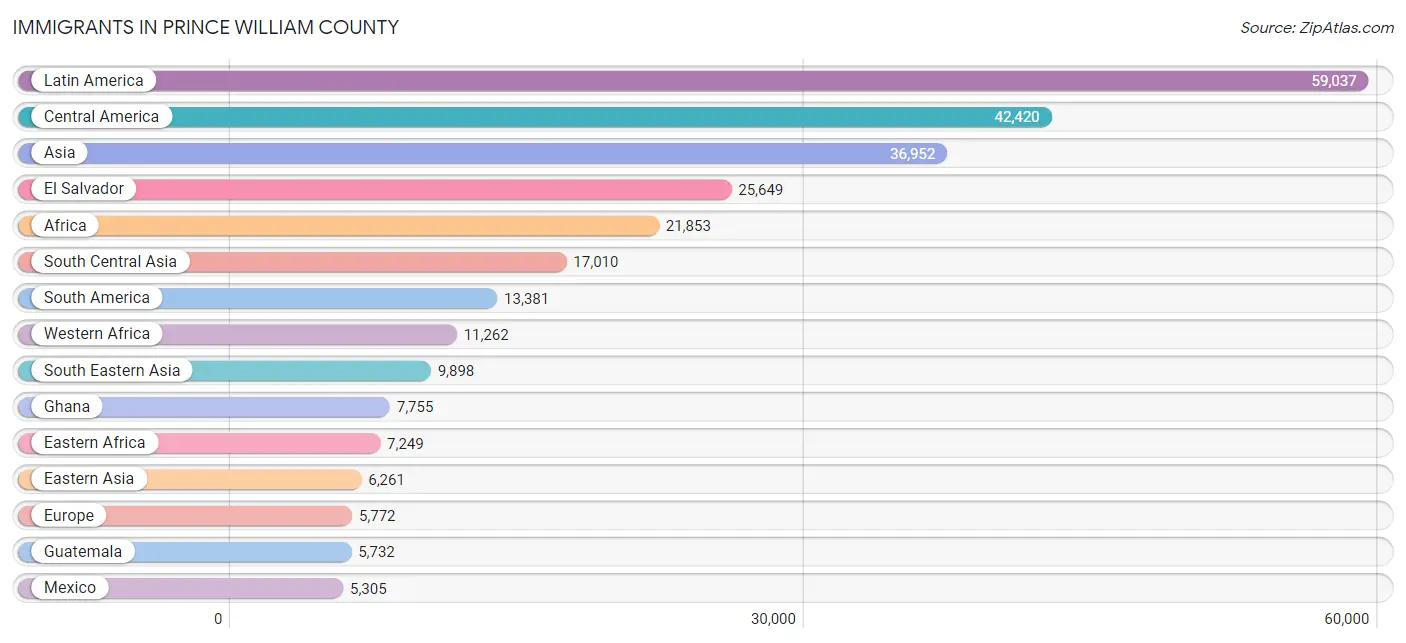
Immigrants in Prince William County
The most numerous immigrant groups reported in Prince William County came from Latin America (59,037 | 12.3%), Central America (42,420 | 8.8%), Asia (36,952 | 7.7%), El Salvador (25,649 | 5.3%), and Africa (21,853 | 4.5%), together accounting for 38.6% of all Prince William County residents.
| Immigration Origin | # Population | % Population |
| Afghanistan | 3,937 | 0.8% |
| Africa | 21,853 | 4.5% |
| Albania | 49 | 0.0% |
| Argentina | 992 | 0.2% |
| Armenia | 16 | 0.0% |
| Asia | 36,952 | 7.7% |
| Australia | 70 | 0.0% |
| Austria | 50 | 0.0% |
| Bahamas | 9 | 0.0% |
| Bangladesh | 2,127 | 0.4% |
| Barbados | 20 | 0.0% |
| Belarus | 28 | 0.0% |
| Belgium | 42 | 0.0% |
| Belize | 54 | 0.0% |
| Bolivia | 3,893 | 0.8% |
| Bosnia and Herzegovina | 70 | 0.0% |
| Brazil | 451 | 0.1% |
| Bulgaria | 189 | 0.0% |
| Cambodia | 571 | 0.1% |
| Cameroon | 500 | 0.1% |
| Canada | 425 | 0.1% |
| Caribbean | 3,236 | 0.7% |
| Central America | 42,420 | 8.8% |
| Chile | 470 | 0.1% |
| China | 1,512 | 0.3% |
| Colombia | 1,313 | 0.3% |
| Congo | 82 | 0.0% |
| Costa Rica | 104 | 0.0% |
| Croatia | 45 | 0.0% |
| Cuba | 164 | 0.0% |
| Czechoslovakia | 104 | 0.0% |
| Denmark | 8 | 0.0% |
| Dominican Republic | 673 | 0.1% |
| Eastern Africa | 7,249 | 1.5% |
| Eastern Asia | 6,261 | 1.3% |
| Eastern Europe | 2,403 | 0.5% |
| Ecuador | 609 | 0.1% |
| Egypt | 685 | 0.1% |
| El Salvador | 25,649 | 5.3% |
| England | 521 | 0.1% |
| Eritrea | 457 | 0.1% |
| Ethiopia | 4,948 | 1.0% |
| Europe | 5,772 | 1.2% |
| France | 103 | 0.0% |
| Germany | 908 | 0.2% |
| Ghana | 7,755 | 1.6% |
| Greece | 199 | 0.0% |
| Grenada | 30 | 0.0% |
| Guatemala | 5,732 | 1.2% |
| Guyana | 128 | 0.0% |
| Haiti | 165 | 0.0% |
| Honduras | 4,254 | 0.9% |
| Hong Kong | 101 | 0.0% |
| Hungary | 90 | 0.0% |
| India | 3,720 | 0.8% |
| Indonesia | 222 | 0.1% |
| Iran | 543 | 0.1% |
| Iraq | 1,415 | 0.3% |
| Ireland | 87 | 0.0% |
| Israel | 73 | 0.0% |
| Italy | 364 | 0.1% |
| Jamaica | 1,195 | 0.3% |
| Japan | 483 | 0.1% |
| Jordan | 389 | 0.1% |
| Kazakhstan | 23 | 0.0% |
| Kenya | 345 | 0.1% |
| Korea | 4,249 | 0.9% |
| Kuwait | 108 | 0.0% |
| Laos | 288 | 0.1% |
| Latin America | 59,037 | 12.3% |
| Lebanon | 637 | 0.1% |
| Liberia | 644 | 0.1% |
| Lithuania | 17 | 0.0% |
| Malaysia | 67 | 0.0% |
| Mexico | 5,305 | 1.1% |
| Middle Africa | 706 | 0.2% |
| Moldova | 27 | 0.0% |
| Morocco | 939 | 0.2% |
| Nepal | 1,379 | 0.3% |
| Netherlands | 28 | 0.0% |
| Nicaragua | 863 | 0.2% |
| Nigeria | 1,155 | 0.2% |
| North Macedonia | 98 | 0.0% |
| Northern Africa | 2,525 | 0.5% |
| Northern Europe | 1,156 | 0.2% |
| Norway | 28 | 0.0% |
| Oceania | 91 | 0.0% |
| Pakistan | 4,955 | 1.0% |
| Panama | 446 | 0.1% |
| Peru | 4,297 | 0.9% |
| Philippines | 4,678 | 1.0% |
| Poland | 167 | 0.0% |
| Portugal | 217 | 0.1% |
| Romania | 351 | 0.1% |
| Russia | 703 | 0.2% |
| Saudi Arabia | 116 | 0.0% |
| Scotland | 29 | 0.0% |
| Senegal | 61 | 0.0% |
| Serbia | 5 | 0.0% |
| Sierra Leone | 1,440 | 0.3% |
| Singapore | 41 | 0.0% |
| Somalia | 242 | 0.1% |
| South Africa | 25 | 0.0% |
| South America | 13,381 | 2.8% |
| South Central Asia | 17,010 | 3.5% |
| South Eastern Asia | 9,898 | 2.1% |
| Southern Europe | 1,044 | 0.2% |
| Spain | 247 | 0.1% |
| Sri Lanka | 83 | 0.0% |
| Sudan | 489 | 0.1% |
| Sweden | 94 | 0.0% |
| Switzerland | 36 | 0.0% |
| Syria | 86 | 0.0% |
| Taiwan | 114 | 0.0% |
| Thailand | 584 | 0.1% |
| Trinidad and Tobago | 795 | 0.2% |
| Turkey | 487 | 0.1% |
| Uganda | 312 | 0.1% |
| Ukraine | 379 | 0.1% |
| Uruguay | 68 | 0.0% |
| Uzbekistan | 142 | 0.0% |
| Venezuela | 975 | 0.2% |
| Vietnam | 3,403 | 0.7% |
| West Indies | 75 | 0.0% |
| Western Africa | 11,262 | 2.3% |
| Western Asia | 3,780 | 0.8% |
| Western Europe | 1,167 | 0.2% |
| Yemen | 46 | 0.0% |
| Zaire | 80 | 0.0% |
| Zimbabwe | 64 | 0.0% | View All 130 Rows |
Sex and Age in Prince William County
Sex and Age in Prince William County
The most populous age groups in Prince William County are 10 to 14 Years (19,573 | 8.1%) for men and 10 to 14 Years (18,324 | 7.7%) for women.
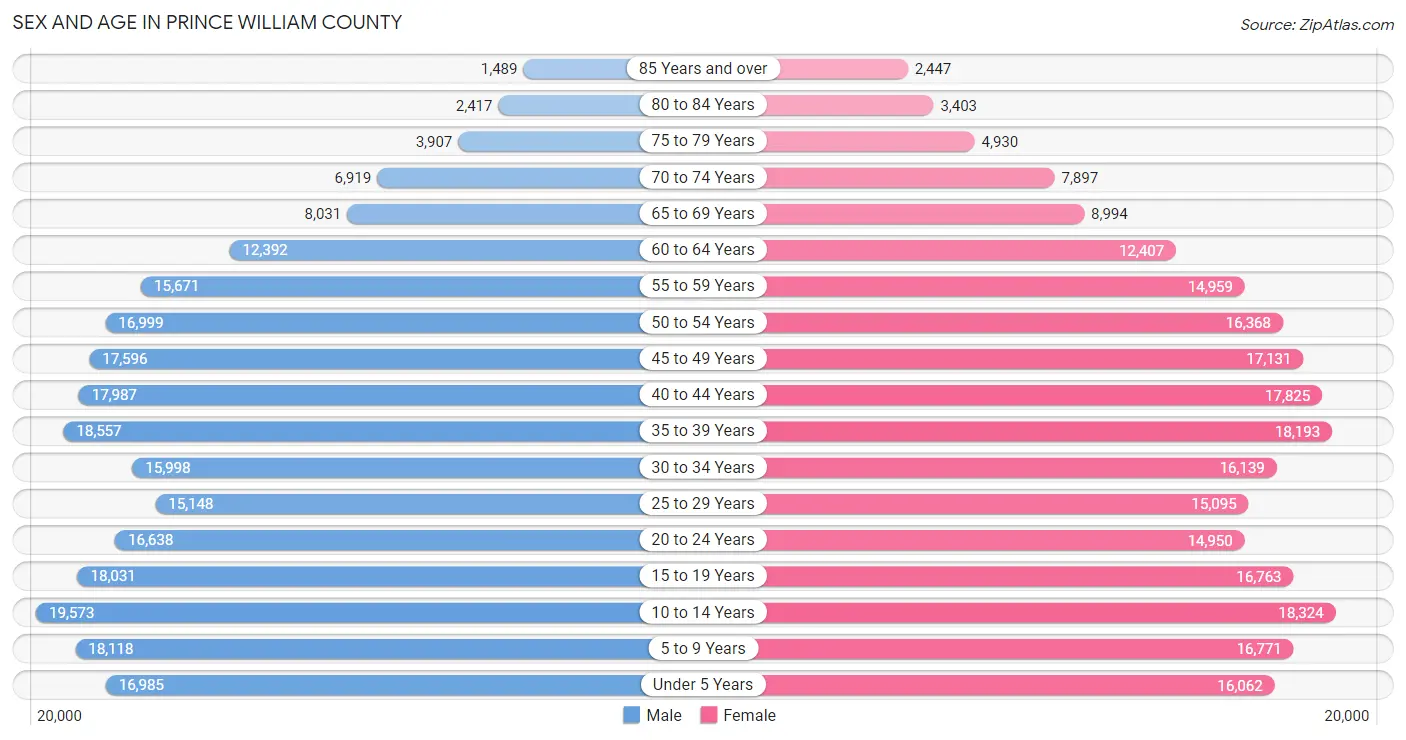
| Age Bracket | Male | Female |
| Under 5 Years | 16,985 (7.0%) | 16,062 (6.7%) |
| 5 to 9 Years | 18,118 (7.5%) | 16,771 (7.0%) |
| 10 to 14 Years | 19,573 (8.1%) | 18,324 (7.7%) |
| 15 to 19 Years | 18,031 (7.4%) | 16,763 (7.0%) |
| 20 to 24 Years | 16,638 (6.9%) | 14,950 (6.3%) |
| 25 to 29 Years | 15,148 (6.2%) | 15,095 (6.3%) |
| 30 to 34 Years | 15,998 (6.6%) | 16,139 (6.8%) |
| 35 to 39 Years | 18,557 (7.6%) | 18,193 (7.6%) |
| 40 to 44 Years | 17,987 (7.4%) | 17,825 (7.5%) |
| 45 to 49 Years | 17,596 (7.3%) | 17,131 (7.2%) |
| 50 to 54 Years | 16,999 (7.0%) | 16,368 (6.9%) |
| 55 to 59 Years | 15,671 (6.5%) | 14,959 (6.3%) |
| 60 to 64 Years | 12,392 (5.1%) | 12,407 (5.2%) |
| 65 to 69 Years | 8,031 (3.3%) | 8,994 (3.8%) |
| 70 to 74 Years | 6,919 (2.9%) | 7,897 (3.3%) |
| 75 to 79 Years | 3,907 (1.6%) | 4,930 (2.1%) |
| 80 to 84 Years | 2,417 (1.0%) | 3,403 (1.4%) |
| 85 Years and over | 1,489 (0.6%) | 2,447 (1.0%) |
| Total | 242,456 (100.0%) | 238,658 (100.0%) |
Families and Households in Prince William County
Median Family Size in Prince William County
The median family size in Prince William County is 3.58 persons per family, with married-couple families (90,737 | 77.7%) accounting for the largest median family size of 3.61 persons per family. On the other hand, single male/father families (8,782 | 7.5%) represent the smallest median family size with 3.32 persons per family.
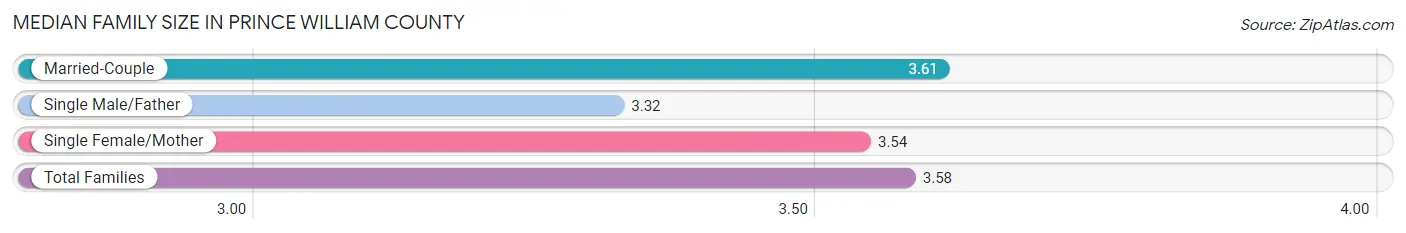
| Family Type | # Families | Family Size |
| Married-Couple | 90,737 (77.7%) | 3.61 |
| Single Male/Father | 8,782 (7.5%) | 3.32 |
| Single Female/Mother | 17,188 (14.7%) | 3.54 |
| Total Families | 116,707 (100.0%) | 3.58 |
Median Household Size in Prince William County
The median household size in Prince William County is 3.13 persons per household, with single female/mother households (17,188 | 11.3%) accounting for the largest median household size of 3.81 persons per household. non-family households (35,909 | 23.5%) represent the smallest median household size with 1.31 persons per household.
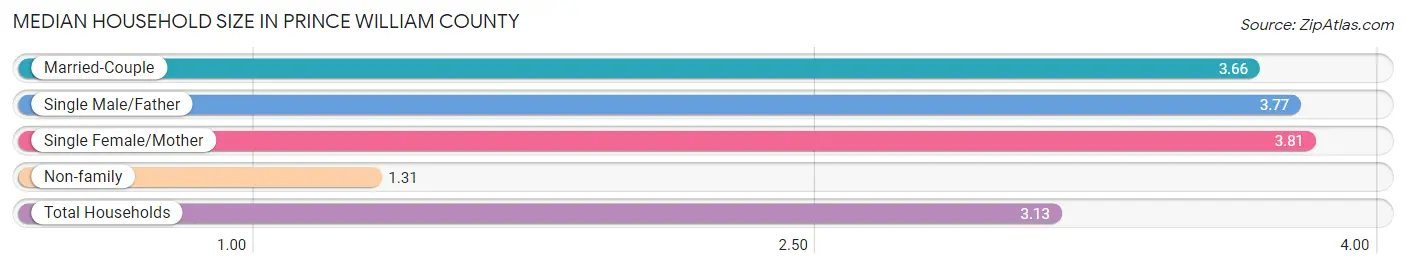
| Household Type | # Households | Household Size |
| Married-Couple | 90,737 (59.5%) | 3.66 |
| Single Male/Father | 8,782 (5.8%) | 3.77 |
| Single Female/Mother | 17,188 (11.3%) | 3.81 |
| Non-family | 35,909 (23.5%) | 1.31 |
| Total Households | 152,616 (100.0%) | 3.13 |
Household Size by Marriage Status in Prince William County
Out of a total of 152,616 households in Prince William County, 116,707 (76.5%) are family households, while 35,909 (23.5%) are nonfamily households. The most numerous type of family households are 2-person households, comprising 36,649, and the most common type of nonfamily households are 1-person households, comprising 29,013.
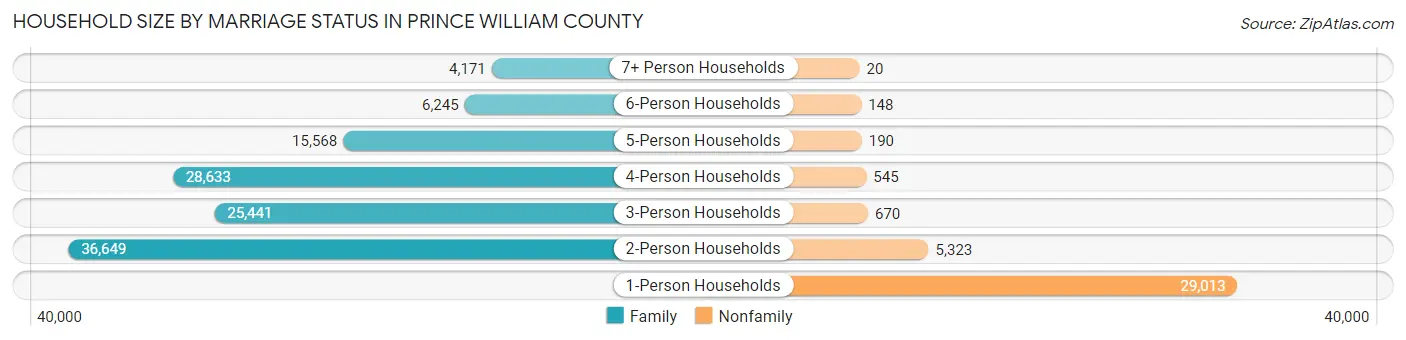
| Household Size | Family Households | Nonfamily Households |
| 1-Person Households | - | 29,013 (19.0%) |
| 2-Person Households | 36,649 (24.0%) | 5,323 (3.5%) |
| 3-Person Households | 25,441 (16.7%) | 670 (0.4%) |
| 4-Person Households | 28,633 (18.8%) | 545 (0.4%) |
| 5-Person Households | 15,568 (10.2%) | 190 (0.1%) |
| 6-Person Households | 6,245 (4.1%) | 148 (0.1%) |
| 7+ Person Households | 4,171 (2.7%) | 20 (0.0%) |
| Total | 116,707 (76.5%) | 35,909 (23.5%) |
Female Fertility in Prince William County
Fertility by Age in Prince William County
Average fertility rate in Prince William County is 59.0 births per 1,000 women. Women in the age bracket of 20 to 34 years have the highest fertility rate with 91.0 births per 1,000 women. Women in the age bracket of 20 to 34 years acount for 59.6% of all women with births.
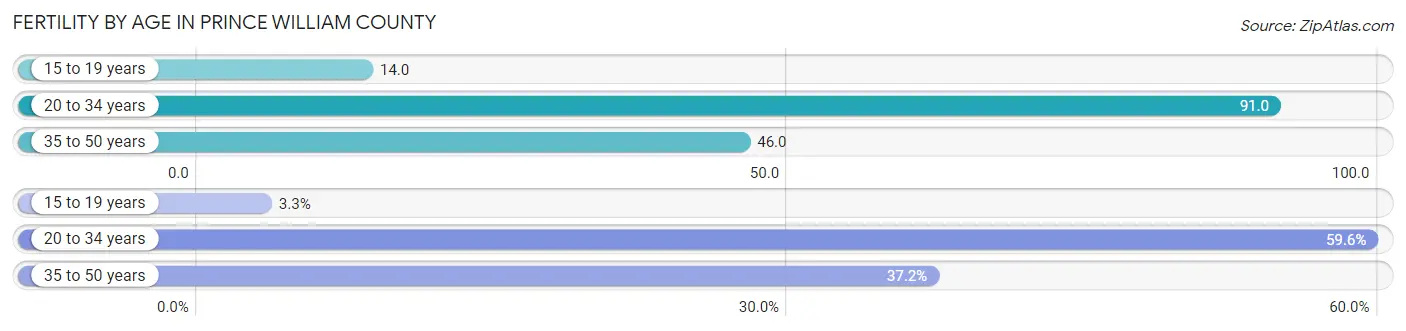
| Age Bracket | Women with Births | Births / 1,000 Women |
| 15 to 19 years | 228 (3.3%) | 14.0 |
| 20 to 34 years | 4,181 (59.6%) | 91.0 |
| 35 to 50 years | 2,612 (37.2%) | 46.0 |
| Total | 7,021 (100.0%) | 59.0 |
Fertility by Age by Marriage Status in Prince William County
70.7% of women with births (7,021) in Prince William County are married. The highest percentage of unmarried women with births falls into 15 to 19 years age bracket with 100.0% of them unmarried at the time of birth, while the lowest percentage of unmarried women with births belong to 35 to 50 years age bracket with 20.1% of them unmarried.
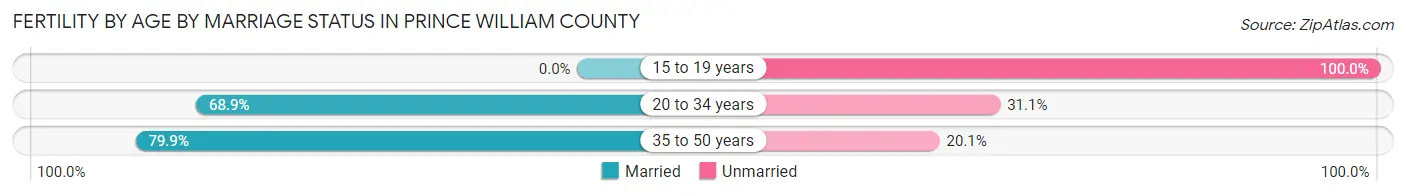
| Age Bracket | Married | Unmarried |
| 15 to 19 years | 0 (0.0%) | 228 (100.0%) |
| 20 to 34 years | 2,881 (68.9%) | 1,300 (31.1%) |
| 35 to 50 years | 2,087 (79.9%) | 525 (20.1%) |
| Total | 4,964 (70.7%) | 2,057 (29.3%) |
Fertility by Education in Prince William County
Average fertility rate in Prince William County is 59.0 births per 1,000 women. Women with the education attainment of high school diploma have the highest fertility rate of 70.0 births per 1,000 women, while women with the education attainment of less than high school have the lowest fertility at 36.0 births per 1,000 women. Women with the education attainment of college or associate's degree represent 31.0% of all women with births.
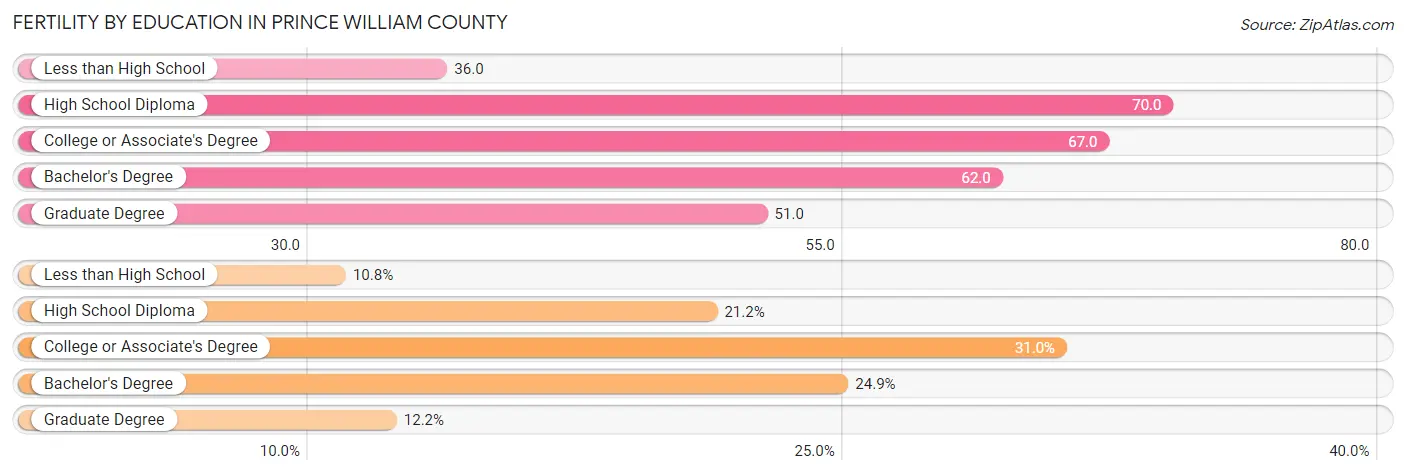
| Educational Attainment | Women with Births | Births / 1,000 Women |
| Less than High School | 755 (10.7%) | 36.0 |
| High School Diploma | 1,488 (21.2%) | 70.0 |
| College or Associate's Degree | 2,177 (31.0%) | 67.0 |
| Bachelor's Degree | 1,746 (24.9%) | 62.0 |
| Graduate Degree | 855 (12.2%) | 51.0 |
| Total | 7,021 (100.0%) | 59.0 |
Fertility by Education by Marriage Status in Prince William County
29.3% of women with births in Prince William County are unmarried. Women with the educational attainment of graduate degree are most likely to be married with 96.7% of them married at childbirth, while women with the educational attainment of less than high school are least likely to be married with 53.9% of them unmarried at childbirth.
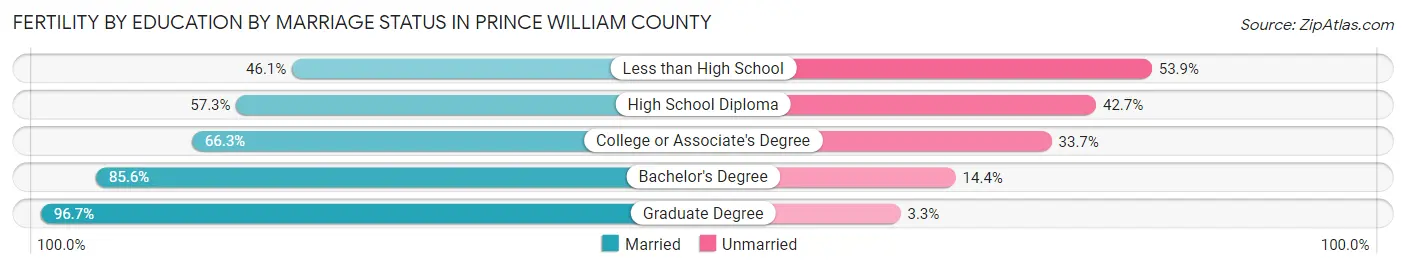
| Educational Attainment | Married | Unmarried |
| Less than High School | 348 (46.1%) | 407 (53.9%) |
| High School Diploma | 853 (57.3%) | 635 (42.7%) |
| College or Associate's Degree | 1,443 (66.3%) | 734 (33.7%) |
| Bachelor's Degree | 1,495 (85.6%) | 251 (14.4%) |
| Graduate Degree | 827 (96.7%) | 28 (3.3%) |
| Total | 4,964 (70.7%) | 2,057 (29.3%) |
Employment Characteristics in Prince William County
Employment by Class of Employer in Prince William County
Among the 249,858 employed individuals in Prince William County, private company employees (147,694 | 59.1%), federal government employees (38,091 | 15.2%), and local government employees (21,443 | 8.6%) make up the most common classes of employment.
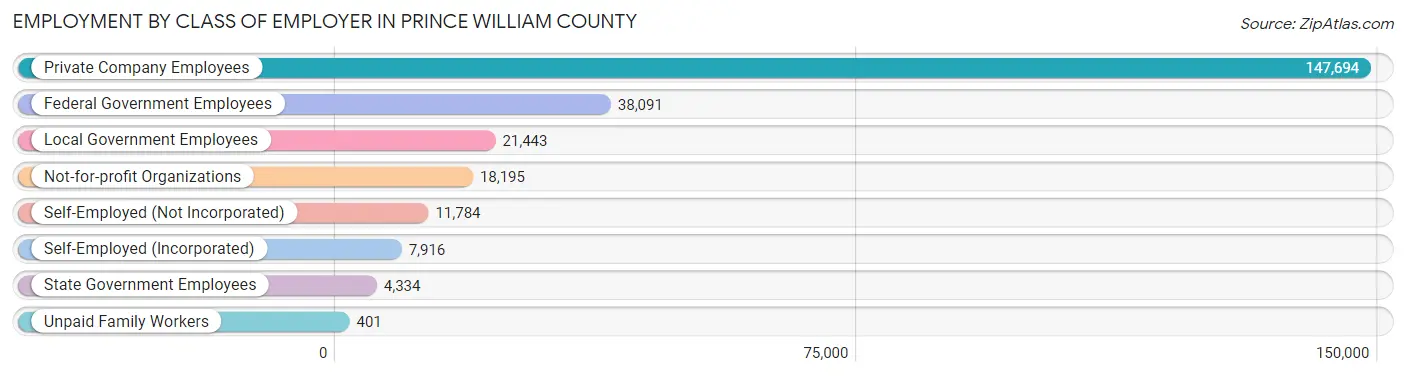
| Employer Class | # Employees | % Employees |
| Private Company Employees | 147,694 | 59.1% |
| Self-Employed (Incorporated) | 7,916 | 3.2% |
| Self-Employed (Not Incorporated) | 11,784 | 4.7% |
| Not-for-profit Organizations | 18,195 | 7.3% |
| Local Government Employees | 21,443 | 8.6% |
| State Government Employees | 4,334 | 1.7% |
| Federal Government Employees | 38,091 | 15.2% |
| Unpaid Family Workers | 401 | 0.2% |
| Total | 249,858 | 100.0% |
Employment Status by Age in Prince William County
According to the labor force statistics for Prince William County, out of the total population over 16 years of age (368,201), 72.3% or 266,209 individuals are in the labor force, with 4.7% or 12,512 of them unemployed. The age group with the highest labor force participation rate is 45 to 54 years, with 88.0% or 59,923 individuals in the labor force. Within the labor force, the 16 to 19 years age range has the highest percentage of unemployed individuals, with 13.1% or 1,365 of them being unemployed.
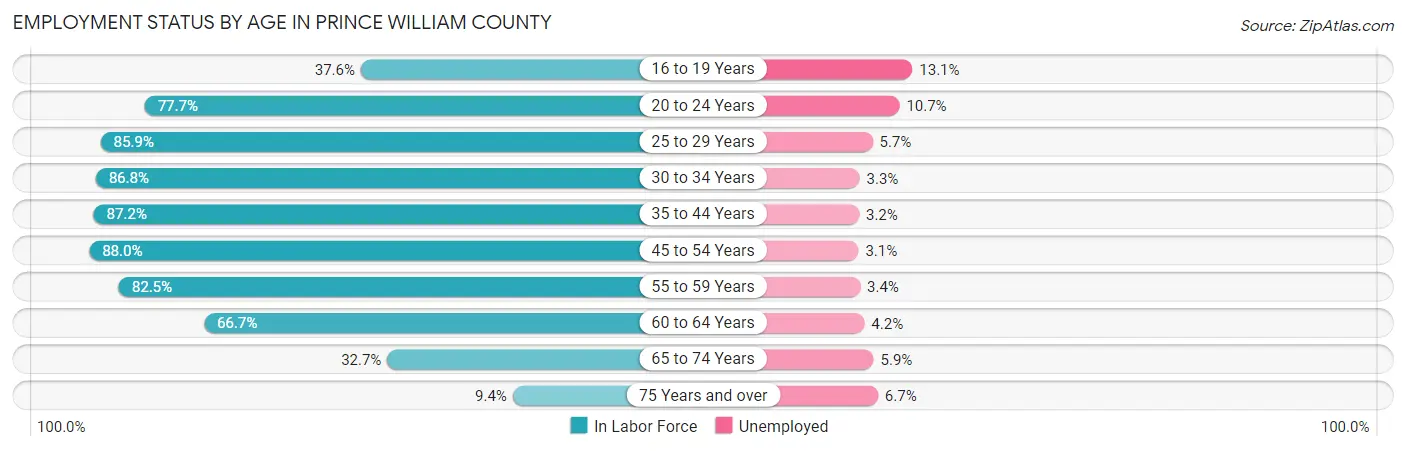
| Age Bracket | In Labor Force | Unemployed |
| 16 to 19 Years | 10,420 (37.6%) | 1,365 (13.1%) |
| 20 to 24 Years | 24,544 (77.7%) | 2,626 (10.7%) |
| 25 to 29 Years | 25,979 (85.9%) | 1,481 (5.7%) |
| 30 to 34 Years | 27,895 (86.8%) | 921 (3.3%) |
| 35 to 44 Years | 63,274 (87.2%) | 2,025 (3.2%) |
| 45 to 54 Years | 59,923 (88.0%) | 1,858 (3.1%) |
| 55 to 59 Years | 25,270 (82.5%) | 859 (3.4%) |
| 60 to 64 Years | 16,541 (66.7%) | 695 (4.2%) |
| 65 to 74 Years | 10,412 (32.7%) | 614 (5.9%) |
| 75 Years and over | 1,748 (9.4%) | 117 (6.7%) |
| Total | 266,209 (72.3%) | 12,512 (4.7%) |
Employment Status by Educational Attainment in Prince William County
According to labor force statistics for Prince William County, 84.7% of individuals (218,920) out of the total population between 25 and 64 years of age (258,465) are in the labor force, with 3.6% or 7,881 of them being unemployed. The group with the highest labor force participation rate are those with the educational attainment of bachelor's degree or higher, with 89.1% or 101,863 individuals in the labor force. Within the labor force, individuals with high school diploma education have the highest percentage of unemployment, with 5.5% or 2,240 of them being unemployed.
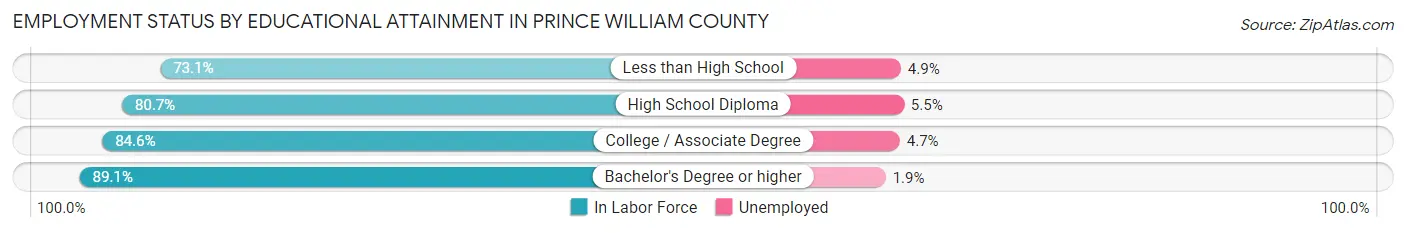
| Educational Attainment | In Labor Force | Unemployed |
| Less than High School | 18,296 (73.1%) | 1,226 (4.9%) |
| High School Diploma | 40,729 (80.7%) | 2,776 (5.5%) |
| College / Associate Degree | 58,071 (84.6%) | 3,226 (4.7%) |
| Bachelor's Degree or higher | 101,863 (89.1%) | 2,172 (1.9%) |
| Total | 218,920 (84.7%) | 9,305 (3.6%) |
Employment Occupations by Sex in Prince William County
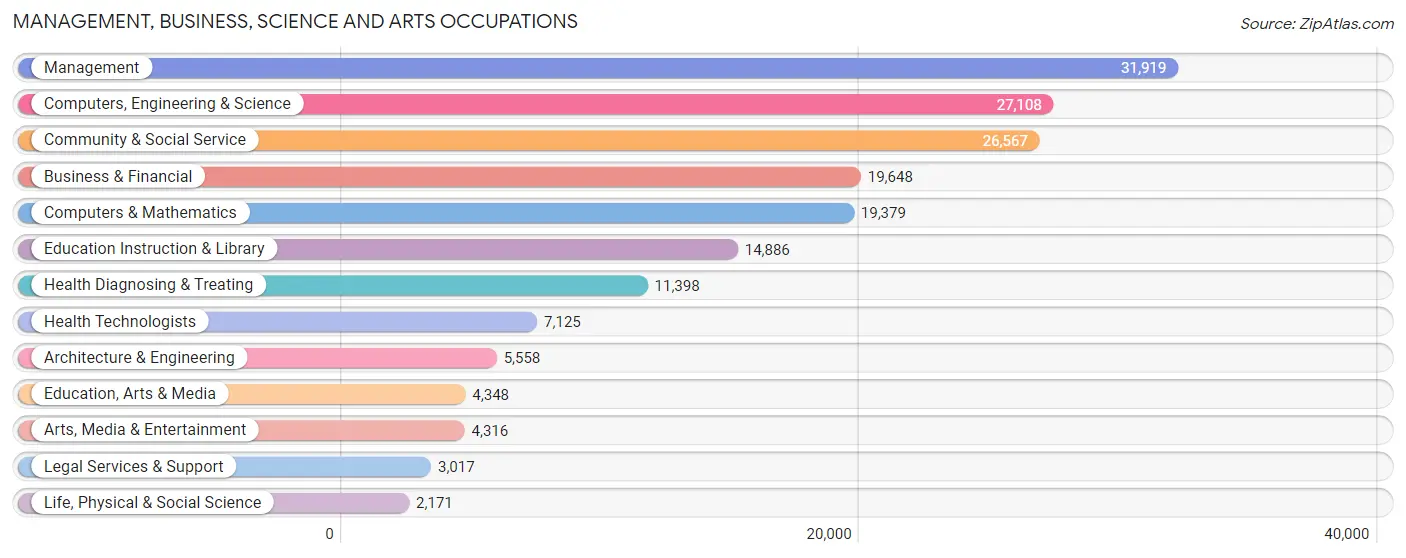
Management, Business, Science and Arts Occupations
The most common Management, Business, Science and Arts occupations in Prince William County are Management (31,919 | 12.9%), Computers, Engineering & Science (27,108 | 10.9%), Community & Social Service (26,567 | 10.7%), Business & Financial (19,648 | 7.9%), and Computers & Mathematics (19,379 | 7.8%).
Management, Business, Science and Arts Occupations by Sex
Within the Management, Business, Science and Arts occupations in Prince William County, the most male-oriented occupations are Architecture & Engineering (86.9%), Computers, Engineering & Science (74.5%), and Computers & Mathematics (72.8%), while the most female-oriented occupations are Health Technologists (83.7%), Education Instruction & Library (79.2%), and Health Diagnosing & Treating (77.0%).
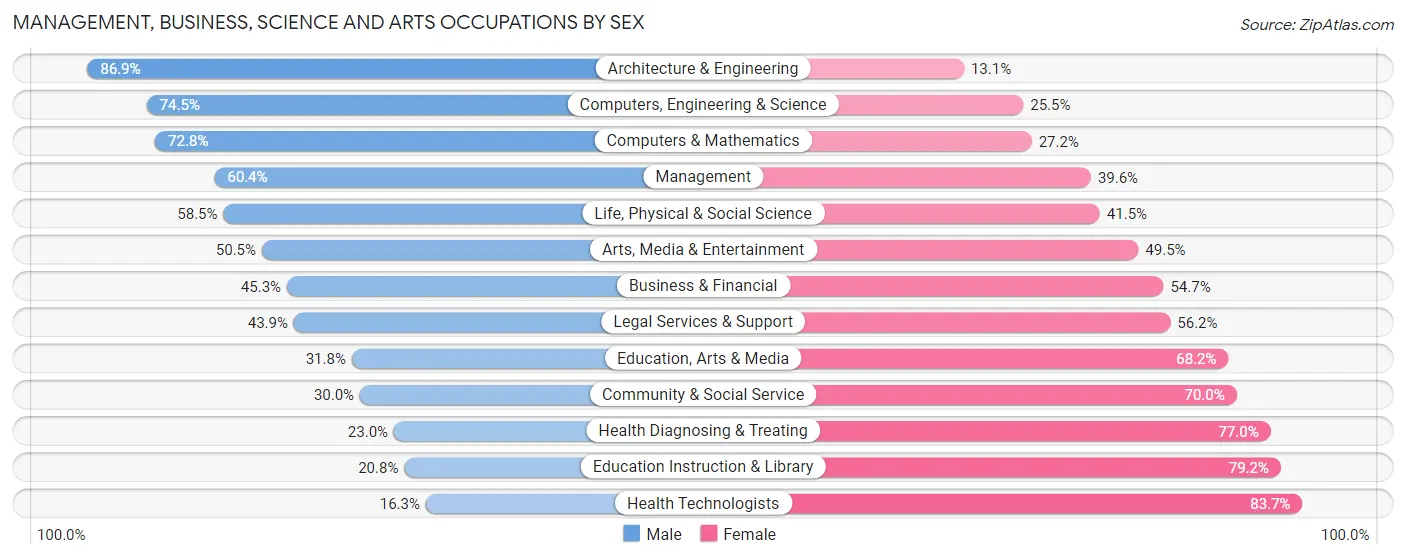
| Occupation | Male | Female |
| Management | 19,282 (60.4%) | 12,637 (39.6%) |
| Business & Financial | 8,897 (45.3%) | 10,751 (54.7%) |
| Computers, Engineering & Science | 20,204 (74.5%) | 6,904 (25.5%) |
| Computers & Mathematics | 14,103 (72.8%) | 5,276 (27.2%) |
| Architecture & Engineering | 4,830 (86.9%) | 728 (13.1%) |
| Life, Physical & Social Science | 1,271 (58.5%) | 900 (41.5%) |
| Community & Social Service | 7,982 (30.0%) | 18,585 (70.0%) |
| Education, Arts & Media | 1,381 (31.8%) | 2,967 (68.2%) |
| Legal Services & Support | 1,323 (43.9%) | 1,694 (56.1%) |
| Education Instruction & Library | 3,098 (20.8%) | 11,788 (79.2%) |
| Arts, Media & Entertainment | 2,180 (50.5%) | 2,136 (49.5%) |
| Health Diagnosing & Treating | 2,617 (23.0%) | 8,781 (77.0%) |
| Health Technologists | 1,162 (16.3%) | 5,963 (83.7%) |
| Total (Category) | 58,982 (50.6%) | 57,658 (49.4%) |
| Total (Overall) | 133,286 (53.8%) | 114,423 (46.2%) |
Services Occupations
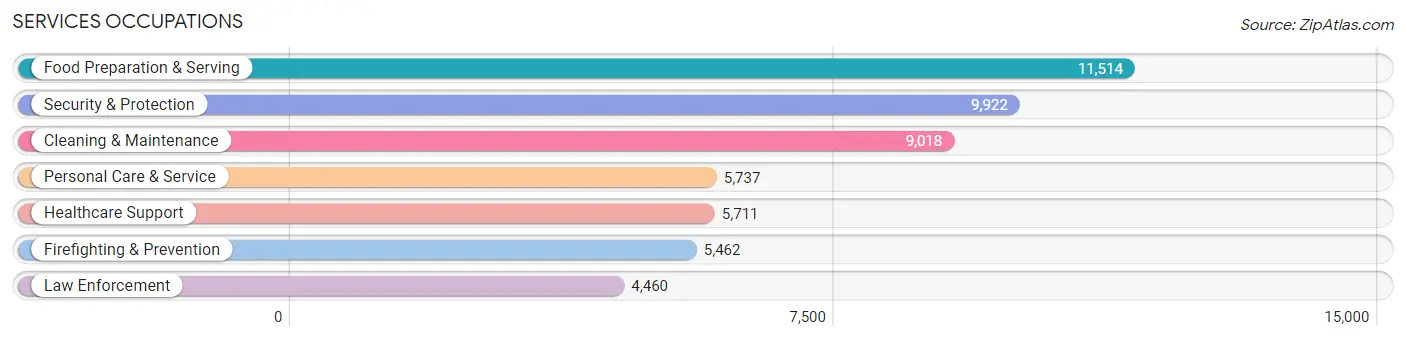
The most common Services occupations in Prince William County are Food Preparation & Serving (11,514 | 4.6%), Security & Protection (9,922 | 4.0%), Cleaning & Maintenance (9,018 | 3.6%), Personal Care & Service (5,737 | 2.3%), and Healthcare Support (5,711 | 2.3%).
Services Occupations by Sex
Within the Services occupations in Prince William County, the most male-oriented occupations are Law Enforcement (79.2%), Security & Protection (75.2%), and Firefighting & Prevention (71.9%), while the most female-oriented occupations are Healthcare Support (85.8%), Personal Care & Service (78.0%), and Food Preparation & Serving (56.7%).
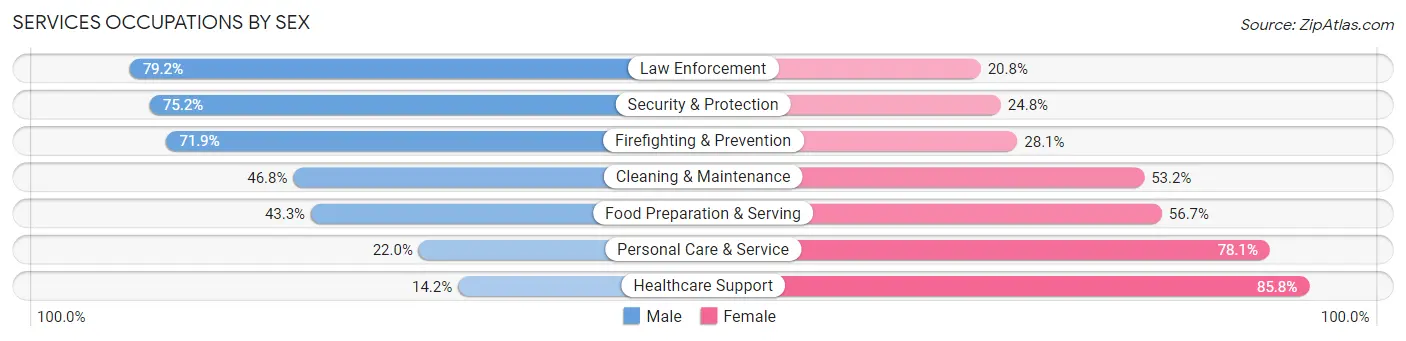
| Occupation | Male | Female |
| Healthcare Support | 809 (14.2%) | 4,902 (85.8%) |
| Security & Protection | 7,459 (75.2%) | 2,463 (24.8%) |
| Firefighting & Prevention | 3,928 (71.9%) | 1,534 (28.1%) |
| Law Enforcement | 3,531 (79.2%) | 929 (20.8%) |
| Food Preparation & Serving | 4,986 (43.3%) | 6,528 (56.7%) |
| Cleaning & Maintenance | 4,220 (46.8%) | 4,798 (53.2%) |
| Personal Care & Service | 1,259 (22.0%) | 4,478 (78.0%) |
| Total (Category) | 18,733 (44.7%) | 23,169 (55.3%) |
| Total (Overall) | 133,286 (53.8%) | 114,423 (46.2%) |
Sales and Office Occupations
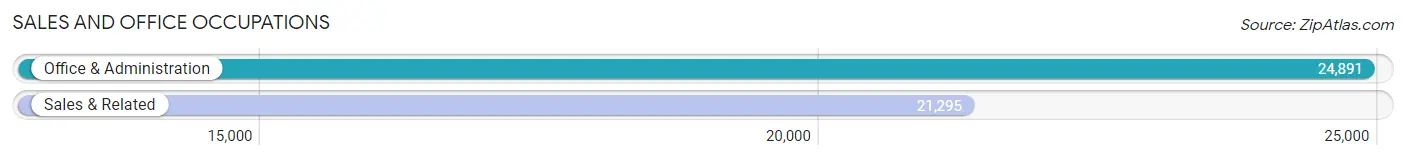
The most common Sales and Office occupations in Prince William County are Office & Administration (24,891 | 10.1%), and Sales & Related (21,295 | 8.6%).
Sales and Office Occupations by Sex
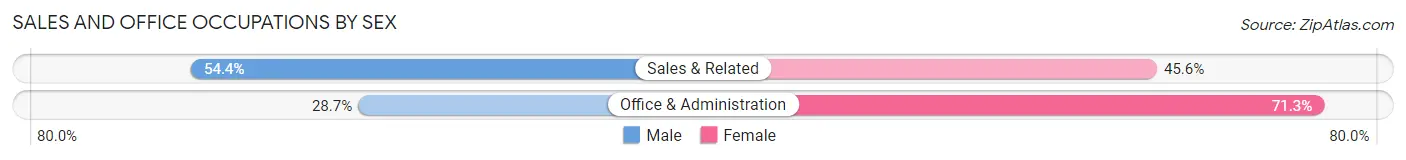
| Occupation | Male | Female |
| Sales & Related | 11,580 (54.4%) | 9,715 (45.6%) |
| Office & Administration | 7,145 (28.7%) | 17,746 (71.3%) |
| Total (Category) | 18,725 (40.5%) | 27,461 (59.5%) |
| Total (Overall) | 133,286 (53.8%) | 114,423 (46.2%) |
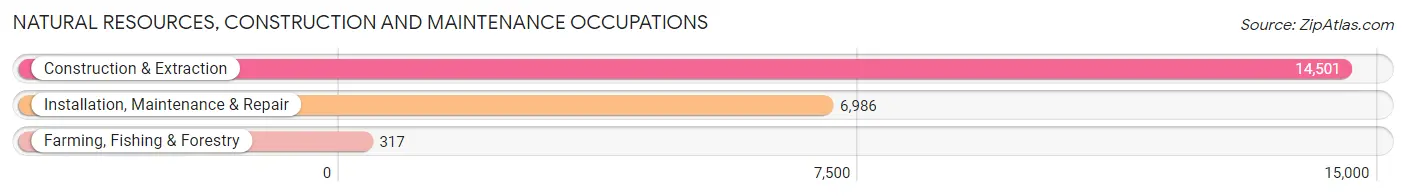
Natural Resources, Construction and Maintenance Occupations
The most common Natural Resources, Construction and Maintenance occupations in Prince William County are Construction & Extraction (14,501 | 5.9%), Installation, Maintenance & Repair (6,986 | 2.8%), and Farming, Fishing & Forestry (317 | 0.1%).
Natural Resources, Construction and Maintenance Occupations by Sex
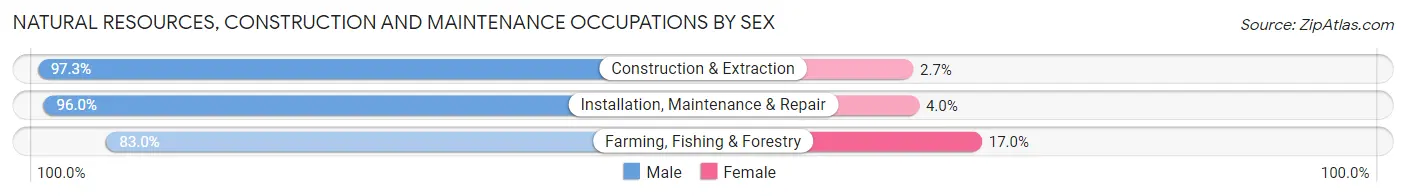
| Occupation | Male | Female |
| Farming, Fishing & Forestry | 263 (83.0%) | 54 (17.0%) |
| Construction & Extraction | 14,103 (97.3%) | 398 (2.7%) |
| Installation, Maintenance & Repair | 6,709 (96.0%) | 277 (4.0%) |
| Total (Category) | 21,075 (96.7%) | 729 (3.3%) |
| Total (Overall) | 133,286 (53.8%) | 114,423 (46.2%) |
Production, Transportation and Moving Occupations
The most common Production, Transportation and Moving occupations in Prince William County are Transportation (8,489 | 3.4%), Production (6,547 | 2.6%), and Material Moving (6,141 | 2.5%).
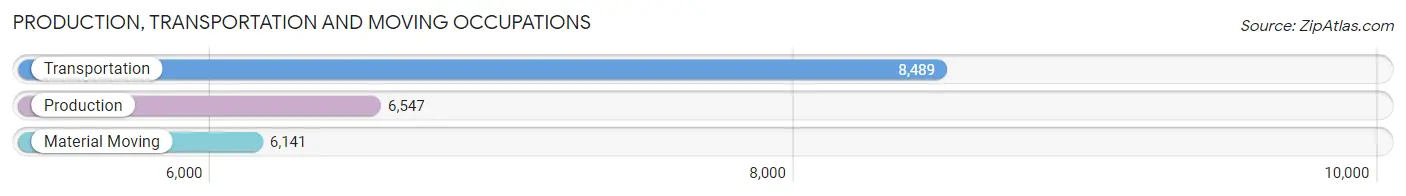
Production, Transportation and Moving Occupations by Sex
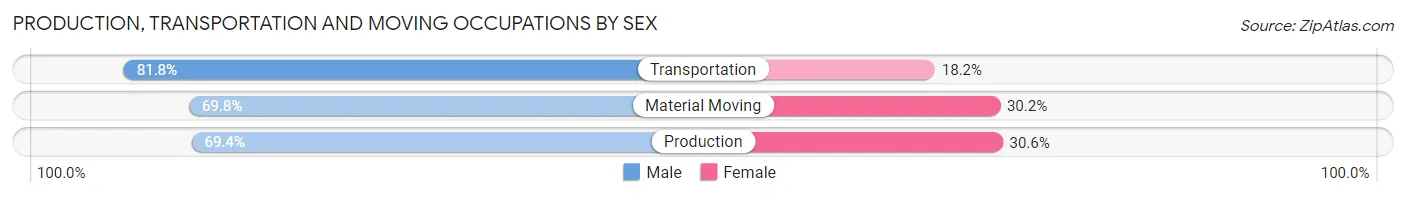
| Occupation | Male | Female |
| Production | 4,541 (69.4%) | 2,006 (30.6%) |
| Transportation | 6,942 (81.8%) | 1,547 (18.2%) |
| Material Moving | 4,288 (69.8%) | 1,853 (30.2%) |
| Total (Category) | 15,771 (74.5%) | 5,406 (25.5%) |
| Total (Overall) | 133,286 (53.8%) | 114,423 (46.2%) |
Employment Industries by Sex in Prince William County
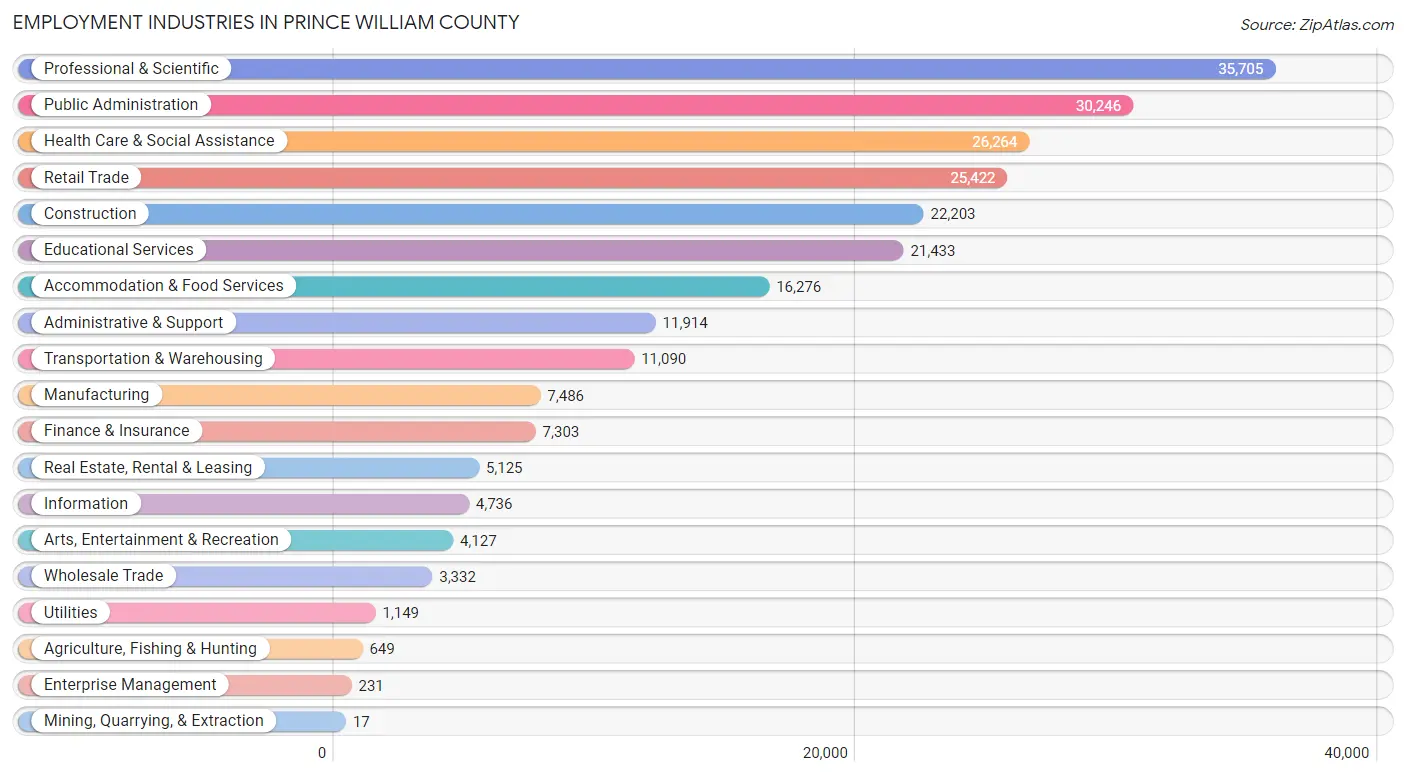
Employment Industries in Prince William County
The major employment industries in Prince William County include Professional & Scientific (35,705 | 14.4%), Public Administration (30,246 | 12.2%), Health Care & Social Assistance (26,264 | 10.6%), Retail Trade (25,422 | 10.3%), and Construction (22,203 | 9.0%).
Employment Industries by Sex in Prince William County
The Prince William County industries that see more men than women are Construction (88.4%), Mining, Quarrying, & Extraction (88.2%), and Transportation & Warehousing (76.2%), whereas the industries that tend to have a higher number of women are Health Care & Social Assistance (79.5%), Educational Services (77.2%), and Finance & Insurance (62.2%).
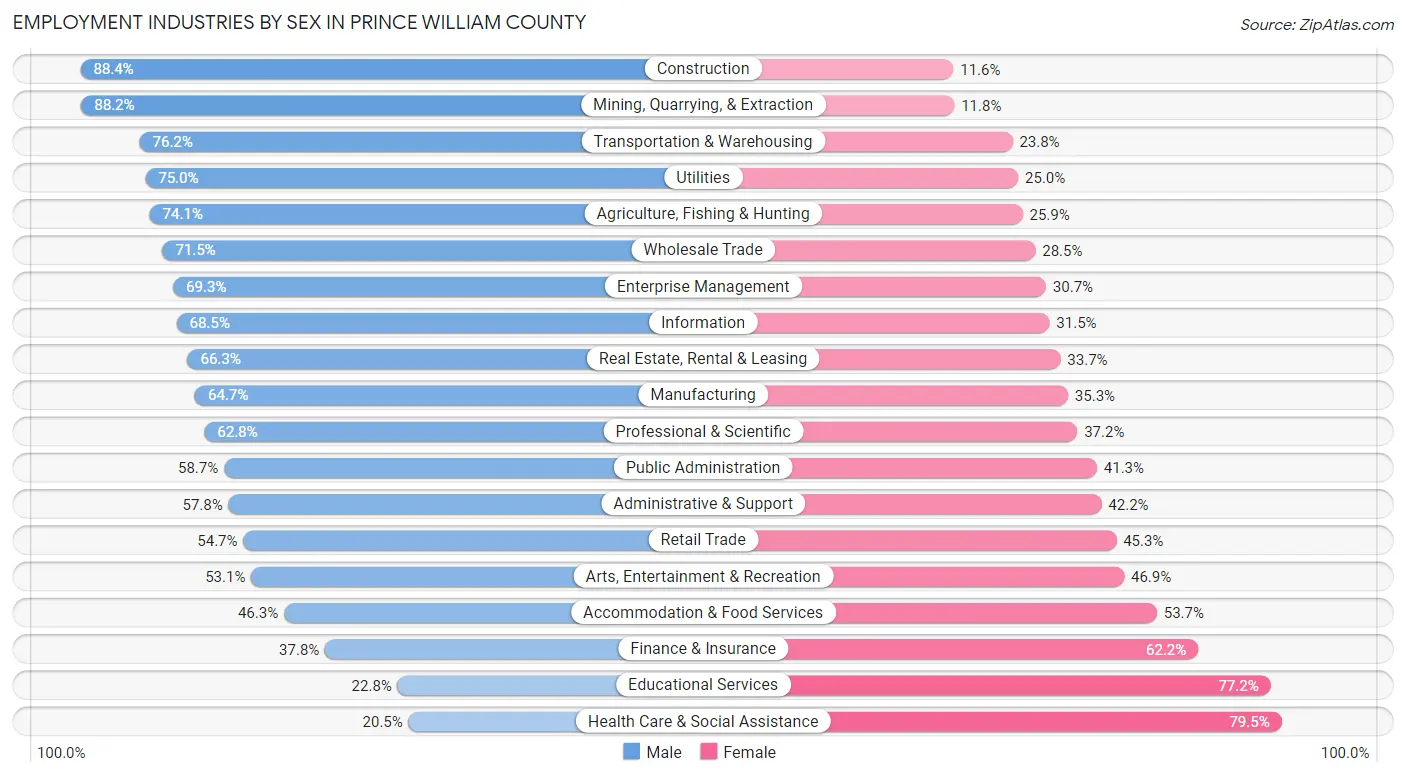
| Industry | Male | Female |
| Agriculture, Fishing & Hunting | 481 (74.1%) | 168 (25.9%) |
| Mining, Quarrying, & Extraction | 15 (88.2%) | 2 (11.8%) |
| Construction | 19,634 (88.4%) | 2,569 (11.6%) |
| Manufacturing | 4,844 (64.7%) | 2,642 (35.3%) |
| Wholesale Trade | 2,381 (71.5%) | 951 (28.5%) |
| Retail Trade | 13,912 (54.7%) | 11,510 (45.3%) |
| Transportation & Warehousing | 8,450 (76.2%) | 2,640 (23.8%) |
| Utilities | 862 (75.0%) | 287 (25.0%) |
| Information | 3,246 (68.5%) | 1,490 (31.5%) |
| Finance & Insurance | 2,760 (37.8%) | 4,543 (62.2%) |
| Real Estate, Rental & Leasing | 3,396 (66.3%) | 1,729 (33.7%) |
| Professional & Scientific | 22,416 (62.8%) | 13,289 (37.2%) |
| Enterprise Management | 160 (69.3%) | 71 (30.7%) |
| Administrative & Support | 6,884 (57.8%) | 5,030 (42.2%) |
| Educational Services | 4,882 (22.8%) | 16,551 (77.2%) |
| Health Care & Social Assistance | 5,388 (20.5%) | 20,876 (79.5%) |
| Arts, Entertainment & Recreation | 2,191 (53.1%) | 1,936 (46.9%) |
| Accommodation & Food Services | 7,537 (46.3%) | 8,739 (53.7%) |
| Public Administration | 17,760 (58.7%) | 12,486 (41.3%) |
| Total | 133,286 (53.8%) | 114,423 (46.2%) |
Education in Prince William County
School Enrollment in Prince William County
The most common levels of schooling among the 134,518 students in Prince William County are middle school (30,745 | 22.9%), high school (30,181 | 22.4%), and elementary school (27,602 | 20.5%).
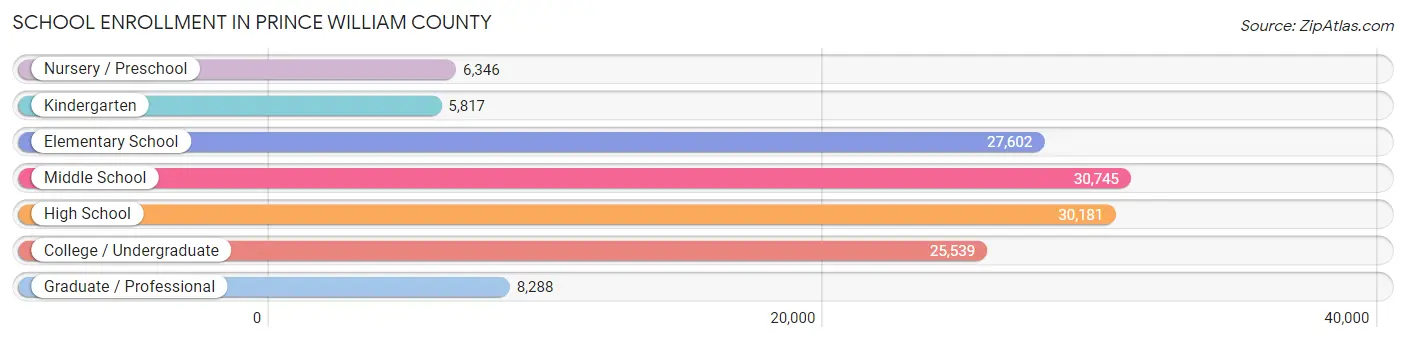
| School Level | # Students | % Students |
| Nursery / Preschool | 6,346 | 4.7% |
| Kindergarten | 5,817 | 4.3% |
| Elementary School | 27,602 | 20.5% |
| Middle School | 30,745 | 22.9% |
| High School | 30,181 | 22.4% |
| College / Undergraduate | 25,539 | 19.0% |
| Graduate / Professional | 8,288 | 6.2% |
| Total | 134,518 | 100.0% |
School Enrollment by Age by Funding Source in Prince William County
Out of a total of 134,518 students who are enrolled in schools in Prince William County, 19,505 (14.5%) attend a private institution, while the remaining 115,013 (85.5%) are enrolled in public schools. The age group of 3 to 4 year olds has the highest likelihood of being enrolled in private schools, with 2,538 (52.8% in the age bracket) enrolled. Conversely, the age group of 15 to 17 year olds has the lowest likelihood of being enrolled in a private school, with 19,987 (92.1% in the age bracket) attending a public institution.
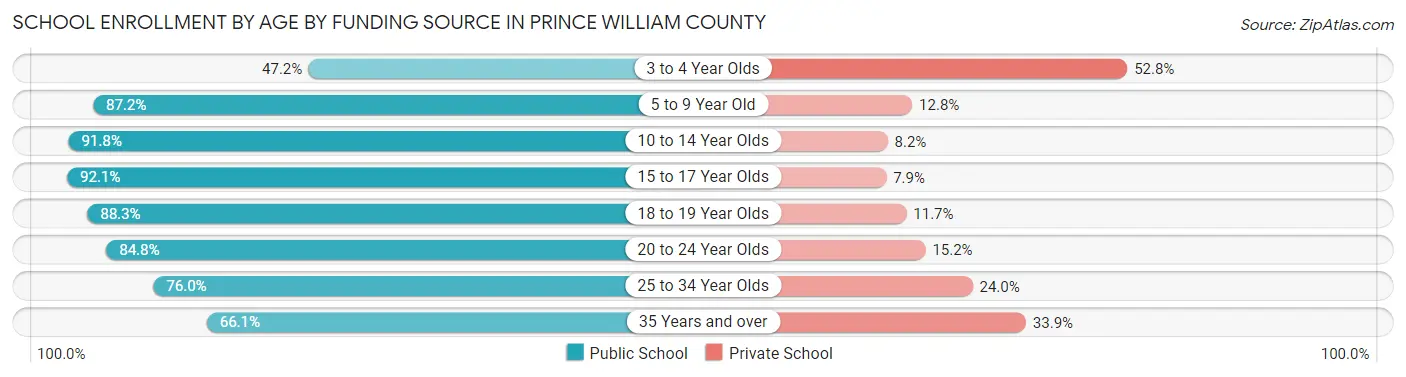
| Age Bracket | Public School | Private School |
| 3 to 4 Year Olds | 2,268 (47.2%) | 2,538 (52.8%) |
| 5 to 9 Year Old | 28,398 (87.2%) | 4,154 (12.8%) |
| 10 to 14 Year Olds | 33,609 (91.8%) | 2,993 (8.2%) |
| 15 to 17 Year Olds | 19,987 (92.1%) | 1,720 (7.9%) |
| 18 to 19 Year Olds | 8,342 (88.3%) | 1,103 (11.7%) |
| 20 to 24 Year Olds | 9,715 (84.8%) | 1,746 (15.2%) |
| 25 to 34 Year Olds | 6,174 (76.0%) | 1,950 (24.0%) |
| 35 Years and over | 6,488 (66.1%) | 3,333 (33.9%) |
| Total | 115,013 (85.5%) | 19,505 (14.5%) |
Educational Attainment by Field of Study in Prince William County
Business (29,476 | 20.4%), social sciences (13,803 | 9.6%), computers & mathematics (12,132 | 8.4%), education (12,086 | 8.4%), and engineering (11,926 | 8.3%) are the most common fields of study among 144,546 individuals in Prince William County who have obtained a bachelor's degree or higher.
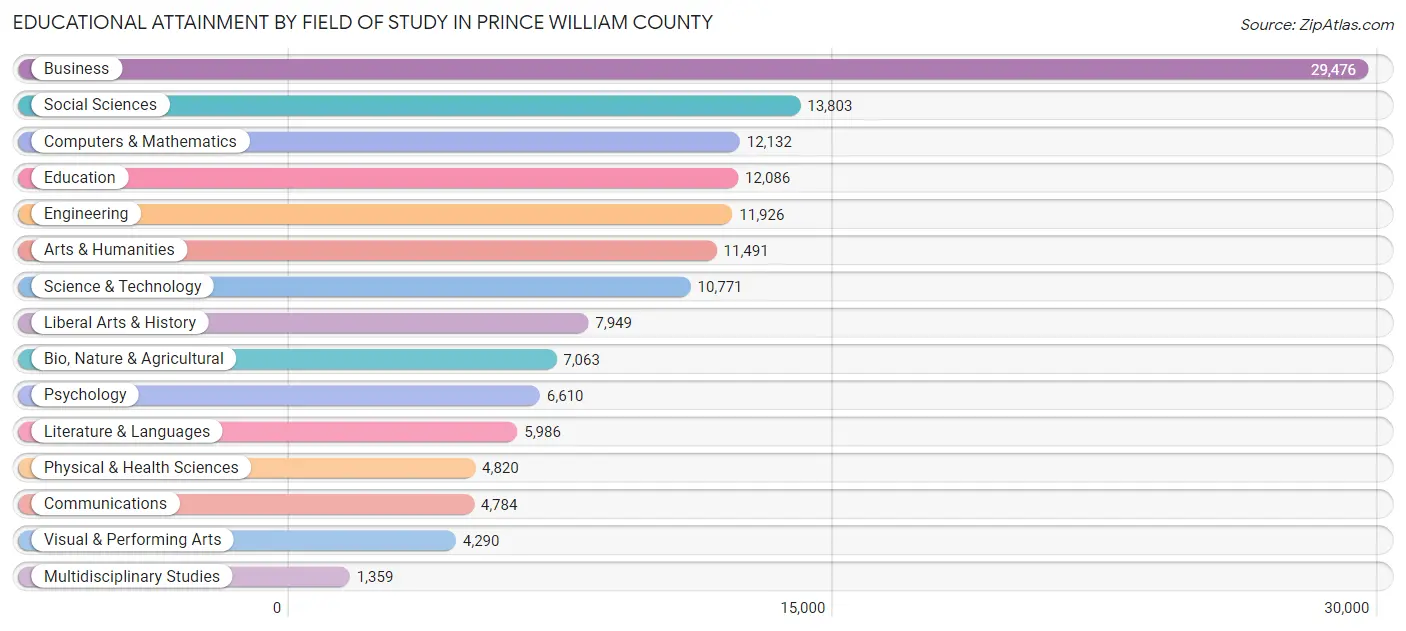
| Field of Study | # Graduates | % Graduates |
| Computers & Mathematics | 12,132 | 8.4% |
| Bio, Nature & Agricultural | 7,063 | 4.9% |
| Physical & Health Sciences | 4,820 | 3.3% |
| Psychology | 6,610 | 4.6% |
| Social Sciences | 13,803 | 9.6% |
| Engineering | 11,926 | 8.3% |
| Multidisciplinary Studies | 1,359 | 0.9% |
| Science & Technology | 10,771 | 7.4% |
| Business | 29,476 | 20.4% |
| Education | 12,086 | 8.4% |
| Literature & Languages | 5,986 | 4.1% |
| Liberal Arts & History | 7,949 | 5.5% |
| Visual & Performing Arts | 4,290 | 3.0% |
| Communications | 4,784 | 3.3% |
| Arts & Humanities | 11,491 | 8.0% |
| Total | 144,546 | 100.0% |
Transportation & Commute in Prince William County
Vehicle Availability by Sex in Prince William County
The most prevalent vehicle ownership categories in Prince William County are males with 2 vehicles (54,856, accounting for 40.5%) and females with 2 vehicles (43,020, making up 48.7%).
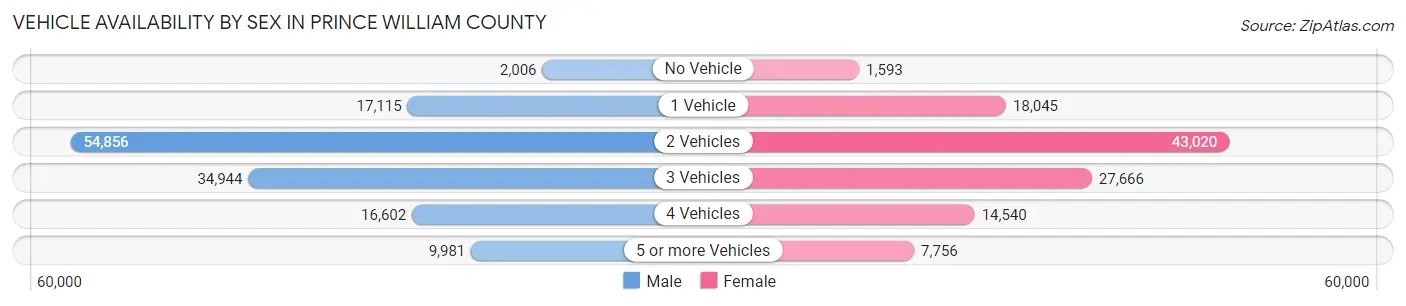
| Vehicles Available | Male | Female |
| No Vehicle | 2,006 (1.5%) | 1,593 (1.4%) |
| 1 Vehicle | 17,115 (12.6%) | 18,045 (16.0%) |
| 2 Vehicles | 54,856 (40.5%) | 43,020 (38.2%) |
| 3 Vehicles | 34,944 (25.8%) | 27,666 (24.6%) |
| 4 Vehicles | 16,602 (12.2%) | 14,540 (12.9%) |
| 5 or more Vehicles | 9,981 (7.4%) | 7,756 (6.9%) |
| Total | 135,504 (100.0%) | 112,620 (100.0%) |
Commute Time in Prince William County
The most frequently occuring commute durations in Prince William County are 45 to 59 minutes (39,022 commuters, 18.4%), 60 to 89 minutes (34,130 commuters, 16.1%), and 30 to 34 minutes (31,175 commuters, 14.7%).
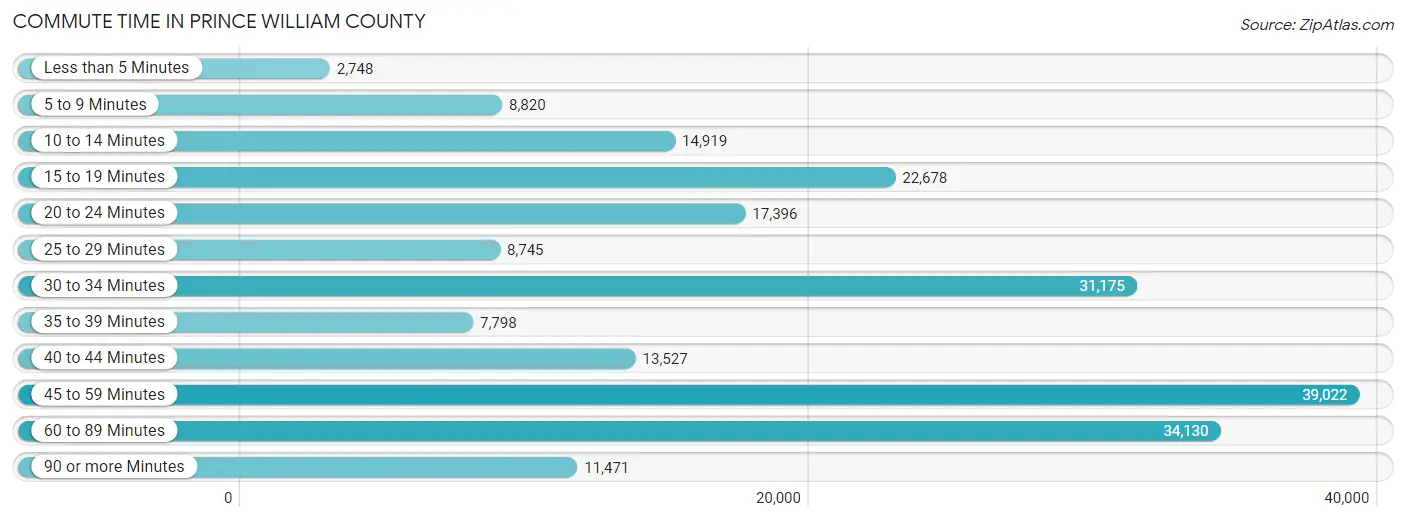
| Commute Time | # Commuters | % Commuters |
| Less than 5 Minutes | 2,748 | 1.3% |
| 5 to 9 Minutes | 8,820 | 4.2% |
| 10 to 14 Minutes | 14,919 | 7.0% |
| 15 to 19 Minutes | 22,678 | 10.7% |
| 20 to 24 Minutes | 17,396 | 8.2% |
| 25 to 29 Minutes | 8,745 | 4.1% |
| 30 to 34 Minutes | 31,175 | 14.7% |
| 35 to 39 Minutes | 7,798 | 3.7% |
| 40 to 44 Minutes | 13,527 | 6.4% |
| 45 to 59 Minutes | 39,022 | 18.4% |
| 60 to 89 Minutes | 34,130 | 16.1% |
| 90 or more Minutes | 11,471 | 5.4% |
Commute Time by Sex in Prince William County
The most common commute times in Prince William County are 45 to 59 minutes (22,999 commuters, 19.4%) for males and 45 to 59 minutes (16,023 commuters, 17.1%) for females.
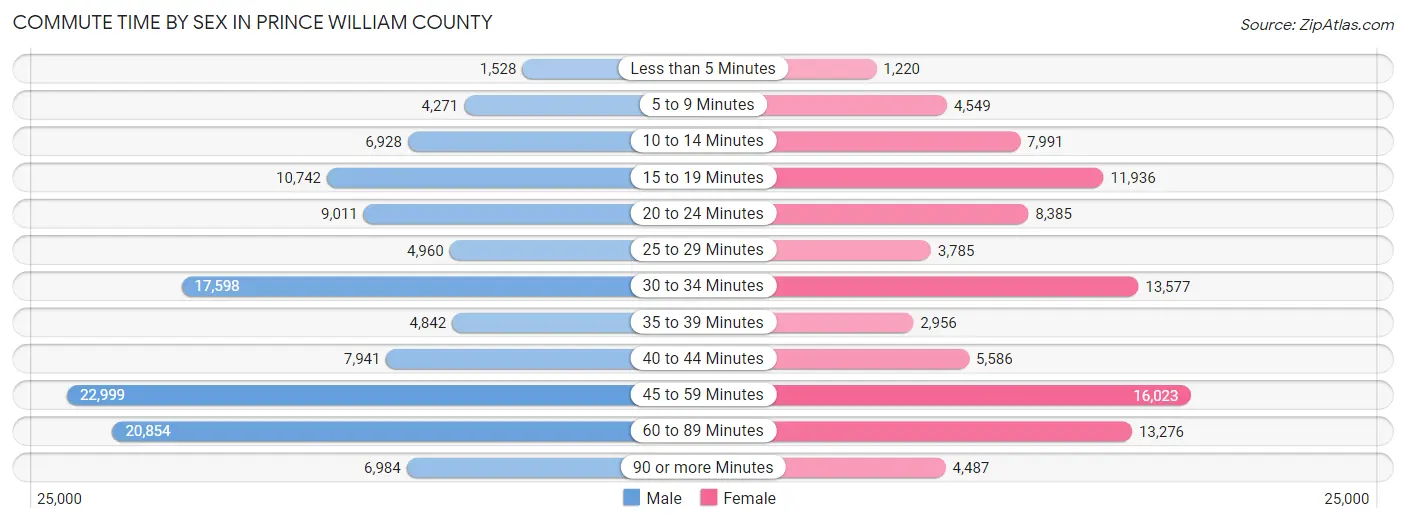
| Commute Time | Male | Female |
| Less than 5 Minutes | 1,528 (1.3%) | 1,220 (1.3%) |
| 5 to 9 Minutes | 4,271 (3.6%) | 4,549 (4.9%) |
| 10 to 14 Minutes | 6,928 (5.8%) | 7,991 (8.5%) |
| 15 to 19 Minutes | 10,742 (9.0%) | 11,936 (12.7%) |
| 20 to 24 Minutes | 9,011 (7.6%) | 8,385 (8.9%) |
| 25 to 29 Minutes | 4,960 (4.2%) | 3,785 (4.0%) |
| 30 to 34 Minutes | 17,598 (14.8%) | 13,577 (14.5%) |
| 35 to 39 Minutes | 4,842 (4.1%) | 2,956 (3.2%) |
| 40 to 44 Minutes | 7,941 (6.7%) | 5,586 (6.0%) |
| 45 to 59 Minutes | 22,999 (19.4%) | 16,023 (17.1%) |
| 60 to 89 Minutes | 20,854 (17.6%) | 13,276 (14.2%) |
| 90 or more Minutes | 6,984 (5.9%) | 4,487 (4.8%) |
Time of Departure to Work by Sex in Prince William County
The most frequent times of departure to work in Prince William County are 6:00 AM to 6:29 AM (15,434, 13.0%) for males and 7:00 AM to 7:29 AM (13,125, 14.0%) for females.
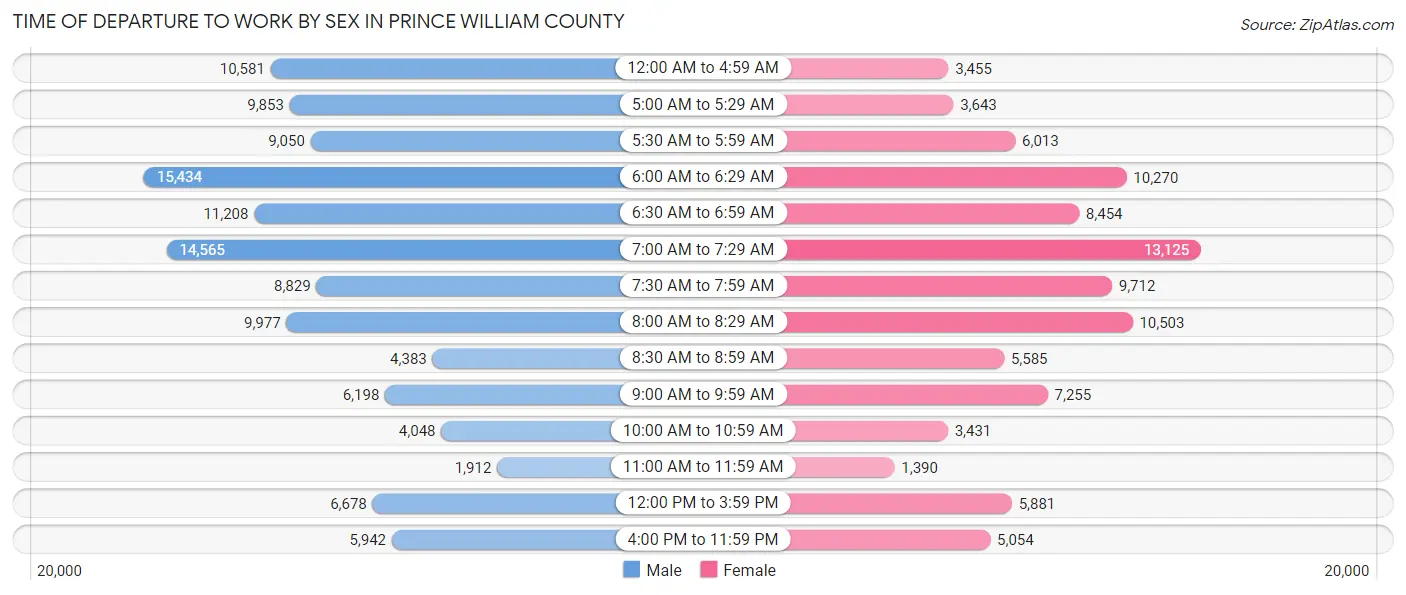
| Time of Departure | Male | Female |
| 12:00 AM to 4:59 AM | 10,581 (8.9%) | 3,455 (3.7%) |
| 5:00 AM to 5:29 AM | 9,853 (8.3%) | 3,643 (3.9%) |
| 5:30 AM to 5:59 AM | 9,050 (7.6%) | 6,013 (6.4%) |
| 6:00 AM to 6:29 AM | 15,434 (13.0%) | 10,270 (11.0%) |
| 6:30 AM to 6:59 AM | 11,208 (9.5%) | 8,454 (9.0%) |
| 7:00 AM to 7:29 AM | 14,565 (12.3%) | 13,125 (14.0%) |
| 7:30 AM to 7:59 AM | 8,829 (7.4%) | 9,712 (10.4%) |
| 8:00 AM to 8:29 AM | 9,977 (8.4%) | 10,503 (11.2%) |
| 8:30 AM to 8:59 AM | 4,383 (3.7%) | 5,585 (6.0%) |
| 9:00 AM to 9:59 AM | 6,198 (5.2%) | 7,255 (7.7%) |
| 10:00 AM to 10:59 AM | 4,048 (3.4%) | 3,431 (3.7%) |
| 11:00 AM to 11:59 AM | 1,912 (1.6%) | 1,390 (1.5%) |
| 12:00 PM to 3:59 PM | 6,678 (5.6%) | 5,881 (6.3%) |
| 4:00 PM to 11:59 PM | 5,942 (5.0%) | 5,054 (5.4%) |
| Total | 118,658 (100.0%) | 93,771 (100.0%) |
Housing Occupancy in Prince William County
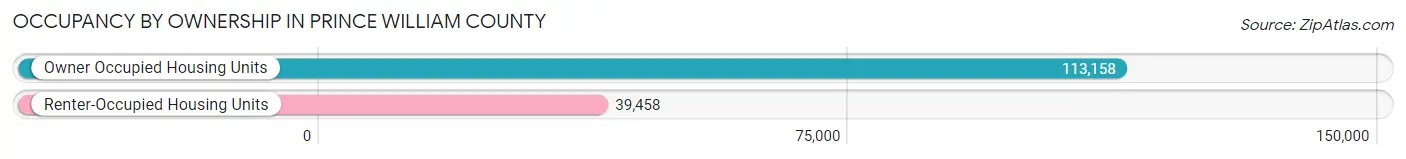
Occupancy by Ownership in Prince William County
Of the total 152,616 dwellings in Prince William County, owner-occupied units account for 113,158 (74.2%), while renter-occupied units make up 39,458 (25.9%).
| Occupancy | # Housing Units | % Housing Units |
| Owner Occupied Housing Units | 113,158 | 74.2% |
| Renter-Occupied Housing Units | 39,458 | 25.9% |
| Total Occupied Housing Units | 152,616 | 100.0% |
Occupancy by Household Size in Prince William County
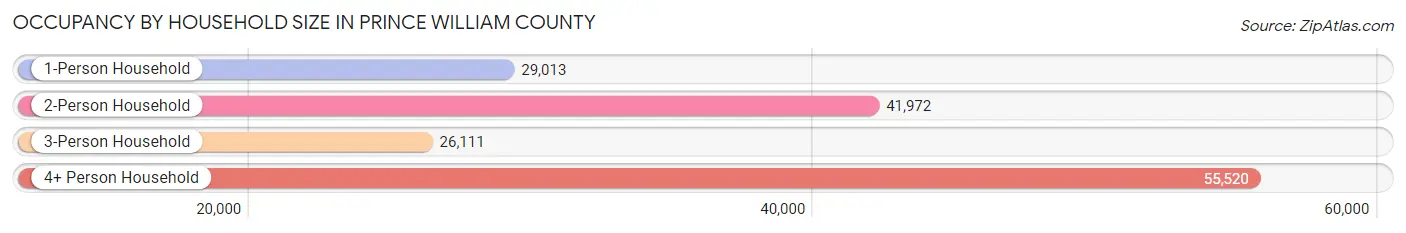
| Household Size | # Housing Units | % Housing Units |
| 1-Person Household | 29,013 | 19.0% |
| 2-Person Household | 41,972 | 27.5% |
| 3-Person Household | 26,111 | 17.1% |
| 4+ Person Household | 55,520 | 36.4% |
| Total Housing Units | 152,616 | 100.0% |
Occupancy by Ownership by Household Size in Prince William County
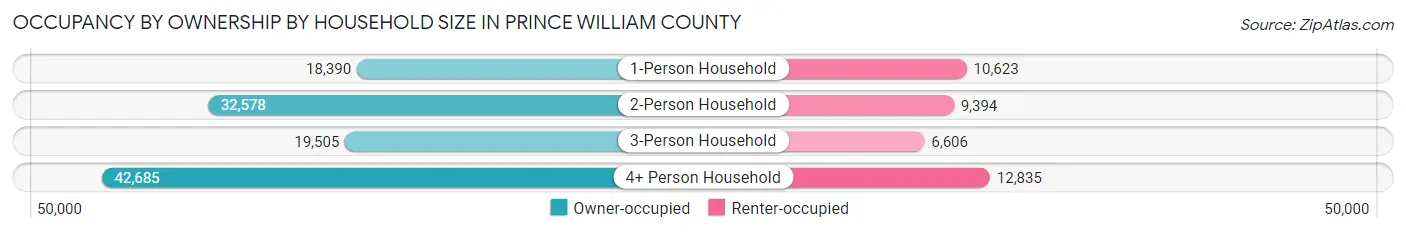
| Household Size | Owner-occupied | Renter-occupied |
| 1-Person Household | 18,390 (63.4%) | 10,623 (36.6%) |
| 2-Person Household | 32,578 (77.6%) | 9,394 (22.4%) |
| 3-Person Household | 19,505 (74.7%) | 6,606 (25.3%) |
| 4+ Person Household | 42,685 (76.9%) | 12,835 (23.1%) |
| Total Housing Units | 113,158 (74.2%) | 39,458 (25.9%) |
Occupancy by Educational Attainment in Prince William County
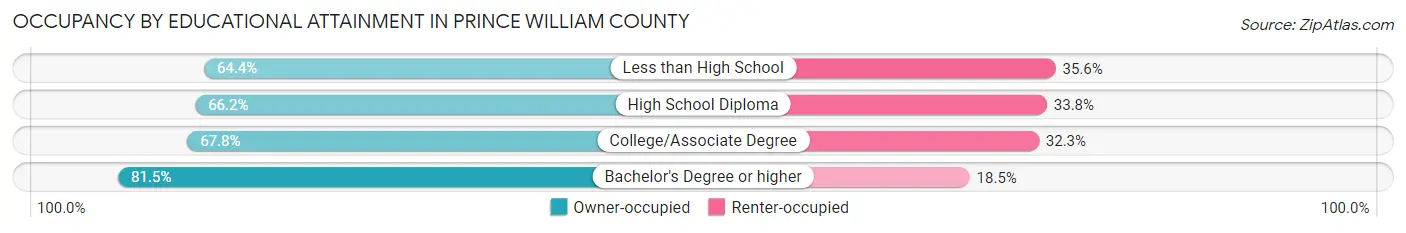
| Household Size | Owner-occupied | Renter-occupied |
| Less than High School | 7,463 (64.4%) | 4,118 (35.6%) |
| High School Diploma | 16,005 (66.2%) | 8,185 (33.8%) |
| College/Associate Degree | 27,113 (67.7%) | 12,909 (32.3%) |
| Bachelor's Degree or higher | 62,577 (81.5%) | 14,246 (18.5%) |
Occupancy by Age of Householder in Prince William County
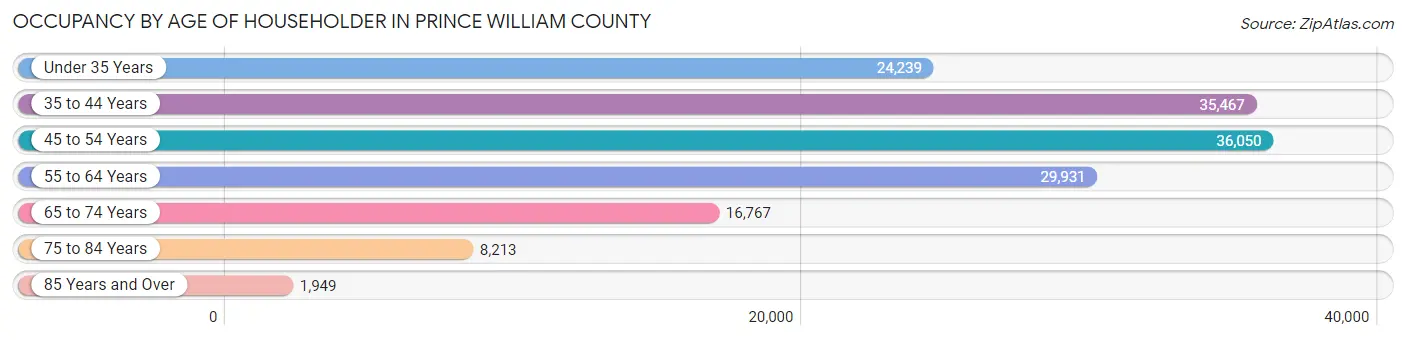
| Age Bracket | # Households | % Households |
| Under 35 Years | 24,239 | 15.9% |
| 35 to 44 Years | 35,467 | 23.2% |
| 45 to 54 Years | 36,050 | 23.6% |
| 55 to 64 Years | 29,931 | 19.6% |
| 65 to 74 Years | 16,767 | 11.0% |
| 75 to 84 Years | 8,213 | 5.4% |
| 85 Years and Over | 1,949 | 1.3% |
| Total | 152,616 | 100.0% |
Housing Finances in Prince William County
Median Income by Occupancy in Prince William County
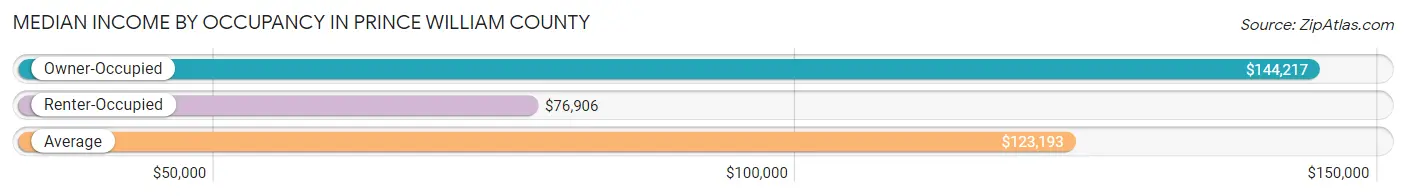
| Occupancy Type | # Households | Median Income |
| Owner-Occupied | 113,158 (74.2%) | $144,217 |
| Renter-Occupied | 39,458 (25.9%) | $76,906 |
| Average | 152,616 (100.0%) | $123,193 |
Occupancy by Householder Income Bracket in Prince William County
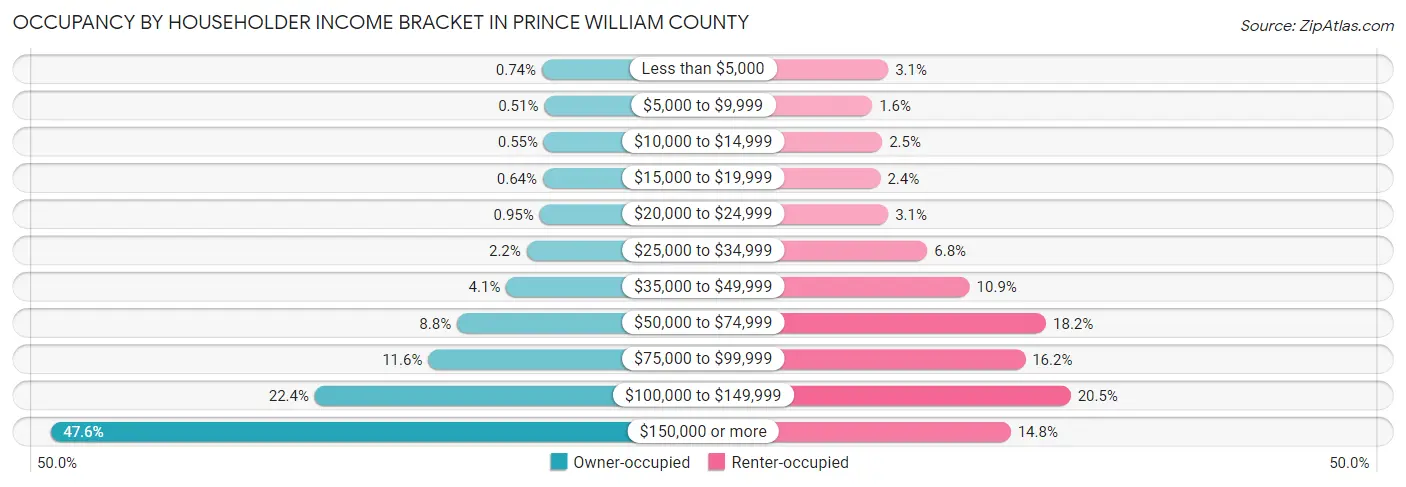
| Income Bracket | Owner-occupied | Renter-occupied |
| Less than $5,000 | 843 (0.7%) | 1,227 (3.1%) |
| $5,000 to $9,999 | 573 (0.5%) | 628 (1.6%) |
| $10,000 to $14,999 | 624 (0.5%) | 1,001 (2.5%) |
| $15,000 to $19,999 | 721 (0.6%) | 935 (2.4%) |
| $20,000 to $24,999 | 1,080 (0.9%) | 1,226 (3.1%) |
| $25,000 to $34,999 | 2,474 (2.2%) | 2,699 (6.8%) |
| $35,000 to $49,999 | 4,678 (4.1%) | 4,290 (10.9%) |
| $50,000 to $74,999 | 9,977 (8.8%) | 7,162 (18.1%) |
| $75,000 to $99,999 | 13,079 (11.6%) | 6,375 (16.2%) |
| $100,000 to $149,999 | 25,301 (22.4%) | 8,084 (20.5%) |
| $150,000 or more | 53,808 (47.5%) | 5,831 (14.8%) |
| Total | 113,158 (100.0%) | 39,458 (100.0%) |
Monthly Housing Cost Tiers in Prince William County
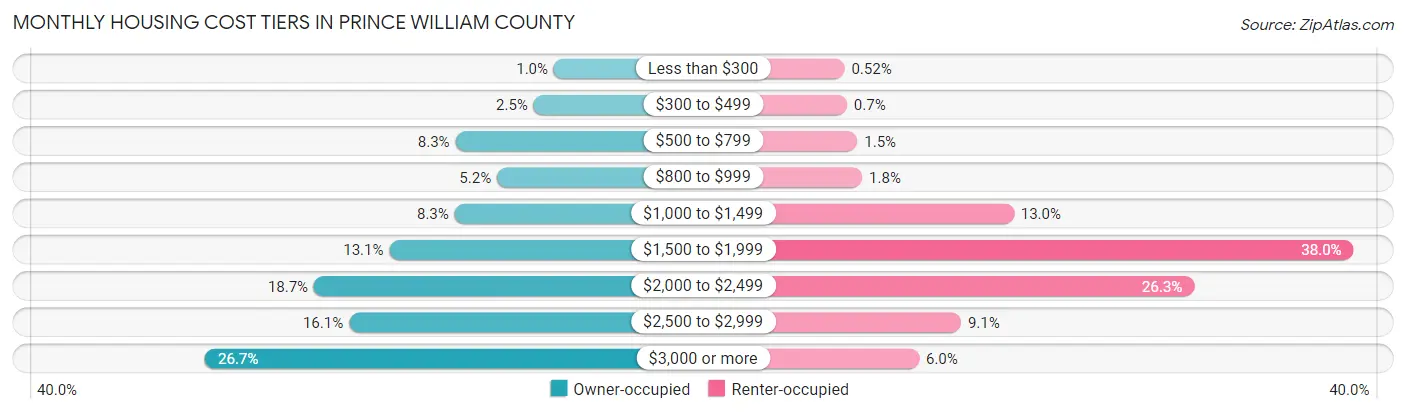
| Monthly Cost | Owner-occupied | Renter-occupied |
| Less than $300 | 1,158 (1.0%) | 205 (0.5%) |
| $300 to $499 | 2,844 (2.5%) | 277 (0.7%) |
| $500 to $799 | 9,357 (8.3%) | 579 (1.5%) |
| $800 to $999 | 5,893 (5.2%) | 719 (1.8%) |
| $1,000 to $1,499 | 9,431 (8.3%) | 5,124 (13.0%) |
| $1,500 to $1,999 | 14,865 (13.1%) | 14,993 (38.0%) |
| $2,000 to $2,499 | 21,152 (18.7%) | 10,366 (26.3%) |
| $2,500 to $2,999 | 18,233 (16.1%) | 3,591 (9.1%) |
| $3,000 or more | 30,225 (26.7%) | 2,370 (6.0%) |
| Total | 113,158 (100.0%) | 39,458 (100.0%) |
Physical Housing Characteristics in Prince William County
Housing Structures in Prince William County
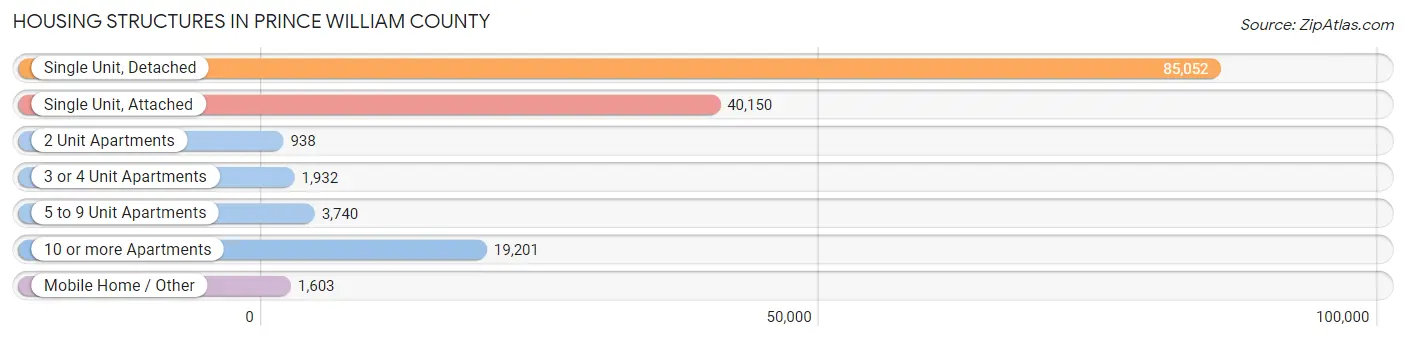
| Structure Type | # Housing Units | % Housing Units |
| Single Unit, Detached | 85,052 | 55.7% |
| Single Unit, Attached | 40,150 | 26.3% |
| 2 Unit Apartments | 938 | 0.6% |
| 3 or 4 Unit Apartments | 1,932 | 1.3% |
| 5 to 9 Unit Apartments | 3,740 | 2.5% |
| 10 or more Apartments | 19,201 | 12.6% |
| Mobile Home / Other | 1,603 | 1.1% |
| Total | 152,616 | 100.0% |
Housing Structures by Occupancy in Prince William County
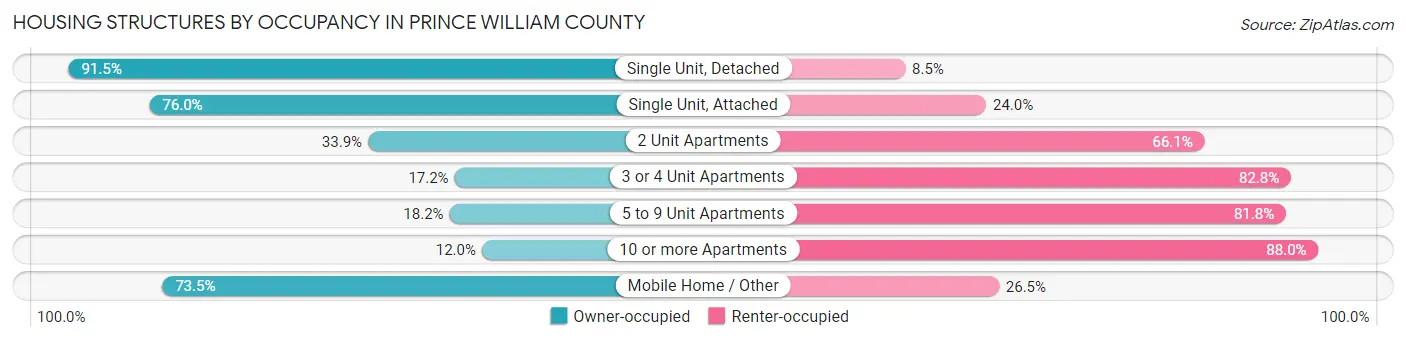
| Structure Type | Owner-occupied | Renter-occupied |
| Single Unit, Detached | 77,854 (91.5%) | 7,198 (8.5%) |
| Single Unit, Attached | 30,496 (76.0%) | 9,654 (24.0%) |
| 2 Unit Apartments | 318 (33.9%) | 620 (66.1%) |
| 3 or 4 Unit Apartments | 333 (17.2%) | 1,599 (82.8%) |
| 5 to 9 Unit Apartments | 681 (18.2%) | 3,059 (81.8%) |
| 10 or more Apartments | 2,298 (12.0%) | 16,903 (88.0%) |
| Mobile Home / Other | 1,178 (73.5%) | 425 (26.5%) |
| Total | 113,158 (74.2%) | 39,458 (25.9%) |
Housing Structures by Number of Rooms in Prince William County
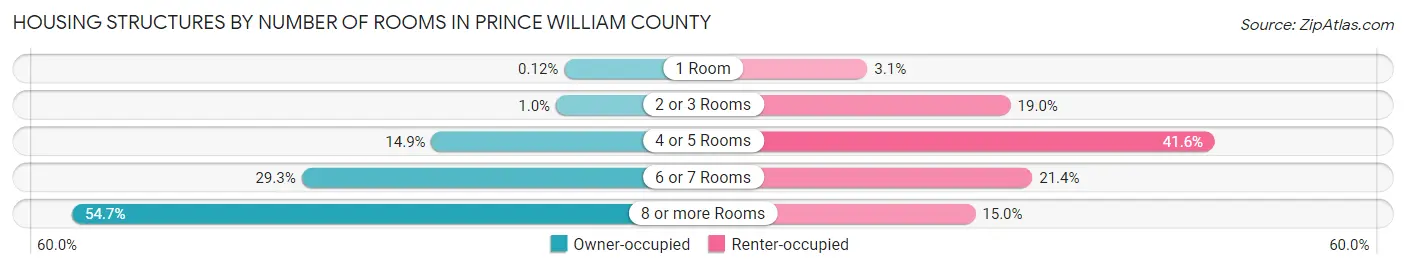
| Number of Rooms | Owner-occupied | Renter-occupied |
| 1 Room | 137 (0.1%) | 1,203 (3.0%) |
| 2 or 3 Rooms | 1,163 (1.0%) | 7,479 (19.0%) |
| 4 or 5 Rooms | 16,805 (14.8%) | 16,418 (41.6%) |
| 6 or 7 Rooms | 33,122 (29.3%) | 8,426 (21.3%) |
| 8 or more Rooms | 61,931 (54.7%) | 5,932 (15.0%) |
| Total | 113,158 (100.0%) | 39,458 (100.0%) |
Housing Structure by Heating Type in Prince William County
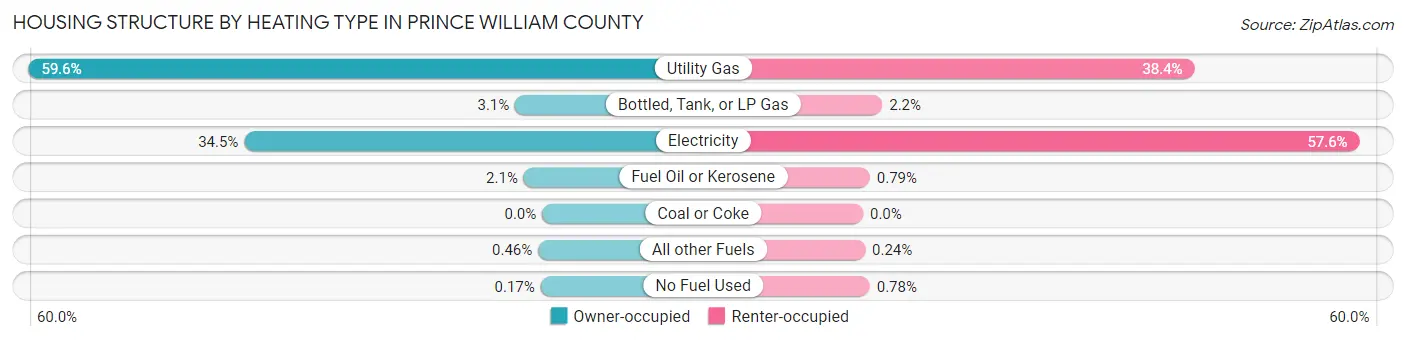
| Heating Type | Owner-occupied | Renter-occupied |
| Utility Gas | 67,408 (59.6%) | 15,159 (38.4%) |
| Bottled, Tank, or LP Gas | 3,538 (3.1%) | 878 (2.2%) |
| Electricity | 39,089 (34.5%) | 22,707 (57.6%) |
| Fuel Oil or Kerosene | 2,412 (2.1%) | 312 (0.8%) |
| Coal or Coke | 0 (0.0%) | 0 (0.0%) |
| All other Fuels | 518 (0.5%) | 93 (0.2%) |
| No Fuel Used | 193 (0.2%) | 309 (0.8%) |
| Total | 113,158 (100.0%) | 39,458 (100.0%) |
Household Vehicle Usage in Prince William County
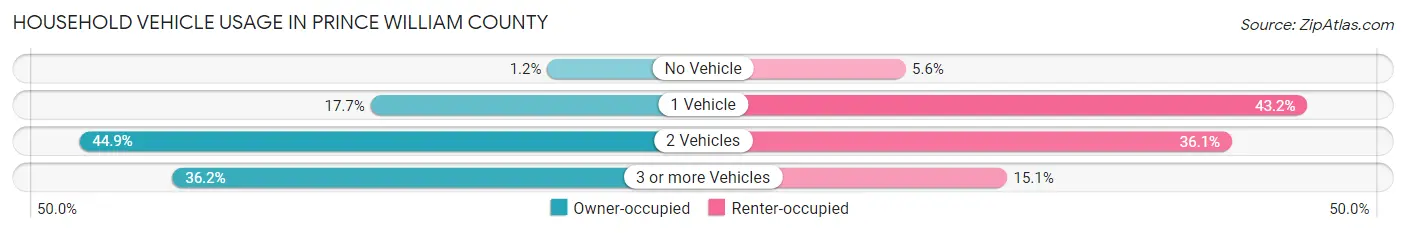
| Vehicles per Household | Owner-occupied | Renter-occupied |
| No Vehicle | 1,365 (1.2%) | 2,218 (5.6%) |
| 1 Vehicle | 20,036 (17.7%) | 17,032 (43.2%) |
| 2 Vehicles | 50,780 (44.9%) | 14,254 (36.1%) |
| 3 or more Vehicles | 40,977 (36.2%) | 5,954 (15.1%) |
| Total | 113,158 (100.0%) | 39,458 (100.0%) |
Real Estate & Mortgages in Prince William County
Real Estate and Mortgage Overview in Prince William County
| Characteristic | Without Mortgage | With Mortgage |
| Housing Units | 22,131 | 91,027 |
| Median Property Value | $452,000 | $476,800 |
| Median Household Income | $108,750 | $46,625 |
| Monthly Housing Costs | $772 | $30,193 |
| Real Estate Taxes | $4,768 | $4,056 |
Property Value by Mortgage Status in Prince William County
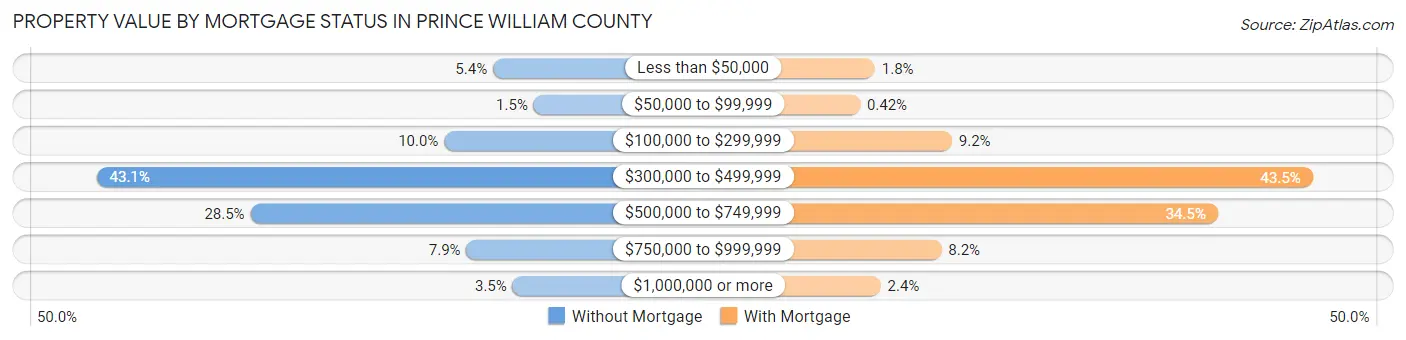
| Property Value | Without Mortgage | With Mortgage |
| Less than $50,000 | 1,193 (5.4%) | 1,675 (1.8%) |
| $50,000 to $99,999 | 335 (1.5%) | 378 (0.4%) |
| $100,000 to $299,999 | 2,221 (10.0%) | 8,347 (9.2%) |
| $300,000 to $499,999 | 9,547 (43.1%) | 39,622 (43.5%) |
| $500,000 to $749,999 | 6,305 (28.5%) | 31,391 (34.5%) |
| $750,000 to $999,999 | 1,752 (7.9%) | 7,436 (8.2%) |
| $1,000,000 or more | 778 (3.5%) | 2,178 (2.4%) |
| Total | 22,131 (100.0%) | 91,027 (100.0%) |
Household Income by Mortgage Status in Prince William County
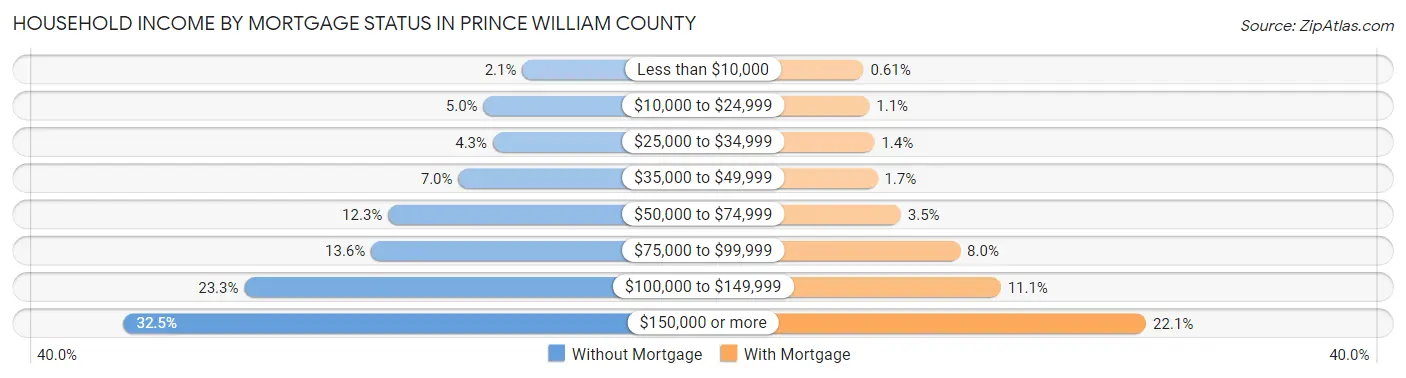
| Household Income | Without Mortgage | With Mortgage |
| Less than $10,000 | 460 (2.1%) | 557 (0.6%) |
| $10,000 to $24,999 | 1,115 (5.0%) | 956 (1.1%) |
| $25,000 to $34,999 | 955 (4.3%) | 1,310 (1.4%) |
| $35,000 to $49,999 | 1,537 (7.0%) | 1,519 (1.7%) |
| $50,000 to $74,999 | 2,723 (12.3%) | 3,141 (3.5%) |
| $75,000 to $99,999 | 3,010 (13.6%) | 7,254 (8.0%) |
| $100,000 to $149,999 | 5,148 (23.3%) | 10,069 (11.1%) |
| $150,000 or more | 7,183 (32.5%) | 20,153 (22.1%) |
| Total | 22,131 (100.0%) | 91,027 (100.0%) |
Property Value to Household Income Ratio in Prince William County
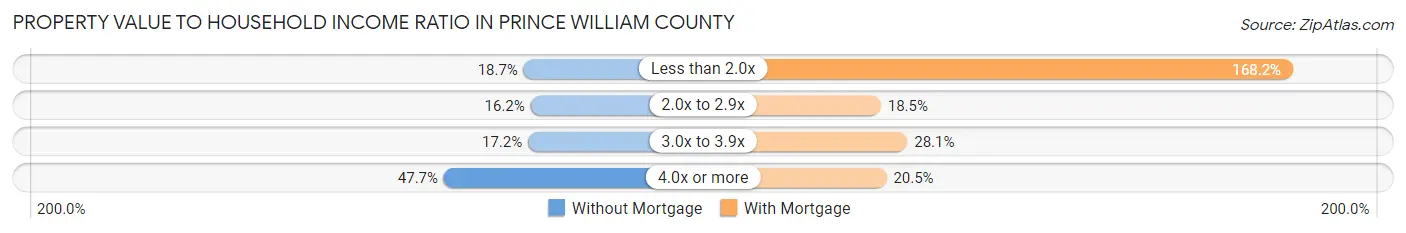
| Value-to-Income Ratio | Without Mortgage | With Mortgage |
| Less than 2.0x | 4,142 (18.7%) | 153,080 (168.2%) |
| 2.0x to 2.9x | 3,588 (16.2%) | 16,834 (18.5%) |
| 3.0x to 3.9x | 3,796 (17.2%) | 25,575 (28.1%) |
| 4.0x or more | 10,559 (47.7%) | 18,685 (20.5%) |
| Total | 22,131 (100.0%) | 91,027 (100.0%) |
Real Estate Taxes by Mortgage Status in Prince William County
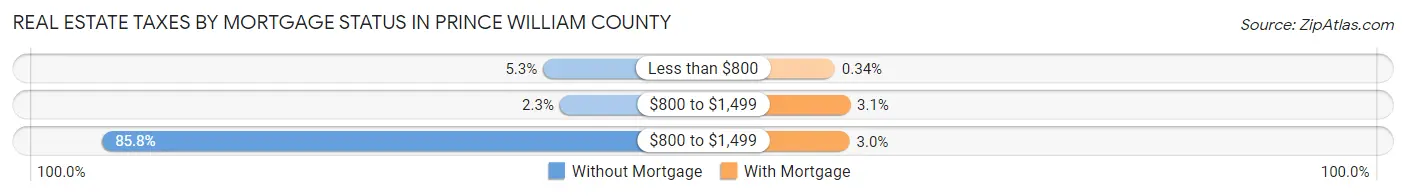
| Property Taxes | Without Mortgage | With Mortgage |
| Less than $800 | 1,175 (5.3%) | 312 (0.3%) |
| $800 to $1,499 | 500 (2.3%) | 2,831 (3.1%) |
| $800 to $1,499 | 18,991 (85.8%) | 2,748 (3.0%) |
| Total | 22,131 (100.0%) | 91,027 (100.0%) |
Health & Disability in Prince William County
Health Insurance Coverage by Age in Prince William County
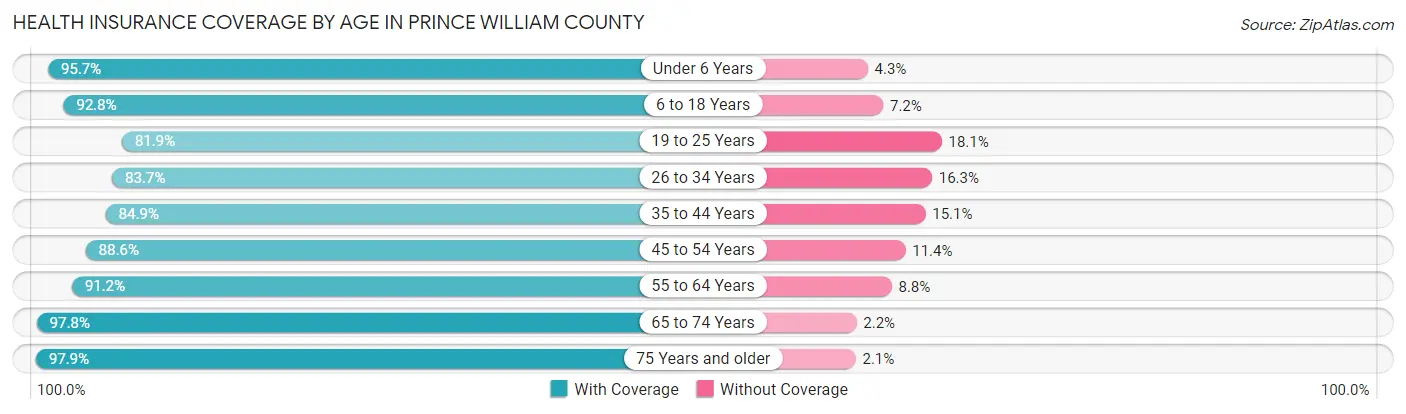
| Age Bracket | With Coverage | Without Coverage |
| Under 6 Years | 37,612 (95.7%) | 1,706 (4.3%) |
| 6 to 18 Years | 88,439 (92.8%) | 6,882 (7.2%) |
| 19 to 25 Years | 34,456 (81.9%) | 7,629 (18.1%) |
| 26 to 34 Years | 44,702 (83.7%) | 8,711 (16.3%) |
| 35 to 44 Years | 59,913 (84.9%) | 10,667 (15.1%) |
| 45 to 54 Years | 59,680 (88.6%) | 7,661 (11.4%) |
| 55 to 64 Years | 50,323 (91.2%) | 4,861 (8.8%) |
| 65 to 74 Years | 30,926 (97.8%) | 710 (2.2%) |
| 75 Years and older | 17,847 (97.9%) | 383 (2.1%) |
| Total | 423,898 (89.6%) | 49,210 (10.4%) |
Health Insurance Coverage by Citizenship Status in Prince William County
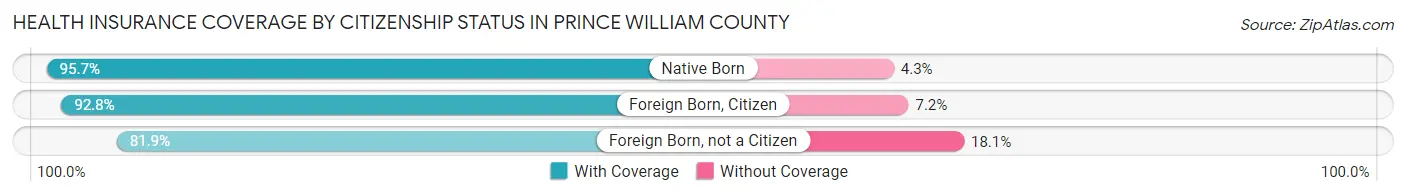
| Citizenship Status | With Coverage | Without Coverage |
| Native Born | 37,612 (95.7%) | 1,706 (4.3%) |
| Foreign Born, Citizen | 88,439 (92.8%) | 6,882 (7.2%) |
| Foreign Born, not a Citizen | 34,456 (81.9%) | 7,629 (18.1%) |
Health Insurance Coverage by Household Income in Prince William County
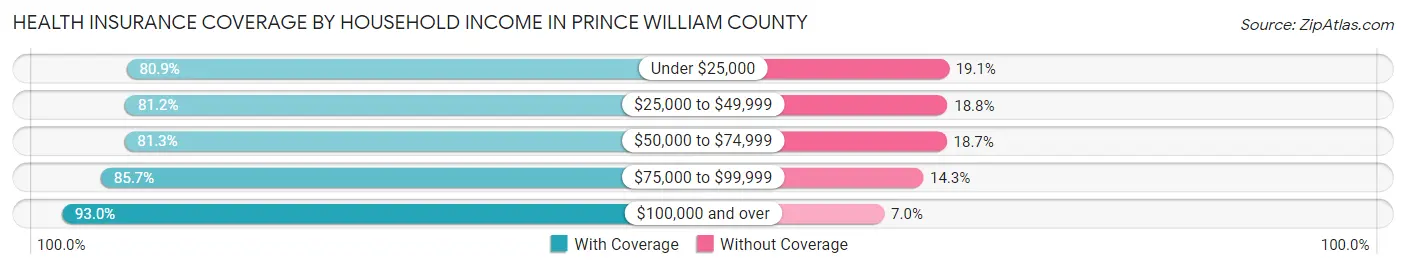
| Household Income | With Coverage | Without Coverage |
| Under $25,000 | 15,280 (80.9%) | 3,606 (19.1%) |
| $25,000 to $49,999 | 28,682 (81.2%) | 6,652 (18.8%) |
| $50,000 to $74,999 | 38,234 (81.3%) | 8,795 (18.7%) |
| $75,000 to $99,999 | 48,043 (85.7%) | 8,009 (14.3%) |
| $100,000 and over | 293,350 (93.0%) | 22,079 (7.0%) |
Public vs Private Health Insurance Coverage by Age in Prince William County
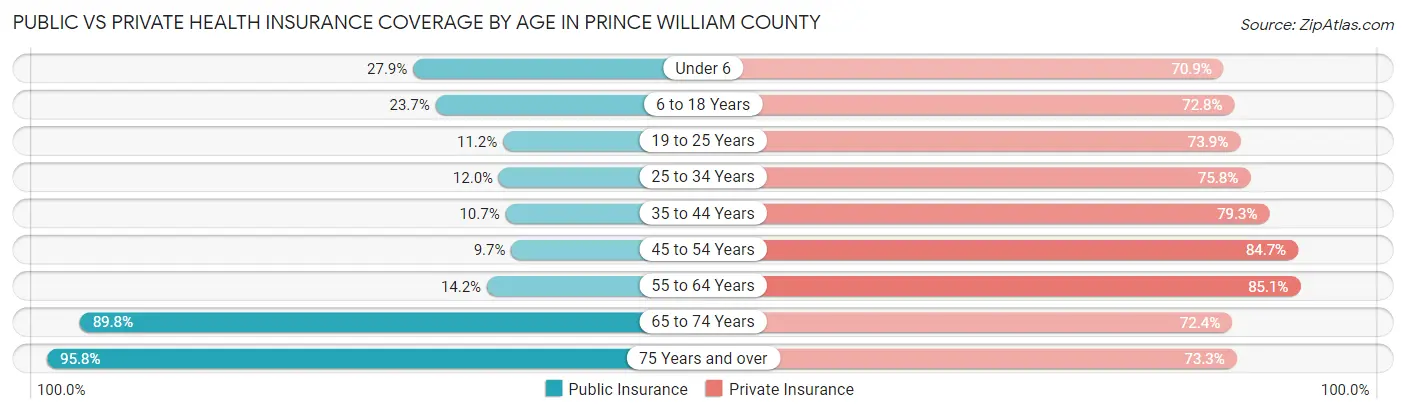
| Age Bracket | Public Insurance | Private Insurance |
| Under 6 | 10,965 (27.9%) | 27,864 (70.9%) |
| 6 to 18 Years | 22,620 (23.7%) | 69,430 (72.8%) |
| 19 to 25 Years | 4,712 (11.2%) | 31,103 (73.9%) |
| 25 to 34 Years | 6,389 (12.0%) | 40,473 (75.8%) |
| 35 to 44 Years | 7,581 (10.7%) | 55,992 (79.3%) |
| 45 to 54 Years | 6,502 (9.7%) | 57,011 (84.7%) |
| 55 to 64 Years | 7,824 (14.2%) | 46,953 (85.1%) |
| 65 to 74 Years | 28,397 (89.8%) | 22,911 (72.4%) |
| 75 Years and over | 17,468 (95.8%) | 13,359 (73.3%) |
| Total | 112,458 (23.8%) | 365,096 (77.2%) |
Disability Status by Sex by Age in Prince William County
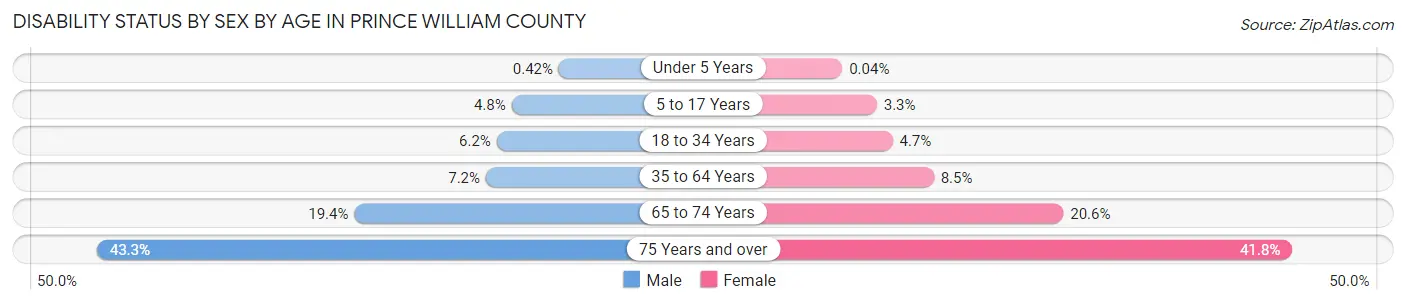
| Age Bracket | Male | Female |
| Under 5 Years | 72 (0.4%) | 7 (0.0%) |
| 5 to 17 Years | 2,363 (4.8%) | 1,492 (3.3%) |
| 18 to 34 Years | 3,133 (6.2%) | 2,423 (4.7%) |
| 35 to 64 Years | 6,945 (7.2%) | 8,228 (8.5%) |
| 65 to 74 Years | 2,879 (19.4%) | 3,453 (20.6%) |
| 75 Years and over | 3,330 (43.3%) | 4,406 (41.8%) |
Disability Class by Sex by Age in Prince William County
Disability Class: Hearing Difficulty
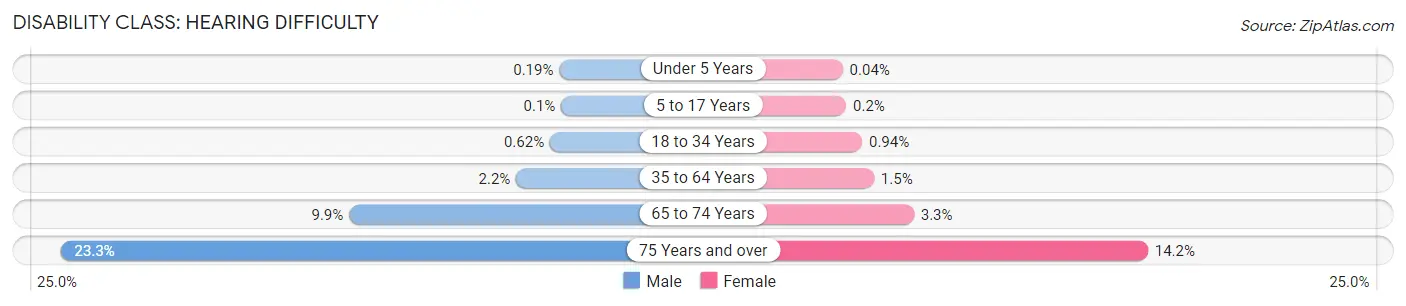
| Age Bracket | Male | Female |
| Under 5 Years | 32 (0.2%) | 7 (0.0%) |
| 5 to 17 Years | 50 (0.1%) | 92 (0.2%) |
| 18 to 34 Years | 314 (0.6%) | 482 (0.9%) |
| 35 to 64 Years | 2,114 (2.2%) | 1,438 (1.5%) |
| 65 to 74 Years | 1,476 (9.9%) | 561 (3.3%) |
| 75 Years and over | 1,791 (23.3%) | 1,497 (14.2%) |
Disability Class: Vision Difficulty
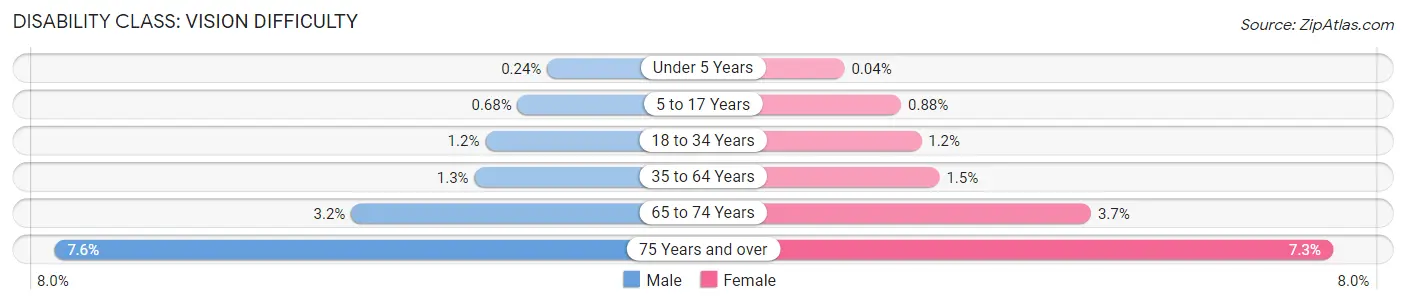
| Age Bracket | Male | Female |
| Under 5 Years | 40 (0.2%) | 7 (0.0%) |
| 5 to 17 Years | 333 (0.7%) | 406 (0.9%) |
| 18 to 34 Years | 585 (1.2%) | 606 (1.2%) |
| 35 to 64 Years | 1,278 (1.3%) | 1,401 (1.5%) |
| 65 to 74 Years | 467 (3.2%) | 622 (3.7%) |
| 75 Years and over | 581 (7.6%) | 768 (7.3%) |
Disability Class: Cognitive Difficulty
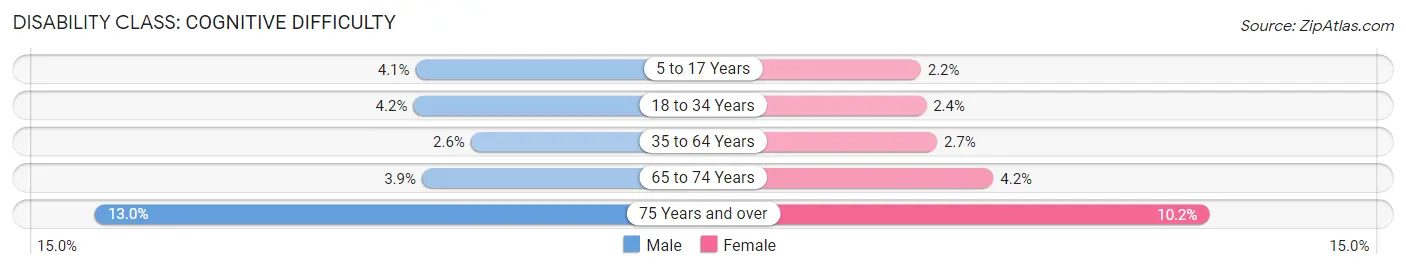
| Age Bracket | Male | Female |
| 5 to 17 Years | 2,023 (4.1%) | 1,010 (2.2%) |
| 18 to 34 Years | 2,117 (4.2%) | 1,207 (2.4%) |
| 35 to 64 Years | 2,493 (2.6%) | 2,552 (2.6%) |
| 65 to 74 Years | 585 (3.9%) | 709 (4.2%) |
| 75 Years and over | 1,003 (13.0%) | 1,078 (10.2%) |
Disability Class: Ambulatory Difficulty
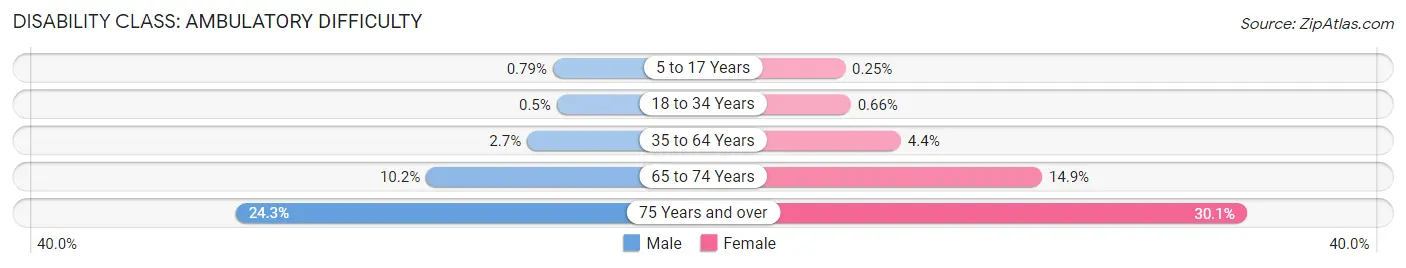
| Age Bracket | Male | Female |
| 5 to 17 Years | 388 (0.8%) | 115 (0.3%) |
| 18 to 34 Years | 252 (0.5%) | 338 (0.7%) |
| 35 to 64 Years | 2,612 (2.7%) | 4,236 (4.4%) |
| 65 to 74 Years | 1,514 (10.2%) | 2,495 (14.9%) |
| 75 Years and over | 1,870 (24.3%) | 3,167 (30.0%) |
Disability Class: Self-Care Difficulty
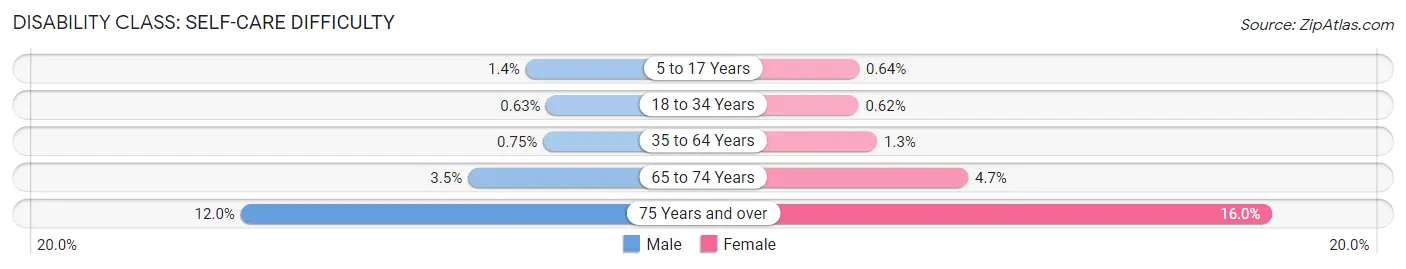
| Age Bracket | Male | Female |
| 5 to 17 Years | 687 (1.4%) | 292 (0.6%) |
| 18 to 34 Years | 321 (0.6%) | 317 (0.6%) |
| 35 to 64 Years | 727 (0.7%) | 1,262 (1.3%) |
| 65 to 74 Years | 525 (3.5%) | 787 (4.7%) |
| 75 Years and over | 921 (12.0%) | 1,684 (16.0%) |
Technology Access in Prince William County
Computing Device Access in Prince William County
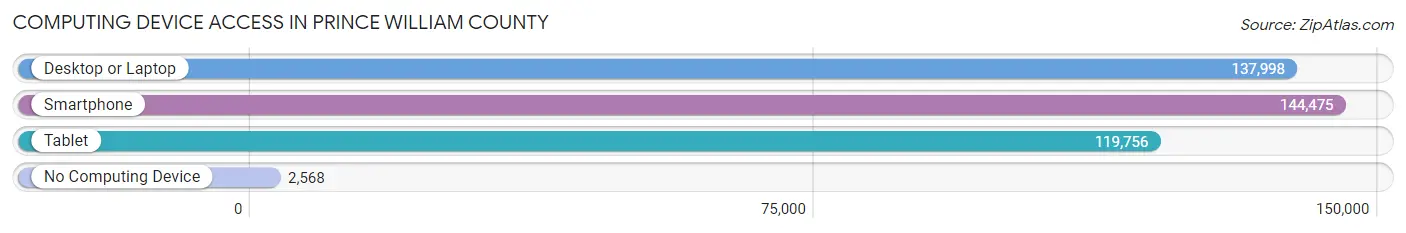
| Device Type | # Households | % Households |
| Desktop or Laptop | 137,998 | 90.4% |
| Smartphone | 144,475 | 94.7% |
| Tablet | 119,756 | 78.5% |
| No Computing Device | 2,568 | 1.7% |
| Total | 152,616 | 100.0% |
Internet Access in Prince William County
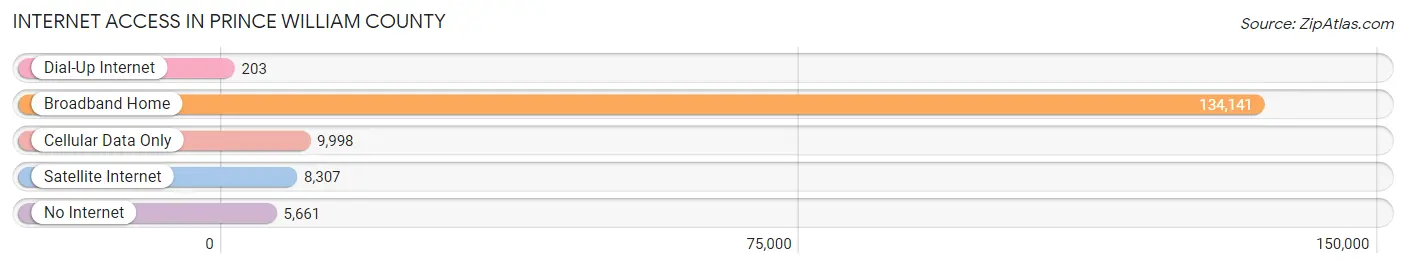
| Internet Type | # Households | % Households |
| Dial-Up Internet | 203 | 0.1% |
| Broadband Home | 134,141 | 87.9% |
| Cellular Data Only | 9,998 | 6.6% |
| Satellite Internet | 8,307 | 5.4% |
| No Internet | 5,661 | 3.7% |
| Total | 152,616 | 100.0% |
Prince William County Summary
William County, Virginia is located in the northern part of the state, just south of Washington, D.C. It is bordered by Fairfax County to the north, Loudoun County to the west, Fauquier County to the south, and the Potomac River to the east. The county seat is the town of Manassas, and the county is part of the Washington-Arlington-Alexandria metropolitan area.
History
William County was formed in 1731 from Prince George County. It was named for William, Prince of Orange, who later became King William III of England. The county was originally part of the Northern Neck Proprietary, a land grant from King Charles II of England to seven of his supporters. The county was divided into six districts, each with its own court.
The county was the site of two major Civil War battles, the First Battle of Manassas (Bull Run) in 1861 and the Second Battle of Manassas in 1862. The county was also the site of the Battle of Chantilly in 1862.
Geography
William County is located in the northern part of Virginia, just south of Washington, D.C. It is bordered by Fairfax County to the north, Loudoun County to the west, Fauquier County to the south, and the Potomac River to the east. The county is part of the Washington-Arlington-Alexandria metropolitan area.
The county is mostly rural, with rolling hills and valleys. The terrain is mostly forested, with some agricultural land. The county is home to several state parks, including Bull Run Regional Park, Manassas National Battlefield Park, and Prince William Forest Park.
Economy
William County has a diverse economy, with a mix of government, technology, and service industries. The county is home to several major employers, including the U.S. Department of Defense, Lockheed Martin, and General Dynamics. The county is also home to several universities, including George Mason University, Northern Virginia Community College, and the University of Mary Washington.
The county is also home to several major shopping centers, including Potomac Mills, Manassas Mall, and Stonebridge at Potomac Town Center.
Demographics
As of the 2010 census, William County had a population of 402,002. The racial makeup of the county was 68.3% White, 17.3% African American, 8.2% Hispanic or Latino, 5.2% Asian, and 0.7% Native American.
The median household income in the county was $90,717, and the median family income was $103,717. The per capita income was $37,845. The poverty rate was 6.2%.
William County is served by several school districts, including Prince William County Public Schools, Manassas City Public Schools, and Manassas Park City Public Schools. The county is also home to several private schools, including Bishop O'Connell High School, Seton School, and St. John Paul the Great Catholic High School.
Common Questions
What is Per Capita Income in Prince William County?
Per Capita income in Prince William County is $48,958.
What is the Median Family Income in Prince William County?
Median Family Income in Prince William County is $135,196.
What is the Median Household income in Prince William County?
Median Household Income in Prince William County is $123,193.
What is Income or Wage Gap in Prince William County?
Income or Wage Gap in Prince William County is 31.9%.
Women in Prince William County earn 68.1 cents for every dollar earned by a man.
What is Family Income Deficit in Prince William County?
Family Income Deficit in Prince William County is $12,376.
Families that are below poverty line in Prince William County earn $12,376 less on average than the poverty threshold level.
What is Inequality or Gini Index in Prince William County?
Inequality or Gini Index in Prince William County is 0.39.
What is the Total Population of Prince William County?
Total Population of Prince William County is 481,114.
What is the Total Male Population of Prince William County?
Total Male Population of Prince William County is 242,456.
What is the Total Female Population of Prince William County?
Total Female Population of Prince William County is 238,658.
What is the Ratio of Males per 100 Females in Prince William County?
There are 101.59 Males per 100 Females in Prince William County.
What is the Ratio of Females per 100 Males in Prince William County?
There are 98.43 Females per 100 Males in Prince William County.
What is the Median Population Age in Prince William County?
Median Population Age in Prince William County is 35.8 Years.
What is the Average Family Size in Prince William County
Average Family Size in Prince William County is 3.6 People.
What is the Average Household Size in Prince William County
Average Household Size in Prince William County is 3.1 People.
How Large is the Labor Force in Prince William County?
There are 266,209 People in the Labor Forcein in Prince William County.
What is the Percentage of People in the Labor Force in Prince William County?
72.3% of People are in the Labor Force in Prince William County.
What is the Unemployment Rate in Prince William County?
Unemployment Rate in Prince William County is 4.7%.