Prince George County, VA Map & Demographics
Prince George County Overview
$31,801
PER CAPITA INCOME
$88,333
AVG FAMILY INCOME
$80,318
AVG HOUSEHOLD INCOME
22.2%
WAGE / INCOME GAP [ % ]
77.8¢/ $1
WAGE / INCOME GAP [ $ ]
$10,532
FAMILY INCOME DEFICIT
0.37
INEQUALITY / GINI INDEX
42,634
TOTAL POPULATION
23,947
MALE POPULATION
18,687
FEMALE POPULATION
128.15
MALES / 100 FEMALES
78.03
FEMALES / 100 MALES
34.2
MEDIAN AGE
3.3
AVG FAMILY SIZE
2.9
AVG HOUSEHOLD SIZE
21,343
LABOR FORCE [ PEOPLE ]
60.9%
PERCENT IN LABOR FORCE
7.5%
UNEMPLOYMENT RATE
Prince George County Area Codes
Income in Prince George County
Income Overview in Prince George County
Per Capita Income in Prince George County is $31,801, while median incomes of families and households are $88,333 and $80,318 respectively.
| Characteristic | Number | Measure |
| Per Capita Income | 42,634 | $31,801 |
| Median Family Income | 9,600 | $88,333 |
| Mean Family Income | 9,600 | $102,091 |
| Median Household Income | 12,808 | $80,318 |
| Mean Household Income | 12,808 | $94,603 |
| Income Deficit | 9,600 | $10,532 |
| Wage / Income Gap (%) | 42,634 | 22.17% |
| Wage / Income Gap ($) | 42,634 | 77.83¢ per $1 |
| Gini / Inequality Index | 42,634 | 0.37 |
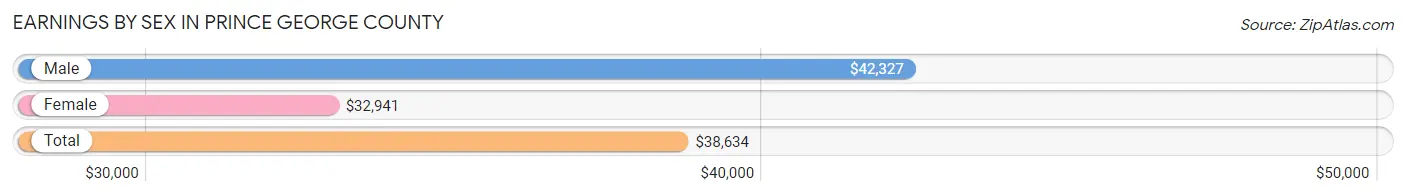
Earnings by Sex in Prince George County
Average Earnings in Prince George County are $38,634, $42,327 for men and $32,941 for women, a difference of 22.2%.
| Sex | Number | Average Earnings |
| Male | 13,379 (57.8%) | $42,327 |
| Female | 9,754 (42.2%) | $32,941 |
| Total | 23,133 (100.0%) | $38,634 |
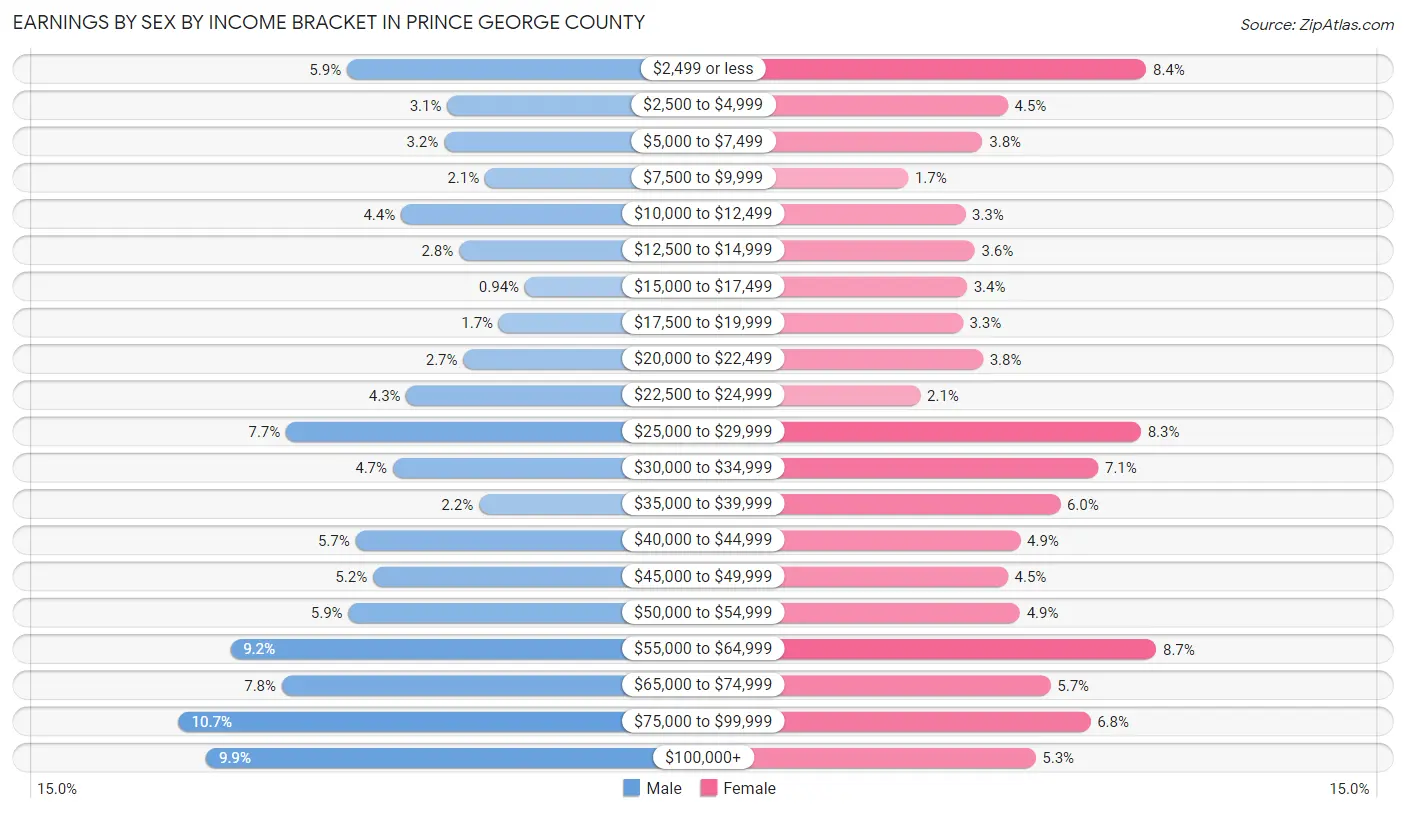
Earnings by Sex by Income Bracket in Prince George County
The most common earnings brackets in Prince George County are $75,000 to $99,999 for men (1,428 | 10.7%) and $55,000 to $64,999 for women (848 | 8.7%).
| Income | Male | Female |
| $2,499 or less | 795 (5.9%) | 820 (8.4%) |
| $2,500 to $4,999 | 418 (3.1%) | 441 (4.5%) |
| $5,000 to $7,499 | 430 (3.2%) | 372 (3.8%) |
| $7,500 to $9,999 | 276 (2.1%) | 168 (1.7%) |
| $10,000 to $12,499 | 592 (4.4%) | 324 (3.3%) |
| $12,500 to $14,999 | 373 (2.8%) | 350 (3.6%) |
| $15,000 to $17,499 | 126 (0.9%) | 329 (3.4%) |
| $17,500 to $19,999 | 223 (1.7%) | 317 (3.3%) |
| $20,000 to $22,499 | 357 (2.7%) | 373 (3.8%) |
| $22,500 to $24,999 | 571 (4.3%) | 201 (2.1%) |
| $25,000 to $29,999 | 1,023 (7.6%) | 806 (8.3%) |
| $30,000 to $34,999 | 622 (4.6%) | 689 (7.1%) |
| $35,000 to $39,999 | 298 (2.2%) | 584 (6.0%) |
| $40,000 to $44,999 | 762 (5.7%) | 475 (4.9%) |
| $45,000 to $49,999 | 697 (5.2%) | 441 (4.5%) |
| $50,000 to $54,999 | 790 (5.9%) | 474 (4.9%) |
| $55,000 to $64,999 | 1,234 (9.2%) | 848 (8.7%) |
| $65,000 to $74,999 | 1,040 (7.8%) | 558 (5.7%) |
| $75,000 to $99,999 | 1,428 (10.7%) | 667 (6.8%) |
| $100,000+ | 1,324 (9.9%) | 517 (5.3%) |
| Total | 13,379 (100.0%) | 9,754 (100.0%) |
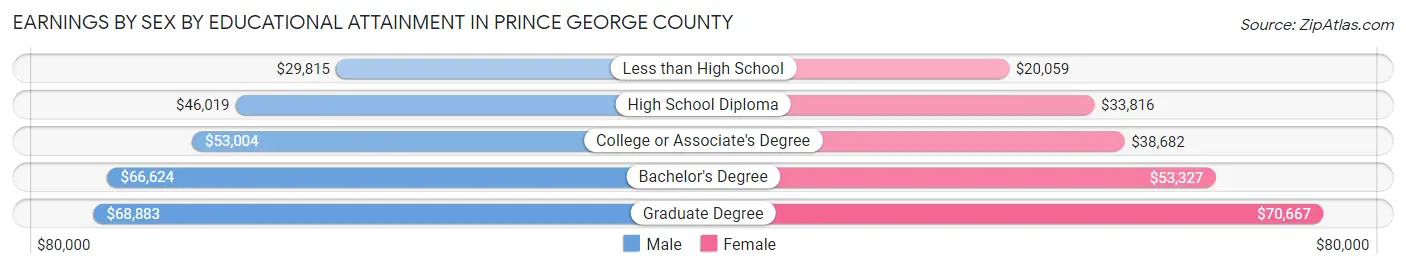
Earnings by Sex by Educational Attainment in Prince George County
Average earnings in Prince George County are $54,458 for men and $41,820 for women, a difference of 23.2%. Men with an educational attainment of graduate degree enjoy the highest average annual earnings of $68,883, while those with less than high school education earn the least with $29,815. Women with an educational attainment of graduate degree earn the most with the average annual earnings of $70,667, while those with less than high school education have the smallest earnings of $20,059.
| Educational Attainment | Male Income | Female Income |
| Less than High School | $29,815 | $20,059 |
| High School Diploma | $46,019 | $33,816 |
| College or Associate's Degree | $53,004 | $38,682 |
| Bachelor's Degree | $66,624 | $53,327 |
| Graduate Degree | $68,883 | $70,667 |
| Total | $54,458 | $41,820 |
Family Income in Prince George County
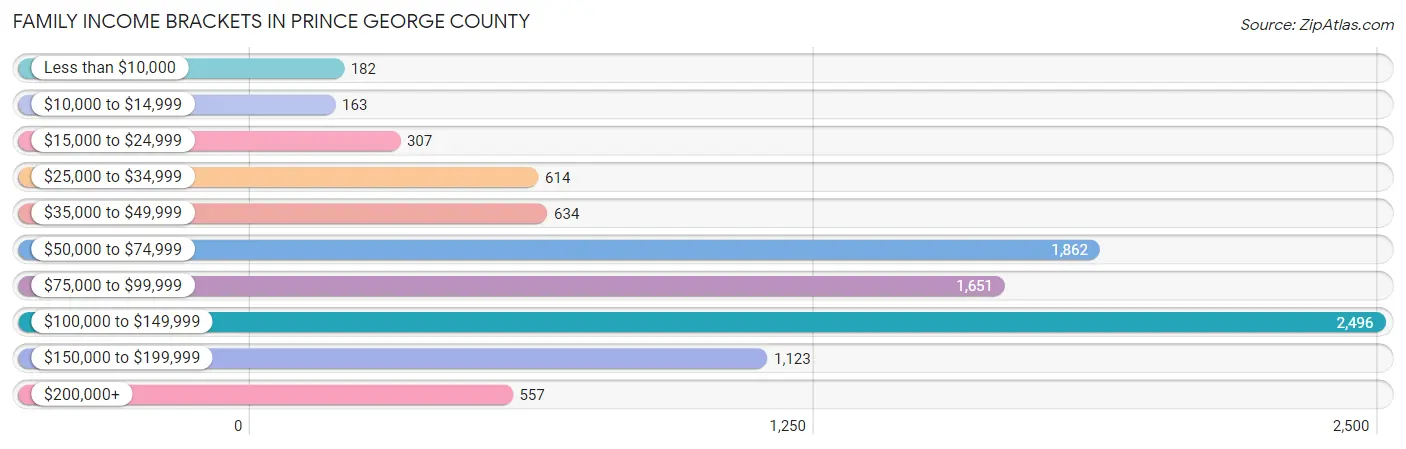
Family Income Brackets in Prince George County
According to the Prince George County family income data, there are 2,496 families falling into the $100,000 to $149,999 income range, which is the most common income bracket and makes up 26.0% of all families. Conversely, the $10,000 to $14,999 income bracket is the least frequent group with only 163 families (1.7%) belonging to this category.
| Income Bracket | # Families | % Families |
| Less than $10,000 | 182 | 1.9% |
| $10,000 to $14,999 | 163 | 1.7% |
| $15,000 to $24,999 | 307 | 3.2% |
| $25,000 to $34,999 | 614 | 6.4% |
| $35,000 to $49,999 | 634 | 6.6% |
| $50,000 to $74,999 | 1,862 | 19.4% |
| $75,000 to $99,999 | 1,651 | 17.2% |
| $100,000 to $149,999 | 2,496 | 26.0% |
| $150,000 to $199,999 | 1,123 | 11.7% |
| $200,000+ | 557 | 5.8% |
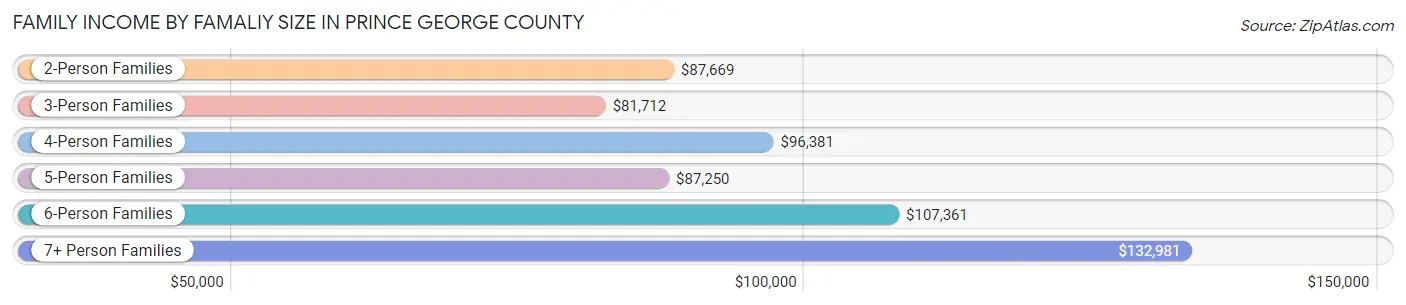
Family Income by Famaliy Size in Prince George County
7+ person families (101 | 1.1%) account for the highest median family income in Prince George County with $132,981 per family, while 2-person families (4,144 | 43.2%) have the highest median income of $43,834 per family member.
| Income Bracket | # Families | Median Income |
| 2-Person Families | 4,144 (43.2%) | $87,669 |
| 3-Person Families | 2,707 (28.2%) | $81,712 |
| 4-Person Families | 1,643 (17.1%) | $96,381 |
| 5-Person Families | 772 (8.0%) | $87,250 |
| 6-Person Families | 233 (2.4%) | $107,361 |
| 7+ Person Families | 101 (1.1%) | $132,981 |
| Total | 9,600 (100.0%) | $88,333 |
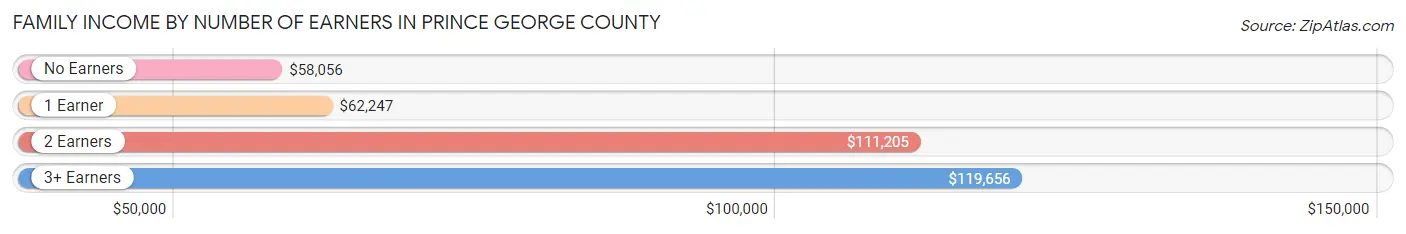
Family Income by Number of Earners in Prince George County
The median family income in Prince George County is $88,333, with families comprising 3+ earners (1,111) having the highest median family income of $119,656, while families with no earners (1,360) have the lowest median family income of $58,056, accounting for 11.6% and 14.2% of families, respectively.
| Number of Earners | # Families | Median Income |
| No Earners | 1,360 (14.2%) | $58,056 |
| 1 Earner | 3,133 (32.6%) | $62,247 |
| 2 Earners | 3,996 (41.6%) | $111,205 |
| 3+ Earners | 1,111 (11.6%) | $119,656 |
| Total | 9,600 (100.0%) | $88,333 |
Household Income in Prince George County
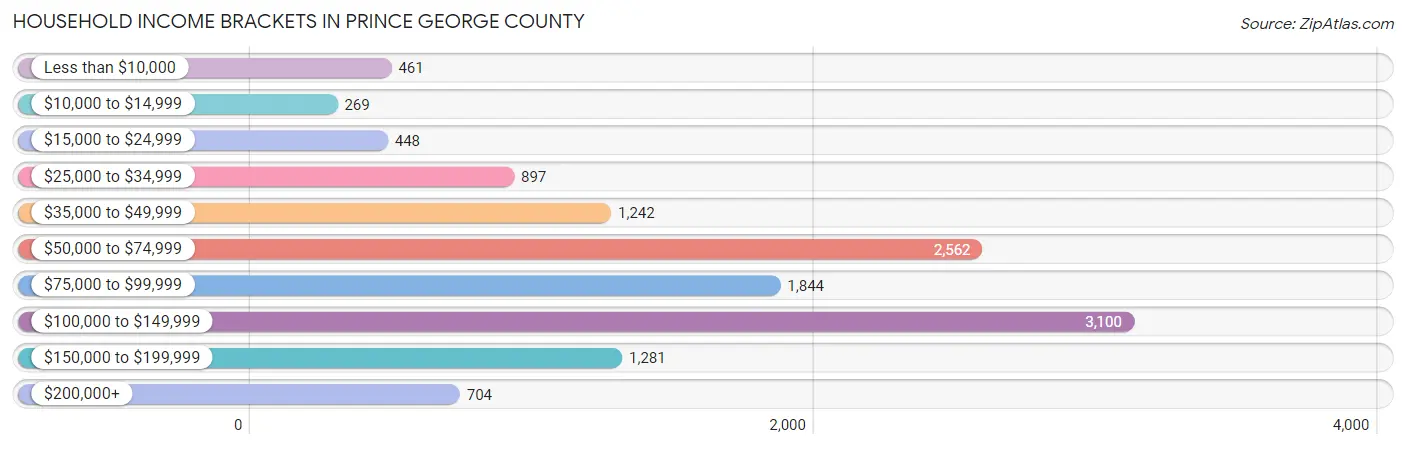
Household Income Brackets in Prince George County
With 3,100 households falling in the category, the $100,000 to $149,999 income range is the most frequent in Prince George County, accounting for 24.2% of all households. In contrast, only 269 households (2.1%) fall into the $10,000 to $14,999 income bracket, making it the least populous group.
| Income Bracket | # Households | % Households |
| Less than $10,000 | 461 | 3.6% |
| $10,000 to $14,999 | 269 | 2.1% |
| $15,000 to $24,999 | 448 | 3.5% |
| $25,000 to $34,999 | 897 | 7.0% |
| $35,000 to $49,999 | 1,242 | 9.7% |
| $50,000 to $74,999 | 2,562 | 20.0% |
| $75,000 to $99,999 | 1,844 | 14.4% |
| $100,000 to $149,999 | 3,100 | 24.2% |
| $150,000 to $199,999 | 1,281 | 10.0% |
| $200,000+ | 704 | 5.5% |
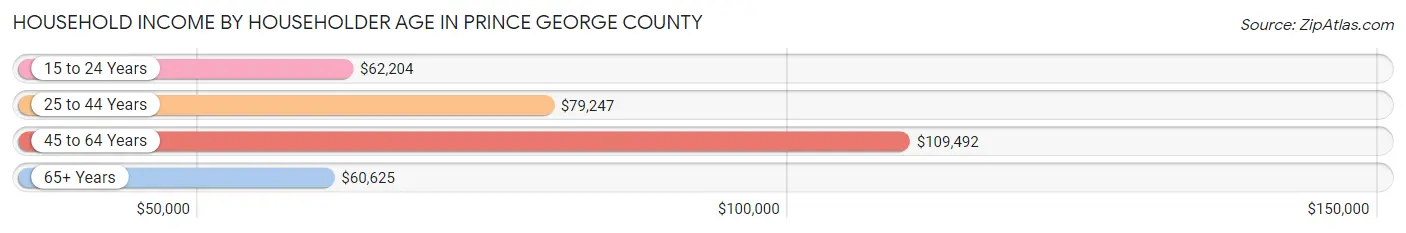
Household Income by Householder Age in Prince George County
The median household income in Prince George County is $80,318, with the highest median household income of $109,492 found in the 45 to 64 years age bracket for the primary householder. A total of 4,394 households (34.3%) fall into this category. Meanwhile, the 65+ years age bracket for the primary householder has the lowest median household income of $60,625, with 3,366 households (26.3%) in this group.
| Income Bracket | # Households | Median Income |
| 15 to 24 Years | 267 (2.1%) | $62,204 |
| 25 to 44 Years | 4,781 (37.3%) | $79,247 |
| 45 to 64 Years | 4,394 (34.3%) | $109,492 |
| 65+ Years | 3,366 (26.3%) | $60,625 |
| Total | 12,808 (100.0%) | $80,318 |
Poverty in Prince George County
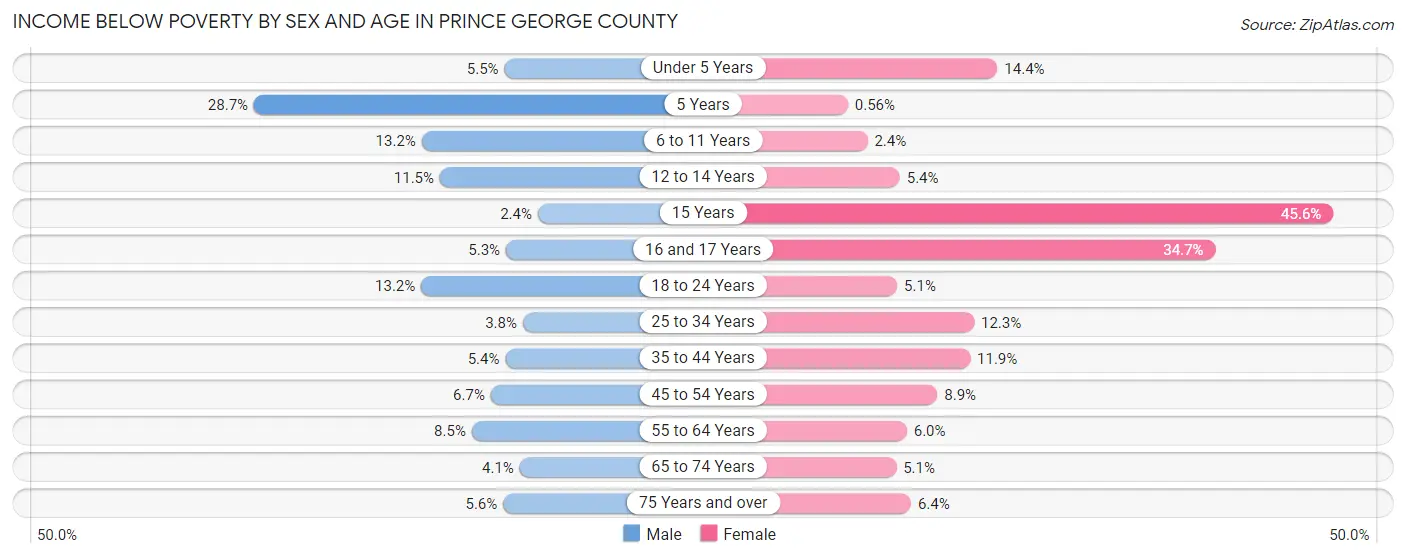
Income Below Poverty by Sex and Age in Prince George County
With 7.6% poverty level for males and 8.9% for females among the residents of Prince George County, 5 year old males and 15 year old females are the most vulnerable to poverty, with 83 males (28.7%) and 83 females (45.6%) in their respective age groups living below the poverty level.
| Age Bracket | Male | Female |
| Under 5 Years | 62 (5.5%) | 136 (14.4%) |
| 5 Years | 83 (28.7%) | 1 (0.6%) |
| 6 to 11 Years | 173 (13.2%) | 33 (2.4%) |
| 12 to 14 Years | 94 (11.5%) | 42 (5.4%) |
| 15 Years | 11 (2.4%) | 83 (45.6%) |
| 16 and 17 Years | 16 (5.3%) | 156 (34.7%) |
| 18 to 24 Years | 350 (13.2%) | 110 (5.1%) |
| 25 to 34 Years | 120 (3.8%) | 284 (12.3%) |
| 35 to 44 Years | 135 (5.4%) | 274 (11.9%) |
| 45 to 54 Years | 124 (6.7%) | 180 (8.9%) |
| 55 to 64 Years | 159 (8.5%) | 133 (6.0%) |
| 65 to 74 Years | 61 (4.1%) | 85 (5.1%) |
| 75 Years and over | 52 (5.6%) | 83 (6.4%) |
| Total | 1,440 (7.6%) | 1,600 (8.9%) |
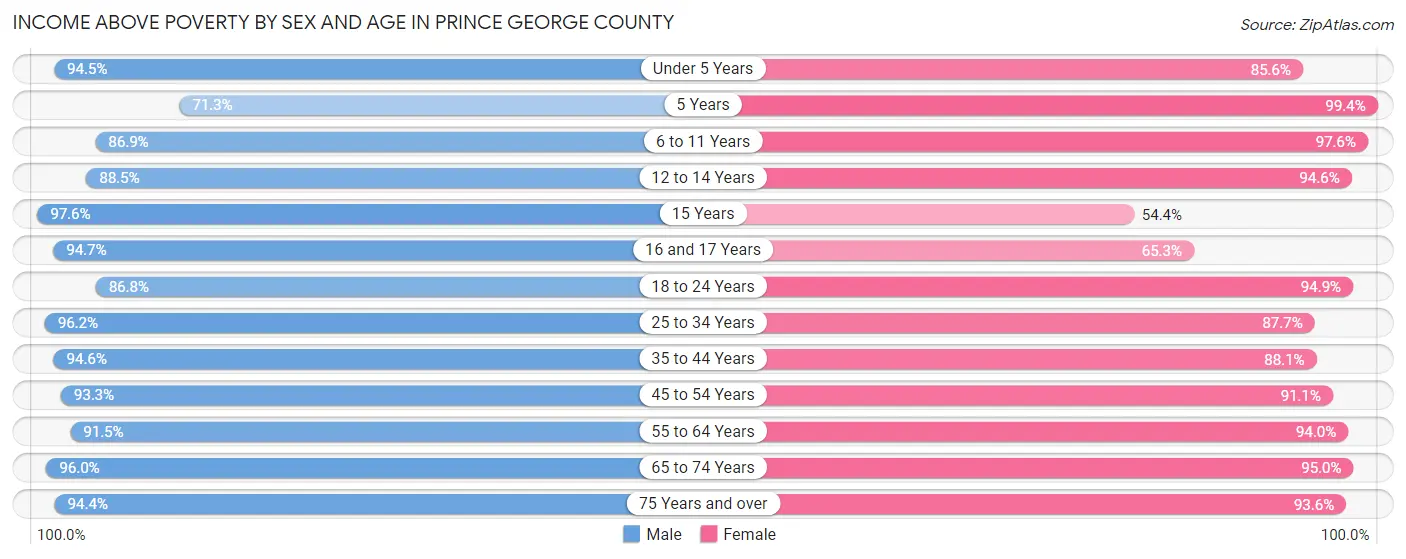
Income Above Poverty by Sex and Age in Prince George County
According to the poverty statistics in Prince George County, males aged 15 years and females aged 5 years are the age groups that are most secure financially, with 97.6% of males and 99.4% of females in these age groups living above the poverty line.
| Age Bracket | Male | Female |
| Under 5 Years | 1,071 (94.5%) | 806 (85.6%) |
| 5 Years | 206 (71.3%) | 179 (99.4%) |
| 6 to 11 Years | 1,143 (86.9%) | 1,353 (97.6%) |
| 12 to 14 Years | 726 (88.5%) | 739 (94.6%) |
| 15 Years | 454 (97.6%) | 99 (54.4%) |
| 16 and 17 Years | 284 (94.7%) | 294 (65.3%) |
| 18 to 24 Years | 2,302 (86.8%) | 2,028 (94.9%) |
| 25 to 34 Years | 3,072 (96.2%) | 2,031 (87.7%) |
| 35 to 44 Years | 2,371 (94.6%) | 2,027 (88.1%) |
| 45 to 54 Years | 1,716 (93.3%) | 1,850 (91.1%) |
| 55 to 64 Years | 1,712 (91.5%) | 2,074 (94.0%) |
| 65 to 74 Years | 1,447 (96.0%) | 1,599 (95.0%) |
| 75 Years and over | 879 (94.4%) | 1,210 (93.6%) |
| Total | 17,383 (92.3%) | 16,289 (91.1%) |
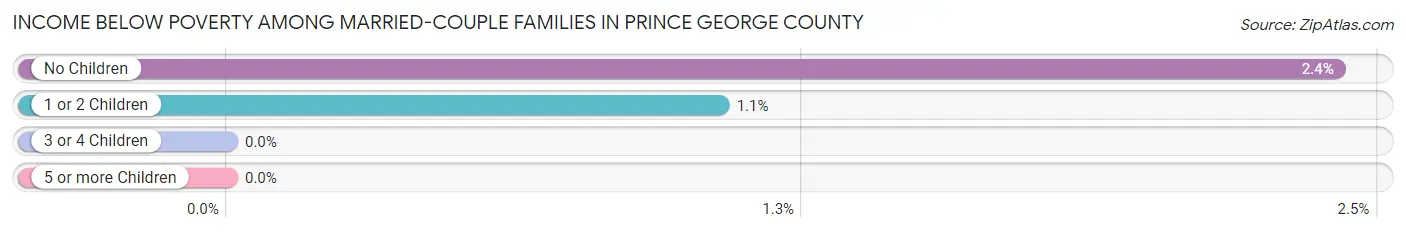
Income Below Poverty Among Married-Couple Families in Prince George County
The poverty statistics for married-couple families in Prince George County show that 1.8% or 126 of the total 7,192 families live below the poverty line. Families with no children have the highest poverty rate of 2.4%, comprising of 100 families. On the other hand, families with 3 or 4 children have the lowest poverty rate of 0.0%, which includes 0 families.
| Children | Above Poverty | Below Poverty |
| No Children | 4,048 (97.6%) | 100 (2.4%) |
| 1 or 2 Children | 2,414 (98.9%) | 26 (1.1%) |
| 3 or 4 Children | 558 (100.0%) | 0 (0.0%) |
| 5 or more Children | 46 (100.0%) | 0 (0.0%) |
| Total | 7,066 (98.3%) | 126 (1.8%) |
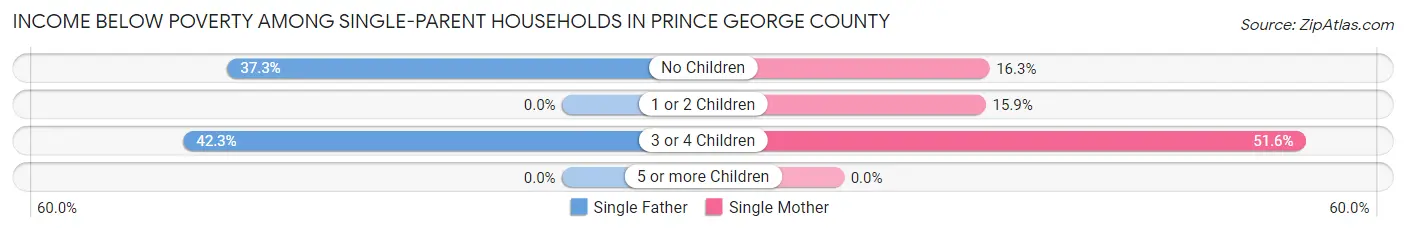
Income Below Poverty Among Single-Parent Households in Prince George County
According to the poverty data in Prince George County, 19.5% or 142 single-father households and 19.3% or 324 single-mother households are living below the poverty line. Among single-father households, those with 3 or 4 children have the highest poverty rate, with 30 households (42.2%) experiencing poverty. Likewise, among single-mother households, those with 3 or 4 children have the highest poverty rate, with 81 households (51.6%) falling below the poverty line.
| Children | Single Father | Single Mother |
| No Children | 112 (37.3%) | 69 (16.3%) |
| 1 or 2 Children | 0 (0.0%) | 174 (15.9%) |
| 3 or 4 Children | 30 (42.2%) | 81 (51.6%) |
| 5 or more Children | 0 (0.0%) | 0 (0.0%) |
| Total | 142 (19.5%) | 324 (19.3%) |
Income Below Poverty Among Married-Couple vs Single-Parent Households in Prince George County
The poverty data for Prince George County shows that 126 of the married-couple family households (1.8%) and 466 of the single-parent households (19.4%) are living below the poverty level. Within the married-couple family households, those with no children have the highest poverty rate, with 100 households (2.4%) falling below the poverty line. Among the single-parent households, those with 3 or 4 children have the highest poverty rate, with 111 household (48.7%) living below poverty.
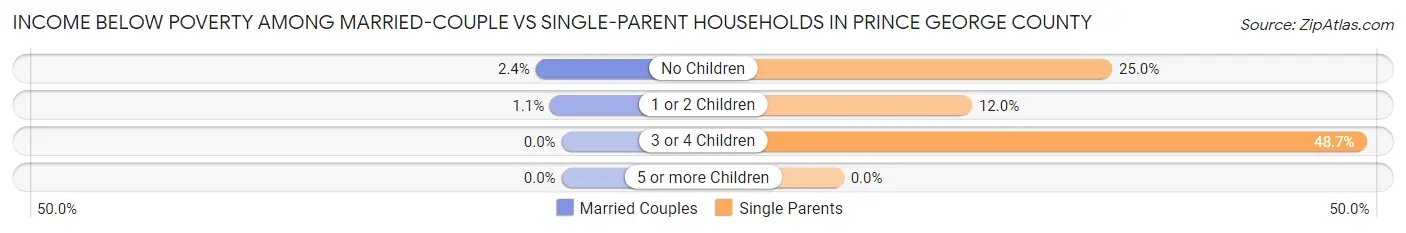
| Children | Married-Couple Families | Single-Parent Households |
| No Children | 100 (2.4%) | 181 (25.0%) |
| 1 or 2 Children | 26 (1.1%) | 174 (11.9%) |
| 3 or 4 Children | 0 (0.0%) | 111 (48.7%) |
| 5 or more Children | 0 (0.0%) | 0 (0.0%) |
| Total | 126 (1.8%) | 466 (19.4%) |
Race in Prince George County
The most populous races in Prince George County are White / Caucasian (23,798 | 55.8%), Black / African American (13,255 | 31.1%), and Hispanic or Latino (4,117 | 9.7%).
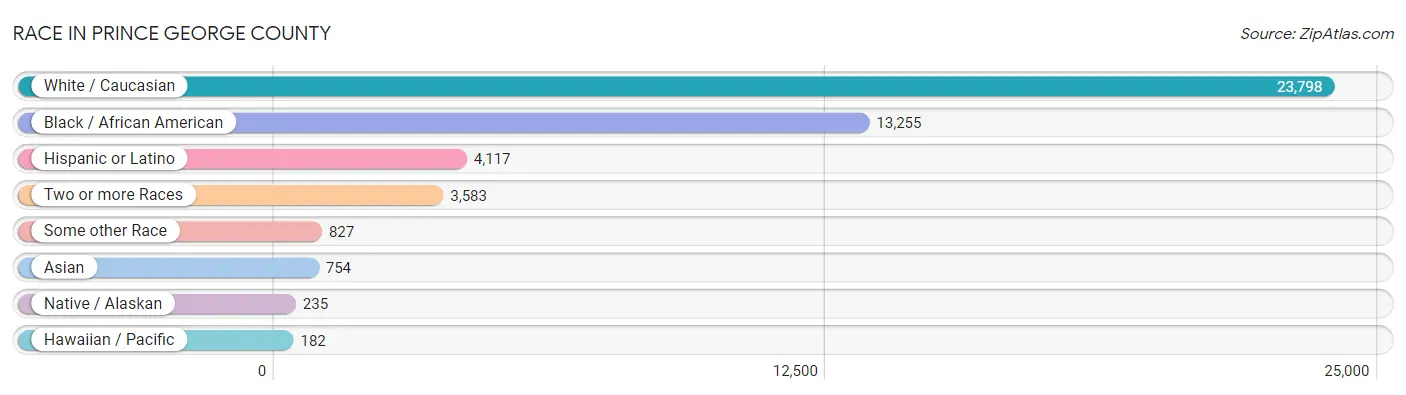
| Race | # Population | % Population |
| Asian | 754 | 1.8% |
| Black / African American | 13,255 | 31.1% |
| Hawaiian / Pacific | 182 | 0.4% |
| Hispanic or Latino | 4,117 | 9.7% |
| Native / Alaskan | 235 | 0.5% |
| White / Caucasian | 23,798 | 55.8% |
| Two or more Races | 3,583 | 8.4% |
| Some other Race | 827 | 1.9% |
| Total | 42,634 | 100.0% |
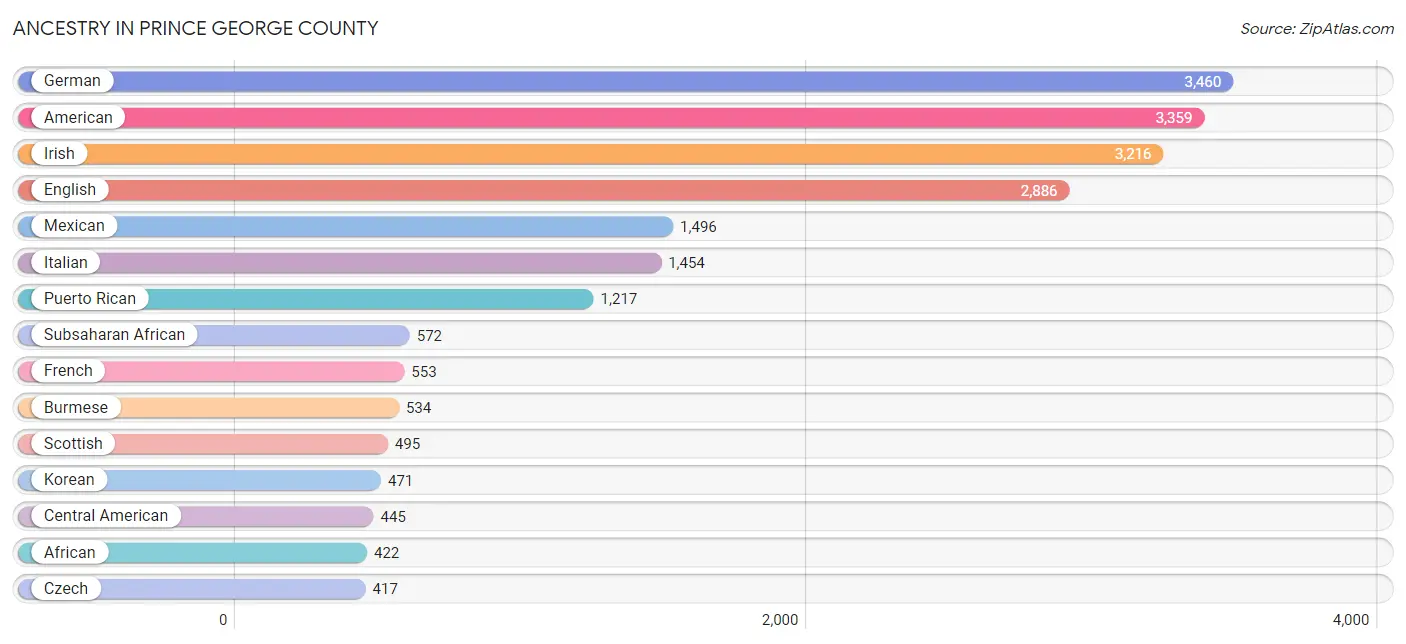
Ancestry in Prince George County
The most populous ancestries reported in Prince George County are German (3,460 | 8.1%), American (3,359 | 7.9%), Irish (3,216 | 7.5%), English (2,886 | 6.8%), and Mexican (1,496 | 3.5%), together accounting for 33.8% of all Prince George County residents.
| Ancestry | # Population | % Population |
| Afghan | 48 | 0.1% |
| African | 422 | 1.0% |
| American | 3,359 | 7.9% |
| Apache | 24 | 0.1% |
| Arab | 213 | 0.5% |
| Argentinean | 1 | 0.0% |
| Armenian | 10 | 0.0% |
| Australian | 26 | 0.1% |
| Austrian | 38 | 0.1% |
| Bhutanese | 97 | 0.2% |
| Blackfeet | 47 | 0.1% |
| Brazilian | 104 | 0.2% |
| British | 307 | 0.7% |
| British West Indian | 13 | 0.0% |
| Burmese | 534 | 1.3% |
| Cajun | 7 | 0.0% |
| Central American | 445 | 1.0% |
| Central American Indian | 194 | 0.5% |
| Cherokee | 168 | 0.4% |
| Chilean | 15 | 0.0% |
| Chippewa | 24 | 0.1% |
| Choctaw | 5 | 0.0% |
| Colombian | 27 | 0.1% |
| Creek | 27 | 0.1% |
| Croatian | 63 | 0.2% |
| Cuban | 47 | 0.1% |
| Czech | 417 | 1.0% |
| Czechoslovakian | 190 | 0.4% |
| Danish | 95 | 0.2% |
| Dominican | 76 | 0.2% |
| Dutch | 314 | 0.7% |
| Eastern European | 39 | 0.1% |
| Ecuadorian | 79 | 0.2% |
| English | 2,886 | 6.8% |
| European | 340 | 0.8% |
| Finnish | 16 | 0.0% |
| French | 553 | 1.3% |
| French American Indian | 10 | 0.0% |
| French Canadian | 115 | 0.3% |
| German | 3,460 | 8.1% |
| Greek | 138 | 0.3% |
| Guamanian / Chamorro | 28 | 0.1% |
| Guatemalan | 34 | 0.1% |
| Haitian | 62 | 0.2% |
| Honduran | 144 | 0.3% |
| Hungarian | 107 | 0.3% |
| Indian (Asian) | 77 | 0.2% |
| Iranian | 20 | 0.1% |
| Iraqi | 24 | 0.1% |
| Irish | 3,216 | 7.5% |
| Italian | 1,454 | 3.4% |
| Jamaican | 180 | 0.4% |
| Japanese | 65 | 0.2% |
| Kenyan | 3 | 0.0% |
| Korean | 471 | 1.1% |
| Laotian | 17 | 0.0% |
| Lebanese | 11 | 0.0% |
| Mexican | 1,496 | 3.5% |
| Mexican American Indian | 25 | 0.1% |
| Moroccan | 18 | 0.0% |
| Native Hawaiian | 7 | 0.0% |
| Navajo | 7 | 0.0% |
| Nicaraguan | 23 | 0.1% |
| Nigerian | 10 | 0.0% |
| Northern European | 4 | 0.0% |
| Norwegian | 78 | 0.2% |
| Osage | 50 | 0.1% |
| Pakistani | 76 | 0.2% |
| Palestinian | 59 | 0.1% |
| Panamanian | 148 | 0.4% |
| Peruvian | 65 | 0.2% |
| Polish | 408 | 1.0% |
| Portuguese | 109 | 0.3% |
| Puerto Rican | 1,217 | 2.9% |
| Romanian | 12 | 0.0% |
| Russian | 82 | 0.2% |
| Salvadoran | 96 | 0.2% |
| Samoan | 30 | 0.1% |
| Scandinavian | 16 | 0.0% |
| Scotch-Irish | 341 | 0.8% |
| Scottish | 495 | 1.2% |
| Shoshone | 35 | 0.1% |
| Sierra Leonean | 110 | 0.3% |
| Sioux | 7 | 0.0% |
| Slovak | 18 | 0.0% |
| South American | 243 | 0.6% |
| Spaniard | 154 | 0.4% |
| Spanish | 60 | 0.1% |
| Sri Lankan | 68 | 0.2% |
| Subsaharan African | 572 | 1.3% |
| Swedish | 142 | 0.3% |
| Swiss | 20 | 0.1% |
| Syrian | 18 | 0.0% |
| Thai | 81 | 0.2% |
| Trinidadian and Tobagonian | 44 | 0.1% |
| U.S. Virgin Islander | 9 | 0.0% |
| Ukrainian | 8 | 0.0% |
| Ute | 6 | 0.0% |
| Venezuelan | 56 | 0.1% |
| Welsh | 159 | 0.4% |
| West Indian | 37 | 0.1% |
| Yugoslavian | 63 | 0.2% |
| Yup'ik | 6 | 0.0% | View All 103 Rows |
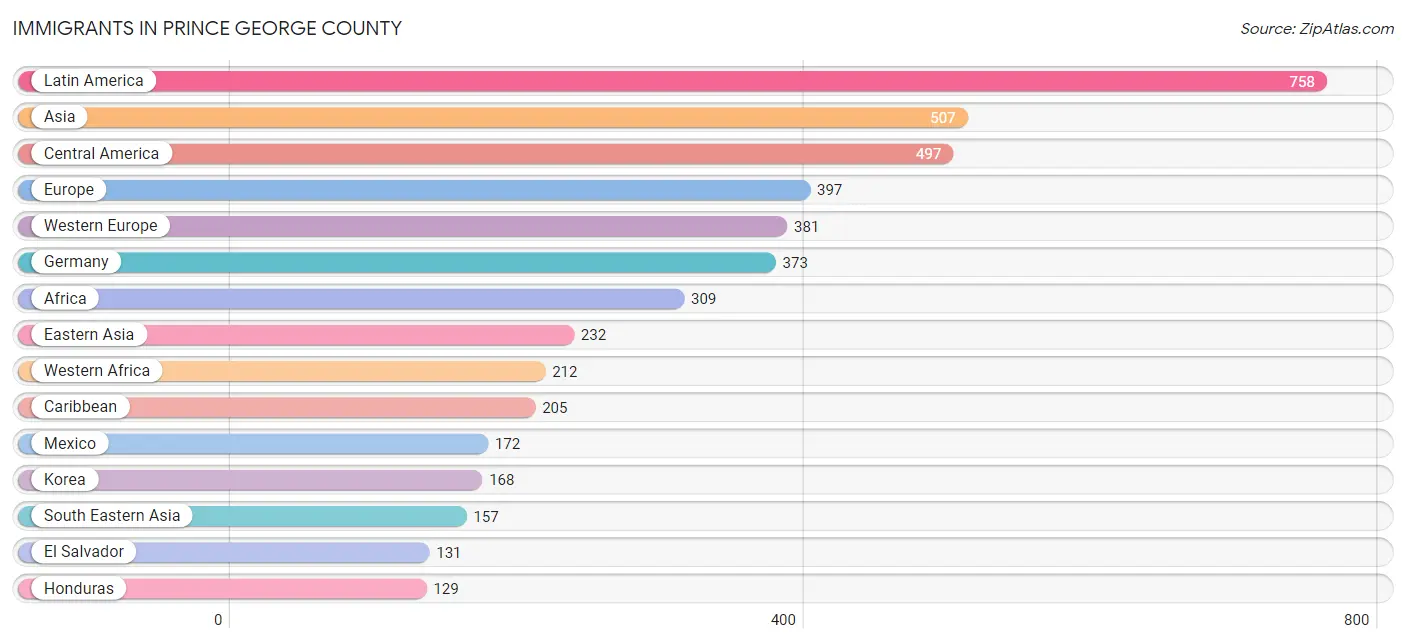
Immigrants in Prince George County
The most numerous immigrant groups reported in Prince George County came from Latin America (758 | 1.8%), Asia (507 | 1.2%), Central America (497 | 1.2%), Europe (397 | 0.9%), and Western Europe (381 | 0.9%), together accounting for 6.0% of all Prince George County residents.
| Immigration Origin | # Population | % Population |
| Afghanistan | 10 | 0.0% |
| Africa | 309 | 0.7% |
| Argentina | 4 | 0.0% |
| Asia | 507 | 1.2% |
| Bosnia and Herzegovina | 16 | 0.0% |
| Brazil | 15 | 0.0% |
| Cameroon | 57 | 0.1% |
| Canada | 16 | 0.0% |
| Caribbean | 205 | 0.5% |
| Central America | 497 | 1.2% |
| China | 14 | 0.0% |
| Colombia | 9 | 0.0% |
| Cuba | 9 | 0.0% |
| Dominican Republic | 40 | 0.1% |
| Eastern Africa | 10 | 0.0% |
| Eastern Asia | 232 | 0.5% |
| Eastern Europe | 16 | 0.0% |
| El Salvador | 131 | 0.3% |
| Ethiopia | 7 | 0.0% |
| Europe | 397 | 0.9% |
| France | 8 | 0.0% |
| Germany | 373 | 0.9% |
| Grenada | 13 | 0.0% |
| Guatemala | 11 | 0.0% |
| Haiti | 92 | 0.2% |
| Honduras | 129 | 0.3% |
| Hong Kong | 13 | 0.0% |
| Iraq | 24 | 0.1% |
| Jamaica | 30 | 0.1% |
| Japan | 50 | 0.1% |
| Kenya | 3 | 0.0% |
| Korea | 168 | 0.4% |
| Latin America | 758 | 1.8% |
| Mexico | 172 | 0.4% |
| Middle Africa | 57 | 0.1% |
| Nicaragua | 23 | 0.1% |
| Nigeria | 53 | 0.1% |
| Oceania | 10 | 0.0% |
| Pakistan | 17 | 0.0% |
| Panama | 31 | 0.1% |
| Peru | 1 | 0.0% |
| Philippines | 94 | 0.2% |
| Sierra Leone | 85 | 0.2% |
| South America | 56 | 0.1% |
| South Central Asia | 27 | 0.1% |
| South Eastern Asia | 157 | 0.4% |
| Thailand | 22 | 0.1% |
| Trinidad and Tobago | 14 | 0.0% |
| Venezuela | 27 | 0.1% |
| Vietnam | 41 | 0.1% |
| Western Africa | 212 | 0.5% |
| Western Asia | 91 | 0.2% |
| Western Europe | 381 | 0.9% |
| Yemen | 67 | 0.2% | View All 54 Rows |
Sex and Age in Prince George County
Sex and Age in Prince George County
The most populous age groups in Prince George County are 15 to 19 Years (2,587 | 10.8%) for men and 20 to 24 Years (1,605 | 8.6%) for women.
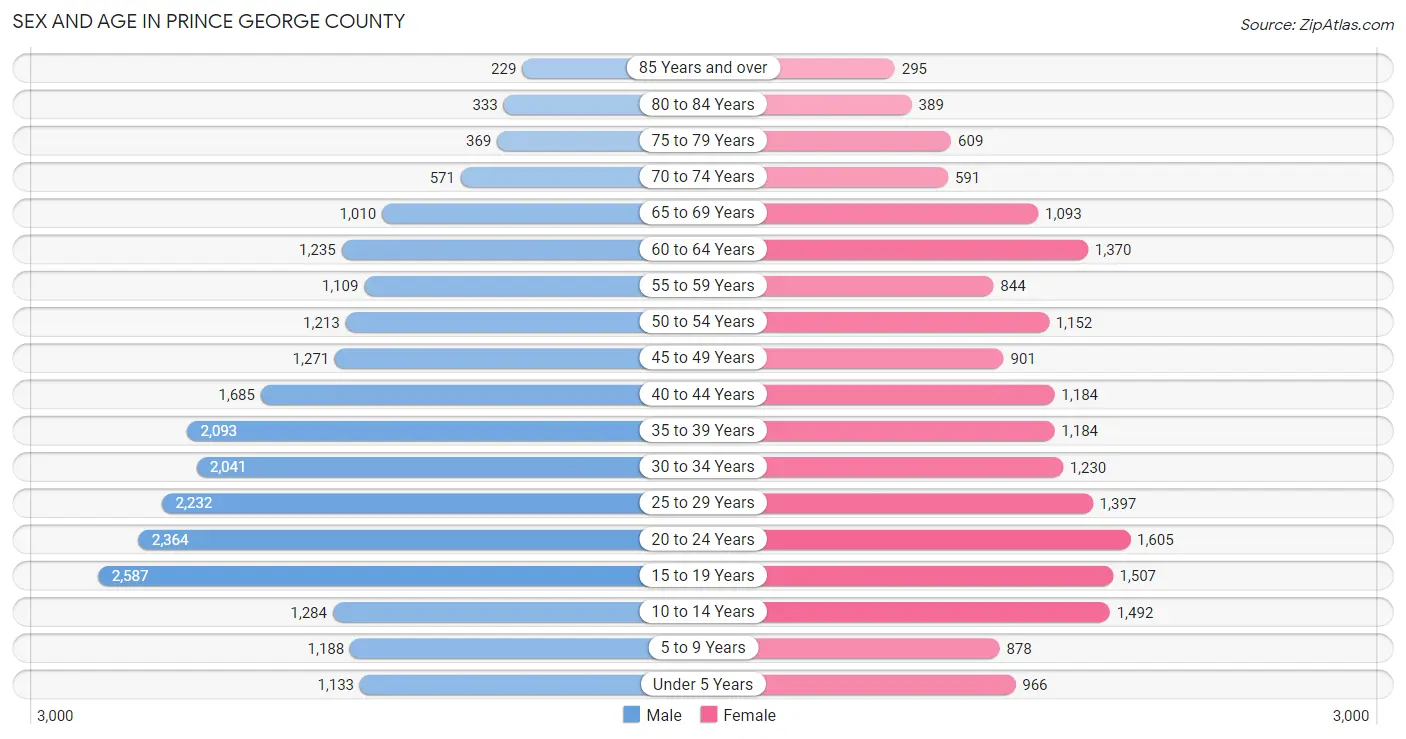
| Age Bracket | Male | Female |
| Under 5 Years | 1,133 (4.7%) | 966 (5.2%) |
| 5 to 9 Years | 1,188 (5.0%) | 878 (4.7%) |
| 10 to 14 Years | 1,284 (5.4%) | 1,492 (8.0%) |
| 15 to 19 Years | 2,587 (10.8%) | 1,507 (8.1%) |
| 20 to 24 Years | 2,364 (9.9%) | 1,605 (8.6%) |
| 25 to 29 Years | 2,232 (9.3%) | 1,397 (7.5%) |
| 30 to 34 Years | 2,041 (8.5%) | 1,230 (6.6%) |
| 35 to 39 Years | 2,093 (8.7%) | 1,184 (6.3%) |
| 40 to 44 Years | 1,685 (7.0%) | 1,184 (6.3%) |
| 45 to 49 Years | 1,271 (5.3%) | 901 (4.8%) |
| 50 to 54 Years | 1,213 (5.1%) | 1,152 (6.2%) |
| 55 to 59 Years | 1,109 (4.6%) | 844 (4.5%) |
| 60 to 64 Years | 1,235 (5.2%) | 1,370 (7.3%) |
| 65 to 69 Years | 1,010 (4.2%) | 1,093 (5.9%) |
| 70 to 74 Years | 571 (2.4%) | 591 (3.2%) |
| 75 to 79 Years | 369 (1.5%) | 609 (3.3%) |
| 80 to 84 Years | 333 (1.4%) | 389 (2.1%) |
| 85 Years and over | 229 (1.0%) | 295 (1.6%) |
| Total | 23,947 (100.0%) | 18,687 (100.0%) |
Families and Households in Prince George County
Median Family Size in Prince George County
The median family size in Prince George County is 3.31 persons per family, with single female/mother families (1,678 | 17.5%) accounting for the largest median family size of 3.38 persons per family. On the other hand, single male/father families (730 | 7.6%) represent the smallest median family size with 3.07 persons per family.
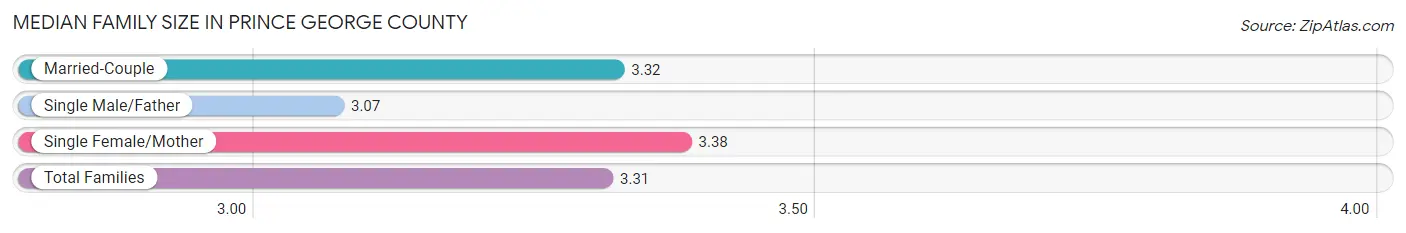
| Family Type | # Families | Family Size |
| Married-Couple | 7,192 (74.9%) | 3.32 |
| Single Male/Father | 730 (7.6%) | 3.07 |
| Single Female/Mother | 1,678 (17.5%) | 3.38 |
| Total Families | 9,600 (100.0%) | 3.31 |
Median Household Size in Prince George County
The median household size in Prince George County is 2.87 persons per household, with single female/mother households (1,678 | 13.1%) accounting for the largest median household size of 3.79 persons per household. non-family households (3,208 | 25.1%) represent the smallest median household size with 1.23 persons per household.
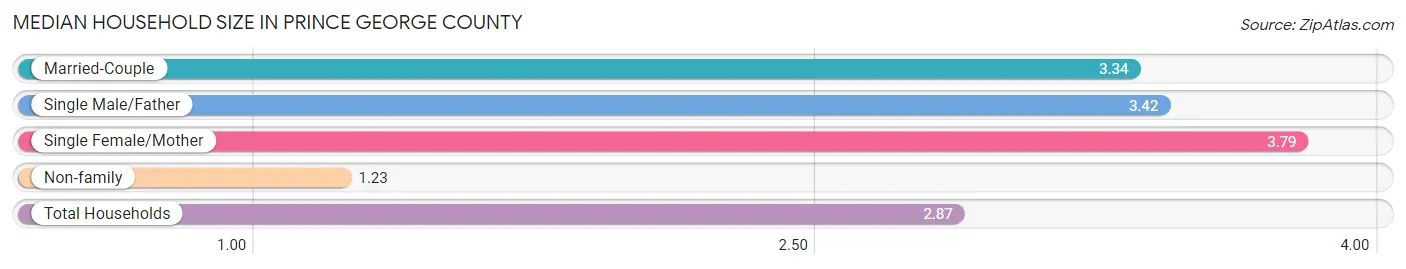
| Household Type | # Households | Household Size |
| Married-Couple | 7,192 (56.1%) | 3.34 |
| Single Male/Father | 730 (5.7%) | 3.42 |
| Single Female/Mother | 1,678 (13.1%) | 3.79 |
| Non-family | 3,208 (25.1%) | 1.23 |
| Total Households | 12,808 (100.0%) | 2.87 |
Household Size by Marriage Status in Prince George County
Out of a total of 12,808 households in Prince George County, 9,600 (75.0%) are family households, while 3,208 (25.1%) are nonfamily households. The most numerous type of family households are 2-person households, comprising 3,951, and the most common type of nonfamily households are 1-person households, comprising 2,525.
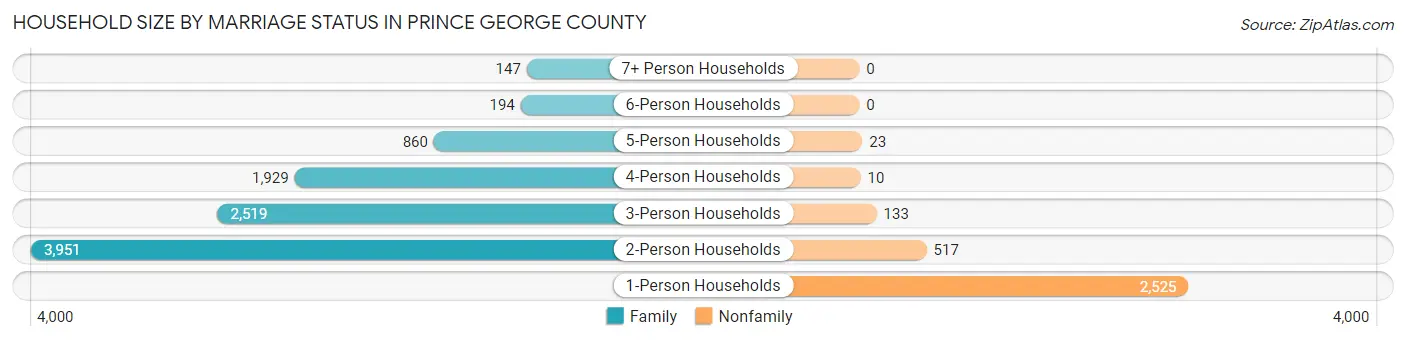
| Household Size | Family Households | Nonfamily Households |
| 1-Person Households | - | 2,525 (19.7%) |
| 2-Person Households | 3,951 (30.8%) | 517 (4.0%) |
| 3-Person Households | 2,519 (19.7%) | 133 (1.0%) |
| 4-Person Households | 1,929 (15.1%) | 10 (0.1%) |
| 5-Person Households | 860 (6.7%) | 23 (0.2%) |
| 6-Person Households | 194 (1.5%) | 0 (0.0%) |
| 7+ Person Households | 147 (1.1%) | 0 (0.0%) |
| Total | 9,600 (75.0%) | 3,208 (25.1%) |
Female Fertility in Prince George County
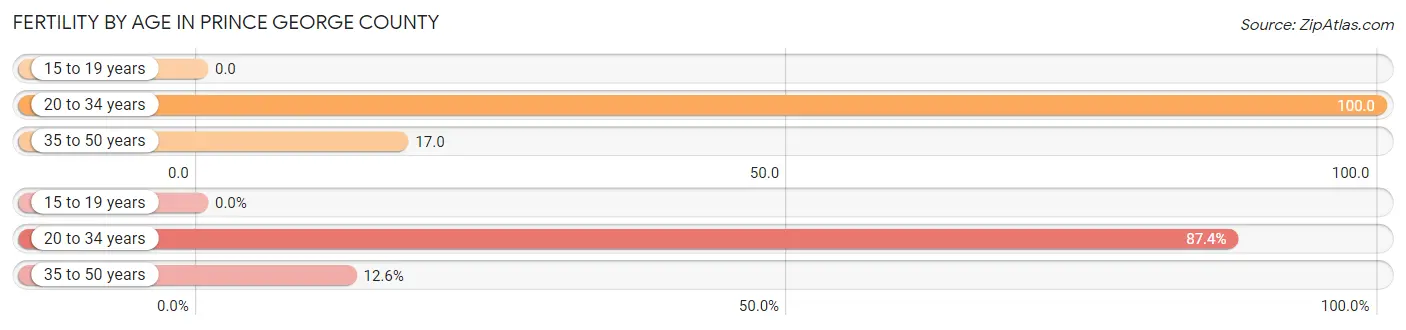
Fertility by Age in Prince George County
Average fertility rate in Prince George County is 52.0 births per 1,000 women. Women in the age bracket of 20 to 34 years have the highest fertility rate with 100.0 births per 1,000 women. Women in the age bracket of 20 to 34 years acount for 87.4% of all women with births.
| Age Bracket | Women with Births | Births / 1,000 Women |
| 15 to 19 years | 0 (0.0%) | 0.0 |
| 20 to 34 years | 423 (87.4%) | 100.0 |
| 35 to 50 years | 61 (12.6%) | 17.0 |
| Total | 484 (100.0%) | 52.0 |
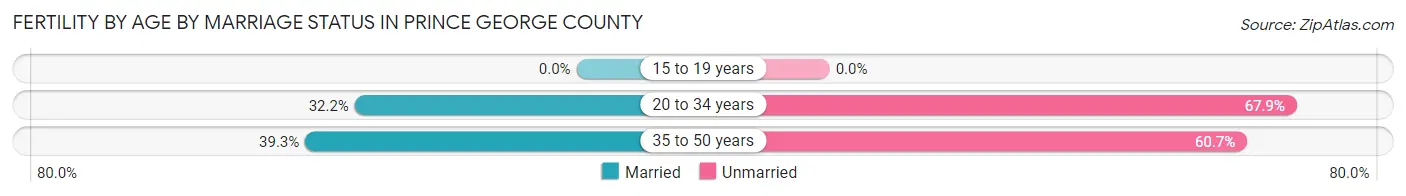
Fertility by Age by Marriage Status in Prince George County
33.1% of women with births (484) in Prince George County are married. The highest percentage of unmarried women with births falls into 20 to 34 years age bracket with 67.8% of them unmarried at the time of birth, while the lowest percentage of unmarried women with births belong to 35 to 50 years age bracket with 60.7% of them unmarried.
| Age Bracket | Married | Unmarried |
| 15 to 19 years | 0 (0.0%) | 0 (0.0%) |
| 20 to 34 years | 136 (32.2%) | 287 (67.8%) |
| 35 to 50 years | 24 (39.3%) | 37 (60.7%) |
| Total | 160 (33.1%) | 324 (66.9%) |
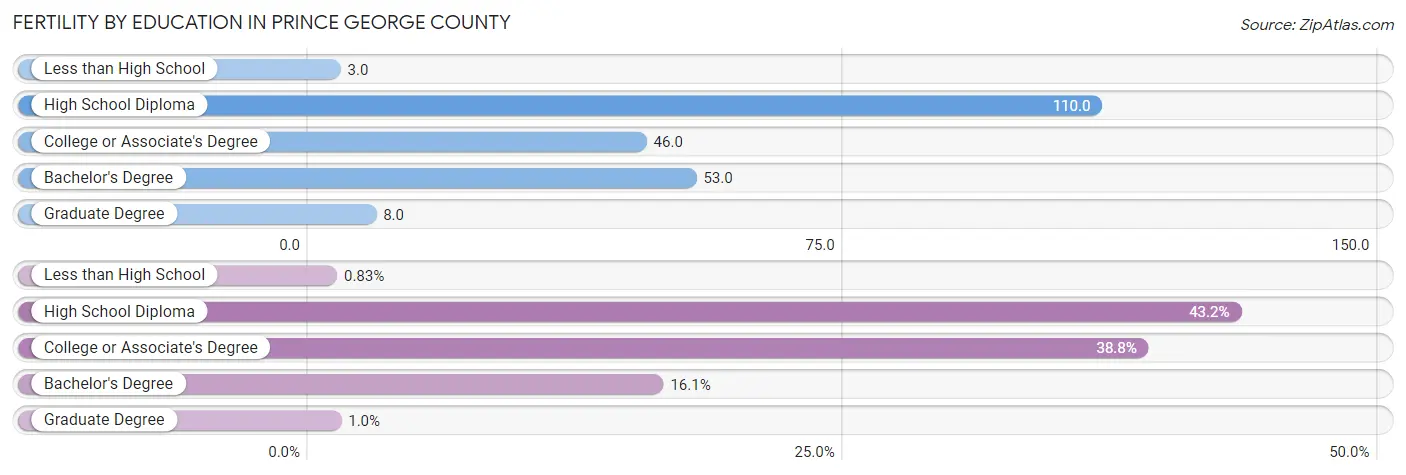
Fertility by Education in Prince George County
Average fertility rate in Prince George County is 52.0 births per 1,000 women. Women with the education attainment of high school diploma have the highest fertility rate of 110.0 births per 1,000 women, while women with the education attainment of less than high school have the lowest fertility at 3.0 births per 1,000 women. Women with the education attainment of high school diploma represent 43.2% of all women with births.
| Educational Attainment | Women with Births | Births / 1,000 Women |
| Less than High School | 4 (0.8%) | 3.0 |
| High School Diploma | 209 (43.2%) | 110.0 |
| College or Associate's Degree | 188 (38.8%) | 46.0 |
| Bachelor's Degree | 78 (16.1%) | 53.0 |
| Graduate Degree | 5 (1.0%) | 8.0 |
| Total | 484 (100.0%) | 52.0 |
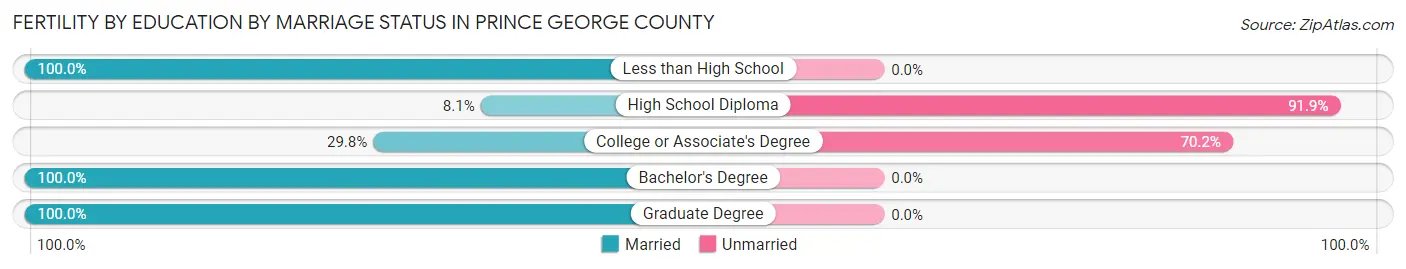
Fertility by Education by Marriage Status in Prince George County
66.9% of women with births in Prince George County are unmarried. Women with the educational attainment of less than high school are most likely to be married with 100.0% of them married at childbirth, while women with the educational attainment of high school diploma are least likely to be married with 91.9% of them unmarried at childbirth.
| Educational Attainment | Married | Unmarried |
| Less than High School | 4 (100.0%) | 0 (0.0%) |
| High School Diploma | 17 (8.1%) | 192 (91.9%) |
| College or Associate's Degree | 56 (29.8%) | 132 (70.2%) |
| Bachelor's Degree | 78 (100.0%) | 0 (0.0%) |
| Graduate Degree | 5 (100.0%) | 0 (0.0%) |
| Total | 160 (33.1%) | 324 (66.9%) |
Employment Characteristics in Prince George County
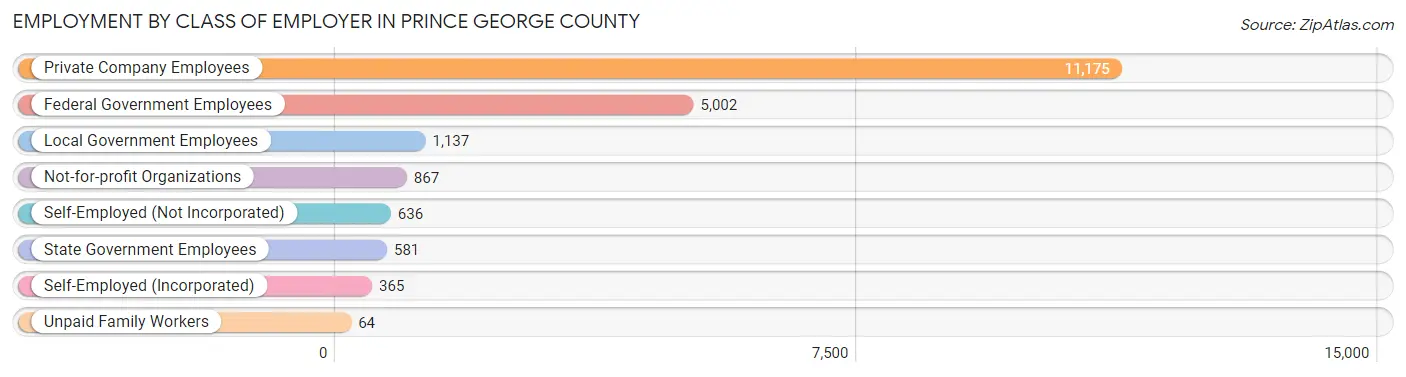
Employment by Class of Employer in Prince George County
Among the 19,827 employed individuals in Prince George County, private company employees (11,175 | 56.4%), federal government employees (5,002 | 25.2%), and local government employees (1,137 | 5.7%) make up the most common classes of employment.
| Employer Class | # Employees | % Employees |
| Private Company Employees | 11,175 | 56.4% |
| Self-Employed (Incorporated) | 365 | 1.8% |
| Self-Employed (Not Incorporated) | 636 | 3.2% |
| Not-for-profit Organizations | 867 | 4.4% |
| Local Government Employees | 1,137 | 5.7% |
| State Government Employees | 581 | 2.9% |
| Federal Government Employees | 5,002 | 25.2% |
| Unpaid Family Workers | 64 | 0.3% |
| Total | 19,827 | 100.0% |
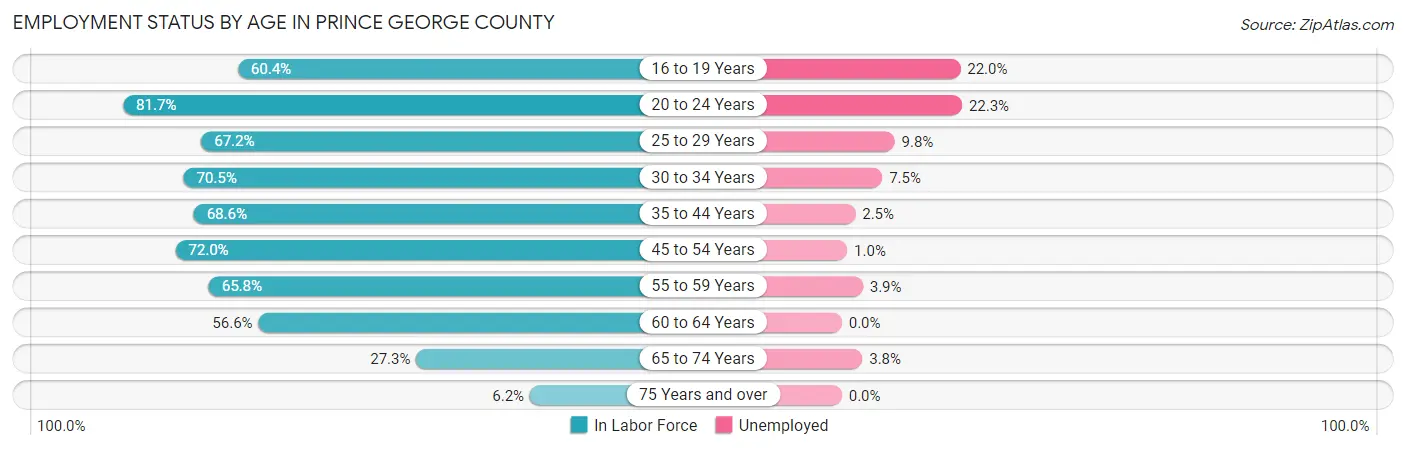
Employment Status by Age in Prince George County
According to the labor force statistics for Prince George County, out of the total population over 16 years of age (35,046), 60.9% or 21,343 individuals are in the labor force, with 7.5% or 1,601 of them unemployed. The age group with the highest labor force participation rate is 20 to 24 years, with 81.7% or 3,243 individuals in the labor force. Within the labor force, the 20 to 24 years age range has the highest percentage of unemployed individuals, with 22.3% or 723 of them being unemployed.
| Age Bracket | In Labor Force | Unemployed |
| 16 to 19 Years | 2,082 (60.4%) | 458 (22.0%) |
| 20 to 24 Years | 3,243 (81.7%) | 723 (22.3%) |
| 25 to 29 Years | 2,439 (67.2%) | 239 (9.8%) |
| 30 to 34 Years | 2,306 (70.5%) | 173 (7.5%) |
| 35 to 44 Years | 4,216 (68.6%) | 105 (2.5%) |
| 45 to 54 Years | 3,267 (72.0%) | 33 (1.0%) |
| 55 to 59 Years | 1,285 (65.8%) | 50 (3.9%) |
| 60 to 64 Years | 1,474 (56.6%) | 0 (0.0%) |
| 65 to 74 Years | 891 (27.3%) | 34 (3.8%) |
| 75 Years and over | 138 (6.2%) | 0 (0.0%) |
| Total | 21,343 (60.9%) | 1,601 (7.5%) |
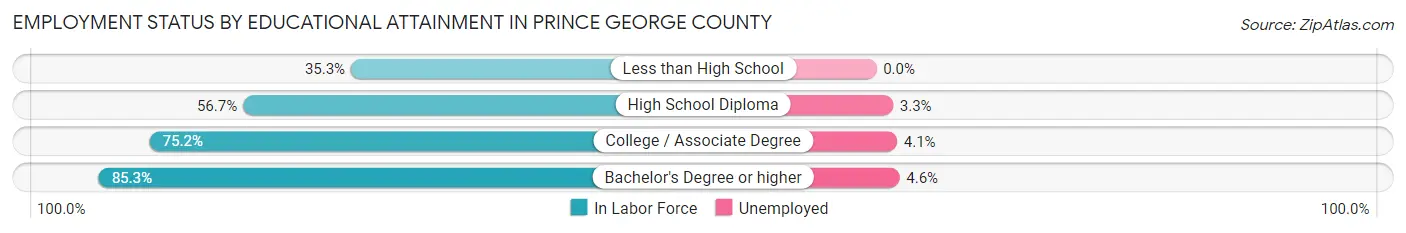
Employment Status by Educational Attainment in Prince George County
According to labor force statistics for Prince George County, 67.7% of individuals (14,989) out of the total population between 25 and 64 years of age (22,141) are in the labor force, with 3.8% or 570 of them being unemployed. The group with the highest labor force participation rate are those with the educational attainment of bachelor's degree or higher, with 85.3% or 4,279 individuals in the labor force. Within the labor force, individuals with bachelor's degree or higher education have the highest percentage of unemployment, with 4.6% or 197 of them being unemployed.
| Educational Attainment | In Labor Force | Unemployed |
| Less than High School | 761 (35.3%) | 0 (0.0%) |
| High School Diploma | 4,029 (56.7%) | 234 (3.3%) |
| College / Associate Degree | 5,912 (75.2%) | 322 (4.1%) |
| Bachelor's Degree or higher | 4,279 (85.3%) | 231 (4.6%) |
| Total | 14,989 (67.7%) | 841 (3.8%) |
Employment Occupations by Sex in Prince George County
Management, Business, Science and Arts Occupations
The most common Management, Business, Science and Arts occupations in Prince George County are Community & Social Service (1,947 | 11.8%), Education Instruction & Library (1,206 | 7.3%), Health Diagnosing & Treating (1,177 | 7.2%), Management (1,043 | 6.4%), and Business & Financial (925 | 5.6%).
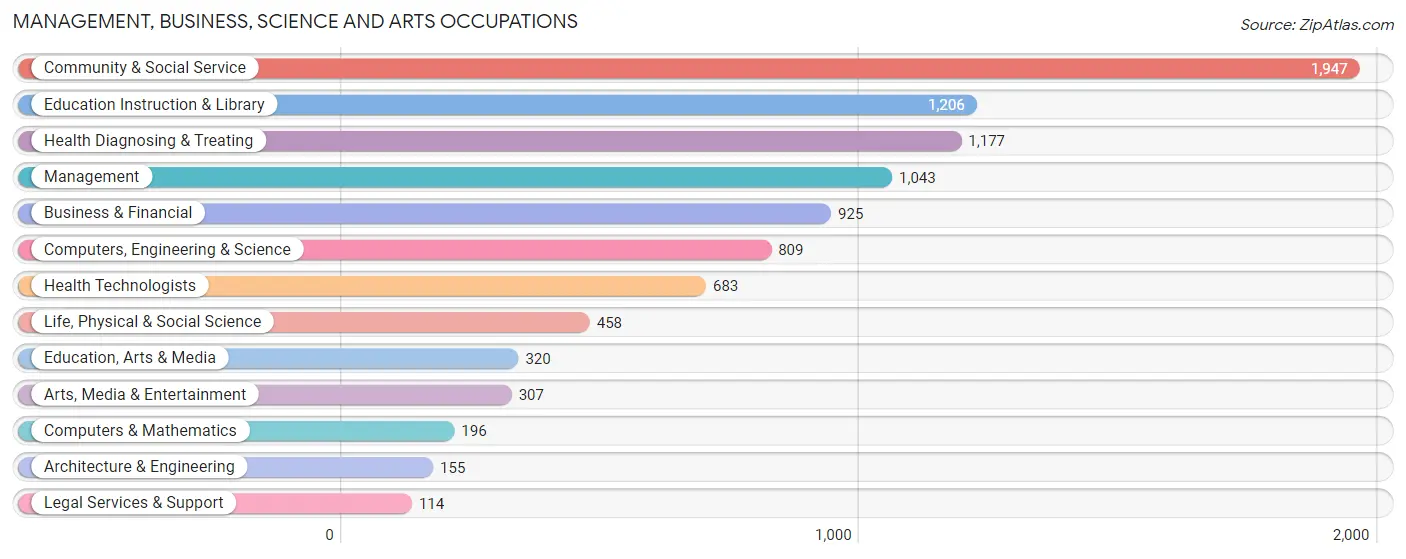
Management, Business, Science and Arts Occupations by Sex
Within the Management, Business, Science and Arts occupations in Prince George County, the most male-oriented occupations are Architecture & Engineering (95.5%), Life, Physical & Social Science (92.1%), and Computers, Engineering & Science (91.1%), while the most female-oriented occupations are Legal Services & Support (93.0%), Health Diagnosing & Treating (91.2%), and Health Technologists (84.8%).
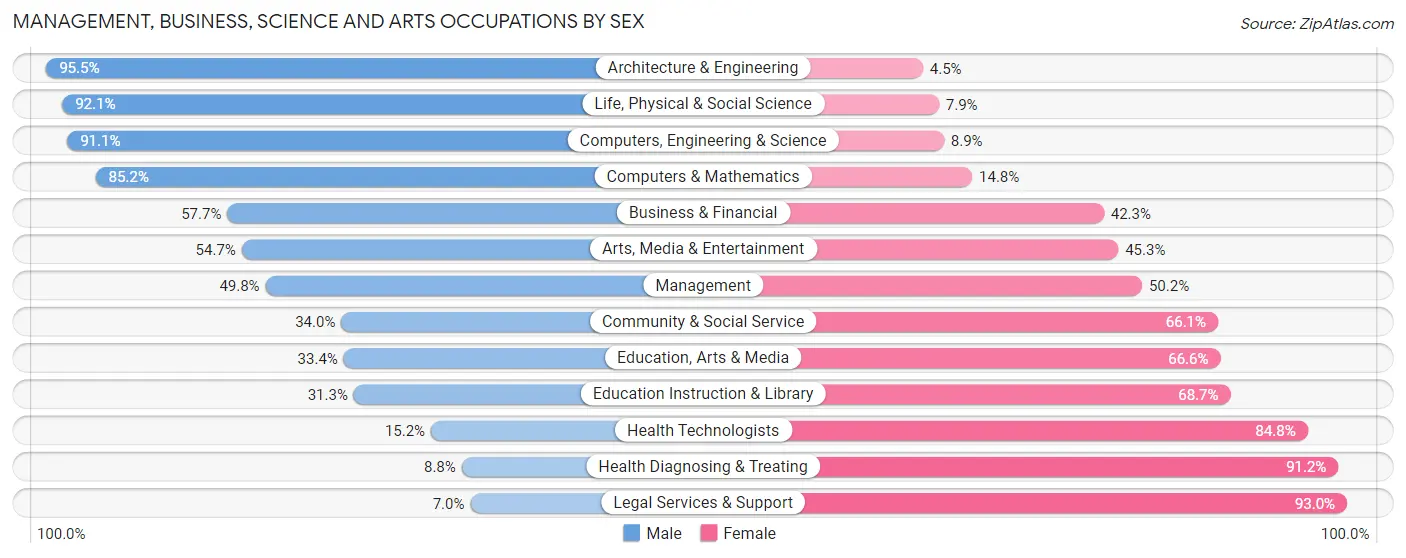
| Occupation | Male | Female |
| Management | 519 (49.8%) | 524 (50.2%) |
| Business & Financial | 534 (57.7%) | 391 (42.3%) |
| Computers, Engineering & Science | 737 (91.1%) | 72 (8.9%) |
| Computers & Mathematics | 167 (85.2%) | 29 (14.8%) |
| Architecture & Engineering | 148 (95.5%) | 7 (4.5%) |
| Life, Physical & Social Science | 422 (92.1%) | 36 (7.9%) |
| Community & Social Service | 661 (34.0%) | 1,286 (66.0%) |
| Education, Arts & Media | 107 (33.4%) | 213 (66.6%) |
| Legal Services & Support | 8 (7.0%) | 106 (93.0%) |
| Education Instruction & Library | 378 (31.3%) | 828 (68.7%) |
| Arts, Media & Entertainment | 168 (54.7%) | 139 (45.3%) |
| Health Diagnosing & Treating | 104 (8.8%) | 1,073 (91.2%) |
| Health Technologists | 104 (15.2%) | 579 (84.8%) |
| Total (Category) | 2,555 (43.3%) | 3,346 (56.7%) |
| Total (Overall) | 8,163 (49.7%) | 8,268 (50.3%) |
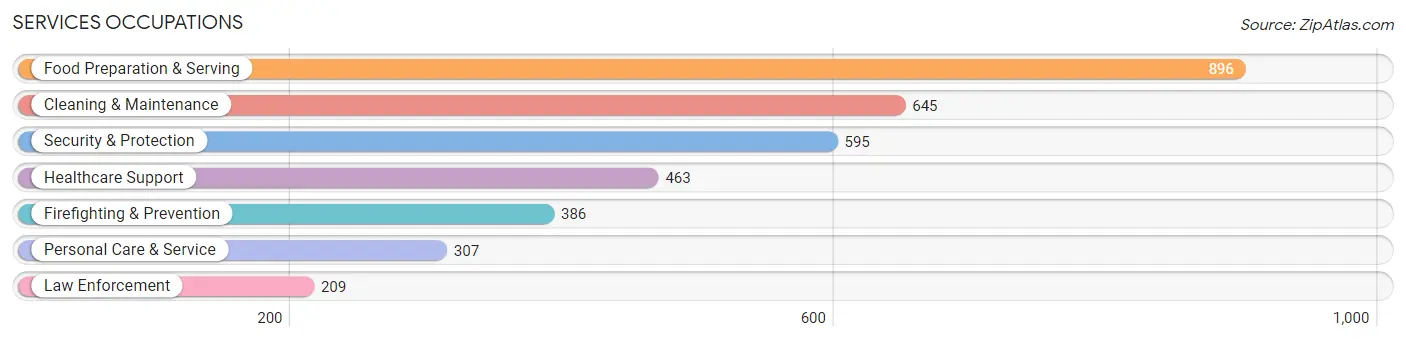
Services Occupations
The most common Services occupations in Prince George County are Food Preparation & Serving (896 | 5.4%), Cleaning & Maintenance (645 | 3.9%), Security & Protection (595 | 3.6%), Healthcare Support (463 | 2.8%), and Firefighting & Prevention (386 | 2.4%).
Services Occupations by Sex
Within the Services occupations in Prince George County, the most male-oriented occupations are Firefighting & Prevention (82.6%), Security & Protection (81.9%), and Law Enforcement (80.4%), while the most female-oriented occupations are Food Preparation & Serving (94.9%), Healthcare Support (94.4%), and Personal Care & Service (71.0%).
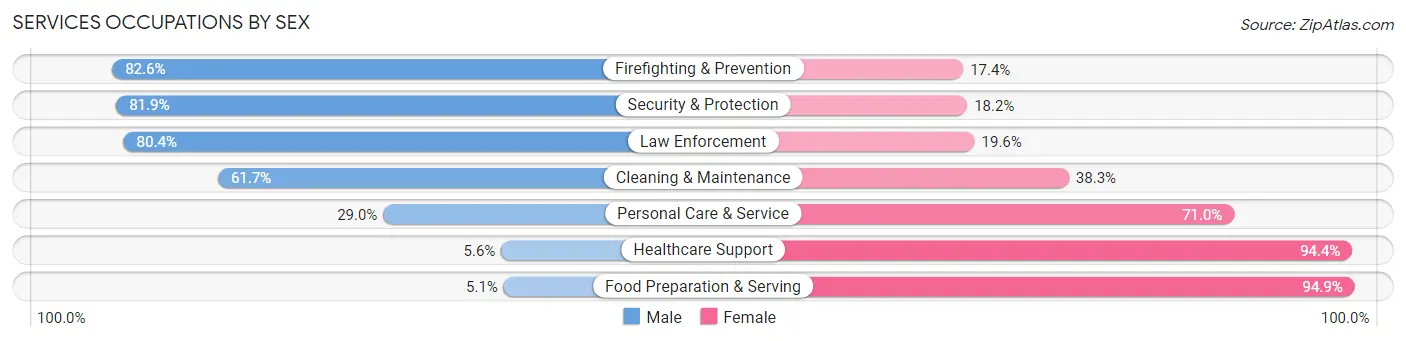
| Occupation | Male | Female |
| Healthcare Support | 26 (5.6%) | 437 (94.4%) |
| Security & Protection | 487 (81.9%) | 108 (18.1%) |
| Firefighting & Prevention | 319 (82.6%) | 67 (17.4%) |
| Law Enforcement | 168 (80.4%) | 41 (19.6%) |
| Food Preparation & Serving | 46 (5.1%) | 850 (94.9%) |
| Cleaning & Maintenance | 398 (61.7%) | 247 (38.3%) |
| Personal Care & Service | 89 (29.0%) | 218 (71.0%) |
| Total (Category) | 1,046 (36.0%) | 1,860 (64.0%) |
| Total (Overall) | 8,163 (49.7%) | 8,268 (50.3%) |
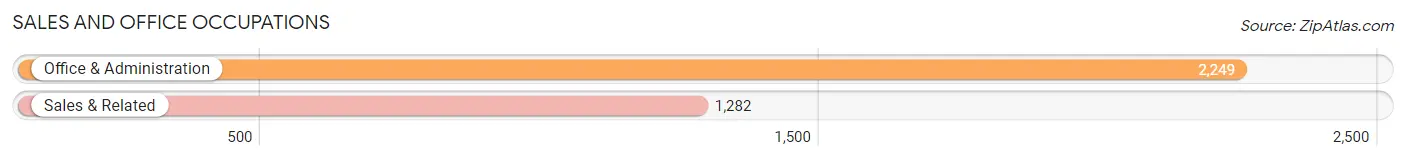
Sales and Office Occupations
The most common Sales and Office occupations in Prince George County are Office & Administration (2,249 | 13.7%), and Sales & Related (1,282 | 7.8%).
Sales and Office Occupations by Sex

| Occupation | Male | Female |
| Sales & Related | 595 (46.4%) | 687 (53.6%) |
| Office & Administration | 359 (16.0%) | 1,890 (84.0%) |
| Total (Category) | 954 (27.0%) | 2,577 (73.0%) |
| Total (Overall) | 8,163 (49.7%) | 8,268 (50.3%) |
Natural Resources, Construction and Maintenance Occupations
The most common Natural Resources, Construction and Maintenance occupations in Prince George County are Installation, Maintenance & Repair (1,233 | 7.5%), Construction & Extraction (671 | 4.1%), and Farming, Fishing & Forestry (10 | 0.1%).

Natural Resources, Construction and Maintenance Occupations by Sex
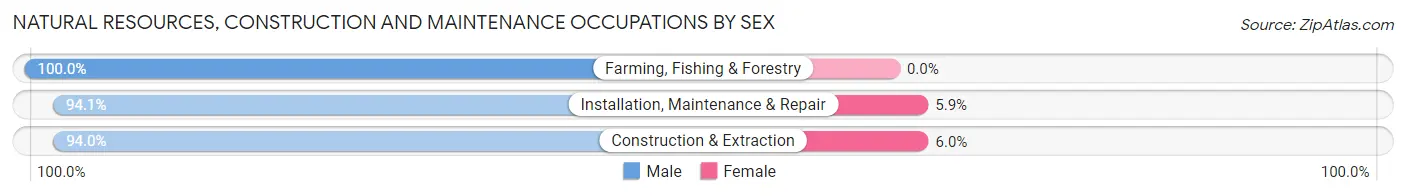
| Occupation | Male | Female |
| Farming, Fishing & Forestry | 10 (100.0%) | 0 (0.0%) |
| Construction & Extraction | 631 (94.0%) | 40 (6.0%) |
| Installation, Maintenance & Repair | 1,160 (94.1%) | 73 (5.9%) |
| Total (Category) | 1,801 (94.1%) | 113 (5.9%) |
| Total (Overall) | 8,163 (49.7%) | 8,268 (50.3%) |
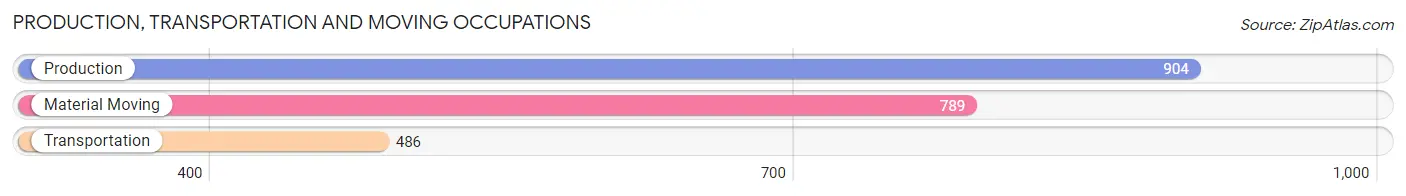
Production, Transportation and Moving Occupations
The most common Production, Transportation and Moving occupations in Prince George County are Production (904 | 5.5%), Material Moving (789 | 4.8%), and Transportation (486 | 3.0%).
Production, Transportation and Moving Occupations by Sex
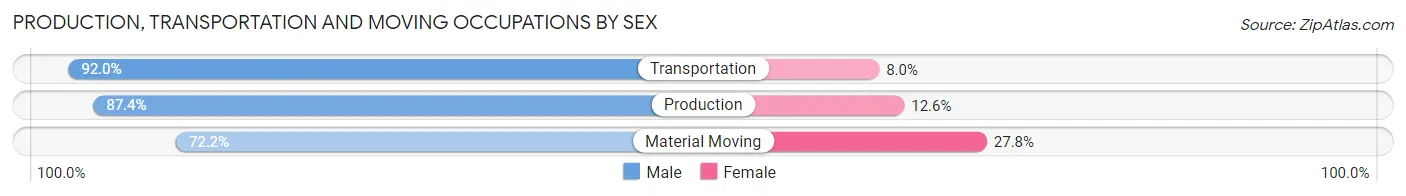
| Occupation | Male | Female |
| Production | 790 (87.4%) | 114 (12.6%) |
| Transportation | 447 (92.0%) | 39 (8.0%) |
| Material Moving | 570 (72.2%) | 219 (27.8%) |
| Total (Category) | 1,807 (82.9%) | 372 (17.1%) |
| Total (Overall) | 8,163 (49.7%) | 8,268 (50.3%) |
Employment Industries by Sex in Prince George County
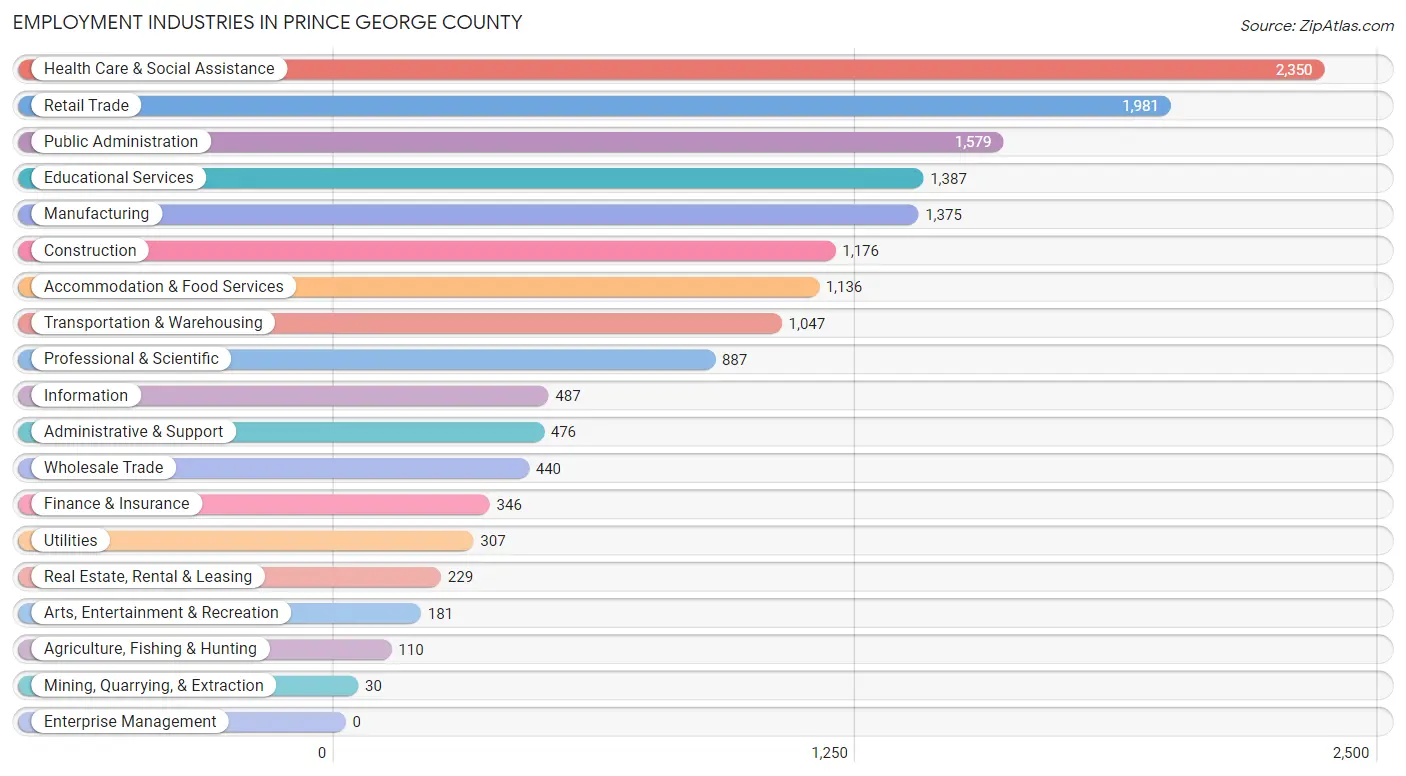
Employment Industries in Prince George County
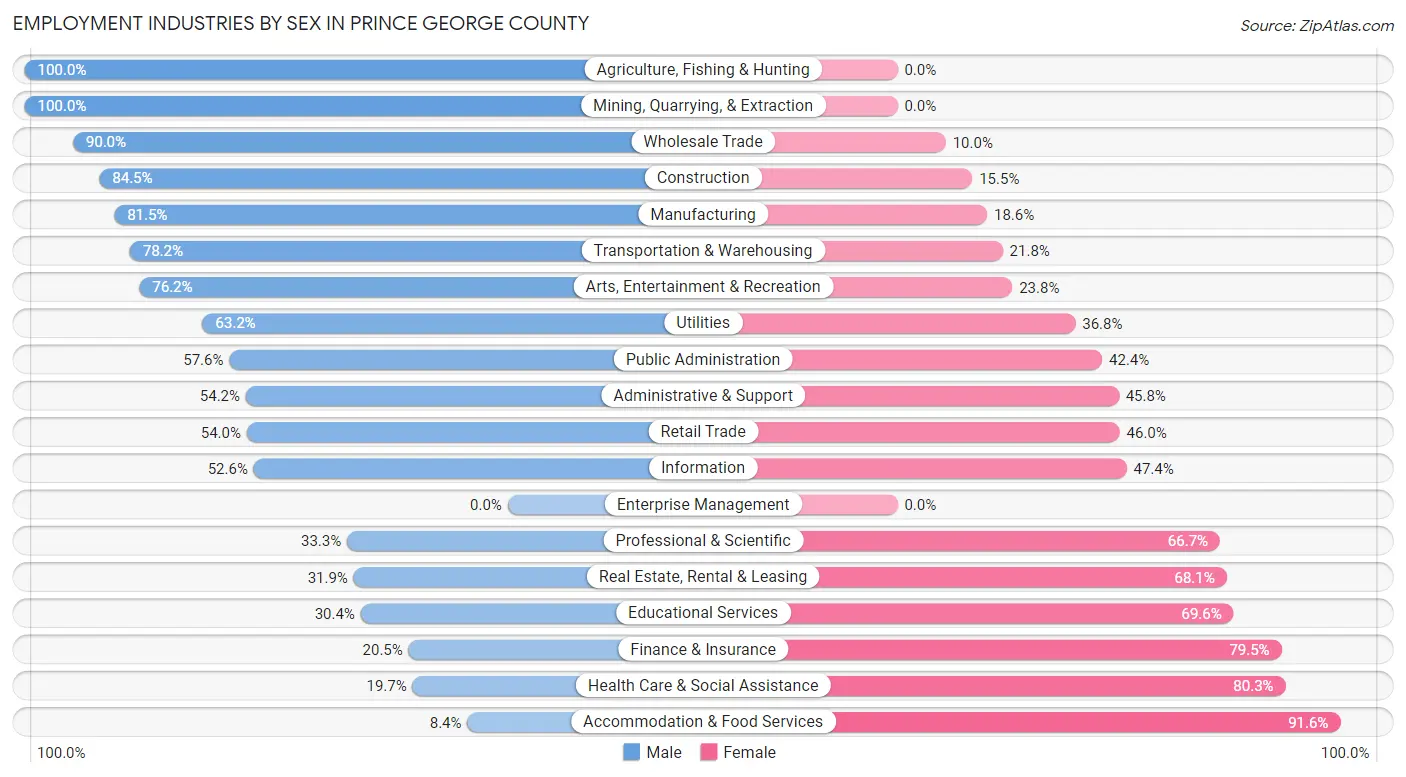
The major employment industries in Prince George County include Health Care & Social Assistance (2,350 | 14.3%), Retail Trade (1,981 | 12.1%), Public Administration (1,579 | 9.6%), Educational Services (1,387 | 8.4%), and Manufacturing (1,375 | 8.4%).
Employment Industries by Sex in Prince George County
The Prince George County industries that see more men than women are Agriculture, Fishing & Hunting (100.0%), Mining, Quarrying, & Extraction (100.0%), and Wholesale Trade (90.0%), whereas the industries that tend to have a higher number of women are Accommodation & Food Services (91.6%), Health Care & Social Assistance (80.3%), and Finance & Insurance (79.5%).
| Industry | Male | Female |
| Agriculture, Fishing & Hunting | 110 (100.0%) | 0 (0.0%) |
| Mining, Quarrying, & Extraction | 30 (100.0%) | 0 (0.0%) |
| Construction | 994 (84.5%) | 182 (15.5%) |
| Manufacturing | 1,120 (81.5%) | 255 (18.5%) |
| Wholesale Trade | 396 (90.0%) | 44 (10.0%) |
| Retail Trade | 1,070 (54.0%) | 911 (46.0%) |
| Transportation & Warehousing | 819 (78.2%) | 228 (21.8%) |
| Utilities | 194 (63.2%) | 113 (36.8%) |
| Information | 256 (52.6%) | 231 (47.4%) |
| Finance & Insurance | 71 (20.5%) | 275 (79.5%) |
| Real Estate, Rental & Leasing | 73 (31.9%) | 156 (68.1%) |
| Professional & Scientific | 295 (33.3%) | 592 (66.7%) |
| Enterprise Management | 0 (0.0%) | 0 (0.0%) |
| Administrative & Support | 258 (54.2%) | 218 (45.8%) |
| Educational Services | 422 (30.4%) | 965 (69.6%) |
| Health Care & Social Assistance | 463 (19.7%) | 1,887 (80.3%) |
| Arts, Entertainment & Recreation | 138 (76.2%) | 43 (23.8%) |
| Accommodation & Food Services | 95 (8.4%) | 1,041 (91.6%) |
| Public Administration | 910 (57.6%) | 669 (42.4%) |
| Total | 8,163 (49.7%) | 8,268 (50.3%) |
Education in Prince George County
School Enrollment in Prince George County
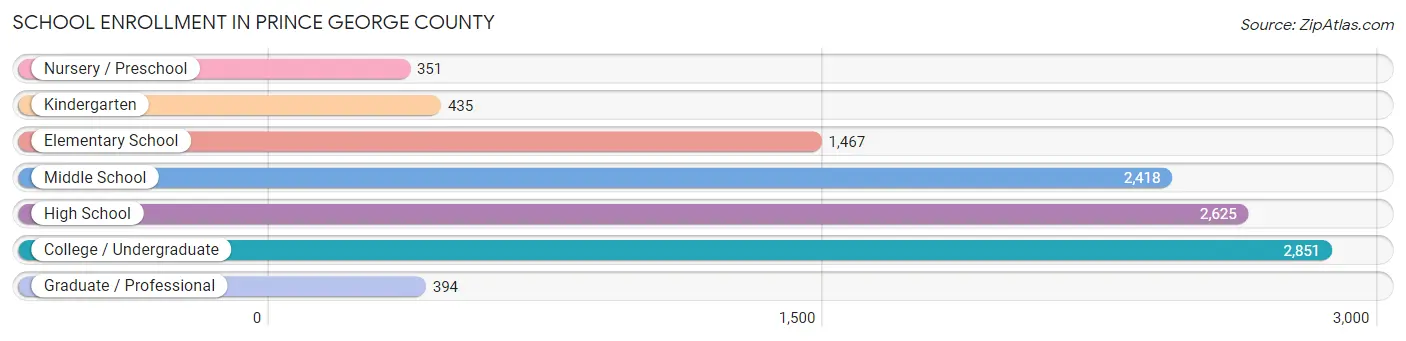
The most common levels of schooling among the 10,541 students in Prince George County are college / undergraduate (2,851 | 27.1%), high school (2,625 | 24.9%), and middle school (2,418 | 22.9%).
| School Level | # Students | % Students |
| Nursery / Preschool | 351 | 3.3% |
| Kindergarten | 435 | 4.1% |
| Elementary School | 1,467 | 13.9% |
| Middle School | 2,418 | 22.9% |
| High School | 2,625 | 24.9% |
| College / Undergraduate | 2,851 | 27.1% |
| Graduate / Professional | 394 | 3.7% |
| Total | 10,541 | 100.0% |
School Enrollment by Age by Funding Source in Prince George County
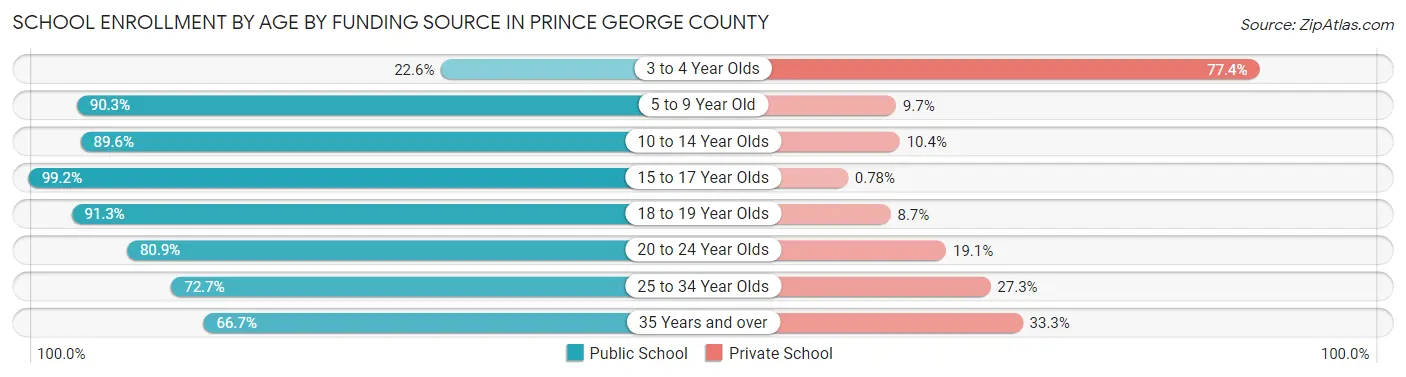
Out of a total of 10,541 students who are enrolled in schools in Prince George County, 1,444 (13.7%) attend a private institution, while the remaining 9,097 (86.3%) are enrolled in public schools. The age group of 3 to 4 year olds has the highest likelihood of being enrolled in private schools, with 144 (77.4% in the age bracket) enrolled. Conversely, the age group of 15 to 17 year olds has the lowest likelihood of being enrolled in a private school, with 1,391 (99.2% in the age bracket) attending a public institution.
| Age Bracket | Public School | Private School |
| 3 to 4 Year Olds | 42 (22.6%) | 144 (77.4%) |
| 5 to 9 Year Old | 1,717 (90.3%) | 185 (9.7%) |
| 10 to 14 Year Olds | 2,479 (89.6%) | 289 (10.4%) |
| 15 to 17 Year Olds | 1,391 (99.2%) | 11 (0.8%) |
| 18 to 19 Year Olds | 1,390 (91.3%) | 133 (8.7%) |
| 20 to 24 Year Olds | 1,082 (80.9%) | 255 (19.1%) |
| 25 to 34 Year Olds | 537 (72.7%) | 202 (27.3%) |
| 35 Years and over | 456 (66.7%) | 228 (33.3%) |
| Total | 9,097 (86.3%) | 1,444 (13.7%) |
Educational Attainment by Field of Study in Prince George County
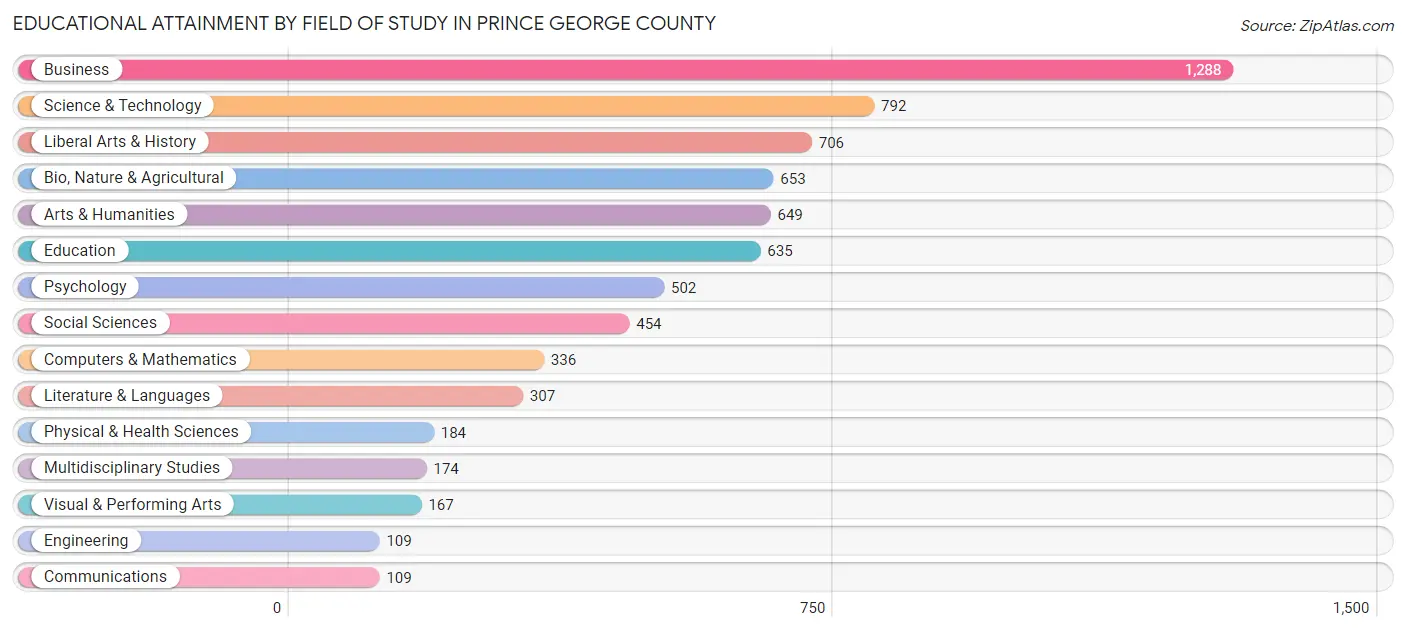
Business (1,288 | 18.2%), science & technology (792 | 11.2%), liberal arts & history (706 | 10.0%), bio, nature & agricultural (653 | 9.2%), and arts & humanities (649 | 9.2%) are the most common fields of study among 7,065 individuals in Prince George County who have obtained a bachelor's degree or higher.
| Field of Study | # Graduates | % Graduates |
| Computers & Mathematics | 336 | 4.8% |
| Bio, Nature & Agricultural | 653 | 9.2% |
| Physical & Health Sciences | 184 | 2.6% |
| Psychology | 502 | 7.1% |
| Social Sciences | 454 | 6.4% |
| Engineering | 109 | 1.5% |
| Multidisciplinary Studies | 174 | 2.5% |
| Science & Technology | 792 | 11.2% |
| Business | 1,288 | 18.2% |
| Education | 635 | 9.0% |
| Literature & Languages | 307 | 4.3% |
| Liberal Arts & History | 706 | 10.0% |
| Visual & Performing Arts | 167 | 2.4% |
| Communications | 109 | 1.5% |
| Arts & Humanities | 649 | 9.2% |
| Total | 7,065 | 100.0% |
Transportation & Commute in Prince George County
Vehicle Availability by Sex in Prince George County
The most prevalent vehicle ownership categories in Prince George County are males with 2 vehicles (3,147, accounting for 33.3%) and females with 2 vehicles (2,367, making up 37.5%).
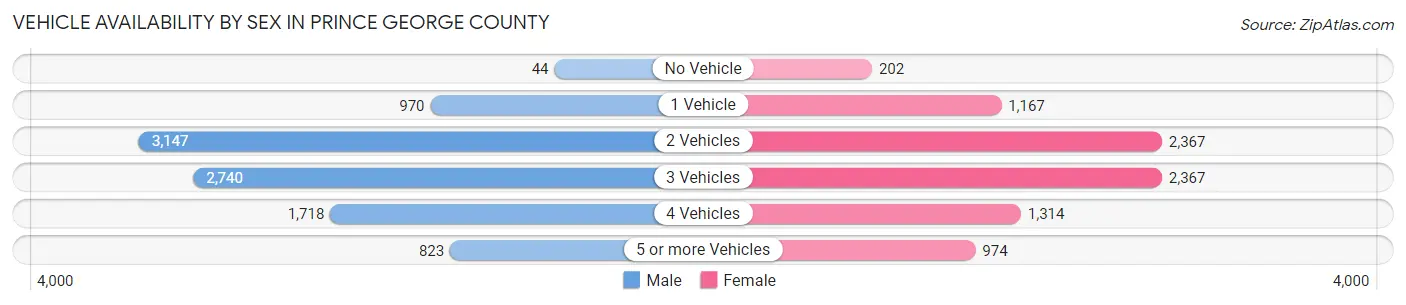
| Vehicles Available | Male | Female |
| No Vehicle | 44 (0.5%) | 202 (2.4%) |
| 1 Vehicle | 970 (10.3%) | 1,167 (13.9%) |
| 2 Vehicles | 3,147 (33.3%) | 2,367 (28.2%) |
| 3 Vehicles | 2,740 (29.0%) | 2,367 (28.2%) |
| 4 Vehicles | 1,718 (18.2%) | 1,314 (15.7%) |
| 5 or more Vehicles | 823 (8.7%) | 974 (11.6%) |
| Total | 9,442 (100.0%) | 8,391 (100.0%) |
Commute Time in Prince George County
The most frequently occuring commute durations in Prince George County are 20 to 24 minutes (2,848 commuters, 16.0%), 15 to 19 minutes (2,596 commuters, 14.6%), and 10 to 14 minutes (2,241 commuters, 12.6%).
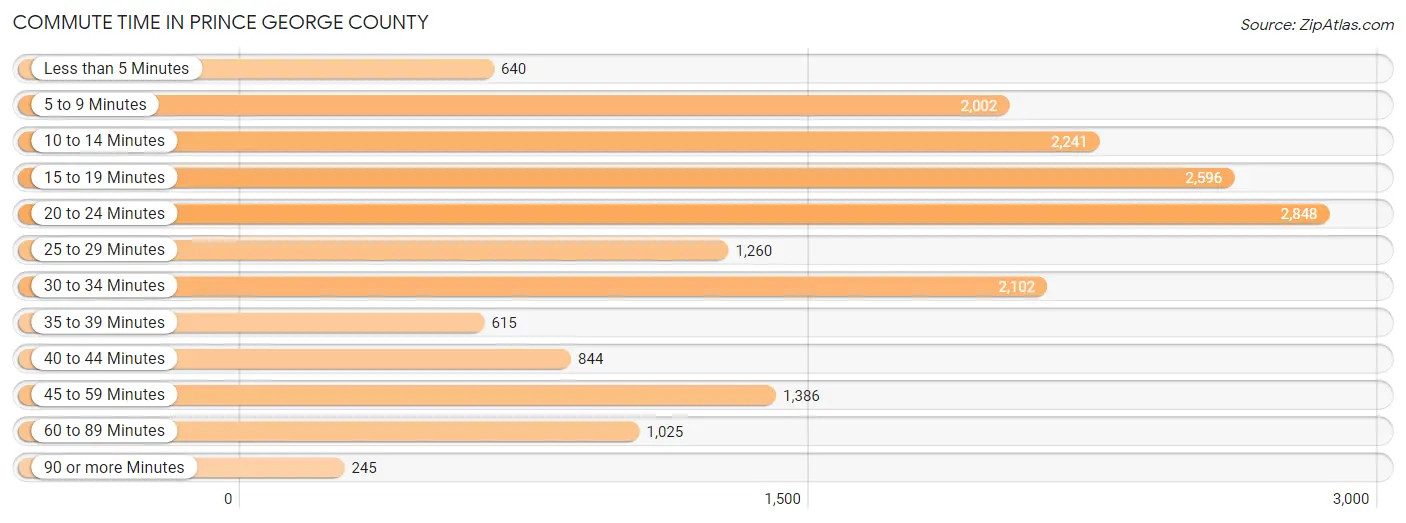
| Commute Time | # Commuters | % Commuters |
| Less than 5 Minutes | 640 | 3.6% |
| 5 to 9 Minutes | 2,002 | 11.2% |
| 10 to 14 Minutes | 2,241 | 12.6% |
| 15 to 19 Minutes | 2,596 | 14.6% |
| 20 to 24 Minutes | 2,848 | 16.0% |
| 25 to 29 Minutes | 1,260 | 7.1% |
| 30 to 34 Minutes | 2,102 | 11.8% |
| 35 to 39 Minutes | 615 | 3.5% |
| 40 to 44 Minutes | 844 | 4.7% |
| 45 to 59 Minutes | 1,386 | 7.8% |
| 60 to 89 Minutes | 1,025 | 5.8% |
| 90 or more Minutes | 245 | 1.4% |
Commute Time by Sex in Prince George County
The most common commute times in Prince George County are 20 to 24 minutes (1,666 commuters, 16.6%) for males and 15 to 19 minutes (1,369 commuters, 17.6%) for females.
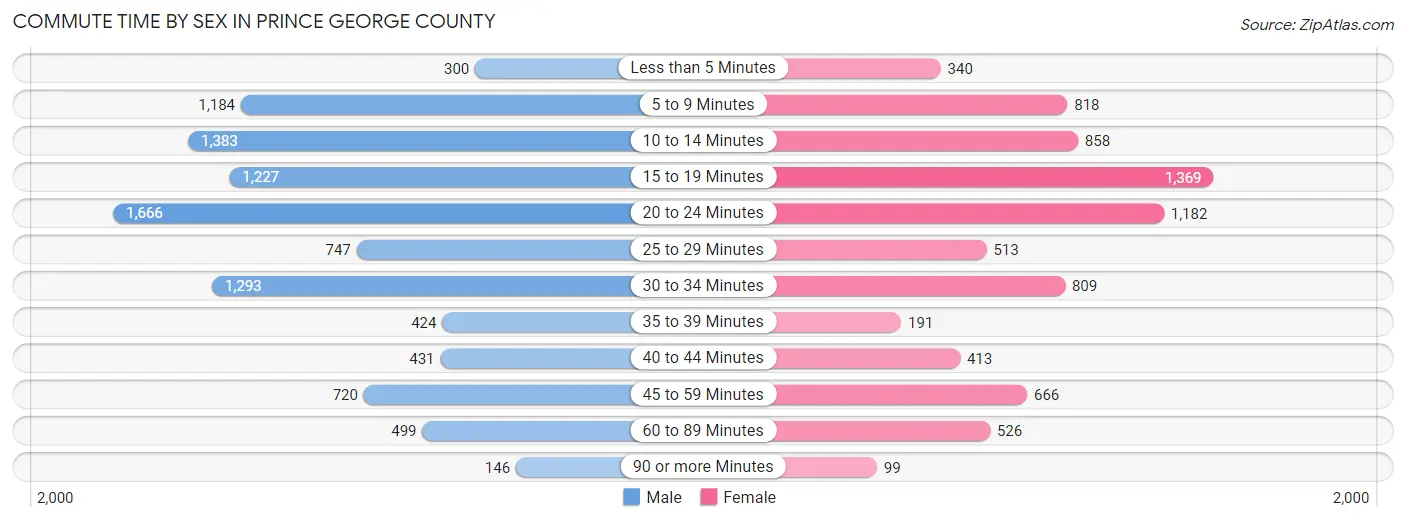
| Commute Time | Male | Female |
| Less than 5 Minutes | 300 (3.0%) | 340 (4.4%) |
| 5 to 9 Minutes | 1,184 (11.8%) | 818 (10.5%) |
| 10 to 14 Minutes | 1,383 (13.8%) | 858 (11.0%) |
| 15 to 19 Minutes | 1,227 (12.2%) | 1,369 (17.6%) |
| 20 to 24 Minutes | 1,666 (16.6%) | 1,182 (15.2%) |
| 25 to 29 Minutes | 747 (7.5%) | 513 (6.6%) |
| 30 to 34 Minutes | 1,293 (12.9%) | 809 (10.4%) |
| 35 to 39 Minutes | 424 (4.2%) | 191 (2.5%) |
| 40 to 44 Minutes | 431 (4.3%) | 413 (5.3%) |
| 45 to 59 Minutes | 720 (7.2%) | 666 (8.6%) |
| 60 to 89 Minutes | 499 (5.0%) | 526 (6.8%) |
| 90 or more Minutes | 146 (1.5%) | 99 (1.3%) |
Time of Departure to Work by Sex in Prince George County
The most frequent times of departure to work in Prince George County are 6:00 AM to 6:29 AM (1,593, 15.9%) for males and 7:00 AM to 7:29 AM (1,284, 16.5%) for females.
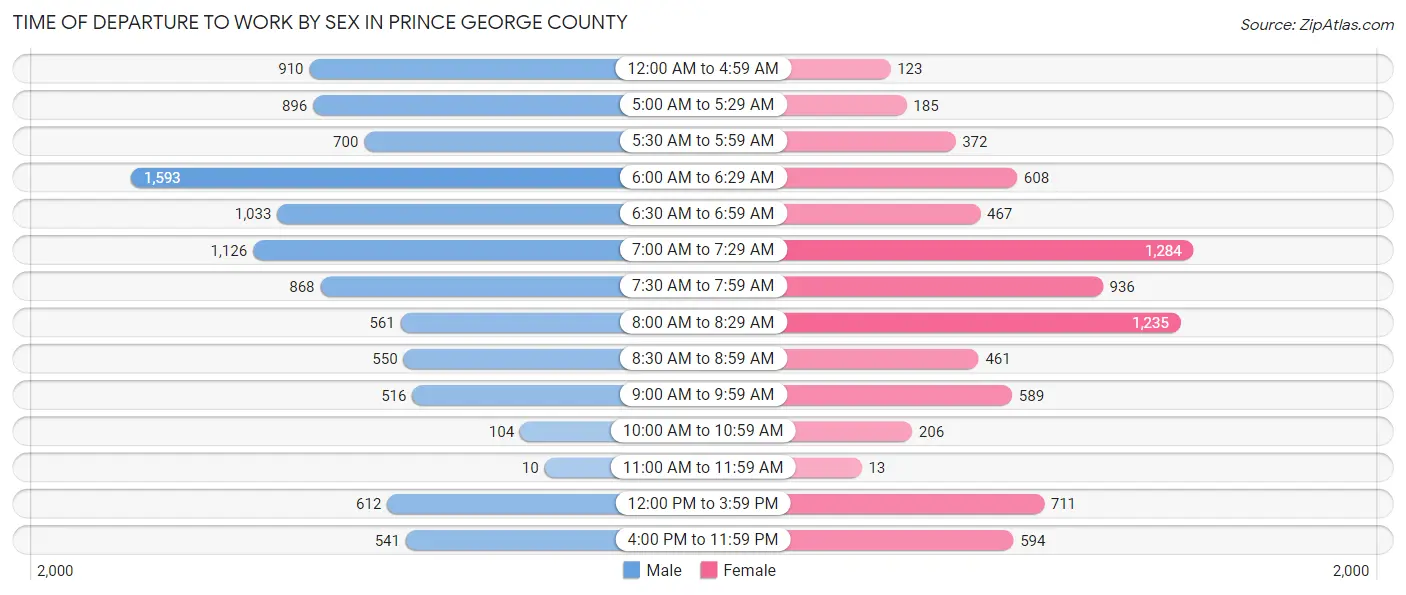
| Time of Departure | Male | Female |
| 12:00 AM to 4:59 AM | 910 (9.1%) | 123 (1.6%) |
| 5:00 AM to 5:29 AM | 896 (8.9%) | 185 (2.4%) |
| 5:30 AM to 5:59 AM | 700 (7.0%) | 372 (4.8%) |
| 6:00 AM to 6:29 AM | 1,593 (15.9%) | 608 (7.8%) |
| 6:30 AM to 6:59 AM | 1,033 (10.3%) | 467 (6.0%) |
| 7:00 AM to 7:29 AM | 1,126 (11.2%) | 1,284 (16.5%) |
| 7:30 AM to 7:59 AM | 868 (8.7%) | 936 (12.0%) |
| 8:00 AM to 8:29 AM | 561 (5.6%) | 1,235 (15.9%) |
| 8:30 AM to 8:59 AM | 550 (5.5%) | 461 (5.9%) |
| 9:00 AM to 9:59 AM | 516 (5.1%) | 589 (7.6%) |
| 10:00 AM to 10:59 AM | 104 (1.0%) | 206 (2.6%) |
| 11:00 AM to 11:59 AM | 10 (0.1%) | 13 (0.2%) |
| 12:00 PM to 3:59 PM | 612 (6.1%) | 711 (9.1%) |
| 4:00 PM to 11:59 PM | 541 (5.4%) | 594 (7.6%) |
| Total | 10,020 (100.0%) | 7,784 (100.0%) |
Housing Occupancy in Prince George County
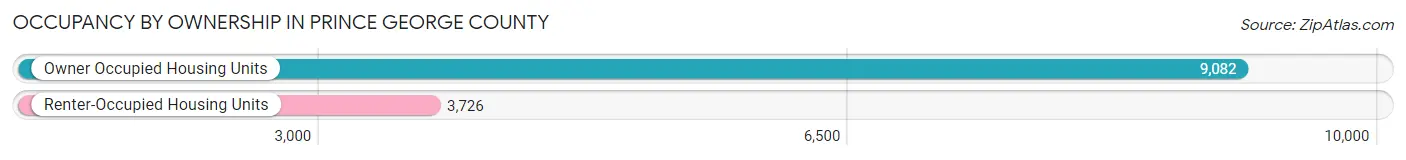
Occupancy by Ownership in Prince George County
Of the total 12,808 dwellings in Prince George County, owner-occupied units account for 9,082 (70.9%), while renter-occupied units make up 3,726 (29.1%).
| Occupancy | # Housing Units | % Housing Units |
| Owner Occupied Housing Units | 9,082 | 70.9% |
| Renter-Occupied Housing Units | 3,726 | 29.1% |
| Total Occupied Housing Units | 12,808 | 100.0% |
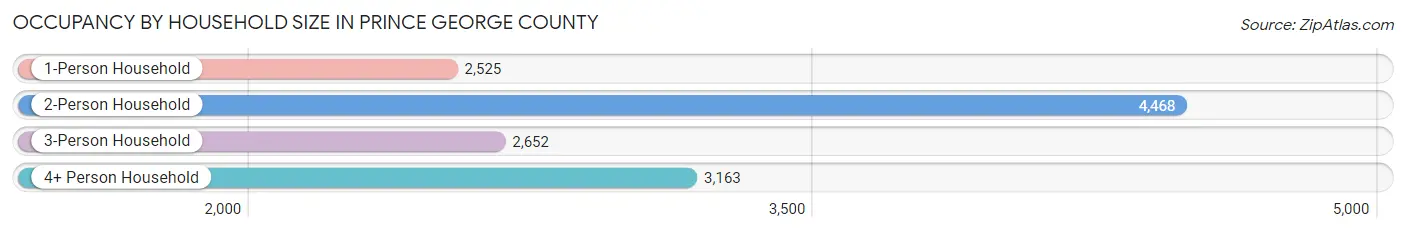
Occupancy by Household Size in Prince George County
| Household Size | # Housing Units | % Housing Units |
| 1-Person Household | 2,525 | 19.7% |
| 2-Person Household | 4,468 | 34.9% |
| 3-Person Household | 2,652 | 20.7% |
| 4+ Person Household | 3,163 | 24.7% |
| Total Housing Units | 12,808 | 100.0% |
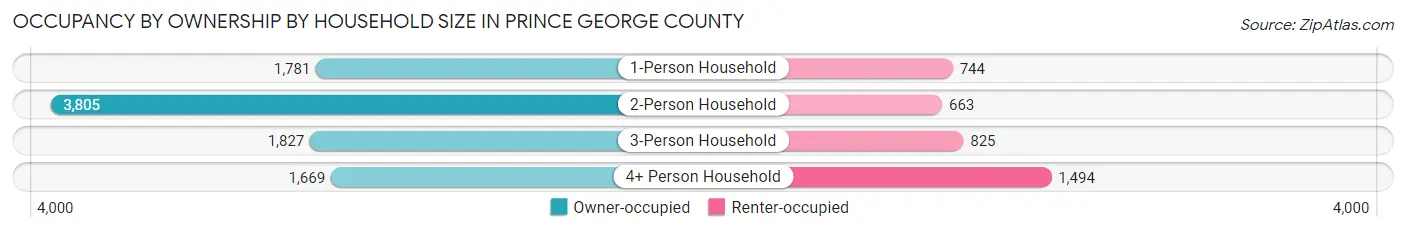
Occupancy by Ownership by Household Size in Prince George County
| Household Size | Owner-occupied | Renter-occupied |
| 1-Person Household | 1,781 (70.5%) | 744 (29.5%) |
| 2-Person Household | 3,805 (85.2%) | 663 (14.8%) |
| 3-Person Household | 1,827 (68.9%) | 825 (31.1%) |
| 4+ Person Household | 1,669 (52.8%) | 1,494 (47.2%) |
| Total Housing Units | 9,082 (70.9%) | 3,726 (29.1%) |
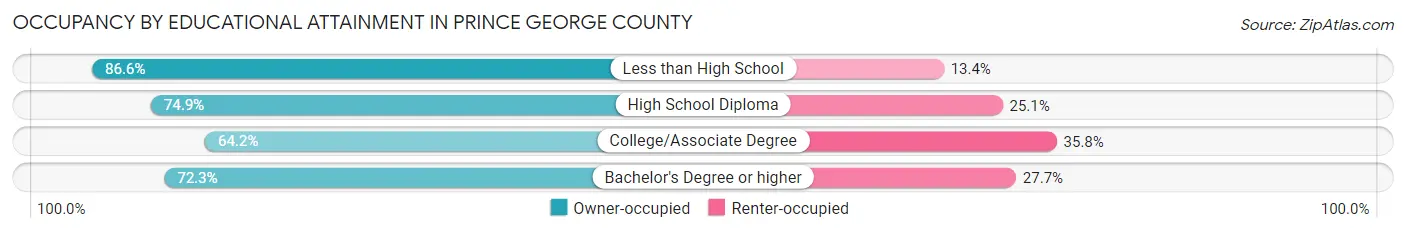
Occupancy by Educational Attainment in Prince George County
| Household Size | Owner-occupied | Renter-occupied |
| Less than High School | 744 (86.6%) | 115 (13.4%) |
| High School Diploma | 2,416 (74.9%) | 808 (25.1%) |
| College/Associate Degree | 3,067 (64.2%) | 1,709 (35.8%) |
| Bachelor's Degree or higher | 2,855 (72.3%) | 1,094 (27.7%) |
Occupancy by Age of Householder in Prince George County
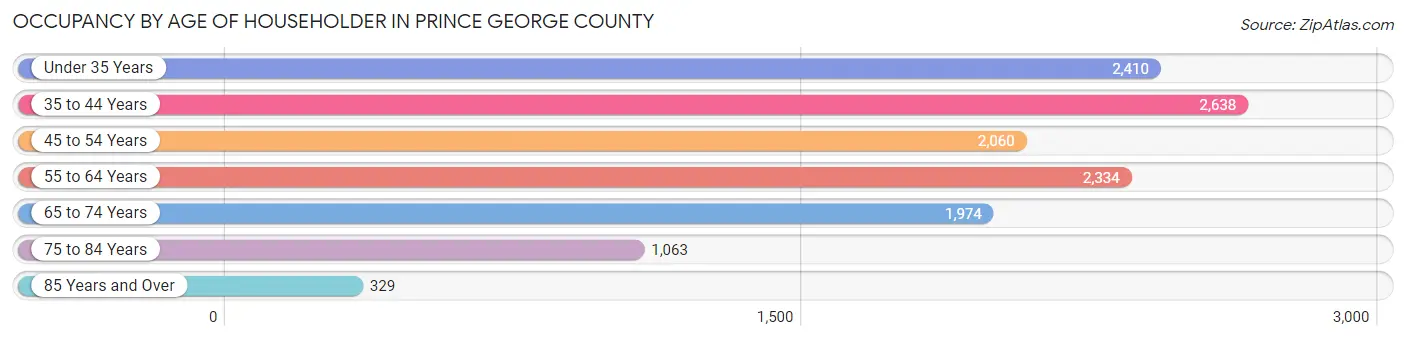
| Age Bracket | # Households | % Households |
| Under 35 Years | 2,410 | 18.8% |
| 35 to 44 Years | 2,638 | 20.6% |
| 45 to 54 Years | 2,060 | 16.1% |
| 55 to 64 Years | 2,334 | 18.2% |
| 65 to 74 Years | 1,974 | 15.4% |
| 75 to 84 Years | 1,063 | 8.3% |
| 85 Years and Over | 329 | 2.6% |
| Total | 12,808 | 100.0% |
Housing Finances in Prince George County
Median Income by Occupancy in Prince George County
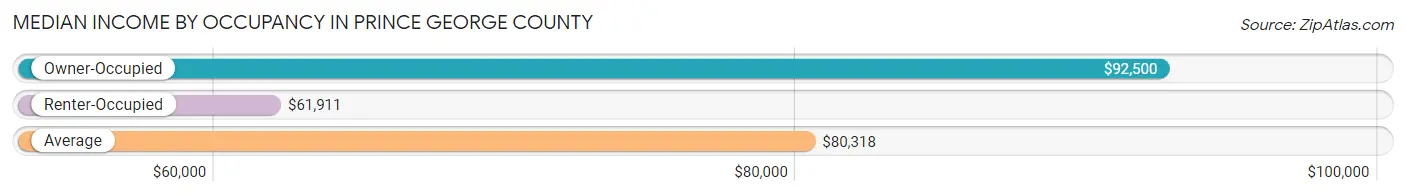
| Occupancy Type | # Households | Median Income |
| Owner-Occupied | 9,082 (70.9%) | $92,500 |
| Renter-Occupied | 3,726 (29.1%) | $61,911 |
| Average | 12,808 (100.0%) | $80,318 |
Occupancy by Householder Income Bracket in Prince George County
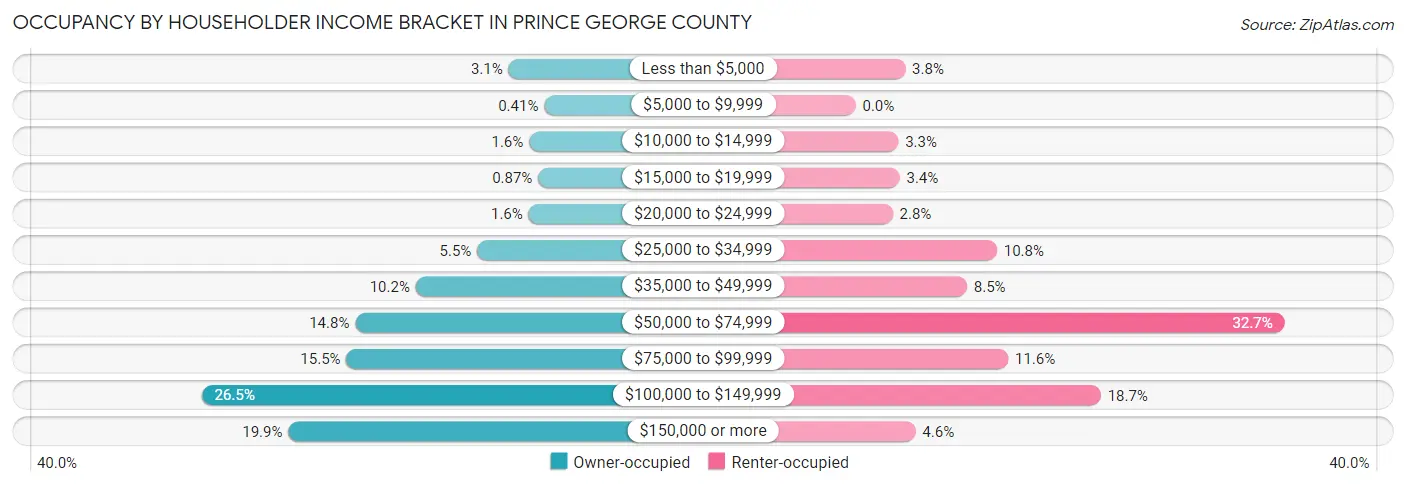
| Income Bracket | Owner-occupied | Renter-occupied |
| Less than $5,000 | 284 (3.1%) | 141 (3.8%) |
| $5,000 to $9,999 | 37 (0.4%) | 0 (0.0%) |
| $10,000 to $14,999 | 142 (1.6%) | 121 (3.3%) |
| $15,000 to $19,999 | 79 (0.9%) | 125 (3.4%) |
| $20,000 to $24,999 | 145 (1.6%) | 105 (2.8%) |
| $25,000 to $34,999 | 501 (5.5%) | 401 (10.8%) |
| $35,000 to $49,999 | 926 (10.2%) | 316 (8.5%) |
| $50,000 to $74,999 | 1,345 (14.8%) | 1,218 (32.7%) |
| $75,000 to $99,999 | 1,406 (15.5%) | 433 (11.6%) |
| $100,000 to $149,999 | 2,409 (26.5%) | 696 (18.7%) |
| $150,000 or more | 1,808 (19.9%) | 170 (4.6%) |
| Total | 9,082 (100.0%) | 3,726 (100.0%) |
Monthly Housing Cost Tiers in Prince George County
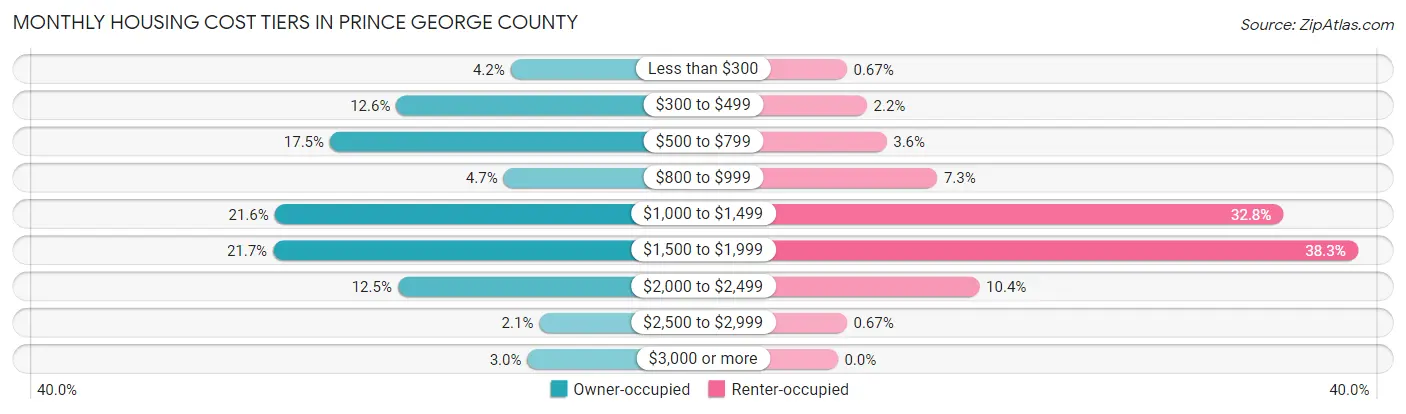
| Monthly Cost | Owner-occupied | Renter-occupied |
| Less than $300 | 382 (4.2%) | 25 (0.7%) |
| $300 to $499 | 1,147 (12.6%) | 80 (2.1%) |
| $500 to $799 | 1,591 (17.5%) | 134 (3.6%) |
| $800 to $999 | 430 (4.7%) | 273 (7.3%) |
| $1,000 to $1,499 | 1,961 (21.6%) | 1,223 (32.8%) |
| $1,500 to $1,999 | 1,972 (21.7%) | 1,427 (38.3%) |
| $2,000 to $2,499 | 1,137 (12.5%) | 389 (10.4%) |
| $2,500 to $2,999 | 191 (2.1%) | 25 (0.7%) |
| $3,000 or more | 271 (3.0%) | 0 (0.0%) |
| Total | 9,082 (100.0%) | 3,726 (100.0%) |
Physical Housing Characteristics in Prince George County
Housing Structures in Prince George County
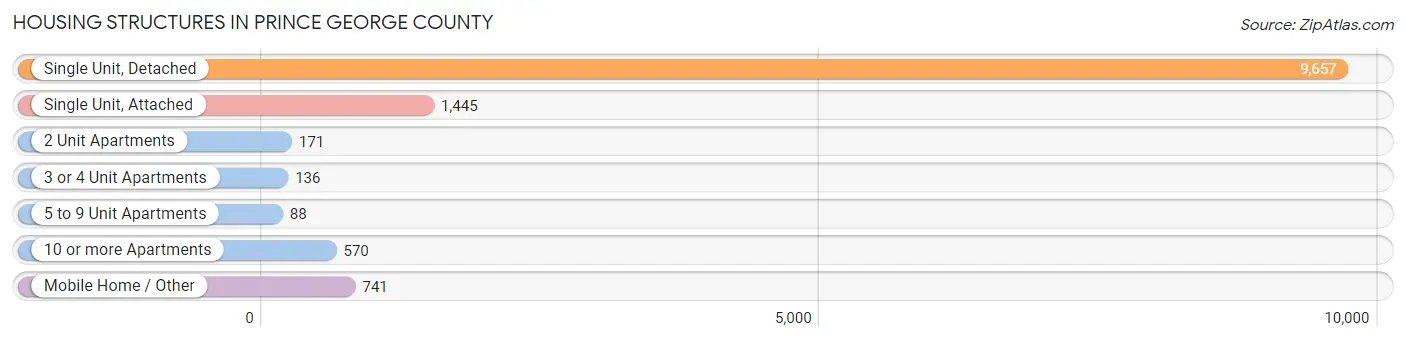
| Structure Type | # Housing Units | % Housing Units |
| Single Unit, Detached | 9,657 | 75.4% |
| Single Unit, Attached | 1,445 | 11.3% |
| 2 Unit Apartments | 171 | 1.3% |
| 3 or 4 Unit Apartments | 136 | 1.1% |
| 5 to 9 Unit Apartments | 88 | 0.7% |
| 10 or more Apartments | 570 | 4.4% |
| Mobile Home / Other | 741 | 5.8% |
| Total | 12,808 | 100.0% |
Housing Structures by Occupancy in Prince George County
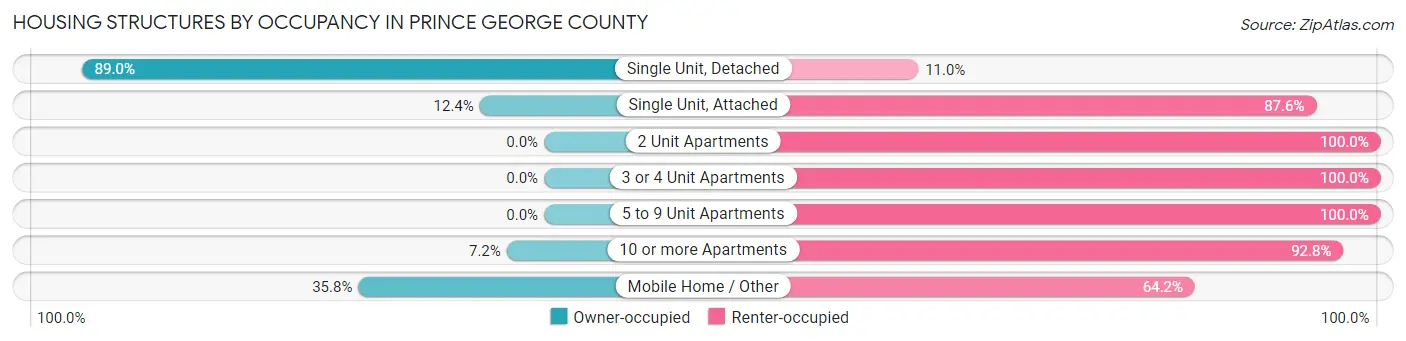
| Structure Type | Owner-occupied | Renter-occupied |
| Single Unit, Detached | 8,597 (89.0%) | 1,060 (11.0%) |
| Single Unit, Attached | 179 (12.4%) | 1,266 (87.6%) |
| 2 Unit Apartments | 0 (0.0%) | 171 (100.0%) |
| 3 or 4 Unit Apartments | 0 (0.0%) | 136 (100.0%) |
| 5 to 9 Unit Apartments | 0 (0.0%) | 88 (100.0%) |
| 10 or more Apartments | 41 (7.2%) | 529 (92.8%) |
| Mobile Home / Other | 265 (35.8%) | 476 (64.2%) |
| Total | 9,082 (70.9%) | 3,726 (29.1%) |
Housing Structures by Number of Rooms in Prince George County
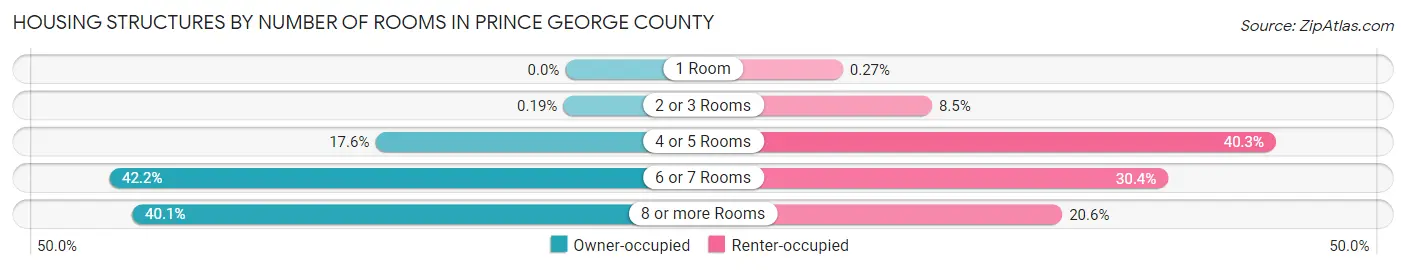
| Number of Rooms | Owner-occupied | Renter-occupied |
| 1 Room | 0 (0.0%) | 10 (0.3%) |
| 2 or 3 Rooms | 17 (0.2%) | 317 (8.5%) |
| 4 or 5 Rooms | 1,596 (17.6%) | 1,502 (40.3%) |
| 6 or 7 Rooms | 3,832 (42.2%) | 1,131 (30.3%) |
| 8 or more Rooms | 3,637 (40.1%) | 766 (20.6%) |
| Total | 9,082 (100.0%) | 3,726 (100.0%) |
Housing Structure by Heating Type in Prince George County
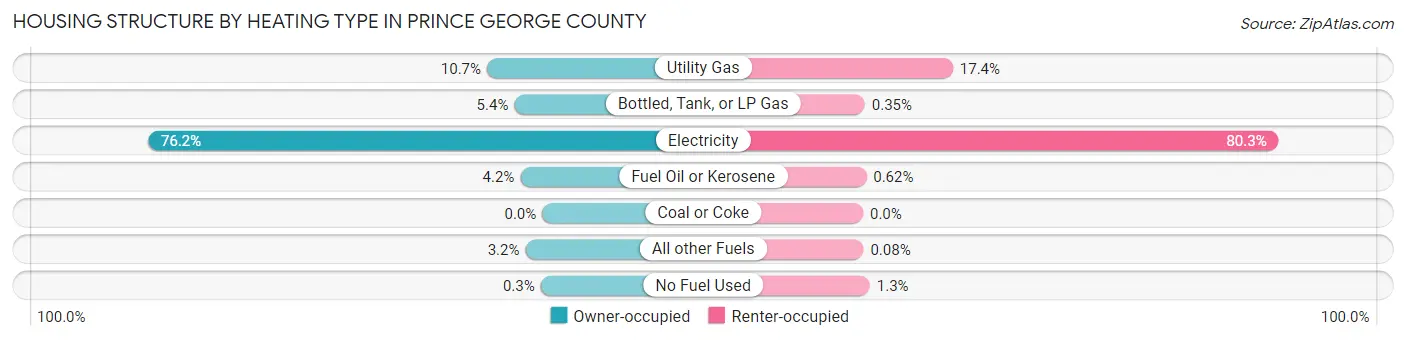
| Heating Type | Owner-occupied | Renter-occupied |
| Utility Gas | 969 (10.7%) | 647 (17.4%) |
| Bottled, Tank, or LP Gas | 489 (5.4%) | 13 (0.4%) |
| Electricity | 6,919 (76.2%) | 2,991 (80.3%) |
| Fuel Oil or Kerosene | 384 (4.2%) | 23 (0.6%) |
| Coal or Coke | 0 (0.0%) | 0 (0.0%) |
| All other Fuels | 294 (3.2%) | 3 (0.1%) |
| No Fuel Used | 27 (0.3%) | 49 (1.3%) |
| Total | 9,082 (100.0%) | 3,726 (100.0%) |
Household Vehicle Usage in Prince George County
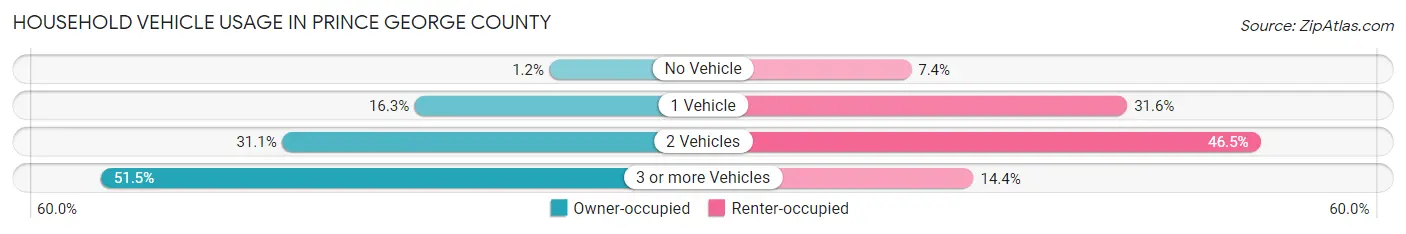
| Vehicles per Household | Owner-occupied | Renter-occupied |
| No Vehicle | 106 (1.2%) | 277 (7.4%) |
| 1 Vehicle | 1,478 (16.3%) | 1,178 (31.6%) |
| 2 Vehicles | 2,825 (31.1%) | 1,734 (46.5%) |
| 3 or more Vehicles | 4,673 (51.4%) | 537 (14.4%) |
| Total | 9,082 (100.0%) | 3,726 (100.0%) |
Real Estate & Mortgages in Prince George County
Real Estate and Mortgage Overview in Prince George County
| Characteristic | Without Mortgage | With Mortgage |
| Housing Units | 3,171 | 5,911 |
| Median Property Value | $252,000 | $252,500 |
| Median Household Income | $67,489 | $1,344 |
| Monthly Housing Costs | $518 | $271 |
| Real Estate Taxes | $2,003 | $236 |
Property Value by Mortgage Status in Prince George County
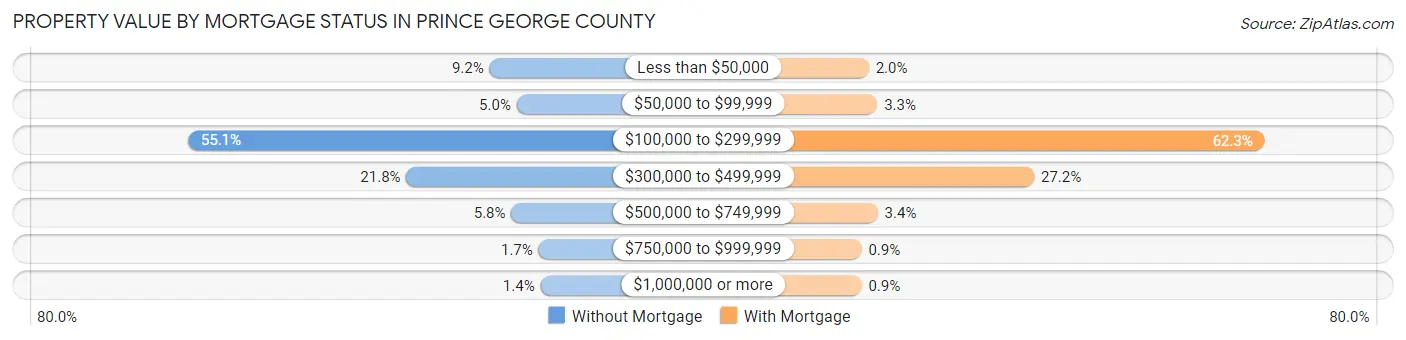
| Property Value | Without Mortgage | With Mortgage |
| Less than $50,000 | 290 (9.1%) | 118 (2.0%) |
| $50,000 to $99,999 | 159 (5.0%) | 195 (3.3%) |
| $100,000 to $299,999 | 1,748 (55.1%) | 3,685 (62.3%) |
| $300,000 to $499,999 | 692 (21.8%) | 1,608 (27.2%) |
| $500,000 to $749,999 | 185 (5.8%) | 199 (3.4%) |
| $750,000 to $999,999 | 53 (1.7%) | 53 (0.9%) |
| $1,000,000 or more | 44 (1.4%) | 53 (0.9%) |
| Total | 3,171 (100.0%) | 5,911 (100.0%) |
Household Income by Mortgage Status in Prince George County
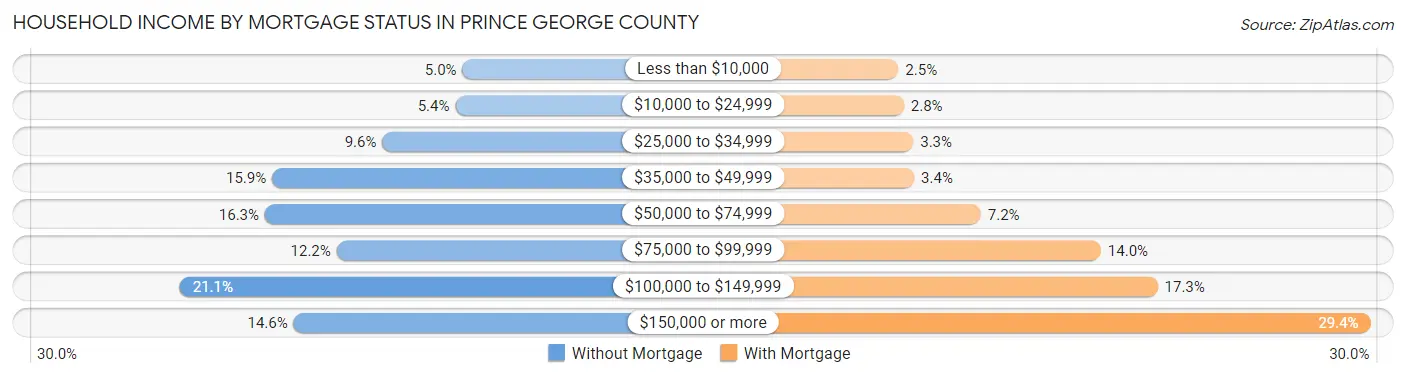
| Household Income | Without Mortgage | With Mortgage |
| Less than $10,000 | 158 (5.0%) | 145 (2.5%) |
| $10,000 to $24,999 | 171 (5.4%) | 163 (2.8%) |
| $25,000 to $34,999 | 303 (9.6%) | 195 (3.3%) |
| $35,000 to $49,999 | 503 (15.9%) | 198 (3.4%) |
| $50,000 to $74,999 | 516 (16.3%) | 423 (7.2%) |
| $75,000 to $99,999 | 386 (12.2%) | 829 (14.0%) |
| $100,000 to $149,999 | 670 (21.1%) | 1,020 (17.3%) |
| $150,000 or more | 464 (14.6%) | 1,739 (29.4%) |
| Total | 3,171 (100.0%) | 5,911 (100.0%) |
Property Value to Household Income Ratio in Prince George County
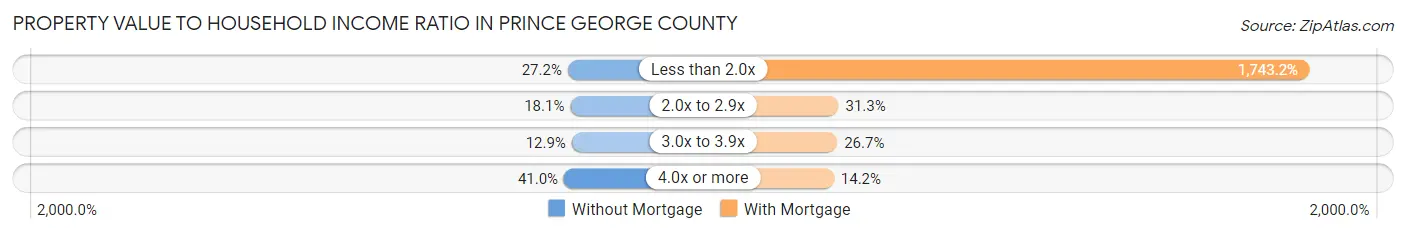
| Value-to-Income Ratio | Without Mortgage | With Mortgage |
| Less than 2.0x | 861 (27.2%) | 103,042 (1,743.2%) |
| 2.0x to 2.9x | 575 (18.1%) | 1,850 (31.3%) |
| 3.0x to 3.9x | 408 (12.9%) | 1,575 (26.7%) |
| 4.0x or more | 1,300 (41.0%) | 840 (14.2%) |
| Total | 3,171 (100.0%) | 5,911 (100.0%) |
Real Estate Taxes by Mortgage Status in Prince George County
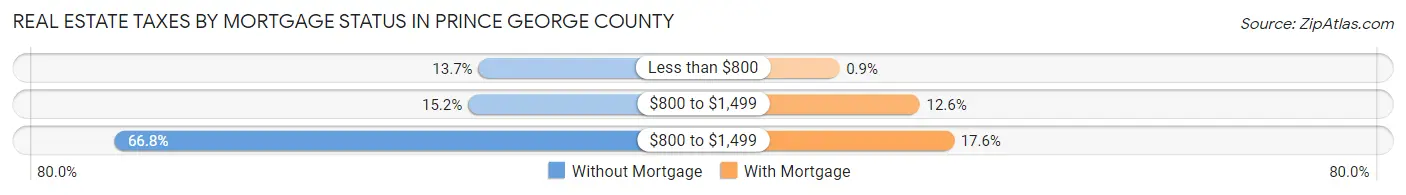
| Property Taxes | Without Mortgage | With Mortgage |
| Less than $800 | 434 (13.7%) | 53 (0.9%) |
| $800 to $1,499 | 482 (15.2%) | 747 (12.6%) |
| $800 to $1,499 | 2,118 (66.8%) | 1,042 (17.6%) |
| Total | 3,171 (100.0%) | 5,911 (100.0%) |
Health & Disability in Prince George County
Health Insurance Coverage by Age in Prince George County
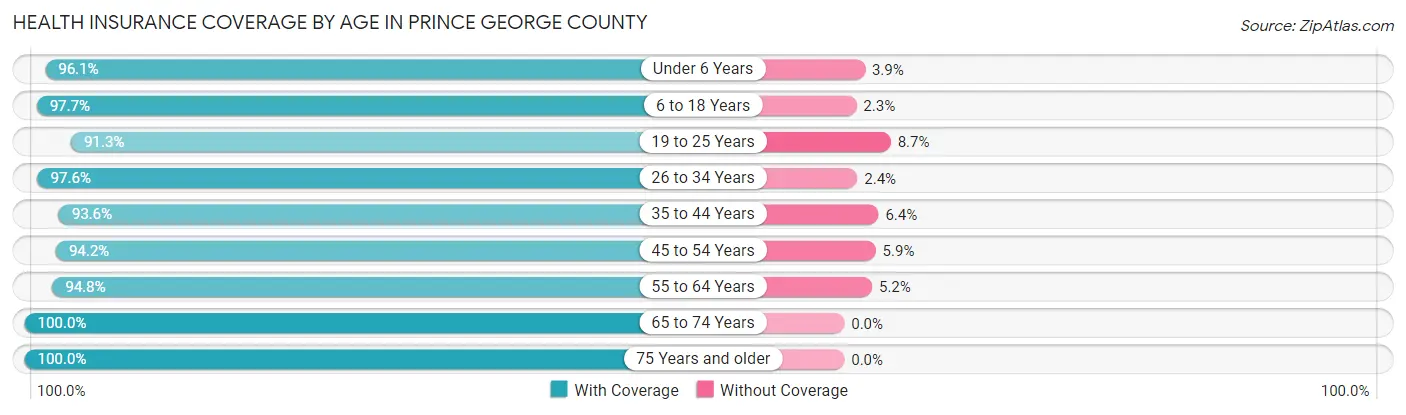
| Age Bracket | With Coverage | Without Coverage |
| Under 6 Years | 2,469 (96.1%) | 99 (3.9%) |
| 6 to 18 Years | 6,776 (97.7%) | 157 (2.3%) |
| 19 to 25 Years | 3,848 (91.3%) | 365 (8.7%) |
| 26 to 34 Years | 4,033 (97.6%) | 101 (2.4%) |
| 35 to 44 Years | 3,874 (93.6%) | 264 (6.4%) |
| 45 to 54 Years | 3,510 (94.2%) | 218 (5.9%) |
| 55 to 64 Years | 3,867 (94.8%) | 211 (5.2%) |
| 65 to 74 Years | 3,192 (100.0%) | 0 (0.0%) |
| 75 Years and older | 2,224 (100.0%) | 0 (0.0%) |
| Total | 33,793 (96.0%) | 1,415 (4.0%) |
Health Insurance Coverage by Citizenship Status in Prince George County
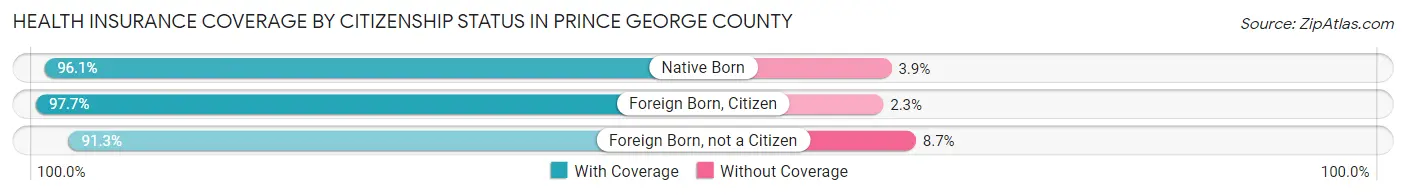
| Citizenship Status | With Coverage | Without Coverage |
| Native Born | 2,469 (96.1%) | 99 (3.9%) |
| Foreign Born, Citizen | 6,776 (97.7%) | 157 (2.3%) |
| Foreign Born, not a Citizen | 3,848 (91.3%) | 365 (8.7%) |
Health Insurance Coverage by Household Income in Prince George County
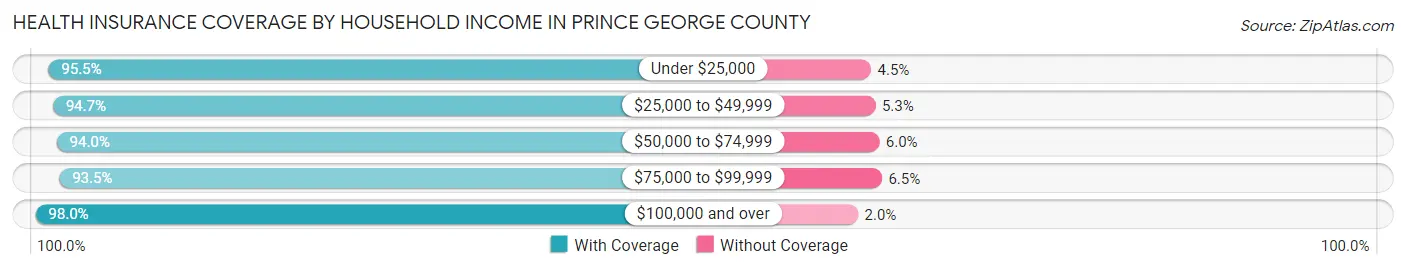
| Household Income | With Coverage | Without Coverage |
| Under $25,000 | 2,271 (95.5%) | 106 (4.5%) |
| $25,000 to $49,999 | 4,881 (94.7%) | 272 (5.3%) |
| $50,000 to $74,999 | 5,767 (94.0%) | 368 (6.0%) |
| $75,000 to $99,999 | 4,828 (93.5%) | 335 (6.5%) |
| $100,000 and over | 16,029 (98.0%) | 332 (2.0%) |
Public vs Private Health Insurance Coverage by Age in Prince George County
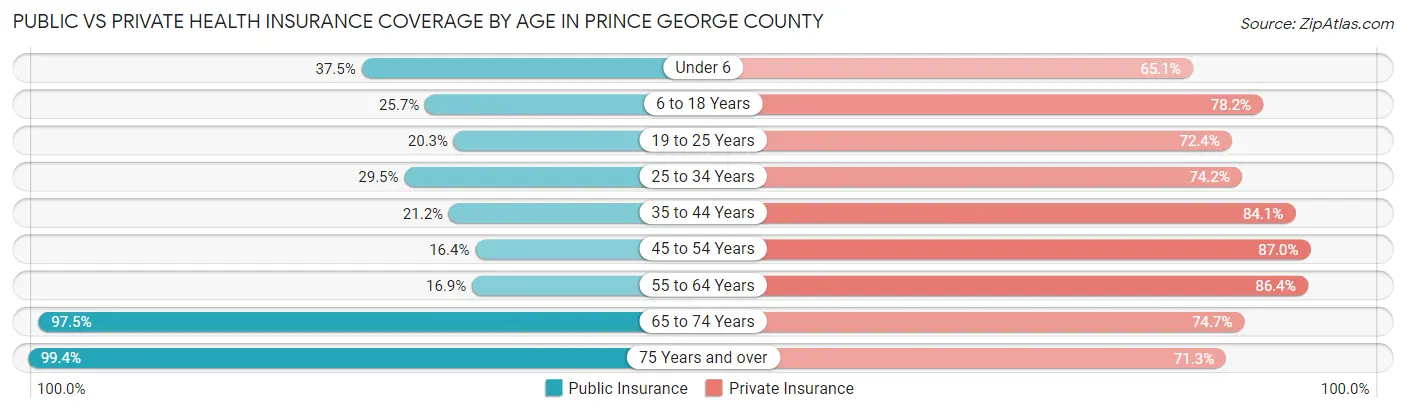
| Age Bracket | Public Insurance | Private Insurance |
| Under 6 | 962 (37.5%) | 1,672 (65.1%) |
| 6 to 18 Years | 1,779 (25.7%) | 5,419 (78.2%) |
| 19 to 25 Years | 856 (20.3%) | 3,048 (72.4%) |
| 25 to 34 Years | 1,220 (29.5%) | 3,067 (74.2%) |
| 35 to 44 Years | 879 (21.2%) | 3,481 (84.1%) |
| 45 to 54 Years | 610 (16.4%) | 3,242 (87.0%) |
| 55 to 64 Years | 691 (16.9%) | 3,525 (86.4%) |
| 65 to 74 Years | 3,111 (97.5%) | 2,384 (74.7%) |
| 75 Years and over | 2,211 (99.4%) | 1,586 (71.3%) |
| Total | 12,319 (35.0%) | 27,424 (77.9%) |
Disability Status by Sex by Age in Prince George County
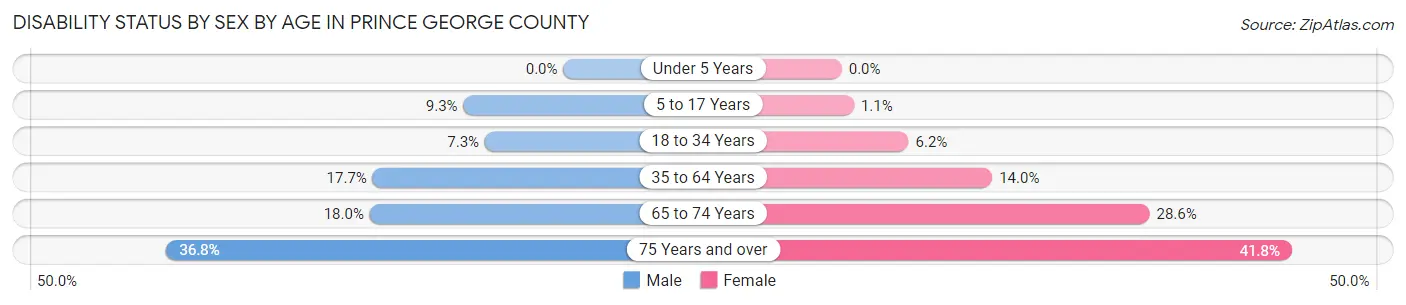
| Age Bracket | Male | Female |
| Under 5 Years | 0 (0.0%) | 0 (0.0%) |
| 5 to 17 Years | 300 (9.3%) | 34 (1.1%) |
| 18 to 34 Years | 379 (7.3%) | 267 (6.2%) |
| 35 to 64 Years | 968 (17.7%) | 904 (14.0%) |
| 65 to 74 Years | 271 (18.0%) | 481 (28.6%) |
| 75 Years and over | 343 (36.8%) | 540 (41.8%) |
Disability Class by Sex by Age in Prince George County
Disability Class: Hearing Difficulty
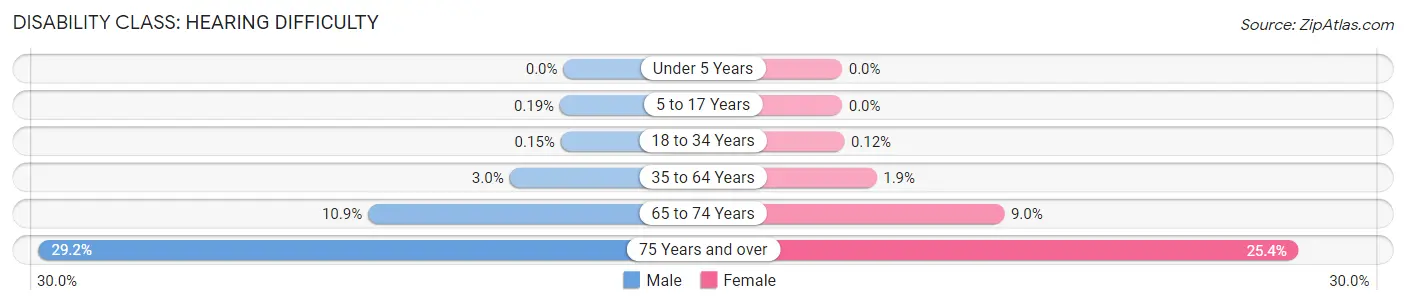
| Age Bracket | Male | Female |
| Under 5 Years | 0 (0.0%) | 0 (0.0%) |
| 5 to 17 Years | 6 (0.2%) | 0 (0.0%) |
| 18 to 34 Years | 8 (0.2%) | 5 (0.1%) |
| 35 to 64 Years | 164 (3.0%) | 124 (1.9%) |
| 65 to 74 Years | 164 (10.9%) | 152 (9.0%) |
| 75 Years and over | 272 (29.2%) | 329 (25.4%) |
Disability Class: Vision Difficulty
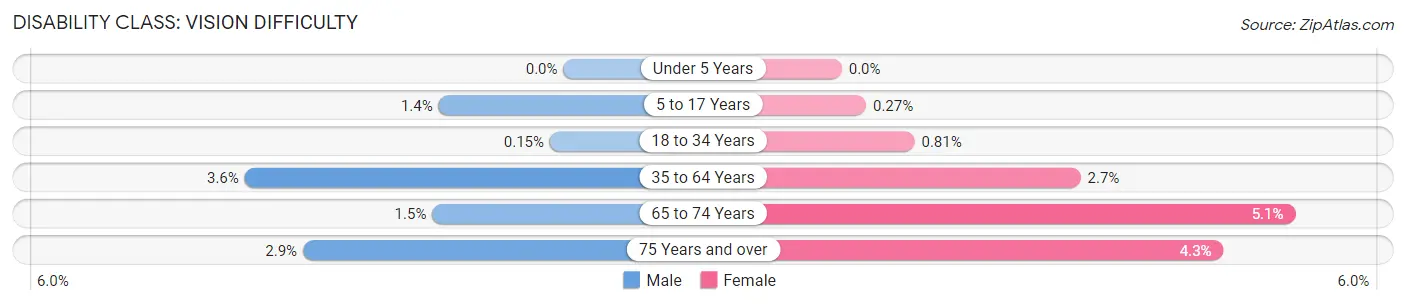
| Age Bracket | Male | Female |
| Under 5 Years | 0 (0.0%) | 0 (0.0%) |
| 5 to 17 Years | 45 (1.4%) | 8 (0.3%) |
| 18 to 34 Years | 8 (0.2%) | 35 (0.8%) |
| 35 to 64 Years | 194 (3.5%) | 172 (2.7%) |
| 65 to 74 Years | 22 (1.5%) | 85 (5.1%) |
| 75 Years and over | 27 (2.9%) | 55 (4.3%) |
Disability Class: Cognitive Difficulty
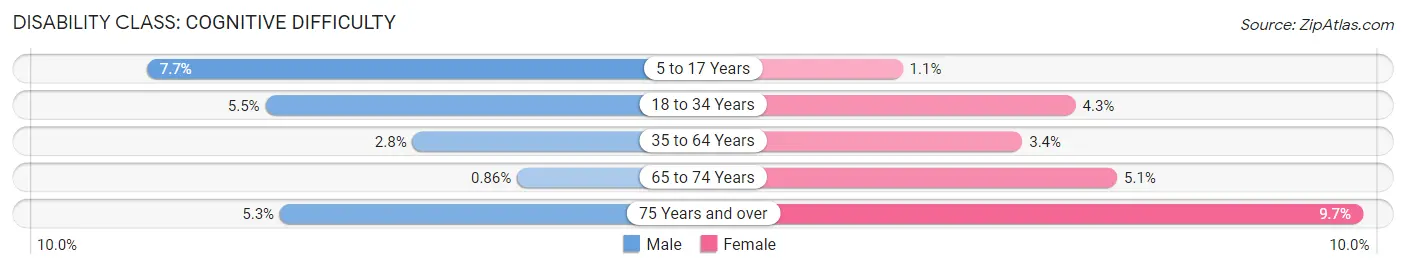
| Age Bracket | Male | Female |
| 5 to 17 Years | 250 (7.7%) | 34 (1.1%) |
| 18 to 34 Years | 288 (5.5%) | 187 (4.3%) |
| 35 to 64 Years | 153 (2.8%) | 217 (3.4%) |
| 65 to 74 Years | 13 (0.9%) | 86 (5.1%) |
| 75 Years and over | 49 (5.3%) | 125 (9.7%) |
Disability Class: Ambulatory Difficulty
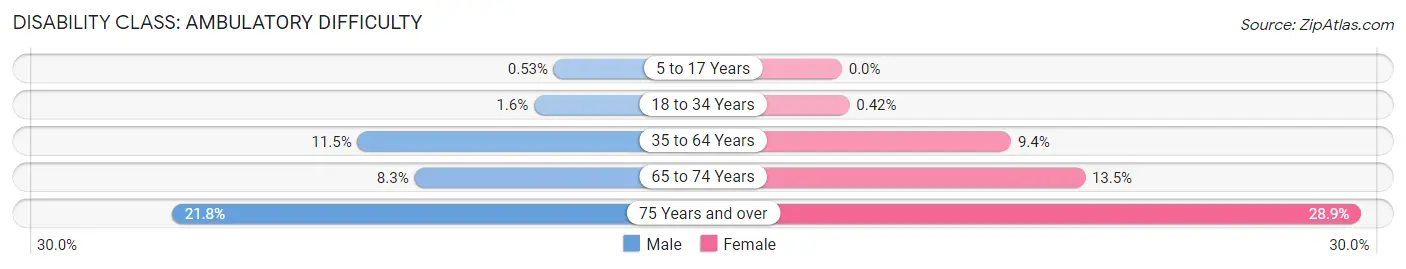
| Age Bracket | Male | Female |
| 5 to 17 Years | 17 (0.5%) | 0 (0.0%) |
| 18 to 34 Years | 85 (1.6%) | 18 (0.4%) |
| 35 to 64 Years | 627 (11.5%) | 610 (9.4%) |
| 65 to 74 Years | 125 (8.3%) | 228 (13.5%) |
| 75 Years and over | 203 (21.8%) | 374 (28.9%) |
Disability Class: Self-Care Difficulty
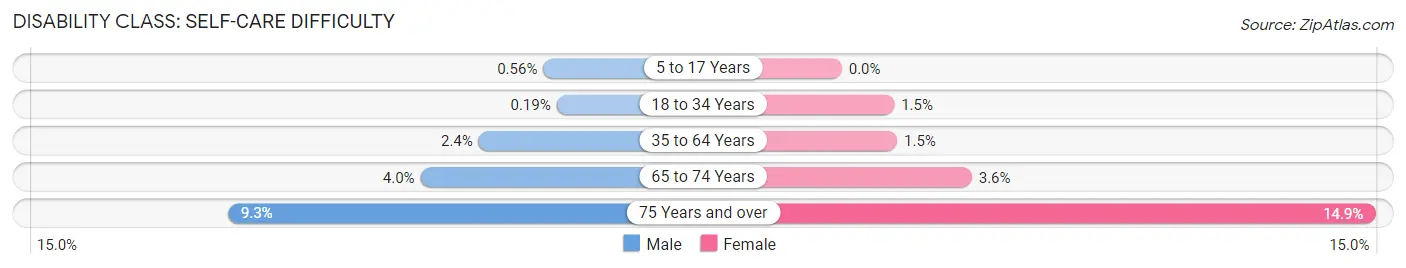
| Age Bracket | Male | Female |
| 5 to 17 Years | 18 (0.6%) | 0 (0.0%) |
| 18 to 34 Years | 10 (0.2%) | 63 (1.5%) |
| 35 to 64 Years | 129 (2.4%) | 100 (1.5%) |
| 65 to 74 Years | 60 (4.0%) | 61 (3.6%) |
| 75 Years and over | 87 (9.3%) | 192 (14.8%) |
Technology Access in Prince George County
Computing Device Access in Prince George County
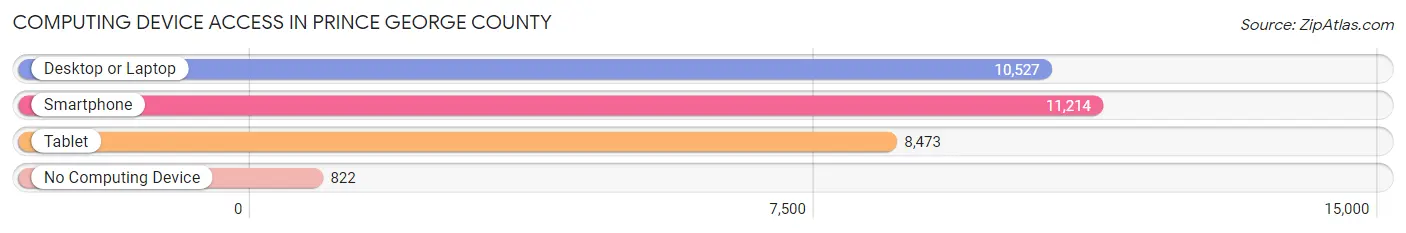
| Device Type | # Households | % Households |
| Desktop or Laptop | 10,527 | 82.2% |
| Smartphone | 11,214 | 87.5% |
| Tablet | 8,473 | 66.1% |
| No Computing Device | 822 | 6.4% |
| Total | 12,808 | 100.0% |
Internet Access in Prince George County
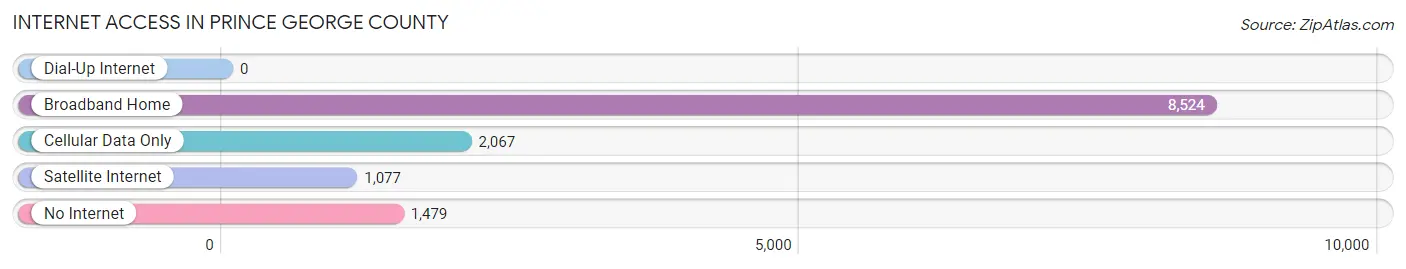
| Internet Type | # Households | % Households |
| Dial-Up Internet | 0 | 0.0% |
| Broadband Home | 8,524 | 66.5% |
| Cellular Data Only | 2,067 | 16.1% |
| Satellite Internet | 1,077 | 8.4% |
| No Internet | 1,479 | 11.6% |
| Total | 12,808 | 100.0% |
Prince George County Summary
George County, Virginia is located in the southeastern part of the state, just south of the James River. It is bordered by the cities of Richmond, Petersburg, and Hopewell, as well as the counties of Dinwiddie, Prince William, and Charles City. The county seat is the city of Prince George, which is located in the center of the county.
Geography
Prince George County covers an area of approximately 437 square miles, making it the second largest county in Virginia. The terrain is mostly flat, with some rolling hills in the northern part of the county. The Appomattox River forms the northern border of the county, while the James River forms the southern border. The county is home to several state parks, including Pocahontas State Park, Bear Creek Lake State Park, and Prince George County Park.
Climate
Prince George County has a humid subtropical climate, with hot, humid summers and mild winters. The average annual temperature is around 60°F, with average highs in the summer reaching the mid-80s and average lows in the winter reaching the mid-30s. The county receives an average of 45 inches of precipitation per year, with most of it falling in the summer months.
Demographics
As of the 2010 census, Prince George County had a population of 35,725. The racial makeup of the county was 68.3% White, 25.2% African American, 0.5% Native American, 1.7% Asian, 0.1% Pacific Islander, 2.2% from other races, and 2.1% from two or more races. Hispanic or Latino of any race were 4.7% of the population.
Economy
Prince George County is home to several major employers, including Fort Lee, a U.S. Army base, and the Defense Supply Center Richmond, a major logistics center for the Department of Defense. Other major employers include the Virginia State University, Southside Regional Medical Center, and the Virginia Department of Corrections. The county also has a thriving agricultural sector, with crops such as corn, soybeans, and wheat being grown in the area.
History
Prince George County was established in 1703, and was named for Prince George of Denmark, the husband of Queen Anne. The county was originally part of Charles City County, but was split off in 1703. The county was home to several prominent families, including the Randolphs, the Lees, and the Harrisons. During the American Revolution, the county was the site of several battles, including the Battle of Petersburg and the Battle of Swift Creek.
In the 19th century, the county was home to several prominent industries, including tobacco farming, ironworks, and lumber mills. The county was also home to several prominent educational institutions, including the Virginia Theological Seminary and the Virginia Normal and Collegiate Institute.
In the 20th century, the county experienced rapid growth, with the population increasing from 15,000 in 1900 to over 35,000 in 2010. The county is now home to several major employers, including Fort Lee and the Defense Supply Center Richmond. The county is also home to several state parks, including Pocahontas State Park and Bear Creek Lake State Park.
Common Questions
What is Per Capita Income in Prince George County?
Per Capita income in Prince George County is $31,801.
What is the Median Family Income in Prince George County?
Median Family Income in Prince George County is $88,333.
What is the Median Household income in Prince George County?
Median Household Income in Prince George County is $80,318.
What is Income or Wage Gap in Prince George County?
Income or Wage Gap in Prince George County is 22.2%.
Women in Prince George County earn 77.8 cents for every dollar earned by a man.
What is Family Income Deficit in Prince George County?
Family Income Deficit in Prince George County is $10,532.
Families that are below poverty line in Prince George County earn $10,532 less on average than the poverty threshold level.
What is Inequality or Gini Index in Prince George County?
Inequality or Gini Index in Prince George County is 0.37.
What is the Total Population of Prince George County?
Total Population of Prince George County is 42,634.
What is the Total Male Population of Prince George County?
Total Male Population of Prince George County is 23,947.
What is the Total Female Population of Prince George County?
Total Female Population of Prince George County is 18,687.
What is the Ratio of Males per 100 Females in Prince George County?
There are 128.15 Males per 100 Females in Prince George County.
What is the Ratio of Females per 100 Males in Prince George County?
There are 78.03 Females per 100 Males in Prince George County.
What is the Median Population Age in Prince George County?
Median Population Age in Prince George County is 34.2 Years.
What is the Average Family Size in Prince George County
Average Family Size in Prince George County is 3.3 People.
What is the Average Household Size in Prince George County
Average Household Size in Prince George County is 2.9 People.
How Large is the Labor Force in Prince George County?
There are 21,343 People in the Labor Forcein in Prince George County.
What is the Percentage of People in the Labor Force in Prince George County?
60.9% of People are in the Labor Force in Prince George County.
What is the Unemployment Rate in Prince George County?
Unemployment Rate in Prince George County is 7.5%.