Prince Edward County, VA Map & Demographics
Prince Edward County Map
Prince Edward County Overview
$25,205
PER CAPITA INCOME
$77,032
AVG FAMILY INCOME
$57,304
AVG HOUSEHOLD INCOME
22.1%
WAGE / INCOME GAP [ % ]
77.9¢/ $1
WAGE / INCOME GAP [ $ ]
$10,315
FAMILY INCOME DEFICIT
0.45
INEQUALITY / GINI INDEX
21,922
TOTAL POPULATION
11,433
MALE POPULATION
10,489
FEMALE POPULATION
109.00
MALES / 100 FEMALES
91.74
FEMALES / 100 MALES
32.0
MEDIAN AGE
2.8
AVG FAMILY SIZE
2.2
AVG HOUSEHOLD SIZE
8,836
LABOR FORCE [ PEOPLE ]
46.4%
PERCENT IN LABOR FORCE
2.4%
UNEMPLOYMENT RATE
Prince Edward County Area Codes
Income in Prince Edward County
Income Overview in Prince Edward County
Per Capita Income in Prince Edward County is $25,205, while median incomes of families and households are $77,032 and $57,304 respectively.
| Characteristic | Number | Measure |
| Per Capita Income | 21,922 | $25,205 |
| Median Family Income | 4,399 | $77,032 |
| Mean Family Income | 4,399 | $92,209 |
| Median Household Income | 7,416 | $57,304 |
| Mean Household Income | 7,416 | $73,707 |
| Income Deficit | 4,399 | $10,315 |
| Wage / Income Gap (%) | 21,922 | 22.06% |
| Wage / Income Gap ($) | 21,922 | 77.94¢ per $1 |
| Gini / Inequality Index | 21,922 | 0.45 |
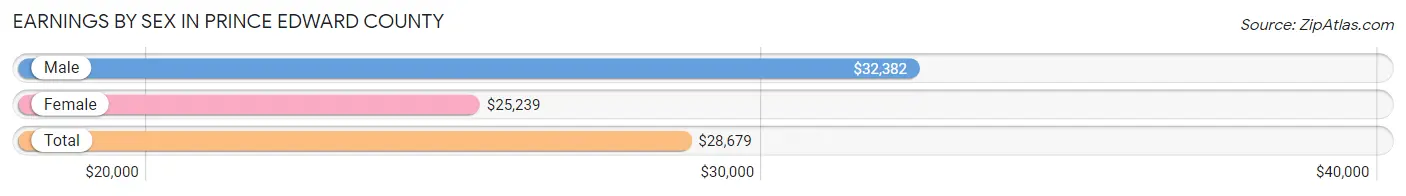
Earnings by Sex in Prince Edward County
Average Earnings in Prince Edward County are $28,679, $32,382 for men and $25,239 for women, a difference of 22.1%.
| Sex | Number | Average Earnings |
| Male | 5,991 (56.7%) | $32,382 |
| Female | 4,577 (43.3%) | $25,239 |
| Total | 10,568 (100.0%) | $28,679 |
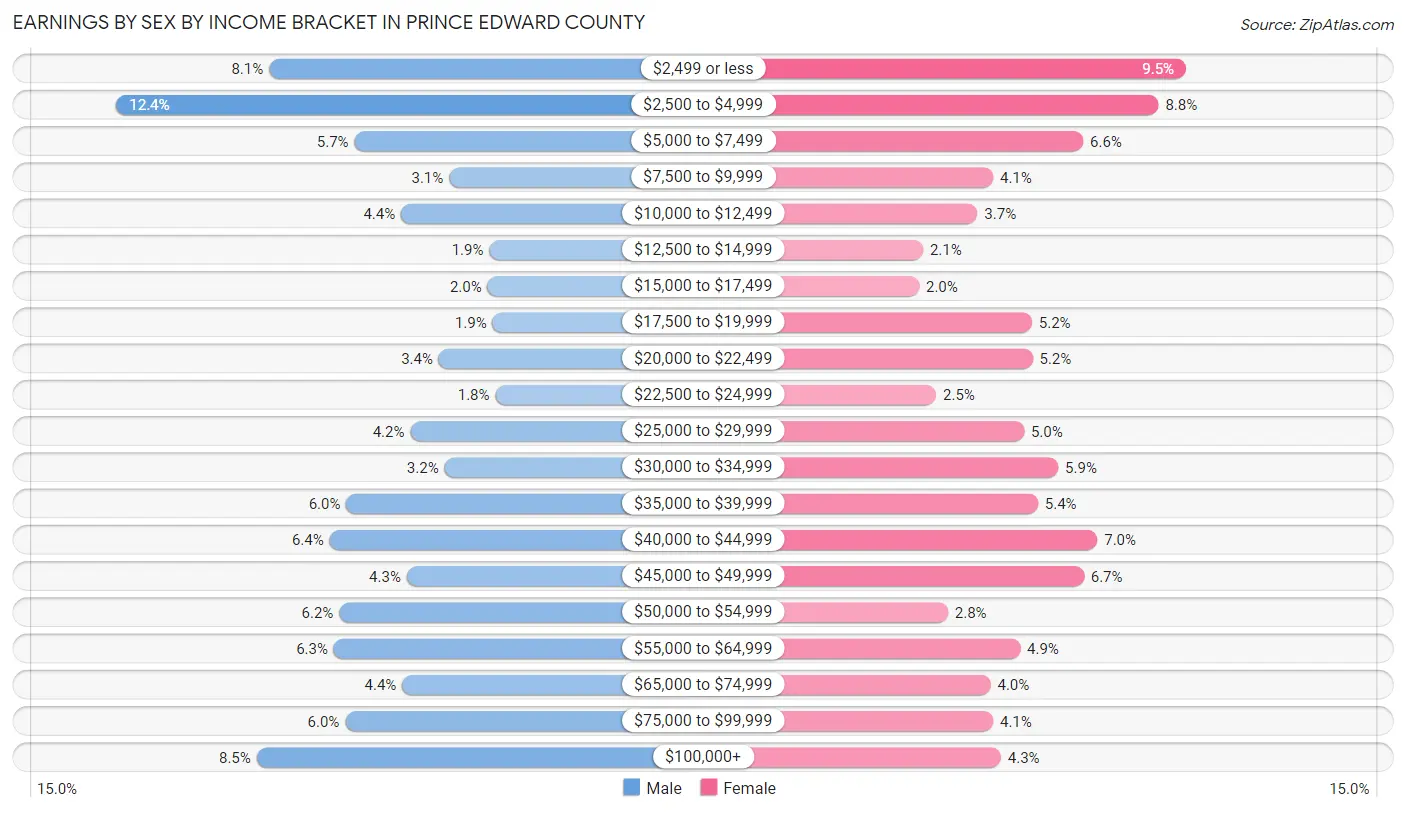
Earnings by Sex by Income Bracket in Prince Edward County
The most common earnings brackets in Prince Edward County are $2,500 to $4,999 for men (744 | 12.4%) and $2,499 or less for women (436 | 9.5%).
| Income | Male | Female |
| $2,499 or less | 487 (8.1%) | 436 (9.5%) |
| $2,500 to $4,999 | 744 (12.4%) | 401 (8.8%) |
| $5,000 to $7,499 | 343 (5.7%) | 304 (6.6%) |
| $7,500 to $9,999 | 184 (3.1%) | 188 (4.1%) |
| $10,000 to $12,499 | 265 (4.4%) | 168 (3.7%) |
| $12,500 to $14,999 | 116 (1.9%) | 98 (2.1%) |
| $15,000 to $17,499 | 119 (2.0%) | 93 (2.0%) |
| $17,500 to $19,999 | 111 (1.8%) | 238 (5.2%) |
| $20,000 to $22,499 | 201 (3.4%) | 239 (5.2%) |
| $22,500 to $24,999 | 106 (1.8%) | 115 (2.5%) |
| $25,000 to $29,999 | 249 (4.2%) | 228 (5.0%) |
| $30,000 to $34,999 | 192 (3.2%) | 272 (5.9%) |
| $35,000 to $39,999 | 357 (6.0%) | 246 (5.4%) |
| $40,000 to $44,999 | 385 (6.4%) | 322 (7.0%) |
| $45,000 to $49,999 | 255 (4.3%) | 305 (6.7%) |
| $50,000 to $54,999 | 369 (6.2%) | 130 (2.8%) |
| $55,000 to $64,999 | 378 (6.3%) | 223 (4.9%) |
| $65,000 to $74,999 | 263 (4.4%) | 185 (4.0%) |
| $75,000 to $99,999 | 359 (6.0%) | 188 (4.1%) |
| $100,000+ | 508 (8.5%) | 198 (4.3%) |
| Total | 5,991 (100.0%) | 4,577 (100.0%) |
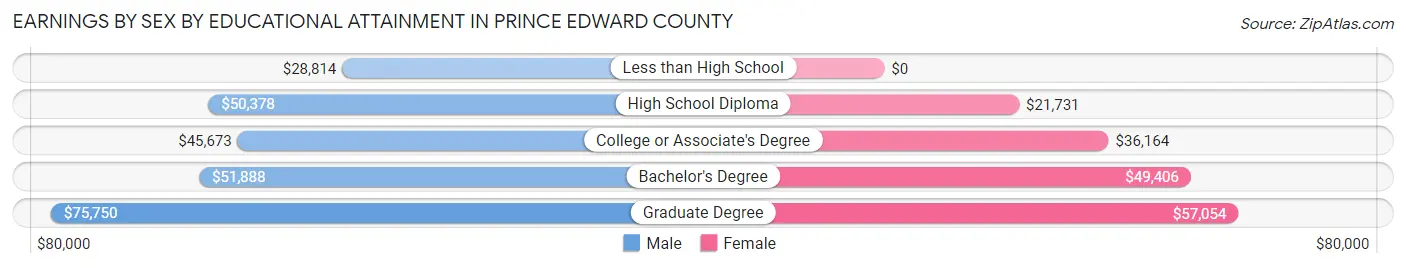
Earnings by Sex by Educational Attainment in Prince Edward County
Average earnings in Prince Edward County are $50,144 for men and $36,150 for women, a difference of 27.9%. Men with an educational attainment of graduate degree enjoy the highest average annual earnings of $75,750, while those with less than high school education earn the least with $28,814. Women with an educational attainment of graduate degree earn the most with the average annual earnings of $57,054, while those with high school diploma education have the smallest earnings of $21,731.
| Educational Attainment | Male Income | Female Income |
| Less than High School | $28,814 | $0 |
| High School Diploma | $50,378 | $21,731 |
| College or Associate's Degree | $45,673 | $36,164 |
| Bachelor's Degree | $51,888 | $49,406 |
| Graduate Degree | $75,750 | $57,054 |
| Total | $50,144 | $36,150 |
Family Income in Prince Edward County
Family Income Brackets in Prince Edward County
According to the Prince Edward County family income data, there are 981 families falling into the $100,000 to $149,999 income range, which is the most common income bracket and makes up 22.3% of all families. Conversely, the less than $10,000 income bracket is the least frequent group with only 132 families (3.0%) belonging to this category.
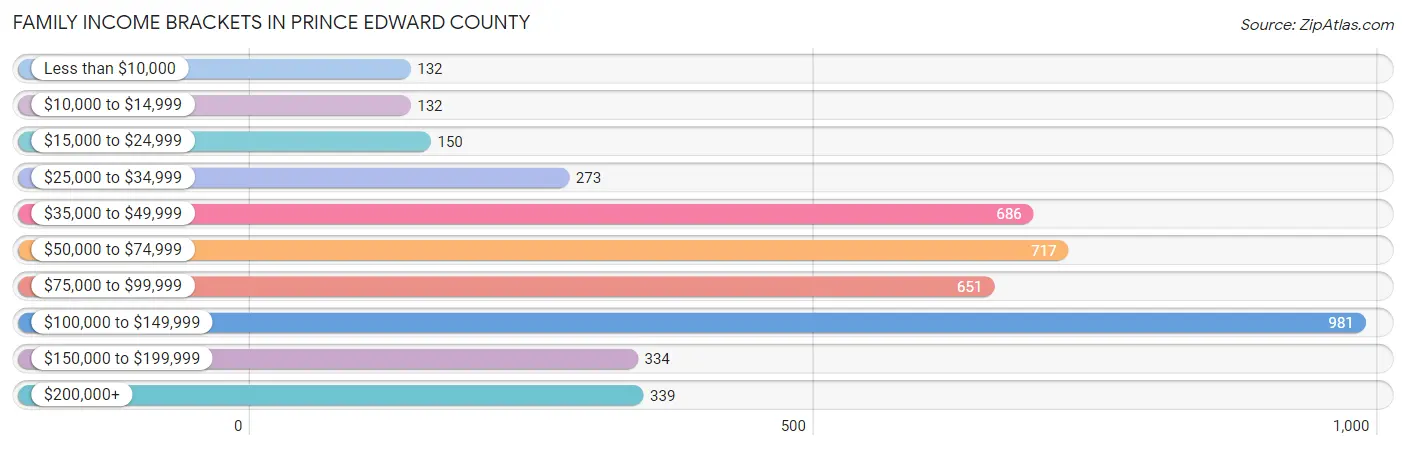
| Income Bracket | # Families | % Families |
| Less than $10,000 | 132 | 3.0% |
| $10,000 to $14,999 | 132 | 3.0% |
| $15,000 to $24,999 | 150 | 3.4% |
| $25,000 to $34,999 | 273 | 6.2% |
| $35,000 to $49,999 | 686 | 15.6% |
| $50,000 to $74,999 | 717 | 16.3% |
| $75,000 to $99,999 | 651 | 14.8% |
| $100,000 to $149,999 | 981 | 22.3% |
| $150,000 to $199,999 | 334 | 7.6% |
| $200,000+ | 339 | 7.7% |
Family Income by Famaliy Size in Prince Edward County
6-person families (108 | 2.5%) account for the highest median family income in Prince Edward County with $136,765 per family, while 2-person families (2,030 | 46.2%) have the highest median income of $30,402 per family member.
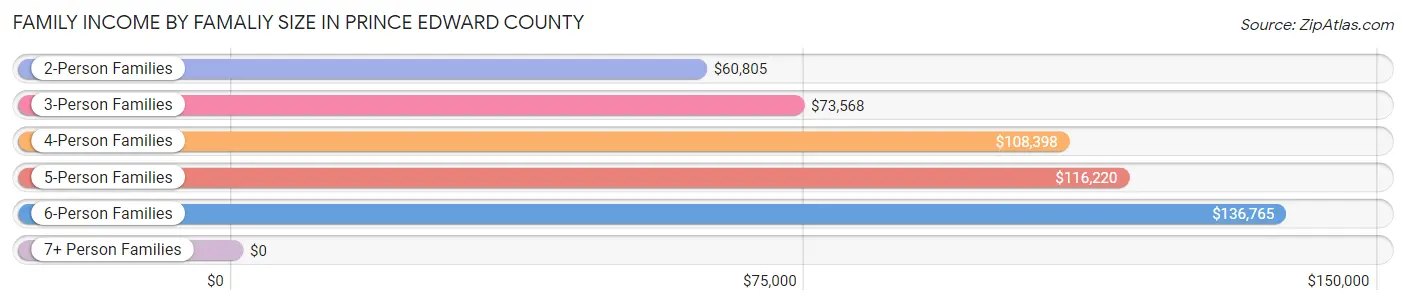
| Income Bracket | # Families | Median Income |
| 2-Person Families | 2,030 (46.2%) | $60,805 |
| 3-Person Families | 1,281 (29.1%) | $73,568 |
| 4-Person Families | 627 (14.2%) | $108,398 |
| 5-Person Families | 330 (7.5%) | $116,220 |
| 6-Person Families | 108 (2.5%) | $136,765 |
| 7+ Person Families | 23 (0.5%) | $0 |
| Total | 4,399 (100.0%) | $77,032 |
Family Income by Number of Earners in Prince Edward County
The median family income in Prince Edward County is $77,032, with families comprising 3+ earners (398) having the highest median family income of $104,928, while families with no earners (726) have the lowest median family income of $40,221, accounting for 9.0% and 16.5% of families, respectively.
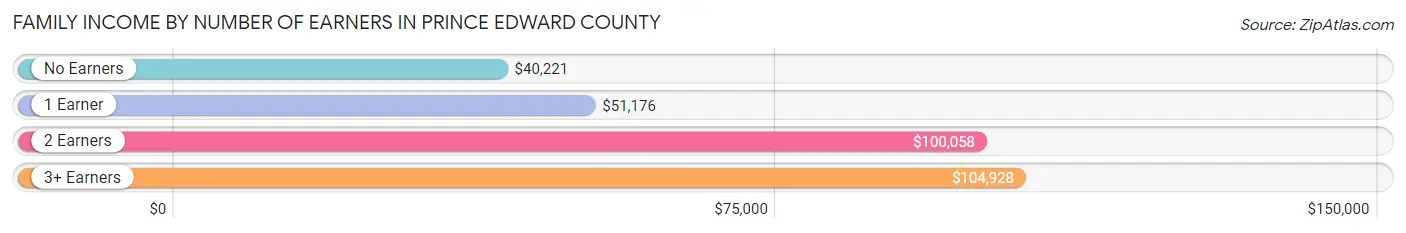
| Number of Earners | # Families | Median Income |
| No Earners | 726 (16.5%) | $40,221 |
| 1 Earner | 1,540 (35.0%) | $51,176 |
| 2 Earners | 1,735 (39.4%) | $100,058 |
| 3+ Earners | 398 (9.0%) | $104,928 |
| Total | 4,399 (100.0%) | $77,032 |
Household Income in Prince Edward County
Household Income Brackets in Prince Edward County
With 1,238 households falling in the category, the $50,000 to $74,999 income range is the most frequent in Prince Edward County, accounting for 16.7% of all households. In contrast, only 371 households (5.0%) fall into the $200,000+ income bracket, making it the least populous group.
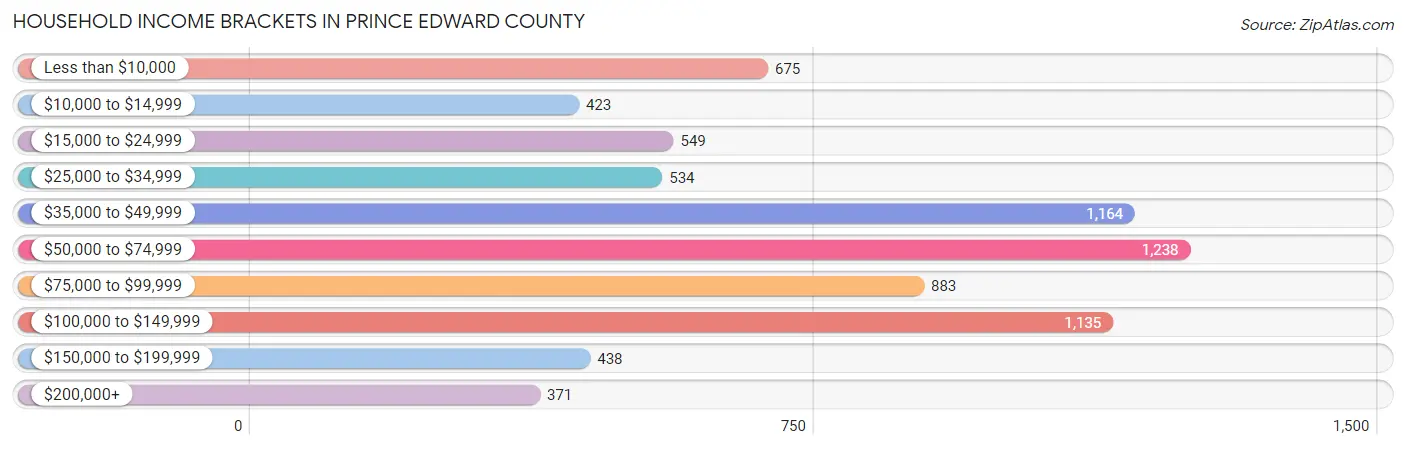
| Income Bracket | # Households | % Households |
| Less than $10,000 | 675 | 9.1% |
| $10,000 to $14,999 | 423 | 5.7% |
| $15,000 to $24,999 | 549 | 7.4% |
| $25,000 to $34,999 | 534 | 7.2% |
| $35,000 to $49,999 | 1,164 | 15.7% |
| $50,000 to $74,999 | 1,238 | 16.7% |
| $75,000 to $99,999 | 883 | 11.9% |
| $100,000 to $149,999 | 1,135 | 15.3% |
| $150,000 to $199,999 | 438 | 5.9% |
| $200,000+ | 371 | 5.0% |
Household Income by Householder Age in Prince Edward County
The median household income in Prince Edward County is $57,304, with the highest median household income of $65,486 found in the 45 to 64 years age bracket for the primary householder. A total of 2,557 households (34.5%) fall into this category. Meanwhile, the 65+ years age bracket for the primary householder has the lowest median household income of $38,817, with 2,319 households (31.3%) in this group.
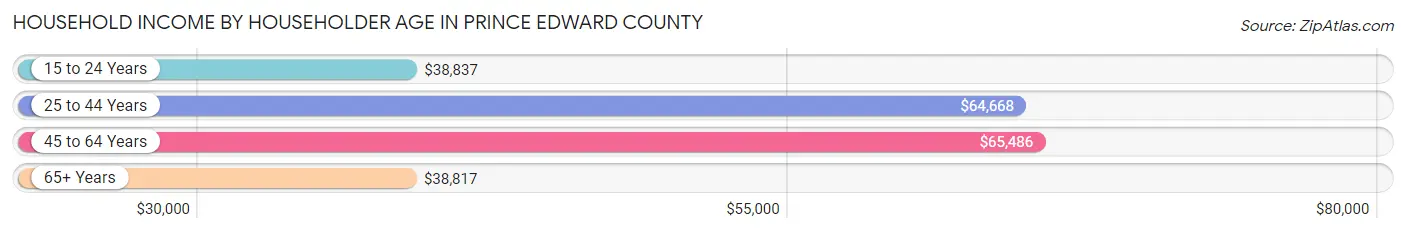
| Income Bracket | # Households | Median Income |
| 15 to 24 Years | 563 (7.6%) | $38,837 |
| 25 to 44 Years | 1,977 (26.7%) | $64,668 |
| 45 to 64 Years | 2,557 (34.5%) | $65,486 |
| 65+ Years | 2,319 (31.3%) | $38,817 |
| Total | 7,416 (100.0%) | $57,304 |
Poverty in Prince Edward County
Income Below Poverty by Sex and Age in Prince Edward County
With 15.3% poverty level for males and 20.8% for females among the residents of Prince Edward County, 6 to 11 year old males and 18 to 24 year old females are the most vulnerable to poverty, with 163 males (43.9%) and 301 females (40.8%) in their respective age groups living below the poverty level.
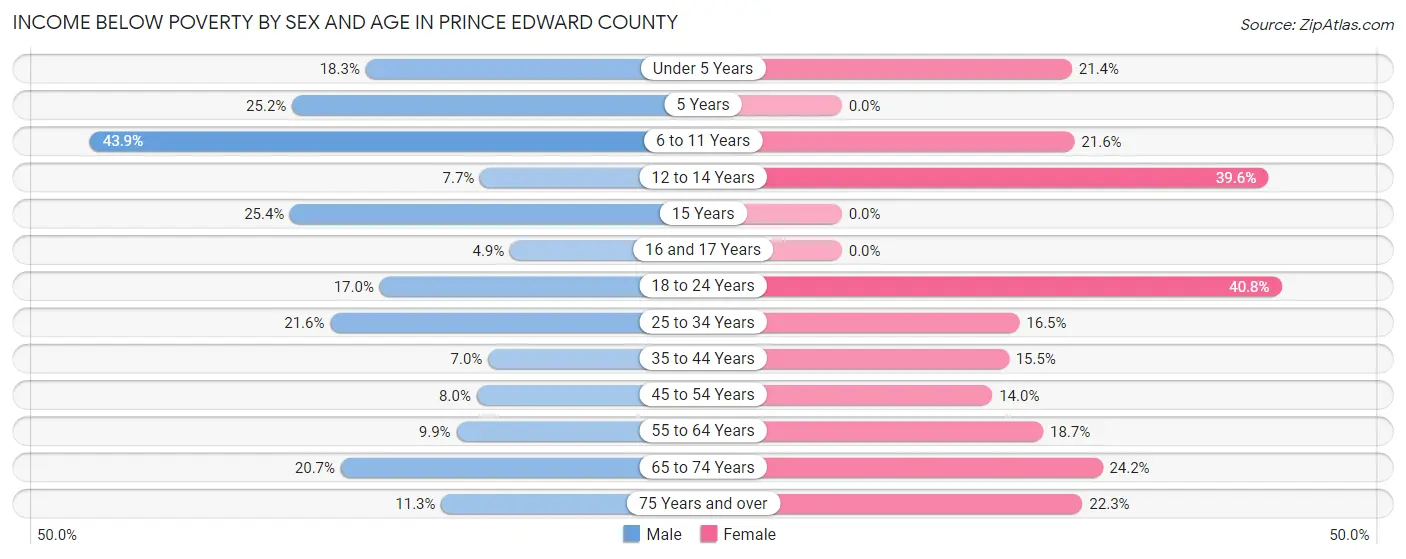
| Age Bracket | Male | Female |
| Under 5 Years | 84 (18.3%) | 76 (21.3%) |
| 5 Years | 38 (25.2%) | 0 (0.0%) |
| 6 to 11 Years | 163 (43.9%) | 136 (21.6%) |
| 12 to 14 Years | 21 (7.7%) | 70 (39.6%) |
| 15 Years | 36 (25.4%) | 0 (0.0%) |
| 16 and 17 Years | 12 (4.9%) | 0 (0.0%) |
| 18 to 24 Years | 192 (17.0%) | 301 (40.8%) |
| 25 to 34 Years | 196 (21.6%) | 202 (16.5%) |
| 35 to 44 Years | 64 (7.0%) | 142 (15.5%) |
| 45 to 54 Years | 74 (8.0%) | 135 (14.0%) |
| 55 to 64 Years | 116 (9.9%) | 227 (18.7%) |
| 65 to 74 Years | 185 (20.6%) | 254 (24.2%) |
| 75 Years and over | 65 (11.3%) | 199 (22.3%) |
| Total | 1,246 (15.3%) | 1,742 (20.8%) |
Income Above Poverty by Sex and Age in Prince Edward County
According to the poverty statistics in Prince Edward County, males aged 16 and 17 years and females aged 5 years are the age groups that are most secure financially, with 95.1% of males and 100.0% of females in these age groups living above the poverty line.
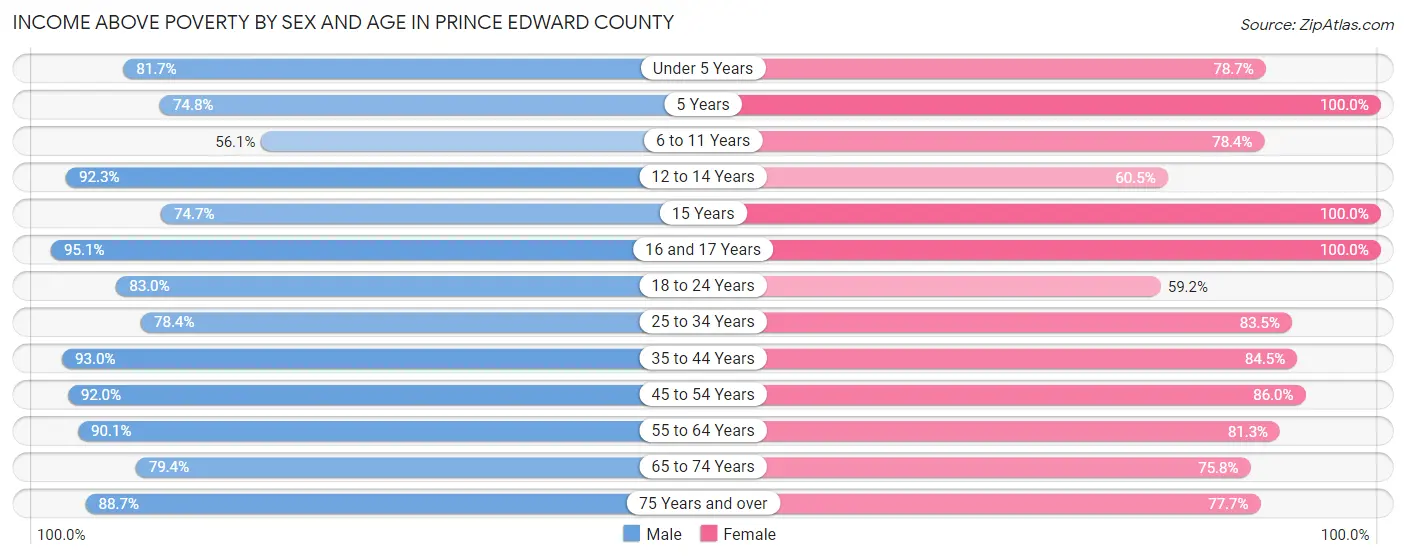
| Age Bracket | Male | Female |
| Under 5 Years | 374 (81.7%) | 280 (78.6%) |
| 5 Years | 113 (74.8%) | 18 (100.0%) |
| 6 to 11 Years | 208 (56.1%) | 494 (78.4%) |
| 12 to 14 Years | 251 (92.3%) | 107 (60.5%) |
| 15 Years | 106 (74.7%) | 32 (100.0%) |
| 16 and 17 Years | 231 (95.1%) | 136 (100.0%) |
| 18 to 24 Years | 935 (83.0%) | 437 (59.2%) |
| 25 to 34 Years | 710 (78.4%) | 1,024 (83.5%) |
| 35 to 44 Years | 853 (93.0%) | 775 (84.5%) |
| 45 to 54 Years | 846 (92.0%) | 832 (86.0%) |
| 55 to 64 Years | 1,053 (90.1%) | 988 (81.3%) |
| 65 to 74 Years | 711 (79.3%) | 796 (75.8%) |
| 75 Years and over | 509 (88.7%) | 692 (77.7%) |
| Total | 6,900 (84.7%) | 6,611 (79.1%) |
Income Below Poverty Among Married-Couple Families in Prince Edward County
The poverty statistics for married-couple families in Prince Edward County show that 5.8% or 173 of the total 2,993 families live below the poverty line. Families with 5 or more children have the highest poverty rate of 100.0%, comprising of 23 families. On the other hand, families with 1 or 2 children have the lowest poverty rate of 3.1%, which includes 27 families.
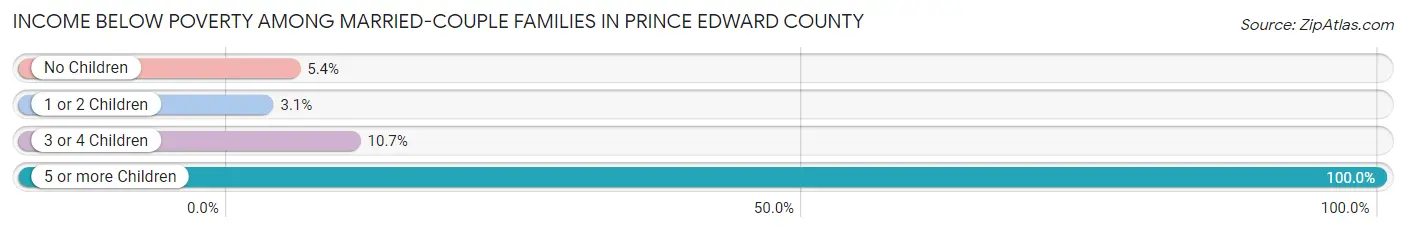
| Children | Above Poverty | Below Poverty |
| No Children | 1,814 (94.6%) | 104 (5.4%) |
| 1 or 2 Children | 847 (96.9%) | 27 (3.1%) |
| 3 or 4 Children | 159 (89.3%) | 19 (10.7%) |
| 5 or more Children | 0 (0.0%) | 23 (100.0%) |
| Total | 2,820 (94.2%) | 173 (5.8%) |
Income Below Poverty Among Single-Parent Households in Prince Edward County
According to the poverty data in Prince Edward County, 5.4% or 30 single-father households and 21.2% or 181 single-mother households are living below the poverty line. Among single-father households, those with 5 or more children have the highest poverty rate, with 12 households (100.0%) experiencing poverty. Likewise, among single-mother households, those with 3 or 4 children have the highest poverty rate, with 33 households (44.6%) falling below the poverty line.
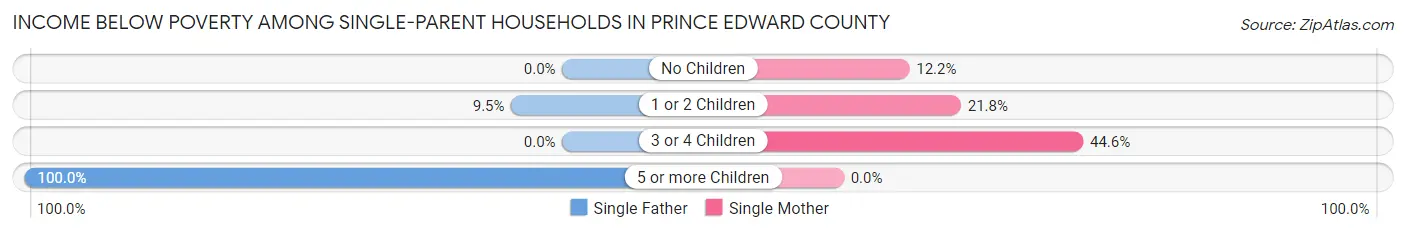
| Children | Single Father | Single Mother |
| No Children | 0 (0.0%) | 28 (12.2%) |
| 1 or 2 Children | 18 (9.5%) | 120 (21.8%) |
| 3 or 4 Children | 0 (0.0%) | 33 (44.6%) |
| 5 or more Children | 12 (100.0%) | 0 (0.0%) |
| Total | 30 (5.4%) | 181 (21.2%) |
Income Below Poverty Among Married-Couple vs Single-Parent Households in Prince Edward County
The poverty data for Prince Edward County shows that 173 of the married-couple family households (5.8%) and 211 of the single-parent households (15.0%) are living below the poverty level. Within the married-couple family households, those with 5 or more children have the highest poverty rate, with 23 households (100.0%) falling below the poverty line. Among the single-parent households, those with 5 or more children have the highest poverty rate, with 12 household (100.0%) living below poverty.
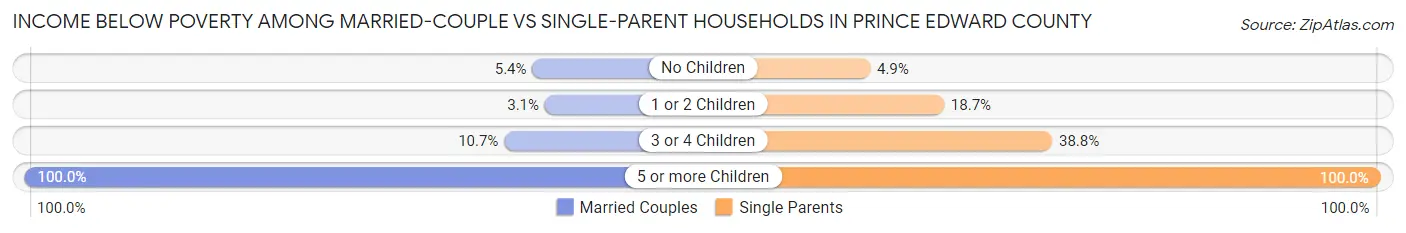
| Children | Married-Couple Families | Single-Parent Households |
| No Children | 104 (5.4%) | 28 (4.9%) |
| 1 or 2 Children | 27 (3.1%) | 138 (18.7%) |
| 3 or 4 Children | 19 (10.7%) | 33 (38.8%) |
| 5 or more Children | 23 (100.0%) | 12 (100.0%) |
| Total | 173 (5.8%) | 211 (15.0%) |
Race in Prince Edward County
The most populous races in Prince Edward County are White / Caucasian (13,737 | 62.7%), Black / African American (6,559 | 29.9%), and Two or more Races (895 | 4.1%).
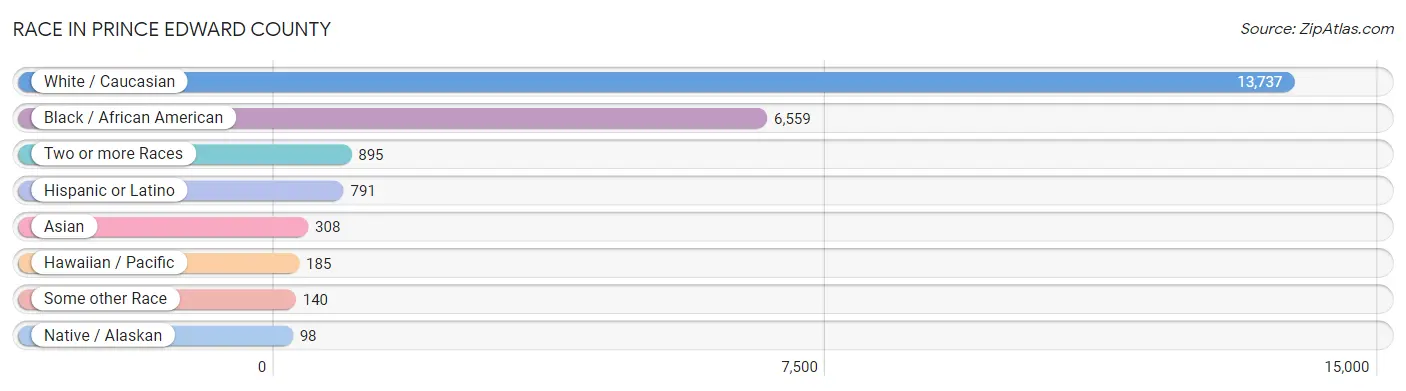
| Race | # Population | % Population |
| Asian | 308 | 1.4% |
| Black / African American | 6,559 | 29.9% |
| Hawaiian / Pacific | 185 | 0.8% |
| Hispanic or Latino | 791 | 3.6% |
| Native / Alaskan | 98 | 0.4% |
| White / Caucasian | 13,737 | 62.7% |
| Two or more Races | 895 | 4.1% |
| Some other Race | 140 | 0.6% |
| Total | 21,922 | 100.0% |
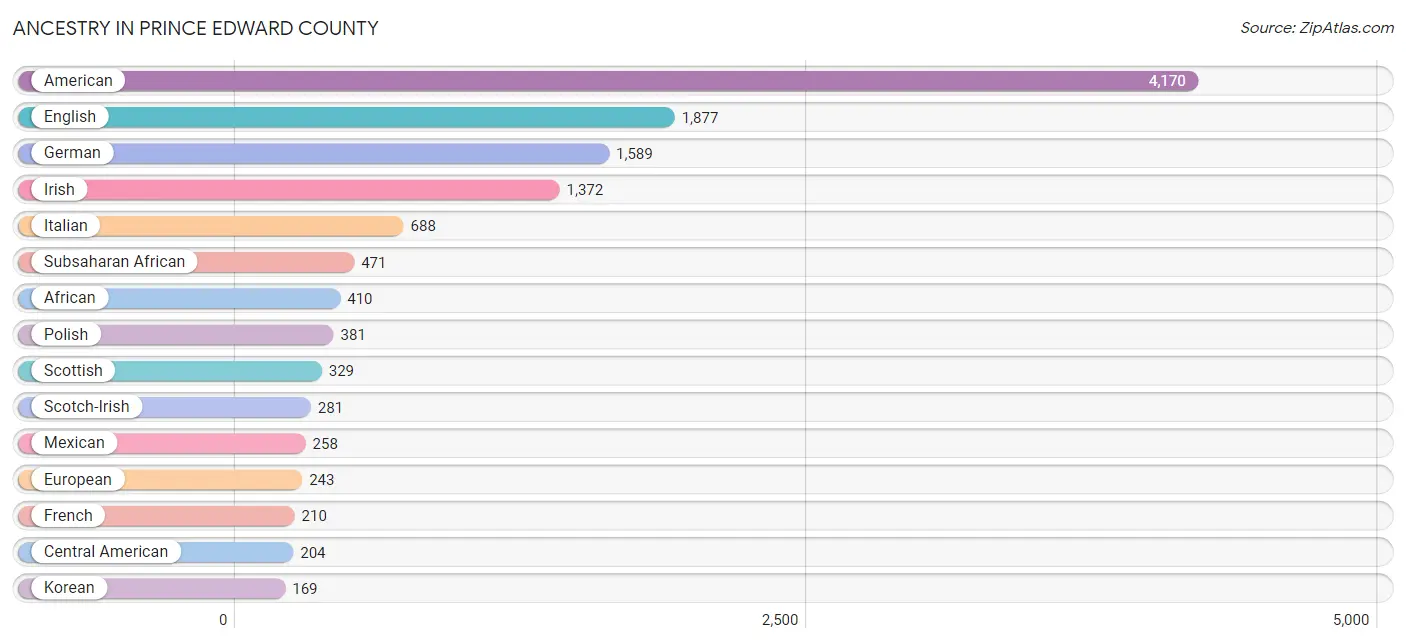
Ancestry in Prince Edward County
The most populous ancestries reported in Prince Edward County are American (4,170 | 19.0%), English (1,877 | 8.6%), German (1,589 | 7.2%), Irish (1,372 | 6.3%), and Italian (688 | 3.1%), together accounting for 44.2% of all Prince Edward County residents.
| Ancestry | # Population | % Population |
| African | 410 | 1.9% |
| American | 4,170 | 19.0% |
| Arab | 48 | 0.2% |
| Armenian | 8 | 0.0% |
| Austrian | 20 | 0.1% |
| Belgian | 6 | 0.0% |
| Bhutanese | 35 | 0.2% |
| Bolivian | 116 | 0.5% |
| Brazilian | 21 | 0.1% |
| British | 102 | 0.5% |
| Burmese | 78 | 0.4% |
| Canadian | 18 | 0.1% |
| Central American | 204 | 0.9% |
| Central American Indian | 11 | 0.1% |
| Cherokee | 45 | 0.2% |
| Chippewa | 3 | 0.0% |
| Croatian | 17 | 0.1% |
| Cuban | 13 | 0.1% |
| Czech | 6 | 0.0% |
| Dutch | 45 | 0.2% |
| Eastern European | 38 | 0.2% |
| English | 1,877 | 8.6% |
| Ethiopian | 12 | 0.1% |
| European | 243 | 1.1% |
| Finnish | 3 | 0.0% |
| French | 210 | 1.0% |
| French Canadian | 74 | 0.3% |
| German | 1,589 | 7.2% |
| Greek | 18 | 0.1% |
| Guatemalan | 135 | 0.6% |
| Honduran | 23 | 0.1% |
| Hungarian | 47 | 0.2% |
| Indian (Asian) | 46 | 0.2% |
| Irish | 1,372 | 6.3% |
| Italian | 688 | 3.1% |
| Jamaican | 42 | 0.2% |
| Korean | 169 | 0.8% |
| Lebanese | 36 | 0.2% |
| Lithuanian | 3 | 0.0% |
| Malaysian | 81 | 0.4% |
| Mexican | 258 | 1.2% |
| Mexican American Indian | 51 | 0.2% |
| Nigerian | 49 | 0.2% |
| Norwegian | 138 | 0.6% |
| Pakistani | 11 | 0.1% |
| Polish | 381 | 1.7% |
| Portuguese | 23 | 0.1% |
| Puerto Rican | 114 | 0.5% |
| Romanian | 5 | 0.0% |
| Russian | 36 | 0.2% |
| Salvadoran | 46 | 0.2% |
| Scotch-Irish | 281 | 1.3% |
| Scottish | 329 | 1.5% |
| Slovak | 29 | 0.1% |
| South American | 116 | 0.5% |
| Spaniard | 4 | 0.0% |
| Sri Lankan | 6 | 0.0% |
| Subsaharan African | 471 | 2.1% |
| Swedish | 96 | 0.4% |
| Swiss | 98 | 0.4% |
| Thai | 23 | 0.1% |
| Trinidadian and Tobagonian | 23 | 0.1% |
| Ukrainian | 16 | 0.1% |
| Welsh | 27 | 0.1% |
| West Indian | 23 | 0.1% | View All 65 Rows |
Immigrants in Prince Edward County
The most numerous immigrant groups reported in Prince Edward County came from Latin America (446 | 2.0%), Central America (316 | 1.4%), Asia (123 | 0.6%), Europe (103 | 0.5%), and Guatemala (97 | 0.4%), together accounting for 4.9% of all Prince Edward County residents.
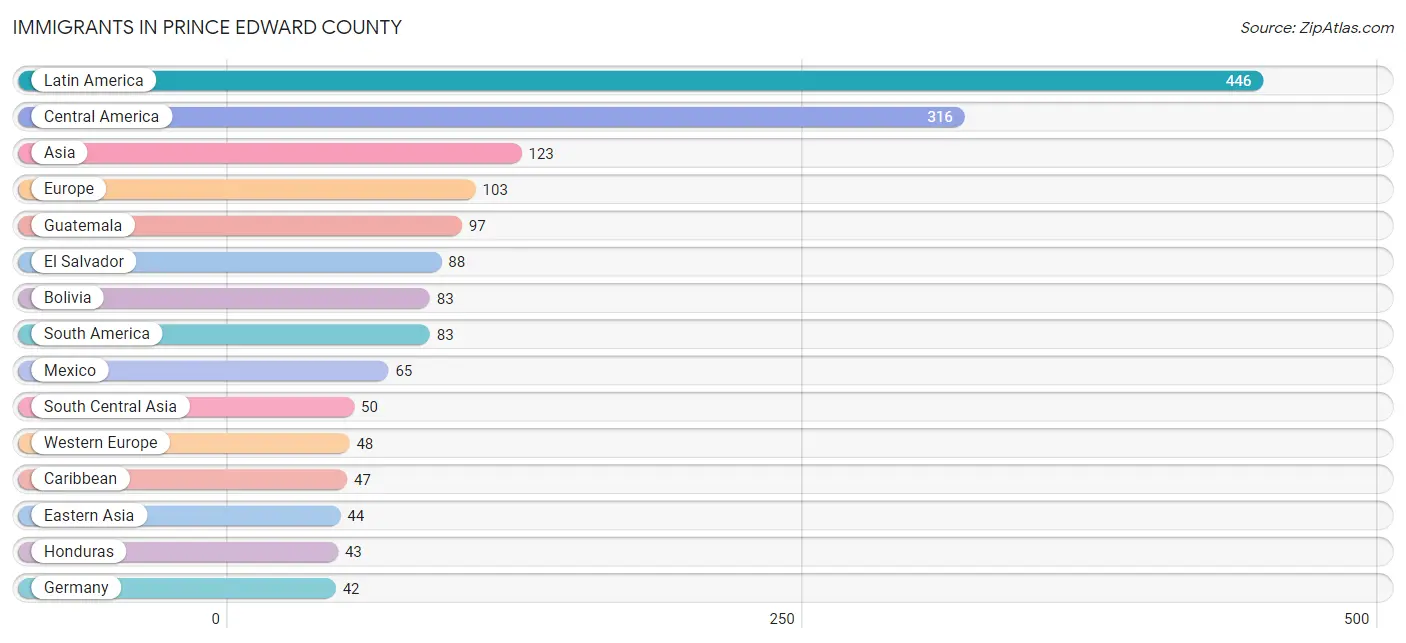
| Immigration Origin | # Population | % Population |
| Africa | 34 | 0.2% |
| Asia | 123 | 0.6% |
| Belgium | 6 | 0.0% |
| Bolivia | 83 | 0.4% |
| Canada | 7 | 0.0% |
| Caribbean | 47 | 0.2% |
| Central America | 316 | 1.4% |
| China | 29 | 0.1% |
| Eastern Africa | 12 | 0.1% |
| Eastern Asia | 44 | 0.2% |
| Eastern Europe | 18 | 0.1% |
| El Salvador | 88 | 0.4% |
| Ethiopia | 12 | 0.1% |
| Europe | 103 | 0.5% |
| Germany | 42 | 0.2% |
| Guatemala | 97 | 0.4% |
| Honduras | 43 | 0.2% |
| India | 36 | 0.2% |
| Ireland | 16 | 0.1% |
| Jamaica | 24 | 0.1% |
| Japan | 15 | 0.1% |
| Kazakhstan | 7 | 0.0% |
| Latin America | 446 | 2.0% |
| Lebanon | 11 | 0.1% |
| Mexico | 65 | 0.3% |
| Nicaragua | 23 | 0.1% |
| Nigeria | 10 | 0.1% |
| Northern Africa | 12 | 0.1% |
| Northern Europe | 37 | 0.2% |
| Pakistan | 7 | 0.0% |
| Philippines | 13 | 0.1% |
| Russia | 10 | 0.1% |
| Scotland | 12 | 0.1% |
| South America | 83 | 0.4% |
| South Central Asia | 50 | 0.2% |
| South Eastern Asia | 13 | 0.1% |
| Taiwan | 14 | 0.1% |
| Trinidad and Tobago | 23 | 0.1% |
| Turkey | 5 | 0.0% |
| Ukraine | 8 | 0.0% |
| Western Africa | 10 | 0.1% |
| Western Asia | 16 | 0.1% |
| Western Europe | 48 | 0.2% | View All 43 Rows |
Sex and Age in Prince Edward County
Sex and Age in Prince Edward County
The most populous age groups in Prince Edward County are 20 to 24 Years (2,093 | 18.3%) for men and 20 to 24 Years (1,390 | 13.3%) for women.
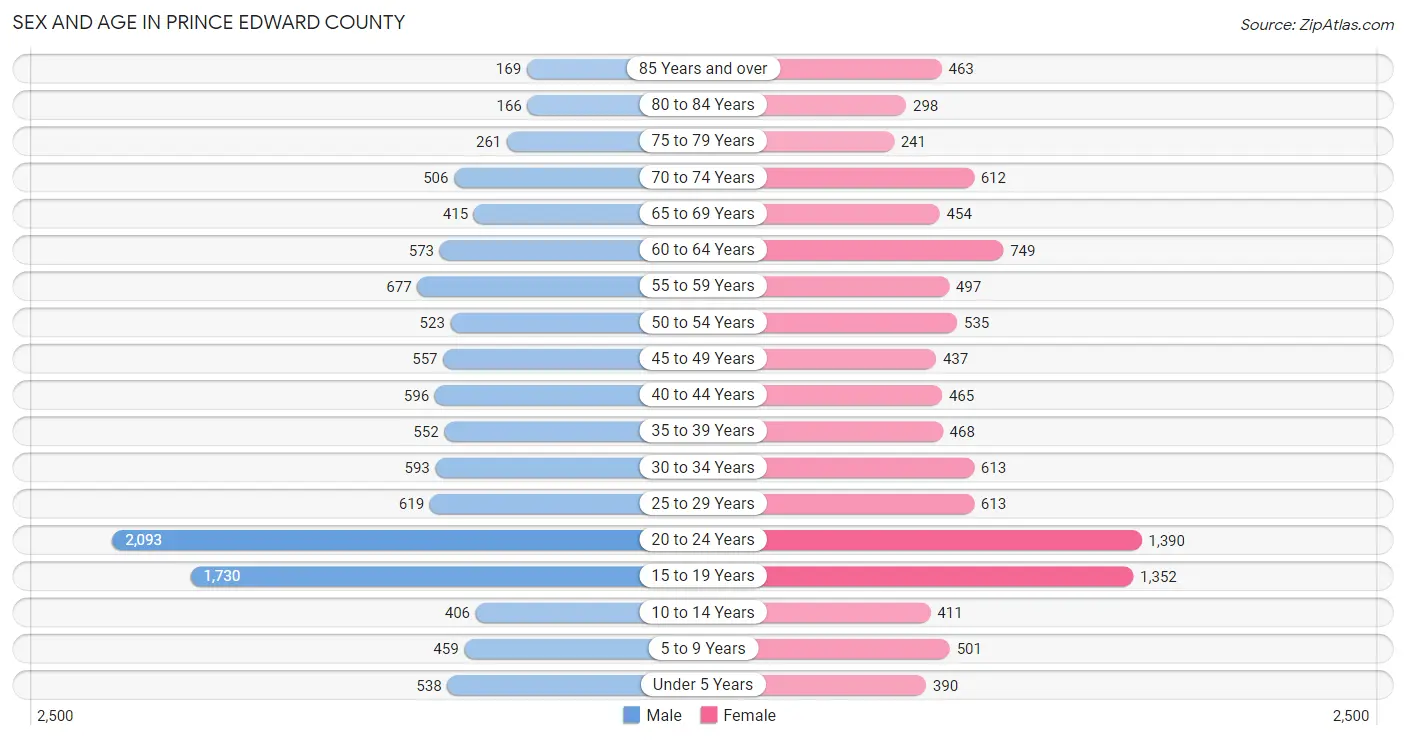
| Age Bracket | Male | Female |
| Under 5 Years | 538 (4.7%) | 390 (3.7%) |
| 5 to 9 Years | 459 (4.0%) | 501 (4.8%) |
| 10 to 14 Years | 406 (3.5%) | 411 (3.9%) |
| 15 to 19 Years | 1,730 (15.1%) | 1,352 (12.9%) |
| 20 to 24 Years | 2,093 (18.3%) | 1,390 (13.3%) |
| 25 to 29 Years | 619 (5.4%) | 613 (5.8%) |
| 30 to 34 Years | 593 (5.2%) | 613 (5.8%) |
| 35 to 39 Years | 552 (4.8%) | 468 (4.5%) |
| 40 to 44 Years | 596 (5.2%) | 465 (4.4%) |
| 45 to 49 Years | 557 (4.9%) | 437 (4.2%) |
| 50 to 54 Years | 523 (4.6%) | 535 (5.1%) |
| 55 to 59 Years | 677 (5.9%) | 497 (4.7%) |
| 60 to 64 Years | 573 (5.0%) | 749 (7.1%) |
| 65 to 69 Years | 415 (3.6%) | 454 (4.3%) |
| 70 to 74 Years | 506 (4.4%) | 612 (5.8%) |
| 75 to 79 Years | 261 (2.3%) | 241 (2.3%) |
| 80 to 84 Years | 166 (1.5%) | 298 (2.8%) |
| 85 Years and over | 169 (1.5%) | 463 (4.4%) |
| Total | 11,433 (100.0%) | 10,489 (100.0%) |
Families and Households in Prince Edward County
Median Family Size in Prince Edward County
The median family size in Prince Edward County is 2.79 persons per family, with married-couple families (2,993 | 68.0%) accounting for the largest median family size of 2.93 persons per family. On the other hand, single male/father families (553 | 12.6%) represent the smallest median family size with 2.28 persons per family.
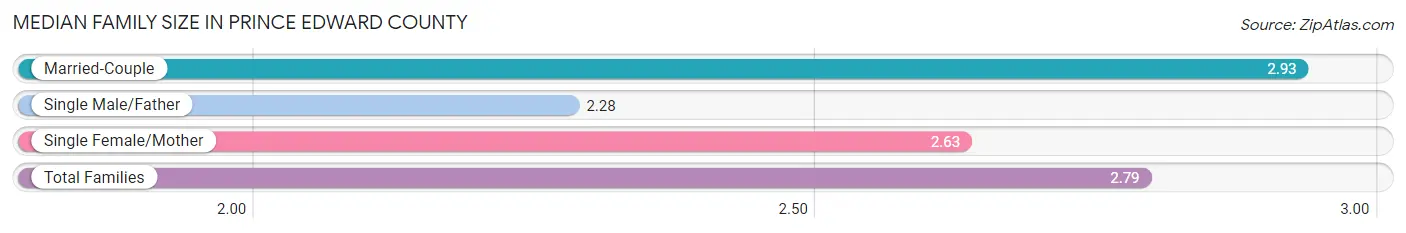
| Family Type | # Families | Family Size |
| Married-Couple | 2,993 (68.0%) | 2.93 |
| Single Male/Father | 553 (12.6%) | 2.28 |
| Single Female/Mother | 853 (19.4%) | 2.63 |
| Total Families | 4,399 (100.0%) | 2.79 |
Median Household Size in Prince Edward County
The median household size in Prince Edward County is 2.25 persons per household, with married-couple households (2,993 | 40.4%) accounting for the largest median household size of 2.96 persons per household. non-family households (3,017 | 40.7%) represent the smallest median household size with 1.35 persons per household.
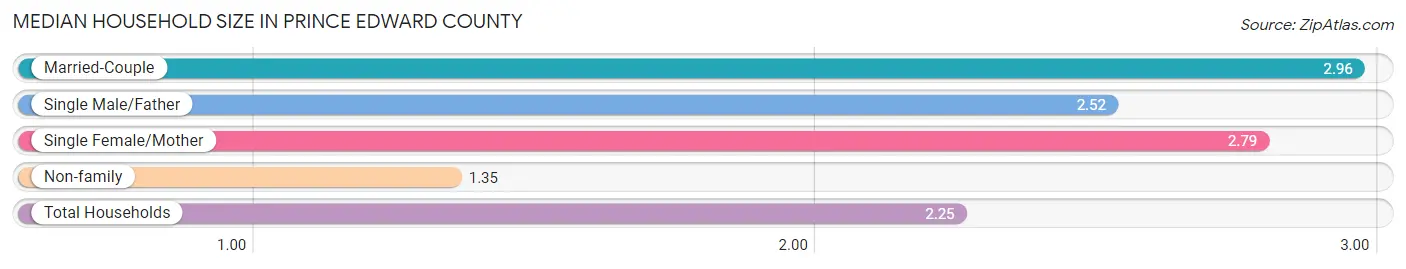
| Household Type | # Households | Household Size |
| Married-Couple | 2,993 (40.4%) | 2.96 |
| Single Male/Father | 553 (7.5%) | 2.52 |
| Single Female/Mother | 853 (11.5%) | 2.79 |
| Non-family | 3,017 (40.7%) | 1.35 |
| Total Households | 7,416 (100.0%) | 2.25 |
Household Size by Marriage Status in Prince Edward County
Out of a total of 7,416 households in Prince Edward County, 4,399 (59.3%) are family households, while 3,017 (40.7%) are nonfamily households. The most numerous type of family households are 2-person households, comprising 1,917, and the most common type of nonfamily households are 1-person households, comprising 2,260.
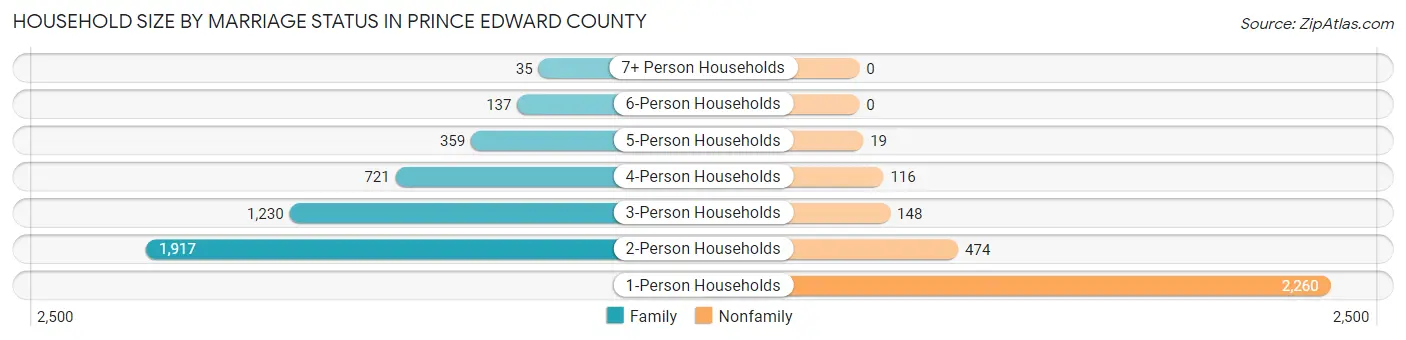
| Household Size | Family Households | Nonfamily Households |
| 1-Person Households | - | 2,260 (30.5%) |
| 2-Person Households | 1,917 (25.9%) | 474 (6.4%) |
| 3-Person Households | 1,230 (16.6%) | 148 (2.0%) |
| 4-Person Households | 721 (9.7%) | 116 (1.6%) |
| 5-Person Households | 359 (4.8%) | 19 (0.3%) |
| 6-Person Households | 137 (1.8%) | 0 (0.0%) |
| 7+ Person Households | 35 (0.5%) | 0 (0.0%) |
| Total | 4,399 (59.3%) | 3,017 (40.7%) |
Female Fertility in Prince Edward County
Fertility by Age in Prince Edward County
Average fertility rate in Prince Edward County is 34.0 births per 1,000 women. Women in the age bracket of 20 to 34 years have the highest fertility rate with 62.0 births per 1,000 women. Women in the age bracket of 20 to 34 years acount for 87.5% of all women with births.
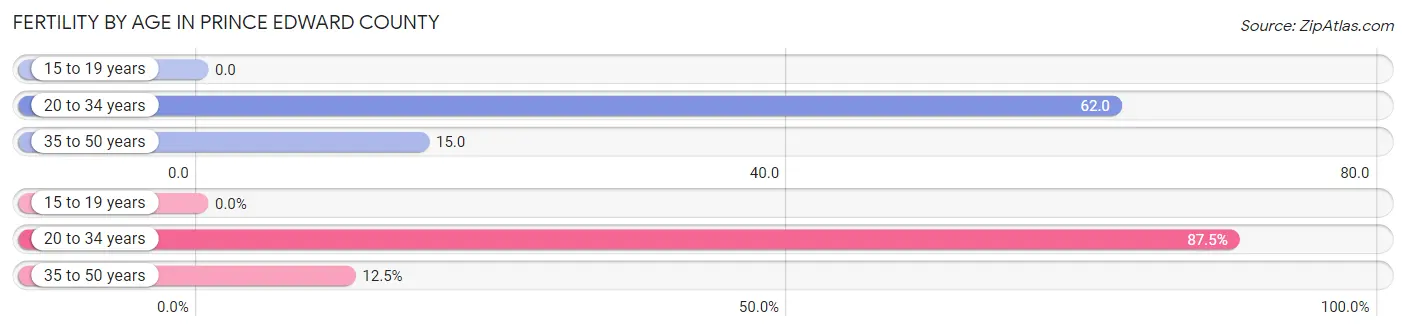
| Age Bracket | Women with Births | Births / 1,000 Women |
| 15 to 19 years | 0 (0.0%) | 0.0 |
| 20 to 34 years | 161 (87.5%) | 62.0 |
| 35 to 50 years | 23 (12.5%) | 15.0 |
| Total | 184 (100.0%) | 34.0 |
Fertility by Age by Marriage Status in Prince Edward County
39.1% of women with births (184) in Prince Edward County are married. The highest percentage of unmarried women with births falls into 20 to 34 years age bracket with 69.6% of them unmarried at the time of birth, while the lowest percentage of unmarried women with births belong to 35 to 50 years age bracket with 0.0% of them unmarried.
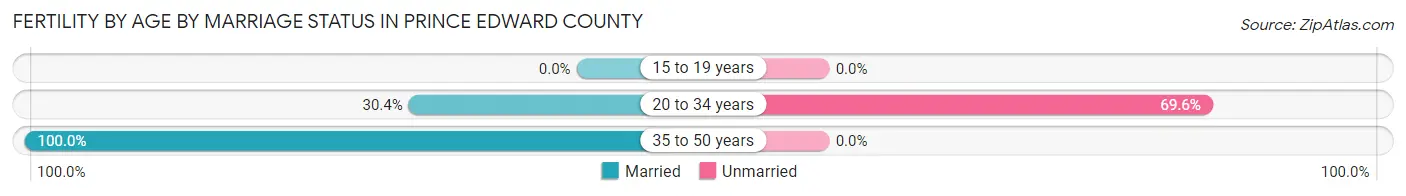
| Age Bracket | Married | Unmarried |
| 15 to 19 years | 0 (0.0%) | 0 (0.0%) |
| 20 to 34 years | 49 (30.4%) | 112 (69.6%) |
| 35 to 50 years | 23 (100.0%) | 0 (0.0%) |
| Total | 72 (39.1%) | 112 (60.9%) |
Fertility by Education in Prince Edward County
Average fertility rate in Prince Edward County is 34.0 births per 1,000 women. Women with the education attainment of graduate degree have the highest fertility rate of 87.0 births per 1,000 women, while women with the education attainment of college or associate's degree have the lowest fertility at 21.0 births per 1,000 women. Women with the education attainment of college or associate's degree represent 32.6% of all women with births.
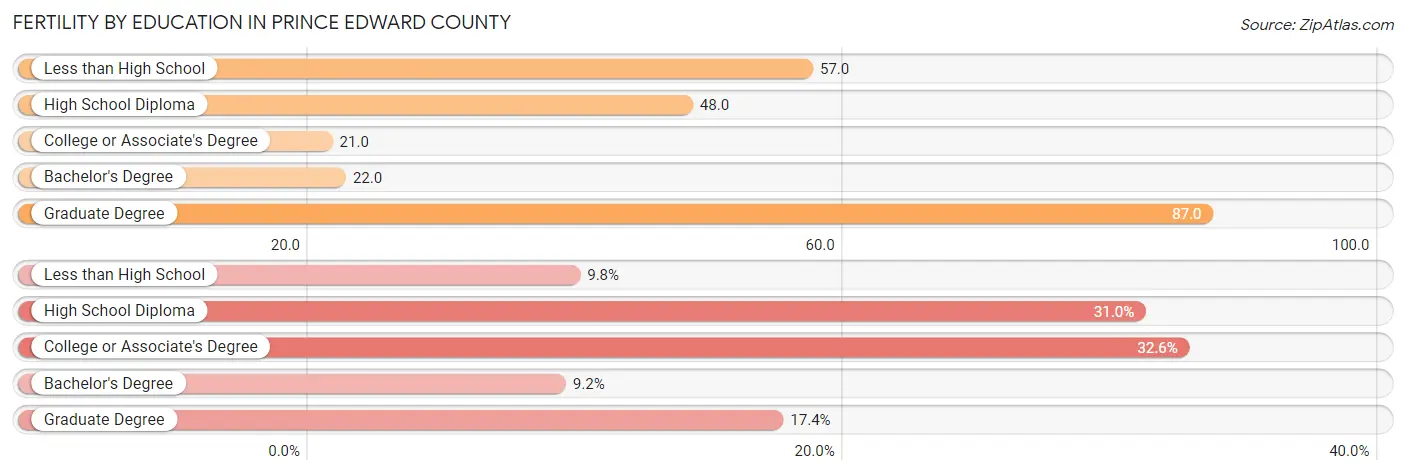
| Educational Attainment | Women with Births | Births / 1,000 Women |
| Less than High School | 18 (9.8%) | 57.0 |
| High School Diploma | 57 (31.0%) | 48.0 |
| College or Associate's Degree | 60 (32.6%) | 21.0 |
| Bachelor's Degree | 17 (9.2%) | 22.0 |
| Graduate Degree | 32 (17.4%) | 87.0 |
| Total | 184 (100.0%) | 34.0 |
Fertility by Education by Marriage Status in Prince Edward County
60.9% of women with births in Prince Edward County are unmarried. Women with the educational attainment of bachelor's degree are most likely to be married with 100.0% of them married at childbirth, while women with the educational attainment of less than high school are least likely to be married with 100.0% of them unmarried at childbirth.
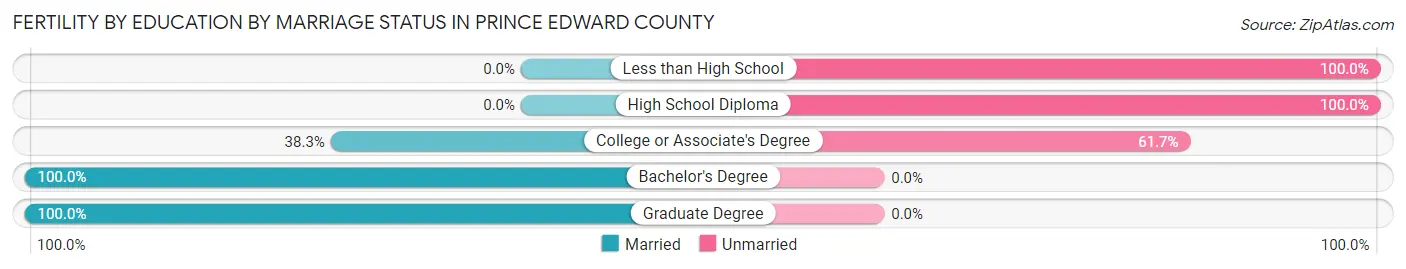
| Educational Attainment | Married | Unmarried |
| Less than High School | 0 (0.0%) | 18 (100.0%) |
| High School Diploma | 0 (0.0%) | 57 (100.0%) |
| College or Associate's Degree | 23 (38.3%) | 37 (61.7%) |
| Bachelor's Degree | 17 (100.0%) | 0 (0.0%) |
| Graduate Degree | 32 (100.0%) | 0 (0.0%) |
| Total | 72 (39.1%) | 112 (60.9%) |
Employment Characteristics in Prince Edward County
Employment by Class of Employer in Prince Edward County
Among the 8,237 employed individuals in Prince Edward County, private company employees (4,754 | 57.7%), state government employees (1,365 | 16.6%), and local government employees (725 | 8.8%) make up the most common classes of employment.
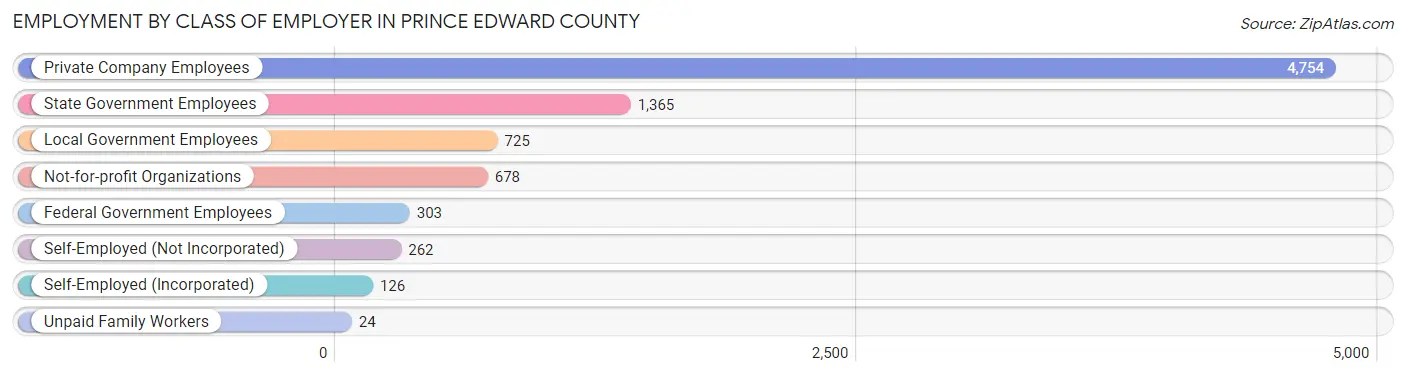
| Employer Class | # Employees | % Employees |
| Private Company Employees | 4,754 | 57.7% |
| Self-Employed (Incorporated) | 126 | 1.5% |
| Self-Employed (Not Incorporated) | 262 | 3.2% |
| Not-for-profit Organizations | 678 | 8.2% |
| Local Government Employees | 725 | 8.8% |
| State Government Employees | 1,365 | 16.6% |
| Federal Government Employees | 303 | 3.7% |
| Unpaid Family Workers | 24 | 0.3% |
| Total | 8,237 | 100.0% |
Employment Status by Age in Prince Edward County
According to the labor force statistics for Prince Edward County, out of the total population over 16 years of age (19,043), 46.4% or 8,836 individuals are in the labor force, with 2.4% or 212 of them unemployed. The age group with the highest labor force participation rate is 30 to 34 years, with 76.9% or 927 individuals in the labor force. Within the labor force, the 16 to 19 years age range has the highest percentage of unemployed individuals, with 11.7% or 110 of them being unemployed.
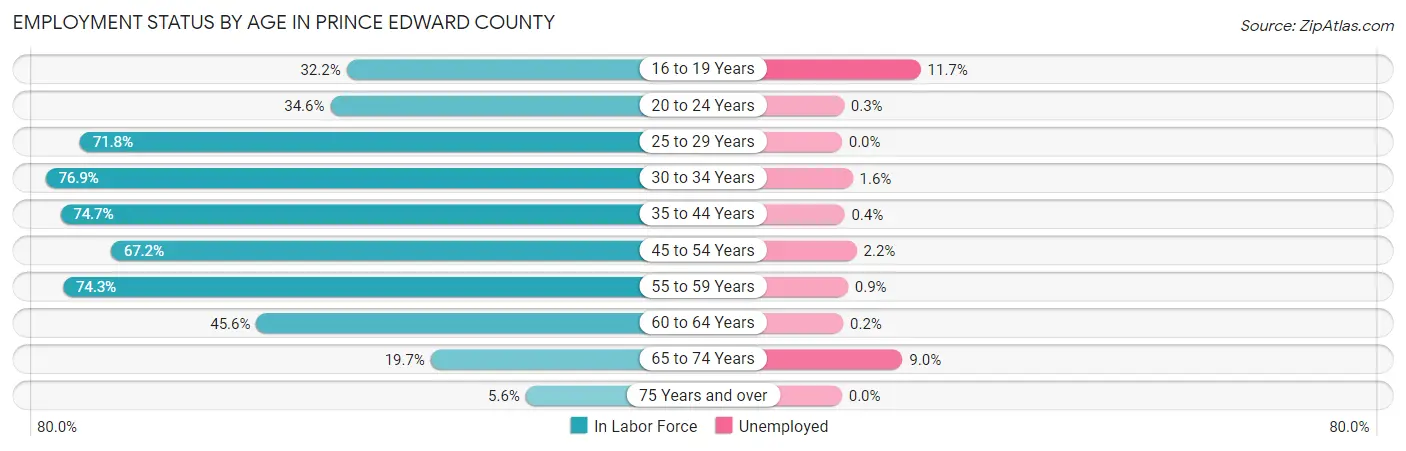
| Age Bracket | In Labor Force | Unemployed |
| 16 to 19 Years | 936 (32.2%) | 110 (11.7%) |
| 20 to 24 Years | 1,205 (34.6%) | 4 (0.3%) |
| 25 to 29 Years | 885 (71.8%) | 0 (0.0%) |
| 30 to 34 Years | 927 (76.9%) | 15 (1.6%) |
| 35 to 44 Years | 1,555 (74.7%) | 6 (0.4%) |
| 45 to 54 Years | 1,379 (67.2%) | 30 (2.2%) |
| 55 to 59 Years | 872 (74.3%) | 8 (0.9%) |
| 60 to 64 Years | 603 (45.6%) | 1 (0.2%) |
| 65 to 74 Years | 391 (19.7%) | 35 (9.0%) |
| 75 Years and over | 89 (5.6%) | 0 (0.0%) |
| Total | 8,836 (46.4%) | 212 (2.4%) |
Employment Status by Educational Attainment in Prince Edward County
According to labor force statistics for Prince Edward County, 68.6% of individuals (6,220) out of the total population between 25 and 64 years of age (9,067) are in the labor force, with 1.0% or 62 of them being unemployed. The group with the highest labor force participation rate are those with the educational attainment of bachelor's degree or higher, with 88.8% or 2,084 individuals in the labor force. Within the labor force, individuals with less than high school education have the highest percentage of unemployment, with 9.0% or 23 of them being unemployed.
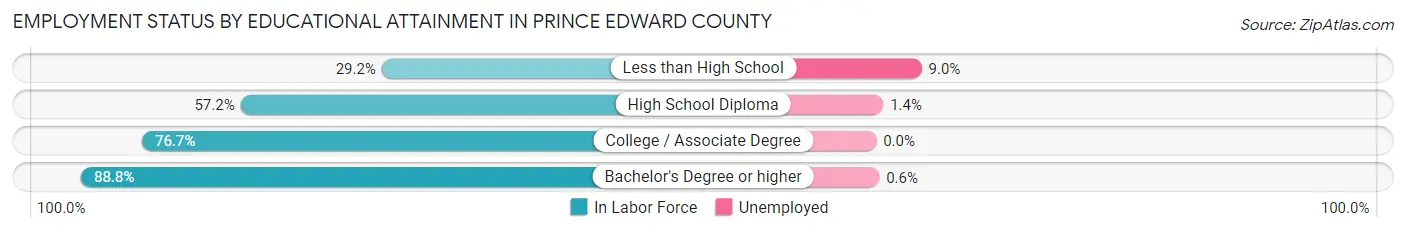
| Educational Attainment | In Labor Force | Unemployed |
| Less than High School | 255 (29.2%) | 79 (9.0%) |
| High School Diploma | 1,770 (57.2%) | 43 (1.4%) |
| College / Associate Degree | 2,111 (76.7%) | 0 (0.0%) |
| Bachelor's Degree or higher | 2,084 (88.8%) | 14 (0.6%) |
| Total | 6,220 (68.6%) | 91 (1.0%) |
Employment Occupations by Sex in Prince Edward County
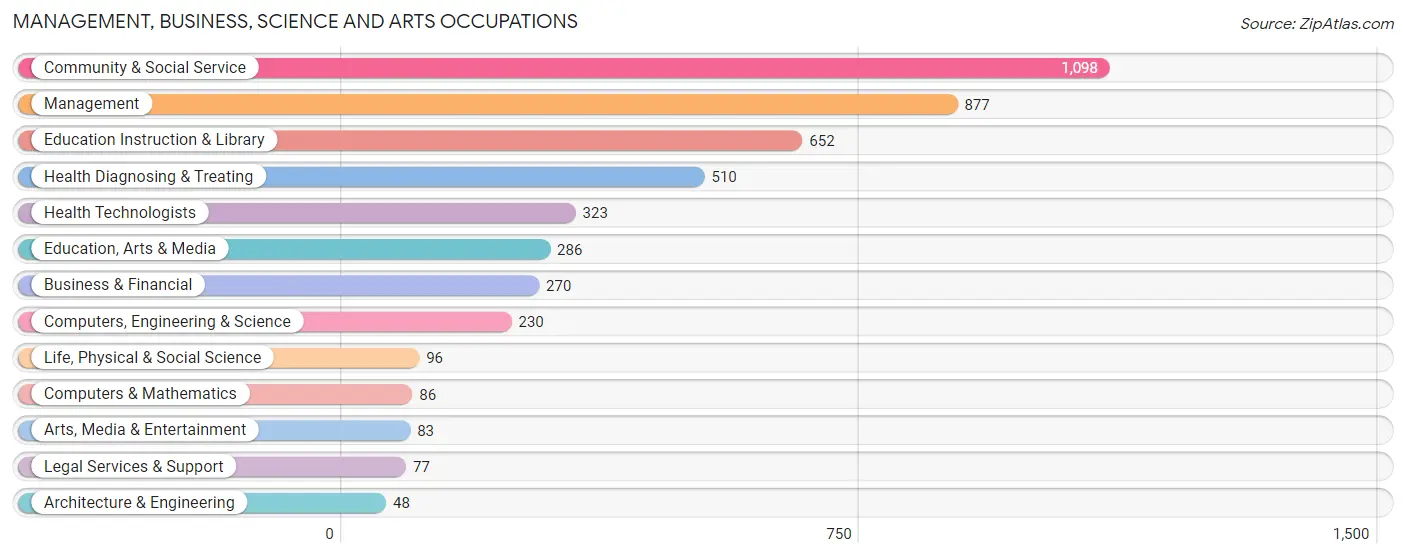
Management, Business, Science and Arts Occupations
The most common Management, Business, Science and Arts occupations in Prince Edward County are Community & Social Service (1,098 | 12.8%), Management (877 | 10.2%), Education Instruction & Library (652 | 7.6%), Health Diagnosing & Treating (510 | 5.9%), and Health Technologists (323 | 3.8%).
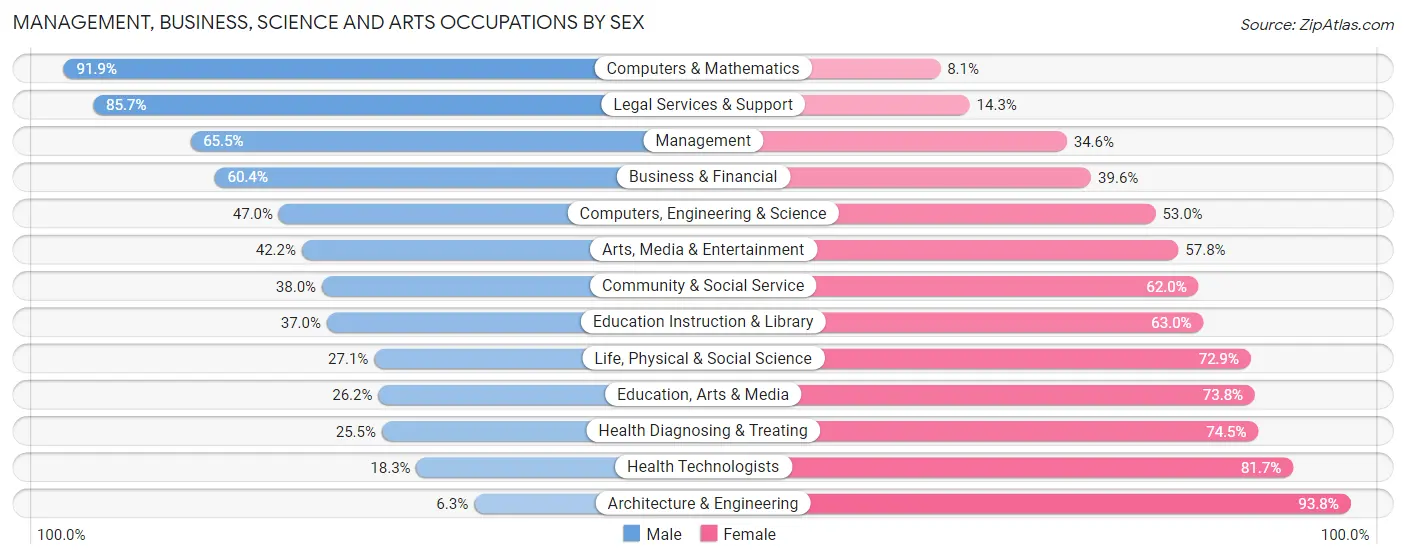
Management, Business, Science and Arts Occupations by Sex
Within the Management, Business, Science and Arts occupations in Prince Edward County, the most male-oriented occupations are Computers & Mathematics (91.9%), Legal Services & Support (85.7%), and Management (65.4%), while the most female-oriented occupations are Architecture & Engineering (93.8%), Health Technologists (81.7%), and Health Diagnosing & Treating (74.5%).
| Occupation | Male | Female |
| Management | 574 (65.4%) | 303 (34.5%) |
| Business & Financial | 163 (60.4%) | 107 (39.6%) |
| Computers, Engineering & Science | 108 (47.0%) | 122 (53.0%) |
| Computers & Mathematics | 79 (91.9%) | 7 (8.1%) |
| Architecture & Engineering | 3 (6.2%) | 45 (93.8%) |
| Life, Physical & Social Science | 26 (27.1%) | 70 (72.9%) |
| Community & Social Service | 417 (38.0%) | 681 (62.0%) |
| Education, Arts & Media | 75 (26.2%) | 211 (73.8%) |
| Legal Services & Support | 66 (85.7%) | 11 (14.3%) |
| Education Instruction & Library | 241 (37.0%) | 411 (63.0%) |
| Arts, Media & Entertainment | 35 (42.2%) | 48 (57.8%) |
| Health Diagnosing & Treating | 130 (25.5%) | 380 (74.5%) |
| Health Technologists | 59 (18.3%) | 264 (81.7%) |
| Total (Category) | 1,392 (46.6%) | 1,593 (53.4%) |
| Total (Overall) | 4,748 (55.3%) | 3,840 (44.7%) |
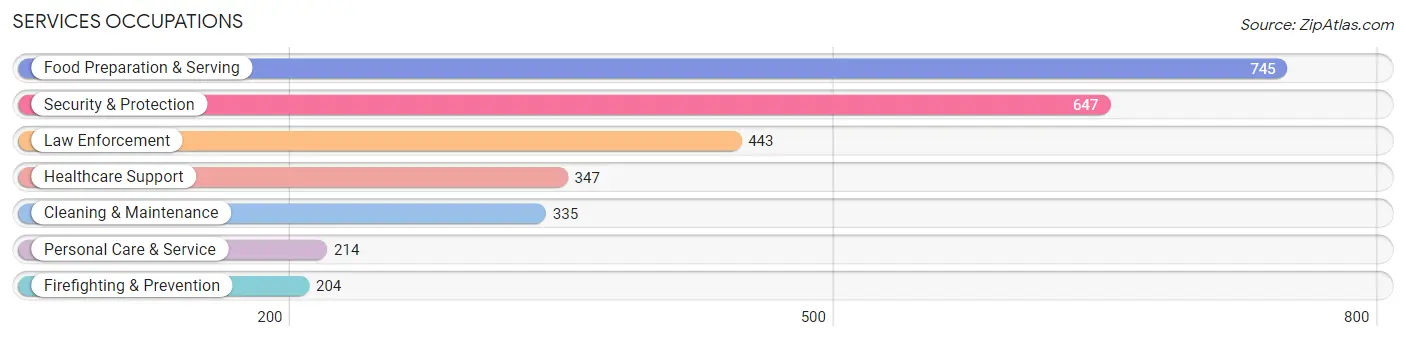
Services Occupations
The most common Services occupations in Prince Edward County are Food Preparation & Serving (745 | 8.7%), Security & Protection (647 | 7.5%), Law Enforcement (443 | 5.2%), Healthcare Support (347 | 4.0%), and Cleaning & Maintenance (335 | 3.9%).
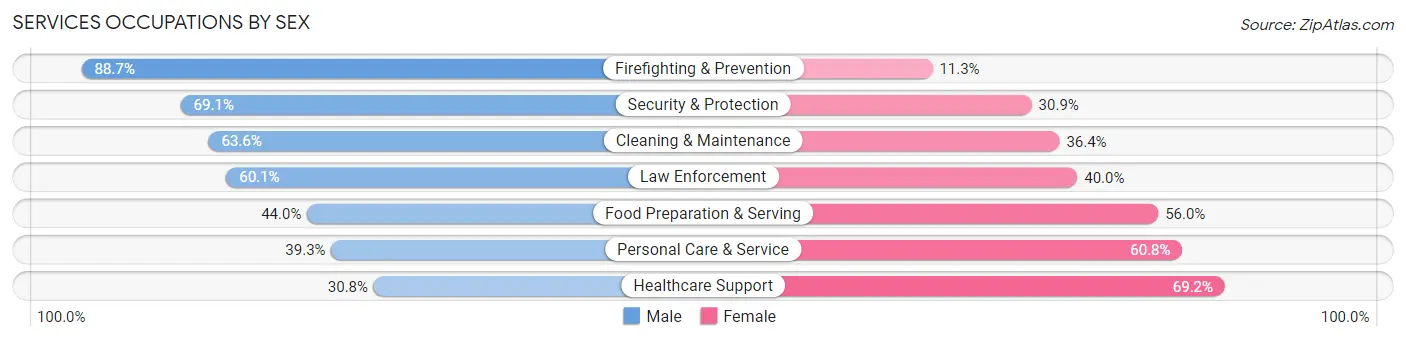
Services Occupations by Sex
Within the Services occupations in Prince Edward County, the most male-oriented occupations are Firefighting & Prevention (88.7%), Security & Protection (69.1%), and Cleaning & Maintenance (63.6%), while the most female-oriented occupations are Healthcare Support (69.2%), Personal Care & Service (60.8%), and Food Preparation & Serving (56.0%).
| Occupation | Male | Female |
| Healthcare Support | 107 (30.8%) | 240 (69.2%) |
| Security & Protection | 447 (69.1%) | 200 (30.9%) |
| Firefighting & Prevention | 181 (88.7%) | 23 (11.3%) |
| Law Enforcement | 266 (60.1%) | 177 (40.0%) |
| Food Preparation & Serving | 328 (44.0%) | 417 (56.0%) |
| Cleaning & Maintenance | 213 (63.6%) | 122 (36.4%) |
| Personal Care & Service | 84 (39.3%) | 130 (60.8%) |
| Total (Category) | 1,179 (51.5%) | 1,109 (48.5%) |
| Total (Overall) | 4,748 (55.3%) | 3,840 (44.7%) |
Sales and Office Occupations
The most common Sales and Office occupations in Prince Edward County are Sales & Related (884 | 10.3%), and Office & Administration (784 | 9.1%).
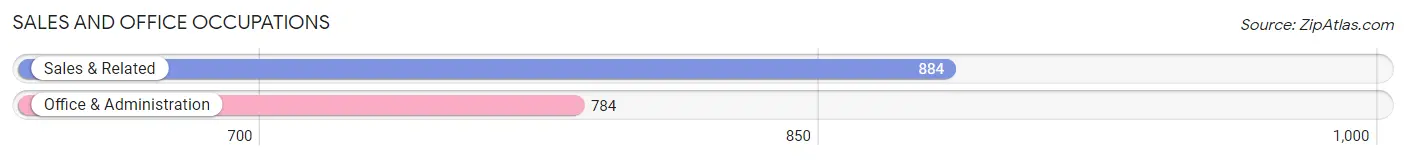
Sales and Office Occupations by Sex
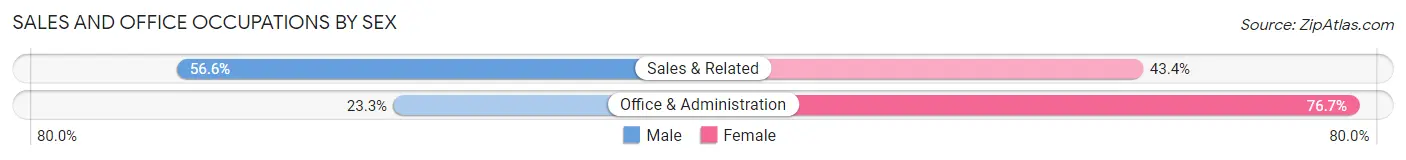
| Occupation | Male | Female |
| Sales & Related | 500 (56.6%) | 384 (43.4%) |
| Office & Administration | 183 (23.3%) | 601 (76.7%) |
| Total (Category) | 683 (40.9%) | 985 (59.1%) |
| Total (Overall) | 4,748 (55.3%) | 3,840 (44.7%) |
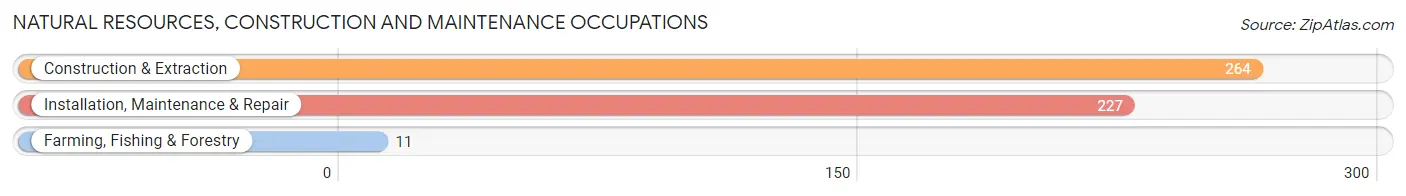
Natural Resources, Construction and Maintenance Occupations
The most common Natural Resources, Construction and Maintenance occupations in Prince Edward County are Construction & Extraction (264 | 3.1%), Installation, Maintenance & Repair (227 | 2.6%), and Farming, Fishing & Forestry (11 | 0.1%).
Natural Resources, Construction and Maintenance Occupations by Sex
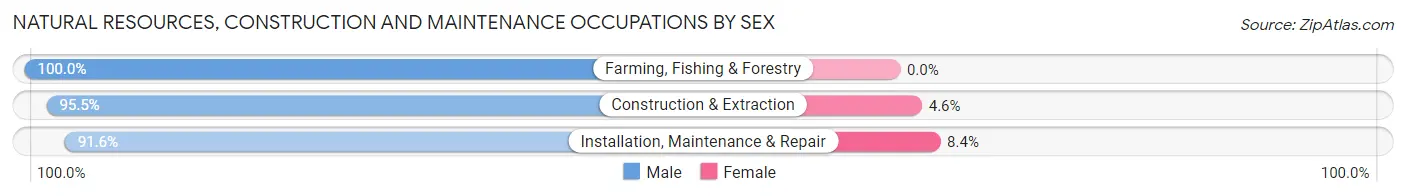
| Occupation | Male | Female |
| Farming, Fishing & Forestry | 11 (100.0%) | 0 (0.0%) |
| Construction & Extraction | 252 (95.5%) | 12 (4.5%) |
| Installation, Maintenance & Repair | 208 (91.6%) | 19 (8.4%) |
| Total (Category) | 471 (93.8%) | 31 (6.2%) |
| Total (Overall) | 4,748 (55.3%) | 3,840 (44.7%) |
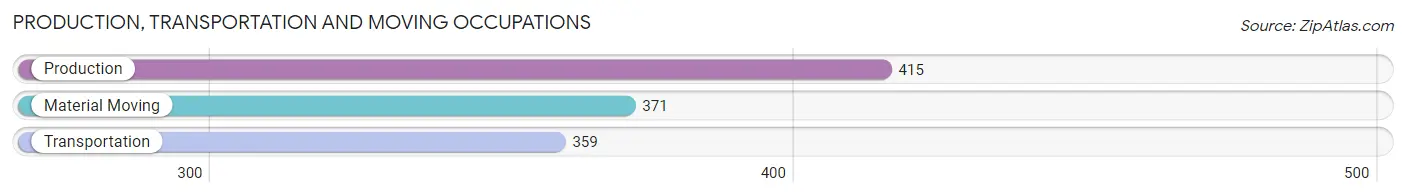
Production, Transportation and Moving Occupations
The most common Production, Transportation and Moving occupations in Prince Edward County are Production (415 | 4.8%), Material Moving (371 | 4.3%), and Transportation (359 | 4.2%).
Production, Transportation and Moving Occupations by Sex
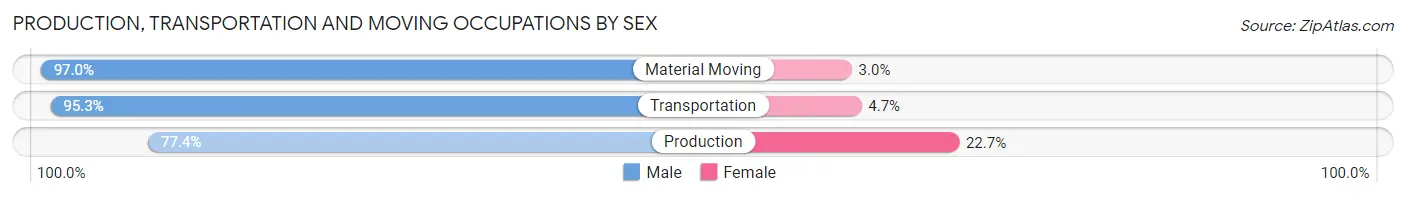
| Occupation | Male | Female |
| Production | 321 (77.3%) | 94 (22.7%) |
| Transportation | 342 (95.3%) | 17 (4.7%) |
| Material Moving | 360 (97.0%) | 11 (3.0%) |
| Total (Category) | 1,023 (89.3%) | 122 (10.7%) |
| Total (Overall) | 4,748 (55.3%) | 3,840 (44.7%) |
Employment Industries by Sex in Prince Edward County
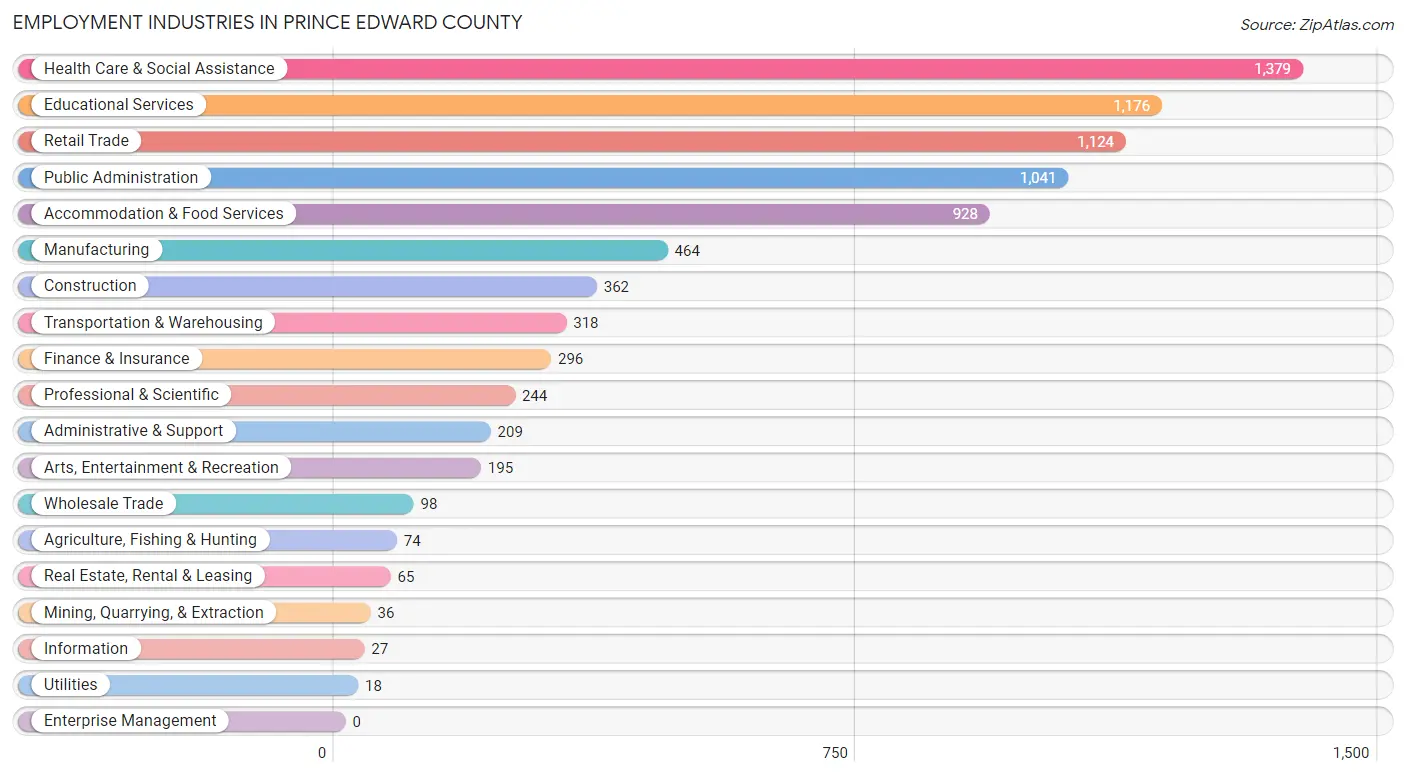
Employment Industries in Prince Edward County
The major employment industries in Prince Edward County include Health Care & Social Assistance (1,379 | 16.1%), Educational Services (1,176 | 13.7%), Retail Trade (1,124 | 13.1%), Public Administration (1,041 | 12.1%), and Accommodation & Food Services (928 | 10.8%).
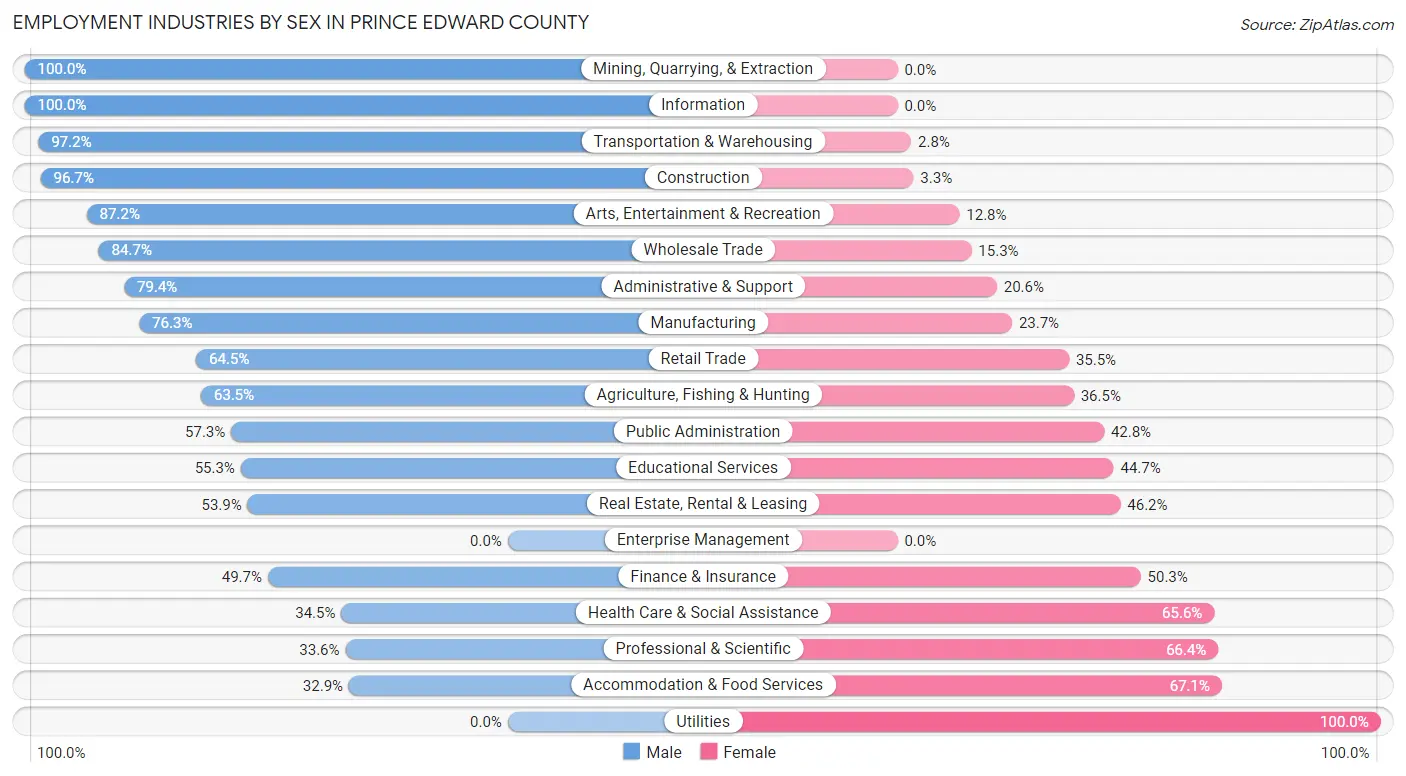
Employment Industries by Sex in Prince Edward County
The Prince Edward County industries that see more men than women are Mining, Quarrying, & Extraction (100.0%), Information (100.0%), and Transportation & Warehousing (97.2%), whereas the industries that tend to have a higher number of women are Utilities (100.0%), Accommodation & Food Services (67.1%), and Professional & Scientific (66.4%).
| Industry | Male | Female |
| Agriculture, Fishing & Hunting | 47 (63.5%) | 27 (36.5%) |
| Mining, Quarrying, & Extraction | 36 (100.0%) | 0 (0.0%) |
| Construction | 350 (96.7%) | 12 (3.3%) |
| Manufacturing | 354 (76.3%) | 110 (23.7%) |
| Wholesale Trade | 83 (84.7%) | 15 (15.3%) |
| Retail Trade | 725 (64.5%) | 399 (35.5%) |
| Transportation & Warehousing | 309 (97.2%) | 9 (2.8%) |
| Utilities | 0 (0.0%) | 18 (100.0%) |
| Information | 27 (100.0%) | 0 (0.0%) |
| Finance & Insurance | 147 (49.7%) | 149 (50.3%) |
| Real Estate, Rental & Leasing | 35 (53.8%) | 30 (46.2%) |
| Professional & Scientific | 82 (33.6%) | 162 (66.4%) |
| Enterprise Management | 0 (0.0%) | 0 (0.0%) |
| Administrative & Support | 166 (79.4%) | 43 (20.6%) |
| Educational Services | 650 (55.3%) | 526 (44.7%) |
| Health Care & Social Assistance | 475 (34.4%) | 904 (65.5%) |
| Arts, Entertainment & Recreation | 170 (87.2%) | 25 (12.8%) |
| Accommodation & Food Services | 305 (32.9%) | 623 (67.1%) |
| Public Administration | 596 (57.3%) | 445 (42.7%) |
| Total | 4,748 (55.3%) | 3,840 (44.7%) |
Education in Prince Edward County
School Enrollment in Prince Edward County
The most common levels of schooling among the 7,711 students in Prince Edward County are college / undergraduate (4,893 | 63.4%), high school (762 | 9.9%), and middle school (675 | 8.7%).
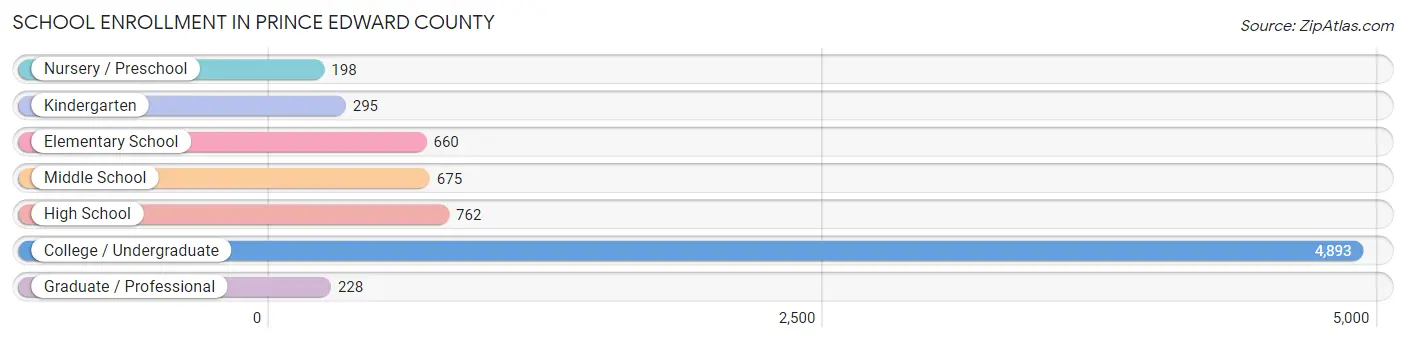
| School Level | # Students | % Students |
| Nursery / Preschool | 198 | 2.6% |
| Kindergarten | 295 | 3.8% |
| Elementary School | 660 | 8.6% |
| Middle School | 675 | 8.7% |
| High School | 762 | 9.9% |
| College / Undergraduate | 4,893 | 63.4% |
| Graduate / Professional | 228 | 3.0% |
| Total | 7,711 | 100.0% |
School Enrollment by Age by Funding Source in Prince Edward County
Out of a total of 7,711 students who are enrolled in schools in Prince Edward County, 1,959 (25.4%) attend a private institution, while the remaining 5,752 (74.6%) are enrolled in public schools. The age group of 3 to 4 year olds has the highest likelihood of being enrolled in private schools, with 105 (72.4% in the age bracket) enrolled. Conversely, the age group of 10 to 14 year olds has the lowest likelihood of being enrolled in a private school, with 655 (81.4% in the age bracket) attending a public institution.
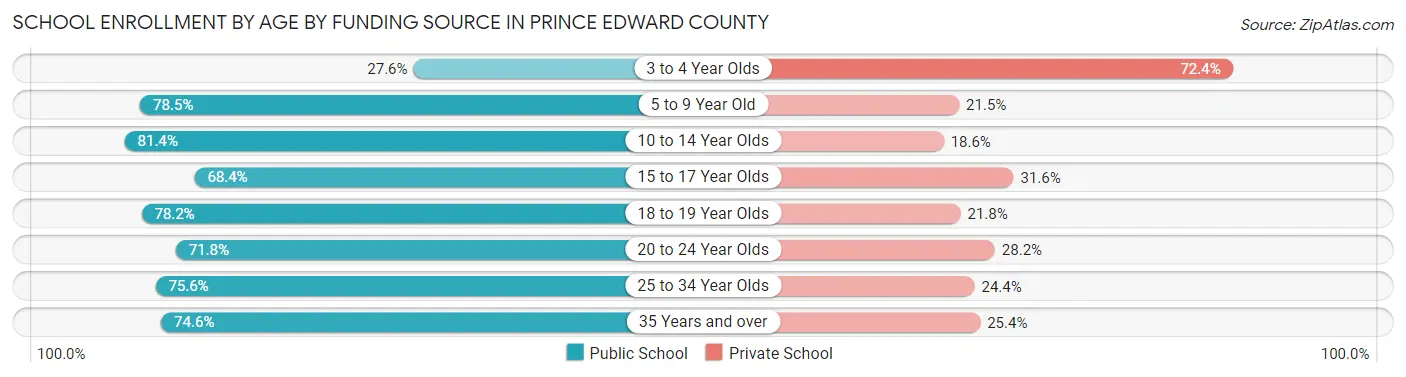
| Age Bracket | Public School | Private School |
| 3 to 4 Year Olds | 40 (27.6%) | 105 (72.4%) |
| 5 to 9 Year Old | 748 (78.5%) | 205 (21.5%) |
| 10 to 14 Year Olds | 655 (81.4%) | 150 (18.6%) |
| 15 to 17 Year Olds | 376 (68.4%) | 174 (31.6%) |
| 18 to 19 Year Olds | 1,739 (78.2%) | 484 (21.8%) |
| 20 to 24 Year Olds | 1,872 (71.8%) | 734 (28.2%) |
| 25 to 34 Year Olds | 152 (75.6%) | 49 (24.4%) |
| 35 Years and over | 170 (74.6%) | 58 (25.4%) |
| Total | 5,752 (74.6%) | 1,959 (25.4%) |
Educational Attainment by Field of Study in Prince Edward County
Business (730 | 20.5%), education (627 | 17.6%), science & technology (365 | 10.3%), arts & humanities (303 | 8.5%), and bio, nature & agricultural (260 | 7.3%) are the most common fields of study among 3,555 individuals in Prince Edward County who have obtained a bachelor's degree or higher.
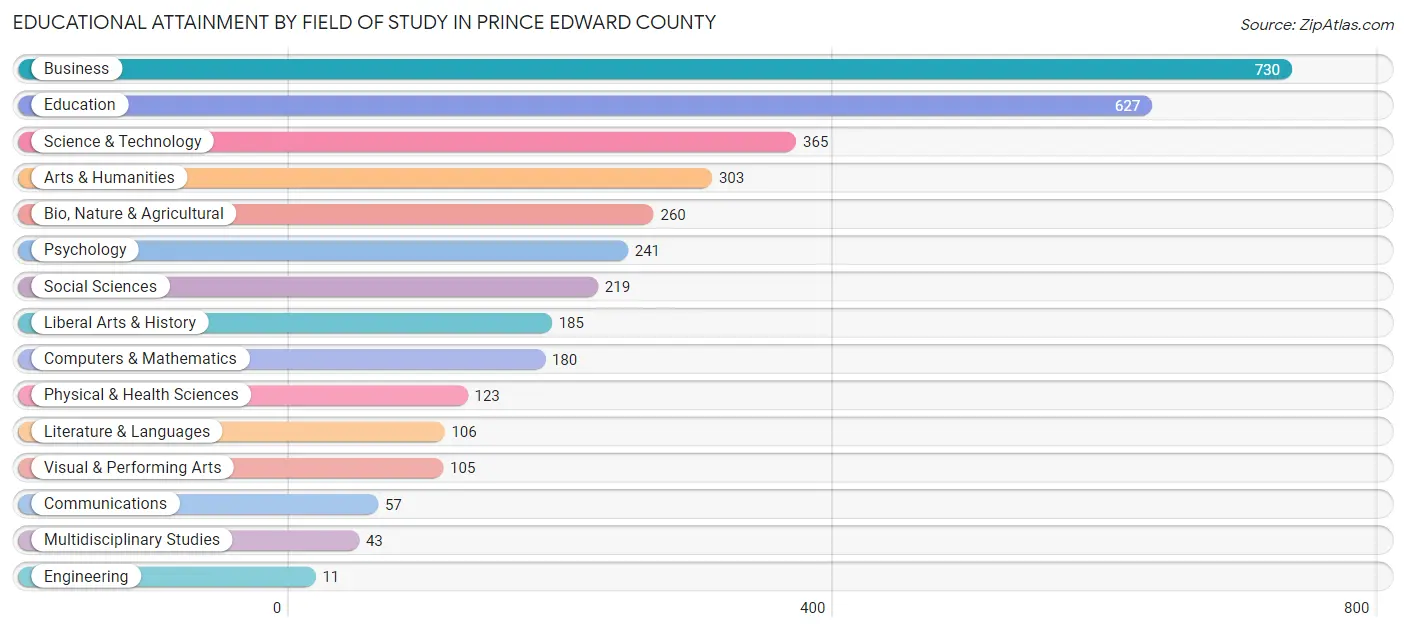
| Field of Study | # Graduates | % Graduates |
| Computers & Mathematics | 180 | 5.1% |
| Bio, Nature & Agricultural | 260 | 7.3% |
| Physical & Health Sciences | 123 | 3.5% |
| Psychology | 241 | 6.8% |
| Social Sciences | 219 | 6.2% |
| Engineering | 11 | 0.3% |
| Multidisciplinary Studies | 43 | 1.2% |
| Science & Technology | 365 | 10.3% |
| Business | 730 | 20.5% |
| Education | 627 | 17.6% |
| Literature & Languages | 106 | 3.0% |
| Liberal Arts & History | 185 | 5.2% |
| Visual & Performing Arts | 105 | 2.9% |
| Communications | 57 | 1.6% |
| Arts & Humanities | 303 | 8.5% |
| Total | 3,555 | 100.0% |
Transportation & Commute in Prince Edward County
Vehicle Availability by Sex in Prince Edward County
The most prevalent vehicle ownership categories in Prince Edward County are males with 2 vehicles (1,504, accounting for 37.5%) and females with 2 vehicles (1,390, making up 42.2%).
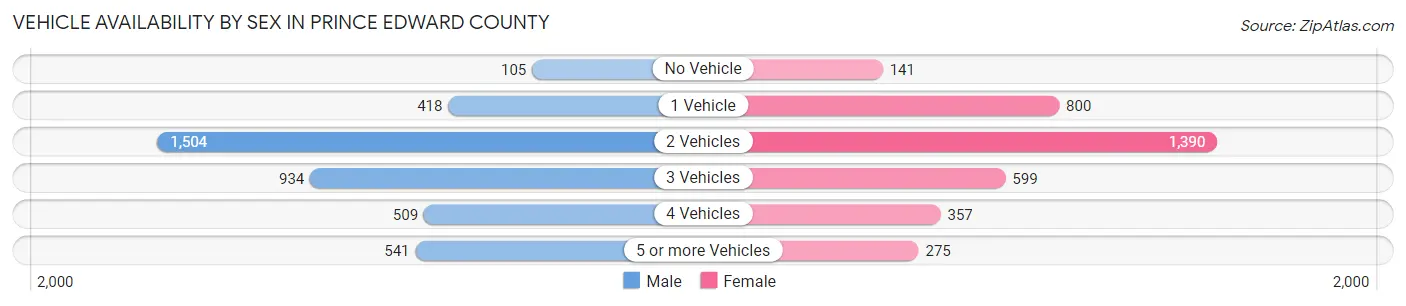
| Vehicles Available | Male | Female |
| No Vehicle | 105 (2.6%) | 141 (4.0%) |
| 1 Vehicle | 418 (10.4%) | 800 (22.5%) |
| 2 Vehicles | 1,504 (37.5%) | 1,390 (39.0%) |
| 3 Vehicles | 934 (23.3%) | 599 (16.8%) |
| 4 Vehicles | 509 (12.7%) | 357 (10.0%) |
| 5 or more Vehicles | 541 (13.5%) | 275 (7.7%) |
| Total | 4,011 (100.0%) | 3,562 (100.0%) |
Commute Time in Prince Edward County
The most frequently occuring commute durations in Prince Edward County are 15 to 19 minutes (1,241 commuters, 16.0%), 5 to 9 minutes (1,235 commuters, 16.0%), and 10 to 14 minutes (1,090 commuters, 14.1%).
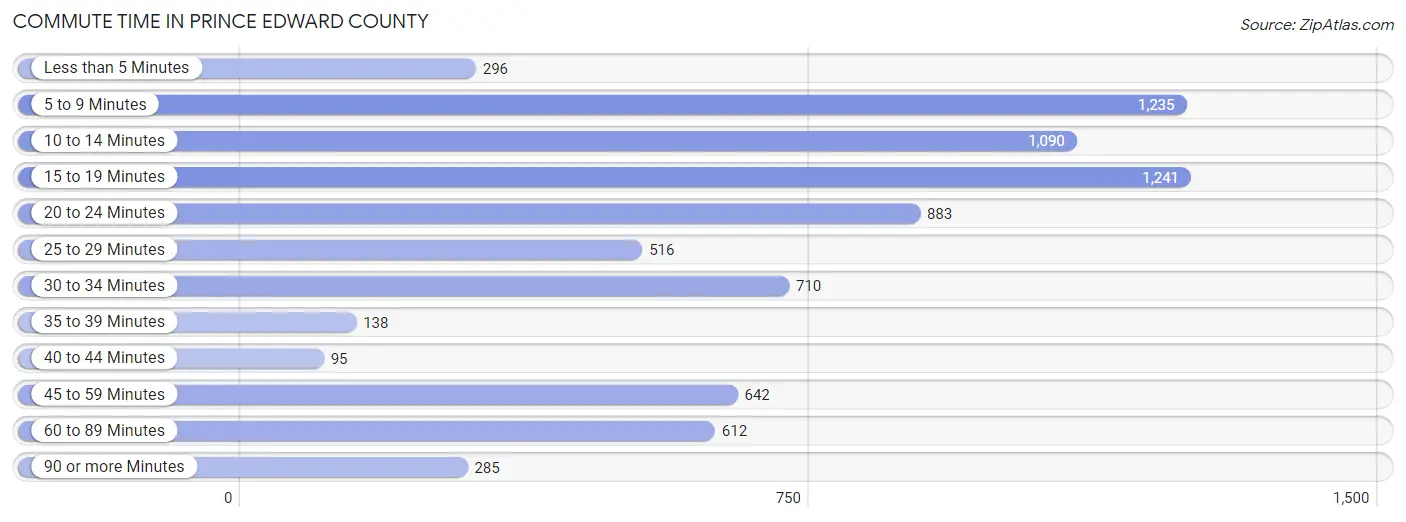
| Commute Time | # Commuters | % Commuters |
| Less than 5 Minutes | 296 | 3.8% |
| 5 to 9 Minutes | 1,235 | 16.0% |
| 10 to 14 Minutes | 1,090 | 14.1% |
| 15 to 19 Minutes | 1,241 | 16.0% |
| 20 to 24 Minutes | 883 | 11.4% |
| 25 to 29 Minutes | 516 | 6.7% |
| 30 to 34 Minutes | 710 | 9.2% |
| 35 to 39 Minutes | 138 | 1.8% |
| 40 to 44 Minutes | 95 | 1.2% |
| 45 to 59 Minutes | 642 | 8.3% |
| 60 to 89 Minutes | 612 | 7.9% |
| 90 or more Minutes | 285 | 3.7% |
Commute Time by Sex in Prince Edward County
The most common commute times in Prince Edward County are 5 to 9 minutes (728 commuters, 17.1%) for males and 15 to 19 minutes (587 commuters, 16.8%) for females.
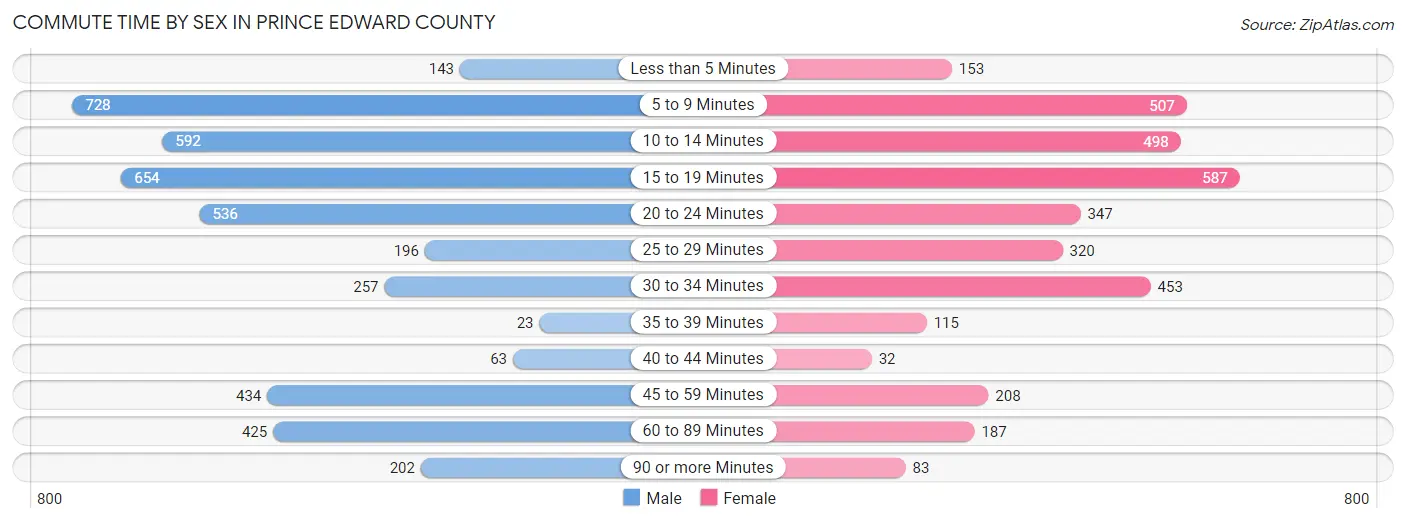
| Commute Time | Male | Female |
| Less than 5 Minutes | 143 (3.4%) | 153 (4.4%) |
| 5 to 9 Minutes | 728 (17.1%) | 507 (14.5%) |
| 10 to 14 Minutes | 592 (13.9%) | 498 (14.3%) |
| 15 to 19 Minutes | 654 (15.4%) | 587 (16.8%) |
| 20 to 24 Minutes | 536 (12.6%) | 347 (9.9%) |
| 25 to 29 Minutes | 196 (4.6%) | 320 (9.2%) |
| 30 to 34 Minutes | 257 (6.0%) | 453 (13.0%) |
| 35 to 39 Minutes | 23 (0.5%) | 115 (3.3%) |
| 40 to 44 Minutes | 63 (1.5%) | 32 (0.9%) |
| 45 to 59 Minutes | 434 (10.2%) | 208 (6.0%) |
| 60 to 89 Minutes | 425 (10.0%) | 187 (5.4%) |
| 90 or more Minutes | 202 (4.8%) | 83 (2.4%) |
Time of Departure to Work by Sex in Prince Edward County
The most frequent times of departure to work in Prince Edward County are 7:00 AM to 7:29 AM (752, 17.7%) for males and 6:00 AM to 6:29 AM (540, 15.5%) for females.
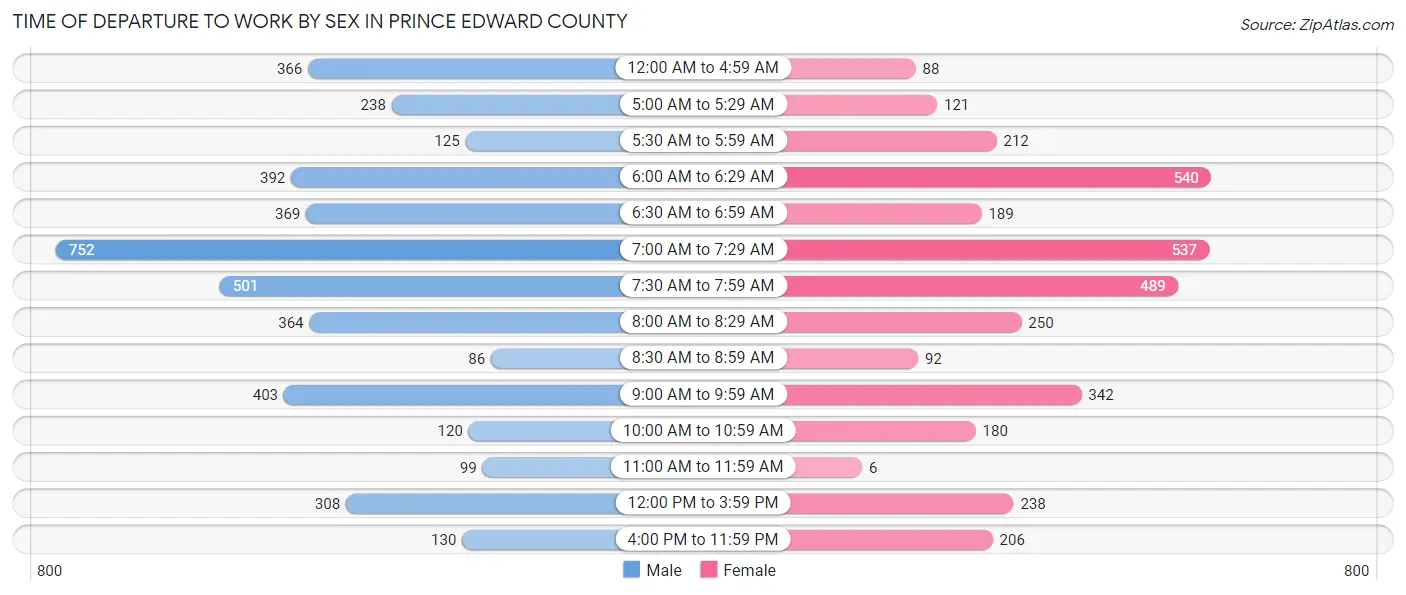
| Time of Departure | Male | Female |
| 12:00 AM to 4:59 AM | 366 (8.6%) | 88 (2.5%) |
| 5:00 AM to 5:29 AM | 238 (5.6%) | 121 (3.5%) |
| 5:30 AM to 5:59 AM | 125 (2.9%) | 212 (6.1%) |
| 6:00 AM to 6:29 AM | 392 (9.2%) | 540 (15.5%) |
| 6:30 AM to 6:59 AM | 369 (8.7%) | 189 (5.4%) |
| 7:00 AM to 7:29 AM | 752 (17.7%) | 537 (15.4%) |
| 7:30 AM to 7:59 AM | 501 (11.8%) | 489 (14.0%) |
| 8:00 AM to 8:29 AM | 364 (8.6%) | 250 (7.2%) |
| 8:30 AM to 8:59 AM | 86 (2.0%) | 92 (2.6%) |
| 9:00 AM to 9:59 AM | 403 (9.5%) | 342 (9.8%) |
| 10:00 AM to 10:59 AM | 120 (2.8%) | 180 (5.2%) |
| 11:00 AM to 11:59 AM | 99 (2.3%) | 6 (0.2%) |
| 12:00 PM to 3:59 PM | 308 (7.2%) | 238 (6.8%) |
| 4:00 PM to 11:59 PM | 130 (3.1%) | 206 (5.9%) |
| Total | 4,253 (100.0%) | 3,490 (100.0%) |
Housing Occupancy in Prince Edward County
Occupancy by Ownership in Prince Edward County
Of the total 7,416 dwellings in Prince Edward County, owner-occupied units account for 4,520 (61.0%), while renter-occupied units make up 2,896 (39.1%).
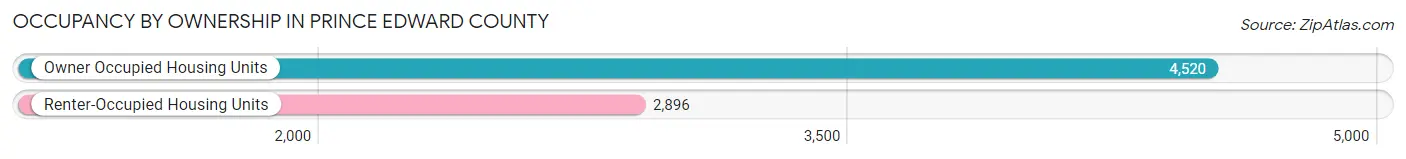
| Occupancy | # Housing Units | % Housing Units |
| Owner Occupied Housing Units | 4,520 | 61.0% |
| Renter-Occupied Housing Units | 2,896 | 39.1% |
| Total Occupied Housing Units | 7,416 | 100.0% |
Occupancy by Household Size in Prince Edward County
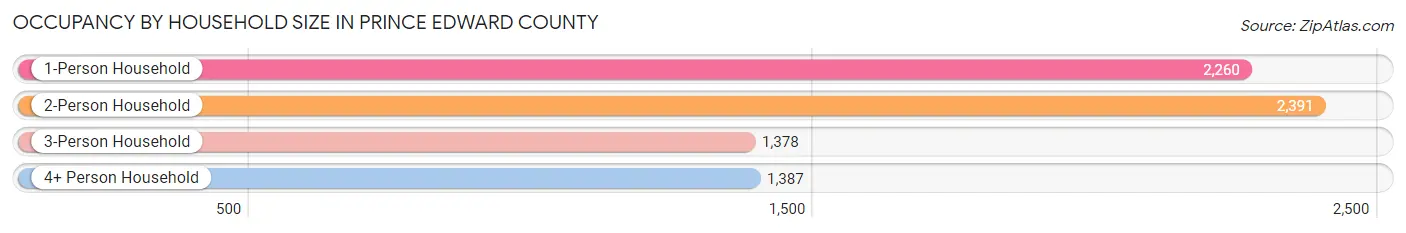
| Household Size | # Housing Units | % Housing Units |
| 1-Person Household | 2,260 | 30.5% |
| 2-Person Household | 2,391 | 32.2% |
| 3-Person Household | 1,378 | 18.6% |
| 4+ Person Household | 1,387 | 18.7% |
| Total Housing Units | 7,416 | 100.0% |
Occupancy by Ownership by Household Size in Prince Edward County
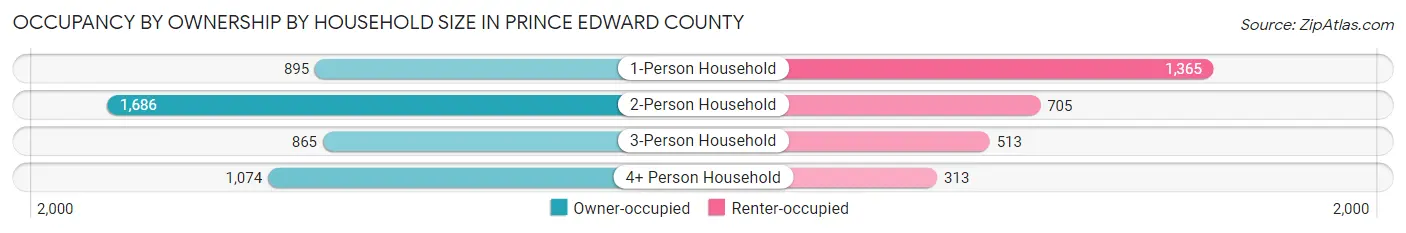
| Household Size | Owner-occupied | Renter-occupied |
| 1-Person Household | 895 (39.6%) | 1,365 (60.4%) |
| 2-Person Household | 1,686 (70.5%) | 705 (29.5%) |
| 3-Person Household | 865 (62.8%) | 513 (37.2%) |
| 4+ Person Household | 1,074 (77.4%) | 313 (22.6%) |
| Total Housing Units | 4,520 (61.0%) | 2,896 (39.1%) |
Occupancy by Educational Attainment in Prince Edward County
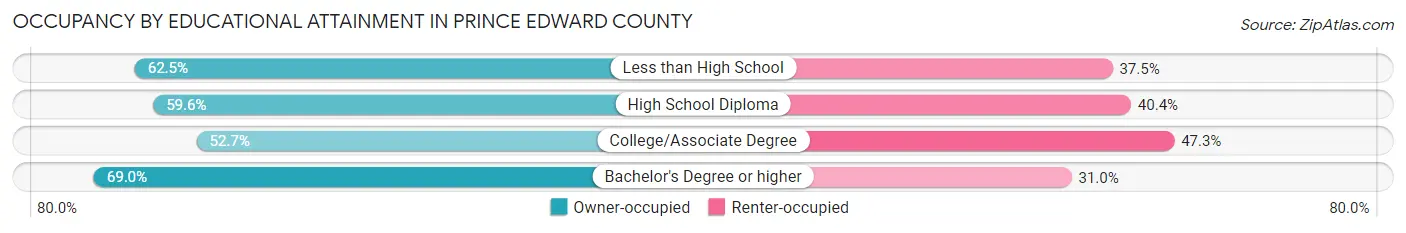
| Household Size | Owner-occupied | Renter-occupied |
| Less than High School | 382 (62.5%) | 229 (37.5%) |
| High School Diploma | 1,291 (59.6%) | 875 (40.4%) |
| College/Associate Degree | 1,148 (52.7%) | 1,029 (47.3%) |
| Bachelor's Degree or higher | 1,699 (69.0%) | 763 (31.0%) |
Occupancy by Age of Householder in Prince Edward County
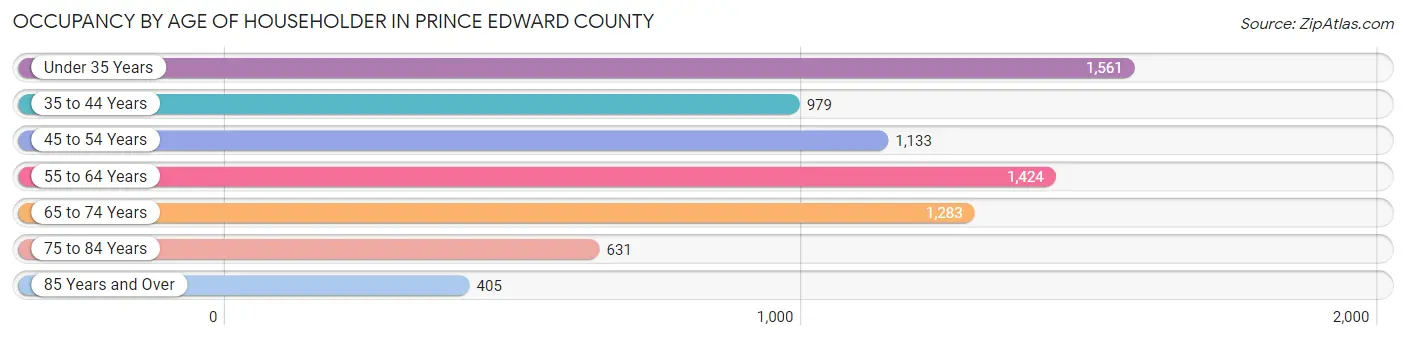
| Age Bracket | # Households | % Households |
| Under 35 Years | 1,561 | 21.0% |
| 35 to 44 Years | 979 | 13.2% |
| 45 to 54 Years | 1,133 | 15.3% |
| 55 to 64 Years | 1,424 | 19.2% |
| 65 to 74 Years | 1,283 | 17.3% |
| 75 to 84 Years | 631 | 8.5% |
| 85 Years and Over | 405 | 5.5% |
| Total | 7,416 | 100.0% |
Housing Finances in Prince Edward County
Median Income by Occupancy in Prince Edward County
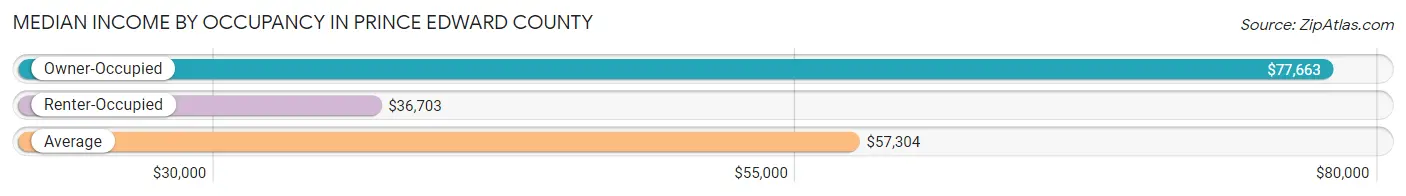
| Occupancy Type | # Households | Median Income |
| Owner-Occupied | 4,520 (61.0%) | $77,663 |
| Renter-Occupied | 2,896 (39.1%) | $36,703 |
| Average | 7,416 (100.0%) | $57,304 |
Occupancy by Householder Income Bracket in Prince Edward County
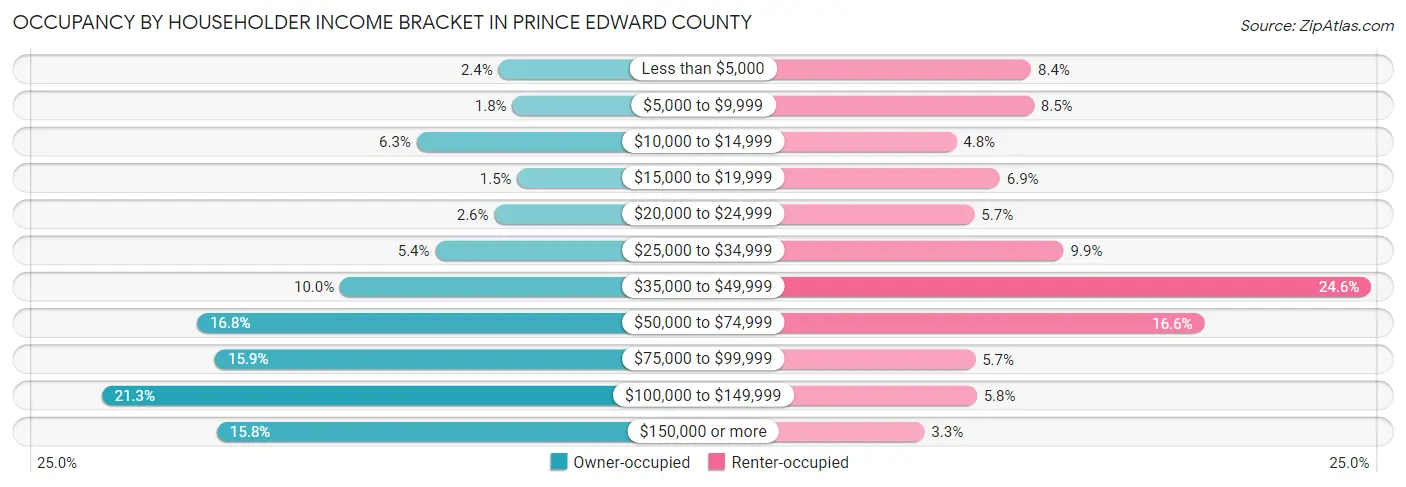
| Income Bracket | Owner-occupied | Renter-occupied |
| Less than $5,000 | 110 (2.4%) | 242 (8.4%) |
| $5,000 to $9,999 | 80 (1.8%) | 246 (8.5%) |
| $10,000 to $14,999 | 286 (6.3%) | 139 (4.8%) |
| $15,000 to $19,999 | 69 (1.5%) | 199 (6.9%) |
| $20,000 to $24,999 | 119 (2.6%) | 164 (5.7%) |
| $25,000 to $34,999 | 246 (5.4%) | 287 (9.9%) |
| $35,000 to $49,999 | 451 (10.0%) | 711 (24.5%) |
| $50,000 to $74,999 | 759 (16.8%) | 481 (16.6%) |
| $75,000 to $99,999 | 720 (15.9%) | 165 (5.7%) |
| $100,000 to $149,999 | 964 (21.3%) | 167 (5.8%) |
| $150,000 or more | 716 (15.8%) | 95 (3.3%) |
| Total | 4,520 (100.0%) | 2,896 (100.0%) |
Monthly Housing Cost Tiers in Prince Edward County
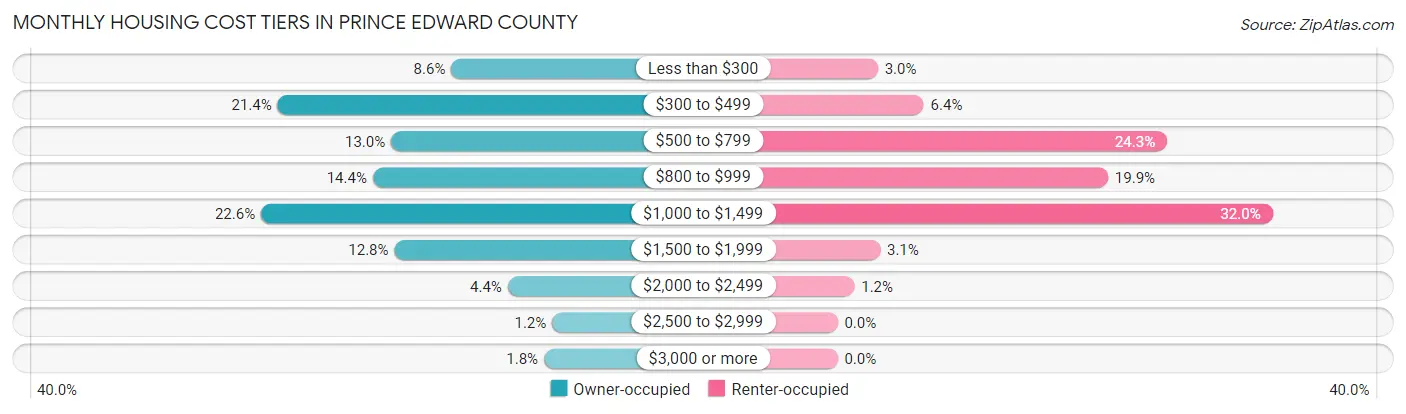
| Monthly Cost | Owner-occupied | Renter-occupied |
| Less than $300 | 388 (8.6%) | 86 (3.0%) |
| $300 to $499 | 966 (21.4%) | 184 (6.4%) |
| $500 to $799 | 588 (13.0%) | 703 (24.3%) |
| $800 to $999 | 649 (14.4%) | 577 (19.9%) |
| $1,000 to $1,499 | 1,021 (22.6%) | 928 (32.0%) |
| $1,500 to $1,999 | 577 (12.8%) | 91 (3.1%) |
| $2,000 to $2,499 | 200 (4.4%) | 36 (1.2%) |
| $2,500 to $2,999 | 52 (1.1%) | 0 (0.0%) |
| $3,000 or more | 79 (1.8%) | 0 (0.0%) |
| Total | 4,520 (100.0%) | 2,896 (100.0%) |
Physical Housing Characteristics in Prince Edward County
Housing Structures in Prince Edward County
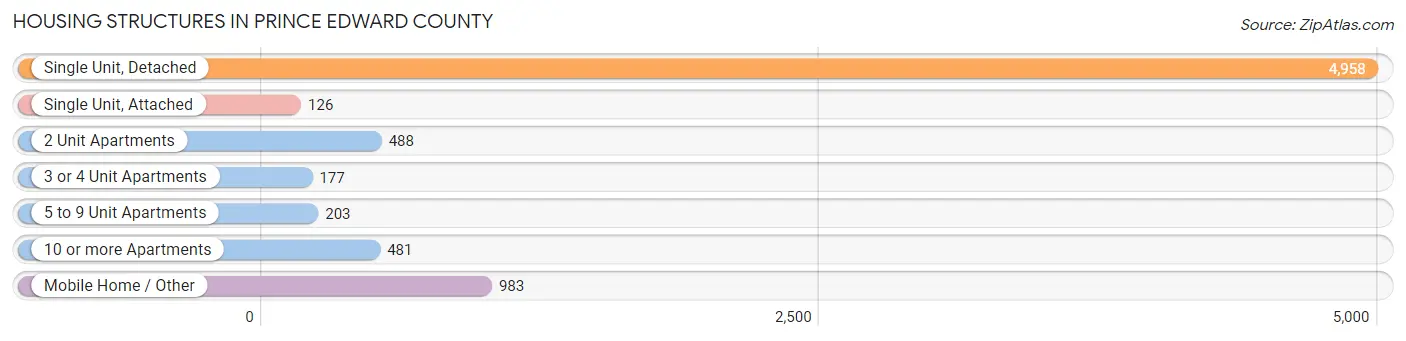
| Structure Type | # Housing Units | % Housing Units |
| Single Unit, Detached | 4,958 | 66.9% |
| Single Unit, Attached | 126 | 1.7% |
| 2 Unit Apartments | 488 | 6.6% |
| 3 or 4 Unit Apartments | 177 | 2.4% |
| 5 to 9 Unit Apartments | 203 | 2.7% |
| 10 or more Apartments | 481 | 6.5% |
| Mobile Home / Other | 983 | 13.3% |
| Total | 7,416 | 100.0% |
Housing Structures by Occupancy in Prince Edward County
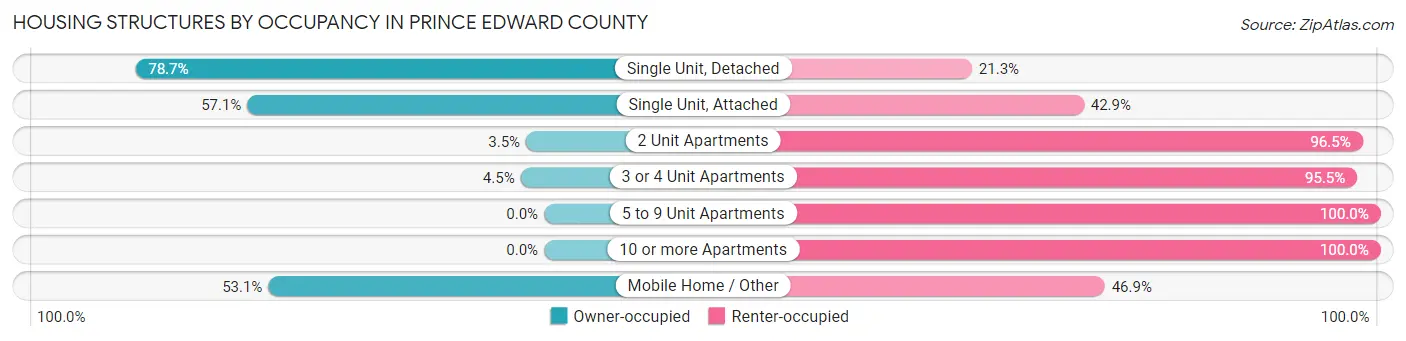
| Structure Type | Owner-occupied | Renter-occupied |
| Single Unit, Detached | 3,901 (78.7%) | 1,057 (21.3%) |
| Single Unit, Attached | 72 (57.1%) | 54 (42.9%) |
| 2 Unit Apartments | 17 (3.5%) | 471 (96.5%) |
| 3 or 4 Unit Apartments | 8 (4.5%) | 169 (95.5%) |
| 5 to 9 Unit Apartments | 0 (0.0%) | 203 (100.0%) |
| 10 or more Apartments | 0 (0.0%) | 481 (100.0%) |
| Mobile Home / Other | 522 (53.1%) | 461 (46.9%) |
| Total | 4,520 (61.0%) | 2,896 (39.1%) |
Housing Structures by Number of Rooms in Prince Edward County
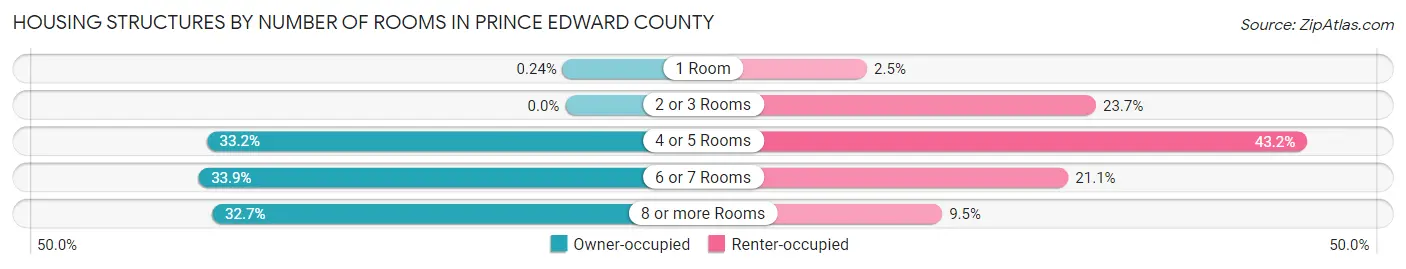
| Number of Rooms | Owner-occupied | Renter-occupied |
| 1 Room | 11 (0.2%) | 73 (2.5%) |
| 2 or 3 Rooms | 0 (0.0%) | 686 (23.7%) |
| 4 or 5 Rooms | 1,499 (33.2%) | 1,251 (43.2%) |
| 6 or 7 Rooms | 1,534 (33.9%) | 612 (21.1%) |
| 8 or more Rooms | 1,476 (32.7%) | 274 (9.5%) |
| Total | 4,520 (100.0%) | 2,896 (100.0%) |
Housing Structure by Heating Type in Prince Edward County
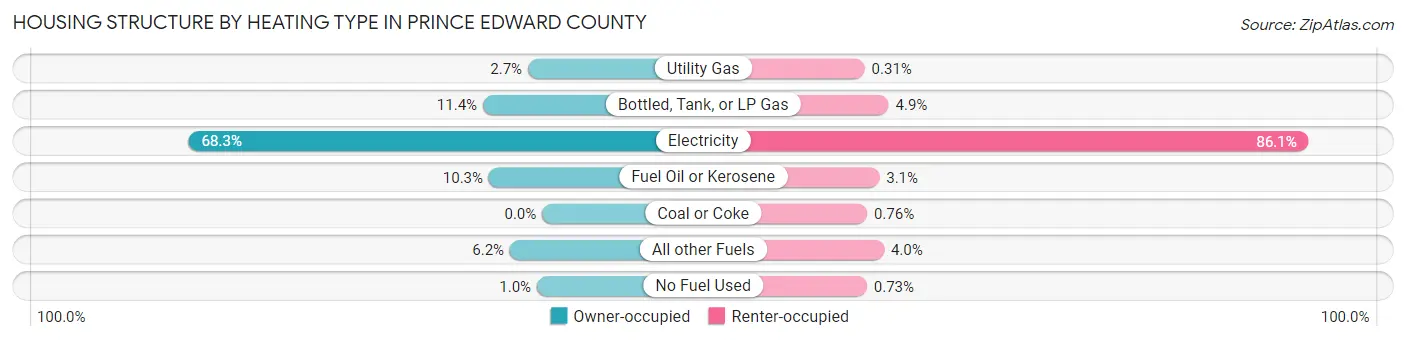
| Heating Type | Owner-occupied | Renter-occupied |
| Utility Gas | 124 (2.7%) | 9 (0.3%) |
| Bottled, Tank, or LP Gas | 517 (11.4%) | 143 (4.9%) |
| Electricity | 3,088 (68.3%) | 2,493 (86.1%) |
| Fuel Oil or Kerosene | 465 (10.3%) | 91 (3.1%) |
| Coal or Coke | 0 (0.0%) | 22 (0.8%) |
| All other Fuels | 281 (6.2%) | 117 (4.0%) |
| No Fuel Used | 45 (1.0%) | 21 (0.7%) |
| Total | 4,520 (100.0%) | 2,896 (100.0%) |
Household Vehicle Usage in Prince Edward County
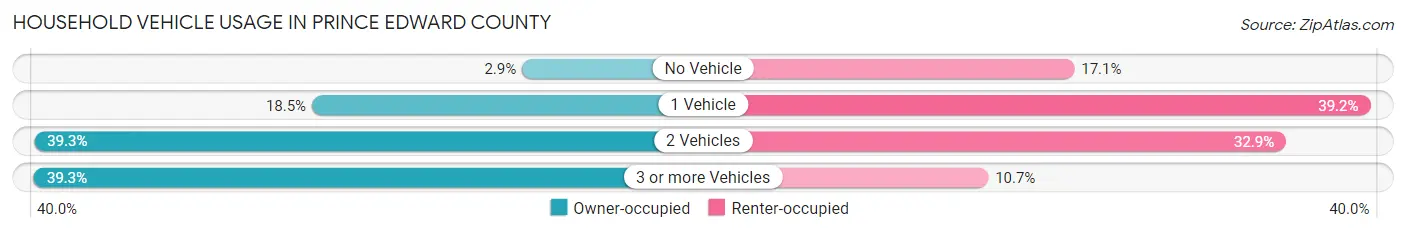
| Vehicles per Household | Owner-occupied | Renter-occupied |
| No Vehicle | 129 (2.9%) | 496 (17.1%) |
| 1 Vehicle | 838 (18.5%) | 1,136 (39.2%) |
| 2 Vehicles | 1,776 (39.3%) | 954 (32.9%) |
| 3 or more Vehicles | 1,777 (39.3%) | 310 (10.7%) |
| Total | 4,520 (100.0%) | 2,896 (100.0%) |
Real Estate & Mortgages in Prince Edward County
Real Estate and Mortgage Overview in Prince Edward County
| Characteristic | Without Mortgage | With Mortgage |
| Housing Units | 1,833 | 2,687 |
| Median Property Value | $172,600 | $199,300 |
| Median Household Income | $55,563 | $505 |
| Monthly Housing Costs | $409 | $79 |
| Real Estate Taxes | $886 | $59 |
Property Value by Mortgage Status in Prince Edward County
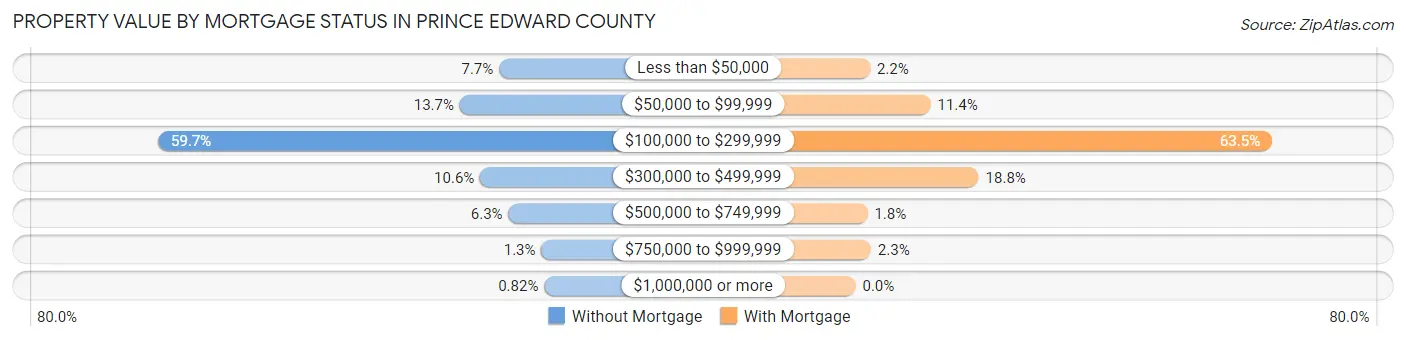
| Property Value | Without Mortgage | With Mortgage |
| Less than $50,000 | 141 (7.7%) | 59 (2.2%) |
| $50,000 to $99,999 | 251 (13.7%) | 307 (11.4%) |
| $100,000 to $299,999 | 1,094 (59.7%) | 1,705 (63.4%) |
| $300,000 to $499,999 | 194 (10.6%) | 504 (18.8%) |
| $500,000 to $749,999 | 115 (6.3%) | 49 (1.8%) |
| $750,000 to $999,999 | 23 (1.3%) | 63 (2.3%) |
| $1,000,000 or more | 15 (0.8%) | 0 (0.0%) |
| Total | 1,833 (100.0%) | 2,687 (100.0%) |
Household Income by Mortgage Status in Prince Edward County
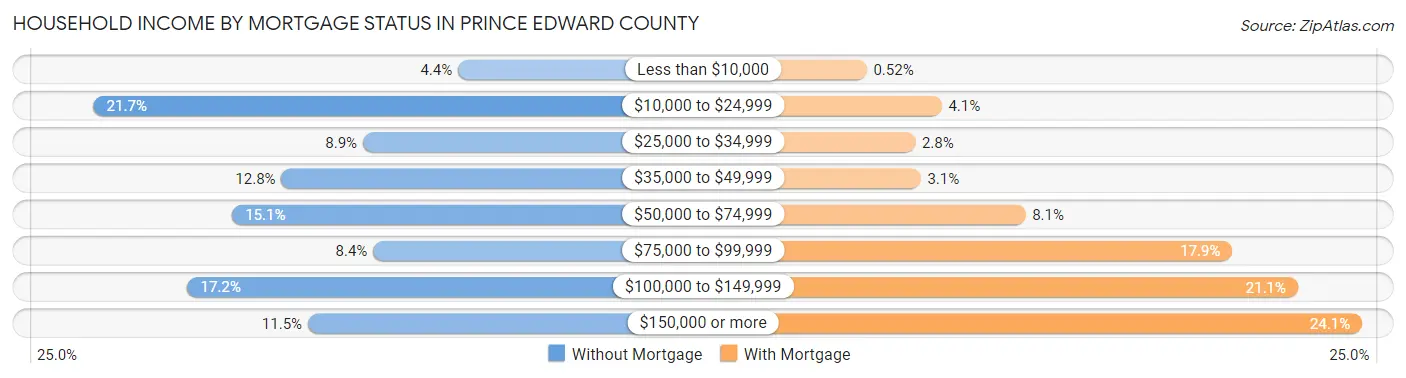
| Household Income | Without Mortgage | With Mortgage |
| Less than $10,000 | 80 (4.4%) | 14 (0.5%) |
| $10,000 to $24,999 | 398 (21.7%) | 110 (4.1%) |
| $25,000 to $34,999 | 163 (8.9%) | 76 (2.8%) |
| $35,000 to $49,999 | 234 (12.8%) | 83 (3.1%) |
| $50,000 to $74,999 | 277 (15.1%) | 217 (8.1%) |
| $75,000 to $99,999 | 154 (8.4%) | 482 (17.9%) |
| $100,000 to $149,999 | 316 (17.2%) | 566 (21.1%) |
| $150,000 or more | 211 (11.5%) | 648 (24.1%) |
| Total | 1,833 (100.0%) | 2,687 (100.0%) |
Property Value to Household Income Ratio in Prince Edward County
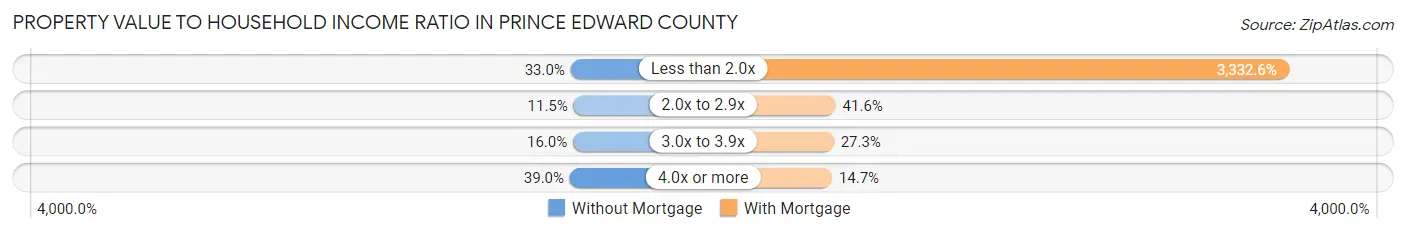
| Value-to-Income Ratio | Without Mortgage | With Mortgage |
| Less than 2.0x | 605 (33.0%) | 89,548 (3,332.6%) |
| 2.0x to 2.9x | 211 (11.5%) | 1,118 (41.6%) |
| 3.0x to 3.9x | 294 (16.0%) | 734 (27.3%) |
| 4.0x or more | 715 (39.0%) | 395 (14.7%) |
| Total | 1,833 (100.0%) | 2,687 (100.0%) |
Real Estate Taxes by Mortgage Status in Prince Edward County
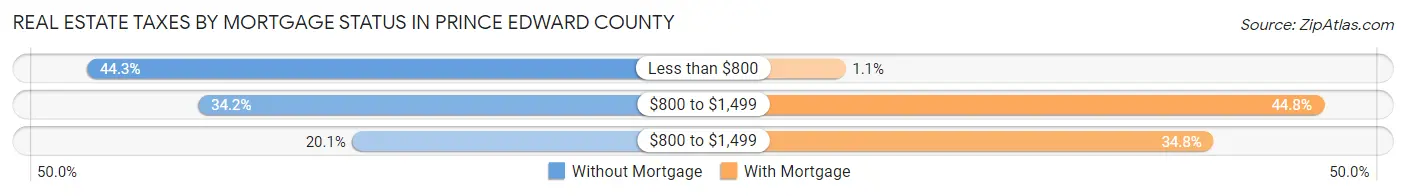
| Property Taxes | Without Mortgage | With Mortgage |
| Less than $800 | 812 (44.3%) | 30 (1.1%) |
| $800 to $1,499 | 626 (34.2%) | 1,204 (44.8%) |
| $800 to $1,499 | 369 (20.1%) | 934 (34.8%) |
| Total | 1,833 (100.0%) | 2,687 (100.0%) |
Health & Disability in Prince Edward County
Health Insurance Coverage by Age in Prince Edward County
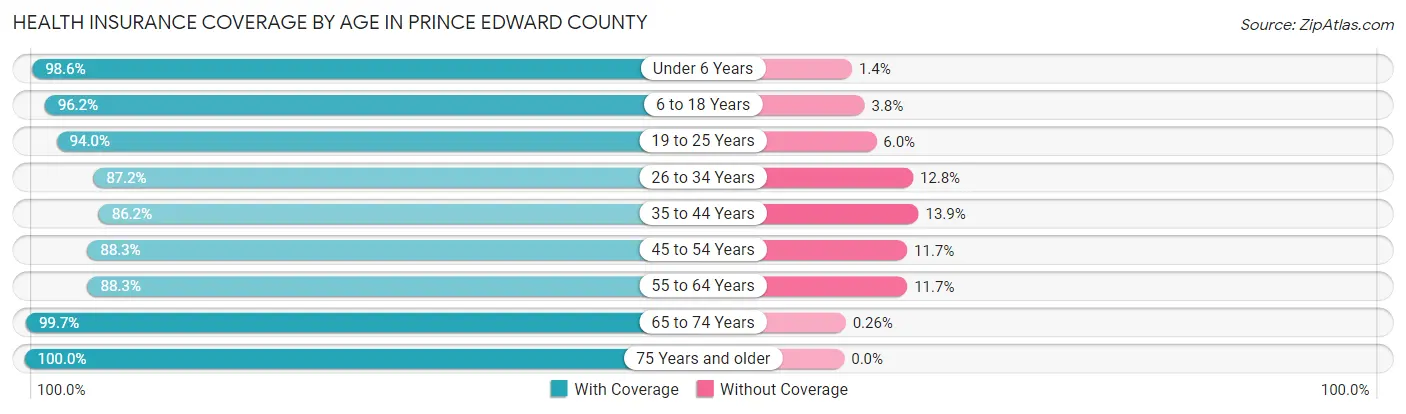
| Age Bracket | With Coverage | Without Coverage |
| Under 6 Years | 1,105 (98.6%) | 16 (1.4%) |
| 6 to 18 Years | 3,231 (96.2%) | 127 (3.8%) |
| 19 to 25 Years | 4,406 (94.0%) | 280 (6.0%) |
| 26 to 34 Years | 1,717 (87.2%) | 252 (12.8%) |
| 35 to 44 Years | 1,580 (86.2%) | 254 (13.9%) |
| 45 to 54 Years | 1,666 (88.3%) | 221 (11.7%) |
| 55 to 64 Years | 2,104 (88.3%) | 280 (11.7%) |
| 65 to 74 Years | 1,941 (99.7%) | 5 (0.3%) |
| 75 Years and older | 1,465 (100.0%) | 0 (0.0%) |
| Total | 19,215 (93.0%) | 1,435 (7.0%) |
Health Insurance Coverage by Citizenship Status in Prince Edward County
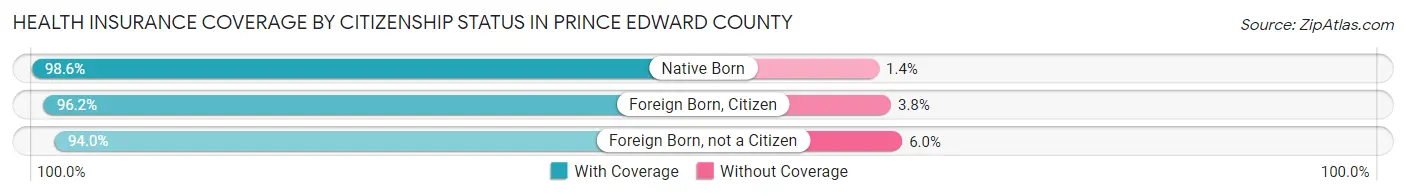
| Citizenship Status | With Coverage | Without Coverage |
| Native Born | 1,105 (98.6%) | 16 (1.4%) |
| Foreign Born, Citizen | 3,231 (96.2%) | 127 (3.8%) |
| Foreign Born, not a Citizen | 4,406 (94.0%) | 280 (6.0%) |
Health Insurance Coverage by Household Income in Prince Edward County
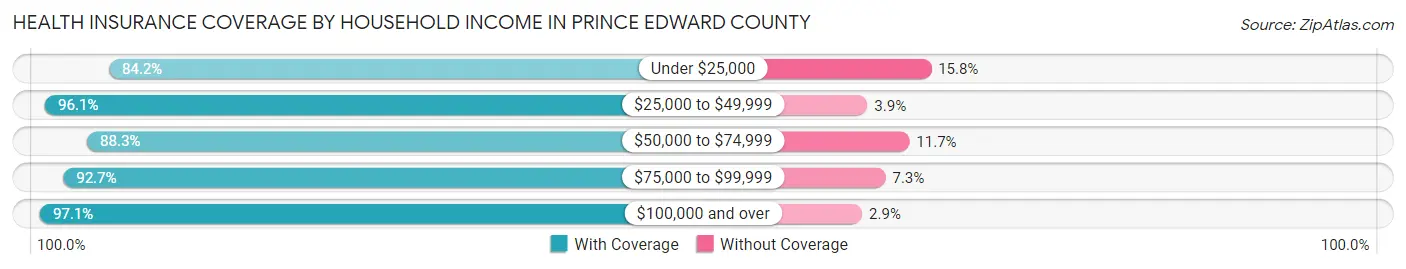
| Household Income | With Coverage | Without Coverage |
| Under $25,000 | 2,151 (84.2%) | 404 (15.8%) |
| $25,000 to $49,999 | 2,914 (96.1%) | 117 (3.9%) |
| $50,000 to $74,999 | 2,559 (88.3%) | 340 (11.7%) |
| $75,000 to $99,999 | 2,299 (92.7%) | 180 (7.3%) |
| $100,000 and over | 5,525 (97.1%) | 164 (2.9%) |
Public vs Private Health Insurance Coverage by Age in Prince Edward County
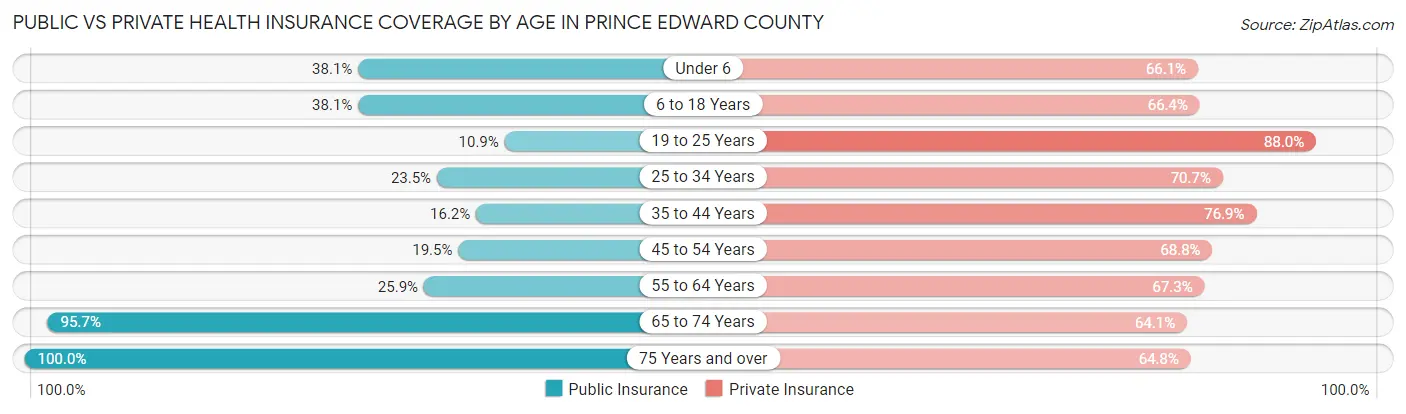
| Age Bracket | Public Insurance | Private Insurance |
| Under 6 | 427 (38.1%) | 741 (66.1%) |
| 6 to 18 Years | 1,279 (38.1%) | 2,231 (66.4%) |
| 19 to 25 Years | 511 (10.9%) | 4,125 (88.0%) |
| 25 to 34 Years | 462 (23.5%) | 1,392 (70.7%) |
| 35 to 44 Years | 297 (16.2%) | 1,411 (76.9%) |
| 45 to 54 Years | 368 (19.5%) | 1,298 (68.8%) |
| 55 to 64 Years | 617 (25.9%) | 1,605 (67.3%) |
| 65 to 74 Years | 1,863 (95.7%) | 1,247 (64.1%) |
| 75 Years and over | 1,465 (100.0%) | 949 (64.8%) |
| Total | 7,289 (35.3%) | 14,999 (72.6%) |
Disability Status by Sex by Age in Prince Edward County
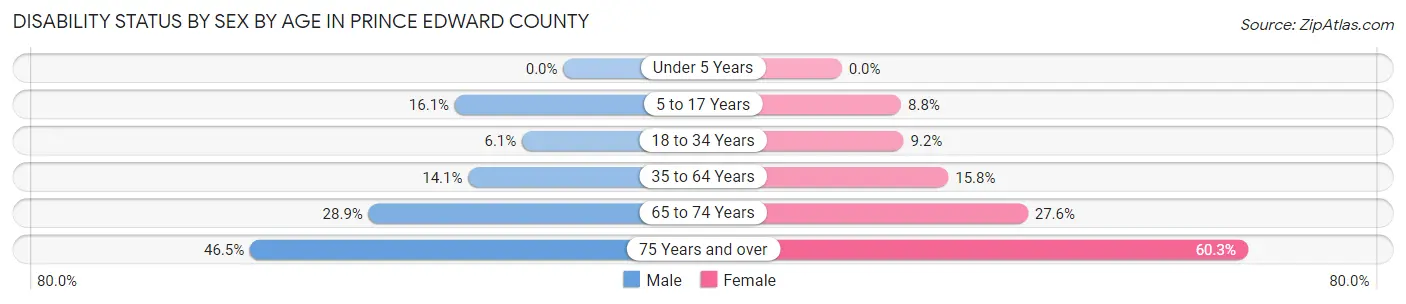
| Age Bracket | Male | Female |
| Under 5 Years | 0 (0.0%) | 0 (0.0%) |
| 5 to 17 Years | 204 (16.1%) | 95 (8.8%) |
| 18 to 34 Years | 251 (6.1%) | 345 (9.2%) |
| 35 to 64 Years | 424 (14.1%) | 490 (15.8%) |
| 65 to 74 Years | 259 (28.9%) | 290 (27.6%) |
| 75 Years and over | 267 (46.5%) | 537 (60.3%) |
Disability Class by Sex by Age in Prince Edward County
Disability Class: Hearing Difficulty
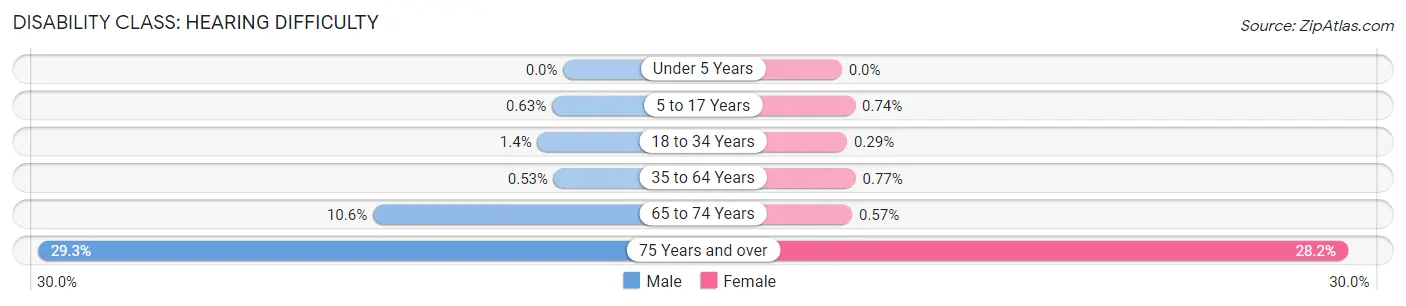
| Age Bracket | Male | Female |
| Under 5 Years | 0 (0.0%) | 0 (0.0%) |
| 5 to 17 Years | 8 (0.6%) | 8 (0.7%) |
| 18 to 34 Years | 59 (1.4%) | 11 (0.3%) |
| 35 to 64 Years | 16 (0.5%) | 24 (0.8%) |
| 65 to 74 Years | 95 (10.6%) | 6 (0.6%) |
| 75 Years and over | 168 (29.3%) | 251 (28.2%) |
Disability Class: Vision Difficulty
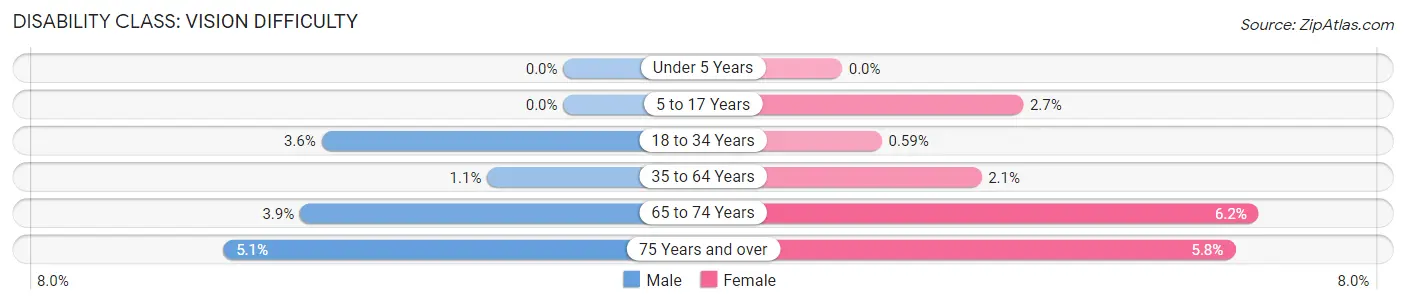
| Age Bracket | Male | Female |
| Under 5 Years | 0 (0.0%) | 0 (0.0%) |
| 5 to 17 Years | 0 (0.0%) | 29 (2.7%) |
| 18 to 34 Years | 147 (3.6%) | 22 (0.6%) |
| 35 to 64 Years | 34 (1.1%) | 64 (2.1%) |
| 65 to 74 Years | 35 (3.9%) | 65 (6.2%) |
| 75 Years and over | 29 (5.1%) | 52 (5.8%) |
Disability Class: Cognitive Difficulty
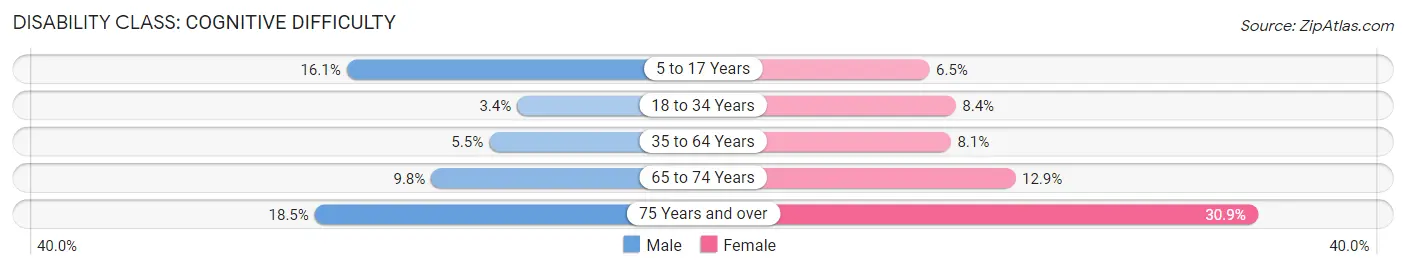
| Age Bracket | Male | Female |
| 5 to 17 Years | 204 (16.1%) | 70 (6.5%) |
| 18 to 34 Years | 141 (3.4%) | 317 (8.4%) |
| 35 to 64 Years | 166 (5.5%) | 250 (8.1%) |
| 65 to 74 Years | 88 (9.8%) | 135 (12.9%) |
| 75 Years and over | 106 (18.5%) | 275 (30.9%) |
Disability Class: Ambulatory Difficulty
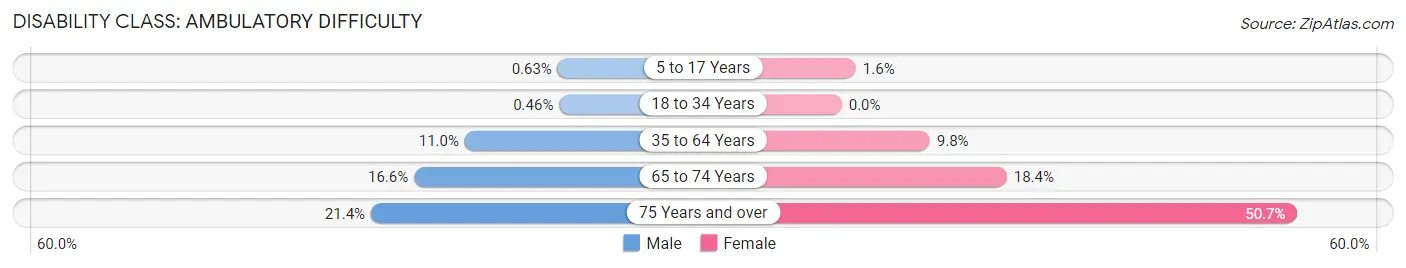
| Age Bracket | Male | Female |
| 5 to 17 Years | 8 (0.6%) | 17 (1.6%) |
| 18 to 34 Years | 19 (0.5%) | 0 (0.0%) |
| 35 to 64 Years | 330 (11.0%) | 304 (9.8%) |
| 65 to 74 Years | 149 (16.6%) | 193 (18.4%) |
| 75 Years and over | 123 (21.4%) | 452 (50.7%) |
Disability Class: Self-Care Difficulty
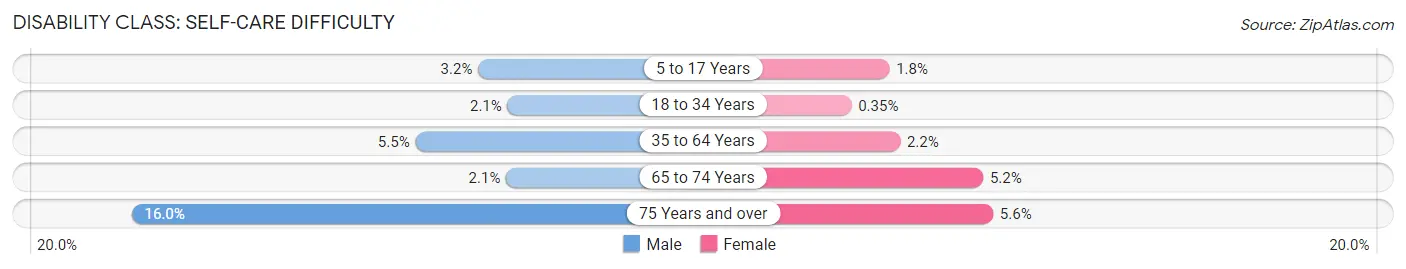
| Age Bracket | Male | Female |
| 5 to 17 Years | 40 (3.2%) | 19 (1.8%) |
| 18 to 34 Years | 85 (2.1%) | 13 (0.4%) |
| 35 to 64 Years | 165 (5.5%) | 67 (2.2%) |
| 65 to 74 Years | 19 (2.1%) | 55 (5.2%) |
| 75 Years and over | 92 (16.0%) | 50 (5.6%) |
Technology Access in Prince Edward County
Computing Device Access in Prince Edward County
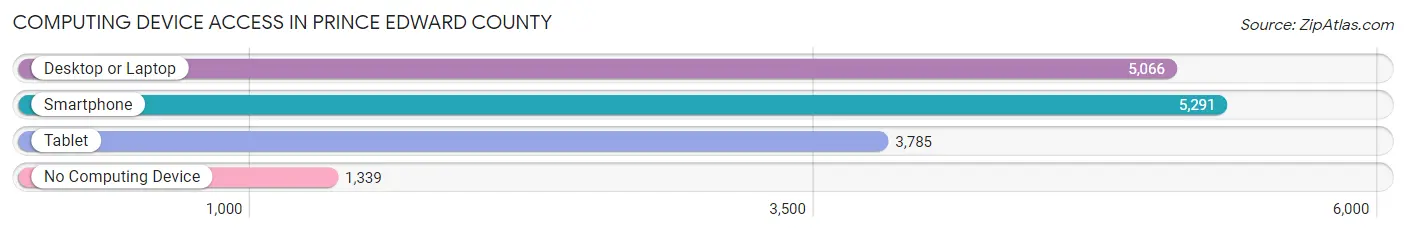
| Device Type | # Households | % Households |
| Desktop or Laptop | 5,066 | 68.3% |
| Smartphone | 5,291 | 71.4% |
| Tablet | 3,785 | 51.0% |
| No Computing Device | 1,339 | 18.1% |
| Total | 7,416 | 100.0% |
Internet Access in Prince Edward County
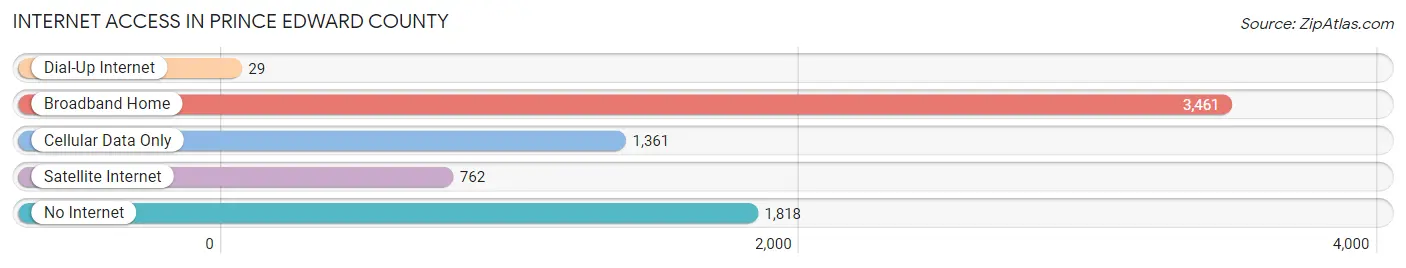
| Internet Type | # Households | % Households |
| Dial-Up Internet | 29 | 0.4% |
| Broadband Home | 3,461 | 46.7% |
| Cellular Data Only | 1,361 | 18.3% |
| Satellite Internet | 762 | 10.3% |
| No Internet | 1,818 | 24.5% |
| Total | 7,416 | 100.0% |
Prince Edward County Summary
Edward County, Virginia is located in the southeastern part of the state, on the eastern shore of the Chesapeake Bay. It is bordered by the cities of Norfolk and Virginia Beach to the north, and the counties of Northampton and Accomack to the south. The county seat is the town of Farmville, which is located in the center of the county.
Edward County was established in 1754, and was named for Prince Edward, the son of King George II. The county was originally part of the Virginia Colony, and was one of the original eight shires of the colony. The county was divided into two parts in 1776, with the northern part becoming Prince Edward County and the southern part becoming Charlotte County.
The geography of Edward County is mostly flat, with rolling hills in the northern part of the county. The county is drained by the Appomattox River, which flows through the county from north to south. The county is also home to several lakes, including Lake Chesdin, Lake Gaston, and Lake Anna.
The economy of Edward County is largely based on agriculture, with the county being home to several large farms. The county is also home to several manufacturing companies, including a paper mill, a furniture factory, and a textile mill. The county is also home to several wineries, and is a popular tourist destination.
The population of Edward County in 2000 was 28,945, with the majority of the population being white (83.3%). African Americans make up 11.7% of the population, and Hispanics make up 2.3%. The median household income in the county is $37,845, and the median home value is $112,000.
The county is served by several public school systems, including the Prince Edward County Public Schools, the Charlotte County Public Schools, and the Appomattox County Public Schools. The county is also home to several private schools, including the Prince Edward Academy and the Appomattox Academy.
Edward County is home to several historical sites, including the High Bridge Trail State Park, the Appomattox Court House National Historical Park, and the Pamplin Historical Park. The county is also home to several museums, including the Prince Edward County Historical Society Museum, the Appomattox County Historical Society Museum, and the Pamplin Historical Park Museum.
Edward County is a rural county with a rich history and a strong agricultural economy. The county is home to several historical sites, museums, and wineries, and is a popular tourist destination. The county is served by several public school systems, and is home to several private schools. The county has a diverse population, with the majority of the population being white. The median household income in the county is $37,845, and the median home value is $112,000.
Common Questions
What is Per Capita Income in Prince Edward County?
Per Capita income in Prince Edward County is $25,205.
What is the Median Family Income in Prince Edward County?
Median Family Income in Prince Edward County is $77,032.
What is the Median Household income in Prince Edward County?
Median Household Income in Prince Edward County is $57,304.
What is Income or Wage Gap in Prince Edward County?
Income or Wage Gap in Prince Edward County is 22.1%.
Women in Prince Edward County earn 77.9 cents for every dollar earned by a man.
What is Family Income Deficit in Prince Edward County?
Family Income Deficit in Prince Edward County is $10,315.
Families that are below poverty line in Prince Edward County earn $10,315 less on average than the poverty threshold level.
What is Inequality or Gini Index in Prince Edward County?
Inequality or Gini Index in Prince Edward County is 0.45.
What is the Total Population of Prince Edward County?
Total Population of Prince Edward County is 21,922.
What is the Total Male Population of Prince Edward County?
Total Male Population of Prince Edward County is 11,433.
What is the Total Female Population of Prince Edward County?
Total Female Population of Prince Edward County is 10,489.
What is the Ratio of Males per 100 Females in Prince Edward County?
There are 109.00 Males per 100 Females in Prince Edward County.
What is the Ratio of Females per 100 Males in Prince Edward County?
There are 91.74 Females per 100 Males in Prince Edward County.
What is the Median Population Age in Prince Edward County?
Median Population Age in Prince Edward County is 32.0 Years.
What is the Average Family Size in Prince Edward County
Average Family Size in Prince Edward County is 2.8 People.
What is the Average Household Size in Prince Edward County
Average Household Size in Prince Edward County is 2.2 People.
How Large is the Labor Force in Prince Edward County?
There are 8,836 People in the Labor Forcein in Prince Edward County.
What is the Percentage of People in the Labor Force in Prince Edward County?
46.4% of People are in the Labor Force in Prince Edward County.
What is the Unemployment Rate in Prince Edward County?
Unemployment Rate in Prince Edward County is 2.4%.