Powhatan County, VA Map & Demographics
Powhatan County Map
Powhatan County Overview
$47,268
PER CAPITA INCOME
$121,199
AVG FAMILY INCOME
$108,089
AVG HOUSEHOLD INCOME
19.9%
WAGE / INCOME GAP [ % ]
80.1¢/ $1
WAGE / INCOME GAP [ $ ]
0.37
INEQUALITY / GINI INDEX
30,503
TOTAL POPULATION
16,003
MALE POPULATION
14,500
FEMALE POPULATION
110.37
MALES / 100 FEMALES
90.61
FEMALES / 100 MALES
45.6
MEDIAN AGE
2.9
AVG FAMILY SIZE
2.6
AVG HOUSEHOLD SIZE
15,761
LABOR FORCE [ PEOPLE ]
61.3%
PERCENT IN LABOR FORCE
2.6%
UNEMPLOYMENT RATE
Powhatan County Area Codes
Income in Powhatan County
Income Overview in Powhatan County
Per Capita Income in Powhatan County is $47,268, while median incomes of families and households are $121,199 and $108,089 respectively.
| Characteristic | Number | Measure |
| Per Capita Income | 30,503 | $47,268 |
| Median Family Income | 8,827 | $121,199 |
| Mean Family Income | 8,827 | $136,569 |
| Median Household Income | 11,077 | $108,089 |
| Mean Household Income | 11,077 | $125,037 |
| Income Deficit | 8,827 | $0 |
| Wage / Income Gap (%) | 30,503 | 19.88% |
| Wage / Income Gap ($) | 30,503 | 80.12¢ per $1 |
| Gini / Inequality Index | 30,503 | 0.37 |
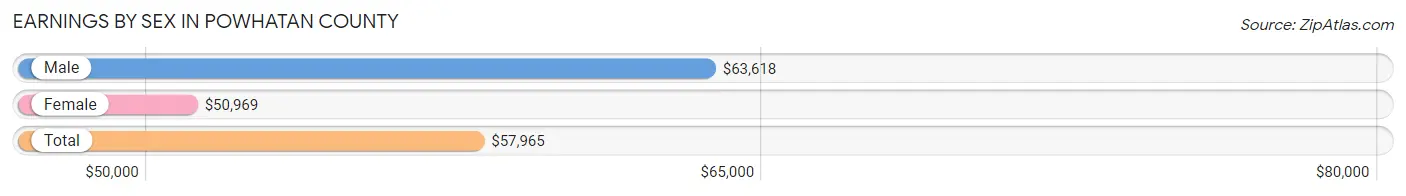
Earnings by Sex in Powhatan County
Average Earnings in Powhatan County are $57,965, $63,618 for men and $50,969 for women, a difference of 19.9%.
| Sex | Number | Average Earnings |
| Male | 8,766 (53.0%) | $63,618 |
| Female | 7,774 (47.0%) | $50,969 |
| Total | 16,540 (100.0%) | $57,965 |
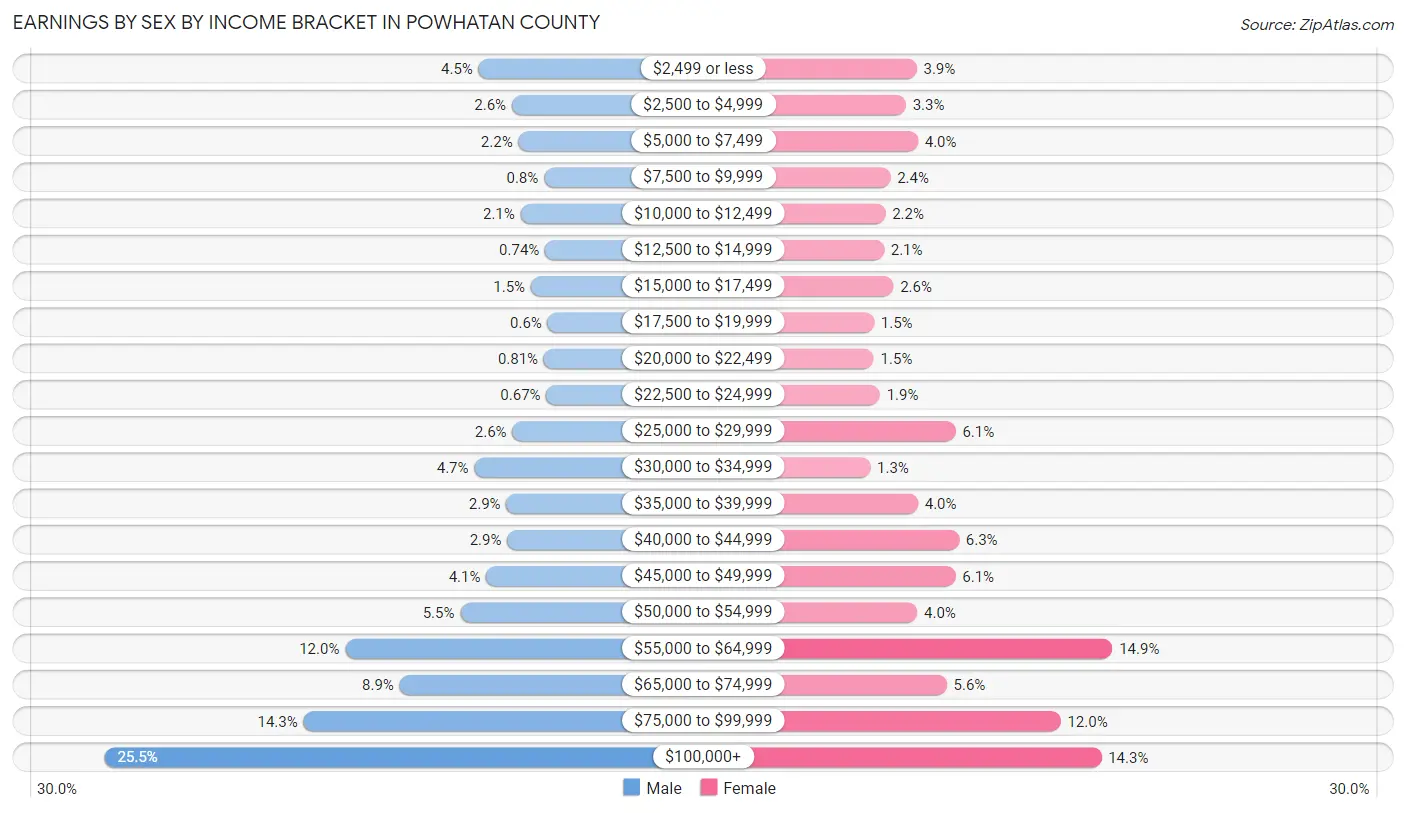
Earnings by Sex by Income Bracket in Powhatan County
The most common earnings brackets in Powhatan County are $100,000+ for men (2,236 | 25.5%) and $55,000 to $64,999 for women (1,160 | 14.9%).
| Income | Male | Female |
| $2,499 or less | 393 (4.5%) | 305 (3.9%) |
| $2,500 to $4,999 | 229 (2.6%) | 257 (3.3%) |
| $5,000 to $7,499 | 196 (2.2%) | 310 (4.0%) |
| $7,500 to $9,999 | 70 (0.8%) | 190 (2.4%) |
| $10,000 to $12,499 | 186 (2.1%) | 168 (2.2%) |
| $12,500 to $14,999 | 65 (0.7%) | 162 (2.1%) |
| $15,000 to $17,499 | 135 (1.5%) | 203 (2.6%) |
| $17,500 to $19,999 | 53 (0.6%) | 118 (1.5%) |
| $20,000 to $22,499 | 71 (0.8%) | 117 (1.5%) |
| $22,500 to $24,999 | 59 (0.7%) | 144 (1.8%) |
| $25,000 to $29,999 | 226 (2.6%) | 475 (6.1%) |
| $30,000 to $34,999 | 414 (4.7%) | 102 (1.3%) |
| $35,000 to $39,999 | 256 (2.9%) | 310 (4.0%) |
| $40,000 to $44,999 | 252 (2.9%) | 490 (6.3%) |
| $45,000 to $49,999 | 355 (4.1%) | 474 (6.1%) |
| $50,000 to $54,999 | 483 (5.5%) | 307 (4.0%) |
| $55,000 to $64,999 | 1,050 (12.0%) | 1,160 (14.9%) |
| $65,000 to $74,999 | 782 (8.9%) | 436 (5.6%) |
| $75,000 to $99,999 | 1,255 (14.3%) | 934 (12.0%) |
| $100,000+ | 2,236 (25.5%) | 1,112 (14.3%) |
| Total | 8,766 (100.0%) | 7,774 (100.0%) |
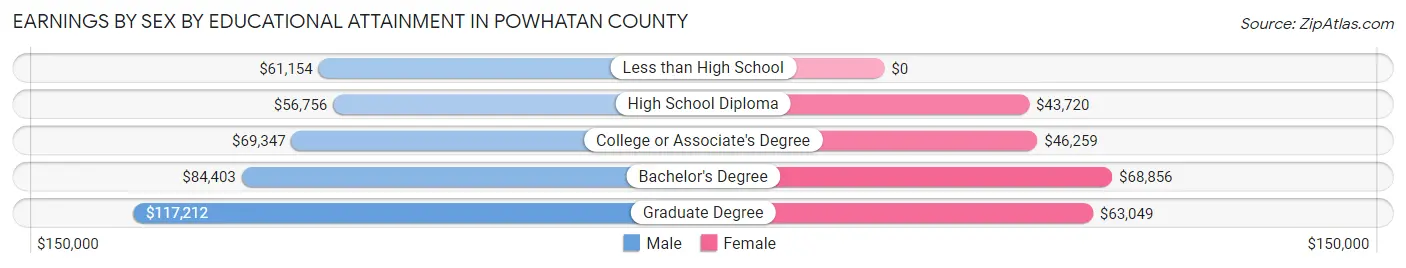
Earnings by Sex by Educational Attainment in Powhatan County
Average earnings in Powhatan County are $69,078 for men and $56,515 for women, a difference of 18.2%. Men with an educational attainment of graduate degree enjoy the highest average annual earnings of $117,212, while those with high school diploma education earn the least with $56,756. Women with an educational attainment of bachelor's degree earn the most with the average annual earnings of $68,856, while those with high school diploma education have the smallest earnings of $43,720.
| Educational Attainment | Male Income | Female Income |
| Less than High School | $61,154 | $0 |
| High School Diploma | $56,756 | $43,720 |
| College or Associate's Degree | $69,347 | $46,259 |
| Bachelor's Degree | $84,403 | $68,856 |
| Graduate Degree | $117,212 | $63,049 |
| Total | $69,078 | $56,515 |
Family Income in Powhatan County
Family Income Brackets in Powhatan County
According to the Powhatan County family income data, there are 2,595 families falling into the $100,000 to $149,999 income range, which is the most common income bracket and makes up 29.4% of all families. Conversely, the $10,000 to $14,999 income bracket is the least frequent group with only 35 families (0.4%) belonging to this category.
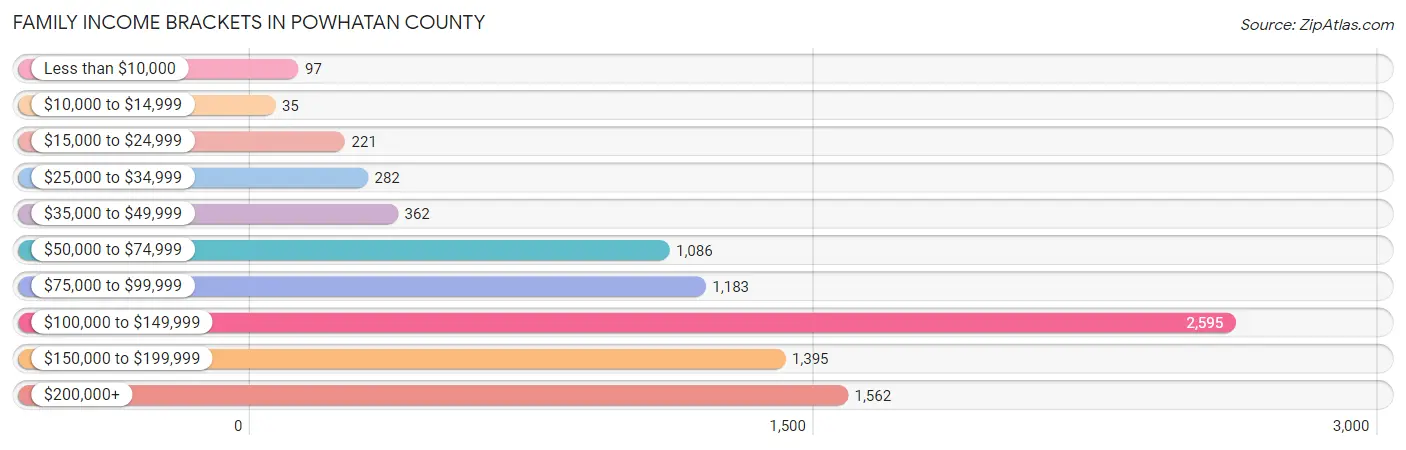
| Income Bracket | # Families | % Families |
| Less than $10,000 | 97 | 1.1% |
| $10,000 to $14,999 | 35 | 0.4% |
| $15,000 to $24,999 | 221 | 2.5% |
| $25,000 to $34,999 | 282 | 3.2% |
| $35,000 to $49,999 | 362 | 4.1% |
| $50,000 to $74,999 | 1,086 | 12.3% |
| $75,000 to $99,999 | 1,183 | 13.4% |
| $100,000 to $149,999 | 2,595 | 29.4% |
| $150,000 to $199,999 | 1,395 | 15.8% |
| $200,000+ | 1,562 | 17.7% |
Family Income by Famaliy Size in Powhatan County
5-person families (613 | 6.9%) account for the highest median family income in Powhatan County with $155,875 per family, while 2-person families (4,697 | 53.2%) have the highest median income of $51,625 per family member.
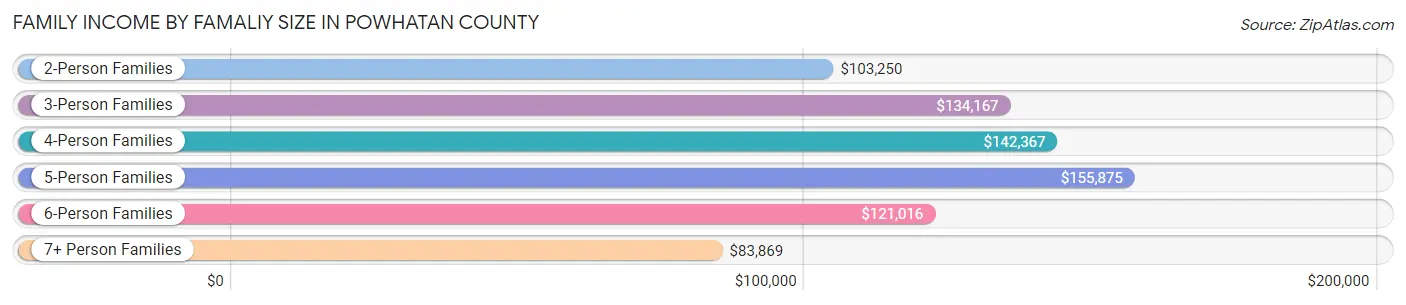
| Income Bracket | # Families | Median Income |
| 2-Person Families | 4,697 (53.2%) | $103,250 |
| 3-Person Families | 1,956 (22.2%) | $134,167 |
| 4-Person Families | 1,396 (15.8%) | $142,367 |
| 5-Person Families | 613 (6.9%) | $155,875 |
| 6-Person Families | 83 (0.9%) | $121,016 |
| 7+ Person Families | 82 (0.9%) | $83,869 |
| Total | 8,827 (100.0%) | $121,199 |
Family Income by Number of Earners in Powhatan County
The median family income in Powhatan County is $121,199, with families comprising 3+ earners (977) having the highest median family income of $186,760, while families with no earners (1,368) have the lowest median family income of $64,211, accounting for 11.1% and 15.5% of families, respectively.
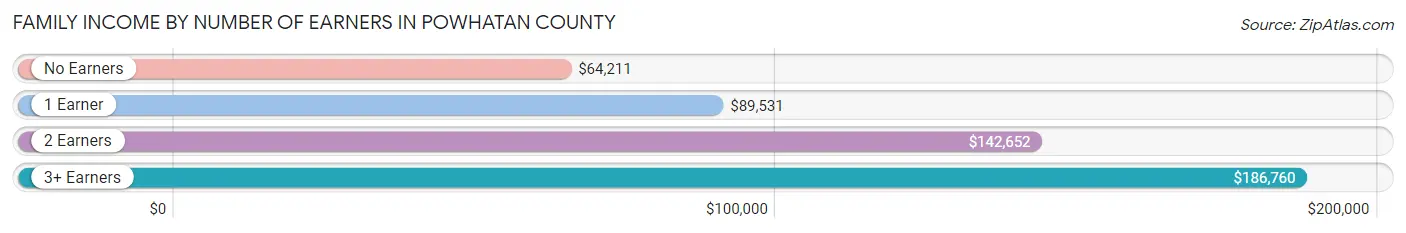
| Number of Earners | # Families | Median Income |
| No Earners | 1,368 (15.5%) | $64,211 |
| 1 Earner | 2,468 (28.0%) | $89,531 |
| 2 Earners | 4,014 (45.5%) | $142,652 |
| 3+ Earners | 977 (11.1%) | $186,760 |
| Total | 8,827 (100.0%) | $121,199 |
Household Income in Powhatan County
Household Income Brackets in Powhatan County
With 2,825 households falling in the category, the $100,000 to $149,999 income range is the most frequent in Powhatan County, accounting for 25.5% of all households. In contrast, only 133 households (1.2%) fall into the $10,000 to $14,999 income bracket, making it the least populous group.
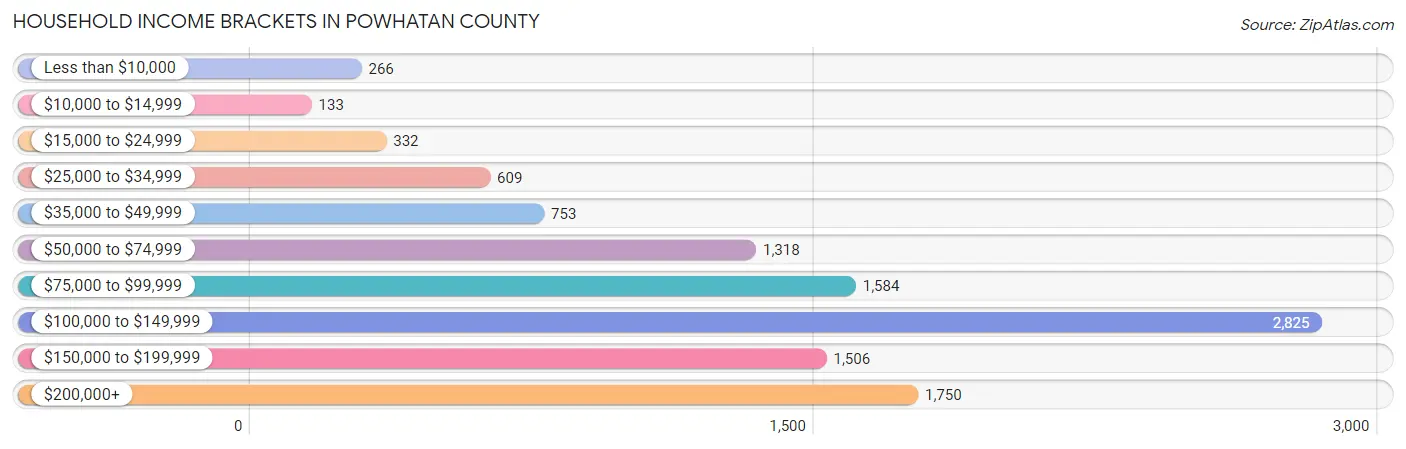
| Income Bracket | # Households | % Households |
| Less than $10,000 | 266 | 2.4% |
| $10,000 to $14,999 | 133 | 1.2% |
| $15,000 to $24,999 | 332 | 3.0% |
| $25,000 to $34,999 | 609 | 5.5% |
| $35,000 to $49,999 | 753 | 6.8% |
| $50,000 to $74,999 | 1,318 | 11.9% |
| $75,000 to $99,999 | 1,584 | 14.3% |
| $100,000 to $149,999 | 2,825 | 25.5% |
| $150,000 to $199,999 | 1,506 | 13.6% |
| $200,000+ | 1,750 | 15.8% |
Household Income by Householder Age in Powhatan County
The median household income in Powhatan County is $108,089, with the highest median household income of $137,617 found in the 45 to 64 years age bracket for the primary householder. A total of 4,523 households (40.8%) fall into this category. Meanwhile, the 65+ years age bracket for the primary householder has the lowest median household income of $77,175, with 3,395 households (30.6%) in this group.
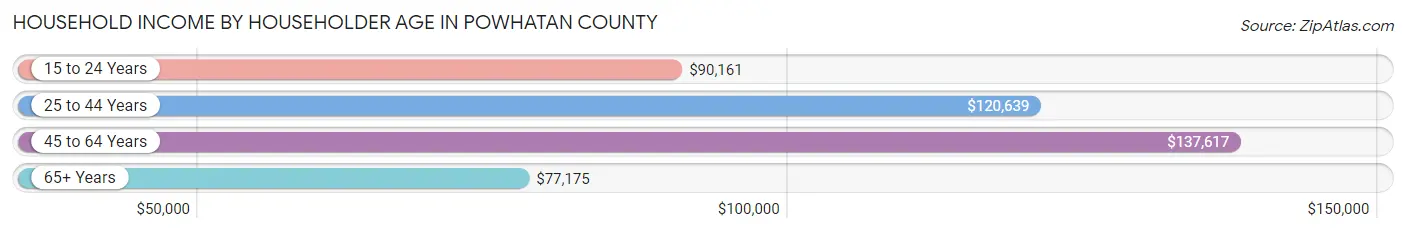
| Income Bracket | # Households | Median Income |
| 15 to 24 Years | 308 (2.8%) | $90,161 |
| 25 to 44 Years | 2,851 (25.7%) | $120,639 |
| 45 to 64 Years | 4,523 (40.8%) | $137,617 |
| 65+ Years | 3,395 (30.6%) | $77,175 |
| Total | 11,077 (100.0%) | $108,089 |
Poverty in Powhatan County
Income Below Poverty by Sex and Age in Powhatan County
With 4.5% poverty level for males and 4.5% for females among the residents of Powhatan County, under 5 year old males and 18 to 24 year old females are the most vulnerable to poverty, with 142 males (21.4%) and 126 females (14.9%) in their respective age groups living below the poverty level.
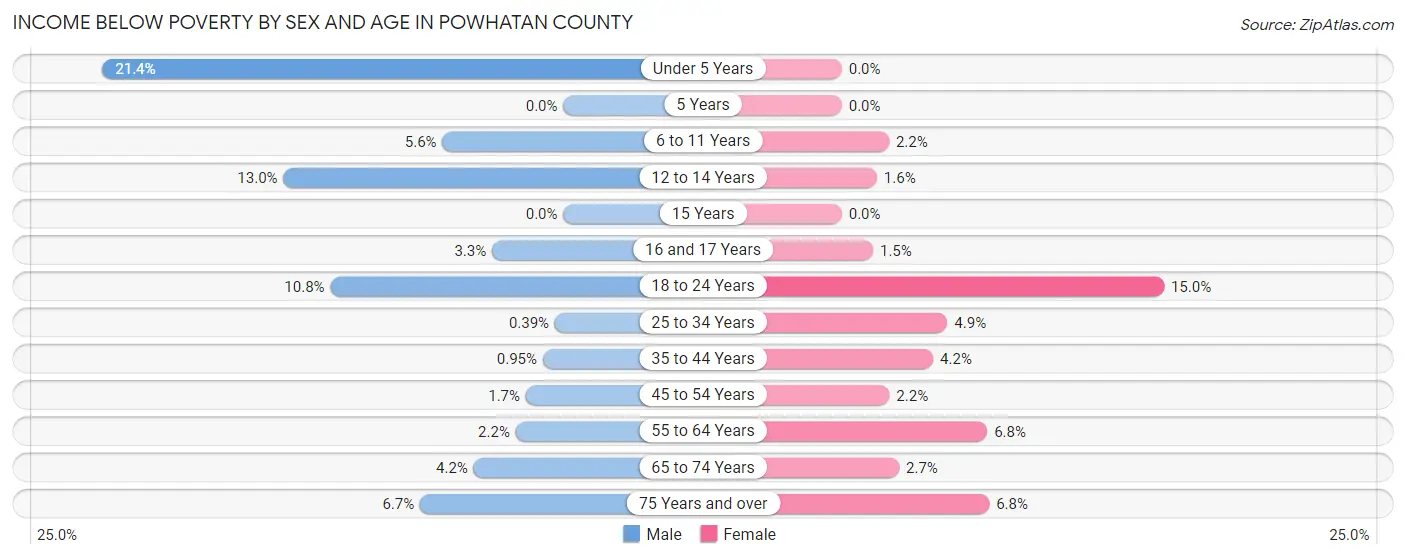
| Age Bracket | Male | Female |
| Under 5 Years | 142 (21.4%) | 0 (0.0%) |
| 5 Years | 0 (0.0%) | 0 (0.0%) |
| 6 to 11 Years | 53 (5.6%) | 15 (2.2%) |
| 12 to 14 Years | 79 (13.0%) | 11 (1.6%) |
| 15 Years | 0 (0.0%) | 0 (0.0%) |
| 16 and 17 Years | 9 (3.3%) | 5 (1.5%) |
| 18 to 24 Years | 120 (10.8%) | 126 (14.9%) |
| 25 to 34 Years | 6 (0.4%) | 70 (4.9%) |
| 35 to 44 Years | 17 (0.9%) | 83 (4.2%) |
| 45 to 54 Years | 36 (1.7%) | 49 (2.2%) |
| 55 to 64 Years | 52 (2.2%) | 163 (6.8%) |
| 65 to 74 Years | 73 (4.2%) | 49 (2.7%) |
| 75 Years and over | 65 (6.7%) | 82 (6.8%) |
| Total | 652 (4.5%) | 653 (4.5%) |
Income Above Poverty by Sex and Age in Powhatan County
According to the poverty statistics in Powhatan County, males aged 5 years and females aged under 5 years are the age groups that are most secure financially, with 100.0% of males and 100.0% of females in these age groups living above the poverty line.
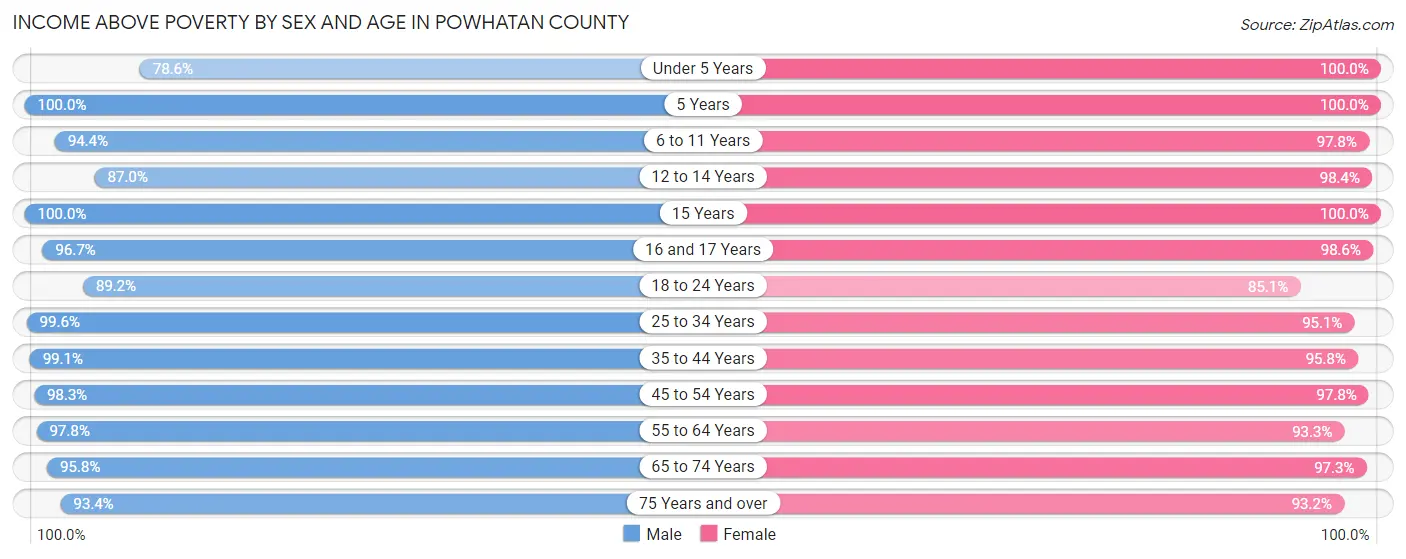
| Age Bracket | Male | Female |
| Under 5 Years | 522 (78.6%) | 609 (100.0%) |
| 5 Years | 62 (100.0%) | 27 (100.0%) |
| 6 to 11 Years | 892 (94.4%) | 671 (97.8%) |
| 12 to 14 Years | 529 (87.0%) | 662 (98.4%) |
| 15 Years | 216 (100.0%) | 133 (100.0%) |
| 16 and 17 Years | 263 (96.7%) | 339 (98.6%) |
| 18 to 24 Years | 990 (89.2%) | 717 (85.1%) |
| 25 to 34 Years | 1,513 (99.6%) | 1,358 (95.1%) |
| 35 to 44 Years | 1,778 (99.1%) | 1,874 (95.8%) |
| 45 to 54 Years | 2,034 (98.3%) | 2,172 (97.8%) |
| 55 to 64 Years | 2,304 (97.8%) | 2,252 (93.2%) |
| 65 to 74 Years | 1,681 (95.8%) | 1,792 (97.3%) |
| 75 Years and over | 913 (93.3%) | 1,116 (93.2%) |
| Total | 13,697 (95.5%) | 13,722 (95.5%) |
Income Below Poverty Among Married-Couple Families in Powhatan County
The poverty statistics for married-couple families in Powhatan County show that 1.7% or 122 of the total 7,350 families live below the poverty line. Families with 3 or 4 children have the highest poverty rate of 2.5%, comprising of 10 families. On the other hand, families with 5 or more children have the lowest poverty rate of 0.0%, which includes 0 families.
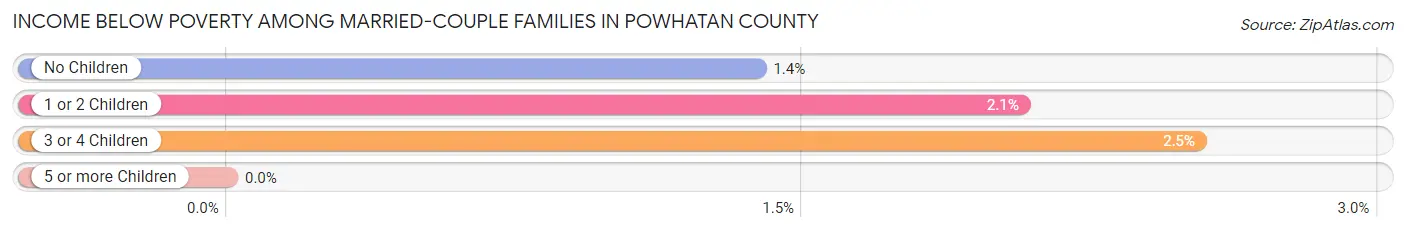
| Children | Above Poverty | Below Poverty |
| No Children | 4,563 (98.6%) | 64 (1.4%) |
| 1 or 2 Children | 2,270 (97.9%) | 48 (2.1%) |
| 3 or 4 Children | 386 (97.5%) | 10 (2.5%) |
| 5 or more Children | 9 (100.0%) | 0 (0.0%) |
| Total | 7,228 (98.3%) | 122 (1.7%) |
Income Below Poverty Among Single-Parent Households in Powhatan County
According to the poverty data in Powhatan County, 3.2% or 22 single-father households and 19.3% or 154 single-mother households are living below the poverty line. Among single-father households, those with 1 or 2 children have the highest poverty rate, with 22 households (11.2%) experiencing poverty. Likewise, among single-mother households, those with 1 or 2 children have the highest poverty rate, with 110 households (28.6%) falling below the poverty line.
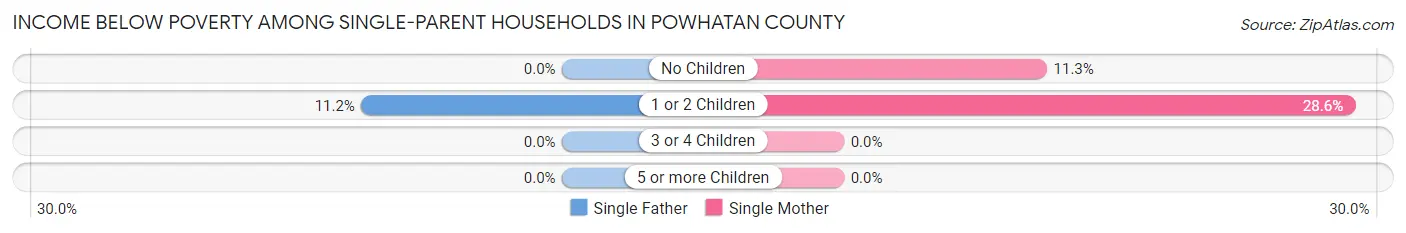
| Children | Single Father | Single Mother |
| No Children | 0 (0.0%) | 44 (11.3%) |
| 1 or 2 Children | 22 (11.2%) | 110 (28.6%) |
| 3 or 4 Children | 0 (0.0%) | 0 (0.0%) |
| 5 or more Children | 0 (0.0%) | 0 (0.0%) |
| Total | 22 (3.2%) | 154 (19.3%) |
Income Below Poverty Among Married-Couple vs Single-Parent Households in Powhatan County
The poverty data for Powhatan County shows that 122 of the married-couple family households (1.7%) and 176 of the single-parent households (11.9%) are living below the poverty level. Within the married-couple family households, those with 3 or 4 children have the highest poverty rate, with 10 households (2.5%) falling below the poverty line. Among the single-parent households, those with 1 or 2 children have the highest poverty rate, with 132 household (22.7%) living below poverty.
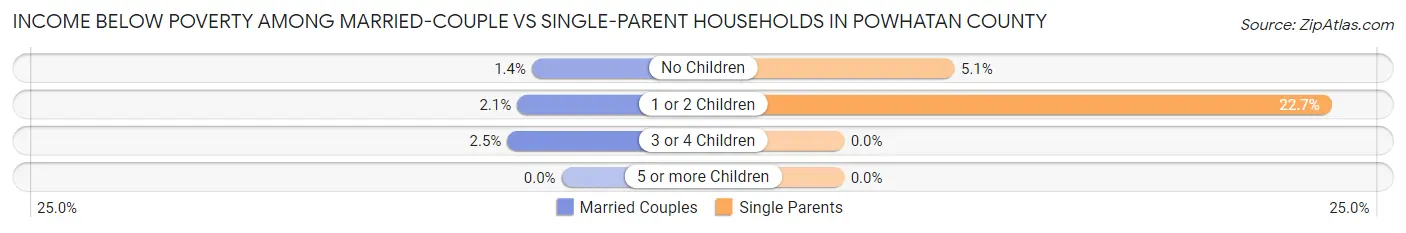
| Children | Married-Couple Families | Single-Parent Households |
| No Children | 64 (1.4%) | 44 (5.1%) |
| 1 or 2 Children | 48 (2.1%) | 132 (22.7%) |
| 3 or 4 Children | 10 (2.5%) | 0 (0.0%) |
| 5 or more Children | 0 (0.0%) | 0 (0.0%) |
| Total | 122 (1.7%) | 176 (11.9%) |
Race in Powhatan County
The most populous races in Powhatan County are White / Caucasian (26,240 | 86.0%), Black / African American (2,685 | 8.8%), and Two or more Races (1,164 | 3.8%).
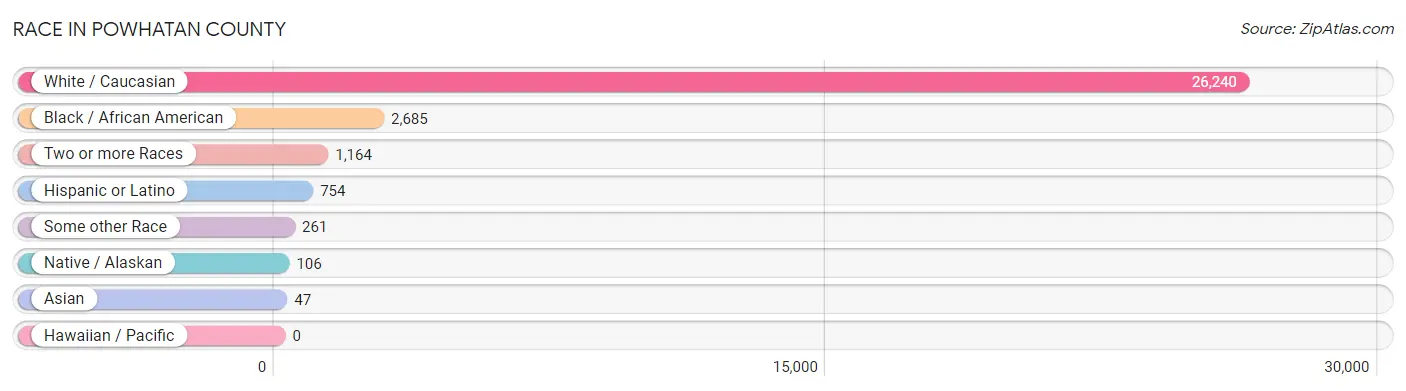
| Race | # Population | % Population |
| Asian | 47 | 0.2% |
| Black / African American | 2,685 | 8.8% |
| Hawaiian / Pacific | 0 | 0.0% |
| Hispanic or Latino | 754 | 2.5% |
| Native / Alaskan | 106 | 0.4% |
| White / Caucasian | 26,240 | 86.0% |
| Two or more Races | 1,164 | 3.8% |
| Some other Race | 261 | 0.9% |
| Total | 30,503 | 100.0% |
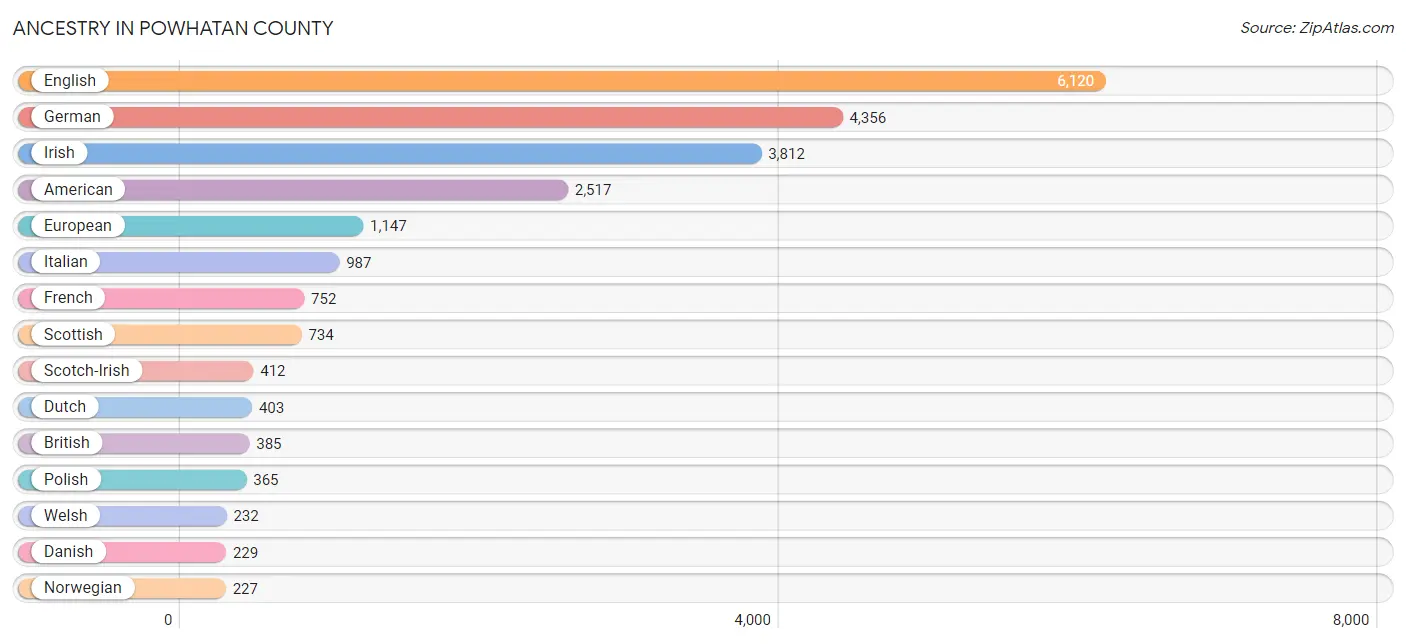
Ancestry in Powhatan County
The most populous ancestries reported in Powhatan County are English (6,120 | 20.1%), German (4,356 | 14.3%), Irish (3,812 | 12.5%), American (2,517 | 8.3%), and European (1,147 | 3.8%), together accounting for 58.9% of all Powhatan County residents.
| Ancestry | # Population | % Population |
| African | 9 | 0.0% |
| American | 2,517 | 8.3% |
| Arab | 197 | 0.6% |
| Austrian | 58 | 0.2% |
| Bhutanese | 7 | 0.0% |
| Brazilian | 26 | 0.1% |
| British | 385 | 1.3% |
| Bulgarian | 30 | 0.1% |
| Canadian | 49 | 0.2% |
| Central American | 178 | 0.6% |
| Central American Indian | 58 | 0.2% |
| Cherokee | 105 | 0.3% |
| Choctaw | 5 | 0.0% |
| Czech | 29 | 0.1% |
| Czechoslovakian | 22 | 0.1% |
| Danish | 229 | 0.7% |
| Dominican | 20 | 0.1% |
| Dutch | 403 | 1.3% |
| Ecuadorian | 24 | 0.1% |
| Egyptian | 3 | 0.0% |
| English | 6,120 | 20.1% |
| Ethiopian | 5 | 0.0% |
| European | 1,147 | 3.8% |
| Finnish | 15 | 0.1% |
| French | 752 | 2.5% |
| French American Indian | 5 | 0.0% |
| French Canadian | 115 | 0.4% |
| German | 4,356 | 14.3% |
| Greek | 44 | 0.1% |
| Haitian | 5 | 0.0% |
| Honduran | 61 | 0.2% |
| Hungarian | 78 | 0.3% |
| Indian (Asian) | 15 | 0.1% |
| Irish | 3,812 | 12.5% |
| Italian | 987 | 3.2% |
| Jamaican | 30 | 0.1% |
| Jordanian | 156 | 0.5% |
| Korean | 141 | 0.5% |
| Lithuanian | 69 | 0.2% |
| Mexican | 64 | 0.2% |
| Mongolian | 2 | 0.0% |
| Moroccan | 30 | 0.1% |
| Nigerian | 19 | 0.1% |
| Northern European | 82 | 0.3% |
| Norwegian | 227 | 0.7% |
| Panamanian | 4 | 0.0% |
| Peruvian | 18 | 0.1% |
| Polish | 365 | 1.2% |
| Portuguese | 42 | 0.1% |
| Puerto Rican | 211 | 0.7% |
| Romanian | 16 | 0.1% |
| Russian | 88 | 0.3% |
| Salvadoran | 99 | 0.3% |
| Scandinavian | 65 | 0.2% |
| Scotch-Irish | 412 | 1.3% |
| Scottish | 734 | 2.4% |
| Serbian | 14 | 0.1% |
| Sioux | 5 | 0.0% |
| Slovak | 78 | 0.3% |
| Slovene | 23 | 0.1% |
| South American | 42 | 0.1% |
| South American Indian | 58 | 0.2% |
| Spanish | 44 | 0.1% |
| Subsaharan African | 66 | 0.2% |
| Sudanese | 32 | 0.1% |
| Swedish | 163 | 0.5% |
| U.S. Virgin Islander | 6 | 0.0% |
| Ukrainian | 39 | 0.1% |
| Welsh | 232 | 0.8% |
| Yugoslavian | 155 | 0.5% | View All 70 Rows |
Immigrants in Powhatan County
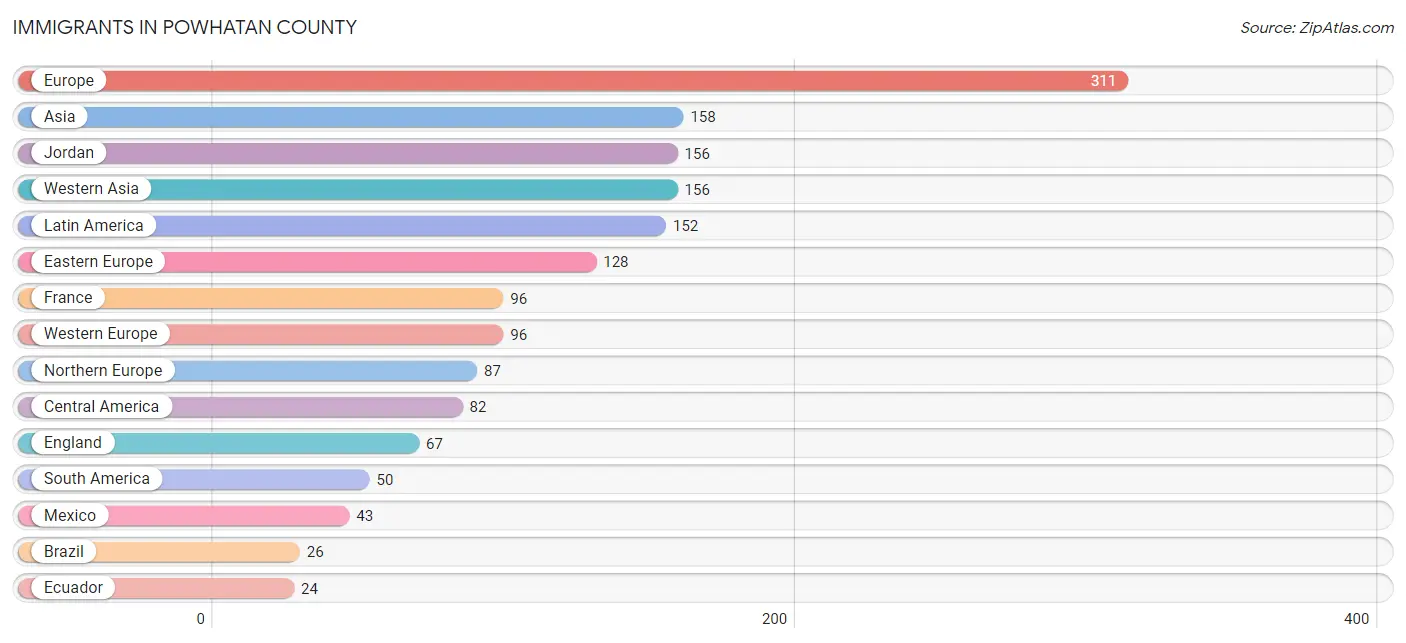
The most numerous immigrant groups reported in Powhatan County came from Europe (311 | 1.0%), Asia (158 | 0.5%), Jordan (156 | 0.5%), Western Asia (156 | 0.5%), and Latin America (152 | 0.5%), together accounting for 3.1% of all Powhatan County residents.
| Immigration Origin | # Population | % Population |
| Africa | 14 | 0.1% |
| Asia | 158 | 0.5% |
| Brazil | 26 | 0.1% |
| Canada | 17 | 0.1% |
| Caribbean | 20 | 0.1% |
| Central America | 82 | 0.3% |
| Dominican Republic | 20 | 0.1% |
| Eastern Africa | 6 | 0.0% |
| Eastern Europe | 128 | 0.4% |
| Ecuador | 24 | 0.1% |
| El Salvador | 22 | 0.1% |
| England | 67 | 0.2% |
| Ethiopia | 5 | 0.0% |
| Europe | 311 | 1.0% |
| France | 96 | 0.3% |
| Honduras | 17 | 0.1% |
| Jordan | 156 | 0.5% |
| Latin America | 152 | 0.5% |
| Malaysia | 2 | 0.0% |
| Mexico | 43 | 0.1% |
| Northern Africa | 8 | 0.0% |
| Northern Europe | 87 | 0.3% |
| Norway | 5 | 0.0% |
| South America | 50 | 0.2% |
| South Eastern Asia | 2 | 0.0% |
| Western Asia | 156 | 0.5% |
| Western Europe | 96 | 0.3% | View All 27 Rows |
Sex and Age in Powhatan County
Sex and Age in Powhatan County
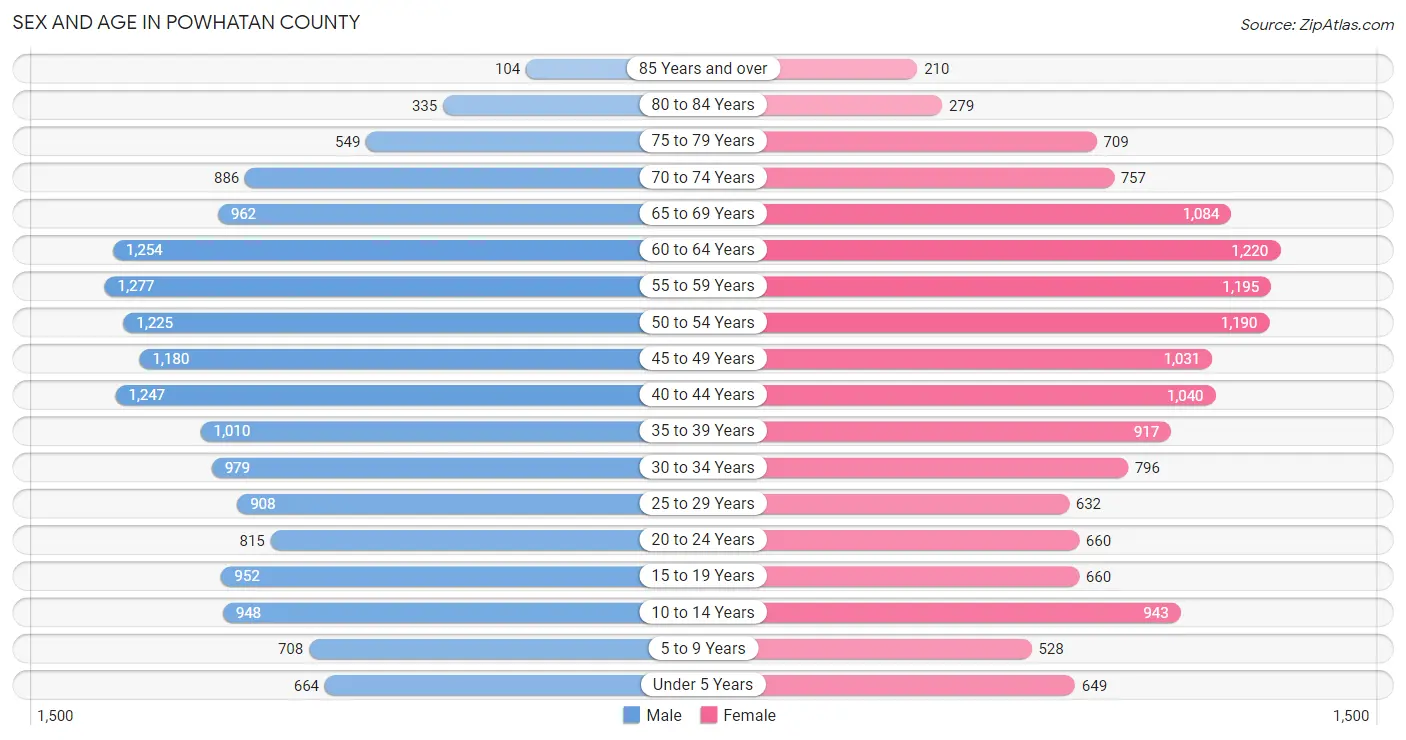
The most populous age groups in Powhatan County are 55 to 59 Years (1,277 | 8.0%) for men and 60 to 64 Years (1,220 | 8.4%) for women.
| Age Bracket | Male | Female |
| Under 5 Years | 664 (4.2%) | 649 (4.5%) |
| 5 to 9 Years | 708 (4.4%) | 528 (3.6%) |
| 10 to 14 Years | 948 (5.9%) | 943 (6.5%) |
| 15 to 19 Years | 952 (5.9%) | 660 (4.5%) |
| 20 to 24 Years | 815 (5.1%) | 660 (4.5%) |
| 25 to 29 Years | 908 (5.7%) | 632 (4.4%) |
| 30 to 34 Years | 979 (6.1%) | 796 (5.5%) |
| 35 to 39 Years | 1,010 (6.3%) | 917 (6.3%) |
| 40 to 44 Years | 1,247 (7.8%) | 1,040 (7.2%) |
| 45 to 49 Years | 1,180 (7.4%) | 1,031 (7.1%) |
| 50 to 54 Years | 1,225 (7.6%) | 1,190 (8.2%) |
| 55 to 59 Years | 1,277 (8.0%) | 1,195 (8.2%) |
| 60 to 64 Years | 1,254 (7.8%) | 1,220 (8.4%) |
| 65 to 69 Years | 962 (6.0%) | 1,084 (7.5%) |
| 70 to 74 Years | 886 (5.5%) | 757 (5.2%) |
| 75 to 79 Years | 549 (3.4%) | 709 (4.9%) |
| 80 to 84 Years | 335 (2.1%) | 279 (1.9%) |
| 85 Years and over | 104 (0.6%) | 210 (1.5%) |
| Total | 16,003 (100.0%) | 14,500 (100.0%) |
Families and Households in Powhatan County
Median Family Size in Powhatan County
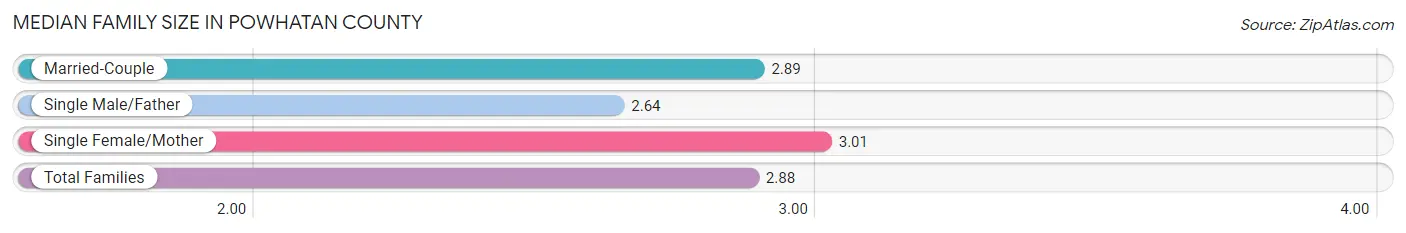
The median family size in Powhatan County is 2.88 persons per family, with single female/mother families (799 | 9.0%) accounting for the largest median family size of 3.01 persons per family. On the other hand, single male/father families (678 | 7.7%) represent the smallest median family size with 2.64 persons per family.
| Family Type | # Families | Family Size |
| Married-Couple | 7,350 (83.3%) | 2.89 |
| Single Male/Father | 678 (7.7%) | 2.64 |
| Single Female/Mother | 799 (9.0%) | 3.01 |
| Total Families | 8,827 (100.0%) | 2.88 |
Median Household Size in Powhatan County
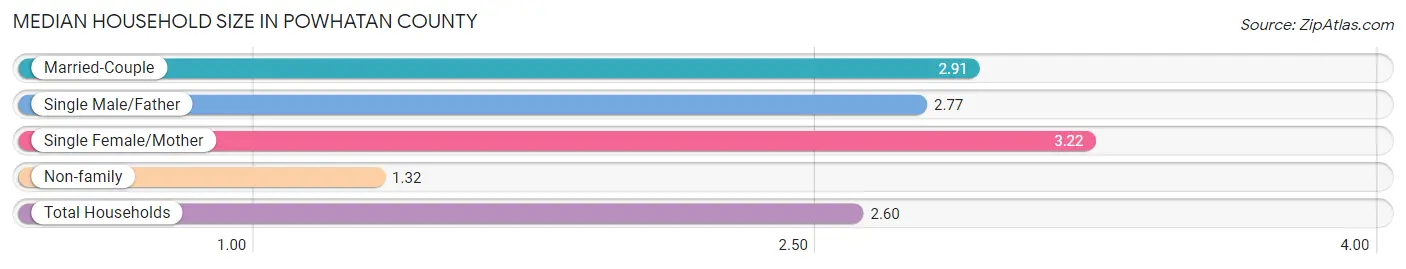
The median household size in Powhatan County is 2.60 persons per household, with single female/mother households (799 | 7.2%) accounting for the largest median household size of 3.22 persons per household. non-family households (2,250 | 20.3%) represent the smallest median household size with 1.32 persons per household.
| Household Type | # Households | Household Size |
| Married-Couple | 7,350 (66.3%) | 2.91 |
| Single Male/Father | 678 (6.1%) | 2.77 |
| Single Female/Mother | 799 (7.2%) | 3.22 |
| Non-family | 2,250 (20.3%) | 1.32 |
| Total Households | 11,077 (100.0%) | 2.60 |
Household Size by Marriage Status in Powhatan County
Out of a total of 11,077 households in Powhatan County, 8,827 (79.7%) are family households, while 2,250 (20.3%) are nonfamily households. The most numerous type of family households are 2-person households, comprising 4,613, and the most common type of nonfamily households are 1-person households, comprising 1,741.
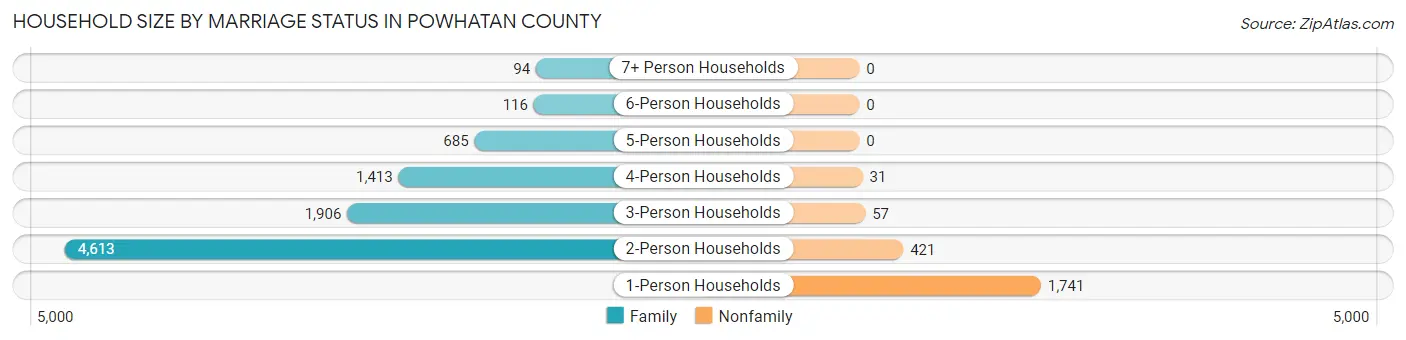
| Household Size | Family Households | Nonfamily Households |
| 1-Person Households | - | 1,741 (15.7%) |
| 2-Person Households | 4,613 (41.6%) | 421 (3.8%) |
| 3-Person Households | 1,906 (17.2%) | 57 (0.5%) |
| 4-Person Households | 1,413 (12.8%) | 31 (0.3%) |
| 5-Person Households | 685 (6.2%) | 0 (0.0%) |
| 6-Person Households | 116 (1.1%) | 0 (0.0%) |
| 7+ Person Households | 94 (0.9%) | 0 (0.0%) |
| Total | 8,827 (79.7%) | 2,250 (20.3%) |
Female Fertility in Powhatan County
Fertility by Age in Powhatan County
Average fertility rate in Powhatan County is 65.0 births per 1,000 women. Women in the age bracket of 20 to 34 years have the highest fertility rate with 155.0 births per 1,000 women. Women in the age bracket of 20 to 34 years acount for 83.9% of all women with births.
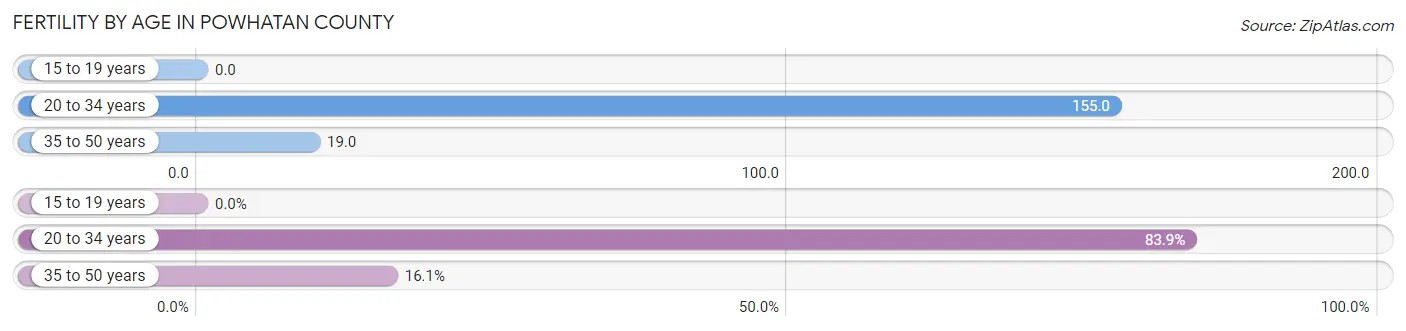
| Age Bracket | Women with Births | Births / 1,000 Women |
| 15 to 19 years | 0 (0.0%) | 0.0 |
| 20 to 34 years | 323 (83.9%) | 155.0 |
| 35 to 50 years | 62 (16.1%) | 19.0 |
| Total | 385 (100.0%) | 65.0 |
Fertility by Age by Marriage Status in Powhatan County
49.1% of women with births (385) in Powhatan County are married. The highest percentage of unmarried women with births falls into 20 to 34 years age bracket with 60.7% of them unmarried at the time of birth, while the lowest percentage of unmarried women with births belong to 35 to 50 years age bracket with 0.0% of them unmarried.
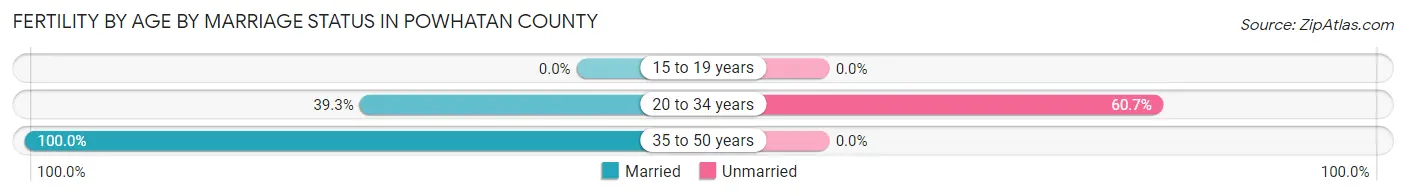
| Age Bracket | Married | Unmarried |
| 15 to 19 years | 0 (0.0%) | 0 (0.0%) |
| 20 to 34 years | 127 (39.3%) | 196 (60.7%) |
| 35 to 50 years | 62 (100.0%) | 0 (0.0%) |
| Total | 189 (49.1%) | 196 (50.9%) |
Fertility by Education in Powhatan County
Average fertility rate in Powhatan County is 65.0 births per 1,000 women. Women with the education attainment of high school diploma have the highest fertility rate of 117.0 births per 1,000 women, while women with the education attainment of graduate degree have the lowest fertility at 18.0 births per 1,000 women. Women with the education attainment of high school diploma represent 39.0% of all women with births.
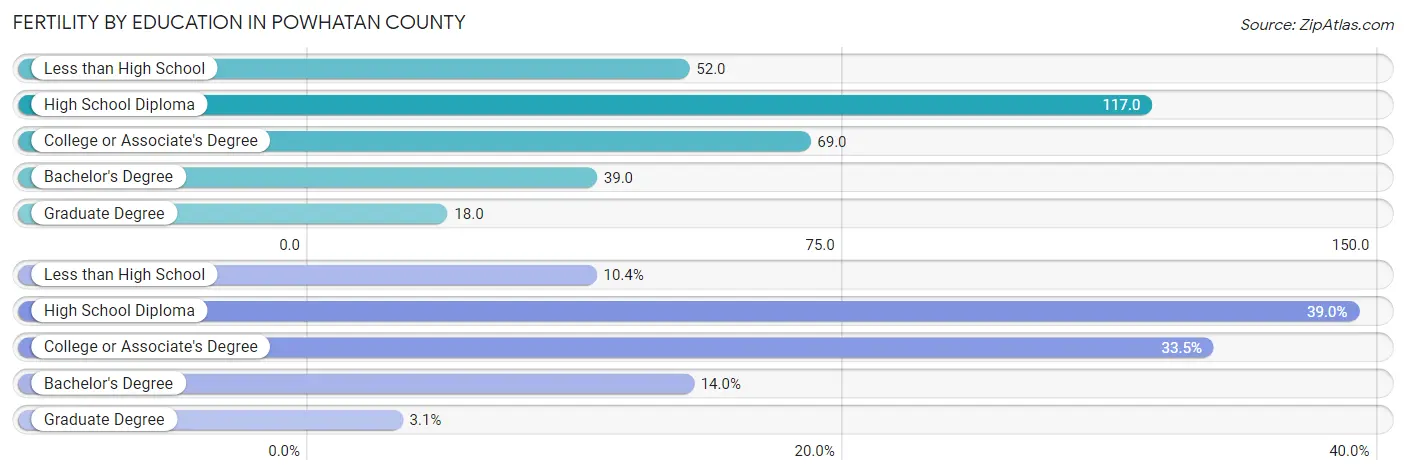
| Educational Attainment | Women with Births | Births / 1,000 Women |
| Less than High School | 40 (10.4%) | 52.0 |
| High School Diploma | 150 (39.0%) | 117.0 |
| College or Associate's Degree | 129 (33.5%) | 69.0 |
| Bachelor's Degree | 54 (14.0%) | 39.0 |
| Graduate Degree | 12 (3.1%) | 18.0 |
| Total | 385 (100.0%) | 65.0 |
Fertility by Education by Marriage Status in Powhatan County
50.9% of women with births in Powhatan County are unmarried. Women with the educational attainment of less than high school are most likely to be married with 100.0% of them married at childbirth, while women with the educational attainment of high school diploma are least likely to be married with 100.0% of them unmarried at childbirth.
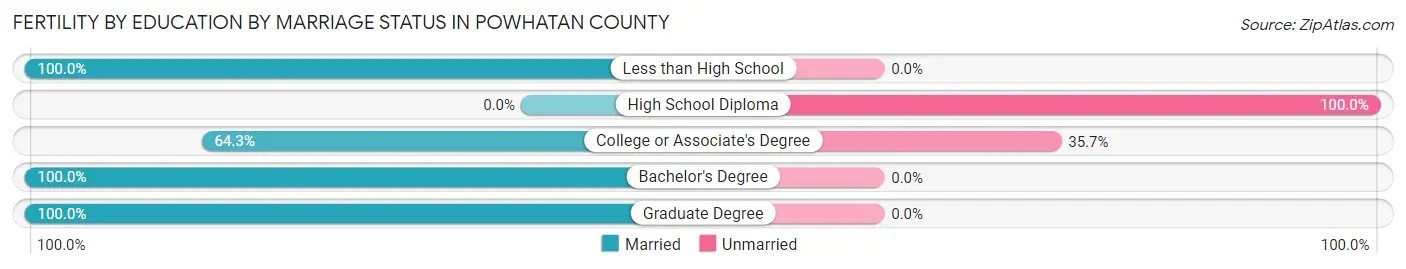
| Educational Attainment | Married | Unmarried |
| Less than High School | 40 (100.0%) | 0 (0.0%) |
| High School Diploma | 0 (0.0%) | 150 (100.0%) |
| College or Associate's Degree | 83 (64.3%) | 46 (35.7%) |
| Bachelor's Degree | 54 (100.0%) | 0 (0.0%) |
| Graduate Degree | 12 (100.0%) | 0 (0.0%) |
| Total | 189 (49.1%) | 196 (50.9%) |
Employment Characteristics in Powhatan County
Employment by Class of Employer in Powhatan County
Among the 15,147 employed individuals in Powhatan County, private company employees (9,951 | 65.7%), local government employees (1,283 | 8.5%), and self-employed (incorporated) (1,093 | 7.2%) make up the most common classes of employment.
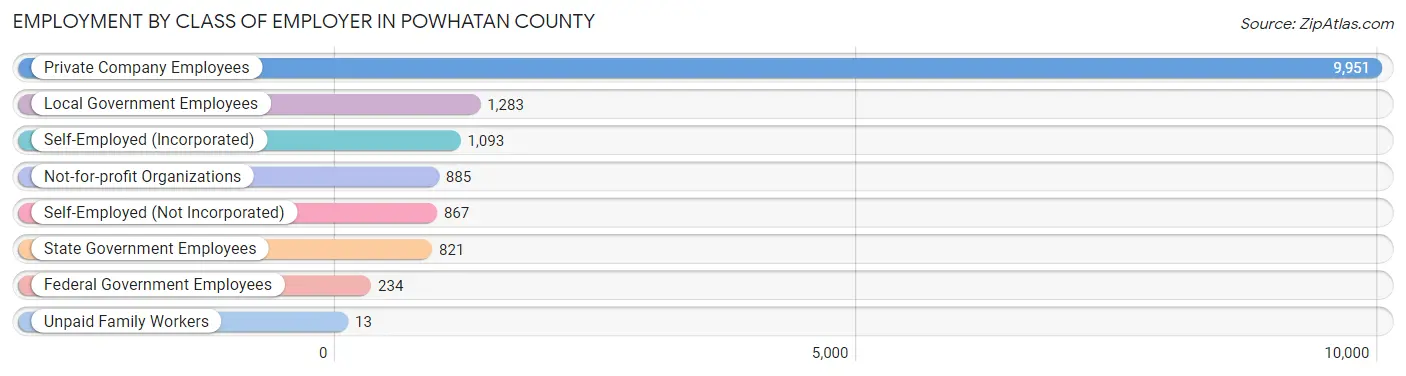
| Employer Class | # Employees | % Employees |
| Private Company Employees | 9,951 | 65.7% |
| Self-Employed (Incorporated) | 1,093 | 7.2% |
| Self-Employed (Not Incorporated) | 867 | 5.7% |
| Not-for-profit Organizations | 885 | 5.8% |
| Local Government Employees | 1,283 | 8.5% |
| State Government Employees | 821 | 5.4% |
| Federal Government Employees | 234 | 1.5% |
| Unpaid Family Workers | 13 | 0.1% |
| Total | 15,147 | 100.0% |
Employment Status by Age in Powhatan County
According to the labor force statistics for Powhatan County, out of the total population over 16 years of age (25,712), 61.3% or 15,761 individuals are in the labor force, with 2.6% or 410 of them unemployed. The age group with the highest labor force participation rate is 25 to 29 years, with 83.1% or 1,280 individuals in the labor force. Within the labor force, the 20 to 24 years age range has the highest percentage of unemployed individuals, with 12.2% or 143 of them being unemployed.
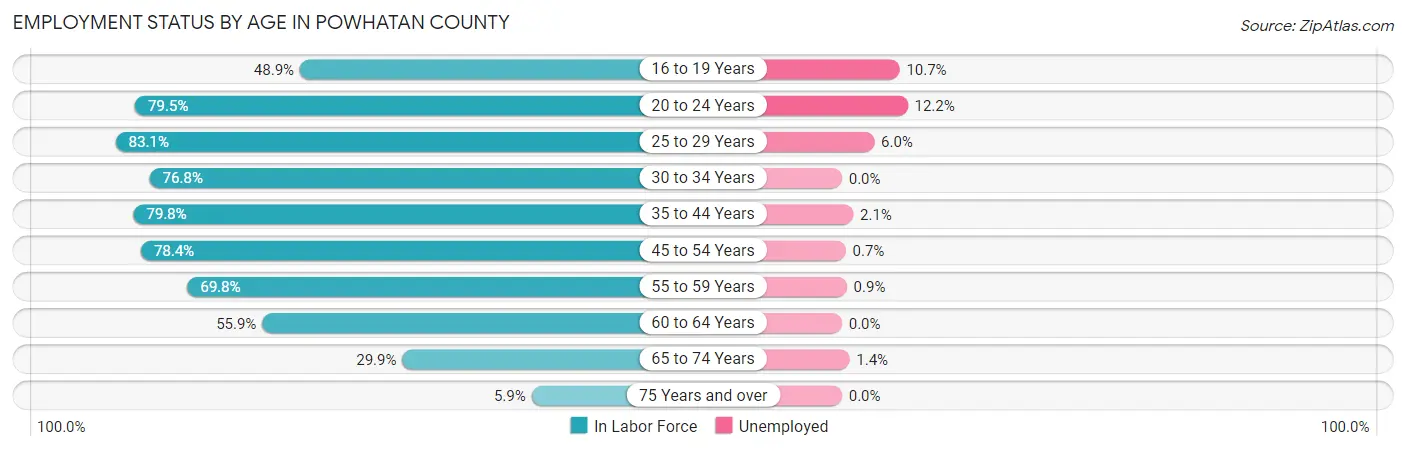
| Age Bracket | In Labor Force | Unemployed |
| 16 to 19 Years | 617 (48.9%) | 66 (10.7%) |
| 20 to 24 Years | 1,173 (79.5%) | 143 (12.2%) |
| 25 to 29 Years | 1,280 (83.1%) | 77 (6.0%) |
| 30 to 34 Years | 1,363 (76.8%) | 0 (0.0%) |
| 35 to 44 Years | 3,363 (79.8%) | 71 (2.1%) |
| 45 to 54 Years | 3,627 (78.4%) | 25 (0.7%) |
| 55 to 59 Years | 1,725 (69.8%) | 16 (0.9%) |
| 60 to 64 Years | 1,383 (55.9%) | 0 (0.0%) |
| 65 to 74 Years | 1,103 (29.9%) | 15 (1.4%) |
| 75 Years and over | 129 (5.9%) | 0 (0.0%) |
| Total | 15,761 (61.3%) | 410 (2.6%) |
Employment Status by Educational Attainment in Powhatan County
According to labor force statistics for Powhatan County, 74.5% of individuals (12,740) out of the total population between 25 and 64 years of age (17,101) are in the labor force, with 1.5% or 191 of them being unemployed. The group with the highest labor force participation rate are those with the educational attainment of bachelor's degree or higher, with 89.3% or 5,087 individuals in the labor force. Within the labor force, individuals with less than high school education have the highest percentage of unemployment, with 8.0% or 40 of them being unemployed.
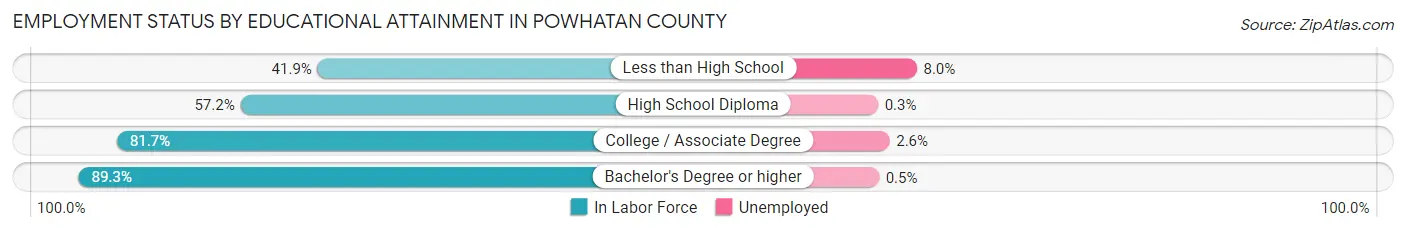
| Educational Attainment | In Labor Force | Unemployed |
| Less than High School | 498 (41.9%) | 95 (8.0%) |
| High School Diploma | 2,770 (57.2%) | 15 (0.3%) |
| College / Associate Degree | 4,390 (81.7%) | 140 (2.6%) |
| Bachelor's Degree or higher | 5,087 (89.3%) | 28 (0.5%) |
| Total | 12,740 (74.5%) | 257 (1.5%) |
Employment Occupations by Sex in Powhatan County
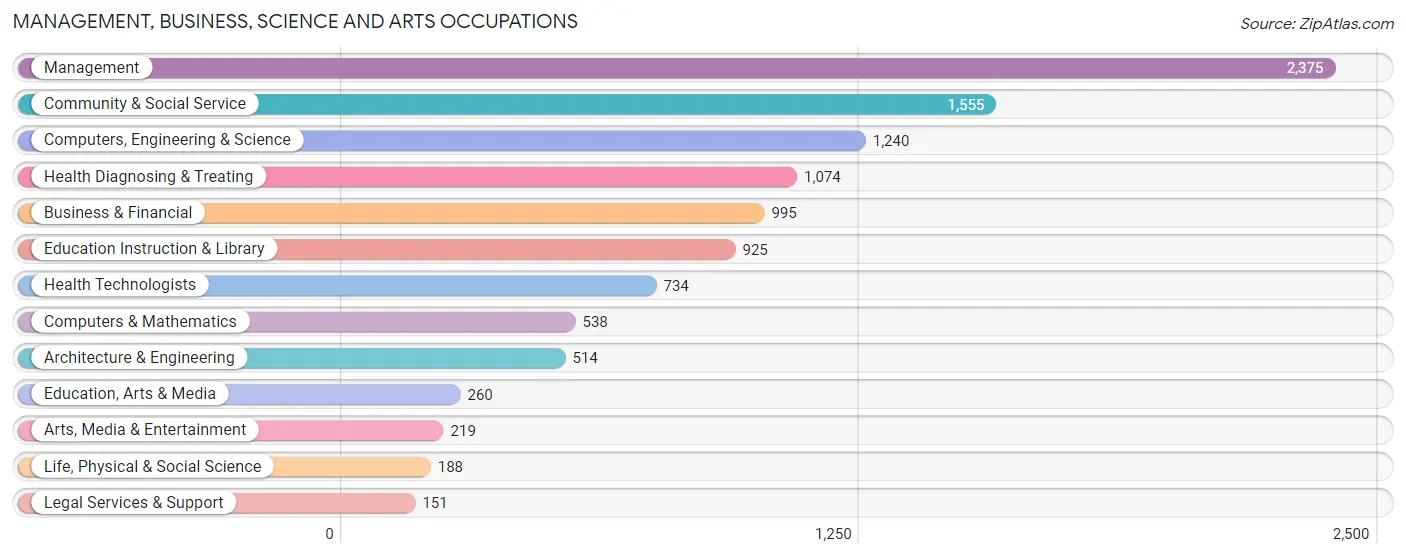
Management, Business, Science and Arts Occupations
The most common Management, Business, Science and Arts occupations in Powhatan County are Management (2,375 | 15.5%), Community & Social Service (1,555 | 10.1%), Computers, Engineering & Science (1,240 | 8.1%), Health Diagnosing & Treating (1,074 | 7.0%), and Business & Financial (995 | 6.5%).
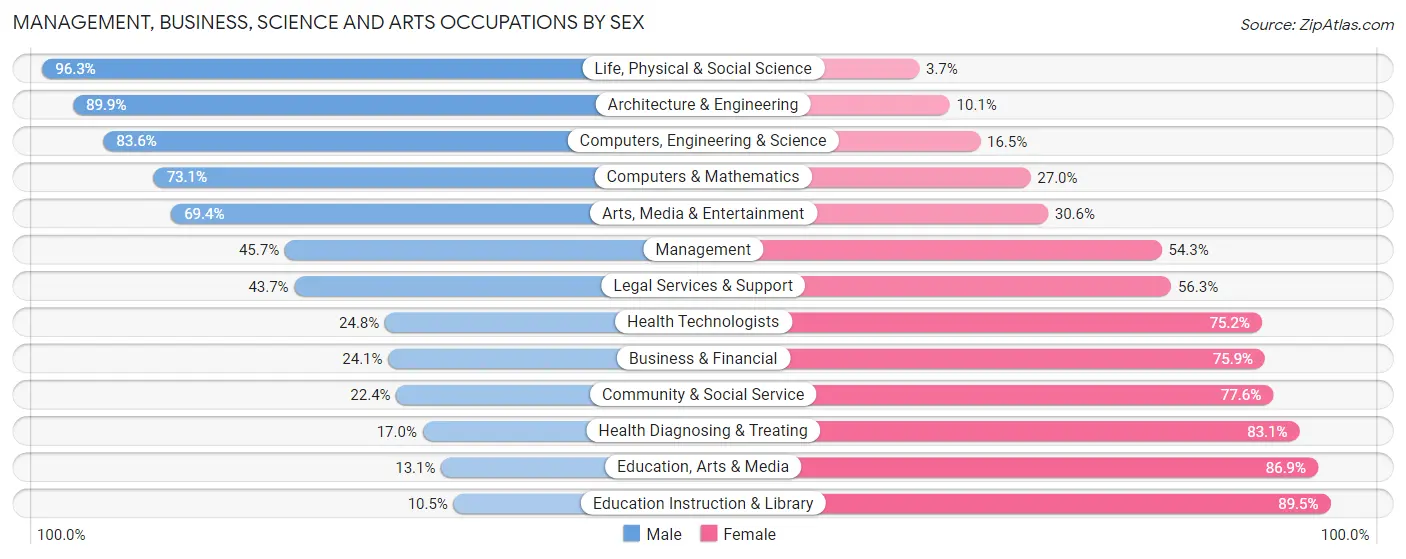
Management, Business, Science and Arts Occupations by Sex
Within the Management, Business, Science and Arts occupations in Powhatan County, the most male-oriented occupations are Life, Physical & Social Science (96.3%), Architecture & Engineering (89.9%), and Computers, Engineering & Science (83.6%), while the most female-oriented occupations are Education Instruction & Library (89.5%), Education, Arts & Media (86.9%), and Health Diagnosing & Treating (83.1%).
| Occupation | Male | Female |
| Management | 1,085 (45.7%) | 1,290 (54.3%) |
| Business & Financial | 240 (24.1%) | 755 (75.9%) |
| Computers, Engineering & Science | 1,036 (83.6%) | 204 (16.5%) |
| Computers & Mathematics | 393 (73.1%) | 145 (27.0%) |
| Architecture & Engineering | 462 (89.9%) | 52 (10.1%) |
| Life, Physical & Social Science | 181 (96.3%) | 7 (3.7%) |
| Community & Social Service | 349 (22.4%) | 1,206 (77.6%) |
| Education, Arts & Media | 34 (13.1%) | 226 (86.9%) |
| Legal Services & Support | 66 (43.7%) | 85 (56.3%) |
| Education Instruction & Library | 97 (10.5%) | 828 (89.5%) |
| Arts, Media & Entertainment | 152 (69.4%) | 67 (30.6%) |
| Health Diagnosing & Treating | 182 (17.0%) | 892 (83.1%) |
| Health Technologists | 182 (24.8%) | 552 (75.2%) |
| Total (Category) | 2,892 (40.0%) | 4,347 (60.1%) |
| Total (Overall) | 7,960 (51.8%) | 7,392 (48.1%) |
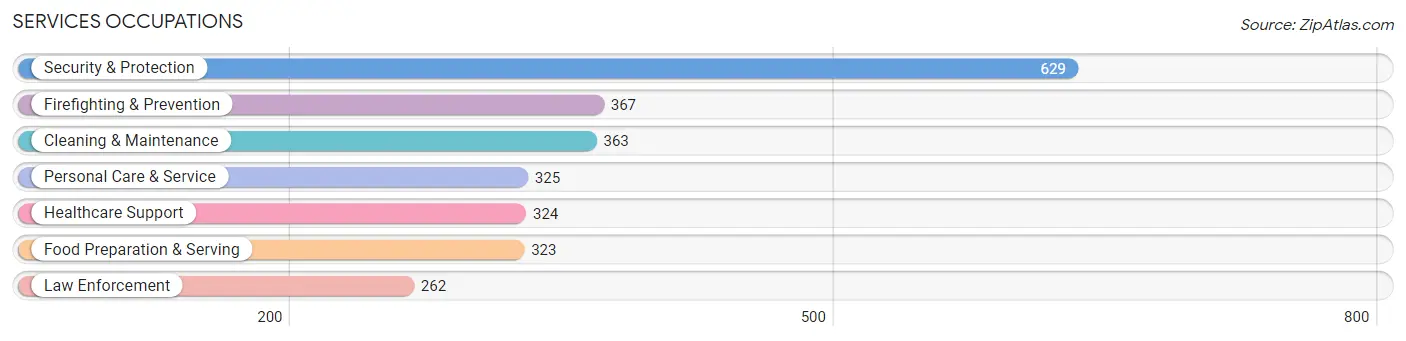
Services Occupations
The most common Services occupations in Powhatan County are Security & Protection (629 | 4.1%), Firefighting & Prevention (367 | 2.4%), Cleaning & Maintenance (363 | 2.4%), Personal Care & Service (325 | 2.1%), and Healthcare Support (324 | 2.1%).
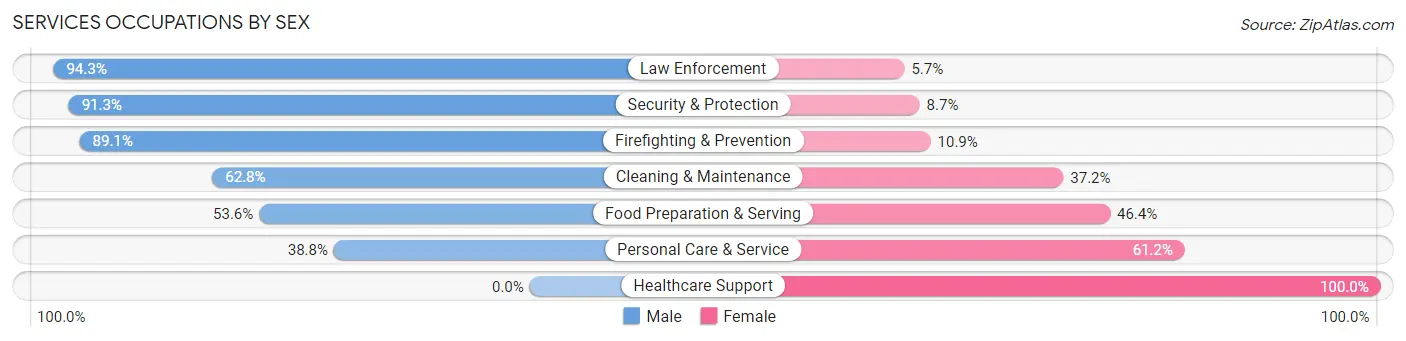
Services Occupations by Sex
Within the Services occupations in Powhatan County, the most male-oriented occupations are Law Enforcement (94.3%), Security & Protection (91.3%), and Firefighting & Prevention (89.1%), while the most female-oriented occupations are Healthcare Support (100.0%), Personal Care & Service (61.2%), and Food Preparation & Serving (46.4%).
| Occupation | Male | Female |
| Healthcare Support | 0 (0.0%) | 324 (100.0%) |
| Security & Protection | 574 (91.3%) | 55 (8.7%) |
| Firefighting & Prevention | 327 (89.1%) | 40 (10.9%) |
| Law Enforcement | 247 (94.3%) | 15 (5.7%) |
| Food Preparation & Serving | 173 (53.6%) | 150 (46.4%) |
| Cleaning & Maintenance | 228 (62.8%) | 135 (37.2%) |
| Personal Care & Service | 126 (38.8%) | 199 (61.2%) |
| Total (Category) | 1,101 (56.1%) | 863 (43.9%) |
| Total (Overall) | 7,960 (51.8%) | 7,392 (48.1%) |
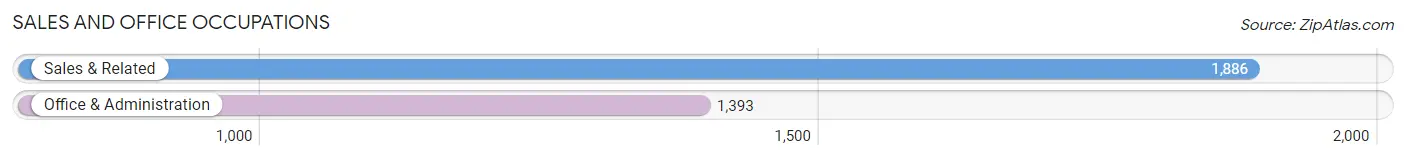
Sales and Office Occupations
The most common Sales and Office occupations in Powhatan County are Sales & Related (1,886 | 12.3%), and Office & Administration (1,393 | 9.1%).
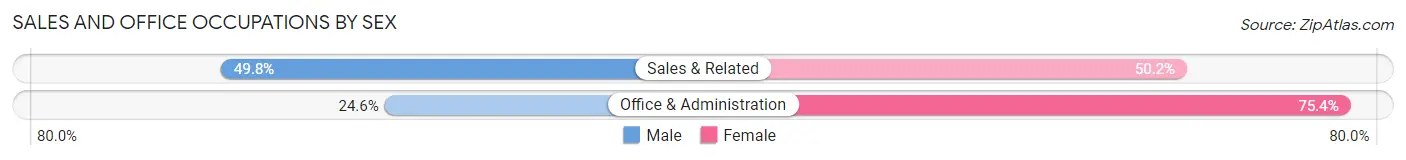
Sales and Office Occupations by Sex
| Occupation | Male | Female |
| Sales & Related | 939 (49.8%) | 947 (50.2%) |
| Office & Administration | 343 (24.6%) | 1,050 (75.4%) |
| Total (Category) | 1,282 (39.1%) | 1,997 (60.9%) |
| Total (Overall) | 7,960 (51.8%) | 7,392 (48.1%) |
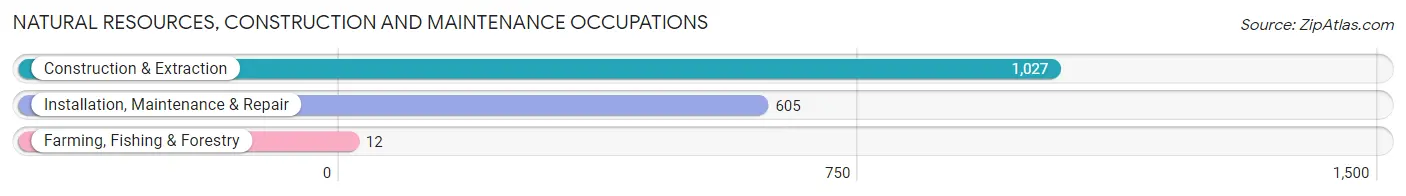
Natural Resources, Construction and Maintenance Occupations
The most common Natural Resources, Construction and Maintenance occupations in Powhatan County are Construction & Extraction (1,027 | 6.7%), Installation, Maintenance & Repair (605 | 3.9%), and Farming, Fishing & Forestry (12 | 0.1%).
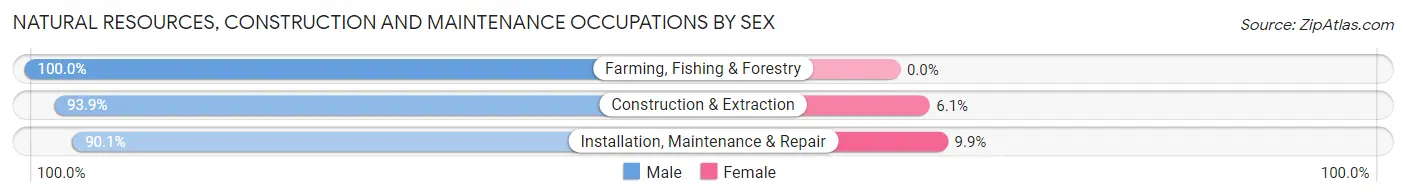
Natural Resources, Construction and Maintenance Occupations by Sex
| Occupation | Male | Female |
| Farming, Fishing & Forestry | 12 (100.0%) | 0 (0.0%) |
| Construction & Extraction | 964 (93.9%) | 63 (6.1%) |
| Installation, Maintenance & Repair | 545 (90.1%) | 60 (9.9%) |
| Total (Category) | 1,521 (92.5%) | 123 (7.5%) |
| Total (Overall) | 7,960 (51.8%) | 7,392 (48.1%) |
Production, Transportation and Moving Occupations
The most common Production, Transportation and Moving occupations in Powhatan County are Transportation (445 | 2.9%), Material Moving (395 | 2.6%), and Production (386 | 2.5%).
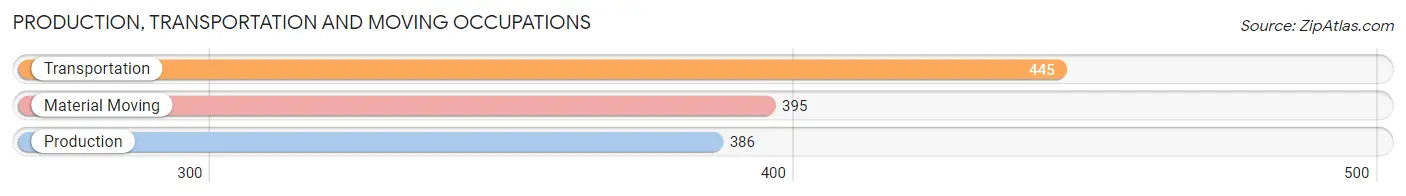
Production, Transportation and Moving Occupations by Sex
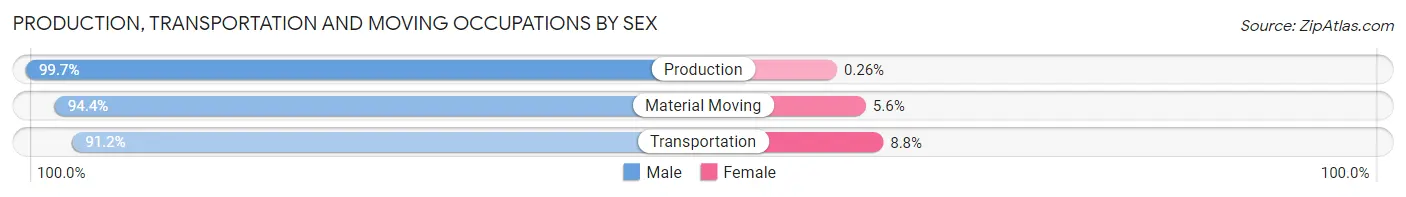
| Occupation | Male | Female |
| Production | 385 (99.7%) | 1 (0.3%) |
| Transportation | 406 (91.2%) | 39 (8.8%) |
| Material Moving | 373 (94.4%) | 22 (5.6%) |
| Total (Category) | 1,164 (94.9%) | 62 (5.1%) |
| Total (Overall) | 7,960 (51.8%) | 7,392 (48.1%) |
Employment Industries by Sex in Powhatan County
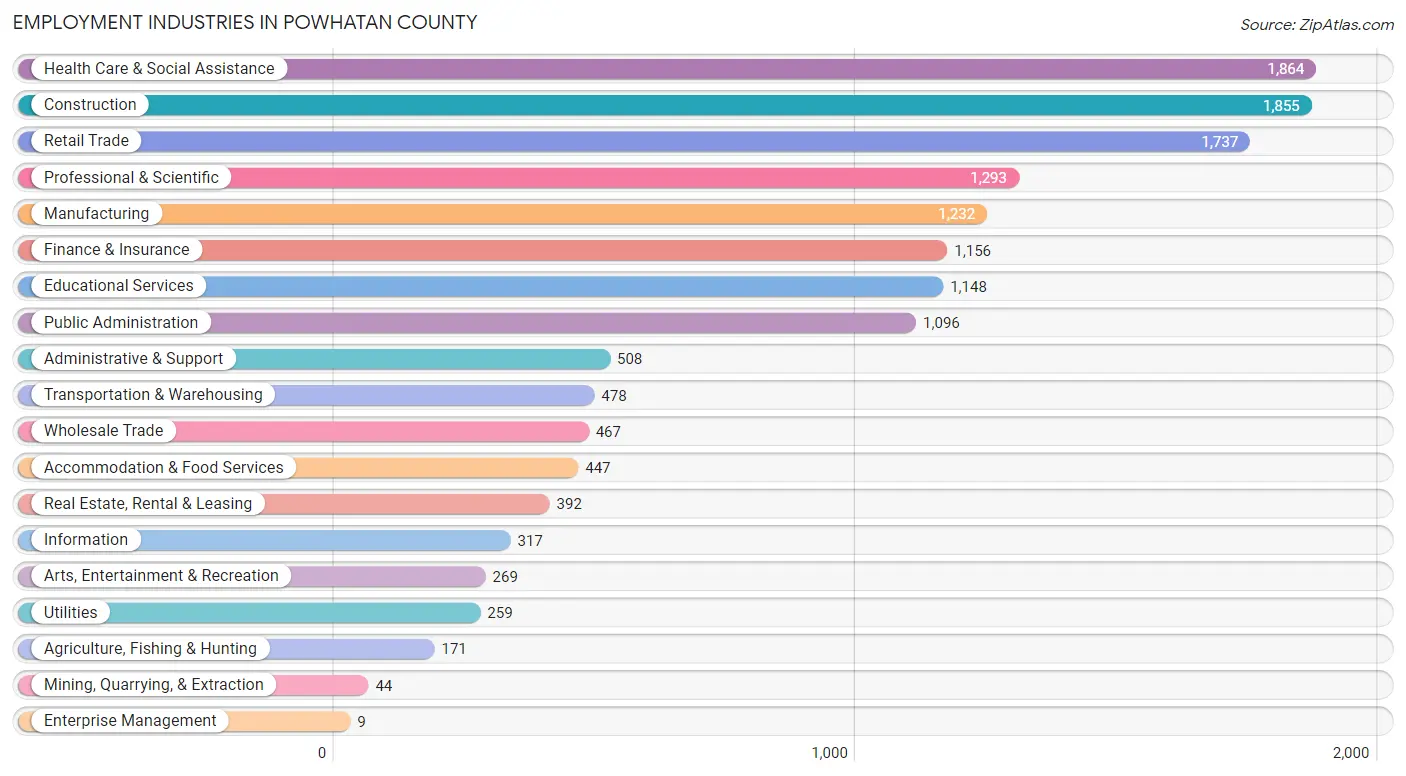
Employment Industries in Powhatan County
The major employment industries in Powhatan County include Health Care & Social Assistance (1,864 | 12.1%), Construction (1,855 | 12.1%), Retail Trade (1,737 | 11.3%), Professional & Scientific (1,293 | 8.4%), and Manufacturing (1,232 | 8.0%).
Employment Industries by Sex in Powhatan County
The Powhatan County industries that see more men than women are Mining, Quarrying, & Extraction (100.0%), Enterprise Management (100.0%), and Manufacturing (92.0%), whereas the industries that tend to have a higher number of women are Educational Services (93.4%), Health Care & Social Assistance (86.6%), and Utilities (83.4%).
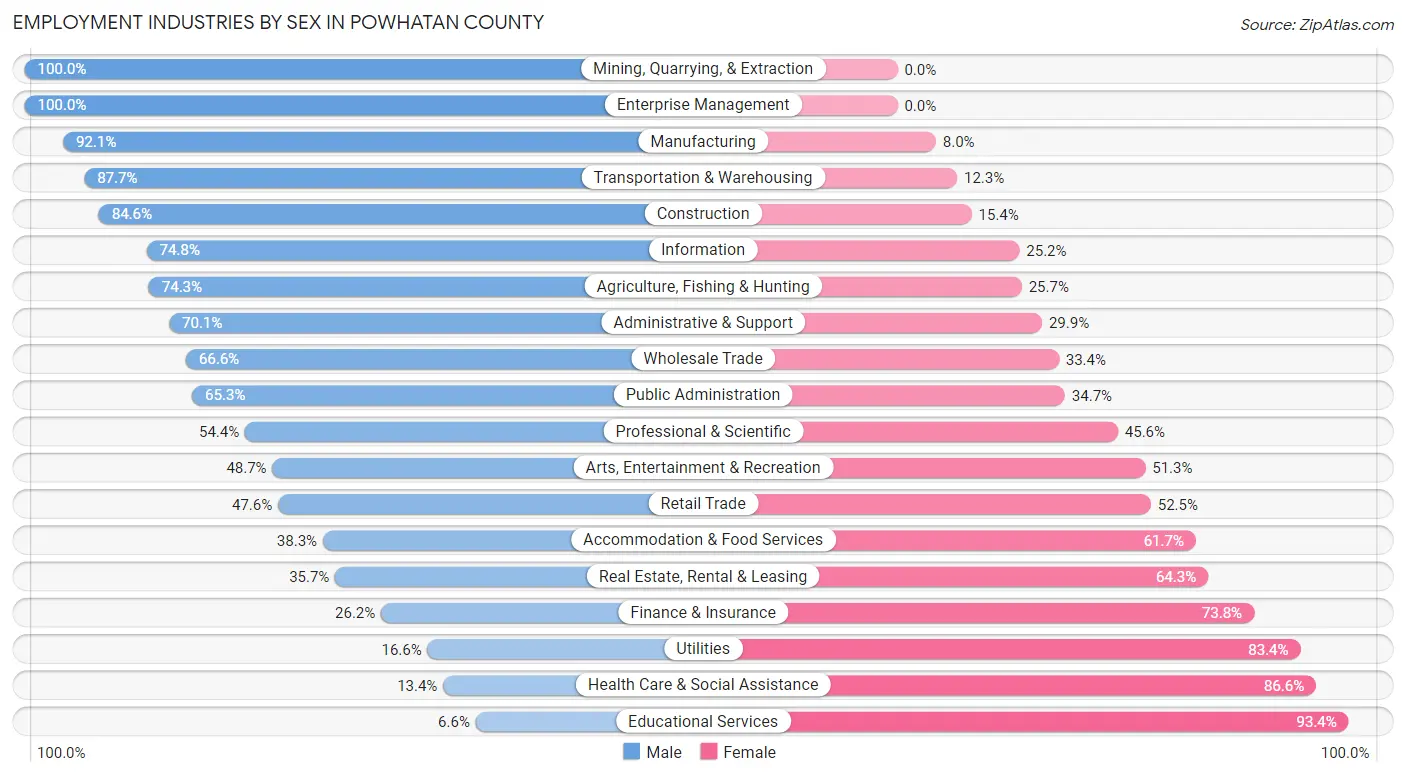
| Industry | Male | Female |
| Agriculture, Fishing & Hunting | 127 (74.3%) | 44 (25.7%) |
| Mining, Quarrying, & Extraction | 44 (100.0%) | 0 (0.0%) |
| Construction | 1,570 (84.6%) | 285 (15.4%) |
| Manufacturing | 1,134 (92.0%) | 98 (8.0%) |
| Wholesale Trade | 311 (66.6%) | 156 (33.4%) |
| Retail Trade | 826 (47.5%) | 911 (52.4%) |
| Transportation & Warehousing | 419 (87.7%) | 59 (12.3%) |
| Utilities | 43 (16.6%) | 216 (83.4%) |
| Information | 237 (74.8%) | 80 (25.2%) |
| Finance & Insurance | 303 (26.2%) | 853 (73.8%) |
| Real Estate, Rental & Leasing | 140 (35.7%) | 252 (64.3%) |
| Professional & Scientific | 703 (54.4%) | 590 (45.6%) |
| Enterprise Management | 9 (100.0%) | 0 (0.0%) |
| Administrative & Support | 356 (70.1%) | 152 (29.9%) |
| Educational Services | 76 (6.6%) | 1,072 (93.4%) |
| Health Care & Social Assistance | 249 (13.4%) | 1,615 (86.6%) |
| Arts, Entertainment & Recreation | 131 (48.7%) | 138 (51.3%) |
| Accommodation & Food Services | 171 (38.3%) | 276 (61.7%) |
| Public Administration | 716 (65.3%) | 380 (34.7%) |
| Total | 7,960 (51.8%) | 7,392 (48.1%) |
Education in Powhatan County
School Enrollment in Powhatan County
The most common levels of schooling among the 5,658 students in Powhatan County are middle school (1,629 | 28.8%), high school (1,476 | 26.1%), and elementary school (985 | 17.4%).
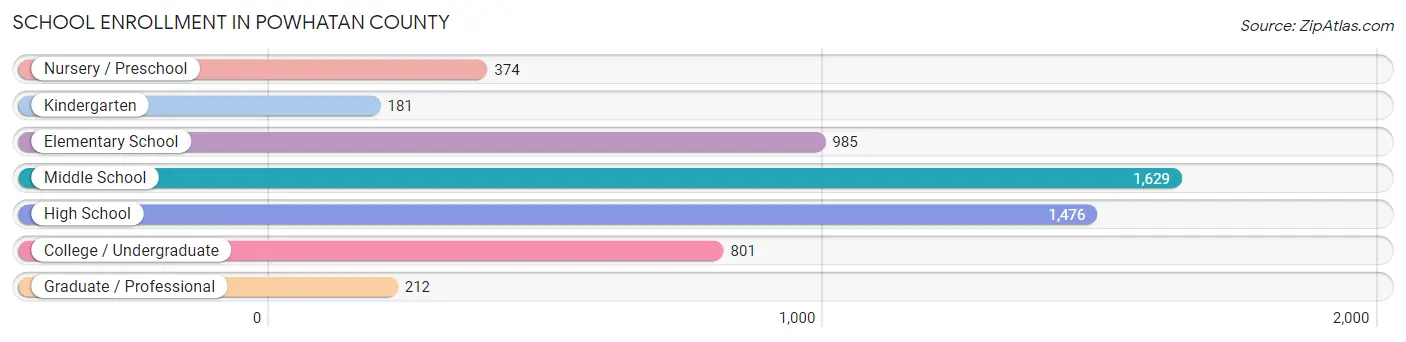
| School Level | # Students | % Students |
| Nursery / Preschool | 374 | 6.6% |
| Kindergarten | 181 | 3.2% |
| Elementary School | 985 | 17.4% |
| Middle School | 1,629 | 28.8% |
| High School | 1,476 | 26.1% |
| College / Undergraduate | 801 | 14.2% |
| Graduate / Professional | 212 | 3.7% |
| Total | 5,658 | 100.0% |
School Enrollment by Age by Funding Source in Powhatan County
Out of a total of 5,658 students who are enrolled in schools in Powhatan County, 736 (13.0%) attend a private institution, while the remaining 4,922 (87.0%) are enrolled in public schools. The age group of 3 to 4 year olds has the highest likelihood of being enrolled in private schools, with 203 (58.8% in the age bracket) enrolled. Conversely, the age group of 15 to 17 year olds has the lowest likelihood of being enrolled in a private school, with 1,025 (98.7% in the age bracket) attending a public institution.
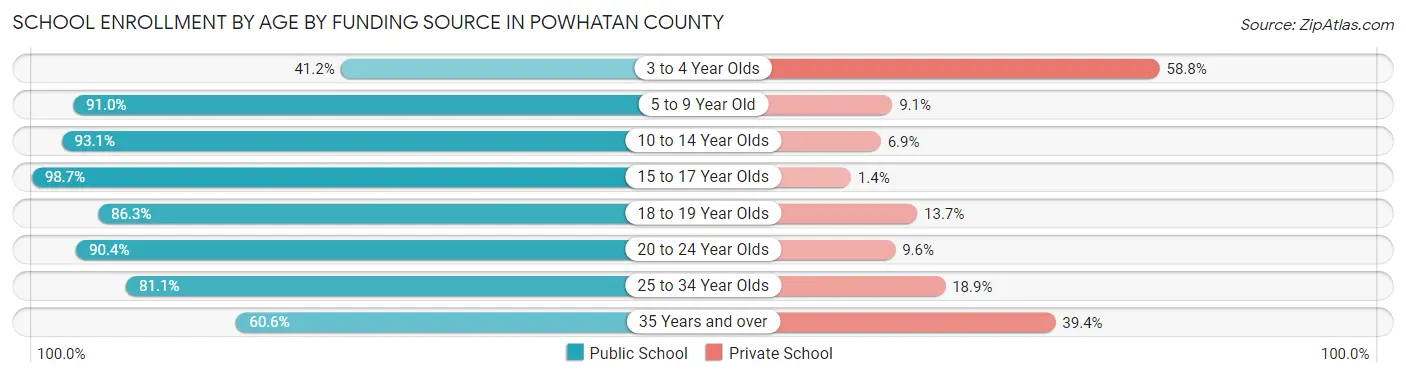
| Age Bracket | Public School | Private School |
| 3 to 4 Year Olds | 142 (41.2%) | 203 (58.8%) |
| 5 to 9 Year Old | 1,045 (90.9%) | 104 (9.0%) |
| 10 to 14 Year Olds | 1,713 (93.1%) | 127 (6.9%) |
| 15 to 17 Year Olds | 1,025 (98.7%) | 14 (1.3%) |
| 18 to 19 Year Olds | 366 (86.3%) | 58 (13.7%) |
| 20 to 24 Year Olds | 226 (90.4%) | 24 (9.6%) |
| 25 to 34 Year Olds | 150 (81.1%) | 35 (18.9%) |
| 35 Years and over | 258 (60.6%) | 168 (39.4%) |
| Total | 4,922 (87.0%) | 736 (13.0%) |
Educational Attainment by Field of Study in Powhatan County
Business (1,703 | 20.7%), education (1,105 | 13.5%), science & technology (724 | 8.8%), arts & humanities (692 | 8.4%), and computers & mathematics (585 | 7.1%) are the most common fields of study among 8,216 individuals in Powhatan County who have obtained a bachelor's degree or higher.
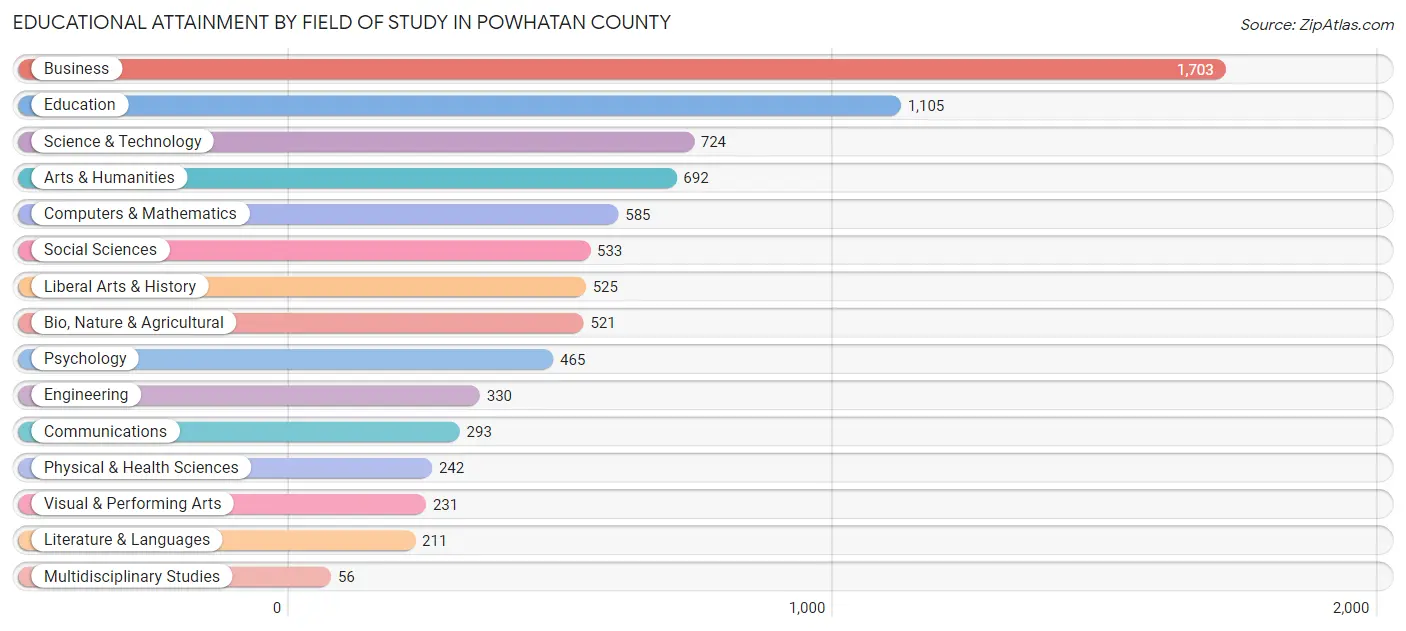
| Field of Study | # Graduates | % Graduates |
| Computers & Mathematics | 585 | 7.1% |
| Bio, Nature & Agricultural | 521 | 6.3% |
| Physical & Health Sciences | 242 | 2.9% |
| Psychology | 465 | 5.7% |
| Social Sciences | 533 | 6.5% |
| Engineering | 330 | 4.0% |
| Multidisciplinary Studies | 56 | 0.7% |
| Science & Technology | 724 | 8.8% |
| Business | 1,703 | 20.7% |
| Education | 1,105 | 13.5% |
| Literature & Languages | 211 | 2.6% |
| Liberal Arts & History | 525 | 6.4% |
| Visual & Performing Arts | 231 | 2.8% |
| Communications | 293 | 3.6% |
| Arts & Humanities | 692 | 8.4% |
| Total | 8,216 | 100.0% |
Transportation & Commute in Powhatan County
Vehicle Availability by Sex in Powhatan County
The most prevalent vehicle ownership categories in Powhatan County are males with 2 vehicles (2,868, accounting for 36.6%) and females with 2 vehicles (2,815, making up 39.3%).
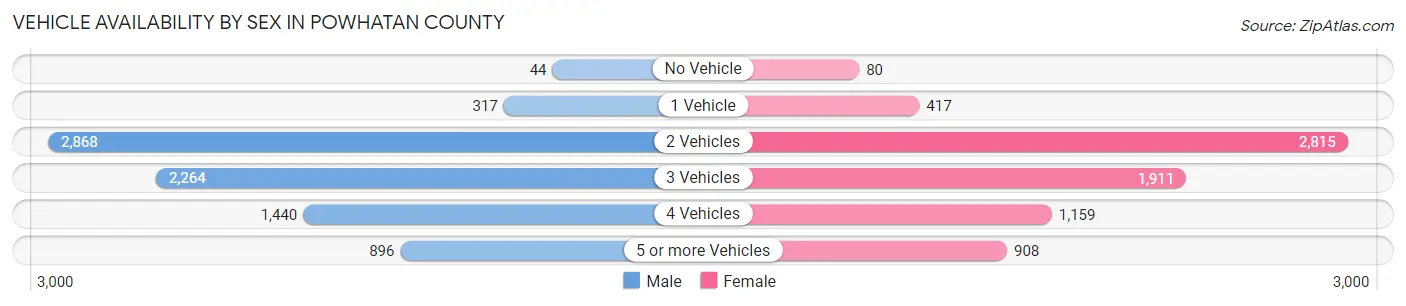
| Vehicles Available | Male | Female |
| No Vehicle | 44 (0.6%) | 80 (1.1%) |
| 1 Vehicle | 317 (4.1%) | 417 (5.7%) |
| 2 Vehicles | 2,868 (36.6%) | 2,815 (38.6%) |
| 3 Vehicles | 2,264 (28.9%) | 1,911 (26.2%) |
| 4 Vehicles | 1,440 (18.4%) | 1,159 (15.9%) |
| 5 or more Vehicles | 896 (11.4%) | 908 (12.5%) |
| Total | 7,829 (100.0%) | 7,290 (100.0%) |
Commute Time in Powhatan County
The most frequently occuring commute durations in Powhatan County are 45 to 59 minutes (2,727 commuters, 21.4%), 30 to 34 minutes (1,892 commuters, 14.8%), and 10 to 14 minutes (1,233 commuters, 9.7%).
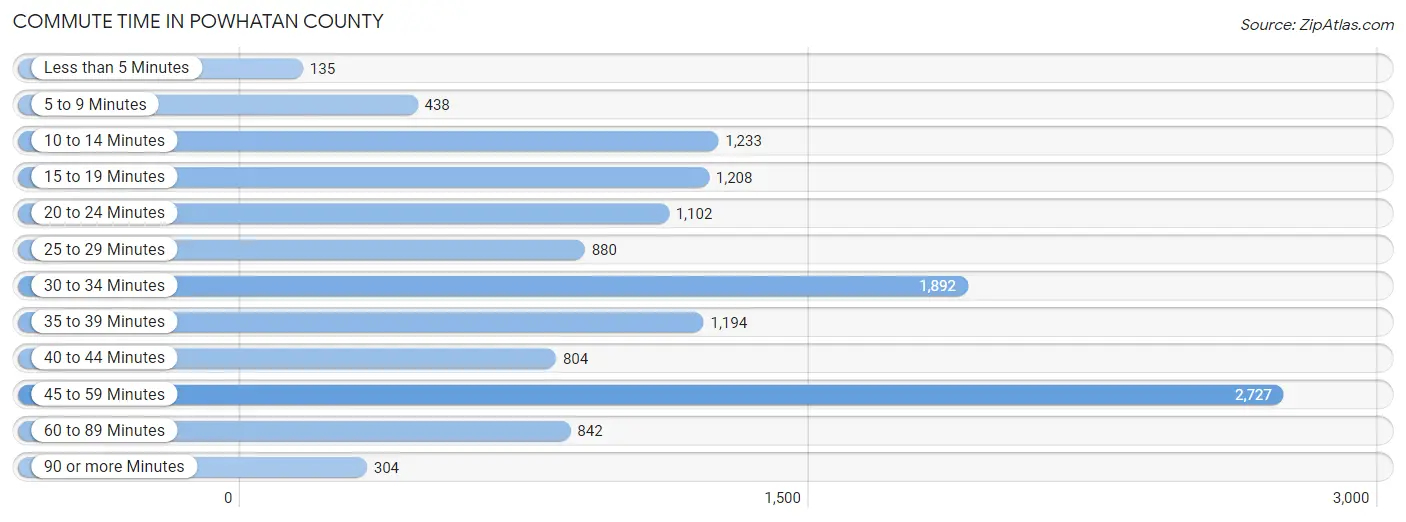
| Commute Time | # Commuters | % Commuters |
| Less than 5 Minutes | 135 | 1.1% |
| 5 to 9 Minutes | 438 | 3.4% |
| 10 to 14 Minutes | 1,233 | 9.7% |
| 15 to 19 Minutes | 1,208 | 9.5% |
| 20 to 24 Minutes | 1,102 | 8.6% |
| 25 to 29 Minutes | 880 | 6.9% |
| 30 to 34 Minutes | 1,892 | 14.8% |
| 35 to 39 Minutes | 1,194 | 9.4% |
| 40 to 44 Minutes | 804 | 6.3% |
| 45 to 59 Minutes | 2,727 | 21.4% |
| 60 to 89 Minutes | 842 | 6.6% |
| 90 or more Minutes | 304 | 2.4% |
Commute Time by Sex in Powhatan County
The most common commute times in Powhatan County are 45 to 59 minutes (1,746 commuters, 25.0%) for males and 45 to 59 minutes (981 commuters, 17.0%) for females.
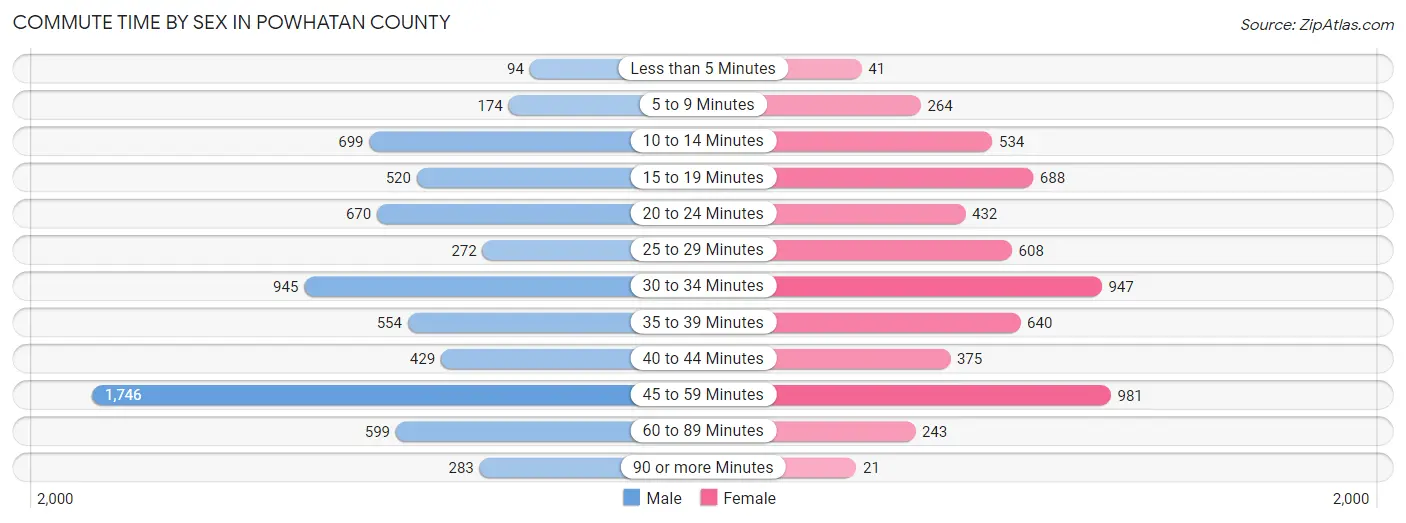
| Commute Time | Male | Female |
| Less than 5 Minutes | 94 (1.3%) | 41 (0.7%) |
| 5 to 9 Minutes | 174 (2.5%) | 264 (4.6%) |
| 10 to 14 Minutes | 699 (10.0%) | 534 (9.2%) |
| 15 to 19 Minutes | 520 (7.4%) | 688 (11.9%) |
| 20 to 24 Minutes | 670 (9.6%) | 432 (7.5%) |
| 25 to 29 Minutes | 272 (3.9%) | 608 (10.5%) |
| 30 to 34 Minutes | 945 (13.5%) | 947 (16.4%) |
| 35 to 39 Minutes | 554 (7.9%) | 640 (11.1%) |
| 40 to 44 Minutes | 429 (6.1%) | 375 (6.5%) |
| 45 to 59 Minutes | 1,746 (25.0%) | 981 (17.0%) |
| 60 to 89 Minutes | 599 (8.6%) | 243 (4.2%) |
| 90 or more Minutes | 283 (4.1%) | 21 (0.4%) |
Time of Departure to Work by Sex in Powhatan County
The most frequent times of departure to work in Powhatan County are 7:00 AM to 7:29 AM (1,317, 18.9%) for males and 7:00 AM to 7:29 AM (1,076, 18.6%) for females.
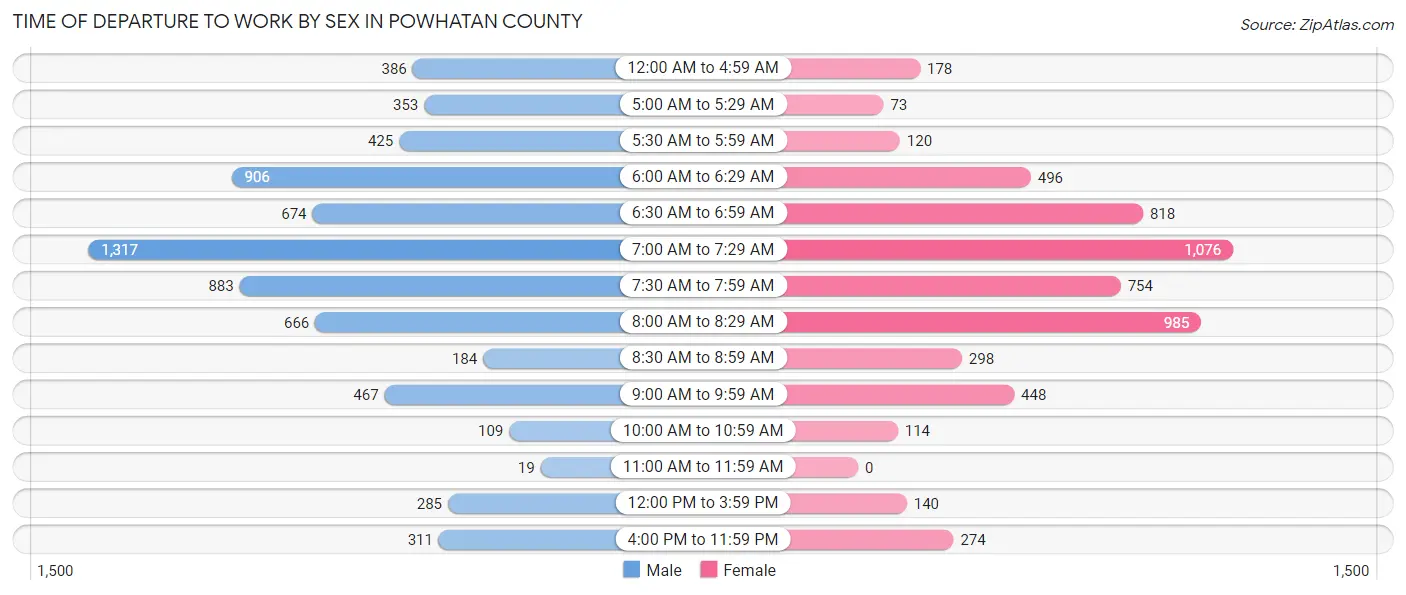
| Time of Departure | Male | Female |
| 12:00 AM to 4:59 AM | 386 (5.5%) | 178 (3.1%) |
| 5:00 AM to 5:29 AM | 353 (5.1%) | 73 (1.3%) |
| 5:30 AM to 5:59 AM | 425 (6.1%) | 120 (2.1%) |
| 6:00 AM to 6:29 AM | 906 (13.0%) | 496 (8.6%) |
| 6:30 AM to 6:59 AM | 674 (9.7%) | 818 (14.2%) |
| 7:00 AM to 7:29 AM | 1,317 (18.9%) | 1,076 (18.6%) |
| 7:30 AM to 7:59 AM | 883 (12.6%) | 754 (13.1%) |
| 8:00 AM to 8:29 AM | 666 (9.5%) | 985 (17.1%) |
| 8:30 AM to 8:59 AM | 184 (2.6%) | 298 (5.2%) |
| 9:00 AM to 9:59 AM | 467 (6.7%) | 448 (7.8%) |
| 10:00 AM to 10:59 AM | 109 (1.6%) | 114 (2.0%) |
| 11:00 AM to 11:59 AM | 19 (0.3%) | 0 (0.0%) |
| 12:00 PM to 3:59 PM | 285 (4.1%) | 140 (2.4%) |
| 4:00 PM to 11:59 PM | 311 (4.4%) | 274 (4.8%) |
| Total | 6,985 (100.0%) | 5,774 (100.0%) |
Housing Occupancy in Powhatan County
Occupancy by Ownership in Powhatan County
Of the total 11,077 dwellings in Powhatan County, owner-occupied units account for 10,099 (91.2%), while renter-occupied units make up 978 (8.8%).
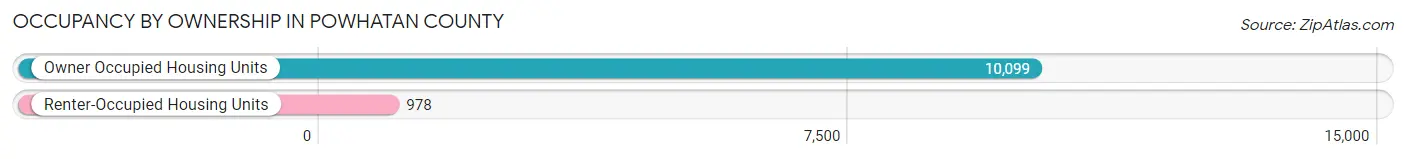
| Occupancy | # Housing Units | % Housing Units |
| Owner Occupied Housing Units | 10,099 | 91.2% |
| Renter-Occupied Housing Units | 978 | 8.8% |
| Total Occupied Housing Units | 11,077 | 100.0% |
Occupancy by Household Size in Powhatan County
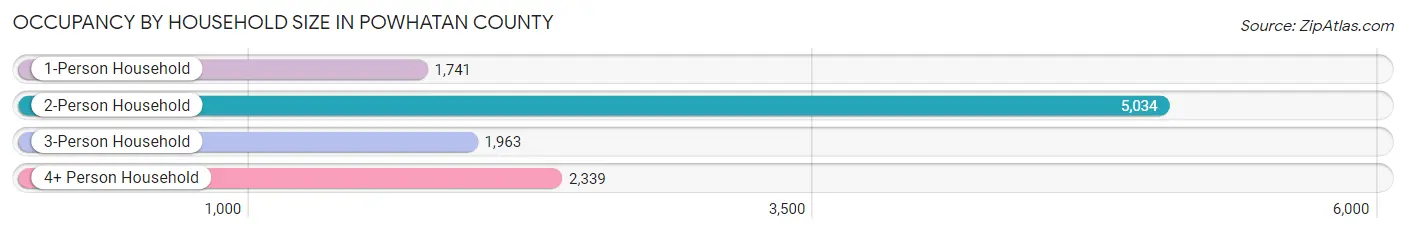
| Household Size | # Housing Units | % Housing Units |
| 1-Person Household | 1,741 | 15.7% |
| 2-Person Household | 5,034 | 45.5% |
| 3-Person Household | 1,963 | 17.7% |
| 4+ Person Household | 2,339 | 21.1% |
| Total Housing Units | 11,077 | 100.0% |
Occupancy by Ownership by Household Size in Powhatan County
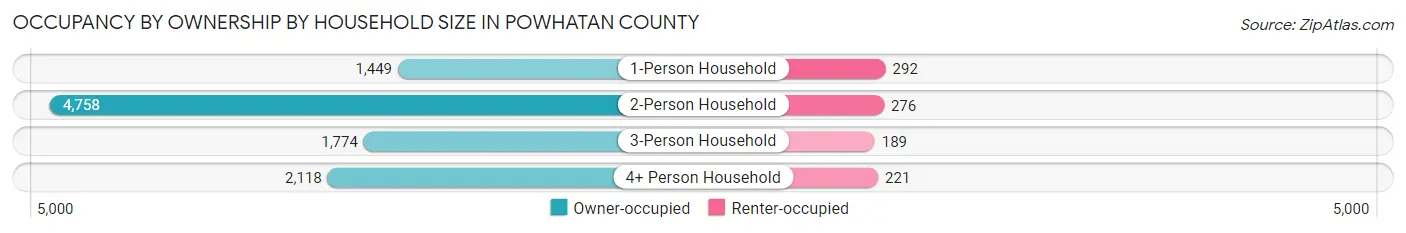
| Household Size | Owner-occupied | Renter-occupied |
| 1-Person Household | 1,449 (83.2%) | 292 (16.8%) |
| 2-Person Household | 4,758 (94.5%) | 276 (5.5%) |
| 3-Person Household | 1,774 (90.4%) | 189 (9.6%) |
| 4+ Person Household | 2,118 (90.5%) | 221 (9.5%) |
| Total Housing Units | 10,099 (91.2%) | 978 (8.8%) |
Occupancy by Educational Attainment in Powhatan County
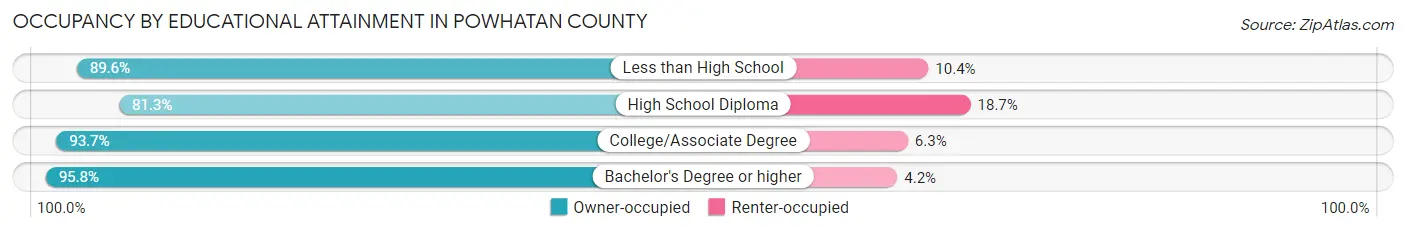
| Household Size | Owner-occupied | Renter-occupied |
| Less than High School | 545 (89.6%) | 63 (10.4%) |
| High School Diploma | 2,248 (81.3%) | 518 (18.7%) |
| College/Associate Degree | 3,309 (93.7%) | 222 (6.3%) |
| Bachelor's Degree or higher | 3,997 (95.8%) | 175 (4.2%) |
Occupancy by Age of Householder in Powhatan County
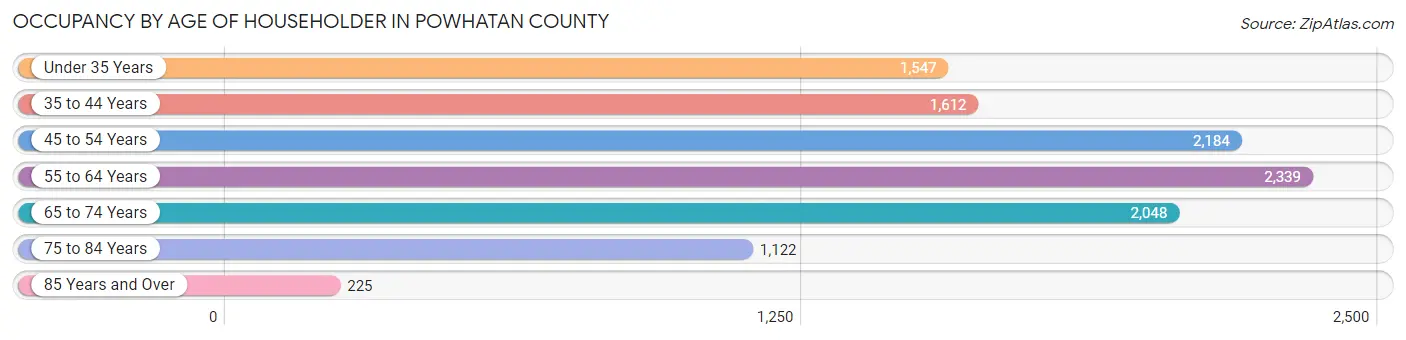
| Age Bracket | # Households | % Households |
| Under 35 Years | 1,547 | 14.0% |
| 35 to 44 Years | 1,612 | 14.5% |
| 45 to 54 Years | 2,184 | 19.7% |
| 55 to 64 Years | 2,339 | 21.1% |
| 65 to 74 Years | 2,048 | 18.5% |
| 75 to 84 Years | 1,122 | 10.1% |
| 85 Years and Over | 225 | 2.0% |
| Total | 11,077 | 100.0% |
Housing Finances in Powhatan County
Median Income by Occupancy in Powhatan County
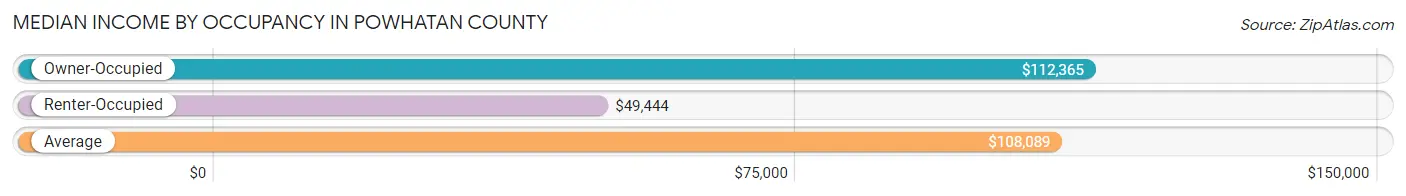
| Occupancy Type | # Households | Median Income |
| Owner-Occupied | 10,099 (91.2%) | $112,365 |
| Renter-Occupied | 978 (8.8%) | $49,444 |
| Average | 11,077 (100.0%) | $108,089 |
Occupancy by Householder Income Bracket in Powhatan County
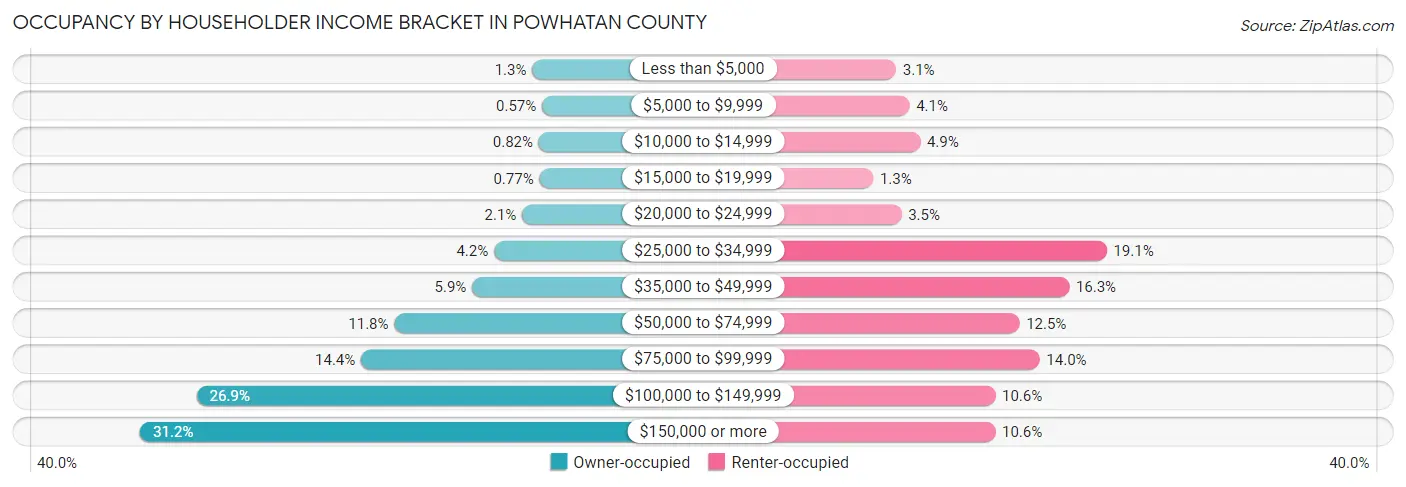
| Income Bracket | Owner-occupied | Renter-occupied |
| Less than $5,000 | 133 (1.3%) | 30 (3.1%) |
| $5,000 to $9,999 | 58 (0.6%) | 40 (4.1%) |
| $10,000 to $14,999 | 83 (0.8%) | 48 (4.9%) |
| $15,000 to $19,999 | 78 (0.8%) | 13 (1.3%) |
| $20,000 to $24,999 | 211 (2.1%) | 34 (3.5%) |
| $25,000 to $34,999 | 427 (4.2%) | 187 (19.1%) |
| $35,000 to $49,999 | 596 (5.9%) | 159 (16.3%) |
| $50,000 to $74,999 | 1,195 (11.8%) | 122 (12.5%) |
| $75,000 to $99,999 | 1,450 (14.4%) | 137 (14.0%) |
| $100,000 to $149,999 | 2,717 (26.9%) | 104 (10.6%) |
| $150,000 or more | 3,151 (31.2%) | 104 (10.6%) |
| Total | 10,099 (100.0%) | 978 (100.0%) |
Monthly Housing Cost Tiers in Powhatan County
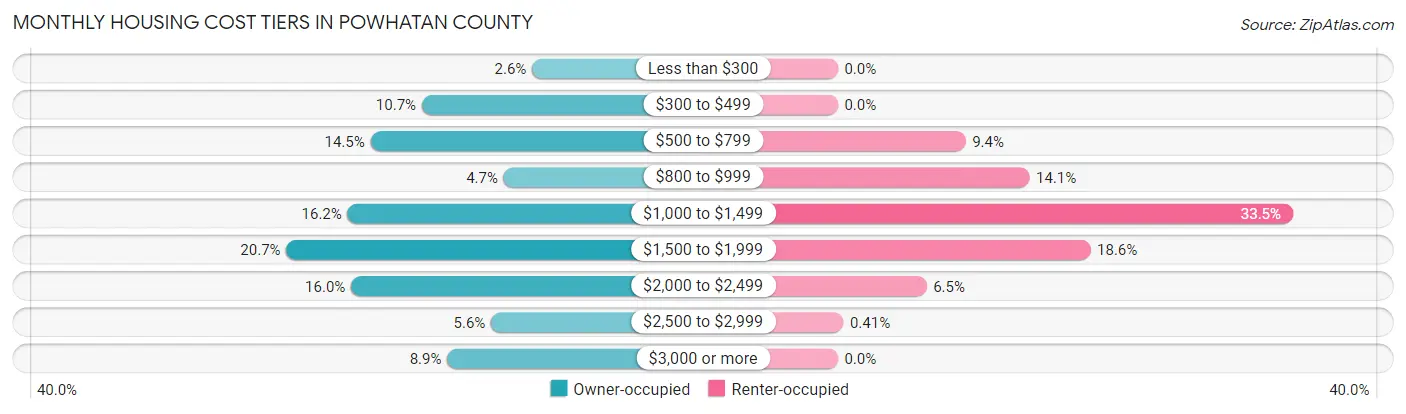
| Monthly Cost | Owner-occupied | Renter-occupied |
| Less than $300 | 265 (2.6%) | 0 (0.0%) |
| $300 to $499 | 1,085 (10.7%) | 0 (0.0%) |
| $500 to $799 | 1,466 (14.5%) | 92 (9.4%) |
| $800 to $999 | 476 (4.7%) | 138 (14.1%) |
| $1,000 to $1,499 | 1,637 (16.2%) | 328 (33.5%) |
| $1,500 to $1,999 | 2,093 (20.7%) | 182 (18.6%) |
| $2,000 to $2,499 | 1,611 (16.0%) | 64 (6.5%) |
| $2,500 to $2,999 | 570 (5.6%) | 4 (0.4%) |
| $3,000 or more | 896 (8.9%) | 0 (0.0%) |
| Total | 10,099 (100.0%) | 978 (100.0%) |
Physical Housing Characteristics in Powhatan County
Housing Structures in Powhatan County
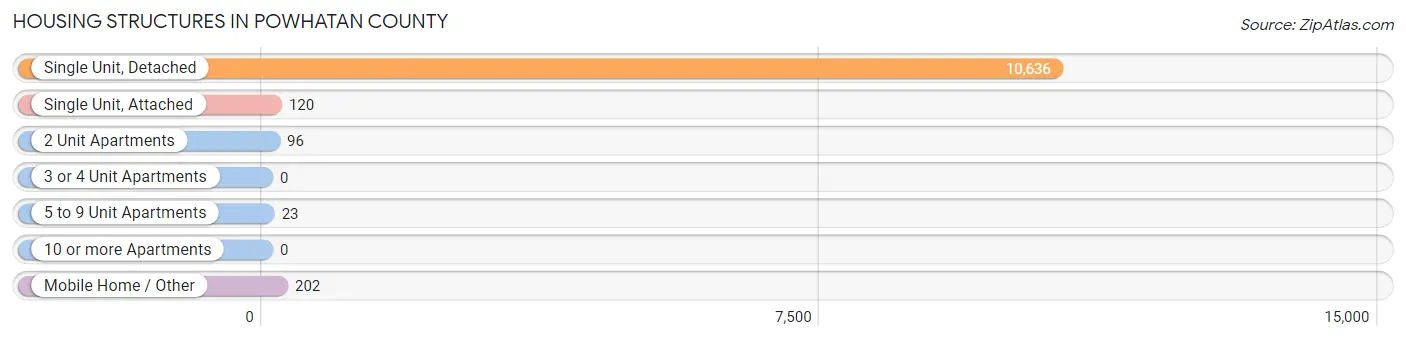
| Structure Type | # Housing Units | % Housing Units |
| Single Unit, Detached | 10,636 | 96.0% |
| Single Unit, Attached | 120 | 1.1% |
| 2 Unit Apartments | 96 | 0.9% |
| 3 or 4 Unit Apartments | 0 | 0.0% |
| 5 to 9 Unit Apartments | 23 | 0.2% |
| 10 or more Apartments | 0 | 0.0% |
| Mobile Home / Other | 202 | 1.8% |
| Total | 11,077 | 100.0% |
Housing Structures by Occupancy in Powhatan County
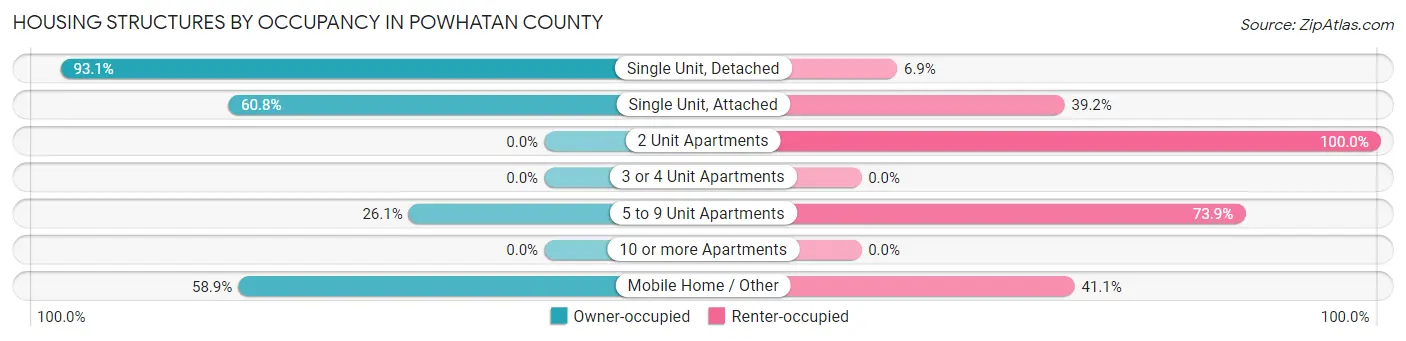
| Structure Type | Owner-occupied | Renter-occupied |
| Single Unit, Detached | 9,901 (93.1%) | 735 (6.9%) |
| Single Unit, Attached | 73 (60.8%) | 47 (39.2%) |
| 2 Unit Apartments | 0 (0.0%) | 96 (100.0%) |
| 3 or 4 Unit Apartments | 0 (0.0%) | 0 (0.0%) |
| 5 to 9 Unit Apartments | 6 (26.1%) | 17 (73.9%) |
| 10 or more Apartments | 0 (0.0%) | 0 (0.0%) |
| Mobile Home / Other | 119 (58.9%) | 83 (41.1%) |
| Total | 10,099 (91.2%) | 978 (8.8%) |
Housing Structures by Number of Rooms in Powhatan County
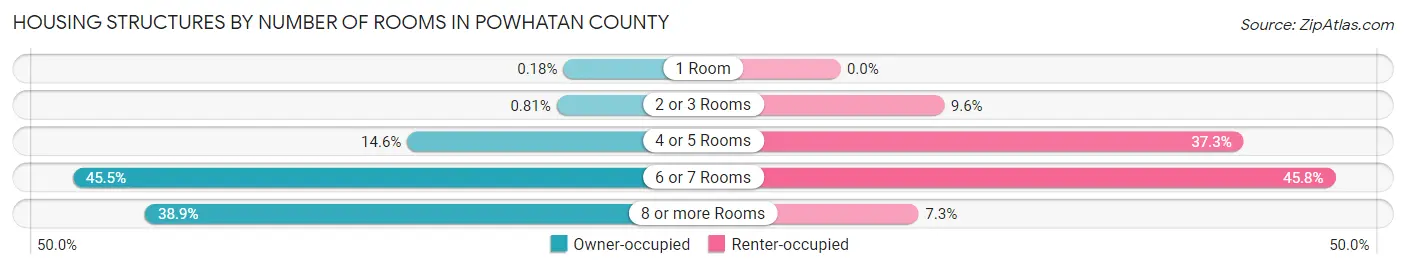
| Number of Rooms | Owner-occupied | Renter-occupied |
| 1 Room | 18 (0.2%) | 0 (0.0%) |
| 2 or 3 Rooms | 82 (0.8%) | 94 (9.6%) |
| 4 or 5 Rooms | 1,476 (14.6%) | 365 (37.3%) |
| 6 or 7 Rooms | 4,599 (45.5%) | 448 (45.8%) |
| 8 or more Rooms | 3,924 (38.9%) | 71 (7.3%) |
| Total | 10,099 (100.0%) | 978 (100.0%) |
Housing Structure by Heating Type in Powhatan County
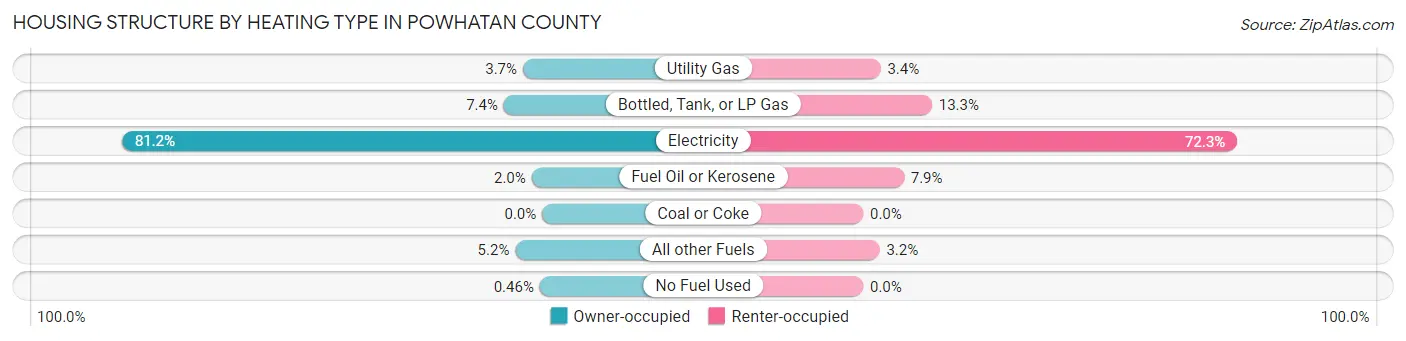
| Heating Type | Owner-occupied | Renter-occupied |
| Utility Gas | 376 (3.7%) | 33 (3.4%) |
| Bottled, Tank, or LP Gas | 747 (7.4%) | 130 (13.3%) |
| Electricity | 8,201 (81.2%) | 707 (72.3%) |
| Fuel Oil or Kerosene | 205 (2.0%) | 77 (7.9%) |
| Coal or Coke | 0 (0.0%) | 0 (0.0%) |
| All other Fuels | 524 (5.2%) | 31 (3.2%) |
| No Fuel Used | 46 (0.5%) | 0 (0.0%) |
| Total | 10,099 (100.0%) | 978 (100.0%) |
Household Vehicle Usage in Powhatan County
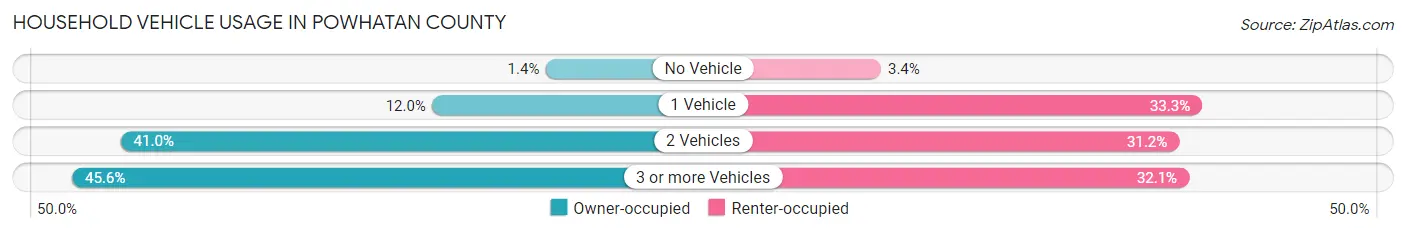
| Vehicles per Household | Owner-occupied | Renter-occupied |
| No Vehicle | 141 (1.4%) | 33 (3.4%) |
| 1 Vehicle | 1,212 (12.0%) | 326 (33.3%) |
| 2 Vehicles | 4,144 (41.0%) | 305 (31.2%) |
| 3 or more Vehicles | 4,602 (45.6%) | 314 (32.1%) |
| Total | 10,099 (100.0%) | 978 (100.0%) |
Real Estate & Mortgages in Powhatan County
Real Estate and Mortgage Overview in Powhatan County
| Characteristic | Without Mortgage | With Mortgage |
| Housing Units | 3,080 | 7,019 |
| Median Property Value | $364,100 | $353,400 |
| Median Household Income | $76,007 | $2,668 |
| Monthly Housing Costs | $540 | $877 |
| Real Estate Taxes | $2,384 | $29 |
Property Value by Mortgage Status in Powhatan County
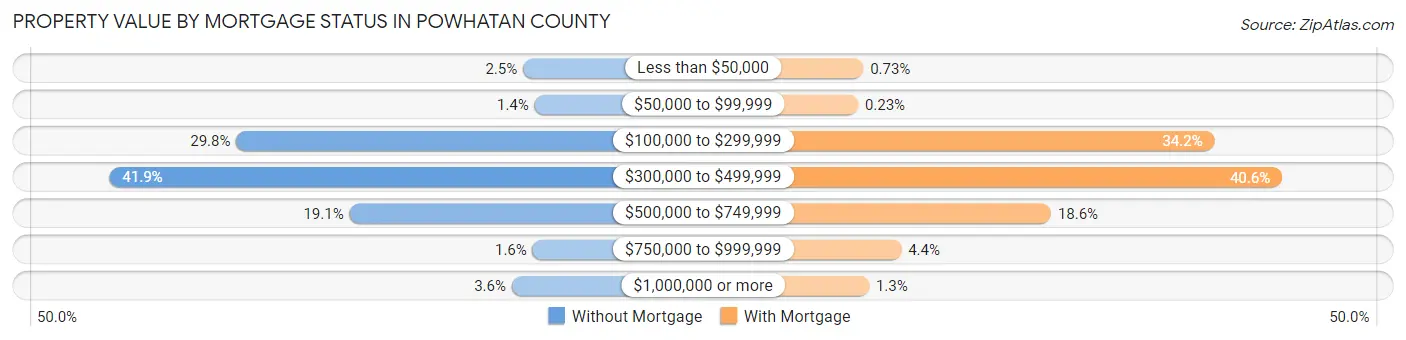
| Property Value | Without Mortgage | With Mortgage |
| Less than $50,000 | 78 (2.5%) | 51 (0.7%) |
| $50,000 to $99,999 | 44 (1.4%) | 16 (0.2%) |
| $100,000 to $299,999 | 919 (29.8%) | 2,399 (34.2%) |
| $300,000 to $499,999 | 1,291 (41.9%) | 2,852 (40.6%) |
| $500,000 to $749,999 | 587 (19.1%) | 1,306 (18.6%) |
| $750,000 to $999,999 | 50 (1.6%) | 305 (4.3%) |
| $1,000,000 or more | 111 (3.6%) | 90 (1.3%) |
| Total | 3,080 (100.0%) | 7,019 (100.0%) |
Household Income by Mortgage Status in Powhatan County
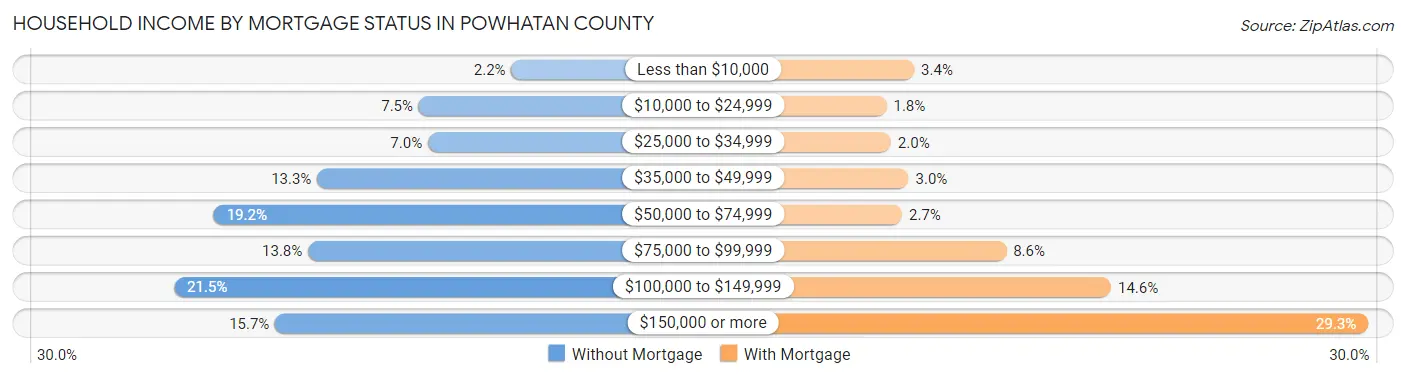
| Household Income | Without Mortgage | With Mortgage |
| Less than $10,000 | 67 (2.2%) | 235 (3.4%) |
| $10,000 to $24,999 | 230 (7.5%) | 124 (1.8%) |
| $25,000 to $34,999 | 214 (7.0%) | 142 (2.0%) |
| $35,000 to $49,999 | 409 (13.3%) | 213 (3.0%) |
| $50,000 to $74,999 | 591 (19.2%) | 187 (2.7%) |
| $75,000 to $99,999 | 425 (13.8%) | 604 (8.6%) |
| $100,000 to $149,999 | 661 (21.5%) | 1,025 (14.6%) |
| $150,000 or more | 483 (15.7%) | 2,056 (29.3%) |
| Total | 3,080 (100.0%) | 7,019 (100.0%) |
Property Value to Household Income Ratio in Powhatan County
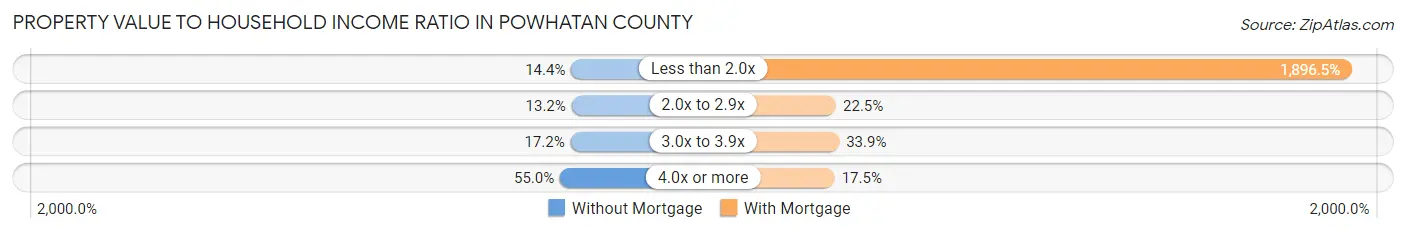
| Value-to-Income Ratio | Without Mortgage | With Mortgage |
| Less than 2.0x | 444 (14.4%) | 133,114 (1,896.5%) |
| 2.0x to 2.9x | 406 (13.2%) | 1,579 (22.5%) |
| 3.0x to 3.9x | 530 (17.2%) | 2,378 (33.9%) |
| 4.0x or more | 1,694 (55.0%) | 1,230 (17.5%) |
| Total | 3,080 (100.0%) | 7,019 (100.0%) |
Real Estate Taxes by Mortgage Status in Powhatan County
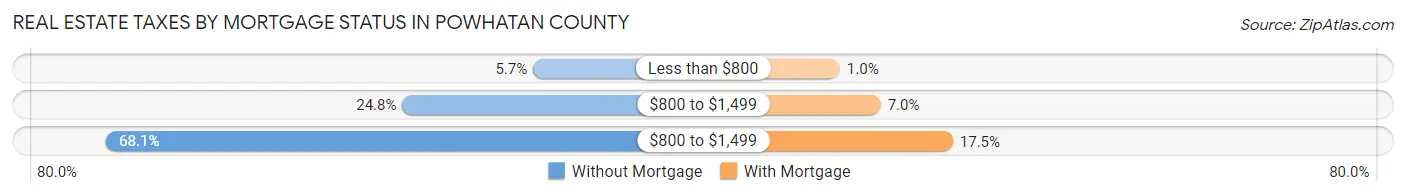
| Property Taxes | Without Mortgage | With Mortgage |
| Less than $800 | 176 (5.7%) | 70 (1.0%) |
| $800 to $1,499 | 764 (24.8%) | 489 (7.0%) |
| $800 to $1,499 | 2,097 (68.1%) | 1,229 (17.5%) |
| Total | 3,080 (100.0%) | 7,019 (100.0%) |
Health & Disability in Powhatan County
Health Insurance Coverage by Age in Powhatan County
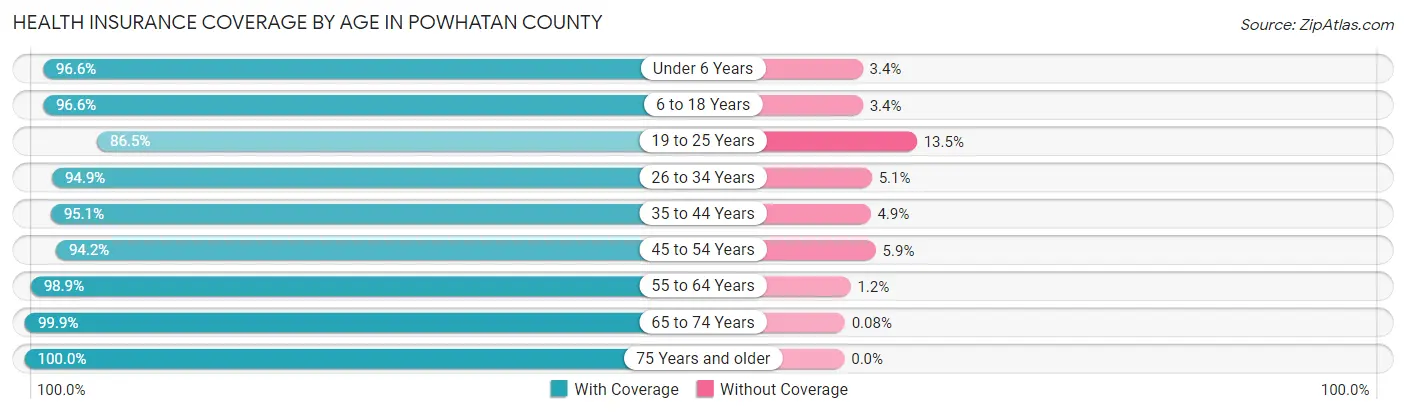
| Age Bracket | With Coverage | Without Coverage |
| Under 6 Years | 1,354 (96.6%) | 48 (3.4%) |
| 6 to 18 Years | 4,050 (96.6%) | 144 (3.4%) |
| 19 to 25 Years | 1,710 (86.5%) | 267 (13.5%) |
| 26 to 34 Years | 2,565 (94.9%) | 138 (5.1%) |
| 35 to 44 Years | 3,569 (95.1%) | 183 (4.9%) |
| 45 to 54 Years | 4,040 (94.2%) | 251 (5.9%) |
| 55 to 64 Years | 4,716 (98.9%) | 55 (1.1%) |
| 65 to 74 Years | 3,592 (99.9%) | 3 (0.1%) |
| 75 Years and older | 2,176 (100.0%) | 0 (0.0%) |
| Total | 27,772 (96.2%) | 1,089 (3.8%) |
Health Insurance Coverage by Citizenship Status in Powhatan County
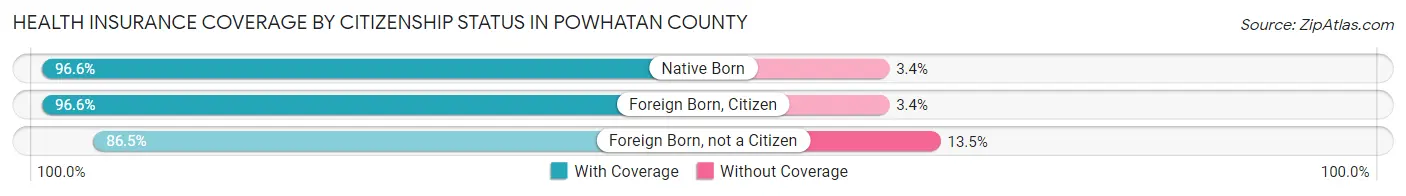
| Citizenship Status | With Coverage | Without Coverage |
| Native Born | 1,354 (96.6%) | 48 (3.4%) |
| Foreign Born, Citizen | 4,050 (96.6%) | 144 (3.4%) |
| Foreign Born, not a Citizen | 1,710 (86.5%) | 267 (13.5%) |
Health Insurance Coverage by Household Income in Powhatan County
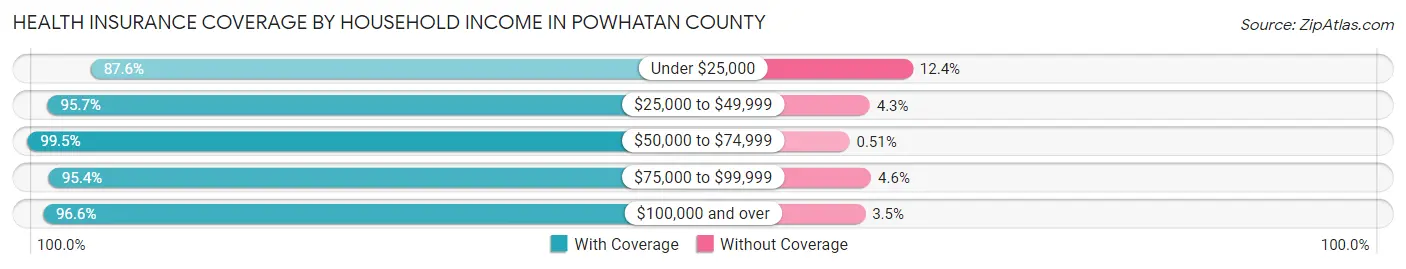
| Household Income | With Coverage | Without Coverage |
| Under $25,000 | 1,011 (87.6%) | 143 (12.4%) |
| $25,000 to $49,999 | 2,351 (95.7%) | 106 (4.3%) |
| $50,000 to $74,999 | 2,718 (99.5%) | 14 (0.5%) |
| $75,000 to $99,999 | 3,701 (95.4%) | 177 (4.6%) |
| $100,000 and over | 17,949 (96.6%) | 641 (3.5%) |
Public vs Private Health Insurance Coverage by Age in Powhatan County
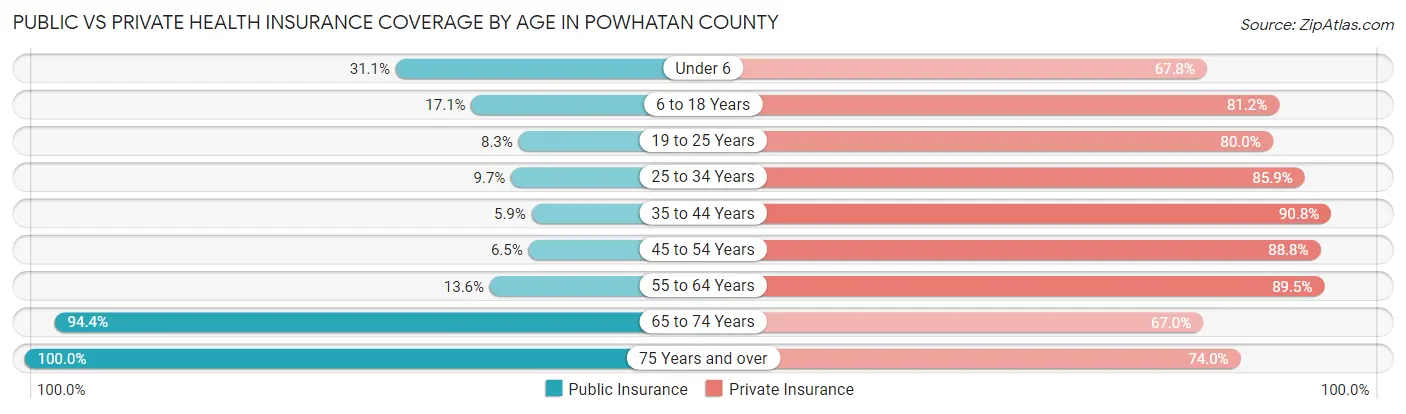
| Age Bracket | Public Insurance | Private Insurance |
| Under 6 | 436 (31.1%) | 950 (67.8%) |
| 6 to 18 Years | 716 (17.1%) | 3,404 (81.2%) |
| 19 to 25 Years | 164 (8.3%) | 1,581 (80.0%) |
| 25 to 34 Years | 262 (9.7%) | 2,322 (85.9%) |
| 35 to 44 Years | 221 (5.9%) | 3,408 (90.8%) |
| 45 to 54 Years | 277 (6.5%) | 3,811 (88.8%) |
| 55 to 64 Years | 651 (13.6%) | 4,272 (89.5%) |
| 65 to 74 Years | 3,394 (94.4%) | 2,410 (67.0%) |
| 75 Years and over | 2,176 (100.0%) | 1,610 (74.0%) |
| Total | 8,297 (28.7%) | 23,768 (82.4%) |
Disability Status by Sex by Age in Powhatan County
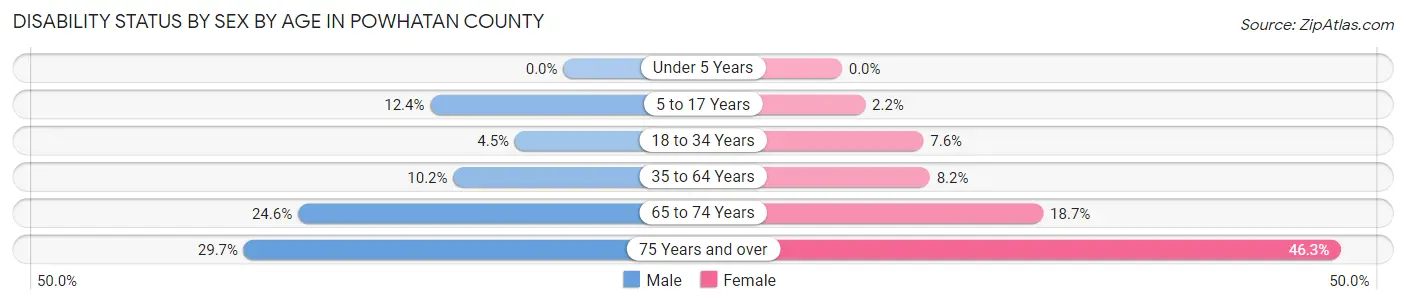
| Age Bracket | Male | Female |
| Under 5 Years | 0 (0.0%) | 0 (0.0%) |
| 5 to 17 Years | 262 (12.3%) | 42 (2.2%) |
| 18 to 34 Years | 118 (4.5%) | 172 (7.6%) |
| 35 to 64 Years | 635 (10.2%) | 538 (8.2%) |
| 65 to 74 Years | 432 (24.6%) | 344 (18.7%) |
| 75 Years and over | 290 (29.6%) | 555 (46.3%) |
Disability Class by Sex by Age in Powhatan County
Disability Class: Hearing Difficulty
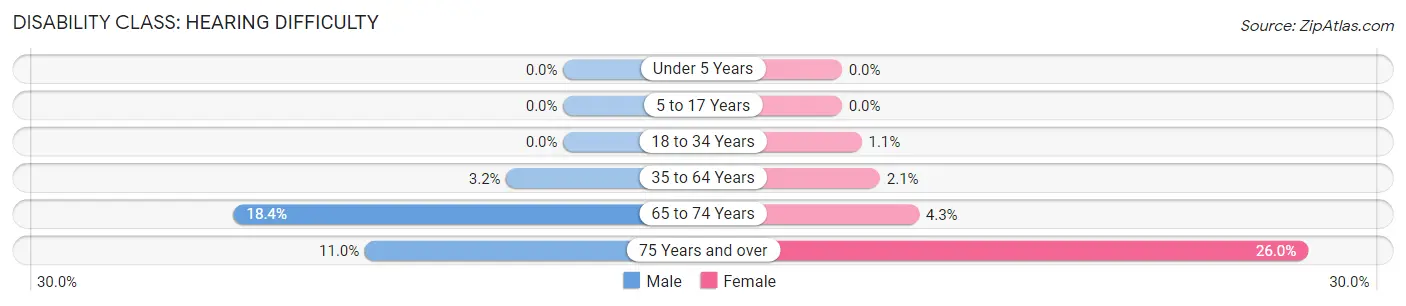
| Age Bracket | Male | Female |
| Under 5 Years | 0 (0.0%) | 0 (0.0%) |
| 5 to 17 Years | 0 (0.0%) | 0 (0.0%) |
| 18 to 34 Years | 0 (0.0%) | 25 (1.1%) |
| 35 to 64 Years | 197 (3.2%) | 140 (2.1%) |
| 65 to 74 Years | 322 (18.4%) | 79 (4.3%) |
| 75 Years and over | 108 (11.0%) | 311 (26.0%) |
Disability Class: Vision Difficulty
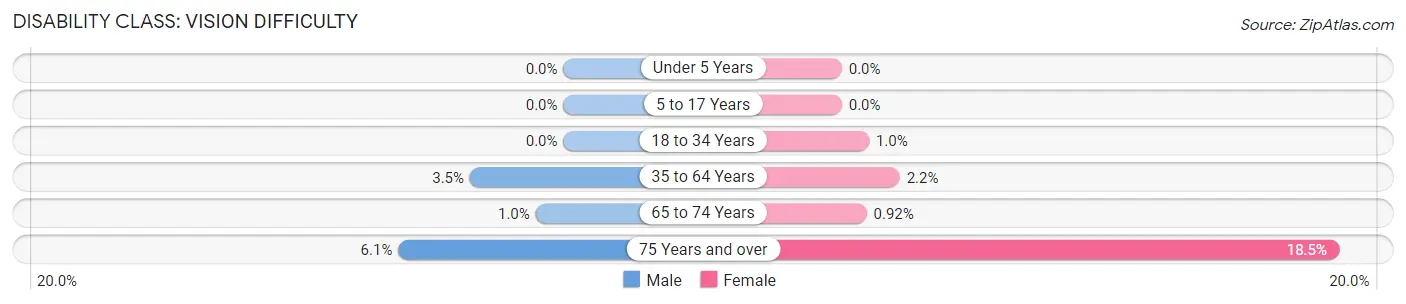
| Age Bracket | Male | Female |
| Under 5 Years | 0 (0.0%) | 0 (0.0%) |
| 5 to 17 Years | 0 (0.0%) | 0 (0.0%) |
| 18 to 34 Years | 0 (0.0%) | 23 (1.0%) |
| 35 to 64 Years | 216 (3.5%) | 142 (2.1%) |
| 65 to 74 Years | 18 (1.0%) | 17 (0.9%) |
| 75 Years and over | 60 (6.1%) | 221 (18.4%) |
Disability Class: Cognitive Difficulty
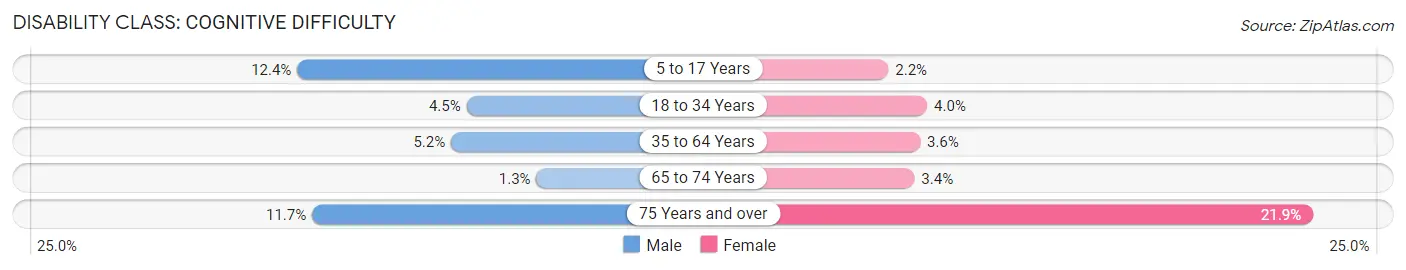
| Age Bracket | Male | Female |
| 5 to 17 Years | 262 (12.3%) | 42 (2.2%) |
| 18 to 34 Years | 118 (4.5%) | 90 (4.0%) |
| 35 to 64 Years | 324 (5.2%) | 239 (3.6%) |
| 65 to 74 Years | 22 (1.3%) | 62 (3.4%) |
| 75 Years and over | 114 (11.7%) | 262 (21.9%) |
Disability Class: Ambulatory Difficulty
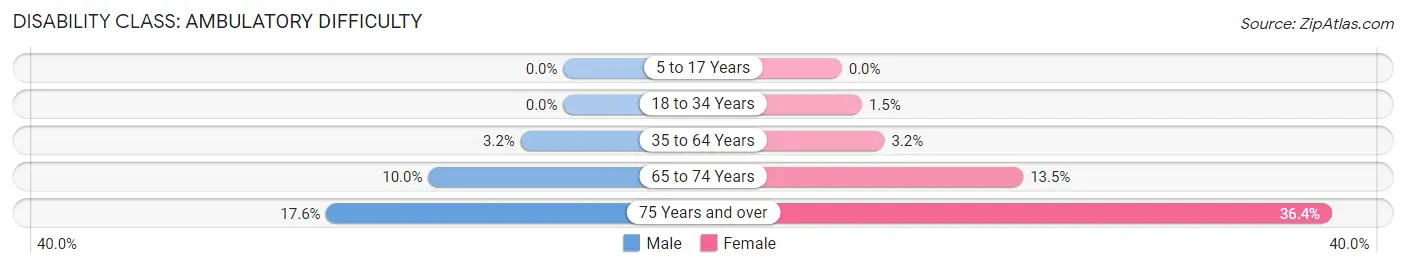
| Age Bracket | Male | Female |
| 5 to 17 Years | 0 (0.0%) | 0 (0.0%) |
| 18 to 34 Years | 0 (0.0%) | 34 (1.5%) |
| 35 to 64 Years | 197 (3.2%) | 209 (3.2%) |
| 65 to 74 Years | 176 (10.0%) | 248 (13.5%) |
| 75 Years and over | 172 (17.6%) | 436 (36.4%) |
Disability Class: Self-Care Difficulty
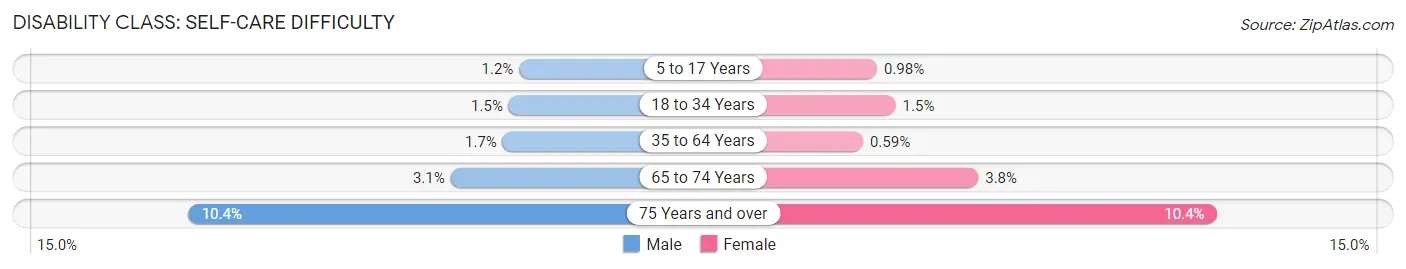
| Age Bracket | Male | Female |
| 5 to 17 Years | 26 (1.2%) | 19 (1.0%) |
| 18 to 34 Years | 40 (1.5%) | 34 (1.5%) |
| 35 to 64 Years | 105 (1.7%) | 39 (0.6%) |
| 65 to 74 Years | 55 (3.1%) | 70 (3.8%) |
| 75 Years and over | 102 (10.4%) | 125 (10.4%) |
Technology Access in Powhatan County
Computing Device Access in Powhatan County
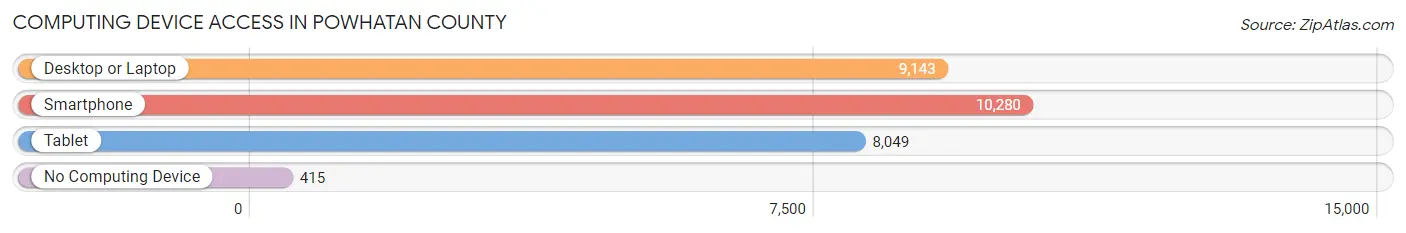
| Device Type | # Households | % Households |
| Desktop or Laptop | 9,143 | 82.5% |
| Smartphone | 10,280 | 92.8% |
| Tablet | 8,049 | 72.7% |
| No Computing Device | 415 | 3.7% |
| Total | 11,077 | 100.0% |
Internet Access in Powhatan County
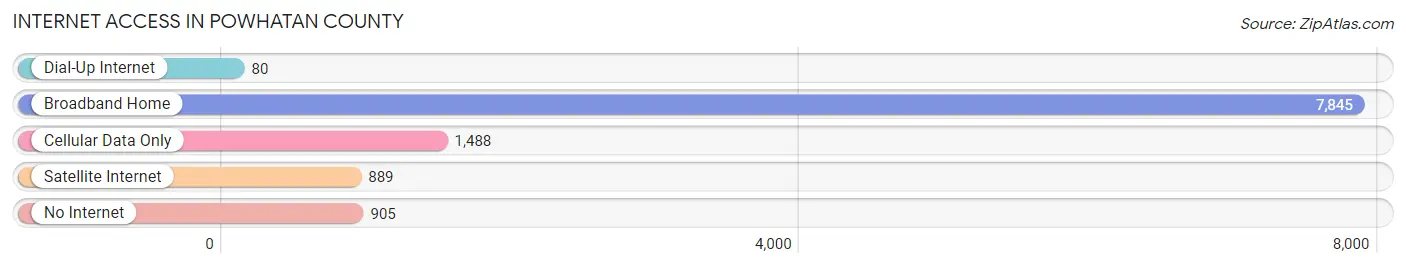
| Internet Type | # Households | % Households |
| Dial-Up Internet | 80 | 0.7% |
| Broadband Home | 7,845 | 70.8% |
| Cellular Data Only | 1,488 | 13.4% |
| Satellite Internet | 889 | 8.0% |
| No Internet | 905 | 8.2% |
| Total | 11,077 | 100.0% |
Powhatan County Summary
Powhatan County, Virginia is located in the central part of the state, just west of Richmond. It is bordered by Goochland County to the north, Cumberland County to the east, Amelia County to the south, and Fluvanna County to the west. The county seat is Powhatan, and the county is named after the Native American chief, Powhatan. The county has a total area of 437 square miles, of which 434 square miles is land and 3 square miles is water.
History
Powhatan County was formed in 1777 from parts of Cumberland and Goochland counties. It was named after the Native American chief, Powhatan, who was the father of Pocahontas. The county was originally part of the Virginia Colony, and was home to many Native American tribes, including the Monacan, the Nottoway, and the Pamunkey.
During the American Revolution, Powhatan County was the site of several battles, including the Battle of Powhatan Courthouse in 1781. The county was also the site of the Battle of Trevilian Station in 1864, which was the largest all-cavalry battle of the Civil War.
Geography
Powhatan County is located in the central part of Virginia, just west of Richmond. It is bordered by Goochland County to the north, Cumberland County to the east, Amelia County to the south, and Fluvanna County to the west. The county has a total area of 437 square miles, of which 434 square miles is land and 3 square miles is water.
The county is mostly rural, with rolling hills and forests. The James River forms the northern border of the county, and the Appomattox River forms the eastern border. The county is home to several state parks, including Pocahontas State Park, Twin Lakes State Park, and James River State Park.
Economy
Powhatan County has a diverse economy, with a mix of agriculture, manufacturing, and services. The county is home to several large employers, including the WestRock paper mill, the Dominion Energy power plant, and the Walmart distribution center.
Agriculture is an important part of the county’s economy, with crops such as corn, soybeans, wheat, and hay being grown. Livestock production is also important, with beef cattle, dairy cows, and hogs being raised.
Manufacturing is also an important part of the county’s economy, with companies such as WestRock, Dominion Energy, and Walmart having large operations in the county.
Demographics
As of the 2010 census, Powhatan County had a population of 28,046. The population is mostly white (87.3%), with African Americans making up 8.2% of the population, and Hispanics making up 2.3%.
The median household income in the county is $68,845, and the median home value is $269,400. The unemployment rate is 4.2%, which is lower than the national average.
Conclusion
Powhatan County, Virginia is a rural county located in the central part of the state, just west of Richmond. It is bordered by Goochland County to the north, Cumberland County to the east, Amelia County to the south, and Fluvanna County to the west. The county has a total area of 437 square miles, of which 434 square miles is land and 3 square miles is water. The county has a diverse economy, with a mix of agriculture, manufacturing, and services. As of the 2010 census, Powhatan County had a population of 28,046, with a median household income of $68,845 and a median home value of $269,400.
Common Questions
What is Per Capita Income in Powhatan County?
Per Capita income in Powhatan County is $47,268.
What is the Median Family Income in Powhatan County?
Median Family Income in Powhatan County is $121,199.
What is the Median Household income in Powhatan County?
Median Household Income in Powhatan County is $108,089.
What is Income or Wage Gap in Powhatan County?
Income or Wage Gap in Powhatan County is 19.9%.
Women in Powhatan County earn 80.1 cents for every dollar earned by a man.
What is Inequality or Gini Index in Powhatan County?
Inequality or Gini Index in Powhatan County is 0.37.
What is the Total Population of Powhatan County?
Total Population of Powhatan County is 30,503.
What is the Total Male Population of Powhatan County?
Total Male Population of Powhatan County is 16,003.
What is the Total Female Population of Powhatan County?
Total Female Population of Powhatan County is 14,500.
What is the Ratio of Males per 100 Females in Powhatan County?
There are 110.37 Males per 100 Females in Powhatan County.
What is the Ratio of Females per 100 Males in Powhatan County?
There are 90.61 Females per 100 Males in Powhatan County.
What is the Median Population Age in Powhatan County?
Median Population Age in Powhatan County is 45.6 Years.
What is the Average Family Size in Powhatan County
Average Family Size in Powhatan County is 2.9 People.
What is the Average Household Size in Powhatan County
Average Household Size in Powhatan County is 2.6 People.
How Large is the Labor Force in Powhatan County?
There are 15,761 People in the Labor Forcein in Powhatan County.
What is the Percentage of People in the Labor Force in Powhatan County?
61.3% of People are in the Labor Force in Powhatan County.
What is the Unemployment Rate in Powhatan County?
Unemployment Rate in Powhatan County is 2.6%.