Pittsylvania County, VA Map & Demographics
Pittsylvania County Map
Pittsylvania County Overview
$28,428
PER CAPITA INCOME
$65,263
AVG FAMILY INCOME
$52,619
AVG HOUSEHOLD INCOME
23.0%
WAGE / INCOME GAP [ % ]
77.0¢/ $1
WAGE / INCOME GAP [ $ ]
$9,256
FAMILY INCOME DEFICIT
0.44
INEQUALITY / GINI INDEX
60,541
TOTAL POPULATION
30,142
MALE POPULATION
30,399
FEMALE POPULATION
99.15
MALES / 100 FEMALES
100.85
FEMALES / 100 MALES
48.0
MEDIAN AGE
2.9
AVG FAMILY SIZE
2.4
AVG HOUSEHOLD SIZE
27,235
LABOR FORCE [ PEOPLE ]
53.5%
PERCENT IN LABOR FORCE
5.4%
UNEMPLOYMENT RATE
Pittsylvania County Area Codes
Income in Pittsylvania County
Income Overview in Pittsylvania County
Per Capita Income in Pittsylvania County is $28,428, while median incomes of families and households are $65,263 and $52,619 respectively.
| Characteristic | Number | Measure |
| Per Capita Income | 60,541 | $28,428 |
| Median Family Income | 16,426 | $65,263 |
| Mean Family Income | 16,426 | $80,030 |
| Median Household Income | 24,487 | $52,619 |
| Mean Household Income | 24,487 | $67,427 |
| Income Deficit | 16,426 | $9,256 |
| Wage / Income Gap (%) | 60,541 | 22.96% |
| Wage / Income Gap ($) | 60,541 | 77.04¢ per $1 |
| Gini / Inequality Index | 60,541 | 0.44 |
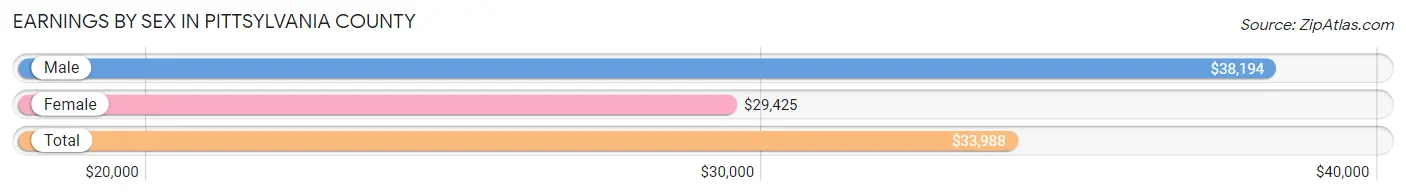
Earnings by Sex in Pittsylvania County
Average Earnings in Pittsylvania County are $33,988, $38,194 for men and $29,425 for women, a difference of 23.0%.
| Sex | Number | Average Earnings |
| Male | 14,612 (51.1%) | $38,194 |
| Female | 14,005 (48.9%) | $29,425 |
| Total | 28,617 (100.0%) | $33,988 |
Earnings by Sex by Income Bracket in Pittsylvania County
The most common earnings brackets in Pittsylvania County are $55,000 to $64,999 for men (1,361 | 9.3%) and $55,000 to $64,999 for women (1,172 | 8.4%).
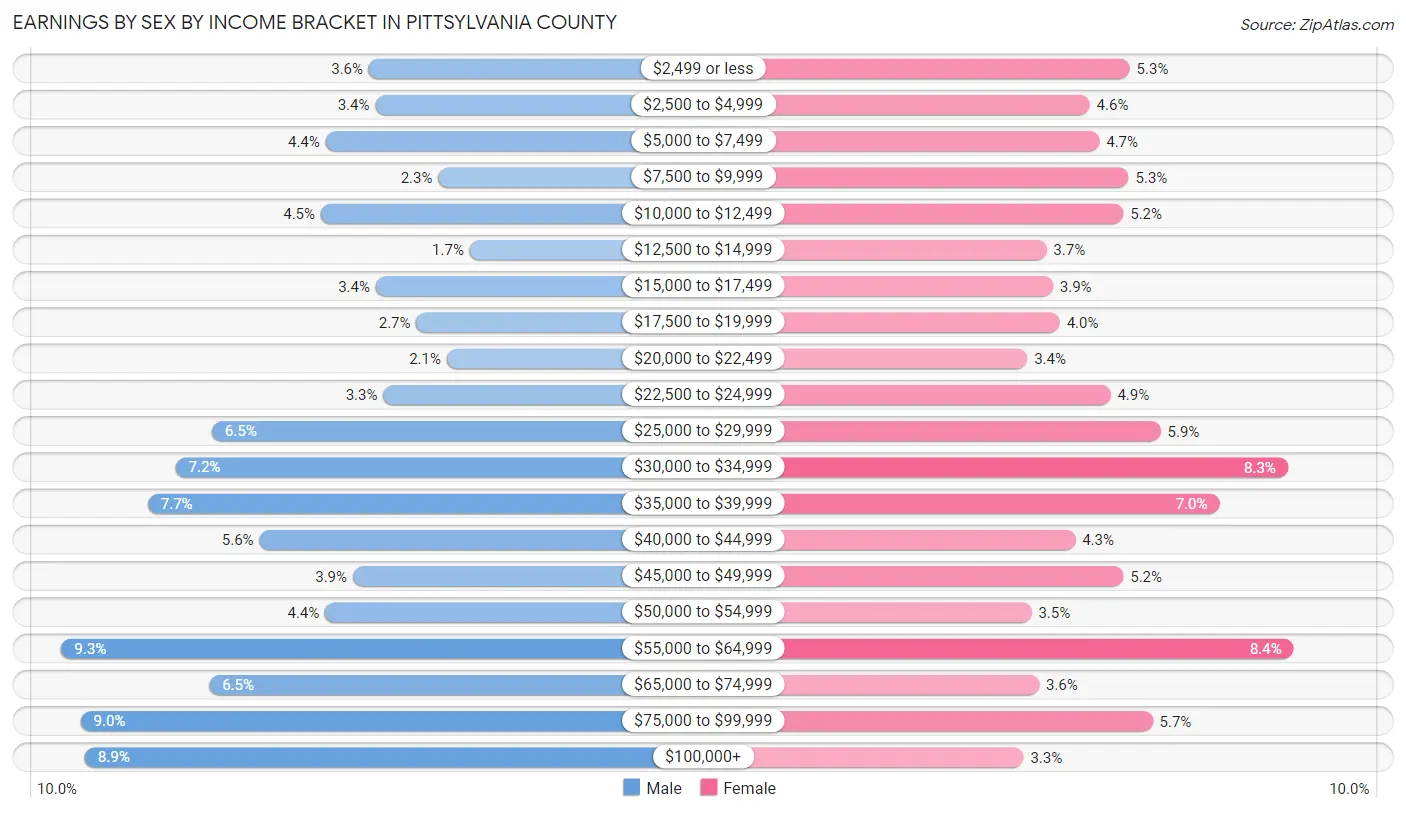
| Income | Male | Female |
| $2,499 or less | 519 (3.5%) | 742 (5.3%) |
| $2,500 to $4,999 | 501 (3.4%) | 637 (4.5%) |
| $5,000 to $7,499 | 637 (4.4%) | 663 (4.7%) |
| $7,500 to $9,999 | 329 (2.2%) | 740 (5.3%) |
| $10,000 to $12,499 | 650 (4.4%) | 725 (5.2%) |
| $12,500 to $14,999 | 243 (1.7%) | 524 (3.7%) |
| $15,000 to $17,499 | 500 (3.4%) | 541 (3.9%) |
| $17,500 to $19,999 | 389 (2.7%) | 559 (4.0%) |
| $20,000 to $22,499 | 305 (2.1%) | 474 (3.4%) |
| $22,500 to $24,999 | 479 (3.3%) | 692 (4.9%) |
| $25,000 to $29,999 | 949 (6.5%) | 824 (5.9%) |
| $30,000 to $34,999 | 1,048 (7.2%) | 1,157 (8.3%) |
| $35,000 to $39,999 | 1,124 (7.7%) | 977 (7.0%) |
| $40,000 to $44,999 | 819 (5.6%) | 599 (4.3%) |
| $45,000 to $49,999 | 562 (3.8%) | 726 (5.2%) |
| $50,000 to $54,999 | 638 (4.4%) | 484 (3.5%) |
| $55,000 to $64,999 | 1,361 (9.3%) | 1,172 (8.4%) |
| $65,000 to $74,999 | 955 (6.5%) | 504 (3.6%) |
| $75,000 to $99,999 | 1,308 (8.9%) | 802 (5.7%) |
| $100,000+ | 1,296 (8.9%) | 463 (3.3%) |
| Total | 14,612 (100.0%) | 14,005 (100.0%) |
Earnings by Sex by Educational Attainment in Pittsylvania County
Average earnings in Pittsylvania County are $43,060 for men and $32,296 for women, a difference of 25.0%. Men with an educational attainment of graduate degree enjoy the highest average annual earnings of $92,738, while those with less than high school education earn the least with $35,070. Women with an educational attainment of graduate degree earn the most with the average annual earnings of $58,069, while those with less than high school education have the smallest earnings of $22,480.
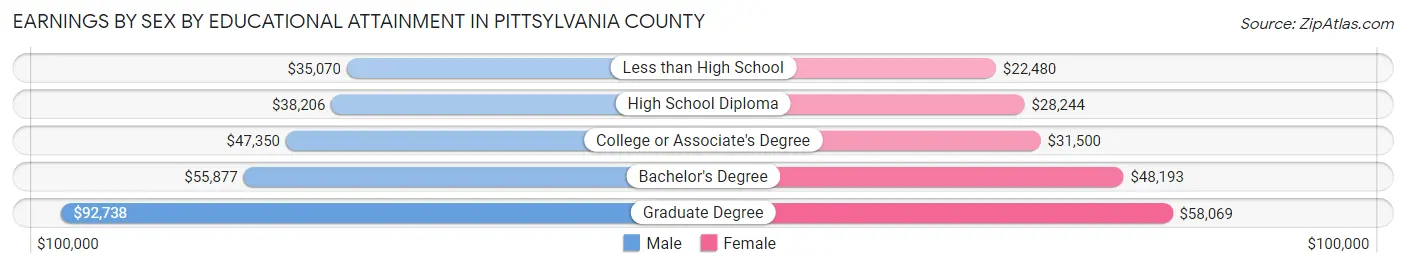
| Educational Attainment | Male Income | Female Income |
| Less than High School | $35,070 | $22,480 |
| High School Diploma | $38,206 | $28,244 |
| College or Associate's Degree | $47,350 | $31,500 |
| Bachelor's Degree | $55,877 | $48,193 |
| Graduate Degree | $92,738 | $58,069 |
| Total | $43,060 | $32,296 |
Family Income in Pittsylvania County
Family Income Brackets in Pittsylvania County
According to the Pittsylvania County family income data, there are 3,417 families falling into the $50,000 to $74,999 income range, which is the most common income bracket and makes up 20.8% of all families. Conversely, the $10,000 to $14,999 income bracket is the least frequent group with only 476 families (2.9%) belonging to this category.
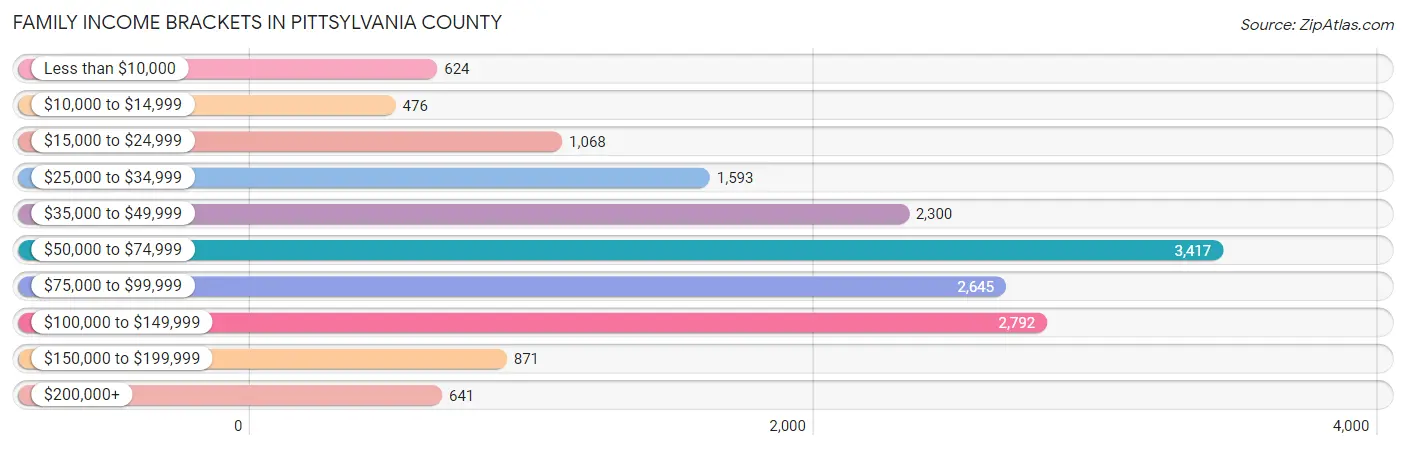
| Income Bracket | # Families | % Families |
| Less than $10,000 | 624 | 3.8% |
| $10,000 to $14,999 | 476 | 2.9% |
| $15,000 to $24,999 | 1,068 | 6.5% |
| $25,000 to $34,999 | 1,593 | 9.7% |
| $35,000 to $49,999 | 2,300 | 14.0% |
| $50,000 to $74,999 | 3,417 | 20.8% |
| $75,000 to $99,999 | 2,645 | 16.1% |
| $100,000 to $149,999 | 2,792 | 17.0% |
| $150,000 to $199,999 | 871 | 5.3% |
| $200,000+ | 641 | 3.9% |
Family Income by Famaliy Size in Pittsylvania County
5-person families (882 | 5.4%) account for the highest median family income in Pittsylvania County with $84,091 per family, while 2-person families (9,145 | 55.7%) have the highest median income of $29,509 per family member.
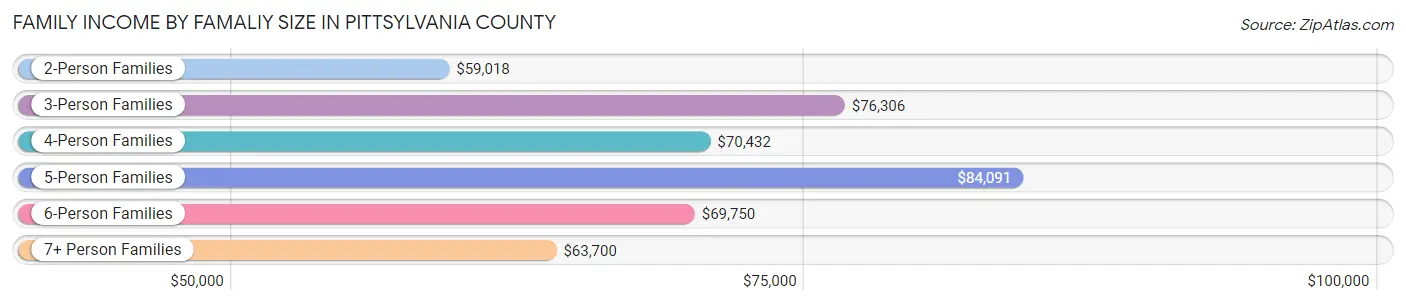
| Income Bracket | # Families | Median Income |
| 2-Person Families | 9,145 (55.7%) | $59,018 |
| 3-Person Families | 3,743 (22.8%) | $76,306 |
| 4-Person Families | 2,245 (13.7%) | $70,432 |
| 5-Person Families | 882 (5.4%) | $84,091 |
| 6-Person Families | 319 (1.9%) | $69,750 |
| 7+ Person Families | 92 (0.6%) | $63,700 |
| Total | 16,426 (100.0%) | $65,263 |
Family Income by Number of Earners in Pittsylvania County
The median family income in Pittsylvania County is $65,263, with families comprising 3+ earners (1,395) having the highest median family income of $108,858, while families with no earners (3,399) have the lowest median family income of $36,560, accounting for 8.5% and 20.7% of families, respectively.
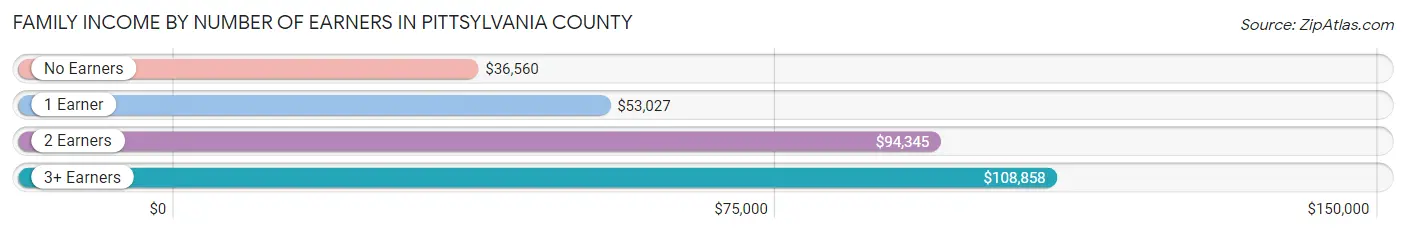
| Number of Earners | # Families | Median Income |
| No Earners | 3,399 (20.7%) | $36,560 |
| 1 Earner | 6,176 (37.6%) | $53,027 |
| 2 Earners | 5,456 (33.2%) | $94,345 |
| 3+ Earners | 1,395 (8.5%) | $108,858 |
| Total | 16,426 (100.0%) | $65,263 |
Household Income in Pittsylvania County
Household Income Brackets in Pittsylvania County
With 4,555 households falling in the category, the $50,000 to $74,999 income range is the most frequent in Pittsylvania County, accounting for 18.6% of all households. In contrast, only 735 households (3.0%) fall into the $200,000+ income bracket, making it the least populous group.
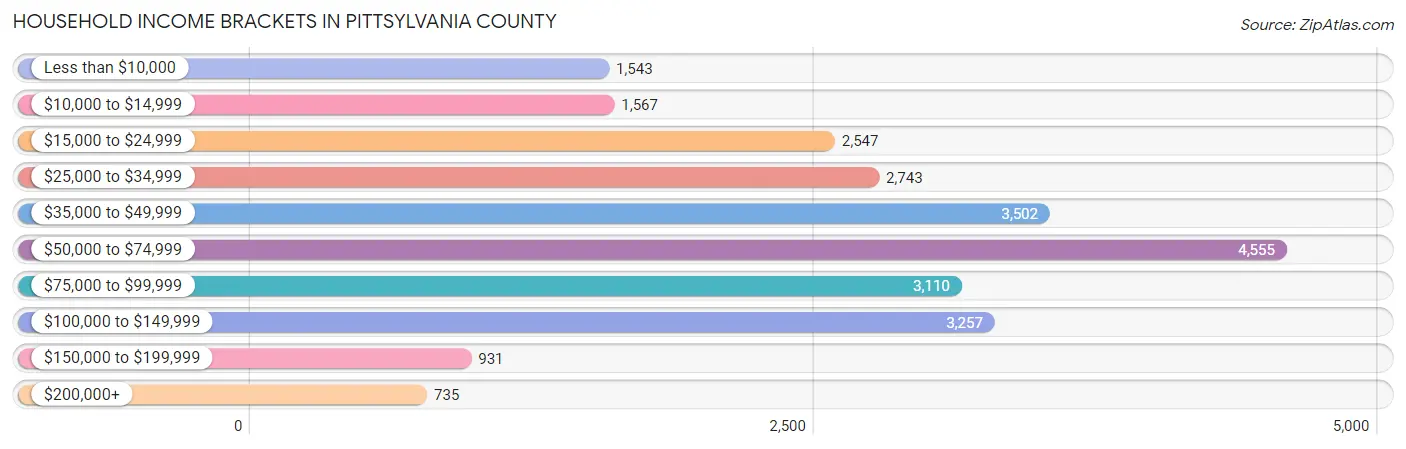
| Income Bracket | # Households | % Households |
| Less than $10,000 | 1,543 | 6.3% |
| $10,000 to $14,999 | 1,567 | 6.4% |
| $15,000 to $24,999 | 2,547 | 10.4% |
| $25,000 to $34,999 | 2,743 | 11.2% |
| $35,000 to $49,999 | 3,502 | 14.3% |
| $50,000 to $74,999 | 4,555 | 18.6% |
| $75,000 to $99,999 | 3,110 | 12.7% |
| $100,000 to $149,999 | 3,257 | 13.3% |
| $150,000 to $199,999 | 931 | 3.8% |
| $200,000+ | 735 | 3.0% |
Household Income by Householder Age in Pittsylvania County
The median household income in Pittsylvania County is $52,619, with the highest median household income of $64,060 found in the 45 to 64 years age bracket for the primary householder. A total of 9,945 households (40.6%) fall into this category. Meanwhile, the 65+ years age bracket for the primary householder has the lowest median household income of $38,220, with 8,866 households (36.2%) in this group.
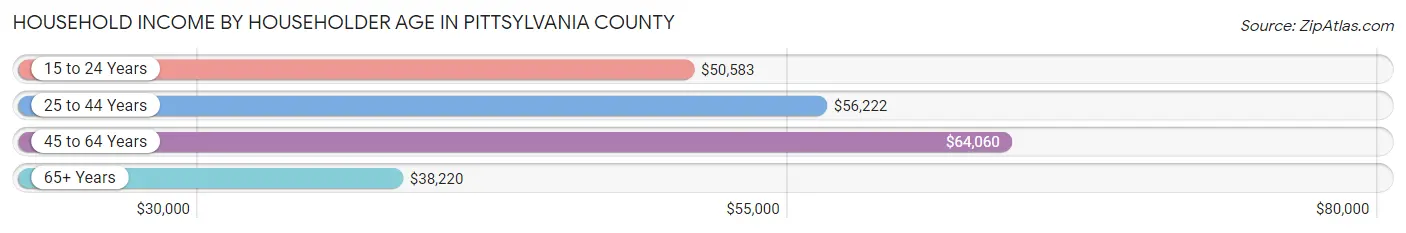
| Income Bracket | # Households | Median Income |
| 15 to 24 Years | 539 (2.2%) | $50,583 |
| 25 to 44 Years | 5,137 (21.0%) | $56,222 |
| 45 to 64 Years | 9,945 (40.6%) | $64,060 |
| 65+ Years | 8,866 (36.2%) | $38,220 |
| Total | 24,487 (100.0%) | $52,619 |
Poverty in Pittsylvania County
Income Below Poverty by Sex and Age in Pittsylvania County
With 15.0% poverty level for males and 17.7% for females among the residents of Pittsylvania County, 5 year old males and 5 year old females are the most vulnerable to poverty, with 73 males (65.2%) and 112 females (38.6%) in their respective age groups living below the poverty level.
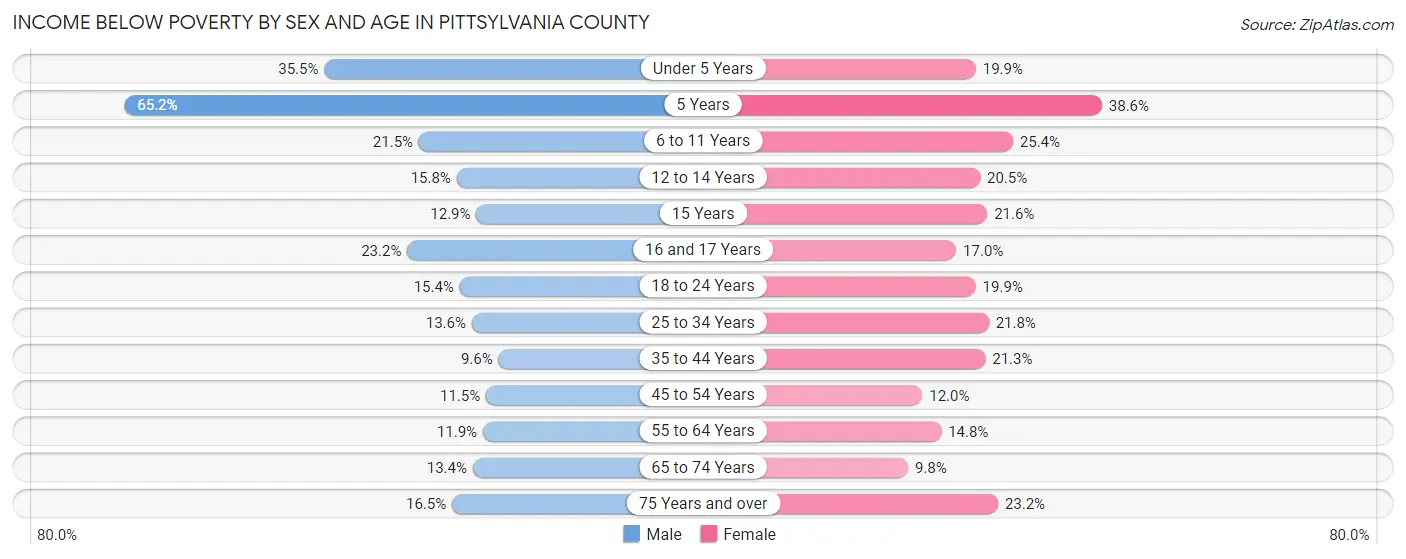
| Age Bracket | Male | Female |
| Under 5 Years | 442 (35.5%) | 242 (19.9%) |
| 5 Years | 73 (65.2%) | 112 (38.6%) |
| 6 to 11 Years | 443 (21.4%) | 487 (25.4%) |
| 12 to 14 Years | 147 (15.8%) | 195 (20.5%) |
| 15 Years | 65 (12.9%) | 65 (21.6%) |
| 16 and 17 Years | 156 (23.2%) | 125 (17.0%) |
| 18 to 24 Years | 376 (15.4%) | 413 (19.9%) |
| 25 to 34 Years | 422 (13.6%) | 590 (21.8%) |
| 35 to 44 Years | 280 (9.6%) | 704 (21.3%) |
| 45 to 54 Years | 467 (11.5%) | 479 (11.9%) |
| 55 to 64 Years | 545 (11.9%) | 745 (14.8%) |
| 65 to 74 Years | 514 (13.4%) | 421 (9.8%) |
| 75 Years and over | 417 (16.5%) | 789 (23.2%) |
| Total | 4,347 (15.0%) | 5,367 (17.7%) |
Income Above Poverty by Sex and Age in Pittsylvania County
According to the poverty statistics in Pittsylvania County, males aged 35 to 44 years and females aged 65 to 74 years are the age groups that are most secure financially, with 90.4% of males and 90.2% of females in these age groups living above the poverty line.
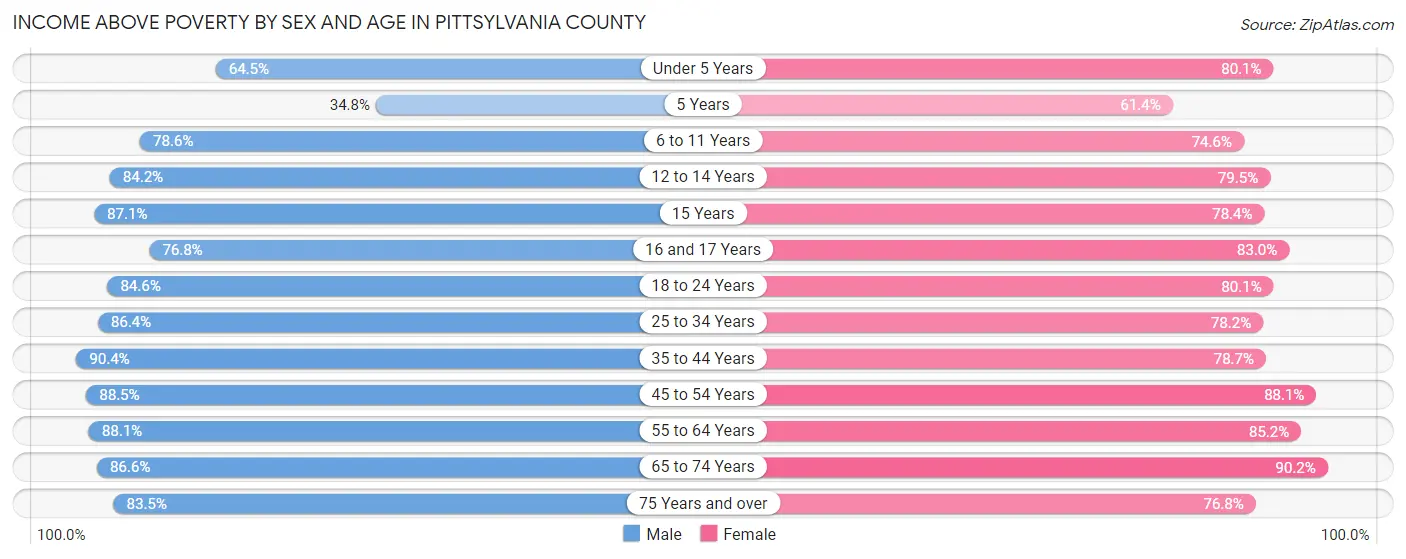
| Age Bracket | Male | Female |
| Under 5 Years | 803 (64.5%) | 974 (80.1%) |
| 5 Years | 39 (34.8%) | 178 (61.4%) |
| 6 to 11 Years | 1,622 (78.5%) | 1,430 (74.6%) |
| 12 to 14 Years | 781 (84.2%) | 755 (79.5%) |
| 15 Years | 438 (87.1%) | 236 (78.4%) |
| 16 and 17 Years | 517 (76.8%) | 611 (83.0%) |
| 18 to 24 Years | 2,067 (84.6%) | 1,664 (80.1%) |
| 25 to 34 Years | 2,681 (86.4%) | 2,115 (78.2%) |
| 35 to 44 Years | 2,631 (90.4%) | 2,599 (78.7%) |
| 45 to 54 Years | 3,604 (88.5%) | 3,529 (88.0%) |
| 55 to 64 Years | 4,018 (88.1%) | 4,302 (85.2%) |
| 65 to 74 Years | 3,310 (86.6%) | 3,860 (90.2%) |
| 75 Years and over | 2,106 (83.5%) | 2,613 (76.8%) |
| Total | 24,617 (85.0%) | 24,866 (82.3%) |
Income Below Poverty Among Married-Couple Families in Pittsylvania County
The poverty statistics for married-couple families in Pittsylvania County show that 6.9% or 798 of the total 11,607 families live below the poverty line. Families with 5 or more children have the highest poverty rate of 24.7%, comprising of 19 families. On the other hand, families with no children have the lowest poverty rate of 5.7%, which includes 457 families.
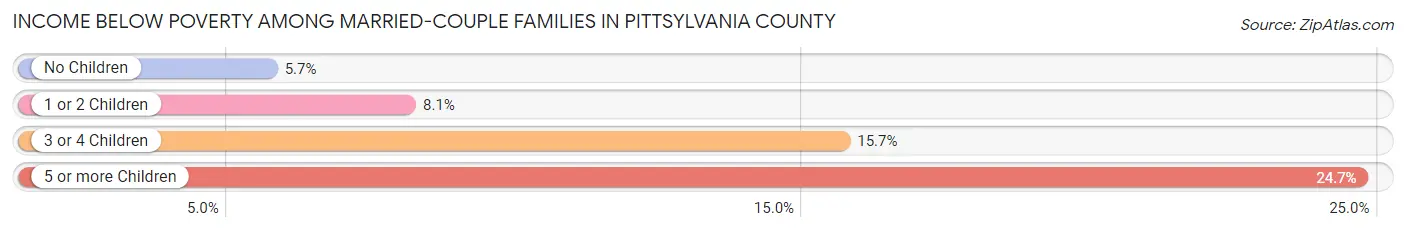
| Children | Above Poverty | Below Poverty |
| No Children | 7,574 (94.3%) | 457 (5.7%) |
| 1 or 2 Children | 2,746 (91.9%) | 242 (8.1%) |
| 3 or 4 Children | 431 (84.3%) | 80 (15.7%) |
| 5 or more Children | 58 (75.3%) | 19 (24.7%) |
| Total | 10,809 (93.1%) | 798 (6.9%) |
Income Below Poverty Among Single-Parent Households in Pittsylvania County
According to the poverty data in Pittsylvania County, 13.3% or 193 single-father households and 28.5% or 961 single-mother households are living below the poverty line. Among single-father households, those with 3 or 4 children have the highest poverty rate, with 20 households (35.7%) experiencing poverty. Likewise, among single-mother households, those with 3 or 4 children have the highest poverty rate, with 250 households (75.3%) falling below the poverty line.
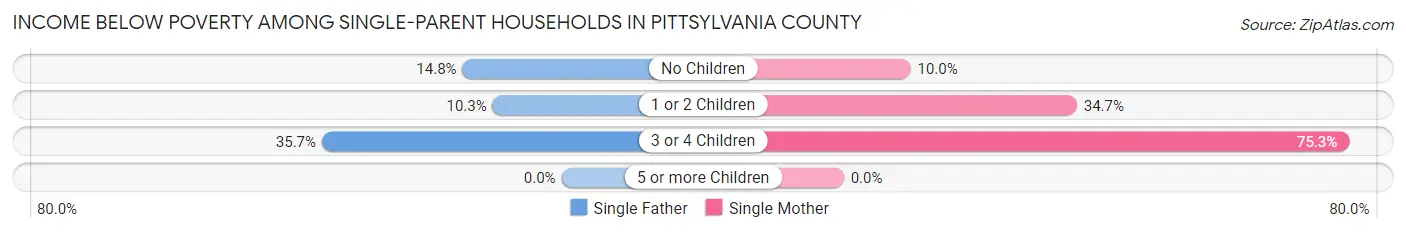
| Children | Single Father | Single Mother |
| No Children | 97 (14.8%) | 136 (10.0%) |
| 1 or 2 Children | 76 (10.3%) | 575 (34.7%) |
| 3 or 4 Children | 20 (35.7%) | 250 (75.3%) |
| 5 or more Children | 0 (0.0%) | 0 (0.0%) |
| Total | 193 (13.3%) | 961 (28.5%) |
Income Below Poverty Among Married-Couple vs Single-Parent Households in Pittsylvania County
The poverty data for Pittsylvania County shows that 798 of the married-couple family households (6.9%) and 1,154 of the single-parent households (23.9%) are living below the poverty level. Within the married-couple family households, those with 5 or more children have the highest poverty rate, with 19 households (24.7%) falling below the poverty line. Among the single-parent households, those with 3 or 4 children have the highest poverty rate, with 270 household (69.6%) living below poverty.
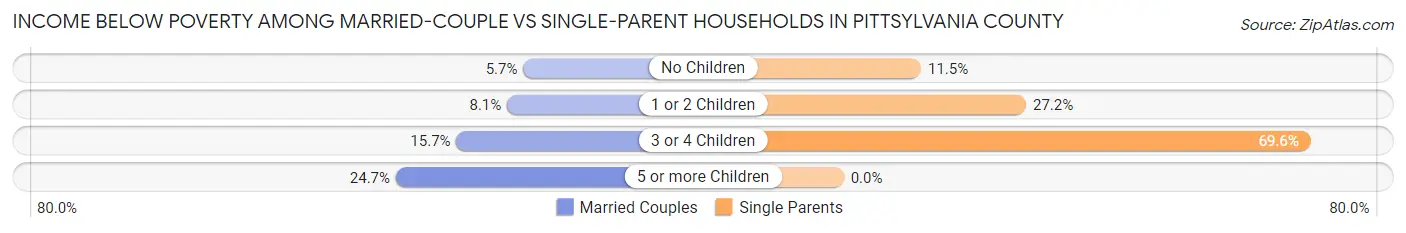
| Children | Married-Couple Families | Single-Parent Households |
| No Children | 457 (5.7%) | 233 (11.5%) |
| 1 or 2 Children | 242 (8.1%) | 651 (27.2%) |
| 3 or 4 Children | 80 (15.7%) | 270 (69.6%) |
| 5 or more Children | 19 (24.7%) | 0 (0.0%) |
| Total | 798 (6.9%) | 1,154 (23.9%) |
Race in Pittsylvania County
The most populous races in Pittsylvania County are White / Caucasian (45,165 | 74.6%), Black / African American (11,842 | 19.6%), and Two or more Races (2,378 | 3.9%).
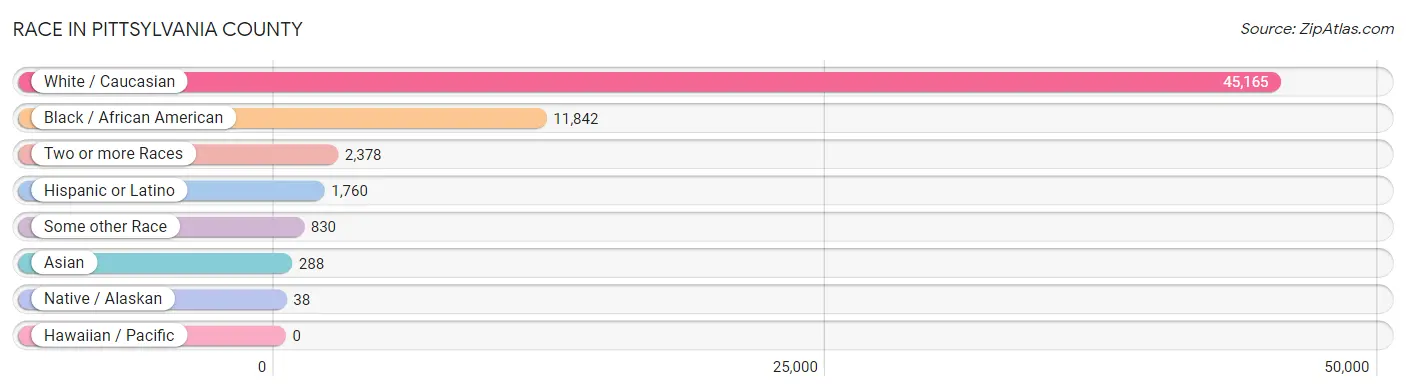
| Race | # Population | % Population |
| Asian | 288 | 0.5% |
| Black / African American | 11,842 | 19.6% |
| Hawaiian / Pacific | 0 | 0.0% |
| Hispanic or Latino | 1,760 | 2.9% |
| Native / Alaskan | 38 | 0.1% |
| White / Caucasian | 45,165 | 74.6% |
| Two or more Races | 2,378 | 3.9% |
| Some other Race | 830 | 1.4% |
| Total | 60,541 | 100.0% |
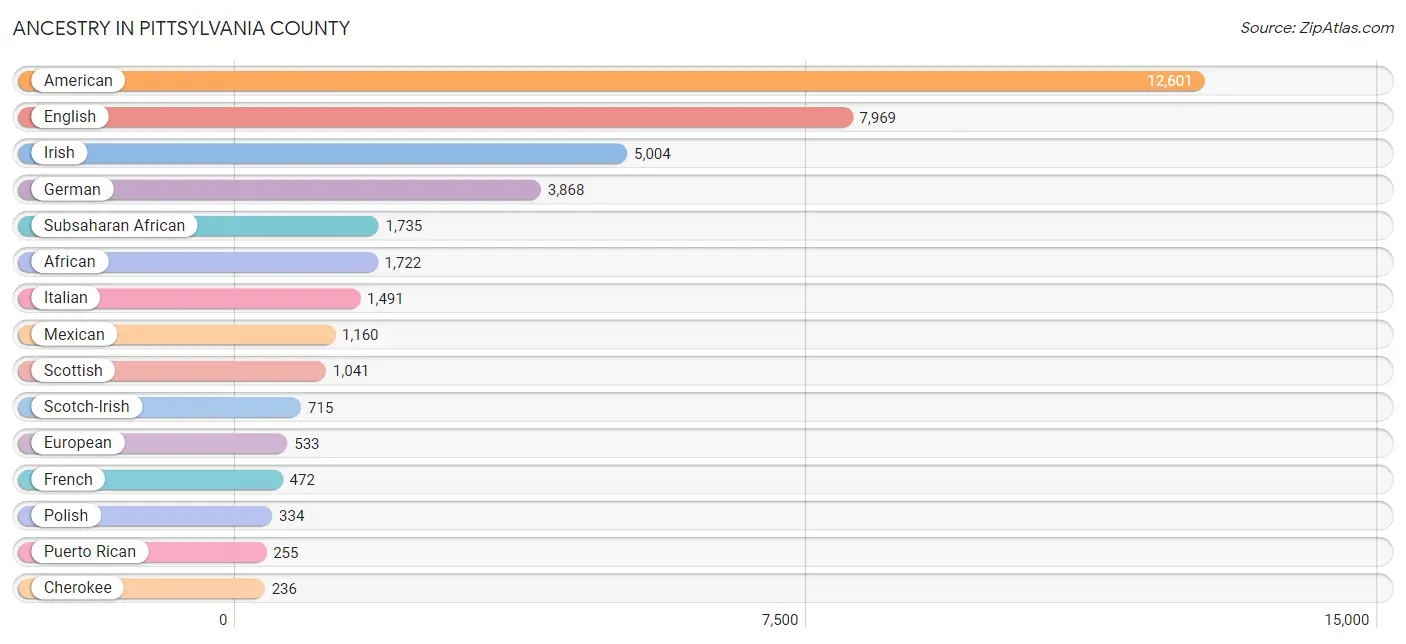
Ancestry in Pittsylvania County
The most populous ancestries reported in Pittsylvania County are American (12,601 | 20.8%), English (7,969 | 13.2%), Irish (5,004 | 8.3%), German (3,868 | 6.4%), and Subsaharan African (1,735 | 2.9%), together accounting for 51.5% of all Pittsylvania County residents.
| Ancestry | # Population | % Population |
| African | 1,722 | 2.8% |
| American | 12,601 | 20.8% |
| Apache | 7 | 0.0% |
| Austrian | 40 | 0.1% |
| Belgian | 25 | 0.0% |
| Blackfeet | 20 | 0.0% |
| Brazilian | 16 | 0.0% |
| British | 170 | 0.3% |
| Burmese | 38 | 0.1% |
| Canadian | 55 | 0.1% |
| Celtic | 7 | 0.0% |
| Central American | 119 | 0.2% |
| Cherokee | 236 | 0.4% |
| Chickasaw | 8 | 0.0% |
| Chippewa | 8 | 0.0% |
| Colombian | 53 | 0.1% |
| Cuban | 34 | 0.1% |
| Czech | 207 | 0.3% |
| Czechoslovakian | 66 | 0.1% |
| Danish | 33 | 0.1% |
| Dutch | 201 | 0.3% |
| Eastern European | 31 | 0.1% |
| English | 7,969 | 13.2% |
| European | 533 | 0.9% |
| Finnish | 5 | 0.0% |
| French | 472 | 0.8% |
| French Canadian | 57 | 0.1% |
| German | 3,868 | 6.4% |
| Greek | 90 | 0.2% |
| Haitian | 4 | 0.0% |
| Honduran | 18 | 0.0% |
| Houma | 4 | 0.0% |
| Hungarian | 111 | 0.2% |
| Indian (Asian) | 55 | 0.1% |
| Irish | 5,004 | 8.3% |
| Iroquois | 107 | 0.2% |
| Israeli | 14 | 0.0% |
| Italian | 1,491 | 2.5% |
| Jamaican | 29 | 0.1% |
| Korean | 170 | 0.3% |
| Mexican | 1,160 | 1.9% |
| Mexican American Indian | 9 | 0.0% |
| Mongolian | 13 | 0.0% |
| Northern European | 60 | 0.1% |
| Norwegian | 38 | 0.1% |
| Pakistani | 144 | 0.2% |
| Panamanian | 20 | 0.0% |
| Pennsylvania German | 119 | 0.2% |
| Peruvian | 31 | 0.1% |
| Polish | 334 | 0.5% |
| Potawatomi | 6 | 0.0% |
| Pueblo | 34 | 0.1% |
| Puerto Rican | 255 | 0.4% |
| Romanian | 47 | 0.1% |
| Russian | 199 | 0.3% |
| Salvadoran | 81 | 0.1% |
| Scandinavian | 69 | 0.1% |
| Scotch-Irish | 715 | 1.2% |
| Scottish | 1,041 | 1.7% |
| Seminole | 4 | 0.0% |
| Sioux | 2 | 0.0% |
| South American | 84 | 0.1% |
| South American Indian | 27 | 0.0% |
| Spanish | 29 | 0.1% |
| Sri Lankan | 53 | 0.1% |
| Subsaharan African | 1,735 | 2.9% |
| Swedish | 125 | 0.2% |
| Swiss | 77 | 0.1% |
| Thai | 46 | 0.1% |
| Trinidadian and Tobagonian | 3 | 0.0% |
| Turkish | 8 | 0.0% |
| Ukrainian | 30 | 0.1% |
| Welsh | 206 | 0.3% | View All 73 Rows |
Immigrants in Pittsylvania County
The most numerous immigrant groups reported in Pittsylvania County came from Latin America (585 | 1.0%), Central America (528 | 0.9%), Mexico (400 | 0.7%), Asia (270 | 0.4%), and South Eastern Asia (119 | 0.2%), together accounting for 3.2% of all Pittsylvania County residents.
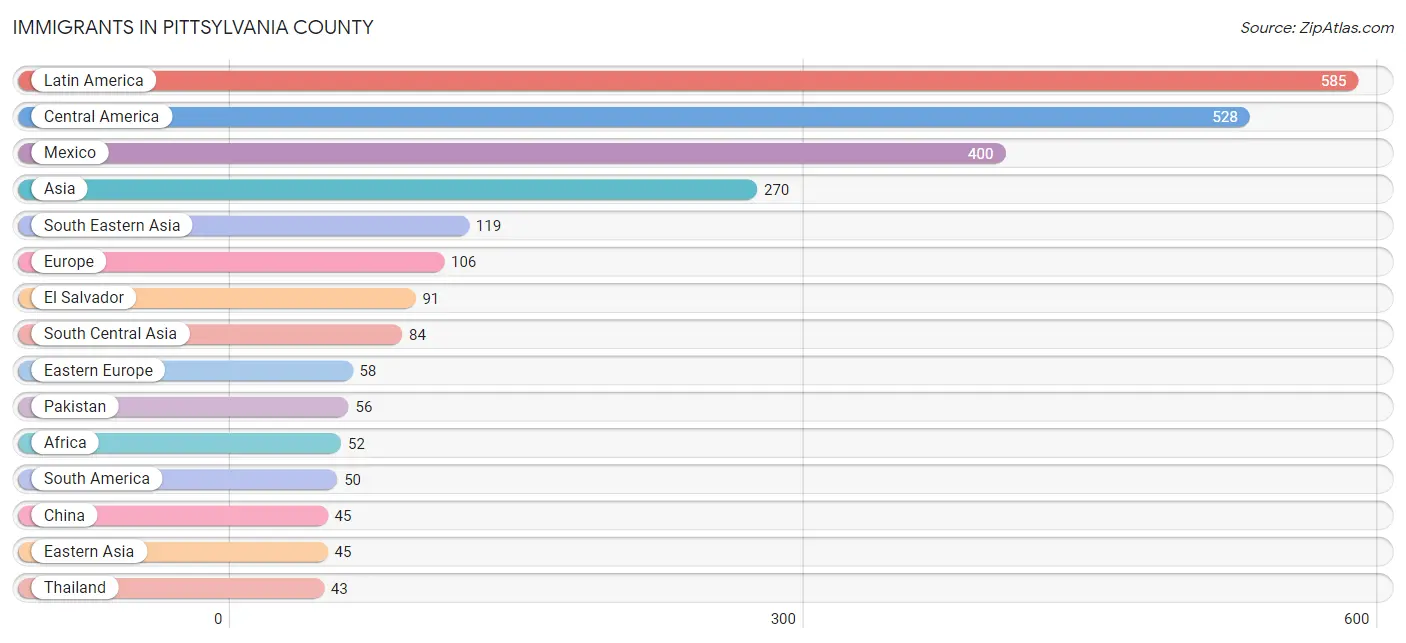
| Immigration Origin | # Population | % Population |
| Africa | 52 | 0.1% |
| Asia | 270 | 0.4% |
| Brazil | 16 | 0.0% |
| Canada | 4 | 0.0% |
| Caribbean | 7 | 0.0% |
| Central America | 528 | 0.9% |
| China | 45 | 0.1% |
| Colombia | 27 | 0.0% |
| Eastern Asia | 45 | 0.1% |
| Eastern Europe | 58 | 0.1% |
| El Salvador | 91 | 0.2% |
| Europe | 106 | 0.2% |
| Germany | 37 | 0.1% |
| Honduras | 17 | 0.0% |
| Hungary | 3 | 0.0% |
| India | 28 | 0.1% |
| Israel | 14 | 0.0% |
| Italy | 8 | 0.0% |
| Jamaica | 7 | 0.0% |
| Kuwait | 8 | 0.0% |
| Latin America | 585 | 1.0% |
| Malaysia | 8 | 0.0% |
| Mexico | 400 | 0.7% |
| Middle Africa | 23 | 0.0% |
| Northern Europe | 3 | 0.0% |
| Pakistan | 56 | 0.1% |
| Panama | 20 | 0.0% |
| Peru | 7 | 0.0% |
| Philippines | 17 | 0.0% |
| Poland | 13 | 0.0% |
| Russia | 42 | 0.1% |
| South America | 50 | 0.1% |
| South Central Asia | 84 | 0.1% |
| South Eastern Asia | 119 | 0.2% |
| Southern Europe | 8 | 0.0% |
| Thailand | 43 | 0.1% |
| Vietnam | 15 | 0.0% |
| Western Asia | 22 | 0.0% |
| Western Europe | 37 | 0.1% | View All 39 Rows |
Sex and Age in Pittsylvania County
Sex and Age in Pittsylvania County
The most populous age groups in Pittsylvania County are 60 to 64 Years (2,822 | 9.4%) for men and 60 to 64 Years (2,778 | 9.1%) for women.
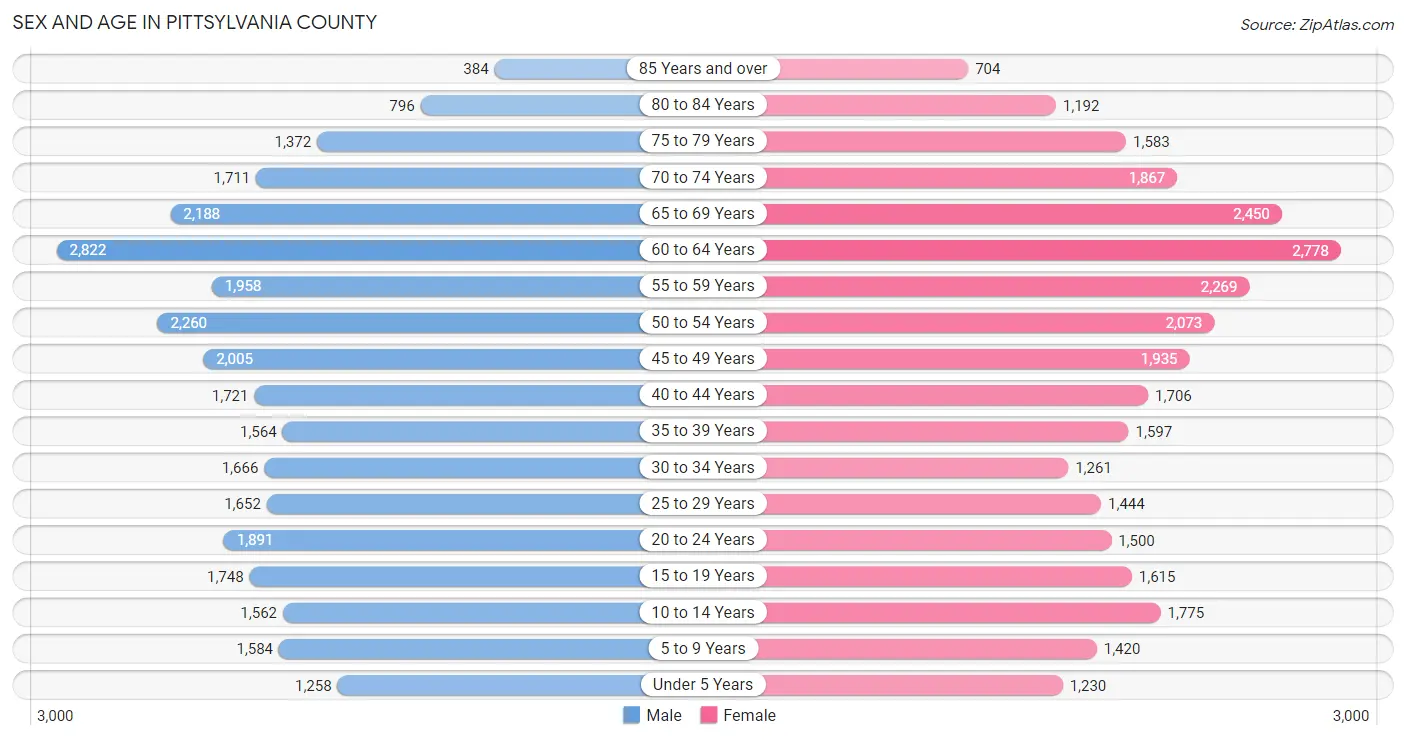
| Age Bracket | Male | Female |
| Under 5 Years | 1,258 (4.2%) | 1,230 (4.1%) |
| 5 to 9 Years | 1,584 (5.3%) | 1,420 (4.7%) |
| 10 to 14 Years | 1,562 (5.2%) | 1,775 (5.8%) |
| 15 to 19 Years | 1,748 (5.8%) | 1,615 (5.3%) |
| 20 to 24 Years | 1,891 (6.3%) | 1,500 (4.9%) |
| 25 to 29 Years | 1,652 (5.5%) | 1,444 (4.8%) |
| 30 to 34 Years | 1,666 (5.5%) | 1,261 (4.2%) |
| 35 to 39 Years | 1,564 (5.2%) | 1,597 (5.2%) |
| 40 to 44 Years | 1,721 (5.7%) | 1,706 (5.6%) |
| 45 to 49 Years | 2,005 (6.7%) | 1,935 (6.4%) |
| 50 to 54 Years | 2,260 (7.5%) | 2,073 (6.8%) |
| 55 to 59 Years | 1,958 (6.5%) | 2,269 (7.5%) |
| 60 to 64 Years | 2,822 (9.4%) | 2,778 (9.1%) |
| 65 to 69 Years | 2,188 (7.3%) | 2,450 (8.1%) |
| 70 to 74 Years | 1,711 (5.7%) | 1,867 (6.1%) |
| 75 to 79 Years | 1,372 (4.5%) | 1,583 (5.2%) |
| 80 to 84 Years | 796 (2.6%) | 1,192 (3.9%) |
| 85 Years and over | 384 (1.3%) | 704 (2.3%) |
| Total | 30,142 (100.0%) | 30,399 (100.0%) |
Families and Households in Pittsylvania County
Median Family Size in Pittsylvania County
The median family size in Pittsylvania County is 2.94 persons per family, with single female/mother families (3,366 | 20.5%) accounting for the largest median family size of 3.11 persons per family. On the other hand, single male/father families (1,453 | 8.8%) represent the smallest median family size with 2.69 persons per family.
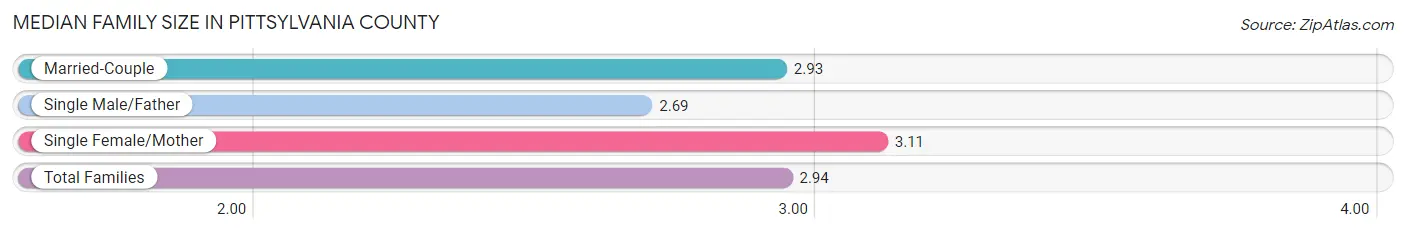
| Family Type | # Families | Family Size |
| Married-Couple | 11,607 (70.7%) | 2.93 |
| Single Male/Father | 1,453 (8.8%) | 2.69 |
| Single Female/Mother | 3,366 (20.5%) | 3.11 |
| Total Families | 16,426 (100.0%) | 2.94 |
Median Household Size in Pittsylvania County
The median household size in Pittsylvania County is 2.42 persons per household, with single female/mother households (3,366 | 13.8%) accounting for the largest median household size of 3.33 persons per household. non-family households (8,061 | 32.9%) represent the smallest median household size with 1.17 persons per household.
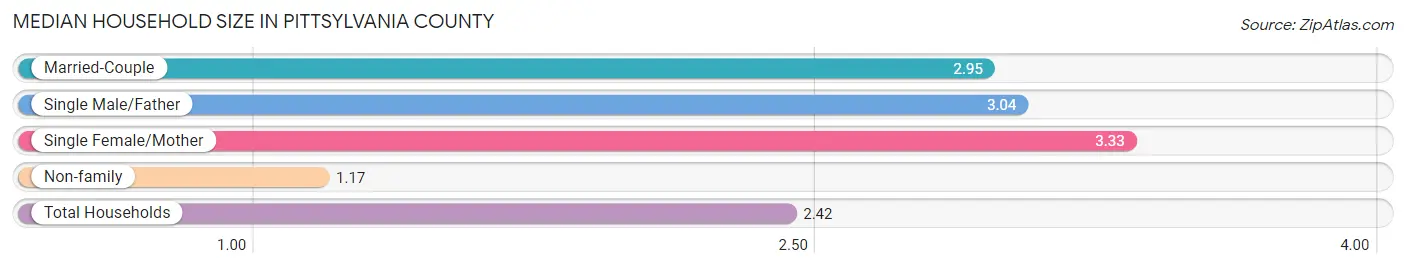
| Household Type | # Households | Household Size |
| Married-Couple | 11,607 (47.4%) | 2.95 |
| Single Male/Father | 1,453 (5.9%) | 3.04 |
| Single Female/Mother | 3,366 (13.8%) | 3.33 |
| Non-family | 8,061 (32.9%) | 1.17 |
| Total Households | 24,487 (100.0%) | 2.42 |
Household Size by Marriage Status in Pittsylvania County
Out of a total of 24,487 households in Pittsylvania County, 16,426 (67.1%) are family households, while 8,061 (32.9%) are nonfamily households. The most numerous type of family households are 2-person households, comprising 8,821, and the most common type of nonfamily households are 1-person households, comprising 7,110.
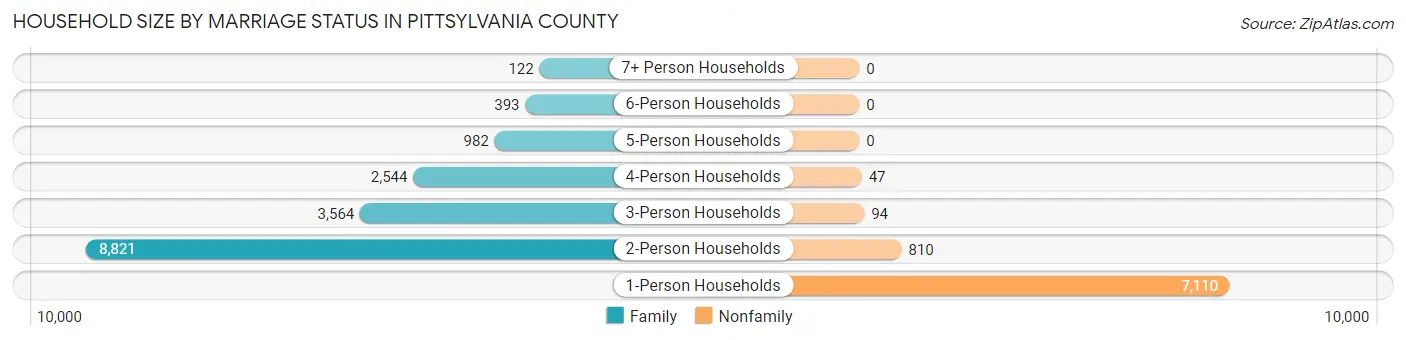
| Household Size | Family Households | Nonfamily Households |
| 1-Person Households | - | 7,110 (29.0%) |
| 2-Person Households | 8,821 (36.0%) | 810 (3.3%) |
| 3-Person Households | 3,564 (14.5%) | 94 (0.4%) |
| 4-Person Households | 2,544 (10.4%) | 47 (0.2%) |
| 5-Person Households | 982 (4.0%) | 0 (0.0%) |
| 6-Person Households | 393 (1.6%) | 0 (0.0%) |
| 7+ Person Households | 122 (0.5%) | 0 (0.0%) |
| Total | 16,426 (67.1%) | 8,061 (32.9%) |
Female Fertility in Pittsylvania County
Fertility by Age in Pittsylvania County
Average fertility rate in Pittsylvania County is 52.0 births per 1,000 women. Women in the age bracket of 20 to 34 years have the highest fertility rate with 110.0 births per 1,000 women. Women in the age bracket of 20 to 34 years acount for 77.3% of all women with births.
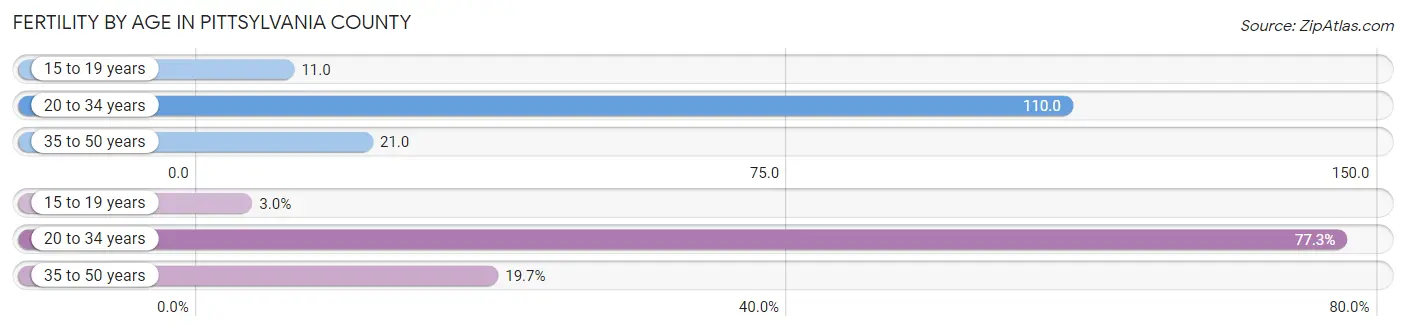
| Age Bracket | Women with Births | Births / 1,000 Women |
| 15 to 19 years | 18 (3.0%) | 11.0 |
| 20 to 34 years | 463 (77.3%) | 110.0 |
| 35 to 50 years | 118 (19.7%) | 21.0 |
| Total | 599 (100.0%) | 52.0 |
Fertility by Age by Marriage Status in Pittsylvania County
65.1% of women with births (599) in Pittsylvania County are married. The highest percentage of unmarried women with births falls into 15 to 19 years age bracket with 100.0% of them unmarried at the time of birth, while the lowest percentage of unmarried women with births belong to 35 to 50 years age bracket with 0.0% of them unmarried.
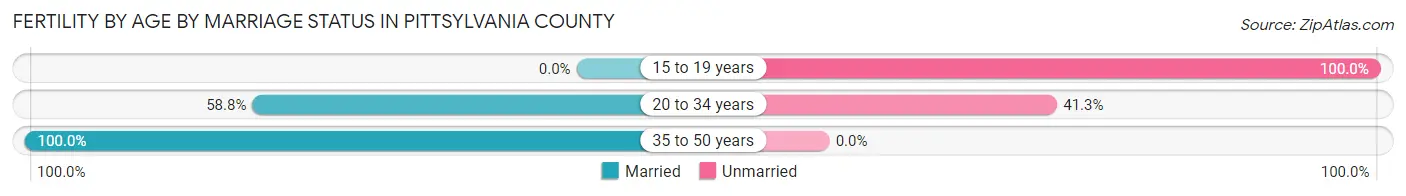
| Age Bracket | Married | Unmarried |
| 15 to 19 years | 0 (0.0%) | 18 (100.0%) |
| 20 to 34 years | 272 (58.8%) | 191 (41.2%) |
| 35 to 50 years | 118 (100.0%) | 0 (0.0%) |
| Total | 390 (65.1%) | 209 (34.9%) |
Fertility by Education in Pittsylvania County
Average fertility rate in Pittsylvania County is 52.0 births per 1,000 women. Women with the education attainment of college or associate's degree have the highest fertility rate of 79.0 births per 1,000 women, while women with the education attainment of less than high school have the lowest fertility at 15.0 births per 1,000 women. Women with the education attainment of college or associate's degree represent 58.1% of all women with births.
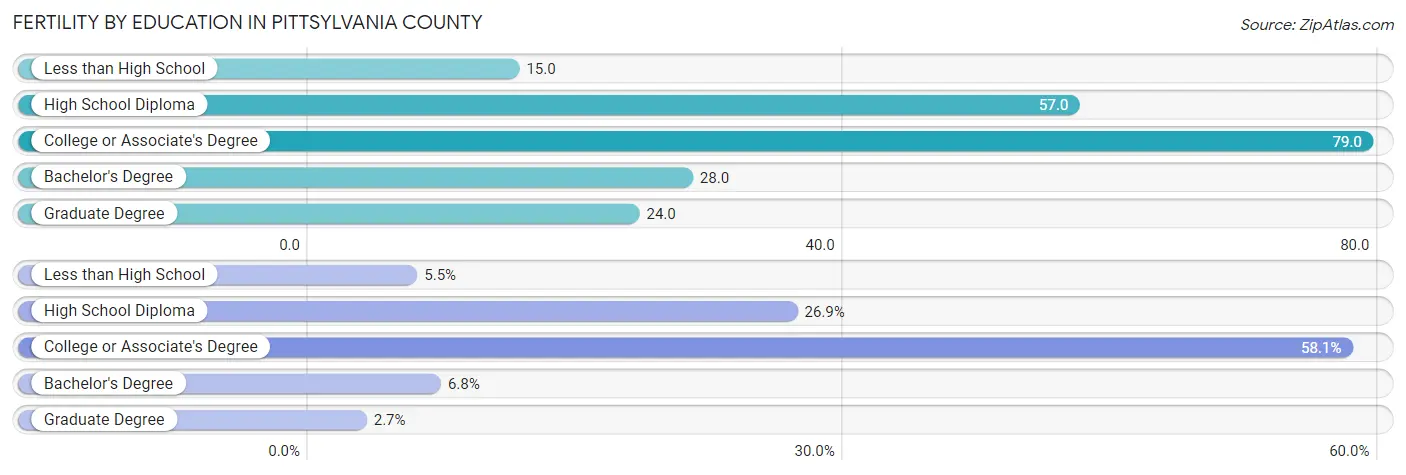
| Educational Attainment | Women with Births | Births / 1,000 Women |
| Less than High School | 33 (5.5%) | 15.0 |
| High School Diploma | 161 (26.9%) | 57.0 |
| College or Associate's Degree | 348 (58.1%) | 79.0 |
| Bachelor's Degree | 41 (6.8%) | 28.0 |
| Graduate Degree | 16 (2.7%) | 24.0 |
| Total | 599 (100.0%) | 52.0 |
Fertility by Education by Marriage Status in Pittsylvania County
34.9% of women with births in Pittsylvania County are unmarried. Women with the educational attainment of bachelor's degree are most likely to be married with 100.0% of them married at childbirth, while women with the educational attainment of less than high school are least likely to be married with 54.5% of them unmarried at childbirth.
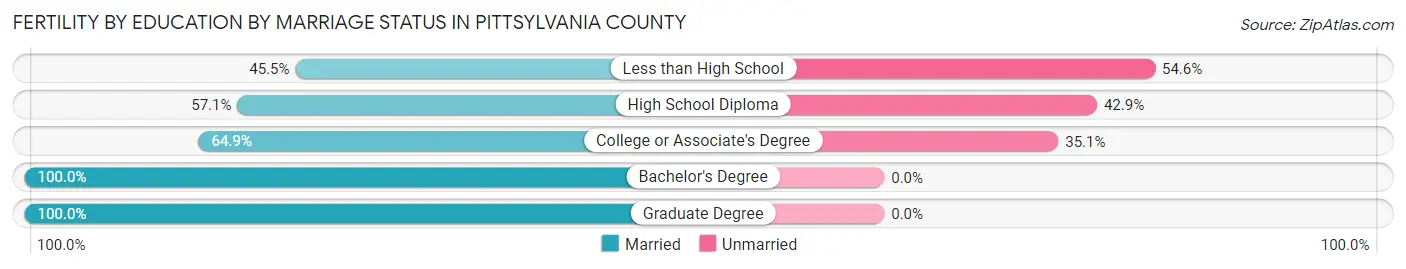
| Educational Attainment | Married | Unmarried |
| Less than High School | 15 (45.5%) | 18 (54.5%) |
| High School Diploma | 92 (57.1%) | 69 (42.9%) |
| College or Associate's Degree | 226 (64.9%) | 122 (35.1%) |
| Bachelor's Degree | 41 (100.0%) | 0 (0.0%) |
| Graduate Degree | 16 (100.0%) | 0 (0.0%) |
| Total | 390 (65.1%) | 209 (34.9%) |
Employment Characteristics in Pittsylvania County
Employment by Class of Employer in Pittsylvania County
Among the 25,257 employed individuals in Pittsylvania County, private company employees (17,630 | 69.8%), local government employees (2,492 | 9.9%), and self-employed (not incorporated) (1,285 | 5.1%) make up the most common classes of employment.
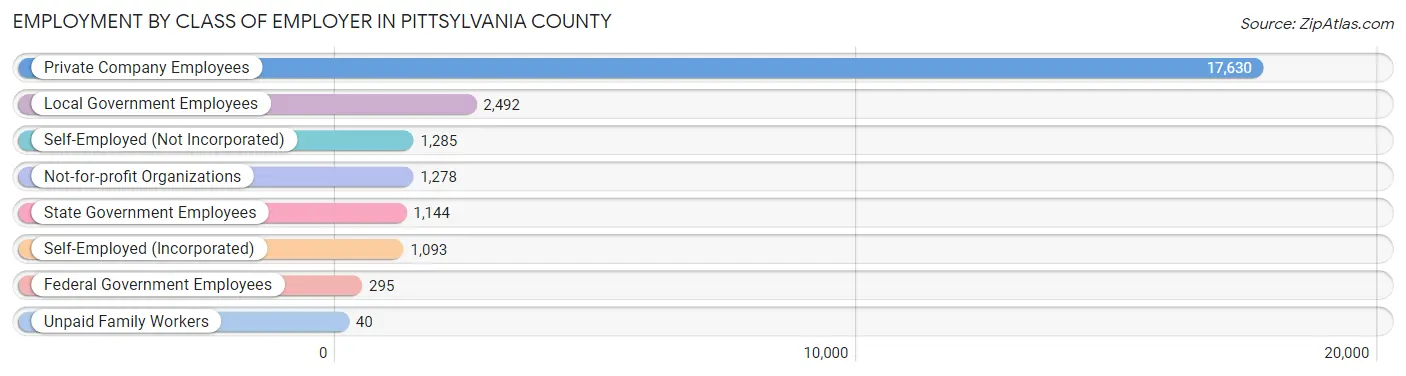
| Employer Class | # Employees | % Employees |
| Private Company Employees | 17,630 | 69.8% |
| Self-Employed (Incorporated) | 1,093 | 4.3% |
| Self-Employed (Not Incorporated) | 1,285 | 5.1% |
| Not-for-profit Organizations | 1,278 | 5.1% |
| Local Government Employees | 2,492 | 9.9% |
| State Government Employees | 1,144 | 4.5% |
| Federal Government Employees | 295 | 1.2% |
| Unpaid Family Workers | 40 | 0.2% |
| Total | 25,257 | 100.0% |
Employment Status by Age in Pittsylvania County
According to the labor force statistics for Pittsylvania County, out of the total population over 16 years of age (50,907), 53.5% or 27,235 individuals are in the labor force, with 5.4% or 1,471 of them unemployed. The age group with the highest labor force participation rate is 30 to 34 years, with 82.1% or 2,403 individuals in the labor force. Within the labor force, the 16 to 19 years age range has the highest percentage of unemployed individuals, with 11.7% or 101 of them being unemployed.
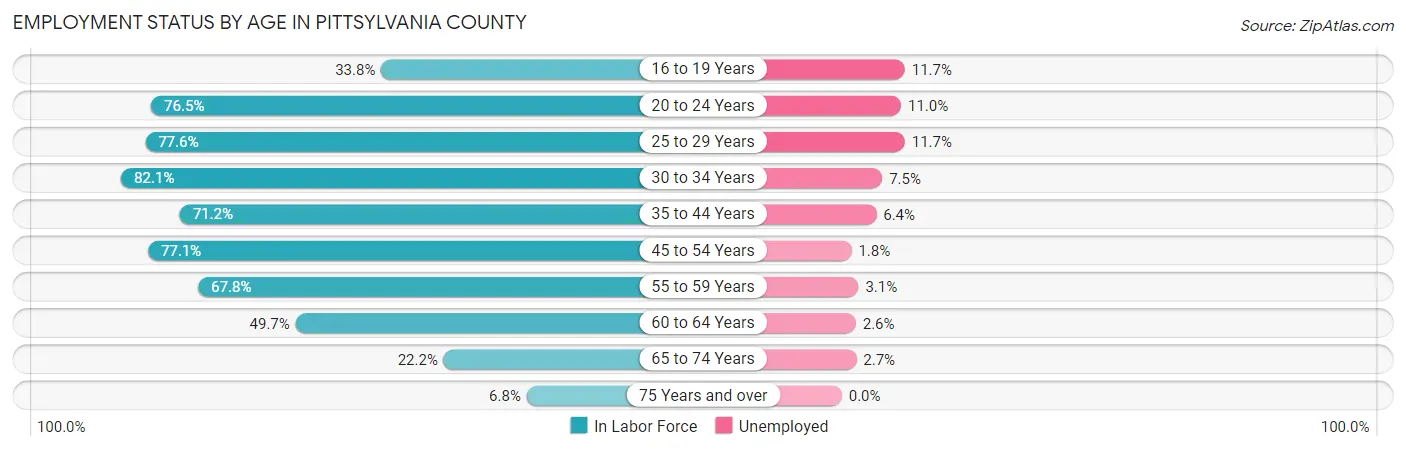
| Age Bracket | In Labor Force | Unemployed |
| 16 to 19 Years | 865 (33.8%) | 101 (11.7%) |
| 20 to 24 Years | 2,594 (76.5%) | 285 (11.0%) |
| 25 to 29 Years | 2,402 (77.6%) | 281 (11.7%) |
| 30 to 34 Years | 2,403 (82.1%) | 180 (7.5%) |
| 35 to 44 Years | 4,691 (71.2%) | 300 (6.4%) |
| 45 to 54 Years | 6,378 (77.1%) | 115 (1.8%) |
| 55 to 59 Years | 2,866 (67.8%) | 89 (3.1%) |
| 60 to 64 Years | 2,783 (49.7%) | 72 (2.6%) |
| 65 to 74 Years | 1,824 (22.2%) | 49 (2.7%) |
| 75 Years and over | 410 (6.8%) | 0 (0.0%) |
| Total | 27,235 (53.5%) | 1,471 (5.4%) |
Employment Status by Educational Attainment in Pittsylvania County
According to labor force statistics for Pittsylvania County, 70.1% of individuals (21,528) out of the total population between 25 and 64 years of age (30,711) are in the labor force, with 4.8% or 1,033 of them being unemployed. The group with the highest labor force participation rate are those with the educational attainment of bachelor's degree or higher, with 82.2% or 4,198 individuals in the labor force. Within the labor force, individuals with less than high school education have the highest percentage of unemployment, with 8.6% or 134 of them being unemployed.
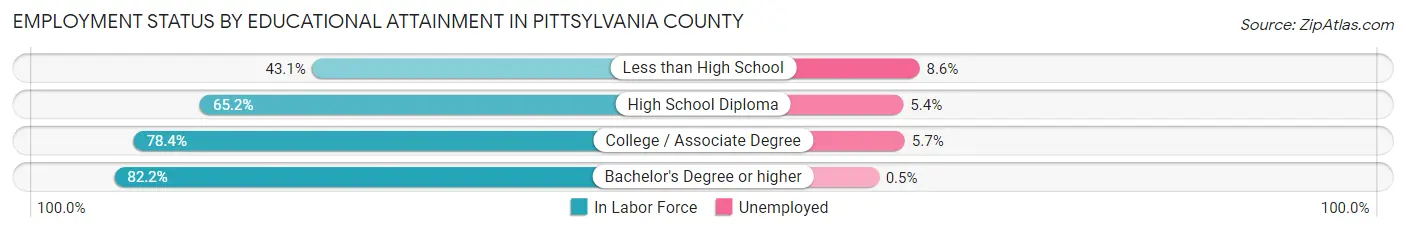
| Educational Attainment | In Labor Force | Unemployed |
| Less than High School | 1,560 (43.1%) | 311 (8.6%) |
| High School Diploma | 7,285 (65.2%) | 603 (5.4%) |
| College / Associate Degree | 8,476 (78.4%) | 616 (5.7%) |
| Bachelor's Degree or higher | 4,198 (82.2%) | 26 (0.5%) |
| Total | 21,528 (70.1%) | 1,474 (4.8%) |
Employment Occupations by Sex in Pittsylvania County
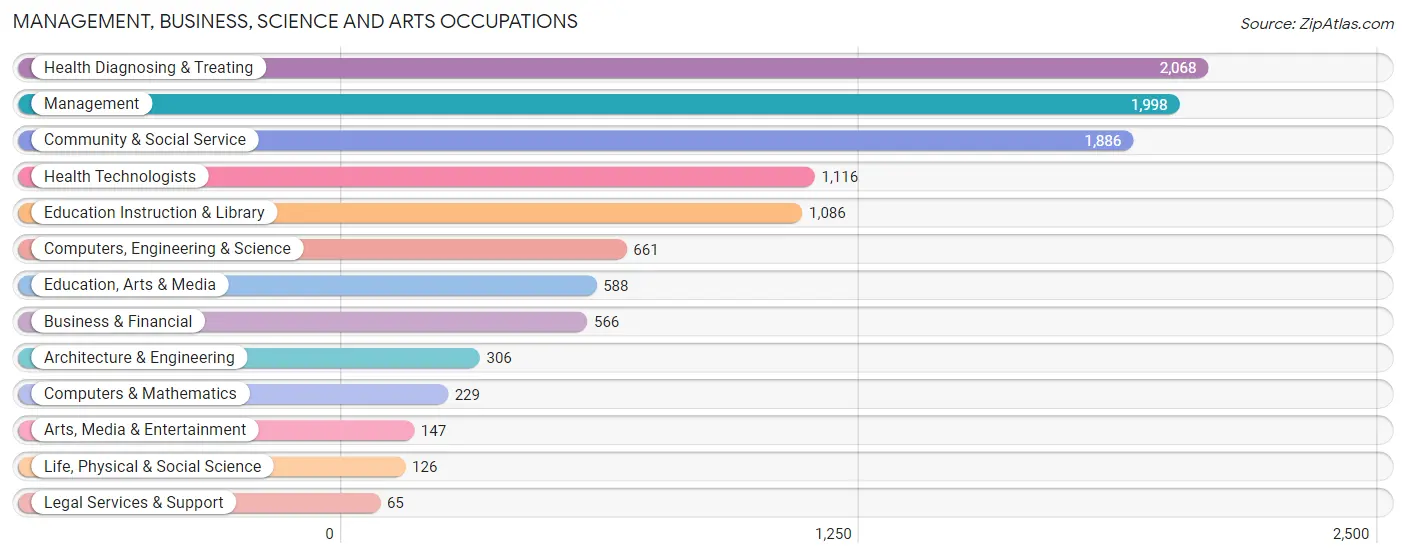
Management, Business, Science and Arts Occupations
The most common Management, Business, Science and Arts occupations in Pittsylvania County are Health Diagnosing & Treating (2,068 | 8.0%), Management (1,998 | 7.8%), Community & Social Service (1,886 | 7.3%), Health Technologists (1,116 | 4.3%), and Education Instruction & Library (1,086 | 4.2%).
Management, Business, Science and Arts Occupations by Sex
Within the Management, Business, Science and Arts occupations in Pittsylvania County, the most male-oriented occupations are Architecture & Engineering (88.6%), Computers, Engineering & Science (71.4%), and Computers & Mathematics (62.0%), while the most female-oriented occupations are Health Diagnosing & Treating (91.1%), Health Technologists (90.5%), and Education, Arts & Media (82.7%).
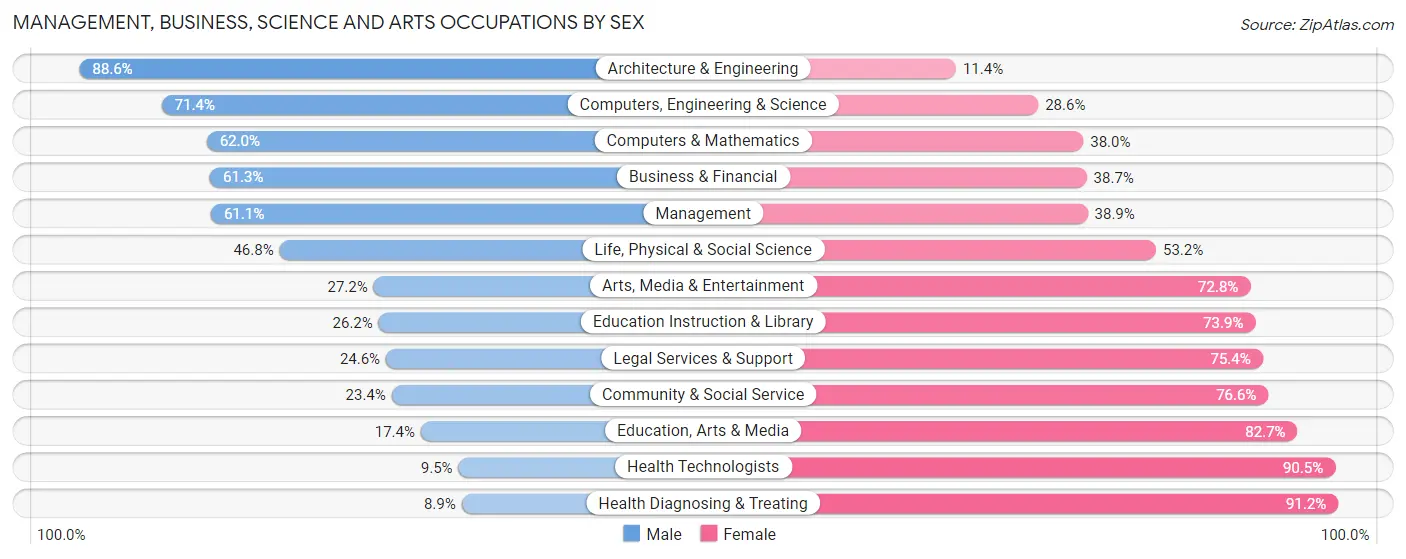
| Occupation | Male | Female |
| Management | 1,221 (61.1%) | 777 (38.9%) |
| Business & Financial | 347 (61.3%) | 219 (38.7%) |
| Computers, Engineering & Science | 472 (71.4%) | 189 (28.6%) |
| Computers & Mathematics | 142 (62.0%) | 87 (38.0%) |
| Architecture & Engineering | 271 (88.6%) | 35 (11.4%) |
| Life, Physical & Social Science | 59 (46.8%) | 67 (53.2%) |
| Community & Social Service | 442 (23.4%) | 1,444 (76.6%) |
| Education, Arts & Media | 102 (17.3%) | 486 (82.7%) |
| Legal Services & Support | 16 (24.6%) | 49 (75.4%) |
| Education Instruction & Library | 284 (26.2%) | 802 (73.9%) |
| Arts, Media & Entertainment | 40 (27.2%) | 107 (72.8%) |
| Health Diagnosing & Treating | 183 (8.8%) | 1,885 (91.1%) |
| Health Technologists | 106 (9.5%) | 1,010 (90.5%) |
| Total (Category) | 2,665 (37.1%) | 4,514 (62.9%) |
| Total (Overall) | 12,978 (50.4%) | 12,752 (49.6%) |
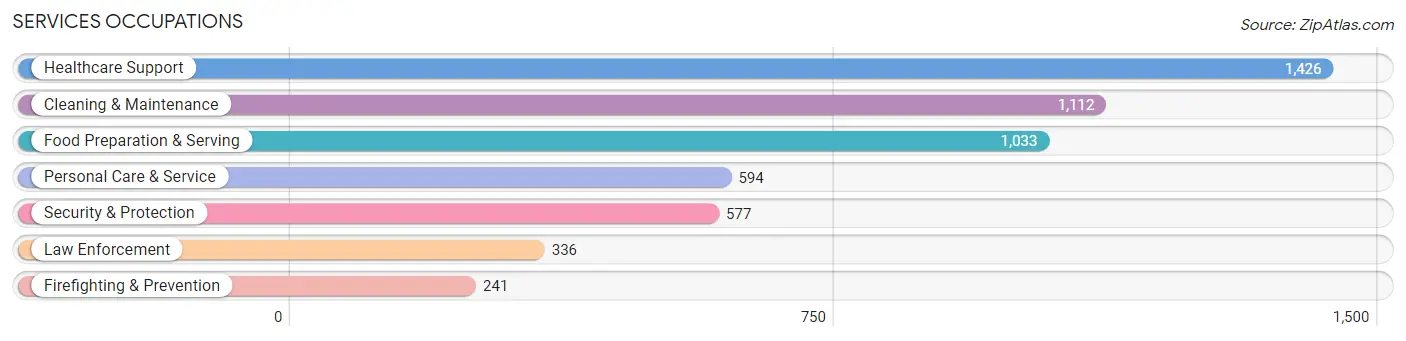
Services Occupations
The most common Services occupations in Pittsylvania County are Healthcare Support (1,426 | 5.5%), Cleaning & Maintenance (1,112 | 4.3%), Food Preparation & Serving (1,033 | 4.0%), Personal Care & Service (594 | 2.3%), and Security & Protection (577 | 2.2%).
Services Occupations by Sex
Within the Services occupations in Pittsylvania County, the most male-oriented occupations are Firefighting & Prevention (90.5%), Security & Protection (84.1%), and Law Enforcement (79.5%), while the most female-oriented occupations are Healthcare Support (93.0%), Personal Care & Service (63.8%), and Food Preparation & Serving (61.9%).
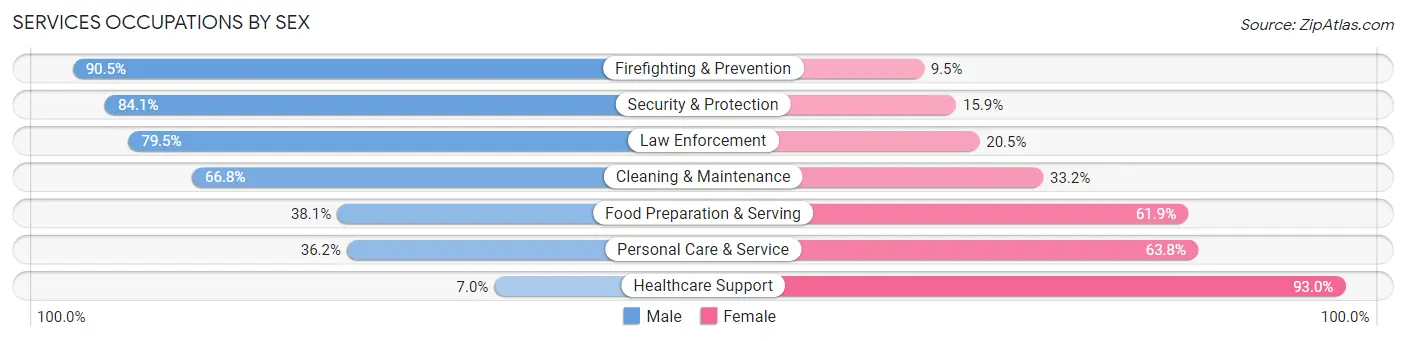
| Occupation | Male | Female |
| Healthcare Support | 100 (7.0%) | 1,326 (93.0%) |
| Security & Protection | 485 (84.1%) | 92 (15.9%) |
| Firefighting & Prevention | 218 (90.5%) | 23 (9.5%) |
| Law Enforcement | 267 (79.5%) | 69 (20.5%) |
| Food Preparation & Serving | 394 (38.1%) | 639 (61.9%) |
| Cleaning & Maintenance | 743 (66.8%) | 369 (33.2%) |
| Personal Care & Service | 215 (36.2%) | 379 (63.8%) |
| Total (Category) | 1,937 (40.8%) | 2,805 (59.2%) |
| Total (Overall) | 12,978 (50.4%) | 12,752 (49.6%) |
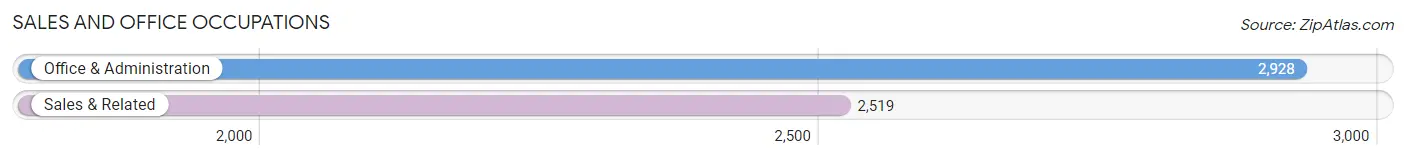
Sales and Office Occupations
The most common Sales and Office occupations in Pittsylvania County are Office & Administration (2,928 | 11.4%), and Sales & Related (2,519 | 9.8%).
Sales and Office Occupations by Sex

| Occupation | Male | Female |
| Sales & Related | 1,083 (43.0%) | 1,436 (57.0%) |
| Office & Administration | 518 (17.7%) | 2,410 (82.3%) |
| Total (Category) | 1,601 (29.4%) | 3,846 (70.6%) |
| Total (Overall) | 12,978 (50.4%) | 12,752 (49.6%) |
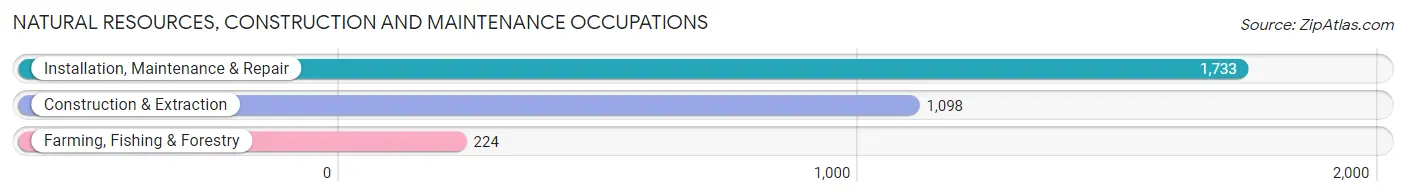
Natural Resources, Construction and Maintenance Occupations
The most common Natural Resources, Construction and Maintenance occupations in Pittsylvania County are Installation, Maintenance & Repair (1,733 | 6.7%), Construction & Extraction (1,098 | 4.3%), and Farming, Fishing & Forestry (224 | 0.9%).
Natural Resources, Construction and Maintenance Occupations by Sex
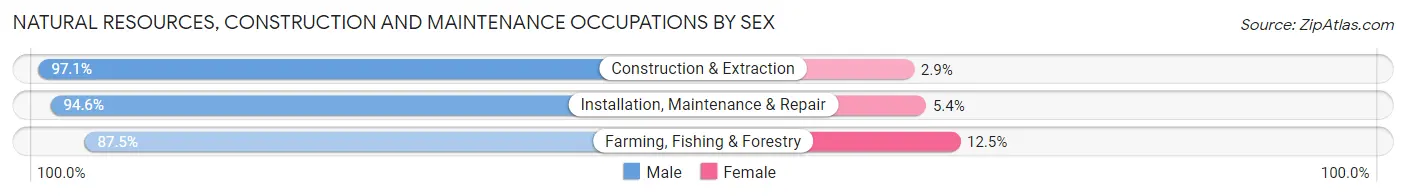
| Occupation | Male | Female |
| Farming, Fishing & Forestry | 196 (87.5%) | 28 (12.5%) |
| Construction & Extraction | 1,066 (97.1%) | 32 (2.9%) |
| Installation, Maintenance & Repair | 1,639 (94.6%) | 94 (5.4%) |
| Total (Category) | 2,901 (95.0%) | 154 (5.0%) |
| Total (Overall) | 12,978 (50.4%) | 12,752 (49.6%) |
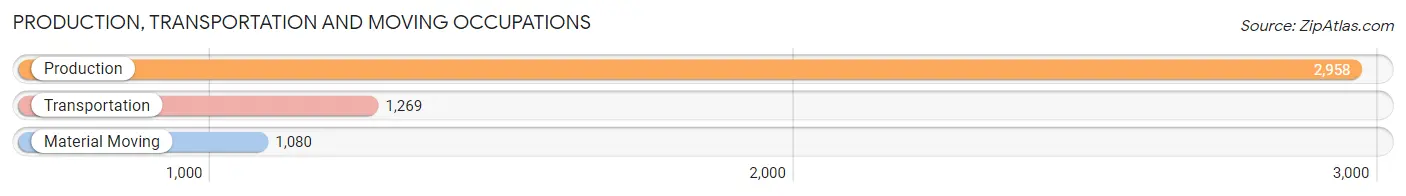
Production, Transportation and Moving Occupations
The most common Production, Transportation and Moving occupations in Pittsylvania County are Production (2,958 | 11.5%), Transportation (1,269 | 4.9%), and Material Moving (1,080 | 4.2%).
Production, Transportation and Moving Occupations by Sex
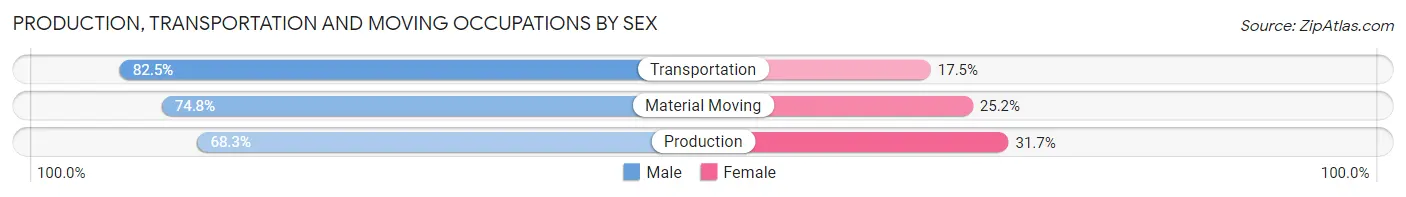
| Occupation | Male | Female |
| Production | 2,019 (68.3%) | 939 (31.7%) |
| Transportation | 1,047 (82.5%) | 222 (17.5%) |
| Material Moving | 808 (74.8%) | 272 (25.2%) |
| Total (Category) | 3,874 (73.0%) | 1,433 (27.0%) |
| Total (Overall) | 12,978 (50.4%) | 12,752 (49.6%) |
Employment Industries by Sex in Pittsylvania County
Employment Industries in Pittsylvania County
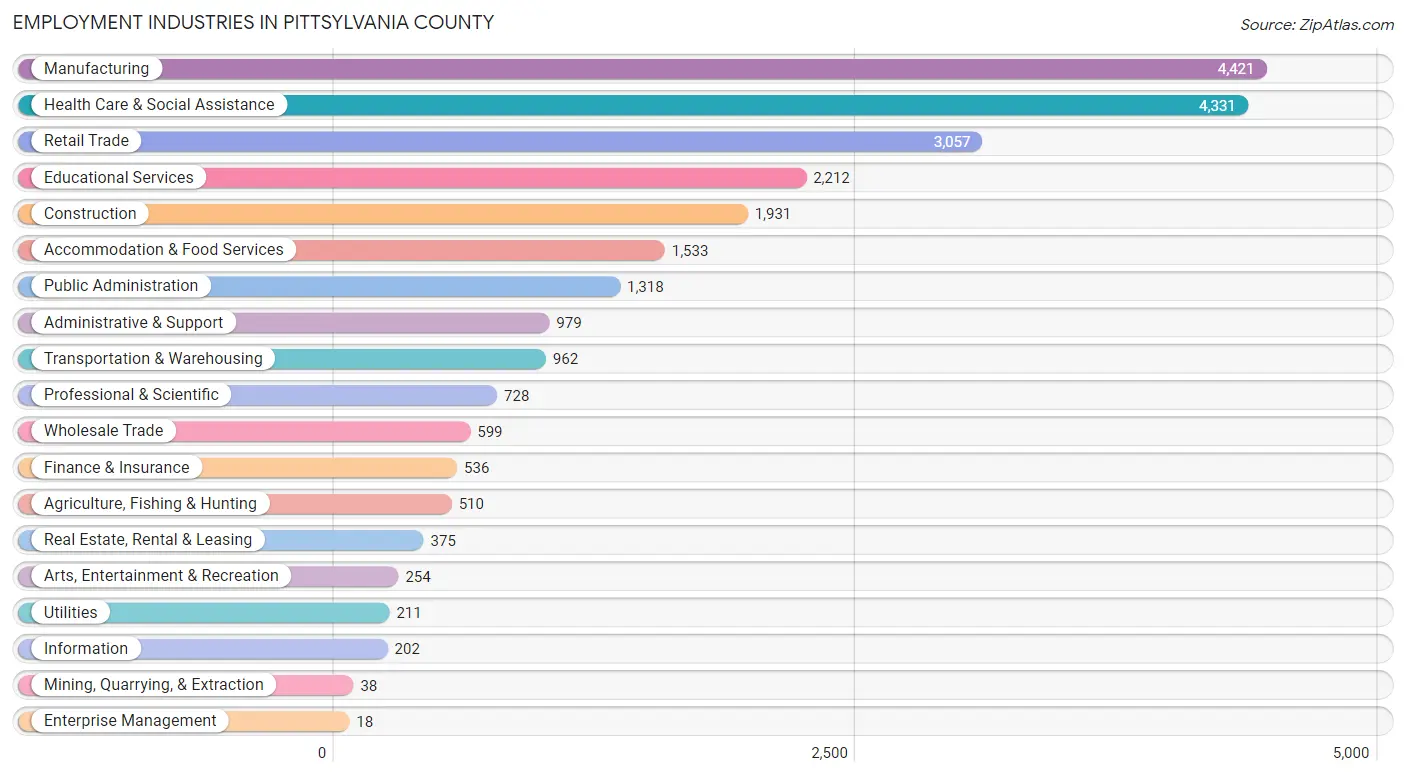
The major employment industries in Pittsylvania County include Manufacturing (4,421 | 17.2%), Health Care & Social Assistance (4,331 | 16.8%), Retail Trade (3,057 | 11.9%), Educational Services (2,212 | 8.6%), and Construction (1,931 | 7.5%).
Employment Industries by Sex in Pittsylvania County
The Pittsylvania County industries that see more men than women are Enterprise Management (100.0%), Agriculture, Fishing & Hunting (92.7%), and Construction (90.7%), whereas the industries that tend to have a higher number of women are Health Care & Social Assistance (89.1%), Finance & Insurance (78.5%), and Educational Services (68.1%).
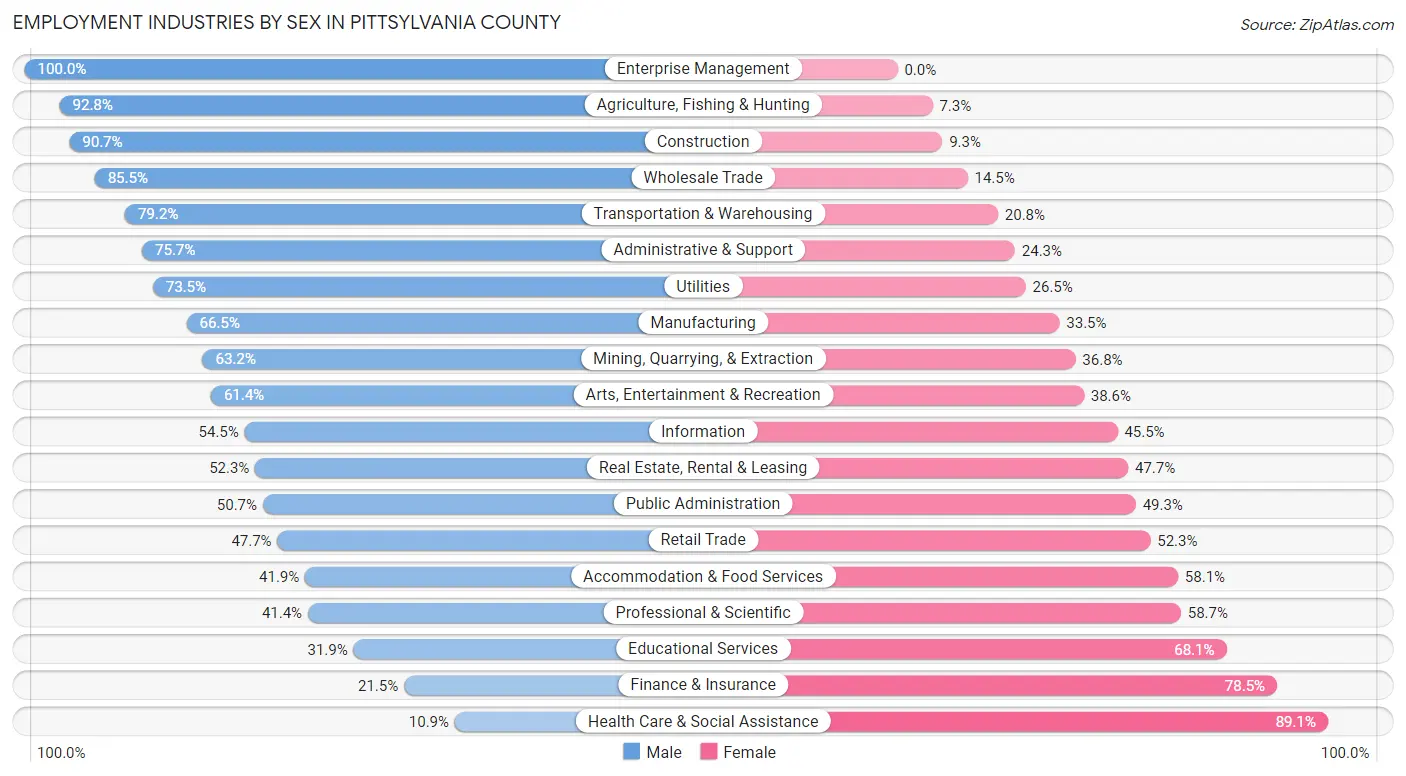
| Industry | Male | Female |
| Agriculture, Fishing & Hunting | 473 (92.7%) | 37 (7.2%) |
| Mining, Quarrying, & Extraction | 24 (63.2%) | 14 (36.8%) |
| Construction | 1,752 (90.7%) | 179 (9.3%) |
| Manufacturing | 2,939 (66.5%) | 1,482 (33.5%) |
| Wholesale Trade | 512 (85.5%) | 87 (14.5%) |
| Retail Trade | 1,457 (47.7%) | 1,600 (52.3%) |
| Transportation & Warehousing | 762 (79.2%) | 200 (20.8%) |
| Utilities | 155 (73.5%) | 56 (26.5%) |
| Information | 110 (54.5%) | 92 (45.5%) |
| Finance & Insurance | 115 (21.5%) | 421 (78.5%) |
| Real Estate, Rental & Leasing | 196 (52.3%) | 179 (47.7%) |
| Professional & Scientific | 301 (41.3%) | 427 (58.7%) |
| Enterprise Management | 18 (100.0%) | 0 (0.0%) |
| Administrative & Support | 741 (75.7%) | 238 (24.3%) |
| Educational Services | 706 (31.9%) | 1,506 (68.1%) |
| Health Care & Social Assistance | 474 (10.9%) | 3,857 (89.1%) |
| Arts, Entertainment & Recreation | 156 (61.4%) | 98 (38.6%) |
| Accommodation & Food Services | 643 (41.9%) | 890 (58.1%) |
| Public Administration | 668 (50.7%) | 650 (49.3%) |
| Total | 12,978 (50.4%) | 12,752 (49.6%) |
Education in Pittsylvania County
School Enrollment in Pittsylvania County
The most common levels of schooling among the 10,876 students in Pittsylvania County are high school (2,860 | 26.3%), middle school (2,444 | 22.5%), and elementary school (2,404 | 22.1%).
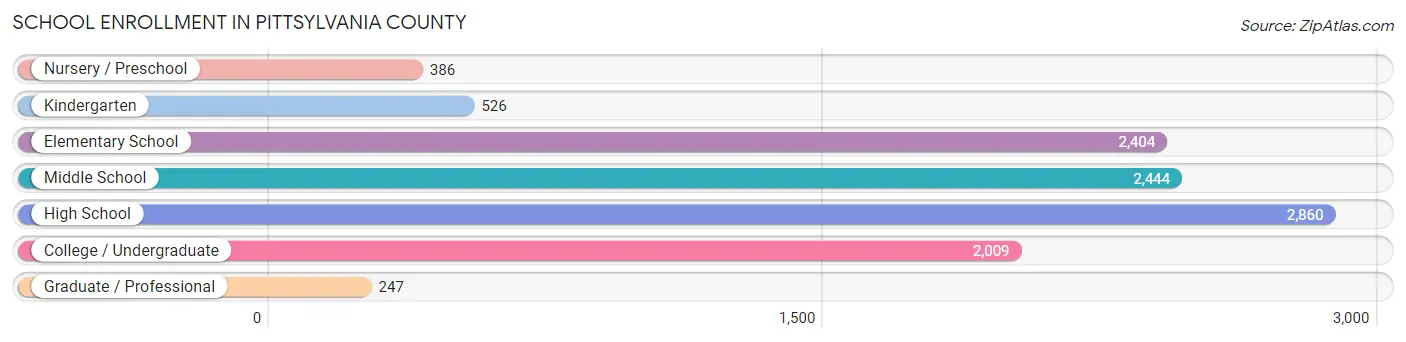
| School Level | # Students | % Students |
| Nursery / Preschool | 386 | 3.5% |
| Kindergarten | 526 | 4.8% |
| Elementary School | 2,404 | 22.1% |
| Middle School | 2,444 | 22.5% |
| High School | 2,860 | 26.3% |
| College / Undergraduate | 2,009 | 18.5% |
| Graduate / Professional | 247 | 2.3% |
| Total | 10,876 | 100.0% |
School Enrollment by Age by Funding Source in Pittsylvania County
Out of a total of 10,876 students who are enrolled in schools in Pittsylvania County, 1,871 (17.2%) attend a private institution, while the remaining 9,005 (82.8%) are enrolled in public schools. The age group of 25 to 34 year olds has the highest likelihood of being enrolled in private schools, with 151 (48.9% in the age bracket) enrolled. Conversely, the age group of 5 to 9 year old has the lowest likelihood of being enrolled in a private school, with 2,310 (87.2% in the age bracket) attending a public institution.
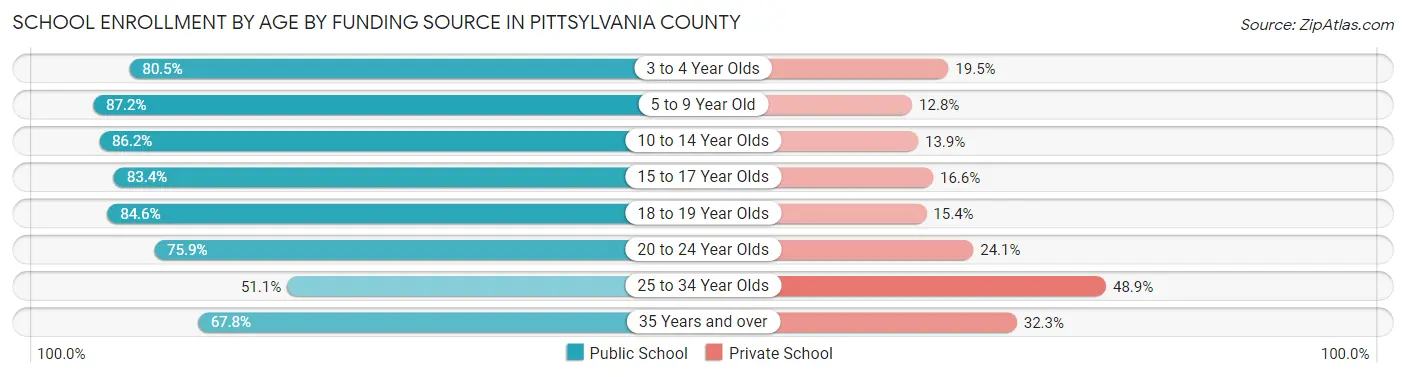
| Age Bracket | Public School | Private School |
| 3 to 4 Year Olds | 293 (80.5%) | 71 (19.5%) |
| 5 to 9 Year Old | 2,310 (87.2%) | 338 (12.8%) |
| 10 to 14 Year Olds | 2,649 (86.2%) | 426 (13.9%) |
| 15 to 17 Year Olds | 1,763 (83.4%) | 352 (16.6%) |
| 18 to 19 Year Olds | 697 (84.6%) | 127 (15.4%) |
| 20 to 24 Year Olds | 842 (75.9%) | 268 (24.1%) |
| 25 to 34 Year Olds | 158 (51.1%) | 151 (48.9%) |
| 35 Years and over | 292 (67.7%) | 139 (32.3%) |
| Total | 9,005 (82.8%) | 1,871 (17.2%) |
Educational Attainment by Field of Study in Pittsylvania County
Business (1,278 | 17.1%), education (1,248 | 16.7%), science & technology (944 | 12.6%), arts & humanities (697 | 9.3%), and social sciences (536 | 7.2%) are the most common fields of study among 7,478 individuals in Pittsylvania County who have obtained a bachelor's degree or higher.
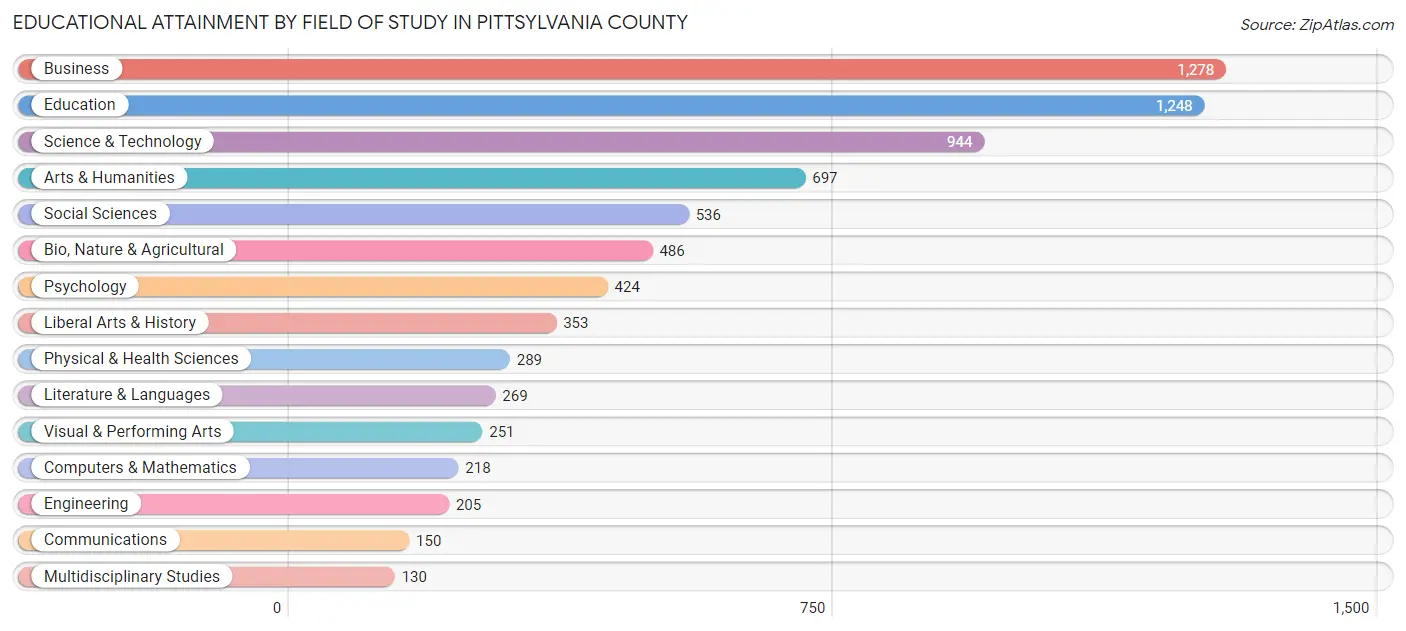
| Field of Study | # Graduates | % Graduates |
| Computers & Mathematics | 218 | 2.9% |
| Bio, Nature & Agricultural | 486 | 6.5% |
| Physical & Health Sciences | 289 | 3.9% |
| Psychology | 424 | 5.7% |
| Social Sciences | 536 | 7.2% |
| Engineering | 205 | 2.7% |
| Multidisciplinary Studies | 130 | 1.7% |
| Science & Technology | 944 | 12.6% |
| Business | 1,278 | 17.1% |
| Education | 1,248 | 16.7% |
| Literature & Languages | 269 | 3.6% |
| Liberal Arts & History | 353 | 4.7% |
| Visual & Performing Arts | 251 | 3.4% |
| Communications | 150 | 2.0% |
| Arts & Humanities | 697 | 9.3% |
| Total | 7,478 | 100.0% |
Transportation & Commute in Pittsylvania County
Vehicle Availability by Sex in Pittsylvania County
The most prevalent vehicle ownership categories in Pittsylvania County are males with 2 vehicles (4,269, accounting for 33.4%) and females with 2 vehicles (4,585, making up 34.3%).
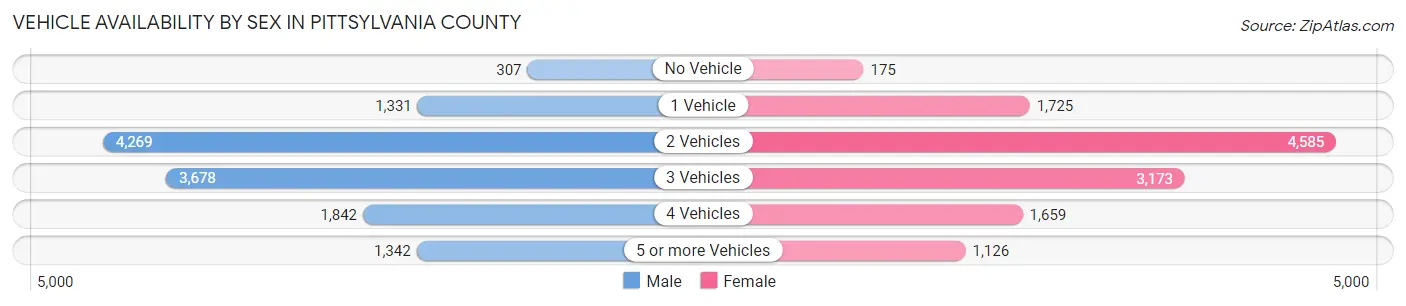
| Vehicles Available | Male | Female |
| No Vehicle | 307 (2.4%) | 175 (1.4%) |
| 1 Vehicle | 1,331 (10.4%) | 1,725 (13.9%) |
| 2 Vehicles | 4,269 (33.4%) | 4,585 (36.8%) |
| 3 Vehicles | 3,678 (28.8%) | 3,173 (25.5%) |
| 4 Vehicles | 1,842 (14.4%) | 1,659 (13.3%) |
| 5 or more Vehicles | 1,342 (10.5%) | 1,126 (9.0%) |
| Total | 12,769 (100.0%) | 12,443 (100.0%) |
Commute Time in Pittsylvania County
The most frequently occuring commute durations in Pittsylvania County are 20 to 24 minutes (4,954 commuters, 20.4%), 15 to 19 minutes (4,124 commuters, 17.0%), and 30 to 34 minutes (3,295 commuters, 13.6%).
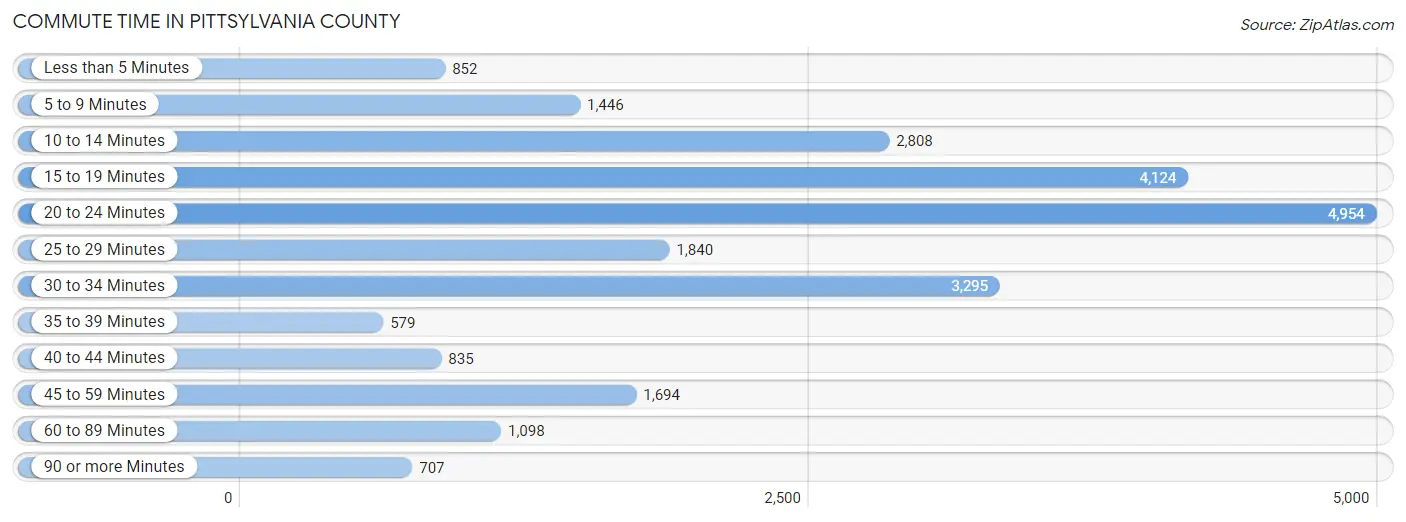
| Commute Time | # Commuters | % Commuters |
| Less than 5 Minutes | 852 | 3.5% |
| 5 to 9 Minutes | 1,446 | 6.0% |
| 10 to 14 Minutes | 2,808 | 11.6% |
| 15 to 19 Minutes | 4,124 | 17.0% |
| 20 to 24 Minutes | 4,954 | 20.4% |
| 25 to 29 Minutes | 1,840 | 7.6% |
| 30 to 34 Minutes | 3,295 | 13.6% |
| 35 to 39 Minutes | 579 | 2.4% |
| 40 to 44 Minutes | 835 | 3.5% |
| 45 to 59 Minutes | 1,694 | 7.0% |
| 60 to 89 Minutes | 1,098 | 4.5% |
| 90 or more Minutes | 707 | 2.9% |
Commute Time by Sex in Pittsylvania County
The most common commute times in Pittsylvania County are 20 to 24 minutes (2,320 commuters, 18.7%) for males and 20 to 24 minutes (2,634 commuters, 22.3%) for females.
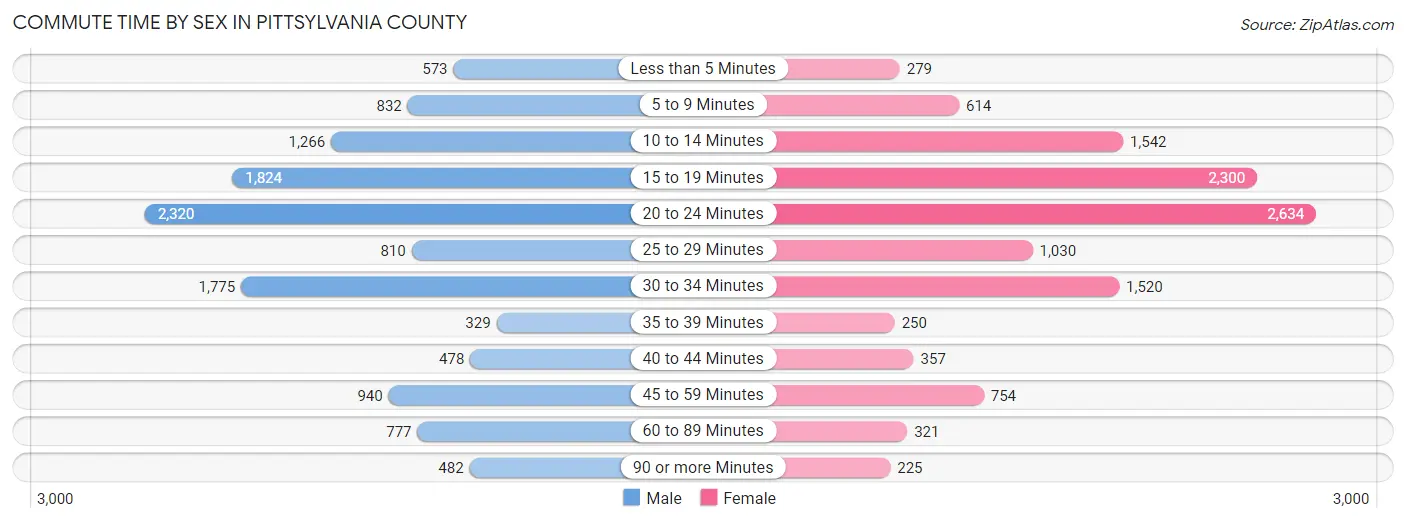
| Commute Time | Male | Female |
| Less than 5 Minutes | 573 (4.6%) | 279 (2.4%) |
| 5 to 9 Minutes | 832 (6.7%) | 614 (5.2%) |
| 10 to 14 Minutes | 1,266 (10.2%) | 1,542 (13.0%) |
| 15 to 19 Minutes | 1,824 (14.7%) | 2,300 (19.5%) |
| 20 to 24 Minutes | 2,320 (18.7%) | 2,634 (22.3%) |
| 25 to 29 Minutes | 810 (6.5%) | 1,030 (8.7%) |
| 30 to 34 Minutes | 1,775 (14.3%) | 1,520 (12.9%) |
| 35 to 39 Minutes | 329 (2.6%) | 250 (2.1%) |
| 40 to 44 Minutes | 478 (3.8%) | 357 (3.0%) |
| 45 to 59 Minutes | 940 (7.6%) | 754 (6.4%) |
| 60 to 89 Minutes | 777 (6.3%) | 321 (2.7%) |
| 90 or more Minutes | 482 (3.9%) | 225 (1.9%) |
Time of Departure to Work by Sex in Pittsylvania County
The most frequent times of departure to work in Pittsylvania County are 7:00 AM to 7:29 AM (2,295, 18.5%) for males and 7:30 AM to 7:59 AM (2,511, 21.2%) for females.
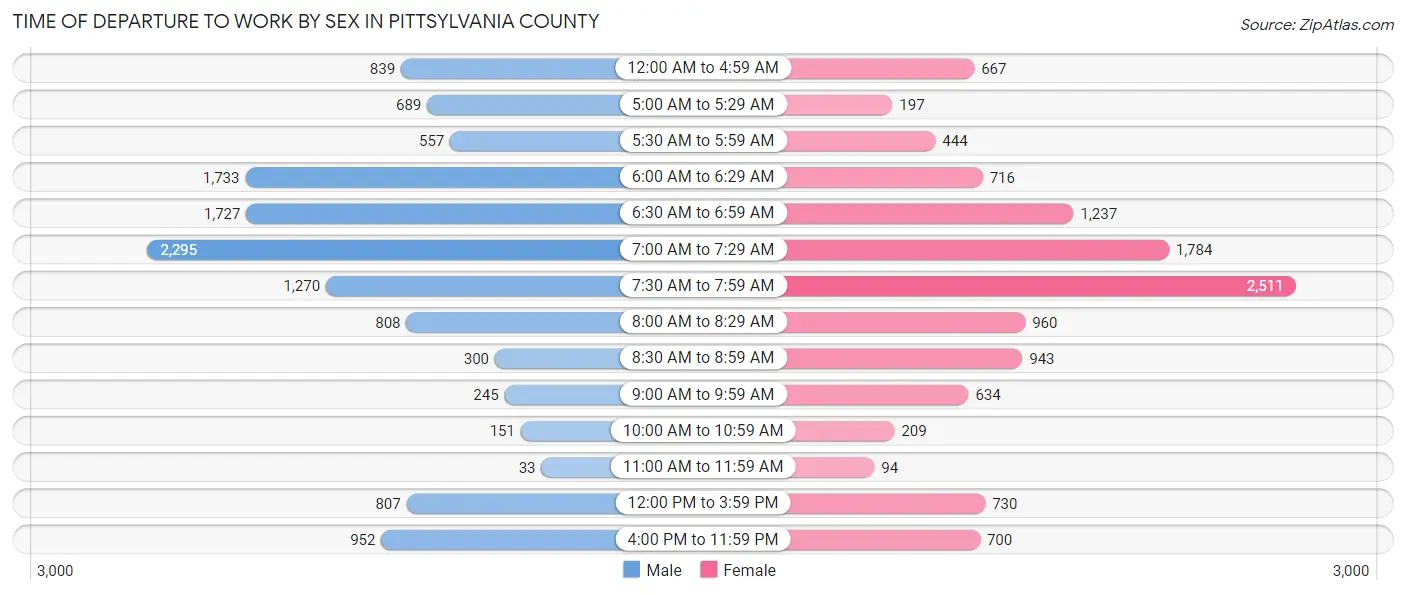
| Time of Departure | Male | Female |
| 12:00 AM to 4:59 AM | 839 (6.8%) | 667 (5.6%) |
| 5:00 AM to 5:29 AM | 689 (5.6%) | 197 (1.7%) |
| 5:30 AM to 5:59 AM | 557 (4.5%) | 444 (3.7%) |
| 6:00 AM to 6:29 AM | 1,733 (14.0%) | 716 (6.0%) |
| 6:30 AM to 6:59 AM | 1,727 (13.9%) | 1,237 (10.5%) |
| 7:00 AM to 7:29 AM | 2,295 (18.5%) | 1,784 (15.1%) |
| 7:30 AM to 7:59 AM | 1,270 (10.2%) | 2,511 (21.2%) |
| 8:00 AM to 8:29 AM | 808 (6.5%) | 960 (8.1%) |
| 8:30 AM to 8:59 AM | 300 (2.4%) | 943 (8.0%) |
| 9:00 AM to 9:59 AM | 245 (2.0%) | 634 (5.4%) |
| 10:00 AM to 10:59 AM | 151 (1.2%) | 209 (1.8%) |
| 11:00 AM to 11:59 AM | 33 (0.3%) | 94 (0.8%) |
| 12:00 PM to 3:59 PM | 807 (6.5%) | 730 (6.2%) |
| 4:00 PM to 11:59 PM | 952 (7.7%) | 700 (5.9%) |
| Total | 12,406 (100.0%) | 11,826 (100.0%) |
Housing Occupancy in Pittsylvania County
Occupancy by Ownership in Pittsylvania County
Of the total 24,487 dwellings in Pittsylvania County, owner-occupied units account for 18,951 (77.4%), while renter-occupied units make up 5,536 (22.6%).
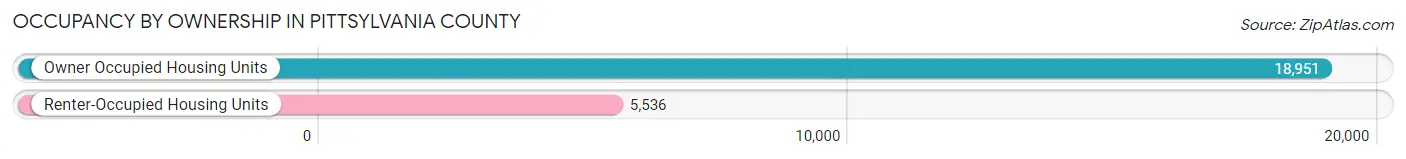
| Occupancy | # Housing Units | % Housing Units |
| Owner Occupied Housing Units | 18,951 | 77.4% |
| Renter-Occupied Housing Units | 5,536 | 22.6% |
| Total Occupied Housing Units | 24,487 | 100.0% |
Occupancy by Household Size in Pittsylvania County
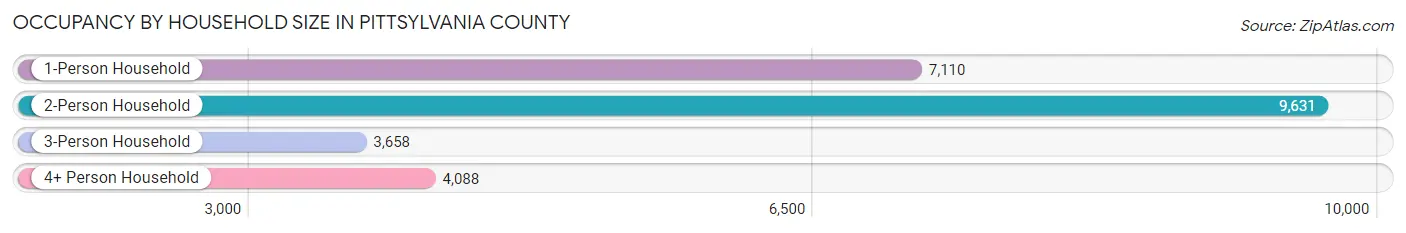
| Household Size | # Housing Units | % Housing Units |
| 1-Person Household | 7,110 | 29.0% |
| 2-Person Household | 9,631 | 39.3% |
| 3-Person Household | 3,658 | 14.9% |
| 4+ Person Household | 4,088 | 16.7% |
| Total Housing Units | 24,487 | 100.0% |
Occupancy by Ownership by Household Size in Pittsylvania County
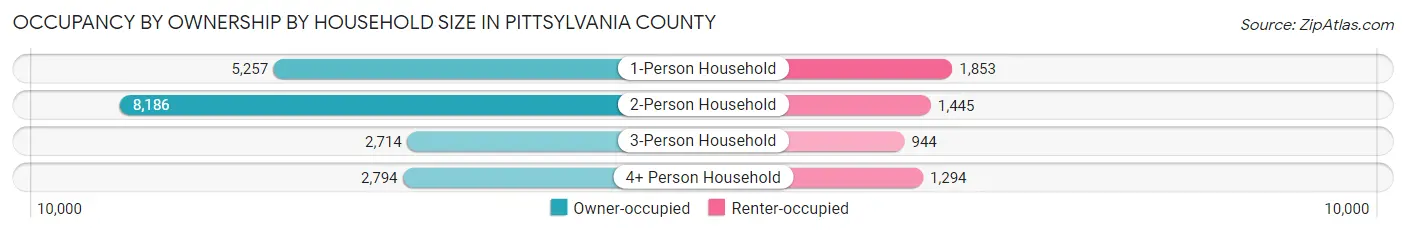
| Household Size | Owner-occupied | Renter-occupied |
| 1-Person Household | 5,257 (73.9%) | 1,853 (26.1%) |
| 2-Person Household | 8,186 (85.0%) | 1,445 (15.0%) |
| 3-Person Household | 2,714 (74.2%) | 944 (25.8%) |
| 4+ Person Household | 2,794 (68.3%) | 1,294 (31.7%) |
| Total Housing Units | 18,951 (77.4%) | 5,536 (22.6%) |
Occupancy by Educational Attainment in Pittsylvania County
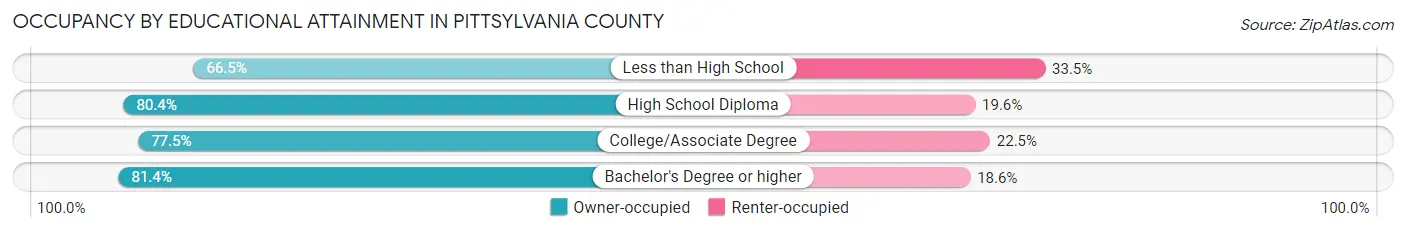
| Household Size | Owner-occupied | Renter-occupied |
| Less than High School | 2,574 (66.5%) | 1,296 (33.5%) |
| High School Diploma | 6,761 (80.4%) | 1,649 (19.6%) |
| College/Associate Degree | 6,272 (77.5%) | 1,825 (22.5%) |
| Bachelor's Degree or higher | 3,344 (81.4%) | 766 (18.6%) |
Occupancy by Age of Householder in Pittsylvania County
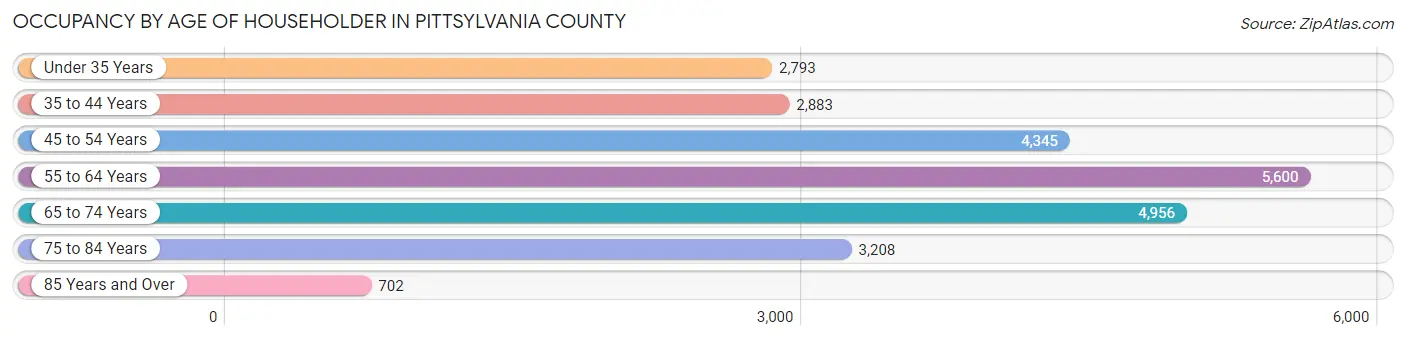
| Age Bracket | # Households | % Households |
| Under 35 Years | 2,793 | 11.4% |
| 35 to 44 Years | 2,883 | 11.8% |
| 45 to 54 Years | 4,345 | 17.7% |
| 55 to 64 Years | 5,600 | 22.9% |
| 65 to 74 Years | 4,956 | 20.2% |
| 75 to 84 Years | 3,208 | 13.1% |
| 85 Years and Over | 702 | 2.9% |
| Total | 24,487 | 100.0% |
Housing Finances in Pittsylvania County
Median Income by Occupancy in Pittsylvania County
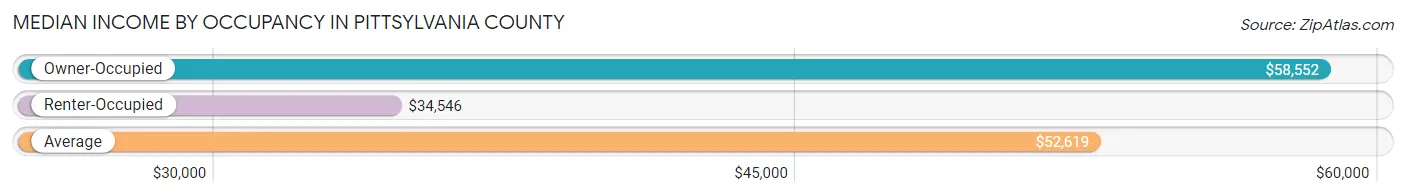
| Occupancy Type | # Households | Median Income |
| Owner-Occupied | 18,951 (77.4%) | $58,552 |
| Renter-Occupied | 5,536 (22.6%) | $34,546 |
| Average | 24,487 (100.0%) | $52,619 |
Occupancy by Householder Income Bracket in Pittsylvania County
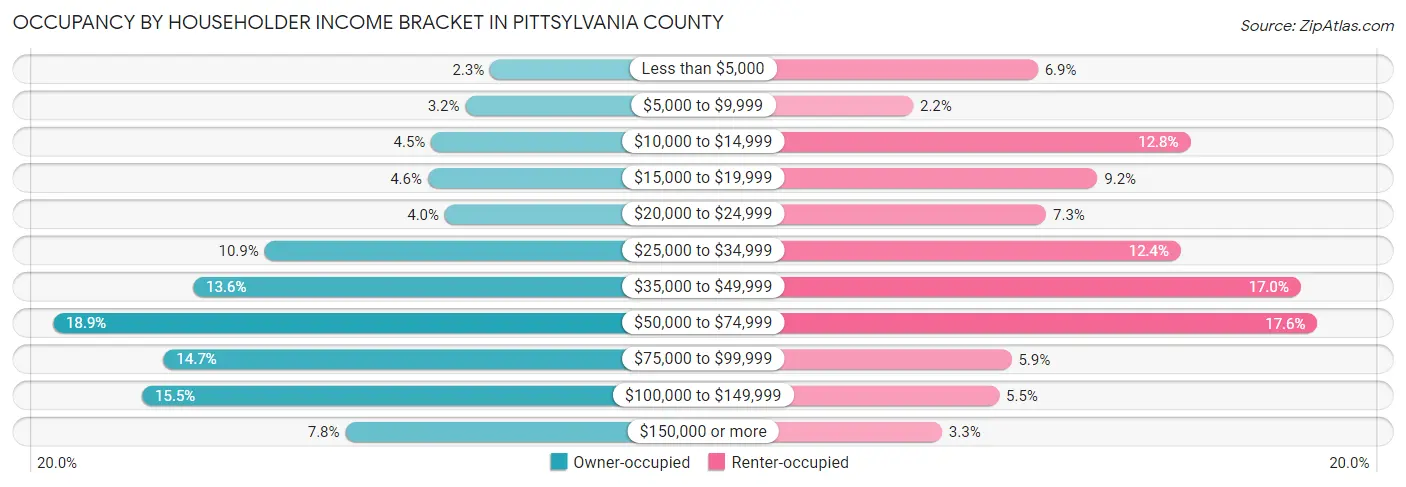
| Income Bracket | Owner-occupied | Renter-occupied |
| Less than $5,000 | 431 (2.3%) | 384 (6.9%) |
| $5,000 to $9,999 | 608 (3.2%) | 121 (2.2%) |
| $10,000 to $14,999 | 854 (4.5%) | 706 (12.8%) |
| $15,000 to $19,999 | 879 (4.6%) | 510 (9.2%) |
| $20,000 to $24,999 | 756 (4.0%) | 402 (7.3%) |
| $25,000 to $34,999 | 2,059 (10.9%) | 686 (12.4%) |
| $35,000 to $49,999 | 2,573 (13.6%) | 939 (17.0%) |
| $50,000 to $74,999 | 3,586 (18.9%) | 974 (17.6%) |
| $75,000 to $99,999 | 2,788 (14.7%) | 329 (5.9%) |
| $100,000 to $149,999 | 2,943 (15.5%) | 303 (5.5%) |
| $150,000 or more | 1,474 (7.8%) | 182 (3.3%) |
| Total | 18,951 (100.0%) | 5,536 (100.0%) |
Monthly Housing Cost Tiers in Pittsylvania County
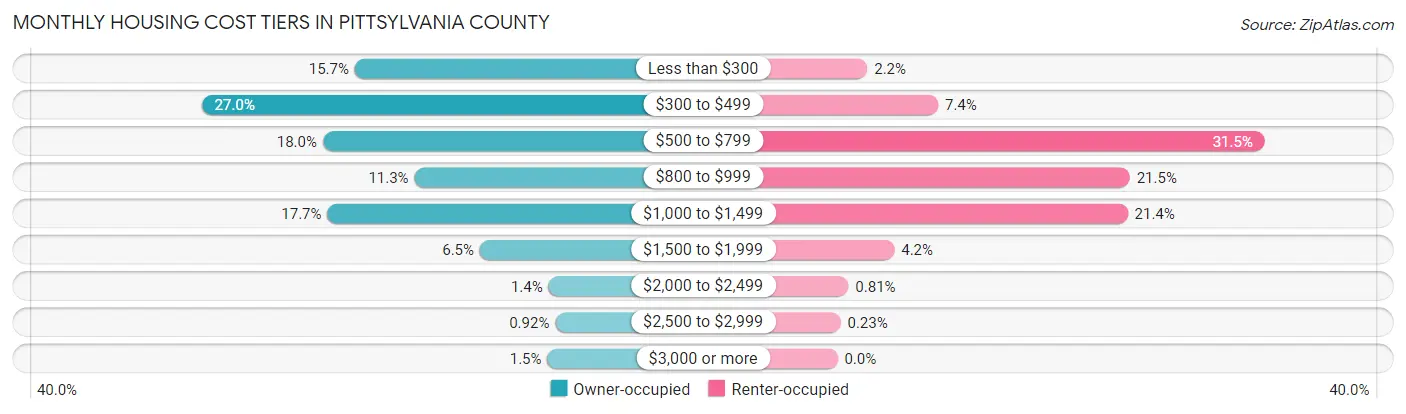
| Monthly Cost | Owner-occupied | Renter-occupied |
| Less than $300 | 2,972 (15.7%) | 122 (2.2%) |
| $300 to $499 | 5,111 (27.0%) | 410 (7.4%) |
| $500 to $799 | 3,419 (18.0%) | 1,742 (31.5%) |
| $800 to $999 | 2,140 (11.3%) | 1,192 (21.5%) |
| $1,000 to $1,499 | 3,354 (17.7%) | 1,183 (21.4%) |
| $1,500 to $1,999 | 1,227 (6.5%) | 232 (4.2%) |
| $2,000 to $2,499 | 268 (1.4%) | 45 (0.8%) |
| $2,500 to $2,999 | 175 (0.9%) | 13 (0.2%) |
| $3,000 or more | 285 (1.5%) | 0 (0.0%) |
| Total | 18,951 (100.0%) | 5,536 (100.0%) |
Physical Housing Characteristics in Pittsylvania County
Housing Structures in Pittsylvania County
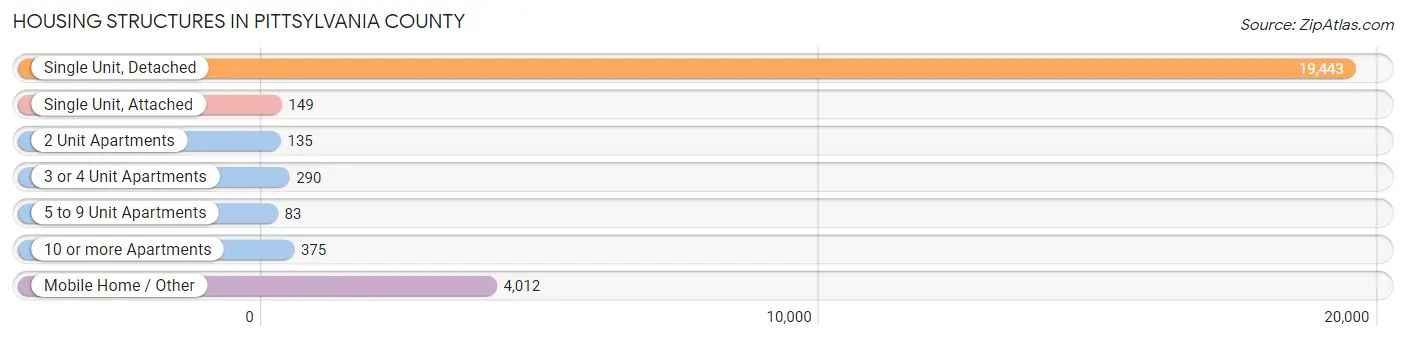
| Structure Type | # Housing Units | % Housing Units |
| Single Unit, Detached | 19,443 | 79.4% |
| Single Unit, Attached | 149 | 0.6% |
| 2 Unit Apartments | 135 | 0.5% |
| 3 or 4 Unit Apartments | 290 | 1.2% |
| 5 to 9 Unit Apartments | 83 | 0.3% |
| 10 or more Apartments | 375 | 1.5% |
| Mobile Home / Other | 4,012 | 16.4% |
| Total | 24,487 | 100.0% |
Housing Structures by Occupancy in Pittsylvania County
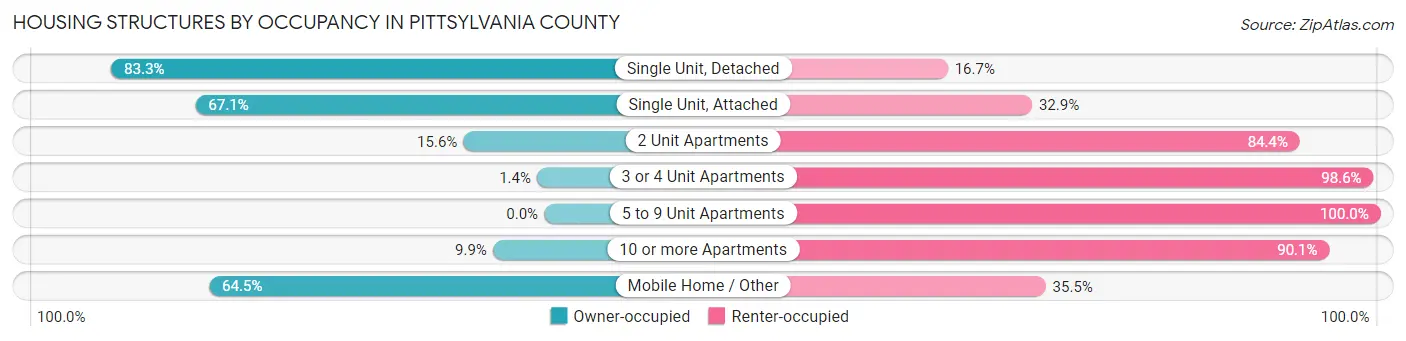
| Structure Type | Owner-occupied | Renter-occupied |
| Single Unit, Detached | 16,202 (83.3%) | 3,241 (16.7%) |
| Single Unit, Attached | 100 (67.1%) | 49 (32.9%) |
| 2 Unit Apartments | 21 (15.6%) | 114 (84.4%) |
| 3 or 4 Unit Apartments | 4 (1.4%) | 286 (98.6%) |
| 5 to 9 Unit Apartments | 0 (0.0%) | 83 (100.0%) |
| 10 or more Apartments | 37 (9.9%) | 338 (90.1%) |
| Mobile Home / Other | 2,587 (64.5%) | 1,425 (35.5%) |
| Total | 18,951 (77.4%) | 5,536 (22.6%) |
Housing Structures by Number of Rooms in Pittsylvania County
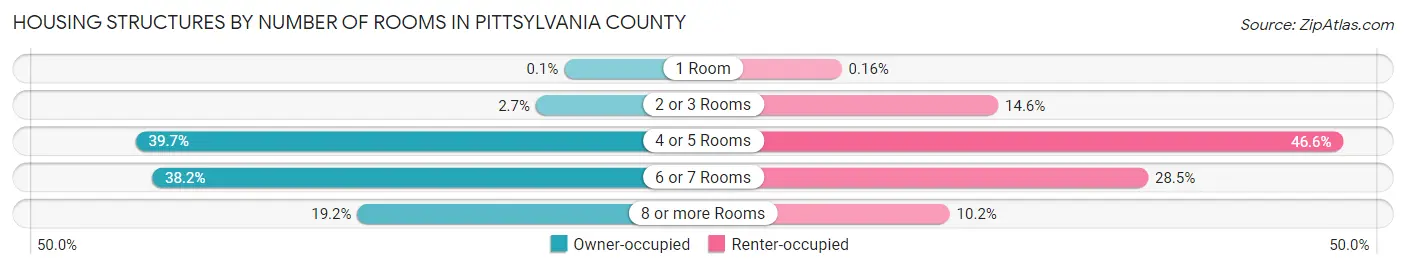
| Number of Rooms | Owner-occupied | Renter-occupied |
| 1 Room | 19 (0.1%) | 9 (0.2%) |
| 2 or 3 Rooms | 516 (2.7%) | 810 (14.6%) |
| 4 or 5 Rooms | 7,530 (39.7%) | 2,577 (46.6%) |
| 6 or 7 Rooms | 7,242 (38.2%) | 1,578 (28.5%) |
| 8 or more Rooms | 3,644 (19.2%) | 562 (10.2%) |
| Total | 18,951 (100.0%) | 5,536 (100.0%) |
Housing Structure by Heating Type in Pittsylvania County
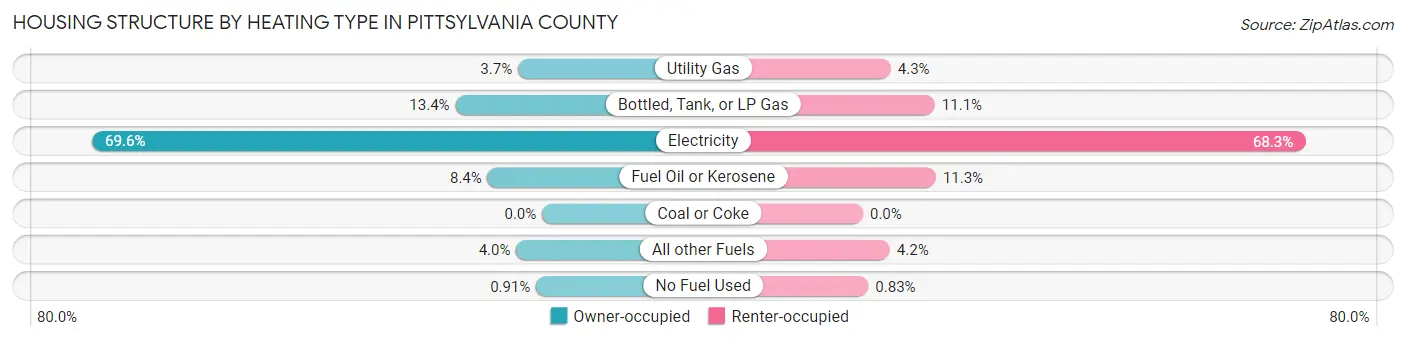
| Heating Type | Owner-occupied | Renter-occupied |
| Utility Gas | 706 (3.7%) | 238 (4.3%) |
| Bottled, Tank, or LP Gas | 2,540 (13.4%) | 615 (11.1%) |
| Electricity | 13,180 (69.6%) | 3,783 (68.3%) |
| Fuel Oil or Kerosene | 1,596 (8.4%) | 624 (11.3%) |
| Coal or Coke | 0 (0.0%) | 0 (0.0%) |
| All other Fuels | 756 (4.0%) | 230 (4.2%) |
| No Fuel Used | 173 (0.9%) | 46 (0.8%) |
| Total | 18,951 (100.0%) | 5,536 (100.0%) |
Household Vehicle Usage in Pittsylvania County
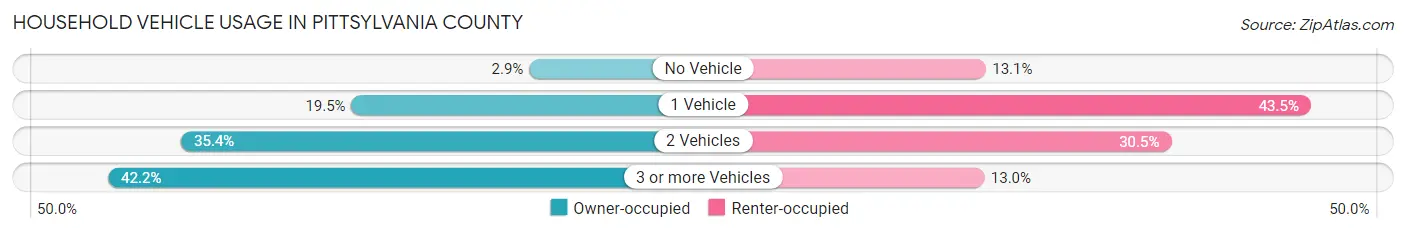
| Vehicles per Household | Owner-occupied | Renter-occupied |
| No Vehicle | 550 (2.9%) | 725 (13.1%) |
| 1 Vehicle | 3,693 (19.5%) | 2,407 (43.5%) |
| 2 Vehicles | 6,709 (35.4%) | 1,686 (30.5%) |
| 3 or more Vehicles | 7,999 (42.2%) | 718 (13.0%) |
| Total | 18,951 (100.0%) | 5,536 (100.0%) |
Real Estate & Mortgages in Pittsylvania County
Real Estate and Mortgage Overview in Pittsylvania County
| Characteristic | Without Mortgage | With Mortgage |
| Housing Units | 10,474 | 8,477 |
| Median Property Value | $126,800 | $156,900 |
| Median Household Income | $45,340 | $955 |
| Monthly Housing Costs | $376 | $285 |
| Real Estate Taxes | $828 | $185 |
Property Value by Mortgage Status in Pittsylvania County
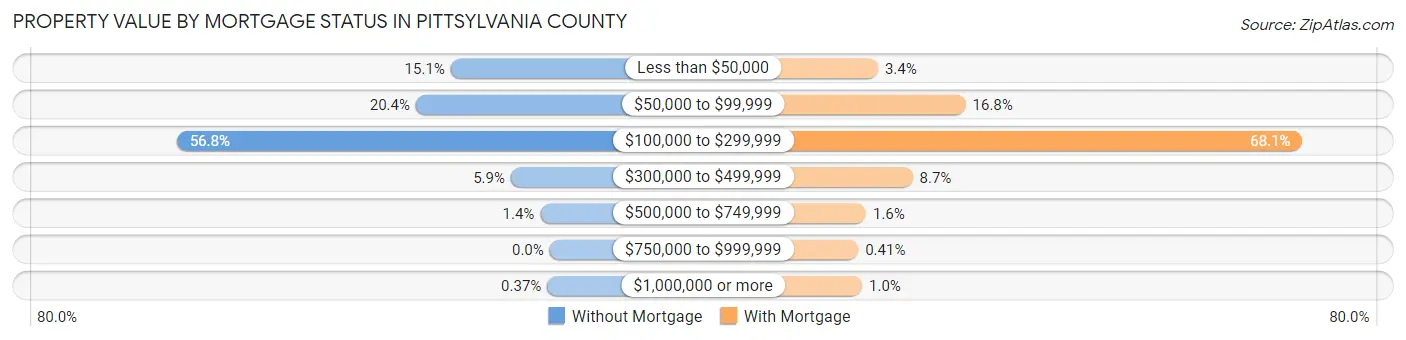
| Property Value | Without Mortgage | With Mortgage |
| Less than $50,000 | 1,579 (15.1%) | 290 (3.4%) |
| $50,000 to $99,999 | 2,136 (20.4%) | 1,422 (16.8%) |
| $100,000 to $299,999 | 5,951 (56.8%) | 5,772 (68.1%) |
| $300,000 to $499,999 | 619 (5.9%) | 737 (8.7%) |
| $500,000 to $749,999 | 150 (1.4%) | 136 (1.6%) |
| $750,000 to $999,999 | 0 (0.0%) | 35 (0.4%) |
| $1,000,000 or more | 39 (0.4%) | 85 (1.0%) |
| Total | 10,474 (100.0%) | 8,477 (100.0%) |
Household Income by Mortgage Status in Pittsylvania County
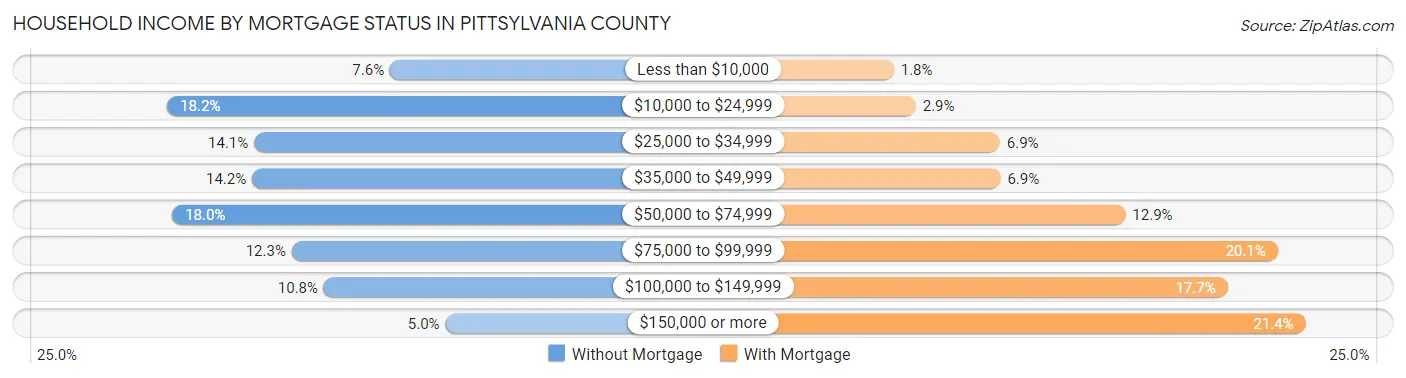
| Household Income | Without Mortgage | With Mortgage |
| Less than $10,000 | 796 (7.6%) | 154 (1.8%) |
| $10,000 to $24,999 | 1,907 (18.2%) | 243 (2.9%) |
| $25,000 to $34,999 | 1,474 (14.1%) | 582 (6.9%) |
| $35,000 to $49,999 | 1,484 (14.2%) | 585 (6.9%) |
| $50,000 to $74,999 | 1,882 (18.0%) | 1,089 (12.9%) |
| $75,000 to $99,999 | 1,286 (12.3%) | 1,704 (20.1%) |
| $100,000 to $149,999 | 1,126 (10.7%) | 1,502 (17.7%) |
| $150,000 or more | 519 (5.0%) | 1,817 (21.4%) |
| Total | 10,474 (100.0%) | 8,477 (100.0%) |
Property Value to Household Income Ratio in Pittsylvania County
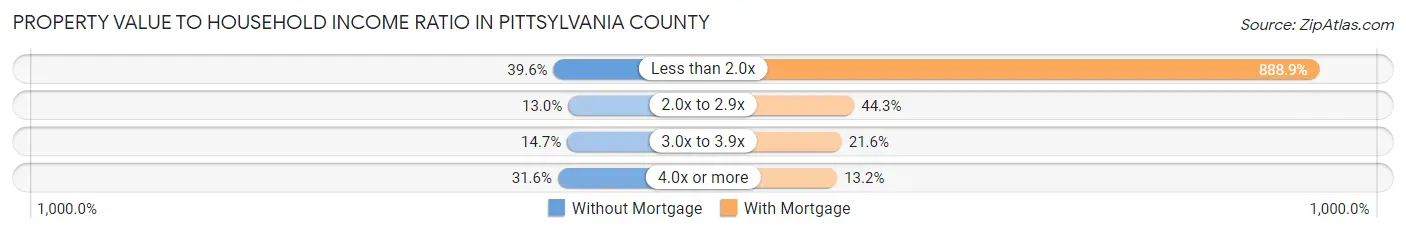
| Value-to-Income Ratio | Without Mortgage | With Mortgage |
| Less than 2.0x | 4,152 (39.6%) | 75,354 (888.9%) |
| 2.0x to 2.9x | 1,362 (13.0%) | 3,752 (44.3%) |
| 3.0x to 3.9x | 1,544 (14.7%) | 1,830 (21.6%) |
| 4.0x or more | 3,311 (31.6%) | 1,122 (13.2%) |
| Total | 10,474 (100.0%) | 8,477 (100.0%) |
Real Estate Taxes by Mortgage Status in Pittsylvania County
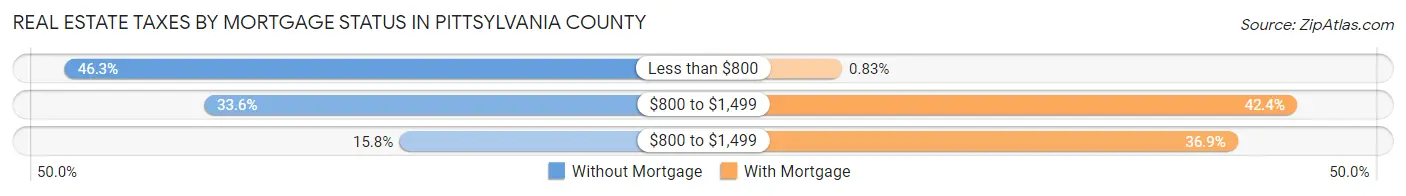
| Property Taxes | Without Mortgage | With Mortgage |
| Less than $800 | 4,852 (46.3%) | 70 (0.8%) |
| $800 to $1,499 | 3,520 (33.6%) | 3,590 (42.3%) |
| $800 to $1,499 | 1,655 (15.8%) | 3,131 (36.9%) |
| Total | 10,474 (100.0%) | 8,477 (100.0%) |
Health & Disability in Pittsylvania County
Health Insurance Coverage by Age in Pittsylvania County
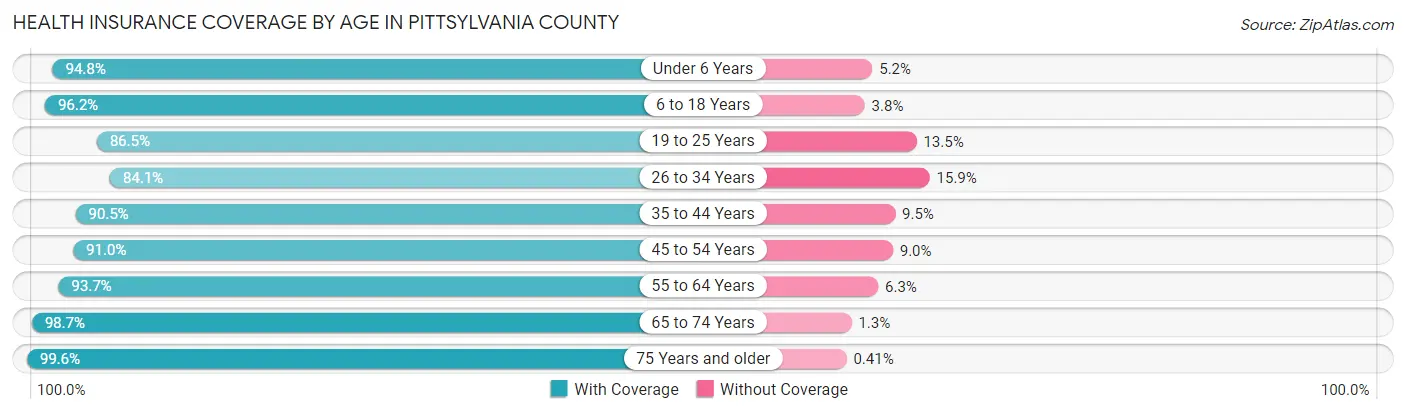
| Age Bracket | With Coverage | Without Coverage |
| Under 6 Years | 2,739 (94.8%) | 151 (5.2%) |
| 6 to 18 Years | 8,394 (96.2%) | 332 (3.8%) |
| 19 to 25 Years | 3,837 (86.5%) | 597 (13.5%) |
| 26 to 34 Years | 4,466 (84.1%) | 845 (15.9%) |
| 35 to 44 Years | 5,614 (90.5%) | 588 (9.5%) |
| 45 to 54 Years | 7,349 (91.0%) | 730 (9.0%) |
| 55 to 64 Years | 9,004 (93.7%) | 606 (6.3%) |
| 65 to 74 Years | 7,997 (98.7%) | 108 (1.3%) |
| 75 Years and older | 5,901 (99.6%) | 24 (0.4%) |
| Total | 55,301 (93.3%) | 3,981 (6.7%) |
Health Insurance Coverage by Citizenship Status in Pittsylvania County
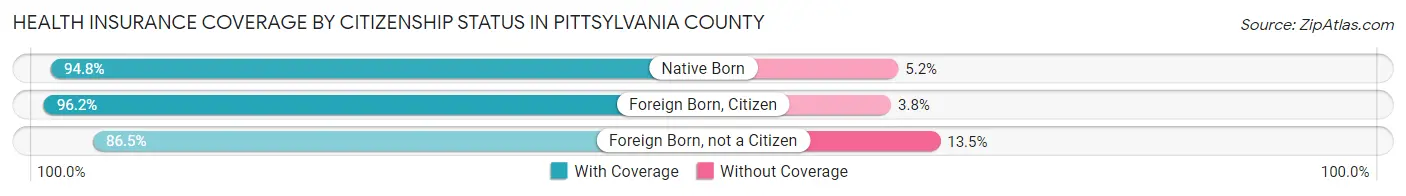
| Citizenship Status | With Coverage | Without Coverage |
| Native Born | 2,739 (94.8%) | 151 (5.2%) |
| Foreign Born, Citizen | 8,394 (96.2%) | 332 (3.8%) |
| Foreign Born, not a Citizen | 3,837 (86.5%) | 597 (13.5%) |
Health Insurance Coverage by Household Income in Pittsylvania County
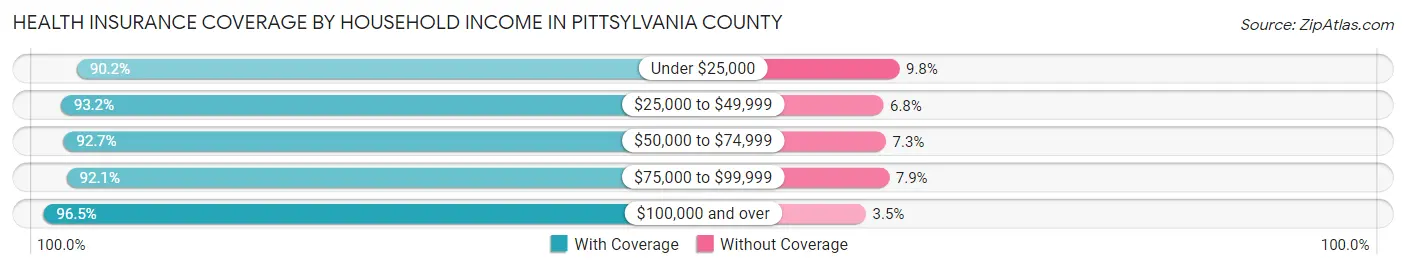
| Household Income | With Coverage | Without Coverage |
| Under $25,000 | 8,395 (90.2%) | 911 (9.8%) |
| $25,000 to $49,999 | 13,422 (93.2%) | 977 (6.8%) |
| $50,000 to $74,999 | 10,381 (92.7%) | 814 (7.3%) |
| $75,000 to $99,999 | 7,977 (92.1%) | 682 (7.9%) |
| $100,000 and over | 15,093 (96.5%) | 553 (3.5%) |
Public vs Private Health Insurance Coverage by Age in Pittsylvania County
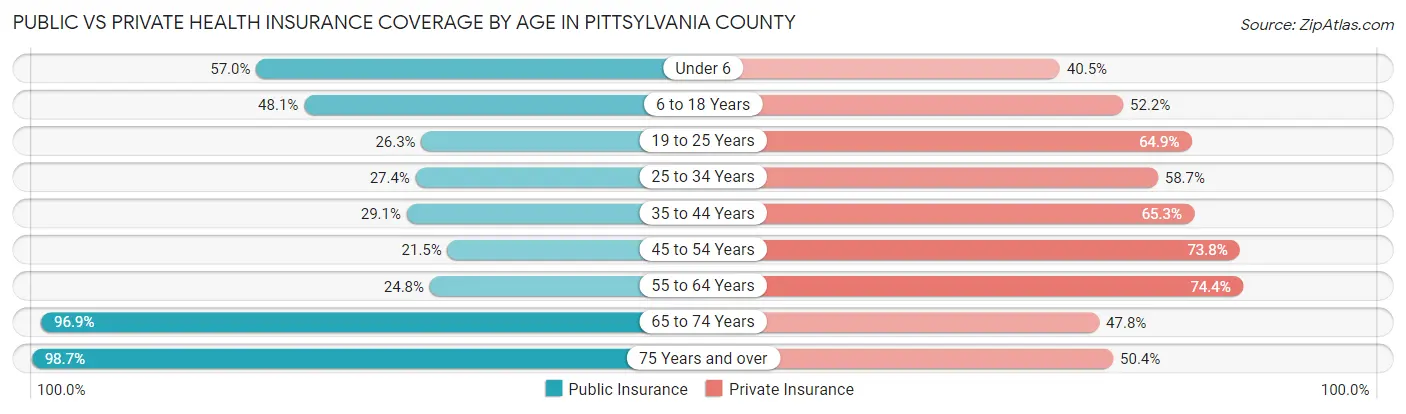
| Age Bracket | Public Insurance | Private Insurance |
| Under 6 | 1,647 (57.0%) | 1,170 (40.5%) |
| 6 to 18 Years | 4,198 (48.1%) | 4,557 (52.2%) |
| 19 to 25 Years | 1,168 (26.3%) | 2,876 (64.9%) |
| 25 to 34 Years | 1,456 (27.4%) | 3,115 (58.7%) |
| 35 to 44 Years | 1,802 (29.1%) | 4,051 (65.3%) |
| 45 to 54 Years | 1,735 (21.5%) | 5,963 (73.8%) |
| 55 to 64 Years | 2,381 (24.8%) | 7,147 (74.4%) |
| 65 to 74 Years | 7,856 (96.9%) | 3,872 (47.8%) |
| 75 Years and over | 5,846 (98.7%) | 2,984 (50.4%) |
| Total | 28,089 (47.4%) | 35,735 (60.3%) |
Disability Status by Sex by Age in Pittsylvania County
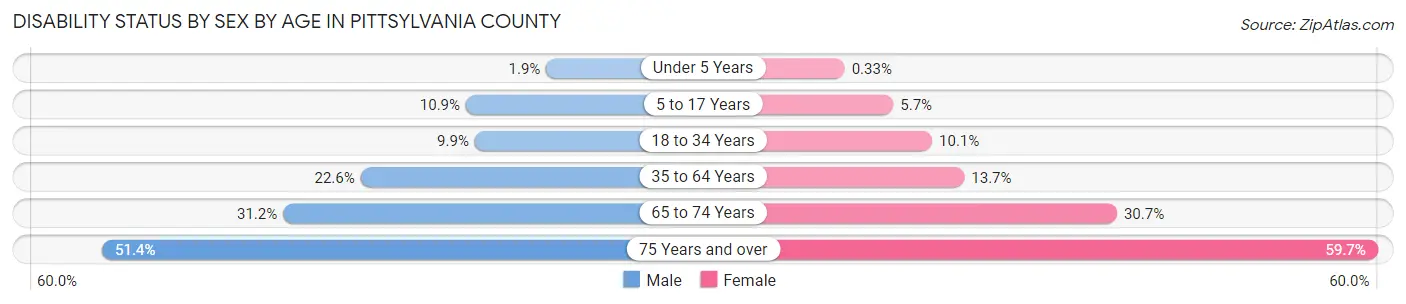
| Age Bracket | Male | Female |
| Under 5 Years | 24 (1.9%) | 4 (0.3%) |
| 5 to 17 Years | 469 (10.9%) | 243 (5.7%) |
| 18 to 34 Years | 547 (9.9%) | 481 (10.1%) |
| 35 to 64 Years | 2,608 (22.6%) | 1,685 (13.7%) |
| 65 to 74 Years | 1,194 (31.2%) | 1,312 (30.6%) |
| 75 Years and over | 1,296 (51.4%) | 2,030 (59.7%) |
Disability Class by Sex by Age in Pittsylvania County
Disability Class: Hearing Difficulty
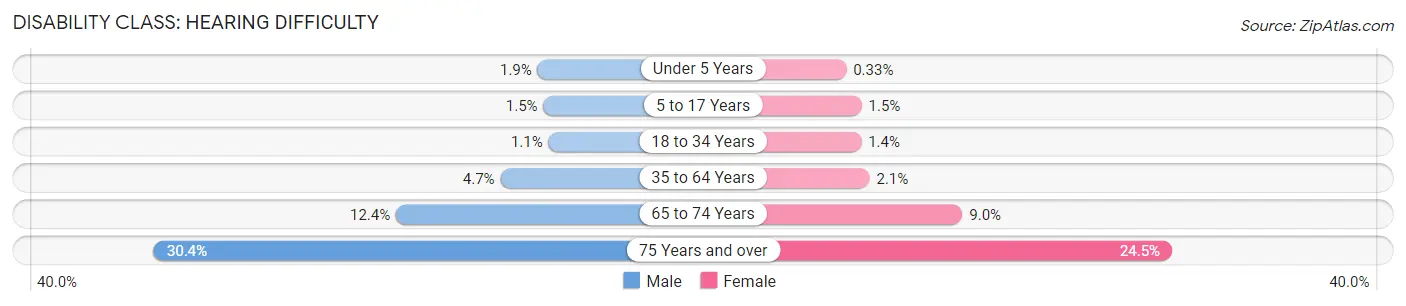
| Age Bracket | Male | Female |
| Under 5 Years | 24 (1.9%) | 4 (0.3%) |
| 5 to 17 Years | 64 (1.5%) | 62 (1.5%) |
| 18 to 34 Years | 61 (1.1%) | 69 (1.4%) |
| 35 to 64 Years | 539 (4.7%) | 254 (2.1%) |
| 65 to 74 Years | 475 (12.4%) | 383 (8.9%) |
| 75 Years and over | 767 (30.4%) | 834 (24.5%) |
Disability Class: Vision Difficulty
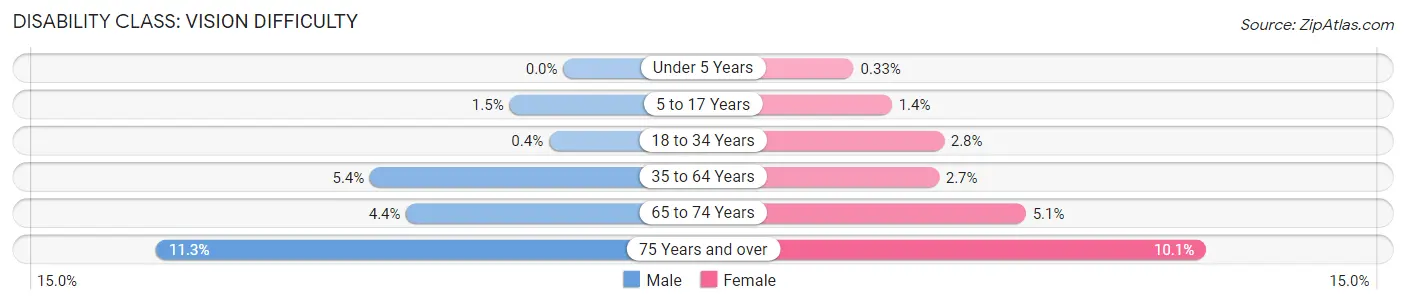
| Age Bracket | Male | Female |
| Under 5 Years | 0 (0.0%) | 4 (0.3%) |
| 5 to 17 Years | 65 (1.5%) | 59 (1.4%) |
| 18 to 34 Years | 22 (0.4%) | 136 (2.8%) |
| 35 to 64 Years | 621 (5.4%) | 333 (2.7%) |
| 65 to 74 Years | 167 (4.4%) | 219 (5.1%) |
| 75 Years and over | 286 (11.3%) | 345 (10.1%) |
Disability Class: Cognitive Difficulty
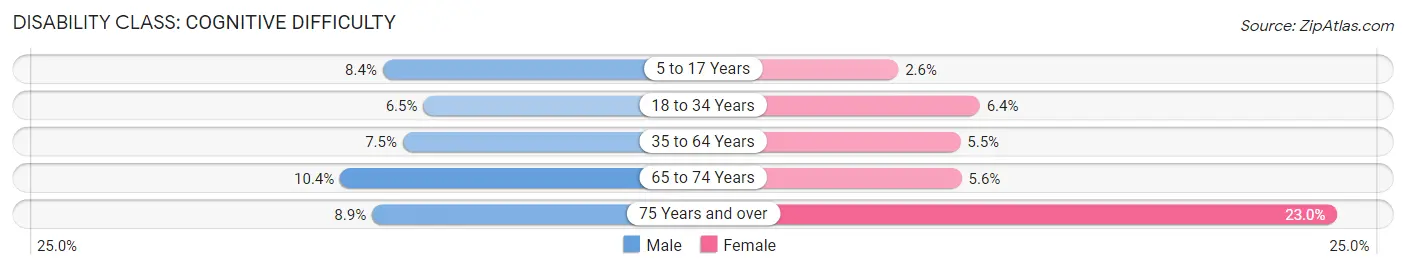
| Age Bracket | Male | Female |
| 5 to 17 Years | 362 (8.4%) | 111 (2.6%) |
| 18 to 34 Years | 360 (6.5%) | 306 (6.4%) |
| 35 to 64 Years | 860 (7.4%) | 679 (5.5%) |
| 65 to 74 Years | 396 (10.4%) | 238 (5.6%) |
| 75 Years and over | 224 (8.9%) | 782 (23.0%) |
Disability Class: Ambulatory Difficulty
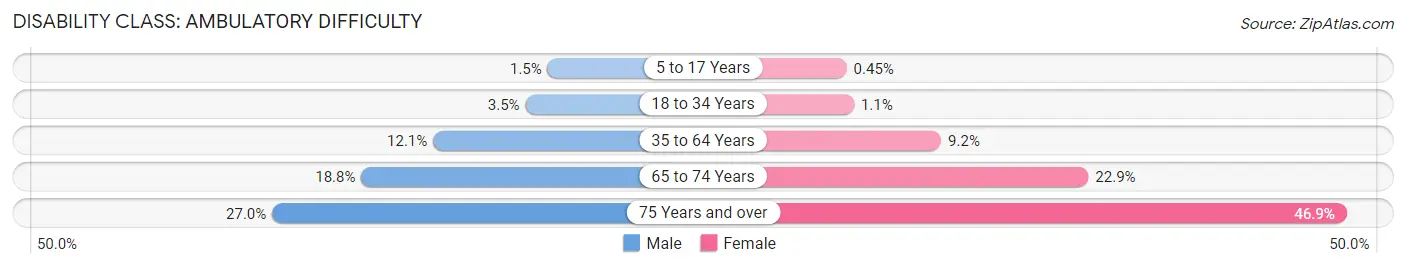
| Age Bracket | Male | Female |
| 5 to 17 Years | 63 (1.5%) | 19 (0.4%) |
| 18 to 34 Years | 195 (3.5%) | 54 (1.1%) |
| 35 to 64 Years | 1,396 (12.1%) | 1,138 (9.2%) |
| 65 to 74 Years | 717 (18.8%) | 980 (22.9%) |
| 75 Years and over | 682 (27.0%) | 1,594 (46.9%) |
Disability Class: Self-Care Difficulty
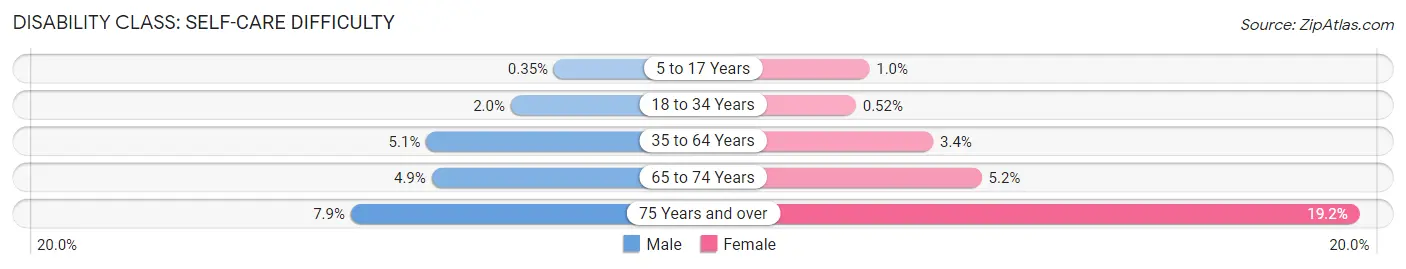
| Age Bracket | Male | Female |
| 5 to 17 Years | 15 (0.4%) | 43 (1.0%) |
| 18 to 34 Years | 108 (1.9%) | 25 (0.5%) |
| 35 to 64 Years | 588 (5.1%) | 419 (3.4%) |
| 65 to 74 Years | 187 (4.9%) | 222 (5.2%) |
| 75 Years and over | 199 (7.9%) | 654 (19.2%) |
Technology Access in Pittsylvania County
Computing Device Access in Pittsylvania County
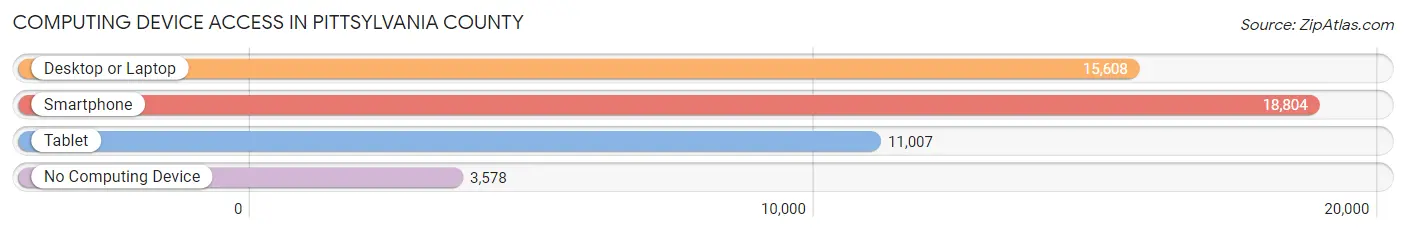
| Device Type | # Households | % Households |
| Desktop or Laptop | 15,608 | 63.7% |
| Smartphone | 18,804 | 76.8% |
| Tablet | 11,007 | 45.0% |
| No Computing Device | 3,578 | 14.6% |
| Total | 24,487 | 100.0% |
Internet Access in Pittsylvania County
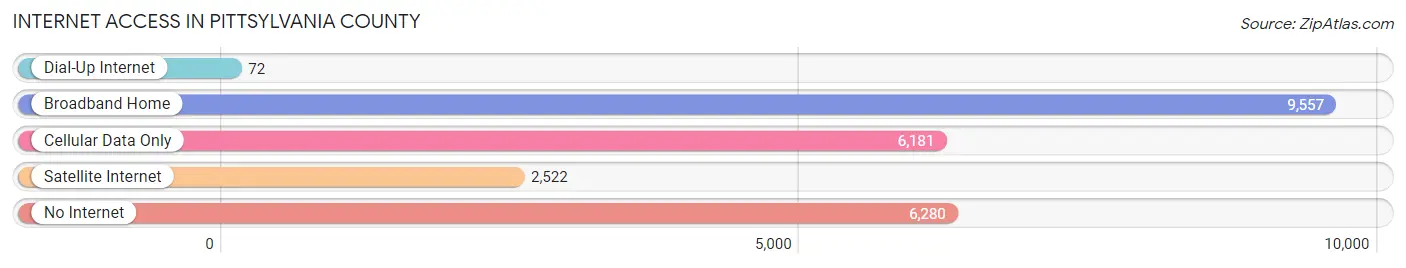
| Internet Type | # Households | % Households |
| Dial-Up Internet | 72 | 0.3% |
| Broadband Home | 9,557 | 39.0% |
| Cellular Data Only | 6,181 | 25.2% |
| Satellite Internet | 2,522 | 10.3% |
| No Internet | 6,280 | 25.7% |
| Total | 24,487 | 100.0% |
Pittsylvania County Summary
Pittsylvania County, Virginia is located in the south-central part of the state and is part of the Danville, Virginia Metropolitan Statistical Area. The county was established in 1767 and is named for William Pitt, the Earl of Chatham. The county has a total area of 745 square miles and a population of 63,506 as of the 2010 census.
Geography
Pittsylvania County is located in the Piedmont region of Virginia and is bordered by Henry County to the north, Halifax County to the east, Patrick County to the south, and Franklin and Campbell Counties to the west. The county is divided into two distinct regions by the Dan River, which runs through the center of the county. The northern region is hilly and is part of the Blue Ridge Mountains, while the southern region is flatter and is part of the Piedmont Plateau. The county is home to several state parks, including Fairy Stone State Park, Staunton River State Park, and Philpott Lake.
Economy
Pittsylvania County’s economy is largely based on agriculture and manufacturing. The county is home to several large farms, including tobacco, corn, and soybean farms. The county is also home to several manufacturing companies, including Dan River Mills, which produces textiles, and the Pittsylvania County Wood Products Company, which produces furniture. The county is also home to several retail stores, including Walmart, Lowe’s, and Target.
Demographics
As of the 2010 census, Pittsylvania County had a population of 63,506. The racial makeup of the county was 79.2% White, 17.7% African American, 0.4% Native American, 0.7% Asian, 0.1% Pacific Islander, 0.7% from other races, and 1.3% from two or more races. Hispanic or Latino of any race were 2.2% of the population.
The median income for a household in the county was $41,945 and the median income for a family was $50,945. The per capita income for the county was $20,945. About 11.2% of families and 14.2% of the population were below the poverty line, including 19.2% of those under age 18 and 11.2% of those age 65 or over.
Education
Pittsylvania County is served by the Pittsylvania County Public Schools system, which consists of 14 elementary schools, four middle schools, and four high schools. The county is also home to several private schools, including Danville Christian Academy and Chatham Hall. The county is also home to several higher education institutions, including Averett University, Danville Community College, and the University of Virginia’s College at Wise.
Conclusion
Pittsylvania County, Virginia is a rural county located in the south-central part of the state. The county is home to several state parks, farms, and manufacturing companies, and has a population of 63,506 as of the 2010 census. The county’s economy is largely based on agriculture and manufacturing, and the county is served by the Pittsylvania County Public Schools system. The county is also home to several higher education institutions, including Averett University, Danville Community College, and the University of Virginia’s College at Wise.
Common Questions
What is Per Capita Income in Pittsylvania County?
Per Capita income in Pittsylvania County is $28,428.
What is the Median Family Income in Pittsylvania County?
Median Family Income in Pittsylvania County is $65,263.
What is the Median Household income in Pittsylvania County?
Median Household Income in Pittsylvania County is $52,619.
What is Income or Wage Gap in Pittsylvania County?
Income or Wage Gap in Pittsylvania County is 23.0%.
Women in Pittsylvania County earn 77.0 cents for every dollar earned by a man.
What is Family Income Deficit in Pittsylvania County?
Family Income Deficit in Pittsylvania County is $9,256.
Families that are below poverty line in Pittsylvania County earn $9,256 less on average than the poverty threshold level.
What is Inequality or Gini Index in Pittsylvania County?
Inequality or Gini Index in Pittsylvania County is 0.44.
What is the Total Population of Pittsylvania County?
Total Population of Pittsylvania County is 60,541.
What is the Total Male Population of Pittsylvania County?
Total Male Population of Pittsylvania County is 30,142.
What is the Total Female Population of Pittsylvania County?
Total Female Population of Pittsylvania County is 30,399.
What is the Ratio of Males per 100 Females in Pittsylvania County?
There are 99.15 Males per 100 Females in Pittsylvania County.
What is the Ratio of Females per 100 Males in Pittsylvania County?
There are 100.85 Females per 100 Males in Pittsylvania County.
What is the Median Population Age in Pittsylvania County?
Median Population Age in Pittsylvania County is 48.0 Years.
What is the Average Family Size in Pittsylvania County
Average Family Size in Pittsylvania County is 2.9 People.
What is the Average Household Size in Pittsylvania County
Average Household Size in Pittsylvania County is 2.4 People.
How Large is the Labor Force in Pittsylvania County?
There are 27,235 People in the Labor Forcein in Pittsylvania County.
What is the Percentage of People in the Labor Force in Pittsylvania County?
53.5% of People are in the Labor Force in Pittsylvania County.
What is the Unemployment Rate in Pittsylvania County?
Unemployment Rate in Pittsylvania County is 5.4%.