Page County, VA Map & Demographics
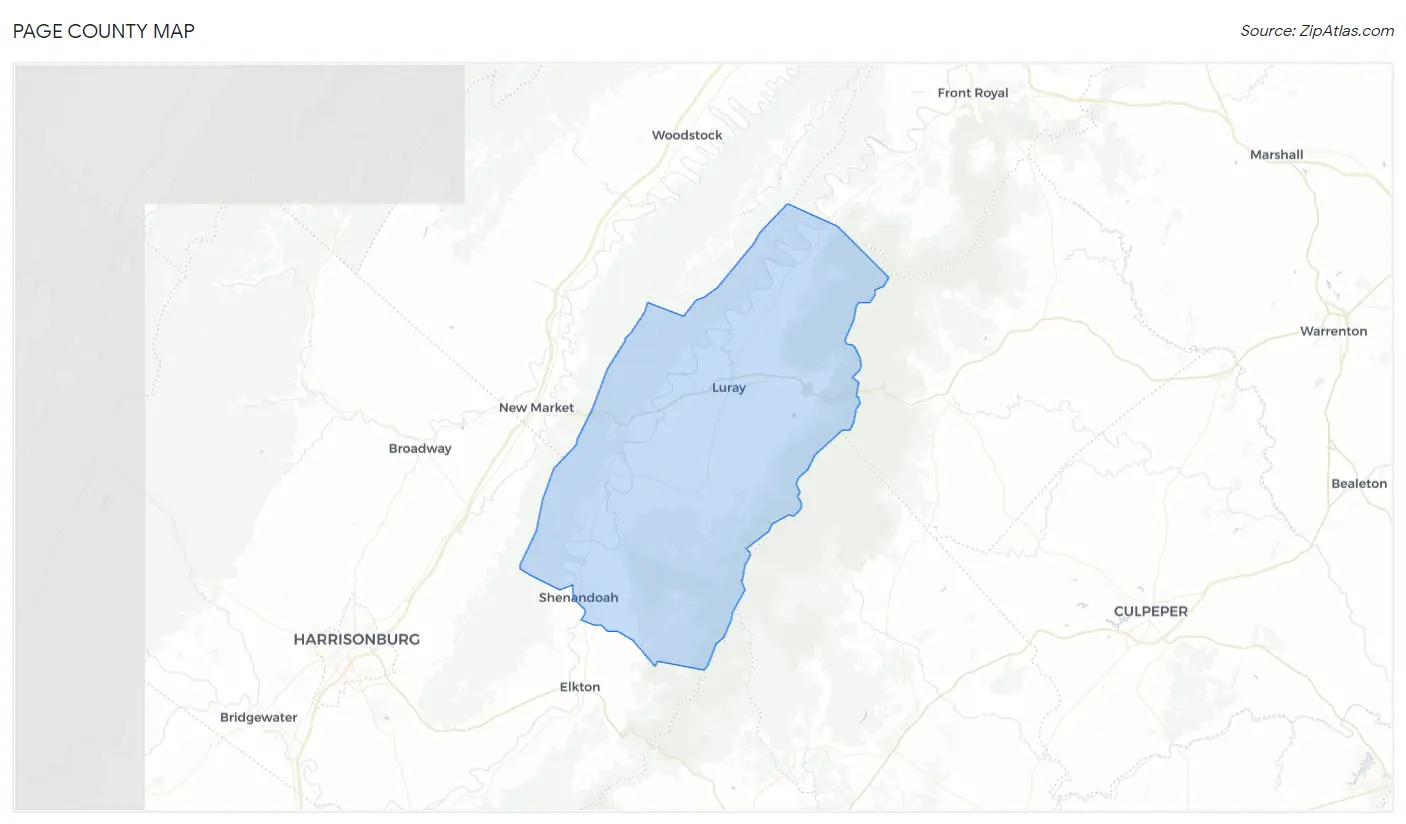
Page County Map
Page County Overview
$30,146
PER CAPITA INCOME
$72,637
AVG FAMILY INCOME
$56,760
AVG HOUSEHOLD INCOME
36.6%
WAGE / INCOME GAP [ % ]
63.4¢/ $1
WAGE / INCOME GAP [ $ ]
$7,707
FAMILY INCOME DEFICIT
0.41
INEQUALITY / GINI INDEX
23,753
TOTAL POPULATION
11,987
MALE POPULATION
11,766
FEMALE POPULATION
101.88
MALES / 100 FEMALES
98.16
FEMALES / 100 MALES
45.3
MEDIAN AGE
3.2
AVG FAMILY SIZE
2.5
AVG HOUSEHOLD SIZE
11,508
LABOR FORCE [ PEOPLE ]
58.9%
PERCENT IN LABOR FORCE
4.6%
UNEMPLOYMENT RATE
Page County Area Codes
Income in Page County
Income Overview in Page County
Per Capita Income in Page County is $30,146, while median incomes of families and households are $72,637 and $56,760 respectively.
| Characteristic | Number | Measure |
| Per Capita Income | 23,753 | $30,146 |
| Median Family Income | 6,070 | $72,637 |
| Mean Family Income | 6,070 | $83,002 |
| Median Household Income | 9,351 | $56,760 |
| Mean Household Income | 9,351 | $70,963 |
| Income Deficit | 6,070 | $7,707 |
| Wage / Income Gap (%) | 23,753 | 36.57% |
| Wage / Income Gap ($) | 23,753 | 63.43¢ per $1 |
| Gini / Inequality Index | 23,753 | 0.41 |
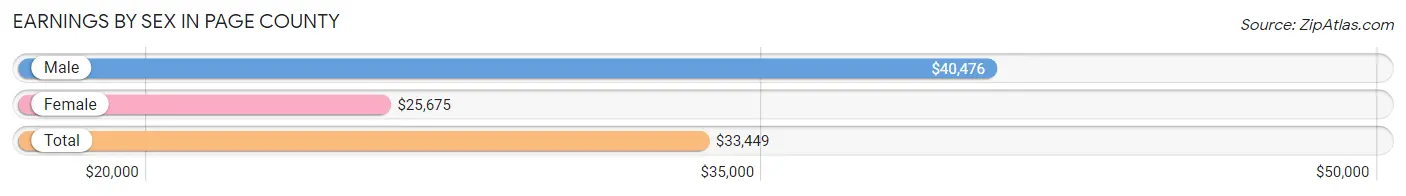
Earnings by Sex in Page County
Average Earnings in Page County are $33,449, $40,476 for men and $25,675 for women, a difference of 36.6%.
| Sex | Number | Average Earnings |
| Male | 6,321 (51.6%) | $40,476 |
| Female | 5,923 (48.4%) | $25,675 |
| Total | 12,244 (100.0%) | $33,449 |
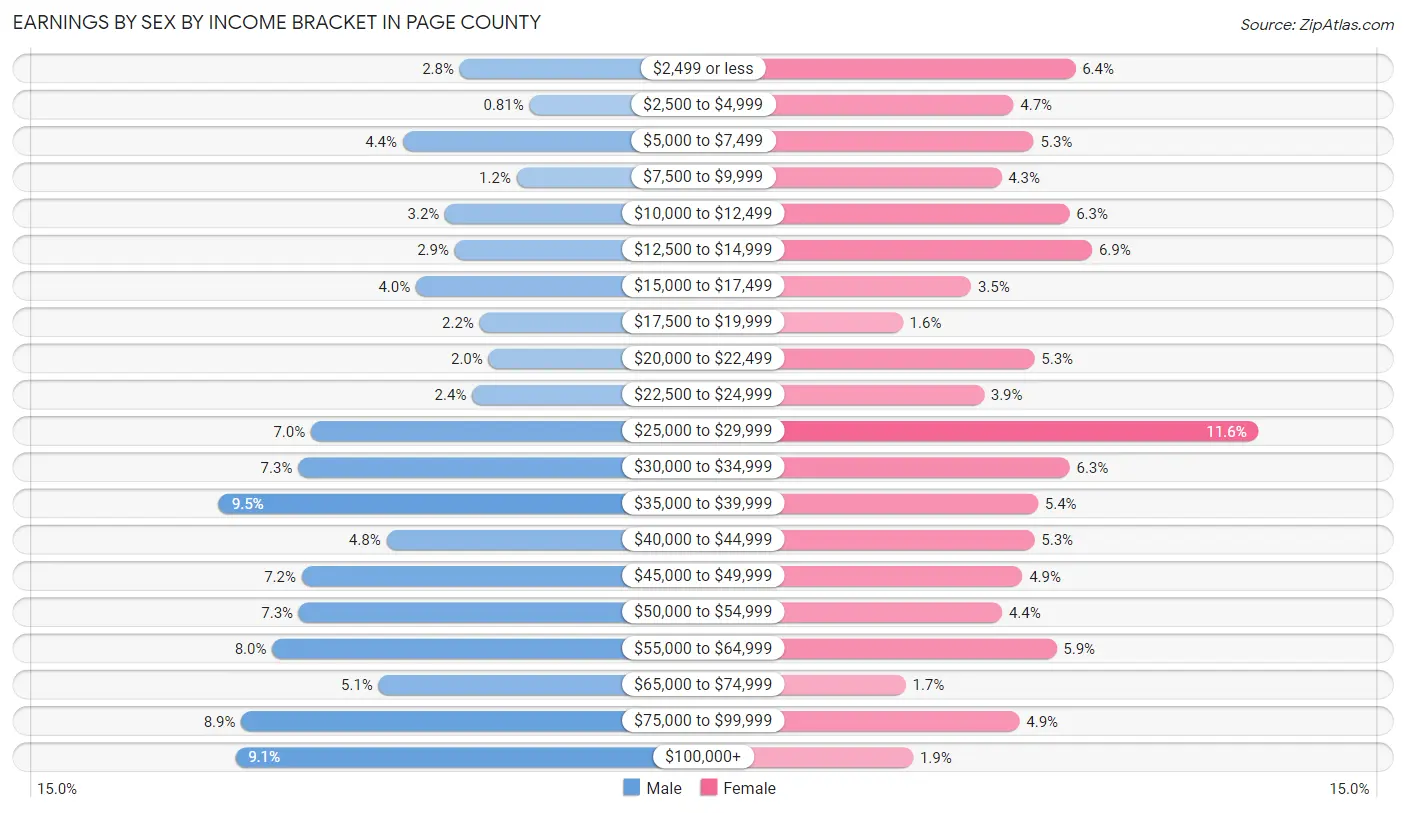
Earnings by Sex by Income Bracket in Page County
The most common earnings brackets in Page County are $35,000 to $39,999 for men (603 | 9.5%) and $25,000 to $29,999 for women (685 | 11.6%).
| Income | Male | Female |
| $2,499 or less | 175 (2.8%) | 380 (6.4%) |
| $2,500 to $4,999 | 51 (0.8%) | 277 (4.7%) |
| $5,000 to $7,499 | 276 (4.4%) | 311 (5.2%) |
| $7,500 to $9,999 | 74 (1.2%) | 257 (4.3%) |
| $10,000 to $12,499 | 201 (3.2%) | 370 (6.2%) |
| $12,500 to $14,999 | 184 (2.9%) | 408 (6.9%) |
| $15,000 to $17,499 | 253 (4.0%) | 207 (3.5%) |
| $17,500 to $19,999 | 140 (2.2%) | 93 (1.6%) |
| $20,000 to $22,499 | 124 (2.0%) | 312 (5.3%) |
| $22,500 to $24,999 | 153 (2.4%) | 228 (3.8%) |
| $25,000 to $29,999 | 439 (7.0%) | 685 (11.6%) |
| $30,000 to $34,999 | 462 (7.3%) | 371 (6.3%) |
| $35,000 to $39,999 | 603 (9.5%) | 318 (5.4%) |
| $40,000 to $44,999 | 305 (4.8%) | 312 (5.3%) |
| $45,000 to $49,999 | 456 (7.2%) | 292 (4.9%) |
| $50,000 to $54,999 | 461 (7.3%) | 258 (4.4%) |
| $55,000 to $64,999 | 508 (8.0%) | 349 (5.9%) |
| $65,000 to $74,999 | 319 (5.1%) | 98 (1.7%) |
| $75,000 to $99,999 | 563 (8.9%) | 287 (4.9%) |
| $100,000+ | 574 (9.1%) | 110 (1.9%) |
| Total | 6,321 (100.0%) | 5,923 (100.0%) |
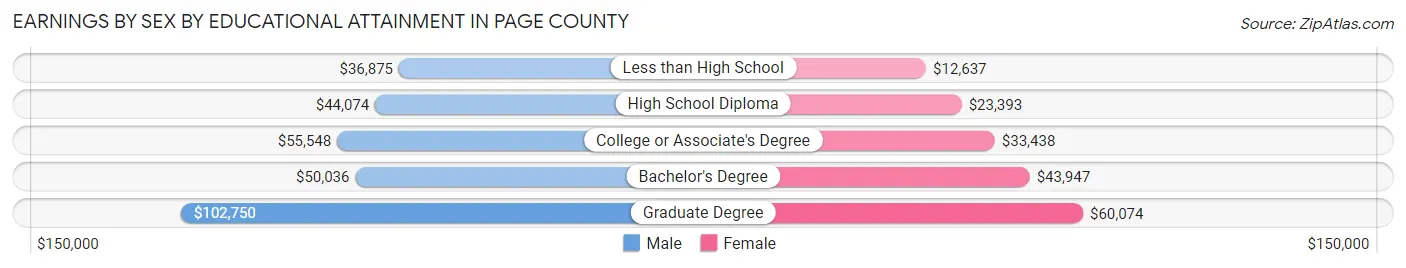
Earnings by Sex by Educational Attainment in Page County
Average earnings in Page County are $45,854 for men and $27,658 for women, a difference of 39.7%. Men with an educational attainment of graduate degree enjoy the highest average annual earnings of $102,750, while those with less than high school education earn the least with $36,875. Women with an educational attainment of graduate degree earn the most with the average annual earnings of $60,074, while those with less than high school education have the smallest earnings of $12,637.
| Educational Attainment | Male Income | Female Income |
| Less than High School | $36,875 | $12,637 |
| High School Diploma | $44,074 | $23,393 |
| College or Associate's Degree | $55,548 | $33,438 |
| Bachelor's Degree | $50,036 | $43,947 |
| Graduate Degree | $102,750 | $60,074 |
| Total | $45,854 | $27,658 |
Family Income in Page County
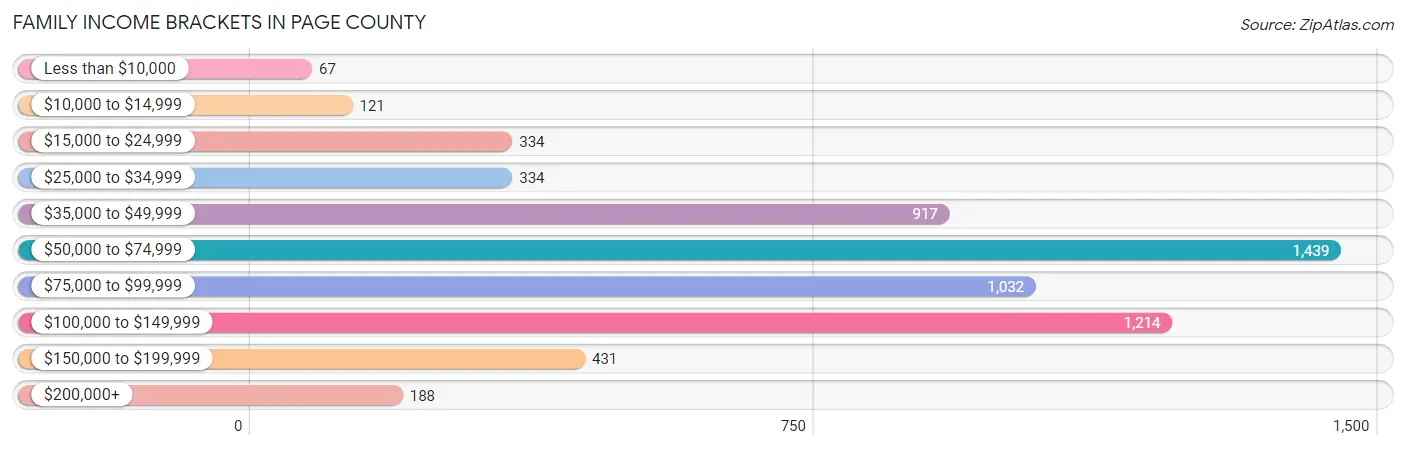
Family Income Brackets in Page County
According to the Page County family income data, there are 1,439 families falling into the $50,000 to $74,999 income range, which is the most common income bracket and makes up 23.7% of all families. Conversely, the less than $10,000 income bracket is the least frequent group with only 67 families (1.1%) belonging to this category.
| Income Bracket | # Families | % Families |
| Less than $10,000 | 67 | 1.1% |
| $10,000 to $14,999 | 121 | 2.0% |
| $15,000 to $24,999 | 334 | 5.5% |
| $25,000 to $34,999 | 334 | 5.5% |
| $35,000 to $49,999 | 917 | 15.1% |
| $50,000 to $74,999 | 1,439 | 23.7% |
| $75,000 to $99,999 | 1,032 | 17.0% |
| $100,000 to $149,999 | 1,214 | 20.0% |
| $150,000 to $199,999 | 431 | 7.1% |
| $200,000+ | 188 | 3.1% |
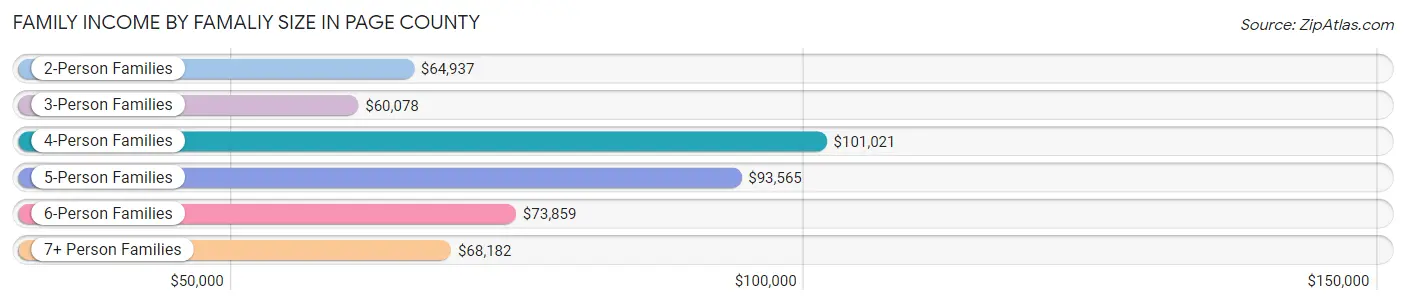
Family Income by Famaliy Size in Page County
4-person families (855 | 14.1%) account for the highest median family income in Page County with $101,021 per family, while 2-person families (3,462 | 57.0%) have the highest median income of $32,468 per family member.
| Income Bracket | # Families | Median Income |
| 2-Person Families | 3,462 (57.0%) | $64,937 |
| 3-Person Families | 1,027 (16.9%) | $60,078 |
| 4-Person Families | 855 (14.1%) | $101,021 |
| 5-Person Families | 471 (7.8%) | $93,565 |
| 6-Person Families | 223 (3.7%) | $73,859 |
| 7+ Person Families | 32 (0.5%) | $68,182 |
| Total | 6,070 (100.0%) | $72,637 |
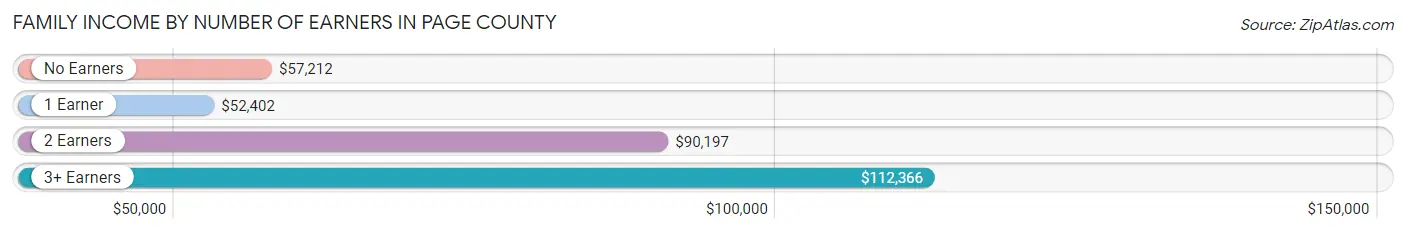
Family Income by Number of Earners in Page County
The median family income in Page County is $72,637, with families comprising 3+ earners (660) having the highest median family income of $112,366, while families with 1 earner (1,880) have the lowest median family income of $52,402, accounting for 10.9% and 31.0% of families, respectively.
| Number of Earners | # Families | Median Income |
| No Earners | 1,291 (21.3%) | $57,212 |
| 1 Earner | 1,880 (31.0%) | $52,402 |
| 2 Earners | 2,239 (36.9%) | $90,197 |
| 3+ Earners | 660 (10.9%) | $112,366 |
| Total | 6,070 (100.0%) | $72,637 |
Household Income in Page County
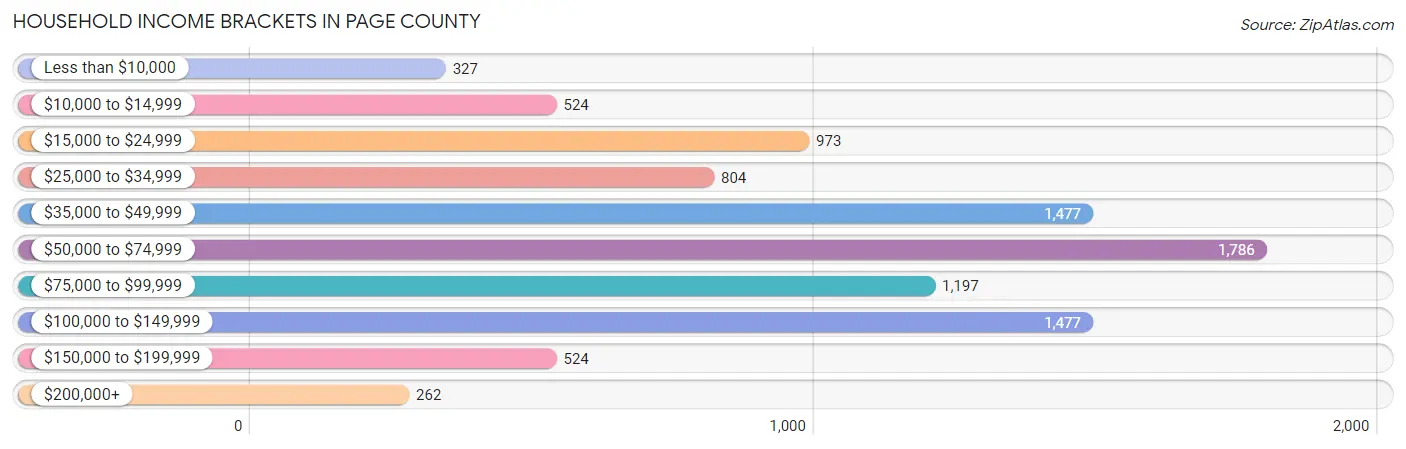
Household Income Brackets in Page County
With 1,786 households falling in the category, the $50,000 to $74,999 income range is the most frequent in Page County, accounting for 19.1% of all households. In contrast, only 262 households (2.8%) fall into the $200,000+ income bracket, making it the least populous group.
| Income Bracket | # Households | % Households |
| Less than $10,000 | 327 | 3.5% |
| $10,000 to $14,999 | 524 | 5.6% |
| $15,000 to $24,999 | 973 | 10.4% |
| $25,000 to $34,999 | 804 | 8.6% |
| $35,000 to $49,999 | 1,477 | 15.8% |
| $50,000 to $74,999 | 1,786 | 19.1% |
| $75,000 to $99,999 | 1,197 | 12.8% |
| $100,000 to $149,999 | 1,477 | 15.8% |
| $150,000 to $199,999 | 524 | 5.6% |
| $200,000+ | 262 | 2.8% |
Household Income by Householder Age in Page County
The median household income in Page County is $56,760, with the highest median household income of $74,521 found in the 25 to 44 years age bracket for the primary householder. A total of 2,038 households (21.8%) fall into this category. Meanwhile, the 65+ years age bracket for the primary householder has the lowest median household income of $43,381, with 3,288 households (35.2%) in this group.
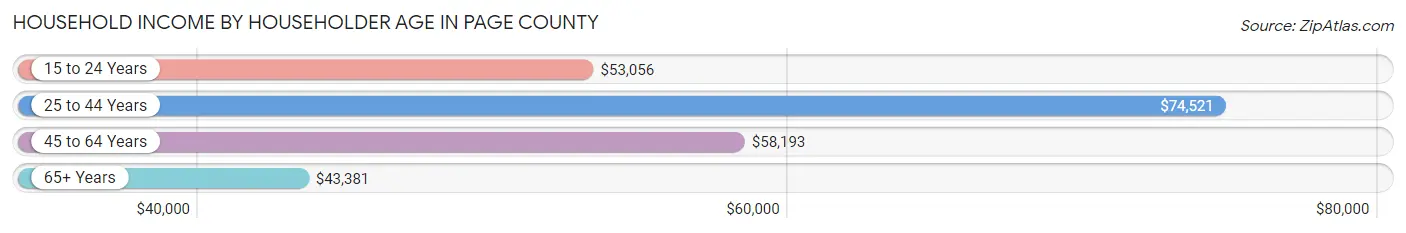
| Income Bracket | # Households | Median Income |
| 15 to 24 Years | 58 (0.6%) | $53,056 |
| 25 to 44 Years | 2,038 (21.8%) | $74,521 |
| 45 to 64 Years | 3,967 (42.4%) | $58,193 |
| 65+ Years | 3,288 (35.2%) | $43,381 |
| Total | 9,351 (100.0%) | $56,760 |
Poverty in Page County
Income Below Poverty by Sex and Age in Page County
With 9.1% poverty level for males and 11.0% for females among the residents of Page County, 16 and 17 year old males and 55 to 64 year old females are the most vulnerable to poverty, with 42 males (17.6%) and 277 females (15.2%) in their respective age groups living below the poverty level.
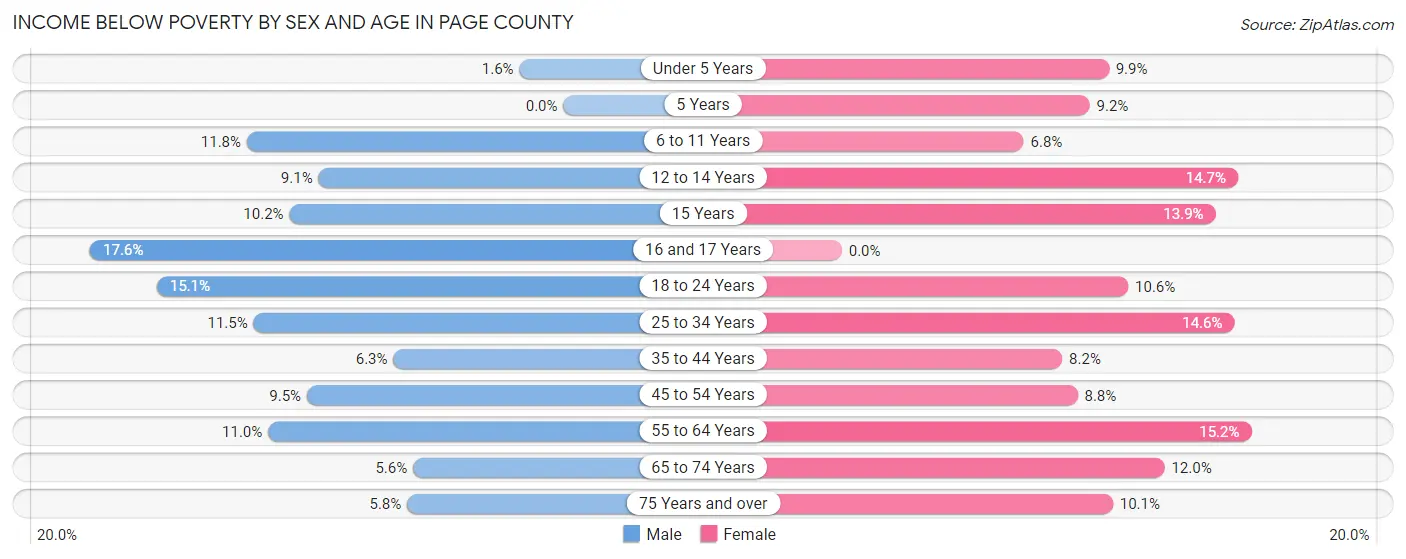
| Age Bracket | Male | Female |
| Under 5 Years | 10 (1.6%) | 58 (9.9%) |
| 5 Years | 0 (0.0%) | 16 (9.2%) |
| 6 to 11 Years | 102 (11.7%) | 49 (6.8%) |
| 12 to 14 Years | 40 (9.1%) | 51 (14.7%) |
| 15 Years | 24 (10.2%) | 19 (13.9%) |
| 16 and 17 Years | 42 (17.6%) | 0 (0.0%) |
| 18 to 24 Years | 137 (15.1%) | 78 (10.6%) |
| 25 to 34 Years | 151 (11.5%) | 193 (14.6%) |
| 35 to 44 Years | 87 (6.3%) | 108 (8.2%) |
| 45 to 54 Years | 157 (9.5%) | 137 (8.7%) |
| 55 to 64 Years | 201 (11.0%) | 277 (15.2%) |
| 65 to 74 Years | 80 (5.6%) | 176 (12.0%) |
| 75 Years and over | 52 (5.8%) | 116 (10.1%) |
| Total | 1,083 (9.1%) | 1,278 (11.0%) |
Income Above Poverty by Sex and Age in Page County
According to the poverty statistics in Page County, males aged 5 years and females aged 16 and 17 years are the age groups that are most secure financially, with 100.0% of males and 100.0% of females in these age groups living above the poverty line.
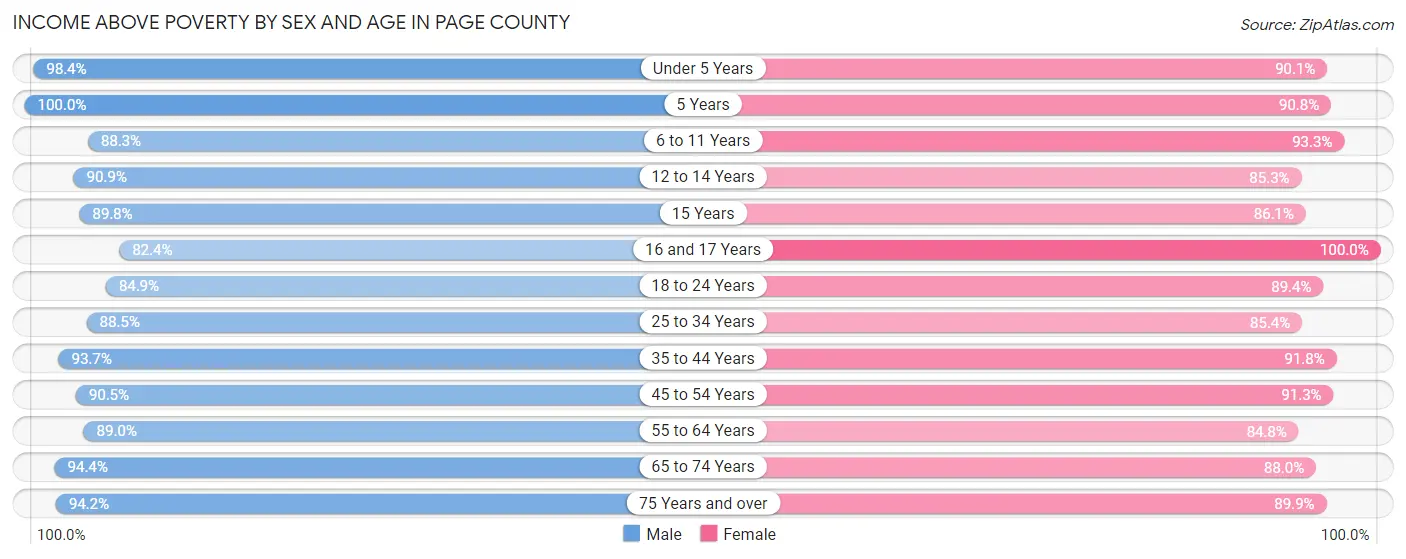
| Age Bracket | Male | Female |
| Under 5 Years | 605 (98.4%) | 527 (90.1%) |
| 5 Years | 71 (100.0%) | 158 (90.8%) |
| 6 to 11 Years | 766 (88.2%) | 677 (93.2%) |
| 12 to 14 Years | 400 (90.9%) | 296 (85.3%) |
| 15 Years | 212 (89.8%) | 118 (86.1%) |
| 16 and 17 Years | 197 (82.4%) | 286 (100.0%) |
| 18 to 24 Years | 771 (84.9%) | 656 (89.4%) |
| 25 to 34 Years | 1,162 (88.5%) | 1,132 (85.4%) |
| 35 to 44 Years | 1,291 (93.7%) | 1,213 (91.8%) |
| 45 to 54 Years | 1,492 (90.5%) | 1,429 (91.2%) |
| 55 to 64 Years | 1,633 (89.0%) | 1,545 (84.8%) |
| 65 to 74 Years | 1,354 (94.4%) | 1,293 (88.0%) |
| 75 Years and over | 845 (94.2%) | 1,037 (89.9%) |
| Total | 10,799 (90.9%) | 10,367 (89.0%) |
Income Below Poverty Among Married-Couple Families in Page County
The poverty statistics for married-couple families in Page County show that 2.6% or 126 of the total 4,750 families live below the poverty line. Families with 1 or 2 children have the highest poverty rate of 4.1%, comprising of 45 families. On the other hand, families with 3 or 4 children have the lowest poverty rate of 0.2%, which includes 1 families.
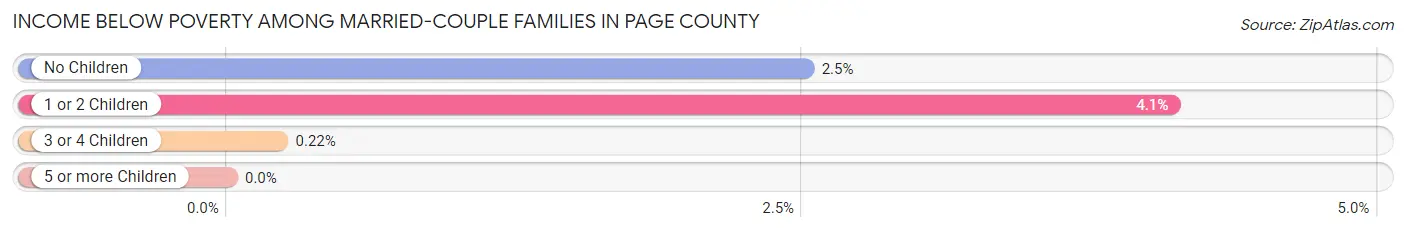
| Children | Above Poverty | Below Poverty |
| No Children | 3,112 (97.5%) | 80 (2.5%) |
| 1 or 2 Children | 1,052 (95.9%) | 45 (4.1%) |
| 3 or 4 Children | 460 (99.8%) | 1 (0.2%) |
| 5 or more Children | 0 (0.0%) | 0 (0.0%) |
| Total | 4,624 (97.4%) | 126 (2.6%) |
Income Below Poverty Among Single-Parent Households in Page County
According to the poverty data in Page County, 26.3% or 133 single-father households and 12.5% or 102 single-mother households are living below the poverty line. Among single-father households, those with 1 or 2 children have the highest poverty rate, with 99 households (35.4%) experiencing poverty. Likewise, among single-mother households, those with 3 or 4 children have the highest poverty rate, with 37 households (97.4%) falling below the poverty line.
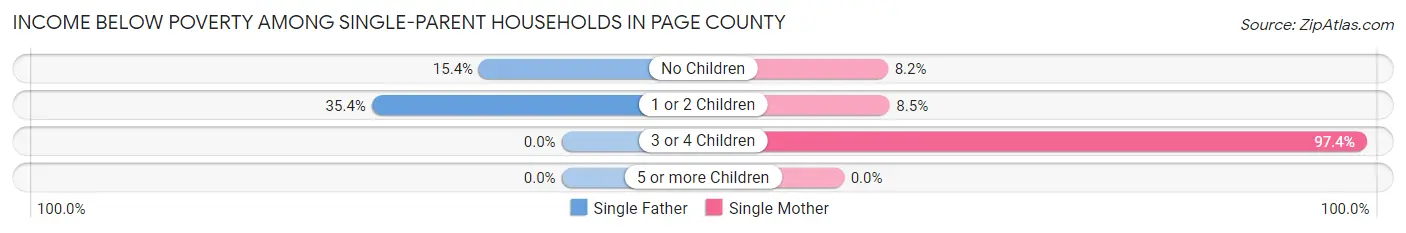
| Children | Single Father | Single Mother |
| No Children | 34 (15.4%) | 31 (8.2%) |
| 1 or 2 Children | 99 (35.4%) | 34 (8.5%) |
| 3 or 4 Children | 0 (0.0%) | 37 (97.4%) |
| 5 or more Children | 0 (0.0%) | 0 (0.0%) |
| Total | 133 (26.3%) | 102 (12.5%) |
Income Below Poverty Among Married-Couple vs Single-Parent Households in Page County
The poverty data for Page County shows that 126 of the married-couple family households (2.6%) and 235 of the single-parent households (17.8%) are living below the poverty level. Within the married-couple family households, those with 1 or 2 children have the highest poverty rate, with 45 households (4.1%) falling below the poverty line. Among the single-parent households, those with 3 or 4 children have the highest poverty rate, with 37 household (88.1%) living below poverty.
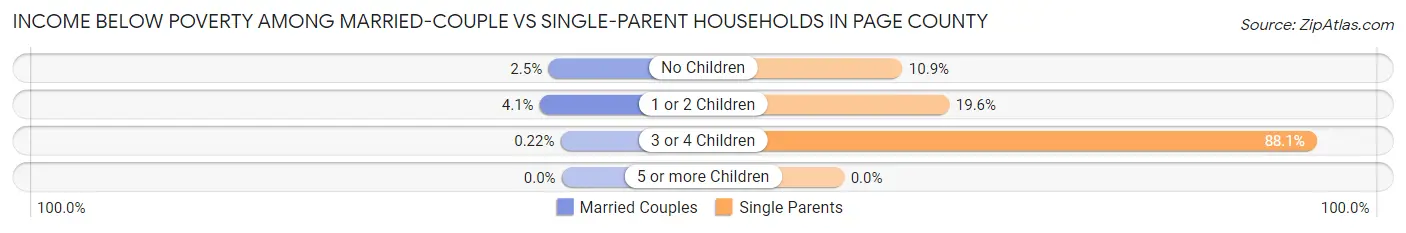
| Children | Married-Couple Families | Single-Parent Households |
| No Children | 80 (2.5%) | 65 (10.8%) |
| 1 or 2 Children | 45 (4.1%) | 133 (19.6%) |
| 3 or 4 Children | 1 (0.2%) | 37 (88.1%) |
| 5 or more Children | 0 (0.0%) | 0 (0.0%) |
| Total | 126 (2.6%) | 235 (17.8%) |
Race in Page County
The most populous races in Page County are White / Caucasian (22,077 | 92.9%), Two or more Races (887 | 3.7%), and Hispanic or Latino (562 | 2.4%).
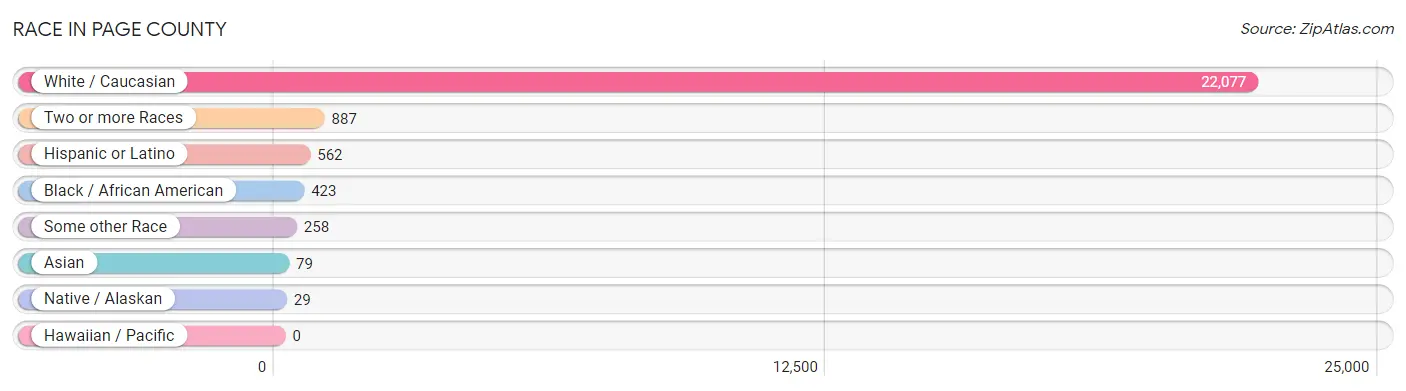
| Race | # Population | % Population |
| Asian | 79 | 0.3% |
| Black / African American | 423 | 1.8% |
| Hawaiian / Pacific | 0 | 0.0% |
| Hispanic or Latino | 562 | 2.4% |
| Native / Alaskan | 29 | 0.1% |
| White / Caucasian | 22,077 | 92.9% |
| Two or more Races | 887 | 3.7% |
| Some other Race | 258 | 1.1% |
| Total | 23,753 | 100.0% |
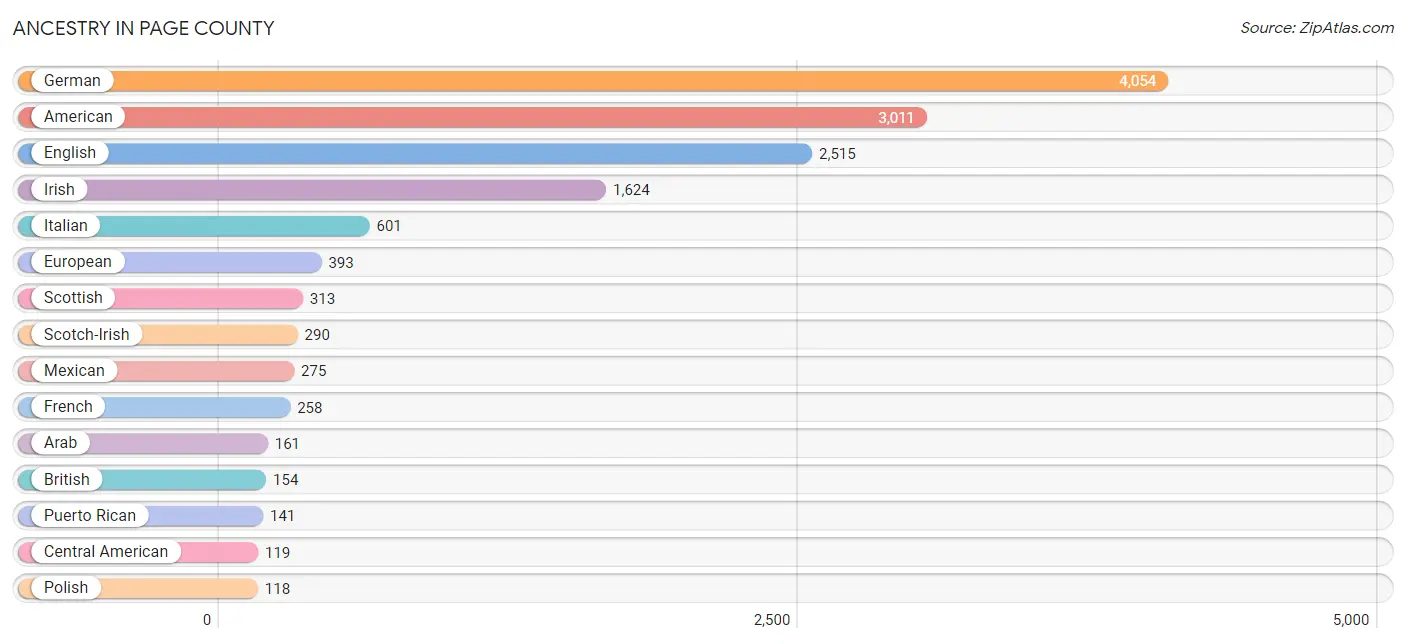
Ancestry in Page County
The most populous ancestries reported in Page County are German (4,054 | 17.1%), American (3,011 | 12.7%), English (2,515 | 10.6%), Irish (1,624 | 6.8%), and Italian (601 | 2.5%), together accounting for 49.7% of all Page County residents.
| Ancestry | # Population | % Population |
| African | 6 | 0.0% |
| American | 3,011 | 12.7% |
| Arab | 161 | 0.7% |
| Austrian | 11 | 0.1% |
| Bahamian | 19 | 0.1% |
| Belgian | 29 | 0.1% |
| Bhutanese | 2 | 0.0% |
| British | 154 | 0.6% |
| Burmese | 4 | 0.0% |
| Central American | 119 | 0.5% |
| Central American Indian | 45 | 0.2% |
| Cherokee | 33 | 0.1% |
| Chippewa | 12 | 0.1% |
| Costa Rican | 3 | 0.0% |
| Czech | 62 | 0.3% |
| Danish | 13 | 0.1% |
| Dutch | 100 | 0.4% |
| Eastern European | 13 | 0.1% |
| English | 2,515 | 10.6% |
| European | 393 | 1.7% |
| Finnish | 3 | 0.0% |
| French | 258 | 1.1% |
| French Canadian | 15 | 0.1% |
| German | 4,054 | 17.1% |
| Greek | 31 | 0.1% |
| Honduran | 47 | 0.2% |
| Hungarian | 31 | 0.1% |
| Indian (Asian) | 7 | 0.0% |
| Irish | 1,624 | 6.8% |
| Iroquois | 52 | 0.2% |
| Italian | 601 | 2.5% |
| Jamaican | 24 | 0.1% |
| Korean | 66 | 0.3% |
| Lebanese | 11 | 0.1% |
| Lithuanian | 8 | 0.0% |
| Mexican | 275 | 1.2% |
| Moroccan | 4 | 0.0% |
| Navajo | 3 | 0.0% |
| Nicaraguan | 49 | 0.2% |
| Northern European | 20 | 0.1% |
| Norwegian | 103 | 0.4% |
| Pakistani | 8 | 0.0% |
| Polish | 118 | 0.5% |
| Puerto Rican | 141 | 0.6% |
| Romanian | 4 | 0.0% |
| Russian | 14 | 0.1% |
| Salvadoran | 20 | 0.1% |
| Scandinavian | 14 | 0.1% |
| Scotch-Irish | 290 | 1.2% |
| Scottish | 313 | 1.3% |
| South American | 7 | 0.0% |
| Spanish | 20 | 0.1% |
| Sri Lankan | 9 | 0.0% |
| Subsaharan African | 22 | 0.1% |
| Swedish | 72 | 0.3% |
| Swiss | 34 | 0.1% |
| Thai | 26 | 0.1% |
| U.S. Virgin Islander | 13 | 0.1% |
| Welsh | 79 | 0.3% |
| West Indian | 7 | 0.0% | View All 60 Rows |
Immigrants in Page County
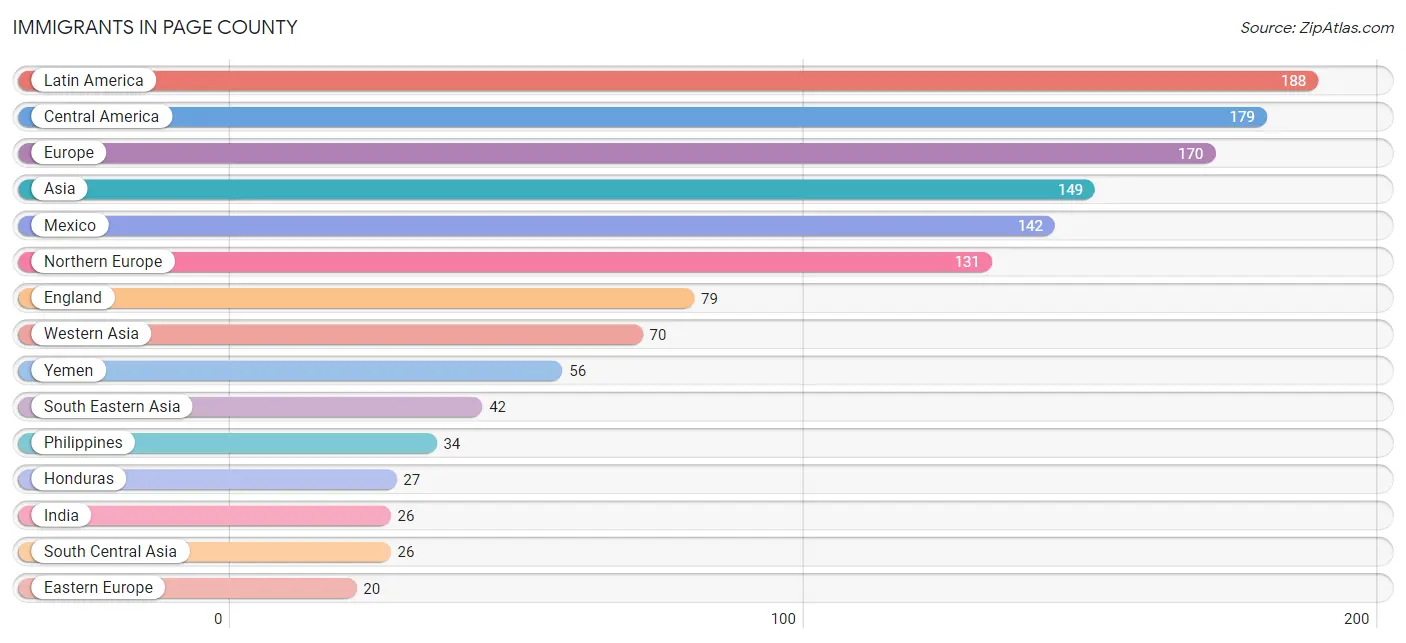
The most numerous immigrant groups reported in Page County came from Latin America (188 | 0.8%), Central America (179 | 0.7%), Europe (170 | 0.7%), Asia (149 | 0.6%), and Mexico (142 | 0.6%), together accounting for 3.5% of all Page County residents.
| Immigration Origin | # Population | % Population |
| Africa | 4 | 0.0% |
| Asia | 149 | 0.6% |
| Australia | 8 | 0.0% |
| Bahamas | 3 | 0.0% |
| Caribbean | 3 | 0.0% |
| Central America | 179 | 0.7% |
| China | 7 | 0.0% |
| Costa Rica | 3 | 0.0% |
| Eastern Asia | 11 | 0.1% |
| Eastern Europe | 20 | 0.1% |
| El Salvador | 7 | 0.0% |
| England | 79 | 0.3% |
| Europe | 170 | 0.7% |
| Germany | 19 | 0.1% |
| Honduras | 27 | 0.1% |
| Hong Kong | 5 | 0.0% |
| Hungary | 20 | 0.1% |
| India | 26 | 0.1% |
| Israel | 5 | 0.0% |
| Korea | 4 | 0.0% |
| Kuwait | 6 | 0.0% |
| Latin America | 188 | 0.8% |
| Lebanon | 3 | 0.0% |
| Mexico | 142 | 0.6% |
| Morocco | 4 | 0.0% |
| Northern Africa | 4 | 0.0% |
| Northern Europe | 131 | 0.5% |
| Oceania | 8 | 0.0% |
| Philippines | 34 | 0.1% |
| South America | 6 | 0.0% |
| South Central Asia | 26 | 0.1% |
| South Eastern Asia | 42 | 0.2% |
| Thailand | 8 | 0.0% |
| Western Asia | 70 | 0.3% |
| Western Europe | 19 | 0.1% |
| Yemen | 56 | 0.2% | View All 36 Rows |
Sex and Age in Page County
Sex and Age in Page County
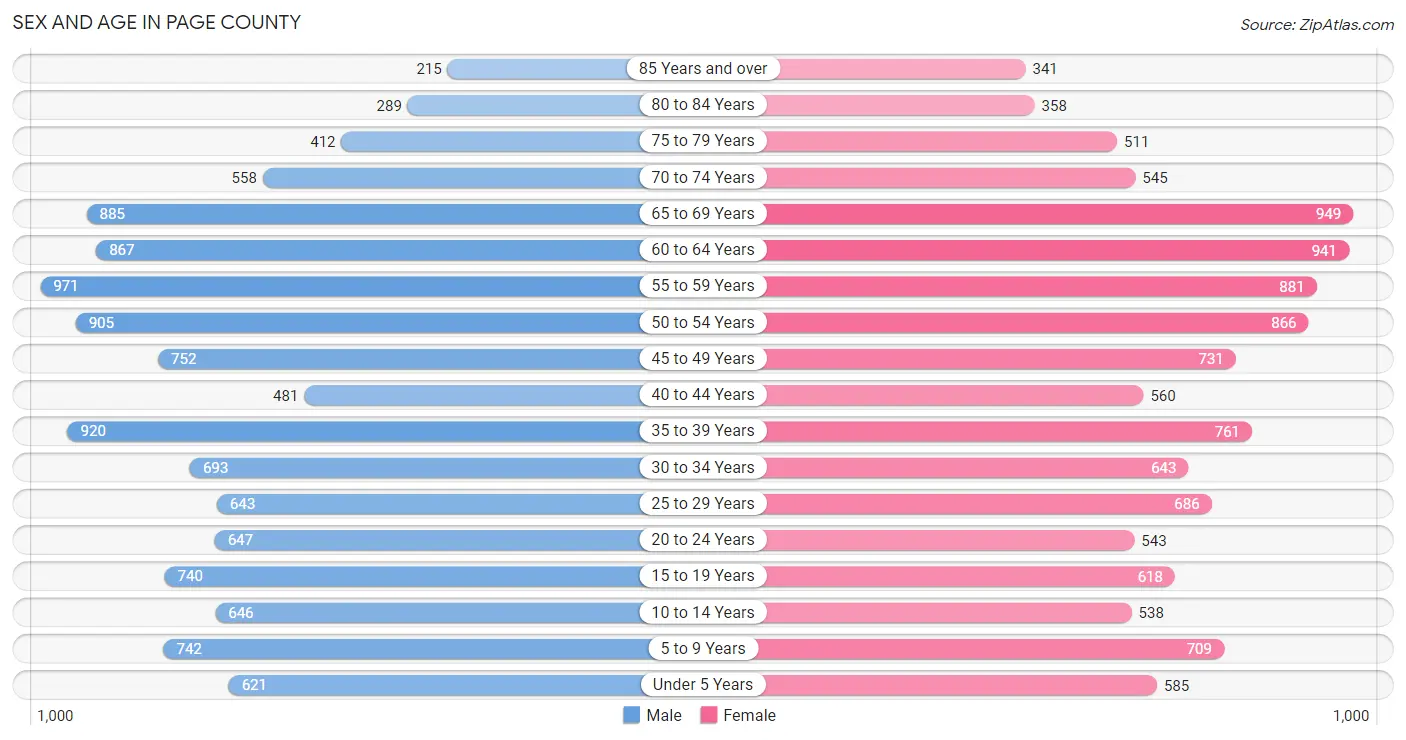
The most populous age groups in Page County are 55 to 59 Years (971 | 8.1%) for men and 65 to 69 Years (949 | 8.1%) for women.
| Age Bracket | Male | Female |
| Under 5 Years | 621 (5.2%) | 585 (5.0%) |
| 5 to 9 Years | 742 (6.2%) | 709 (6.0%) |
| 10 to 14 Years | 646 (5.4%) | 538 (4.6%) |
| 15 to 19 Years | 740 (6.2%) | 618 (5.2%) |
| 20 to 24 Years | 647 (5.4%) | 543 (4.6%) |
| 25 to 29 Years | 643 (5.4%) | 686 (5.8%) |
| 30 to 34 Years | 693 (5.8%) | 643 (5.5%) |
| 35 to 39 Years | 920 (7.7%) | 761 (6.5%) |
| 40 to 44 Years | 481 (4.0%) | 560 (4.8%) |
| 45 to 49 Years | 752 (6.3%) | 731 (6.2%) |
| 50 to 54 Years | 905 (7.5%) | 866 (7.4%) |
| 55 to 59 Years | 971 (8.1%) | 881 (7.5%) |
| 60 to 64 Years | 867 (7.2%) | 941 (8.0%) |
| 65 to 69 Years | 885 (7.4%) | 949 (8.1%) |
| 70 to 74 Years | 558 (4.7%) | 545 (4.6%) |
| 75 to 79 Years | 412 (3.4%) | 511 (4.3%) |
| 80 to 84 Years | 289 (2.4%) | 358 (3.0%) |
| 85 Years and over | 215 (1.8%) | 341 (2.9%) |
| Total | 11,987 (100.0%) | 11,766 (100.0%) |
Families and Households in Page County
Median Family Size in Page County
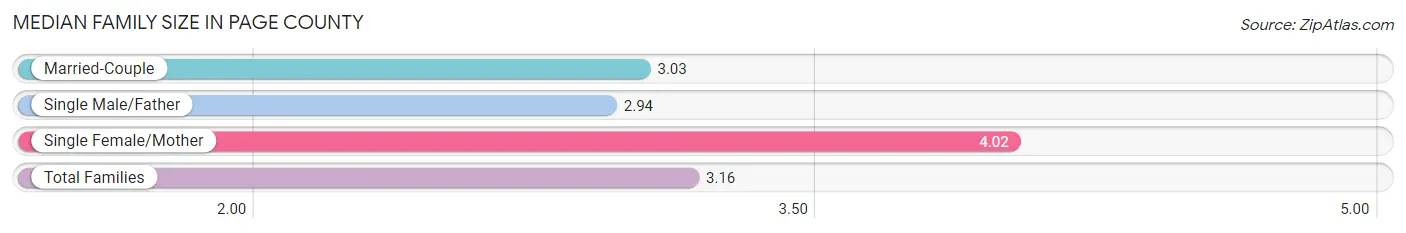
The median family size in Page County is 3.16 persons per family, with single female/mother families (815 | 13.4%) accounting for the largest median family size of 4.02 persons per family. On the other hand, single male/father families (505 | 8.3%) represent the smallest median family size with 2.94 persons per family.
| Family Type | # Families | Family Size |
| Married-Couple | 4,750 (78.2%) | 3.03 |
| Single Male/Father | 505 (8.3%) | 2.94 |
| Single Female/Mother | 815 (13.4%) | 4.02 |
| Total Families | 6,070 (100.0%) | 3.16 |
Median Household Size in Page County
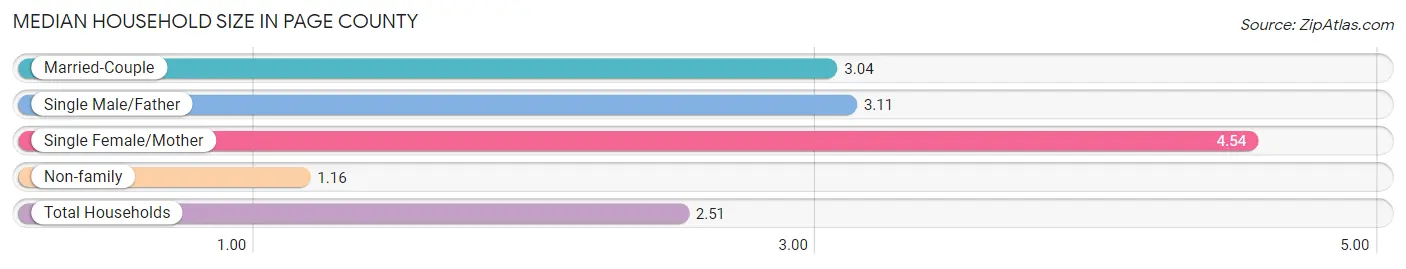
The median household size in Page County is 2.51 persons per household, with single female/mother households (815 | 8.7%) accounting for the largest median household size of 4.54 persons per household. non-family households (3,281 | 35.1%) represent the smallest median household size with 1.16 persons per household.
| Household Type | # Households | Household Size |
| Married-Couple | 4,750 (50.8%) | 3.04 |
| Single Male/Father | 505 (5.4%) | 3.11 |
| Single Female/Mother | 815 (8.7%) | 4.54 |
| Non-family | 3,281 (35.1%) | 1.16 |
| Total Households | 9,351 (100.0%) | 2.51 |
Household Size by Marriage Status in Page County
Out of a total of 9,351 households in Page County, 6,070 (64.9%) are family households, while 3,281 (35.1%) are nonfamily households. The most numerous type of family households are 2-person households, comprising 3,296, and the most common type of nonfamily households are 1-person households, comprising 2,911.
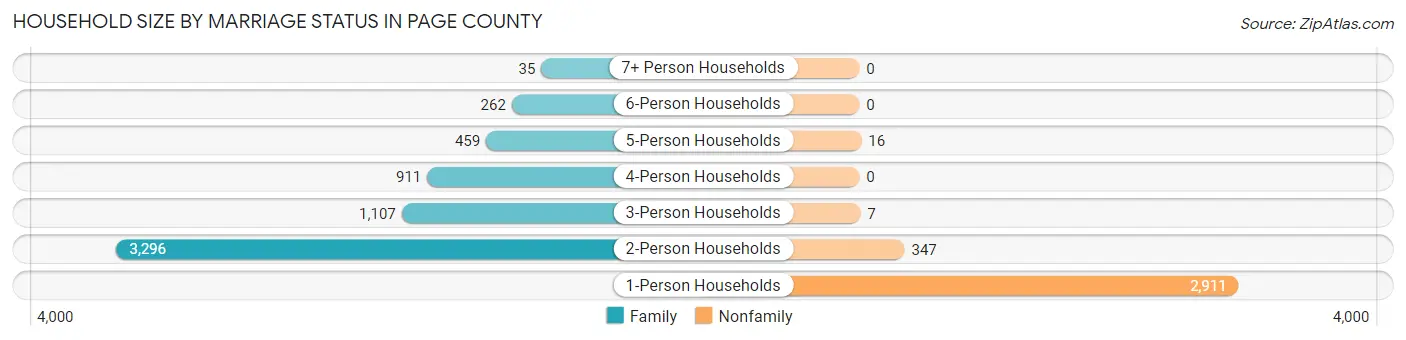
| Household Size | Family Households | Nonfamily Households |
| 1-Person Households | - | 2,911 (31.1%) |
| 2-Person Households | 3,296 (35.2%) | 347 (3.7%) |
| 3-Person Households | 1,107 (11.8%) | 7 (0.1%) |
| 4-Person Households | 911 (9.7%) | 0 (0.0%) |
| 5-Person Households | 459 (4.9%) | 16 (0.2%) |
| 6-Person Households | 262 (2.8%) | 0 (0.0%) |
| 7+ Person Households | 35 (0.4%) | 0 (0.0%) |
| Total | 6,070 (64.9%) | 3,281 (35.1%) |
Female Fertility in Page County
Fertility by Age in Page County
Average fertility rate in Page County is 44.0 births per 1,000 women. Women in the age bracket of 20 to 34 years have the highest fertility rate with 108.0 births per 1,000 women. Women in the age bracket of 20 to 34 years acount for 95.3% of all women with births.
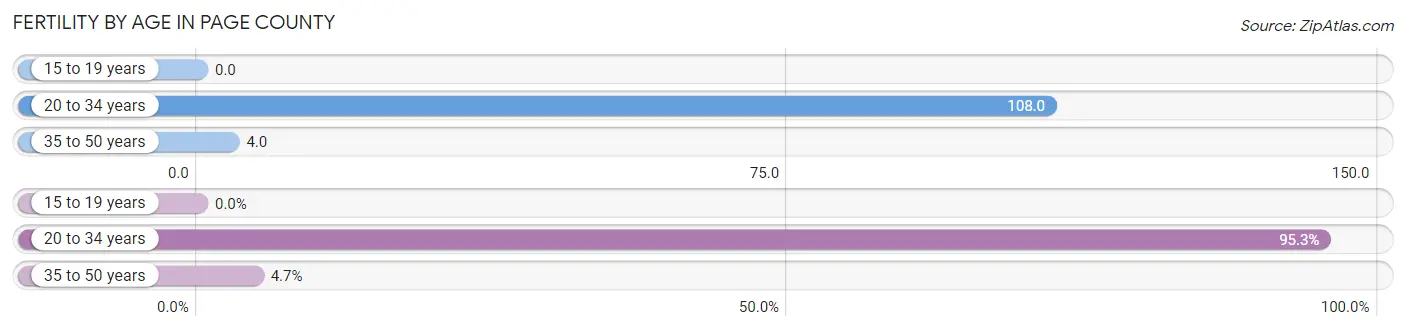
| Age Bracket | Women with Births | Births / 1,000 Women |
| 15 to 19 years | 0 (0.0%) | 0.0 |
| 20 to 34 years | 202 (95.3%) | 108.0 |
| 35 to 50 years | 10 (4.7%) | 4.0 |
| Total | 212 (100.0%) | 44.0 |
Fertility by Age by Marriage Status in Page County
64.6% of women with births (212) in Page County are married. The highest percentage of unmarried women with births falls into 20 to 34 years age bracket with 37.1% of them unmarried at the time of birth, while the lowest percentage of unmarried women with births belong to 35 to 50 years age bracket with 0.0% of them unmarried.
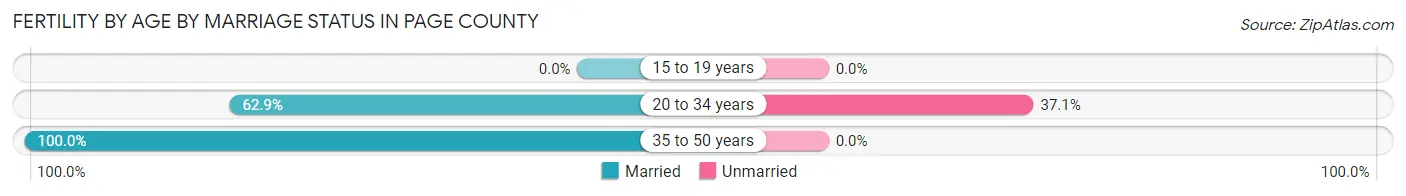
| Age Bracket | Married | Unmarried |
| 15 to 19 years | 0 (0.0%) | 0 (0.0%) |
| 20 to 34 years | 127 (62.9%) | 75 (37.1%) |
| 35 to 50 years | 10 (100.0%) | 0 (0.0%) |
| Total | 137 (64.6%) | 75 (35.4%) |
Fertility by Education in Page County
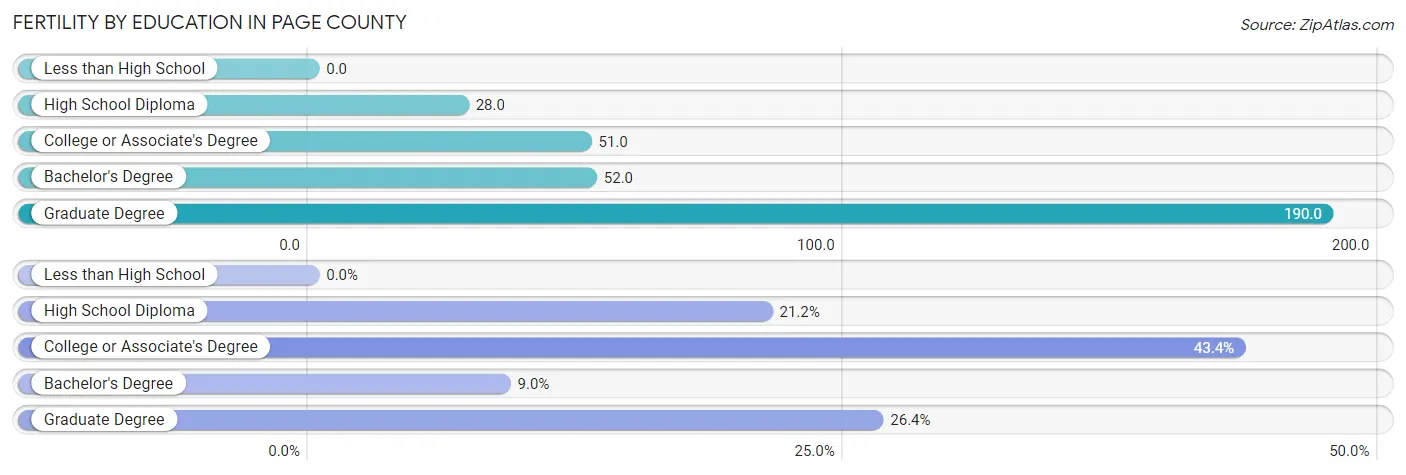
| Educational Attainment | Women with Births | Births / 1,000 Women |
| Less than High School | 0 (0.0%) | 0.0 |
| High School Diploma | 45 (21.2%) | 28.0 |
| College or Associate's Degree | 92 (43.4%) | 51.0 |
| Bachelor's Degree | 19 (9.0%) | 52.0 |
| Graduate Degree | 56 (26.4%) | 190.0 |
| Total | 212 (100.0%) | 44.0 |
Fertility by Education by Marriage Status in Page County
35.4% of women with births in Page County are unmarried. Women with the educational attainment of graduate degree are most likely to be married with 100.0% of them married at childbirth, while women with the educational attainment of college or associate's degree are least likely to be married with 71.7% of them unmarried at childbirth.
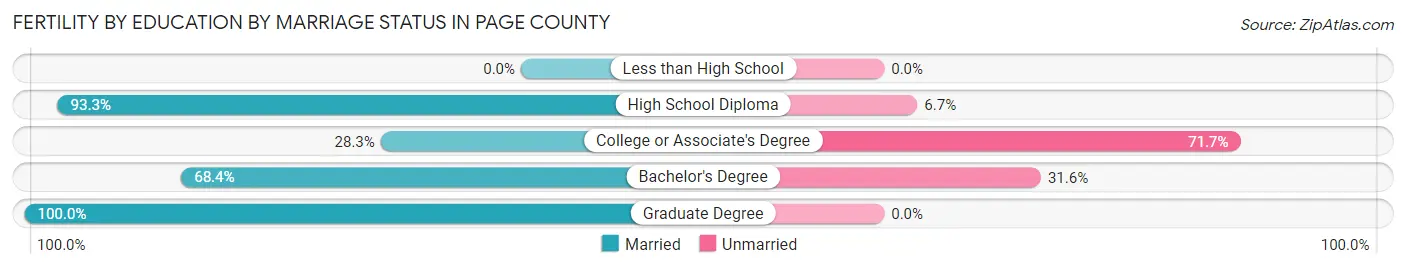
| Educational Attainment | Married | Unmarried |
| Less than High School | 0 (0.0%) | 0 (0.0%) |
| High School Diploma | 42 (93.3%) | 3 (6.7%) |
| College or Associate's Degree | 26 (28.3%) | 66 (71.7%) |
| Bachelor's Degree | 13 (68.4%) | 6 (31.6%) |
| Graduate Degree | 56 (100.0%) | 0 (0.0%) |
| Total | 137 (64.6%) | 75 (35.4%) |
Employment Characteristics in Page County
Employment by Class of Employer in Page County
Among the 10,681 employed individuals in Page County, private company employees (7,416 | 69.4%), local government employees (994 | 9.3%), and self-employed (not incorporated) (532 | 5.0%) make up the most common classes of employment.
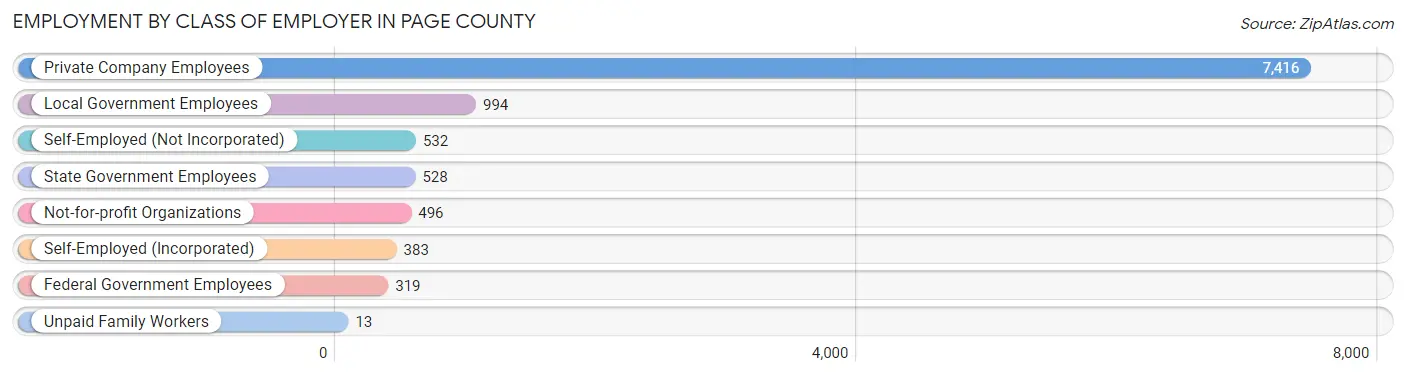
| Employer Class | # Employees | % Employees |
| Private Company Employees | 7,416 | 69.4% |
| Self-Employed (Incorporated) | 383 | 3.6% |
| Self-Employed (Not Incorporated) | 532 | 5.0% |
| Not-for-profit Organizations | 496 | 4.6% |
| Local Government Employees | 994 | 9.3% |
| State Government Employees | 528 | 4.9% |
| Federal Government Employees | 319 | 3.0% |
| Unpaid Family Workers | 13 | 0.1% |
| Total | 10,681 | 100.0% |
Employment Status by Age in Page County
According to the labor force statistics for Page County, out of the total population over 16 years of age (19,539), 58.9% or 11,508 individuals are in the labor force, with 4.6% or 529 of them unemployed. The age group with the highest labor force participation rate is 20 to 24 years, with 82.9% or 987 individuals in the labor force. Within the labor force, the 75 years and over age range has the highest percentage of unemployed individuals, with 12.4% or 16 of them being unemployed.
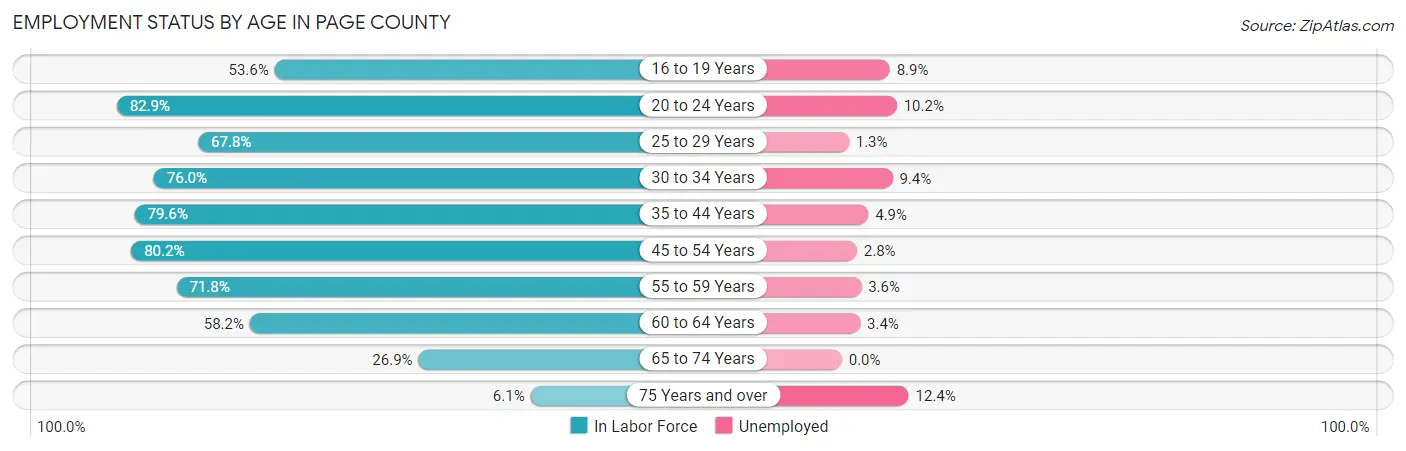
| Age Bracket | In Labor Force | Unemployed |
| 16 to 19 Years | 528 (53.6%) | 47 (8.9%) |
| 20 to 24 Years | 987 (82.9%) | 101 (10.2%) |
| 25 to 29 Years | 901 (67.8%) | 12 (1.3%) |
| 30 to 34 Years | 1,015 (76.0%) | 95 (9.4%) |
| 35 to 44 Years | 2,167 (79.6%) | 106 (4.9%) |
| 45 to 54 Years | 2,610 (80.2%) | 73 (2.8%) |
| 55 to 59 Years | 1,330 (71.8%) | 48 (3.6%) |
| 60 to 64 Years | 1,052 (58.2%) | 36 (3.4%) |
| 65 to 74 Years | 790 (26.9%) | 0 (0.0%) |
| 75 Years and over | 130 (6.1%) | 16 (12.4%) |
| Total | 11,508 (58.9%) | 529 (4.6%) |
Employment Status by Educational Attainment in Page County
According to labor force statistics for Page County, 73.8% of individuals (9,078) out of the total population between 25 and 64 years of age (12,301) are in the labor force, with 4.1% or 372 of them being unemployed. The group with the highest labor force participation rate are those with the educational attainment of college / associate degree, with 79.8% or 2,508 individuals in the labor force. Within the labor force, individuals with less than high school education have the highest percentage of unemployment, with 6.1% or 64 of them being unemployed.
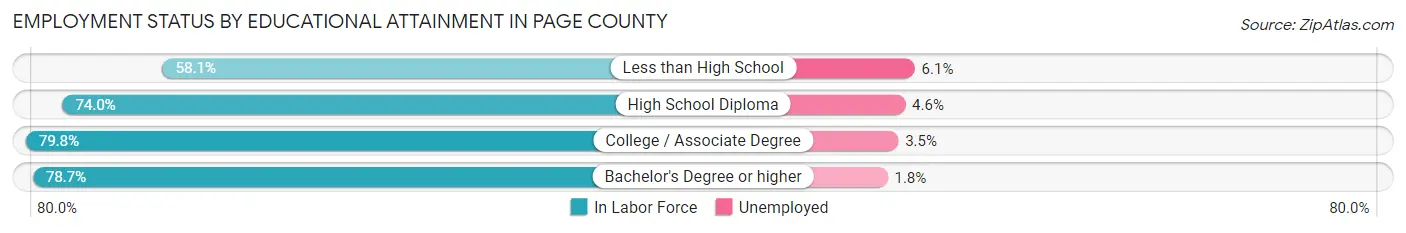
| Educational Attainment | In Labor Force | Unemployed |
| Less than High School | 1,057 (58.1%) | 111 (6.1%) |
| High School Diploma | 4,173 (74.0%) | 259 (4.6%) |
| College / Associate Degree | 2,508 (79.8%) | 110 (3.5%) |
| Bachelor's Degree or higher | 1,337 (78.7%) | 31 (1.8%) |
| Total | 9,078 (73.8%) | 504 (4.1%) |
Employment Occupations by Sex in Page County
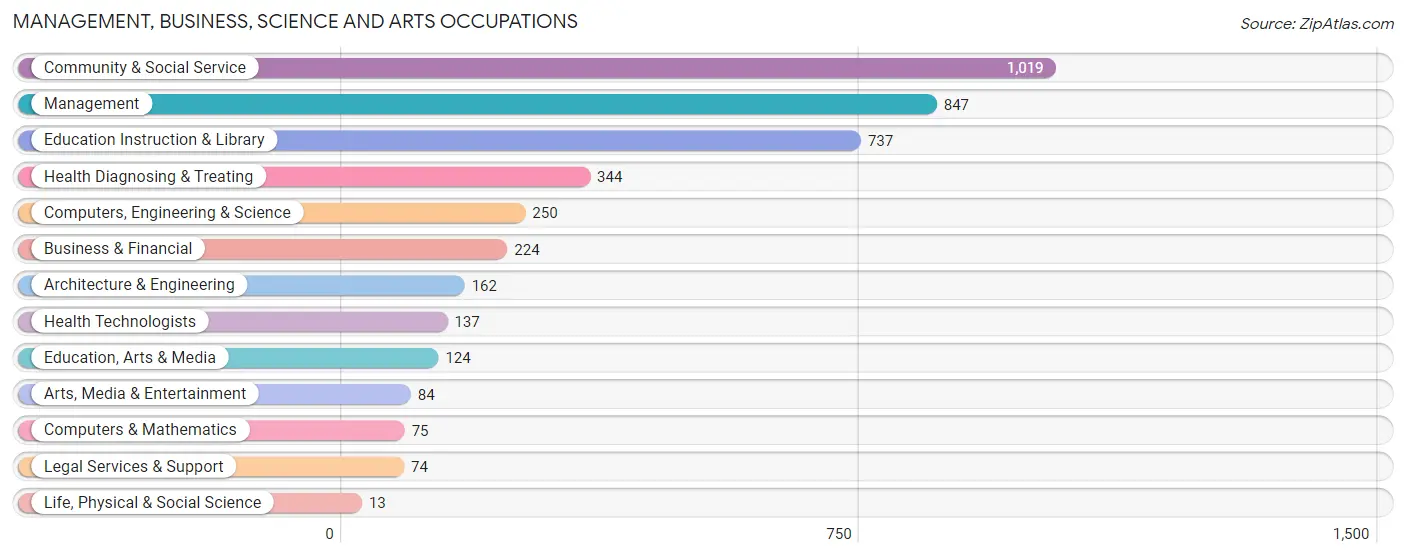
Management, Business, Science and Arts Occupations
The most common Management, Business, Science and Arts occupations in Page County are Community & Social Service (1,019 | 9.3%), Management (847 | 7.7%), Education Instruction & Library (737 | 6.7%), Health Diagnosing & Treating (344 | 3.1%), and Computers, Engineering & Science (250 | 2.3%).
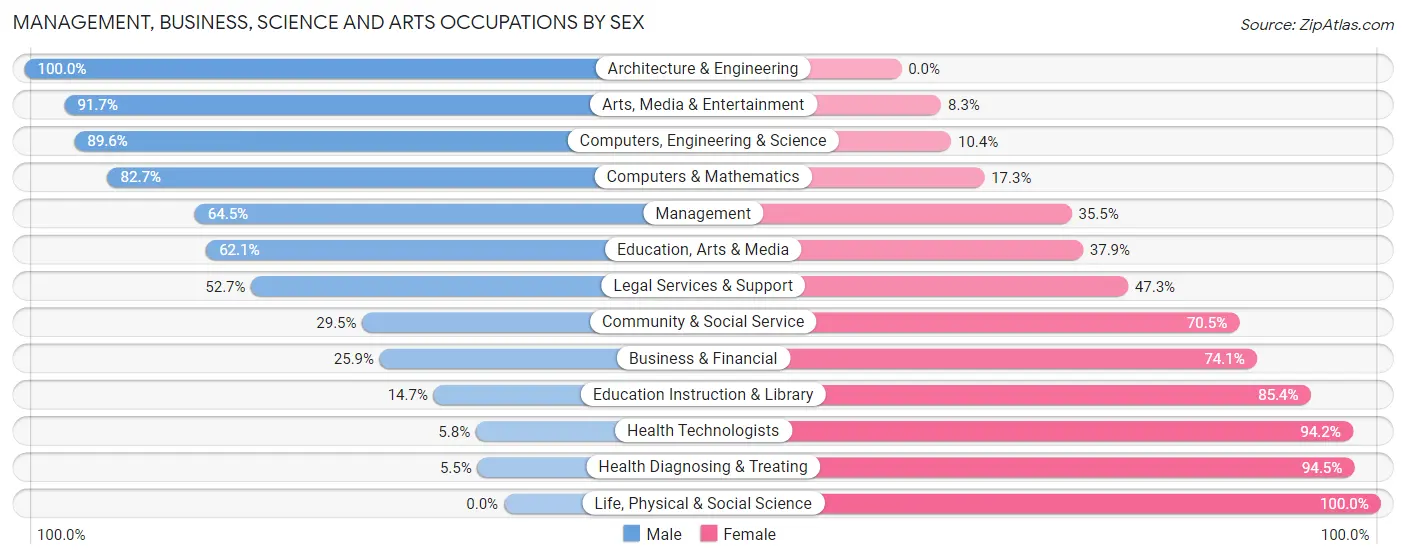
Management, Business, Science and Arts Occupations by Sex
Within the Management, Business, Science and Arts occupations in Page County, the most male-oriented occupations are Architecture & Engineering (100.0%), Arts, Media & Entertainment (91.7%), and Computers, Engineering & Science (89.6%), while the most female-oriented occupations are Life, Physical & Social Science (100.0%), Health Diagnosing & Treating (94.5%), and Health Technologists (94.2%).
| Occupation | Male | Female |
| Management | 546 (64.5%) | 301 (35.5%) |
| Business & Financial | 58 (25.9%) | 166 (74.1%) |
| Computers, Engineering & Science | 224 (89.6%) | 26 (10.4%) |
| Computers & Mathematics | 62 (82.7%) | 13 (17.3%) |
| Architecture & Engineering | 162 (100.0%) | 0 (0.0%) |
| Life, Physical & Social Science | 0 (0.0%) | 13 (100.0%) |
| Community & Social Service | 301 (29.5%) | 718 (70.5%) |
| Education, Arts & Media | 77 (62.1%) | 47 (37.9%) |
| Legal Services & Support | 39 (52.7%) | 35 (47.3%) |
| Education Instruction & Library | 108 (14.6%) | 629 (85.4%) |
| Arts, Media & Entertainment | 77 (91.7%) | 7 (8.3%) |
| Health Diagnosing & Treating | 19 (5.5%) | 325 (94.5%) |
| Health Technologists | 8 (5.8%) | 129 (94.2%) |
| Total (Category) | 1,148 (42.8%) | 1,536 (57.2%) |
| Total (Overall) | 5,787 (52.8%) | 5,167 (47.2%) |
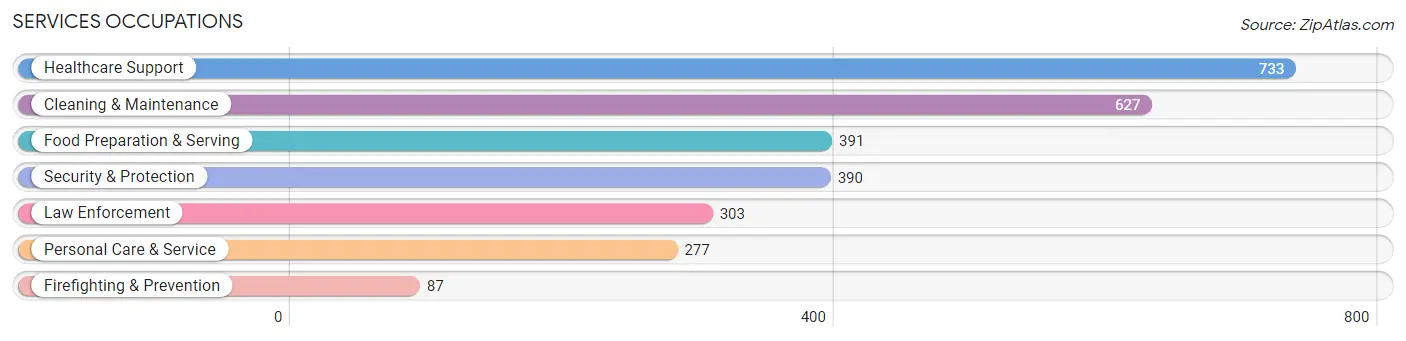
Services Occupations
The most common Services occupations in Page County are Healthcare Support (733 | 6.7%), Cleaning & Maintenance (627 | 5.7%), Food Preparation & Serving (391 | 3.6%), Security & Protection (390 | 3.6%), and Law Enforcement (303 | 2.8%).
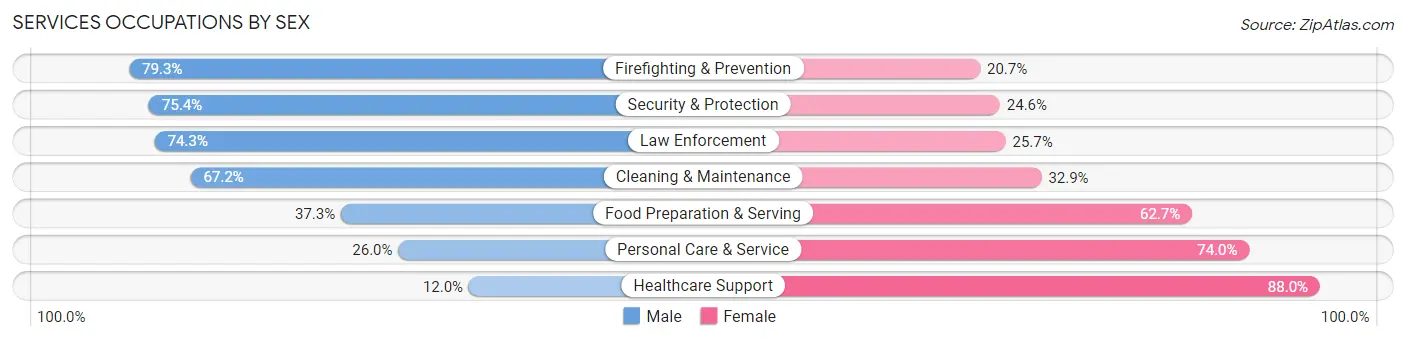
Services Occupations by Sex
Within the Services occupations in Page County, the most male-oriented occupations are Firefighting & Prevention (79.3%), Security & Protection (75.4%), and Law Enforcement (74.3%), while the most female-oriented occupations are Healthcare Support (88.0%), Personal Care & Service (74.0%), and Food Preparation & Serving (62.7%).
| Occupation | Male | Female |
| Healthcare Support | 88 (12.0%) | 645 (88.0%) |
| Security & Protection | 294 (75.4%) | 96 (24.6%) |
| Firefighting & Prevention | 69 (79.3%) | 18 (20.7%) |
| Law Enforcement | 225 (74.3%) | 78 (25.7%) |
| Food Preparation & Serving | 146 (37.3%) | 245 (62.7%) |
| Cleaning & Maintenance | 421 (67.1%) | 206 (32.9%) |
| Personal Care & Service | 72 (26.0%) | 205 (74.0%) |
| Total (Category) | 1,021 (42.2%) | 1,397 (57.8%) |
| Total (Overall) | 5,787 (52.8%) | 5,167 (47.2%) |
Sales and Office Occupations
The most common Sales and Office occupations in Page County are Office & Administration (1,090 | 10.0%), and Sales & Related (1,061 | 9.7%).

Sales and Office Occupations by Sex

| Occupation | Male | Female |
| Sales & Related | 361 (34.0%) | 700 (66.0%) |
| Office & Administration | 170 (15.6%) | 920 (84.4%) |
| Total (Category) | 531 (24.7%) | 1,620 (75.3%) |
| Total (Overall) | 5,787 (52.8%) | 5,167 (47.2%) |
Natural Resources, Construction and Maintenance Occupations
The most common Natural Resources, Construction and Maintenance occupations in Page County are Construction & Extraction (1,101 | 10.1%), Installation, Maintenance & Repair (553 | 5.1%), and Farming, Fishing & Forestry (59 | 0.5%).
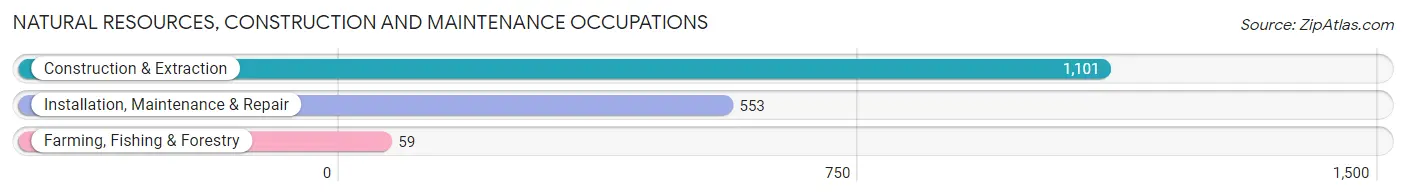
Natural Resources, Construction and Maintenance Occupations by Sex
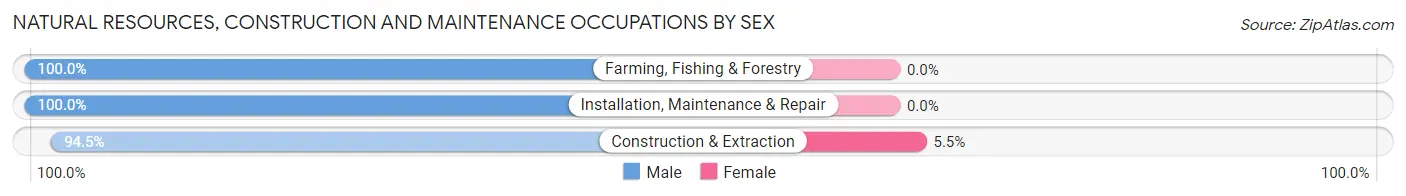
| Occupation | Male | Female |
| Farming, Fishing & Forestry | 59 (100.0%) | 0 (0.0%) |
| Construction & Extraction | 1,040 (94.5%) | 61 (5.5%) |
| Installation, Maintenance & Repair | 553 (100.0%) | 0 (0.0%) |
| Total (Category) | 1,652 (96.4%) | 61 (3.6%) |
| Total (Overall) | 5,787 (52.8%) | 5,167 (47.2%) |
Production, Transportation and Moving Occupations
The most common Production, Transportation and Moving occupations in Page County are Production (1,058 | 9.7%), Material Moving (530 | 4.8%), and Transportation (400 | 3.6%).
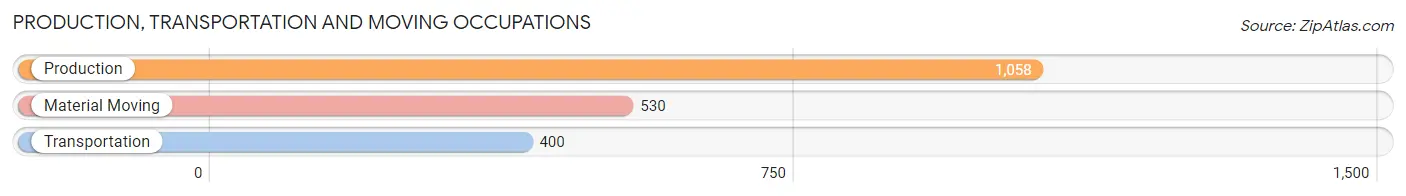
Production, Transportation and Moving Occupations by Sex
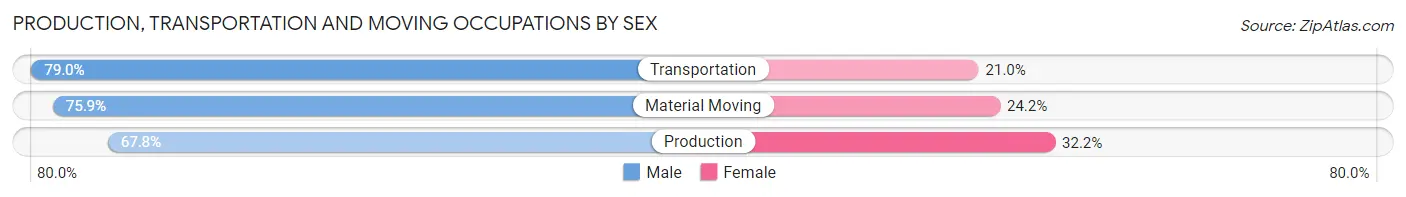
| Occupation | Male | Female |
| Production | 717 (67.8%) | 341 (32.2%) |
| Transportation | 316 (79.0%) | 84 (21.0%) |
| Material Moving | 402 (75.8%) | 128 (24.1%) |
| Total (Category) | 1,435 (72.2%) | 553 (27.8%) |
| Total (Overall) | 5,787 (52.8%) | 5,167 (47.2%) |
Employment Industries by Sex in Page County
Employment Industries in Page County
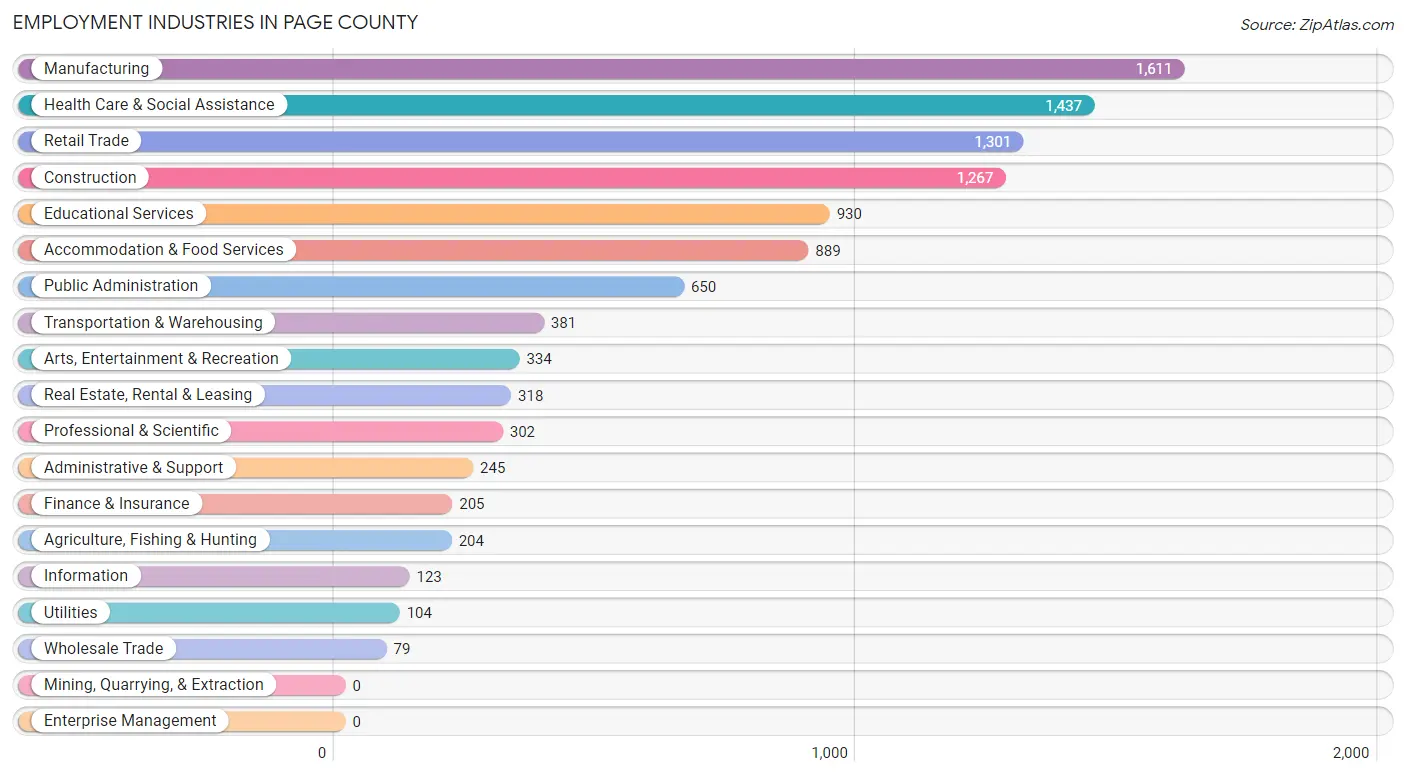
The major employment industries in Page County include Manufacturing (1,611 | 14.7%), Health Care & Social Assistance (1,437 | 13.1%), Retail Trade (1,301 | 11.9%), Construction (1,267 | 11.6%), and Educational Services (930 | 8.5%).
Employment Industries by Sex in Page County
The Page County industries that see more men than women are Agriculture, Fishing & Hunting (93.1%), Utilities (90.4%), and Construction (88.1%), whereas the industries that tend to have a higher number of women are Health Care & Social Assistance (90.9%), Educational Services (73.6%), and Information (68.3%).
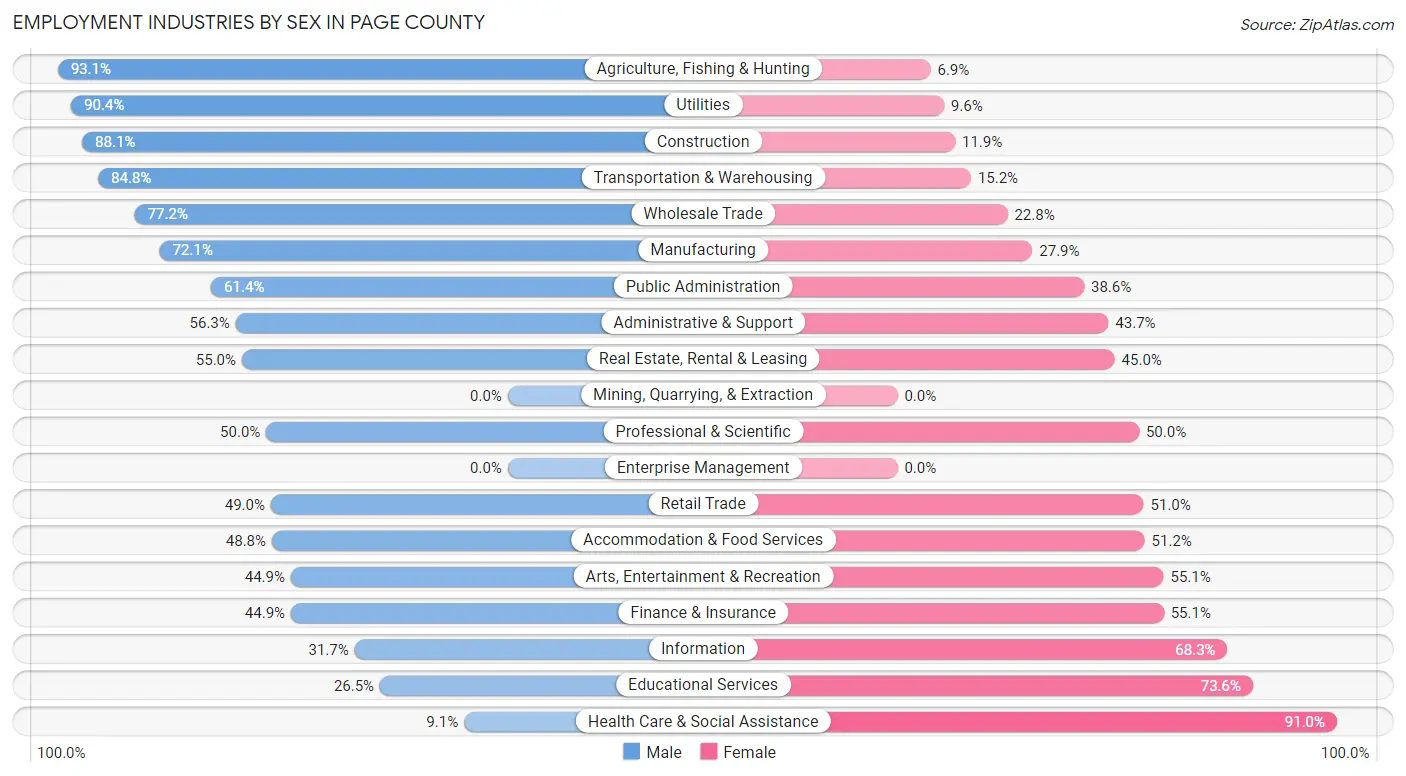
| Industry | Male | Female |
| Agriculture, Fishing & Hunting | 190 (93.1%) | 14 (6.9%) |
| Mining, Quarrying, & Extraction | 0 (0.0%) | 0 (0.0%) |
| Construction | 1,116 (88.1%) | 151 (11.9%) |
| Manufacturing | 1,161 (72.1%) | 450 (27.9%) |
| Wholesale Trade | 61 (77.2%) | 18 (22.8%) |
| Retail Trade | 638 (49.0%) | 663 (51.0%) |
| Transportation & Warehousing | 323 (84.8%) | 58 (15.2%) |
| Utilities | 94 (90.4%) | 10 (9.6%) |
| Information | 39 (31.7%) | 84 (68.3%) |
| Finance & Insurance | 92 (44.9%) | 113 (55.1%) |
| Real Estate, Rental & Leasing | 175 (55.0%) | 143 (45.0%) |
| Professional & Scientific | 151 (50.0%) | 151 (50.0%) |
| Enterprise Management | 0 (0.0%) | 0 (0.0%) |
| Administrative & Support | 138 (56.3%) | 107 (43.7%) |
| Educational Services | 246 (26.5%) | 684 (73.6%) |
| Health Care & Social Assistance | 130 (9.0%) | 1,307 (90.9%) |
| Arts, Entertainment & Recreation | 150 (44.9%) | 184 (55.1%) |
| Accommodation & Food Services | 434 (48.8%) | 455 (51.2%) |
| Public Administration | 399 (61.4%) | 251 (38.6%) |
| Total | 5,787 (52.8%) | 5,167 (47.2%) |
Education in Page County
School Enrollment in Page County
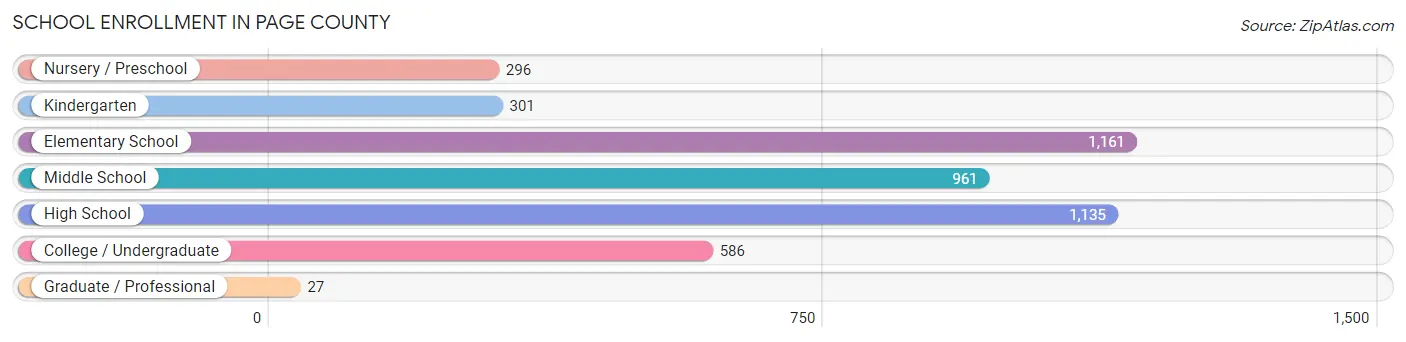
The most common levels of schooling among the 4,467 students in Page County are elementary school (1,161 | 26.0%), high school (1,135 | 25.4%), and middle school (961 | 21.5%).
| School Level | # Students | % Students |
| Nursery / Preschool | 296 | 6.6% |
| Kindergarten | 301 | 6.7% |
| Elementary School | 1,161 | 26.0% |
| Middle School | 961 | 21.5% |
| High School | 1,135 | 25.4% |
| College / Undergraduate | 586 | 13.1% |
| Graduate / Professional | 27 | 0.6% |
| Total | 4,467 | 100.0% |
School Enrollment by Age by Funding Source in Page County
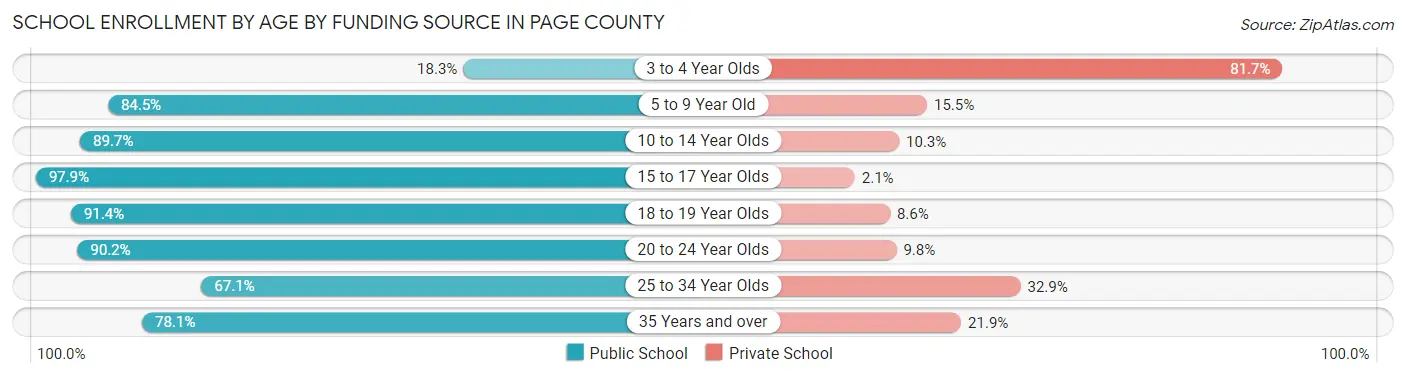
Out of a total of 4,467 students who are enrolled in schools in Page County, 719 (16.1%) attend a private institution, while the remaining 3,748 (83.9%) are enrolled in public schools. The age group of 3 to 4 year olds has the highest likelihood of being enrolled in private schools, with 241 (81.7% in the age bracket) enrolled. Conversely, the age group of 15 to 17 year olds has the lowest likelihood of being enrolled in a private school, with 849 (97.9% in the age bracket) attending a public institution.
| Age Bracket | Public School | Private School |
| 3 to 4 Year Olds | 54 (18.3%) | 241 (81.7%) |
| 5 to 9 Year Old | 1,186 (84.5%) | 218 (15.5%) |
| 10 to 14 Year Olds | 1,033 (89.7%) | 119 (10.3%) |
| 15 to 17 Year Olds | 849 (97.9%) | 18 (2.1%) |
| 18 to 19 Year Olds | 159 (91.4%) | 15 (8.6%) |
| 20 to 24 Year Olds | 211 (90.2%) | 23 (9.8%) |
| 25 to 34 Year Olds | 57 (67.1%) | 28 (32.9%) |
| 35 Years and over | 200 (78.1%) | 56 (21.9%) |
| Total | 3,748 (83.9%) | 719 (16.1%) |
Educational Attainment by Field of Study in Page County
Bio, nature & agricultural (442 | 16.1%), education (397 | 14.5%), business (282 | 10.3%), liberal arts & history (275 | 10.0%), and science & technology (234 | 8.5%) are the most common fields of study among 2,740 individuals in Page County who have obtained a bachelor's degree or higher.
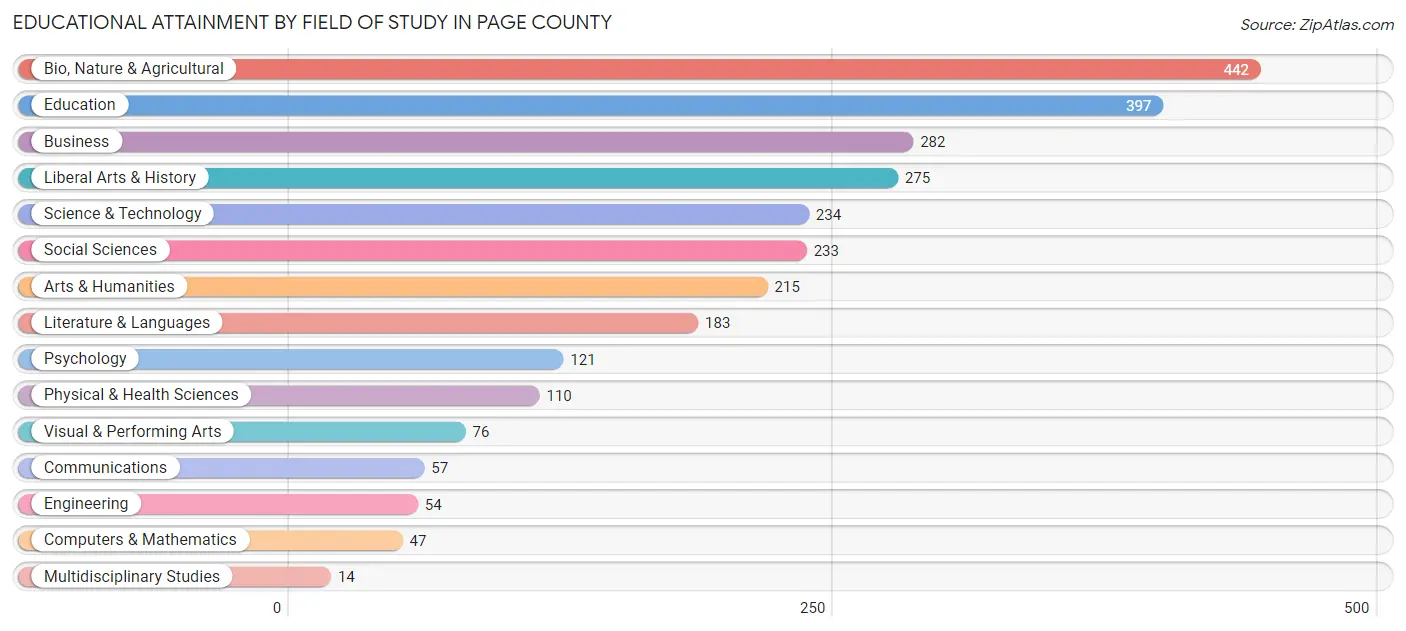
| Field of Study | # Graduates | % Graduates |
| Computers & Mathematics | 47 | 1.7% |
| Bio, Nature & Agricultural | 442 | 16.1% |
| Physical & Health Sciences | 110 | 4.0% |
| Psychology | 121 | 4.4% |
| Social Sciences | 233 | 8.5% |
| Engineering | 54 | 2.0% |
| Multidisciplinary Studies | 14 | 0.5% |
| Science & Technology | 234 | 8.5% |
| Business | 282 | 10.3% |
| Education | 397 | 14.5% |
| Literature & Languages | 183 | 6.7% |
| Liberal Arts & History | 275 | 10.0% |
| Visual & Performing Arts | 76 | 2.8% |
| Communications | 57 | 2.1% |
| Arts & Humanities | 215 | 7.9% |
| Total | 2,740 | 100.0% |
Transportation & Commute in Page County
Vehicle Availability by Sex in Page County
The most prevalent vehicle ownership categories in Page County are males with 2 vehicles (1,721, accounting for 30.2%) and females with 2 vehicles (1,581, making up 34.6%).
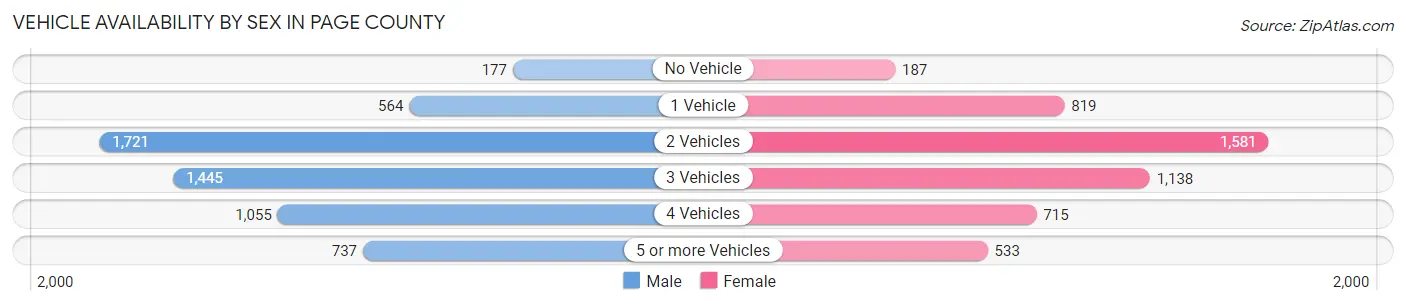
| Vehicles Available | Male | Female |
| No Vehicle | 177 (3.1%) | 187 (3.8%) |
| 1 Vehicle | 564 (9.9%) | 819 (16.5%) |
| 2 Vehicles | 1,721 (30.2%) | 1,581 (31.8%) |
| 3 Vehicles | 1,445 (25.4%) | 1,138 (22.9%) |
| 4 Vehicles | 1,055 (18.5%) | 715 (14.4%) |
| 5 or more Vehicles | 737 (12.9%) | 533 (10.7%) |
| Total | 5,699 (100.0%) | 4,973 (100.0%) |
Commute Time in Page County
The most frequently occuring commute durations in Page County are 45 to 59 minutes (1,465 commuters, 14.5%), 5 to 9 minutes (1,175 commuters, 11.6%), and 10 to 14 minutes (1,162 commuters, 11.5%).
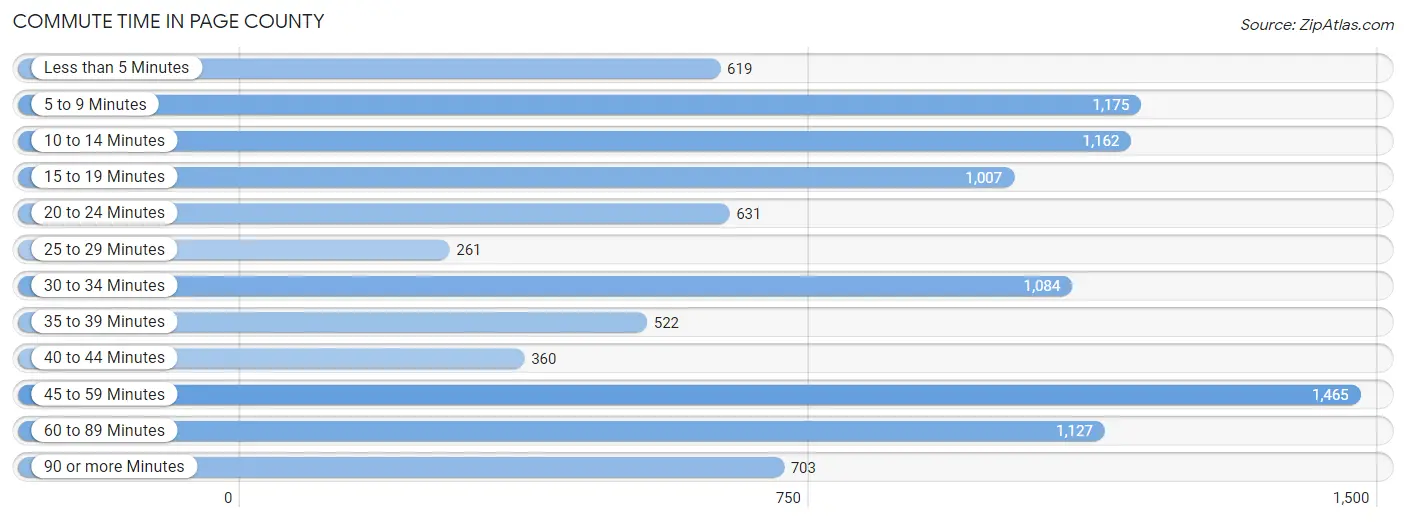
| Commute Time | # Commuters | % Commuters |
| Less than 5 Minutes | 619 | 6.1% |
| 5 to 9 Minutes | 1,175 | 11.6% |
| 10 to 14 Minutes | 1,162 | 11.5% |
| 15 to 19 Minutes | 1,007 | 10.0% |
| 20 to 24 Minutes | 631 | 6.2% |
| 25 to 29 Minutes | 261 | 2.6% |
| 30 to 34 Minutes | 1,084 | 10.7% |
| 35 to 39 Minutes | 522 | 5.2% |
| 40 to 44 Minutes | 360 | 3.6% |
| 45 to 59 Minutes | 1,465 | 14.5% |
| 60 to 89 Minutes | 1,127 | 11.1% |
| 90 or more Minutes | 703 | 7.0% |
Commute Time by Sex in Page County
The most common commute times in Page County are 45 to 59 minutes (877 commuters, 16.3%) for males and 10 to 14 minutes (756 commuters, 15.9%) for females.
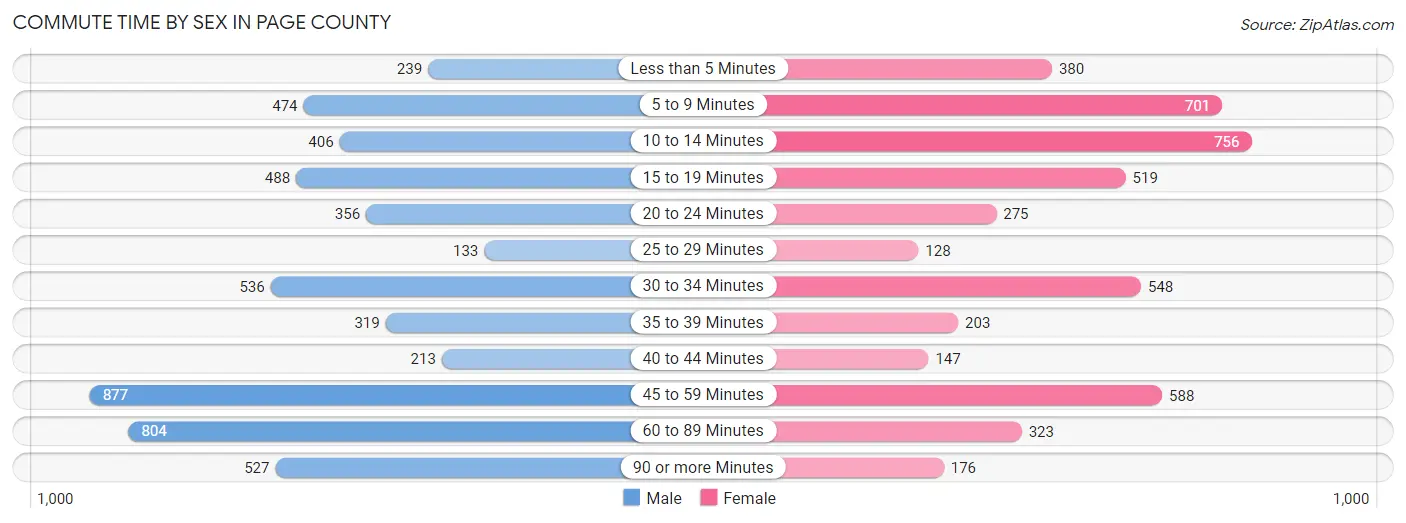
| Commute Time | Male | Female |
| Less than 5 Minutes | 239 (4.4%) | 380 (8.0%) |
| 5 to 9 Minutes | 474 (8.8%) | 701 (14.8%) |
| 10 to 14 Minutes | 406 (7.6%) | 756 (15.9%) |
| 15 to 19 Minutes | 488 (9.1%) | 519 (10.9%) |
| 20 to 24 Minutes | 356 (6.6%) | 275 (5.8%) |
| 25 to 29 Minutes | 133 (2.5%) | 128 (2.7%) |
| 30 to 34 Minutes | 536 (10.0%) | 548 (11.6%) |
| 35 to 39 Minutes | 319 (5.9%) | 203 (4.3%) |
| 40 to 44 Minutes | 213 (4.0%) | 147 (3.1%) |
| 45 to 59 Minutes | 877 (16.3%) | 588 (12.4%) |
| 60 to 89 Minutes | 804 (15.0%) | 323 (6.8%) |
| 90 or more Minutes | 527 (9.8%) | 176 (3.7%) |
Time of Departure to Work by Sex in Page County
The most frequent times of departure to work in Page County are 12:00 AM to 4:59 AM (944, 17.6%) for males and 7:30 AM to 7:59 AM (762, 16.1%) for females.
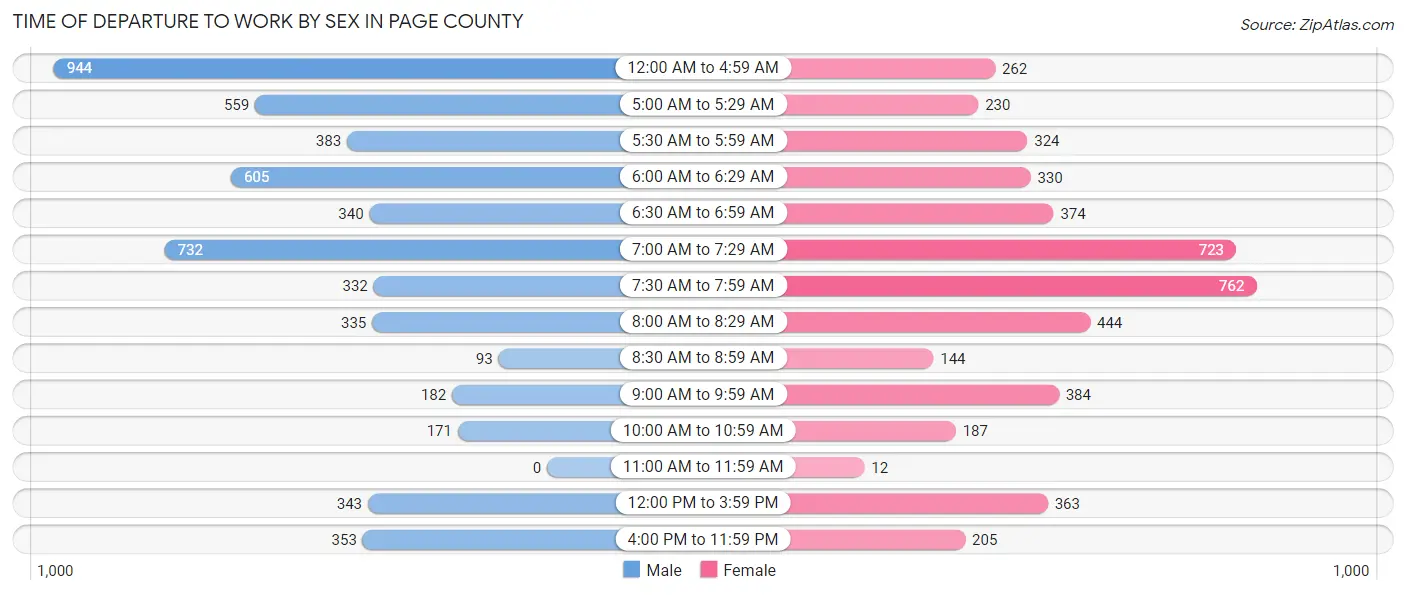
| Time of Departure | Male | Female |
| 12:00 AM to 4:59 AM | 944 (17.6%) | 262 (5.5%) |
| 5:00 AM to 5:29 AM | 559 (10.4%) | 230 (4.9%) |
| 5:30 AM to 5:59 AM | 383 (7.1%) | 324 (6.8%) |
| 6:00 AM to 6:29 AM | 605 (11.3%) | 330 (7.0%) |
| 6:30 AM to 6:59 AM | 340 (6.3%) | 374 (7.9%) |
| 7:00 AM to 7:29 AM | 732 (13.6%) | 723 (15.2%) |
| 7:30 AM to 7:59 AM | 332 (6.2%) | 762 (16.1%) |
| 8:00 AM to 8:29 AM | 335 (6.2%) | 444 (9.4%) |
| 8:30 AM to 8:59 AM | 93 (1.7%) | 144 (3.0%) |
| 9:00 AM to 9:59 AM | 182 (3.4%) | 384 (8.1%) |
| 10:00 AM to 10:59 AM | 171 (3.2%) | 187 (3.9%) |
| 11:00 AM to 11:59 AM | 0 (0.0%) | 12 (0.3%) |
| 12:00 PM to 3:59 PM | 343 (6.4%) | 363 (7.6%) |
| 4:00 PM to 11:59 PM | 353 (6.6%) | 205 (4.3%) |
| Total | 5,372 (100.0%) | 4,744 (100.0%) |
Housing Occupancy in Page County
Occupancy by Ownership in Page County
Of the total 9,351 dwellings in Page County, owner-occupied units account for 6,700 (71.7%), while renter-occupied units make up 2,651 (28.3%).
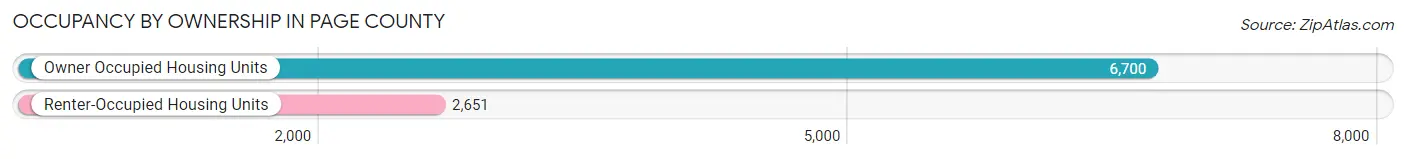
| Occupancy | # Housing Units | % Housing Units |
| Owner Occupied Housing Units | 6,700 | 71.7% |
| Renter-Occupied Housing Units | 2,651 | 28.3% |
| Total Occupied Housing Units | 9,351 | 100.0% |
Occupancy by Household Size in Page County
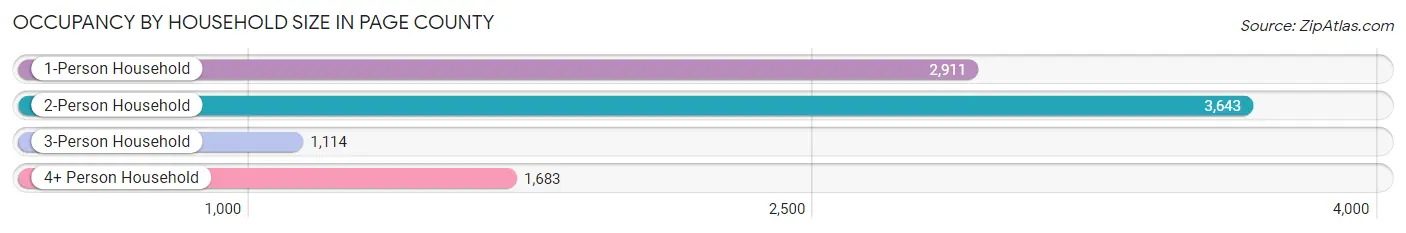
| Household Size | # Housing Units | % Housing Units |
| 1-Person Household | 2,911 | 31.1% |
| 2-Person Household | 3,643 | 39.0% |
| 3-Person Household | 1,114 | 11.9% |
| 4+ Person Household | 1,683 | 18.0% |
| Total Housing Units | 9,351 | 100.0% |
Occupancy by Ownership by Household Size in Page County
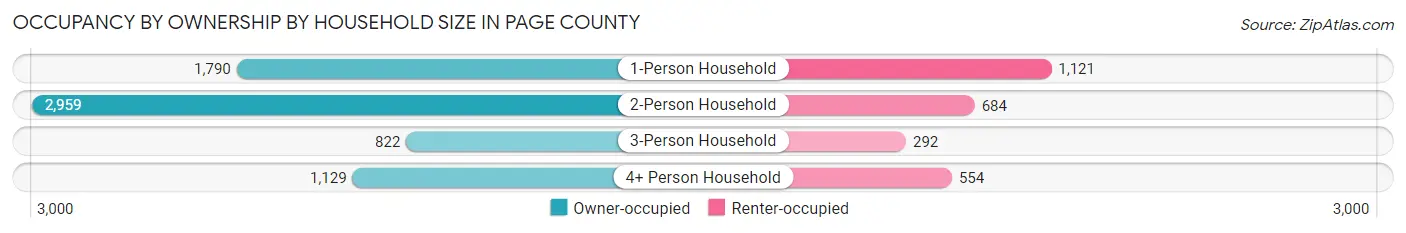
| Household Size | Owner-occupied | Renter-occupied |
| 1-Person Household | 1,790 (61.5%) | 1,121 (38.5%) |
| 2-Person Household | 2,959 (81.2%) | 684 (18.8%) |
| 3-Person Household | 822 (73.8%) | 292 (26.2%) |
| 4+ Person Household | 1,129 (67.1%) | 554 (32.9%) |
| Total Housing Units | 6,700 (71.7%) | 2,651 (28.3%) |
Occupancy by Educational Attainment in Page County
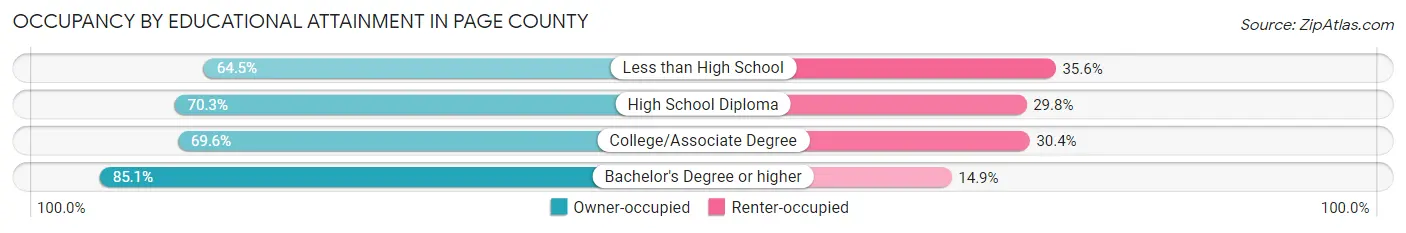
| Household Size | Owner-occupied | Renter-occupied |
| Less than High School | 959 (64.4%) | 529 (35.5%) |
| High School Diploma | 2,702 (70.3%) | 1,144 (29.7%) |
| College/Associate Degree | 1,704 (69.6%) | 744 (30.4%) |
| Bachelor's Degree or higher | 1,335 (85.1%) | 234 (14.9%) |
Occupancy by Age of Householder in Page County
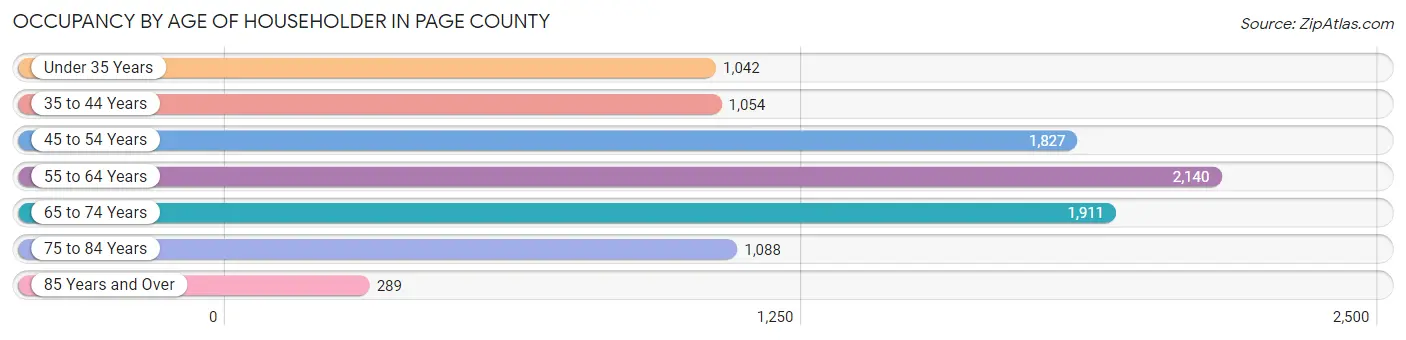
| Age Bracket | # Households | % Households |
| Under 35 Years | 1,042 | 11.1% |
| 35 to 44 Years | 1,054 | 11.3% |
| 45 to 54 Years | 1,827 | 19.5% |
| 55 to 64 Years | 2,140 | 22.9% |
| 65 to 74 Years | 1,911 | 20.4% |
| 75 to 84 Years | 1,088 | 11.6% |
| 85 Years and Over | 289 | 3.1% |
| Total | 9,351 | 100.0% |
Housing Finances in Page County
Median Income by Occupancy in Page County
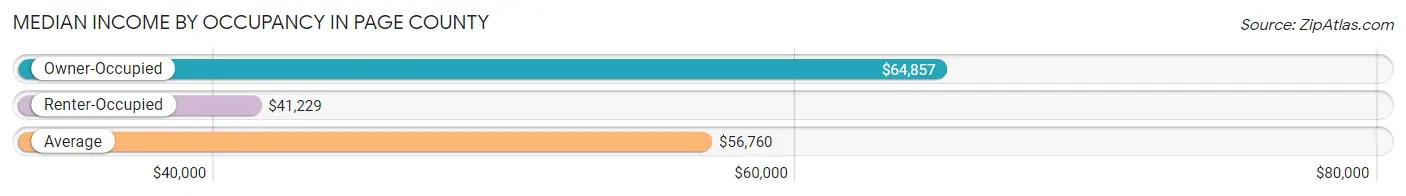
| Occupancy Type | # Households | Median Income |
| Owner-Occupied | 6,700 (71.7%) | $64,857 |
| Renter-Occupied | 2,651 (28.3%) | $41,229 |
| Average | 9,351 (100.0%) | $56,760 |
Occupancy by Householder Income Bracket in Page County
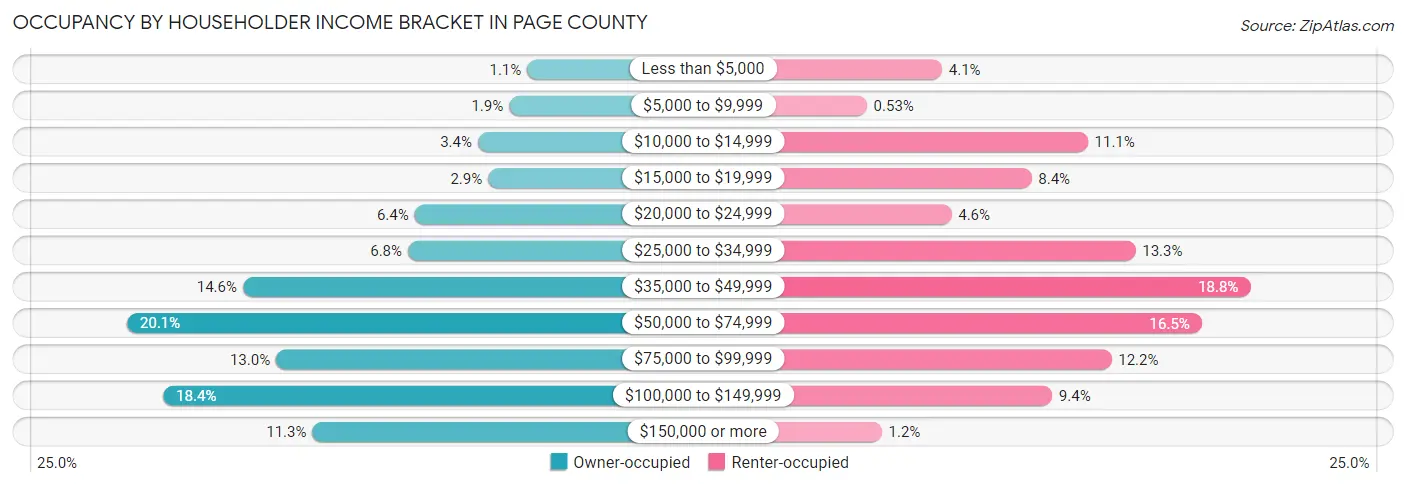
| Income Bracket | Owner-occupied | Renter-occupied |
| Less than $5,000 | 72 (1.1%) | 109 (4.1%) |
| $5,000 to $9,999 | 129 (1.9%) | 14 (0.5%) |
| $10,000 to $14,999 | 229 (3.4%) | 293 (11.1%) |
| $15,000 to $19,999 | 196 (2.9%) | 222 (8.4%) |
| $20,000 to $24,999 | 431 (6.4%) | 121 (4.6%) |
| $25,000 to $34,999 | 452 (6.8%) | 353 (13.3%) |
| $35,000 to $49,999 | 979 (14.6%) | 498 (18.8%) |
| $50,000 to $74,999 | 1,349 (20.1%) | 437 (16.5%) |
| $75,000 to $99,999 | 873 (13.0%) | 323 (12.2%) |
| $100,000 to $149,999 | 1,233 (18.4%) | 248 (9.3%) |
| $150,000 or more | 757 (11.3%) | 33 (1.2%) |
| Total | 6,700 (100.0%) | 2,651 (100.0%) |
Monthly Housing Cost Tiers in Page County
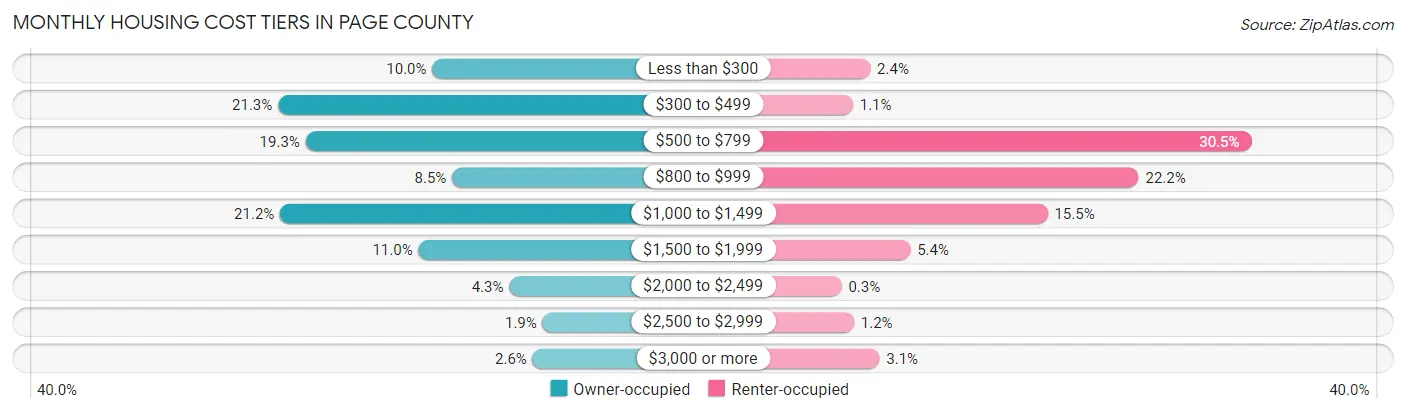
| Monthly Cost | Owner-occupied | Renter-occupied |
| Less than $300 | 668 (10.0%) | 64 (2.4%) |
| $300 to $499 | 1,429 (21.3%) | 30 (1.1%) |
| $500 to $799 | 1,293 (19.3%) | 808 (30.5%) |
| $800 to $999 | 570 (8.5%) | 588 (22.2%) |
| $1,000 to $1,499 | 1,419 (21.2%) | 410 (15.5%) |
| $1,500 to $1,999 | 736 (11.0%) | 142 (5.4%) |
| $2,000 to $2,499 | 288 (4.3%) | 8 (0.3%) |
| $2,500 to $2,999 | 124 (1.8%) | 32 (1.2%) |
| $3,000 or more | 173 (2.6%) | 82 (3.1%) |
| Total | 6,700 (100.0%) | 2,651 (100.0%) |
Physical Housing Characteristics in Page County
Housing Structures in Page County
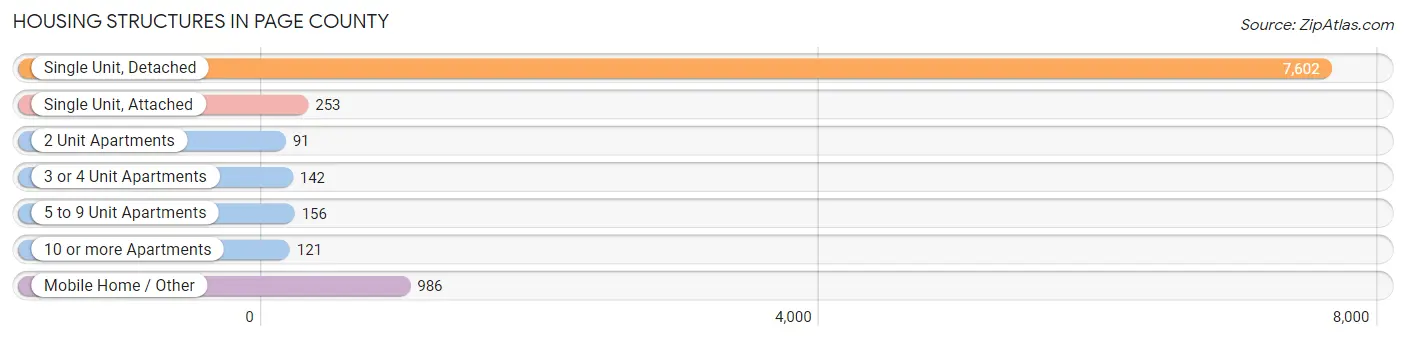
| Structure Type | # Housing Units | % Housing Units |
| Single Unit, Detached | 7,602 | 81.3% |
| Single Unit, Attached | 253 | 2.7% |
| 2 Unit Apartments | 91 | 1.0% |
| 3 or 4 Unit Apartments | 142 | 1.5% |
| 5 to 9 Unit Apartments | 156 | 1.7% |
| 10 or more Apartments | 121 | 1.3% |
| Mobile Home / Other | 986 | 10.5% |
| Total | 9,351 | 100.0% |
Housing Structures by Occupancy in Page County
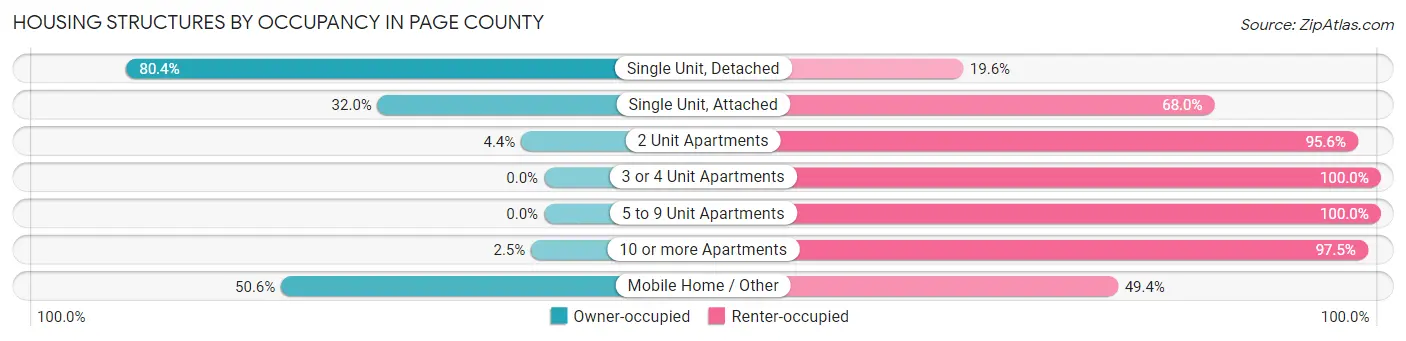
| Structure Type | Owner-occupied | Renter-occupied |
| Single Unit, Detached | 6,113 (80.4%) | 1,489 (19.6%) |
| Single Unit, Attached | 81 (32.0%) | 172 (68.0%) |
| 2 Unit Apartments | 4 (4.4%) | 87 (95.6%) |
| 3 or 4 Unit Apartments | 0 (0.0%) | 142 (100.0%) |
| 5 to 9 Unit Apartments | 0 (0.0%) | 156 (100.0%) |
| 10 or more Apartments | 3 (2.5%) | 118 (97.5%) |
| Mobile Home / Other | 499 (50.6%) | 487 (49.4%) |
| Total | 6,700 (71.7%) | 2,651 (28.3%) |
Housing Structures by Number of Rooms in Page County
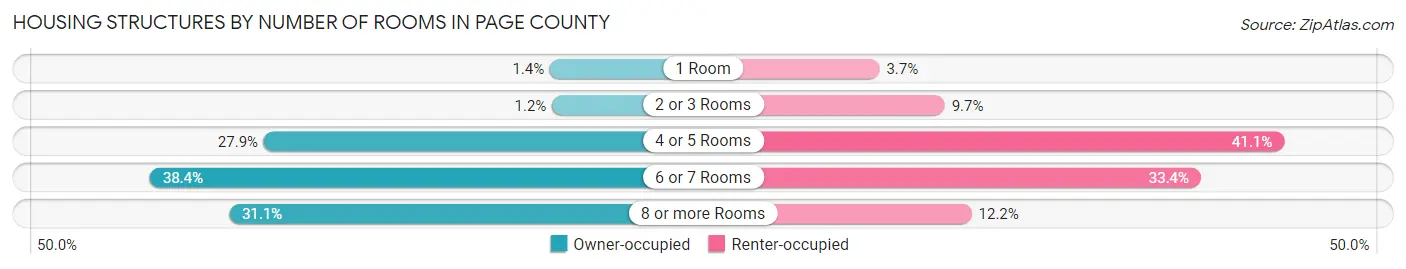
| Number of Rooms | Owner-occupied | Renter-occupied |
| 1 Room | 94 (1.4%) | 97 (3.7%) |
| 2 or 3 Rooms | 81 (1.2%) | 257 (9.7%) |
| 4 or 5 Rooms | 1,867 (27.9%) | 1,089 (41.1%) |
| 6 or 7 Rooms | 2,574 (38.4%) | 885 (33.4%) |
| 8 or more Rooms | 2,084 (31.1%) | 323 (12.2%) |
| Total | 6,700 (100.0%) | 2,651 (100.0%) |
Housing Structure by Heating Type in Page County
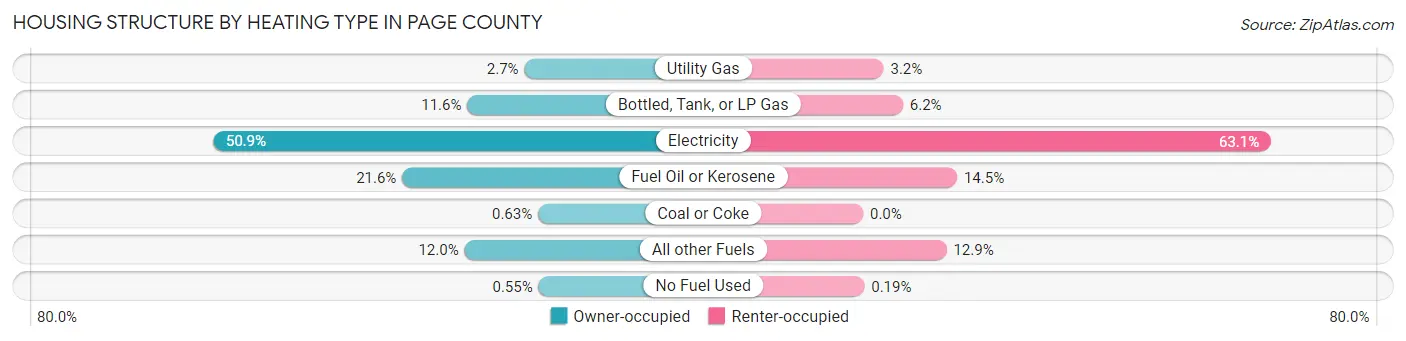
| Heating Type | Owner-occupied | Renter-occupied |
| Utility Gas | 183 (2.7%) | 84 (3.2%) |
| Bottled, Tank, or LP Gas | 775 (11.6%) | 163 (6.1%) |
| Electricity | 3,410 (50.9%) | 1,672 (63.1%) |
| Fuel Oil or Kerosene | 1,449 (21.6%) | 385 (14.5%) |
| Coal or Coke | 42 (0.6%) | 0 (0.0%) |
| All other Fuels | 804 (12.0%) | 342 (12.9%) |
| No Fuel Used | 37 (0.5%) | 5 (0.2%) |
| Total | 6,700 (100.0%) | 2,651 (100.0%) |
Household Vehicle Usage in Page County
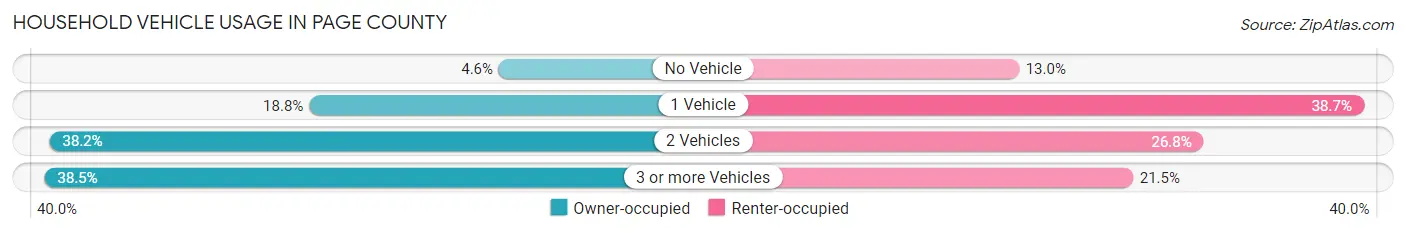
| Vehicles per Household | Owner-occupied | Renter-occupied |
| No Vehicle | 307 (4.6%) | 344 (13.0%) |
| 1 Vehicle | 1,256 (18.8%) | 1,027 (38.7%) |
| 2 Vehicles | 2,556 (38.2%) | 710 (26.8%) |
| 3 or more Vehicles | 2,581 (38.5%) | 570 (21.5%) |
| Total | 6,700 (100.0%) | 2,651 (100.0%) |
Real Estate & Mortgages in Page County
Real Estate and Mortgage Overview in Page County
| Characteristic | Without Mortgage | With Mortgage |
| Housing Units | 3,339 | 3,361 |
| Median Property Value | $176,900 | $216,300 |
| Median Household Income | $55,683 | $575 |
| Monthly Housing Costs | $442 | $173 |
| Real Estate Taxes | $1,463 | $110 |
Property Value by Mortgage Status in Page County
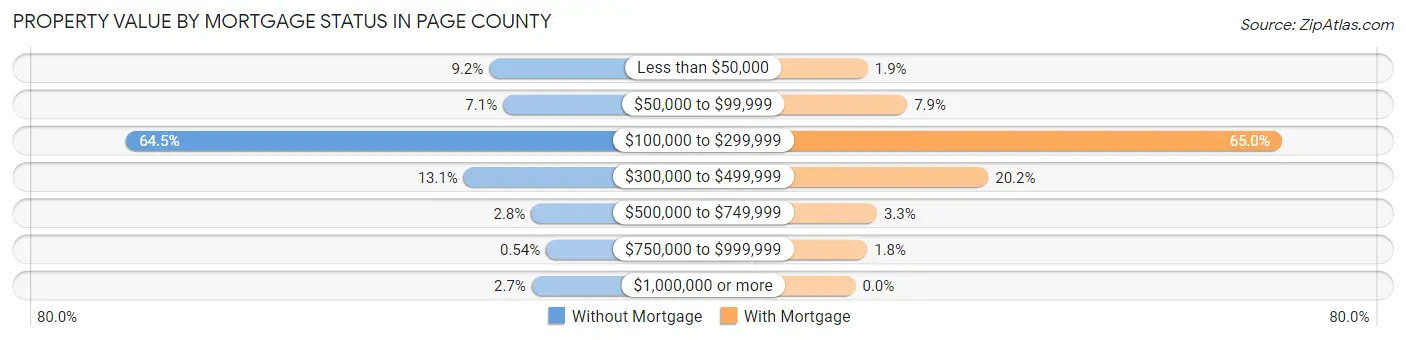
| Property Value | Without Mortgage | With Mortgage |
| Less than $50,000 | 308 (9.2%) | 63 (1.9%) |
| $50,000 to $99,999 | 237 (7.1%) | 265 (7.9%) |
| $100,000 to $299,999 | 2,154 (64.5%) | 2,183 (64.9%) |
| $300,000 to $499,999 | 437 (13.1%) | 680 (20.2%) |
| $500,000 to $749,999 | 94 (2.8%) | 110 (3.3%) |
| $750,000 to $999,999 | 18 (0.5%) | 60 (1.8%) |
| $1,000,000 or more | 91 (2.7%) | 0 (0.0%) |
| Total | 3,339 (100.0%) | 3,361 (100.0%) |
Household Income by Mortgage Status in Page County
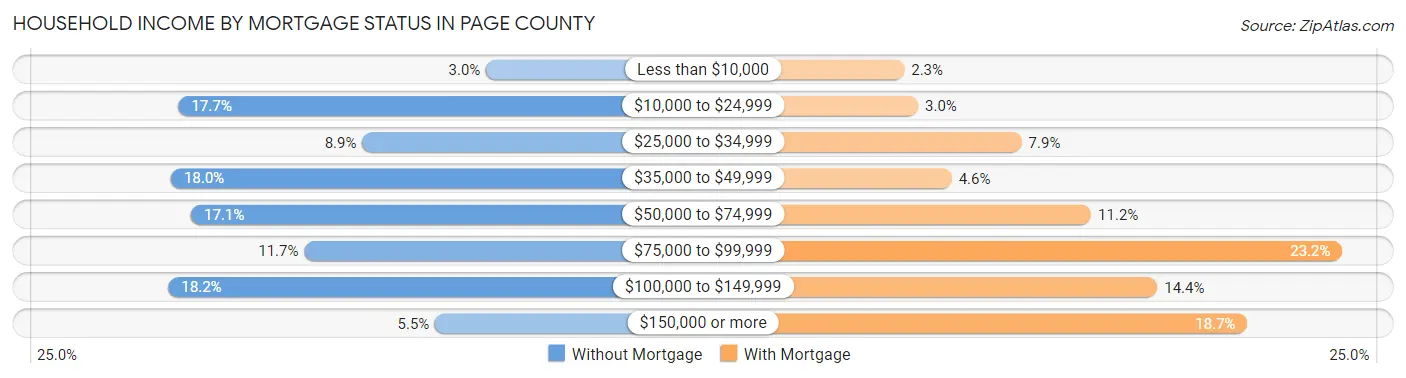
| Household Income | Without Mortgage | With Mortgage |
| Less than $10,000 | 101 (3.0%) | 78 (2.3%) |
| $10,000 to $24,999 | 590 (17.7%) | 100 (3.0%) |
| $25,000 to $34,999 | 298 (8.9%) | 266 (7.9%) |
| $35,000 to $49,999 | 602 (18.0%) | 154 (4.6%) |
| $50,000 to $74,999 | 570 (17.1%) | 377 (11.2%) |
| $75,000 to $99,999 | 390 (11.7%) | 779 (23.2%) |
| $100,000 to $149,999 | 606 (18.1%) | 483 (14.4%) |
| $150,000 or more | 182 (5.4%) | 627 (18.7%) |
| Total | 3,339 (100.0%) | 3,361 (100.0%) |
Property Value to Household Income Ratio in Page County
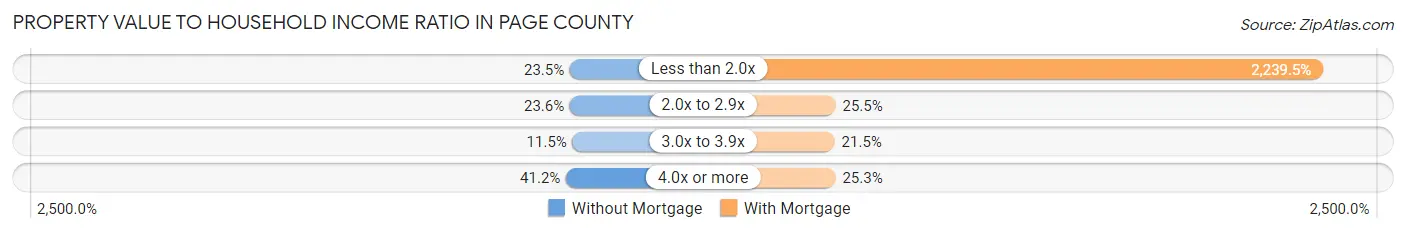
| Value-to-Income Ratio | Without Mortgage | With Mortgage |
| Less than 2.0x | 785 (23.5%) | 75,268 (2,239.5%) |
| 2.0x to 2.9x | 788 (23.6%) | 858 (25.5%) |
| 3.0x to 3.9x | 385 (11.5%) | 723 (21.5%) |
| 4.0x or more | 1,375 (41.2%) | 849 (25.3%) |
| Total | 3,339 (100.0%) | 3,361 (100.0%) |
Real Estate Taxes by Mortgage Status in Page County
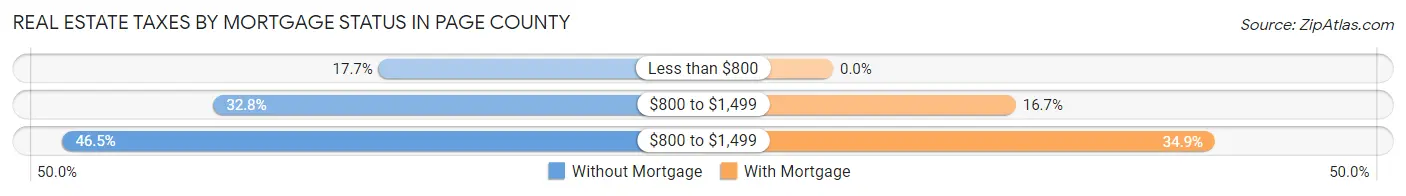
| Property Taxes | Without Mortgage | With Mortgage |
| Less than $800 | 590 (17.7%) | 0 (0.0%) |
| $800 to $1,499 | 1,094 (32.8%) | 561 (16.7%) |
| $800 to $1,499 | 1,554 (46.5%) | 1,172 (34.9%) |
| Total | 3,339 (100.0%) | 3,361 (100.0%) |
Health & Disability in Page County
Health Insurance Coverage by Age in Page County
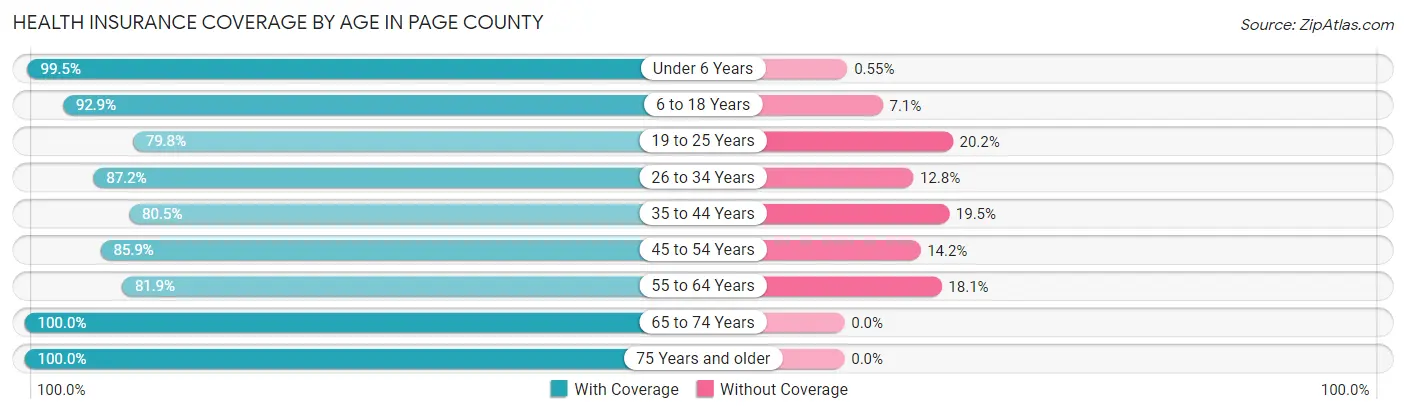
| Age Bracket | With Coverage | Without Coverage |
| Under 6 Years | 1,443 (99.5%) | 8 (0.5%) |
| 6 to 18 Years | 3,216 (92.9%) | 247 (7.1%) |
| 19 to 25 Years | 1,357 (79.8%) | 343 (20.2%) |
| 26 to 34 Years | 2,097 (87.2%) | 308 (12.8%) |
| 35 to 44 Years | 2,155 (80.5%) | 522 (19.5%) |
| 45 to 54 Years | 2,760 (85.9%) | 455 (14.1%) |
| 55 to 64 Years | 2,994 (81.9%) | 662 (18.1%) |
| 65 to 74 Years | 2,903 (100.0%) | 0 (0.0%) |
| 75 Years and older | 2,050 (100.0%) | 0 (0.0%) |
| Total | 20,975 (89.2%) | 2,545 (10.8%) |
Health Insurance Coverage by Citizenship Status in Page County
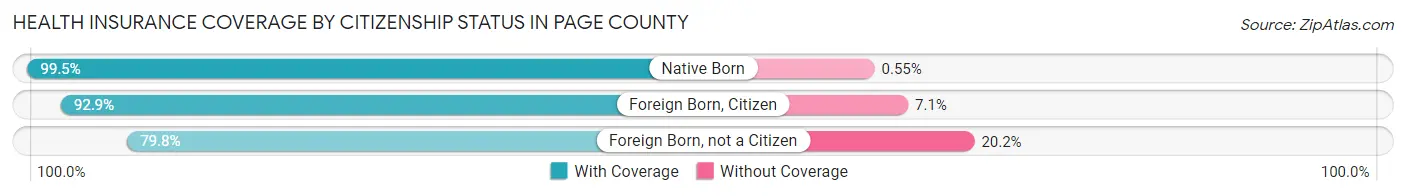
| Citizenship Status | With Coverage | Without Coverage |
| Native Born | 1,443 (99.5%) | 8 (0.5%) |
| Foreign Born, Citizen | 3,216 (92.9%) | 247 (7.1%) |
| Foreign Born, not a Citizen | 1,357 (79.8%) | 343 (20.2%) |
Health Insurance Coverage by Household Income in Page County
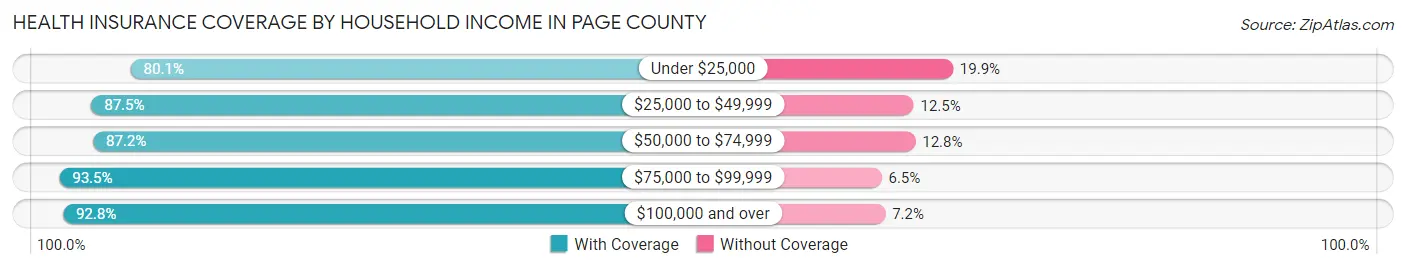
| Household Income | With Coverage | Without Coverage |
| Under $25,000 | 2,080 (80.1%) | 516 (19.9%) |
| $25,000 to $49,999 | 4,414 (87.5%) | 631 (12.5%) |
| $50,000 to $74,999 | 4,207 (87.2%) | 619 (12.8%) |
| $75,000 to $99,999 | 3,058 (93.5%) | 213 (6.5%) |
| $100,000 and over | 7,197 (92.8%) | 558 (7.2%) |
Public vs Private Health Insurance Coverage by Age in Page County
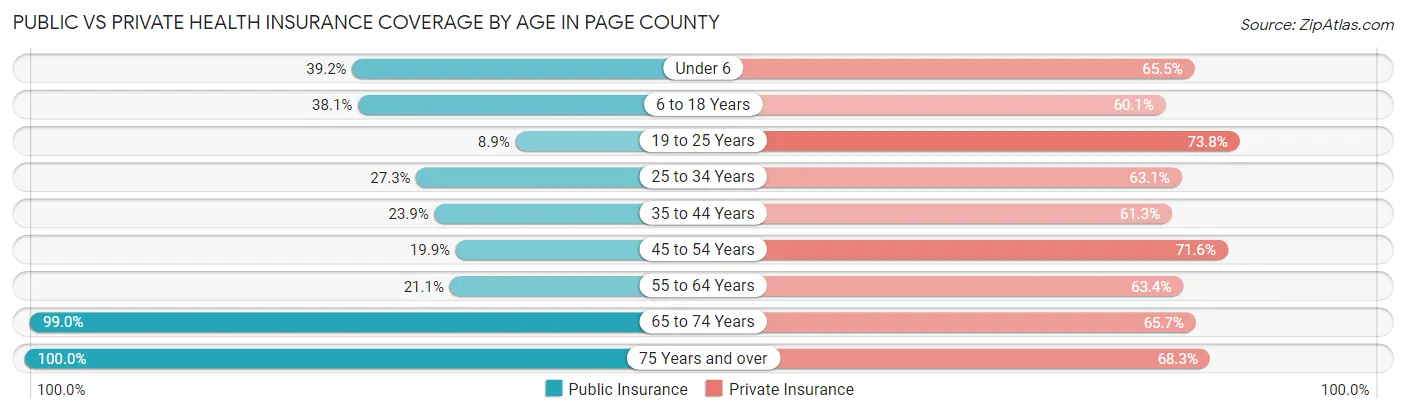
| Age Bracket | Public Insurance | Private Insurance |
| Under 6 | 568 (39.2%) | 950 (65.5%) |
| 6 to 18 Years | 1,319 (38.1%) | 2,082 (60.1%) |
| 19 to 25 Years | 151 (8.9%) | 1,255 (73.8%) |
| 25 to 34 Years | 656 (27.3%) | 1,517 (63.1%) |
| 35 to 44 Years | 640 (23.9%) | 1,641 (61.3%) |
| 45 to 54 Years | 641 (19.9%) | 2,303 (71.6%) |
| 55 to 64 Years | 771 (21.1%) | 2,317 (63.4%) |
| 65 to 74 Years | 2,873 (99.0%) | 1,907 (65.7%) |
| 75 Years and over | 2,050 (100.0%) | 1,400 (68.3%) |
| Total | 9,669 (41.1%) | 15,372 (65.4%) |
Disability Status by Sex by Age in Page County
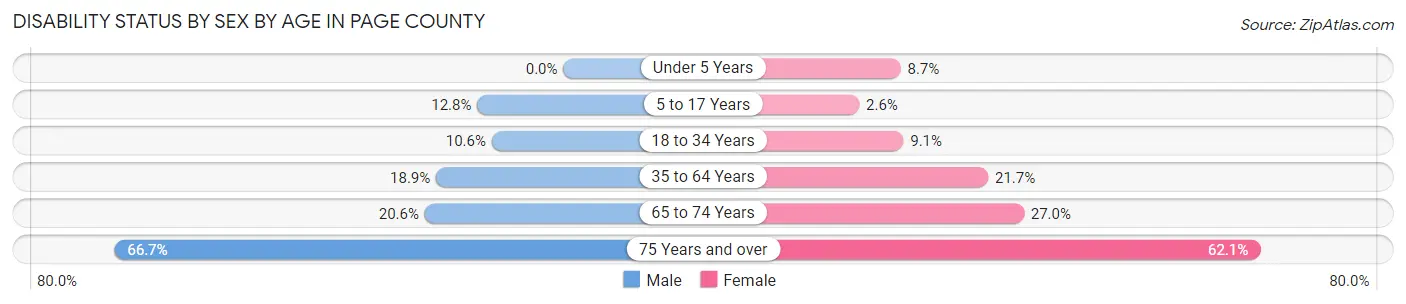
| Age Bracket | Male | Female |
| Under 5 Years | 0 (0.0%) | 51 (8.7%) |
| 5 to 17 Years | 238 (12.8%) | 43 (2.6%) |
| 18 to 34 Years | 236 (10.6%) | 188 (9.1%) |
| 35 to 64 Years | 914 (18.9%) | 1,023 (21.7%) |
| 65 to 74 Years | 295 (20.6%) | 397 (27.0%) |
| 75 Years and over | 598 (66.7%) | 716 (62.1%) |
Disability Class by Sex by Age in Page County
Disability Class: Hearing Difficulty
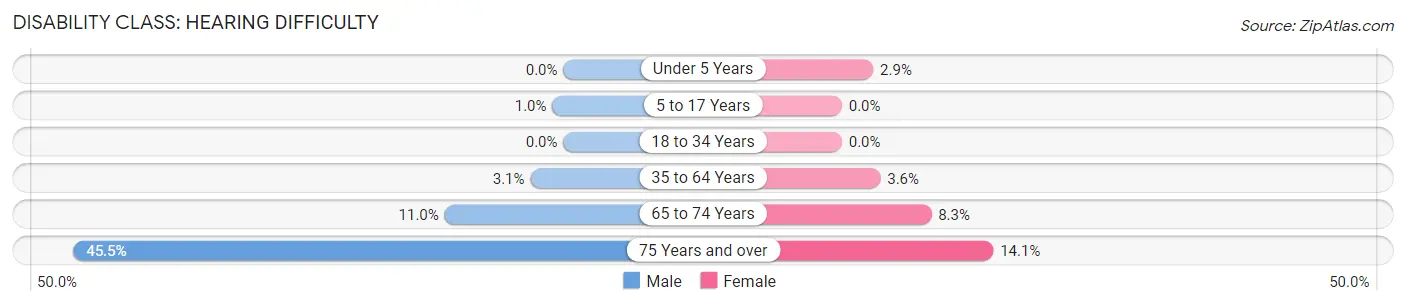
| Age Bracket | Male | Female |
| Under 5 Years | 0 (0.0%) | 17 (2.9%) |
| 5 to 17 Years | 19 (1.0%) | 0 (0.0%) |
| 18 to 34 Years | 0 (0.0%) | 0 (0.0%) |
| 35 to 64 Years | 148 (3.1%) | 168 (3.6%) |
| 65 to 74 Years | 158 (11.0%) | 122 (8.3%) |
| 75 Years and over | 408 (45.5%) | 162 (14.1%) |
Disability Class: Vision Difficulty
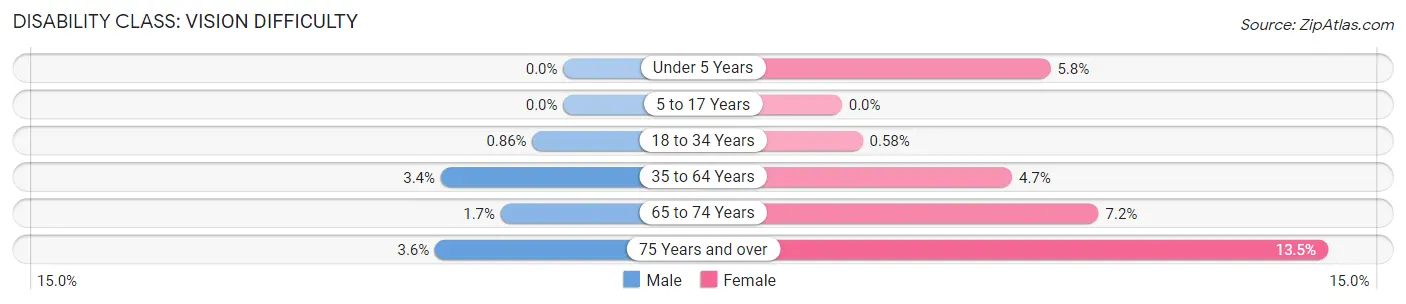
| Age Bracket | Male | Female |
| Under 5 Years | 0 (0.0%) | 34 (5.8%) |
| 5 to 17 Years | 0 (0.0%) | 0 (0.0%) |
| 18 to 34 Years | 19 (0.9%) | 12 (0.6%) |
| 35 to 64 Years | 165 (3.4%) | 223 (4.7%) |
| 65 to 74 Years | 25 (1.7%) | 105 (7.1%) |
| 75 Years and over | 32 (3.6%) | 156 (13.5%) |
Disability Class: Cognitive Difficulty
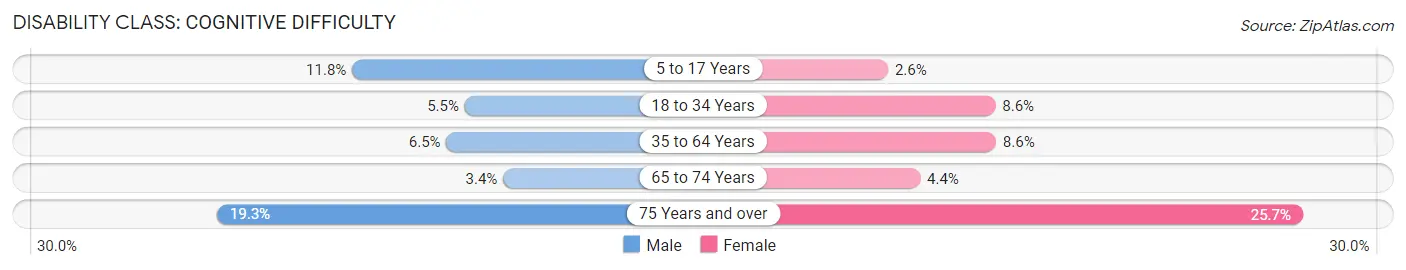
| Age Bracket | Male | Female |
| 5 to 17 Years | 219 (11.8%) | 43 (2.6%) |
| 18 to 34 Years | 122 (5.5%) | 176 (8.6%) |
| 35 to 64 Years | 315 (6.5%) | 404 (8.6%) |
| 65 to 74 Years | 48 (3.4%) | 64 (4.4%) |
| 75 Years and over | 173 (19.3%) | 296 (25.7%) |
Disability Class: Ambulatory Difficulty
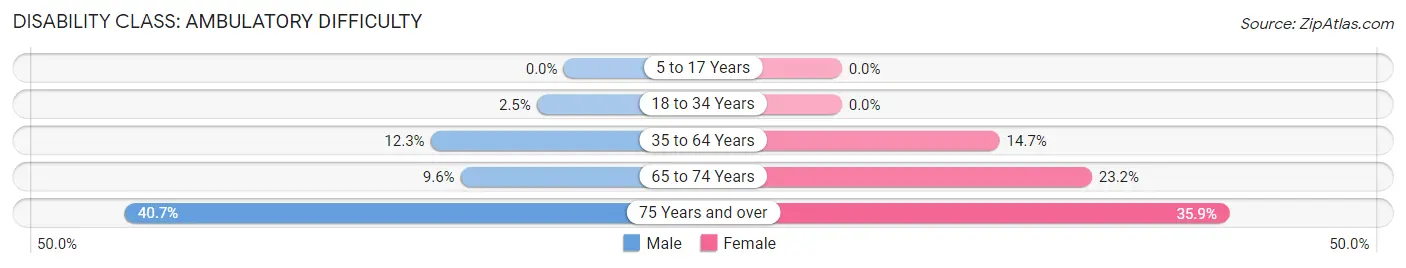
| Age Bracket | Male | Female |
| 5 to 17 Years | 0 (0.0%) | 0 (0.0%) |
| 18 to 34 Years | 55 (2.5%) | 0 (0.0%) |
| 35 to 64 Years | 597 (12.3%) | 690 (14.6%) |
| 65 to 74 Years | 137 (9.6%) | 341 (23.2%) |
| 75 Years and over | 365 (40.7%) | 414 (35.9%) |
Disability Class: Self-Care Difficulty
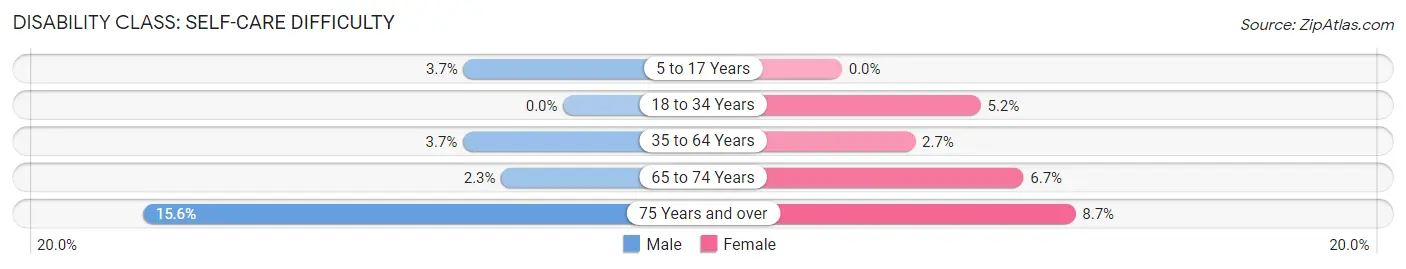
| Age Bracket | Male | Female |
| 5 to 17 Years | 69 (3.7%) | 0 (0.0%) |
| 18 to 34 Years | 0 (0.0%) | 106 (5.1%) |
| 35 to 64 Years | 180 (3.7%) | 128 (2.7%) |
| 65 to 74 Years | 33 (2.3%) | 99 (6.7%) |
| 75 Years and over | 140 (15.6%) | 100 (8.7%) |
Technology Access in Page County
Computing Device Access in Page County
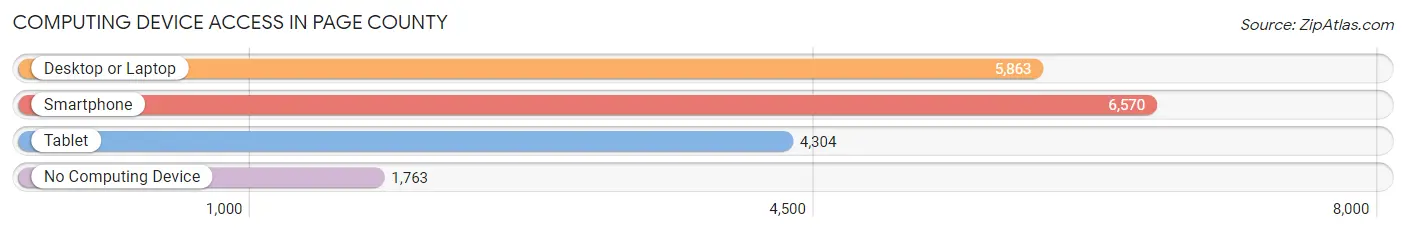
| Device Type | # Households | % Households |
| Desktop or Laptop | 5,863 | 62.7% |
| Smartphone | 6,570 | 70.3% |
| Tablet | 4,304 | 46.0% |
| No Computing Device | 1,763 | 18.9% |
| Total | 9,351 | 100.0% |
Internet Access in Page County
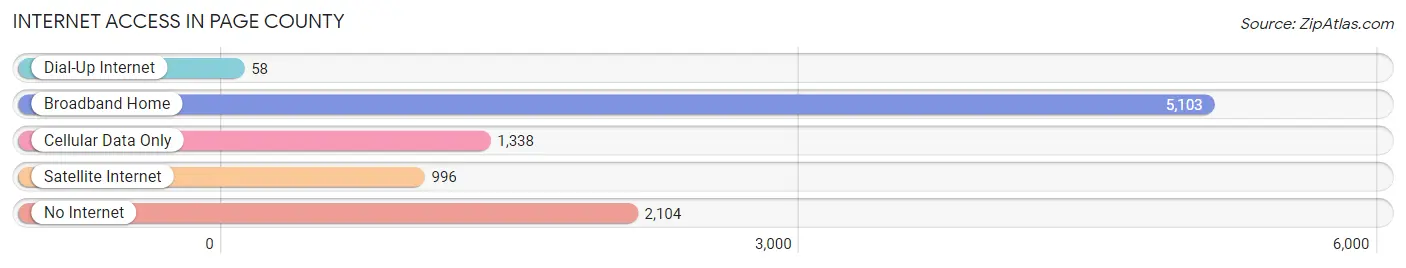
| Internet Type | # Households | % Households |
| Dial-Up Internet | 58 | 0.6% |
| Broadband Home | 5,103 | 54.6% |
| Cellular Data Only | 1,338 | 14.3% |
| Satellite Internet | 996 | 10.6% |
| No Internet | 2,104 | 22.5% |
| Total | 9,351 | 100.0% |
Page County Summary
Page County is a county located in the Commonwealth of Virginia. It is part of the Shenandoah Valley region and is bordered by the Blue Ridge Mountains to the east and the Allegheny Mountains to the west. The county seat is Luray, and the county was created in 1831 from part of Shenandoah County. As of the 2010 census, the population was 24,042.
History
Page County was formed in 1831 from part of Shenandoah County. It was named for John Page, a Virginia governor from 1776 to 1779. The county was originally part of the Shenandoah Valley, and was home to many Native American tribes, including the Iroquois, Shawnee, and Cherokee.
The county was the site of several Civil War battles, including the Battle of New Market in 1864. The county was also the site of the Luray Caverns, which were discovered in 1878.
Geography
Page County is located in the Shenandoah Valley region of Virginia. It is bordered by the Blue Ridge Mountains to the east and the Allegheny Mountains to the west. The county is home to the Shenandoah National Park, which covers part of the Blue Ridge Mountains. The county is also home to the Luray Caverns, which are located in the western part of the county.
The county has a total area of 437 square miles, of which 434 square miles is land and 3 square miles is water. The county is drained by the Shenandoah River and its tributaries.
Economy
Page County is largely rural, with a strong agricultural base. The county is home to several large farms, including the Page Valley Farm, which is one of the largest in the state. The county is also home to several wineries, including the Luray Valley Winery and the Shenandoah Vineyards.
The county is also home to several manufacturing companies, including the Page County Furniture Company, which produces furniture for the home and office. The county is also home to several technology companies, including the Page County Technology Center, which provides technology services to businesses in the county.
Demographics
As of the 2010 census, there were 24,042 people, 9,845 households, and 6,945 families living in the county. The population density was 55.3 people per square mile. The racial makeup of the county was 94.3% White, 2.7% Black or African American, 0.3% Native American, 0.5% Asian, 0.1% Pacific Islander, 0.7% from other races, and 1.4% from two or more races.
The median income for a household in the county was $41,945, and the median income for a family was $50,945. The per capita income for the county was $20,945. About 10.3% of families and 13.2% of the population were below the poverty line, including 17.2% of those under age 18 and 11.2% of those age 65 or over.
Common Questions
What is Per Capita Income in Page County?
Per Capita income in Page County is $30,146.
What is the Median Family Income in Page County?
Median Family Income in Page County is $72,637.
What is the Median Household income in Page County?
Median Household Income in Page County is $56,760.
What is Income or Wage Gap in Page County?
Income or Wage Gap in Page County is 36.6%.
Women in Page County earn 63.4 cents for every dollar earned by a man.
What is Family Income Deficit in Page County?
Family Income Deficit in Page County is $7,707.
Families that are below poverty line in Page County earn $7,707 less on average than the poverty threshold level.
What is Inequality or Gini Index in Page County?
Inequality or Gini Index in Page County is 0.41.
What is the Total Population of Page County?
Total Population of Page County is 23,753.
What is the Total Male Population of Page County?
Total Male Population of Page County is 11,987.
What is the Total Female Population of Page County?
Total Female Population of Page County is 11,766.
What is the Ratio of Males per 100 Females in Page County?
There are 101.88 Males per 100 Females in Page County.
What is the Ratio of Females per 100 Males in Page County?
There are 98.16 Females per 100 Males in Page County.
What is the Median Population Age in Page County?
Median Population Age in Page County is 45.3 Years.
What is the Average Family Size in Page County
Average Family Size in Page County is 3.2 People.
What is the Average Household Size in Page County
Average Household Size in Page County is 2.5 People.
How Large is the Labor Force in Page County?
There are 11,508 People in the Labor Forcein in Page County.
What is the Percentage of People in the Labor Force in Page County?
58.9% of People are in the Labor Force in Page County.
What is the Unemployment Rate in Page County?
Unemployment Rate in Page County is 4.6%.