Nottoway County, VA Map & Demographics
Nottoway County Map
Nottoway County Overview
$27,223
PER CAPITA INCOME
$81,284
AVG FAMILY INCOME
$62,366
AVG HOUSEHOLD INCOME
20.4%
WAGE / INCOME GAP [ % ]
79.6¢/ $1
WAGE / INCOME GAP [ $ ]
$10,743
FAMILY INCOME DEFICIT
0.45
INEQUALITY / GINI INDEX
15,638
TOTAL POPULATION
8,295
MALE POPULATION
7,343
FEMALE POPULATION
112.96
MALES / 100 FEMALES
88.52
FEMALES / 100 MALES
41.3
MEDIAN AGE
3.0
AVG FAMILY SIZE
2.5
AVG HOUSEHOLD SIZE
6,486
LABOR FORCE [ PEOPLE ]
50.1%
PERCENT IN LABOR FORCE
6.4%
UNEMPLOYMENT RATE
Nottoway County Area Codes
Income in Nottoway County
Income Overview in Nottoway County
Per Capita Income in Nottoway County is $27,223, while median incomes of families and households are $81,284 and $62,366 respectively.
| Characteristic | Number | Measure |
| Per Capita Income | 15,638 | $27,223 |
| Median Family Income | 3,546 | $81,284 |
| Mean Family Income | 3,546 | $95,087 |
| Median Household Income | 5,415 | $62,366 |
| Mean Household Income | 5,415 | $78,347 |
| Income Deficit | 3,546 | $10,743 |
| Wage / Income Gap (%) | 15,638 | 20.44% |
| Wage / Income Gap ($) | 15,638 | 79.56¢ per $1 |
| Gini / Inequality Index | 15,638 | 0.45 |
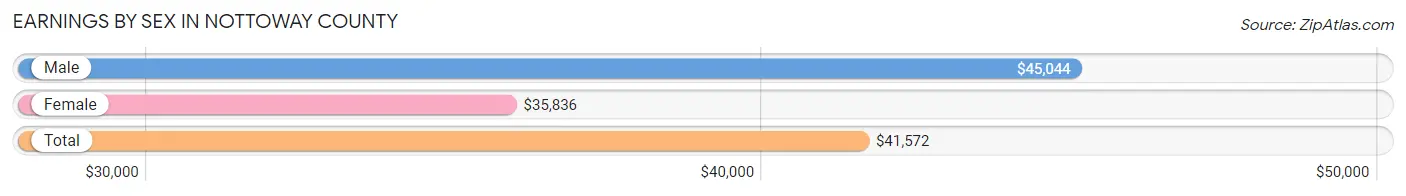
Earnings by Sex in Nottoway County
Average Earnings in Nottoway County are $41,572, $45,044 for men and $35,836 for women, a difference of 20.4%.
| Sex | Number | Average Earnings |
| Male | 3,146 (47.6%) | $45,044 |
| Female | 3,463 (52.4%) | $35,836 |
| Total | 6,609 (100.0%) | $41,572 |
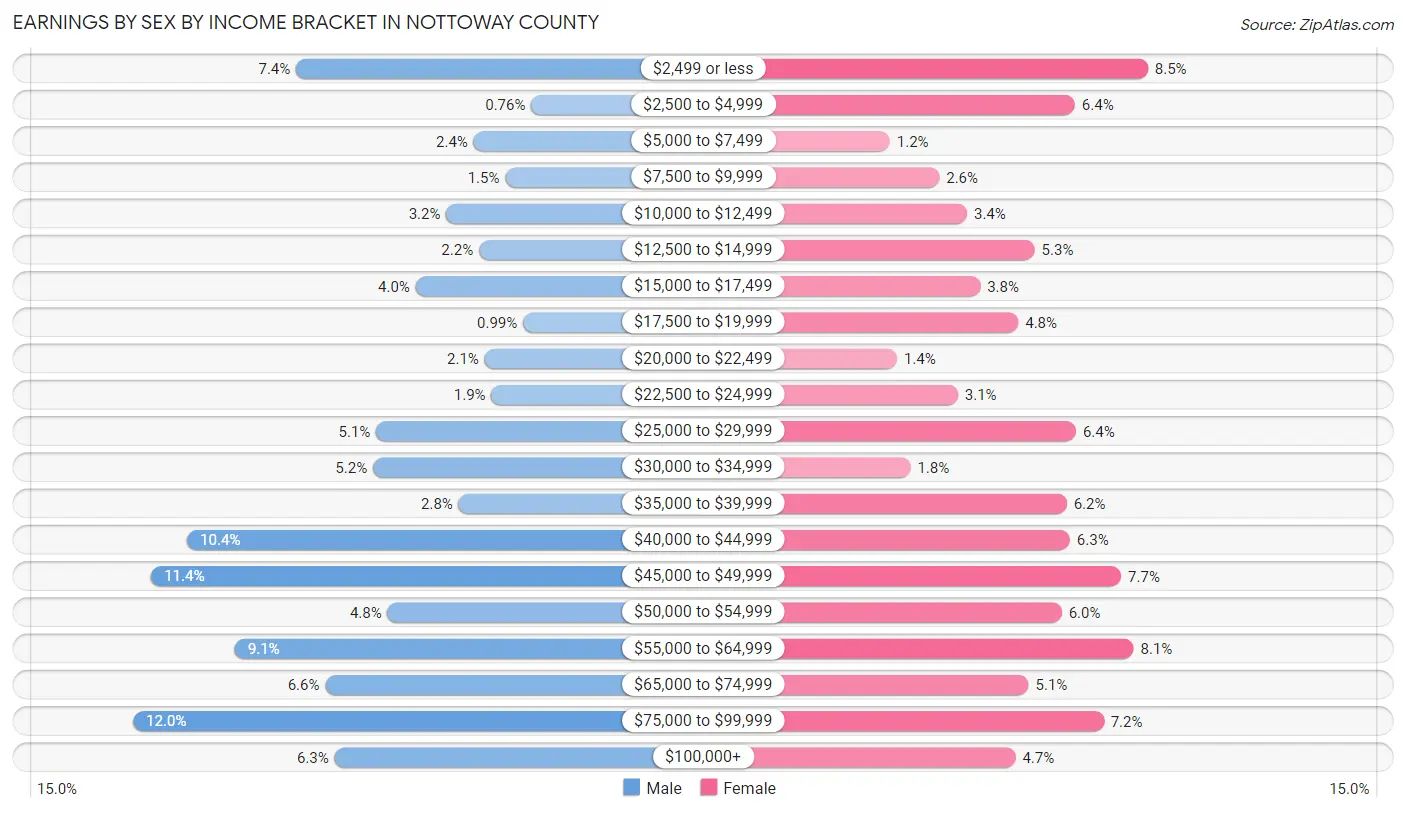
Earnings by Sex by Income Bracket in Nottoway County
The most common earnings brackets in Nottoway County are $75,000 to $99,999 for men (376 | 11.9%) and $2,499 or less for women (293 | 8.5%).
| Income | Male | Female |
| $2,499 or less | 232 (7.4%) | 293 (8.5%) |
| $2,500 to $4,999 | 24 (0.8%) | 222 (6.4%) |
| $5,000 to $7,499 | 75 (2.4%) | 42 (1.2%) |
| $7,500 to $9,999 | 47 (1.5%) | 90 (2.6%) |
| $10,000 to $12,499 | 99 (3.2%) | 117 (3.4%) |
| $12,500 to $14,999 | 70 (2.2%) | 183 (5.3%) |
| $15,000 to $17,499 | 126 (4.0%) | 130 (3.7%) |
| $17,500 to $19,999 | 31 (1.0%) | 167 (4.8%) |
| $20,000 to $22,499 | 65 (2.1%) | 49 (1.4%) |
| $22,500 to $24,999 | 59 (1.9%) | 108 (3.1%) |
| $25,000 to $29,999 | 161 (5.1%) | 223 (6.4%) |
| $30,000 to $34,999 | 164 (5.2%) | 62 (1.8%) |
| $35,000 to $39,999 | 88 (2.8%) | 214 (6.2%) |
| $40,000 to $44,999 | 328 (10.4%) | 217 (6.3%) |
| $45,000 to $49,999 | 360 (11.4%) | 267 (7.7%) |
| $50,000 to $54,999 | 151 (4.8%) | 209 (6.0%) |
| $55,000 to $64,999 | 286 (9.1%) | 279 (8.1%) |
| $65,000 to $74,999 | 206 (6.6%) | 177 (5.1%) |
| $75,000 to $99,999 | 376 (11.9%) | 250 (7.2%) |
| $100,000+ | 198 (6.3%) | 164 (4.7%) |
| Total | 3,146 (100.0%) | 3,463 (100.0%) |
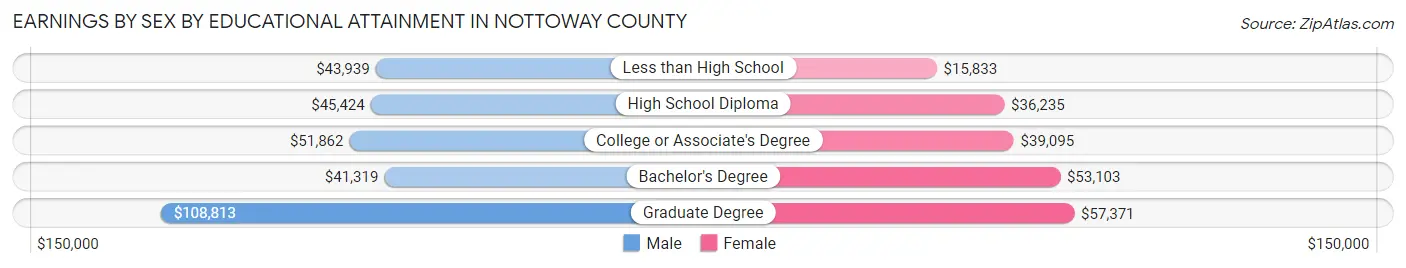
Earnings by Sex by Educational Attainment in Nottoway County
Average earnings in Nottoway County are $45,944 for men and $41,250 for women, a difference of 10.2%. Men with an educational attainment of graduate degree enjoy the highest average annual earnings of $108,813, while those with bachelor's degree education earn the least with $41,319. Women with an educational attainment of graduate degree earn the most with the average annual earnings of $57,371, while those with less than high school education have the smallest earnings of $15,833.
| Educational Attainment | Male Income | Female Income |
| Less than High School | $43,939 | $15,833 |
| High School Diploma | $45,424 | $36,235 |
| College or Associate's Degree | $51,862 | $39,095 |
| Bachelor's Degree | $41,319 | $53,103 |
| Graduate Degree | $108,813 | $57,371 |
| Total | $45,944 | $41,250 |
Family Income in Nottoway County
Family Income Brackets in Nottoway County
According to the Nottoway County family income data, there are 1,046 families falling into the $100,000 to $149,999 income range, which is the most common income bracket and makes up 29.5% of all families. Conversely, the $200,000+ income bracket is the least frequent group with only 78 families (2.2%) belonging to this category.
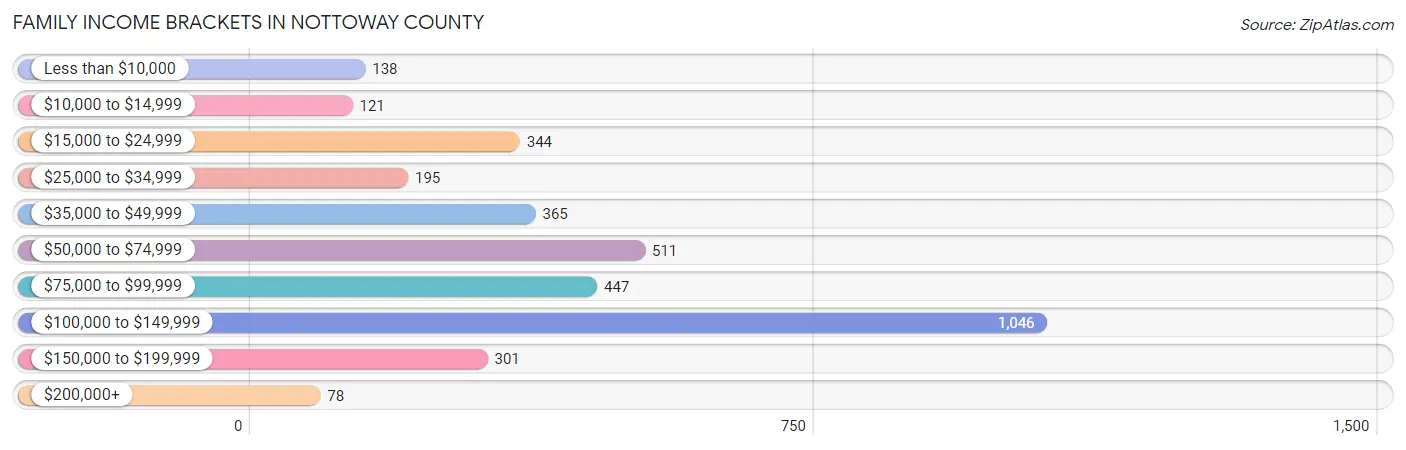
| Income Bracket | # Families | % Families |
| Less than $10,000 | 138 | 3.9% |
| $10,000 to $14,999 | 121 | 3.4% |
| $15,000 to $24,999 | 344 | 9.7% |
| $25,000 to $34,999 | 195 | 5.5% |
| $35,000 to $49,999 | 365 | 10.3% |
| $50,000 to $74,999 | 511 | 14.4% |
| $75,000 to $99,999 | 447 | 12.6% |
| $100,000 to $149,999 | 1,046 | 29.5% |
| $150,000 to $199,999 | 301 | 8.5% |
| $200,000+ | 78 | 2.2% |
Family Income by Famaliy Size in Nottoway County
4-person families (600 | 16.9%) account for the highest median family income in Nottoway County with $113,403 per family, while 2-person families (1,773 | 50.0%) have the highest median income of $34,618 per family member.
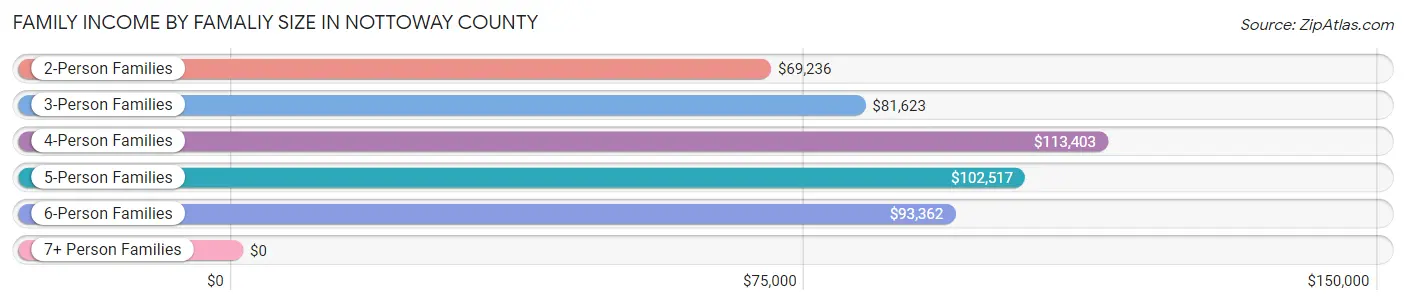
| Income Bracket | # Families | Median Income |
| 2-Person Families | 1,773 (50.0%) | $69,236 |
| 3-Person Families | 762 (21.5%) | $81,623 |
| 4-Person Families | 600 (16.9%) | $113,403 |
| 5-Person Families | 241 (6.8%) | $102,517 |
| 6-Person Families | 156 (4.4%) | $93,362 |
| 7+ Person Families | 14 (0.4%) | $0 |
| Total | 3,546 (100.0%) | $81,284 |
Family Income by Number of Earners in Nottoway County
The median family income in Nottoway County is $81,284, with families comprising 3+ earners (377) having the highest median family income of $148,364, while families with no earners (721) have the lowest median family income of $38,958, accounting for 10.6% and 20.3% of families, respectively.
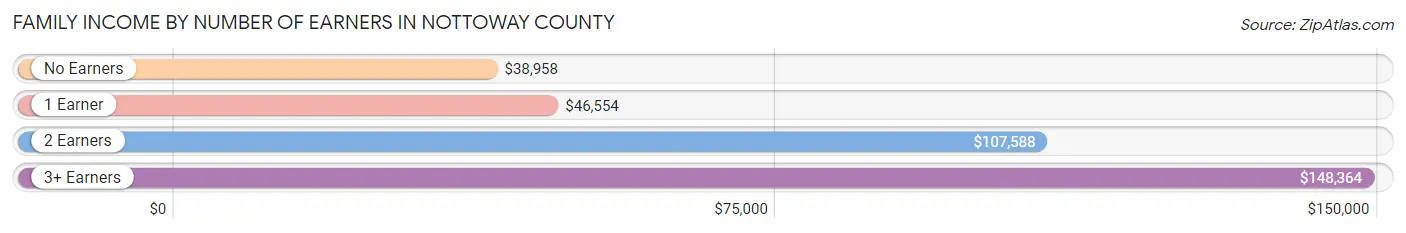
| Number of Earners | # Families | Median Income |
| No Earners | 721 (20.3%) | $38,958 |
| 1 Earner | 1,186 (33.5%) | $46,554 |
| 2 Earners | 1,262 (35.6%) | $107,588 |
| 3+ Earners | 377 (10.6%) | $148,364 |
| Total | 3,546 (100.0%) | $81,284 |
Household Income in Nottoway County
Household Income Brackets in Nottoway County
With 1,121 households falling in the category, the $100,000 to $149,999 income range is the most frequent in Nottoway County, accounting for 20.7% of all households. In contrast, only 87 households (1.6%) fall into the $200,000+ income bracket, making it the least populous group.
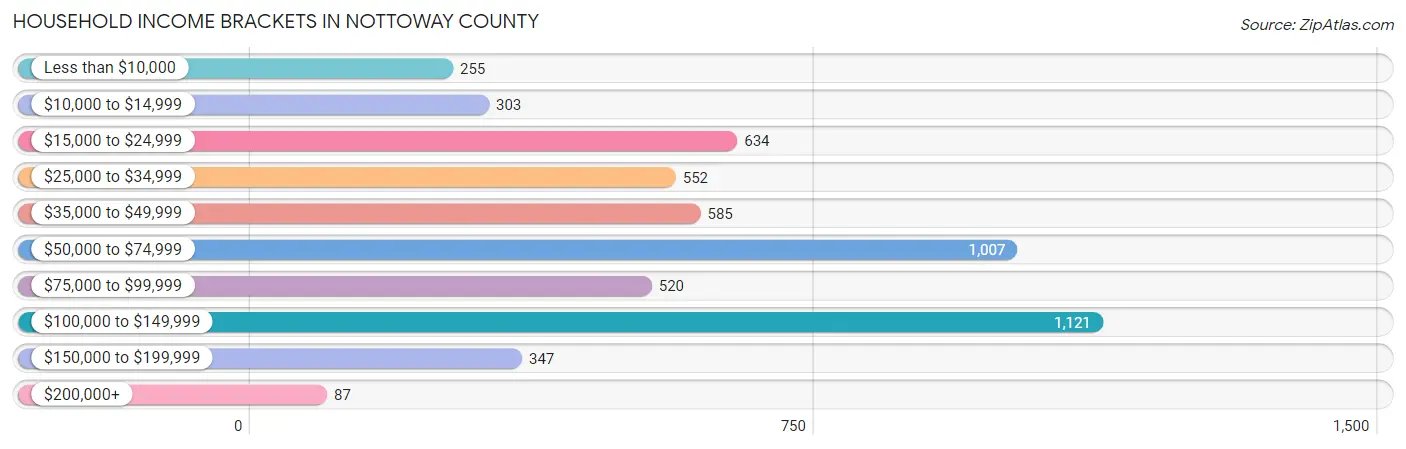
| Income Bracket | # Households | % Households |
| Less than $10,000 | 255 | 4.7% |
| $10,000 to $14,999 | 303 | 5.6% |
| $15,000 to $24,999 | 634 | 11.7% |
| $25,000 to $34,999 | 552 | 10.2% |
| $35,000 to $49,999 | 585 | 10.8% |
| $50,000 to $74,999 | 1,007 | 18.6% |
| $75,000 to $99,999 | 520 | 9.6% |
| $100,000 to $149,999 | 1,121 | 20.7% |
| $150,000 to $199,999 | 347 | 6.4% |
| $200,000+ | 87 | 1.6% |
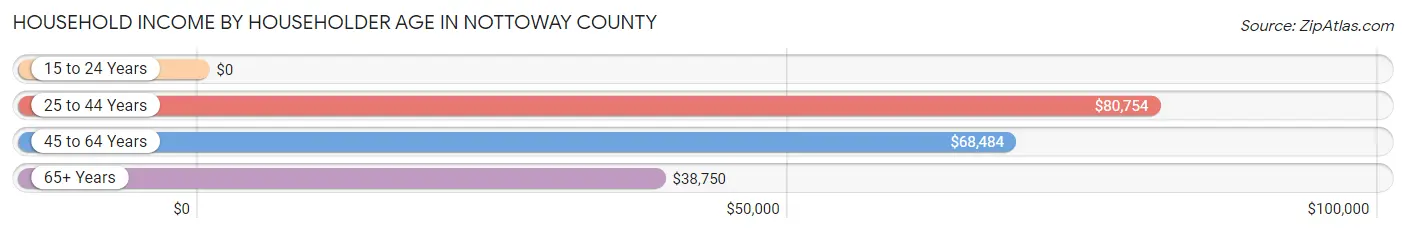
Household Income by Householder Age in Nottoway County
The median household income in Nottoway County is $62,366, with the highest median household income of $80,754 found in the 25 to 44 years age bracket for the primary householder. A total of 1,322 households (24.4%) fall into this category. Meanwhile, the 15 to 24 years age bracket for the primary householder has the lowest median household income of $0, with 298 households (5.5%) in this group.
| Income Bracket | # Households | Median Income |
| 15 to 24 Years | 298 (5.5%) | $0 |
| 25 to 44 Years | 1,322 (24.4%) | $80,754 |
| 45 to 64 Years | 2,065 (38.1%) | $68,484 |
| 65+ Years | 1,730 (32.0%) | $38,750 |
| Total | 5,415 (100.0%) | $62,366 |
Poverty in Nottoway County
Income Below Poverty by Sex and Age in Nottoway County
With 19.4% poverty level for males and 18.9% for females among the residents of Nottoway County, under 5 year old males and 18 to 24 year old females are the most vulnerable to poverty, with 175 males (45.1%) and 240 females (34.9%) in their respective age groups living below the poverty level.
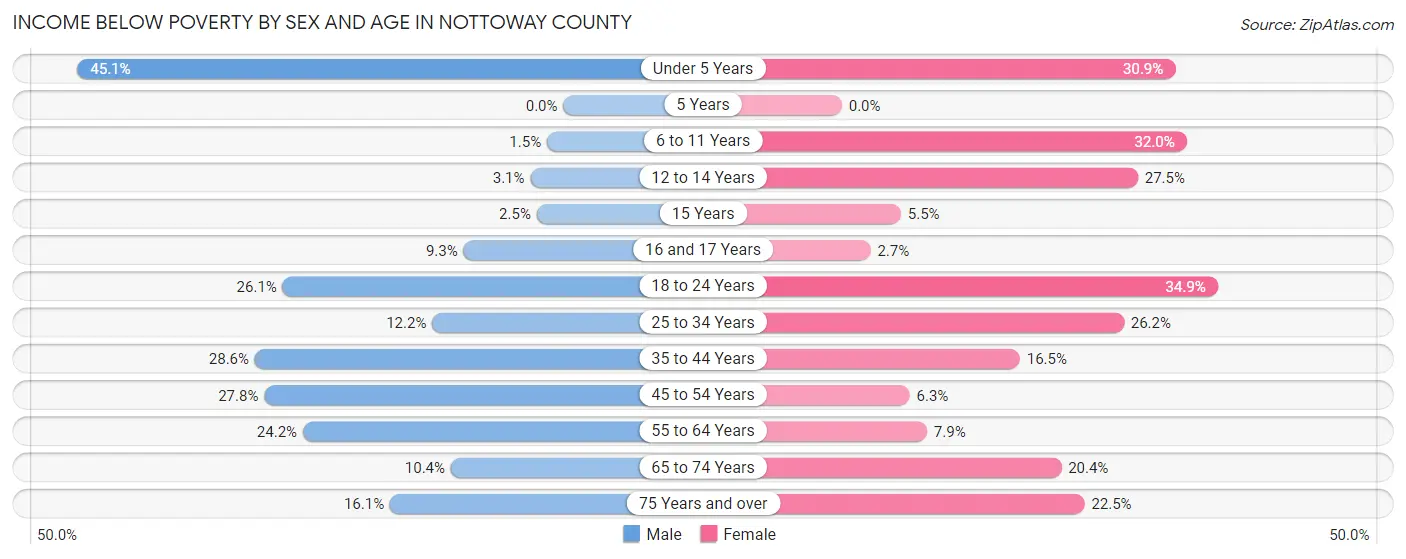
| Age Bracket | Male | Female |
| Under 5 Years | 175 (45.1%) | 120 (30.9%) |
| 5 Years | 0 (0.0%) | 0 (0.0%) |
| 6 to 11 Years | 8 (1.5%) | 136 (32.0%) |
| 12 to 14 Years | 6 (3.1%) | 75 (27.5%) |
| 15 Years | 2 (2.5%) | 8 (5.5%) |
| 16 and 17 Years | 10 (9.3%) | 7 (2.7%) |
| 18 to 24 Years | 143 (26.1%) | 240 (34.9%) |
| 25 to 34 Years | 129 (12.2%) | 185 (26.2%) |
| 35 to 44 Years | 195 (28.6%) | 134 (16.5%) |
| 45 to 54 Years | 264 (27.8%) | 48 (6.3%) |
| 55 to 64 Years | 233 (24.2%) | 86 (7.9%) |
| 65 to 74 Years | 81 (10.4%) | 170 (20.4%) |
| 75 Years and over | 56 (16.1%) | 141 (22.5%) |
| Total | 1,302 (19.4%) | 1,350 (18.9%) |
Income Above Poverty by Sex and Age in Nottoway County
According to the poverty statistics in Nottoway County, males aged 5 years and females aged 5 years are the age groups that are most secure financially, with 100.0% of males and 100.0% of females in these age groups living above the poverty line.
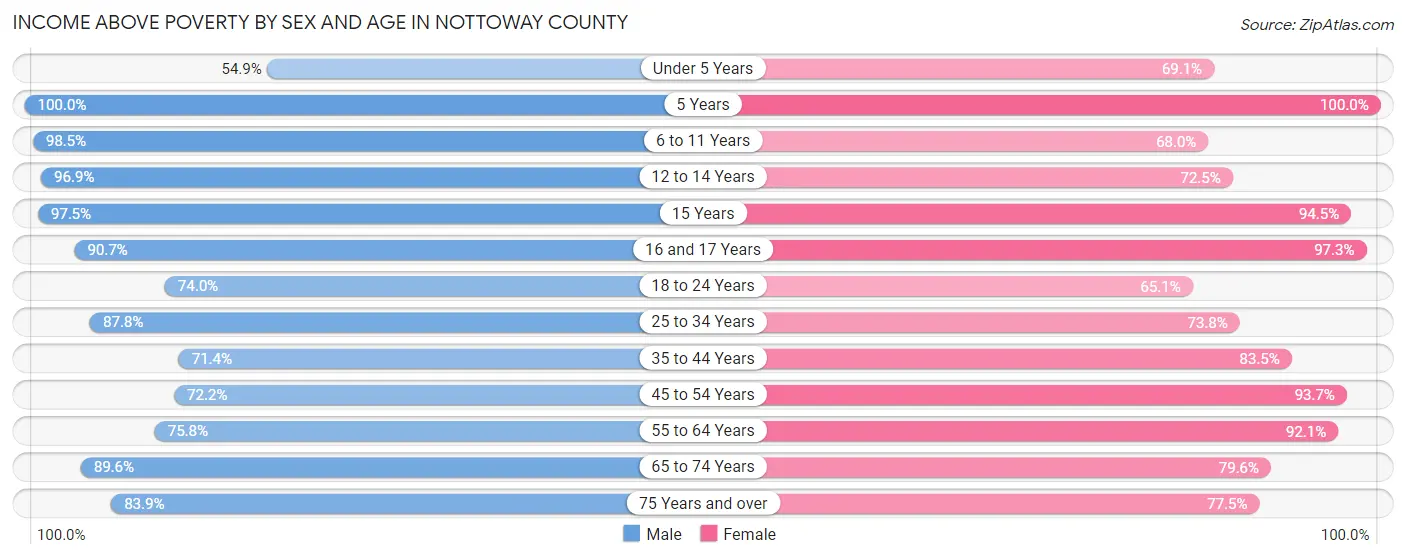
| Age Bracket | Male | Female |
| Under 5 Years | 213 (54.9%) | 268 (69.1%) |
| 5 Years | 98 (100.0%) | 145 (100.0%) |
| 6 to 11 Years | 520 (98.5%) | 289 (68.0%) |
| 12 to 14 Years | 190 (96.9%) | 198 (72.5%) |
| 15 Years | 79 (97.5%) | 138 (94.5%) |
| 16 and 17 Years | 98 (90.7%) | 256 (97.3%) |
| 18 to 24 Years | 406 (74.0%) | 448 (65.1%) |
| 25 to 34 Years | 931 (87.8%) | 522 (73.8%) |
| 35 to 44 Years | 486 (71.4%) | 677 (83.5%) |
| 45 to 54 Years | 687 (72.2%) | 715 (93.7%) |
| 55 to 64 Years | 731 (75.8%) | 1,003 (92.1%) |
| 65 to 74 Years | 695 (89.6%) | 665 (79.6%) |
| 75 Years and over | 292 (83.9%) | 485 (77.5%) |
| Total | 5,426 (80.6%) | 5,809 (81.1%) |
Income Below Poverty Among Married-Couple Families in Nottoway County
The poverty statistics for married-couple families in Nottoway County show that 5.9% or 142 of the total 2,390 families live below the poverty line. Families with 1 or 2 children have the highest poverty rate of 8.2%, comprising of 59 families. On the other hand, families with 5 or more children have the lowest poverty rate of 0.0%, which includes 0 families.
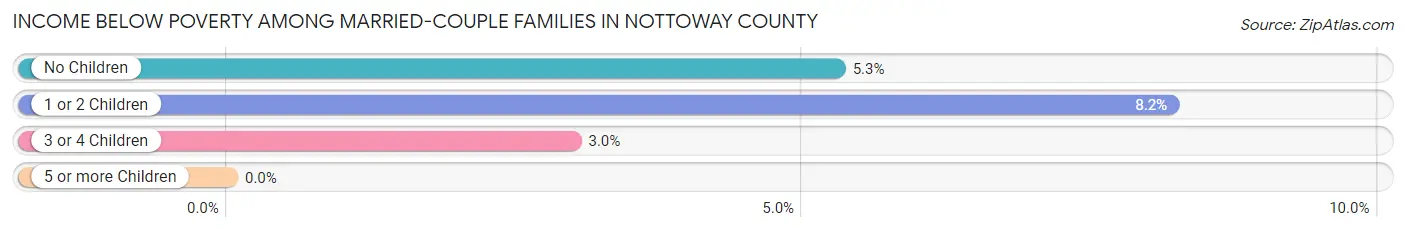
| Children | Above Poverty | Below Poverty |
| No Children | 1,379 (94.7%) | 77 (5.3%) |
| 1 or 2 Children | 661 (91.8%) | 59 (8.2%) |
| 3 or 4 Children | 195 (97.0%) | 6 (3.0%) |
| 5 or more Children | 13 (100.0%) | 0 (0.0%) |
| Total | 2,248 (94.1%) | 142 (5.9%) |
Income Below Poverty Among Single-Parent Households in Nottoway County
According to the poverty data in Nottoway County, 2.0% or 6 single-father households and 34.3% or 293 single-mother households are living below the poverty line. Among single-father households, those with 3 or 4 children have the highest poverty rate, with 2 households (50.0%) experiencing poverty. Likewise, among single-mother households, those with 3 or 4 children have the highest poverty rate, with 138 households (64.2%) falling below the poverty line.
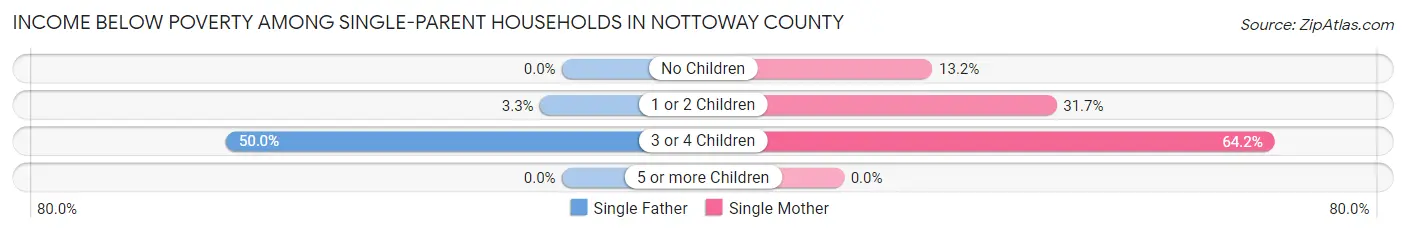
| Children | Single Father | Single Mother |
| No Children | 0 (0.0%) | 34 (13.2%) |
| 1 or 2 Children | 4 (3.3%) | 121 (31.7%) |
| 3 or 4 Children | 2 (50.0%) | 138 (64.2%) |
| 5 or more Children | 0 (0.0%) | 0 (0.0%) |
| Total | 6 (2.0%) | 293 (34.3%) |
Income Below Poverty Among Married-Couple vs Single-Parent Households in Nottoway County
The poverty data for Nottoway County shows that 142 of the married-couple family households (5.9%) and 299 of the single-parent households (25.9%) are living below the poverty level. Within the married-couple family households, those with 1 or 2 children have the highest poverty rate, with 59 households (8.2%) falling below the poverty line. Among the single-parent households, those with 3 or 4 children have the highest poverty rate, with 140 household (63.9%) living below poverty.
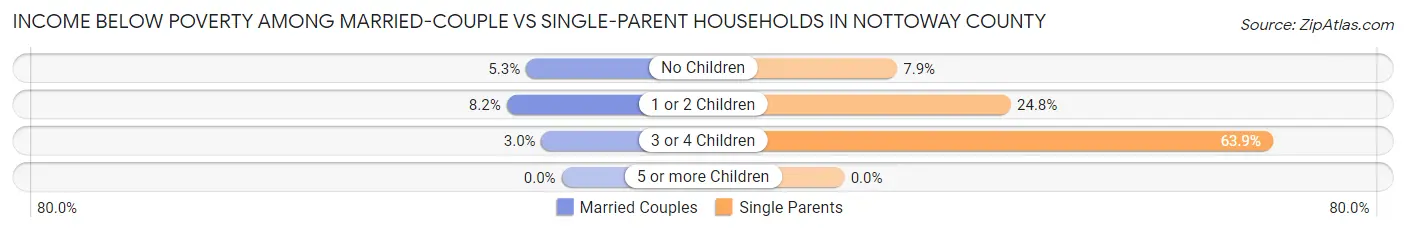
| Children | Married-Couple Families | Single-Parent Households |
| No Children | 77 (5.3%) | 34 (7.9%) |
| 1 or 2 Children | 59 (8.2%) | 125 (24.8%) |
| 3 or 4 Children | 6 (3.0%) | 140 (63.9%) |
| 5 or more Children | 0 (0.0%) | 0 (0.0%) |
| Total | 142 (5.9%) | 299 (25.9%) |
Race in Nottoway County
The most populous races in Nottoway County are White / Caucasian (8,770 | 56.1%), Black / African American (5,955 | 38.1%), and Hispanic or Latino (783 | 5.0%).
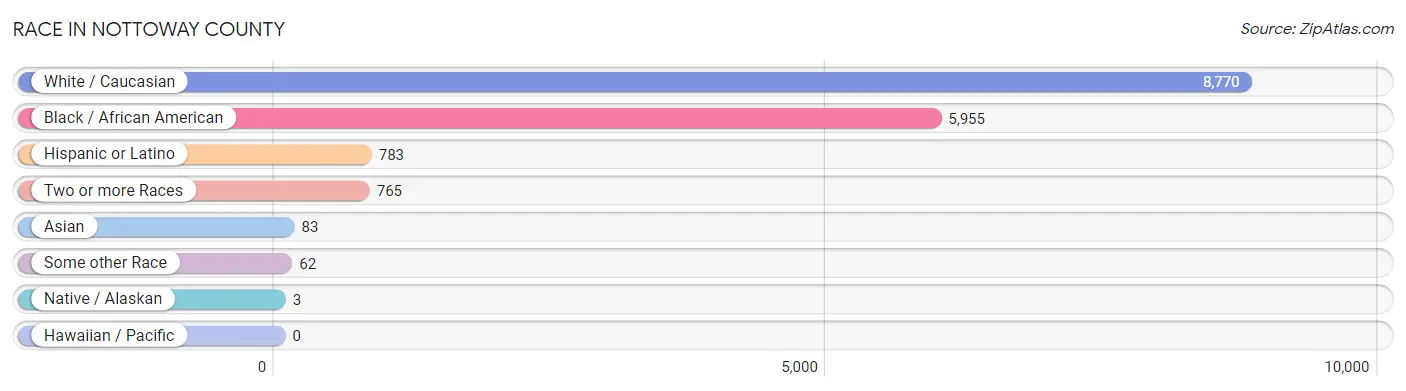
| Race | # Population | % Population |
| Asian | 83 | 0.5% |
| Black / African American | 5,955 | 38.1% |
| Hawaiian / Pacific | 0 | 0.0% |
| Hispanic or Latino | 783 | 5.0% |
| Native / Alaskan | 3 | 0.0% |
| White / Caucasian | 8,770 | 56.1% |
| Two or more Races | 765 | 4.9% |
| Some other Race | 62 | 0.4% |
| Total | 15,638 | 100.0% |
Ancestry in Nottoway County
The most populous ancestries reported in Nottoway County are American (3,917 | 25.1%), English (1,042 | 6.7%), German (700 | 4.5%), Irish (638 | 4.1%), and Subsaharan African (375 | 2.4%), together accounting for 42.7% of all Nottoway County residents.
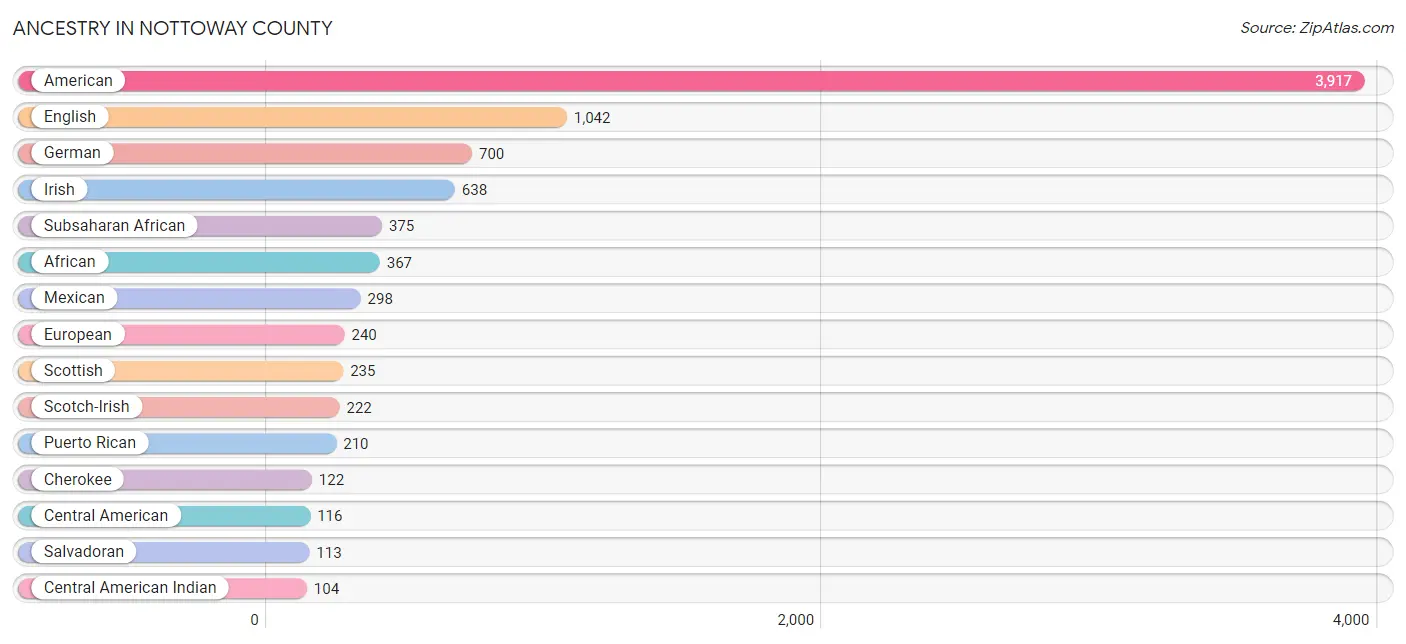
| Ancestry | # Population | % Population |
| African | 367 | 2.4% |
| Albanian | 3 | 0.0% |
| American | 3,917 | 25.1% |
| Arab | 4 | 0.0% |
| Austrian | 59 | 0.4% |
| British | 18 | 0.1% |
| Burmese | 6 | 0.0% |
| Central American | 116 | 0.7% |
| Central American Indian | 104 | 0.7% |
| Cherokee | 122 | 0.8% |
| Chilean | 7 | 0.0% |
| Chippewa | 75 | 0.5% |
| Cuban | 11 | 0.1% |
| Dominican | 20 | 0.1% |
| Dutch | 5 | 0.0% |
| English | 1,042 | 6.7% |
| Ethiopian | 8 | 0.1% |
| European | 240 | 1.5% |
| French | 72 | 0.5% |
| French Canadian | 2 | 0.0% |
| German | 700 | 4.5% |
| Greek | 31 | 0.2% |
| Guyanese | 11 | 0.1% |
| Haitian | 9 | 0.1% |
| Hungarian | 2 | 0.0% |
| Indian (Asian) | 13 | 0.1% |
| Irish | 638 | 4.1% |
| Italian | 42 | 0.3% |
| Korean | 1 | 0.0% |
| Lithuanian | 8 | 0.1% |
| Mexican | 298 | 1.9% |
| Moroccan | 4 | 0.0% |
| Northern European | 6 | 0.0% |
| Norwegian | 13 | 0.1% |
| Panamanian | 3 | 0.0% |
| Peruvian | 16 | 0.1% |
| Polish | 5 | 0.0% |
| Puerto Rican | 210 | 1.3% |
| Salvadoran | 113 | 0.7% |
| Scotch-Irish | 222 | 1.4% |
| Scottish | 235 | 1.5% |
| Slovak | 43 | 0.3% |
| South American | 23 | 0.2% |
| Spanish | 78 | 0.5% |
| Subsaharan African | 375 | 2.4% |
| Swiss | 1 | 0.0% |
| Thai | 17 | 0.1% |
| Ukrainian | 12 | 0.1% |
| Welsh | 29 | 0.2% | View All 49 Rows |
Immigrants in Nottoway County
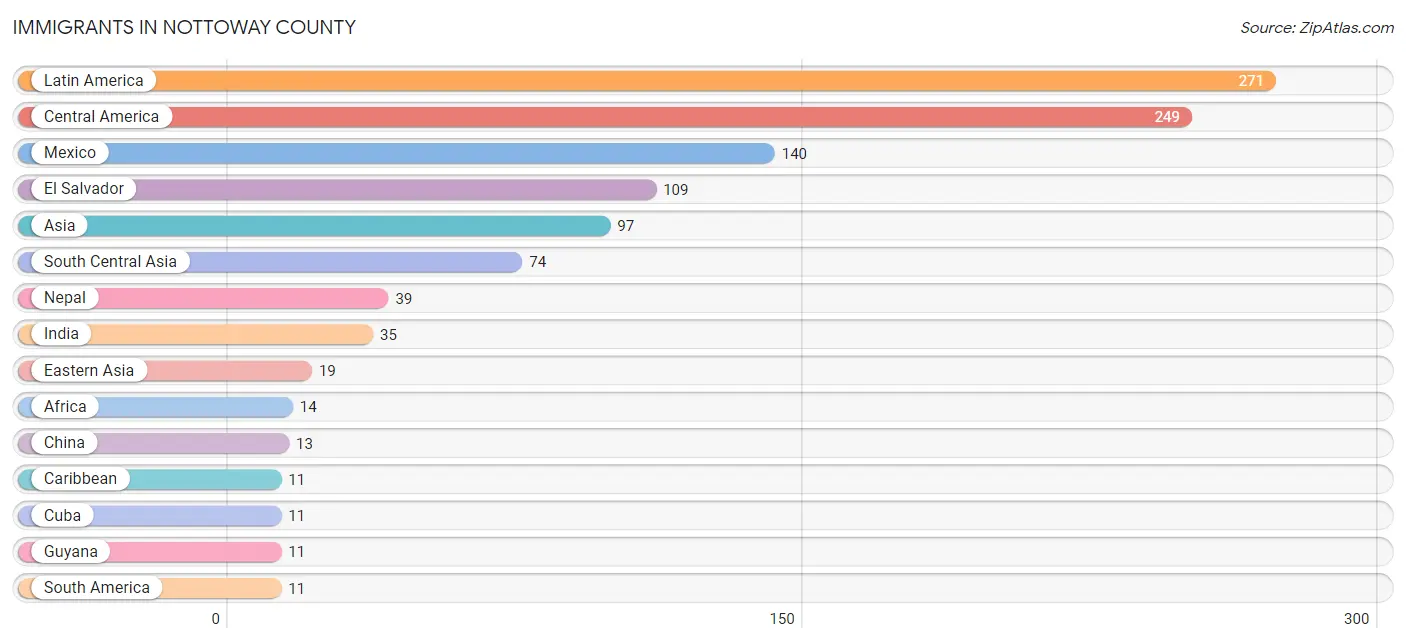
The most numerous immigrant groups reported in Nottoway County came from Latin America (271 | 1.7%), Central America (249 | 1.6%), Mexico (140 | 0.9%), El Salvador (109 | 0.7%), and Asia (97 | 0.6%), together accounting for 5.5% of all Nottoway County residents.
| Immigration Origin | # Population | % Population |
| Africa | 14 | 0.1% |
| Albania | 3 | 0.0% |
| Asia | 97 | 0.6% |
| Caribbean | 11 | 0.1% |
| Central America | 249 | 1.6% |
| China | 13 | 0.1% |
| Cuba | 11 | 0.1% |
| Eastern Africa | 8 | 0.1% |
| Eastern Asia | 19 | 0.1% |
| Eastern Europe | 3 | 0.0% |
| El Salvador | 109 | 0.7% |
| Ethiopia | 8 | 0.1% |
| Europe | 6 | 0.0% |
| Guyana | 11 | 0.1% |
| India | 35 | 0.2% |
| Iraq | 4 | 0.0% |
| Korea | 6 | 0.0% |
| Latin America | 271 | 1.7% |
| Mexico | 140 | 0.9% |
| Nepal | 39 | 0.3% |
| Northern Africa | 6 | 0.0% |
| Northern Europe | 3 | 0.0% |
| Norway | 3 | 0.0% |
| South America | 11 | 0.1% |
| South Central Asia | 74 | 0.5% |
| Sudan | 6 | 0.0% |
| Western Asia | 4 | 0.0% | View All 27 Rows |
Sex and Age in Nottoway County
Sex and Age in Nottoway County
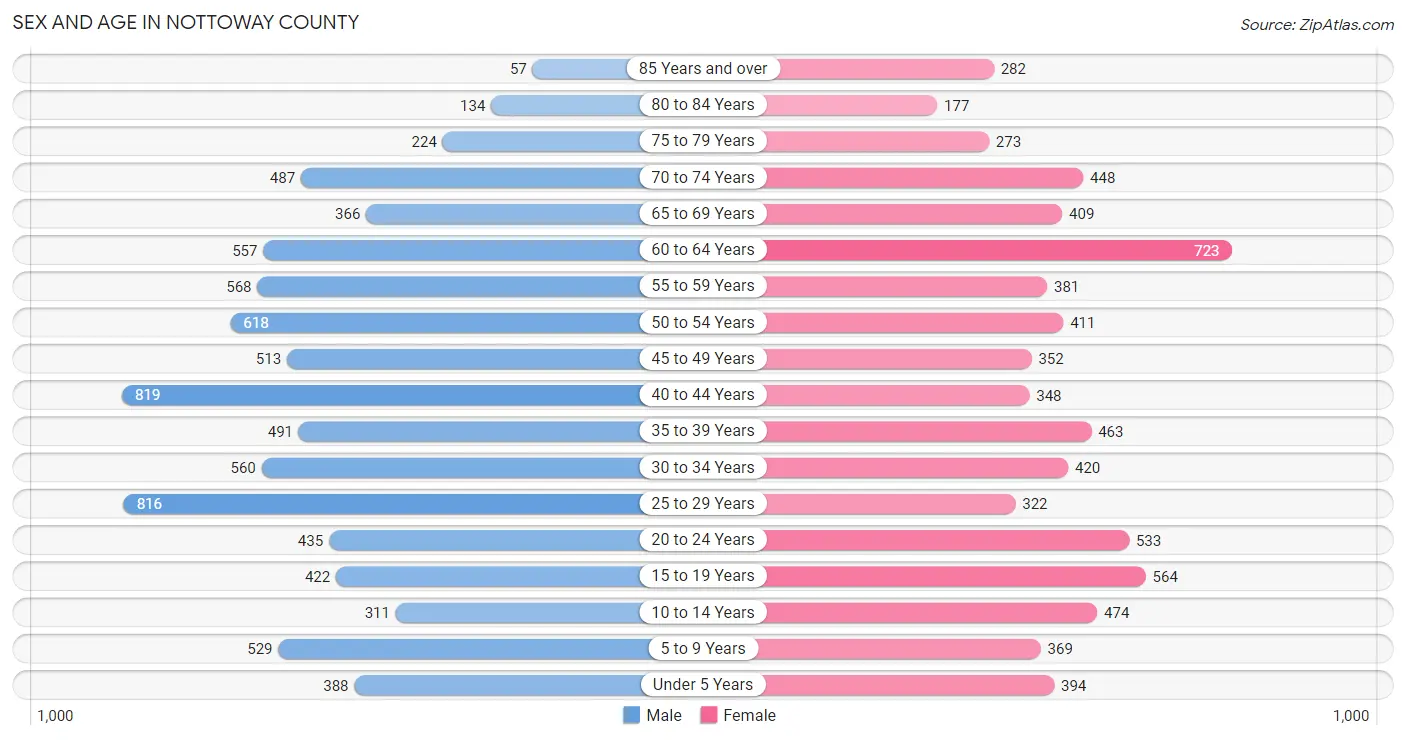
The most populous age groups in Nottoway County are 40 to 44 Years (819 | 9.9%) for men and 60 to 64 Years (723 | 9.9%) for women.
| Age Bracket | Male | Female |
| Under 5 Years | 388 (4.7%) | 394 (5.4%) |
| 5 to 9 Years | 529 (6.4%) | 369 (5.0%) |
| 10 to 14 Years | 311 (3.7%) | 474 (6.5%) |
| 15 to 19 Years | 422 (5.1%) | 564 (7.7%) |
| 20 to 24 Years | 435 (5.2%) | 533 (7.3%) |
| 25 to 29 Years | 816 (9.8%) | 322 (4.4%) |
| 30 to 34 Years | 560 (6.8%) | 420 (5.7%) |
| 35 to 39 Years | 491 (5.9%) | 463 (6.3%) |
| 40 to 44 Years | 819 (9.9%) | 348 (4.7%) |
| 45 to 49 Years | 513 (6.2%) | 352 (4.8%) |
| 50 to 54 Years | 618 (7.4%) | 411 (5.6%) |
| 55 to 59 Years | 568 (6.9%) | 381 (5.2%) |
| 60 to 64 Years | 557 (6.7%) | 723 (9.9%) |
| 65 to 69 Years | 366 (4.4%) | 409 (5.6%) |
| 70 to 74 Years | 487 (5.9%) | 448 (6.1%) |
| 75 to 79 Years | 224 (2.7%) | 273 (3.7%) |
| 80 to 84 Years | 134 (1.6%) | 177 (2.4%) |
| 85 Years and over | 57 (0.7%) | 282 (3.8%) |
| Total | 8,295 (100.0%) | 7,343 (100.0%) |
Families and Households in Nottoway County
Median Family Size in Nottoway County
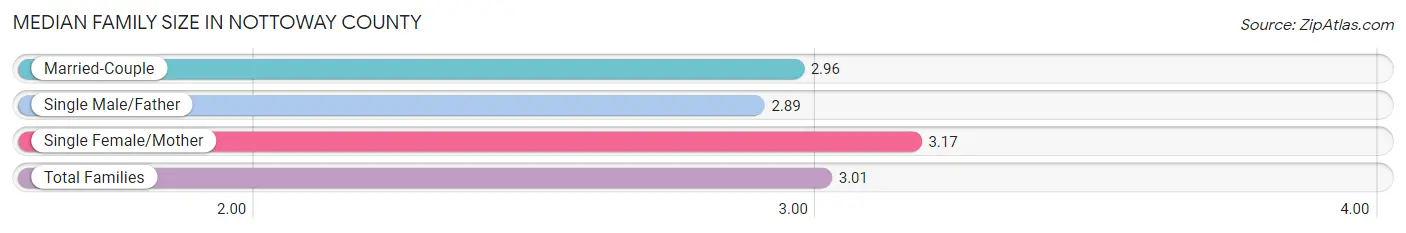
The median family size in Nottoway County is 3.01 persons per family, with single female/mother families (855 | 24.1%) accounting for the largest median family size of 3.17 persons per family. On the other hand, single male/father families (301 | 8.5%) represent the smallest median family size with 2.89 persons per family.
| Family Type | # Families | Family Size |
| Married-Couple | 2,390 (67.4%) | 2.96 |
| Single Male/Father | 301 (8.5%) | 2.89 |
| Single Female/Mother | 855 (24.1%) | 3.17 |
| Total Families | 3,546 (100.0%) | 3.01 |
Median Household Size in Nottoway County
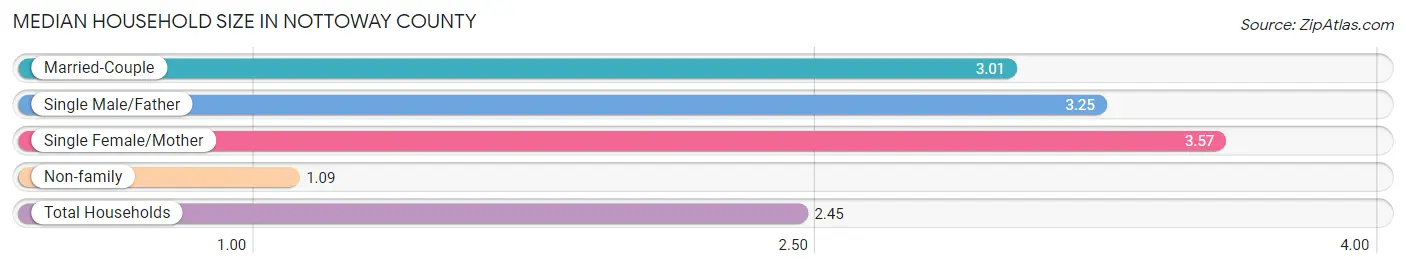
The median household size in Nottoway County is 2.45 persons per household, with single female/mother households (855 | 15.8%) accounting for the largest median household size of 3.57 persons per household. non-family households (1,869 | 34.5%) represent the smallest median household size with 1.09 persons per household.
| Household Type | # Households | Household Size |
| Married-Couple | 2,390 (44.1%) | 3.01 |
| Single Male/Father | 301 (5.6%) | 3.25 |
| Single Female/Mother | 855 (15.8%) | 3.57 |
| Non-family | 1,869 (34.5%) | 1.09 |
| Total Households | 5,415 (100.0%) | 2.45 |
Household Size by Marriage Status in Nottoway County
Out of a total of 5,415 households in Nottoway County, 3,546 (65.5%) are family households, while 1,869 (34.5%) are nonfamily households. The most numerous type of family households are 2-person households, comprising 1,678, and the most common type of nonfamily households are 1-person households, comprising 1,686.
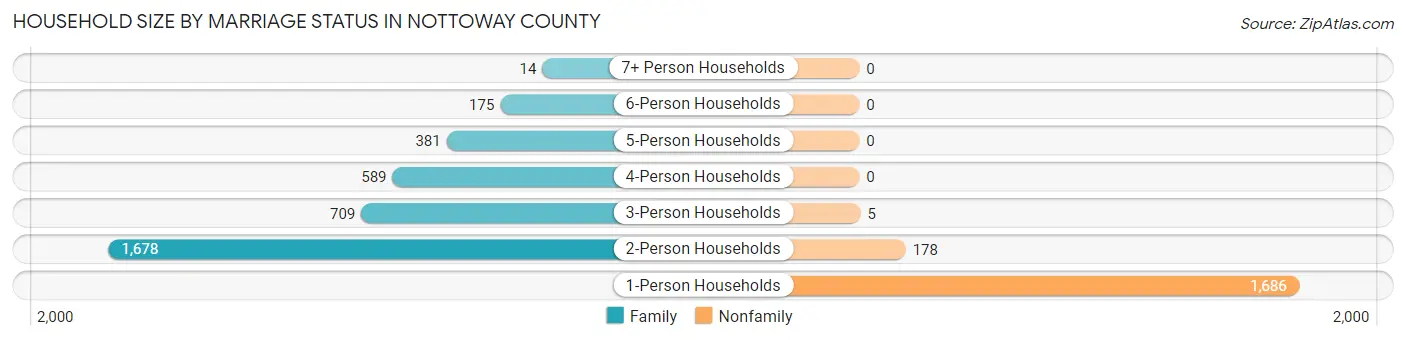
| Household Size | Family Households | Nonfamily Households |
| 1-Person Households | - | 1,686 (31.1%) |
| 2-Person Households | 1,678 (31.0%) | 178 (3.3%) |
| 3-Person Households | 709 (13.1%) | 5 (0.1%) |
| 4-Person Households | 589 (10.9%) | 0 (0.0%) |
| 5-Person Households | 381 (7.0%) | 0 (0.0%) |
| 6-Person Households | 175 (3.2%) | 0 (0.0%) |
| 7+ Person Households | 14 (0.3%) | 0 (0.0%) |
| Total | 3,546 (65.5%) | 1,869 (34.5%) |
Female Fertility in Nottoway County
Fertility by Age in Nottoway County
Average fertility rate in Nottoway County is 48.0 births per 1,000 women. Women in the age bracket of 20 to 34 years have the highest fertility rate with 84.0 births per 1,000 women. Women in the age bracket of 20 to 34 years acount for 70.4% of all women with births.
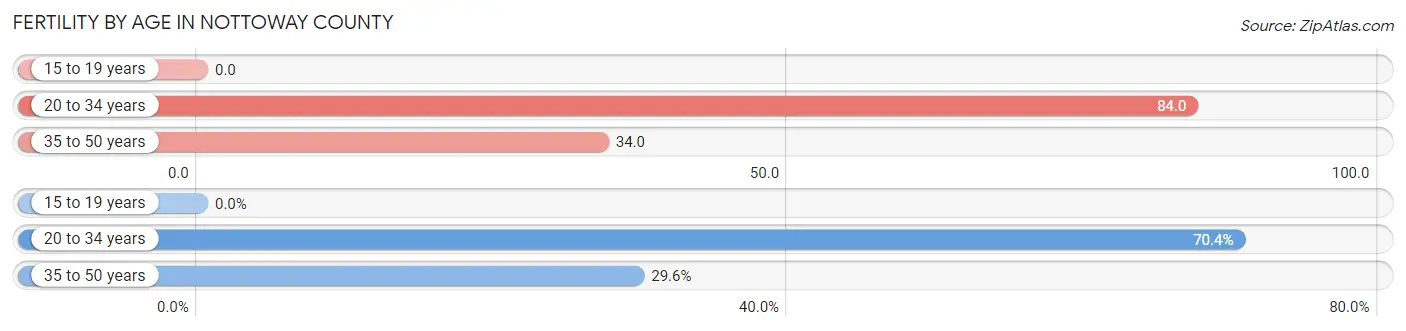
| Age Bracket | Women with Births | Births / 1,000 Women |
| 15 to 19 years | 0 (0.0%) | 0.0 |
| 20 to 34 years | 107 (70.4%) | 84.0 |
| 35 to 50 years | 45 (29.6%) | 34.0 |
| Total | 152 (100.0%) | 48.0 |
Fertility by Age by Marriage Status in Nottoway County
57.9% of women with births (152) in Nottoway County are married. The highest percentage of unmarried women with births falls into 35 to 50 years age bracket with 84.4% of them unmarried at the time of birth, while the lowest percentage of unmarried women with births belong to 20 to 34 years age bracket with 24.3% of them unmarried.
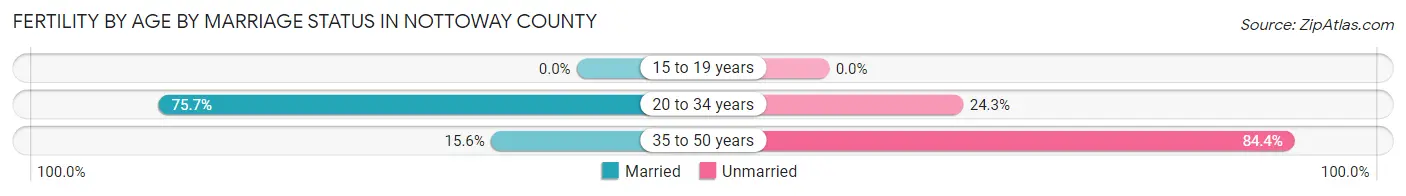
| Age Bracket | Married | Unmarried |
| 15 to 19 years | 0 (0.0%) | 0 (0.0%) |
| 20 to 34 years | 81 (75.7%) | 26 (24.3%) |
| 35 to 50 years | 7 (15.6%) | 38 (84.4%) |
| Total | 88 (57.9%) | 64 (42.1%) |
Fertility by Education in Nottoway County
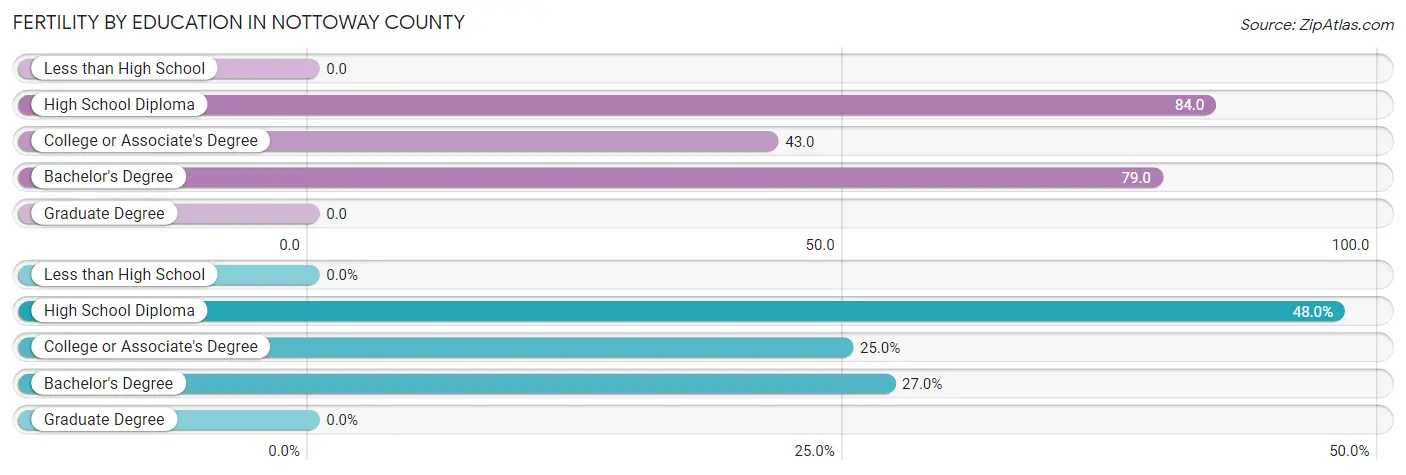
| Educational Attainment | Women with Births | Births / 1,000 Women |
| Less than High School | 0 (0.0%) | 0.0 |
| High School Diploma | 73 (48.0%) | 84.0 |
| College or Associate's Degree | 38 (25.0%) | 43.0 |
| Bachelor's Degree | 41 (27.0%) | 79.0 |
| Graduate Degree | 0 (0.0%) | 0.0 |
| Total | 152 (100.0%) | 48.0 |
Fertility by Education by Marriage Status in Nottoway County
42.1% of women with births in Nottoway County are unmarried. Women with the educational attainment of bachelor's degree are most likely to be married with 100.0% of them married at childbirth, while women with the educational attainment of college or associate's degree are least likely to be married with 100.0% of them unmarried at childbirth.
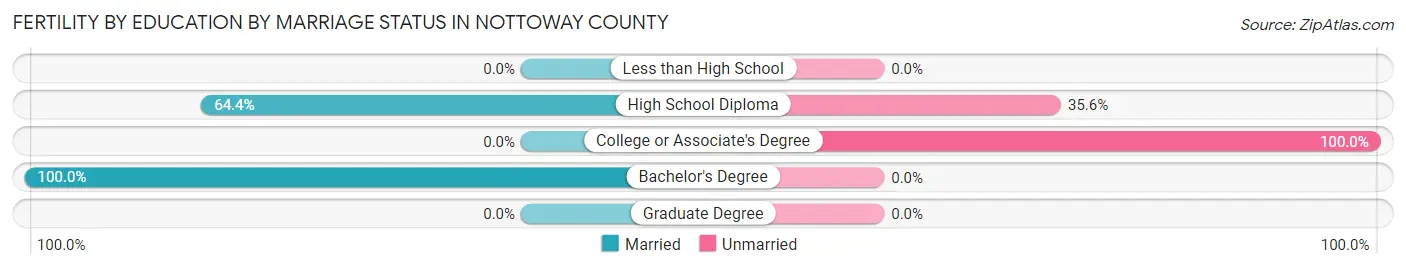
| Educational Attainment | Married | Unmarried |
| Less than High School | 0 (0.0%) | 0 (0.0%) |
| High School Diploma | 47 (64.4%) | 26 (35.6%) |
| College or Associate's Degree | 0 (0.0%) | 38 (100.0%) |
| Bachelor's Degree | 41 (100.0%) | 0 (0.0%) |
| Graduate Degree | 0 (0.0%) | 0 (0.0%) |
| Total | 88 (57.9%) | 64 (42.1%) |
Employment Characteristics in Nottoway County
Employment by Class of Employer in Nottoway County
Among the 5,833 employed individuals in Nottoway County, private company employees (3,798 | 65.1%), state government employees (624 | 10.7%), and local government employees (462 | 7.9%) make up the most common classes of employment.
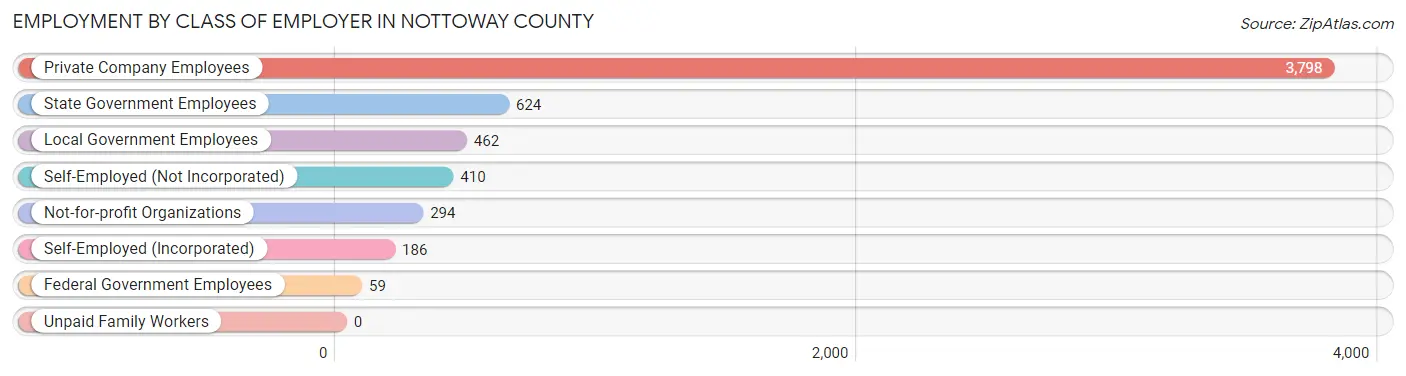
| Employer Class | # Employees | % Employees |
| Private Company Employees | 3,798 | 65.1% |
| Self-Employed (Incorporated) | 186 | 3.2% |
| Self-Employed (Not Incorporated) | 410 | 7.0% |
| Not-for-profit Organizations | 294 | 5.0% |
| Local Government Employees | 462 | 7.9% |
| State Government Employees | 624 | 10.7% |
| Federal Government Employees | 59 | 1.0% |
| Unpaid Family Workers | 0 | 0.0% |
| Total | 5,833 | 100.0% |
Employment Status by Age in Nottoway County
According to the labor force statistics for Nottoway County, out of the total population over 16 years of age (12,946), 50.1% or 6,486 individuals are in the labor force, with 6.4% or 415 of them unemployed. The age group with the highest labor force participation rate is 20 to 24 years, with 79.6% or 771 individuals in the labor force. Within the labor force, the 16 to 19 years age range has the highest percentage of unemployed individuals, with 19.0% or 64 of them being unemployed.
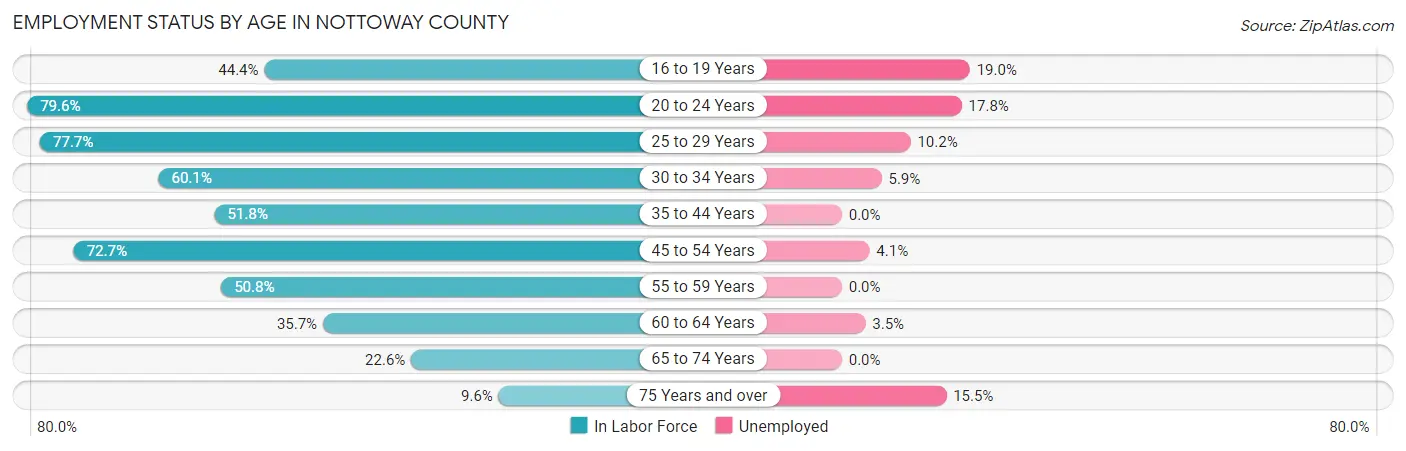
| Age Bracket | In Labor Force | Unemployed |
| 16 to 19 Years | 337 (44.4%) | 64 (19.0%) |
| 20 to 24 Years | 771 (79.6%) | 137 (17.8%) |
| 25 to 29 Years | 884 (77.7%) | 90 (10.2%) |
| 30 to 34 Years | 589 (60.1%) | 35 (5.9%) |
| 35 to 44 Years | 1,099 (51.8%) | 0 (0.0%) |
| 45 to 54 Years | 1,377 (72.7%) | 56 (4.1%) |
| 55 to 59 Years | 482 (50.8%) | 0 (0.0%) |
| 60 to 64 Years | 457 (35.7%) | 16 (3.5%) |
| 65 to 74 Years | 386 (22.6%) | 0 (0.0%) |
| 75 Years and over | 110 (9.6%) | 17 (15.5%) |
| Total | 6,486 (50.1%) | 415 (6.4%) |
Employment Status by Educational Attainment in Nottoway County
According to labor force statistics for Nottoway County, 58.4% of individuals (4,883) out of the total population between 25 and 64 years of age (8,362) are in the labor force, with 4.0% or 195 of them being unemployed. The group with the highest labor force participation rate are those with the educational attainment of bachelor's degree or higher, with 81.5% or 1,148 individuals in the labor force. Within the labor force, individuals with less than high school education have the highest percentage of unemployment, with 9.4% or 39 of them being unemployed.
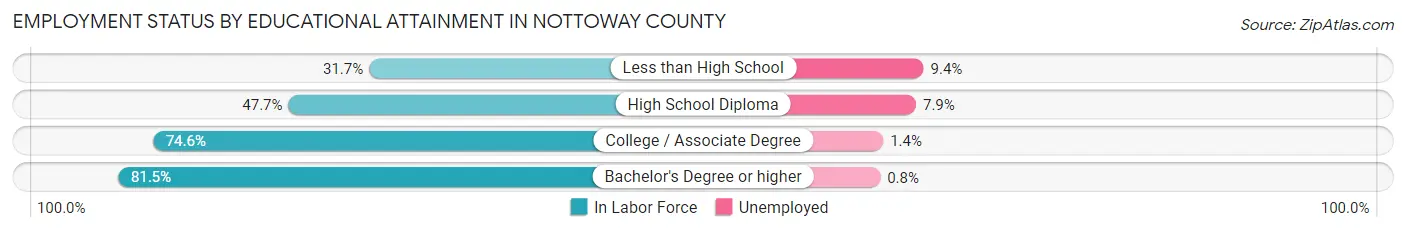
| Educational Attainment | In Labor Force | Unemployed |
| Less than High School | 416 (31.7%) | 123 (9.4%) |
| High School Diploma | 1,573 (47.7%) | 260 (7.9%) |
| College / Associate Degree | 1,749 (74.6%) | 33 (1.4%) |
| Bachelor's Degree or higher | 1,148 (81.5%) | 11 (0.8%) |
| Total | 4,883 (58.4%) | 334 (4.0%) |
Employment Occupations by Sex in Nottoway County
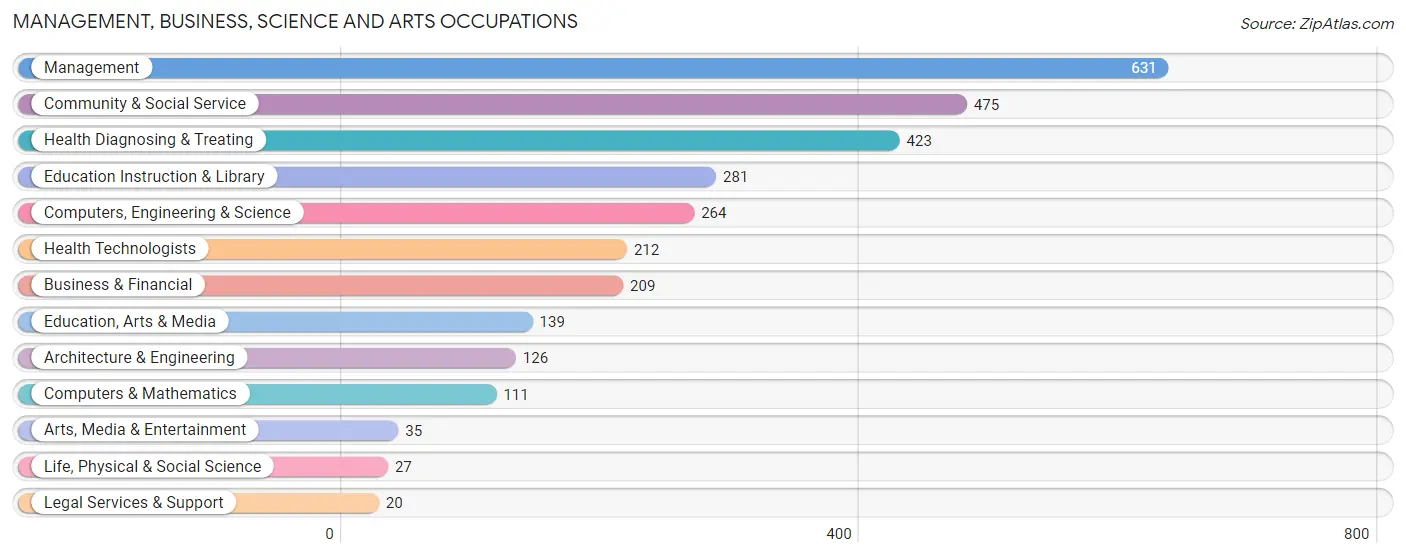
Management, Business, Science and Arts Occupations
The most common Management, Business, Science and Arts occupations in Nottoway County are Management (631 | 10.4%), Community & Social Service (475 | 7.8%), Health Diagnosing & Treating (423 | 7.0%), Education Instruction & Library (281 | 4.6%), and Computers, Engineering & Science (264 | 4.3%).
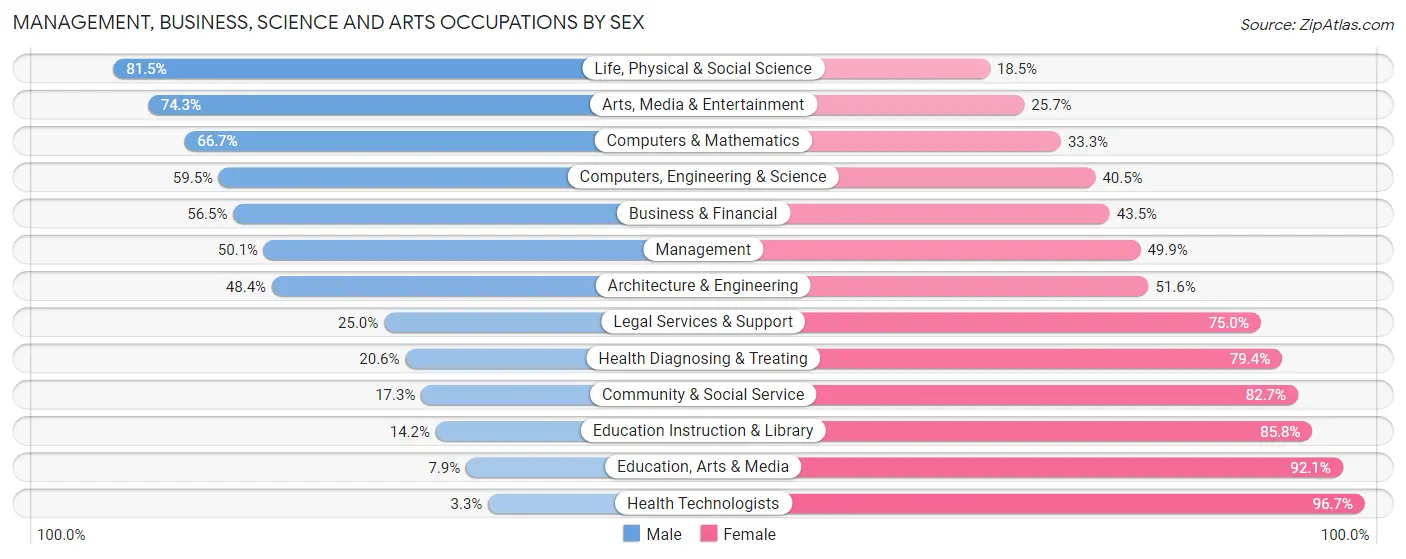
Management, Business, Science and Arts Occupations by Sex
Within the Management, Business, Science and Arts occupations in Nottoway County, the most male-oriented occupations are Life, Physical & Social Science (81.5%), Arts, Media & Entertainment (74.3%), and Computers & Mathematics (66.7%), while the most female-oriented occupations are Health Technologists (96.7%), Education, Arts & Media (92.1%), and Education Instruction & Library (85.8%).
| Occupation | Male | Female |
| Management | 316 (50.1%) | 315 (49.9%) |
| Business & Financial | 118 (56.5%) | 91 (43.5%) |
| Computers, Engineering & Science | 157 (59.5%) | 107 (40.5%) |
| Computers & Mathematics | 74 (66.7%) | 37 (33.3%) |
| Architecture & Engineering | 61 (48.4%) | 65 (51.6%) |
| Life, Physical & Social Science | 22 (81.5%) | 5 (18.5%) |
| Community & Social Service | 82 (17.3%) | 393 (82.7%) |
| Education, Arts & Media | 11 (7.9%) | 128 (92.1%) |
| Legal Services & Support | 5 (25.0%) | 15 (75.0%) |
| Education Instruction & Library | 40 (14.2%) | 241 (85.8%) |
| Arts, Media & Entertainment | 26 (74.3%) | 9 (25.7%) |
| Health Diagnosing & Treating | 87 (20.6%) | 336 (79.4%) |
| Health Technologists | 7 (3.3%) | 205 (96.7%) |
| Total (Category) | 760 (38.0%) | 1,242 (62.0%) |
| Total (Overall) | 2,981 (49.1%) | 3,086 (50.9%) |
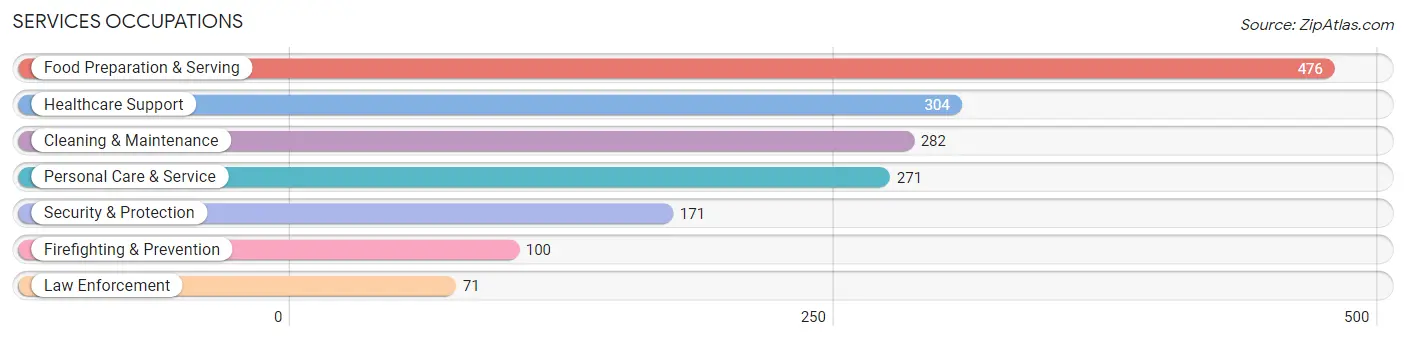
Services Occupations
The most common Services occupations in Nottoway County are Food Preparation & Serving (476 | 7.9%), Healthcare Support (304 | 5.0%), Cleaning & Maintenance (282 | 4.6%), Personal Care & Service (271 | 4.5%), and Security & Protection (171 | 2.8%).
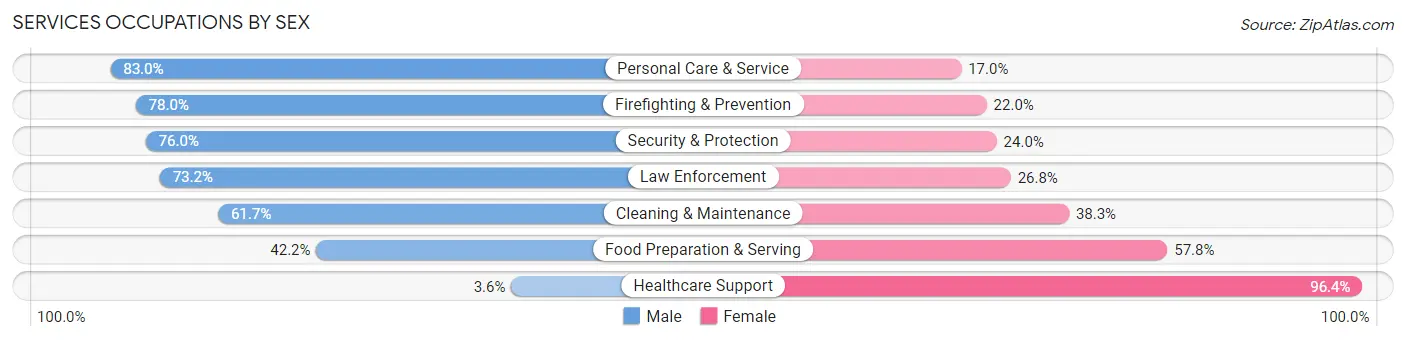
Services Occupations by Sex
Within the Services occupations in Nottoway County, the most male-oriented occupations are Personal Care & Service (83.0%), Firefighting & Prevention (78.0%), and Security & Protection (76.0%), while the most female-oriented occupations are Healthcare Support (96.4%), Food Preparation & Serving (57.8%), and Cleaning & Maintenance (38.3%).
| Occupation | Male | Female |
| Healthcare Support | 11 (3.6%) | 293 (96.4%) |
| Security & Protection | 130 (76.0%) | 41 (24.0%) |
| Firefighting & Prevention | 78 (78.0%) | 22 (22.0%) |
| Law Enforcement | 52 (73.2%) | 19 (26.8%) |
| Food Preparation & Serving | 201 (42.2%) | 275 (57.8%) |
| Cleaning & Maintenance | 174 (61.7%) | 108 (38.3%) |
| Personal Care & Service | 225 (83.0%) | 46 (17.0%) |
| Total (Category) | 741 (49.3%) | 763 (50.7%) |
| Total (Overall) | 2,981 (49.1%) | 3,086 (50.9%) |
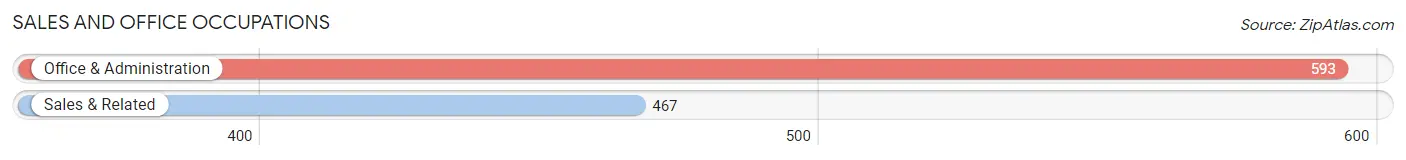
Sales and Office Occupations
The most common Sales and Office occupations in Nottoway County are Office & Administration (593 | 9.8%), and Sales & Related (467 | 7.7%).
Sales and Office Occupations by Sex
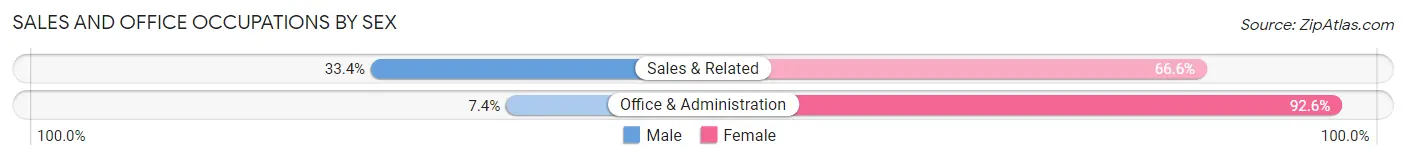
| Occupation | Male | Female |
| Sales & Related | 156 (33.4%) | 311 (66.6%) |
| Office & Administration | 44 (7.4%) | 549 (92.6%) |
| Total (Category) | 200 (18.9%) | 860 (81.1%) |
| Total (Overall) | 2,981 (49.1%) | 3,086 (50.9%) |
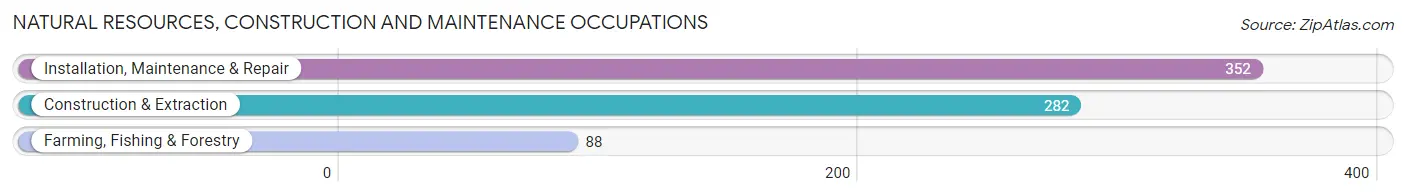
Natural Resources, Construction and Maintenance Occupations
The most common Natural Resources, Construction and Maintenance occupations in Nottoway County are Installation, Maintenance & Repair (352 | 5.8%), Construction & Extraction (282 | 4.6%), and Farming, Fishing & Forestry (88 | 1.5%).
Natural Resources, Construction and Maintenance Occupations by Sex
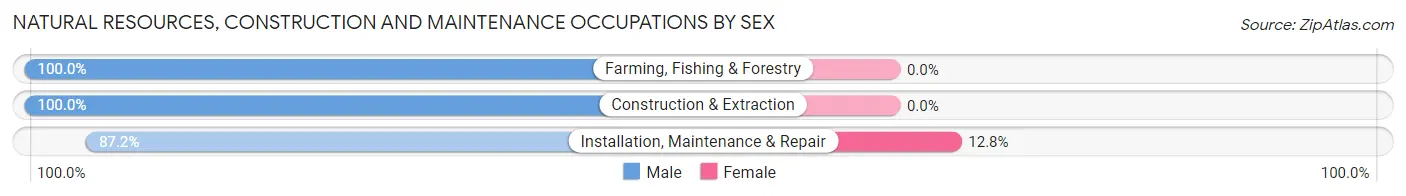
| Occupation | Male | Female |
| Farming, Fishing & Forestry | 88 (100.0%) | 0 (0.0%) |
| Construction & Extraction | 282 (100.0%) | 0 (0.0%) |
| Installation, Maintenance & Repair | 307 (87.2%) | 45 (12.8%) |
| Total (Category) | 677 (93.8%) | 45 (6.2%) |
| Total (Overall) | 2,981 (49.1%) | 3,086 (50.9%) |
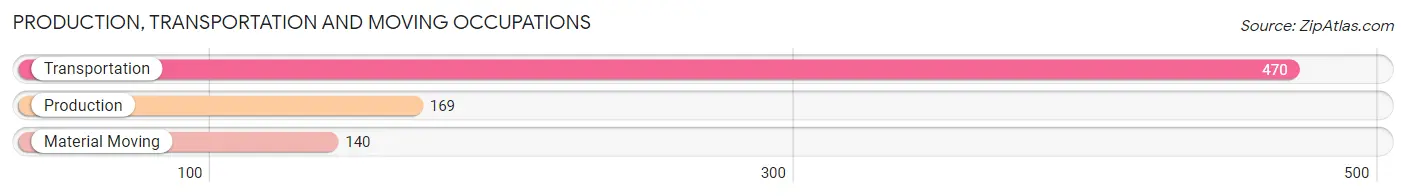
Production, Transportation and Moving Occupations
The most common Production, Transportation and Moving occupations in Nottoway County are Transportation (470 | 7.7%), Production (169 | 2.8%), and Material Moving (140 | 2.3%).
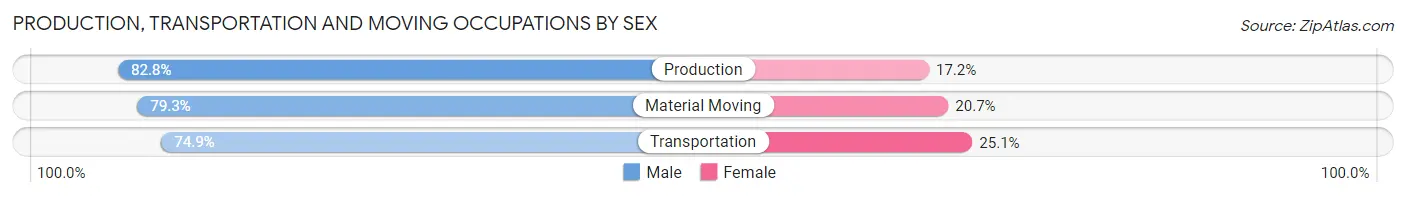
Production, Transportation and Moving Occupations by Sex
| Occupation | Male | Female |
| Production | 140 (82.8%) | 29 (17.2%) |
| Transportation | 352 (74.9%) | 118 (25.1%) |
| Material Moving | 111 (79.3%) | 29 (20.7%) |
| Total (Category) | 603 (77.4%) | 176 (22.6%) |
| Total (Overall) | 2,981 (49.1%) | 3,086 (50.9%) |
Employment Industries by Sex in Nottoway County
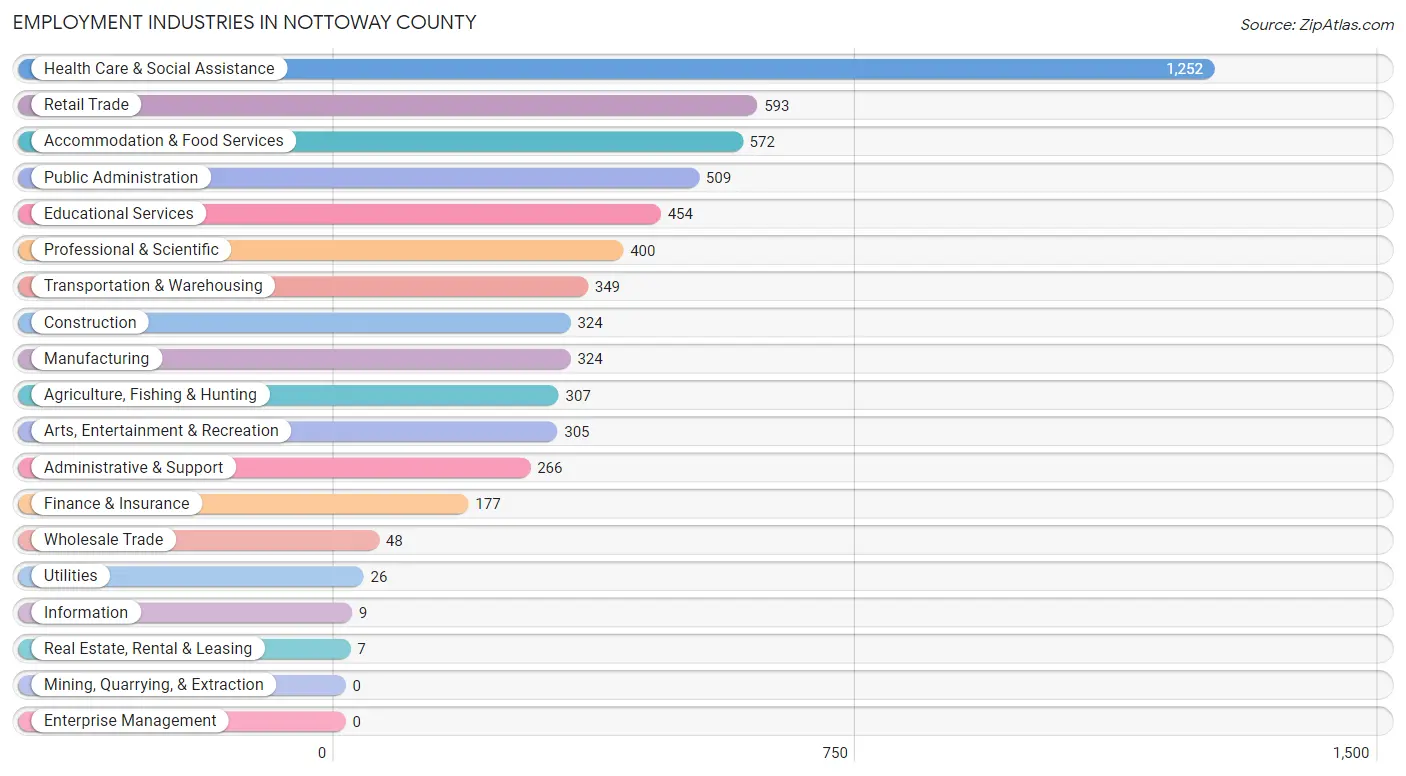
Employment Industries in Nottoway County
The major employment industries in Nottoway County include Health Care & Social Assistance (1,252 | 20.6%), Retail Trade (593 | 9.8%), Accommodation & Food Services (572 | 9.4%), Public Administration (509 | 8.4%), and Educational Services (454 | 7.5%).
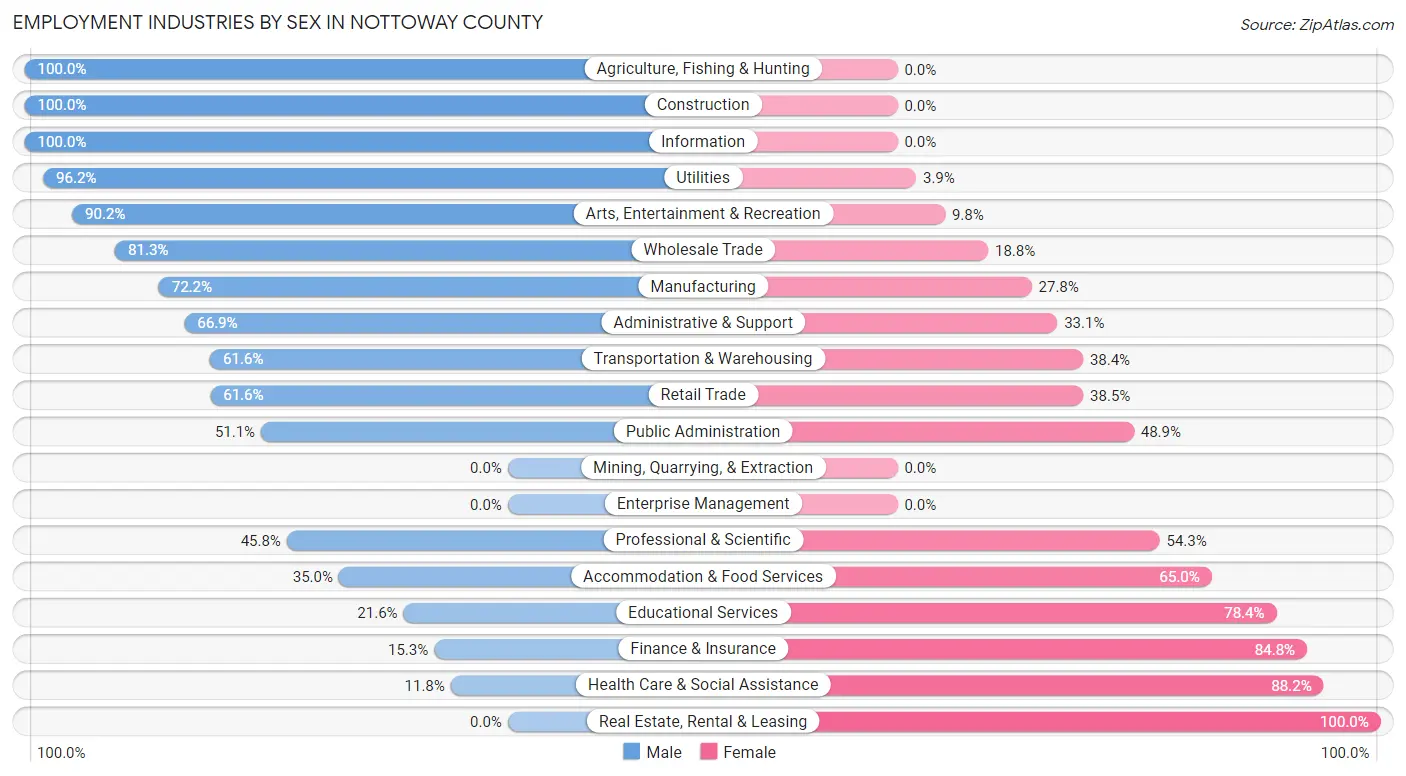
Employment Industries by Sex in Nottoway County
The Nottoway County industries that see more men than women are Agriculture, Fishing & Hunting (100.0%), Construction (100.0%), and Information (100.0%), whereas the industries that tend to have a higher number of women are Real Estate, Rental & Leasing (100.0%), Health Care & Social Assistance (88.2%), and Finance & Insurance (84.8%).
| Industry | Male | Female |
| Agriculture, Fishing & Hunting | 307 (100.0%) | 0 (0.0%) |
| Mining, Quarrying, & Extraction | 0 (0.0%) | 0 (0.0%) |
| Construction | 324 (100.0%) | 0 (0.0%) |
| Manufacturing | 234 (72.2%) | 90 (27.8%) |
| Wholesale Trade | 39 (81.2%) | 9 (18.8%) |
| Retail Trade | 365 (61.6%) | 228 (38.5%) |
| Transportation & Warehousing | 215 (61.6%) | 134 (38.4%) |
| Utilities | 25 (96.2%) | 1 (3.8%) |
| Information | 9 (100.0%) | 0 (0.0%) |
| Finance & Insurance | 27 (15.2%) | 150 (84.8%) |
| Real Estate, Rental & Leasing | 0 (0.0%) | 7 (100.0%) |
| Professional & Scientific | 183 (45.8%) | 217 (54.2%) |
| Enterprise Management | 0 (0.0%) | 0 (0.0%) |
| Administrative & Support | 178 (66.9%) | 88 (33.1%) |
| Educational Services | 98 (21.6%) | 356 (78.4%) |
| Health Care & Social Assistance | 148 (11.8%) | 1,104 (88.2%) |
| Arts, Entertainment & Recreation | 275 (90.2%) | 30 (9.8%) |
| Accommodation & Food Services | 200 (35.0%) | 372 (65.0%) |
| Public Administration | 260 (51.1%) | 249 (48.9%) |
| Total | 2,981 (49.1%) | 3,086 (50.9%) |
Education in Nottoway County
School Enrollment in Nottoway County
The most common levels of schooling among the 3,150 students in Nottoway County are high school (774 | 24.6%), elementary school (753 | 23.9%), and middle school (587 | 18.6%).
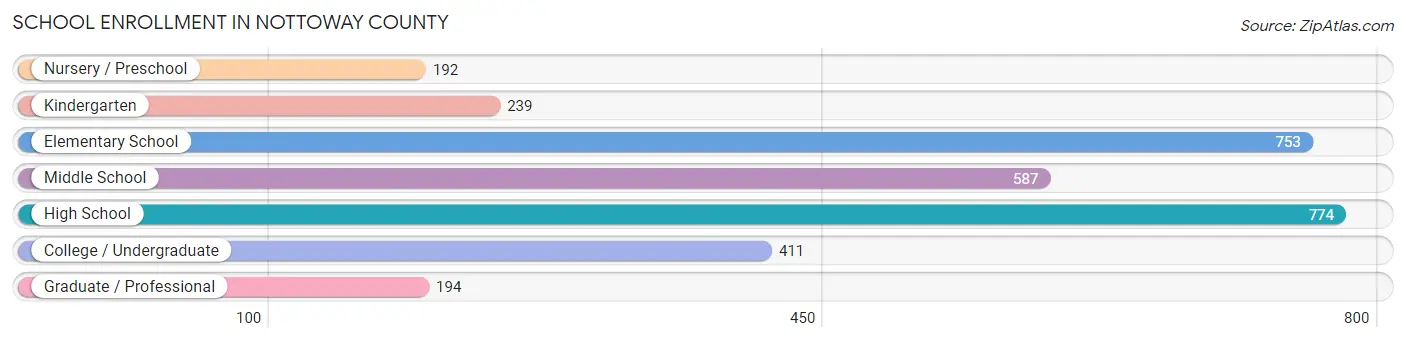
| School Level | # Students | % Students |
| Nursery / Preschool | 192 | 6.1% |
| Kindergarten | 239 | 7.6% |
| Elementary School | 753 | 23.9% |
| Middle School | 587 | 18.6% |
| High School | 774 | 24.6% |
| College / Undergraduate | 411 | 13.1% |
| Graduate / Professional | 194 | 6.2% |
| Total | 3,150 | 100.0% |
School Enrollment by Age by Funding Source in Nottoway County
Out of a total of 3,150 students who are enrolled in schools in Nottoway County, 580 (18.4%) attend a private institution, while the remaining 2,570 (81.6%) are enrolled in public schools. The age group of 3 to 4 year olds has the highest likelihood of being enrolled in private schools, with 76 (49.3% in the age bracket) enrolled. Conversely, the age group of 18 to 19 year olds has the lowest likelihood of being enrolled in a private school, with 180 (99.5% in the age bracket) attending a public institution.
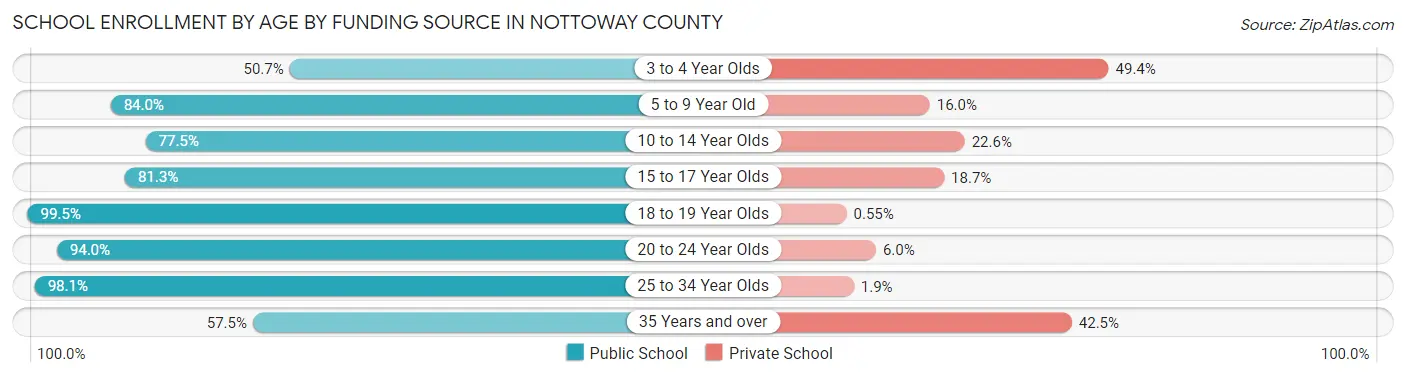
| Age Bracket | Public School | Private School |
| 3 to 4 Year Olds | 78 (50.6%) | 76 (49.3%) |
| 5 to 9 Year Old | 738 (84.0%) | 141 (16.0%) |
| 10 to 14 Year Olds | 608 (77.4%) | 177 (22.6%) |
| 15 to 17 Year Olds | 482 (81.3%) | 111 (18.7%) |
| 18 to 19 Year Olds | 180 (99.5%) | 1 (0.5%) |
| 20 to 24 Year Olds | 312 (94.0%) | 20 (6.0%) |
| 25 to 34 Year Olds | 104 (98.1%) | 2 (1.9%) |
| 35 Years and over | 69 (57.5%) | 51 (42.5%) |
| Total | 2,570 (81.6%) | 580 (18.4%) |
Educational Attainment by Field of Study in Nottoway County
Business (363 | 18.5%), bio, nature & agricultural (260 | 13.3%), science & technology (233 | 11.9%), education (192 | 9.8%), and arts & humanities (161 | 8.2%) are the most common fields of study among 1,957 individuals in Nottoway County who have obtained a bachelor's degree or higher.
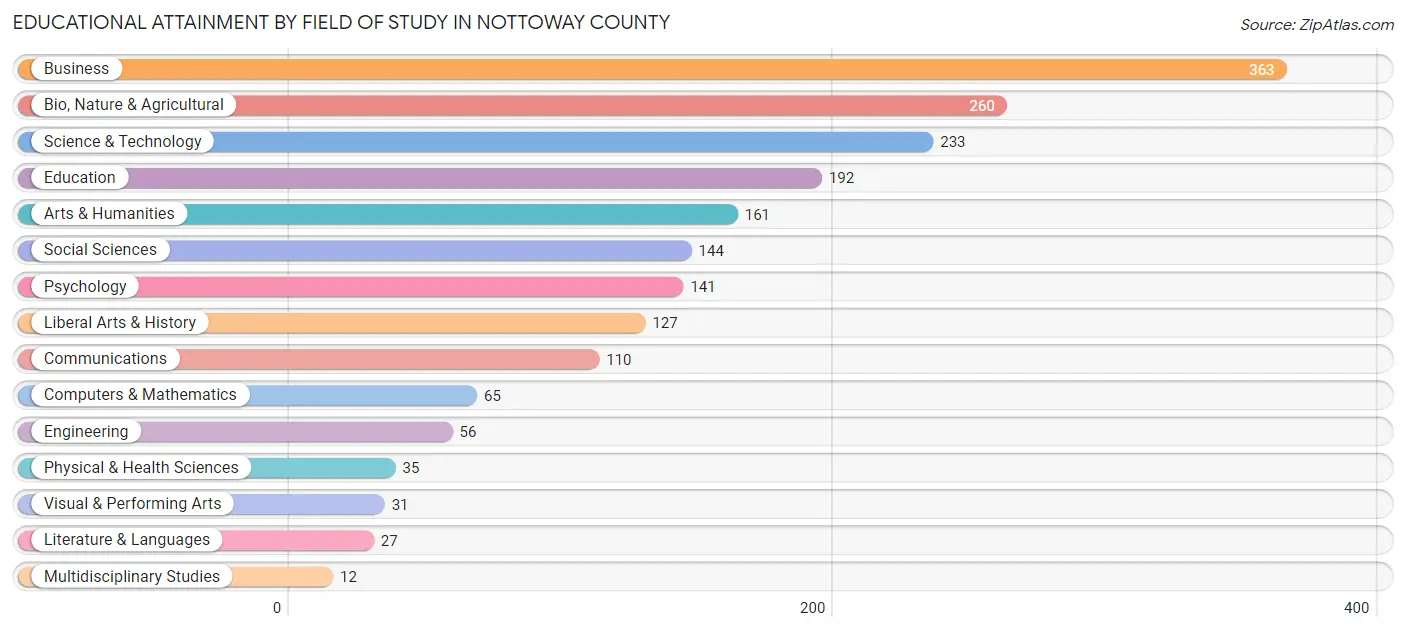
| Field of Study | # Graduates | % Graduates |
| Computers & Mathematics | 65 | 3.3% |
| Bio, Nature & Agricultural | 260 | 13.3% |
| Physical & Health Sciences | 35 | 1.8% |
| Psychology | 141 | 7.2% |
| Social Sciences | 144 | 7.4% |
| Engineering | 56 | 2.9% |
| Multidisciplinary Studies | 12 | 0.6% |
| Science & Technology | 233 | 11.9% |
| Business | 363 | 18.5% |
| Education | 192 | 9.8% |
| Literature & Languages | 27 | 1.4% |
| Liberal Arts & History | 127 | 6.5% |
| Visual & Performing Arts | 31 | 1.6% |
| Communications | 110 | 5.6% |
| Arts & Humanities | 161 | 8.2% |
| Total | 1,957 | 100.0% |
Transportation & Commute in Nottoway County
Vehicle Availability by Sex in Nottoway County
The most prevalent vehicle ownership categories in Nottoway County are males with 3 vehicles (819, accounting for 27.7%) and females with 3 vehicles (894, making up 28.6%).
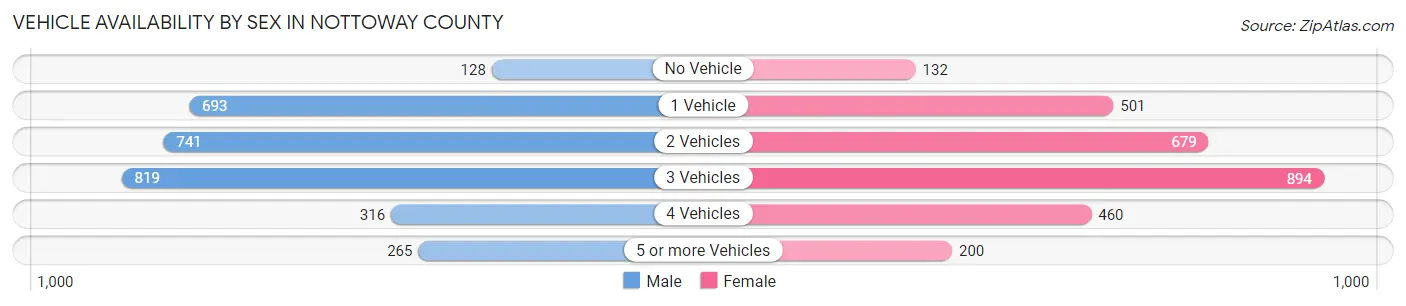
| Vehicles Available | Male | Female |
| No Vehicle | 128 (4.3%) | 132 (4.6%) |
| 1 Vehicle | 693 (23.4%) | 501 (17.5%) |
| 2 Vehicles | 741 (25.0%) | 679 (23.7%) |
| 3 Vehicles | 819 (27.7%) | 894 (31.2%) |
| 4 Vehicles | 316 (10.7%) | 460 (16.1%) |
| 5 or more Vehicles | 265 (8.9%) | 200 (7.0%) |
| Total | 2,962 (100.0%) | 2,866 (100.0%) |
Commute Time in Nottoway County
The most frequently occuring commute durations in Nottoway County are 10 to 14 minutes (750 commuters, 14.0%), 60 to 89 minutes (715 commuters, 13.3%), and 20 to 24 minutes (647 commuters, 12.1%).
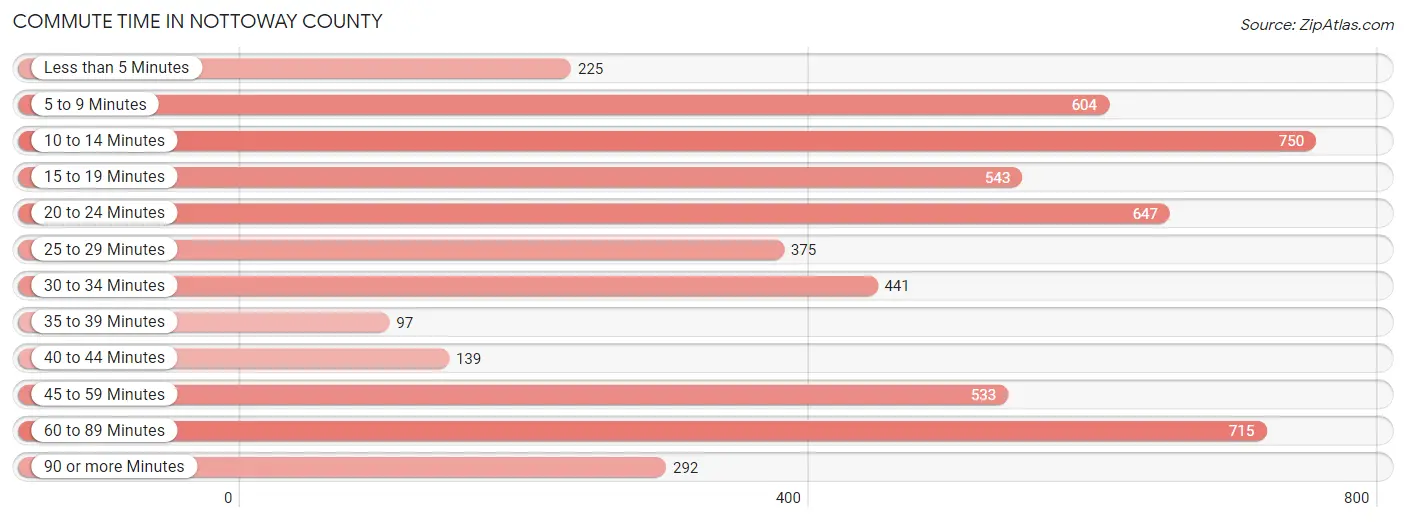
| Commute Time | # Commuters | % Commuters |
| Less than 5 Minutes | 225 | 4.2% |
| 5 to 9 Minutes | 604 | 11.3% |
| 10 to 14 Minutes | 750 | 14.0% |
| 15 to 19 Minutes | 543 | 10.1% |
| 20 to 24 Minutes | 647 | 12.1% |
| 25 to 29 Minutes | 375 | 7.0% |
| 30 to 34 Minutes | 441 | 8.2% |
| 35 to 39 Minutes | 97 | 1.8% |
| 40 to 44 Minutes | 139 | 2.6% |
| 45 to 59 Minutes | 533 | 9.9% |
| 60 to 89 Minutes | 715 | 13.3% |
| 90 or more Minutes | 292 | 5.4% |
Commute Time by Sex in Nottoway County
The most common commute times in Nottoway County are 10 to 14 minutes (539 commuters, 19.9%) for males and 20 to 24 minutes (419 commuters, 15.8%) for females.
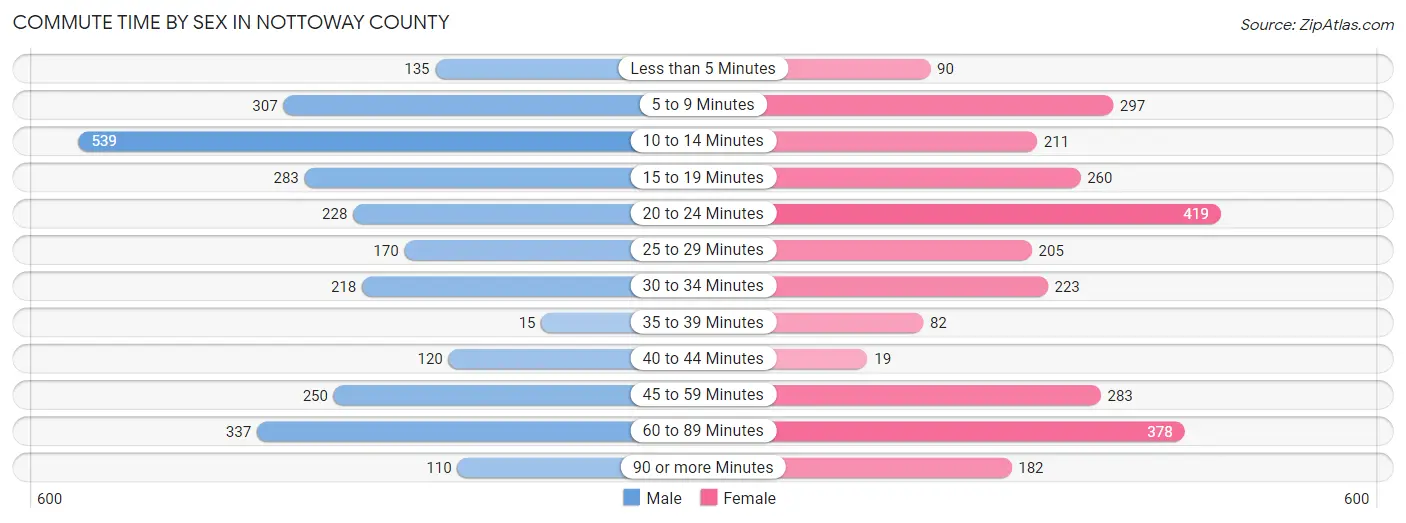
| Commute Time | Male | Female |
| Less than 5 Minutes | 135 (5.0%) | 90 (3.4%) |
| 5 to 9 Minutes | 307 (11.3%) | 297 (11.2%) |
| 10 to 14 Minutes | 539 (19.9%) | 211 (8.0%) |
| 15 to 19 Minutes | 283 (10.4%) | 260 (9.8%) |
| 20 to 24 Minutes | 228 (8.4%) | 419 (15.8%) |
| 25 to 29 Minutes | 170 (6.3%) | 205 (7.7%) |
| 30 to 34 Minutes | 218 (8.0%) | 223 (8.4%) |
| 35 to 39 Minutes | 15 (0.5%) | 82 (3.1%) |
| 40 to 44 Minutes | 120 (4.4%) | 19 (0.7%) |
| 45 to 59 Minutes | 250 (9.2%) | 283 (10.7%) |
| 60 to 89 Minutes | 337 (12.4%) | 378 (14.3%) |
| 90 or more Minutes | 110 (4.1%) | 182 (6.9%) |
Time of Departure to Work by Sex in Nottoway County
The most frequent times of departure to work in Nottoway County are 7:00 AM to 7:29 AM (576, 21.2%) for males and 7:00 AM to 7:29 AM (490, 18.5%) for females.
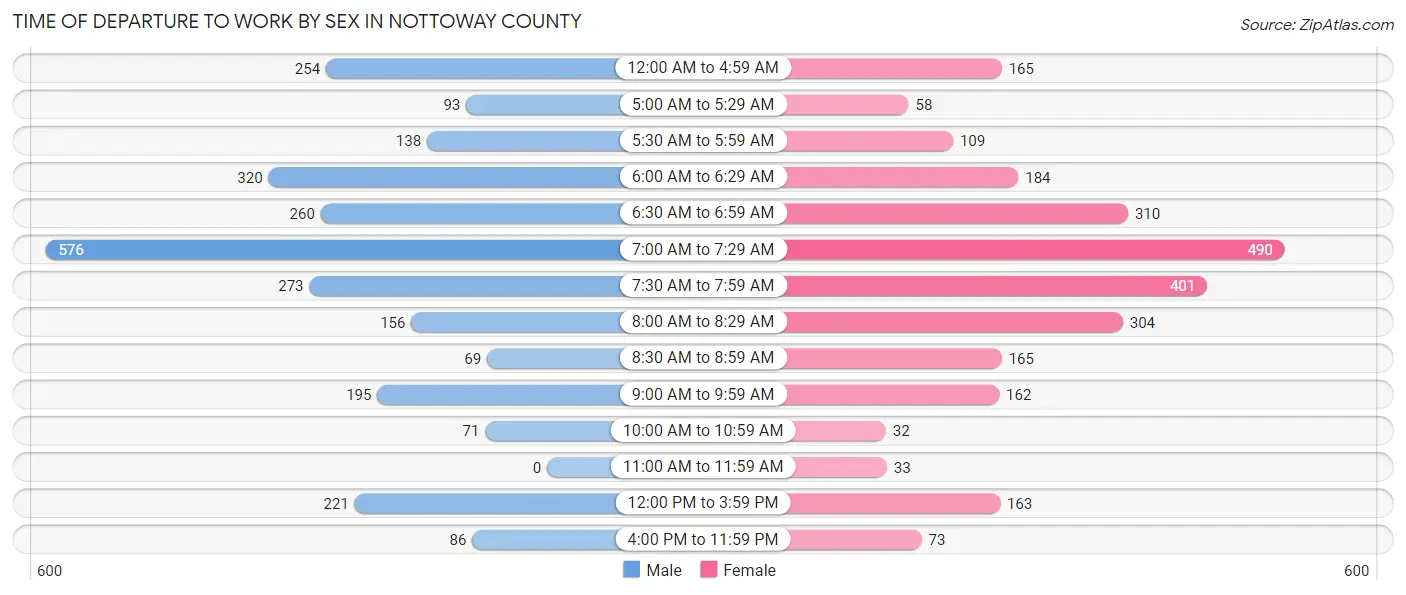
| Time of Departure | Male | Female |
| 12:00 AM to 4:59 AM | 254 (9.4%) | 165 (6.2%) |
| 5:00 AM to 5:29 AM | 93 (3.4%) | 58 (2.2%) |
| 5:30 AM to 5:59 AM | 138 (5.1%) | 109 (4.1%) |
| 6:00 AM to 6:29 AM | 320 (11.8%) | 184 (7.0%) |
| 6:30 AM to 6:59 AM | 260 (9.6%) | 310 (11.7%) |
| 7:00 AM to 7:29 AM | 576 (21.2%) | 490 (18.5%) |
| 7:30 AM to 7:59 AM | 273 (10.1%) | 401 (15.1%) |
| 8:00 AM to 8:29 AM | 156 (5.8%) | 304 (11.5%) |
| 8:30 AM to 8:59 AM | 69 (2.5%) | 165 (6.2%) |
| 9:00 AM to 9:59 AM | 195 (7.2%) | 162 (6.1%) |
| 10:00 AM to 10:59 AM | 71 (2.6%) | 32 (1.2%) |
| 11:00 AM to 11:59 AM | 0 (0.0%) | 33 (1.3%) |
| 12:00 PM to 3:59 PM | 221 (8.2%) | 163 (6.1%) |
| 4:00 PM to 11:59 PM | 86 (3.2%) | 73 (2.8%) |
| Total | 2,712 (100.0%) | 2,649 (100.0%) |
Housing Occupancy in Nottoway County
Occupancy by Ownership in Nottoway County
Of the total 5,415 dwellings in Nottoway County, owner-occupied units account for 3,861 (71.3%), while renter-occupied units make up 1,554 (28.7%).
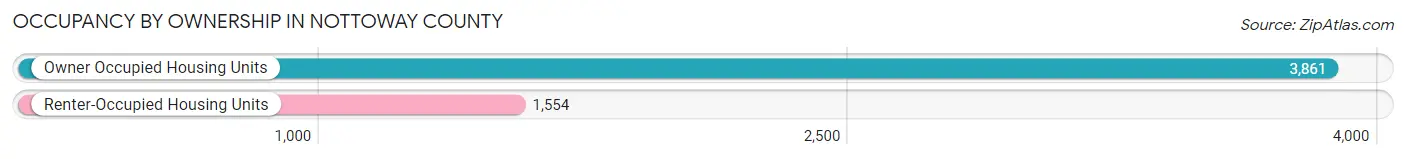
| Occupancy | # Housing Units | % Housing Units |
| Owner Occupied Housing Units | 3,861 | 71.3% |
| Renter-Occupied Housing Units | 1,554 | 28.7% |
| Total Occupied Housing Units | 5,415 | 100.0% |
Occupancy by Household Size in Nottoway County
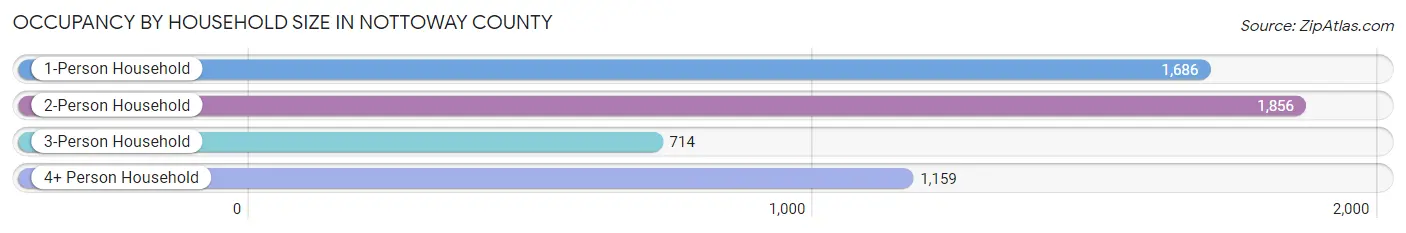
| Household Size | # Housing Units | % Housing Units |
| 1-Person Household | 1,686 | 31.1% |
| 2-Person Household | 1,856 | 34.3% |
| 3-Person Household | 714 | 13.2% |
| 4+ Person Household | 1,159 | 21.4% |
| Total Housing Units | 5,415 | 100.0% |
Occupancy by Ownership by Household Size in Nottoway County
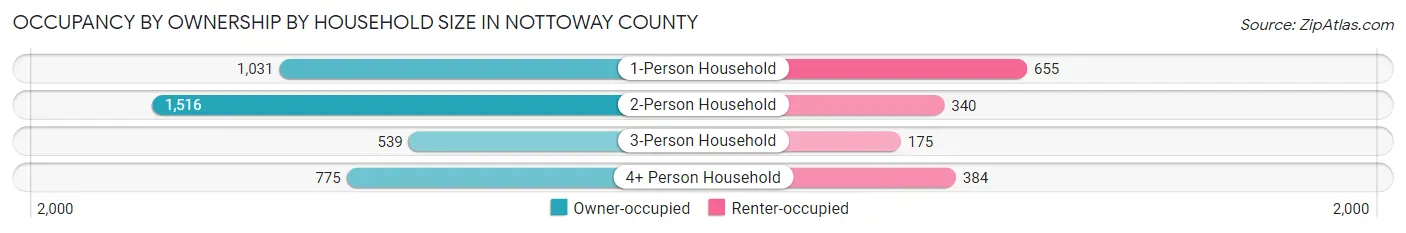
| Household Size | Owner-occupied | Renter-occupied |
| 1-Person Household | 1,031 (61.2%) | 655 (38.9%) |
| 2-Person Household | 1,516 (81.7%) | 340 (18.3%) |
| 3-Person Household | 539 (75.5%) | 175 (24.5%) |
| 4+ Person Household | 775 (66.9%) | 384 (33.1%) |
| Total Housing Units | 3,861 (71.3%) | 1,554 (28.7%) |
Occupancy by Educational Attainment in Nottoway County
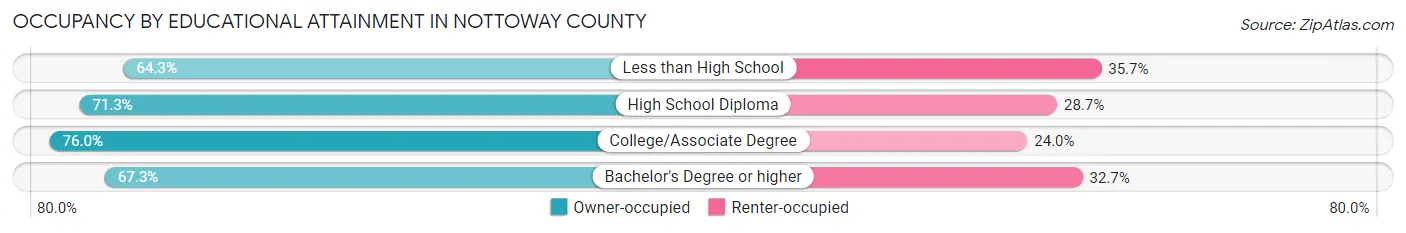
| Household Size | Owner-occupied | Renter-occupied |
| Less than High School | 378 (64.3%) | 210 (35.7%) |
| High School Diploma | 1,334 (71.3%) | 537 (28.7%) |
| College/Associate Degree | 1,395 (76.0%) | 440 (24.0%) |
| Bachelor's Degree or higher | 754 (67.3%) | 367 (32.7%) |
Occupancy by Age of Householder in Nottoway County
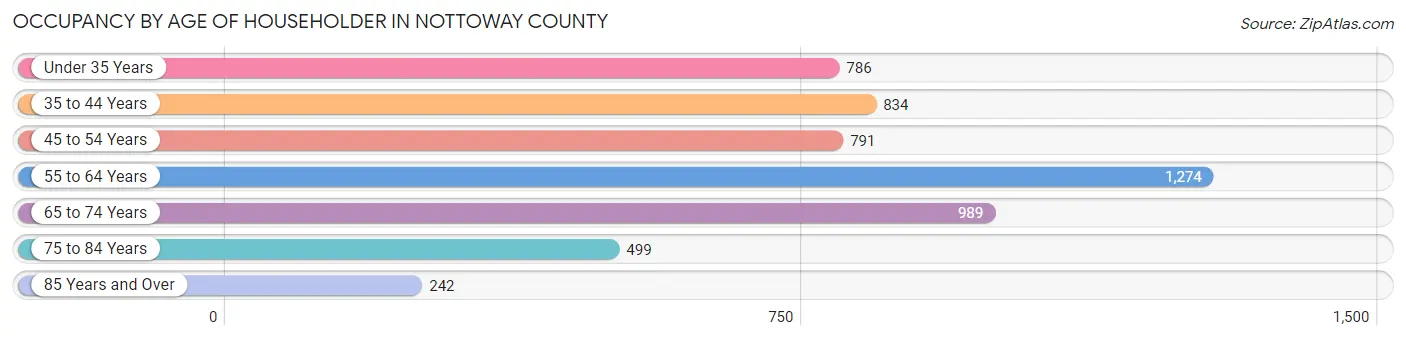
| Age Bracket | # Households | % Households |
| Under 35 Years | 786 | 14.5% |
| 35 to 44 Years | 834 | 15.4% |
| 45 to 54 Years | 791 | 14.6% |
| 55 to 64 Years | 1,274 | 23.5% |
| 65 to 74 Years | 989 | 18.3% |
| 75 to 84 Years | 499 | 9.2% |
| 85 Years and Over | 242 | 4.5% |
| Total | 5,415 | 100.0% |
Housing Finances in Nottoway County
Median Income by Occupancy in Nottoway County
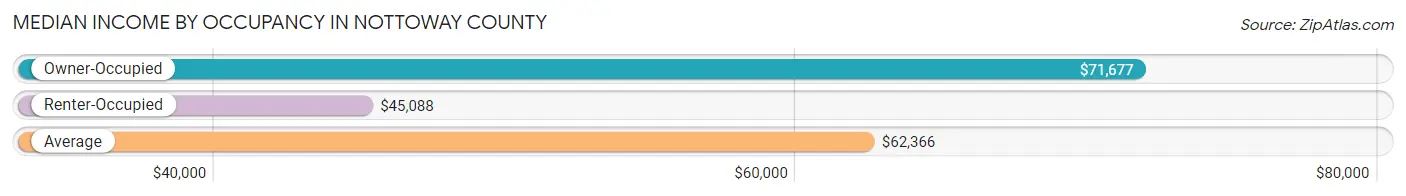
| Occupancy Type | # Households | Median Income |
| Owner-Occupied | 3,861 (71.3%) | $71,677 |
| Renter-Occupied | 1,554 (28.7%) | $45,088 |
| Average | 5,415 (100.0%) | $62,366 |
Occupancy by Householder Income Bracket in Nottoway County
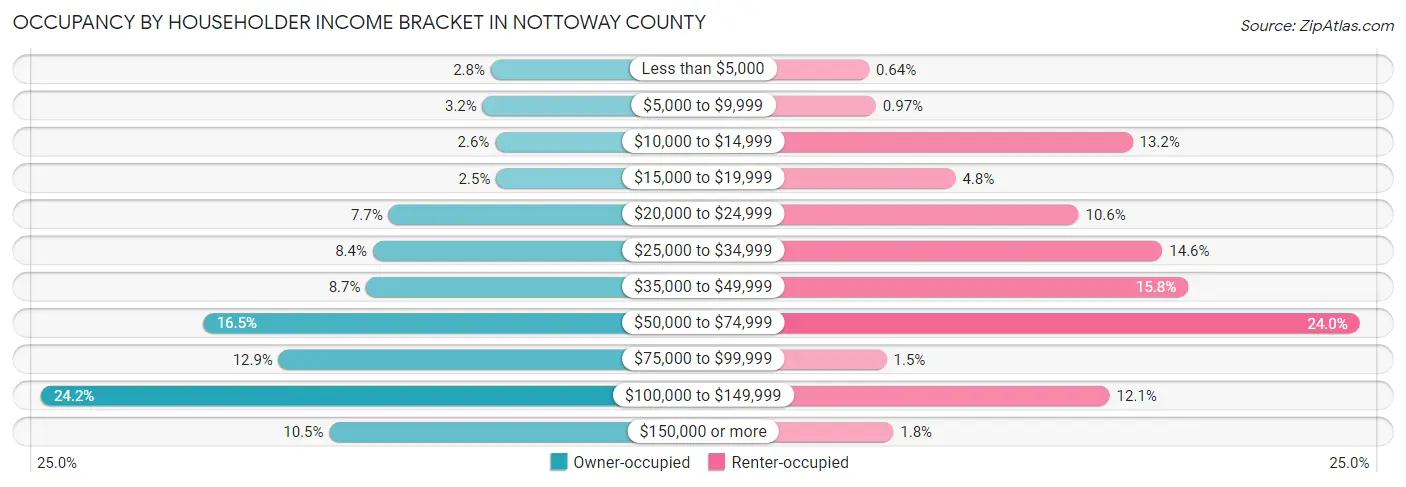
| Income Bracket | Owner-occupied | Renter-occupied |
| Less than $5,000 | 108 (2.8%) | 10 (0.6%) |
| $5,000 to $9,999 | 123 (3.2%) | 15 (1.0%) |
| $10,000 to $14,999 | 100 (2.6%) | 205 (13.2%) |
| $15,000 to $19,999 | 98 (2.5%) | 74 (4.8%) |
| $20,000 to $24,999 | 296 (7.7%) | 165 (10.6%) |
| $25,000 to $34,999 | 325 (8.4%) | 227 (14.6%) |
| $35,000 to $49,999 | 337 (8.7%) | 246 (15.8%) |
| $50,000 to $74,999 | 636 (16.5%) | 373 (24.0%) |
| $75,000 to $99,999 | 498 (12.9%) | 23 (1.5%) |
| $100,000 to $149,999 | 935 (24.2%) | 188 (12.1%) |
| $150,000 or more | 405 (10.5%) | 28 (1.8%) |
| Total | 3,861 (100.0%) | 1,554 (100.0%) |
Monthly Housing Cost Tiers in Nottoway County
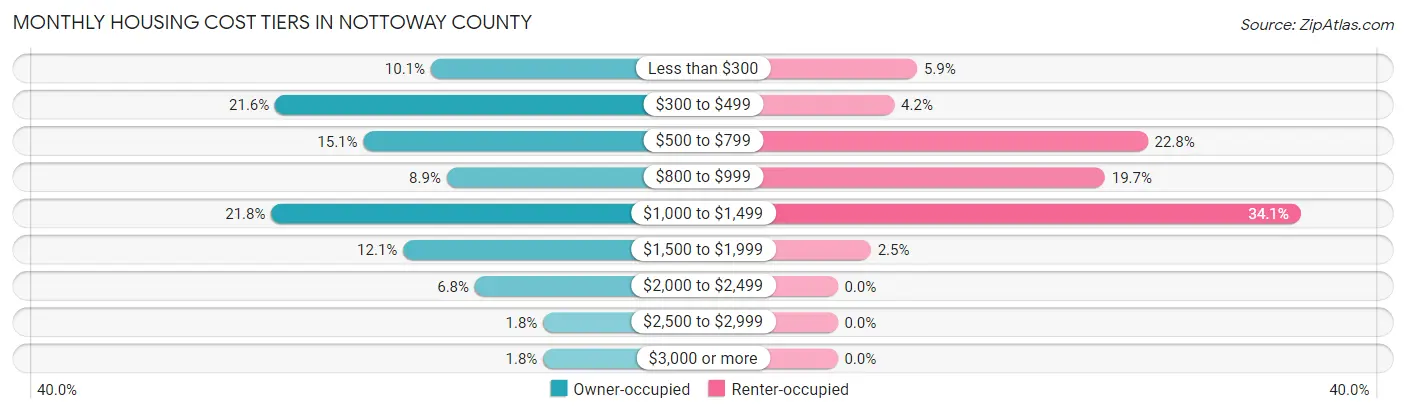
| Monthly Cost | Owner-occupied | Renter-occupied |
| Less than $300 | 389 (10.1%) | 91 (5.9%) |
| $300 to $499 | 832 (21.5%) | 65 (4.2%) |
| $500 to $799 | 581 (15.0%) | 355 (22.8%) |
| $800 to $999 | 344 (8.9%) | 306 (19.7%) |
| $1,000 to $1,499 | 843 (21.8%) | 530 (34.1%) |
| $1,500 to $1,999 | 468 (12.1%) | 38 (2.5%) |
| $2,000 to $2,499 | 264 (6.8%) | 0 (0.0%) |
| $2,500 to $2,999 | 70 (1.8%) | 0 (0.0%) |
| $3,000 or more | 70 (1.8%) | 0 (0.0%) |
| Total | 3,861 (100.0%) | 1,554 (100.0%) |
Physical Housing Characteristics in Nottoway County
Housing Structures in Nottoway County
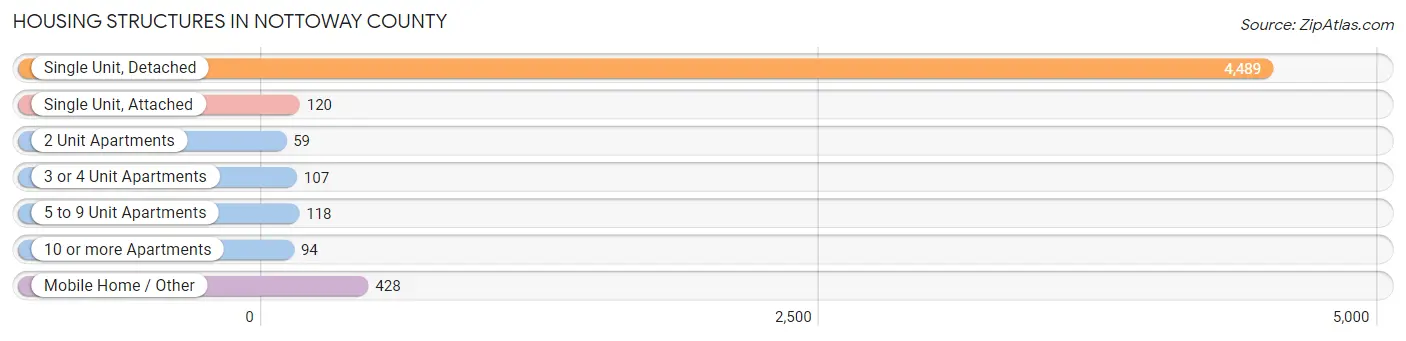
| Structure Type | # Housing Units | % Housing Units |
| Single Unit, Detached | 4,489 | 82.9% |
| Single Unit, Attached | 120 | 2.2% |
| 2 Unit Apartments | 59 | 1.1% |
| 3 or 4 Unit Apartments | 107 | 2.0% |
| 5 to 9 Unit Apartments | 118 | 2.2% |
| 10 or more Apartments | 94 | 1.7% |
| Mobile Home / Other | 428 | 7.9% |
| Total | 5,415 | 100.0% |
Housing Structures by Occupancy in Nottoway County
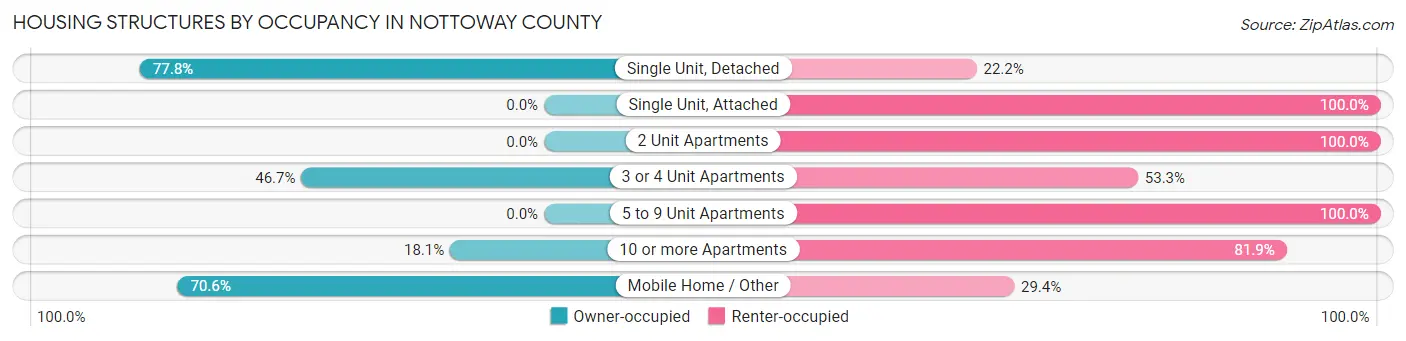
| Structure Type | Owner-occupied | Renter-occupied |
| Single Unit, Detached | 3,492 (77.8%) | 997 (22.2%) |
| Single Unit, Attached | 0 (0.0%) | 120 (100.0%) |
| 2 Unit Apartments | 0 (0.0%) | 59 (100.0%) |
| 3 or 4 Unit Apartments | 50 (46.7%) | 57 (53.3%) |
| 5 to 9 Unit Apartments | 0 (0.0%) | 118 (100.0%) |
| 10 or more Apartments | 17 (18.1%) | 77 (81.9%) |
| Mobile Home / Other | 302 (70.6%) | 126 (29.4%) |
| Total | 3,861 (71.3%) | 1,554 (28.7%) |
Housing Structures by Number of Rooms in Nottoway County
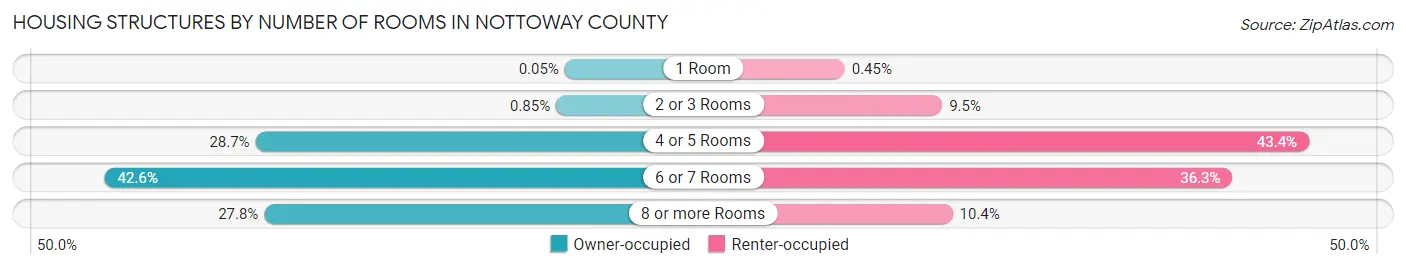
| Number of Rooms | Owner-occupied | Renter-occupied |
| 1 Room | 2 (0.1%) | 7 (0.4%) |
| 2 or 3 Rooms | 33 (0.9%) | 147 (9.5%) |
| 4 or 5 Rooms | 1,106 (28.6%) | 674 (43.4%) |
| 6 or 7 Rooms | 1,645 (42.6%) | 564 (36.3%) |
| 8 or more Rooms | 1,075 (27.8%) | 162 (10.4%) |
| Total | 3,861 (100.0%) | 1,554 (100.0%) |
Housing Structure by Heating Type in Nottoway County
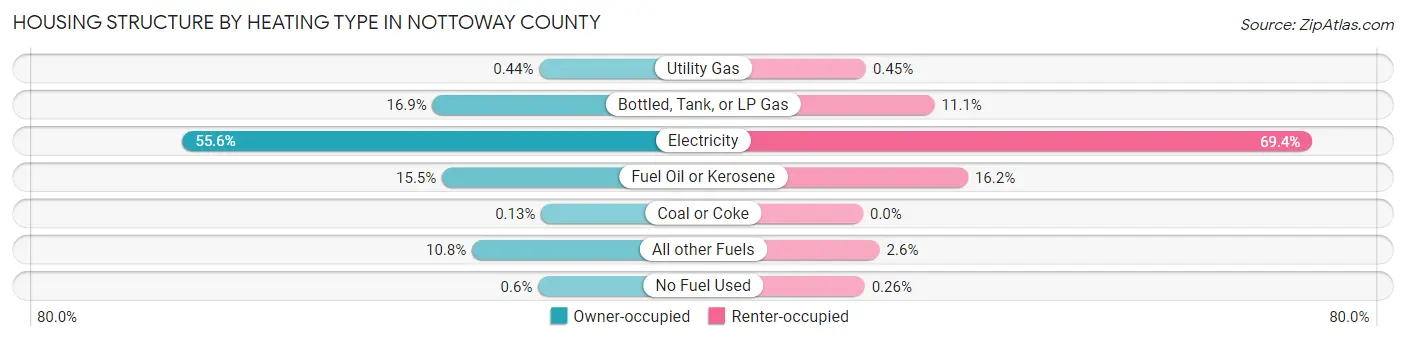
| Heating Type | Owner-occupied | Renter-occupied |
| Utility Gas | 17 (0.4%) | 7 (0.4%) |
| Bottled, Tank, or LP Gas | 654 (16.9%) | 172 (11.1%) |
| Electricity | 2,147 (55.6%) | 1,079 (69.4%) |
| Fuel Oil or Kerosene | 597 (15.5%) | 252 (16.2%) |
| Coal or Coke | 5 (0.1%) | 0 (0.0%) |
| All other Fuels | 418 (10.8%) | 40 (2.6%) |
| No Fuel Used | 23 (0.6%) | 4 (0.3%) |
| Total | 3,861 (100.0%) | 1,554 (100.0%) |
Household Vehicle Usage in Nottoway County
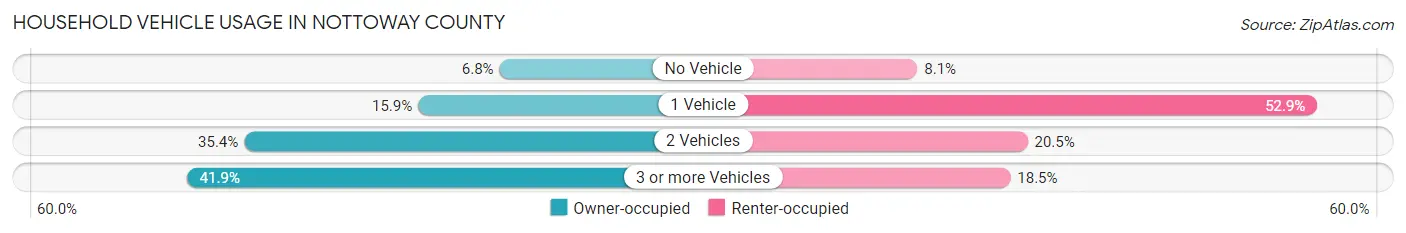
| Vehicles per Household | Owner-occupied | Renter-occupied |
| No Vehicle | 263 (6.8%) | 126 (8.1%) |
| 1 Vehicle | 615 (15.9%) | 822 (52.9%) |
| 2 Vehicles | 1,367 (35.4%) | 318 (20.5%) |
| 3 or more Vehicles | 1,616 (41.8%) | 288 (18.5%) |
| Total | 3,861 (100.0%) | 1,554 (100.0%) |
Real Estate & Mortgages in Nottoway County
Real Estate and Mortgage Overview in Nottoway County
| Characteristic | Without Mortgage | With Mortgage |
| Housing Units | 1,670 | 2,191 |
| Median Property Value | $161,500 | $194,400 |
| Median Household Income | $54,545 | $217 |
| Monthly Housing Costs | $377 | $70 |
| Real Estate Taxes | $725 | $12 |
Property Value by Mortgage Status in Nottoway County
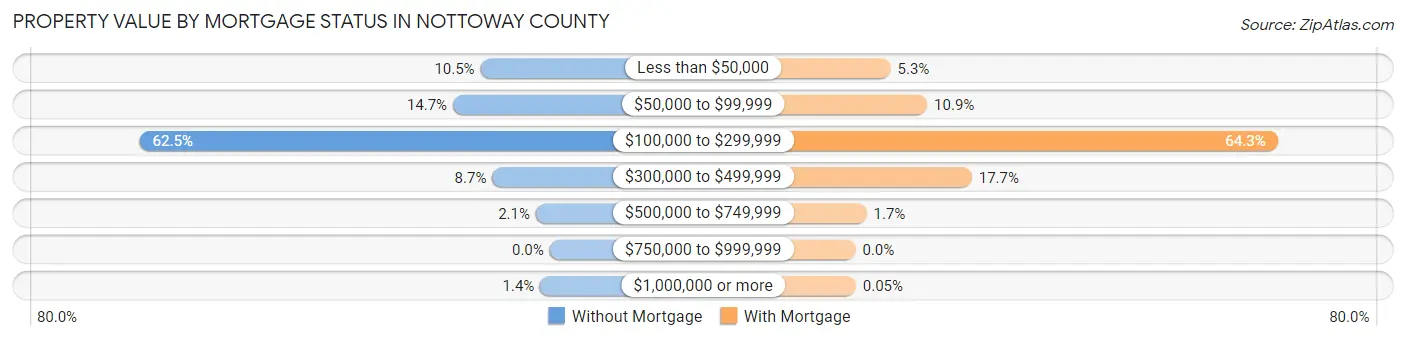
| Property Value | Without Mortgage | With Mortgage |
| Less than $50,000 | 176 (10.5%) | 117 (5.3%) |
| $50,000 to $99,999 | 246 (14.7%) | 239 (10.9%) |
| $100,000 to $299,999 | 1,043 (62.5%) | 1,409 (64.3%) |
| $300,000 to $499,999 | 146 (8.7%) | 388 (17.7%) |
| $500,000 to $749,999 | 35 (2.1%) | 37 (1.7%) |
| $750,000 to $999,999 | 0 (0.0%) | 0 (0.0%) |
| $1,000,000 or more | 24 (1.4%) | 1 (0.1%) |
| Total | 1,670 (100.0%) | 2,191 (100.0%) |
Household Income by Mortgage Status in Nottoway County
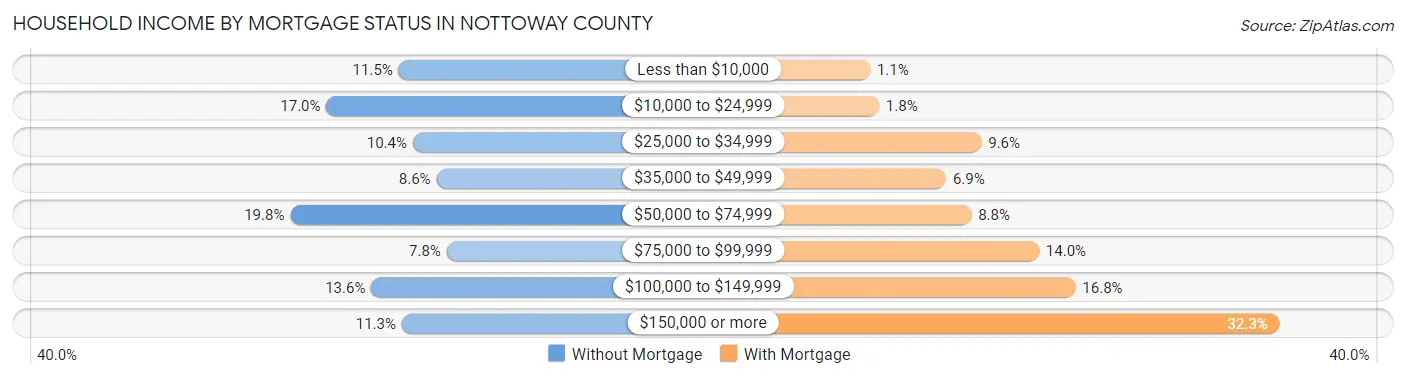
| Household Income | Without Mortgage | With Mortgage |
| Less than $10,000 | 192 (11.5%) | 24 (1.1%) |
| $10,000 to $24,999 | 284 (17.0%) | 39 (1.8%) |
| $25,000 to $34,999 | 174 (10.4%) | 210 (9.6%) |
| $35,000 to $49,999 | 144 (8.6%) | 151 (6.9%) |
| $50,000 to $74,999 | 330 (19.8%) | 193 (8.8%) |
| $75,000 to $99,999 | 131 (7.8%) | 306 (14.0%) |
| $100,000 to $149,999 | 227 (13.6%) | 367 (16.8%) |
| $150,000 or more | 188 (11.3%) | 708 (32.3%) |
| Total | 1,670 (100.0%) | 2,191 (100.0%) |
Property Value to Household Income Ratio in Nottoway County
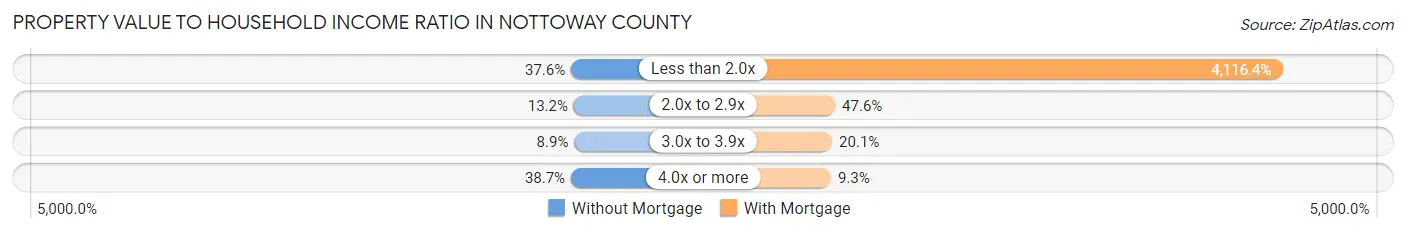
| Value-to-Income Ratio | Without Mortgage | With Mortgage |
| Less than 2.0x | 628 (37.6%) | 90,191 (4,116.4%) |
| 2.0x to 2.9x | 220 (13.2%) | 1,042 (47.6%) |
| 3.0x to 3.9x | 148 (8.9%) | 441 (20.1%) |
| 4.0x or more | 647 (38.7%) | 203 (9.3%) |
| Total | 1,670 (100.0%) | 2,191 (100.0%) |
Real Estate Taxes by Mortgage Status in Nottoway County
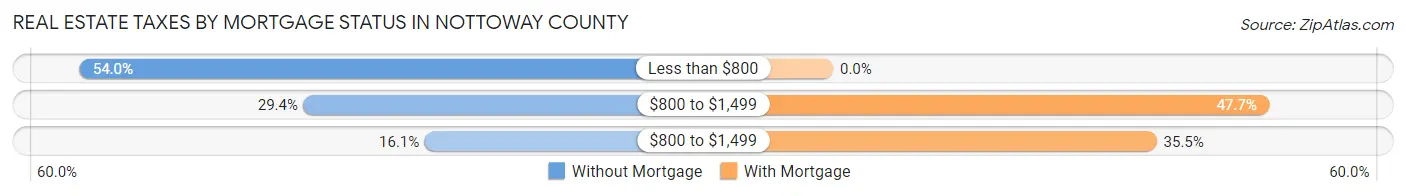
| Property Taxes | Without Mortgage | With Mortgage |
| Less than $800 | 901 (53.9%) | 0 (0.0%) |
| $800 to $1,499 | 491 (29.4%) | 1,046 (47.7%) |
| $800 to $1,499 | 269 (16.1%) | 777 (35.5%) |
| Total | 1,670 (100.0%) | 2,191 (100.0%) |
Health & Disability in Nottoway County
Health Insurance Coverage by Age in Nottoway County
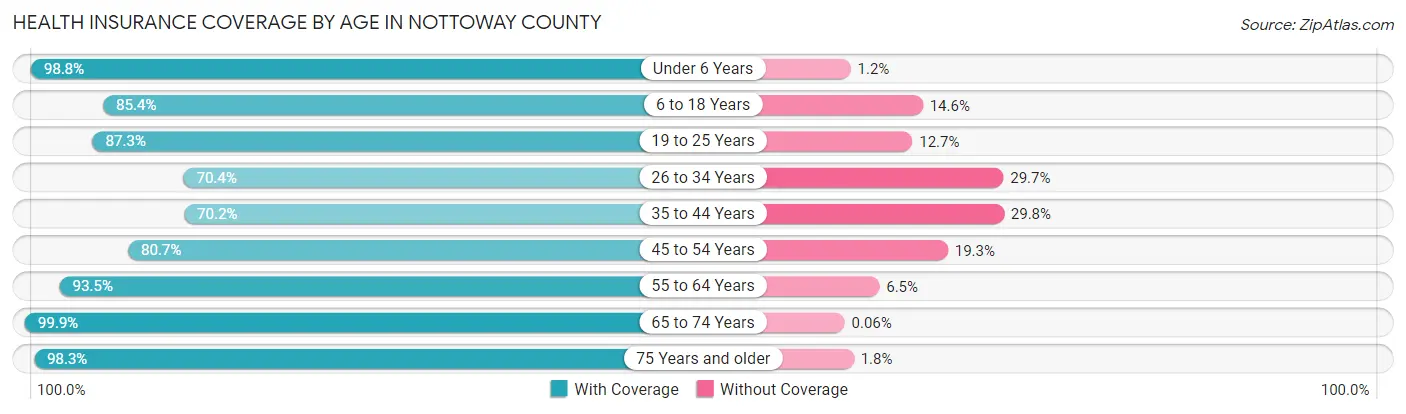
| Age Bracket | With Coverage | Without Coverage |
| Under 6 Years | 1,013 (98.8%) | 12 (1.2%) |
| 6 to 18 Years | 1,973 (85.4%) | 338 (14.6%) |
| 19 to 25 Years | 1,095 (87.3%) | 159 (12.7%) |
| 26 to 34 Years | 1,039 (70.4%) | 438 (29.6%) |
| 35 to 44 Years | 1,048 (70.2%) | 444 (29.8%) |
| 45 to 54 Years | 1,376 (80.7%) | 329 (19.3%) |
| 55 to 64 Years | 1,919 (93.5%) | 134 (6.5%) |
| 65 to 74 Years | 1,610 (99.9%) | 1 (0.1%) |
| 75 Years and older | 957 (98.3%) | 17 (1.8%) |
| Total | 12,030 (86.5%) | 1,872 (13.5%) |
Health Insurance Coverage by Citizenship Status in Nottoway County
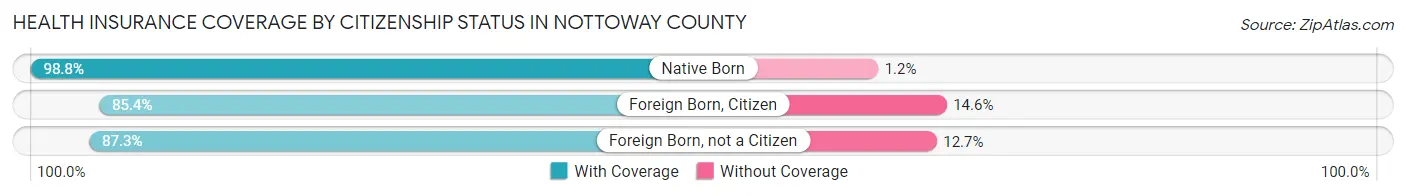
| Citizenship Status | With Coverage | Without Coverage |
| Native Born | 1,013 (98.8%) | 12 (1.2%) |
| Foreign Born, Citizen | 1,973 (85.4%) | 338 (14.6%) |
| Foreign Born, not a Citizen | 1,095 (87.3%) | 159 (12.7%) |
Health Insurance Coverage by Household Income in Nottoway County
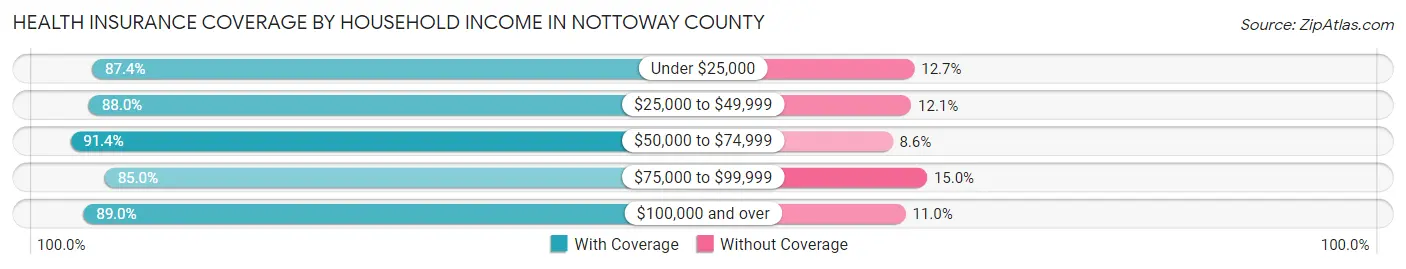
| Household Income | With Coverage | Without Coverage |
| Under $25,000 | 1,685 (87.4%) | 244 (12.7%) |
| $25,000 to $49,999 | 2,218 (87.9%) | 304 (12.0%) |
| $50,000 to $74,999 | 2,382 (91.4%) | 223 (8.6%) |
| $75,000 to $99,999 | 1,443 (85.0%) | 255 (15.0%) |
| $100,000 and over | 4,006 (89.0%) | 495 (11.0%) |
Public vs Private Health Insurance Coverage by Age in Nottoway County
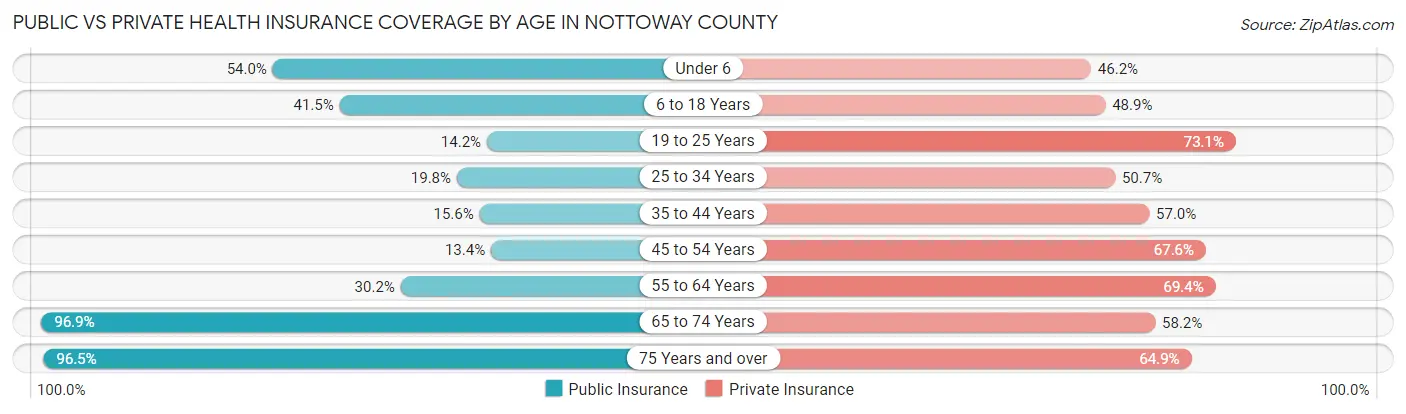
| Age Bracket | Public Insurance | Private Insurance |
| Under 6 | 553 (53.9%) | 474 (46.2%) |
| 6 to 18 Years | 960 (41.5%) | 1,130 (48.9%) |
| 19 to 25 Years | 178 (14.2%) | 917 (73.1%) |
| 25 to 34 Years | 292 (19.8%) | 749 (50.7%) |
| 35 to 44 Years | 232 (15.5%) | 851 (57.0%) |
| 45 to 54 Years | 229 (13.4%) | 1,152 (67.6%) |
| 55 to 64 Years | 620 (30.2%) | 1,424 (69.4%) |
| 65 to 74 Years | 1,561 (96.9%) | 937 (58.2%) |
| 75 Years and over | 940 (96.5%) | 632 (64.9%) |
| Total | 5,565 (40.0%) | 8,266 (59.5%) |
Disability Status by Sex by Age in Nottoway County
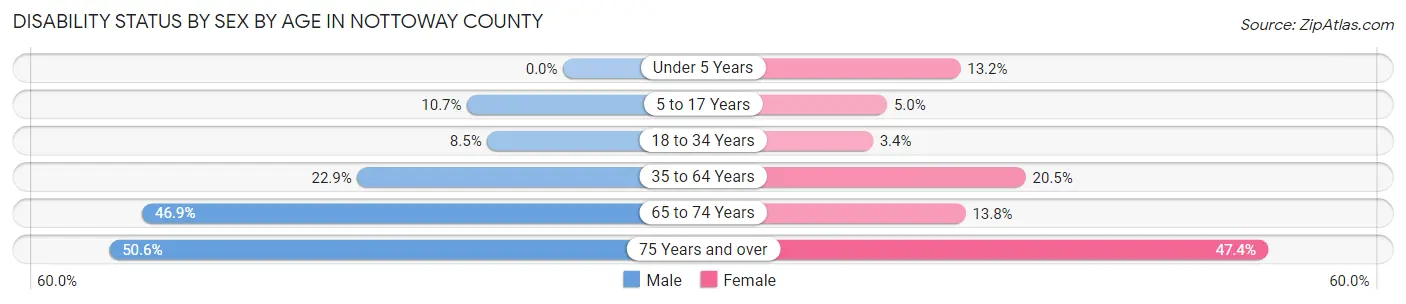
| Age Bracket | Male | Female |
| Under 5 Years | 0 (0.0%) | 52 (13.2%) |
| 5 to 17 Years | 110 (10.7%) | 63 (5.0%) |
| 18 to 34 Years | 136 (8.5%) | 48 (3.4%) |
| 35 to 64 Years | 593 (22.9%) | 545 (20.5%) |
| 65 to 74 Years | 364 (46.9%) | 115 (13.8%) |
| 75 Years and over | 176 (50.6%) | 297 (47.4%) |
Disability Class by Sex by Age in Nottoway County
Disability Class: Hearing Difficulty
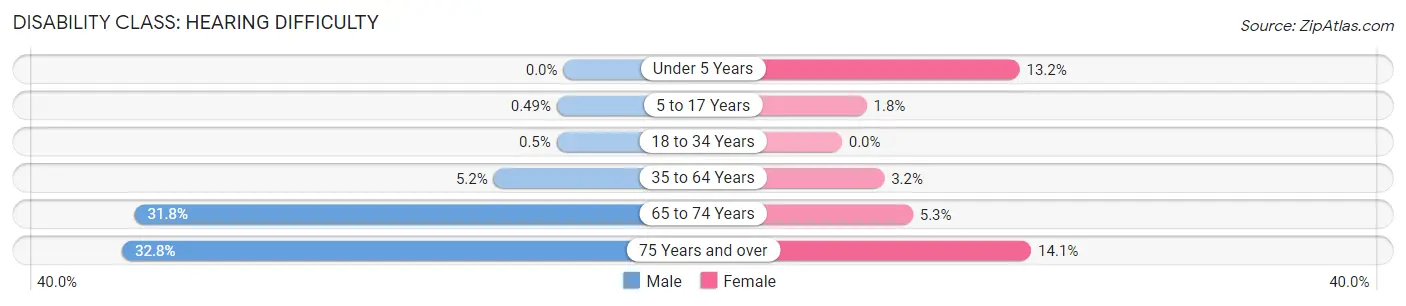
| Age Bracket | Male | Female |
| Under 5 Years | 0 (0.0%) | 52 (13.2%) |
| 5 to 17 Years | 5 (0.5%) | 23 (1.8%) |
| 18 to 34 Years | 8 (0.5%) | 0 (0.0%) |
| 35 to 64 Years | 134 (5.2%) | 84 (3.2%) |
| 65 to 74 Years | 247 (31.8%) | 44 (5.3%) |
| 75 Years and over | 114 (32.8%) | 88 (14.1%) |
Disability Class: Vision Difficulty
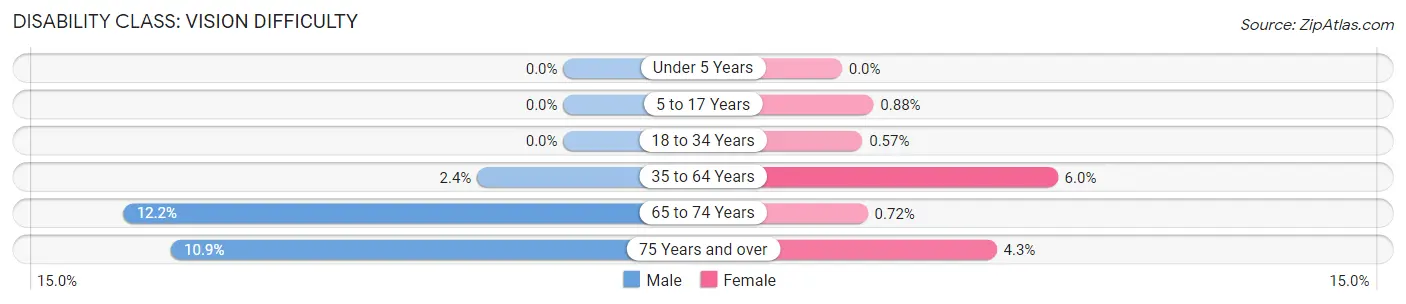
| Age Bracket | Male | Female |
| Under 5 Years | 0 (0.0%) | 0 (0.0%) |
| 5 to 17 Years | 0 (0.0%) | 11 (0.9%) |
| 18 to 34 Years | 0 (0.0%) | 8 (0.6%) |
| 35 to 64 Years | 62 (2.4%) | 160 (6.0%) |
| 65 to 74 Years | 95 (12.2%) | 6 (0.7%) |
| 75 Years and over | 38 (10.9%) | 27 (4.3%) |
Disability Class: Cognitive Difficulty
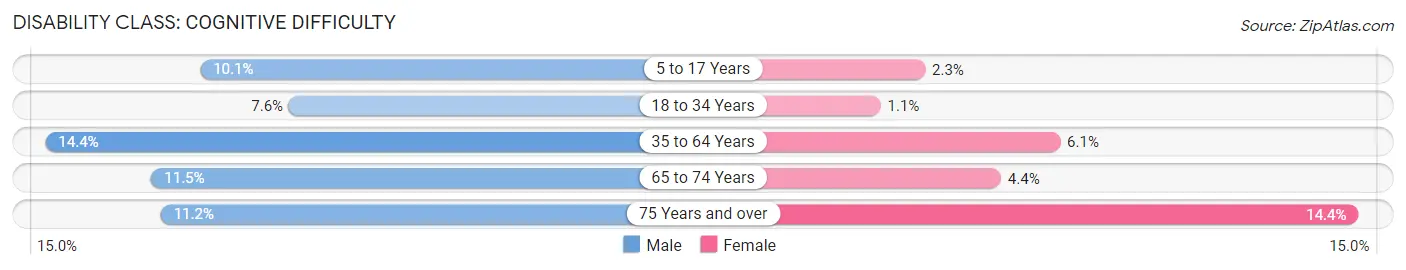
| Age Bracket | Male | Female |
| 5 to 17 Years | 104 (10.1%) | 29 (2.3%) |
| 18 to 34 Years | 123 (7.6%) | 15 (1.1%) |
| 35 to 64 Years | 373 (14.4%) | 162 (6.1%) |
| 65 to 74 Years | 89 (11.5%) | 37 (4.4%) |
| 75 Years and over | 39 (11.2%) | 90 (14.4%) |
Disability Class: Ambulatory Difficulty
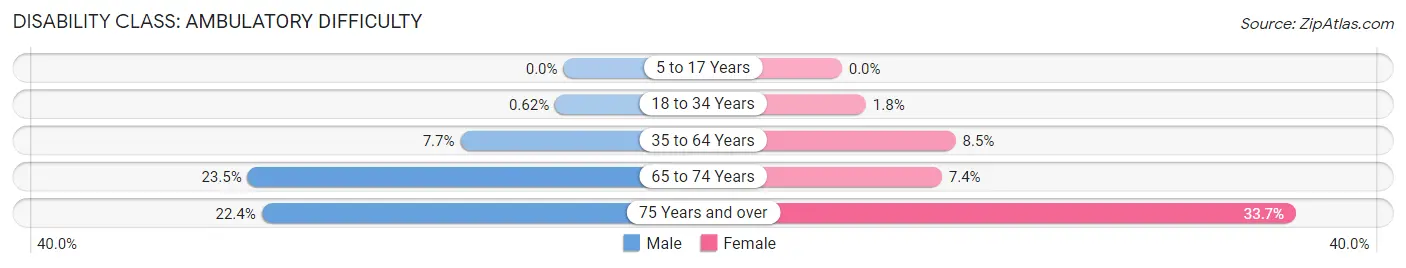
| Age Bracket | Male | Female |
| 5 to 17 Years | 0 (0.0%) | 0 (0.0%) |
| 18 to 34 Years | 10 (0.6%) | 25 (1.8%) |
| 35 to 64 Years | 198 (7.6%) | 225 (8.5%) |
| 65 to 74 Years | 182 (23.4%) | 62 (7.4%) |
| 75 Years and over | 78 (22.4%) | 211 (33.7%) |
Disability Class: Self-Care Difficulty
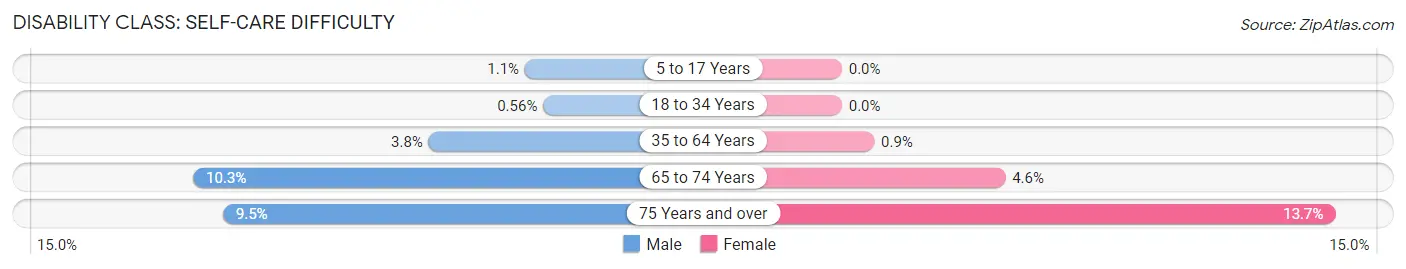
| Age Bracket | Male | Female |
| 5 to 17 Years | 11 (1.1%) | 0 (0.0%) |
| 18 to 34 Years | 9 (0.6%) | 0 (0.0%) |
| 35 to 64 Years | 97 (3.7%) | 24 (0.9%) |
| 65 to 74 Years | 80 (10.3%) | 38 (4.5%) |
| 75 Years and over | 33 (9.5%) | 86 (13.7%) |
Technology Access in Nottoway County
Computing Device Access in Nottoway County
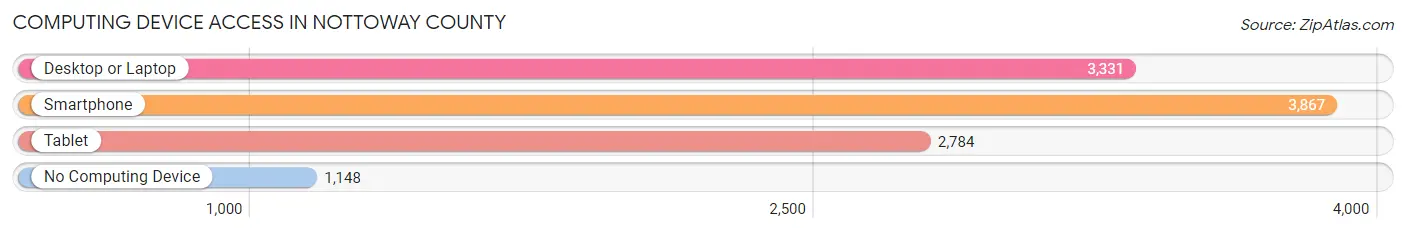
| Device Type | # Households | % Households |
| Desktop or Laptop | 3,331 | 61.5% |
| Smartphone | 3,867 | 71.4% |
| Tablet | 2,784 | 51.4% |
| No Computing Device | 1,148 | 21.2% |
| Total | 5,415 | 100.0% |
Internet Access in Nottoway County

| Internet Type | # Households | % Households |
| Dial-Up Internet | 39 | 0.7% |
| Broadband Home | 2,139 | 39.5% |
| Cellular Data Only | 1,252 | 23.1% |
| Satellite Internet | 598 | 11.0% |
| No Internet | 1,540 | 28.4% |
| Total | 5,415 | 100.0% |
Nottoway County Summary
Nottoway County is located in the south-central part of the Commonwealth of Virginia. It is bordered by Amelia, Dinwiddie, Prince Edward, and Brunswick counties. The county seat is Nottoway Court House. The county was established in 1789 and named for the Nottoway Indians, who were the original inhabitants of the area.
Geography
Nottoway County is located in the Piedmont region of Virginia. The county is mostly flat, with rolling hills in the northern and western parts. The Appomattox River forms the northern border of the county, and the Nottoway River forms the eastern border. The county is mostly rural, with a few small towns and villages scattered throughout. The largest town is Blackstone, which is located in the northern part of the county.
The county has a total area of 441 square miles, of which 437 square miles is land and 4.2 square miles is water. The county is home to several state parks, including High Bridge Trail State Park, Twin Lakes State Park, and Staunton River State Park.
Economy
Nottoway County has a diverse economy, with a mix of agriculture, manufacturing, and services. The county is home to several large employers, including the Nottoway Correctional Center, the Nottoway County Public Schools, and the Nottoway County Sheriff's Office.
Agriculture is an important part of the county's economy. The county is home to several large farms, including the Nottoway Plantation, which is one of the largest farms in the state. The county is also home to several wineries, including the Nottoway Winery and the Nottoway Vineyards.
Manufacturing is also an important part of the county's economy. The county is home to several large manufacturing companies, including the Nottoway Manufacturing Company, which produces furniture, and the Nottoway Plastics Company, which produces plastic products.
Demographics
As of the 2010 census, the population of Nottoway County was 15,853. The population has remained relatively stable over the past decade. The population is mostly white (87.3%), with African Americans making up 8.3% of the population. The median household income is $45,837, and the median home value is $133,400.
The county is home to several small towns and villages, including Blackstone, Crewe, and Burkeville. The county is also home to several large employers, including the Nottoway Correctional Center, the Nottoway County Public Schools, and the Nottoway County Sheriff's Office.
Conclusion
Nottoway County is a rural county located in the south-central part of Virginia. The county is home to several small towns and villages, and is mostly rural, with a few small towns and villages scattered throughout. The county has a diverse economy, with a mix of agriculture, manufacturing, and services. The population of the county is mostly white, with African Americans making up 8.3% of the population. The median household income is $45,837, and the median home value is $133,400.
Common Questions
What is Per Capita Income in Nottoway County?
Per Capita income in Nottoway County is $27,223.
What is the Median Family Income in Nottoway County?
Median Family Income in Nottoway County is $81,284.
What is the Median Household income in Nottoway County?
Median Household Income in Nottoway County is $62,366.
What is Income or Wage Gap in Nottoway County?
Income or Wage Gap in Nottoway County is 20.4%.
Women in Nottoway County earn 79.6 cents for every dollar earned by a man.
What is Family Income Deficit in Nottoway County?
Family Income Deficit in Nottoway County is $10,743.
Families that are below poverty line in Nottoway County earn $10,743 less on average than the poverty threshold level.
What is Inequality or Gini Index in Nottoway County?
Inequality or Gini Index in Nottoway County is 0.45.
What is the Total Population of Nottoway County?
Total Population of Nottoway County is 15,638.
What is the Total Male Population of Nottoway County?
Total Male Population of Nottoway County is 8,295.
What is the Total Female Population of Nottoway County?
Total Female Population of Nottoway County is 7,343.
What is the Ratio of Males per 100 Females in Nottoway County?
There are 112.96 Males per 100 Females in Nottoway County.
What is the Ratio of Females per 100 Males in Nottoway County?
There are 88.52 Females per 100 Males in Nottoway County.
What is the Median Population Age in Nottoway County?
Median Population Age in Nottoway County is 41.3 Years.
What is the Average Family Size in Nottoway County
Average Family Size in Nottoway County is 3.0 People.
What is the Average Household Size in Nottoway County
Average Household Size in Nottoway County is 2.5 People.
How Large is the Labor Force in Nottoway County?
There are 6,486 People in the Labor Forcein in Nottoway County.
What is the Percentage of People in the Labor Force in Nottoway County?
50.1% of People are in the Labor Force in Nottoway County.
What is the Unemployment Rate in Nottoway County?
Unemployment Rate in Nottoway County is 6.4%.