Norton city, VA Map & Demographics
Norton city Map
Norton city Overview
$27,666
PER CAPITA INCOME
$59,750
AVG FAMILY INCOME
$36,974
AVG HOUSEHOLD INCOME
8.1%
WAGE / INCOME GAP [ % ]
91.9¢/ $1
WAGE / INCOME GAP [ $ ]
0.52
INEQUALITY / GINI INDEX
3,668
TOTAL POPULATION
1,692
MALE POPULATION
1,976
FEMALE POPULATION
85.63
MALES / 100 FEMALES
116.78
FEMALES / 100 MALES
43.6
MEDIAN AGE
3.0
AVG FAMILY SIZE
2.3
AVG HOUSEHOLD SIZE
1,625
LABOR FORCE [ PEOPLE ]
51.8%
PERCENT IN LABOR FORCE
7.3%
UNEMPLOYMENT RATE
Norton city Area Codes
Income in Norton city
Income Overview in Norton city
Per Capita Income in Norton city is $27,666, while median incomes of families and households are $59,750 and $36,974 respectively.
| Characteristic | Number | Measure |
| Per Capita Income | 3,668 | $27,666 |
| Median Family Income | 867 | $59,750 |
| Mean Family Income | 867 | $77,636 |
| Median Household Income | 1,592 | $36,974 |
| Mean Household Income | 1,592 | $57,800 |
| Income Deficit | 867 | $0 |
| Wage / Income Gap (%) | 3,668 | 8.07% |
| Wage / Income Gap ($) | 3,668 | 91.93¢ per $1 |
| Gini / Inequality Index | 3,668 | 0.52 |
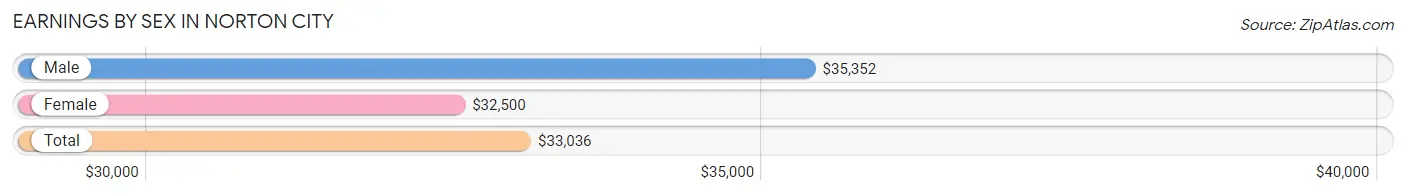
Earnings by Sex in Norton city
Average Earnings in Norton city are $33,036, $35,352 for men and $32,500 for women, a difference of 8.1%.
| Sex | Number | Average Earnings |
| Male | 921 (58.0%) | $35,352 |
| Female | 668 (42.0%) | $32,500 |
| Total | 1,589 (100.0%) | $33,036 |
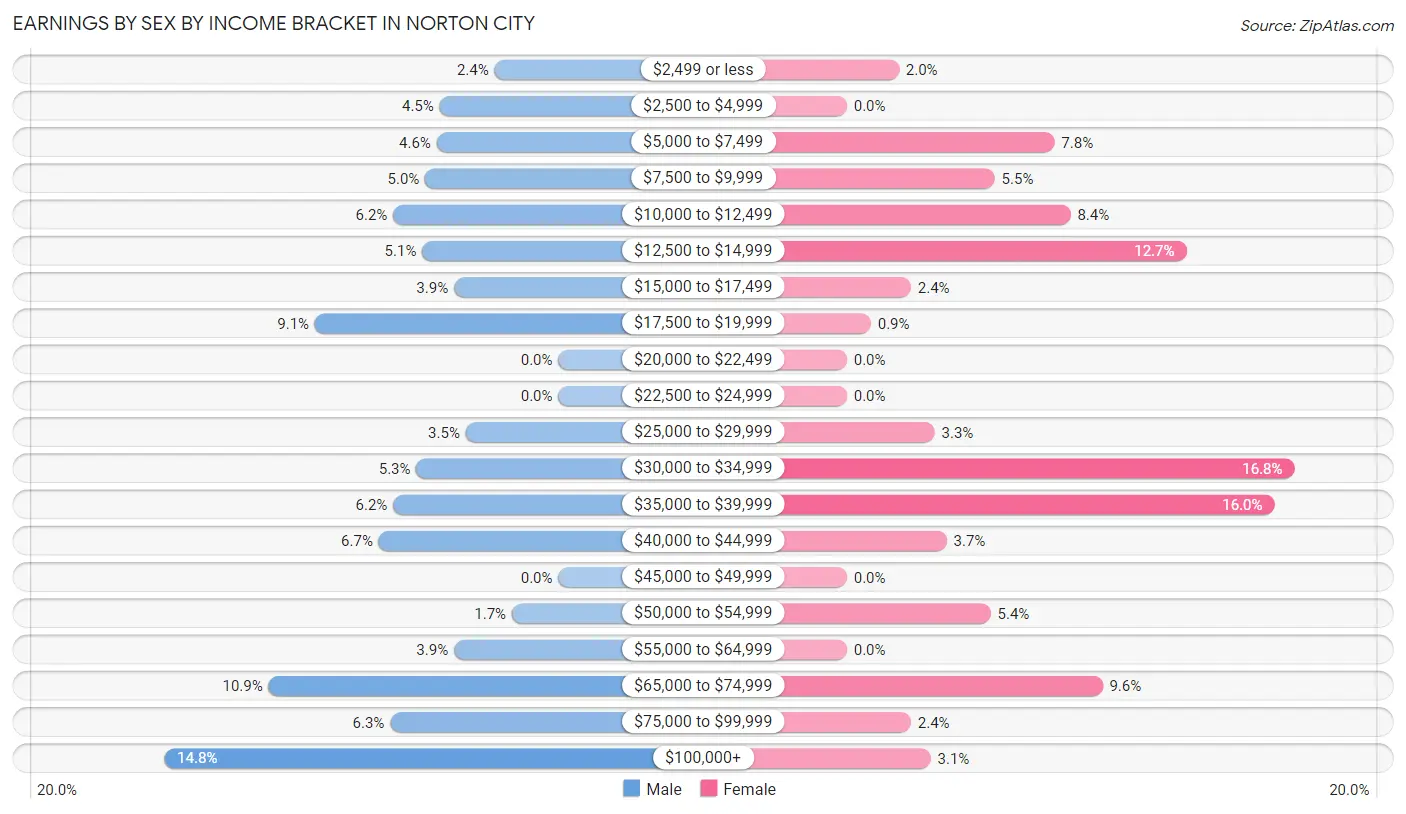
Earnings by Sex by Income Bracket in Norton city
The most common earnings brackets in Norton city are $100,000+ for men (136 | 14.8%) and $30,000 to $34,999 for women (112 | 16.8%).
| Income | Male | Female |
| $2,499 or less | 22 (2.4%) | 13 (1.9%) |
| $2,500 to $4,999 | 41 (4.4%) | 0 (0.0%) |
| $5,000 to $7,499 | 42 (4.6%) | 52 (7.8%) |
| $7,500 to $9,999 | 46 (5.0%) | 37 (5.5%) |
| $10,000 to $12,499 | 57 (6.2%) | 56 (8.4%) |
| $12,500 to $14,999 | 47 (5.1%) | 85 (12.7%) |
| $15,000 to $17,499 | 36 (3.9%) | 16 (2.4%) |
| $17,500 to $19,999 | 84 (9.1%) | 6 (0.9%) |
| $20,000 to $22,499 | 0 (0.0%) | 0 (0.0%) |
| $22,500 to $24,999 | 0 (0.0%) | 0 (0.0%) |
| $25,000 to $29,999 | 32 (3.5%) | 22 (3.3%) |
| $30,000 to $34,999 | 49 (5.3%) | 112 (16.8%) |
| $35,000 to $39,999 | 57 (6.2%) | 107 (16.0%) |
| $40,000 to $44,999 | 62 (6.7%) | 25 (3.7%) |
| $45,000 to $49,999 | 0 (0.0%) | 0 (0.0%) |
| $50,000 to $54,999 | 16 (1.7%) | 36 (5.4%) |
| $55,000 to $64,999 | 36 (3.9%) | 0 (0.0%) |
| $65,000 to $74,999 | 100 (10.9%) | 64 (9.6%) |
| $75,000 to $99,999 | 58 (6.3%) | 16 (2.4%) |
| $100,000+ | 136 (14.8%) | 21 (3.1%) |
| Total | 921 (100.0%) | 668 (100.0%) |
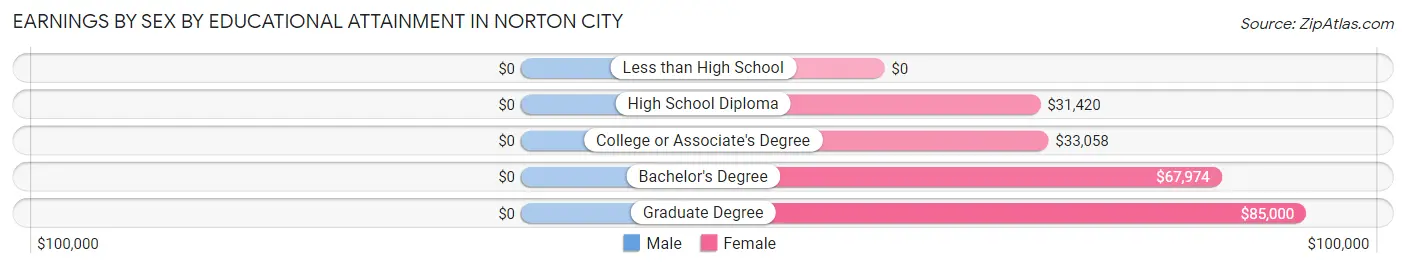
Earnings by Sex by Educational Attainment in Norton city
| Educational Attainment | Male Income | Female Income |
| Less than High School | - | - |
| High School Diploma | - | - |
| College or Associate's Degree | - | - |
| Bachelor's Degree | - | - |
| Graduate Degree | - | - |
| Total | $42,194 | $34,154 |
Family Income in Norton city
Family Income Brackets in Norton city
According to the Norton city family income data, there are 159 families falling into the $35,000 to $49,999 income range, which is the most common income bracket and makes up 18.3% of all families. Conversely, the $15,000 to $24,999 income bracket is the least frequent group with only 27 families (3.1%) belonging to this category.
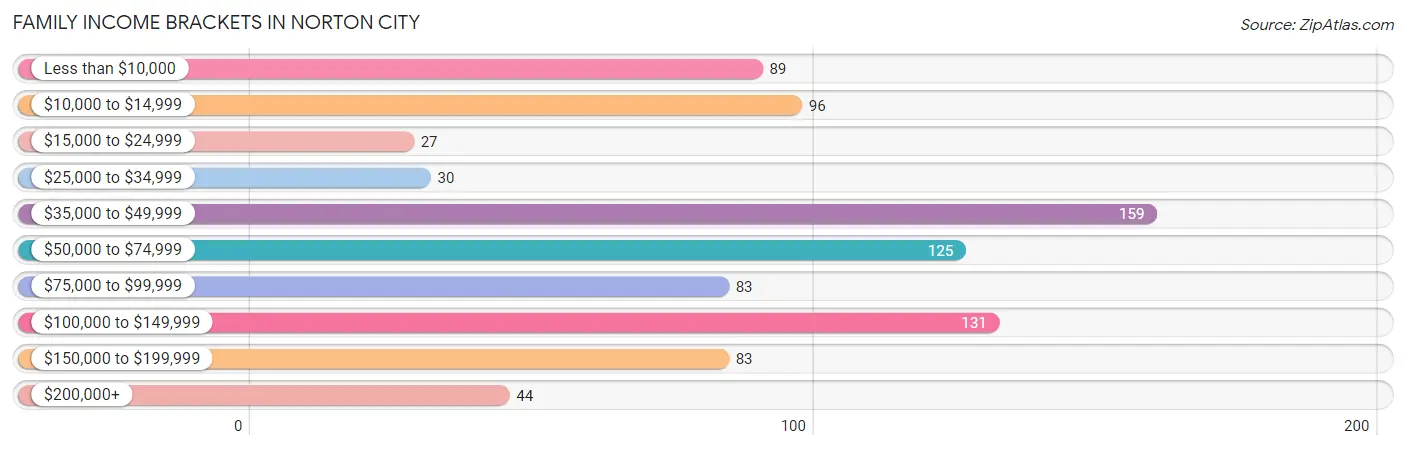
| Income Bracket | # Families | % Families |
| Less than $10,000 | 89 | 10.3% |
| $10,000 to $14,999 | 96 | 11.1% |
| $15,000 to $24,999 | 27 | 3.1% |
| $25,000 to $34,999 | 30 | 3.5% |
| $35,000 to $49,999 | 159 | 18.3% |
| $50,000 to $74,999 | 125 | 14.4% |
| $75,000 to $99,999 | 83 | 9.6% |
| $100,000 to $149,999 | 131 | 15.1% |
| $150,000 to $199,999 | 83 | 9.6% |
| $200,000+ | 44 | 5.1% |
Family Income by Famaliy Size in Norton city
2-person families (392 | 45.2%) account for the highest median family income in Norton city with $56,500 per family, while 2-person families (392 | 45.2%) have the highest median income of $28,250 per family member.
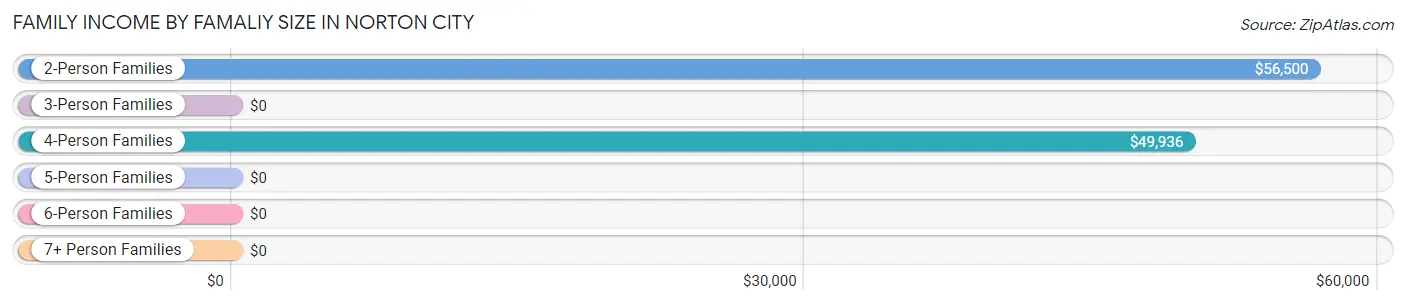
| Income Bracket | # Families | Median Income |
| 2-Person Families | 392 (45.2%) | $56,500 |
| 3-Person Families | 242 (27.9%) | $0 |
| 4-Person Families | 202 (23.3%) | $49,936 |
| 5-Person Families | 31 (3.6%) | $0 |
| 6-Person Families | 0 (0.0%) | $0 |
| 7+ Person Families | 0 (0.0%) | $0 |
| Total | 867 (100.0%) | $59,750 |
Family Income by Number of Earners in Norton city
The median family income in Norton city is $59,750, with families comprising 2 earners (211) having the highest median family income of $112,958, while families with no earners (297) have the lowest median family income of $32,868, accounting for 24.3% and 34.3% of families, respectively.
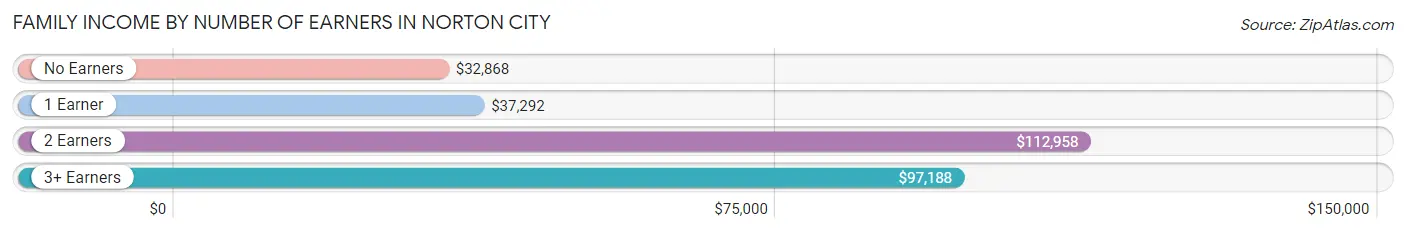
| Number of Earners | # Families | Median Income |
| No Earners | 297 (34.3%) | $32,868 |
| 1 Earner | 257 (29.6%) | $37,292 |
| 2 Earners | 211 (24.3%) | $112,958 |
| 3+ Earners | 102 (11.8%) | $97,188 |
| Total | 867 (100.0%) | $59,750 |
Household Income in Norton city
Household Income Brackets in Norton city
With 252 households falling in the category, the $10,000 to $14,999 income range is the most frequent in Norton city, accounting for 15.8% of all households. In contrast, only 49 households (3.1%) fall into the $200,000+ income bracket, making it the least populous group.
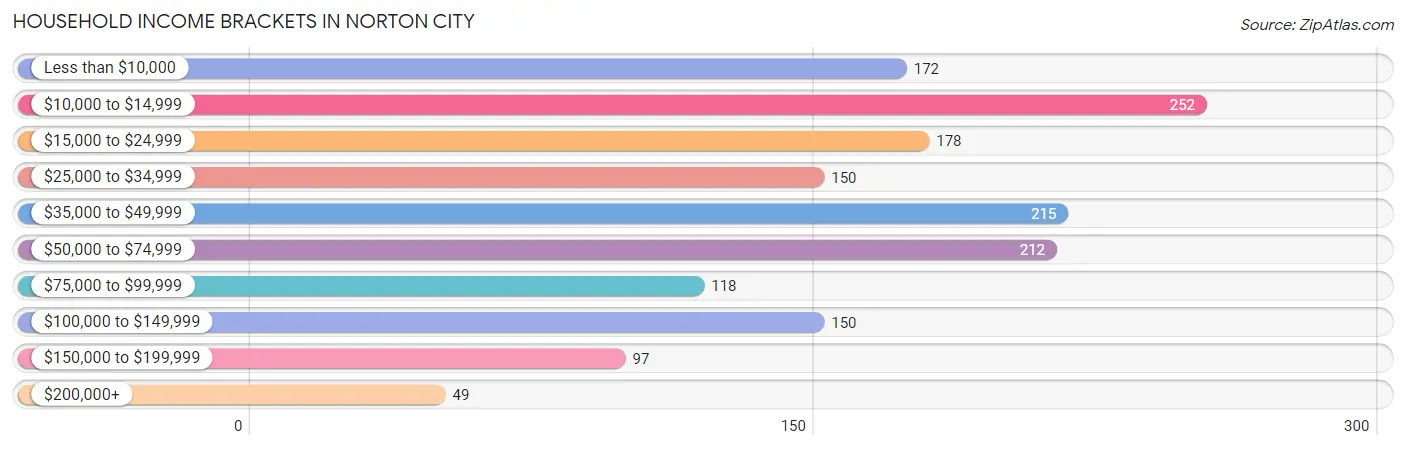
| Income Bracket | # Households | % Households |
| Less than $10,000 | 172 | 10.8% |
| $10,000 to $14,999 | 252 | 15.8% |
| $15,000 to $24,999 | 178 | 11.2% |
| $25,000 to $34,999 | 150 | 9.4% |
| $35,000 to $49,999 | 215 | 13.5% |
| $50,000 to $74,999 | 212 | 13.3% |
| $75,000 to $99,999 | 118 | 7.4% |
| $100,000 to $149,999 | 150 | 9.4% |
| $150,000 to $199,999 | 97 | 6.1% |
| $200,000+ | 49 | 3.1% |
Household Income by Householder Age in Norton city
The median household income in Norton city is $36,974, with the highest median household income of $48,205 found in the 45 to 64 years age bracket for the primary householder. A total of 520 households (32.7%) fall into this category. Meanwhile, the 15 to 24 years age bracket for the primary householder has the lowest median household income of $0, with 45 households (2.8%) in this group.
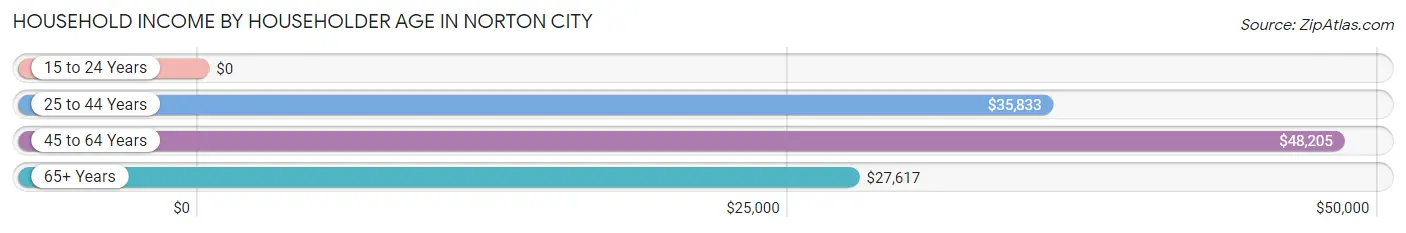
| Income Bracket | # Households | Median Income |
| 15 to 24 Years | 45 (2.8%) | $0 |
| 25 to 44 Years | 432 (27.1%) | $35,833 |
| 45 to 64 Years | 520 (32.7%) | $48,205 |
| 65+ Years | 595 (37.4%) | $27,617 |
| Total | 1,592 (100.0%) | $36,974 |
Poverty in Norton city
Income Below Poverty by Sex and Age in Norton city
With 27.2% poverty level for males and 30.8% for females among the residents of Norton city, under 5 year old males and 18 to 24 year old females are the most vulnerable to poverty, with 49 males (100.0%) and 110 females (71.4%) in their respective age groups living below the poverty level.
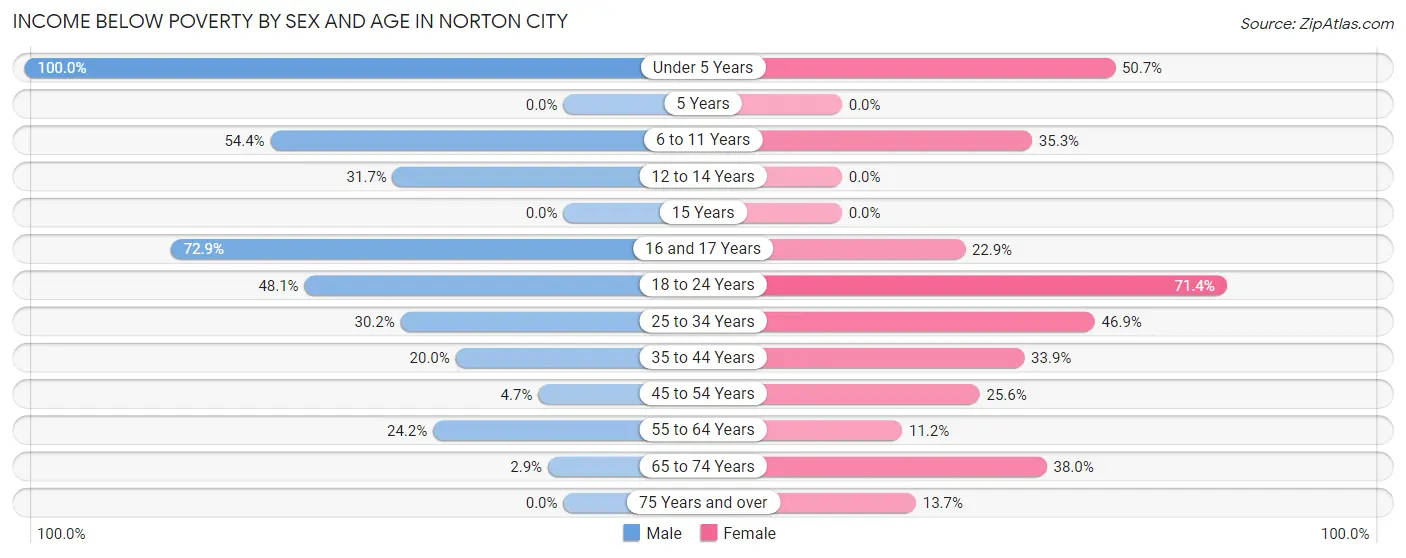
| Age Bracket | Male | Female |
| Under 5 Years | 49 (100.0%) | 36 (50.7%) |
| 5 Years | 0 (0.0%) | 0 (0.0%) |
| 6 to 11 Years | 56 (54.4%) | 30 (35.3%) |
| 12 to 14 Years | 32 (31.7%) | 0 (0.0%) |
| 15 Years | 0 (0.0%) | 0 (0.0%) |
| 16 and 17 Years | 43 (72.9%) | 8 (22.9%) |
| 18 to 24 Years | 99 (48.1%) | 110 (71.4%) |
| 25 to 34 Years | 55 (30.2%) | 92 (46.9%) |
| 35 to 44 Years | 54 (20.0%) | 88 (33.9%) |
| 45 to 54 Years | 11 (4.7%) | 56 (25.6%) |
| 55 to 64 Years | 52 (24.2%) | 33 (11.2%) |
| 65 to 74 Years | 5 (2.9%) | 111 (38.0%) |
| 75 Years and over | 0 (0.0%) | 29 (13.7%) |
| Total | 456 (27.2%) | 593 (30.8%) |
Income Above Poverty by Sex and Age in Norton city
According to the poverty statistics in Norton city, males aged 15 years and females aged 12 to 14 years are the age groups that are most secure financially, with 100.0% of males and 100.0% of females in these age groups living above the poverty line.
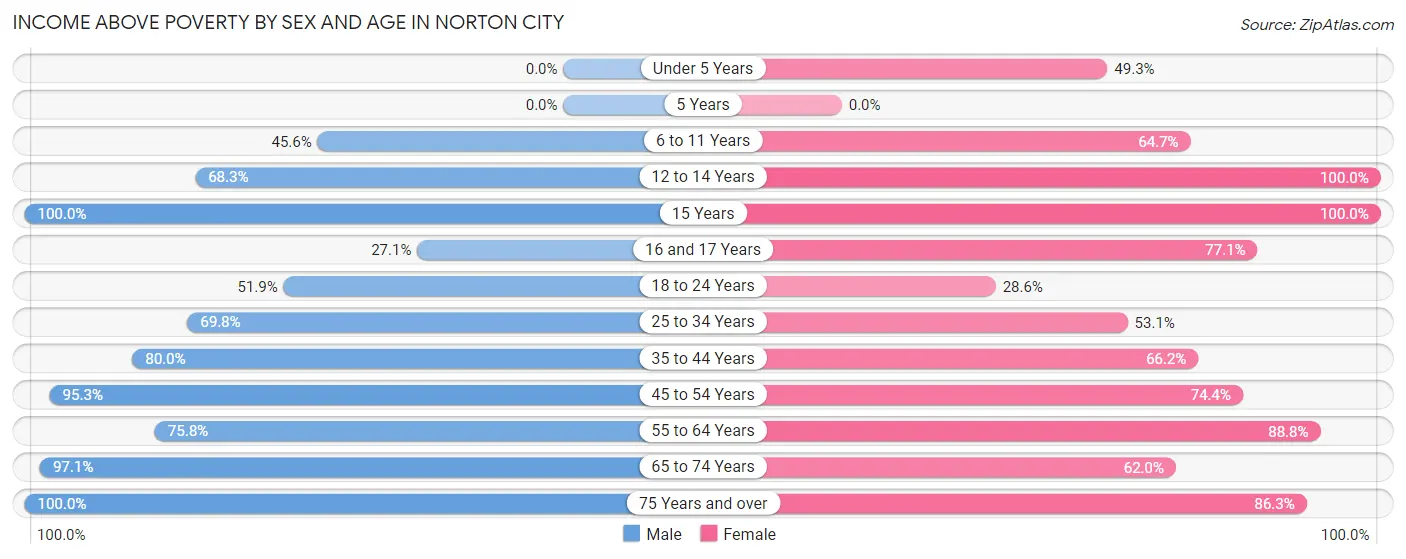
| Age Bracket | Male | Female |
| Under 5 Years | 0 (0.0%) | 35 (49.3%) |
| 5 Years | 0 (0.0%) | 0 (0.0%) |
| 6 to 11 Years | 47 (45.6%) | 55 (64.7%) |
| 12 to 14 Years | 69 (68.3%) | 95 (100.0%) |
| 15 Years | 11 (100.0%) | 15 (100.0%) |
| 16 and 17 Years | 16 (27.1%) | 27 (77.1%) |
| 18 to 24 Years | 107 (51.9%) | 44 (28.6%) |
| 25 to 34 Years | 127 (69.8%) | 104 (53.1%) |
| 35 to 44 Years | 216 (80.0%) | 172 (66.1%) |
| 45 to 54 Years | 225 (95.3%) | 163 (74.4%) |
| 55 to 64 Years | 163 (75.8%) | 262 (88.8%) |
| 65 to 74 Years | 170 (97.1%) | 181 (62.0%) |
| 75 Years and over | 69 (100.0%) | 182 (86.3%) |
| Total | 1,220 (72.8%) | 1,335 (69.2%) |
Income Below Poverty Among Married-Couple Families in Norton city
The poverty statistics for married-couple families in Norton city show that 3.4% or 18 of the total 533 families live below the poverty line. Families with 1 or 2 children have the highest poverty rate of 8.1%, comprising of 18 families. On the other hand, families with no children have the lowest poverty rate of 0.0%, which includes 0 families.
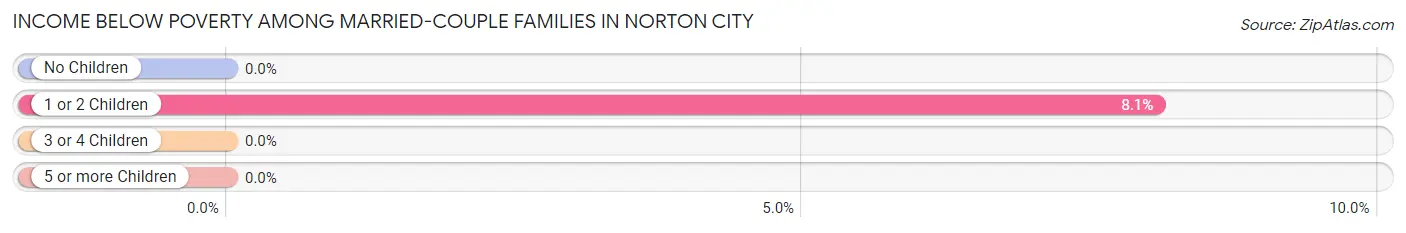
| Children | Above Poverty | Below Poverty |
| No Children | 310 (100.0%) | 0 (0.0%) |
| 1 or 2 Children | 205 (91.9%) | 18 (8.1%) |
| 3 or 4 Children | 0 (0.0%) | 0 (0.0%) |
| 5 or more Children | 0 (0.0%) | 0 (0.0%) |
| Total | 515 (96.6%) | 18 (3.4%) |
Income Below Poverty Among Single-Parent Households in Norton city
According to the poverty data in Norton city, 22.6% or 19 single-father households and 62.4% or 156 single-mother households are living below the poverty line. Among single-father households, those with 1 or 2 children have the highest poverty rate, with 19 households (70.4%) experiencing poverty. Likewise, among single-mother households, those with 3 or 4 children have the highest poverty rate, with 35 households (100.0%) falling below the poverty line.
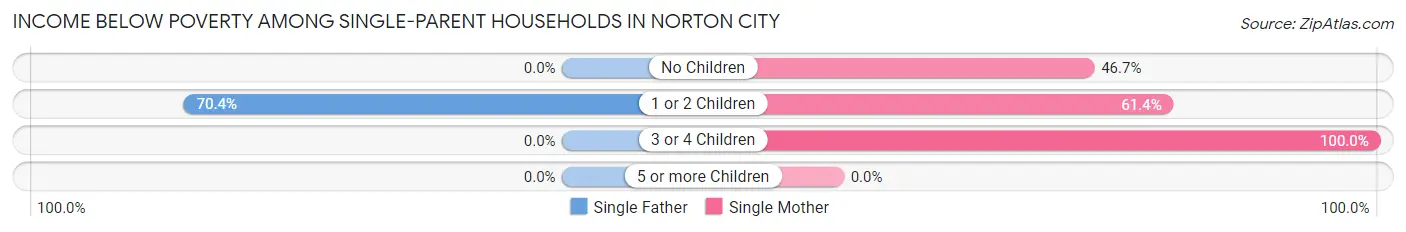
| Children | Single Father | Single Mother |
| No Children | 0 (0.0%) | 35 (46.7%) |
| 1 or 2 Children | 19 (70.4%) | 86 (61.4%) |
| 3 or 4 Children | 0 (0.0%) | 35 (100.0%) |
| 5 or more Children | 0 (0.0%) | 0 (0.0%) |
| Total | 19 (22.6%) | 156 (62.4%) |
Income Below Poverty Among Married-Couple vs Single-Parent Households in Norton city
The poverty data for Norton city shows that 18 of the married-couple family households (3.4%) and 175 of the single-parent households (52.4%) are living below the poverty level. Within the married-couple family households, those with 1 or 2 children have the highest poverty rate, with 18 households (8.1%) falling below the poverty line. Among the single-parent households, those with 3 or 4 children have the highest poverty rate, with 35 household (100.0%) living below poverty.
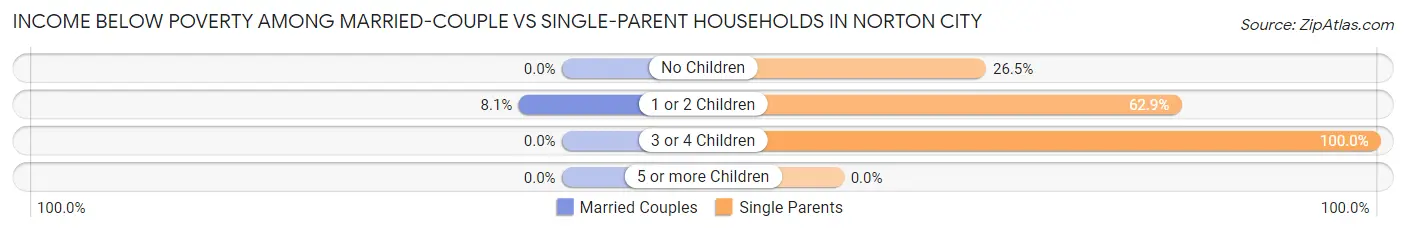
| Children | Married-Couple Families | Single-Parent Households |
| No Children | 0 (0.0%) | 35 (26.5%) |
| 1 or 2 Children | 18 (8.1%) | 105 (62.9%) |
| 3 or 4 Children | 0 (0.0%) | 35 (100.0%) |
| 5 or more Children | 0 (0.0%) | 0 (0.0%) |
| Total | 18 (3.4%) | 175 (52.4%) |
Race in Norton city
The most populous races in Norton city are White / Caucasian (3,462 | 94.4%), Two or more Races (129 | 3.5%), and Black / African American (75 | 2.0%).
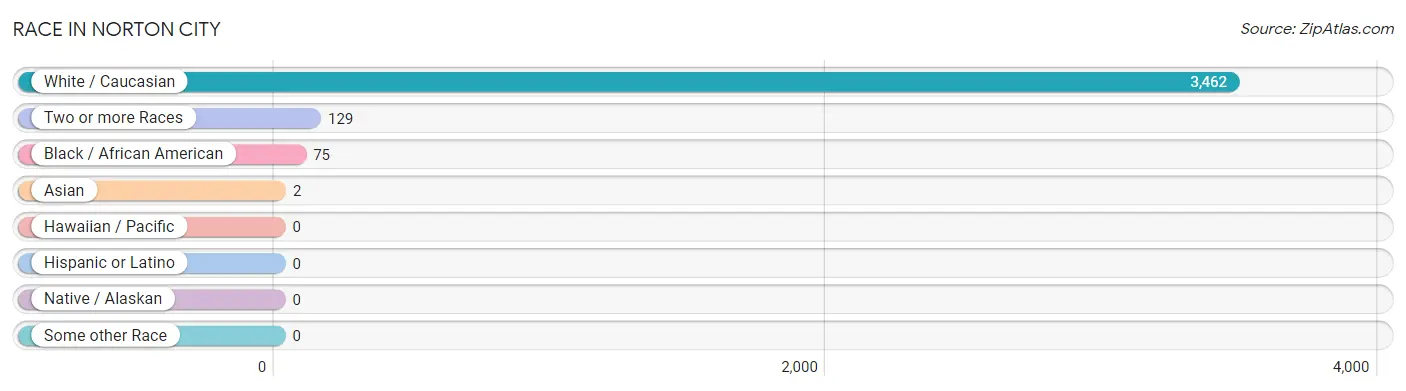
| Race | # Population | % Population |
| Asian | 2 | 0.1% |
| Black / African American | 75 | 2.0% |
| Hawaiian / Pacific | 0 | 0.0% |
| Hispanic or Latino | 0 | 0.0% |
| Native / Alaskan | 0 | 0.0% |
| White / Caucasian | 3,462 | 94.4% |
| Two or more Races | 129 | 3.5% |
| Some other Race | 0 | 0.0% |
| Total | 3,668 | 100.0% |
Ancestry in Norton city
The most populous ancestries reported in Norton city are American (1,077 | 29.4%), English (535 | 14.6%), German (446 | 12.2%), Irish (326 | 8.9%), and Italian (87 | 2.4%), together accounting for 67.4% of all Norton city residents.
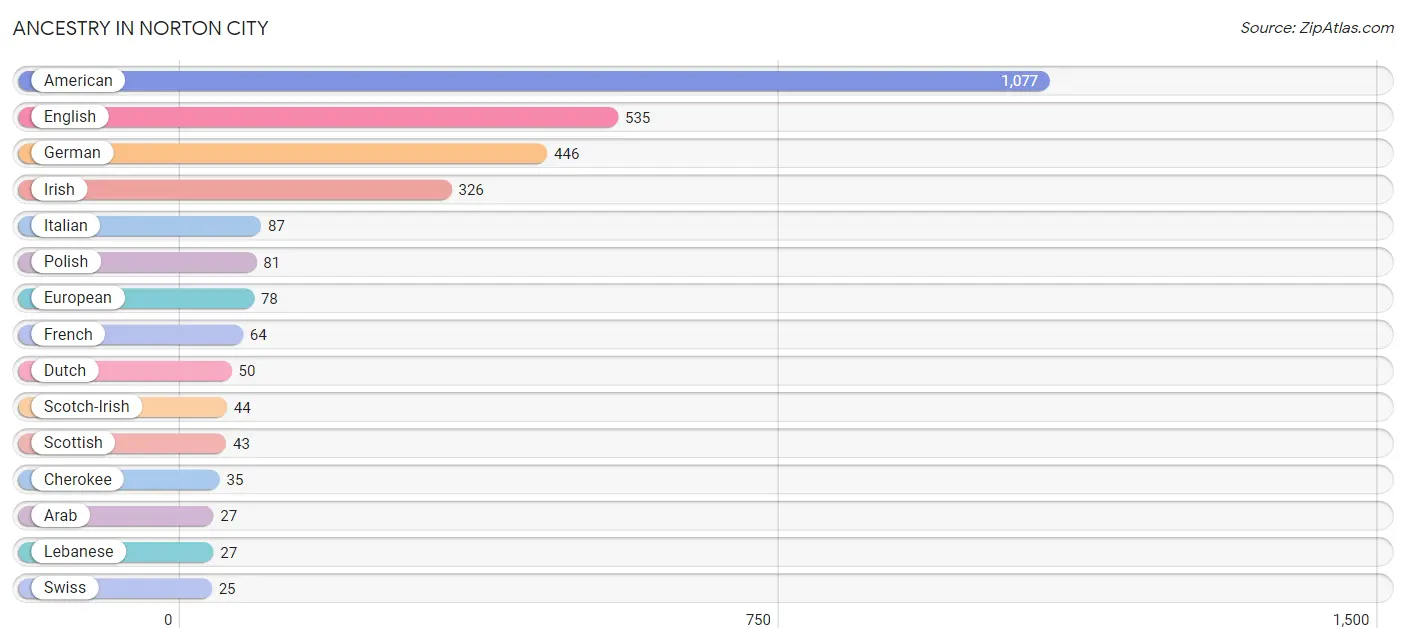
| Ancestry | # Population | % Population |
| American | 1,077 | 29.4% |
| Arab | 27 | 0.7% |
| Blackfeet | 11 | 0.3% |
| British | 15 | 0.4% |
| Cherokee | 35 | 0.9% |
| Dutch | 50 | 1.4% |
| Eastern European | 10 | 0.3% |
| English | 535 | 14.6% |
| European | 78 | 2.1% |
| French | 64 | 1.7% |
| French Canadian | 7 | 0.2% |
| German | 446 | 12.2% |
| Indian (Asian) | 2 | 0.1% |
| Irish | 326 | 8.9% |
| Italian | 87 | 2.4% |
| Lebanese | 27 | 0.7% |
| Polish | 81 | 2.2% |
| Scandinavian | 10 | 0.3% |
| Scotch-Irish | 44 | 1.2% |
| Scottish | 43 | 1.2% |
| Slovak | 13 | 0.4% |
| Swiss | 25 | 0.7% | View All 22 Rows |
Immigrants in Norton city
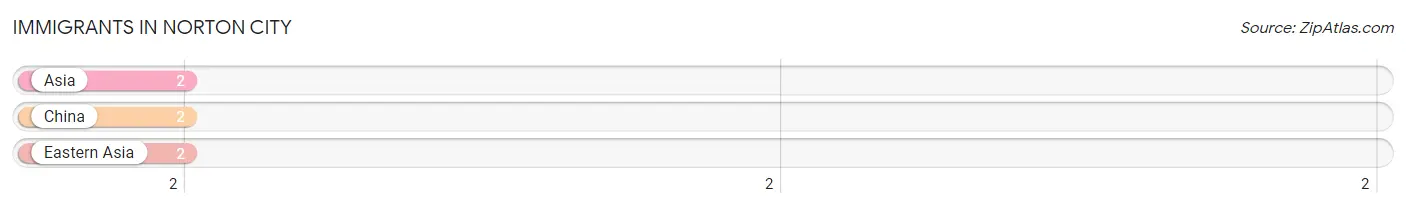
The most numerous immigrant groups reported in Norton city came from Asia (2 | 0.1%), China (2 | 0.1%), and Eastern Asia (2 | 0.1%), together accounting for 0.2% of all Norton city residents.
| Immigration Origin | # Population | % Population |
| Asia | 2 | 0.1% |
| China | 2 | 0.1% |
| Eastern Asia | 2 | 0.1% | View All 3 Rows |
Sex and Age in Norton city
Sex and Age in Norton city
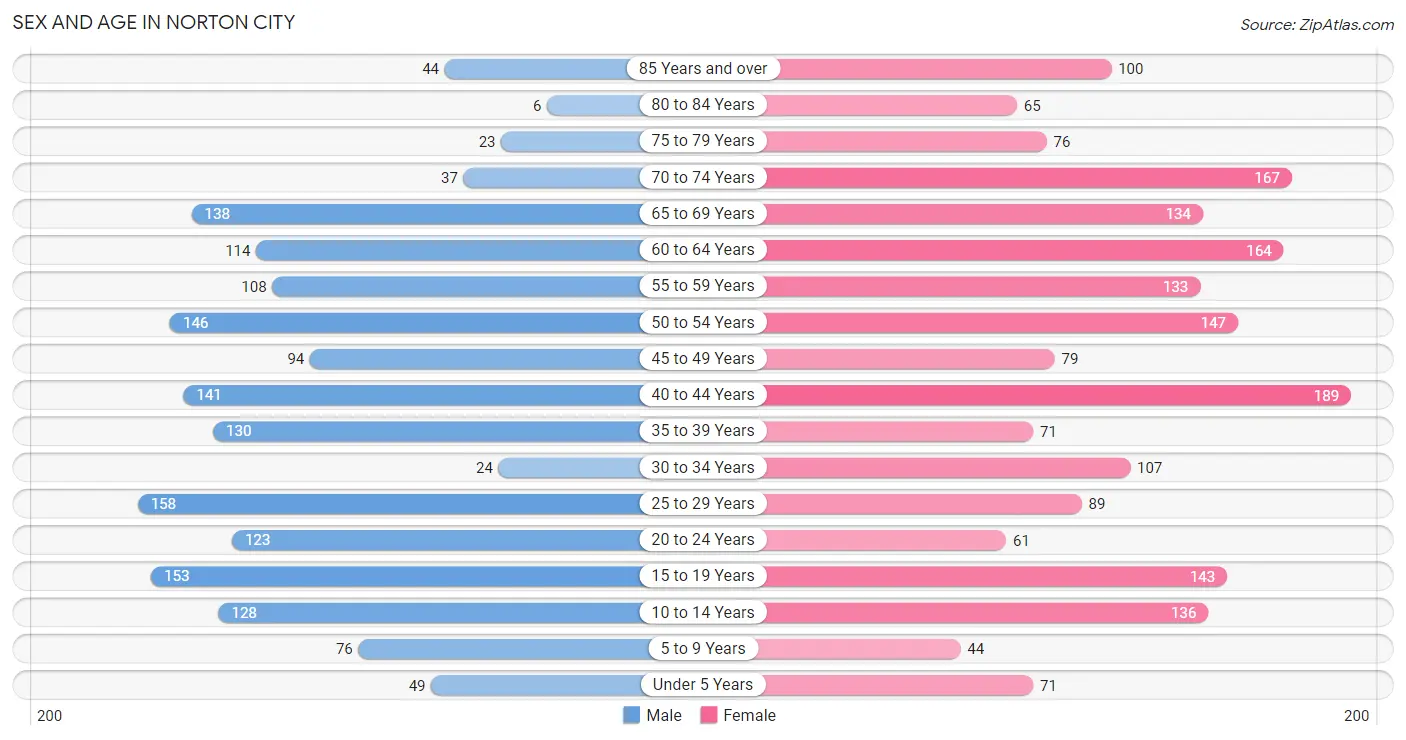
The most populous age groups in Norton city are 25 to 29 Years (158 | 9.3%) for men and 40 to 44 Years (189 | 9.6%) for women.
| Age Bracket | Male | Female |
| Under 5 Years | 49 (2.9%) | 71 (3.6%) |
| 5 to 9 Years | 76 (4.5%) | 44 (2.2%) |
| 10 to 14 Years | 128 (7.6%) | 136 (6.9%) |
| 15 to 19 Years | 153 (9.0%) | 143 (7.2%) |
| 20 to 24 Years | 123 (7.3%) | 61 (3.1%) |
| 25 to 29 Years | 158 (9.3%) | 89 (4.5%) |
| 30 to 34 Years | 24 (1.4%) | 107 (5.4%) |
| 35 to 39 Years | 130 (7.7%) | 71 (3.6%) |
| 40 to 44 Years | 141 (8.3%) | 189 (9.6%) |
| 45 to 49 Years | 94 (5.6%) | 79 (4.0%) |
| 50 to 54 Years | 146 (8.6%) | 147 (7.4%) |
| 55 to 59 Years | 108 (6.4%) | 133 (6.7%) |
| 60 to 64 Years | 114 (6.7%) | 164 (8.3%) |
| 65 to 69 Years | 138 (8.2%) | 134 (6.8%) |
| 70 to 74 Years | 37 (2.2%) | 167 (8.5%) |
| 75 to 79 Years | 23 (1.4%) | 76 (3.8%) |
| 80 to 84 Years | 6 (0.4%) | 65 (3.3%) |
| 85 Years and over | 44 (2.6%) | 100 (5.1%) |
| Total | 1,692 (100.0%) | 1,976 (100.0%) |
Families and Households in Norton city
Median Family Size in Norton city
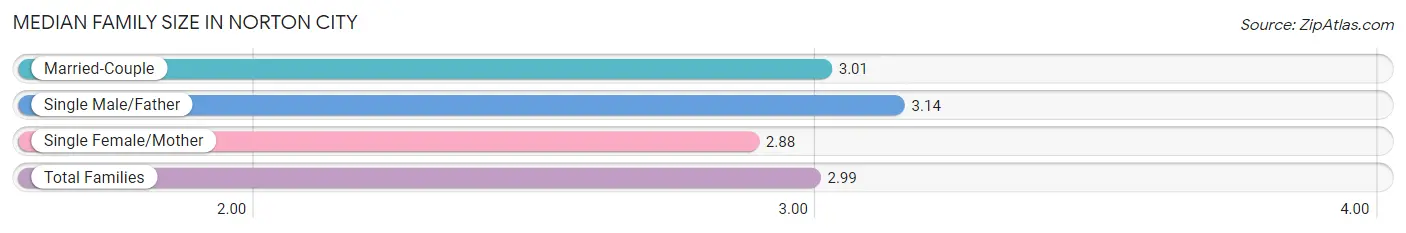
The median family size in Norton city is 2.99 persons per family, with single male/father families (84 | 9.7%) accounting for the largest median family size of 3.14 persons per family. On the other hand, single female/mother families (250 | 28.8%) represent the smallest median family size with 2.88 persons per family.
| Family Type | # Families | Family Size |
| Married-Couple | 533 (61.5%) | 3.01 |
| Single Male/Father | 84 (9.7%) | 3.14 |
| Single Female/Mother | 250 (28.8%) | 2.88 |
| Total Families | 867 (100.0%) | 2.99 |
Median Household Size in Norton city
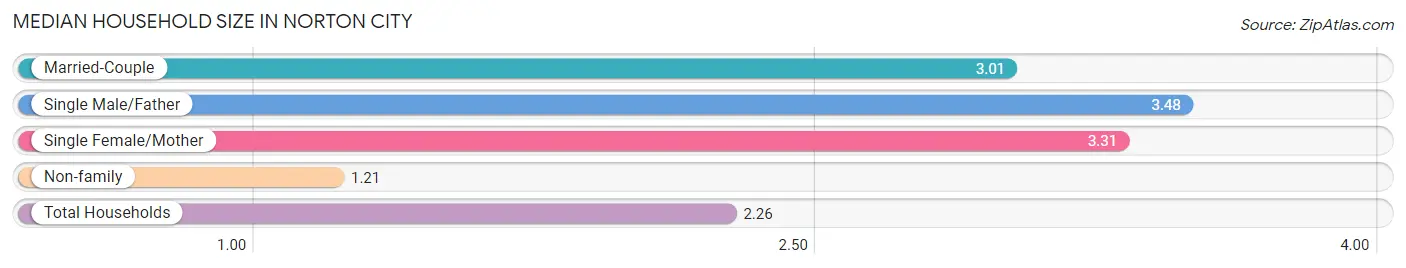
The median household size in Norton city is 2.26 persons per household, with single male/father households (84 | 5.3%) accounting for the largest median household size of 3.48 persons per household. non-family households (725 | 45.5%) represent the smallest median household size with 1.21 persons per household.
| Household Type | # Households | Household Size |
| Married-Couple | 533 (33.5%) | 3.01 |
| Single Male/Father | 84 (5.3%) | 3.48 |
| Single Female/Mother | 250 (15.7%) | 3.31 |
| Non-family | 725 (45.5%) | 1.21 |
| Total Households | 1,592 (100.0%) | 2.26 |
Household Size by Marriage Status in Norton city
Out of a total of 1,592 households in Norton city, 867 (54.5%) are family households, while 725 (45.5%) are nonfamily households. The most numerous type of family households are 2-person households, comprising 346, and the most common type of nonfamily households are 1-person households, comprising 680.
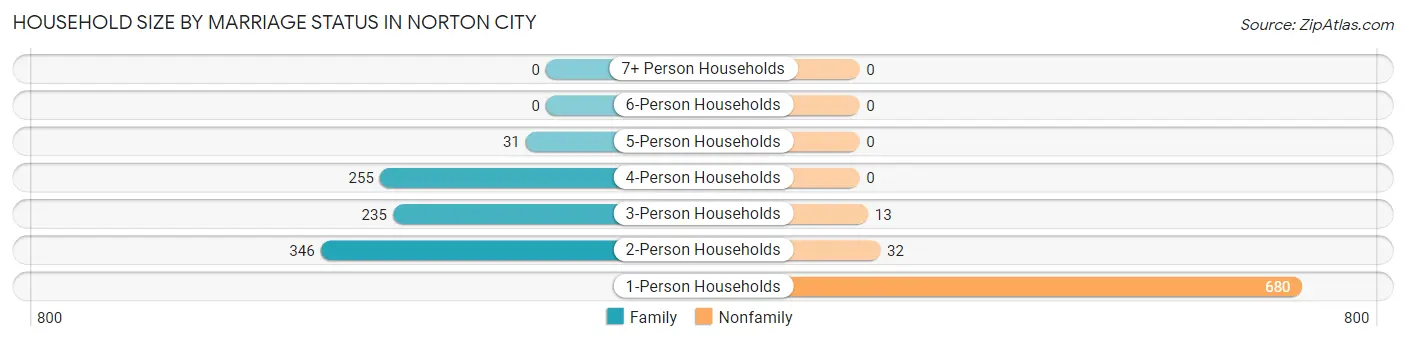
| Household Size | Family Households | Nonfamily Households |
| 1-Person Households | - | 680 (42.7%) |
| 2-Person Households | 346 (21.7%) | 32 (2.0%) |
| 3-Person Households | 235 (14.8%) | 13 (0.8%) |
| 4-Person Households | 255 (16.0%) | 0 (0.0%) |
| 5-Person Households | 31 (1.9%) | 0 (0.0%) |
| 6-Person Households | 0 (0.0%) | 0 (0.0%) |
| 7+ Person Households | 0 (0.0%) | 0 (0.0%) |
| Total | 867 (54.5%) | 725 (45.5%) |
Female Fertility in Norton city
Fertility by Age in Norton city
Average fertility rate in Norton city is 48.0 births per 1,000 women. Women in the age bracket of 15 to 19 years have the highest fertility rate with 259.0 births per 1,000 women. Women in the age bracket of 15 to 19 years acount for 100.0% of all women with births.
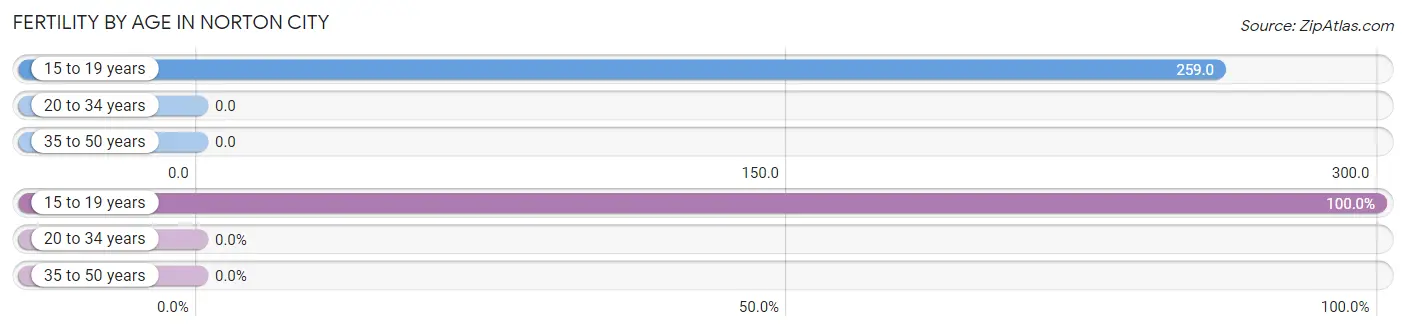
| Age Bracket | Women with Births | Births / 1,000 Women |
| 15 to 19 years | 37 (100.0%) | 259.0 |
| 20 to 34 years | 0 (0.0%) | 0.0 |
| 35 to 50 years | 0 (0.0%) | 0.0 |
| Total | 37 (100.0%) | 48.0 |
Fertility by Age by Marriage Status in Norton city
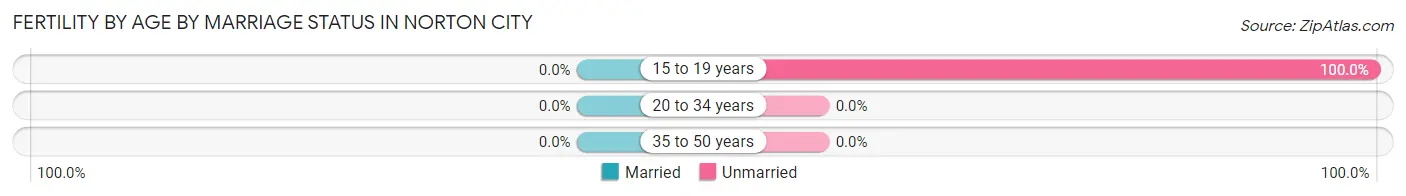
| Age Bracket | Married | Unmarried |
| 15 to 19 years | 0 (0.0%) | 37 (100.0%) |
| 20 to 34 years | 0 (0.0%) | 0 (0.0%) |
| 35 to 50 years | 0 (0.0%) | 0 (0.0%) |
| Total | 0 (0.0%) | 37 (100.0%) |
Fertility by Education in Norton city
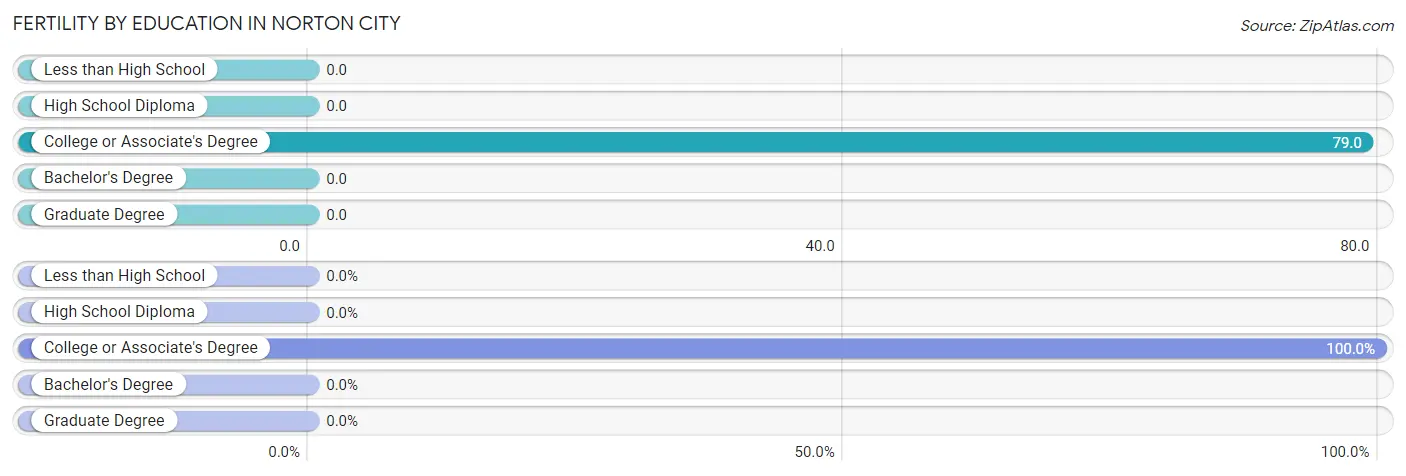
| Educational Attainment | Women with Births | Births / 1,000 Women |
| Less than High School | 0 (0.0%) | 0.0 |
| High School Diploma | 0 (0.0%) | 0.0 |
| College or Associate's Degree | 37 (100.0%) | 79.0 |
| Bachelor's Degree | 0 (0.0%) | 0.0 |
| Graduate Degree | 0 (0.0%) | 0.0 |
| Total | 37 (100.0%) | 48.0 |
Fertility by Education by Marriage Status in Norton city
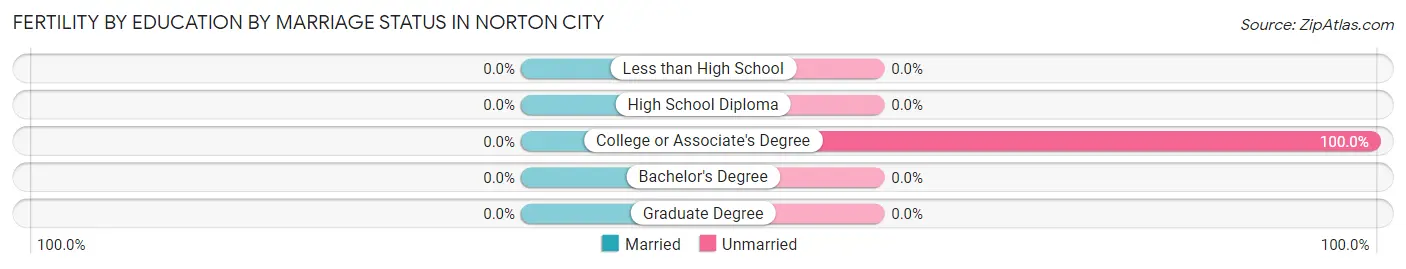
| Educational Attainment | Married | Unmarried |
| Less than High School | 0 (0.0%) | 0 (0.0%) |
| High School Diploma | 0 (0.0%) | 0 (0.0%) |
| College or Associate's Degree | 0 (0.0%) | 37 (100.0%) |
| Bachelor's Degree | 0 (0.0%) | 0 (0.0%) |
| Graduate Degree | 0 (0.0%) | 0 (0.0%) |
| Total | 0 (0.0%) | 37 (100.0%) |
Employment Characteristics in Norton city
Employment by Class of Employer in Norton city
Among the 1,466 employed individuals in Norton city, private company employees (1,087 | 74.2%), not-for-profit organizations (126 | 8.6%), and state government employees (93 | 6.3%) make up the most common classes of employment.
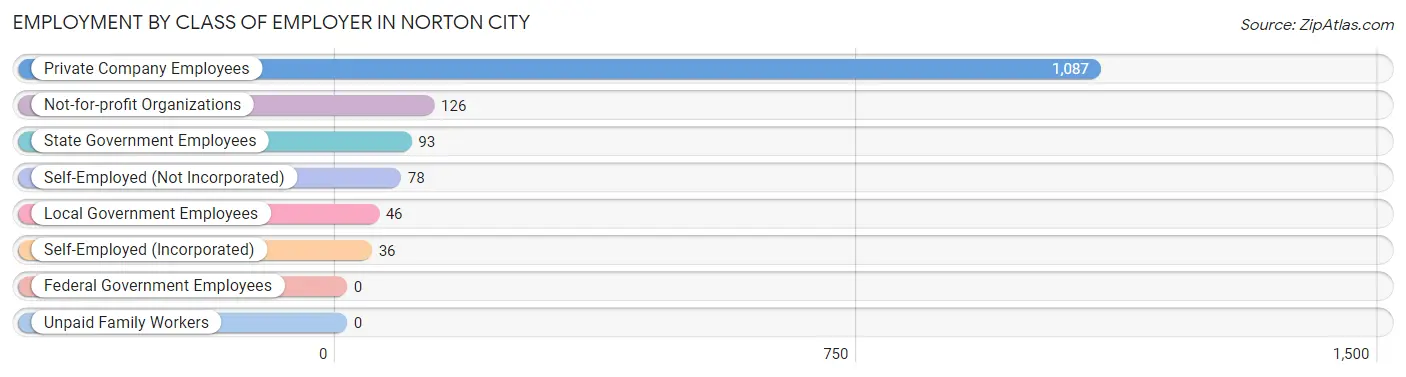
| Employer Class | # Employees | % Employees |
| Private Company Employees | 1,087 | 74.2% |
| Self-Employed (Incorporated) | 36 | 2.5% |
| Self-Employed (Not Incorporated) | 78 | 5.3% |
| Not-for-profit Organizations | 126 | 8.6% |
| Local Government Employees | 46 | 3.1% |
| State Government Employees | 93 | 6.3% |
| Federal Government Employees | 0 | 0.0% |
| Unpaid Family Workers | 0 | 0.0% |
| Total | 1,466 | 100.0% |
Employment Status by Age in Norton city
According to the labor force statistics for Norton city, out of the total population over 16 years of age (3,138), 51.8% or 1,625 individuals are in the labor force, with 7.3% or 119 of them unemployed. The age group with the highest labor force participation rate is 55 to 59 years, with 83.4% or 201 individuals in the labor force. Within the labor force, the 25 to 29 years age range has the highest percentage of unemployed individuals, with 22.8% or 39 of them being unemployed.
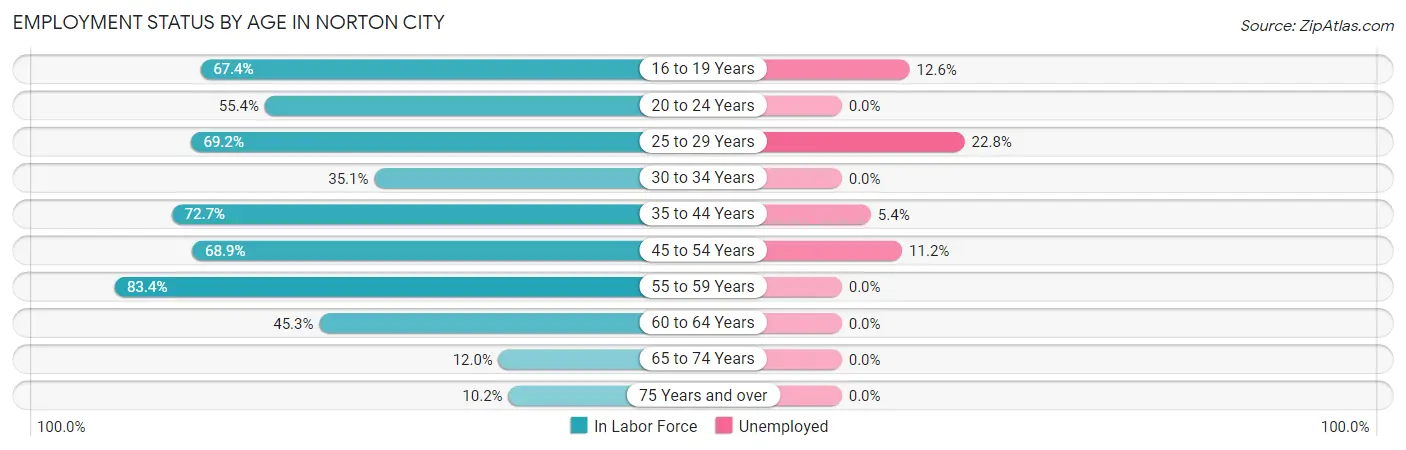
| Age Bracket | In Labor Force | Unemployed |
| 16 to 19 Years | 182 (67.4%) | 23 (12.6%) |
| 20 to 24 Years | 102 (55.4%) | 0 (0.0%) |
| 25 to 29 Years | 171 (69.2%) | 39 (22.8%) |
| 30 to 34 Years | 46 (35.1%) | 0 (0.0%) |
| 35 to 44 Years | 386 (72.7%) | 21 (5.4%) |
| 45 to 54 Years | 321 (68.9%) | 36 (11.2%) |
| 55 to 59 Years | 201 (83.4%) | 0 (0.0%) |
| 60 to 64 Years | 126 (45.3%) | 0 (0.0%) |
| 65 to 74 Years | 57 (12.0%) | 0 (0.0%) |
| 75 Years and over | 32 (10.2%) | 0 (0.0%) |
| Total | 1,625 (51.8%) | 119 (7.3%) |
Employment Status by Educational Attainment in Norton city
According to labor force statistics for Norton city, 66.1% of individuals (1,252) out of the total population between 25 and 64 years of age (1,894) are in the labor force, with 7.7% or 96 of them being unemployed. The group with the highest labor force participation rate are those with the educational attainment of bachelor's degree or higher, with 83.7% or 344 individuals in the labor force. Within the labor force, individuals with high school diploma education have the highest percentage of unemployment, with 12.8% or 36 of them being unemployed.
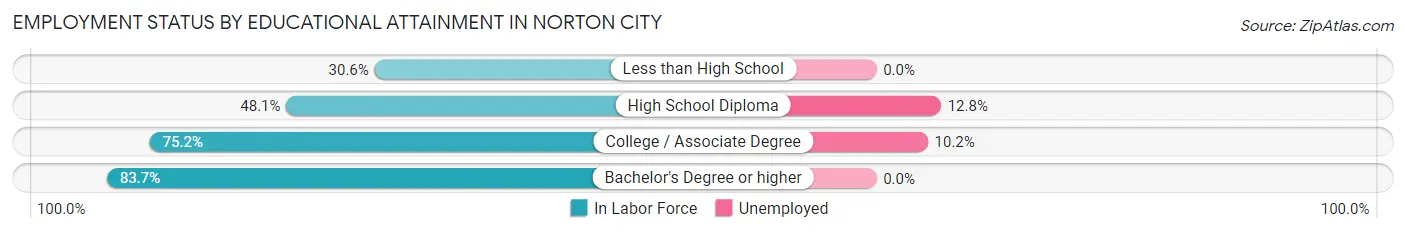
| Educational Attainment | In Labor Force | Unemployed |
| Less than High School | 34 (30.6%) | 0 (0.0%) |
| High School Diploma | 282 (48.1%) | 75 (12.8%) |
| College / Associate Degree | 591 (75.2%) | 80 (10.2%) |
| Bachelor's Degree or higher | 344 (83.7%) | 0 (0.0%) |
| Total | 1,252 (66.1%) | 146 (7.7%) |
Employment Occupations by Sex in Norton city
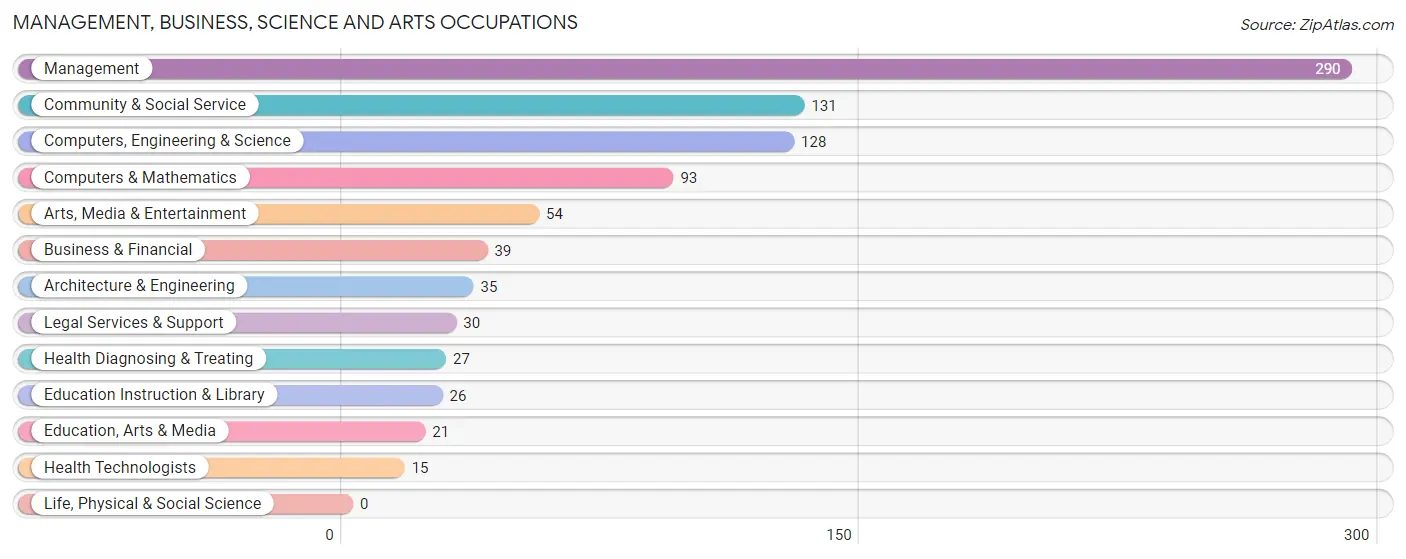
Management, Business, Science and Arts Occupations
The most common Management, Business, Science and Arts occupations in Norton city are Management (290 | 19.3%), Community & Social Service (131 | 8.7%), Computers, Engineering & Science (128 | 8.5%), Computers & Mathematics (93 | 6.2%), and Arts, Media & Entertainment (54 | 3.6%).
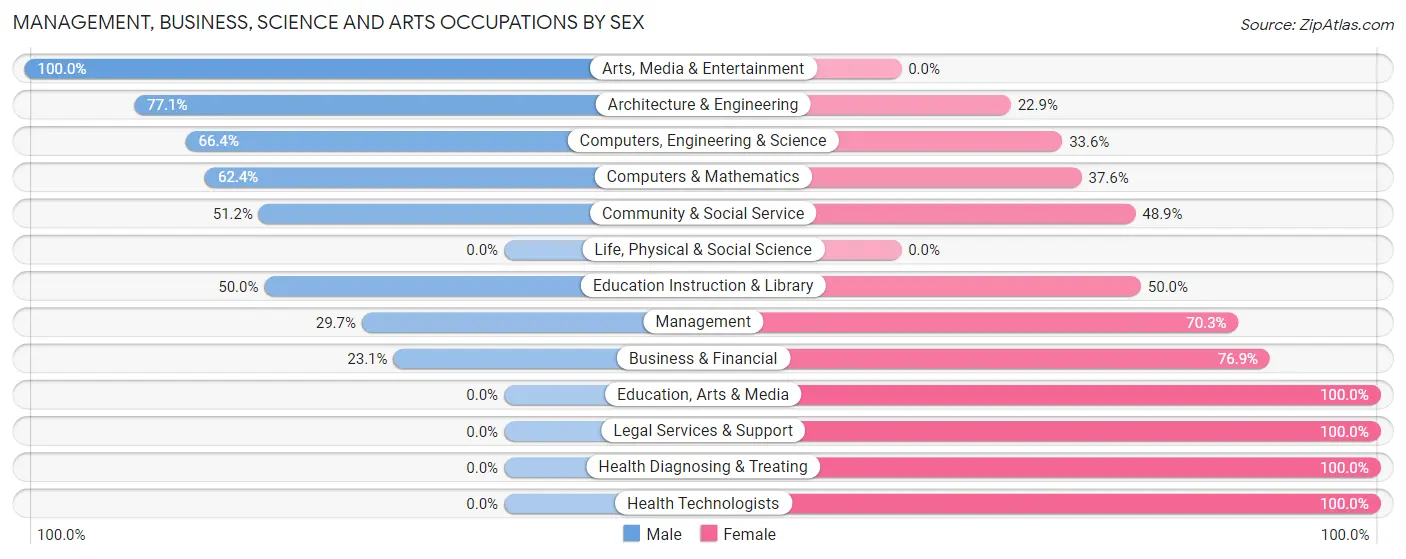
Management, Business, Science and Arts Occupations by Sex
Within the Management, Business, Science and Arts occupations in Norton city, the most male-oriented occupations are Arts, Media & Entertainment (100.0%), Architecture & Engineering (77.1%), and Computers, Engineering & Science (66.4%), while the most female-oriented occupations are Education, Arts & Media (100.0%), Legal Services & Support (100.0%), and Health Diagnosing & Treating (100.0%).
| Occupation | Male | Female |
| Management | 86 (29.7%) | 204 (70.3%) |
| Business & Financial | 9 (23.1%) | 30 (76.9%) |
| Computers, Engineering & Science | 85 (66.4%) | 43 (33.6%) |
| Computers & Mathematics | 58 (62.4%) | 35 (37.6%) |
| Architecture & Engineering | 27 (77.1%) | 8 (22.9%) |
| Life, Physical & Social Science | 0 (0.0%) | 0 (0.0%) |
| Community & Social Service | 67 (51.1%) | 64 (48.8%) |
| Education, Arts & Media | 0 (0.0%) | 21 (100.0%) |
| Legal Services & Support | 0 (0.0%) | 30 (100.0%) |
| Education Instruction & Library | 13 (50.0%) | 13 (50.0%) |
| Arts, Media & Entertainment | 54 (100.0%) | 0 (0.0%) |
| Health Diagnosing & Treating | 0 (0.0%) | 27 (100.0%) |
| Health Technologists | 0 (0.0%) | 15 (100.0%) |
| Total (Category) | 247 (40.2%) | 368 (59.8%) |
| Total (Overall) | 858 (57.0%) | 647 (43.0%) |
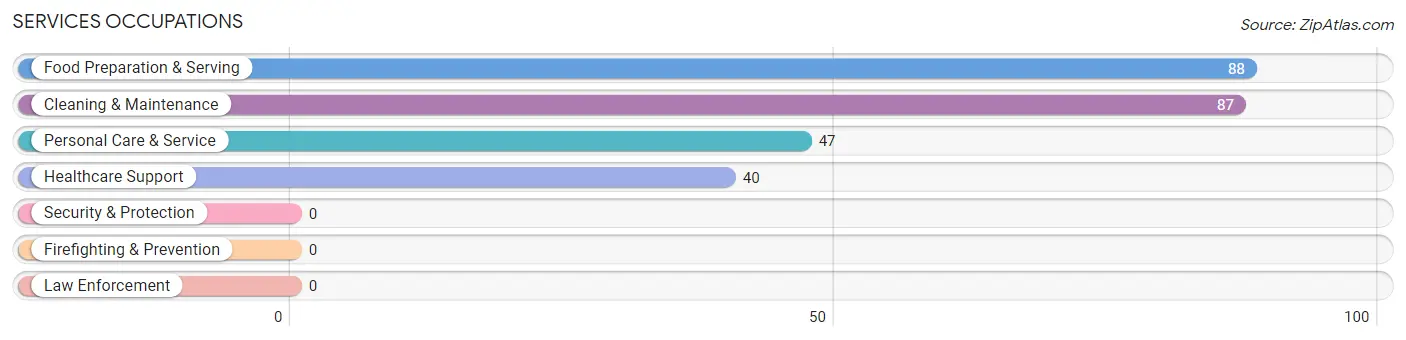
Services Occupations
The most common Services occupations in Norton city are Food Preparation & Serving (88 | 5.9%), Cleaning & Maintenance (87 | 5.8%), Personal Care & Service (47 | 3.1%), and Healthcare Support (40 | 2.7%).
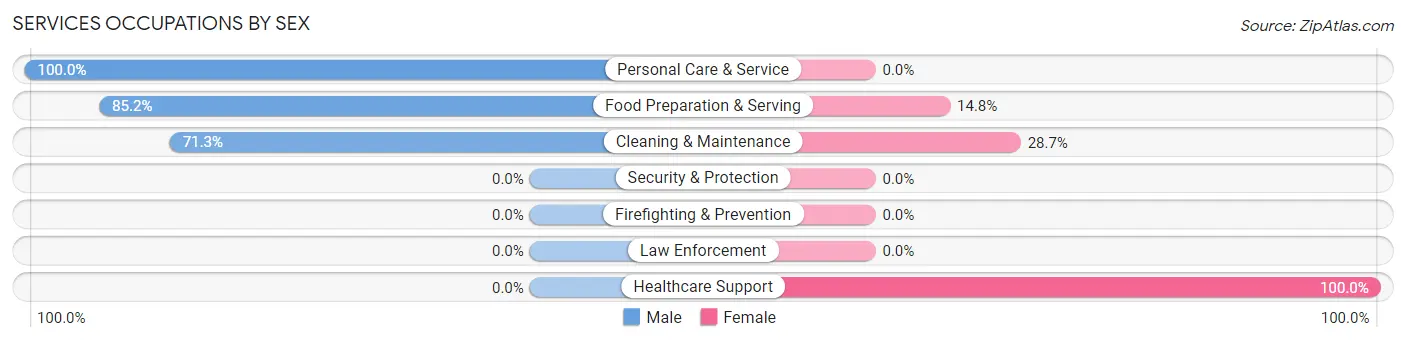
Services Occupations by Sex
Within the Services occupations in Norton city, the most male-oriented occupations are Personal Care & Service (100.0%), Food Preparation & Serving (85.2%), and Cleaning & Maintenance (71.3%), while the most female-oriented occupations are Healthcare Support (100.0%), Cleaning & Maintenance (28.7%), and Food Preparation & Serving (14.8%).
| Occupation | Male | Female |
| Healthcare Support | 0 (0.0%) | 40 (100.0%) |
| Security & Protection | 0 (0.0%) | 0 (0.0%) |
| Firefighting & Prevention | 0 (0.0%) | 0 (0.0%) |
| Law Enforcement | 0 (0.0%) | 0 (0.0%) |
| Food Preparation & Serving | 75 (85.2%) | 13 (14.8%) |
| Cleaning & Maintenance | 62 (71.3%) | 25 (28.7%) |
| Personal Care & Service | 47 (100.0%) | 0 (0.0%) |
| Total (Category) | 184 (70.2%) | 78 (29.8%) |
| Total (Overall) | 858 (57.0%) | 647 (43.0%) |
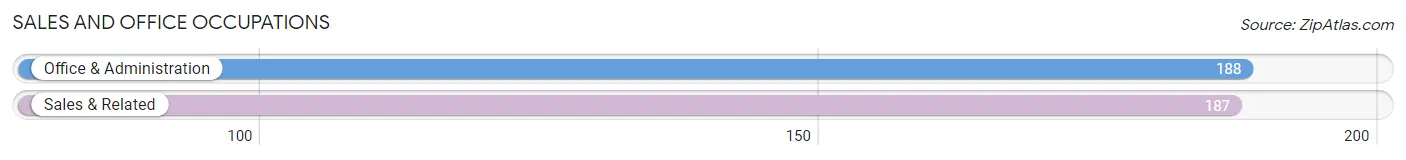
Sales and Office Occupations
The most common Sales and Office occupations in Norton city are Office & Administration (188 | 12.5%), and Sales & Related (187 | 12.4%).
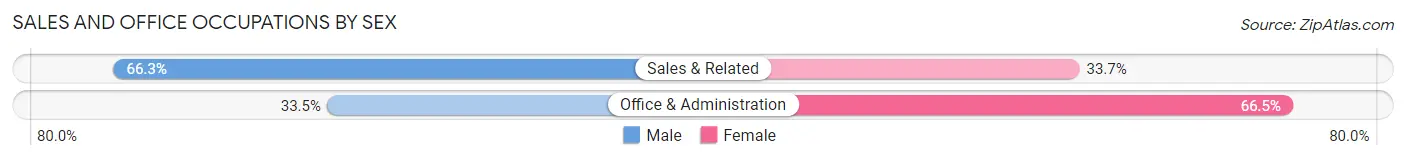
Sales and Office Occupations by Sex
| Occupation | Male | Female |
| Sales & Related | 124 (66.3%) | 63 (33.7%) |
| Office & Administration | 63 (33.5%) | 125 (66.5%) |
| Total (Category) | 187 (49.9%) | 188 (50.1%) |
| Total (Overall) | 858 (57.0%) | 647 (43.0%) |
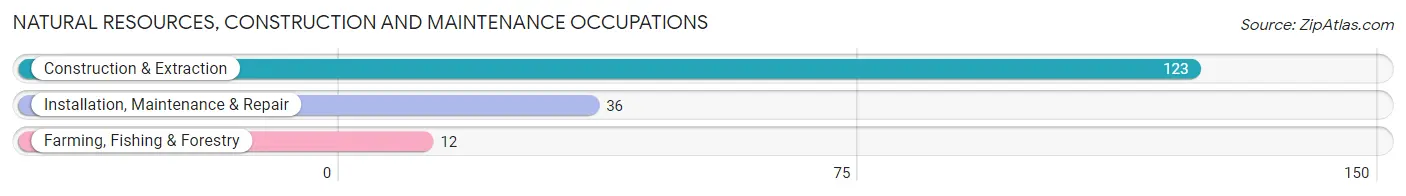
Natural Resources, Construction and Maintenance Occupations
The most common Natural Resources, Construction and Maintenance occupations in Norton city are Construction & Extraction (123 | 8.2%), Installation, Maintenance & Repair (36 | 2.4%), and Farming, Fishing & Forestry (12 | 0.8%).
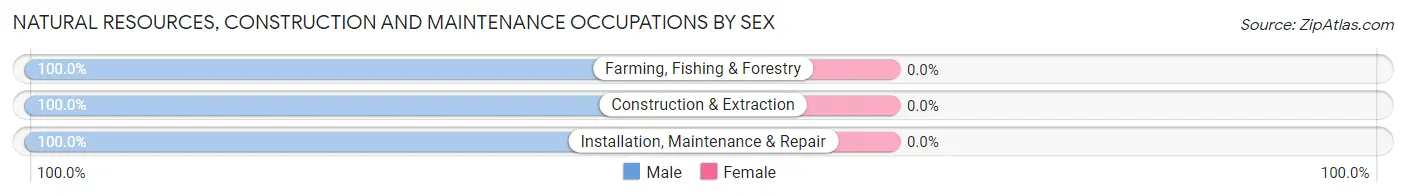
Natural Resources, Construction and Maintenance Occupations by Sex
| Occupation | Male | Female |
| Farming, Fishing & Forestry | 12 (100.0%) | 0 (0.0%) |
| Construction & Extraction | 123 (100.0%) | 0 (0.0%) |
| Installation, Maintenance & Repair | 36 (100.0%) | 0 (0.0%) |
| Total (Category) | 171 (100.0%) | 0 (0.0%) |
| Total (Overall) | 858 (57.0%) | 647 (43.0%) |
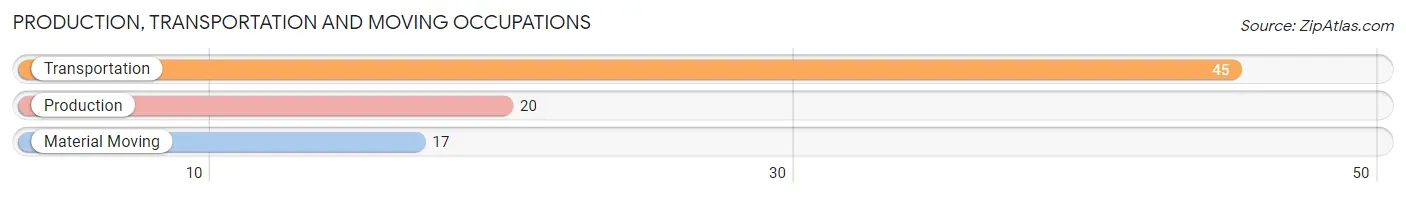
Production, Transportation and Moving Occupations
The most common Production, Transportation and Moving occupations in Norton city are Transportation (45 | 3.0%), Production (20 | 1.3%), and Material Moving (17 | 1.1%).
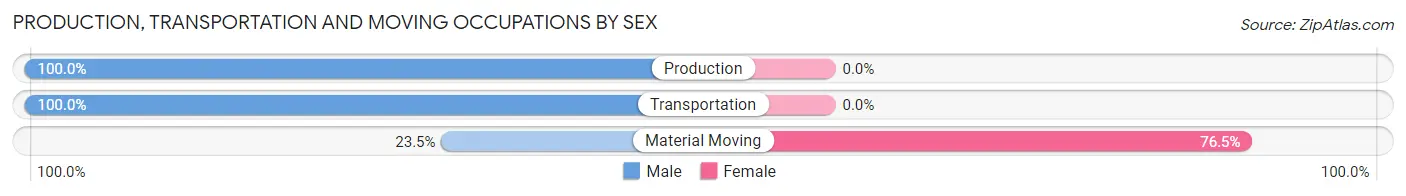
Production, Transportation and Moving Occupations by Sex
| Occupation | Male | Female |
| Production | 20 (100.0%) | 0 (0.0%) |
| Transportation | 45 (100.0%) | 0 (0.0%) |
| Material Moving | 4 (23.5%) | 13 (76.5%) |
| Total (Category) | 69 (84.2%) | 13 (15.9%) |
| Total (Overall) | 858 (57.0%) | 647 (43.0%) |
Employment Industries by Sex in Norton city
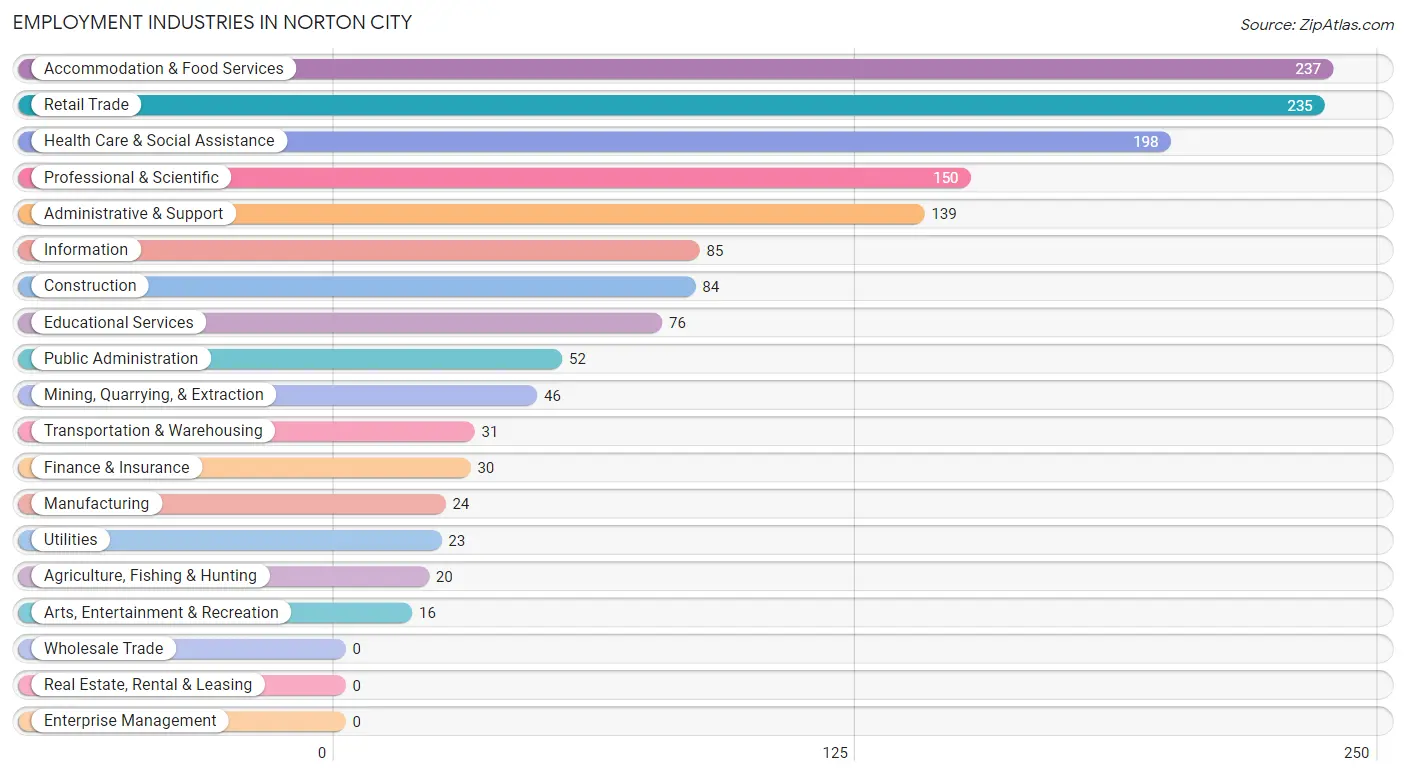
Employment Industries in Norton city
The major employment industries in Norton city include Accommodation & Food Services (237 | 15.8%), Retail Trade (235 | 15.6%), Health Care & Social Assistance (198 | 13.2%), Professional & Scientific (150 | 10.0%), and Administrative & Support (139 | 9.2%).
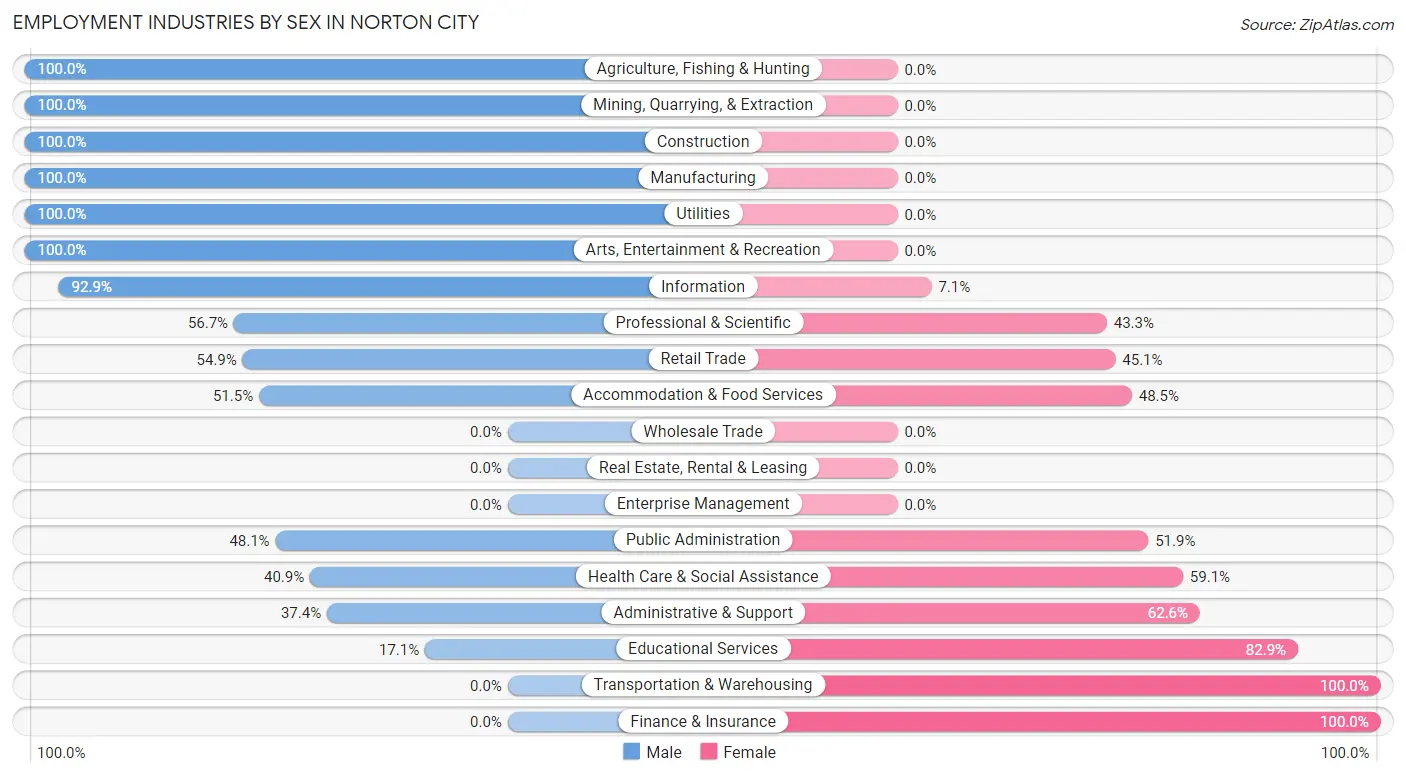
Employment Industries by Sex in Norton city
The Norton city industries that see more men than women are Agriculture, Fishing & Hunting (100.0%), Mining, Quarrying, & Extraction (100.0%), and Construction (100.0%), whereas the industries that tend to have a higher number of women are Transportation & Warehousing (100.0%), Finance & Insurance (100.0%), and Educational Services (82.9%).
| Industry | Male | Female |
| Agriculture, Fishing & Hunting | 20 (100.0%) | 0 (0.0%) |
| Mining, Quarrying, & Extraction | 46 (100.0%) | 0 (0.0%) |
| Construction | 84 (100.0%) | 0 (0.0%) |
| Manufacturing | 24 (100.0%) | 0 (0.0%) |
| Wholesale Trade | 0 (0.0%) | 0 (0.0%) |
| Retail Trade | 129 (54.9%) | 106 (45.1%) |
| Transportation & Warehousing | 0 (0.0%) | 31 (100.0%) |
| Utilities | 23 (100.0%) | 0 (0.0%) |
| Information | 79 (92.9%) | 6 (7.1%) |
| Finance & Insurance | 0 (0.0%) | 30 (100.0%) |
| Real Estate, Rental & Leasing | 0 (0.0%) | 0 (0.0%) |
| Professional & Scientific | 85 (56.7%) | 65 (43.3%) |
| Enterprise Management | 0 (0.0%) | 0 (0.0%) |
| Administrative & Support | 52 (37.4%) | 87 (62.6%) |
| Educational Services | 13 (17.1%) | 63 (82.9%) |
| Health Care & Social Assistance | 81 (40.9%) | 117 (59.1%) |
| Arts, Entertainment & Recreation | 16 (100.0%) | 0 (0.0%) |
| Accommodation & Food Services | 122 (51.5%) | 115 (48.5%) |
| Public Administration | 25 (48.1%) | 27 (51.9%) |
| Total | 858 (57.0%) | 647 (43.0%) |
Education in Norton city
School Enrollment in Norton city
The most common levels of schooling among the 646 students in Norton city are college / undergraduate (212 | 32.8%), middle school (173 | 26.8%), and high school (141 | 21.8%).
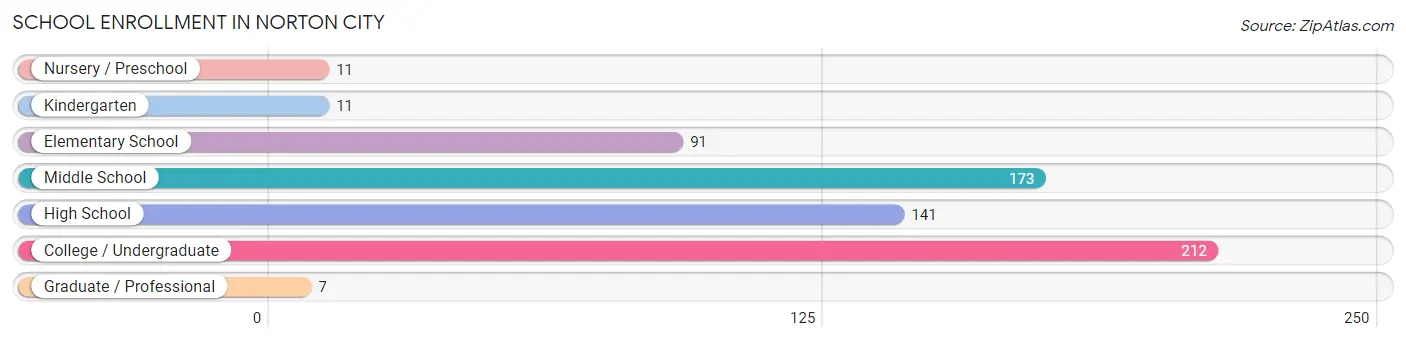
| School Level | # Students | % Students |
| Nursery / Preschool | 11 | 1.7% |
| Kindergarten | 11 | 1.7% |
| Elementary School | 91 | 14.1% |
| Middle School | 173 | 26.8% |
| High School | 141 | 21.8% |
| College / Undergraduate | 212 | 32.8% |
| Graduate / Professional | 7 | 1.1% |
| Total | 646 | 100.0% |
School Enrollment by Age by Funding Source in Norton city
Out of a total of 646 students who are enrolled in schools in Norton city, 63 (9.8%) attend a private institution, while the remaining 583 (90.2%) are enrolled in public schools. The age group of 35 years and over has the highest likelihood of being enrolled in private schools, with 28 (80.0% in the age bracket) enrolled. Conversely, the age group of 3 to 4 year olds has the lowest likelihood of being enrolled in a private school, with 11 (100.0% in the age bracket) attending a public institution.
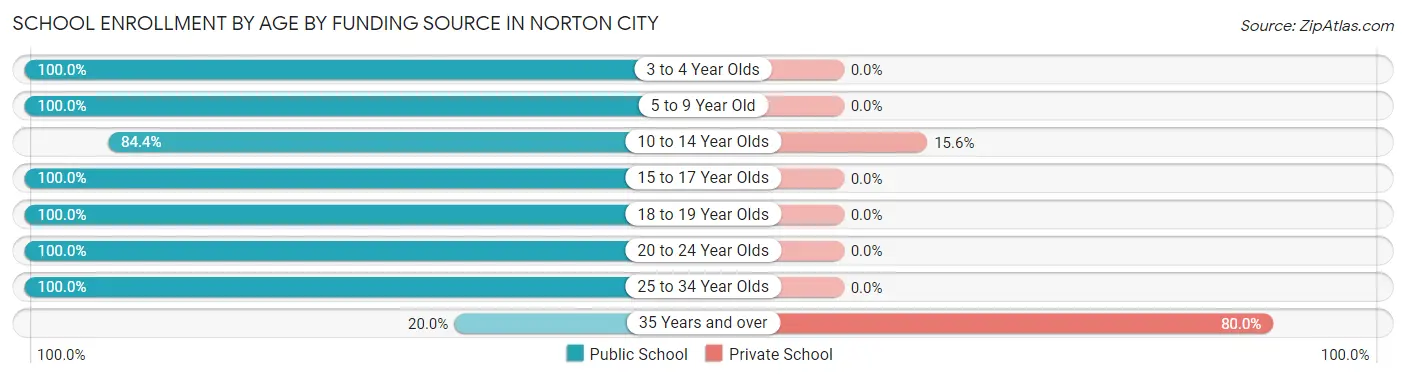
| Age Bracket | Public School | Private School |
| 3 to 4 Year Olds | 11 (100.0%) | 0 (0.0%) |
| 5 to 9 Year Old | 94 (100.0%) | 0 (0.0%) |
| 10 to 14 Year Olds | 190 (84.4%) | 35 (15.6%) |
| 15 to 17 Year Olds | 93 (100.0%) | 0 (0.0%) |
| 18 to 19 Year Olds | 49 (100.0%) | 0 (0.0%) |
| 20 to 24 Year Olds | 123 (100.0%) | 0 (0.0%) |
| 25 to 34 Year Olds | 16 (100.0%) | 0 (0.0%) |
| 35 Years and over | 7 (20.0%) | 28 (80.0%) |
| Total | 583 (90.2%) | 63 (9.8%) |
Educational Attainment by Field of Study in Norton city
Business (123 | 22.7%), literature & languages (111 | 20.5%), education (67 | 12.4%), engineering (56 | 10.3%), and social sciences (41 | 7.6%) are the most common fields of study among 541 individuals in Norton city who have obtained a bachelor's degree or higher.
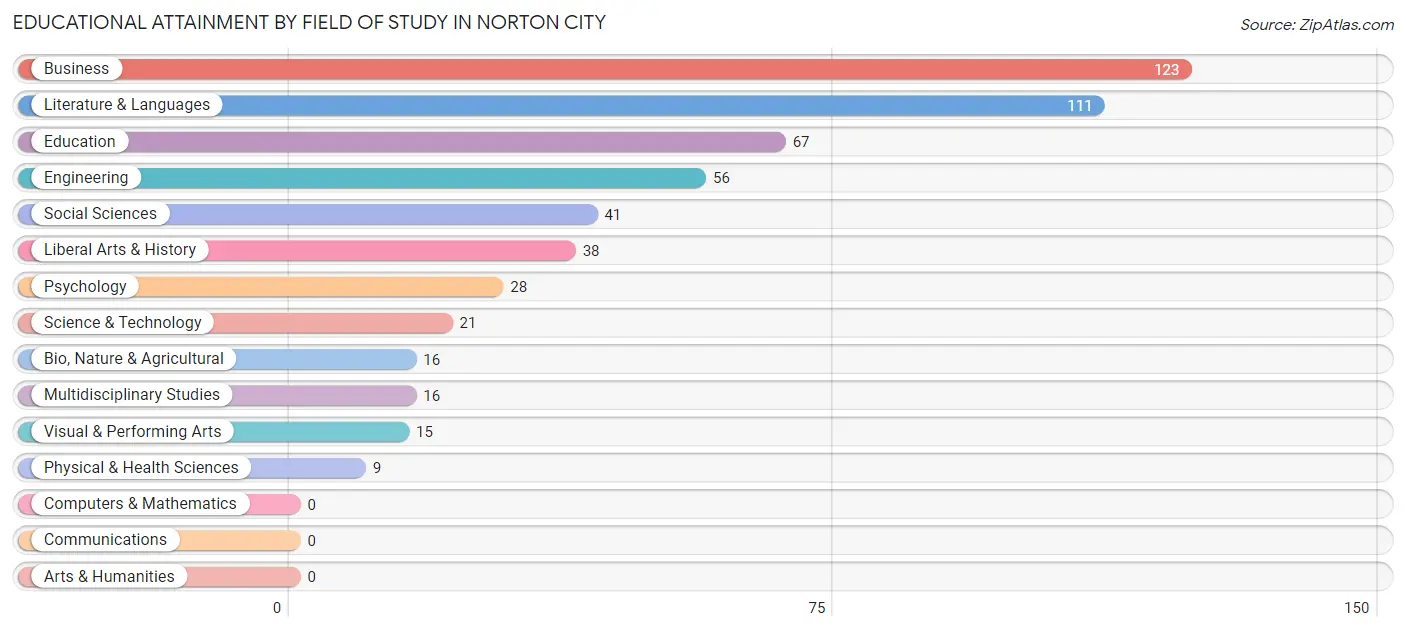
| Field of Study | # Graduates | % Graduates |
| Computers & Mathematics | 0 | 0.0% |
| Bio, Nature & Agricultural | 16 | 3.0% |
| Physical & Health Sciences | 9 | 1.7% |
| Psychology | 28 | 5.2% |
| Social Sciences | 41 | 7.6% |
| Engineering | 56 | 10.3% |
| Multidisciplinary Studies | 16 | 3.0% |
| Science & Technology | 21 | 3.9% |
| Business | 123 | 22.7% |
| Education | 67 | 12.4% |
| Literature & Languages | 111 | 20.5% |
| Liberal Arts & History | 38 | 7.0% |
| Visual & Performing Arts | 15 | 2.8% |
| Communications | 0 | 0.0% |
| Arts & Humanities | 0 | 0.0% |
| Total | 541 | 100.0% |
Transportation & Commute in Norton city
Vehicle Availability by Sex in Norton city
The most prevalent vehicle ownership categories in Norton city are males with 3 vehicles (311, accounting for 36.8%) and females with 3 vehicles (124, making up 50.0%).
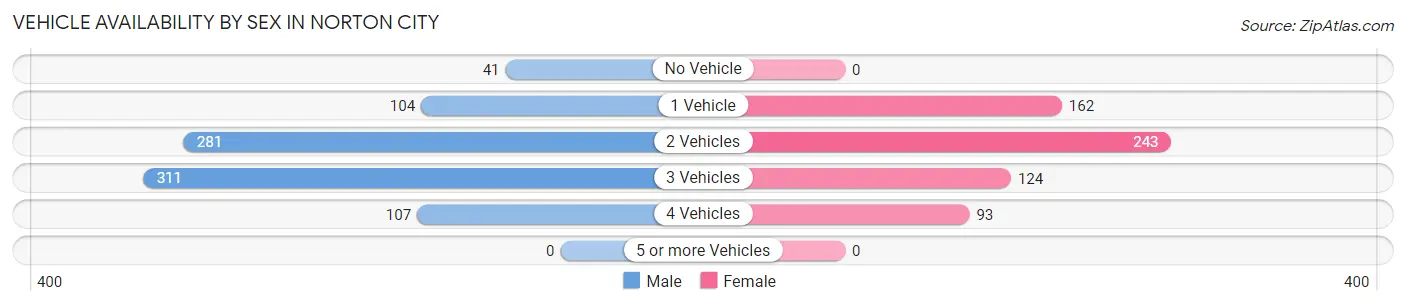
| Vehicles Available | Male | Female |
| No Vehicle | 41 (4.9%) | 0 (0.0%) |
| 1 Vehicle | 104 (12.3%) | 162 (26.1%) |
| 2 Vehicles | 281 (33.3%) | 243 (39.1%) |
| 3 Vehicles | 311 (36.8%) | 124 (19.9%) |
| 4 Vehicles | 107 (12.7%) | 93 (14.9%) |
| 5 or more Vehicles | 0 (0.0%) | 0 (0.0%) |
| Total | 844 (100.0%) | 622 (100.0%) |
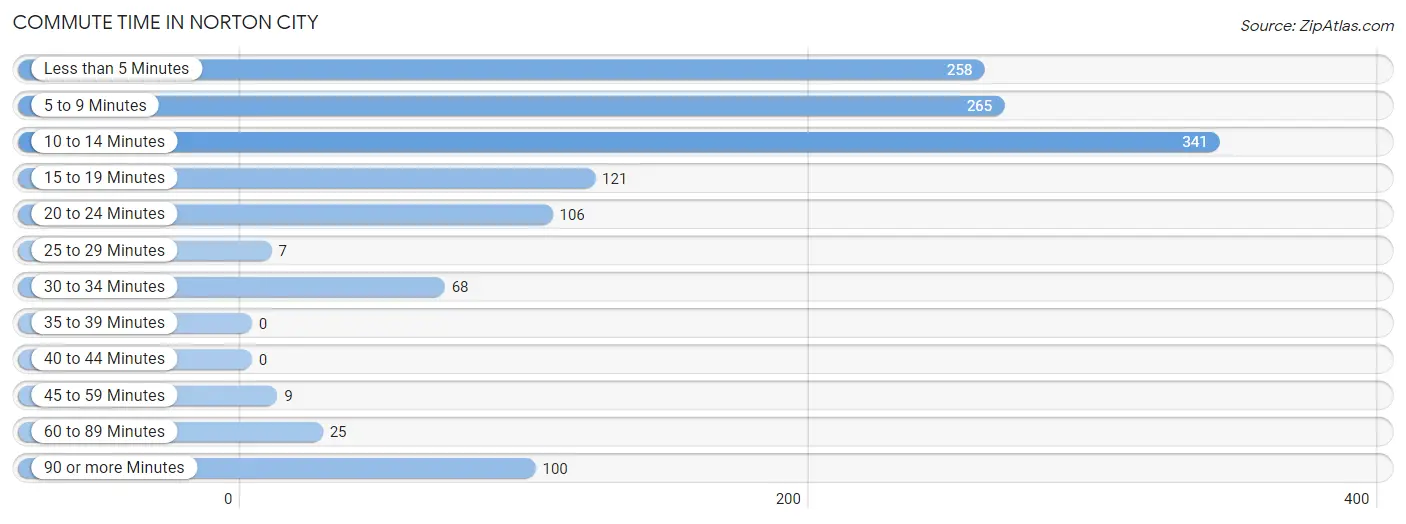
Commute Time in Norton city
The most frequently occuring commute durations in Norton city are 10 to 14 minutes (341 commuters, 26.2%), 5 to 9 minutes (265 commuters, 20.4%), and less than 5 minutes (258 commuters, 19.9%).
| Commute Time | # Commuters | % Commuters |
| Less than 5 Minutes | 258 | 19.9% |
| 5 to 9 Minutes | 265 | 20.4% |
| 10 to 14 Minutes | 341 | 26.2% |
| 15 to 19 Minutes | 121 | 9.3% |
| 20 to 24 Minutes | 106 | 8.2% |
| 25 to 29 Minutes | 7 | 0.5% |
| 30 to 34 Minutes | 68 | 5.2% |
| 35 to 39 Minutes | 0 | 0.0% |
| 40 to 44 Minutes | 0 | 0.0% |
| 45 to 59 Minutes | 9 | 0.7% |
| 60 to 89 Minutes | 25 | 1.9% |
| 90 or more Minutes | 100 | 7.7% |
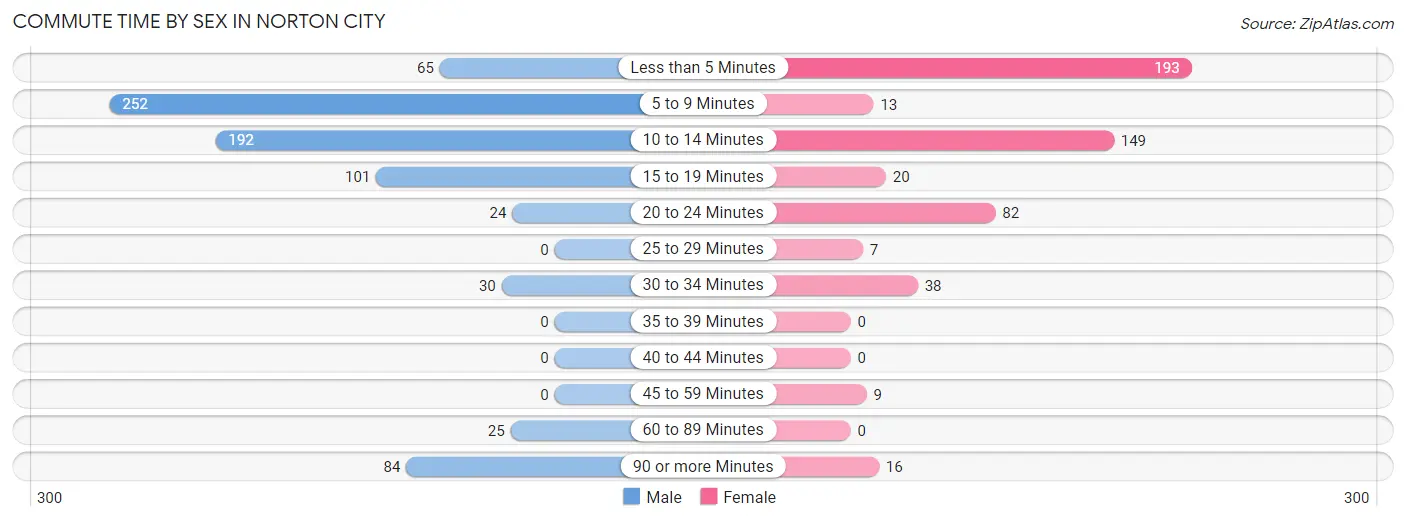
Commute Time by Sex in Norton city
The most common commute times in Norton city are 5 to 9 minutes (252 commuters, 32.6%) for males and less than 5 minutes (193 commuters, 36.6%) for females.
| Commute Time | Male | Female |
| Less than 5 Minutes | 65 (8.4%) | 193 (36.6%) |
| 5 to 9 Minutes | 252 (32.6%) | 13 (2.5%) |
| 10 to 14 Minutes | 192 (24.8%) | 149 (28.3%) |
| 15 to 19 Minutes | 101 (13.1%) | 20 (3.8%) |
| 20 to 24 Minutes | 24 (3.1%) | 82 (15.6%) |
| 25 to 29 Minutes | 0 (0.0%) | 7 (1.3%) |
| 30 to 34 Minutes | 30 (3.9%) | 38 (7.2%) |
| 35 to 39 Minutes | 0 (0.0%) | 0 (0.0%) |
| 40 to 44 Minutes | 0 (0.0%) | 0 (0.0%) |
| 45 to 59 Minutes | 0 (0.0%) | 9 (1.7%) |
| 60 to 89 Minutes | 25 (3.2%) | 0 (0.0%) |
| 90 or more Minutes | 84 (10.9%) | 16 (3.0%) |
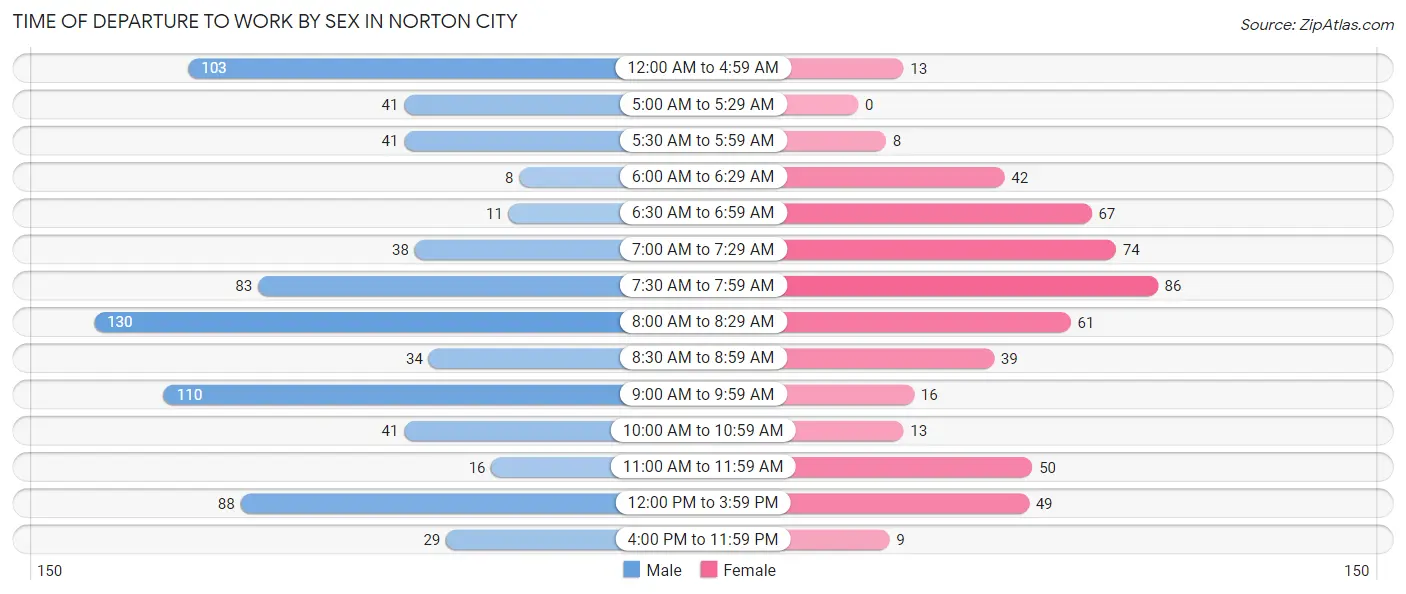
Time of Departure to Work by Sex in Norton city
The most frequent times of departure to work in Norton city are 8:00 AM to 8:29 AM (130, 16.8%) for males and 7:30 AM to 7:59 AM (86, 16.3%) for females.
| Time of Departure | Male | Female |
| 12:00 AM to 4:59 AM | 103 (13.3%) | 13 (2.5%) |
| 5:00 AM to 5:29 AM | 41 (5.3%) | 0 (0.0%) |
| 5:30 AM to 5:59 AM | 41 (5.3%) | 8 (1.5%) |
| 6:00 AM to 6:29 AM | 8 (1.0%) | 42 (8.0%) |
| 6:30 AM to 6:59 AM | 11 (1.4%) | 67 (12.7%) |
| 7:00 AM to 7:29 AM | 38 (4.9%) | 74 (14.0%) |
| 7:30 AM to 7:59 AM | 83 (10.7%) | 86 (16.3%) |
| 8:00 AM to 8:29 AM | 130 (16.8%) | 61 (11.6%) |
| 8:30 AM to 8:59 AM | 34 (4.4%) | 39 (7.4%) |
| 9:00 AM to 9:59 AM | 110 (14.2%) | 16 (3.0%) |
| 10:00 AM to 10:59 AM | 41 (5.3%) | 13 (2.5%) |
| 11:00 AM to 11:59 AM | 16 (2.1%) | 50 (9.5%) |
| 12:00 PM to 3:59 PM | 88 (11.4%) | 49 (9.3%) |
| 4:00 PM to 11:59 PM | 29 (3.7%) | 9 (1.7%) |
| Total | 773 (100.0%) | 527 (100.0%) |
Housing Occupancy in Norton city
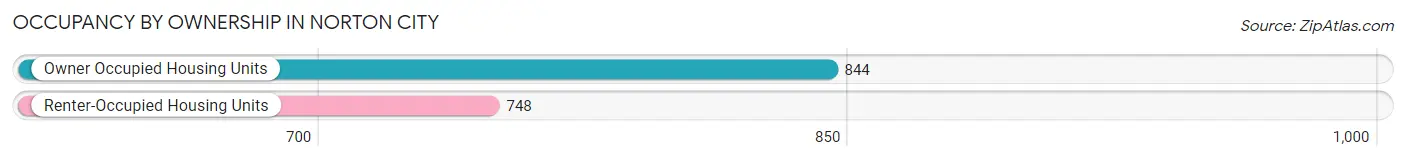
Occupancy by Ownership in Norton city
Of the total 1,592 dwellings in Norton city, owner-occupied units account for 844 (53.0%), while renter-occupied units make up 748 (47.0%).
| Occupancy | # Housing Units | % Housing Units |
| Owner Occupied Housing Units | 844 | 53.0% |
| Renter-Occupied Housing Units | 748 | 47.0% |
| Total Occupied Housing Units | 1,592 | 100.0% |
Occupancy by Household Size in Norton city
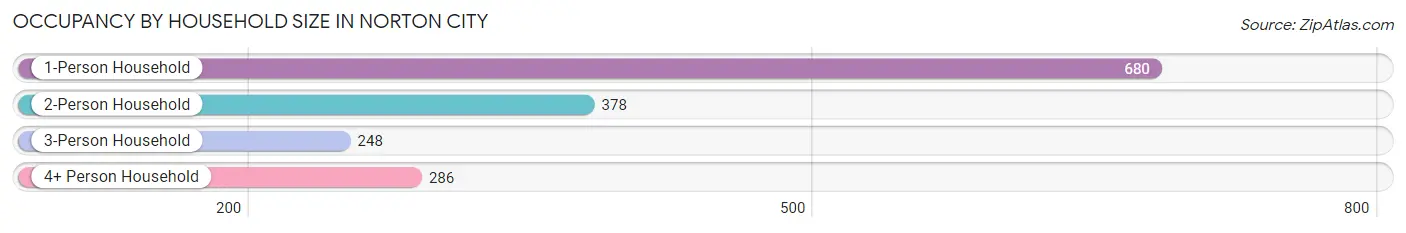
| Household Size | # Housing Units | % Housing Units |
| 1-Person Household | 680 | 42.7% |
| 2-Person Household | 378 | 23.7% |
| 3-Person Household | 248 | 15.6% |
| 4+ Person Household | 286 | 18.0% |
| Total Housing Units | 1,592 | 100.0% |
Occupancy by Ownership by Household Size in Norton city
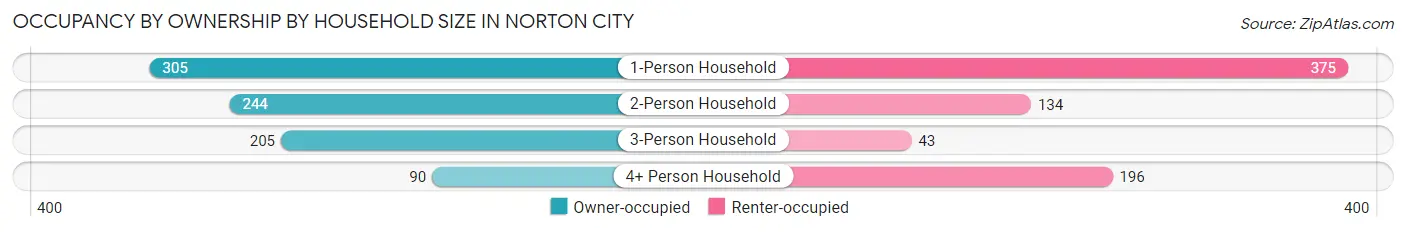
| Household Size | Owner-occupied | Renter-occupied |
| 1-Person Household | 305 (44.9%) | 375 (55.1%) |
| 2-Person Household | 244 (64.5%) | 134 (35.4%) |
| 3-Person Household | 205 (82.7%) | 43 (17.3%) |
| 4+ Person Household | 90 (31.5%) | 196 (68.5%) |
| Total Housing Units | 844 (53.0%) | 748 (47.0%) |
Occupancy by Educational Attainment in Norton city
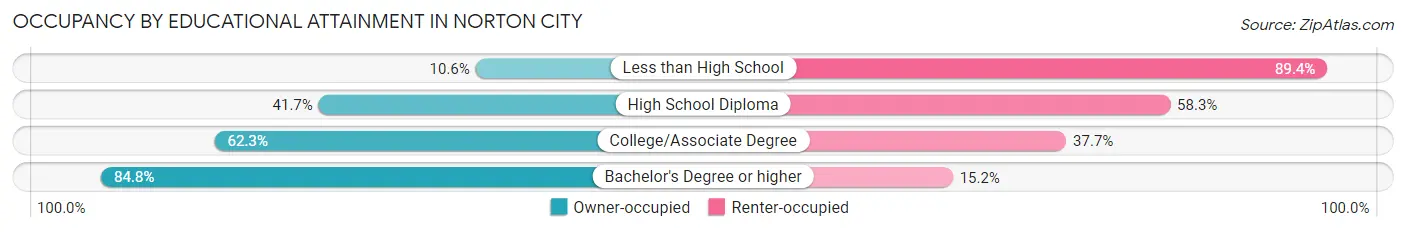
| Household Size | Owner-occupied | Renter-occupied |
| Less than High School | 18 (10.6%) | 152 (89.4%) |
| High School Diploma | 254 (41.7%) | 355 (58.3%) |
| College/Associate Degree | 326 (62.3%) | 197 (37.7%) |
| Bachelor's Degree or higher | 246 (84.8%) | 44 (15.2%) |
Occupancy by Age of Householder in Norton city
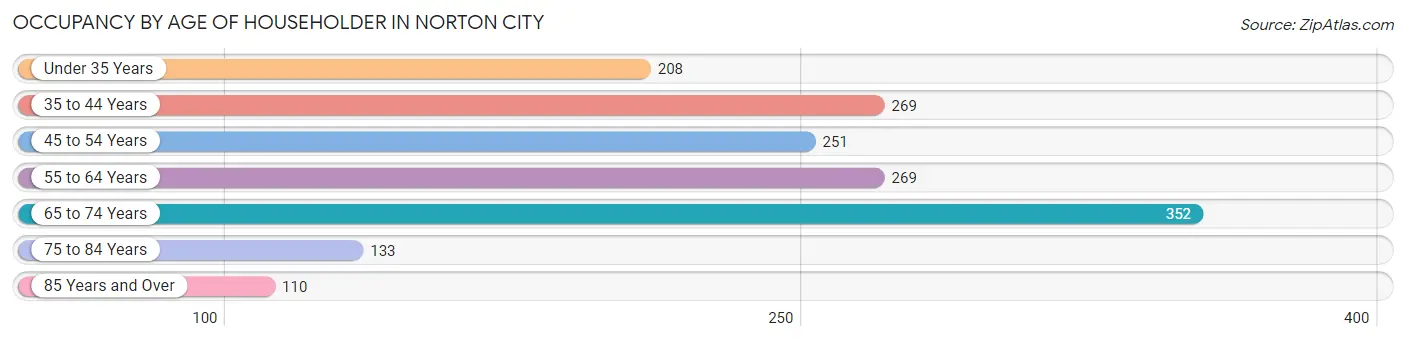
| Age Bracket | # Households | % Households |
| Under 35 Years | 208 | 13.1% |
| 35 to 44 Years | 269 | 16.9% |
| 45 to 54 Years | 251 | 15.8% |
| 55 to 64 Years | 269 | 16.9% |
| 65 to 74 Years | 352 | 22.1% |
| 75 to 84 Years | 133 | 8.4% |
| 85 Years and Over | 110 | 6.9% |
| Total | 1,592 | 100.0% |
Housing Finances in Norton city
Median Income by Occupancy in Norton city
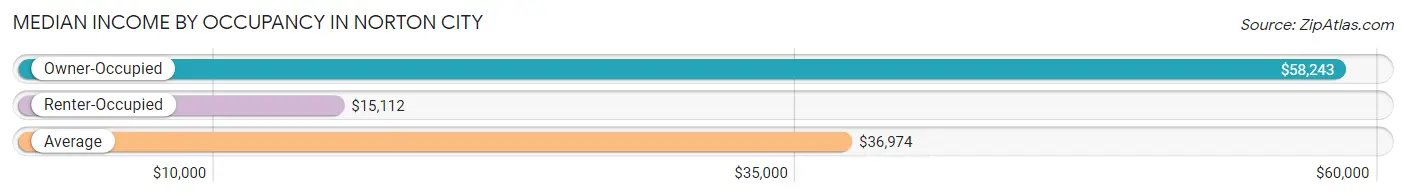
| Occupancy Type | # Households | Median Income |
| Owner-Occupied | 844 (53.0%) | $58,243 |
| Renter-Occupied | 748 (47.0%) | $15,112 |
| Average | 1,592 (100.0%) | $36,974 |
Occupancy by Householder Income Bracket in Norton city
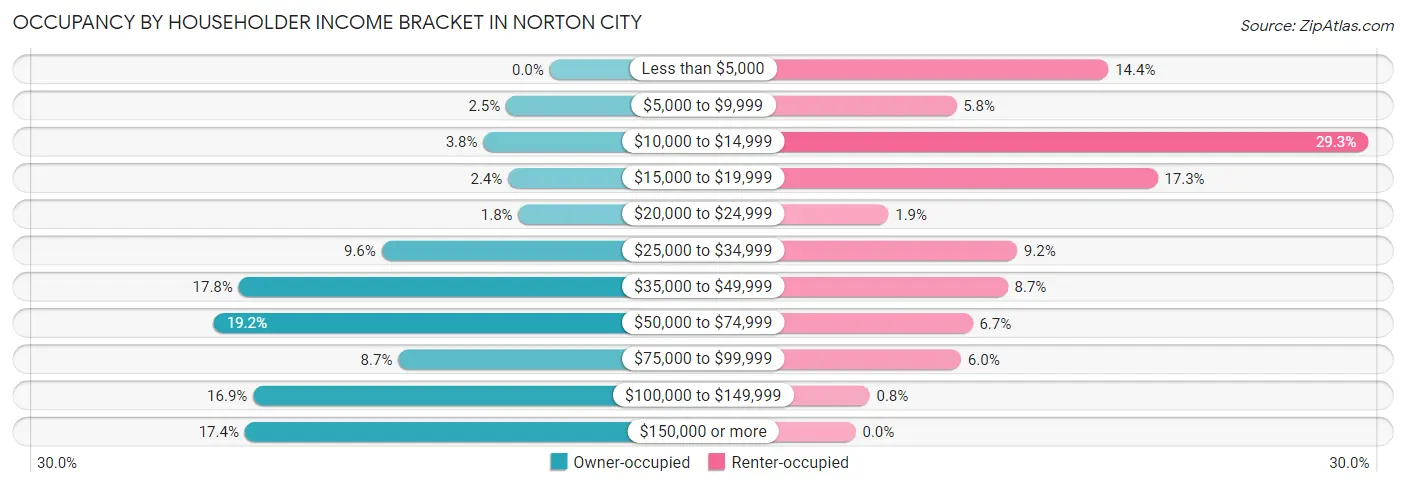
| Income Bracket | Owner-occupied | Renter-occupied |
| Less than $5,000 | 0 (0.0%) | 108 (14.4%) |
| $5,000 to $9,999 | 21 (2.5%) | 43 (5.8%) |
| $10,000 to $14,999 | 32 (3.8%) | 219 (29.3%) |
| $15,000 to $19,999 | 20 (2.4%) | 129 (17.2%) |
| $20,000 to $24,999 | 15 (1.8%) | 14 (1.9%) |
| $25,000 to $34,999 | 81 (9.6%) | 69 (9.2%) |
| $35,000 to $49,999 | 150 (17.8%) | 65 (8.7%) |
| $50,000 to $74,999 | 162 (19.2%) | 50 (6.7%) |
| $75,000 to $99,999 | 73 (8.6%) | 45 (6.0%) |
| $100,000 to $149,999 | 143 (16.9%) | 6 (0.8%) |
| $150,000 or more | 147 (17.4%) | 0 (0.0%) |
| Total | 844 (100.0%) | 748 (100.0%) |
Monthly Housing Cost Tiers in Norton city
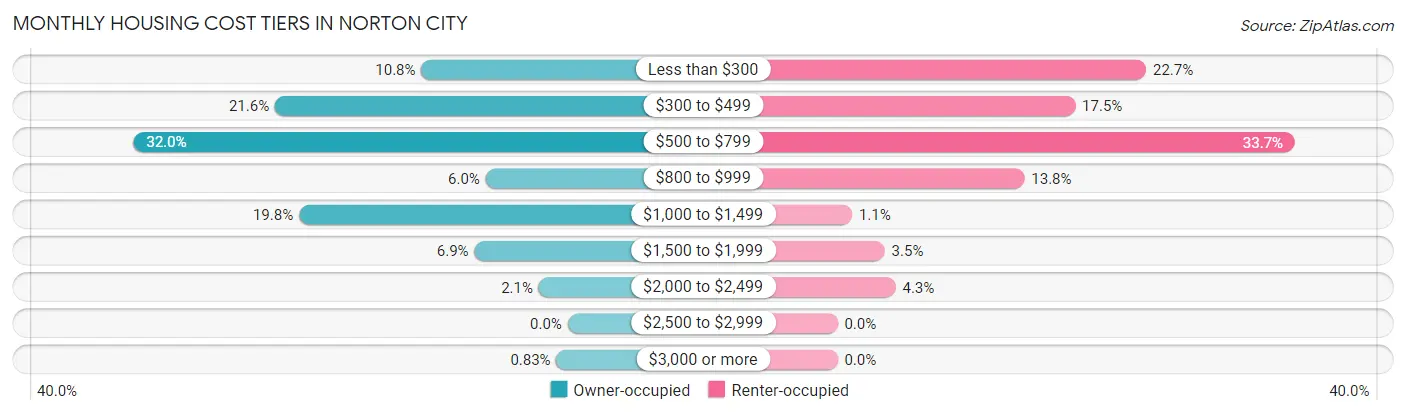
| Monthly Cost | Owner-occupied | Renter-occupied |
| Less than $300 | 91 (10.8%) | 170 (22.7%) |
| $300 to $499 | 182 (21.6%) | 131 (17.5%) |
| $500 to $799 | 270 (32.0%) | 252 (33.7%) |
| $800 to $999 | 51 (6.0%) | 103 (13.8%) |
| $1,000 to $1,499 | 167 (19.8%) | 8 (1.1%) |
| $1,500 to $1,999 | 58 (6.9%) | 26 (3.5%) |
| $2,000 to $2,499 | 18 (2.1%) | 32 (4.3%) |
| $2,500 to $2,999 | 0 (0.0%) | 0 (0.0%) |
| $3,000 or more | 7 (0.8%) | 0 (0.0%) |
| Total | 844 (100.0%) | 748 (100.0%) |
Physical Housing Characteristics in Norton city
Housing Structures in Norton city
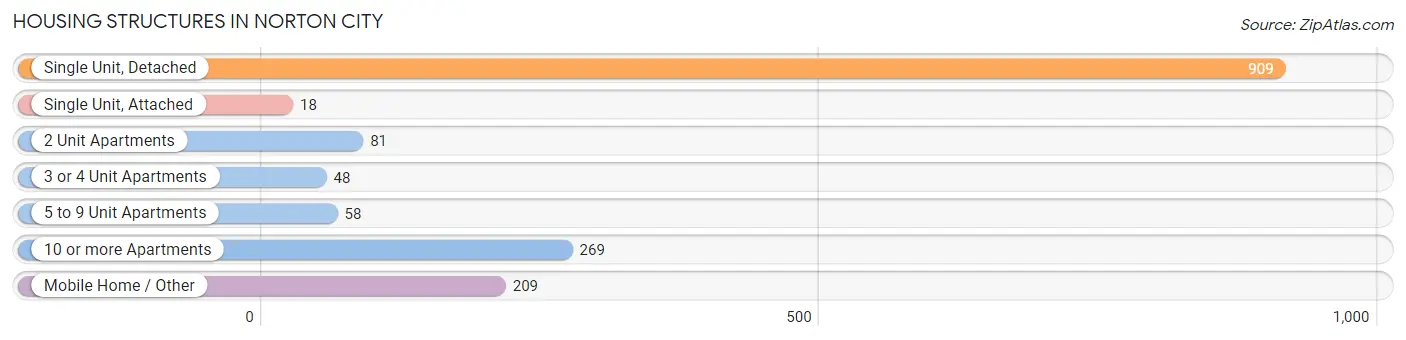
| Structure Type | # Housing Units | % Housing Units |
| Single Unit, Detached | 909 | 57.1% |
| Single Unit, Attached | 18 | 1.1% |
| 2 Unit Apartments | 81 | 5.1% |
| 3 or 4 Unit Apartments | 48 | 3.0% |
| 5 to 9 Unit Apartments | 58 | 3.6% |
| 10 or more Apartments | 269 | 16.9% |
| Mobile Home / Other | 209 | 13.1% |
| Total | 1,592 | 100.0% |
Housing Structures by Occupancy in Norton city
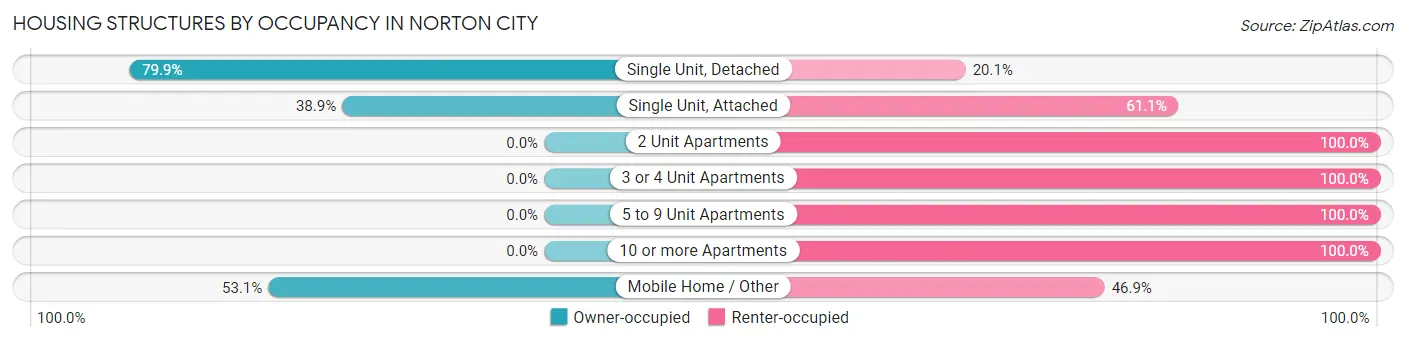
| Structure Type | Owner-occupied | Renter-occupied |
| Single Unit, Detached | 726 (79.9%) | 183 (20.1%) |
| Single Unit, Attached | 7 (38.9%) | 11 (61.1%) |
| 2 Unit Apartments | 0 (0.0%) | 81 (100.0%) |
| 3 or 4 Unit Apartments | 0 (0.0%) | 48 (100.0%) |
| 5 to 9 Unit Apartments | 0 (0.0%) | 58 (100.0%) |
| 10 or more Apartments | 0 (0.0%) | 269 (100.0%) |
| Mobile Home / Other | 111 (53.1%) | 98 (46.9%) |
| Total | 844 (53.0%) | 748 (47.0%) |
Housing Structures by Number of Rooms in Norton city
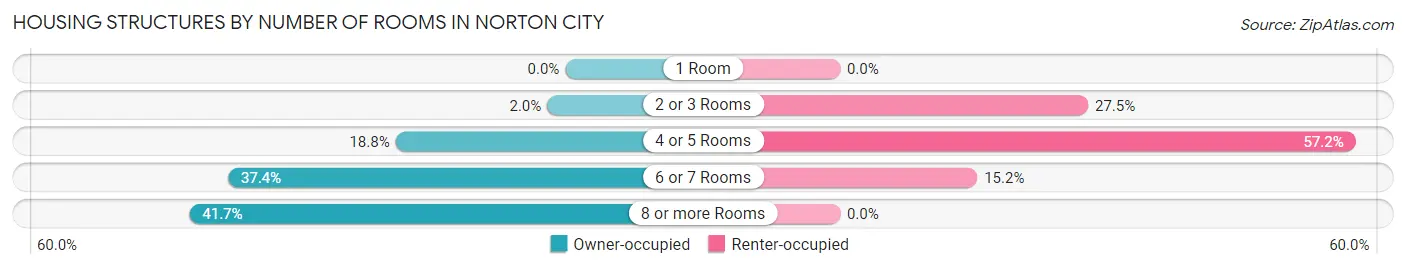
| Number of Rooms | Owner-occupied | Renter-occupied |
| 1 Room | 0 (0.0%) | 0 (0.0%) |
| 2 or 3 Rooms | 17 (2.0%) | 206 (27.5%) |
| 4 or 5 Rooms | 159 (18.8%) | 428 (57.2%) |
| 6 or 7 Rooms | 316 (37.4%) | 114 (15.2%) |
| 8 or more Rooms | 352 (41.7%) | 0 (0.0%) |
| Total | 844 (100.0%) | 748 (100.0%) |
Housing Structure by Heating Type in Norton city
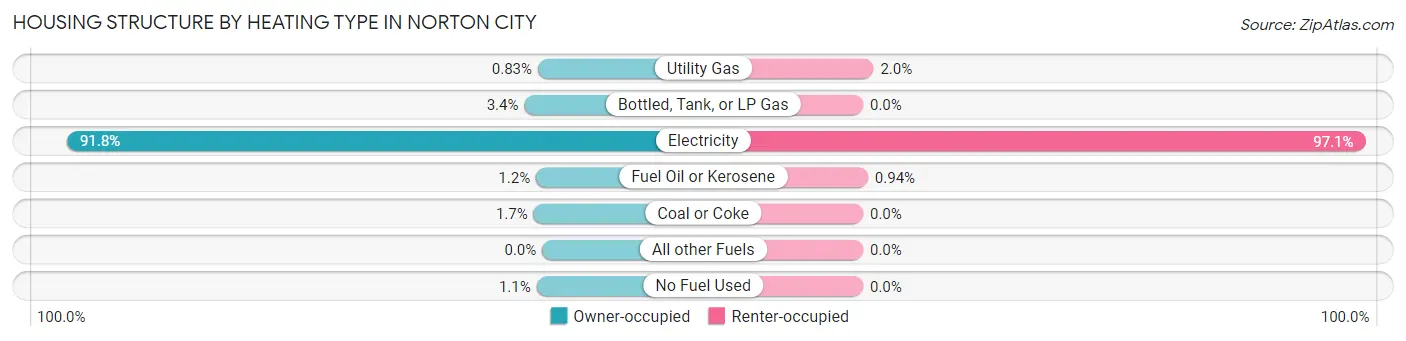
| Heating Type | Owner-occupied | Renter-occupied |
| Utility Gas | 7 (0.8%) | 15 (2.0%) |
| Bottled, Tank, or LP Gas | 29 (3.4%) | 0 (0.0%) |
| Electricity | 775 (91.8%) | 726 (97.1%) |
| Fuel Oil or Kerosene | 10 (1.2%) | 7 (0.9%) |
| Coal or Coke | 14 (1.7%) | 0 (0.0%) |
| All other Fuels | 0 (0.0%) | 0 (0.0%) |
| No Fuel Used | 9 (1.1%) | 0 (0.0%) |
| Total | 844 (100.0%) | 748 (100.0%) |
Household Vehicle Usage in Norton city
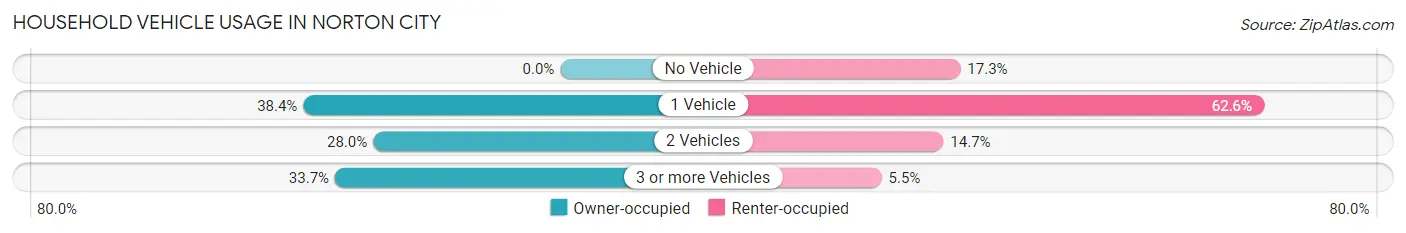
| Vehicles per Household | Owner-occupied | Renter-occupied |
| No Vehicle | 0 (0.0%) | 129 (17.2%) |
| 1 Vehicle | 324 (38.4%) | 468 (62.6%) |
| 2 Vehicles | 236 (28.0%) | 110 (14.7%) |
| 3 or more Vehicles | 284 (33.7%) | 41 (5.5%) |
| Total | 844 (100.0%) | 748 (100.0%) |
Real Estate & Mortgages in Norton city
Real Estate and Mortgage Overview in Norton city
| Characteristic | Without Mortgage | With Mortgage |
| Housing Units | 535 | 309 |
| Median Property Value | $85,000 | $144,000 |
| Median Household Income | $53,979 | $96 |
| Monthly Housing Costs | $494 | $7 |
| Real Estate Taxes | $739 | $25 |
Property Value by Mortgage Status in Norton city
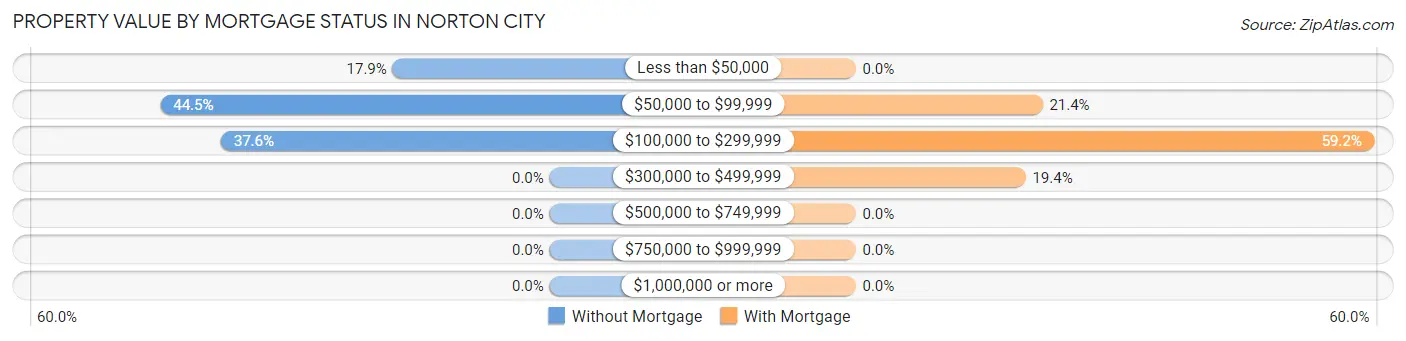
| Property Value | Without Mortgage | With Mortgage |
| Less than $50,000 | 96 (17.9%) | 0 (0.0%) |
| $50,000 to $99,999 | 238 (44.5%) | 66 (21.4%) |
| $100,000 to $299,999 | 201 (37.6%) | 183 (59.2%) |
| $300,000 to $499,999 | 0 (0.0%) | 60 (19.4%) |
| $500,000 to $749,999 | 0 (0.0%) | 0 (0.0%) |
| $750,000 to $999,999 | 0 (0.0%) | 0 (0.0%) |
| $1,000,000 or more | 0 (0.0%) | 0 (0.0%) |
| Total | 535 (100.0%) | 309 (100.0%) |
Household Income by Mortgage Status in Norton city
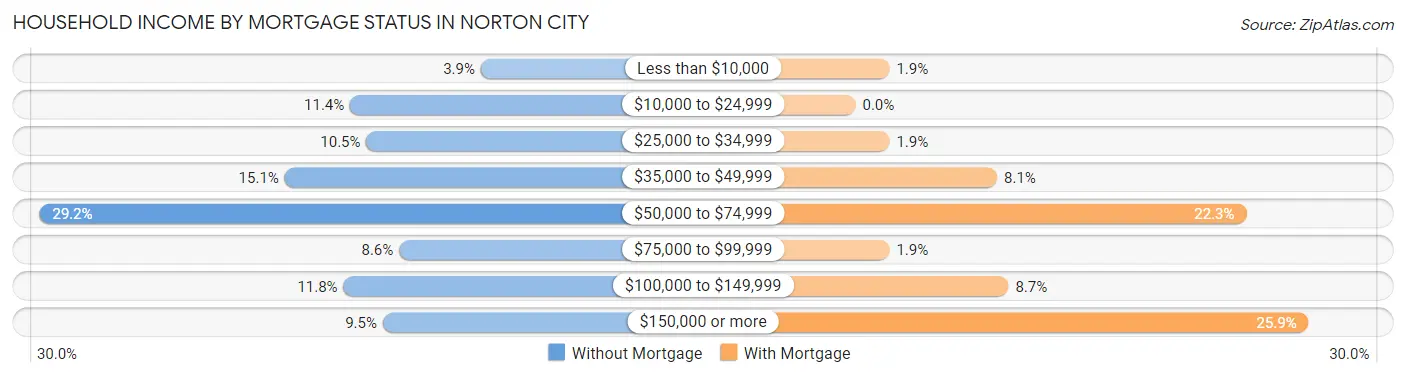
| Household Income | Without Mortgage | With Mortgage |
| Less than $10,000 | 21 (3.9%) | 6 (1.9%) |
| $10,000 to $24,999 | 61 (11.4%) | 0 (0.0%) |
| $25,000 to $34,999 | 56 (10.5%) | 6 (1.9%) |
| $35,000 to $49,999 | 81 (15.1%) | 25 (8.1%) |
| $50,000 to $74,999 | 156 (29.2%) | 69 (22.3%) |
| $75,000 to $99,999 | 46 (8.6%) | 6 (1.9%) |
| $100,000 to $149,999 | 63 (11.8%) | 27 (8.7%) |
| $150,000 or more | 51 (9.5%) | 80 (25.9%) |
| Total | 535 (100.0%) | 309 (100.0%) |
Property Value to Household Income Ratio in Norton city
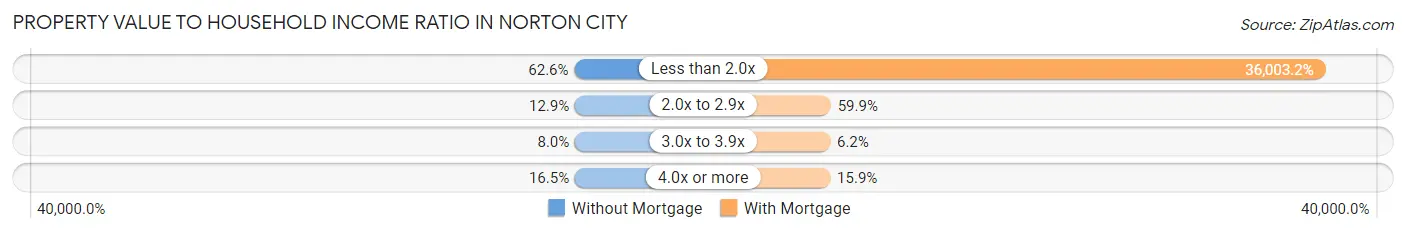
| Value-to-Income Ratio | Without Mortgage | With Mortgage |
| Less than 2.0x | 335 (62.6%) | 111,250 (36,003.2%) |
| 2.0x to 2.9x | 69 (12.9%) | 185 (59.9%) |
| 3.0x to 3.9x | 43 (8.0%) | 19 (6.1%) |
| 4.0x or more | 88 (16.5%) | 49 (15.9%) |
| Total | 535 (100.0%) | 309 (100.0%) |
Real Estate Taxes by Mortgage Status in Norton city
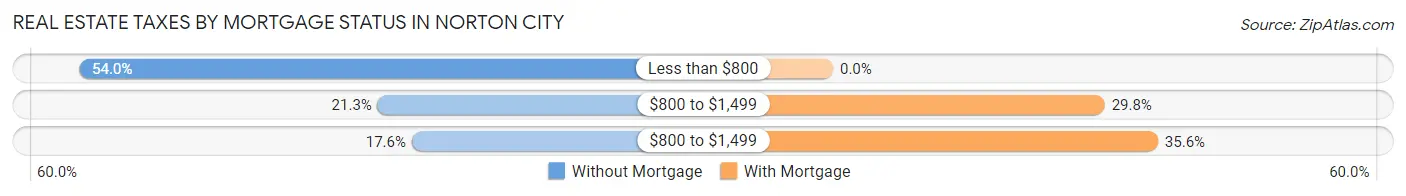
| Property Taxes | Without Mortgage | With Mortgage |
| Less than $800 | 289 (54.0%) | 0 (0.0%) |
| $800 to $1,499 | 114 (21.3%) | 92 (29.8%) |
| $800 to $1,499 | 94 (17.6%) | 110 (35.6%) |
| Total | 535 (100.0%) | 309 (100.0%) |
Health & Disability in Norton city
Health Insurance Coverage by Age in Norton city
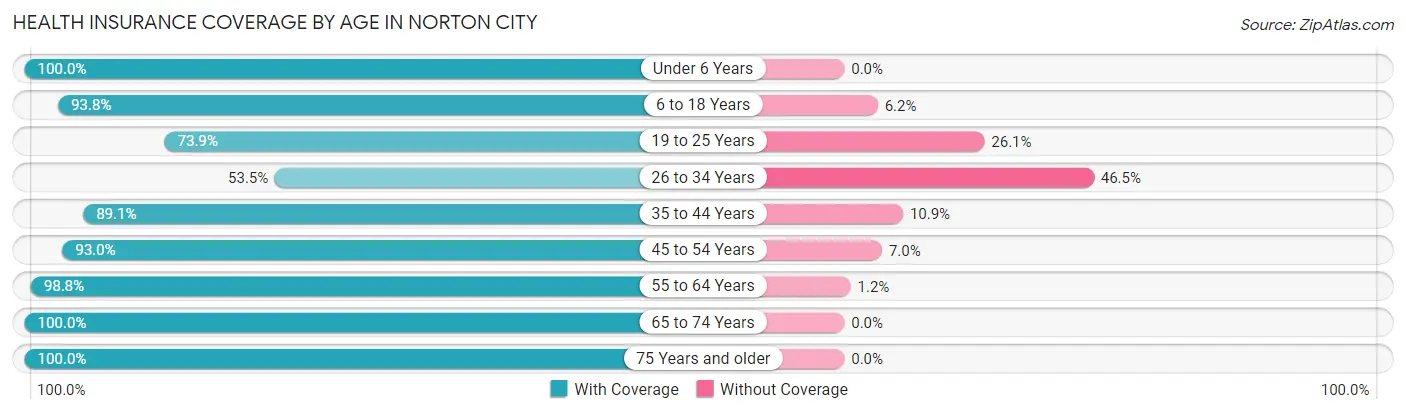
| Age Bracket | With Coverage | Without Coverage |
| Under 6 Years | 120 (100.0%) | 0 (0.0%) |
| 6 to 18 Years | 482 (93.8%) | 32 (6.2%) |
| 19 to 25 Years | 314 (73.9%) | 111 (26.1%) |
| 26 to 34 Years | 162 (53.5%) | 141 (46.5%) |
| 35 to 44 Years | 472 (89.1%) | 58 (10.9%) |
| 45 to 54 Years | 423 (93.0%) | 32 (7.0%) |
| 55 to 64 Years | 504 (98.8%) | 6 (1.2%) |
| 65 to 74 Years | 467 (100.0%) | 0 (0.0%) |
| 75 Years and older | 280 (100.0%) | 0 (0.0%) |
| Total | 3,224 (89.5%) | 380 (10.5%) |
Health Insurance Coverage by Citizenship Status in Norton city
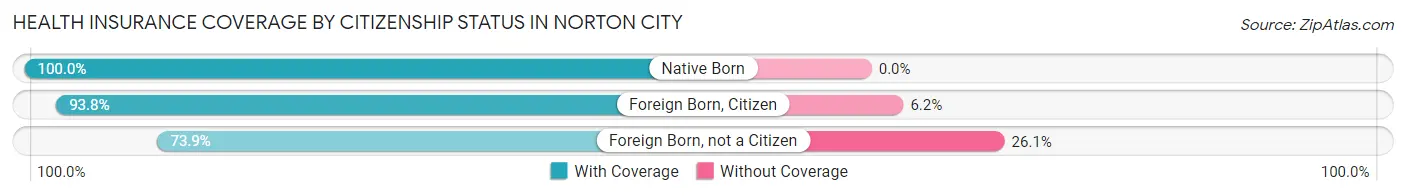
| Citizenship Status | With Coverage | Without Coverage |
| Native Born | 120 (100.0%) | 0 (0.0%) |
| Foreign Born, Citizen | 482 (93.8%) | 32 (6.2%) |
| Foreign Born, not a Citizen | 314 (73.9%) | 111 (26.1%) |
Health Insurance Coverage by Household Income in Norton city
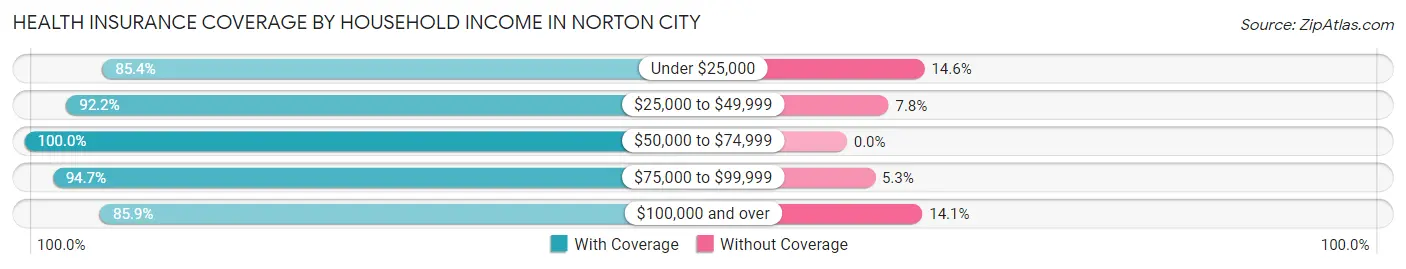
| Household Income | With Coverage | Without Coverage |
| Under $25,000 | 939 (85.4%) | 160 (14.6%) |
| $25,000 to $49,999 | 719 (92.2%) | 61 (7.8%) |
| $50,000 to $74,999 | 411 (100.0%) | 0 (0.0%) |
| $75,000 to $99,999 | 287 (94.7%) | 16 (5.3%) |
| $100,000 and over | 868 (85.9%) | 143 (14.1%) |
Public vs Private Health Insurance Coverage by Age in Norton city
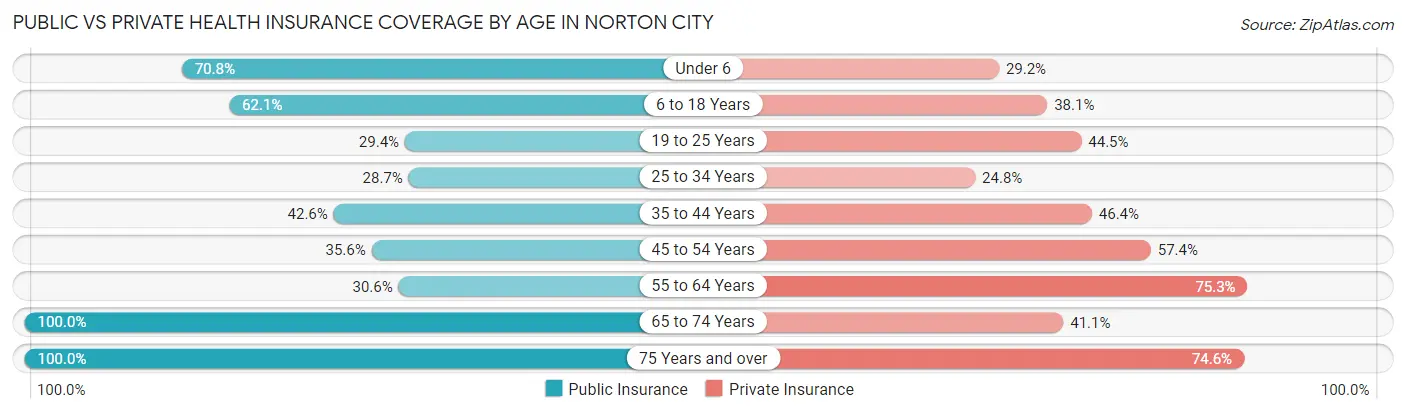
| Age Bracket | Public Insurance | Private Insurance |
| Under 6 | 85 (70.8%) | 35 (29.2%) |
| 6 to 18 Years | 319 (62.1%) | 196 (38.1%) |
| 19 to 25 Years | 125 (29.4%) | 189 (44.5%) |
| 25 to 34 Years | 87 (28.7%) | 75 (24.7%) |
| 35 to 44 Years | 226 (42.6%) | 246 (46.4%) |
| 45 to 54 Years | 162 (35.6%) | 261 (57.4%) |
| 55 to 64 Years | 156 (30.6%) | 384 (75.3%) |
| 65 to 74 Years | 467 (100.0%) | 192 (41.1%) |
| 75 Years and over | 280 (100.0%) | 209 (74.6%) |
| Total | 1,907 (52.9%) | 1,787 (49.6%) |
Disability Status by Sex by Age in Norton city
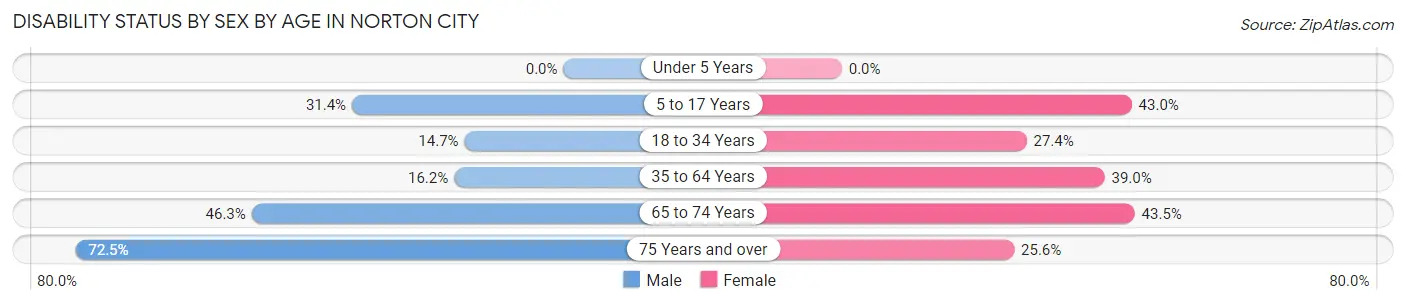
| Age Bracket | Male | Female |
| Under 5 Years | 0 (0.0%) | 0 (0.0%) |
| 5 to 17 Years | 86 (31.4%) | 99 (43.0%) |
| 18 to 34 Years | 57 (14.7%) | 96 (27.4%) |
| 35 to 64 Years | 117 (16.2%) | 302 (39.0%) |
| 65 to 74 Years | 81 (46.3%) | 127 (43.5%) |
| 75 Years and over | 50 (72.5%) | 54 (25.6%) |
Disability Class by Sex by Age in Norton city
Disability Class: Hearing Difficulty
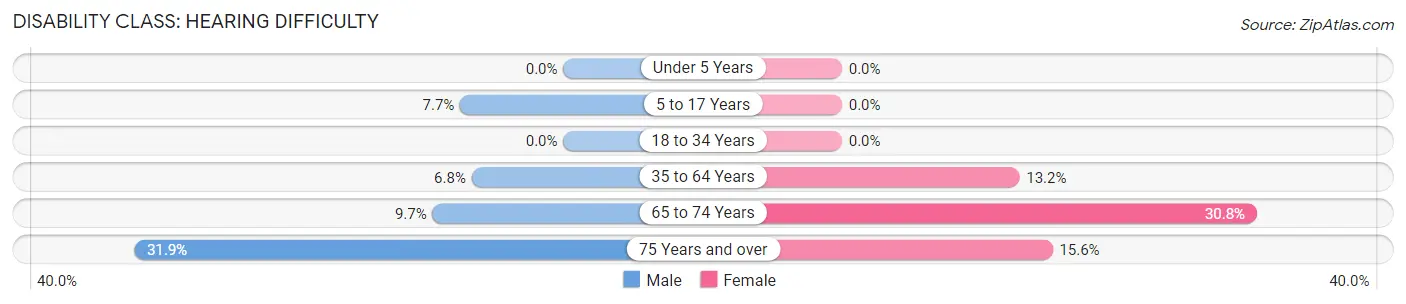
| Age Bracket | Male | Female |
| Under 5 Years | 0 (0.0%) | 0 (0.0%) |
| 5 to 17 Years | 21 (7.7%) | 0 (0.0%) |
| 18 to 34 Years | 0 (0.0%) | 0 (0.0%) |
| 35 to 64 Years | 49 (6.8%) | 102 (13.2%) |
| 65 to 74 Years | 17 (9.7%) | 90 (30.8%) |
| 75 Years and over | 22 (31.9%) | 33 (15.6%) |
Disability Class: Vision Difficulty
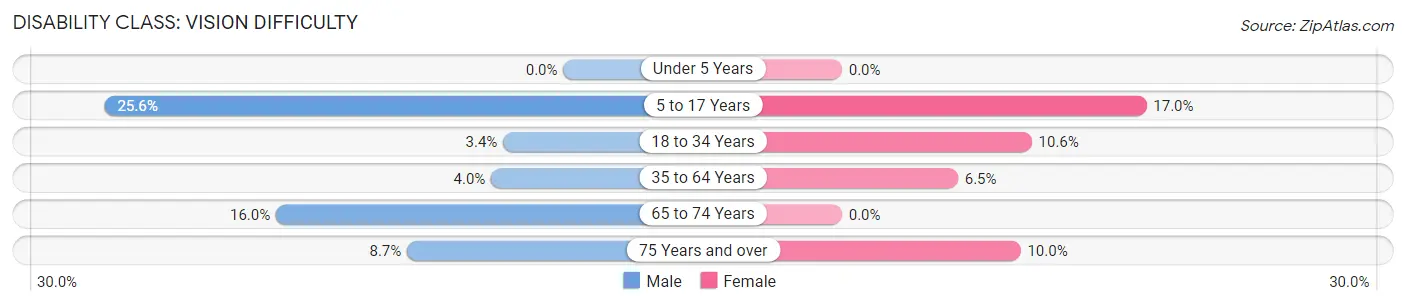
| Age Bracket | Male | Female |
| Under 5 Years | 0 (0.0%) | 0 (0.0%) |
| 5 to 17 Years | 70 (25.6%) | 39 (17.0%) |
| 18 to 34 Years | 13 (3.4%) | 37 (10.6%) |
| 35 to 64 Years | 29 (4.0%) | 50 (6.5%) |
| 65 to 74 Years | 28 (16.0%) | 0 (0.0%) |
| 75 Years and over | 6 (8.7%) | 21 (10.0%) |
Disability Class: Cognitive Difficulty
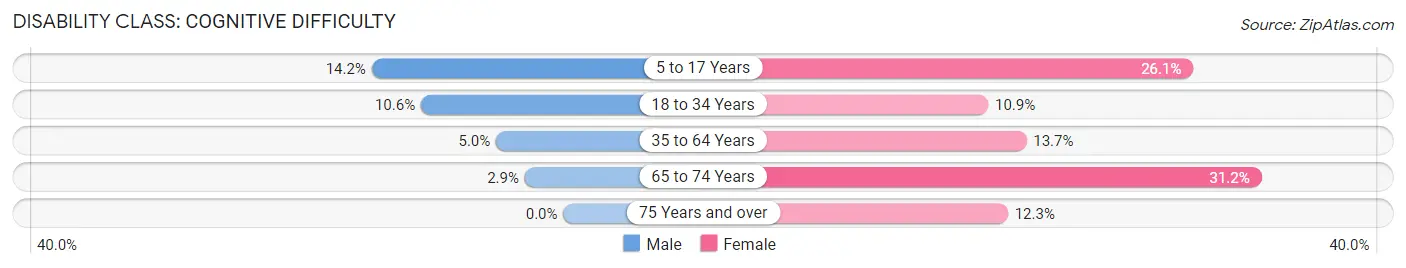
| Age Bracket | Male | Female |
| 5 to 17 Years | 39 (14.2%) | 60 (26.1%) |
| 18 to 34 Years | 41 (10.6%) | 38 (10.9%) |
| 35 to 64 Years | 36 (5.0%) | 106 (13.7%) |
| 65 to 74 Years | 5 (2.9%) | 91 (31.2%) |
| 75 Years and over | 0 (0.0%) | 26 (12.3%) |
Disability Class: Ambulatory Difficulty
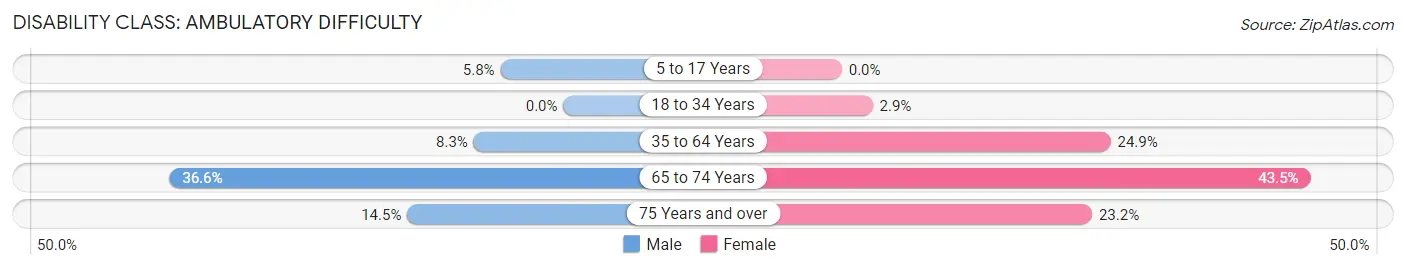
| Age Bracket | Male | Female |
| 5 to 17 Years | 16 (5.8%) | 0 (0.0%) |
| 18 to 34 Years | 0 (0.0%) | 10 (2.9%) |
| 35 to 64 Years | 60 (8.3%) | 193 (24.9%) |
| 65 to 74 Years | 64 (36.6%) | 127 (43.5%) |
| 75 Years and over | 10 (14.5%) | 49 (23.2%) |
Disability Class: Self-Care Difficulty
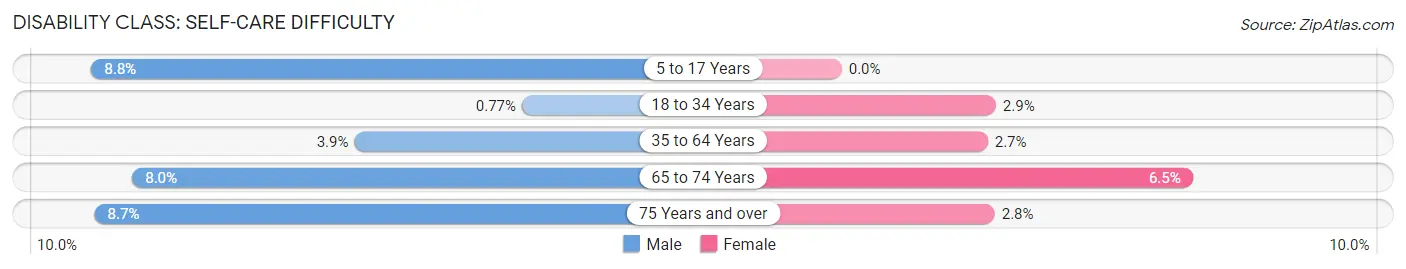
| Age Bracket | Male | Female |
| 5 to 17 Years | 24 (8.8%) | 0 (0.0%) |
| 18 to 34 Years | 3 (0.8%) | 10 (2.9%) |
| 35 to 64 Years | 28 (3.9%) | 21 (2.7%) |
| 65 to 74 Years | 14 (8.0%) | 19 (6.5%) |
| 75 Years and over | 6 (8.7%) | 6 (2.8%) |
Technology Access in Norton city
Computing Device Access in Norton city
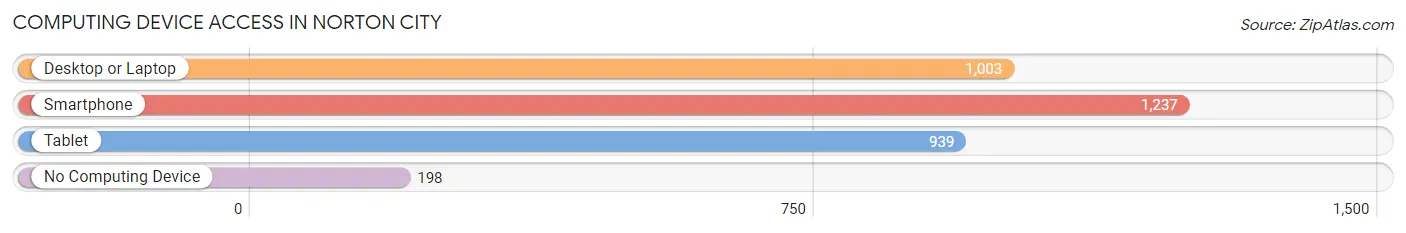
| Device Type | # Households | % Households |
| Desktop or Laptop | 1,003 | 63.0% |
| Smartphone | 1,237 | 77.7% |
| Tablet | 939 | 59.0% |
| No Computing Device | 198 | 12.4% |
| Total | 1,592 | 100.0% |
Internet Access in Norton city
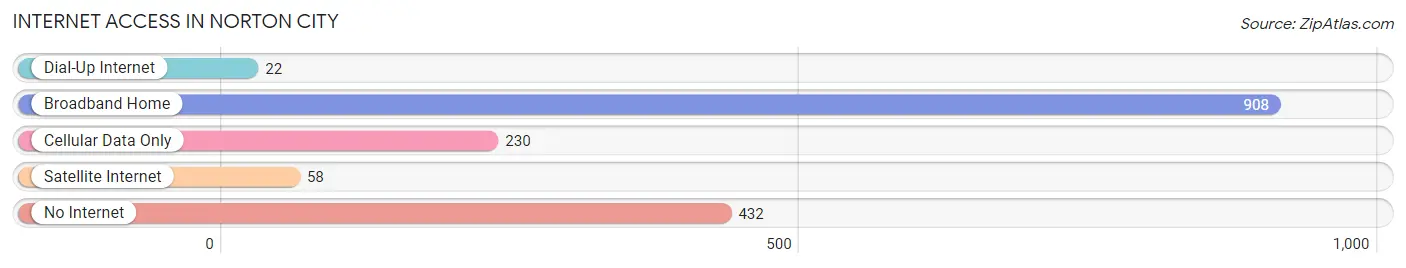
| Internet Type | # Households | % Households |
| Dial-Up Internet | 22 | 1.4% |
| Broadband Home | 908 | 57.0% |
| Cellular Data Only | 230 | 14.4% |
| Satellite Internet | 58 | 3.6% |
| No Internet | 432 | 27.1% |
| Total | 1,592 | 100.0% |
Norton city Summary
Norton City, Virginia is a small city located in the southwestern corner of the state. It is the county seat of Wise County and is part of the Appalachian region. The city has a population of approximately 3,958 people, according to the 2010 census.
History
Norton City was founded in 1854 and was named after the Norton family, who were among the first settlers in the area. The city was originally a small farming community, but it quickly grew into a bustling town due to the coal mining industry. The city was incorporated in 1891 and was the first city in Wise County to be incorporated.
The city experienced a period of growth in the early 20th century, with the construction of the Norfolk and Western Railway in 1906. This allowed for the transportation of coal from the mines in the area to other parts of the country. The city also experienced a period of growth during the Great Depression, when the federal government established the Norton City Works Project Administration (WPA) to provide jobs for the unemployed.
Geography
Norton City is located in the Appalachian Mountains in the southwestern corner of Virginia. The city is situated in the Appalachian Plateau, which is characterized by rolling hills and valleys. The city is located at an elevation of 1,845 feet above sea level.
The city is located in a humid subtropical climate zone, with hot summers and mild winters. The average annual temperature is around 57 degrees Fahrenheit. The city receives an average of 44 inches of precipitation per year, with most of it falling in the form of rain.
Economy
Norton City’s economy is largely based on the coal mining industry. The city is home to several coal mines, which provide jobs for many of the city’s residents. The city also has a number of small businesses, including restaurants, retail stores, and other services.
The city is also home to a number of manufacturing companies, including a furniture factory and a paper mill. The city is also home to a number of educational institutions, including the University of Virginia’s College at Wise and Mountain Empire Community College.
Demographics
According to the 2010 census, the population of Norton City was 3,958. The racial makeup of the city was 95.3% White, 2.2% African American, 0.3% Native American, 0.3% Asian, 0.1% Pacific Islander, 0.7% from other races, and 1.2% from two or more races. Hispanic or Latino of any race were 1.7% of the population.
The median household income in Norton City was $30,938, and the median family income was $37,813. The per capita income for the city was $17,845. About 17.2% of the population was below the poverty line.
Norton City is a small city with a rich history and a diverse economy. The city is home to a number of coal mines, manufacturing companies, and educational institutions. The city has a population of approximately 3,958 people, with a median household income of $30,938. The city is located in the Appalachian Mountains and has a humid subtropical climate.
Common Questions
What is Per Capita Income in Norton city?
Per Capita income in Norton city is $27,666.
What is the Median Family Income in Norton city?
Median Family Income in Norton city is $59,750.
What is the Median Household income in Norton city?
Median Household Income in Norton city is $36,974.
What is Income or Wage Gap in Norton city?
Income or Wage Gap in Norton city is 8.1%.
Women in Norton city earn 91.9 cents for every dollar earned by a man.
What is Inequality or Gini Index in Norton city?
Inequality or Gini Index in Norton city is 0.52.
What is the Total Population of Norton city?
Total Population of Norton city is 3,668.
What is the Total Male Population of Norton city?
Total Male Population of Norton city is 1,692.
What is the Total Female Population of Norton city?
Total Female Population of Norton city is 1,976.
What is the Ratio of Males per 100 Females in Norton city?
There are 85.63 Males per 100 Females in Norton city.
What is the Ratio of Females per 100 Males in Norton city?
There are 116.78 Females per 100 Males in Norton city.
What is the Median Population Age in Norton city?
Median Population Age in Norton city is 43.6 Years.
What is the Average Family Size in Norton city
Average Family Size in Norton city is 3.0 People.
What is the Average Household Size in Norton city
Average Household Size in Norton city is 2.3 People.
How Large is the Labor Force in Norton city?
There are 1,625 People in the Labor Forcein in Norton city.
What is the Percentage of People in the Labor Force in Norton city?
51.8% of People are in the Labor Force in Norton city.
What is the Unemployment Rate in Norton city?
Unemployment Rate in Norton city is 7.3%.