Northumberland County, VA Map & Demographics
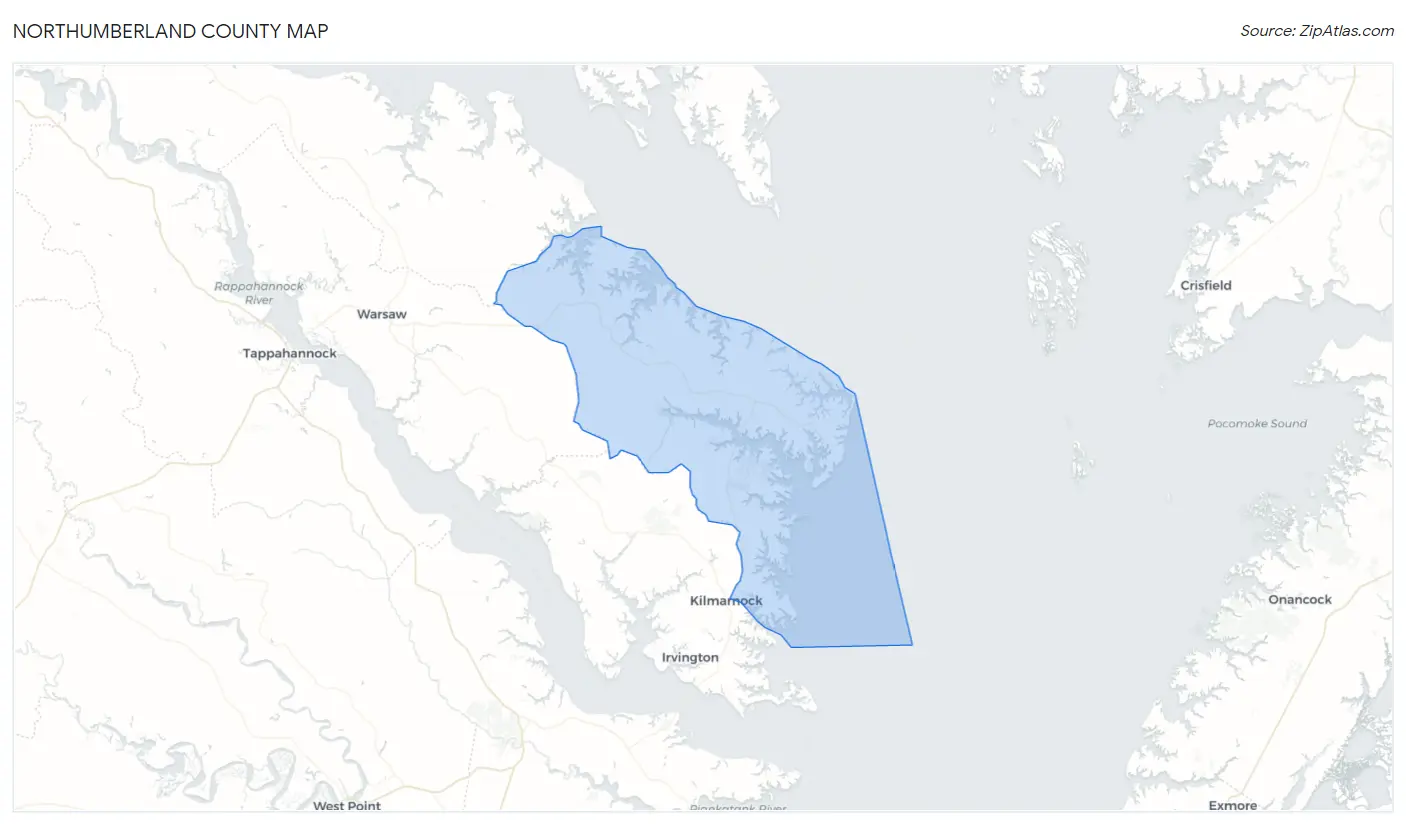
Northumberland County Map
Northumberland County Overview
$45,156
PER CAPITA INCOME
$83,470
AVG FAMILY INCOME
$64,655
AVG HOUSEHOLD INCOME
17.4%
WAGE / INCOME GAP [ % ]
82.6¢/ $1
WAGE / INCOME GAP [ $ ]
$12,546
FAMILY INCOME DEFICIT
0.51
INEQUALITY / GINI INDEX
12,007
TOTAL POPULATION
5,555
MALE POPULATION
6,452
FEMALE POPULATION
86.10
MALES / 100 FEMALES
116.15
FEMALES / 100 MALES
59.0
MEDIAN AGE
2.9
AVG FAMILY SIZE
2.3
AVG HOUSEHOLD SIZE
4,579
LABOR FORCE [ PEOPLE ]
43.2%
PERCENT IN LABOR FORCE
4.9%
UNEMPLOYMENT RATE
Northumberland County Area Codes
Income in Northumberland County
Income Overview in Northumberland County
Per Capita Income in Northumberland County is $45,156, while median incomes of families and households are $83,470 and $64,655 respectively.
| Characteristic | Number | Measure |
| Per Capita Income | 12,007 | $45,156 |
| Median Family Income | 3,177 | $83,470 |
| Mean Family Income | 3,177 | $111,879 |
| Median Household Income | 5,174 | $64,655 |
| Mean Household Income | 5,174 | $98,655 |
| Income Deficit | 3,177 | $12,546 |
| Wage / Income Gap (%) | 12,007 | 17.43% |
| Wage / Income Gap ($) | 12,007 | 82.57¢ per $1 |
| Gini / Inequality Index | 12,007 | 0.51 |
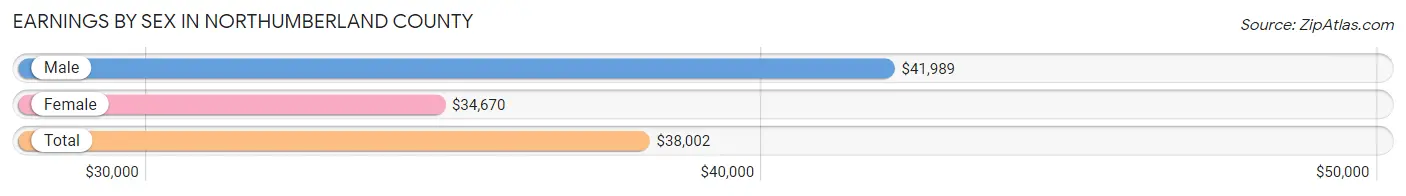
Earnings by Sex in Northumberland County
Average Earnings in Northumberland County are $38,002, $41,989 for men and $34,670 for women, a difference of 17.4%.
| Sex | Number | Average Earnings |
| Male | 2,427 (49.9%) | $41,989 |
| Female | 2,436 (50.1%) | $34,670 |
| Total | 4,863 (100.0%) | $38,002 |
Earnings by Sex by Income Bracket in Northumberland County
The most common earnings brackets in Northumberland County are $100,000+ for men (526 | 21.7%) and $75,000 to $99,999 for women (224 | 9.2%).
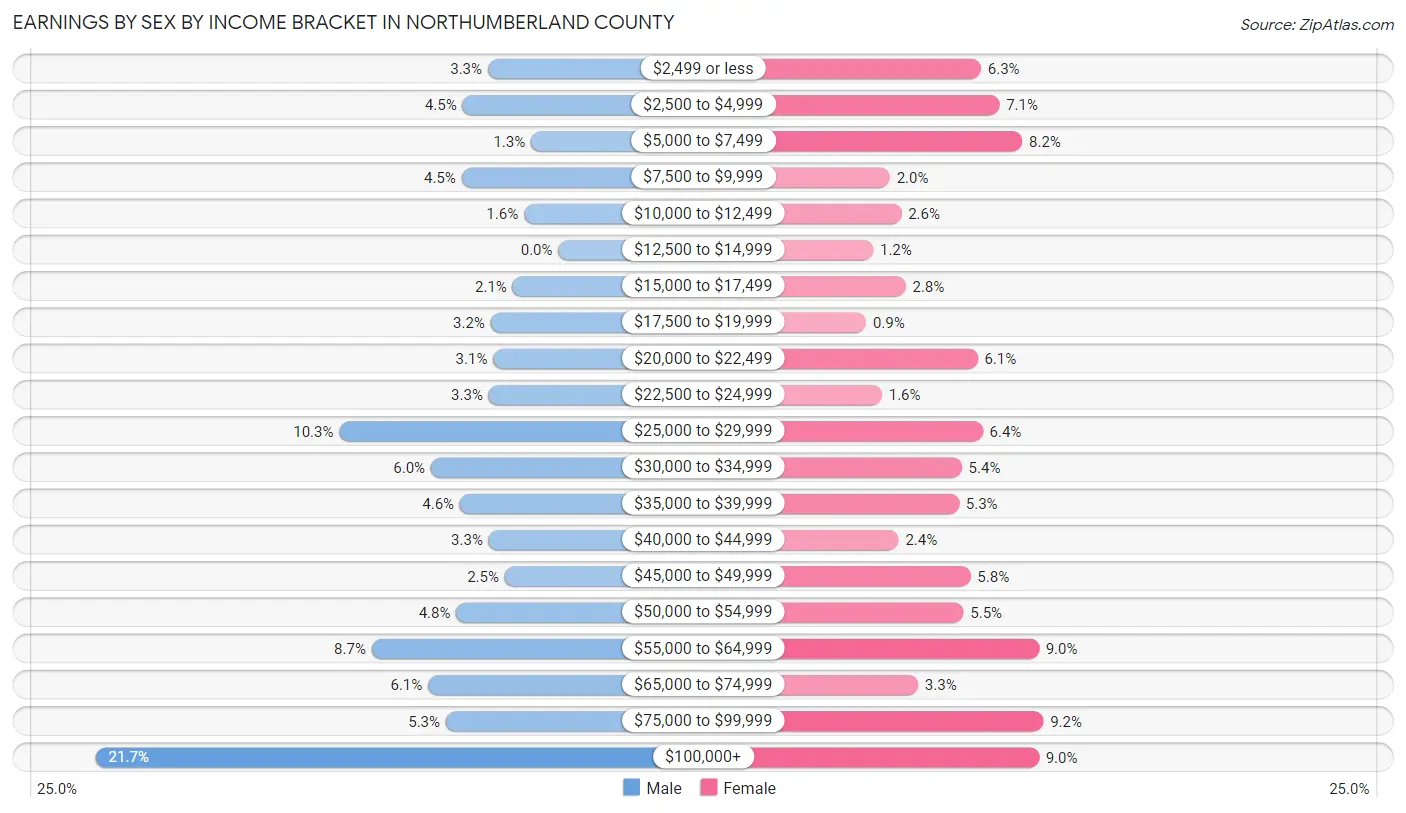
| Income | Male | Female |
| $2,499 or less | 80 (3.3%) | 153 (6.3%) |
| $2,500 to $4,999 | 109 (4.5%) | 174 (7.1%) |
| $5,000 to $7,499 | 31 (1.3%) | 200 (8.2%) |
| $7,500 to $9,999 | 110 (4.5%) | 49 (2.0%) |
| $10,000 to $12,499 | 39 (1.6%) | 62 (2.5%) |
| $12,500 to $14,999 | 0 (0.0%) | 30 (1.2%) |
| $15,000 to $17,499 | 52 (2.1%) | 67 (2.8%) |
| $17,500 to $19,999 | 77 (3.2%) | 22 (0.9%) |
| $20,000 to $22,499 | 74 (3.0%) | 149 (6.1%) |
| $22,500 to $24,999 | 79 (3.3%) | 40 (1.6%) |
| $25,000 to $29,999 | 249 (10.3%) | 155 (6.4%) |
| $30,000 to $34,999 | 145 (6.0%) | 131 (5.4%) |
| $35,000 to $39,999 | 112 (4.6%) | 128 (5.2%) |
| $40,000 to $44,999 | 79 (3.3%) | 59 (2.4%) |
| $45,000 to $49,999 | 61 (2.5%) | 141 (5.8%) |
| $50,000 to $54,999 | 116 (4.8%) | 133 (5.5%) |
| $55,000 to $64,999 | 212 (8.7%) | 219 (9.0%) |
| $65,000 to $74,999 | 148 (6.1%) | 81 (3.3%) |
| $75,000 to $99,999 | 128 (5.3%) | 224 (9.2%) |
| $100,000+ | 526 (21.7%) | 219 (9.0%) |
| Total | 2,427 (100.0%) | 2,436 (100.0%) |
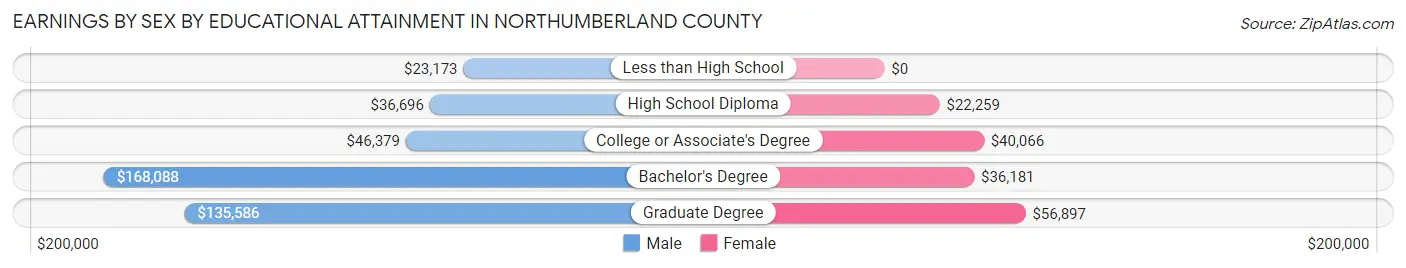
Earnings by Sex by Educational Attainment in Northumberland County
Average earnings in Northumberland County are $48,424 for men and $39,392 for women, a difference of 18.6%. Men with an educational attainment of bachelor's degree enjoy the highest average annual earnings of $168,088, while those with less than high school education earn the least with $23,173. Women with an educational attainment of graduate degree earn the most with the average annual earnings of $56,897, while those with high school diploma education have the smallest earnings of $22,259.
| Educational Attainment | Male Income | Female Income |
| Less than High School | $23,173 | $0 |
| High School Diploma | $36,696 | $22,259 |
| College or Associate's Degree | $46,379 | $40,066 |
| Bachelor's Degree | $168,088 | $36,181 |
| Graduate Degree | $135,586 | $56,897 |
| Total | $48,424 | $39,392 |
Family Income in Northumberland County
Family Income Brackets in Northumberland County
According to the Northumberland County family income data, there are 540 families falling into the $50,000 to $74,999 income range, which is the most common income bracket and makes up 17.0% of all families. Conversely, the $10,000 to $14,999 income bracket is the least frequent group with only 73 families (2.3%) belonging to this category.
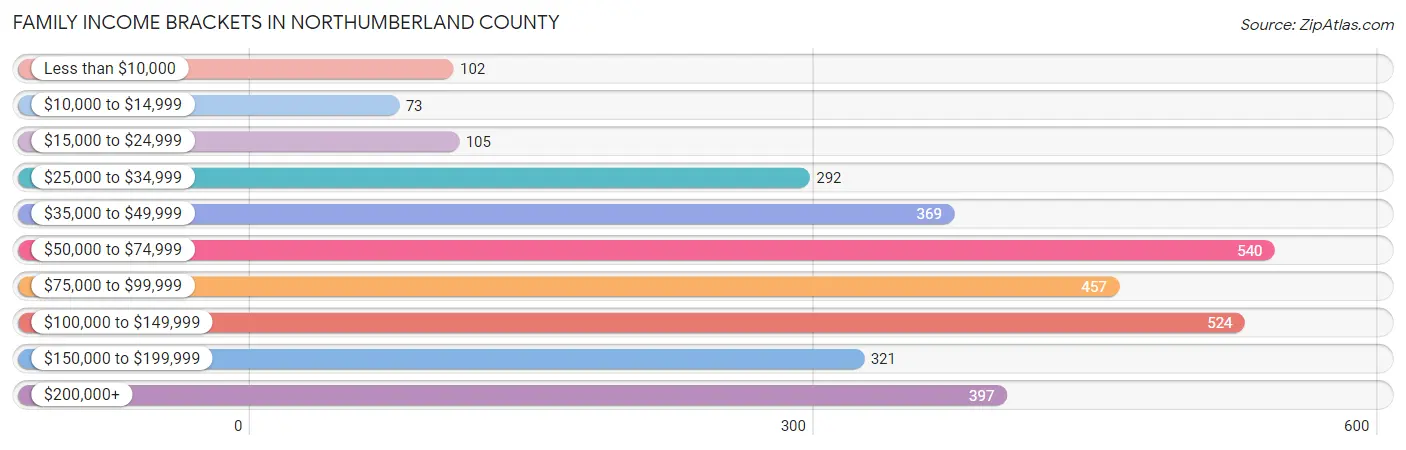
| Income Bracket | # Families | % Families |
| Less than $10,000 | 102 | 3.2% |
| $10,000 to $14,999 | 73 | 2.3% |
| $15,000 to $24,999 | 105 | 3.3% |
| $25,000 to $34,999 | 292 | 9.2% |
| $35,000 to $49,999 | 369 | 11.6% |
| $50,000 to $74,999 | 540 | 17.0% |
| $75,000 to $99,999 | 457 | 14.4% |
| $100,000 to $149,999 | 524 | 16.5% |
| $150,000 to $199,999 | 321 | 10.1% |
| $200,000+ | 397 | 12.5% |
Family Income by Famaliy Size in Northumberland County
7+ person families (85 | 2.7%) account for the highest median family income in Northumberland County with $198,586 per family, while 2-person families (2,345 | 73.8%) have the highest median income of $40,456 per family member.
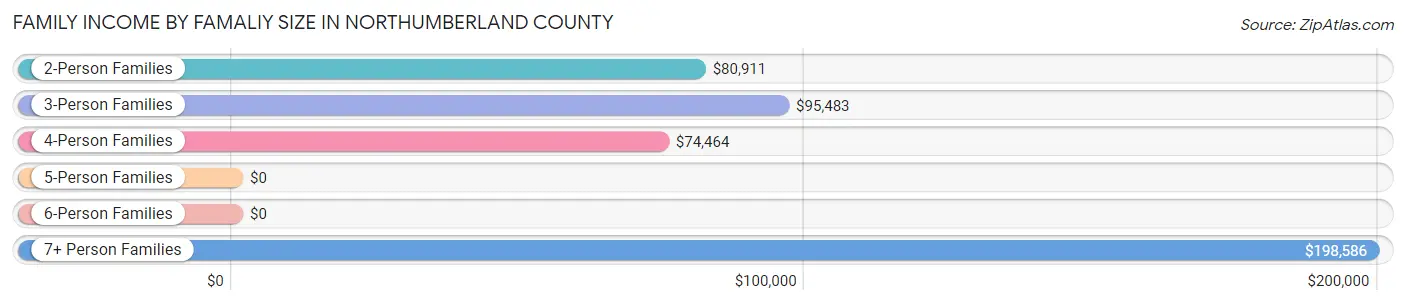
| Income Bracket | # Families | Median Income |
| 2-Person Families | 2,345 (73.8%) | $80,911 |
| 3-Person Families | 447 (14.1%) | $95,483 |
| 4-Person Families | 201 (6.3%) | $74,464 |
| 5-Person Families | 57 (1.8%) | $0 |
| 6-Person Families | 42 (1.3%) | $0 |
| 7+ Person Families | 85 (2.7%) | $198,586 |
| Total | 3,177 (100.0%) | $83,470 |
Family Income by Number of Earners in Northumberland County
The median family income in Northumberland County is $83,470, with families comprising 3+ earners (190) having the highest median family income of $164,286, while families with 1 earner (1,189) have the lowest median family income of $64,102, accounting for 6.0% and 37.4% of families, respectively.
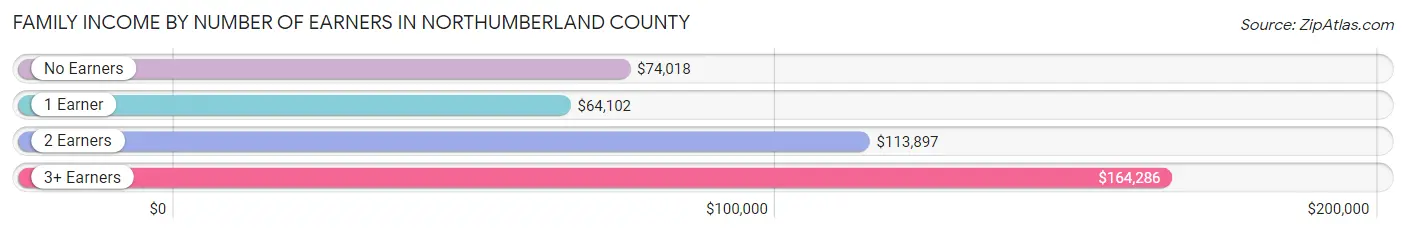
| Number of Earners | # Families | Median Income |
| No Earners | 1,104 (34.7%) | $74,018 |
| 1 Earner | 1,189 (37.4%) | $64,102 |
| 2 Earners | 694 (21.8%) | $113,897 |
| 3+ Earners | 190 (6.0%) | $164,286 |
| Total | 3,177 (100.0%) | $83,470 |
Household Income in Northumberland County
Household Income Brackets in Northumberland County
With 890 households falling in the category, the $50,000 to $74,999 income range is the most frequent in Northumberland County, accounting for 17.2% of all households. In contrast, only 103 households (2.0%) fall into the $10,000 to $14,999 income bracket, making it the least populous group.
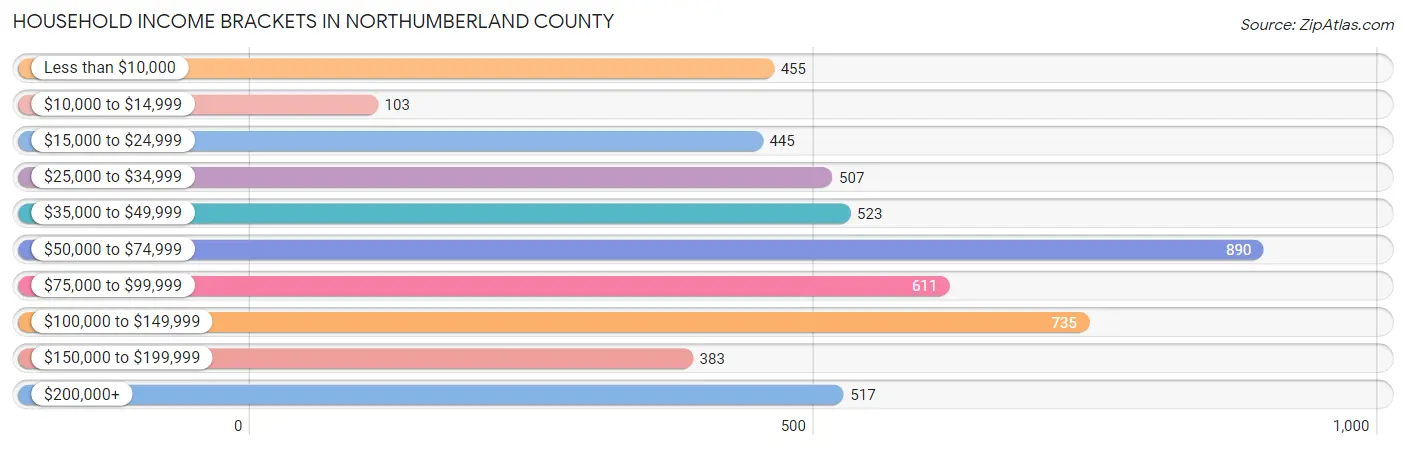
| Income Bracket | # Households | % Households |
| Less than $10,000 | 455 | 8.8% |
| $10,000 to $14,999 | 103 | 2.0% |
| $15,000 to $24,999 | 445 | 8.6% |
| $25,000 to $34,999 | 507 | 9.8% |
| $35,000 to $49,999 | 523 | 10.1% |
| $50,000 to $74,999 | 890 | 17.2% |
| $75,000 to $99,999 | 611 | 11.8% |
| $100,000 to $149,999 | 735 | 14.2% |
| $150,000 to $199,999 | 383 | 7.4% |
| $200,000+ | 517 | 10.0% |
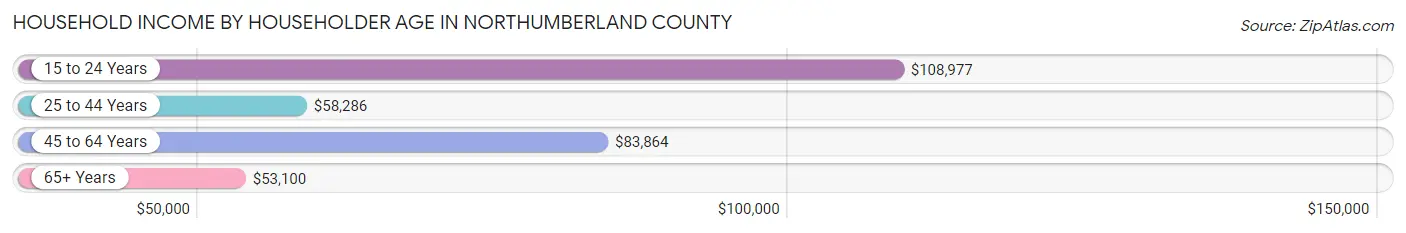
Household Income by Householder Age in Northumberland County
The median household income in Northumberland County is $64,655, with the highest median household income of $108,977 found in the 15 to 24 years age bracket for the primary householder. A total of 23 households (0.4%) fall into this category. Meanwhile, the 65+ years age bracket for the primary householder has the lowest median household income of $53,100, with 2,598 households (50.2%) in this group.
| Income Bracket | # Households | Median Income |
| 15 to 24 Years | 23 (0.4%) | $108,977 |
| 25 to 44 Years | 653 (12.6%) | $58,286 |
| 45 to 64 Years | 1,900 (36.7%) | $83,864 |
| 65+ Years | 2,598 (50.2%) | $53,100 |
| Total | 5,174 (100.0%) | $64,655 |
Poverty in Northumberland County
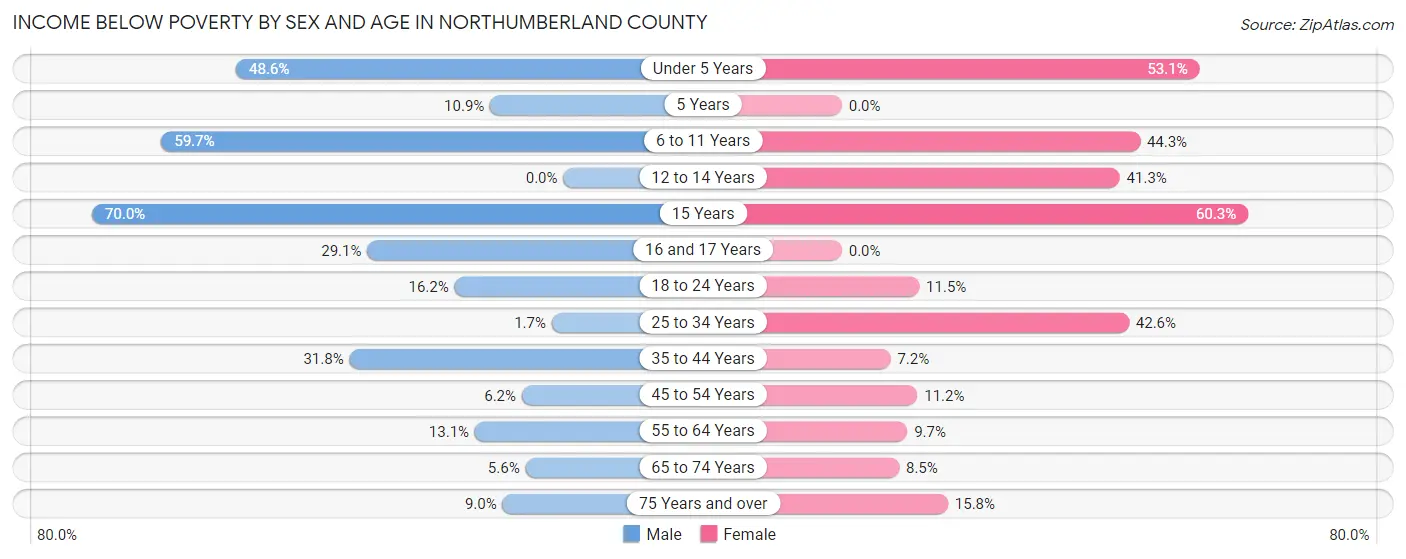
Income Below Poverty by Sex and Age in Northumberland County
With 12.7% poverty level for males and 16.7% for females among the residents of Northumberland County, 15 year old males and 15 year old females are the most vulnerable to poverty, with 14 males (70.0%) and 38 females (60.3%) in their respective age groups living below the poverty level.
| Age Bracket | Male | Female |
| Under 5 Years | 69 (48.6%) | 94 (53.1%) |
| 5 Years | 5 (10.9%) | 0 (0.0%) |
| 6 to 11 Years | 40 (59.7%) | 139 (44.3%) |
| 12 to 14 Years | 0 (0.0%) | 85 (41.3%) |
| 15 Years | 14 (70.0%) | 38 (60.3%) |
| 16 and 17 Years | 23 (29.1%) | 0 (0.0%) |
| 18 to 24 Years | 74 (16.2%) | 54 (11.5%) |
| 25 to 34 Years | 6 (1.7%) | 185 (42.6%) |
| 35 to 44 Years | 148 (31.8%) | 36 (7.2%) |
| 45 to 54 Years | 29 (6.2%) | 53 (11.2%) |
| 55 to 64 Years | 135 (13.1%) | 113 (9.7%) |
| 65 to 74 Years | 57 (5.6%) | 105 (8.5%) |
| 75 Years and over | 104 (9.0%) | 161 (15.8%) |
| Total | 704 (12.7%) | 1,063 (16.7%) |
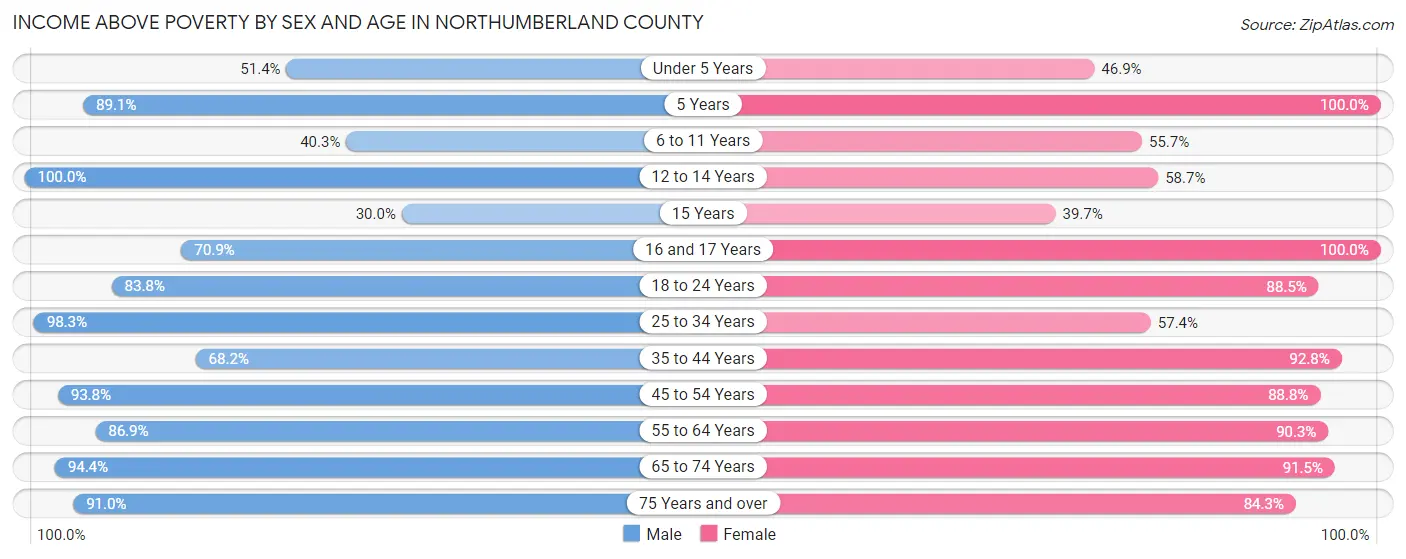
Income Above Poverty by Sex and Age in Northumberland County
According to the poverty statistics in Northumberland County, males aged 12 to 14 years and females aged 5 years are the age groups that are most secure financially, with 100.0% of males and 100.0% of females in these age groups living above the poverty line.
| Age Bracket | Male | Female |
| Under 5 Years | 73 (51.4%) | 83 (46.9%) |
| 5 Years | 41 (89.1%) | 31 (100.0%) |
| 6 to 11 Years | 27 (40.3%) | 175 (55.7%) |
| 12 to 14 Years | 262 (100.0%) | 121 (58.7%) |
| 15 Years | 6 (30.0%) | 25 (39.7%) |
| 16 and 17 Years | 56 (70.9%) | 287 (100.0%) |
| 18 to 24 Years | 384 (83.8%) | 416 (88.5%) |
| 25 to 34 Years | 344 (98.3%) | 249 (57.4%) |
| 35 to 44 Years | 318 (68.2%) | 462 (92.8%) |
| 45 to 54 Years | 442 (93.8%) | 420 (88.8%) |
| 55 to 64 Years | 893 (86.9%) | 1,049 (90.3%) |
| 65 to 74 Years | 957 (94.4%) | 1,130 (91.5%) |
| 75 Years and over | 1,048 (91.0%) | 861 (84.3%) |
| Total | 4,851 (87.3%) | 5,309 (83.3%) |
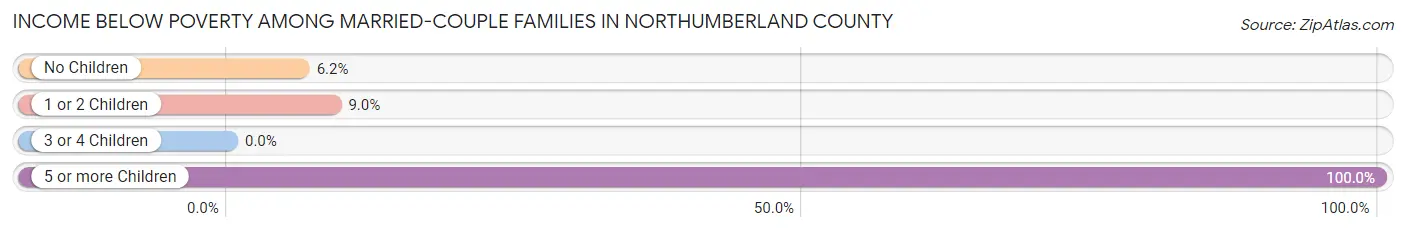
Income Below Poverty Among Married-Couple Families in Northumberland County
The poverty statistics for married-couple families in Northumberland County show that 7.4% or 190 of the total 2,577 families live below the poverty line. Families with 5 or more children have the highest poverty rate of 100.0%, comprising of 26 families. On the other hand, families with 3 or 4 children have the lowest poverty rate of 0.0%, which includes 0 families.
| Children | Above Poverty | Below Poverty |
| No Children | 2,058 (93.8%) | 137 (6.2%) |
| 1 or 2 Children | 273 (91.0%) | 27 (9.0%) |
| 3 or 4 Children | 56 (100.0%) | 0 (0.0%) |
| 5 or more Children | 0 (0.0%) | 26 (100.0%) |
| Total | 2,387 (92.6%) | 190 (7.4%) |
Income Below Poverty Among Single-Parent Households in Northumberland County
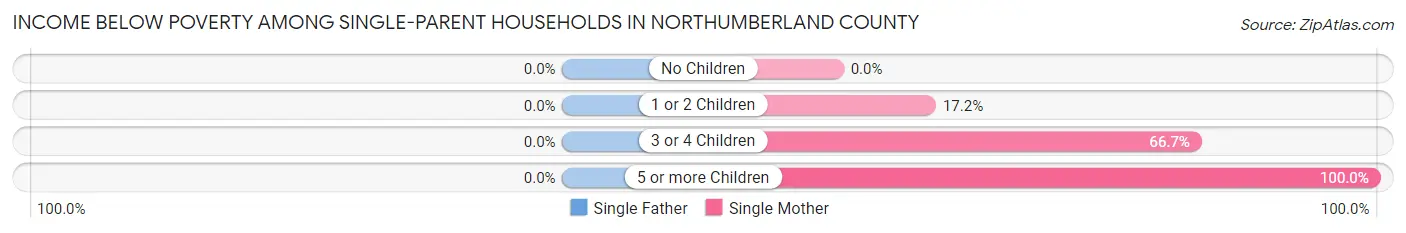
| Children | Single Father | Single Mother |
| No Children | 0 (0.0%) | 0 (0.0%) |
| 1 or 2 Children | 0 (0.0%) | 43 (17.2%) |
| 3 or 4 Children | 0 (0.0%) | 34 (66.7%) |
| 5 or more Children | 0 (0.0%) | 5 (100.0%) |
| Total | 0 (0.0%) | 82 (16.7%) |
Income Below Poverty Among Married-Couple vs Single-Parent Households in Northumberland County
The poverty data for Northumberland County shows that 190 of the married-couple family households (7.4%) and 82 of the single-parent households (13.7%) are living below the poverty level. Within the married-couple family households, those with 5 or more children have the highest poverty rate, with 26 households (100.0%) falling below the poverty line. Among the single-parent households, those with 5 or more children have the highest poverty rate, with 5 household (100.0%) living below poverty.
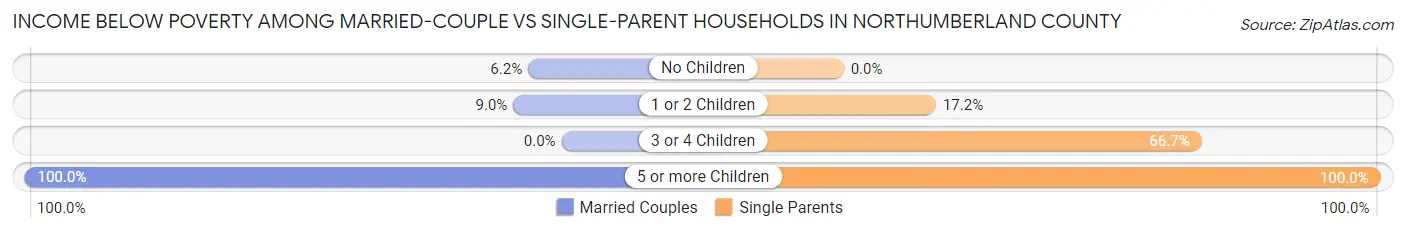
| Children | Married-Couple Families | Single-Parent Households |
| No Children | 137 (6.2%) | 0 (0.0%) |
| 1 or 2 Children | 27 (9.0%) | 43 (17.2%) |
| 3 or 4 Children | 0 (0.0%) | 34 (66.7%) |
| 5 or more Children | 26 (100.0%) | 5 (100.0%) |
| Total | 190 (7.4%) | 82 (13.7%) |
Race in Northumberland County
The most populous races in Northumberland County are White / Caucasian (8,452 | 70.4%), Black / African American (2,510 | 20.9%), and Two or more Races (908 | 7.6%).
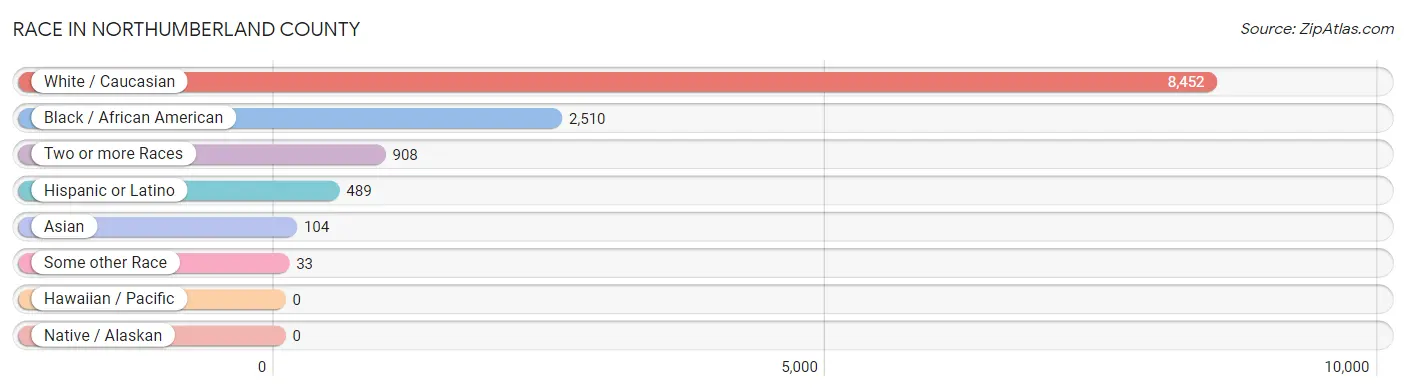
| Race | # Population | % Population |
| Asian | 104 | 0.9% |
| Black / African American | 2,510 | 20.9% |
| Hawaiian / Pacific | 0 | 0.0% |
| Hispanic or Latino | 489 | 4.1% |
| Native / Alaskan | 0 | 0.0% |
| White / Caucasian | 8,452 | 70.4% |
| Two or more Races | 908 | 7.6% |
| Some other Race | 33 | 0.3% |
| Total | 12,007 | 100.0% |
Ancestry in Northumberland County
The most populous ancestries reported in Northumberland County are English (2,029 | 16.9%), American (1,676 | 14.0%), Irish (1,418 | 11.8%), German (1,207 | 10.1%), and European (457 | 3.8%), together accounting for 56.5% of all Northumberland County residents.
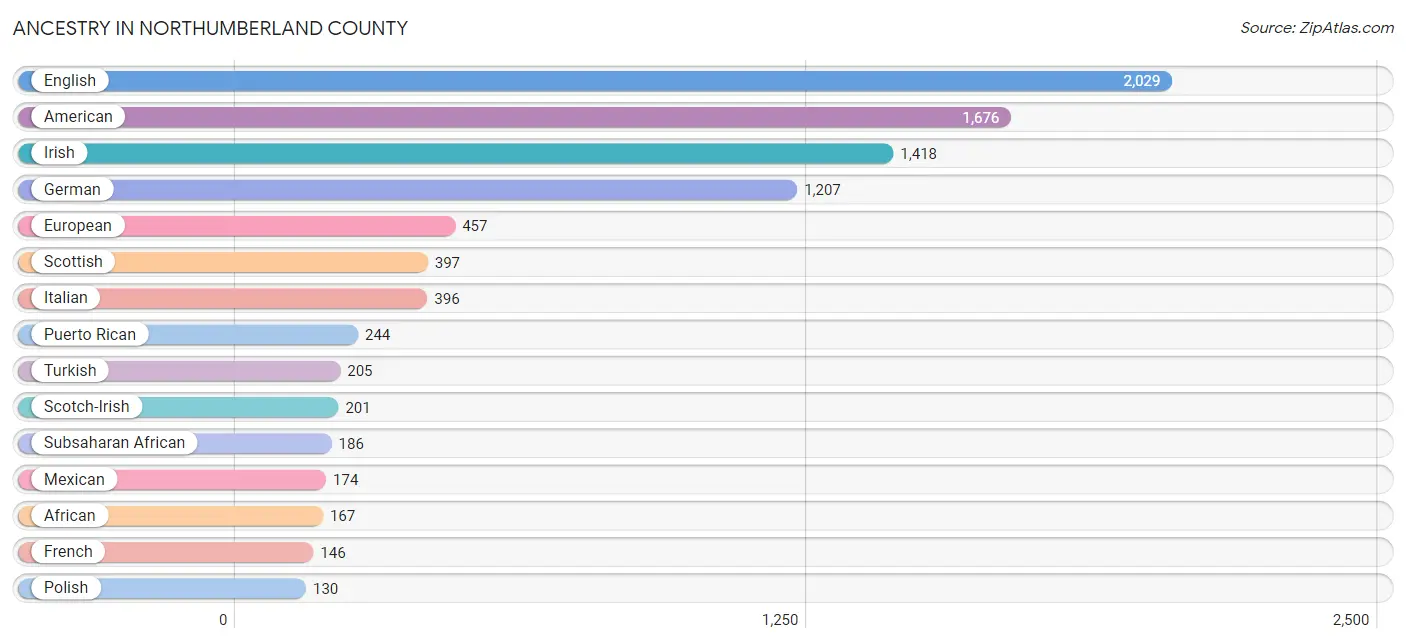
| Ancestry | # Population | % Population |
| African | 167 | 1.4% |
| American | 1,676 | 14.0% |
| Arab | 10 | 0.1% |
| Armenian | 28 | 0.2% |
| Bhutanese | 56 | 0.5% |
| British | 15 | 0.1% |
| Cherokee | 121 | 1.0% |
| Colombian | 44 | 0.4% |
| Croatian | 15 | 0.1% |
| Czech | 26 | 0.2% |
| Danish | 30 | 0.3% |
| Dutch | 35 | 0.3% |
| Eastern European | 38 | 0.3% |
| English | 2,029 | 16.9% |
| European | 457 | 3.8% |
| French | 146 | 1.2% |
| French Canadian | 83 | 0.7% |
| German | 1,207 | 10.1% |
| Irish | 1,418 | 11.8% |
| Italian | 396 | 3.3% |
| Lebanese | 10 | 0.1% |
| Lithuanian | 17 | 0.1% |
| Mexican | 174 | 1.5% |
| Northern European | 28 | 0.2% |
| Norwegian | 70 | 0.6% |
| Polish | 130 | 1.1% |
| Puerto Rican | 244 | 2.0% |
| Romanian | 8 | 0.1% |
| Russian | 6 | 0.1% |
| Scandinavian | 35 | 0.3% |
| Scotch-Irish | 201 | 1.7% |
| Scottish | 397 | 3.3% |
| Slovak | 9 | 0.1% |
| South African | 19 | 0.2% |
| South American | 44 | 0.4% |
| Spanish American | 27 | 0.2% |
| Subsaharan African | 186 | 1.5% |
| Swedish | 24 | 0.2% |
| Swiss | 79 | 0.7% |
| Thai | 79 | 0.7% |
| Turkish | 205 | 1.7% |
| Ukrainian | 10 | 0.1% |
| Welsh | 78 | 0.6% | View All 43 Rows |
Immigrants in Northumberland County
The most numerous immigrant groups reported in Northumberland County came from Latin America (116 | 1.0%), Asia (80 | 0.7%), Central America (72 | 0.6%), Mexico (72 | 0.6%), and India (55 | 0.5%), together accounting for 3.3% of all Northumberland County residents.
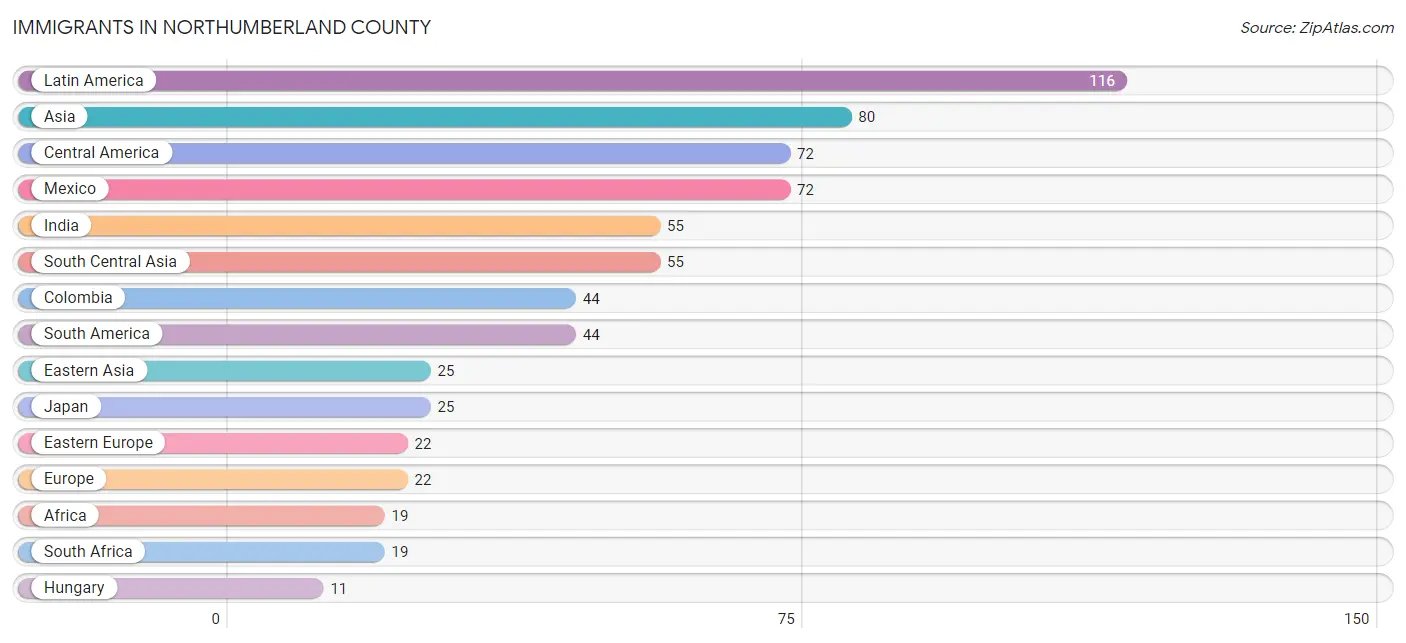
| Immigration Origin | # Population | % Population |
| Africa | 19 | 0.2% |
| Asia | 80 | 0.7% |
| Central America | 72 | 0.6% |
| Colombia | 44 | 0.4% |
| Eastern Asia | 25 | 0.2% |
| Eastern Europe | 22 | 0.2% |
| Europe | 22 | 0.2% |
| Hungary | 11 | 0.1% |
| India | 55 | 0.5% |
| Japan | 25 | 0.2% |
| Latin America | 116 | 1.0% |
| Mexico | 72 | 0.6% |
| South Africa | 19 | 0.2% |
| South America | 44 | 0.4% |
| South Central Asia | 55 | 0.5% | View All 15 Rows |
Sex and Age in Northumberland County
Sex and Age in Northumberland County
The most populous age groups in Northumberland County are 60 to 64 Years (609 | 11.0%) for men and 60 to 64 Years (761 | 11.8%) for women.
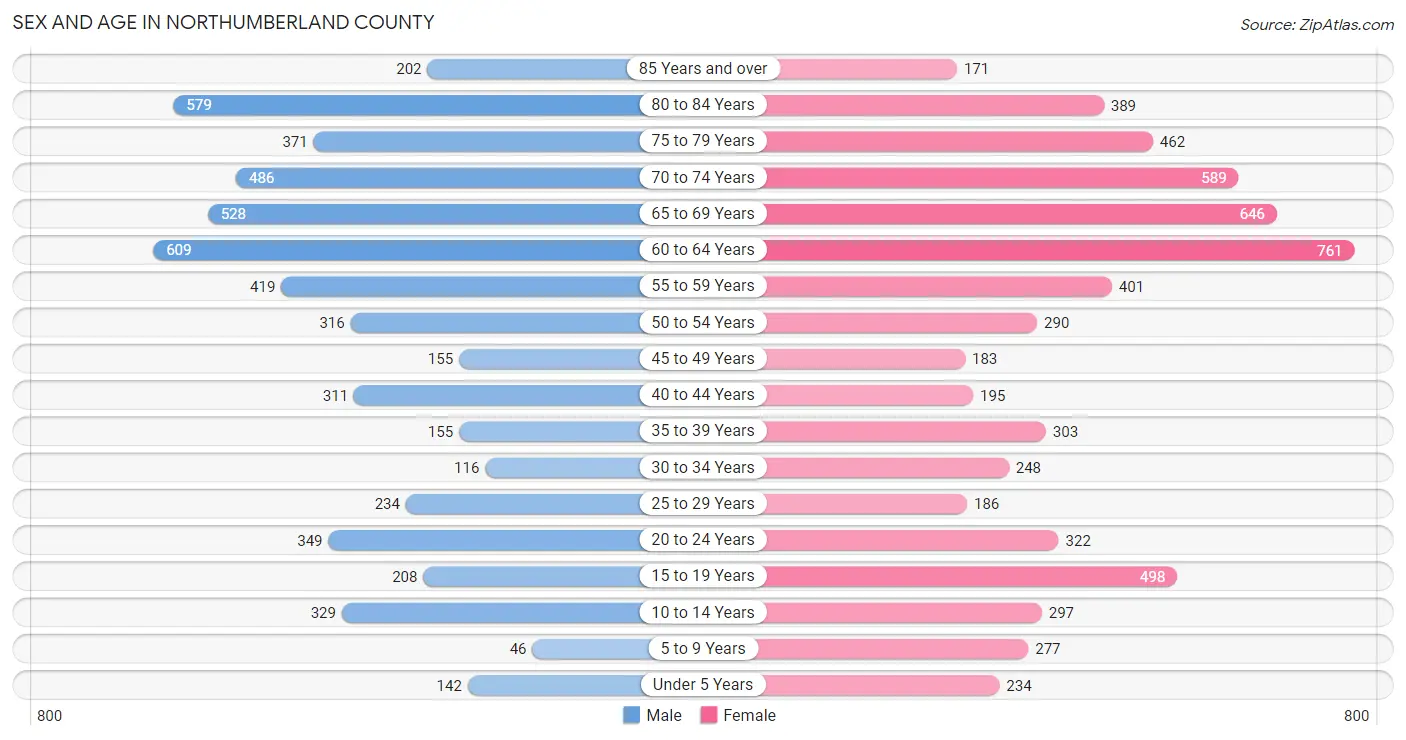
| Age Bracket | Male | Female |
| Under 5 Years | 142 (2.6%) | 234 (3.6%) |
| 5 to 9 Years | 46 (0.8%) | 277 (4.3%) |
| 10 to 14 Years | 329 (5.9%) | 297 (4.6%) |
| 15 to 19 Years | 208 (3.7%) | 498 (7.7%) |
| 20 to 24 Years | 349 (6.3%) | 322 (5.0%) |
| 25 to 29 Years | 234 (4.2%) | 186 (2.9%) |
| 30 to 34 Years | 116 (2.1%) | 248 (3.8%) |
| 35 to 39 Years | 155 (2.8%) | 303 (4.7%) |
| 40 to 44 Years | 311 (5.6%) | 195 (3.0%) |
| 45 to 49 Years | 155 (2.8%) | 183 (2.8%) |
| 50 to 54 Years | 316 (5.7%) | 290 (4.5%) |
| 55 to 59 Years | 419 (7.5%) | 401 (6.2%) |
| 60 to 64 Years | 609 (11.0%) | 761 (11.8%) |
| 65 to 69 Years | 528 (9.5%) | 646 (10.0%) |
| 70 to 74 Years | 486 (8.7%) | 589 (9.1%) |
| 75 to 79 Years | 371 (6.7%) | 462 (7.2%) |
| 80 to 84 Years | 579 (10.4%) | 389 (6.0%) |
| 85 Years and over | 202 (3.6%) | 171 (2.6%) |
| Total | 5,555 (100.0%) | 6,452 (100.0%) |
Families and Households in Northumberland County
Median Family Size in Northumberland County
The median family size in Northumberland County is 2.93 persons per family, with single female/mother families (492 | 15.5%) accounting for the largest median family size of 4.13 persons per family. On the other hand, single male/father families (108 | 3.4%) represent the smallest median family size with 2.56 persons per family.
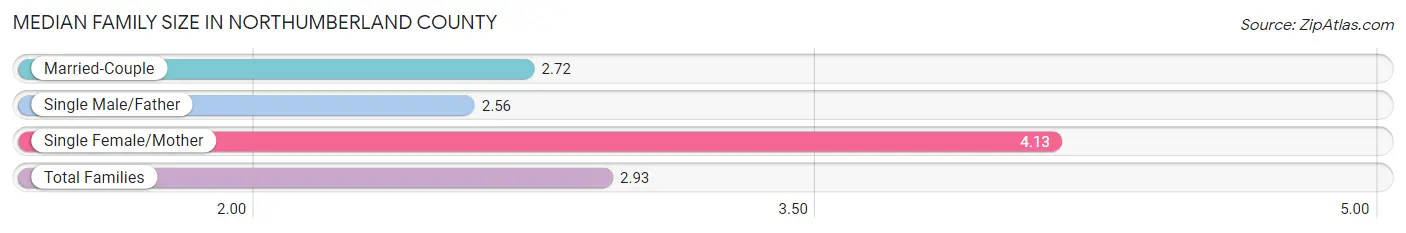
| Family Type | # Families | Family Size |
| Married-Couple | 2,577 (81.1%) | 2.72 |
| Single Male/Father | 108 (3.4%) | 2.56 |
| Single Female/Mother | 492 (15.5%) | 4.13 |
| Total Families | 3,177 (100.0%) | 2.93 |
Median Household Size in Northumberland County
The median household size in Northumberland County is 2.32 persons per household, with single female/mother households (492 | 9.5%) accounting for the largest median household size of 4.35 persons per household. non-family households (1,997 | 38.6%) represent the smallest median household size with 1.19 persons per household.
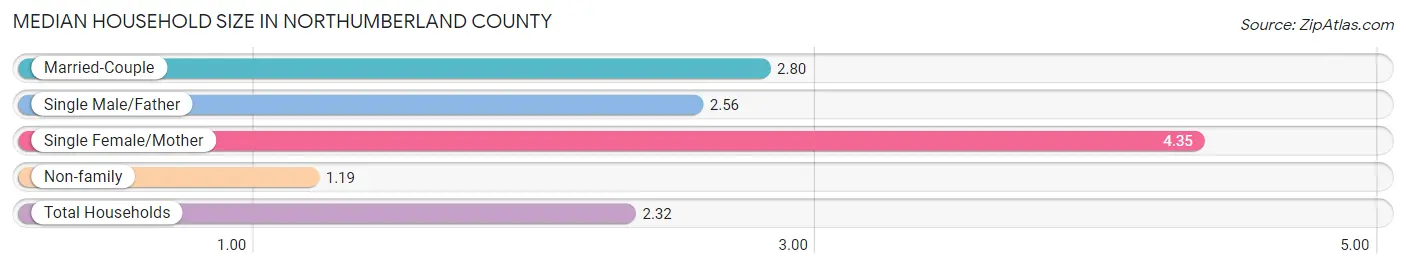
| Household Type | # Households | Household Size |
| Married-Couple | 2,577 (49.8%) | 2.80 |
| Single Male/Father | 108 (2.1%) | 2.56 |
| Single Female/Mother | 492 (9.5%) | 4.35 |
| Non-family | 1,997 (38.6%) | 1.19 |
| Total Households | 5,174 (100.0%) | 2.32 |
Household Size by Marriage Status in Northumberland County
Out of a total of 5,174 households in Northumberland County, 3,177 (61.4%) are family households, while 1,997 (38.6%) are nonfamily households. The most numerous type of family households are 2-person households, comprising 2,291, and the most common type of nonfamily households are 1-person households, comprising 1,774.
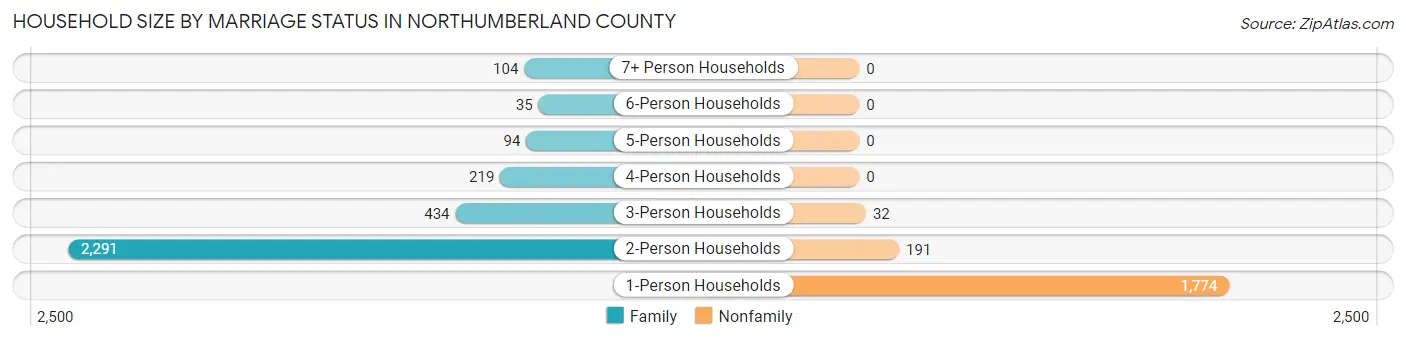
| Household Size | Family Households | Nonfamily Households |
| 1-Person Households | - | 1,774 (34.3%) |
| 2-Person Households | 2,291 (44.3%) | 191 (3.7%) |
| 3-Person Households | 434 (8.4%) | 32 (0.6%) |
| 4-Person Households | 219 (4.2%) | 0 (0.0%) |
| 5-Person Households | 94 (1.8%) | 0 (0.0%) |
| 6-Person Households | 35 (0.7%) | 0 (0.0%) |
| 7+ Person Households | 104 (2.0%) | 0 (0.0%) |
| Total | 3,177 (61.4%) | 1,997 (38.6%) |
Female Fertility in Northumberland County
Fertility by Age in Northumberland County
Average fertility rate in Northumberland County is 8.0 births per 1,000 women. Women in the age bracket of 20 to 34 years have the highest fertility rate with 15.0 births per 1,000 women. Women in the age bracket of 20 to 34 years acount for 68.8% of all women with births.
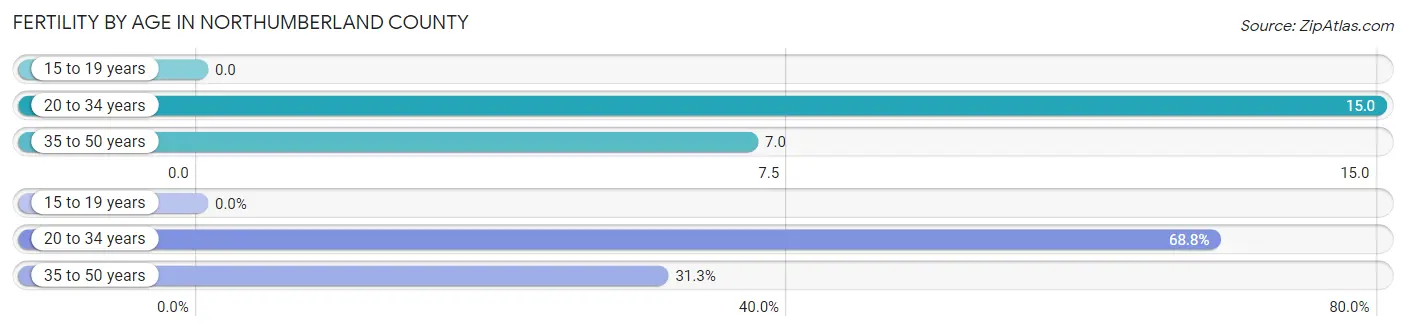
| Age Bracket | Women with Births | Births / 1,000 Women |
| 15 to 19 years | 0 (0.0%) | 0.0 |
| 20 to 34 years | 11 (68.8%) | 15.0 |
| 35 to 50 years | 5 (31.2%) | 7.0 |
| Total | 16 (100.0%) | 8.0 |
Fertility by Age by Marriage Status in Northumberland County
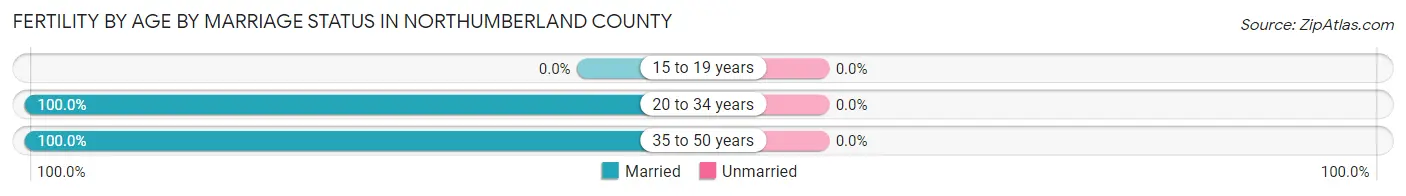
| Age Bracket | Married | Unmarried |
| 15 to 19 years | 0 (0.0%) | 0 (0.0%) |
| 20 to 34 years | 11 (100.0%) | 0 (0.0%) |
| 35 to 50 years | 5 (100.0%) | 0 (0.0%) |
| Total | 16 (100.0%) | 0 (0.0%) |
Fertility by Education in Northumberland County
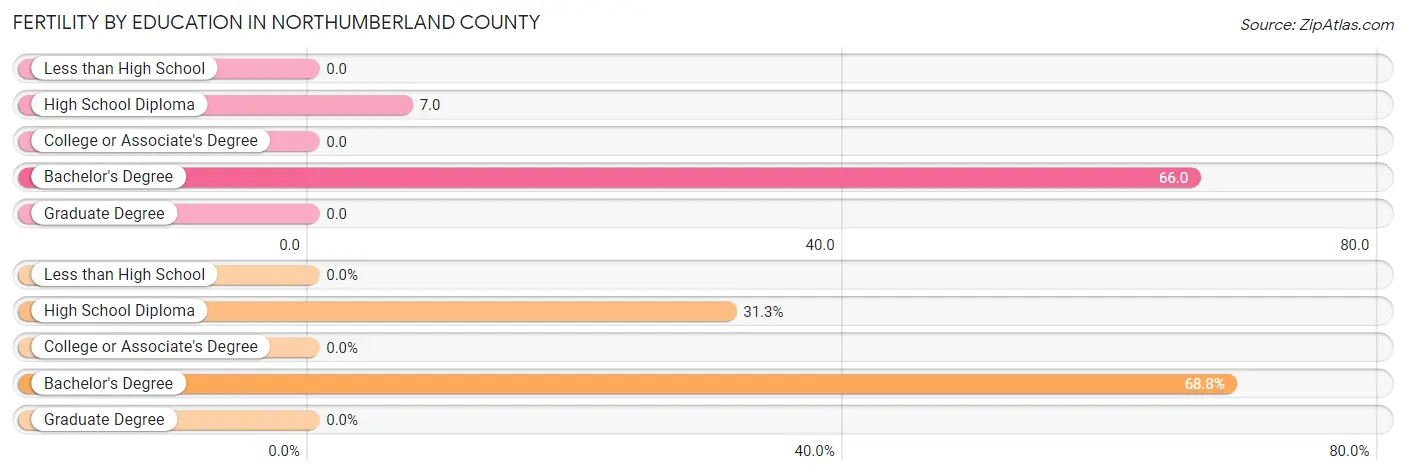
| Educational Attainment | Women with Births | Births / 1,000 Women |
| Less than High School | 0 (0.0%) | 0.0 |
| High School Diploma | 5 (31.2%) | 7.0 |
| College or Associate's Degree | 0 (0.0%) | 0.0 |
| Bachelor's Degree | 11 (68.8%) | 66.0 |
| Graduate Degree | 0 (0.0%) | 0.0 |
| Total | 16 (100.0%) | 8.0 |
Fertility by Education by Marriage Status in Northumberland County
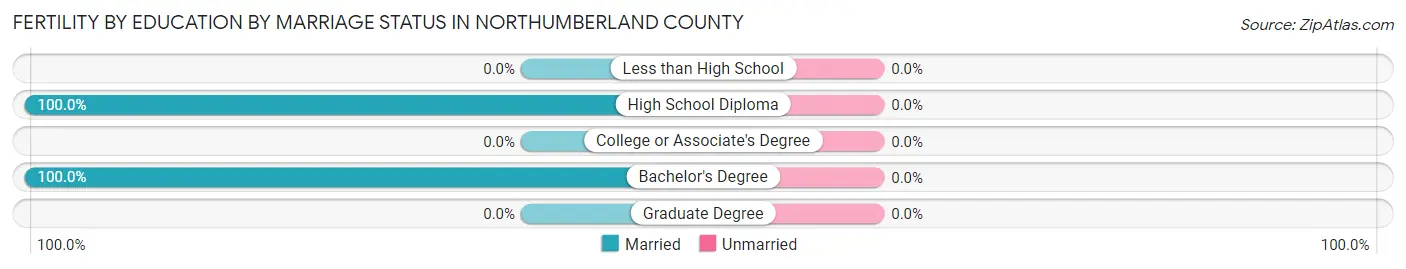
| Educational Attainment | Married | Unmarried |
| Less than High School | 0 (0.0%) | 0 (0.0%) |
| High School Diploma | 5 (100.0%) | 0 (0.0%) |
| College or Associate's Degree | 0 (0.0%) | 0 (0.0%) |
| Bachelor's Degree | 11 (100.0%) | 0 (0.0%) |
| Graduate Degree | 0 (0.0%) | 0 (0.0%) |
| Total | 16 (100.0%) | 0 (0.0%) |
Employment Characteristics in Northumberland County
Employment by Class of Employer in Northumberland County
Among the 4,336 employed individuals in Northumberland County, private company employees (2,540 | 58.6%), local government employees (491 | 11.3%), and self-employed (not incorporated) (309 | 7.1%) make up the most common classes of employment.
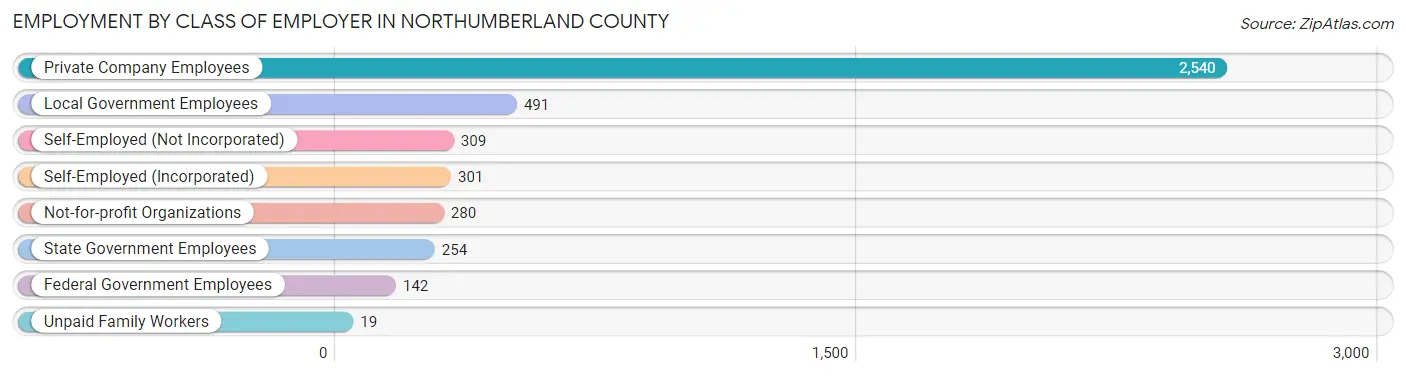
| Employer Class | # Employees | % Employees |
| Private Company Employees | 2,540 | 58.6% |
| Self-Employed (Incorporated) | 301 | 6.9% |
| Self-Employed (Not Incorporated) | 309 | 7.1% |
| Not-for-profit Organizations | 280 | 6.5% |
| Local Government Employees | 491 | 11.3% |
| State Government Employees | 254 | 5.9% |
| Federal Government Employees | 142 | 3.3% |
| Unpaid Family Workers | 19 | 0.4% |
| Total | 4,336 | 100.0% |
Employment Status by Age in Northumberland County
According to the labor force statistics for Northumberland County, out of the total population over 16 years of age (10,599), 43.2% or 4,579 individuals are in the labor force, with 4.9% or 224 of them unemployed. The age group with the highest labor force participation rate is 45 to 54 years, with 77.8% or 734 individuals in the labor force. Within the labor force, the 16 to 19 years age range has the highest percentage of unemployed individuals, with 58.2% or 135 of them being unemployed.
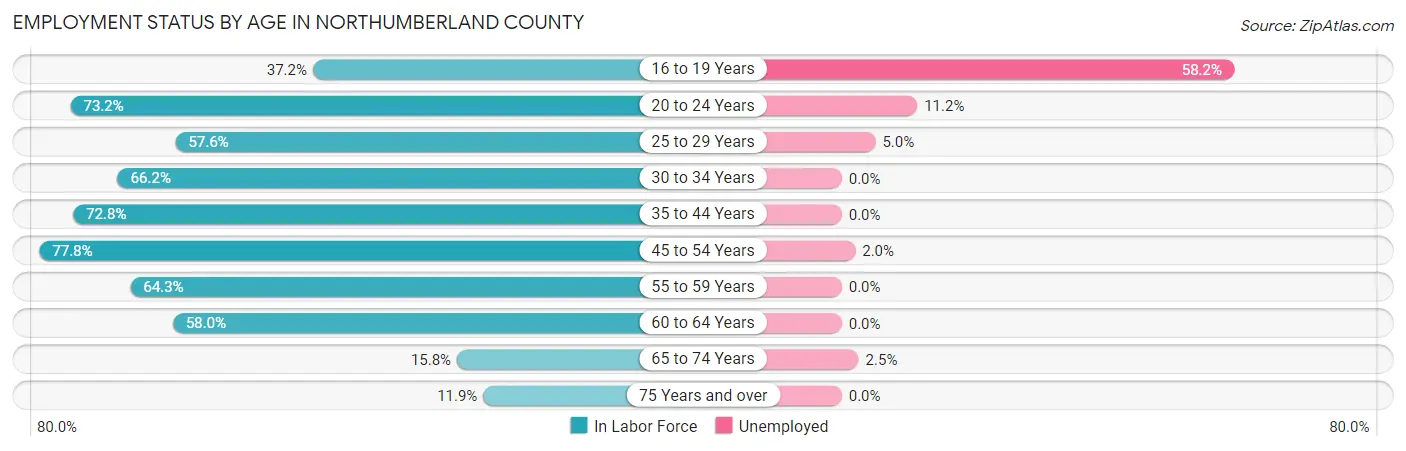
| Age Bracket | In Labor Force | Unemployed |
| 16 to 19 Years | 232 (37.2%) | 135 (58.2%) |
| 20 to 24 Years | 491 (73.2%) | 55 (11.2%) |
| 25 to 29 Years | 242 (57.6%) | 12 (5.0%) |
| 30 to 34 Years | 241 (66.2%) | 0 (0.0%) |
| 35 to 44 Years | 702 (72.8%) | 0 (0.0%) |
| 45 to 54 Years | 734 (77.8%) | 15 (2.0%) |
| 55 to 59 Years | 527 (64.3%) | 0 (0.0%) |
| 60 to 64 Years | 795 (58.0%) | 0 (0.0%) |
| 65 to 74 Years | 355 (15.8%) | 9 (2.5%) |
| 75 Years and over | 259 (11.9%) | 0 (0.0%) |
| Total | 4,579 (43.2%) | 224 (4.9%) |
Employment Status by Educational Attainment in Northumberland County
According to labor force statistics for Northumberland County, 66.4% of individuals (3,242) out of the total population between 25 and 64 years of age (4,882) are in the labor force, with 0.8% or 26 of them being unemployed. The group with the highest labor force participation rate are those with the educational attainment of college / associate degree, with 70.9% or 1,075 individuals in the labor force. Within the labor force, individuals with high school diploma education have the highest percentage of unemployment, with 2.8% or 27 of them being unemployed.
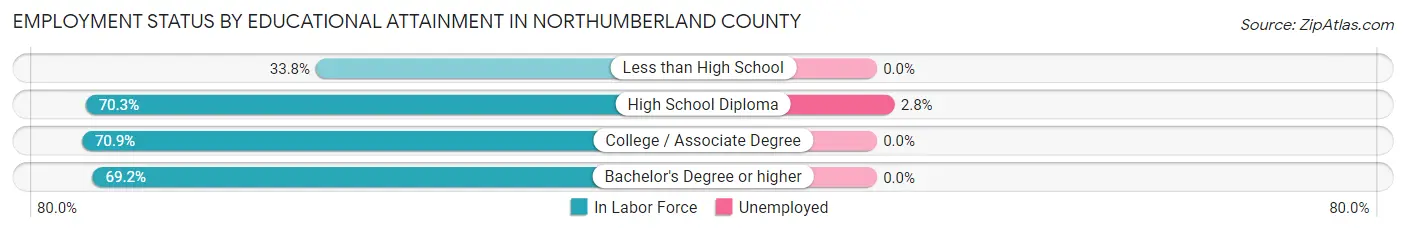
| Educational Attainment | In Labor Force | Unemployed |
| Less than High School | 171 (33.8%) | 0 (0.0%) |
| High School Diploma | 965 (70.3%) | 38 (2.8%) |
| College / Associate Degree | 1,075 (70.9%) | 0 (0.0%) |
| Bachelor's Degree or higher | 1,029 (69.2%) | 0 (0.0%) |
| Total | 3,242 (66.4%) | 39 (0.8%) |
Employment Occupations by Sex in Northumberland County
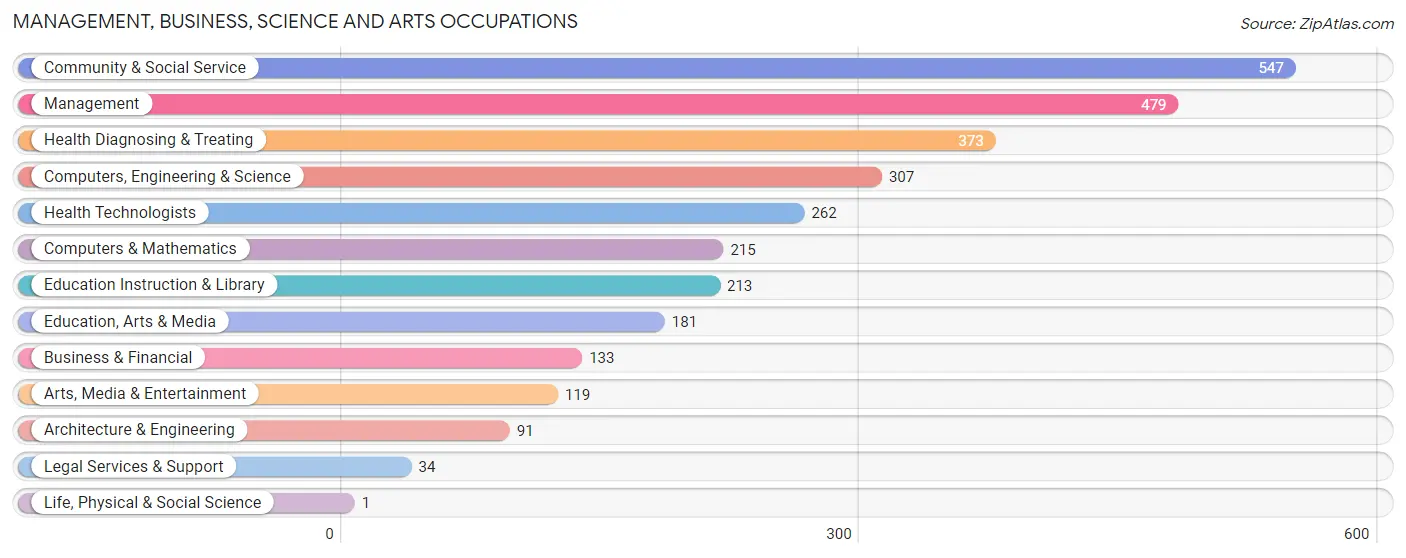
Management, Business, Science and Arts Occupations
The most common Management, Business, Science and Arts occupations in Northumberland County are Community & Social Service (547 | 12.6%), Management (479 | 11.0%), Health Diagnosing & Treating (373 | 8.6%), Computers, Engineering & Science (307 | 7.1%), and Health Technologists (262 | 6.0%).
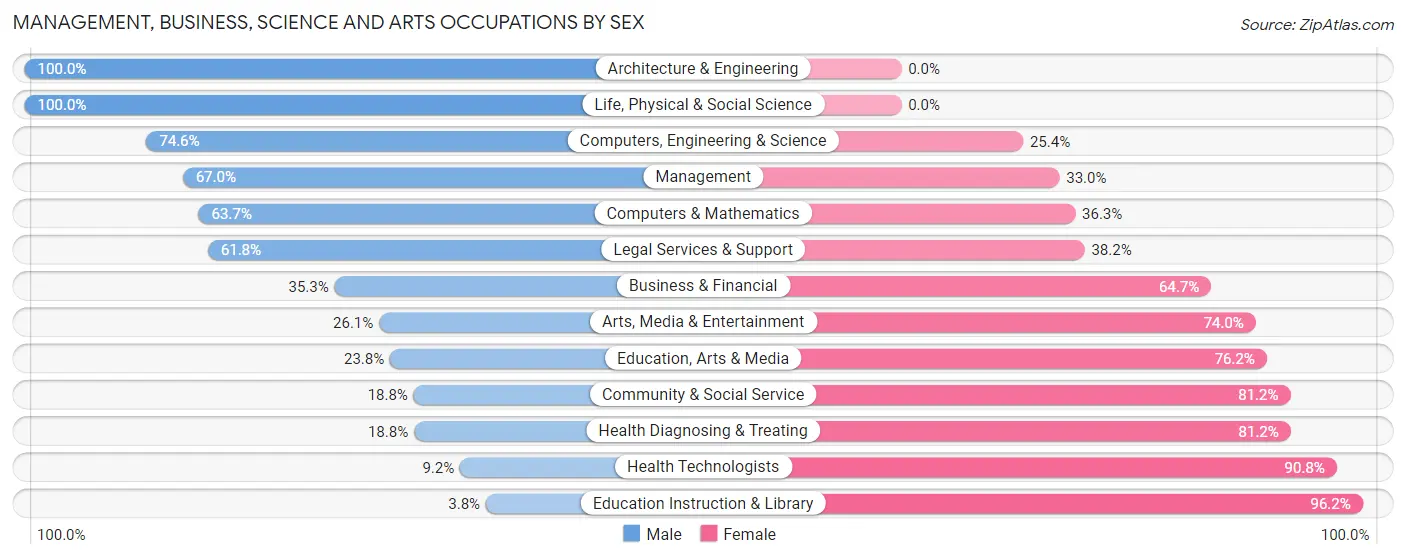
Management, Business, Science and Arts Occupations by Sex
Within the Management, Business, Science and Arts occupations in Northumberland County, the most male-oriented occupations are Architecture & Engineering (100.0%), Life, Physical & Social Science (100.0%), and Computers, Engineering & Science (74.6%), while the most female-oriented occupations are Education Instruction & Library (96.2%), Health Technologists (90.8%), and Health Diagnosing & Treating (81.2%).
| Occupation | Male | Female |
| Management | 321 (67.0%) | 158 (33.0%) |
| Business & Financial | 47 (35.3%) | 86 (64.7%) |
| Computers, Engineering & Science | 229 (74.6%) | 78 (25.4%) |
| Computers & Mathematics | 137 (63.7%) | 78 (36.3%) |
| Architecture & Engineering | 91 (100.0%) | 0 (0.0%) |
| Life, Physical & Social Science | 1 (100.0%) | 0 (0.0%) |
| Community & Social Service | 103 (18.8%) | 444 (81.2%) |
| Education, Arts & Media | 43 (23.8%) | 138 (76.2%) |
| Legal Services & Support | 21 (61.8%) | 13 (38.2%) |
| Education Instruction & Library | 8 (3.8%) | 205 (96.2%) |
| Arts, Media & Entertainment | 31 (26.1%) | 88 (74.0%) |
| Health Diagnosing & Treating | 70 (18.8%) | 303 (81.2%) |
| Health Technologists | 24 (9.2%) | 238 (90.8%) |
| Total (Category) | 770 (41.9%) | 1,069 (58.1%) |
| Total (Overall) | 2,115 (48.6%) | 2,236 (51.4%) |
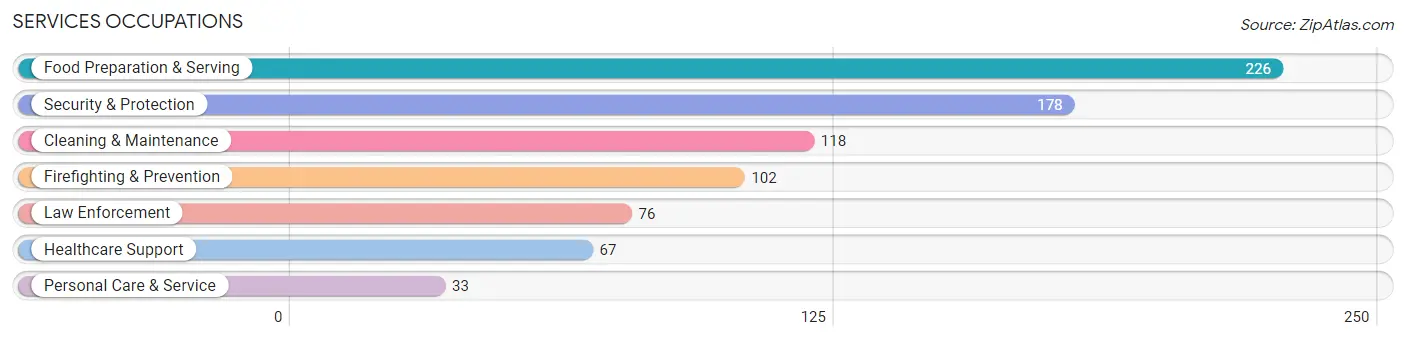
Services Occupations
The most common Services occupations in Northumberland County are Food Preparation & Serving (226 | 5.2%), Security & Protection (178 | 4.1%), Cleaning & Maintenance (118 | 2.7%), Firefighting & Prevention (102 | 2.3%), and Law Enforcement (76 | 1.8%).
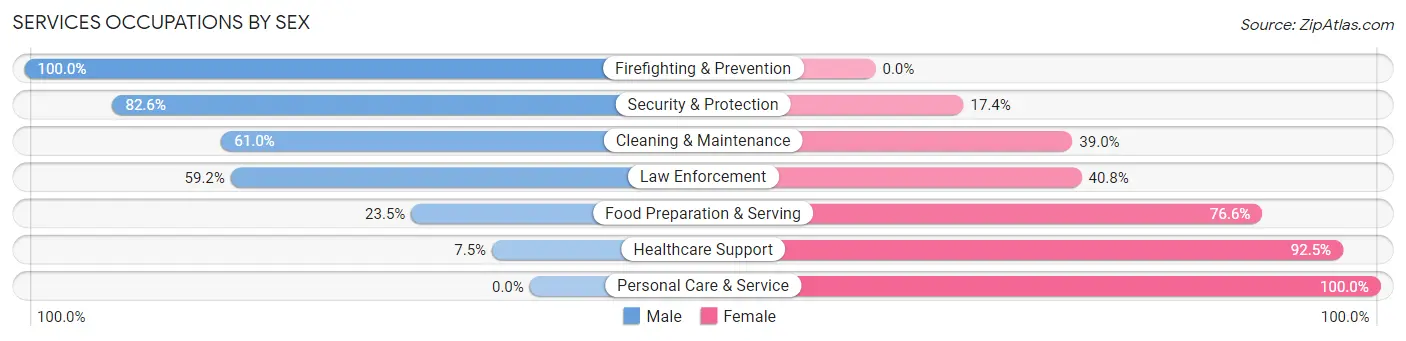
Services Occupations by Sex
Within the Services occupations in Northumberland County, the most male-oriented occupations are Firefighting & Prevention (100.0%), Security & Protection (82.6%), and Cleaning & Maintenance (61.0%), while the most female-oriented occupations are Personal Care & Service (100.0%), Healthcare Support (92.5%), and Food Preparation & Serving (76.5%).
| Occupation | Male | Female |
| Healthcare Support | 5 (7.5%) | 62 (92.5%) |
| Security & Protection | 147 (82.6%) | 31 (17.4%) |
| Firefighting & Prevention | 102 (100.0%) | 0 (0.0%) |
| Law Enforcement | 45 (59.2%) | 31 (40.8%) |
| Food Preparation & Serving | 53 (23.4%) | 173 (76.5%) |
| Cleaning & Maintenance | 72 (61.0%) | 46 (39.0%) |
| Personal Care & Service | 0 (0.0%) | 33 (100.0%) |
| Total (Category) | 277 (44.5%) | 345 (55.5%) |
| Total (Overall) | 2,115 (48.6%) | 2,236 (51.4%) |
Sales and Office Occupations
The most common Sales and Office occupations in Northumberland County are Office & Administration (526 | 12.1%), and Sales & Related (273 | 6.3%).
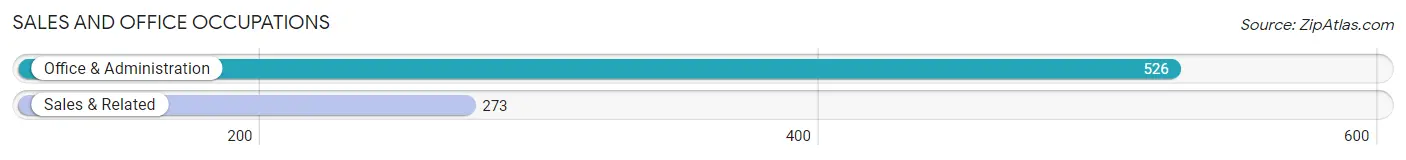
Sales and Office Occupations by Sex
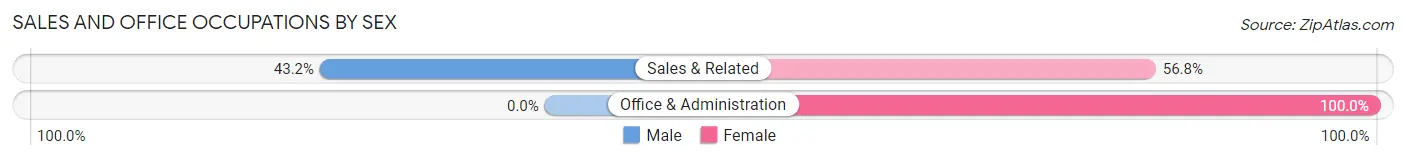
| Occupation | Male | Female |
| Sales & Related | 118 (43.2%) | 155 (56.8%) |
| Office & Administration | 0 (0.0%) | 526 (100.0%) |
| Total (Category) | 118 (14.8%) | 681 (85.2%) |
| Total (Overall) | 2,115 (48.6%) | 2,236 (51.4%) |
Natural Resources, Construction and Maintenance Occupations
The most common Natural Resources, Construction and Maintenance occupations in Northumberland County are Construction & Extraction (422 | 9.7%), Farming, Fishing & Forestry (107 | 2.5%), and Installation, Maintenance & Repair (45 | 1.0%).
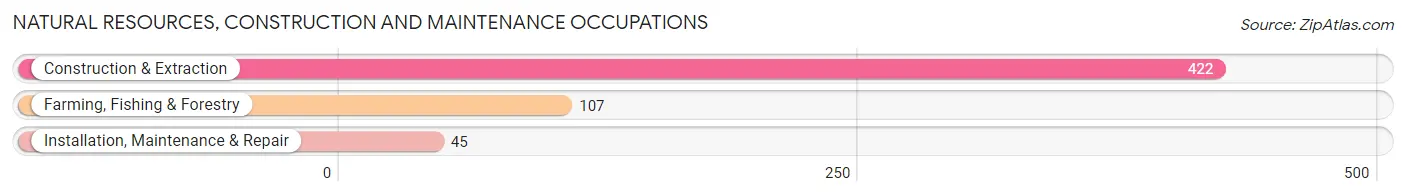
Natural Resources, Construction and Maintenance Occupations by Sex
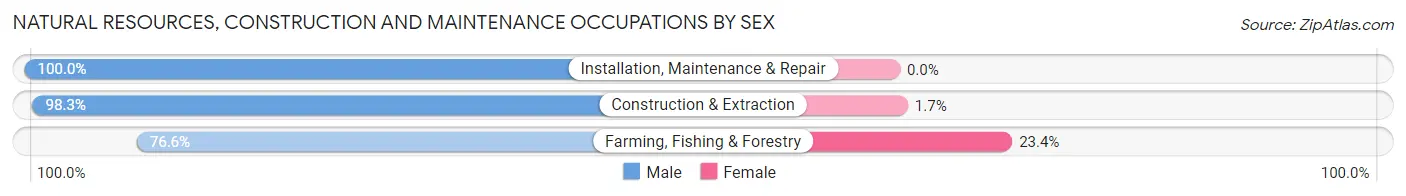
| Occupation | Male | Female |
| Farming, Fishing & Forestry | 82 (76.6%) | 25 (23.4%) |
| Construction & Extraction | 415 (98.3%) | 7 (1.7%) |
| Installation, Maintenance & Repair | 45 (100.0%) | 0 (0.0%) |
| Total (Category) | 542 (94.4%) | 32 (5.6%) |
| Total (Overall) | 2,115 (48.6%) | 2,236 (51.4%) |
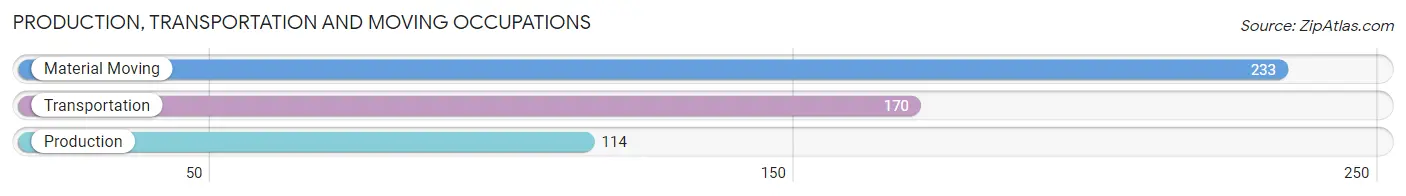
Production, Transportation and Moving Occupations
The most common Production, Transportation and Moving occupations in Northumberland County are Material Moving (233 | 5.4%), Transportation (170 | 3.9%), and Production (114 | 2.6%).
Production, Transportation and Moving Occupations by Sex
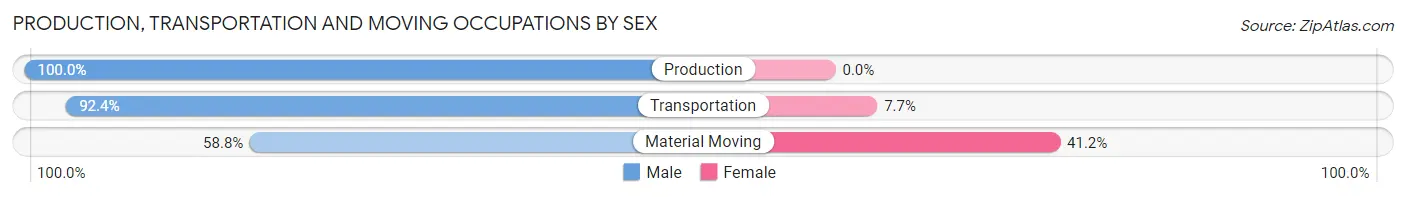
| Occupation | Male | Female |
| Production | 114 (100.0%) | 0 (0.0%) |
| Transportation | 157 (92.3%) | 13 (7.6%) |
| Material Moving | 137 (58.8%) | 96 (41.2%) |
| Total (Category) | 408 (78.9%) | 109 (21.1%) |
| Total (Overall) | 2,115 (48.6%) | 2,236 (51.4%) |
Employment Industries by Sex in Northumberland County
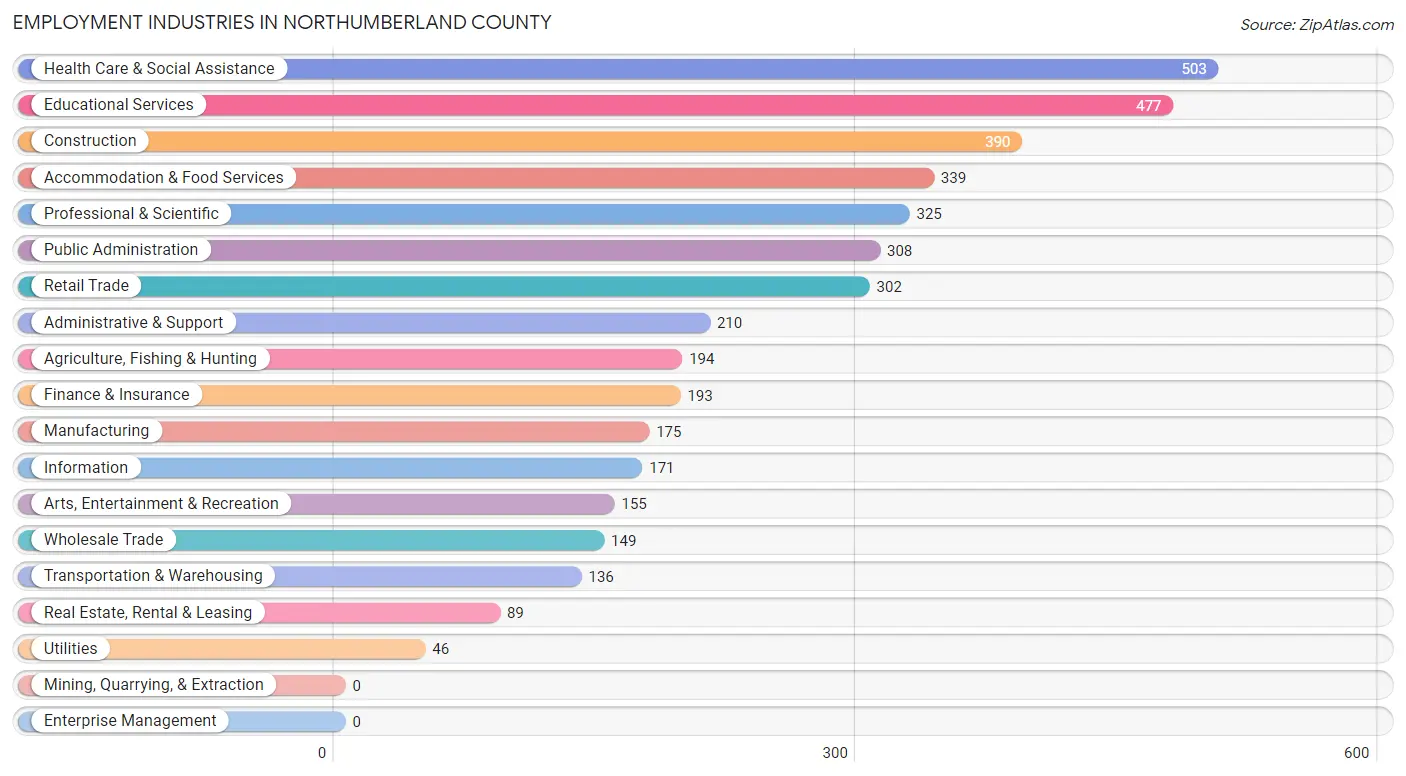
Employment Industries in Northumberland County
The major employment industries in Northumberland County include Health Care & Social Assistance (503 | 11.6%), Educational Services (477 | 11.0%), Construction (390 | 9.0%), Accommodation & Food Services (339 | 7.8%), and Professional & Scientific (325 | 7.5%).
Employment Industries by Sex in Northumberland County
The Northumberland County industries that see more men than women are Construction (95.4%), Manufacturing (80.6%), and Wholesale Trade (80.5%), whereas the industries that tend to have a higher number of women are Educational Services (100.0%), Accommodation & Food Services (92.3%), and Finance & Insurance (85.5%).
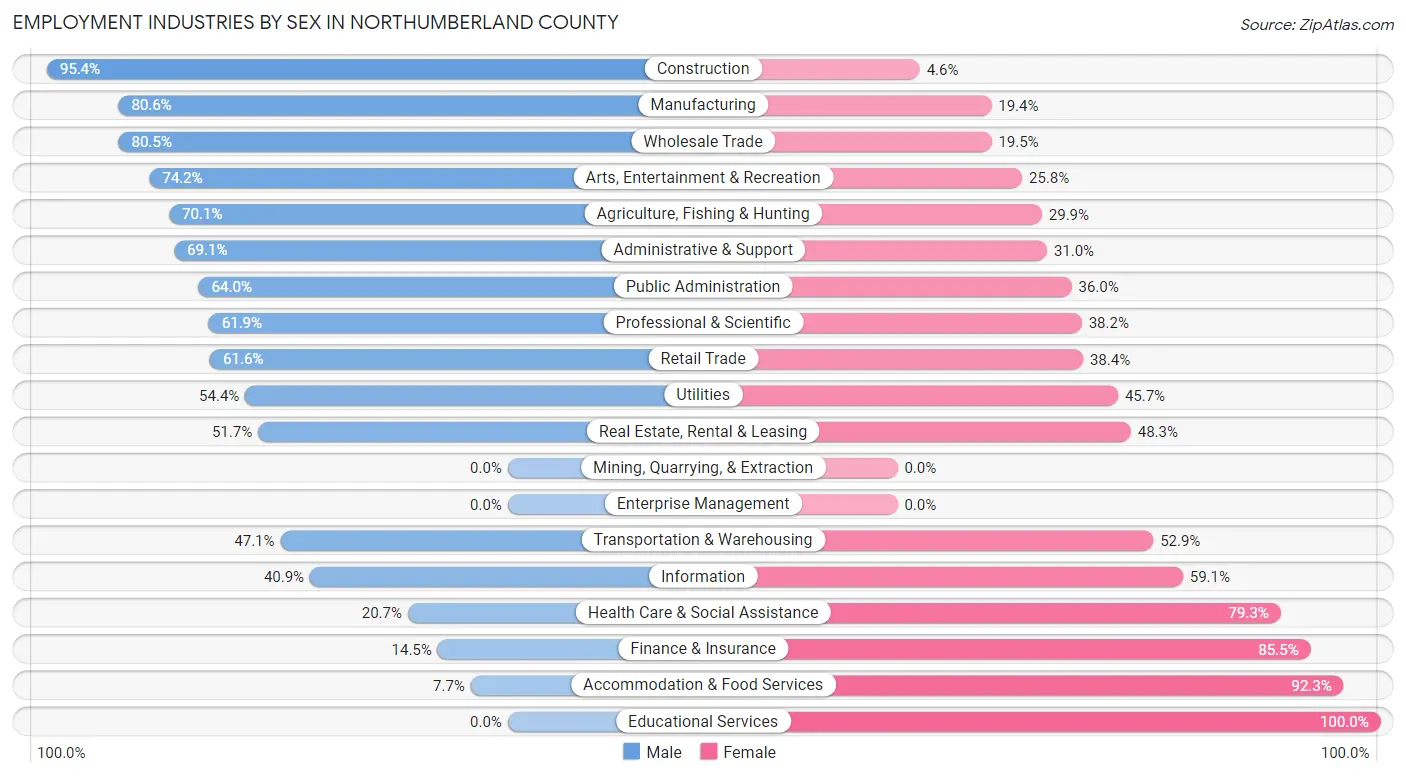
| Industry | Male | Female |
| Agriculture, Fishing & Hunting | 136 (70.1%) | 58 (29.9%) |
| Mining, Quarrying, & Extraction | 0 (0.0%) | 0 (0.0%) |
| Construction | 372 (95.4%) | 18 (4.6%) |
| Manufacturing | 141 (80.6%) | 34 (19.4%) |
| Wholesale Trade | 120 (80.5%) | 29 (19.5%) |
| Retail Trade | 186 (61.6%) | 116 (38.4%) |
| Transportation & Warehousing | 64 (47.1%) | 72 (52.9%) |
| Utilities | 25 (54.3%) | 21 (45.7%) |
| Information | 70 (40.9%) | 101 (59.1%) |
| Finance & Insurance | 28 (14.5%) | 165 (85.5%) |
| Real Estate, Rental & Leasing | 46 (51.7%) | 43 (48.3%) |
| Professional & Scientific | 201 (61.9%) | 124 (38.2%) |
| Enterprise Management | 0 (0.0%) | 0 (0.0%) |
| Administrative & Support | 145 (69.1%) | 65 (30.9%) |
| Educational Services | 0 (0.0%) | 477 (100.0%) |
| Health Care & Social Assistance | 104 (20.7%) | 399 (79.3%) |
| Arts, Entertainment & Recreation | 115 (74.2%) | 40 (25.8%) |
| Accommodation & Food Services | 26 (7.7%) | 313 (92.3%) |
| Public Administration | 197 (64.0%) | 111 (36.0%) |
| Total | 2,115 (48.6%) | 2,236 (51.4%) |
Education in Northumberland County
School Enrollment in Northumberland County
The most common levels of schooling among the 2,083 students in Northumberland County are high school (551 | 26.5%), college / undergraduate (528 | 25.4%), and middle school (481 | 23.1%).
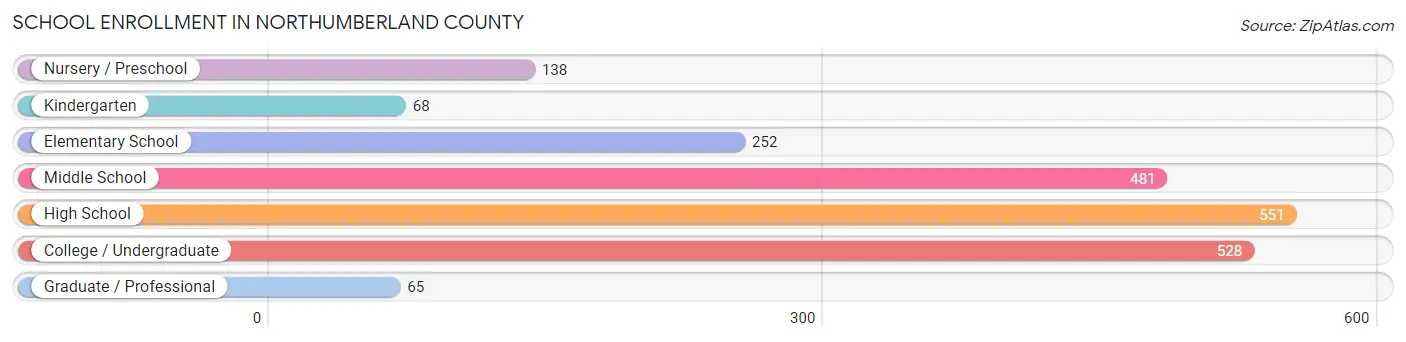
| School Level | # Students | % Students |
| Nursery / Preschool | 138 | 6.6% |
| Kindergarten | 68 | 3.3% |
| Elementary School | 252 | 12.1% |
| Middle School | 481 | 23.1% |
| High School | 551 | 26.5% |
| College / Undergraduate | 528 | 25.4% |
| Graduate / Professional | 65 | 3.1% |
| Total | 2,083 | 100.0% |
School Enrollment by Age by Funding Source in Northumberland County
Out of a total of 2,083 students who are enrolled in schools in Northumberland County, 358 (17.2%) attend a private institution, while the remaining 1,725 (82.8%) are enrolled in public schools. The age group of 35 years and over has the highest likelihood of being enrolled in private schools, with 80 (43.5% in the age bracket) enrolled. Conversely, the age group of 20 to 24 year olds has the lowest likelihood of being enrolled in a private school, with 260 (100.0% in the age bracket) attending a public institution.
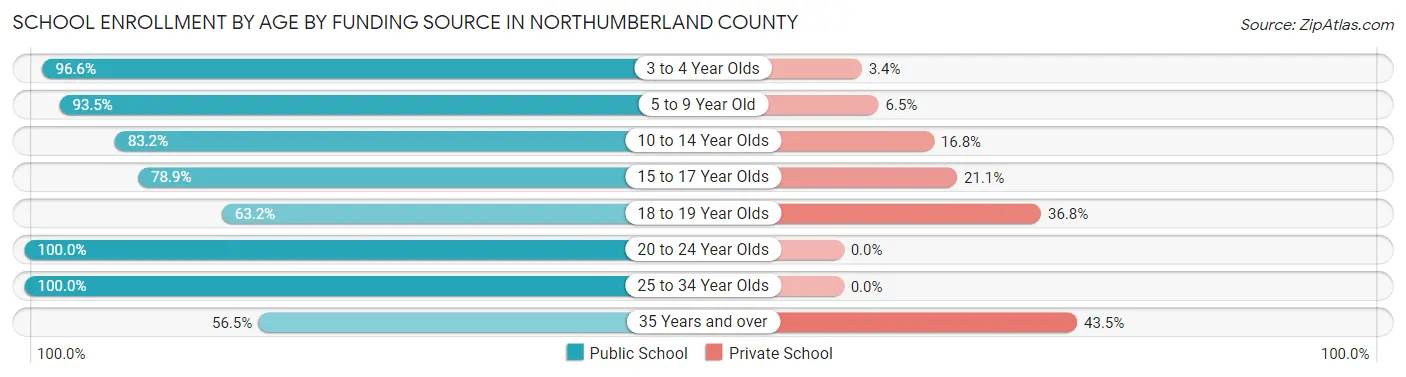
| Age Bracket | Public School | Private School |
| 3 to 4 Year Olds | 115 (96.6%) | 4 (3.4%) |
| 5 to 9 Year Old | 302 (93.5%) | 21 (6.5%) |
| 10 to 14 Year Olds | 470 (83.2%) | 95 (16.8%) |
| 15 to 17 Year Olds | 336 (78.9%) | 90 (21.1%) |
| 18 to 19 Year Olds | 117 (63.2%) | 68 (36.8%) |
| 20 to 24 Year Olds | 260 (100.0%) | 0 (0.0%) |
| 25 to 34 Year Olds | 21 (100.0%) | 0 (0.0%) |
| 35 Years and over | 104 (56.5%) | 80 (43.5%) |
| Total | 1,725 (82.8%) | 358 (17.2%) |
Educational Attainment by Field of Study in Northumberland County
Education (572 | 17.1%), business (441 | 13.2%), social sciences (403 | 12.1%), liberal arts & history (372 | 11.1%), and literature & languages (293 | 8.8%) are the most common fields of study among 3,340 individuals in Northumberland County who have obtained a bachelor's degree or higher.
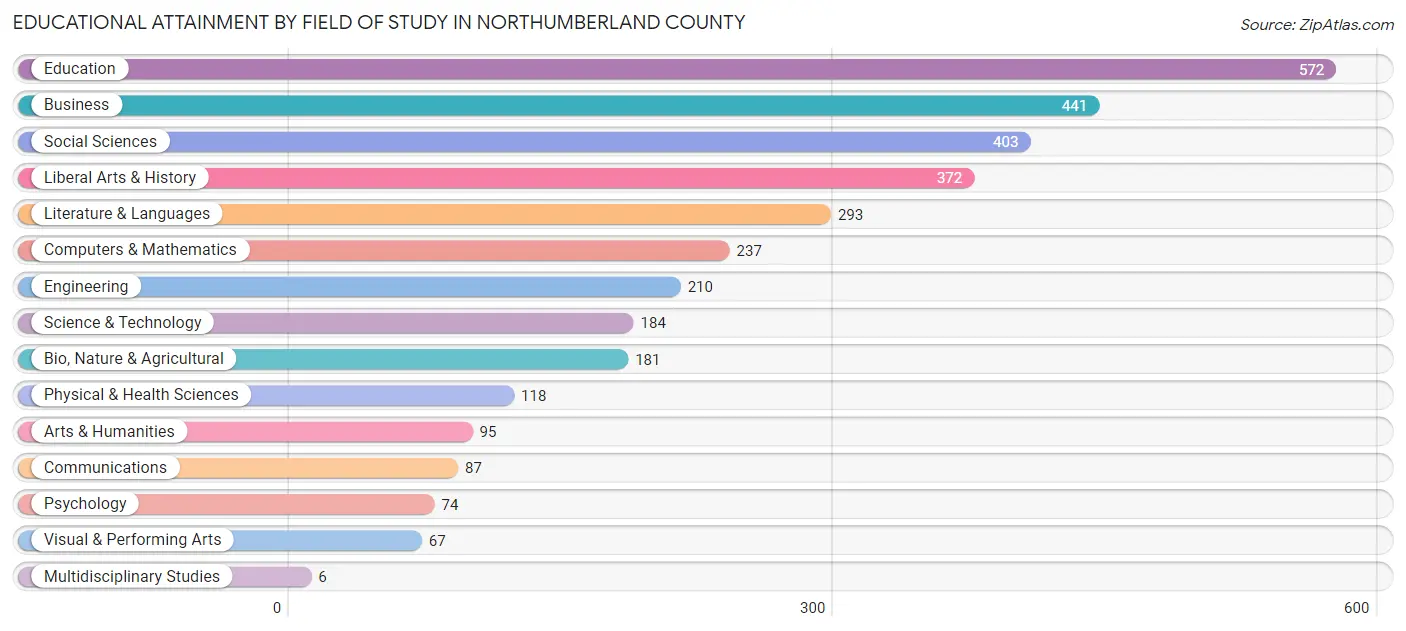
| Field of Study | # Graduates | % Graduates |
| Computers & Mathematics | 237 | 7.1% |
| Bio, Nature & Agricultural | 181 | 5.4% |
| Physical & Health Sciences | 118 | 3.5% |
| Psychology | 74 | 2.2% |
| Social Sciences | 403 | 12.1% |
| Engineering | 210 | 6.3% |
| Multidisciplinary Studies | 6 | 0.2% |
| Science & Technology | 184 | 5.5% |
| Business | 441 | 13.2% |
| Education | 572 | 17.1% |
| Literature & Languages | 293 | 8.8% |
| Liberal Arts & History | 372 | 11.1% |
| Visual & Performing Arts | 67 | 2.0% |
| Communications | 87 | 2.6% |
| Arts & Humanities | 95 | 2.8% |
| Total | 3,340 | 100.0% |
Transportation & Commute in Northumberland County
Vehicle Availability by Sex in Northumberland County
The most prevalent vehicle ownership categories in Northumberland County are males with 1 vehicle (644, accounting for 30.7%) and females with 1 vehicle (292, making up 28.8%).
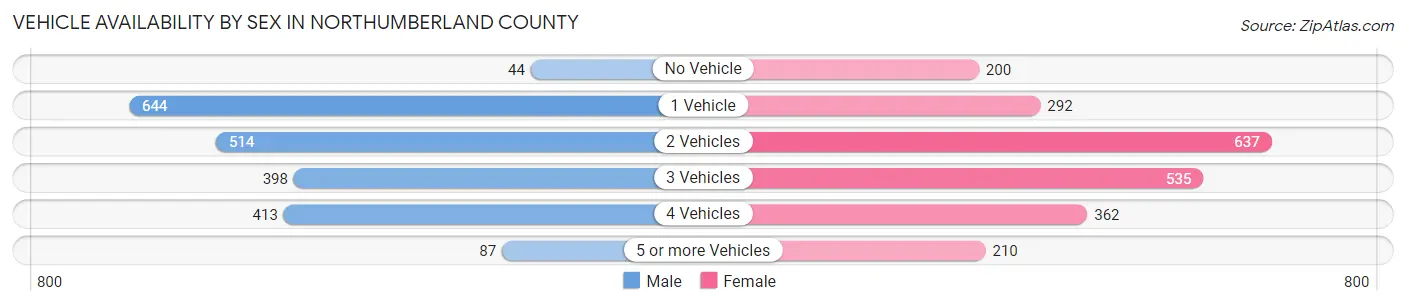
| Vehicles Available | Male | Female |
| No Vehicle | 44 (2.1%) | 200 (8.9%) |
| 1 Vehicle | 644 (30.7%) | 292 (13.1%) |
| 2 Vehicles | 514 (24.5%) | 637 (28.5%) |
| 3 Vehicles | 398 (19.0%) | 535 (23.9%) |
| 4 Vehicles | 413 (19.7%) | 362 (16.2%) |
| 5 or more Vehicles | 87 (4.1%) | 210 (9.4%) |
| Total | 2,100 (100.0%) | 2,236 (100.0%) |
Commute Time in Northumberland County
The most frequently occuring commute durations in Northumberland County are 15 to 19 minutes (577 commuters, 15.3%), 90 or more minutes (540 commuters, 14.3%), and 30 to 34 minutes (478 commuters, 12.7%).
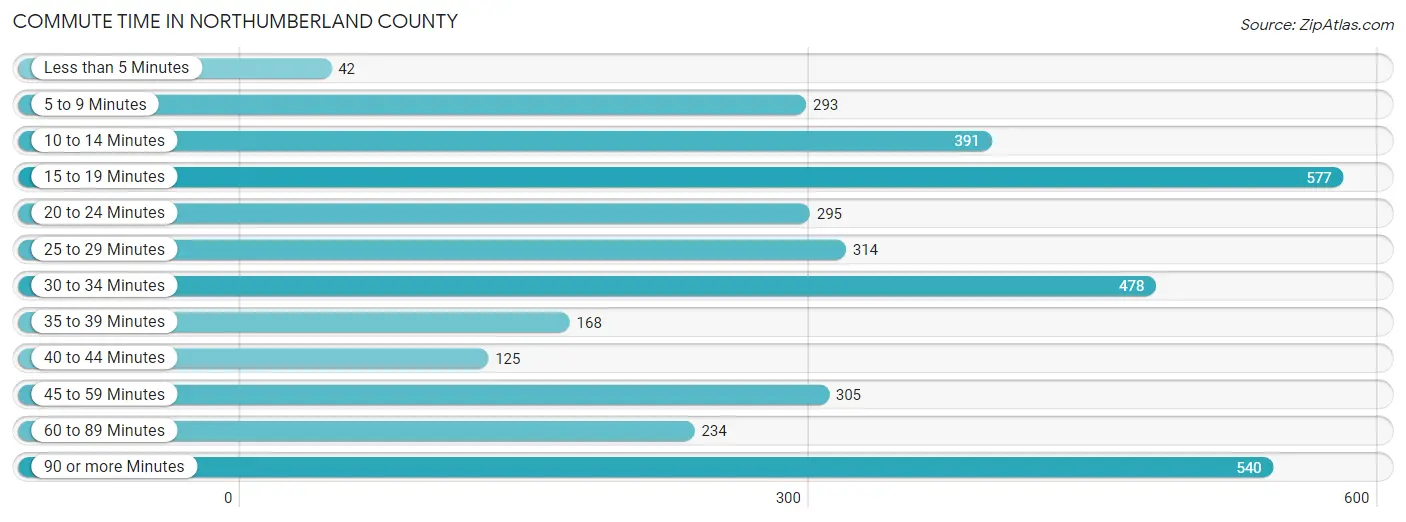
| Commute Time | # Commuters | % Commuters |
| Less than 5 Minutes | 42 | 1.1% |
| 5 to 9 Minutes | 293 | 7.8% |
| 10 to 14 Minutes | 391 | 10.4% |
| 15 to 19 Minutes | 577 | 15.3% |
| 20 to 24 Minutes | 295 | 7.8% |
| 25 to 29 Minutes | 314 | 8.4% |
| 30 to 34 Minutes | 478 | 12.7% |
| 35 to 39 Minutes | 168 | 4.5% |
| 40 to 44 Minutes | 125 | 3.3% |
| 45 to 59 Minutes | 305 | 8.1% |
| 60 to 89 Minutes | 234 | 6.2% |
| 90 or more Minutes | 540 | 14.3% |
Commute Time by Sex in Northumberland County
The most common commute times in Northumberland County are 90 or more minutes (326 commuters, 18.1%) for males and 15 to 19 minutes (300 commuters, 15.3%) for females.
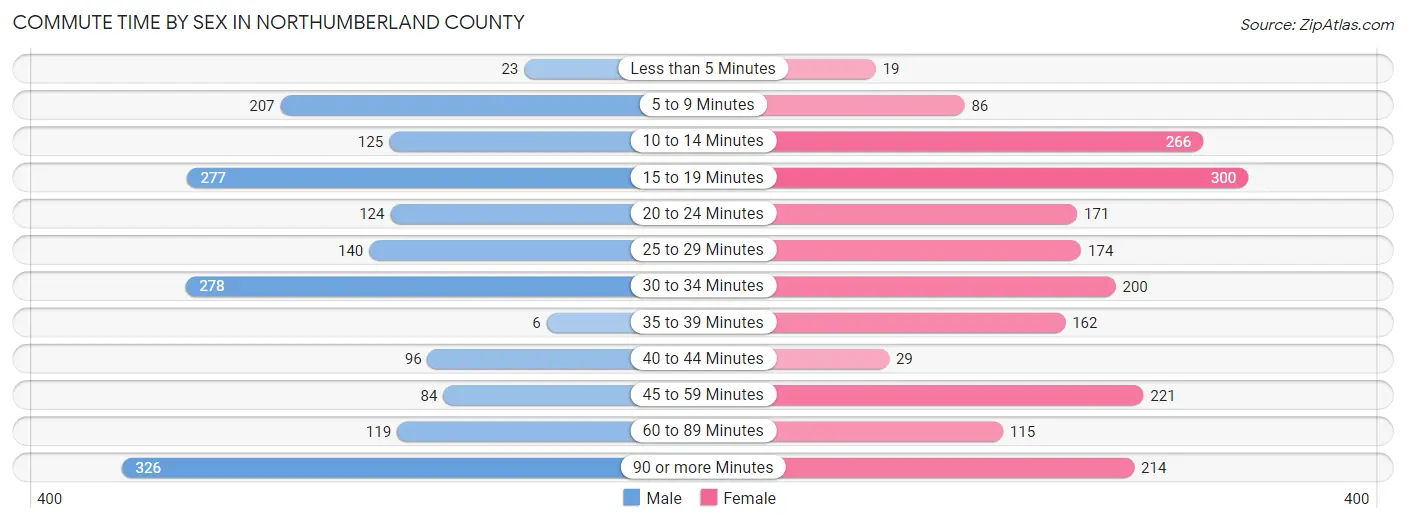
| Commute Time | Male | Female |
| Less than 5 Minutes | 23 (1.3%) | 19 (1.0%) |
| 5 to 9 Minutes | 207 (11.5%) | 86 (4.4%) |
| 10 to 14 Minutes | 125 (6.9%) | 266 (13.6%) |
| 15 to 19 Minutes | 277 (15.3%) | 300 (15.3%) |
| 20 to 24 Minutes | 124 (6.9%) | 171 (8.7%) |
| 25 to 29 Minutes | 140 (7.8%) | 174 (8.9%) |
| 30 to 34 Minutes | 278 (15.4%) | 200 (10.2%) |
| 35 to 39 Minutes | 6 (0.3%) | 162 (8.3%) |
| 40 to 44 Minutes | 96 (5.3%) | 29 (1.5%) |
| 45 to 59 Minutes | 84 (4.6%) | 221 (11.3%) |
| 60 to 89 Minutes | 119 (6.6%) | 115 (5.9%) |
| 90 or more Minutes | 326 (18.1%) | 214 (10.9%) |
Time of Departure to Work by Sex in Northumberland County
The most frequent times of departure to work in Northumberland County are 7:00 AM to 7:29 AM (486, 26.9%) for males and 7:00 AM to 7:29 AM (391, 20.0%) for females.
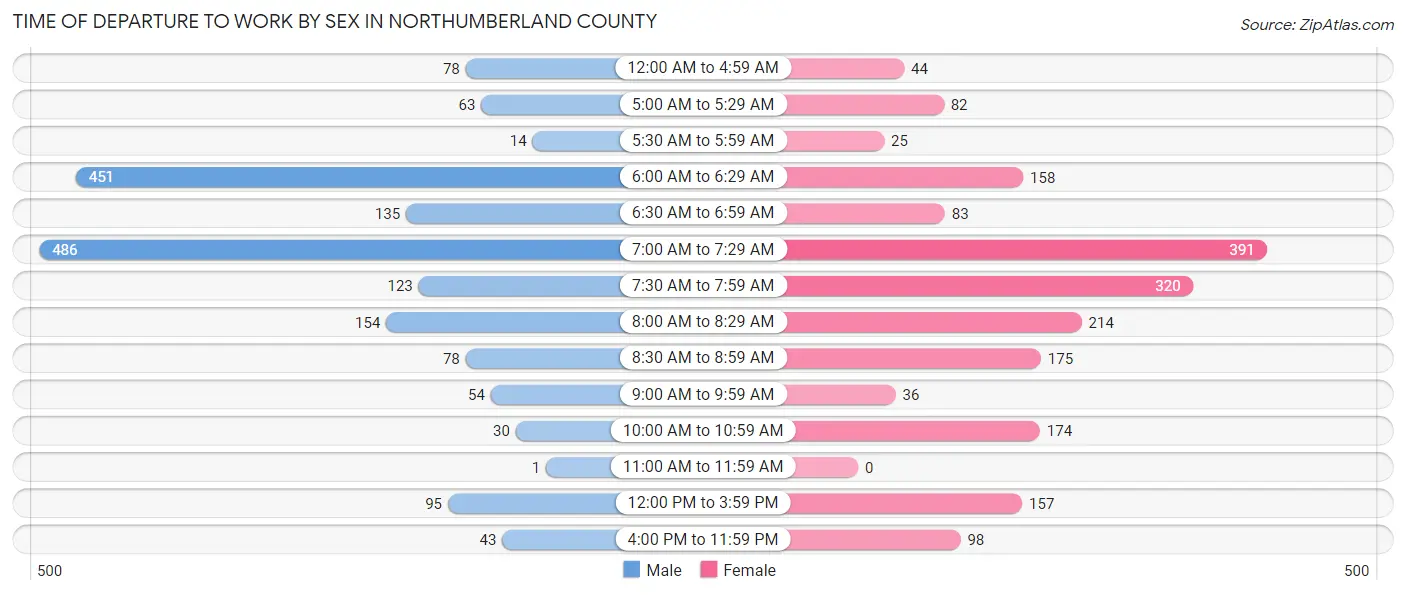
| Time of Departure | Male | Female |
| 12:00 AM to 4:59 AM | 78 (4.3%) | 44 (2.2%) |
| 5:00 AM to 5:29 AM | 63 (3.5%) | 82 (4.2%) |
| 5:30 AM to 5:59 AM | 14 (0.8%) | 25 (1.3%) |
| 6:00 AM to 6:29 AM | 451 (25.0%) | 158 (8.1%) |
| 6:30 AM to 6:59 AM | 135 (7.5%) | 83 (4.2%) |
| 7:00 AM to 7:29 AM | 486 (26.9%) | 391 (20.0%) |
| 7:30 AM to 7:59 AM | 123 (6.8%) | 320 (16.4%) |
| 8:00 AM to 8:29 AM | 154 (8.5%) | 214 (10.9%) |
| 8:30 AM to 8:59 AM | 78 (4.3%) | 175 (8.9%) |
| 9:00 AM to 9:59 AM | 54 (3.0%) | 36 (1.8%) |
| 10:00 AM to 10:59 AM | 30 (1.7%) | 174 (8.9%) |
| 11:00 AM to 11:59 AM | 1 (0.1%) | 0 (0.0%) |
| 12:00 PM to 3:59 PM | 95 (5.3%) | 157 (8.0%) |
| 4:00 PM to 11:59 PM | 43 (2.4%) | 98 (5.0%) |
| Total | 1,805 (100.0%) | 1,957 (100.0%) |
Housing Occupancy in Northumberland County
Occupancy by Ownership in Northumberland County
Of the total 5,174 dwellings in Northumberland County, owner-occupied units account for 4,597 (88.8%), while renter-occupied units make up 577 (11.2%).
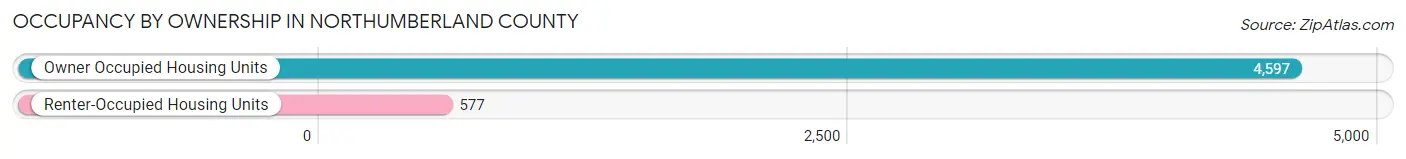
| Occupancy | # Housing Units | % Housing Units |
| Owner Occupied Housing Units | 4,597 | 88.8% |
| Renter-Occupied Housing Units | 577 | 11.2% |
| Total Occupied Housing Units | 5,174 | 100.0% |
Occupancy by Household Size in Northumberland County
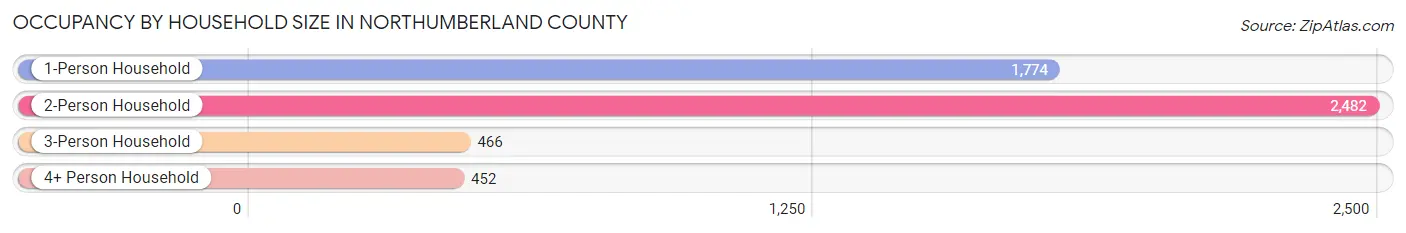
| Household Size | # Housing Units | % Housing Units |
| 1-Person Household | 1,774 | 34.3% |
| 2-Person Household | 2,482 | 48.0% |
| 3-Person Household | 466 | 9.0% |
| 4+ Person Household | 452 | 8.7% |
| Total Housing Units | 5,174 | 100.0% |
Occupancy by Ownership by Household Size in Northumberland County
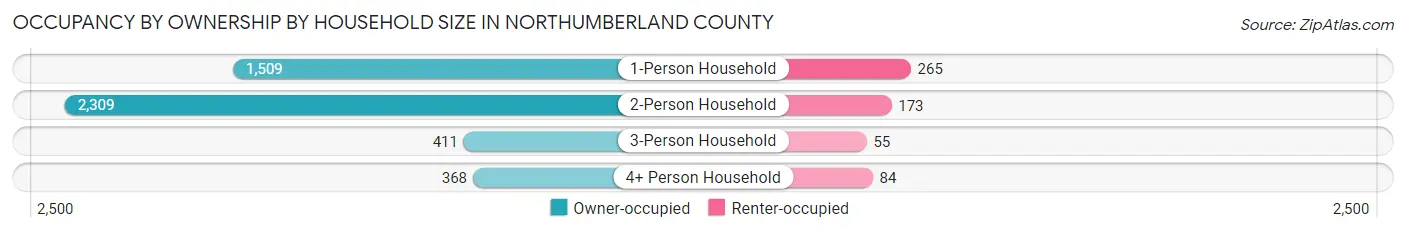
| Household Size | Owner-occupied | Renter-occupied |
| 1-Person Household | 1,509 (85.1%) | 265 (14.9%) |
| 2-Person Household | 2,309 (93.0%) | 173 (7.0%) |
| 3-Person Household | 411 (88.2%) | 55 (11.8%) |
| 4+ Person Household | 368 (81.4%) | 84 (18.6%) |
| Total Housing Units | 4,597 (88.8%) | 577 (11.2%) |
Occupancy by Educational Attainment in Northumberland County
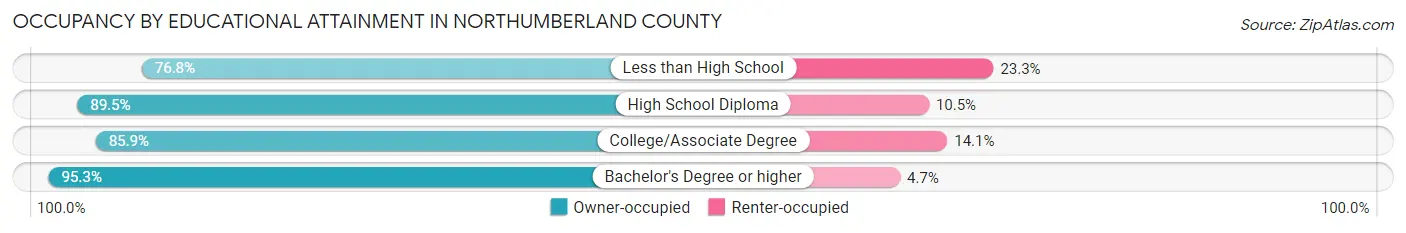
| Household Size | Owner-occupied | Renter-occupied |
| Less than High School | 482 (76.7%) | 146 (23.3%) |
| High School Diploma | 1,087 (89.5%) | 127 (10.5%) |
| College/Associate Degree | 1,340 (85.9%) | 220 (14.1%) |
| Bachelor's Degree or higher | 1,688 (95.3%) | 84 (4.7%) |
Occupancy by Age of Householder in Northumberland County
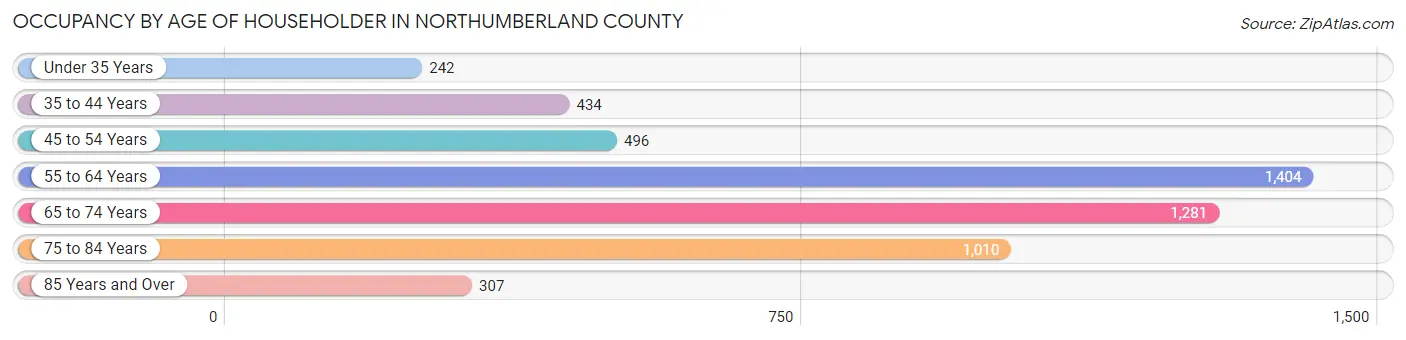
| Age Bracket | # Households | % Households |
| Under 35 Years | 242 | 4.7% |
| 35 to 44 Years | 434 | 8.4% |
| 45 to 54 Years | 496 | 9.6% |
| 55 to 64 Years | 1,404 | 27.1% |
| 65 to 74 Years | 1,281 | 24.8% |
| 75 to 84 Years | 1,010 | 19.5% |
| 85 Years and Over | 307 | 5.9% |
| Total | 5,174 | 100.0% |
Housing Finances in Northumberland County
Median Income by Occupancy in Northumberland County
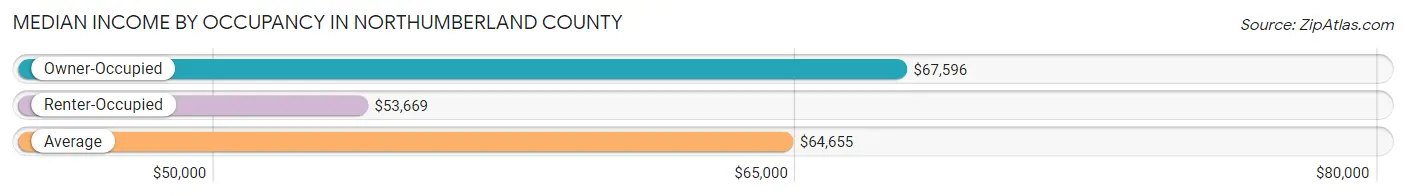
| Occupancy Type | # Households | Median Income |
| Owner-Occupied | 4,597 (88.8%) | $67,596 |
| Renter-Occupied | 577 (11.2%) | $53,669 |
| Average | 5,174 (100.0%) | $64,655 |
Occupancy by Householder Income Bracket in Northumberland County
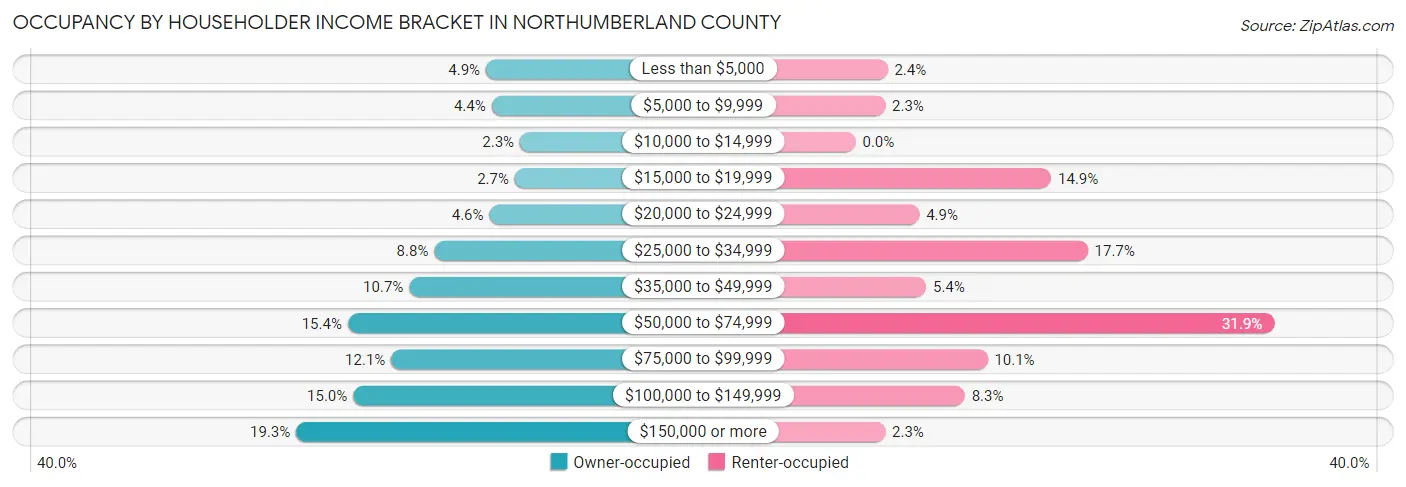
| Income Bracket | Owner-occupied | Renter-occupied |
| Less than $5,000 | 223 (4.9%) | 14 (2.4%) |
| $5,000 to $9,999 | 203 (4.4%) | 13 (2.2%) |
| $10,000 to $14,999 | 104 (2.3%) | 0 (0.0%) |
| $15,000 to $19,999 | 122 (2.6%) | 86 (14.9%) |
| $20,000 to $24,999 | 211 (4.6%) | 28 (4.9%) |
| $25,000 to $34,999 | 404 (8.8%) | 102 (17.7%) |
| $35,000 to $49,999 | 492 (10.7%) | 31 (5.4%) |
| $50,000 to $74,999 | 707 (15.4%) | 184 (31.9%) |
| $75,000 to $99,999 | 555 (12.1%) | 58 (10.1%) |
| $100,000 to $149,999 | 688 (15.0%) | 48 (8.3%) |
| $150,000 or more | 888 (19.3%) | 13 (2.2%) |
| Total | 4,597 (100.0%) | 577 (100.0%) |
Monthly Housing Cost Tiers in Northumberland County
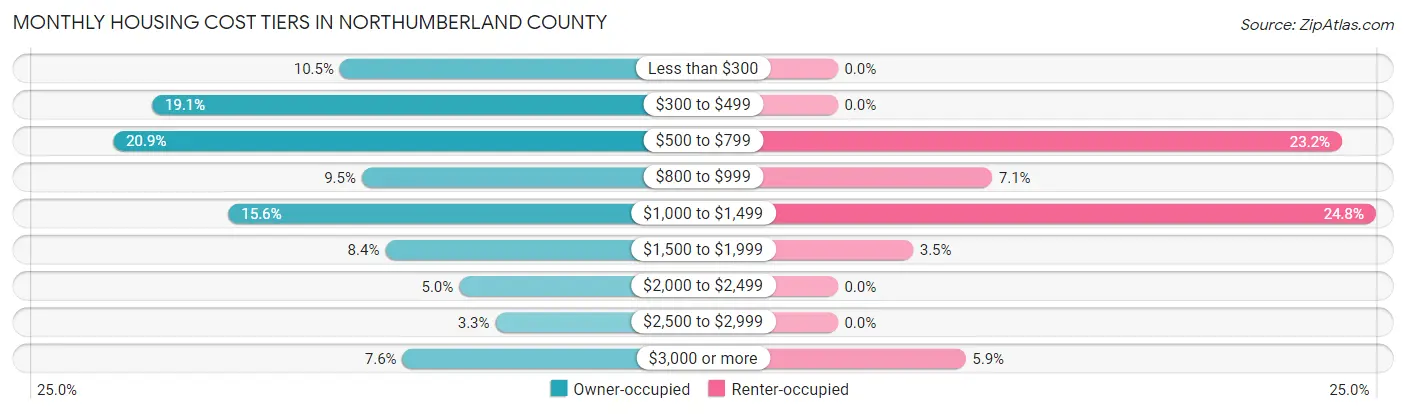
| Monthly Cost | Owner-occupied | Renter-occupied |
| Less than $300 | 482 (10.5%) | 0 (0.0%) |
| $300 to $499 | 880 (19.1%) | 0 (0.0%) |
| $500 to $799 | 962 (20.9%) | 134 (23.2%) |
| $800 to $999 | 436 (9.5%) | 41 (7.1%) |
| $1,000 to $1,499 | 718 (15.6%) | 143 (24.8%) |
| $1,500 to $1,999 | 386 (8.4%) | 20 (3.5%) |
| $2,000 to $2,499 | 230 (5.0%) | 0 (0.0%) |
| $2,500 to $2,999 | 153 (3.3%) | 0 (0.0%) |
| $3,000 or more | 350 (7.6%) | 34 (5.9%) |
| Total | 4,597 (100.0%) | 577 (100.0%) |
Physical Housing Characteristics in Northumberland County
Housing Structures in Northumberland County
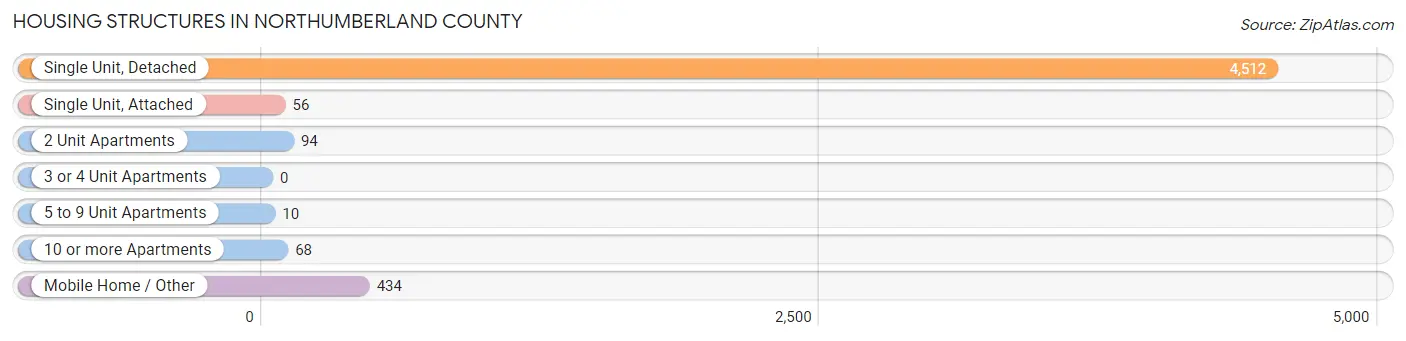
| Structure Type | # Housing Units | % Housing Units |
| Single Unit, Detached | 4,512 | 87.2% |
| Single Unit, Attached | 56 | 1.1% |
| 2 Unit Apartments | 94 | 1.8% |
| 3 or 4 Unit Apartments | 0 | 0.0% |
| 5 to 9 Unit Apartments | 10 | 0.2% |
| 10 or more Apartments | 68 | 1.3% |
| Mobile Home / Other | 434 | 8.4% |
| Total | 5,174 | 100.0% |
Housing Structures by Occupancy in Northumberland County
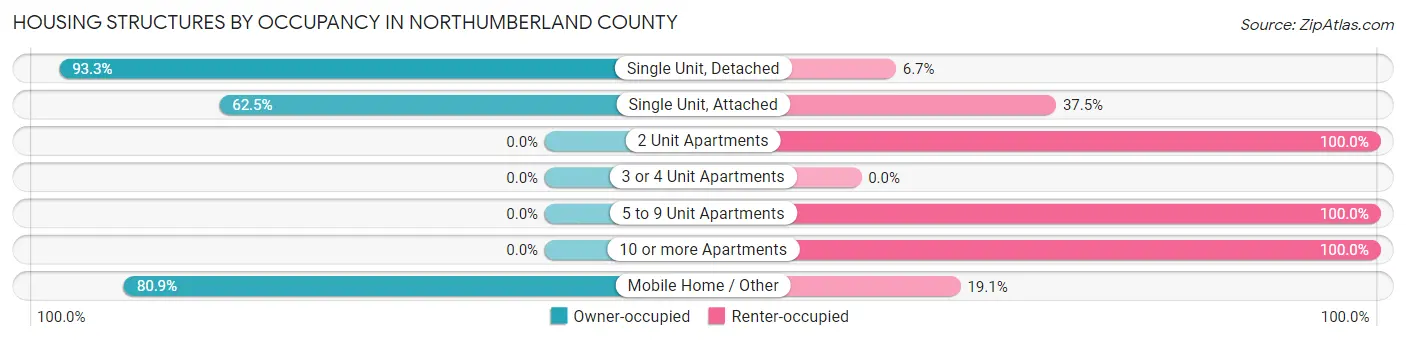
| Structure Type | Owner-occupied | Renter-occupied |
| Single Unit, Detached | 4,211 (93.3%) | 301 (6.7%) |
| Single Unit, Attached | 35 (62.5%) | 21 (37.5%) |
| 2 Unit Apartments | 0 (0.0%) | 94 (100.0%) |
| 3 or 4 Unit Apartments | 0 (0.0%) | 0 (0.0%) |
| 5 to 9 Unit Apartments | 0 (0.0%) | 10 (100.0%) |
| 10 or more Apartments | 0 (0.0%) | 68 (100.0%) |
| Mobile Home / Other | 351 (80.9%) | 83 (19.1%) |
| Total | 4,597 (88.8%) | 577 (11.2%) |
Housing Structures by Number of Rooms in Northumberland County
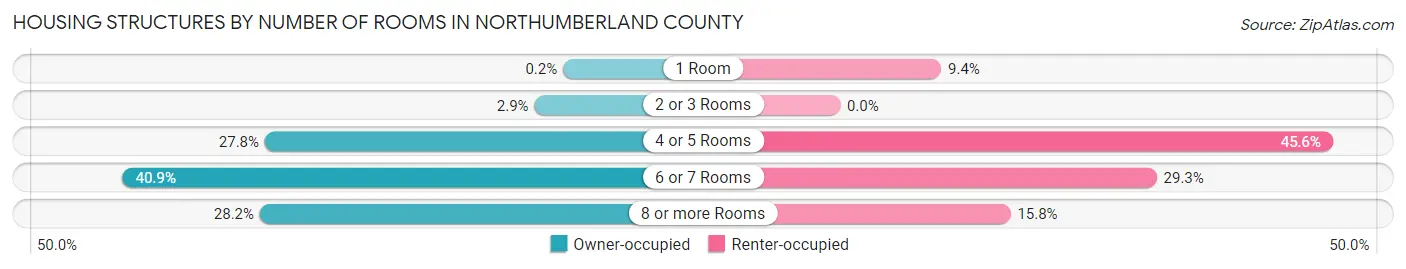
| Number of Rooms | Owner-occupied | Renter-occupied |
| 1 Room | 9 (0.2%) | 54 (9.4%) |
| 2 or 3 Rooms | 131 (2.9%) | 0 (0.0%) |
| 4 or 5 Rooms | 1,277 (27.8%) | 263 (45.6%) |
| 6 or 7 Rooms | 1,882 (40.9%) | 169 (29.3%) |
| 8 or more Rooms | 1,298 (28.2%) | 91 (15.8%) |
| Total | 4,597 (100.0%) | 577 (100.0%) |
Housing Structure by Heating Type in Northumberland County
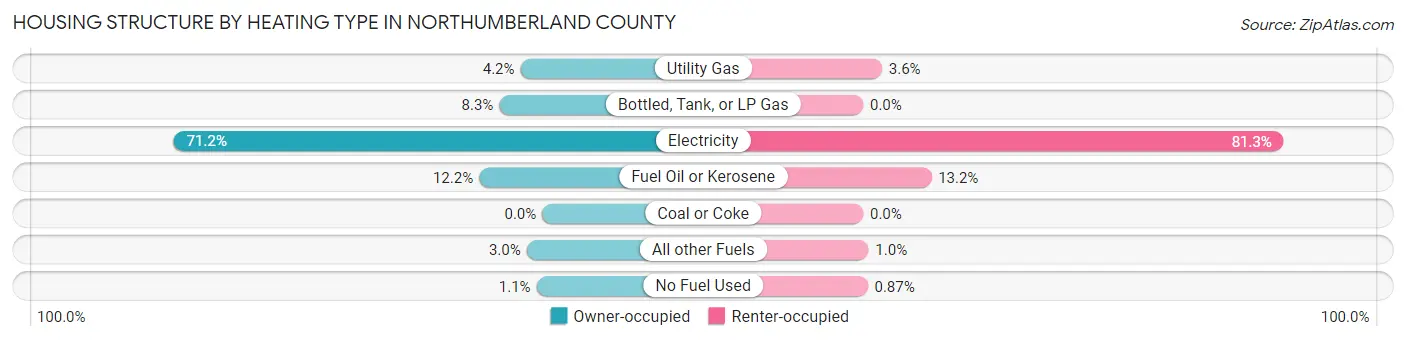
| Heating Type | Owner-occupied | Renter-occupied |
| Utility Gas | 193 (4.2%) | 21 (3.6%) |
| Bottled, Tank, or LP Gas | 381 (8.3%) | 0 (0.0%) |
| Electricity | 3,274 (71.2%) | 469 (81.3%) |
| Fuel Oil or Kerosene | 561 (12.2%) | 76 (13.2%) |
| Coal or Coke | 0 (0.0%) | 0 (0.0%) |
| All other Fuels | 138 (3.0%) | 6 (1.0%) |
| No Fuel Used | 50 (1.1%) | 5 (0.9%) |
| Total | 4,597 (100.0%) | 577 (100.0%) |
Household Vehicle Usage in Northumberland County
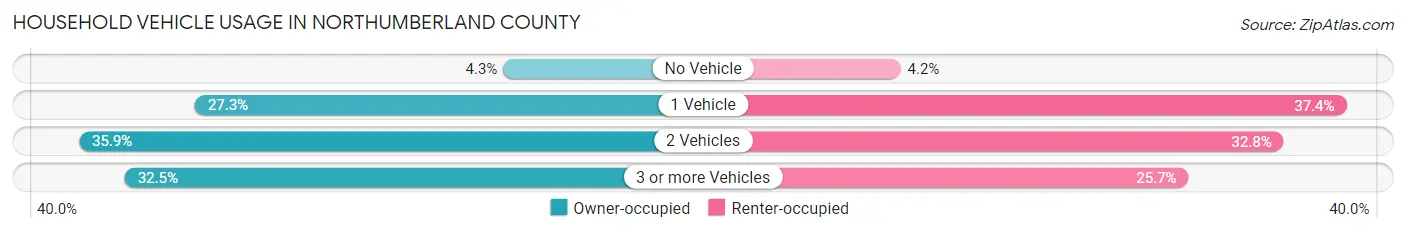
| Vehicles per Household | Owner-occupied | Renter-occupied |
| No Vehicle | 196 (4.3%) | 24 (4.2%) |
| 1 Vehicle | 1,254 (27.3%) | 216 (37.4%) |
| 2 Vehicles | 1,652 (35.9%) | 189 (32.8%) |
| 3 or more Vehicles | 1,495 (32.5%) | 148 (25.7%) |
| Total | 4,597 (100.0%) | 577 (100.0%) |
Real Estate & Mortgages in Northumberland County
Real Estate and Mortgage Overview in Northumberland County
| Characteristic | Without Mortgage | With Mortgage |
| Housing Units | 2,453 | 2,144 |
| Median Property Value | $294,400 | $315,600 |
| Median Household Income | $50,927 | $590 |
| Monthly Housing Costs | $487 | $335 |
| Real Estate Taxes | $1,451 | $12 |
Property Value by Mortgage Status in Northumberland County
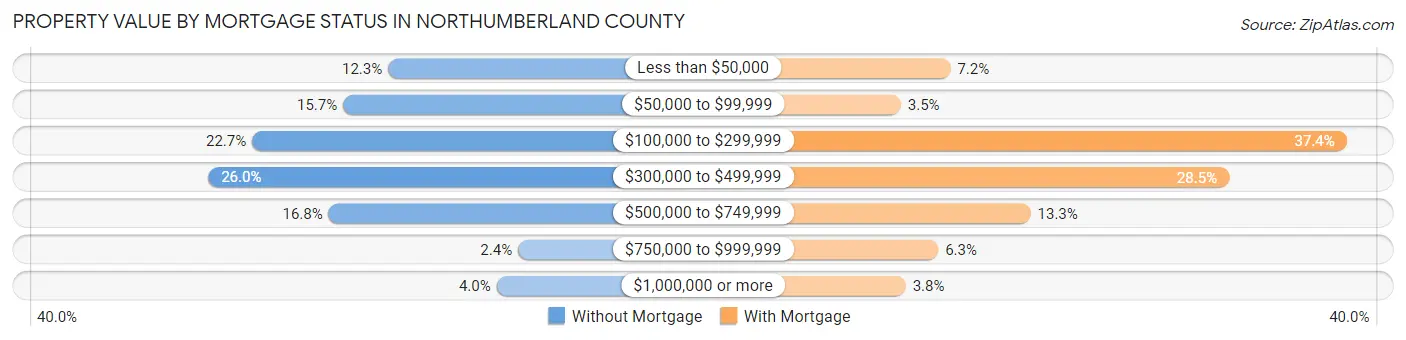
| Property Value | Without Mortgage | With Mortgage |
| Less than $50,000 | 302 (12.3%) | 155 (7.2%) |
| $50,000 to $99,999 | 386 (15.7%) | 74 (3.5%) |
| $100,000 to $299,999 | 556 (22.7%) | 802 (37.4%) |
| $300,000 to $499,999 | 638 (26.0%) | 610 (28.4%) |
| $500,000 to $749,999 | 413 (16.8%) | 286 (13.3%) |
| $750,000 to $999,999 | 59 (2.4%) | 135 (6.3%) |
| $1,000,000 or more | 99 (4.0%) | 82 (3.8%) |
| Total | 2,453 (100.0%) | 2,144 (100.0%) |
Household Income by Mortgage Status in Northumberland County
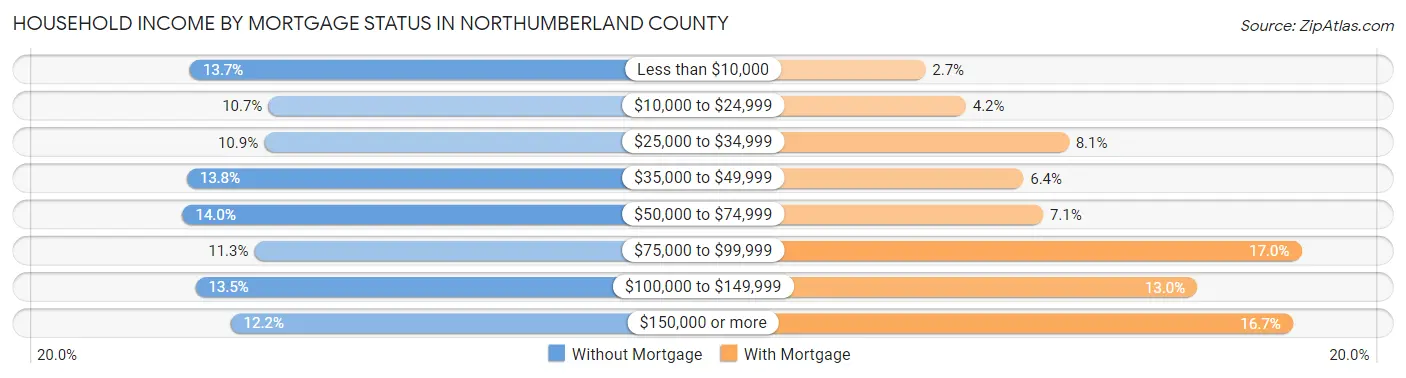
| Household Income | Without Mortgage | With Mortgage |
| Less than $10,000 | 336 (13.7%) | 57 (2.7%) |
| $10,000 to $24,999 | 263 (10.7%) | 90 (4.2%) |
| $25,000 to $34,999 | 267 (10.9%) | 174 (8.1%) |
| $35,000 to $49,999 | 339 (13.8%) | 137 (6.4%) |
| $50,000 to $74,999 | 343 (14.0%) | 153 (7.1%) |
| $75,000 to $99,999 | 276 (11.3%) | 364 (17.0%) |
| $100,000 to $149,999 | 331 (13.5%) | 279 (13.0%) |
| $150,000 or more | 298 (12.1%) | 357 (16.7%) |
| Total | 2,453 (100.0%) | 2,144 (100.0%) |
Property Value to Household Income Ratio in Northumberland County
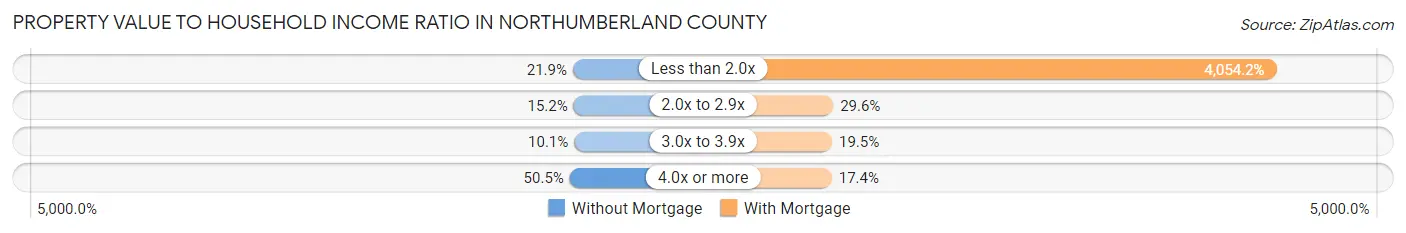
| Value-to-Income Ratio | Without Mortgage | With Mortgage |
| Less than 2.0x | 537 (21.9%) | 86,923 (4,054.2%) |
| 2.0x to 2.9x | 373 (15.2%) | 635 (29.6%) |
| 3.0x to 3.9x | 248 (10.1%) | 419 (19.5%) |
| 4.0x or more | 1,239 (50.5%) | 372 (17.3%) |
| Total | 2,453 (100.0%) | 2,144 (100.0%) |
Real Estate Taxes by Mortgage Status in Northumberland County
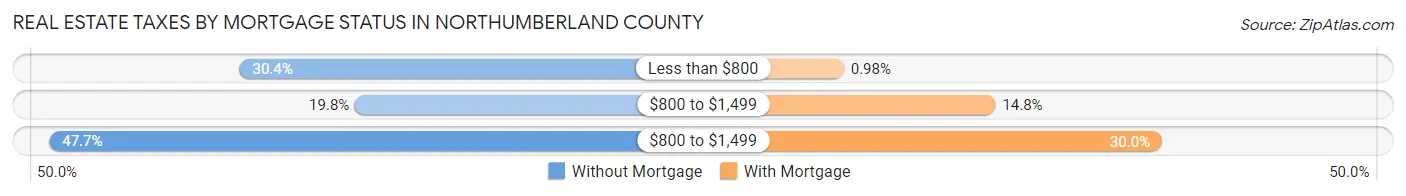
| Property Taxes | Without Mortgage | With Mortgage |
| Less than $800 | 745 (30.4%) | 21 (1.0%) |
| $800 to $1,499 | 486 (19.8%) | 318 (14.8%) |
| $800 to $1,499 | 1,171 (47.7%) | 644 (30.0%) |
| Total | 2,453 (100.0%) | 2,144 (100.0%) |
Health & Disability in Northumberland County
Health Insurance Coverage by Age in Northumberland County
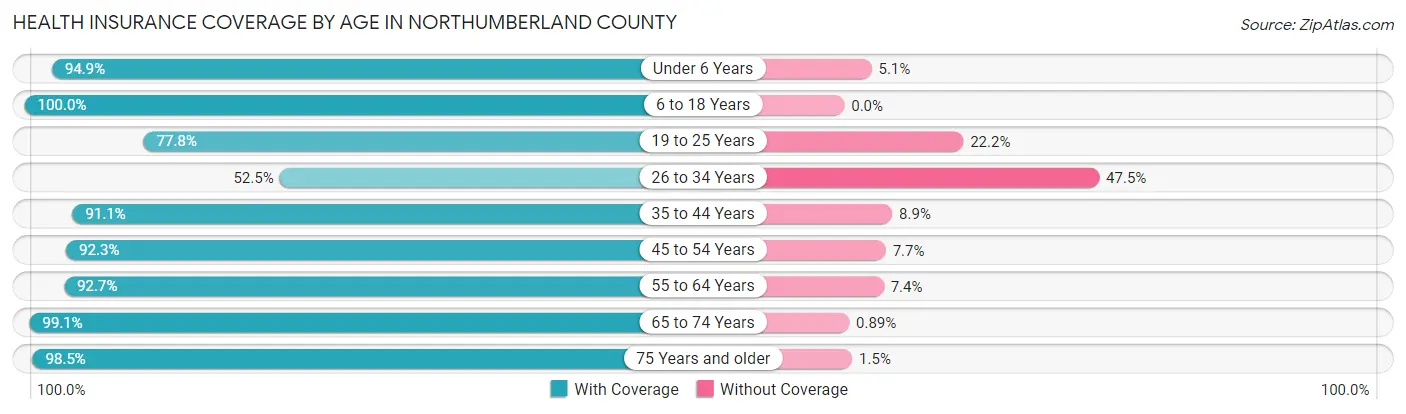
| Age Bracket | With Coverage | Without Coverage |
| Under 6 Years | 430 (94.9%) | 23 (5.1%) |
| 6 to 18 Years | 1,429 (100.0%) | 0 (0.0%) |
| 19 to 25 Years | 744 (77.8%) | 212 (22.2%) |
| 26 to 34 Years | 340 (52.5%) | 308 (47.5%) |
| 35 to 44 Years | 878 (91.1%) | 86 (8.9%) |
| 45 to 54 Years | 871 (92.3%) | 73 (7.7%) |
| 55 to 64 Years | 2,029 (92.6%) | 161 (7.3%) |
| 65 to 74 Years | 2,229 (99.1%) | 20 (0.9%) |
| 75 Years and older | 2,142 (98.5%) | 32 (1.5%) |
| Total | 11,092 (92.4%) | 915 (7.6%) |
Health Insurance Coverage by Citizenship Status in Northumberland County
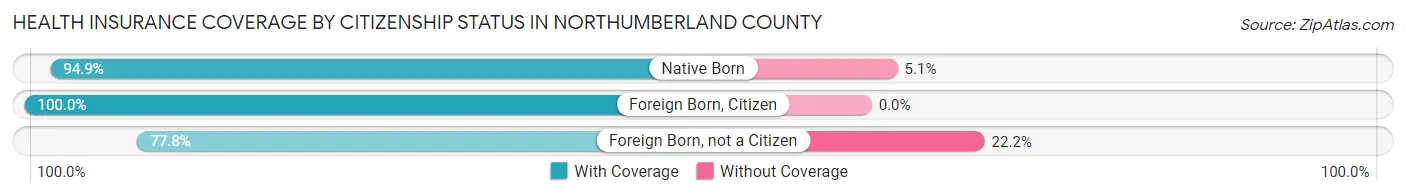
| Citizenship Status | With Coverage | Without Coverage |
| Native Born | 430 (94.9%) | 23 (5.1%) |
| Foreign Born, Citizen | 1,429 (100.0%) | 0 (0.0%) |
| Foreign Born, not a Citizen | 744 (77.8%) | 212 (22.2%) |
Health Insurance Coverage by Household Income in Northumberland County
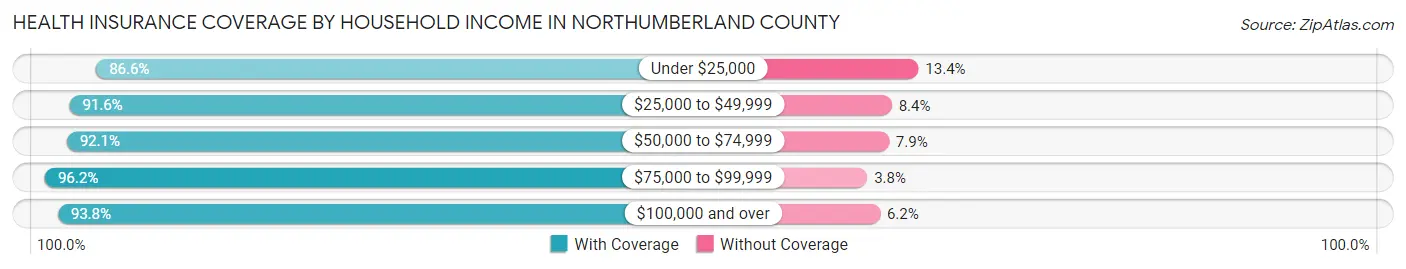
| Household Income | With Coverage | Without Coverage |
| Under $25,000 | 1,432 (86.6%) | 222 (13.4%) |
| $25,000 to $49,999 | 2,168 (91.6%) | 199 (8.4%) |
| $50,000 to $74,999 | 1,716 (92.1%) | 147 (7.9%) |
| $75,000 to $99,999 | 1,356 (96.2%) | 54 (3.8%) |
| $100,000 and over | 4,420 (93.8%) | 293 (6.2%) |
Public vs Private Health Insurance Coverage by Age in Northumberland County
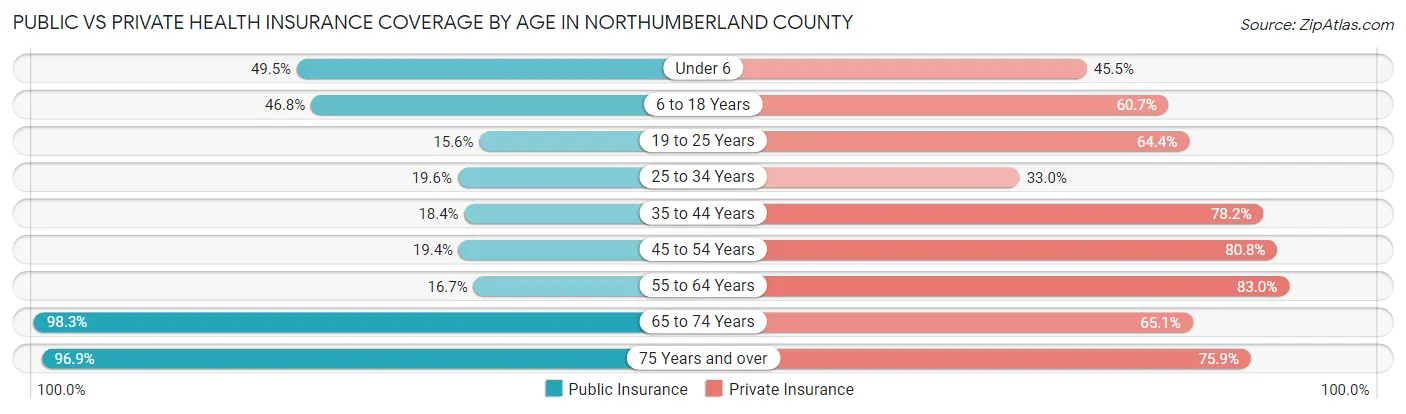
| Age Bracket | Public Insurance | Private Insurance |
| Under 6 | 224 (49.4%) | 206 (45.5%) |
| 6 to 18 Years | 669 (46.8%) | 867 (60.7%) |
| 19 to 25 Years | 149 (15.6%) | 616 (64.4%) |
| 25 to 34 Years | 127 (19.6%) | 214 (33.0%) |
| 35 to 44 Years | 177 (18.4%) | 754 (78.2%) |
| 45 to 54 Years | 183 (19.4%) | 763 (80.8%) |
| 55 to 64 Years | 365 (16.7%) | 1,818 (83.0%) |
| 65 to 74 Years | 2,210 (98.3%) | 1,464 (65.1%) |
| 75 Years and over | 2,106 (96.9%) | 1,650 (75.9%) |
| Total | 6,210 (51.7%) | 8,352 (69.6%) |
Disability Status by Sex by Age in Northumberland County
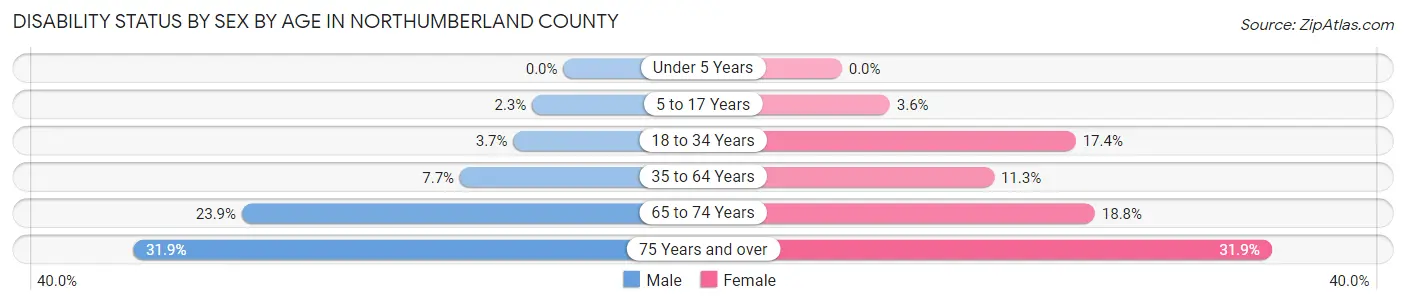
| Age Bracket | Male | Female |
| Under 5 Years | 0 (0.0%) | 0 (0.0%) |
| 5 to 17 Years | 11 (2.3%) | 33 (3.6%) |
| 18 to 34 Years | 30 (3.7%) | 157 (17.4%) |
| 35 to 64 Years | 151 (7.7%) | 241 (11.3%) |
| 65 to 74 Years | 242 (23.9%) | 232 (18.8%) |
| 75 Years and over | 368 (31.9%) | 326 (31.9%) |
Disability Class by Sex by Age in Northumberland County
Disability Class: Hearing Difficulty
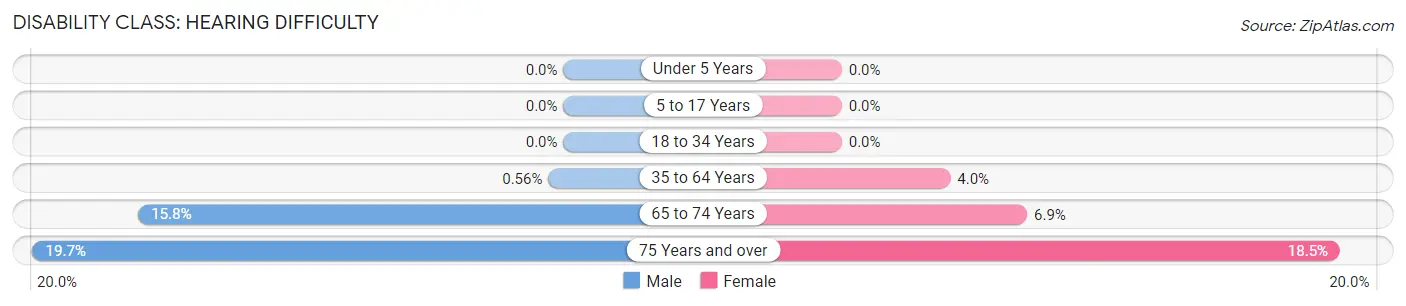
| Age Bracket | Male | Female |
| Under 5 Years | 0 (0.0%) | 0 (0.0%) |
| 5 to 17 Years | 0 (0.0%) | 0 (0.0%) |
| 18 to 34 Years | 0 (0.0%) | 0 (0.0%) |
| 35 to 64 Years | 11 (0.6%) | 86 (4.0%) |
| 65 to 74 Years | 160 (15.8%) | 85 (6.9%) |
| 75 Years and over | 227 (19.7%) | 189 (18.5%) |
Disability Class: Vision Difficulty
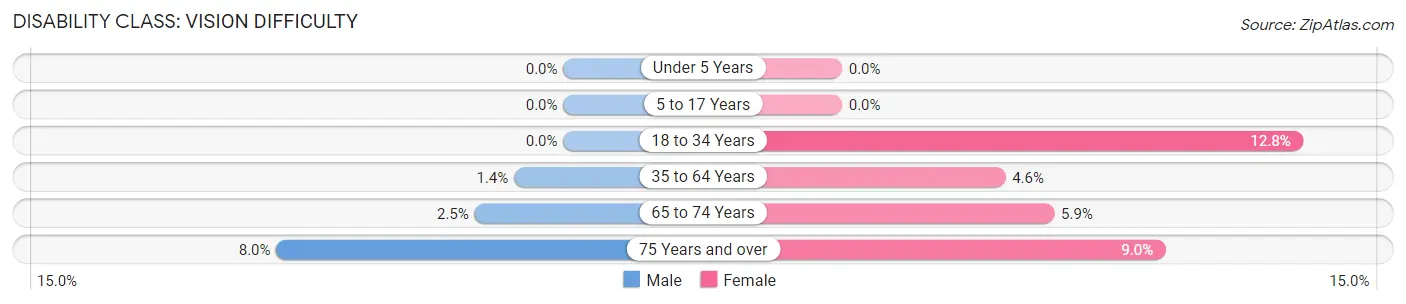
| Age Bracket | Male | Female |
| Under 5 Years | 0 (0.0%) | 0 (0.0%) |
| 5 to 17 Years | 0 (0.0%) | 0 (0.0%) |
| 18 to 34 Years | 0 (0.0%) | 116 (12.8%) |
| 35 to 64 Years | 27 (1.4%) | 97 (4.5%) |
| 65 to 74 Years | 25 (2.5%) | 73 (5.9%) |
| 75 Years and over | 92 (8.0%) | 92 (9.0%) |
Disability Class: Cognitive Difficulty
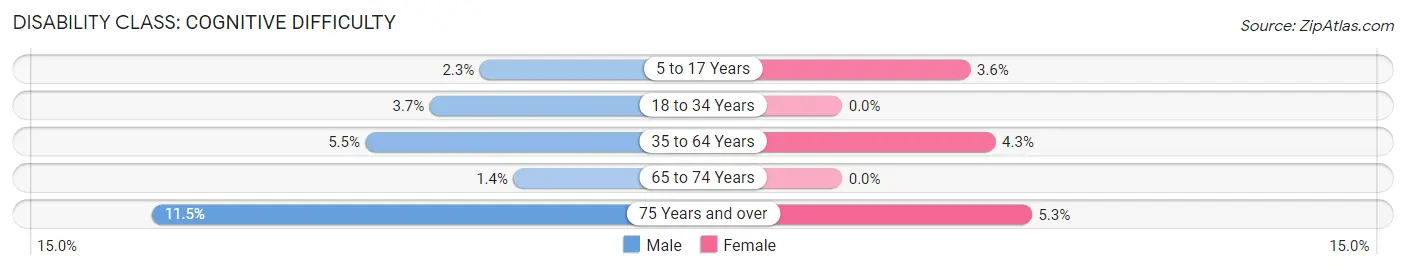
| Age Bracket | Male | Female |
| 5 to 17 Years | 11 (2.3%) | 33 (3.6%) |
| 18 to 34 Years | 30 (3.7%) | 0 (0.0%) |
| 35 to 64 Years | 108 (5.5%) | 91 (4.3%) |
| 65 to 74 Years | 14 (1.4%) | 0 (0.0%) |
| 75 Years and over | 132 (11.5%) | 54 (5.3%) |
Disability Class: Ambulatory Difficulty
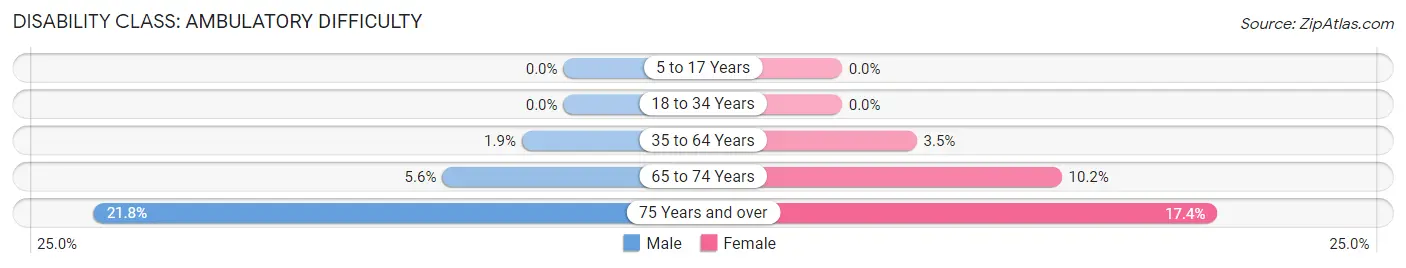
| Age Bracket | Male | Female |
| 5 to 17 Years | 0 (0.0%) | 0 (0.0%) |
| 18 to 34 Years | 0 (0.0%) | 0 (0.0%) |
| 35 to 64 Years | 38 (1.9%) | 74 (3.5%) |
| 65 to 74 Years | 57 (5.6%) | 126 (10.2%) |
| 75 Years and over | 251 (21.8%) | 178 (17.4%) |
Disability Class: Self-Care Difficulty
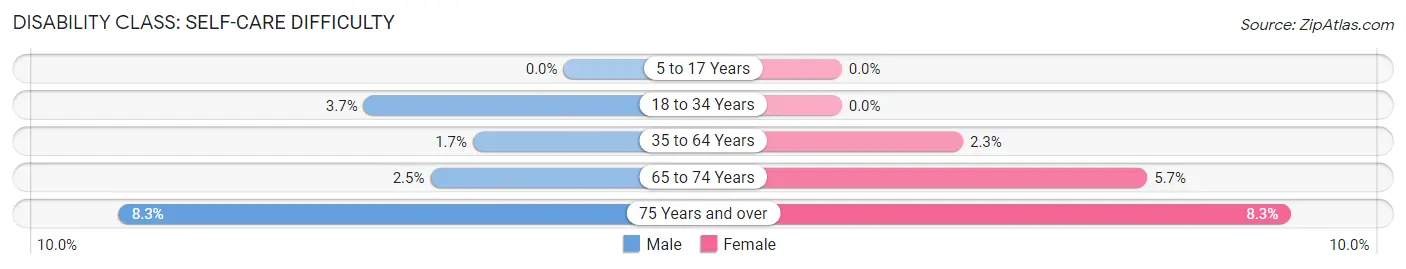
| Age Bracket | Male | Female |
| 5 to 17 Years | 0 (0.0%) | 0 (0.0%) |
| 18 to 34 Years | 30 (3.7%) | 0 (0.0%) |
| 35 to 64 Years | 33 (1.7%) | 48 (2.2%) |
| 65 to 74 Years | 25 (2.5%) | 70 (5.7%) |
| 75 Years and over | 95 (8.3%) | 85 (8.3%) |
Technology Access in Northumberland County
Computing Device Access in Northumberland County
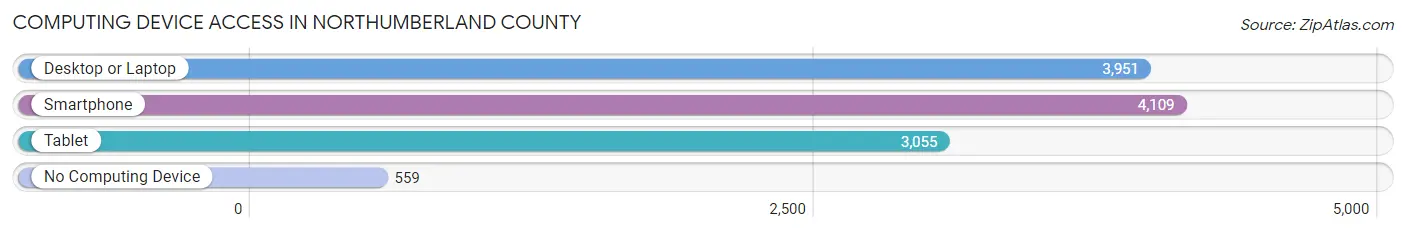
| Device Type | # Households | % Households |
| Desktop or Laptop | 3,951 | 76.4% |
| Smartphone | 4,109 | 79.4% |
| Tablet | 3,055 | 59.1% |
| No Computing Device | 559 | 10.8% |
| Total | 5,174 | 100.0% |
Internet Access in Northumberland County
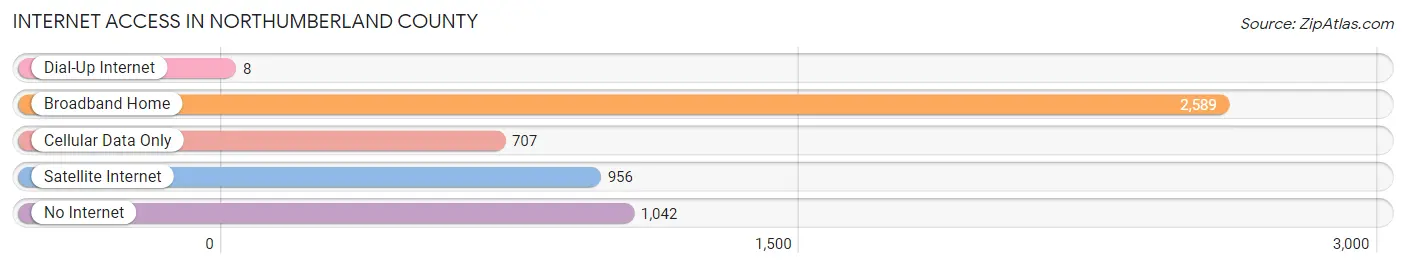
| Internet Type | # Households | % Households |
| Dial-Up Internet | 8 | 0.2% |
| Broadband Home | 2,589 | 50.0% |
| Cellular Data Only | 707 | 13.7% |
| Satellite Internet | 956 | 18.5% |
| No Internet | 1,042 | 20.1% |
| Total | 5,174 | 100.0% |
Northumberland County Summary
Northumberland County, Virginia is located in the Northern Neck region of the Commonwealth of Virginia. It is bordered by the Rappahannock River to the north, the Potomac River to the east, and the Chesapeake Bay to the south. The county seat is Heathsville, and the county is part of the Northern Neck George Washington Birthplace American Viticultural Area.
History
Northumberland County was established in 1648 from the Indian lands of the Northern Neck Proprietary. The county was named for the Duke of Northumberland, who was a major investor in the Virginia Company of London. The county was originally part of Lancaster County, and was later divided into Northumberland and Lancaster counties in 1651.
The county was home to several prominent families, including the Lee, Mason, and Washington families. George Washington was born in the county in 1732, and his family home, Ferry Farm, is located in the county. The county was also home to the first English settlement in the Northern Neck, which was established in 1651.
Geography
Northumberland County is located in the Northern Neck region of Virginia. It is bordered by the Rappahannock River to the north, the Potomac River to the east, and the Chesapeake Bay to the south. The county is mostly rural, with a few small towns and villages. The county seat is Heathsville, and the county is part of the Northern Neck George Washington Birthplace American Viticultural Area.
The county has a total area of 441 square miles, of which 437 square miles is land and 4.2 square miles is water. The county is mostly flat, with some rolling hills in the northern part of the county. The county is home to several state parks, including Belle Isle State Park, Caledon State Park, and Westmoreland State Park.
Economy
Northumberland County has a diverse economy, with a mix of agriculture, manufacturing, and tourism. The county is home to several large agricultural operations, including poultry, beef, and dairy farms. The county is also home to several manufacturing companies, including a paper mill, a furniture factory, and a boat building company.
Tourism is an important part of the county’s economy, with several attractions, including the George Washington Birthplace National Monument, the Northern Neck Artisan Trail, and the Northern Neck Wine Trail. The county is also home to several marinas, which attract visitors from around the region.
Demographics
As of the 2010 census, Northumberland County had a population of 12,330. The population was 53.2% white, 41.2% African American, 0.7% Native American, 0.5% Asian, 0.1% Pacific Islander, 2.2% from other races, and 2.1% from two or more races. Hispanic or Latino of any race were 4.2% of the population.
The median household income in the county was $41,945, and the median family income was $50,945. The per capita income was $20,945. About 17.2% of the population was below the poverty line.
Northumberland County is served by the Northumberland County Public Schools system, which includes four elementary schools, one middle school, and one high school. The county is also home to several private schools, including the Northumberland Christian Academy and the Northumberland Academy of Arts and Sciences.
Common Questions
What is Per Capita Income in Northumberland County?
Per Capita income in Northumberland County is $45,156.
What is the Median Family Income in Northumberland County?
Median Family Income in Northumberland County is $83,470.
What is the Median Household income in Northumberland County?
Median Household Income in Northumberland County is $64,655.
What is Income or Wage Gap in Northumberland County?
Income or Wage Gap in Northumberland County is 17.4%.
Women in Northumberland County earn 82.6 cents for every dollar earned by a man.
What is Family Income Deficit in Northumberland County?
Family Income Deficit in Northumberland County is $12,546.
Families that are below poverty line in Northumberland County earn $12,546 less on average than the poverty threshold level.
What is Inequality or Gini Index in Northumberland County?
Inequality or Gini Index in Northumberland County is 0.51.
What is the Total Population of Northumberland County?
Total Population of Northumberland County is 12,007.
What is the Total Male Population of Northumberland County?
Total Male Population of Northumberland County is 5,555.
What is the Total Female Population of Northumberland County?
Total Female Population of Northumberland County is 6,452.
What is the Ratio of Males per 100 Females in Northumberland County?
There are 86.10 Males per 100 Females in Northumberland County.
What is the Ratio of Females per 100 Males in Northumberland County?
There are 116.15 Females per 100 Males in Northumberland County.
What is the Median Population Age in Northumberland County?
Median Population Age in Northumberland County is 59.0 Years.
What is the Average Family Size in Northumberland County
Average Family Size in Northumberland County is 2.9 People.
What is the Average Household Size in Northumberland County
Average Household Size in Northumberland County is 2.3 People.
How Large is the Labor Force in Northumberland County?
There are 4,579 People in the Labor Forcein in Northumberland County.
What is the Percentage of People in the Labor Force in Northumberland County?
43.2% of People are in the Labor Force in Northumberland County.
What is the Unemployment Rate in Northumberland County?
Unemployment Rate in Northumberland County is 4.9%.