Northampton County, VA Map & Demographics
Northampton County Overview
$37,321
PER CAPITA INCOME
$75,313
AVG FAMILY INCOME
$54,693
AVG HOUSEHOLD INCOME
31.3%
WAGE / INCOME GAP [ % ]
68.7¢/ $1
WAGE / INCOME GAP [ $ ]
$9,591
FAMILY INCOME DEFICIT
0.50
INEQUALITY / GINI INDEX
12,132
TOTAL POPULATION
5,722
MALE POPULATION
6,410
FEMALE POPULATION
89.27
MALES / 100 FEMALES
112.02
FEMALES / 100 MALES
51.3
MEDIAN AGE
2.8
AVG FAMILY SIZE
2.2
AVG HOUSEHOLD SIZE
5,243
LABOR FORCE [ PEOPLE ]
52.0%
PERCENT IN LABOR FORCE
4.8%
UNEMPLOYMENT RATE
Northampton County Area Codes
Income in Northampton County
Income Overview in Northampton County
Per Capita Income in Northampton County is $37,321, while median incomes of families and households are $75,313 and $54,693 respectively.
| Characteristic | Number | Measure |
| Per Capita Income | 12,132 | $37,321 |
| Median Family Income | 3,333 | $75,313 |
| Mean Family Income | 3,333 | $103,795 |
| Median Household Income | 5,344 | $54,693 |
| Mean Household Income | 5,344 | $83,258 |
| Income Deficit | 3,333 | $9,591 |
| Wage / Income Gap (%) | 12,132 | 31.34% |
| Wage / Income Gap ($) | 12,132 | 68.66¢ per $1 |
| Gini / Inequality Index | 12,132 | 0.50 |
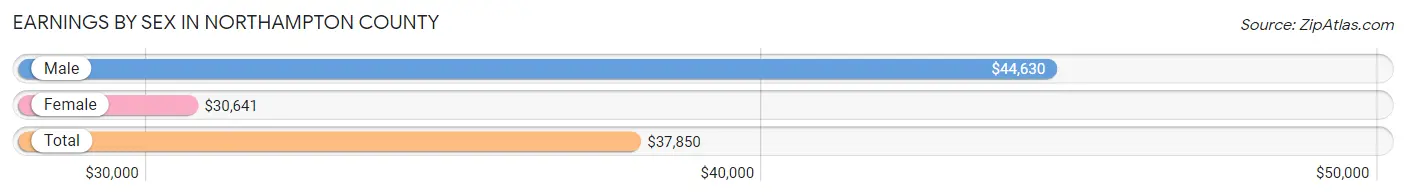
Earnings by Sex in Northampton County
Average Earnings in Northampton County are $37,850, $44,630 for men and $30,641 for women, a difference of 31.3%.
| Sex | Number | Average Earnings |
| Male | 2,673 (48.4%) | $44,630 |
| Female | 2,853 (51.6%) | $30,641 |
| Total | 5,526 (100.0%) | $37,850 |
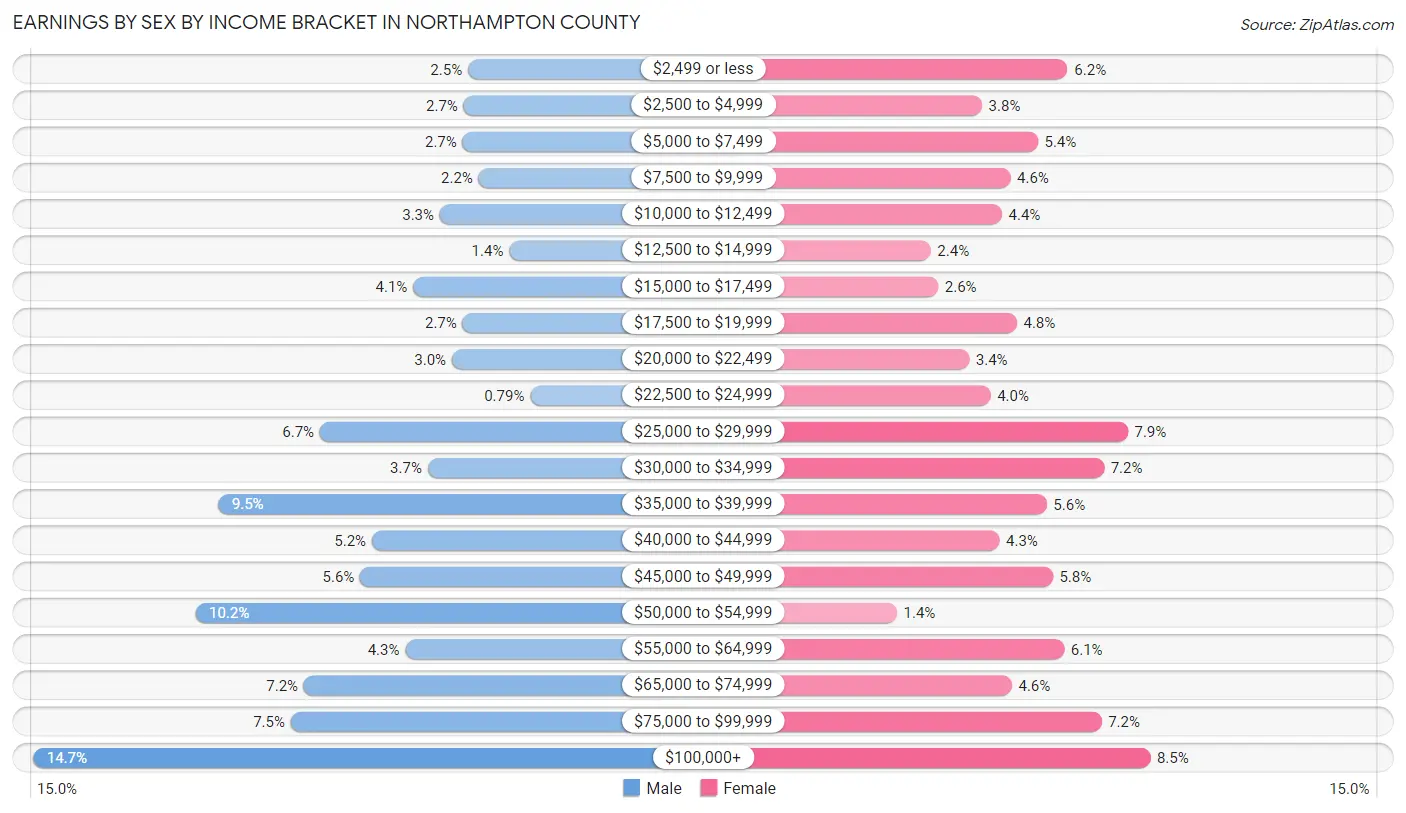
Earnings by Sex by Income Bracket in Northampton County
The most common earnings brackets in Northampton County are $100,000+ for men (394 | 14.7%) and $100,000+ for women (243 | 8.5%).
| Income | Male | Female |
| $2,499 or less | 68 (2.5%) | 177 (6.2%) |
| $2,500 to $4,999 | 71 (2.7%) | 108 (3.8%) |
| $5,000 to $7,499 | 72 (2.7%) | 153 (5.4%) |
| $7,500 to $9,999 | 60 (2.2%) | 131 (4.6%) |
| $10,000 to $12,499 | 89 (3.3%) | 124 (4.3%) |
| $12,500 to $14,999 | 37 (1.4%) | 67 (2.4%) |
| $15,000 to $17,499 | 109 (4.1%) | 73 (2.6%) |
| $17,500 to $19,999 | 72 (2.7%) | 136 (4.8%) |
| $20,000 to $22,499 | 80 (3.0%) | 98 (3.4%) |
| $22,500 to $24,999 | 21 (0.8%) | 115 (4.0%) |
| $25,000 to $29,999 | 179 (6.7%) | 225 (7.9%) |
| $30,000 to $34,999 | 98 (3.7%) | 206 (7.2%) |
| $35,000 to $39,999 | 255 (9.5%) | 160 (5.6%) |
| $40,000 to $44,999 | 140 (5.2%) | 122 (4.3%) |
| $45,000 to $49,999 | 149 (5.6%) | 165 (5.8%) |
| $50,000 to $54,999 | 272 (10.2%) | 40 (1.4%) |
| $55,000 to $64,999 | 115 (4.3%) | 174 (6.1%) |
| $65,000 to $74,999 | 191 (7.1%) | 132 (4.6%) |
| $75,000 to $99,999 | 201 (7.5%) | 204 (7.1%) |
| $100,000+ | 394 (14.7%) | 243 (8.5%) |
| Total | 2,673 (100.0%) | 2,853 (100.0%) |
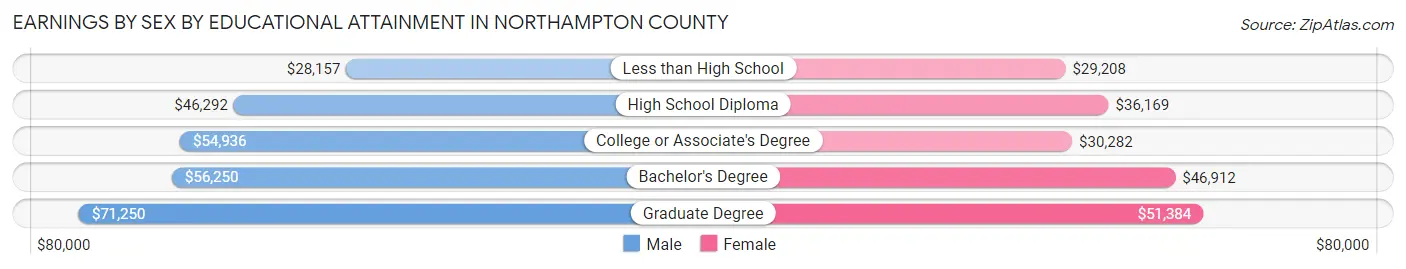
Earnings by Sex by Educational Attainment in Northampton County
Average earnings in Northampton County are $48,965 for men and $34,889 for women, a difference of 28.7%. Men with an educational attainment of graduate degree enjoy the highest average annual earnings of $71,250, while those with less than high school education earn the least with $28,157. Women with an educational attainment of graduate degree earn the most with the average annual earnings of $51,384, while those with less than high school education have the smallest earnings of $29,208.
| Educational Attainment | Male Income | Female Income |
| Less than High School | $28,157 | $29,208 |
| High School Diploma | $46,292 | $36,169 |
| College or Associate's Degree | $54,936 | $30,282 |
| Bachelor's Degree | $56,250 | $46,912 |
| Graduate Degree | $71,250 | $51,384 |
| Total | $48,965 | $34,889 |
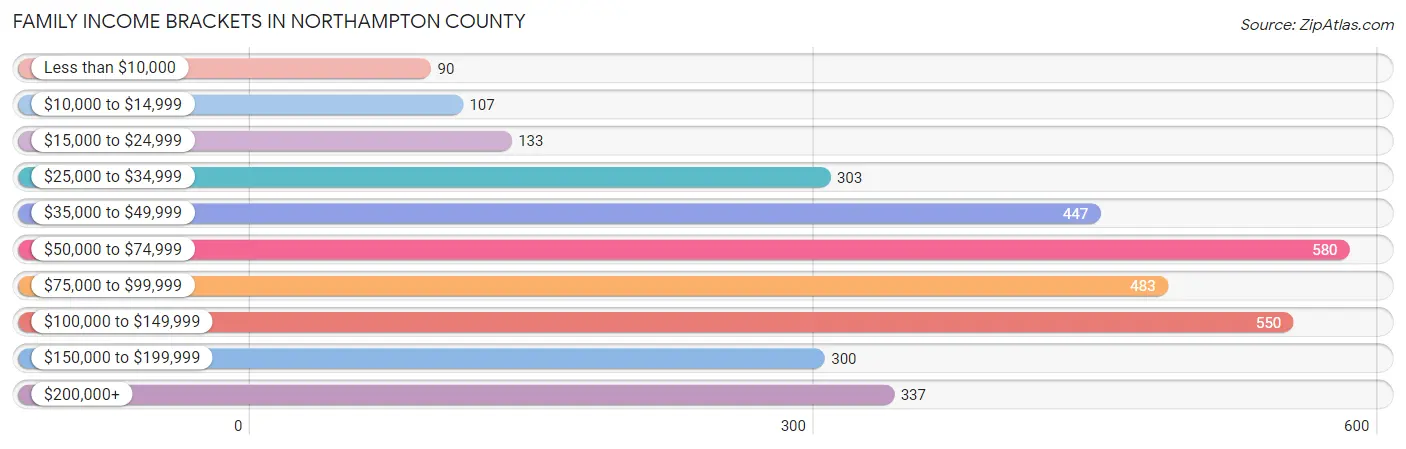
Family Income in Northampton County
Family Income Brackets in Northampton County
According to the Northampton County family income data, there are 580 families falling into the $50,000 to $74,999 income range, which is the most common income bracket and makes up 17.4% of all families. Conversely, the less than $10,000 income bracket is the least frequent group with only 90 families (2.7%) belonging to this category.
| Income Bracket | # Families | % Families |
| Less than $10,000 | 90 | 2.7% |
| $10,000 to $14,999 | 107 | 3.2% |
| $15,000 to $24,999 | 133 | 4.0% |
| $25,000 to $34,999 | 303 | 9.1% |
| $35,000 to $49,999 | 447 | 13.4% |
| $50,000 to $74,999 | 580 | 17.4% |
| $75,000 to $99,999 | 483 | 14.5% |
| $100,000 to $149,999 | 550 | 16.5% |
| $150,000 to $199,999 | 300 | 9.0% |
| $200,000+ | 337 | 10.1% |
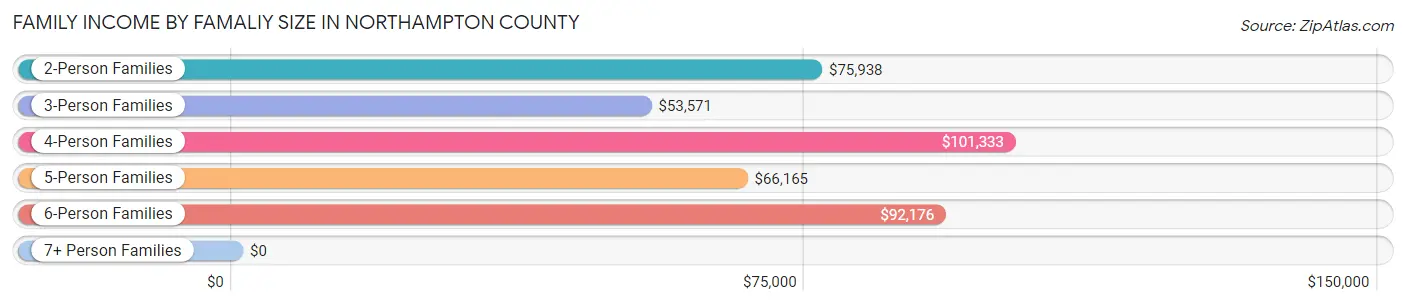
Family Income by Famaliy Size in Northampton County
4-person families (426 | 12.8%) account for the highest median family income in Northampton County with $101,333 per family, while 2-person families (1,986 | 59.6%) have the highest median income of $37,969 per family member.
| Income Bracket | # Families | Median Income |
| 2-Person Families | 1,986 (59.6%) | $75,938 |
| 3-Person Families | 662 (19.9%) | $53,571 |
| 4-Person Families | 426 (12.8%) | $101,333 |
| 5-Person Families | 131 (3.9%) | $66,165 |
| 6-Person Families | 103 (3.1%) | $92,176 |
| 7+ Person Families | 25 (0.7%) | $0 |
| Total | 3,333 (100.0%) | $75,313 |
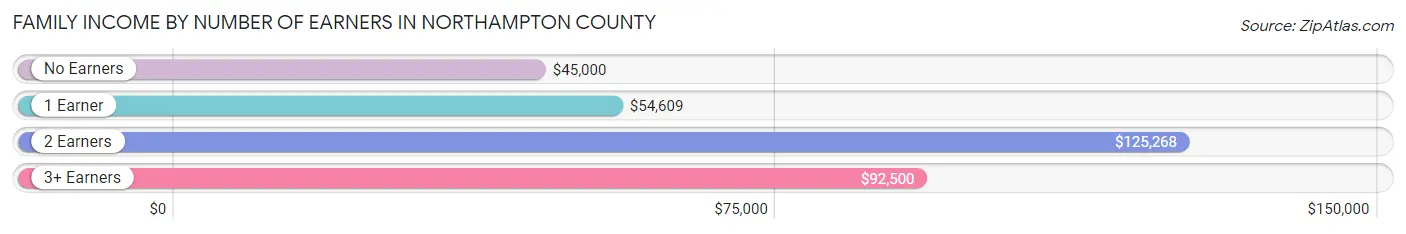
Family Income by Number of Earners in Northampton County
The median family income in Northampton County is $75,313, with families comprising 2 earners (1,068) having the highest median family income of $125,268, while families with no earners (806) have the lowest median family income of $45,000, accounting for 32.0% and 24.2% of families, respectively.
| Number of Earners | # Families | Median Income |
| No Earners | 806 (24.2%) | $45,000 |
| 1 Earner | 1,175 (35.2%) | $54,609 |
| 2 Earners | 1,068 (32.0%) | $125,268 |
| 3+ Earners | 284 (8.5%) | $92,500 |
| Total | 3,333 (100.0%) | $75,313 |
Household Income in Northampton County
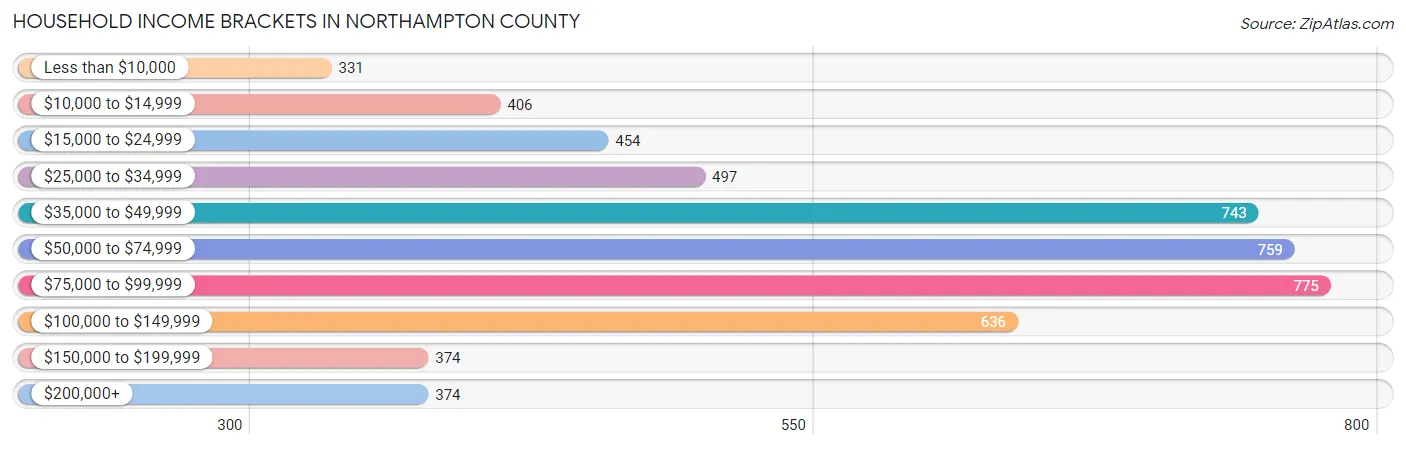
Household Income Brackets in Northampton County
With 775 households falling in the category, the $75,000 to $99,999 income range is the most frequent in Northampton County, accounting for 14.5% of all households. In contrast, only 331 households (6.2%) fall into the less than $10,000 income bracket, making it the least populous group.
| Income Bracket | # Households | % Households |
| Less than $10,000 | 331 | 6.2% |
| $10,000 to $14,999 | 406 | 7.6% |
| $15,000 to $24,999 | 454 | 8.5% |
| $25,000 to $34,999 | 497 | 9.3% |
| $35,000 to $49,999 | 743 | 13.9% |
| $50,000 to $74,999 | 759 | 14.2% |
| $75,000 to $99,999 | 775 | 14.5% |
| $100,000 to $149,999 | 636 | 11.9% |
| $150,000 to $199,999 | 374 | 7.0% |
| $200,000+ | 374 | 7.0% |
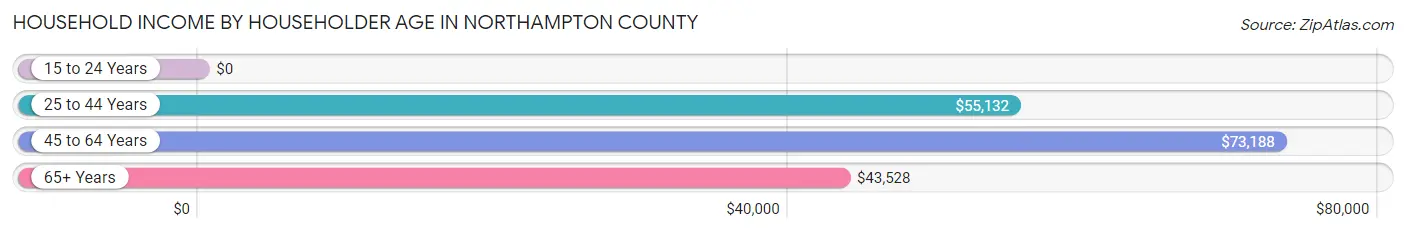
Household Income by Householder Age in Northampton County
The median household income in Northampton County is $54,693, with the highest median household income of $73,188 found in the 45 to 64 years age bracket for the primary householder. A total of 2,035 households (38.1%) fall into this category. Meanwhile, the 15 to 24 years age bracket for the primary householder has the lowest median household income of $0, with 115 households (2.1%) in this group.
| Income Bracket | # Households | Median Income |
| 15 to 24 Years | 115 (2.1%) | $0 |
| 25 to 44 Years | 1,074 (20.1%) | $55,132 |
| 45 to 64 Years | 2,035 (38.1%) | $73,188 |
| 65+ Years | 2,120 (39.7%) | $43,528 |
| Total | 5,344 (100.0%) | $54,693 |
Poverty in Northampton County
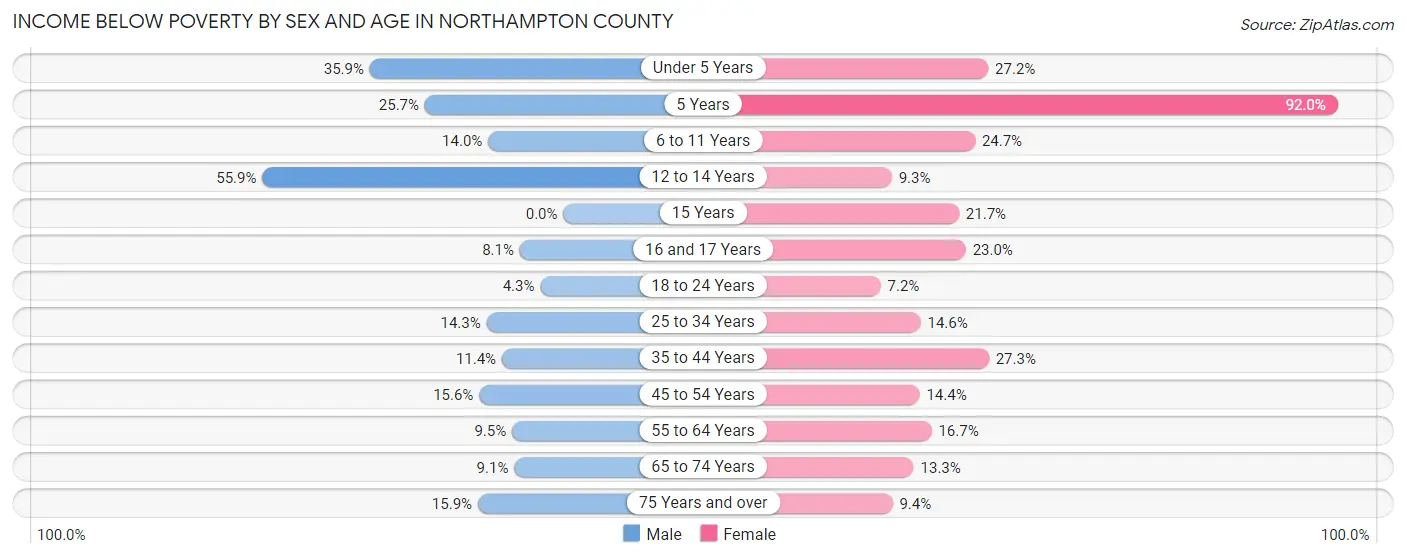
Income Below Poverty by Sex and Age in Northampton County
With 16.0% poverty level for males and 17.4% for females among the residents of Northampton County, 12 to 14 year old males and 5 year old females are the most vulnerable to poverty, with 209 males (55.9%) and 104 females (92.0%) in their respective age groups living below the poverty level.
| Age Bracket | Male | Female |
| Under 5 Years | 97 (35.9%) | 72 (27.2%) |
| 5 Years | 18 (25.7%) | 104 (92.0%) |
| 6 to 11 Years | 37 (14.0%) | 86 (24.7%) |
| 12 to 14 Years | 209 (55.9%) | 14 (9.3%) |
| 15 Years | 0 (0.0%) | 20 (21.7%) |
| 16 and 17 Years | 14 (8.1%) | 23 (23.0%) |
| 18 to 24 Years | 11 (4.3%) | 31 (7.2%) |
| 25 to 34 Years | 90 (14.3%) | 77 (14.6%) |
| 35 to 44 Years | 61 (11.4%) | 162 (27.3%) |
| 45 to 54 Years | 104 (15.6%) | 92 (14.4%) |
| 55 to 64 Years | 82 (9.5%) | 201 (16.7%) |
| 65 to 74 Years | 80 (9.1%) | 135 (13.3%) |
| 75 Years and over | 89 (15.9%) | 74 (9.4%) |
| Total | 892 (16.0%) | 1,091 (17.4%) |
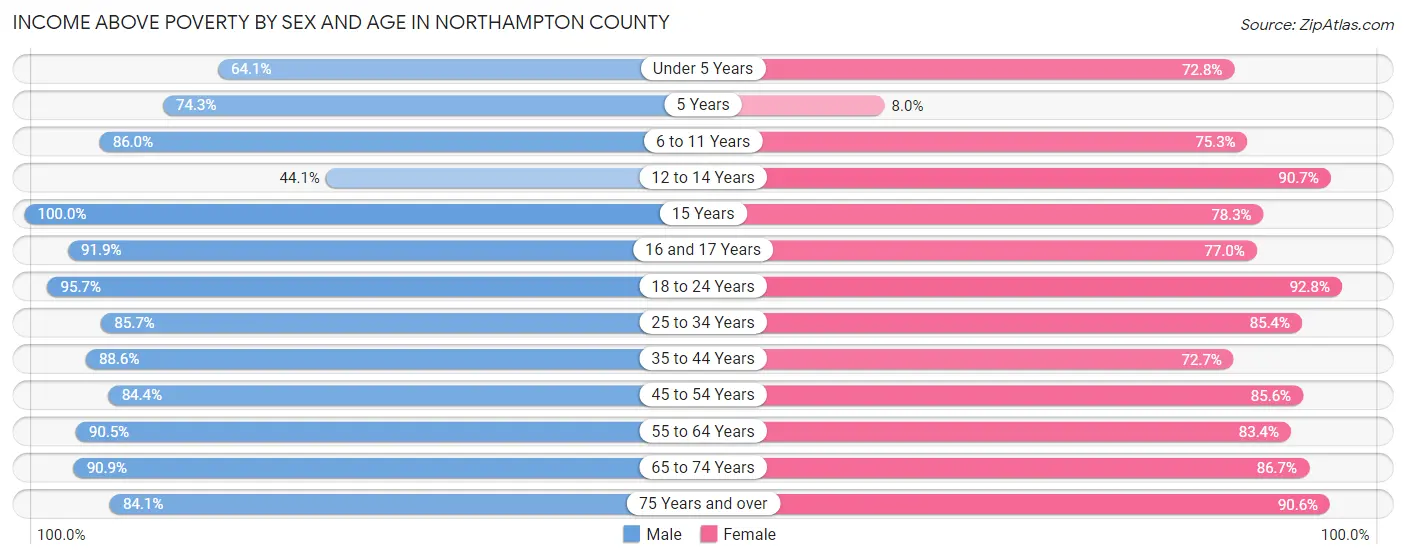
Income Above Poverty by Sex and Age in Northampton County
According to the poverty statistics in Northampton County, males aged 15 years and females aged 18 to 24 years are the age groups that are most secure financially, with 100.0% of males and 92.8% of females in these age groups living above the poverty line.
| Age Bracket | Male | Female |
| Under 5 Years | 173 (64.1%) | 193 (72.8%) |
| 5 Years | 52 (74.3%) | 9 (8.0%) |
| 6 to 11 Years | 228 (86.0%) | 262 (75.3%) |
| 12 to 14 Years | 165 (44.1%) | 137 (90.7%) |
| 15 Years | 41 (100.0%) | 72 (78.3%) |
| 16 and 17 Years | 159 (91.9%) | 77 (77.0%) |
| 18 to 24 Years | 246 (95.7%) | 399 (92.8%) |
| 25 to 34 Years | 541 (85.7%) | 450 (85.4%) |
| 35 to 44 Years | 474 (88.6%) | 432 (72.7%) |
| 45 to 54 Years | 562 (84.4%) | 546 (85.6%) |
| 55 to 64 Years | 778 (90.5%) | 1,006 (83.4%) |
| 65 to 74 Years | 797 (90.9%) | 878 (86.7%) |
| 75 Years and over | 472 (84.1%) | 713 (90.6%) |
| Total | 4,688 (84.0%) | 5,174 (82.6%) |
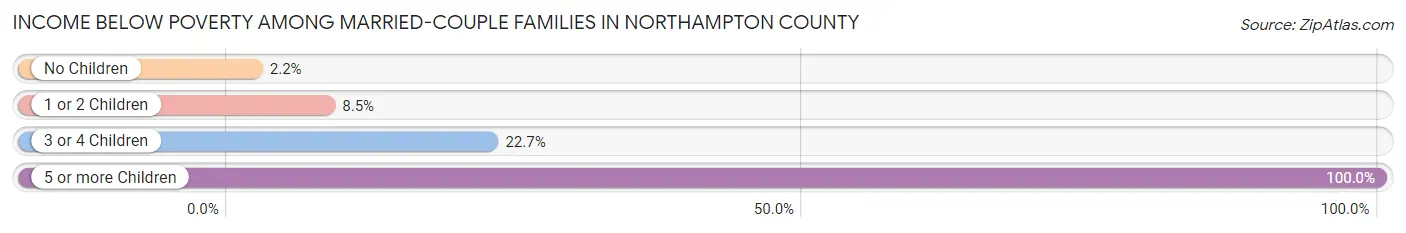
Income Below Poverty Among Married-Couple Families in Northampton County
The poverty statistics for married-couple families in Northampton County show that 5.3% or 126 of the total 2,362 families live below the poverty line. Families with 5 or more children have the highest poverty rate of 100.0%, comprising of 14 families. On the other hand, families with no children have the lowest poverty rate of 2.2%, which includes 37 families.
| Children | Above Poverty | Below Poverty |
| No Children | 1,677 (97.8%) | 37 (2.2%) |
| 1 or 2 Children | 443 (91.5%) | 41 (8.5%) |
| 3 or 4 Children | 116 (77.3%) | 34 (22.7%) |
| 5 or more Children | 0 (0.0%) | 14 (100.0%) |
| Total | 2,236 (94.7%) | 126 (5.3%) |
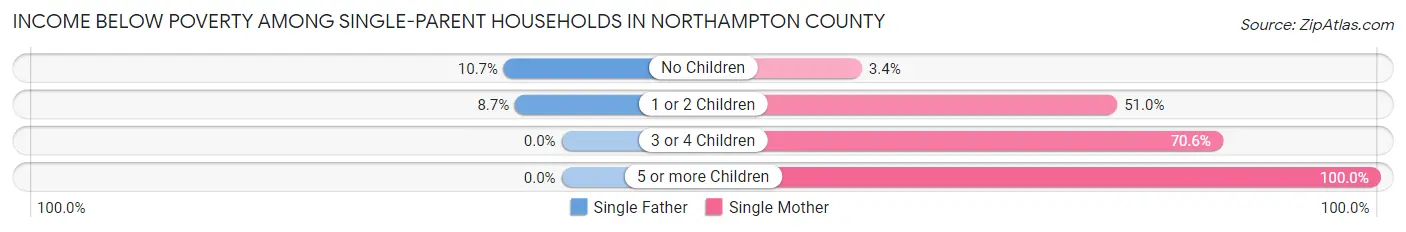
Income Below Poverty Among Single-Parent Households in Northampton County
According to the poverty data in Northampton County, 10.0% or 31 single-father households and 28.8% or 191 single-mother households are living below the poverty line. Among single-father households, those with no children have the highest poverty rate, with 22 households (10.7%) experiencing poverty. Likewise, among single-mother households, those with 5 or more children have the highest poverty rate, with 9 households (100.0%) falling below the poverty line.
| Children | Single Father | Single Mother |
| No Children | 22 (10.7%) | 11 (3.4%) |
| 1 or 2 Children | 9 (8.6%) | 159 (51.0%) |
| 3 or 4 Children | 0 (0.0%) | 12 (70.6%) |
| 5 or more Children | 0 (0.0%) | 9 (100.0%) |
| Total | 31 (10.0%) | 191 (28.8%) |
Income Below Poverty Among Married-Couple vs Single-Parent Households in Northampton County
The poverty data for Northampton County shows that 126 of the married-couple family households (5.3%) and 222 of the single-parent households (22.9%) are living below the poverty level. Within the married-couple family households, those with 5 or more children have the highest poverty rate, with 14 households (100.0%) falling below the poverty line. Among the single-parent households, those with 5 or more children have the highest poverty rate, with 9 household (100.0%) living below poverty.
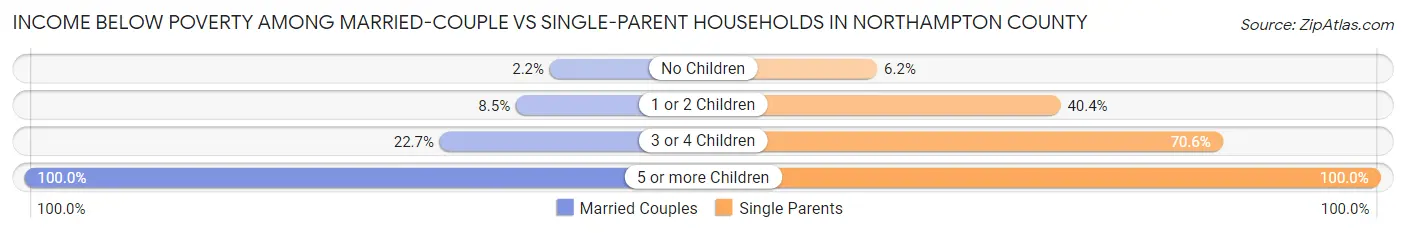
| Children | Married-Couple Families | Single-Parent Households |
| No Children | 37 (2.2%) | 33 (6.2%) |
| 1 or 2 Children | 41 (8.5%) | 168 (40.4%) |
| 3 or 4 Children | 34 (22.7%) | 12 (70.6%) |
| 5 or more Children | 14 (100.0%) | 9 (100.0%) |
| Total | 126 (5.3%) | 222 (22.9%) |
Race in Northampton County
The most populous races in Northampton County are White / Caucasian (7,078 | 58.3%), Black / African American (3,843 | 31.7%), and Hispanic or Latino (1,146 | 9.5%).
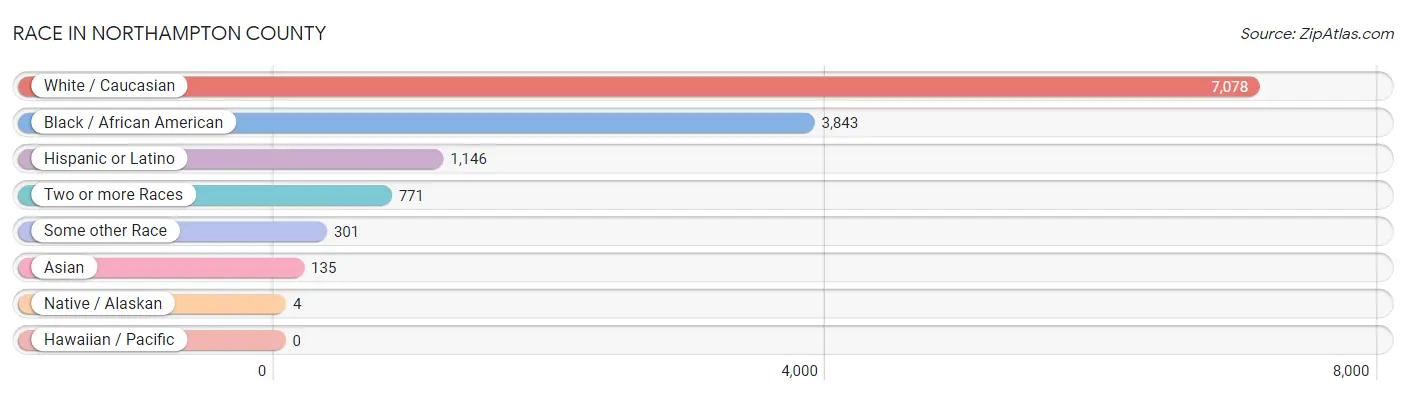
| Race | # Population | % Population |
| Asian | 135 | 1.1% |
| Black / African American | 3,843 | 31.7% |
| Hawaiian / Pacific | 0 | 0.0% |
| Hispanic or Latino | 1,146 | 9.5% |
| Native / Alaskan | 4 | 0.0% |
| White / Caucasian | 7,078 | 58.3% |
| Two or more Races | 771 | 6.4% |
| Some other Race | 301 | 2.5% |
| Total | 12,132 | 100.0% |
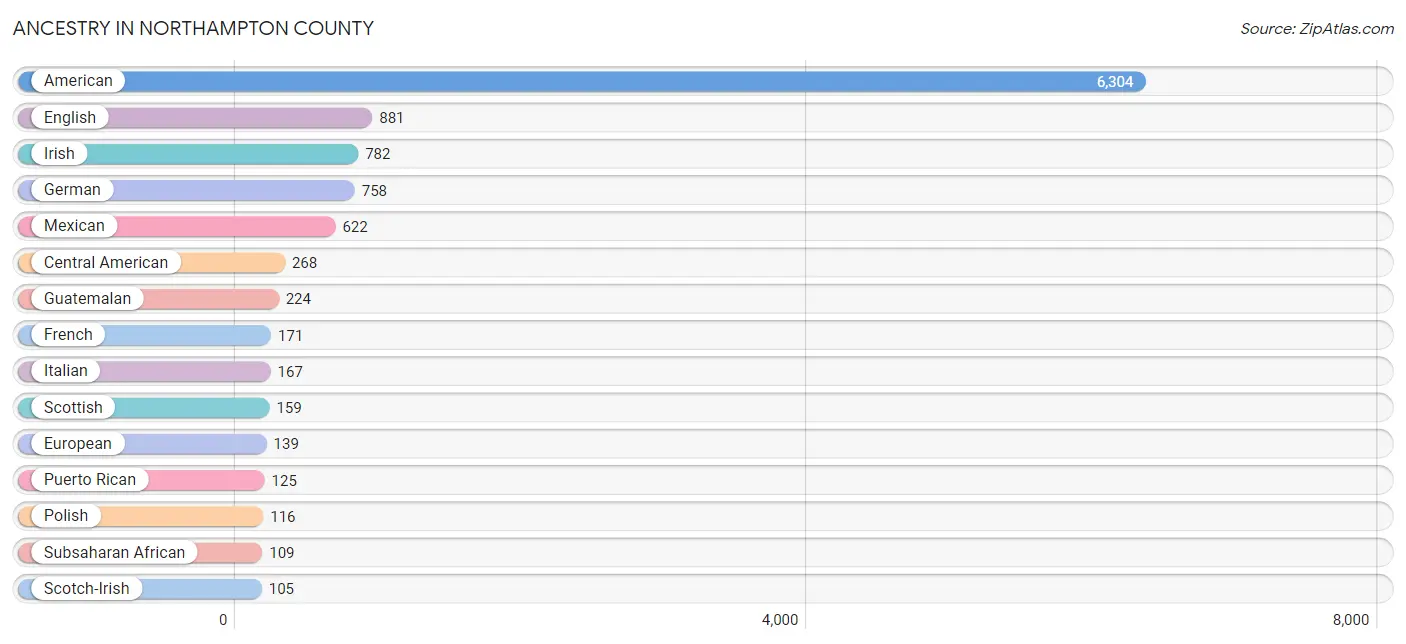
Ancestry in Northampton County
The most populous ancestries reported in Northampton County are American (6,304 | 52.0%), English (881 | 7.3%), Irish (782 | 6.5%), German (758 | 6.2%), and Mexican (622 | 5.1%), together accounting for 77.0% of all Northampton County residents.
| Ancestry | # Population | % Population |
| African | 89 | 0.7% |
| American | 6,304 | 52.0% |
| Arab | 2 | 0.0% |
| Armenian | 14 | 0.1% |
| Australian | 3 | 0.0% |
| Austrian | 14 | 0.1% |
| Bhutanese | 1 | 0.0% |
| British | 44 | 0.4% |
| Bulgarian | 1 | 0.0% |
| Burmese | 8 | 0.1% |
| Canadian | 12 | 0.1% |
| Central American | 268 | 2.2% |
| Cherokee | 49 | 0.4% |
| Chilean | 11 | 0.1% |
| Cuban | 63 | 0.5% |
| Czech | 11 | 0.1% |
| Czechoslovakian | 4 | 0.0% |
| Danish | 3 | 0.0% |
| Dominican | 13 | 0.1% |
| Dutch | 54 | 0.4% |
| Eastern European | 10 | 0.1% |
| English | 881 | 7.3% |
| European | 139 | 1.1% |
| Finnish | 6 | 0.1% |
| French | 171 | 1.4% |
| French American Indian | 1 | 0.0% |
| French Canadian | 11 | 0.1% |
| German | 758 | 6.2% |
| Greek | 45 | 0.4% |
| Guatemalan | 224 | 1.8% |
| Haitian | 8 | 0.1% |
| Honduran | 44 | 0.4% |
| Hungarian | 7 | 0.1% |
| Indian (Asian) | 10 | 0.1% |
| Iranian | 2 | 0.0% |
| Irish | 782 | 6.5% |
| Iroquois | 1 | 0.0% |
| Italian | 167 | 1.4% |
| Jamaican | 5 | 0.0% |
| Japanese | 53 | 0.4% |
| Korean | 40 | 0.3% |
| Laotian | 1 | 0.0% |
| Lebanese | 2 | 0.0% |
| Lithuanian | 14 | 0.1% |
| Mexican | 622 | 5.1% |
| Native Hawaiian | 5 | 0.0% |
| Northern European | 15 | 0.1% |
| Norwegian | 14 | 0.1% |
| Pennsylvania German | 25 | 0.2% |
| Polish | 116 | 1.0% |
| Portuguese | 7 | 0.1% |
| Puerto Rican | 125 | 1.0% |
| Russian | 57 | 0.5% |
| Scandinavian | 2 | 0.0% |
| Scotch-Irish | 105 | 0.9% |
| Scottish | 159 | 1.3% |
| Serbian | 1 | 0.0% |
| Slovene | 2 | 0.0% |
| South African | 20 | 0.2% |
| South American | 11 | 0.1% |
| Spaniard | 24 | 0.2% |
| Subsaharan African | 109 | 0.9% |
| Swedish | 35 | 0.3% |
| Swiss | 10 | 0.1% |
| Thai | 65 | 0.5% |
| Trinidadian and Tobagonian | 14 | 0.1% |
| Turkish | 28 | 0.2% |
| Ukrainian | 6 | 0.1% |
| Welsh | 46 | 0.4% | View All 69 Rows |
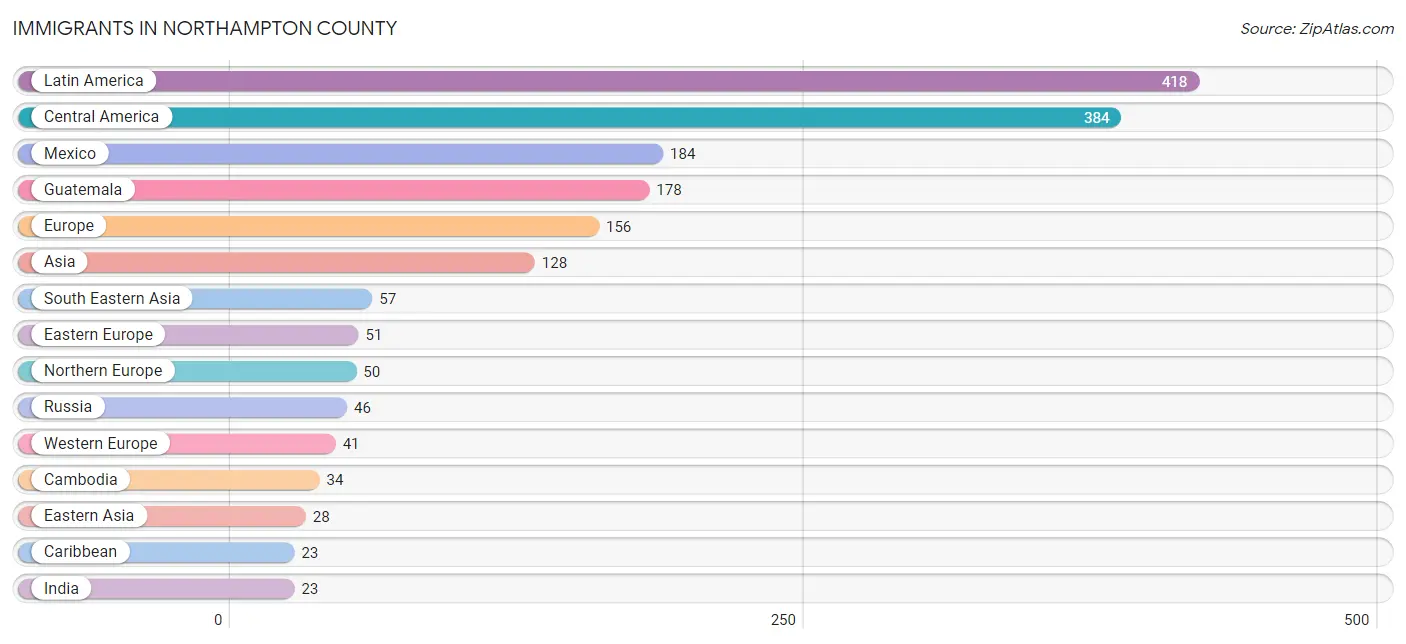
Immigrants in Northampton County
The most numerous immigrant groups reported in Northampton County came from Latin America (418 | 3.5%), Central America (384 | 3.2%), Mexico (184 | 1.5%), Guatemala (178 | 1.5%), and Europe (156 | 1.3%), together accounting for 10.9% of all Northampton County residents.
| Immigration Origin | # Population | % Population |
| Africa | 9 | 0.1% |
| Asia | 128 | 1.1% |
| Australia | 4 | 0.0% |
| Cambodia | 34 | 0.3% |
| Canada | 6 | 0.1% |
| Caribbean | 23 | 0.2% |
| Central America | 384 | 3.2% |
| Chile | 11 | 0.1% |
| China | 21 | 0.2% |
| Cuba | 5 | 0.0% |
| Dominican Republic | 5 | 0.0% |
| Eastern Asia | 28 | 0.2% |
| Eastern Europe | 51 | 0.4% |
| Egypt | 2 | 0.0% |
| England | 14 | 0.1% |
| Europe | 156 | 1.3% |
| France | 2 | 0.0% |
| Germany | 10 | 0.1% |
| Guatemala | 178 | 1.5% |
| Haiti | 8 | 0.1% |
| Honduras | 22 | 0.2% |
| Hong Kong | 19 | 0.2% |
| India | 23 | 0.2% |
| Ireland | 14 | 0.1% |
| Italy | 14 | 0.1% |
| Jamaica | 5 | 0.0% |
| Japan | 1 | 0.0% |
| Korea | 6 | 0.1% |
| Latin America | 418 | 3.5% |
| Lithuania | 2 | 0.0% |
| Mexico | 184 | 1.5% |
| Netherlands | 8 | 0.1% |
| Northern Africa | 2 | 0.0% |
| Northern Europe | 50 | 0.4% |
| Oceania | 4 | 0.0% |
| Philippines | 23 | 0.2% |
| Poland | 3 | 0.0% |
| Russia | 46 | 0.4% |
| South Africa | 7 | 0.1% |
| South America | 11 | 0.1% |
| South Central Asia | 23 | 0.2% |
| South Eastern Asia | 57 | 0.5% |
| Southern Europe | 14 | 0.1% |
| Turkey | 14 | 0.1% |
| Western Asia | 20 | 0.2% |
| Western Europe | 41 | 0.3% | View All 46 Rows |
Sex and Age in Northampton County
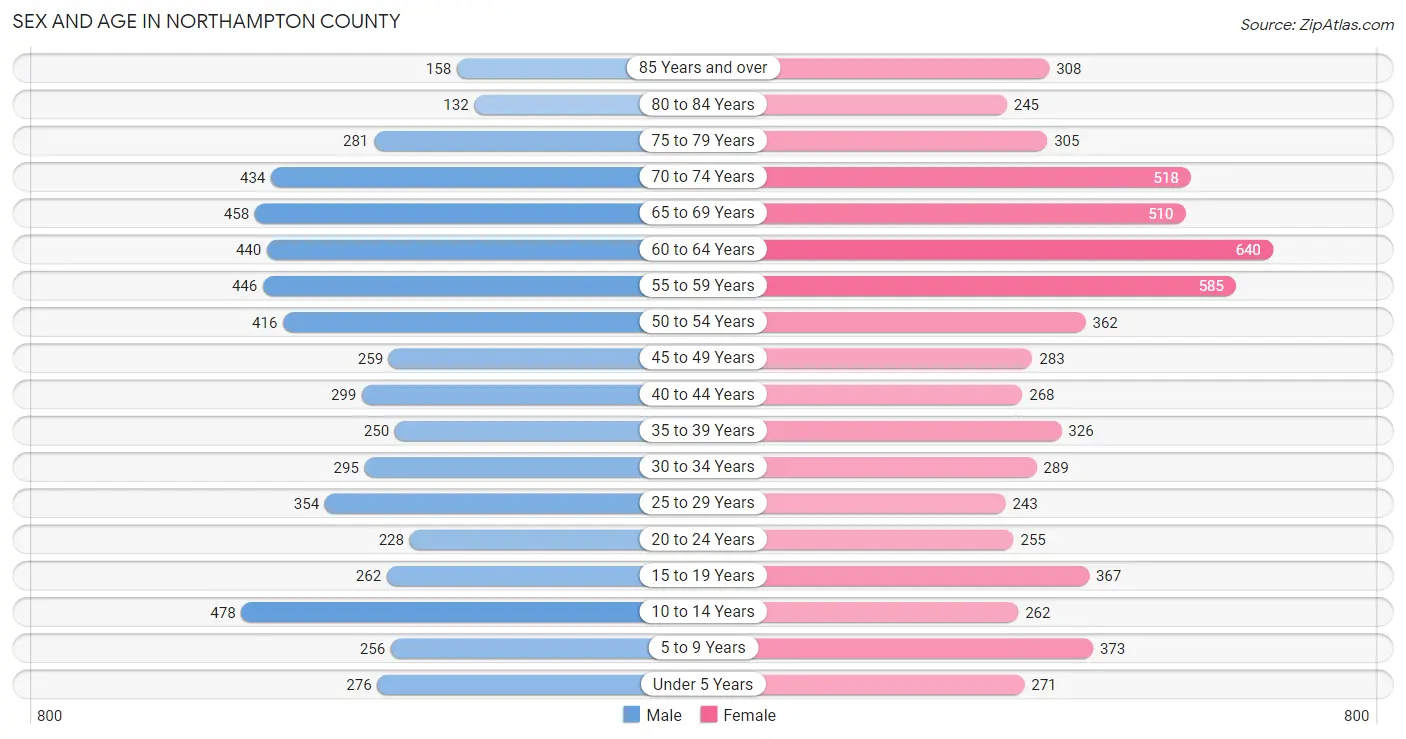
Sex and Age in Northampton County
The most populous age groups in Northampton County are 10 to 14 Years (478 | 8.4%) for men and 60 to 64 Years (640 | 10.0%) for women.
| Age Bracket | Male | Female |
| Under 5 Years | 276 (4.8%) | 271 (4.2%) |
| 5 to 9 Years | 256 (4.5%) | 373 (5.8%) |
| 10 to 14 Years | 478 (8.4%) | 262 (4.1%) |
| 15 to 19 Years | 262 (4.6%) | 367 (5.7%) |
| 20 to 24 Years | 228 (4.0%) | 255 (4.0%) |
| 25 to 29 Years | 354 (6.2%) | 243 (3.8%) |
| 30 to 34 Years | 295 (5.2%) | 289 (4.5%) |
| 35 to 39 Years | 250 (4.4%) | 326 (5.1%) |
| 40 to 44 Years | 299 (5.2%) | 268 (4.2%) |
| 45 to 49 Years | 259 (4.5%) | 283 (4.4%) |
| 50 to 54 Years | 416 (7.3%) | 362 (5.7%) |
| 55 to 59 Years | 446 (7.8%) | 585 (9.1%) |
| 60 to 64 Years | 440 (7.7%) | 640 (10.0%) |
| 65 to 69 Years | 458 (8.0%) | 510 (8.0%) |
| 70 to 74 Years | 434 (7.6%) | 518 (8.1%) |
| 75 to 79 Years | 281 (4.9%) | 305 (4.8%) |
| 80 to 84 Years | 132 (2.3%) | 245 (3.8%) |
| 85 Years and over | 158 (2.8%) | 308 (4.8%) |
| Total | 5,722 (100.0%) | 6,410 (100.0%) |
Families and Households in Northampton County
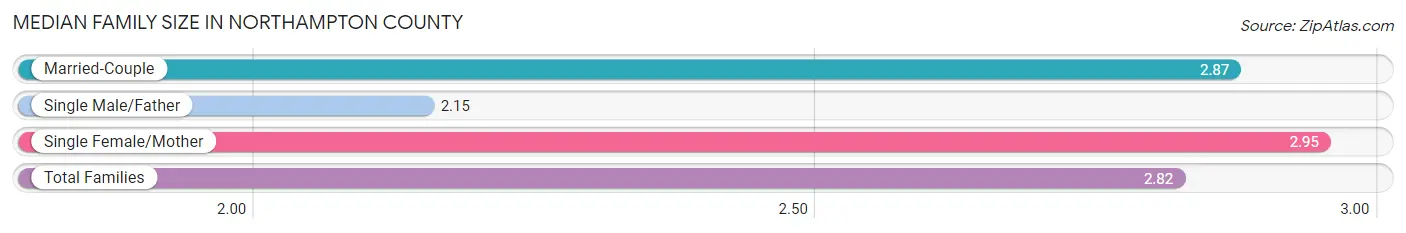
Median Family Size in Northampton County
The median family size in Northampton County is 2.82 persons per family, with single female/mother families (662 | 19.9%) accounting for the largest median family size of 2.95 persons per family. On the other hand, single male/father families (309 | 9.3%) represent the smallest median family size with 2.15 persons per family.
| Family Type | # Families | Family Size |
| Married-Couple | 2,362 (70.9%) | 2.87 |
| Single Male/Father | 309 (9.3%) | 2.15 |
| Single Female/Mother | 662 (19.9%) | 2.95 |
| Total Families | 3,333 (100.0%) | 2.82 |
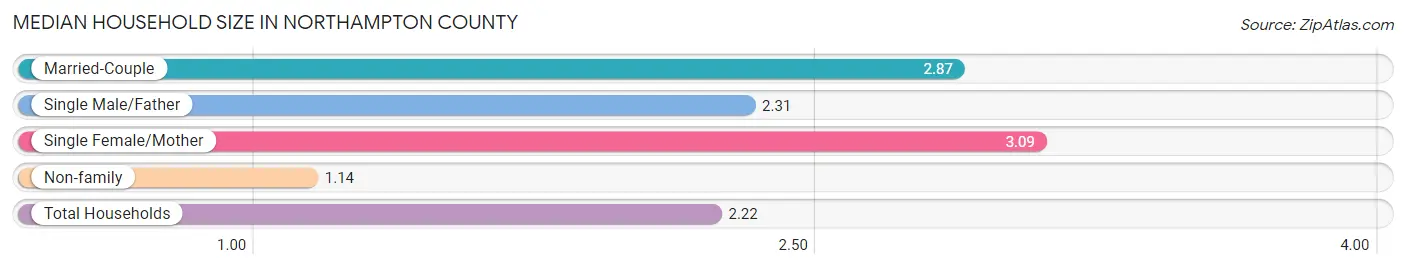
Median Household Size in Northampton County
The median household size in Northampton County is 2.22 persons per household, with single female/mother households (662 | 12.4%) accounting for the largest median household size of 3.09 persons per household. non-family households (2,011 | 37.6%) represent the smallest median household size with 1.14 persons per household.
| Household Type | # Households | Household Size |
| Married-Couple | 2,362 (44.2%) | 2.87 |
| Single Male/Father | 309 (5.8%) | 2.31 |
| Single Female/Mother | 662 (12.4%) | 3.09 |
| Non-family | 2,011 (37.6%) | 1.14 |
| Total Households | 5,344 (100.0%) | 2.22 |
Household Size by Marriage Status in Northampton County
Out of a total of 5,344 households in Northampton County, 3,333 (62.4%) are family households, while 2,011 (37.6%) are nonfamily households. The most numerous type of family households are 2-person households, comprising 1,961, and the most common type of nonfamily households are 1-person households, comprising 1,796.

| Household Size | Family Households | Nonfamily Households |
| 1-Person Households | - | 1,796 (33.6%) |
| 2-Person Households | 1,961 (36.7%) | 193 (3.6%) |
| 3-Person Households | 618 (11.6%) | 22 (0.4%) |
| 4-Person Households | 407 (7.6%) | 0 (0.0%) |
| 5-Person Households | 211 (4.0%) | 0 (0.0%) |
| 6-Person Households | 78 (1.5%) | 0 (0.0%) |
| 7+ Person Households | 58 (1.1%) | 0 (0.0%) |
| Total | 3,333 (62.4%) | 2,011 (37.6%) |
Female Fertility in Northampton County
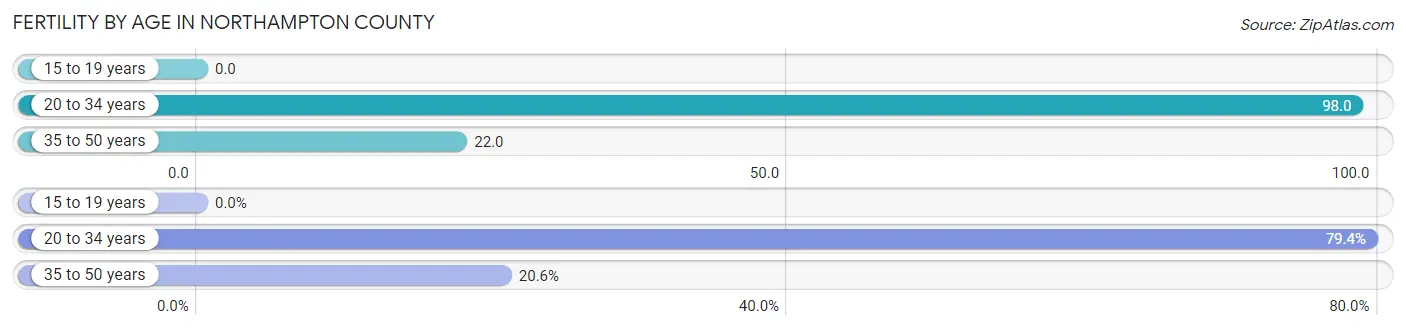
Fertility by Age in Northampton County
Average fertility rate in Northampton County is 47.0 births per 1,000 women. Women in the age bracket of 20 to 34 years have the highest fertility rate with 98.0 births per 1,000 women. Women in the age bracket of 20 to 34 years acount for 79.4% of all women with births.
| Age Bracket | Women with Births | Births / 1,000 Women |
| 15 to 19 years | 0 (0.0%) | 0.0 |
| 20 to 34 years | 77 (79.4%) | 98.0 |
| 35 to 50 years | 20 (20.6%) | 22.0 |
| Total | 97 (100.0%) | 47.0 |
Fertility by Age by Marriage Status in Northampton County
59.8% of women with births (97) in Northampton County are married. The highest percentage of unmarried women with births falls into 20 to 34 years age bracket with 40.3% of them unmarried at the time of birth, while the lowest percentage of unmarried women with births belong to 35 to 50 years age bracket with 40.0% of them unmarried.
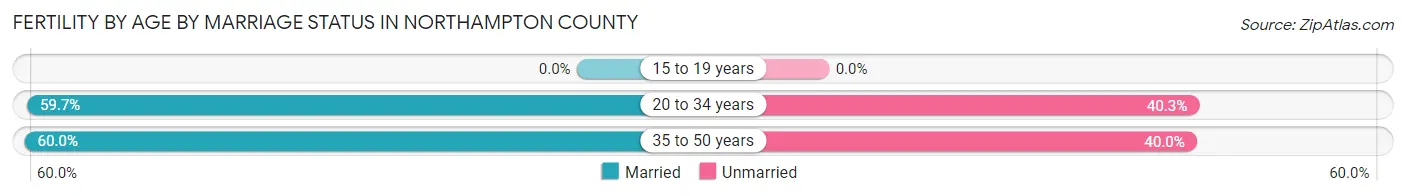
| Age Bracket | Married | Unmarried |
| 15 to 19 years | 0 (0.0%) | 0 (0.0%) |
| 20 to 34 years | 46 (59.7%) | 31 (40.3%) |
| 35 to 50 years | 12 (60.0%) | 8 (40.0%) |
| Total | 58 (59.8%) | 39 (40.2%) |
Fertility by Education in Northampton County
Average fertility rate in Northampton County is 47.0 births per 1,000 women. Women with the education attainment of high school diploma have the highest fertility rate of 69.0 births per 1,000 women, while women with the education attainment of less than high school have the lowest fertility at 17.0 births per 1,000 women. Women with the education attainment of high school diploma represent 38.1% of all women with births.
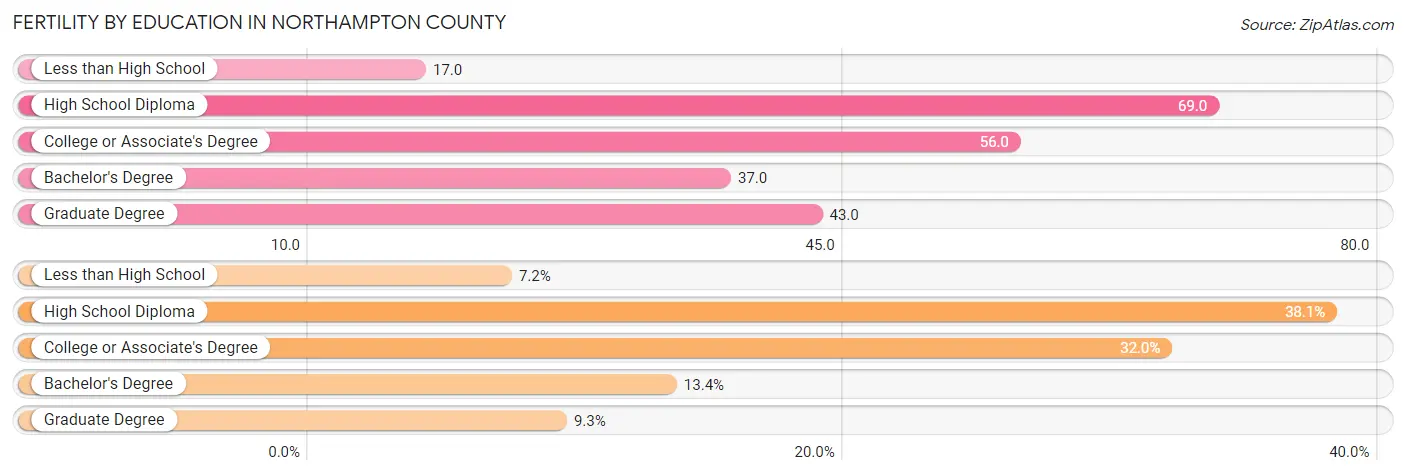
| Educational Attainment | Women with Births | Births / 1,000 Women |
| Less than High School | 7 (7.2%) | 17.0 |
| High School Diploma | 37 (38.1%) | 69.0 |
| College or Associate's Degree | 31 (32.0%) | 56.0 |
| Bachelor's Degree | 13 (13.4%) | 37.0 |
| Graduate Degree | 9 (9.3%) | 43.0 |
| Total | 97 (100.0%) | 47.0 |
Fertility by Education by Marriage Status in Northampton County
40.2% of women with births in Northampton County are unmarried. Women with the educational attainment of bachelor's degree are most likely to be married with 100.0% of them married at childbirth, while women with the educational attainment of less than high school are least likely to be married with 85.7% of them unmarried at childbirth.
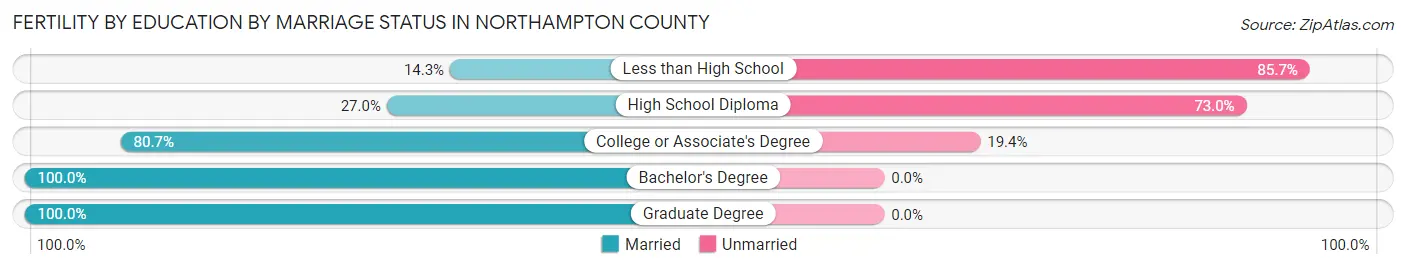
| Educational Attainment | Married | Unmarried |
| Less than High School | 1 (14.3%) | 6 (85.7%) |
| High School Diploma | 10 (27.0%) | 27 (73.0%) |
| College or Associate's Degree | 25 (80.6%) | 6 (19.4%) |
| Bachelor's Degree | 13 (100.0%) | 0 (0.0%) |
| Graduate Degree | 9 (100.0%) | 0 (0.0%) |
| Total | 58 (59.8%) | 39 (40.2%) |
Employment Characteristics in Northampton County
Employment by Class of Employer in Northampton County
Among the 4,850 employed individuals in Northampton County, private company employees (2,779 | 57.3%), local government employees (663 | 13.7%), and self-employed (incorporated) (477 | 9.8%) make up the most common classes of employment.
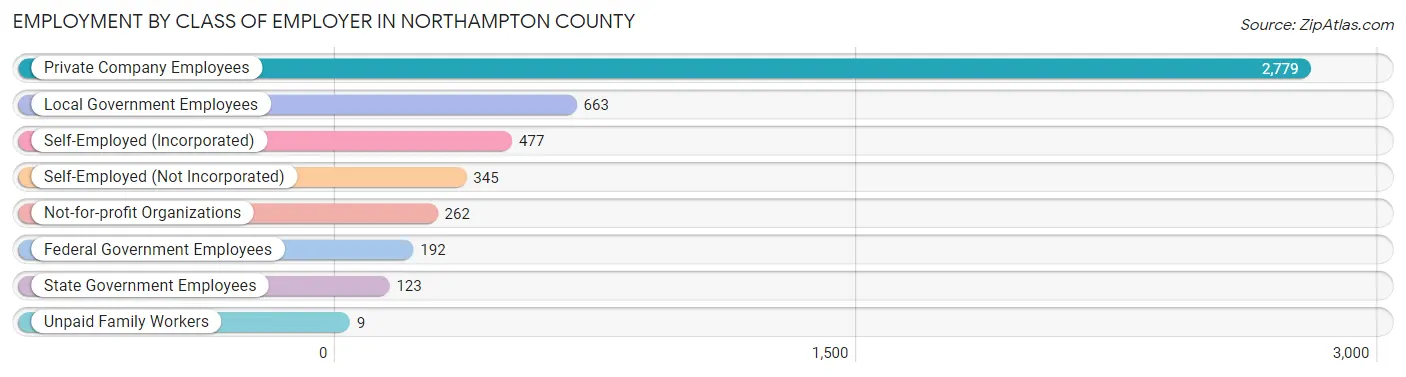
| Employer Class | # Employees | % Employees |
| Private Company Employees | 2,779 | 57.3% |
| Self-Employed (Incorporated) | 477 | 9.8% |
| Self-Employed (Not Incorporated) | 345 | 7.1% |
| Not-for-profit Organizations | 262 | 5.4% |
| Local Government Employees | 663 | 13.7% |
| State Government Employees | 123 | 2.5% |
| Federal Government Employees | 192 | 4.0% |
| Unpaid Family Workers | 9 | 0.2% |
| Total | 4,850 | 100.0% |
Employment Status by Age in Northampton County
According to the labor force statistics for Northampton County, out of the total population over 16 years of age (10,083), 52.0% or 5,243 individuals are in the labor force, with 4.8% or 252 of them unemployed. The age group with the highest labor force participation rate is 45 to 54 years, with 85.2% or 1,125 individuals in the labor force. Within the labor force, the 16 to 19 years age range has the highest percentage of unemployed individuals, with 24.5% or 51 of them being unemployed.
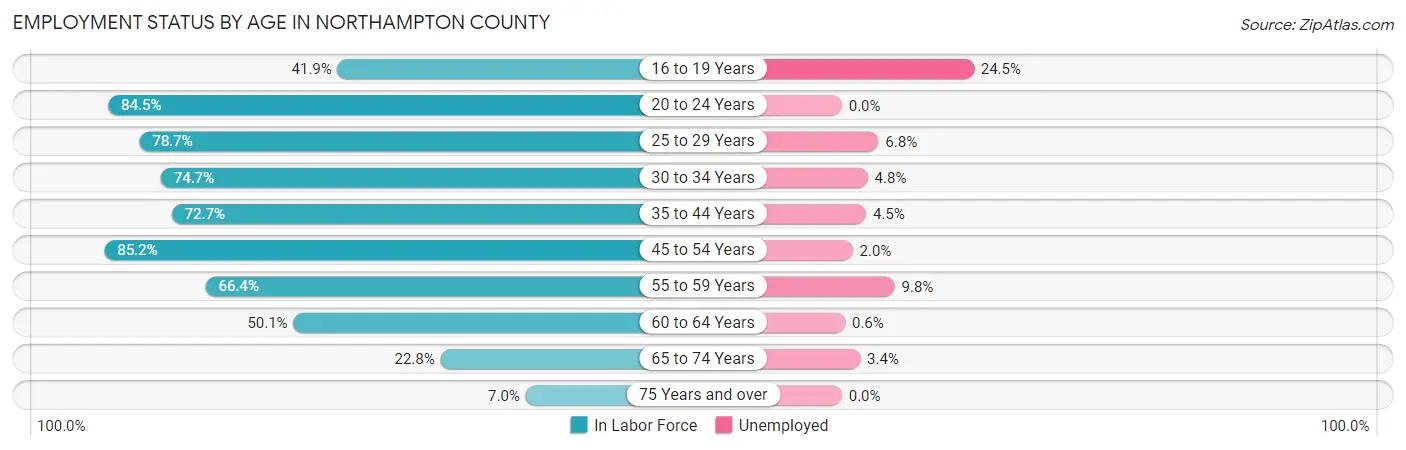
| Age Bracket | In Labor Force | Unemployed |
| 16 to 19 Years | 208 (41.9%) | 51 (24.5%) |
| 20 to 24 Years | 408 (84.5%) | 0 (0.0%) |
| 25 to 29 Years | 470 (78.7%) | 32 (6.8%) |
| 30 to 34 Years | 436 (74.7%) | 21 (4.8%) |
| 35 to 44 Years | 831 (72.7%) | 37 (4.5%) |
| 45 to 54 Years | 1,125 (85.2%) | 22 (2.0%) |
| 55 to 59 Years | 685 (66.4%) | 67 (9.8%) |
| 60 to 64 Years | 541 (50.1%) | 3 (0.6%) |
| 65 to 74 Years | 438 (22.8%) | 15 (3.4%) |
| 75 Years and over | 100 (7.0%) | 0 (0.0%) |
| Total | 5,243 (52.0%) | 252 (4.8%) |
Employment Status by Educational Attainment in Northampton County
According to labor force statistics for Northampton County, 71.0% of individuals (4,086) out of the total population between 25 and 64 years of age (5,755) are in the labor force, with 4.5% or 184 of them being unemployed. The group with the highest labor force participation rate are those with the educational attainment of college / associate degree, with 78.0% or 1,211 individuals in the labor force. Within the labor force, individuals with less than high school education have the highest percentage of unemployment, with 15.6% or 56 of them being unemployed.
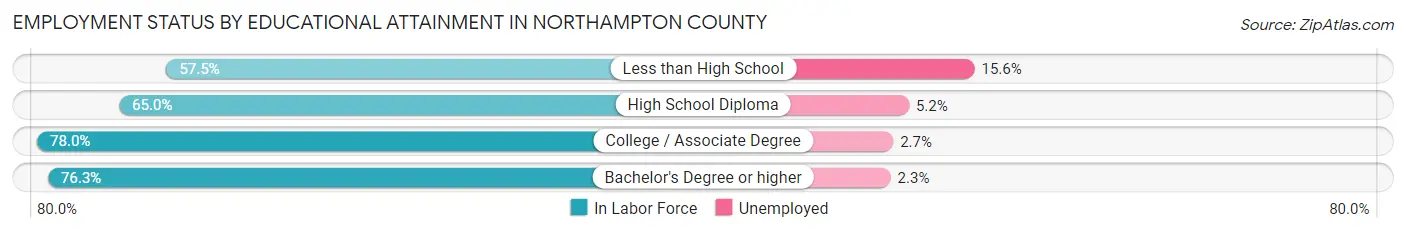
| Educational Attainment | In Labor Force | Unemployed |
| Less than High School | 358 (57.5%) | 97 (15.6%) |
| High School Diploma | 1,225 (65.0%) | 98 (5.2%) |
| College / Associate Degree | 1,211 (78.0%) | 42 (2.7%) |
| Bachelor's Degree or higher | 1,293 (76.3%) | 39 (2.3%) |
| Total | 4,086 (71.0%) | 259 (4.5%) |
Employment Occupations by Sex in Northampton County
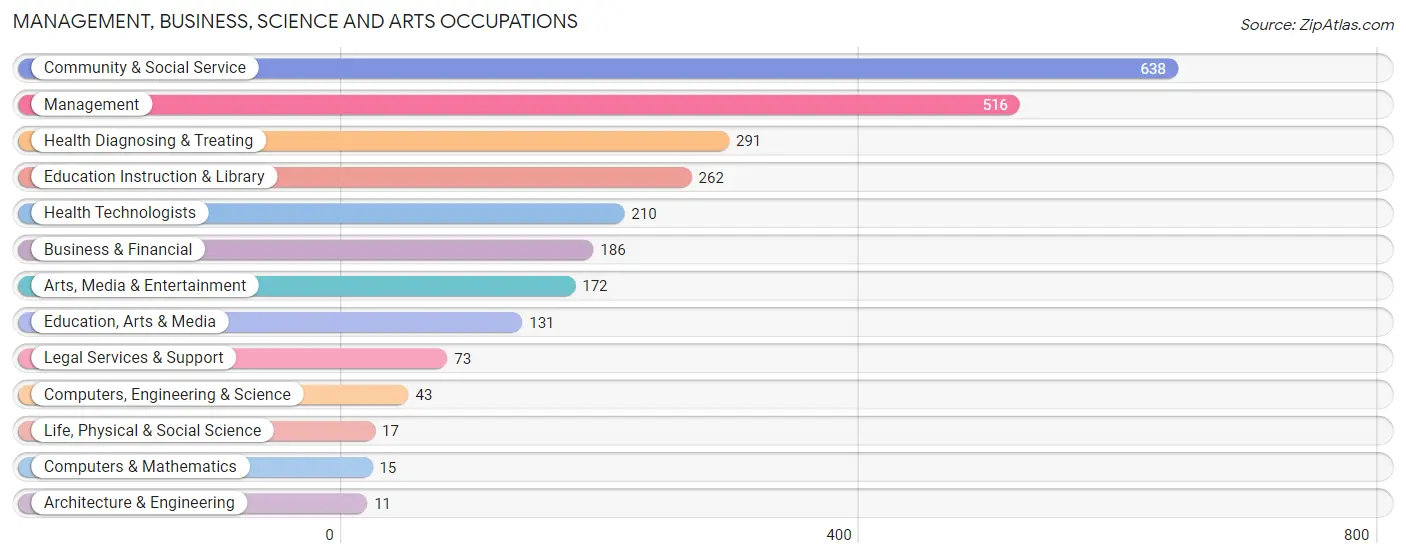
Management, Business, Science and Arts Occupations
The most common Management, Business, Science and Arts occupations in Northampton County are Community & Social Service (638 | 12.9%), Management (516 | 10.4%), Health Diagnosing & Treating (291 | 5.9%), Education Instruction & Library (262 | 5.3%), and Health Technologists (210 | 4.2%).
Management, Business, Science and Arts Occupations by Sex
Within the Management, Business, Science and Arts occupations in Northampton County, the most male-oriented occupations are Architecture & Engineering (100.0%), Computers, Engineering & Science (74.4%), and Life, Physical & Social Science (70.6%), while the most female-oriented occupations are Health Diagnosing & Treating (88.0%), Education Instruction & Library (85.9%), and Health Technologists (84.3%).
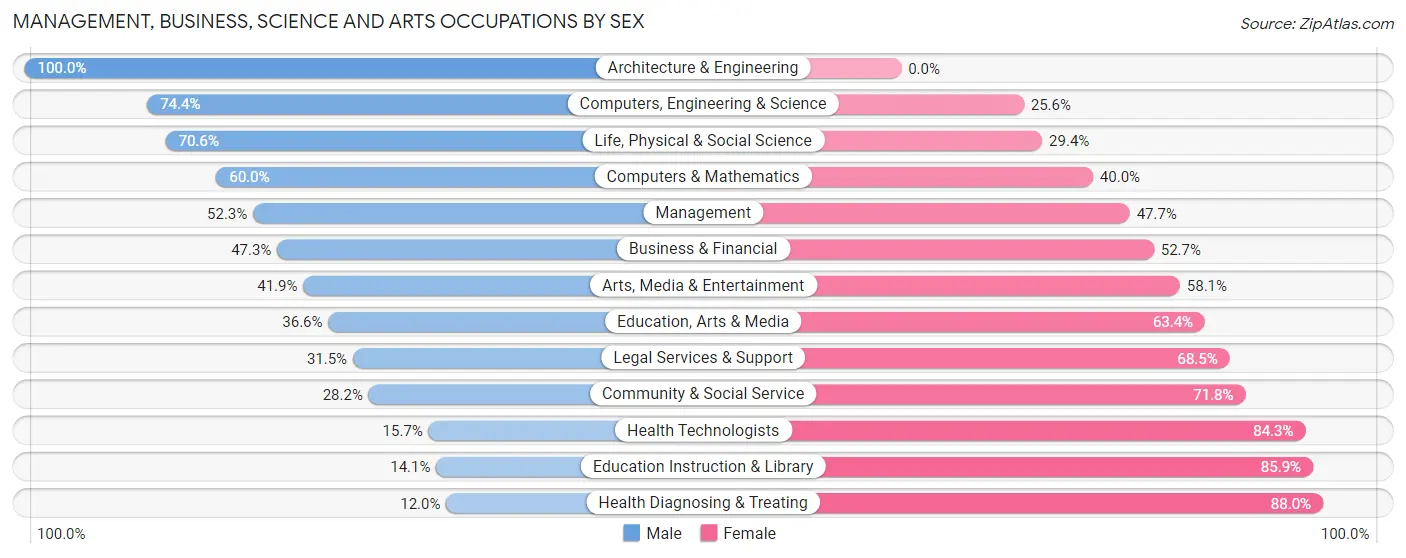
| Occupation | Male | Female |
| Management | 270 (52.3%) | 246 (47.7%) |
| Business & Financial | 88 (47.3%) | 98 (52.7%) |
| Computers, Engineering & Science | 32 (74.4%) | 11 (25.6%) |
| Computers & Mathematics | 9 (60.0%) | 6 (40.0%) |
| Architecture & Engineering | 11 (100.0%) | 0 (0.0%) |
| Life, Physical & Social Science | 12 (70.6%) | 5 (29.4%) |
| Community & Social Service | 180 (28.2%) | 458 (71.8%) |
| Education, Arts & Media | 48 (36.6%) | 83 (63.4%) |
| Legal Services & Support | 23 (31.5%) | 50 (68.5%) |
| Education Instruction & Library | 37 (14.1%) | 225 (85.9%) |
| Arts, Media & Entertainment | 72 (41.9%) | 100 (58.1%) |
| Health Diagnosing & Treating | 35 (12.0%) | 256 (88.0%) |
| Health Technologists | 33 (15.7%) | 177 (84.3%) |
| Total (Category) | 605 (36.1%) | 1,069 (63.9%) |
| Total (Overall) | 2,409 (48.7%) | 2,540 (51.3%) |
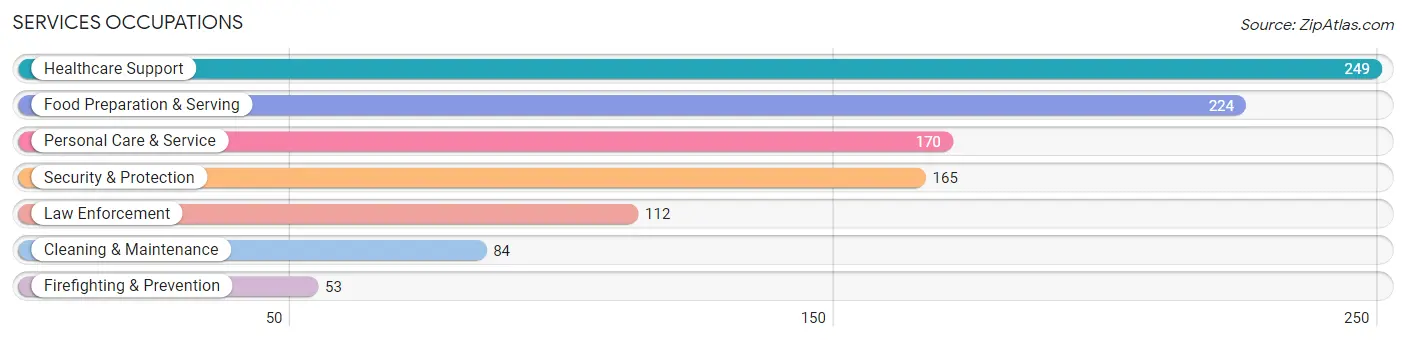
Services Occupations
The most common Services occupations in Northampton County are Healthcare Support (249 | 5.0%), Food Preparation & Serving (224 | 4.5%), Personal Care & Service (170 | 3.4%), Security & Protection (165 | 3.3%), and Law Enforcement (112 | 2.3%).
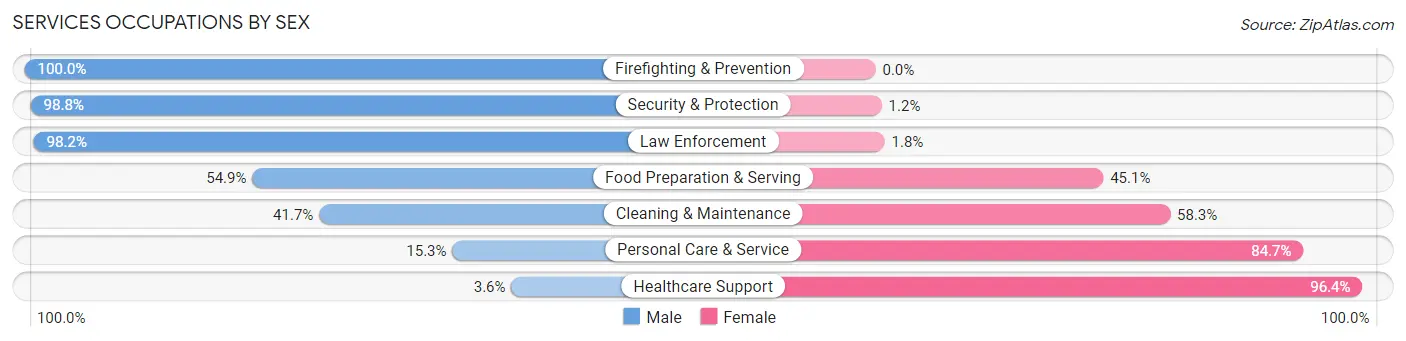
Services Occupations by Sex
Within the Services occupations in Northampton County, the most male-oriented occupations are Firefighting & Prevention (100.0%), Security & Protection (98.8%), and Law Enforcement (98.2%), while the most female-oriented occupations are Healthcare Support (96.4%), Personal Care & Service (84.7%), and Cleaning & Maintenance (58.3%).
| Occupation | Male | Female |
| Healthcare Support | 9 (3.6%) | 240 (96.4%) |
| Security & Protection | 163 (98.8%) | 2 (1.2%) |
| Firefighting & Prevention | 53 (100.0%) | 0 (0.0%) |
| Law Enforcement | 110 (98.2%) | 2 (1.8%) |
| Food Preparation & Serving | 123 (54.9%) | 101 (45.1%) |
| Cleaning & Maintenance | 35 (41.7%) | 49 (58.3%) |
| Personal Care & Service | 26 (15.3%) | 144 (84.7%) |
| Total (Category) | 356 (39.9%) | 536 (60.1%) |
| Total (Overall) | 2,409 (48.7%) | 2,540 (51.3%) |
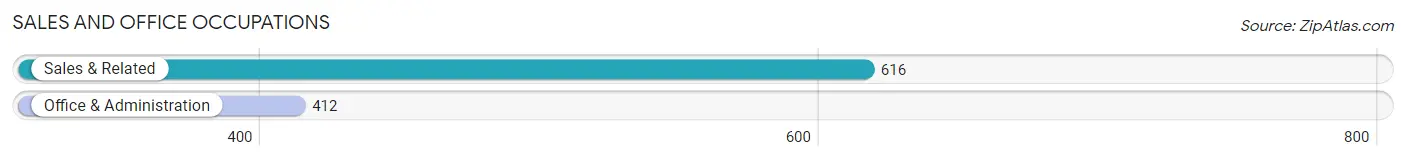
Sales and Office Occupations
The most common Sales and Office occupations in Northampton County are Sales & Related (616 | 12.4%), and Office & Administration (412 | 8.3%).
Sales and Office Occupations by Sex
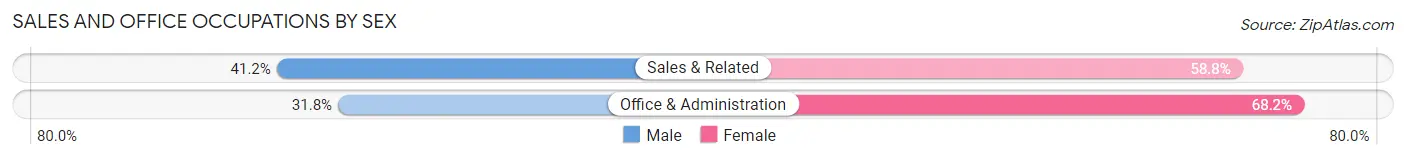
| Occupation | Male | Female |
| Sales & Related | 254 (41.2%) | 362 (58.8%) |
| Office & Administration | 131 (31.8%) | 281 (68.2%) |
| Total (Category) | 385 (37.4%) | 643 (62.5%) |
| Total (Overall) | 2,409 (48.7%) | 2,540 (51.3%) |
Natural Resources, Construction and Maintenance Occupations
The most common Natural Resources, Construction and Maintenance occupations in Northampton County are Farming, Fishing & Forestry (345 | 7.0%), Construction & Extraction (256 | 5.2%), and Installation, Maintenance & Repair (246 | 5.0%).
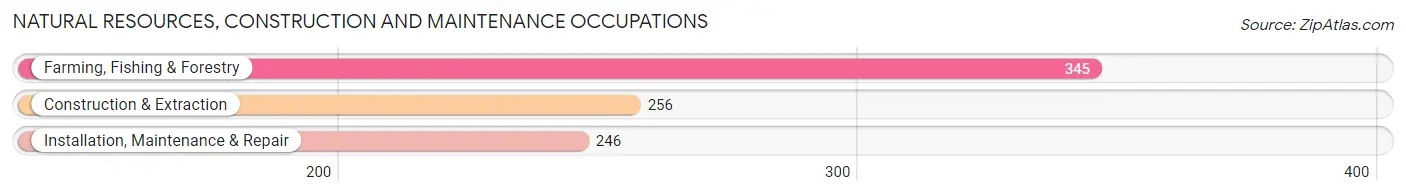
Natural Resources, Construction and Maintenance Occupations by Sex
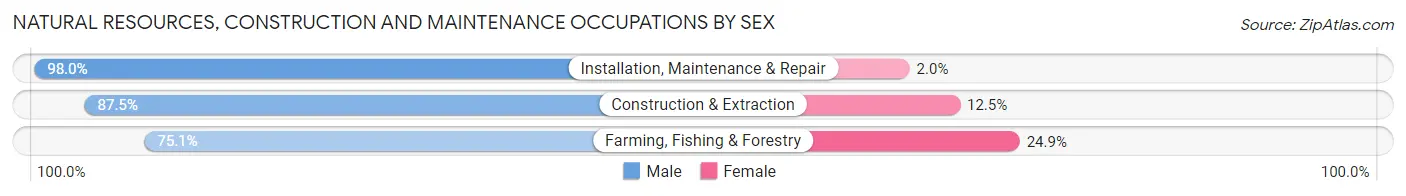
| Occupation | Male | Female |
| Farming, Fishing & Forestry | 259 (75.1%) | 86 (24.9%) |
| Construction & Extraction | 224 (87.5%) | 32 (12.5%) |
| Installation, Maintenance & Repair | 241 (98.0%) | 5 (2.0%) |
| Total (Category) | 724 (85.5%) | 123 (14.5%) |
| Total (Overall) | 2,409 (48.7%) | 2,540 (51.3%) |
Production, Transportation and Moving Occupations
The most common Production, Transportation and Moving occupations in Northampton County are Transportation (242 | 4.9%), Production (178 | 3.6%), and Material Moving (88 | 1.8%).
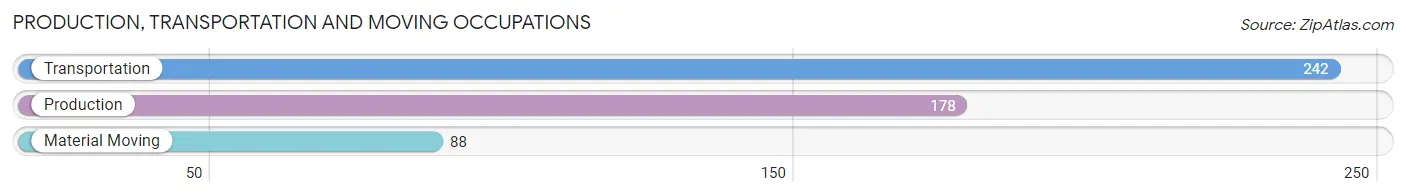
Production, Transportation and Moving Occupations by Sex
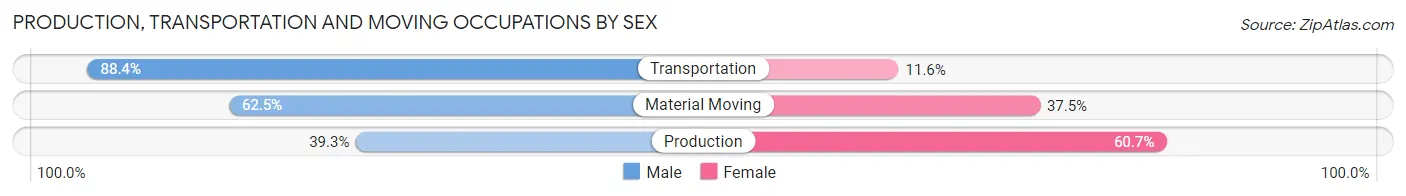
| Occupation | Male | Female |
| Production | 70 (39.3%) | 108 (60.7%) |
| Transportation | 214 (88.4%) | 28 (11.6%) |
| Material Moving | 55 (62.5%) | 33 (37.5%) |
| Total (Category) | 339 (66.7%) | 169 (33.3%) |
| Total (Overall) | 2,409 (48.7%) | 2,540 (51.3%) |
Employment Industries by Sex in Northampton County
Employment Industries in Northampton County
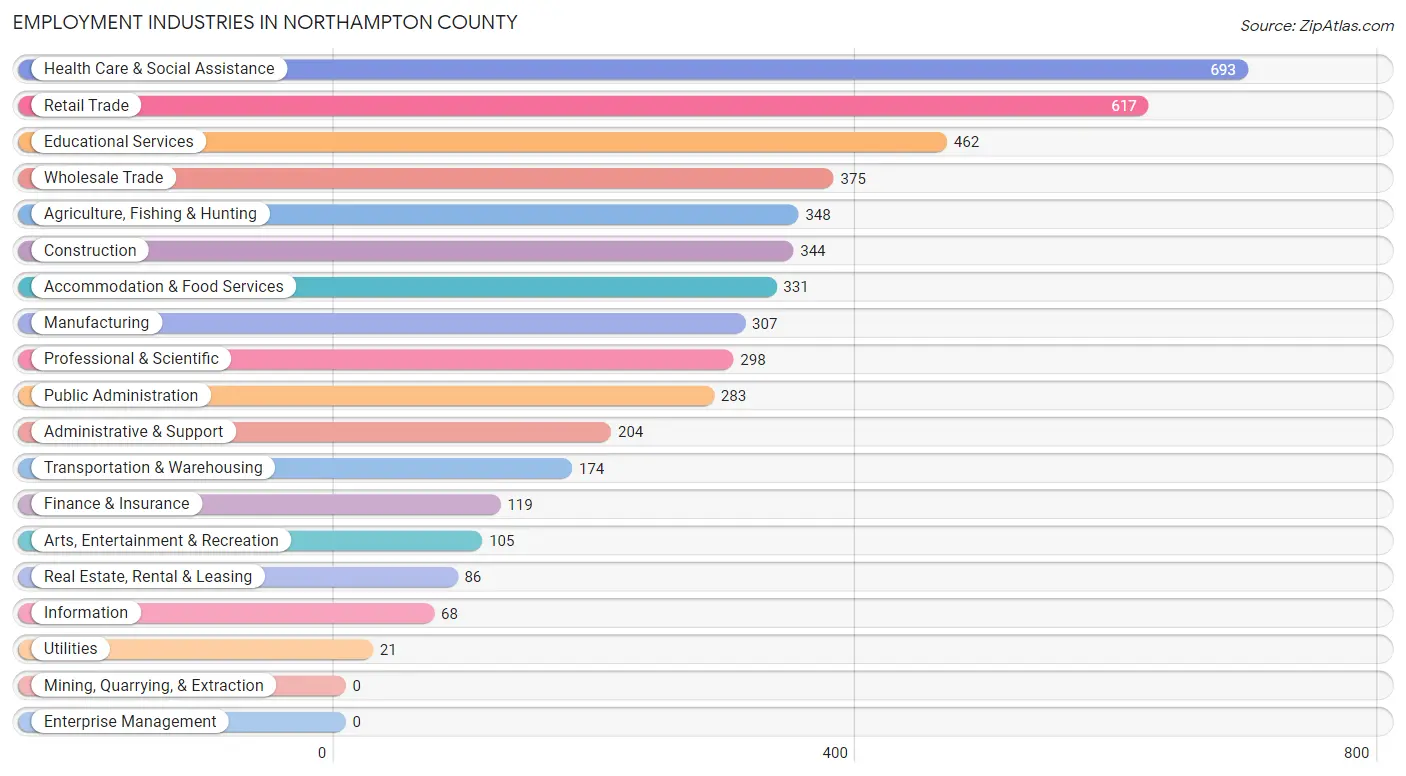
The major employment industries in Northampton County include Health Care & Social Assistance (693 | 14.0%), Retail Trade (617 | 12.5%), Educational Services (462 | 9.3%), Wholesale Trade (375 | 7.6%), and Agriculture, Fishing & Hunting (348 | 7.0%).
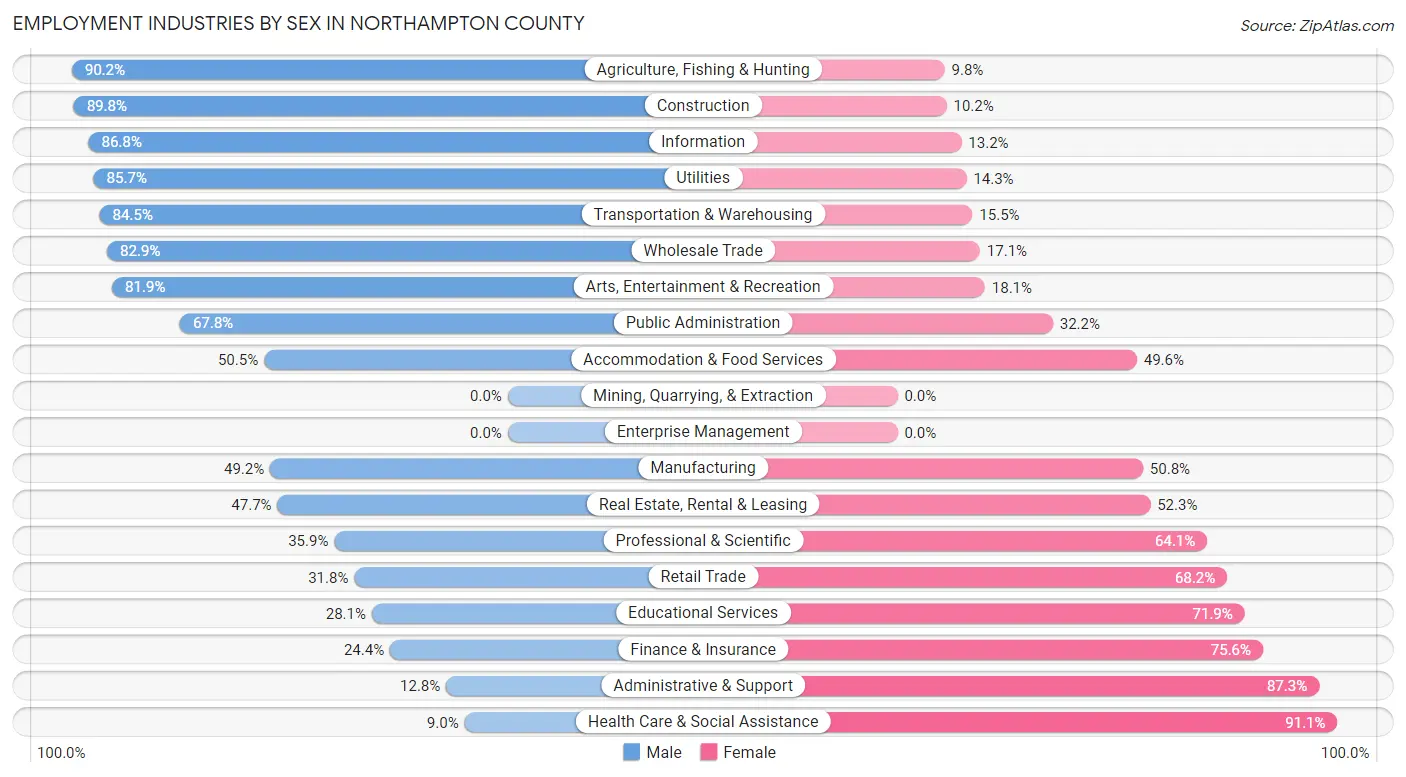
Employment Industries by Sex in Northampton County
The Northampton County industries that see more men than women are Agriculture, Fishing & Hunting (90.2%), Construction (89.8%), and Information (86.8%), whereas the industries that tend to have a higher number of women are Health Care & Social Assistance (91.0%), Administrative & Support (87.3%), and Finance & Insurance (75.6%).
| Industry | Male | Female |
| Agriculture, Fishing & Hunting | 314 (90.2%) | 34 (9.8%) |
| Mining, Quarrying, & Extraction | 0 (0.0%) | 0 (0.0%) |
| Construction | 309 (89.8%) | 35 (10.2%) |
| Manufacturing | 151 (49.2%) | 156 (50.8%) |
| Wholesale Trade | 311 (82.9%) | 64 (17.1%) |
| Retail Trade | 196 (31.8%) | 421 (68.2%) |
| Transportation & Warehousing | 147 (84.5%) | 27 (15.5%) |
| Utilities | 18 (85.7%) | 3 (14.3%) |
| Information | 59 (86.8%) | 9 (13.2%) |
| Finance & Insurance | 29 (24.4%) | 90 (75.6%) |
| Real Estate, Rental & Leasing | 41 (47.7%) | 45 (52.3%) |
| Professional & Scientific | 107 (35.9%) | 191 (64.1%) |
| Enterprise Management | 0 (0.0%) | 0 (0.0%) |
| Administrative & Support | 26 (12.8%) | 178 (87.3%) |
| Educational Services | 130 (28.1%) | 332 (71.9%) |
| Health Care & Social Assistance | 62 (8.9%) | 631 (91.0%) |
| Arts, Entertainment & Recreation | 86 (81.9%) | 19 (18.1%) |
| Accommodation & Food Services | 167 (50.4%) | 164 (49.5%) |
| Public Administration | 192 (67.8%) | 91 (32.2%) |
| Total | 2,409 (48.7%) | 2,540 (51.3%) |
Education in Northampton County
School Enrollment in Northampton County
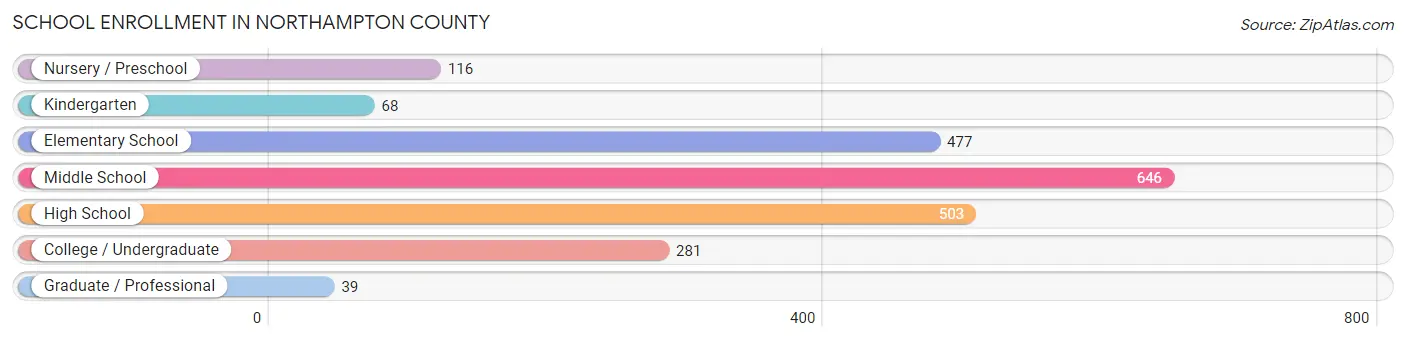
The most common levels of schooling among the 2,130 students in Northampton County are middle school (646 | 30.3%), high school (503 | 23.6%), and elementary school (477 | 22.4%).
| School Level | # Students | % Students |
| Nursery / Preschool | 116 | 5.4% |
| Kindergarten | 68 | 3.2% |
| Elementary School | 477 | 22.4% |
| Middle School | 646 | 30.3% |
| High School | 503 | 23.6% |
| College / Undergraduate | 281 | 13.2% |
| Graduate / Professional | 39 | 1.8% |
| Total | 2,130 | 100.0% |
School Enrollment by Age by Funding Source in Northampton County
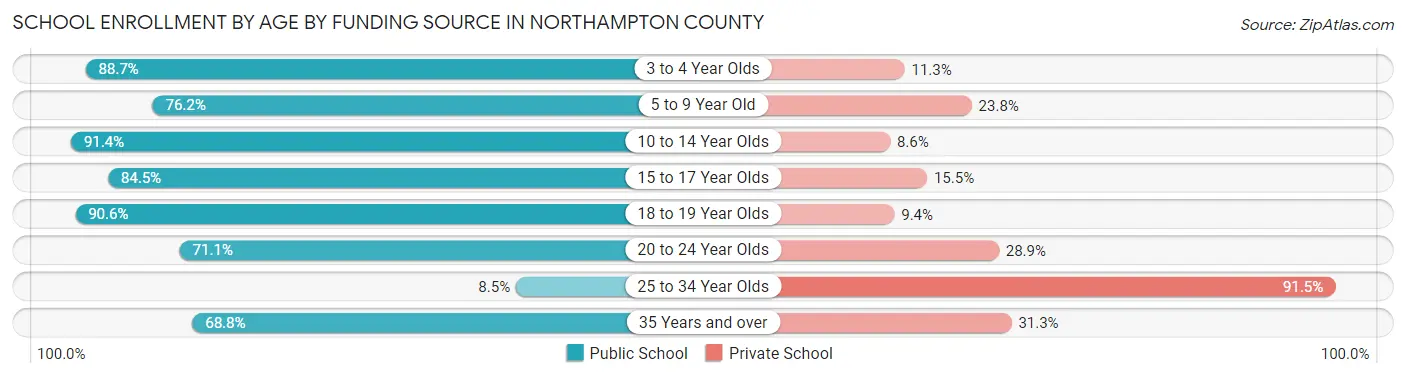
Out of a total of 2,130 students who are enrolled in schools in Northampton County, 377 (17.7%) attend a private institution, while the remaining 1,753 (82.3%) are enrolled in public schools. The age group of 25 to 34 year olds has the highest likelihood of being enrolled in private schools, with 54 (91.5% in the age bracket) enrolled. Conversely, the age group of 10 to 14 year olds has the lowest likelihood of being enrolled in a private school, with 668 (91.4% in the age bracket) attending a public institution.
| Age Bracket | Public School | Private School |
| 3 to 4 Year Olds | 86 (88.7%) | 11 (11.3%) |
| 5 to 9 Year Old | 377 (76.2%) | 118 (23.8%) |
| 10 to 14 Year Olds | 668 (91.4%) | 63 (8.6%) |
| 15 to 17 Year Olds | 343 (84.5%) | 63 (15.5%) |
| 18 to 19 Year Olds | 144 (90.6%) | 15 (9.4%) |
| 20 to 24 Year Olds | 96 (71.1%) | 39 (28.9%) |
| 25 to 34 Year Olds | 5 (8.5%) | 54 (91.5%) |
| 35 Years and over | 33 (68.8%) | 15 (31.2%) |
| Total | 1,753 (82.3%) | 377 (17.7%) |
Educational Attainment by Field of Study in Northampton County
Business (443 | 15.6%), bio, nature & agricultural (285 | 10.0%), social sciences (284 | 10.0%), education (282 | 9.9%), and arts & humanities (258 | 9.1%) are the most common fields of study among 2,843 individuals in Northampton County who have obtained a bachelor's degree or higher.
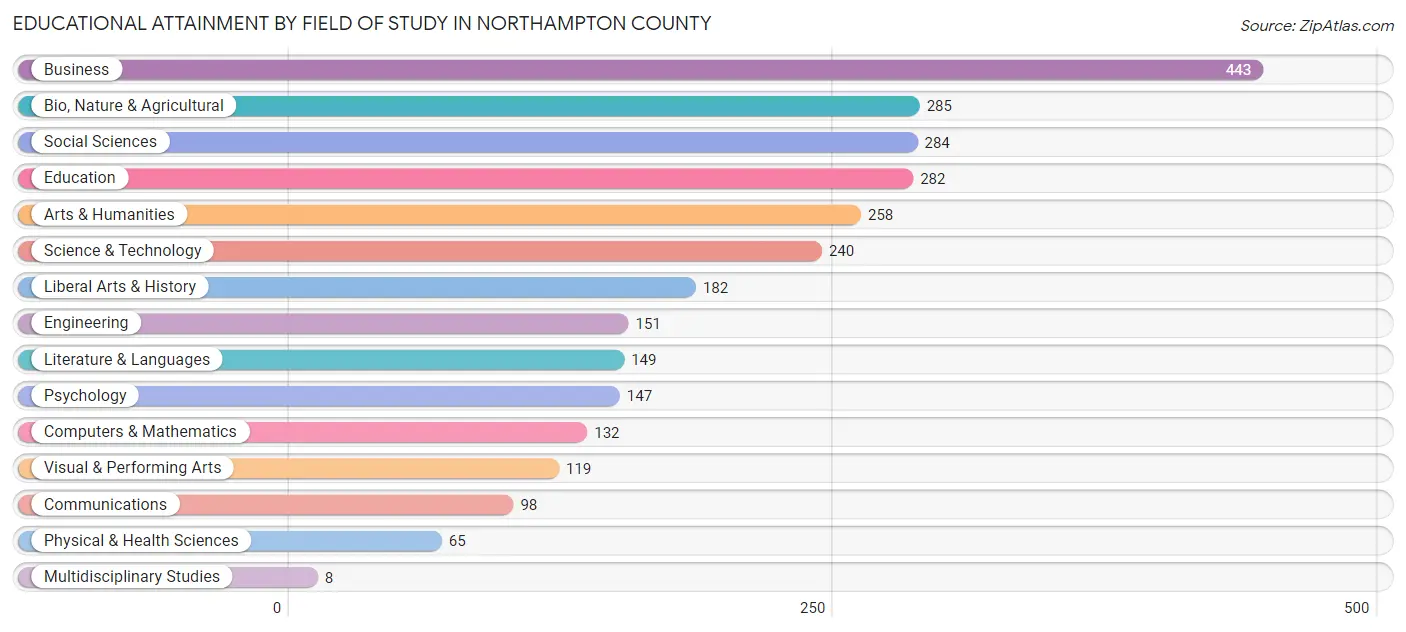
| Field of Study | # Graduates | % Graduates |
| Computers & Mathematics | 132 | 4.6% |
| Bio, Nature & Agricultural | 285 | 10.0% |
| Physical & Health Sciences | 65 | 2.3% |
| Psychology | 147 | 5.2% |
| Social Sciences | 284 | 10.0% |
| Engineering | 151 | 5.3% |
| Multidisciplinary Studies | 8 | 0.3% |
| Science & Technology | 240 | 8.4% |
| Business | 443 | 15.6% |
| Education | 282 | 9.9% |
| Literature & Languages | 149 | 5.2% |
| Liberal Arts & History | 182 | 6.4% |
| Visual & Performing Arts | 119 | 4.2% |
| Communications | 98 | 3.5% |
| Arts & Humanities | 258 | 9.1% |
| Total | 2,843 | 100.0% |
Transportation & Commute in Northampton County
Vehicle Availability by Sex in Northampton County
The most prevalent vehicle ownership categories in Northampton County are males with 3 vehicles (839, accounting for 34.8%) and females with 3 vehicles (779, making up 34.6%).
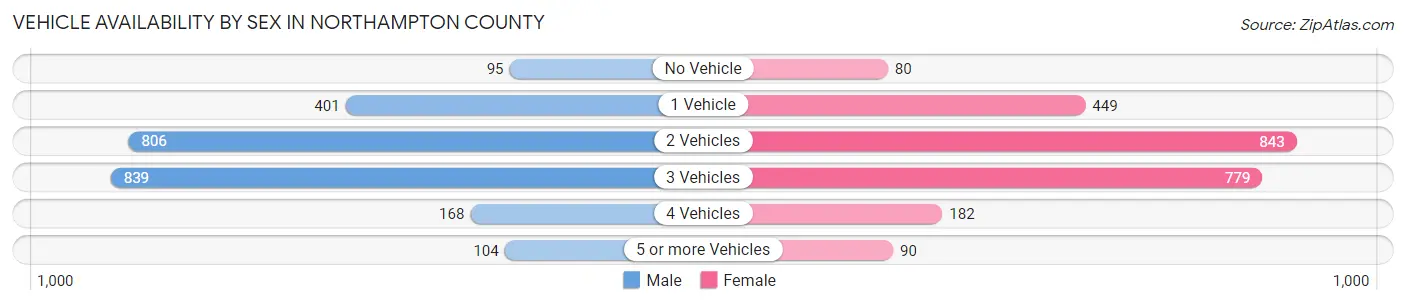
| Vehicles Available | Male | Female |
| No Vehicle | 95 (3.9%) | 80 (3.3%) |
| 1 Vehicle | 401 (16.6%) | 449 (18.5%) |
| 2 Vehicles | 806 (33.4%) | 843 (34.8%) |
| 3 Vehicles | 839 (34.8%) | 779 (32.2%) |
| 4 Vehicles | 168 (7.0%) | 182 (7.5%) |
| 5 or more Vehicles | 104 (4.3%) | 90 (3.7%) |
| Total | 2,413 (100.0%) | 2,423 (100.0%) |
Commute Time in Northampton County
The most frequently occuring commute durations in Northampton County are 5 to 9 minutes (940 commuters, 21.9%), 15 to 19 minutes (641 commuters, 14.9%), and 10 to 14 minutes (569 commuters, 13.3%).
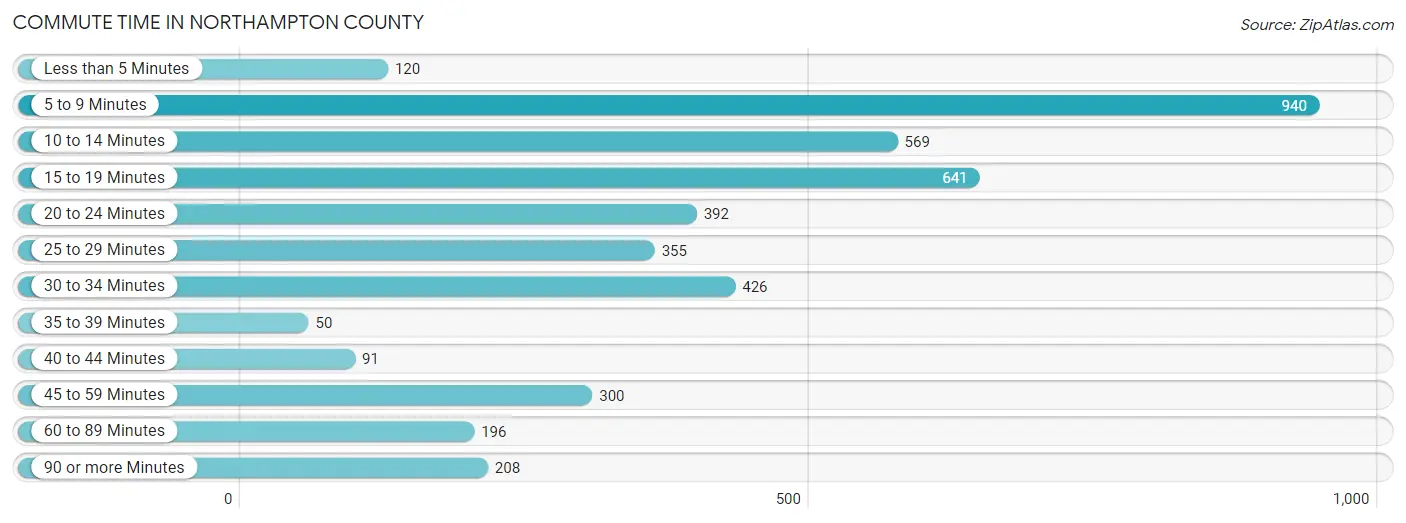
| Commute Time | # Commuters | % Commuters |
| Less than 5 Minutes | 120 | 2.8% |
| 5 to 9 Minutes | 940 | 21.9% |
| 10 to 14 Minutes | 569 | 13.3% |
| 15 to 19 Minutes | 641 | 14.9% |
| 20 to 24 Minutes | 392 | 9.1% |
| 25 to 29 Minutes | 355 | 8.3% |
| 30 to 34 Minutes | 426 | 9.9% |
| 35 to 39 Minutes | 50 | 1.2% |
| 40 to 44 Minutes | 91 | 2.1% |
| 45 to 59 Minutes | 300 | 7.0% |
| 60 to 89 Minutes | 196 | 4.6% |
| 90 or more Minutes | 208 | 4.9% |
Commute Time by Sex in Northampton County
The most common commute times in Northampton County are 5 to 9 minutes (576 commuters, 25.3%) for males and 10 to 14 minutes (381 commuters, 18.9%) for females.
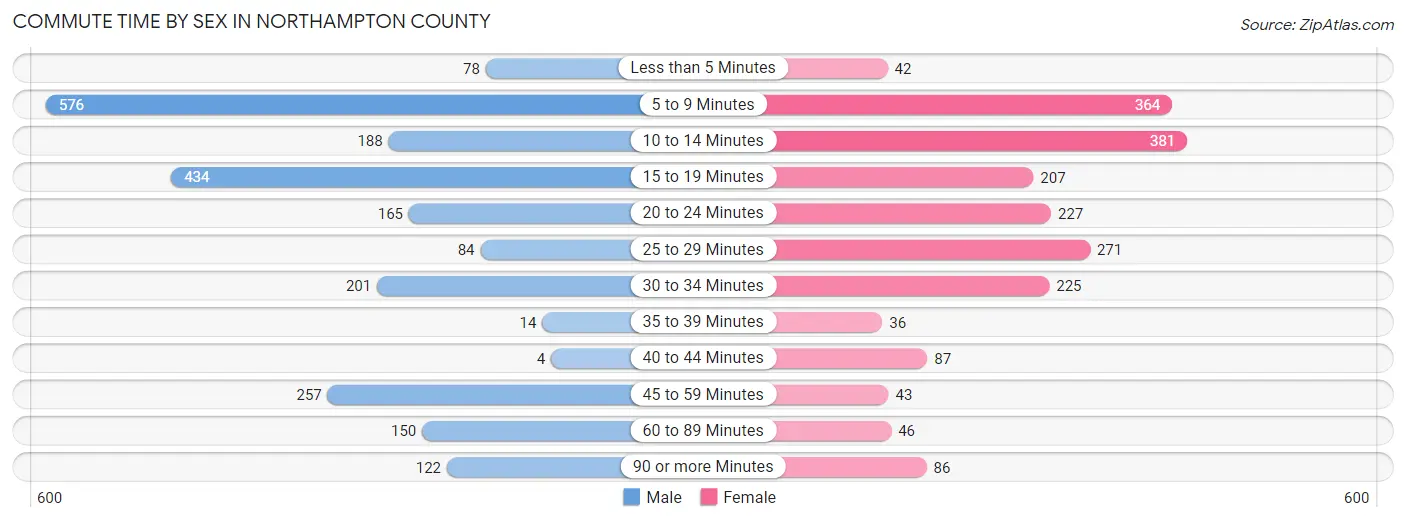
| Commute Time | Male | Female |
| Less than 5 Minutes | 78 (3.4%) | 42 (2.1%) |
| 5 to 9 Minutes | 576 (25.3%) | 364 (18.1%) |
| 10 to 14 Minutes | 188 (8.3%) | 381 (18.9%) |
| 15 to 19 Minutes | 434 (19.1%) | 207 (10.3%) |
| 20 to 24 Minutes | 165 (7.3%) | 227 (11.3%) |
| 25 to 29 Minutes | 84 (3.7%) | 271 (13.5%) |
| 30 to 34 Minutes | 201 (8.8%) | 225 (11.2%) |
| 35 to 39 Minutes | 14 (0.6%) | 36 (1.8%) |
| 40 to 44 Minutes | 4 (0.2%) | 87 (4.3%) |
| 45 to 59 Minutes | 257 (11.3%) | 43 (2.1%) |
| 60 to 89 Minutes | 150 (6.6%) | 46 (2.3%) |
| 90 or more Minutes | 122 (5.4%) | 86 (4.3%) |
Time of Departure to Work by Sex in Northampton County
The most frequent times of departure to work in Northampton County are 7:00 AM to 7:29 AM (381, 16.8%) for males and 8:00 AM to 8:29 AM (341, 16.9%) for females.
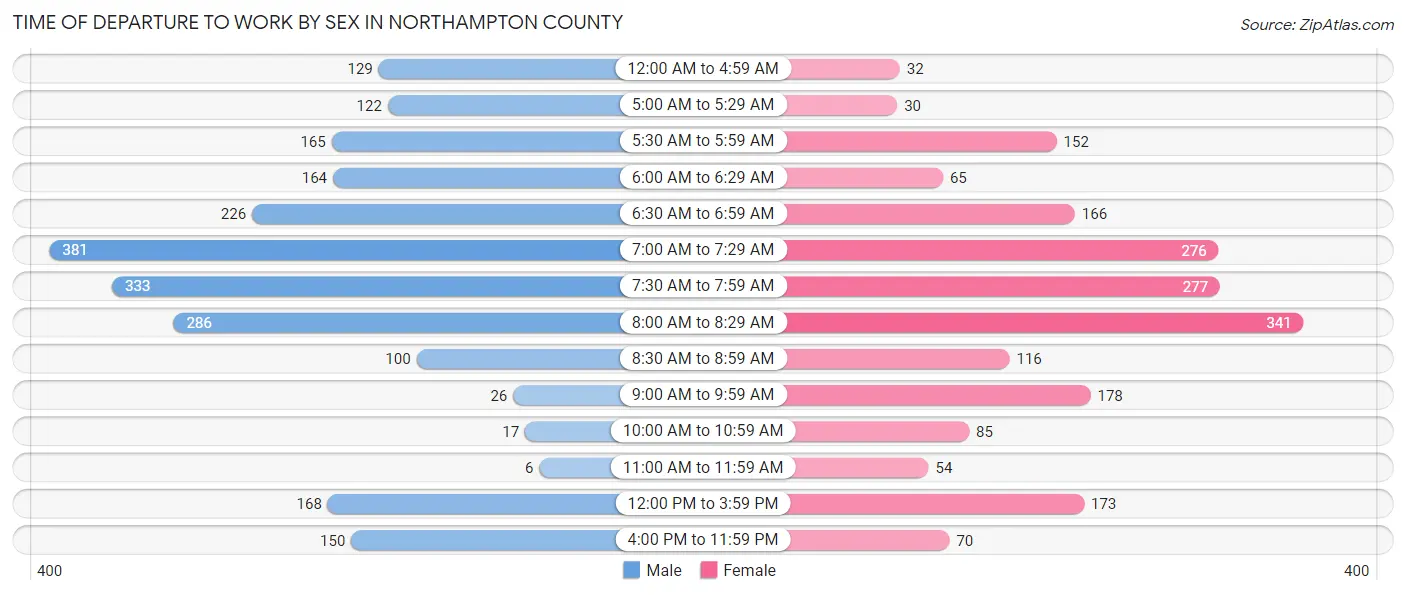
| Time of Departure | Male | Female |
| 12:00 AM to 4:59 AM | 129 (5.7%) | 32 (1.6%) |
| 5:00 AM to 5:29 AM | 122 (5.4%) | 30 (1.5%) |
| 5:30 AM to 5:59 AM | 165 (7.3%) | 152 (7.5%) |
| 6:00 AM to 6:29 AM | 164 (7.2%) | 65 (3.2%) |
| 6:30 AM to 6:59 AM | 226 (9.9%) | 166 (8.2%) |
| 7:00 AM to 7:29 AM | 381 (16.8%) | 276 (13.7%) |
| 7:30 AM to 7:59 AM | 333 (14.6%) | 277 (13.8%) |
| 8:00 AM to 8:29 AM | 286 (12.6%) | 341 (16.9%) |
| 8:30 AM to 8:59 AM | 100 (4.4%) | 116 (5.8%) |
| 9:00 AM to 9:59 AM | 26 (1.1%) | 178 (8.8%) |
| 10:00 AM to 10:59 AM | 17 (0.7%) | 85 (4.2%) |
| 11:00 AM to 11:59 AM | 6 (0.3%) | 54 (2.7%) |
| 12:00 PM to 3:59 PM | 168 (7.4%) | 173 (8.6%) |
| 4:00 PM to 11:59 PM | 150 (6.6%) | 70 (3.5%) |
| Total | 2,273 (100.0%) | 2,015 (100.0%) |
Housing Occupancy in Northampton County
Occupancy by Ownership in Northampton County
Of the total 5,344 dwellings in Northampton County, owner-occupied units account for 3,437 (64.3%), while renter-occupied units make up 1,907 (35.7%).
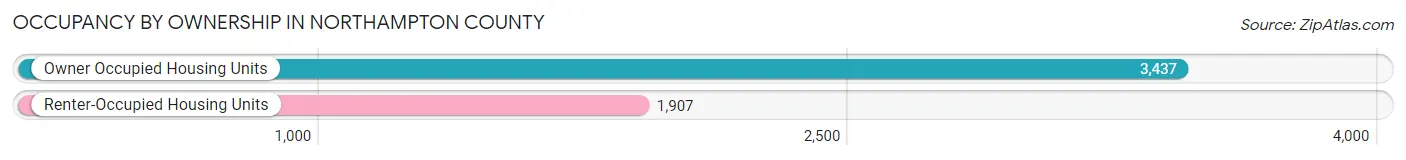
| Occupancy | # Housing Units | % Housing Units |
| Owner Occupied Housing Units | 3,437 | 64.3% |
| Renter-Occupied Housing Units | 1,907 | 35.7% |
| Total Occupied Housing Units | 5,344 | 100.0% |
Occupancy by Household Size in Northampton County
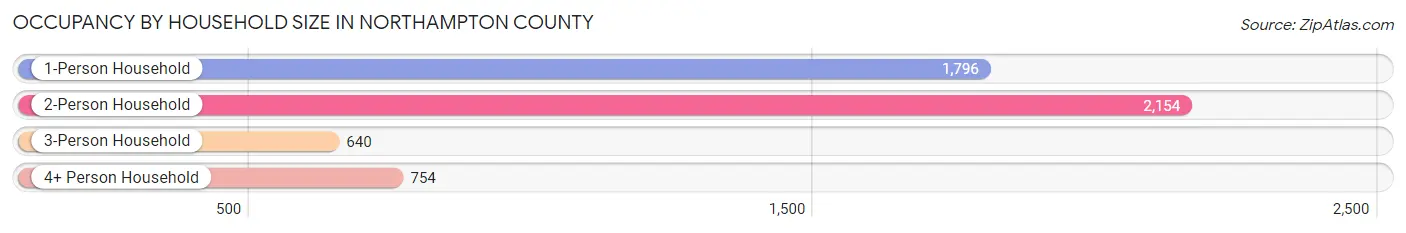
| Household Size | # Housing Units | % Housing Units |
| 1-Person Household | 1,796 | 33.6% |
| 2-Person Household | 2,154 | 40.3% |
| 3-Person Household | 640 | 12.0% |
| 4+ Person Household | 754 | 14.1% |
| Total Housing Units | 5,344 | 100.0% |
Occupancy by Ownership by Household Size in Northampton County
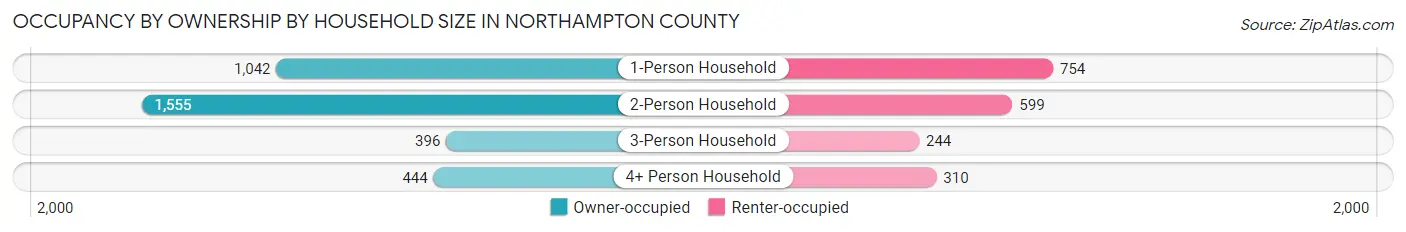
| Household Size | Owner-occupied | Renter-occupied |
| 1-Person Household | 1,042 (58.0%) | 754 (42.0%) |
| 2-Person Household | 1,555 (72.2%) | 599 (27.8%) |
| 3-Person Household | 396 (61.9%) | 244 (38.1%) |
| 4+ Person Household | 444 (58.9%) | 310 (41.1%) |
| Total Housing Units | 3,437 (64.3%) | 1,907 (35.7%) |
Occupancy by Educational Attainment in Northampton County
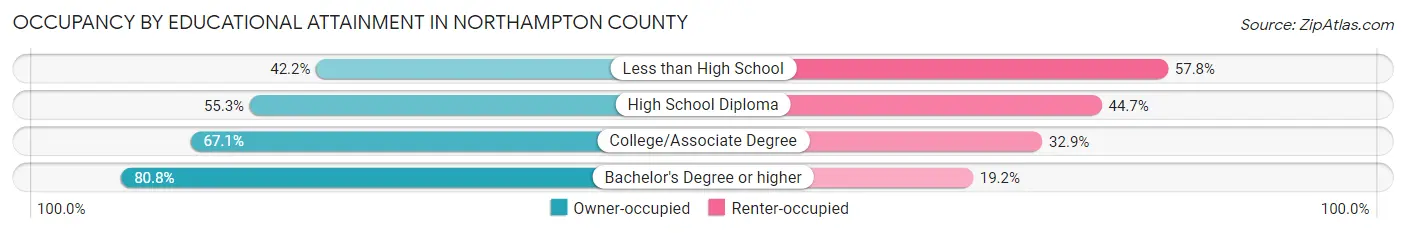
| Household Size | Owner-occupied | Renter-occupied |
| Less than High School | 288 (42.2%) | 395 (57.8%) |
| High School Diploma | 895 (55.3%) | 723 (44.7%) |
| College/Associate Degree | 1,005 (67.1%) | 493 (32.9%) |
| Bachelor's Degree or higher | 1,249 (80.8%) | 296 (19.2%) |
Occupancy by Age of Householder in Northampton County
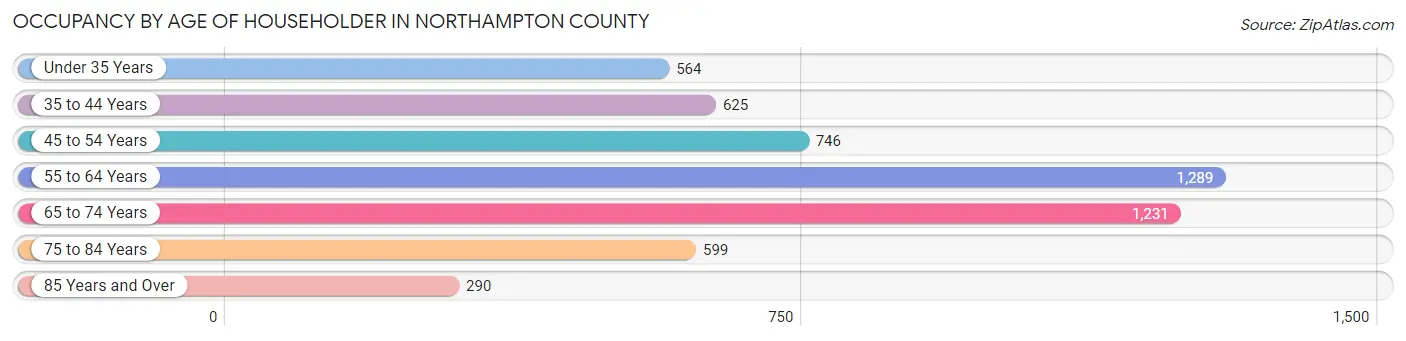
| Age Bracket | # Households | % Households |
| Under 35 Years | 564 | 10.5% |
| 35 to 44 Years | 625 | 11.7% |
| 45 to 54 Years | 746 | 14.0% |
| 55 to 64 Years | 1,289 | 24.1% |
| 65 to 74 Years | 1,231 | 23.0% |
| 75 to 84 Years | 599 | 11.2% |
| 85 Years and Over | 290 | 5.4% |
| Total | 5,344 | 100.0% |
Housing Finances in Northampton County
Median Income by Occupancy in Northampton County
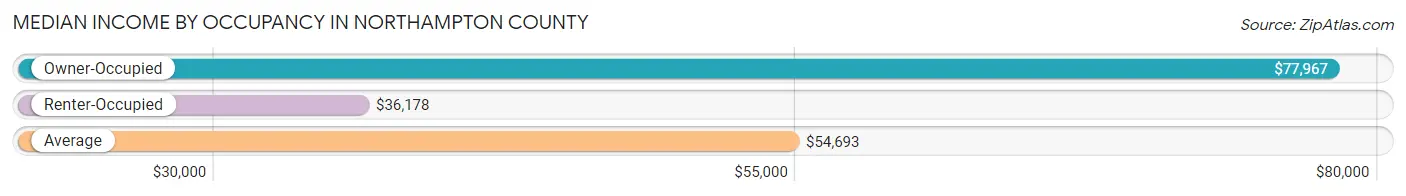
| Occupancy Type | # Households | Median Income |
| Owner-Occupied | 3,437 (64.3%) | $77,967 |
| Renter-Occupied | 1,907 (35.7%) | $36,178 |
| Average | 5,344 (100.0%) | $54,693 |
Occupancy by Householder Income Bracket in Northampton County
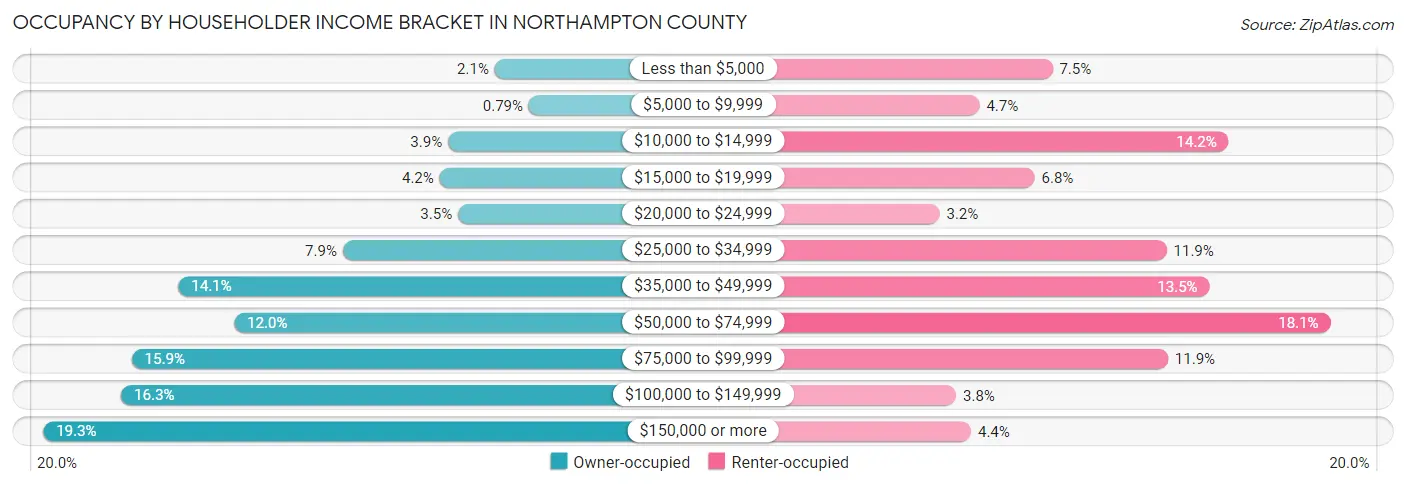
| Income Bracket | Owner-occupied | Renter-occupied |
| Less than $5,000 | 72 (2.1%) | 143 (7.5%) |
| $5,000 to $9,999 | 27 (0.8%) | 90 (4.7%) |
| $10,000 to $14,999 | 133 (3.9%) | 271 (14.2%) |
| $15,000 to $19,999 | 144 (4.2%) | 130 (6.8%) |
| $20,000 to $24,999 | 120 (3.5%) | 61 (3.2%) |
| $25,000 to $34,999 | 271 (7.9%) | 226 (11.8%) |
| $35,000 to $49,999 | 486 (14.1%) | 257 (13.5%) |
| $50,000 to $74,999 | 413 (12.0%) | 345 (18.1%) |
| $75,000 to $99,999 | 547 (15.9%) | 227 (11.9%) |
| $100,000 to $149,999 | 561 (16.3%) | 73 (3.8%) |
| $150,000 or more | 663 (19.3%) | 84 (4.4%) |
| Total | 3,437 (100.0%) | 1,907 (100.0%) |
Monthly Housing Cost Tiers in Northampton County
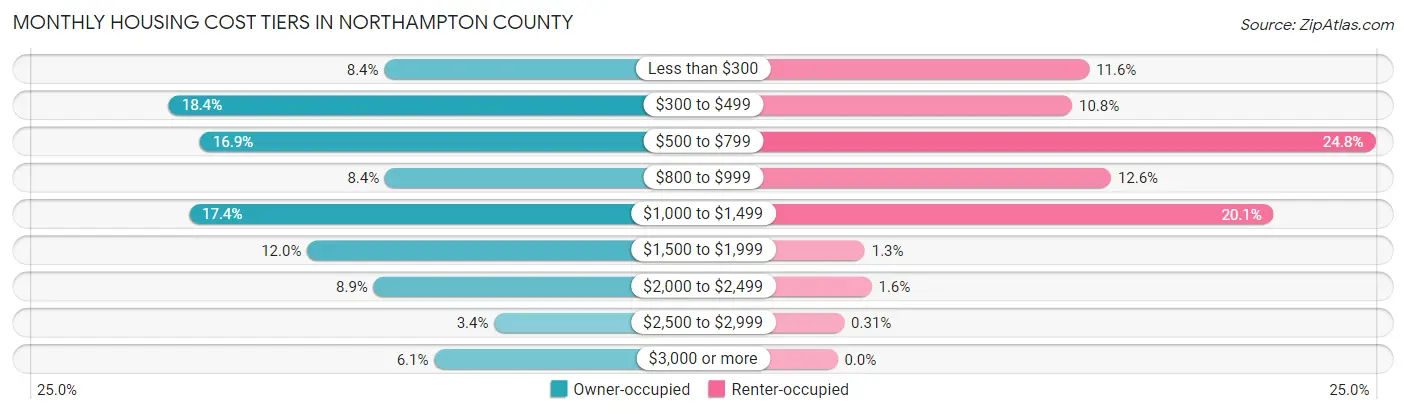
| Monthly Cost | Owner-occupied | Renter-occupied |
| Less than $300 | 290 (8.4%) | 221 (11.6%) |
| $300 to $499 | 631 (18.4%) | 206 (10.8%) |
| $500 to $799 | 582 (16.9%) | 472 (24.7%) |
| $800 to $999 | 289 (8.4%) | 240 (12.6%) |
| $1,000 to $1,499 | 599 (17.4%) | 383 (20.1%) |
| $1,500 to $1,999 | 412 (12.0%) | 24 (1.3%) |
| $2,000 to $2,499 | 307 (8.9%) | 30 (1.6%) |
| $2,500 to $2,999 | 116 (3.4%) | 6 (0.3%) |
| $3,000 or more | 211 (6.1%) | 0 (0.0%) |
| Total | 3,437 (100.0%) | 1,907 (100.0%) |
Physical Housing Characteristics in Northampton County
Housing Structures in Northampton County
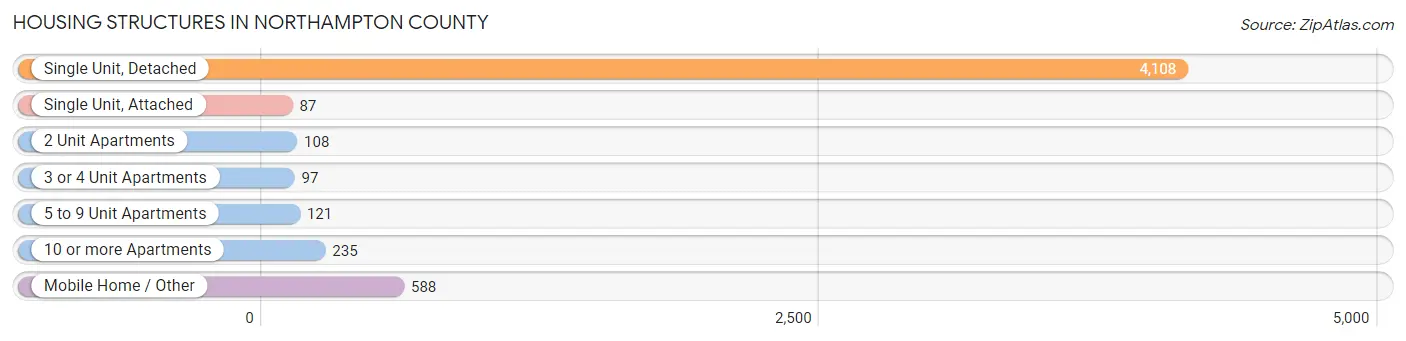
| Structure Type | # Housing Units | % Housing Units |
| Single Unit, Detached | 4,108 | 76.9% |
| Single Unit, Attached | 87 | 1.6% |
| 2 Unit Apartments | 108 | 2.0% |
| 3 or 4 Unit Apartments | 97 | 1.8% |
| 5 to 9 Unit Apartments | 121 | 2.3% |
| 10 or more Apartments | 235 | 4.4% |
| Mobile Home / Other | 588 | 11.0% |
| Total | 5,344 | 100.0% |
Housing Structures by Occupancy in Northampton County
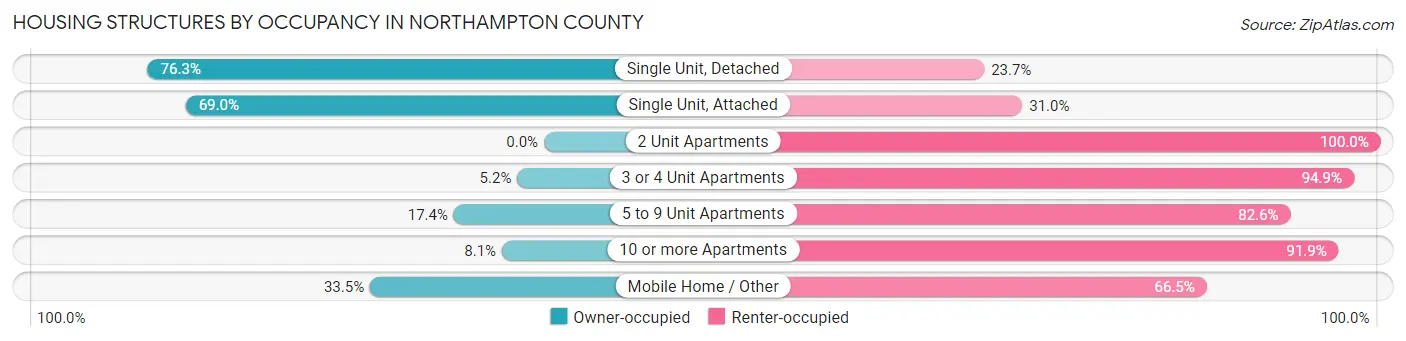
| Structure Type | Owner-occupied | Renter-occupied |
| Single Unit, Detached | 3,135 (76.3%) | 973 (23.7%) |
| Single Unit, Attached | 60 (69.0%) | 27 (31.0%) |
| 2 Unit Apartments | 0 (0.0%) | 108 (100.0%) |
| 3 or 4 Unit Apartments | 5 (5.1%) | 92 (94.9%) |
| 5 to 9 Unit Apartments | 21 (17.4%) | 100 (82.6%) |
| 10 or more Apartments | 19 (8.1%) | 216 (91.9%) |
| Mobile Home / Other | 197 (33.5%) | 391 (66.5%) |
| Total | 3,437 (64.3%) | 1,907 (35.7%) |
Housing Structures by Number of Rooms in Northampton County
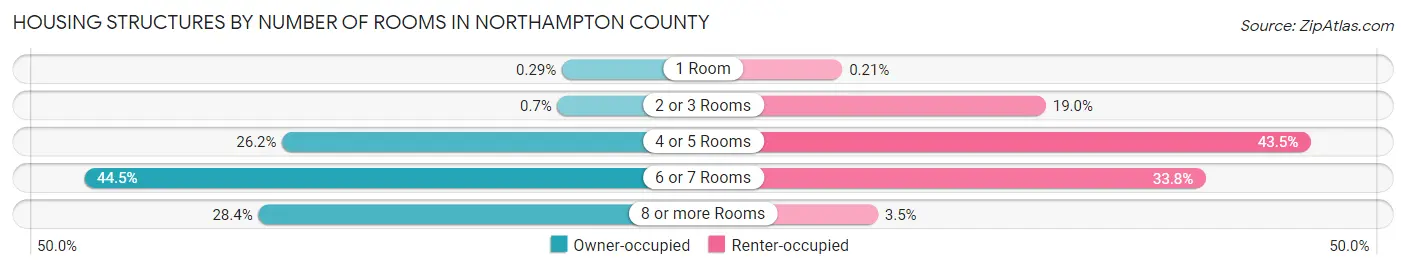
| Number of Rooms | Owner-occupied | Renter-occupied |
| 1 Room | 10 (0.3%) | 4 (0.2%) |
| 2 or 3 Rooms | 24 (0.7%) | 363 (19.0%) |
| 4 or 5 Rooms | 899 (26.2%) | 829 (43.5%) |
| 6 or 7 Rooms | 1,529 (44.5%) | 644 (33.8%) |
| 8 or more Rooms | 975 (28.4%) | 67 (3.5%) |
| Total | 3,437 (100.0%) | 1,907 (100.0%) |
Housing Structure by Heating Type in Northampton County
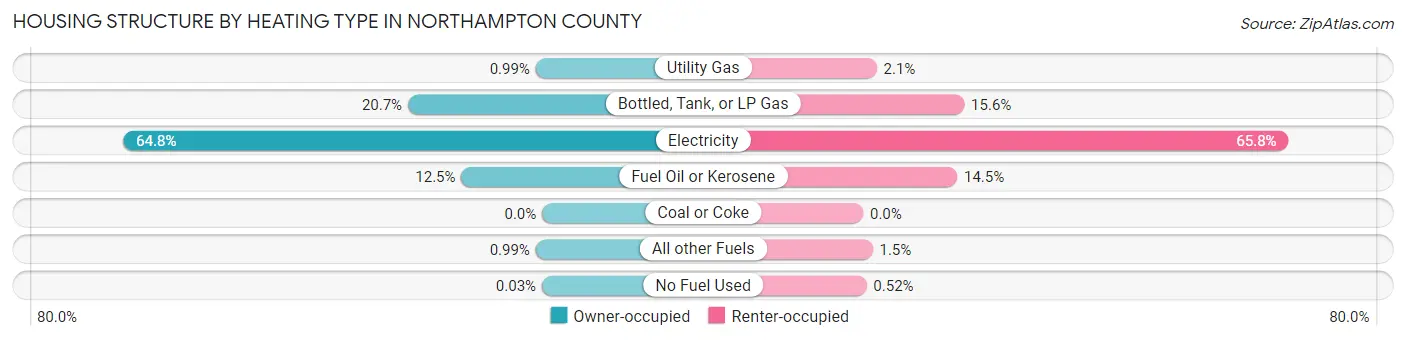
| Heating Type | Owner-occupied | Renter-occupied |
| Utility Gas | 34 (1.0%) | 40 (2.1%) |
| Bottled, Tank, or LP Gas | 713 (20.7%) | 298 (15.6%) |
| Electricity | 2,226 (64.8%) | 1,254 (65.8%) |
| Fuel Oil or Kerosene | 429 (12.5%) | 277 (14.5%) |
| Coal or Coke | 0 (0.0%) | 0 (0.0%) |
| All other Fuels | 34 (1.0%) | 28 (1.5%) |
| No Fuel Used | 1 (0.0%) | 10 (0.5%) |
| Total | 3,437 (100.0%) | 1,907 (100.0%) |
Household Vehicle Usage in Northampton County
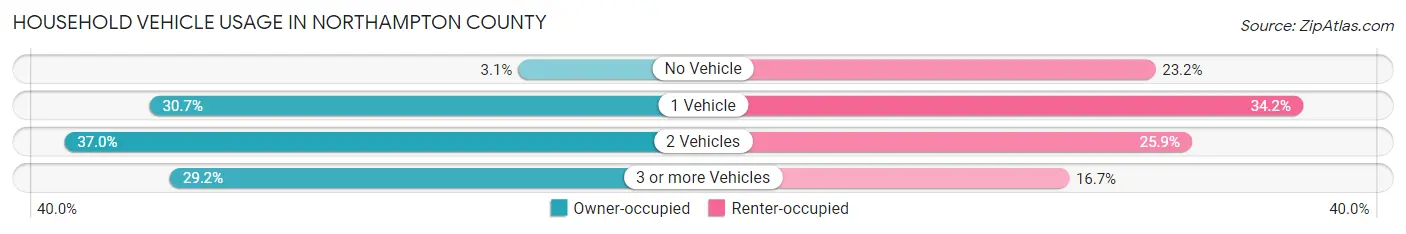
| Vehicles per Household | Owner-occupied | Renter-occupied |
| No Vehicle | 108 (3.1%) | 442 (23.2%) |
| 1 Vehicle | 1,054 (30.7%) | 652 (34.2%) |
| 2 Vehicles | 1,273 (37.0%) | 494 (25.9%) |
| 3 or more Vehicles | 1,002 (29.1%) | 319 (16.7%) |
| Total | 3,437 (100.0%) | 1,907 (100.0%) |
Real Estate & Mortgages in Northampton County
Real Estate and Mortgage Overview in Northampton County
| Characteristic | Without Mortgage | With Mortgage |
| Housing Units | 1,550 | 1,887 |
| Median Property Value | $213,900 | $277,600 |
| Median Household Income | $51,721 | $481 |
| Monthly Housing Costs | $468 | $211 |
| Real Estate Taxes | $1,329 | $23 |
Property Value by Mortgage Status in Northampton County
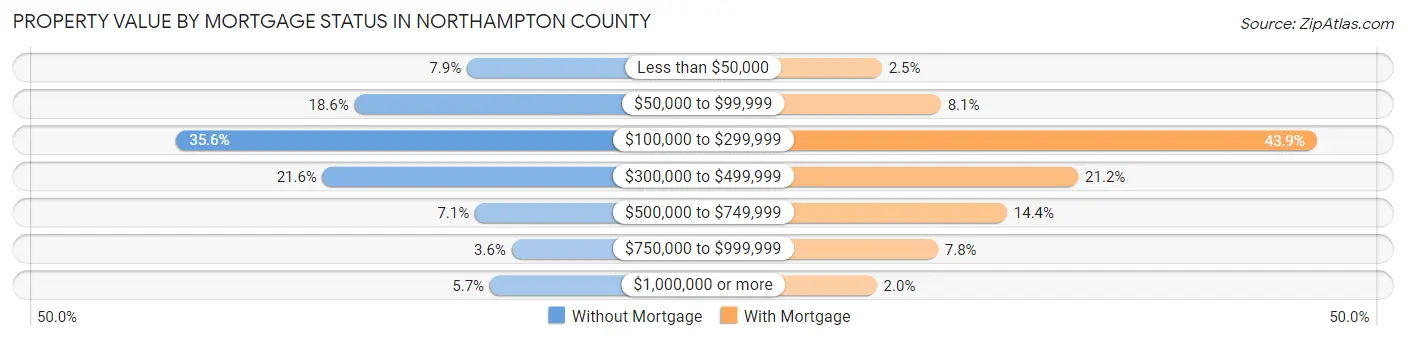
| Property Value | Without Mortgage | With Mortgage |
| Less than $50,000 | 122 (7.9%) | 47 (2.5%) |
| $50,000 to $99,999 | 288 (18.6%) | 153 (8.1%) |
| $100,000 to $299,999 | 551 (35.5%) | 829 (43.9%) |
| $300,000 to $499,999 | 335 (21.6%) | 400 (21.2%) |
| $500,000 to $749,999 | 110 (7.1%) | 272 (14.4%) |
| $750,000 to $999,999 | 56 (3.6%) | 148 (7.8%) |
| $1,000,000 or more | 88 (5.7%) | 38 (2.0%) |
| Total | 1,550 (100.0%) | 1,887 (100.0%) |
Household Income by Mortgage Status in Northampton County
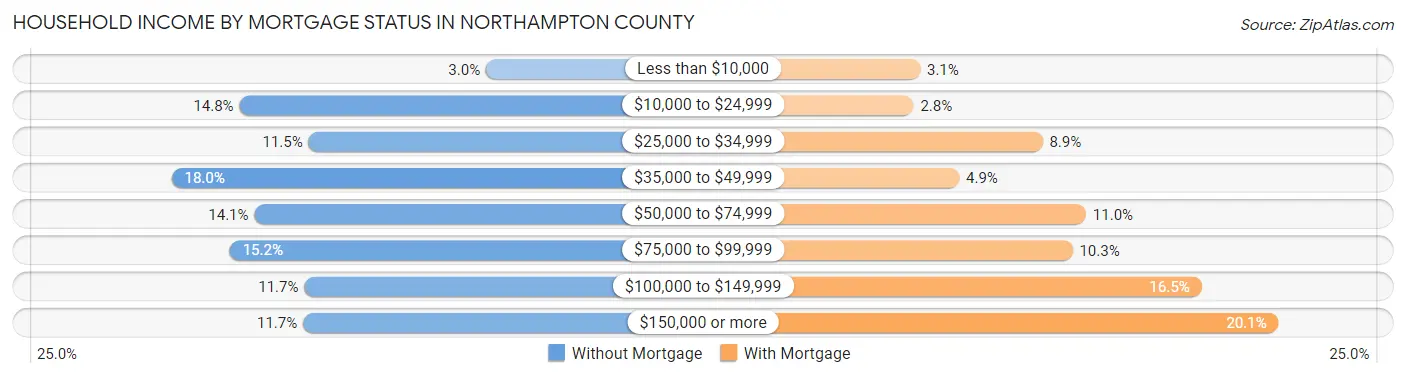
| Household Income | Without Mortgage | With Mortgage |
| Less than $10,000 | 47 (3.0%) | 58 (3.1%) |
| $10,000 to $24,999 | 229 (14.8%) | 52 (2.8%) |
| $25,000 to $34,999 | 178 (11.5%) | 168 (8.9%) |
| $35,000 to $49,999 | 279 (18.0%) | 93 (4.9%) |
| $50,000 to $74,999 | 218 (14.1%) | 207 (11.0%) |
| $75,000 to $99,999 | 236 (15.2%) | 195 (10.3%) |
| $100,000 to $149,999 | 181 (11.7%) | 311 (16.5%) |
| $150,000 or more | 182 (11.7%) | 380 (20.1%) |
| Total | 1,550 (100.0%) | 1,887 (100.0%) |
Property Value to Household Income Ratio in Northampton County
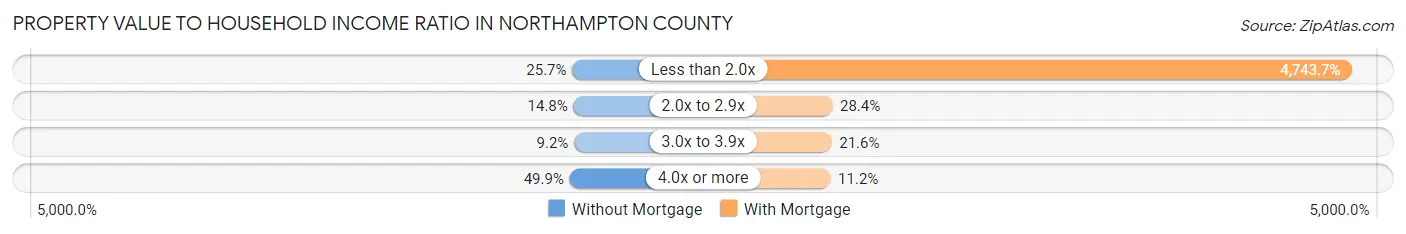
| Value-to-Income Ratio | Without Mortgage | With Mortgage |
| Less than 2.0x | 399 (25.7%) | 89,513 (4,743.7%) |
| 2.0x to 2.9x | 230 (14.8%) | 536 (28.4%) |
| 3.0x to 3.9x | 143 (9.2%) | 408 (21.6%) |
| 4.0x or more | 774 (49.9%) | 211 (11.2%) |
| Total | 1,550 (100.0%) | 1,887 (100.0%) |
Real Estate Taxes by Mortgage Status in Northampton County
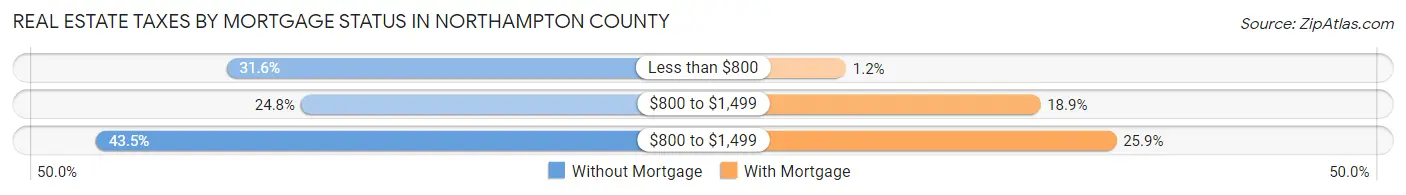
| Property Taxes | Without Mortgage | With Mortgage |
| Less than $800 | 489 (31.6%) | 22 (1.2%) |
| $800 to $1,499 | 384 (24.8%) | 357 (18.9%) |
| $800 to $1,499 | 674 (43.5%) | 488 (25.9%) |
| Total | 1,550 (100.0%) | 1,887 (100.0%) |
Health & Disability in Northampton County
Health Insurance Coverage by Age in Northampton County
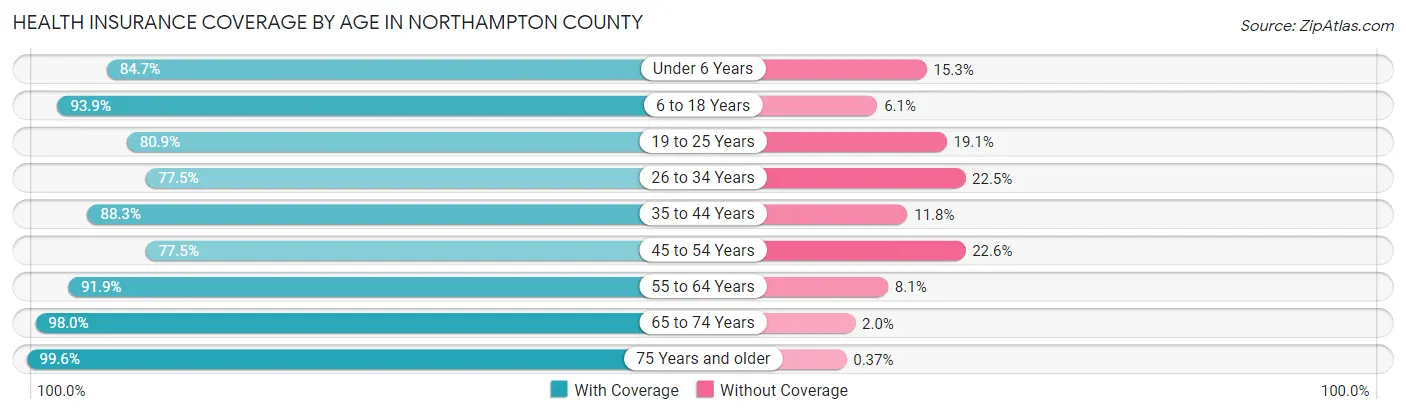
| Age Bracket | With Coverage | Without Coverage |
| Under 6 Years | 618 (84.7%) | 112 (15.3%) |
| 6 to 18 Years | 1,529 (93.9%) | 100 (6.1%) |
| 19 to 25 Years | 607 (80.9%) | 143 (19.1%) |
| 26 to 34 Years | 791 (77.5%) | 230 (22.5%) |
| 35 to 44 Years | 991 (88.2%) | 132 (11.7%) |
| 45 to 54 Years | 1,010 (77.4%) | 294 (22.6%) |
| 55 to 64 Years | 1,899 (91.9%) | 168 (8.1%) |
| 65 to 74 Years | 1,852 (98.0%) | 38 (2.0%) |
| 75 Years and older | 1,343 (99.6%) | 5 (0.4%) |
| Total | 10,640 (89.7%) | 1,222 (10.3%) |
Health Insurance Coverage by Citizenship Status in Northampton County
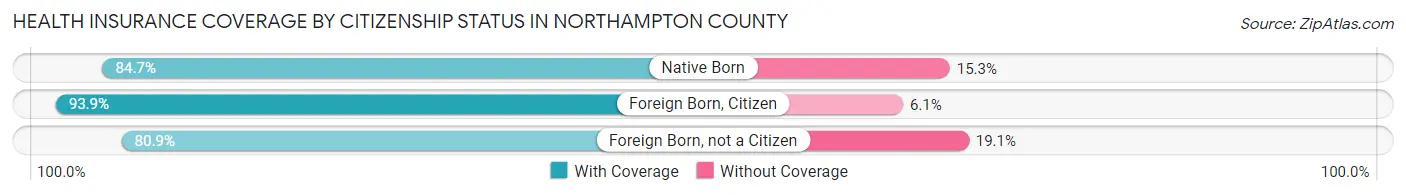
| Citizenship Status | With Coverage | Without Coverage |
| Native Born | 618 (84.7%) | 112 (15.3%) |
| Foreign Born, Citizen | 1,529 (93.9%) | 100 (6.1%) |
| Foreign Born, not a Citizen | 607 (80.9%) | 143 (19.1%) |
Health Insurance Coverage by Household Income in Northampton County
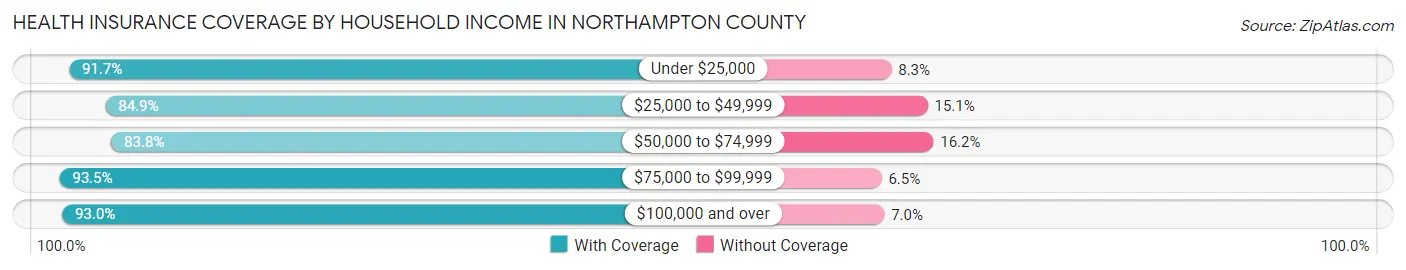
| Household Income | With Coverage | Without Coverage |
| Under $25,000 | 1,749 (91.7%) | 159 (8.3%) |
| $25,000 to $49,999 | 2,194 (84.9%) | 391 (15.1%) |
| $50,000 to $74,999 | 1,428 (83.8%) | 276 (16.2%) |
| $75,000 to $99,999 | 1,554 (93.5%) | 108 (6.5%) |
| $100,000 and over | 3,662 (93.0%) | 276 (7.0%) |
Public vs Private Health Insurance Coverage by Age in Northampton County
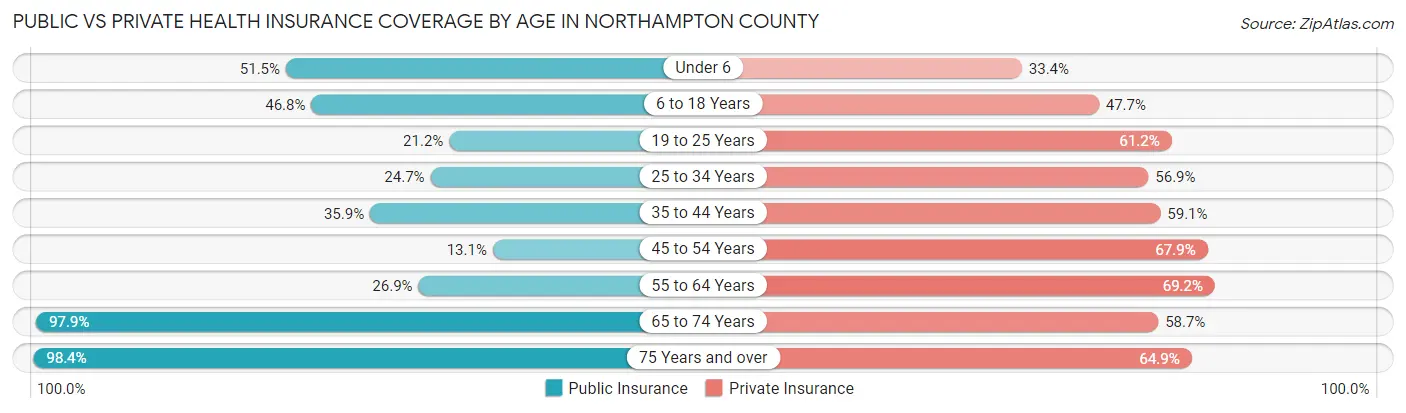
| Age Bracket | Public Insurance | Private Insurance |
| Under 6 | 376 (51.5%) | 244 (33.4%) |
| 6 to 18 Years | 762 (46.8%) | 777 (47.7%) |
| 19 to 25 Years | 159 (21.2%) | 459 (61.2%) |
| 25 to 34 Years | 252 (24.7%) | 581 (56.9%) |
| 35 to 44 Years | 403 (35.9%) | 664 (59.1%) |
| 45 to 54 Years | 171 (13.1%) | 885 (67.9%) |
| 55 to 64 Years | 556 (26.9%) | 1,431 (69.2%) |
| 65 to 74 Years | 1,850 (97.9%) | 1,110 (58.7%) |
| 75 Years and over | 1,326 (98.4%) | 875 (64.9%) |
| Total | 5,855 (49.4%) | 7,026 (59.2%) |
Disability Status by Sex by Age in Northampton County
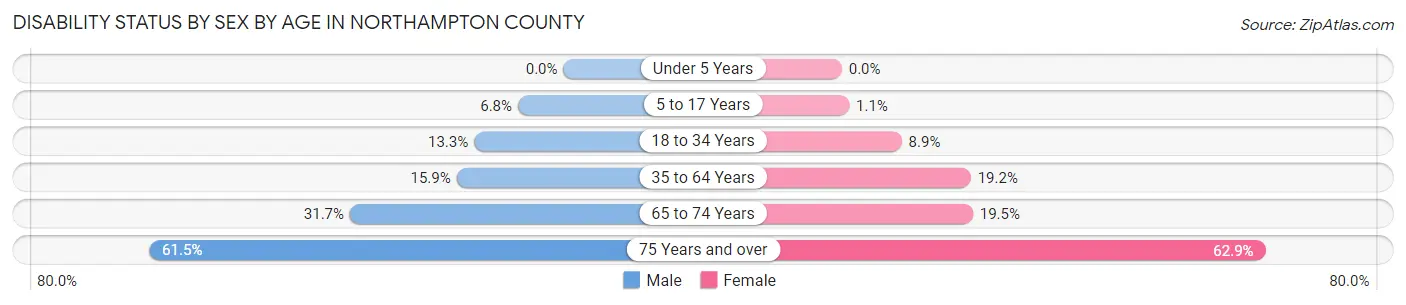
| Age Bracket | Male | Female |
| Under 5 Years | 0 (0.0%) | 0 (0.0%) |
| 5 to 17 Years | 64 (6.8%) | 9 (1.1%) |
| 18 to 34 Years | 113 (13.3%) | 85 (8.9%) |
| 35 to 64 Years | 326 (15.9%) | 467 (19.2%) |
| 65 to 74 Years | 278 (31.7%) | 197 (19.5%) |
| 75 Years and over | 345 (61.5%) | 495 (62.9%) |
Disability Class by Sex by Age in Northampton County
Disability Class: Hearing Difficulty
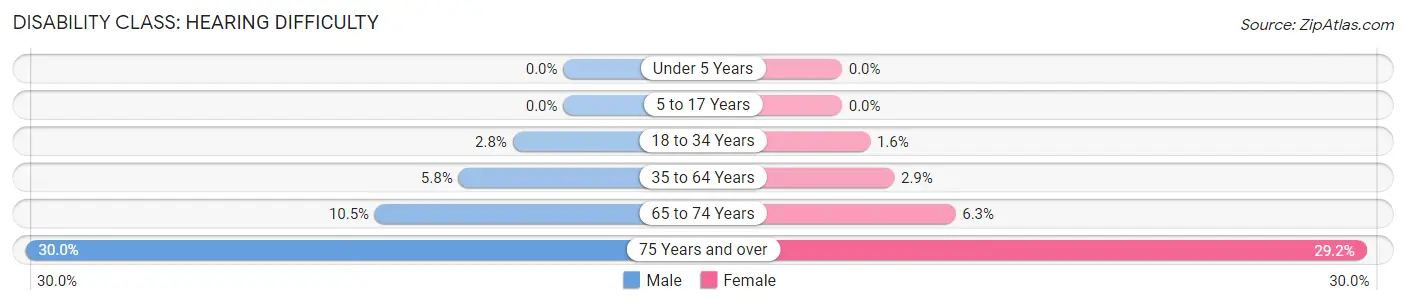
| Age Bracket | Male | Female |
| Under 5 Years | 0 (0.0%) | 0 (0.0%) |
| 5 to 17 Years | 0 (0.0%) | 0 (0.0%) |
| 18 to 34 Years | 24 (2.8%) | 15 (1.6%) |
| 35 to 64 Years | 120 (5.8%) | 71 (2.9%) |
| 65 to 74 Years | 92 (10.5%) | 64 (6.3%) |
| 75 Years and over | 168 (29.9%) | 230 (29.2%) |
Disability Class: Vision Difficulty
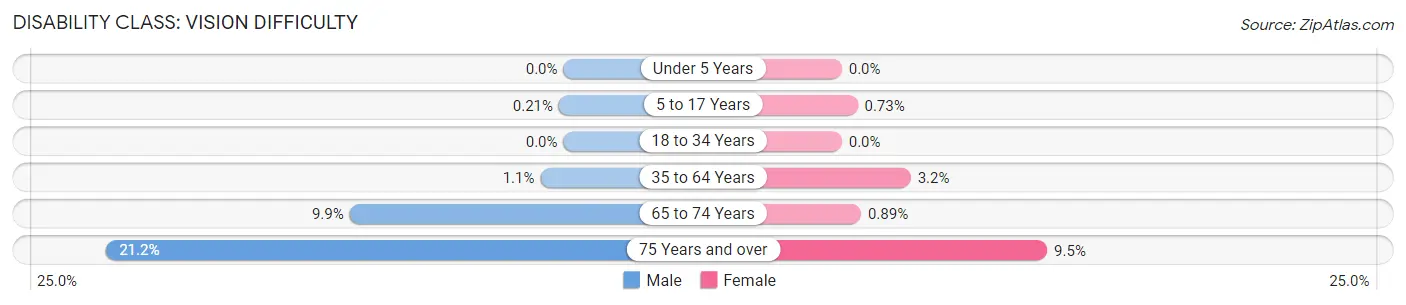
| Age Bracket | Male | Female |
| Under 5 Years | 0 (0.0%) | 0 (0.0%) |
| 5 to 17 Years | 2 (0.2%) | 6 (0.7%) |
| 18 to 34 Years | 0 (0.0%) | 0 (0.0%) |
| 35 to 64 Years | 22 (1.1%) | 78 (3.2%) |
| 65 to 74 Years | 87 (9.9%) | 9 (0.9%) |
| 75 Years and over | 119 (21.2%) | 75 (9.5%) |
Disability Class: Cognitive Difficulty
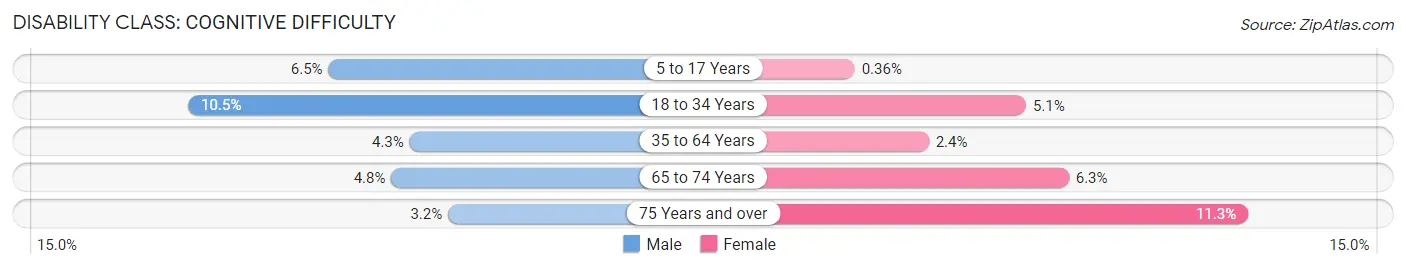
| Age Bracket | Male | Female |
| 5 to 17 Years | 62 (6.5%) | 3 (0.4%) |
| 18 to 34 Years | 89 (10.4%) | 49 (5.1%) |
| 35 to 64 Years | 88 (4.3%) | 59 (2.4%) |
| 65 to 74 Years | 42 (4.8%) | 64 (6.3%) |
| 75 Years and over | 18 (3.2%) | 89 (11.3%) |
Disability Class: Ambulatory Difficulty
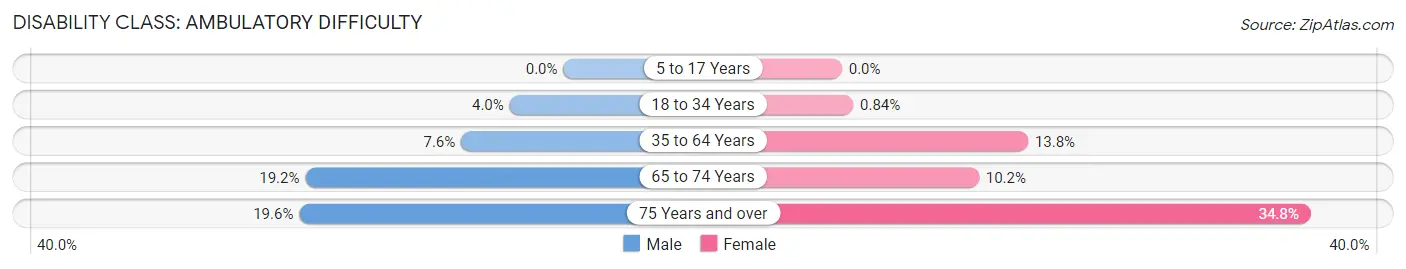
| Age Bracket | Male | Female |
| 5 to 17 Years | 0 (0.0%) | 0 (0.0%) |
| 18 to 34 Years | 34 (4.0%) | 8 (0.8%) |
| 35 to 64 Years | 156 (7.6%) | 337 (13.8%) |
| 65 to 74 Years | 168 (19.2%) | 103 (10.2%) |
| 75 Years and over | 110 (19.6%) | 274 (34.8%) |
Disability Class: Self-Care Difficulty
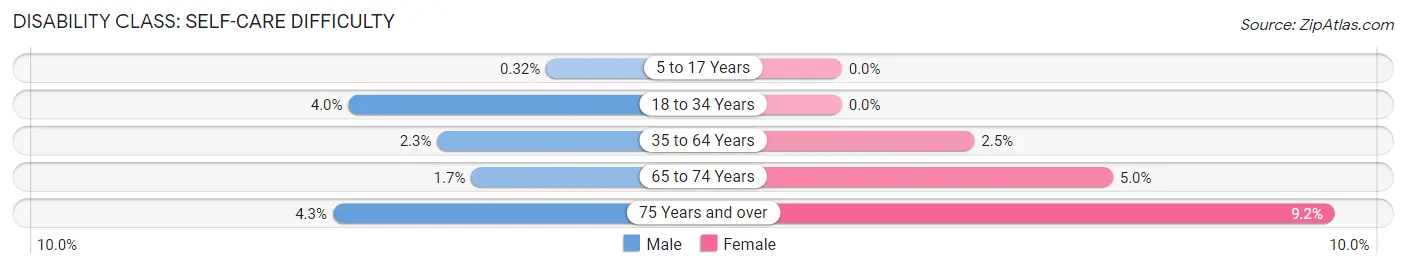
| Age Bracket | Male | Female |
| 5 to 17 Years | 3 (0.3%) | 0 (0.0%) |
| 18 to 34 Years | 34 (4.0%) | 0 (0.0%) |
| 35 to 64 Years | 48 (2.3%) | 60 (2.5%) |
| 65 to 74 Years | 15 (1.7%) | 51 (5.0%) |
| 75 Years and over | 24 (4.3%) | 72 (9.1%) |
Technology Access in Northampton County
Computing Device Access in Northampton County
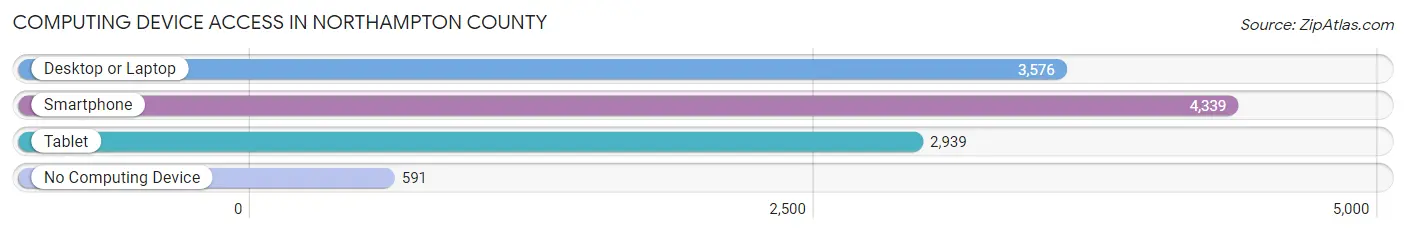
| Device Type | # Households | % Households |
| Desktop or Laptop | 3,576 | 66.9% |
| Smartphone | 4,339 | 81.2% |
| Tablet | 2,939 | 55.0% |
| No Computing Device | 591 | 11.1% |
| Total | 5,344 | 100.0% |
Internet Access in Northampton County
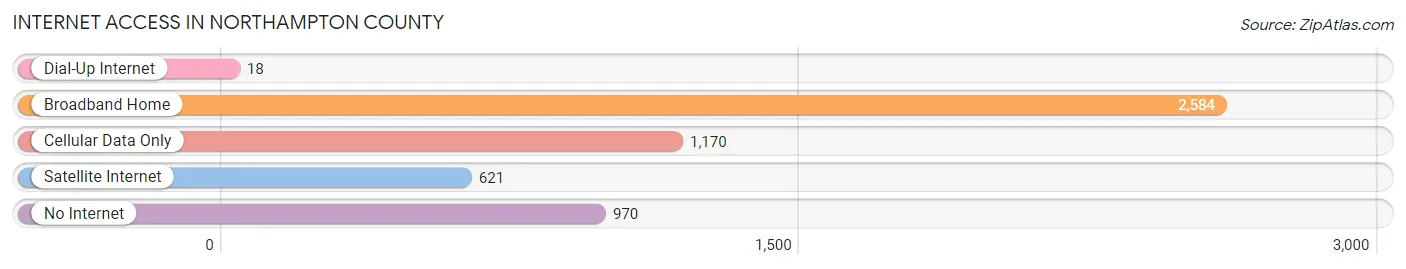
| Internet Type | # Households | % Households |
| Dial-Up Internet | 18 | 0.3% |
| Broadband Home | 2,584 | 48.3% |
| Cellular Data Only | 1,170 | 21.9% |
| Satellite Internet | 621 | 11.6% |
| No Internet | 970 | 18.1% |
| Total | 5,344 | 100.0% |
Northampton County Summary
Northampton County is located in the southeastern corner of Virginia, on the Eastern Shore of the Chesapeake Bay. It is bordered by Accomack County to the north, the Atlantic Ocean to the east, and the Chesapeake Bay to the south and west. The county seat is Eastville, and the county has a total area of 437 square miles.
Northampton County was established in 1634, and is one of the oldest counties in the United States. It was named for the English county of Northamptonshire, and was one of the eight original shires of Virginia. The county was originally part of the Virginia Colony, and was later part of the Commonwealth of Virginia.
The geography of Northampton County is mostly flat, with some rolling hills in the northern part of the county. The county is mostly rural, with a few small towns and villages. The largest town is Eastville, which is the county seat. Other towns include Exmore, Cape Charles, Cheriton, and Nassawadox.
The economy of Northampton County is largely based on agriculture and fishing. The county is home to several large farms, and is a major producer of corn, soybeans, and wheat. The county also has a thriving seafood industry, with many local fishermen harvesting oysters, crabs, and other seafood from the Chesapeake Bay.
The population of Northampton County was estimated to be 33,845 in 2020. The population is mostly white (83.3%), with African Americans making up the largest minority group (14.2%). The median household income in the county is $45,845, and the median home value is $179,000.
Northampton County is served by two public school systems, the Northampton County Public Schools and the Accomack County Public Schools. The county also has several private schools, including the Eastern Shore Academy and the Northampton County Christian Academy.
Northampton County is home to several historical sites, including the Cape Charles Historic District, the Eastville Historic District, and the Nassawadox Historic District. The county is also home to several parks and recreational areas, including the Eastern Shore of Virginia National Wildlife Refuge, the Chincoteague National Wildlife Refuge, and the Kiptopeke State Park.
Northampton County is a beautiful and historic area of Virginia, with a rich history and a vibrant economy. The county is home to a diverse population, and offers a variety of recreational activities and attractions. With its beautiful scenery, friendly people, and strong economy, Northampton County is an ideal place to live and work.
Common Questions
What is Per Capita Income in Northampton County?
Per Capita income in Northampton County is $37,321.
What is the Median Family Income in Northampton County?
Median Family Income in Northampton County is $75,313.
What is the Median Household income in Northampton County?
Median Household Income in Northampton County is $54,693.
What is Income or Wage Gap in Northampton County?
Income or Wage Gap in Northampton County is 31.3%.
Women in Northampton County earn 68.7 cents for every dollar earned by a man.
What is Family Income Deficit in Northampton County?
Family Income Deficit in Northampton County is $9,591.
Families that are below poverty line in Northampton County earn $9,591 less on average than the poverty threshold level.
What is Inequality or Gini Index in Northampton County?
Inequality or Gini Index in Northampton County is 0.50.
What is the Total Population of Northampton County?
Total Population of Northampton County is 12,132.
What is the Total Male Population of Northampton County?
Total Male Population of Northampton County is 5,722.
What is the Total Female Population of Northampton County?
Total Female Population of Northampton County is 6,410.
What is the Ratio of Males per 100 Females in Northampton County?
There are 89.27 Males per 100 Females in Northampton County.
What is the Ratio of Females per 100 Males in Northampton County?
There are 112.02 Females per 100 Males in Northampton County.
What is the Median Population Age in Northampton County?
Median Population Age in Northampton County is 51.3 Years.
What is the Average Family Size in Northampton County
Average Family Size in Northampton County is 2.8 People.
What is the Average Household Size in Northampton County
Average Household Size in Northampton County is 2.2 People.
How Large is the Labor Force in Northampton County?
There are 5,243 People in the Labor Forcein in Northampton County.
What is the Percentage of People in the Labor Force in Northampton County?
52.0% of People are in the Labor Force in Northampton County.
What is the Unemployment Rate in Northampton County?
Unemployment Rate in Northampton County is 4.8%.