New Kent County, VA Map & Demographics
New Kent County Map
New Kent County Overview
$49,666
PER CAPITA INCOME
$122,910
AVG FAMILY INCOME
$113,120
AVG HOUSEHOLD INCOME
22.9%
WAGE / INCOME GAP [ % ]
77.1¢/ $1
WAGE / INCOME GAP [ $ ]
0.38
INEQUALITY / GINI INDEX
23,296
TOTAL POPULATION
12,186
MALE POPULATION
11,110
FEMALE POPULATION
109.68
MALES / 100 FEMALES
91.17
FEMALES / 100 MALES
43.2
MEDIAN AGE
2.9
AVG FAMILY SIZE
2.6
AVG HOUSEHOLD SIZE
12,671
LABOR FORCE [ PEOPLE ]
65.5%
PERCENT IN LABOR FORCE
3.1%
UNEMPLOYMENT RATE
New Kent County Area Codes
Income in New Kent County
Income Overview in New Kent County
Per Capita Income in New Kent County is $49,666, while median incomes of families and households are $122,910 and $113,120 respectively.
| Characteristic | Number | Measure |
| Per Capita Income | 23,296 | $49,666 |
| Median Family Income | 6,856 | $122,910 |
| Mean Family Income | 6,856 | $144,506 |
| Median Household Income | 8,675 | $113,120 |
| Mean Household Income | 8,675 | $131,067 |
| Income Deficit | 6,856 | $0 |
| Wage / Income Gap (%) | 23,296 | 22.94% |
| Wage / Income Gap ($) | 23,296 | 77.06¢ per $1 |
| Gini / Inequality Index | 23,296 | 0.38 |
Earnings by Sex in New Kent County
Average Earnings in New Kent County are $54,045, $58,478 for men and $45,063 for women, a difference of 22.9%.
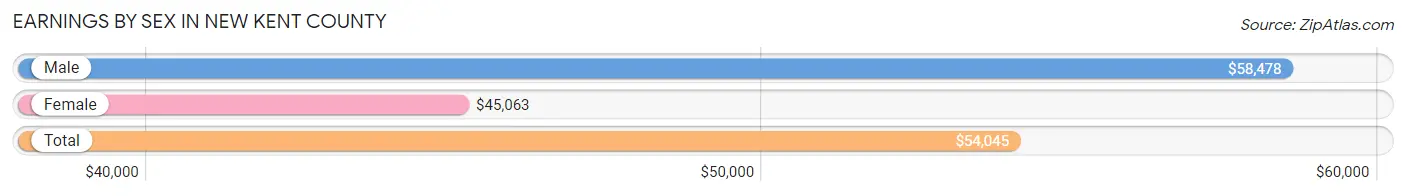
| Sex | Number | Average Earnings |
| Male | 7,694 (56.8%) | $58,478 |
| Female | 5,857 (43.2%) | $45,063 |
| Total | 13,551 (100.0%) | $54,045 |
Earnings by Sex by Income Bracket in New Kent County
The most common earnings brackets in New Kent County are $100,000+ for men (1,878 | 24.4%) and $100,000+ for women (951 | 16.2%).
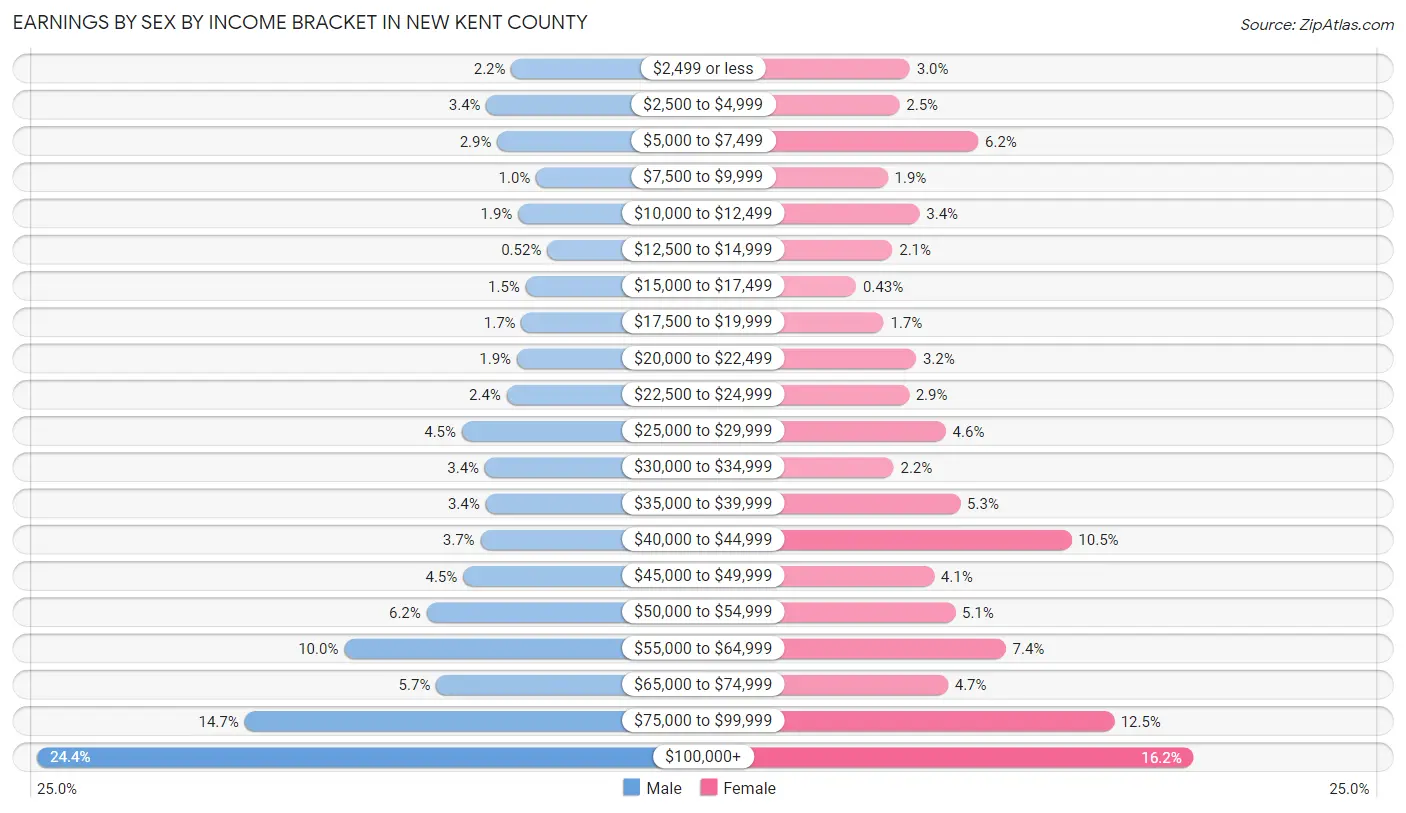
| Income | Male | Female |
| $2,499 or less | 169 (2.2%) | 173 (2.9%) |
| $2,500 to $4,999 | 259 (3.4%) | 144 (2.5%) |
| $5,000 to $7,499 | 220 (2.9%) | 360 (6.1%) |
| $7,500 to $9,999 | 80 (1.0%) | 112 (1.9%) |
| $10,000 to $12,499 | 145 (1.9%) | 199 (3.4%) |
| $12,500 to $14,999 | 40 (0.5%) | 125 (2.1%) |
| $15,000 to $17,499 | 118 (1.5%) | 25 (0.4%) |
| $17,500 to $19,999 | 133 (1.7%) | 101 (1.7%) |
| $20,000 to $22,499 | 149 (1.9%) | 190 (3.2%) |
| $22,500 to $24,999 | 186 (2.4%) | 170 (2.9%) |
| $25,000 to $29,999 | 348 (4.5%) | 271 (4.6%) |
| $30,000 to $34,999 | 265 (3.4%) | 128 (2.2%) |
| $35,000 to $39,999 | 262 (3.4%) | 311 (5.3%) |
| $40,000 to $44,999 | 281 (3.6%) | 616 (10.5%) |
| $45,000 to $49,999 | 343 (4.5%) | 239 (4.1%) |
| $50,000 to $54,999 | 475 (6.2%) | 297 (5.1%) |
| $55,000 to $64,999 | 772 (10.0%) | 436 (7.4%) |
| $65,000 to $74,999 | 440 (5.7%) | 277 (4.7%) |
| $75,000 to $99,999 | 1,131 (14.7%) | 732 (12.5%) |
| $100,000+ | 1,878 (24.4%) | 951 (16.2%) |
| Total | 7,694 (100.0%) | 5,857 (100.0%) |
Earnings by Sex by Educational Attainment in New Kent County
Average earnings in New Kent County are $64,496 for men and $47,453 for women, a difference of 26.4%. Men with an educational attainment of graduate degree enjoy the highest average annual earnings of $80,662, while those with less than high school education earn the least with $32,686. Women with an educational attainment of graduate degree earn the most with the average annual earnings of $82,625, while those with high school diploma education have the smallest earnings of $35,391.
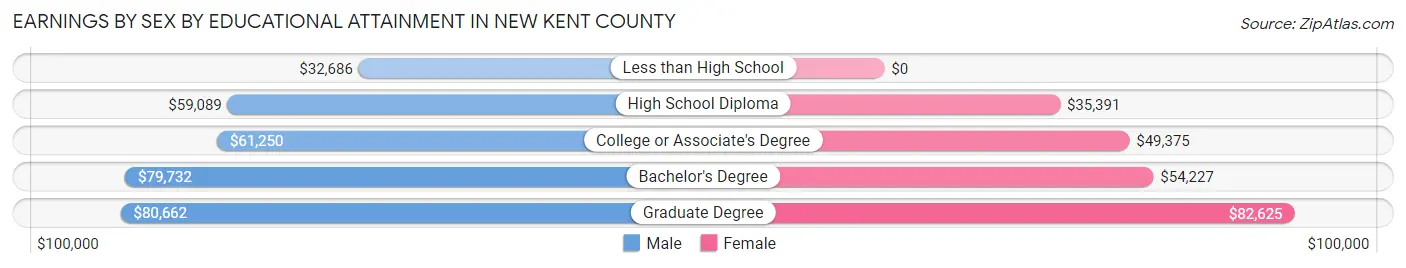
| Educational Attainment | Male Income | Female Income |
| Less than High School | $32,686 | $0 |
| High School Diploma | $59,089 | $35,391 |
| College or Associate's Degree | $61,250 | $49,375 |
| Bachelor's Degree | $79,732 | $54,227 |
| Graduate Degree | $80,662 | $82,625 |
| Total | $64,496 | $47,453 |
Family Income in New Kent County
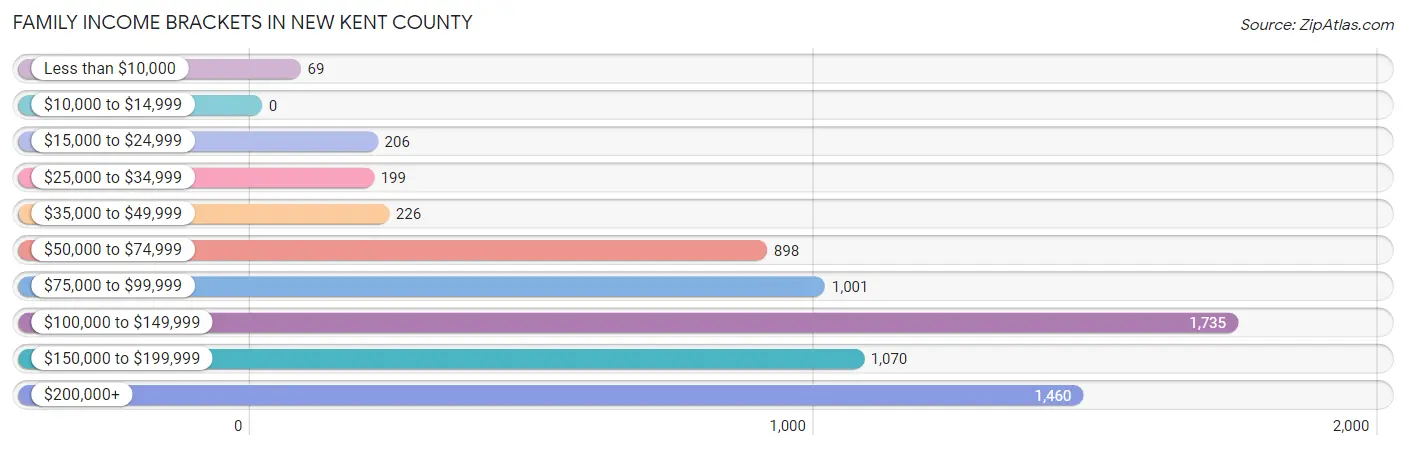
Family Income Brackets in New Kent County
According to the New Kent County family income data, there are 1,735 families falling into the $100,000 to $149,999 income range, which is the most common income bracket and makes up 25.3% of all families.
| Income Bracket | # Families | % Families |
| Less than $10,000 | 69 | 1.0% |
| $10,000 to $14,999 | 0 | 0.0% |
| $15,000 to $24,999 | 206 | 3.0% |
| $25,000 to $34,999 | 199 | 2.9% |
| $35,000 to $49,999 | 226 | 3.3% |
| $50,000 to $74,999 | 898 | 13.1% |
| $75,000 to $99,999 | 1,001 | 14.6% |
| $100,000 to $149,999 | 1,735 | 25.3% |
| $150,000 to $199,999 | 1,070 | 15.6% |
| $200,000+ | 1,460 | 21.3% |
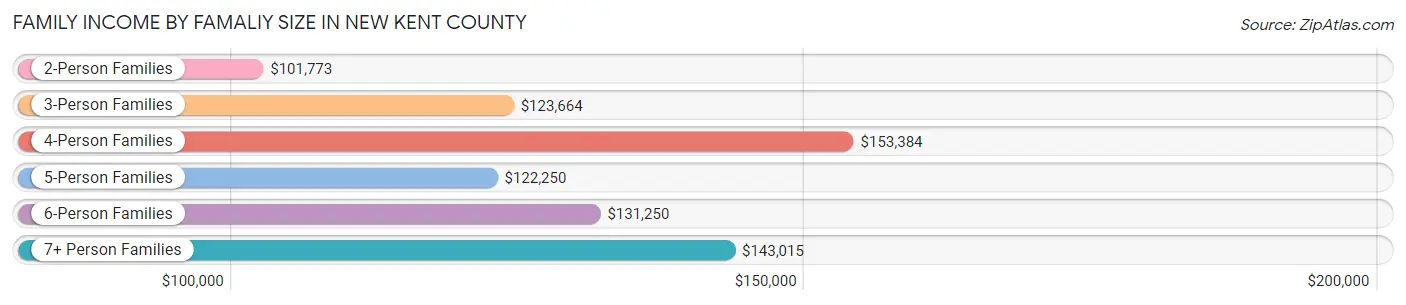
Family Income by Famaliy Size in New Kent County
4-person families (1,205 | 17.6%) account for the highest median family income in New Kent County with $153,384 per family, while 2-person families (3,234 | 47.2%) have the highest median income of $50,886 per family member.
| Income Bracket | # Families | Median Income |
| 2-Person Families | 3,234 (47.2%) | $101,773 |
| 3-Person Families | 1,586 (23.1%) | $123,664 |
| 4-Person Families | 1,205 (17.6%) | $153,384 |
| 5-Person Families | 525 (7.7%) | $122,250 |
| 6-Person Families | 197 (2.9%) | $131,250 |
| 7+ Person Families | 109 (1.6%) | $143,015 |
| Total | 6,856 (100.0%) | $122,910 |
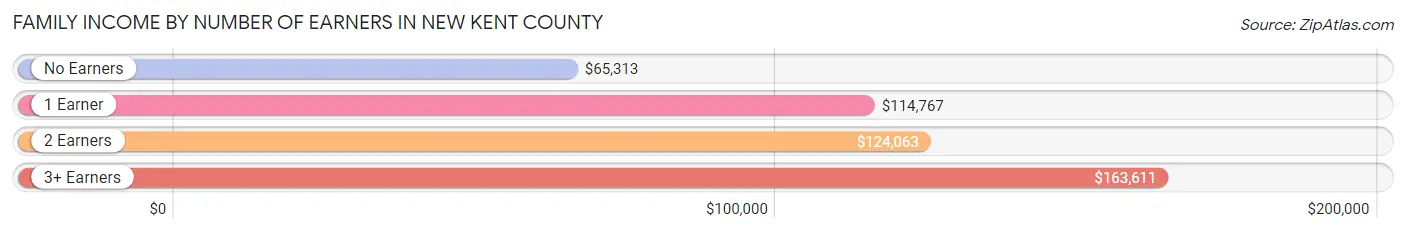
Family Income by Number of Earners in New Kent County
The median family income in New Kent County is $122,910, with families comprising 3+ earners (962) having the highest median family income of $163,611, while families with no earners (807) have the lowest median family income of $65,313, accounting for 14.0% and 11.8% of families, respectively.
| Number of Earners | # Families | Median Income |
| No Earners | 807 (11.8%) | $65,313 |
| 1 Earner | 1,994 (29.1%) | $114,767 |
| 2 Earners | 3,093 (45.1%) | $124,063 |
| 3+ Earners | 962 (14.0%) | $163,611 |
| Total | 6,856 (100.0%) | $122,910 |
Household Income in New Kent County
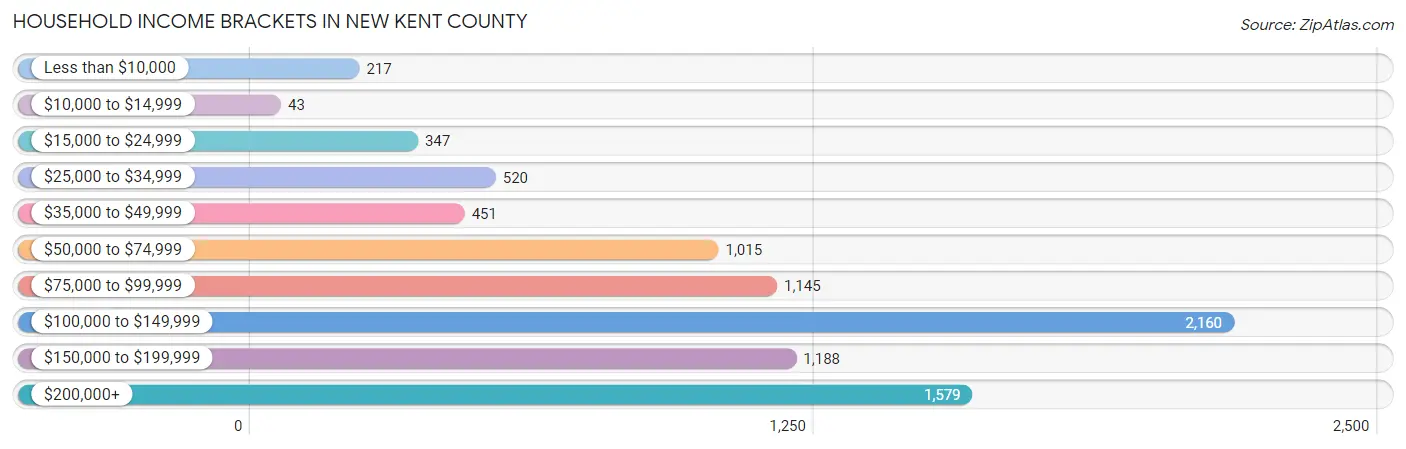
Household Income Brackets in New Kent County
With 2,160 households falling in the category, the $100,000 to $149,999 income range is the most frequent in New Kent County, accounting for 24.9% of all households. In contrast, only 43 households (0.5%) fall into the $10,000 to $14,999 income bracket, making it the least populous group.
| Income Bracket | # Households | % Households |
| Less than $10,000 | 217 | 2.5% |
| $10,000 to $14,999 | 43 | 0.5% |
| $15,000 to $24,999 | 347 | 4.0% |
| $25,000 to $34,999 | 520 | 6.0% |
| $35,000 to $49,999 | 451 | 5.2% |
| $50,000 to $74,999 | 1,015 | 11.7% |
| $75,000 to $99,999 | 1,145 | 13.2% |
| $100,000 to $149,999 | 2,160 | 24.9% |
| $150,000 to $199,999 | 1,188 | 13.7% |
| $200,000+ | 1,579 | 18.2% |
Household Income by Householder Age in New Kent County
The median household income in New Kent County is $113,120, with the highest median household income of $132,962 found in the 45 to 64 years age bracket for the primary householder. A total of 3,782 households (43.6%) fall into this category. Meanwhile, the 15 to 24 years age bracket for the primary householder has the lowest median household income of $0, with 65 households (0.7%) in this group.
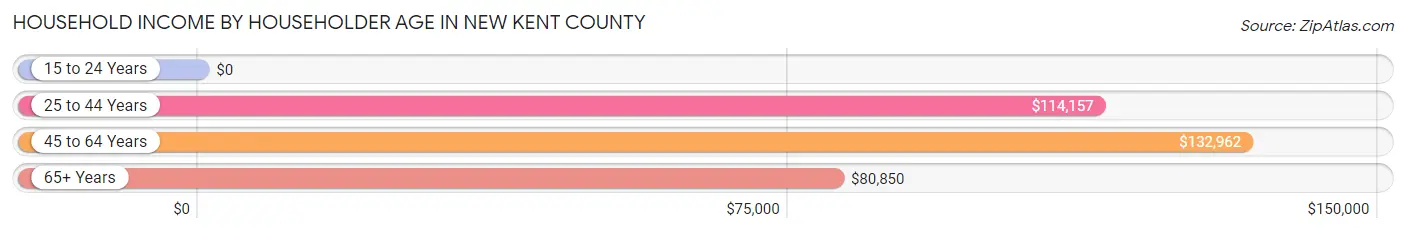
| Income Bracket | # Households | Median Income |
| 15 to 24 Years | 65 (0.7%) | $0 |
| 25 to 44 Years | 2,409 (27.8%) | $114,157 |
| 45 to 64 Years | 3,782 (43.6%) | $132,962 |
| 65+ Years | 2,419 (27.9%) | $80,850 |
| Total | 8,675 (100.0%) | $113,120 |
Poverty in New Kent County
Income Below Poverty by Sex and Age in New Kent County
With 2.7% poverty level for males and 5.2% for females among the residents of New Kent County, 12 to 14 year old males and 75 year old and over females are the most vulnerable to poverty, with 55 males (9.0%) and 142 females (16.5%) in their respective age groups living below the poverty level.
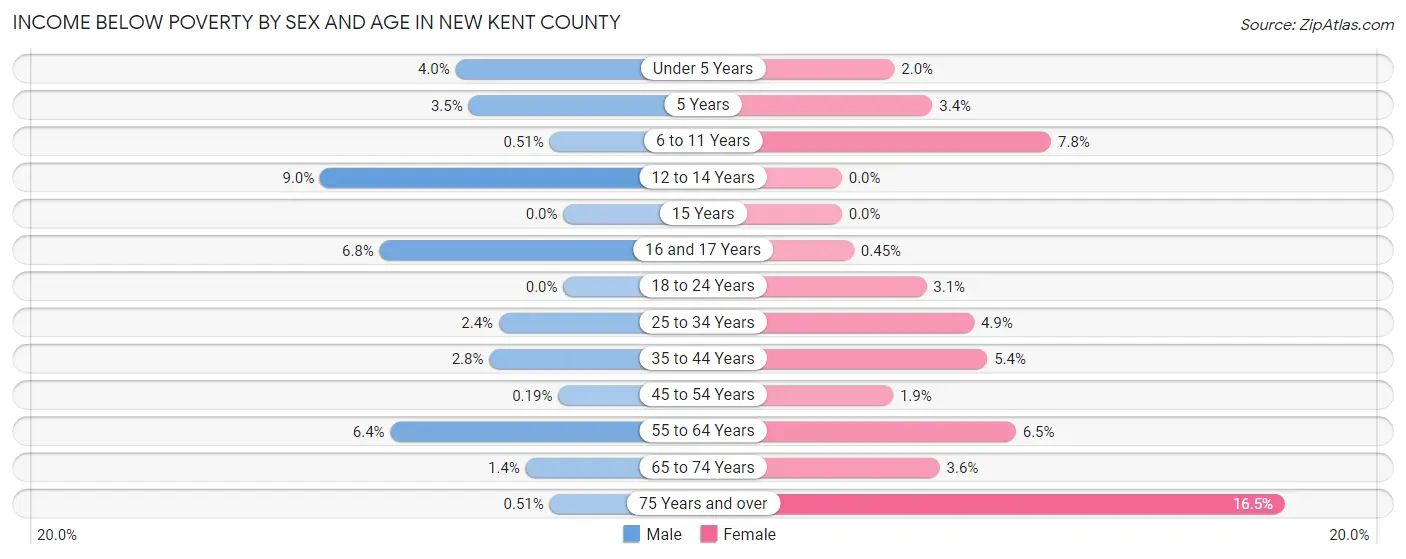
| Age Bracket | Male | Female |
| Under 5 Years | 20 (4.0%) | 9 (1.9%) |
| 5 Years | 5 (3.5%) | 5 (3.4%) |
| 6 to 11 Years | 4 (0.5%) | 52 (7.8%) |
| 12 to 14 Years | 55 (9.0%) | 0 (0.0%) |
| 15 Years | 0 (0.0%) | 0 (0.0%) |
| 16 and 17 Years | 18 (6.8%) | 1 (0.4%) |
| 18 to 24 Years | 0 (0.0%) | 13 (3.1%) |
| 25 to 34 Years | 32 (2.4%) | 76 (4.9%) |
| 35 to 44 Years | 45 (2.8%) | 75 (5.4%) |
| 45 to 54 Years | 3 (0.2%) | 31 (1.9%) |
| 55 to 64 Years | 111 (6.4%) | 122 (6.5%) |
| 65 to 74 Years | 20 (1.4%) | 47 (3.6%) |
| 75 Years and over | 3 (0.5%) | 142 (16.5%) |
| Total | 316 (2.7%) | 573 (5.2%) |
Income Above Poverty by Sex and Age in New Kent County
According to the poverty statistics in New Kent County, males aged 15 years and females aged 12 to 14 years are the age groups that are most secure financially, with 100.0% of males and 100.0% of females in these age groups living above the poverty line.
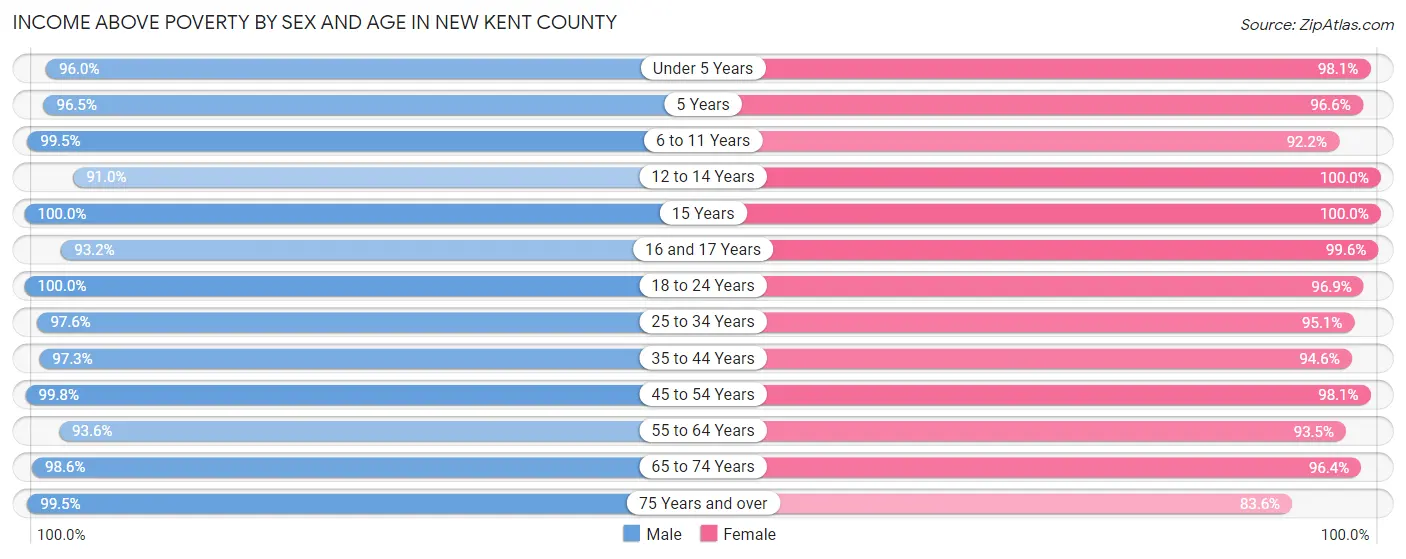
| Age Bracket | Male | Female |
| Under 5 Years | 480 (96.0%) | 452 (98.1%) |
| 5 Years | 137 (96.5%) | 144 (96.6%) |
| 6 to 11 Years | 780 (99.5%) | 617 (92.2%) |
| 12 to 14 Years | 554 (91.0%) | 421 (100.0%) |
| 15 Years | 126 (100.0%) | 71 (100.0%) |
| 16 and 17 Years | 246 (93.2%) | 220 (99.6%) |
| 18 to 24 Years | 906 (100.0%) | 401 (96.9%) |
| 25 to 34 Years | 1,305 (97.6%) | 1,473 (95.1%) |
| 35 to 44 Years | 1,592 (97.3%) | 1,313 (94.6%) |
| 45 to 54 Years | 1,610 (99.8%) | 1,598 (98.1%) |
| 55 to 64 Years | 1,618 (93.6%) | 1,768 (93.5%) |
| 65 to 74 Years | 1,406 (98.6%) | 1,247 (96.4%) |
| 75 Years and over | 590 (99.5%) | 721 (83.6%) |
| Total | 11,350 (97.3%) | 10,446 (94.8%) |
Income Below Poverty Among Married-Couple Families in New Kent County
The poverty statistics for married-couple families in New Kent County show that 1.9% or 113 of the total 5,960 families live below the poverty line. Families with 3 or 4 children have the highest poverty rate of 3.2%, comprising of 13 families. On the other hand, families with 5 or more children have the lowest poverty rate of 0.0%, which includes 0 families.
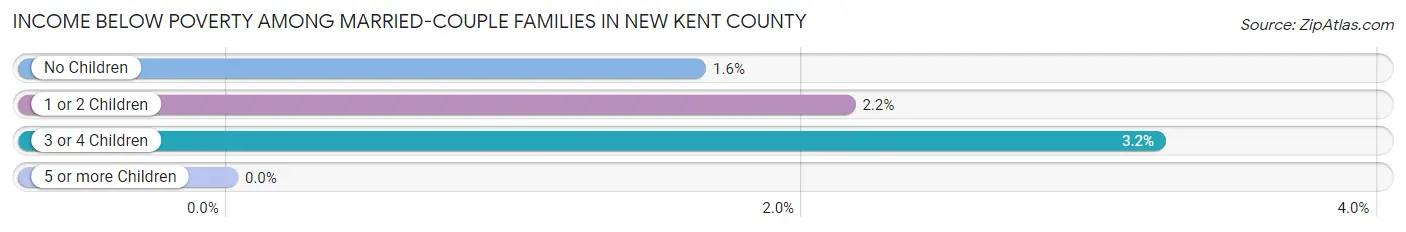
| Children | Above Poverty | Below Poverty |
| No Children | 3,431 (98.4%) | 57 (1.6%) |
| 1 or 2 Children | 1,955 (97.9%) | 43 (2.1%) |
| 3 or 4 Children | 389 (96.8%) | 13 (3.2%) |
| 5 or more Children | 72 (100.0%) | 0 (0.0%) |
| Total | 5,847 (98.1%) | 113 (1.9%) |
Income Below Poverty Among Single-Parent Households in New Kent County
According to the poverty data in New Kent County, 19.1% or 45 single-father households and 10.9% or 72 single-mother households are living below the poverty line. Among single-father households, those with 1 or 2 children have the highest poverty rate, with 45 households (42.1%) experiencing poverty. Likewise, among single-mother households, those with 3 or 4 children have the highest poverty rate, with 16 households (100.0%) falling below the poverty line.
| Children | Single Father | Single Mother |
| No Children | 0 (0.0%) | 0 (0.0%) |
| 1 or 2 Children | 45 (42.1%) | 56 (17.4%) |
| 3 or 4 Children | 0 (0.0%) | 16 (100.0%) |
| 5 or more Children | 0 (0.0%) | 0 (0.0%) |
| Total | 45 (19.1%) | 72 (10.9%) |
Income Below Poverty Among Married-Couple vs Single-Parent Households in New Kent County
The poverty data for New Kent County shows that 113 of the married-couple family households (1.9%) and 117 of the single-parent households (13.1%) are living below the poverty level. Within the married-couple family households, those with 3 or 4 children have the highest poverty rate, with 13 households (3.2%) falling below the poverty line. Among the single-parent households, those with 3 or 4 children have the highest poverty rate, with 16 household (100.0%) living below poverty.
| Children | Married-Couple Families | Single-Parent Households |
| No Children | 57 (1.6%) | 0 (0.0%) |
| 1 or 2 Children | 43 (2.1%) | 101 (23.6%) |
| 3 or 4 Children | 13 (3.2%) | 16 (100.0%) |
| 5 or more Children | 0 (0.0%) | 0 (0.0%) |
| Total | 113 (1.9%) | 117 (13.1%) |
Race in New Kent County
The most populous races in New Kent County are White / Caucasian (18,464 | 79.3%), Black / African American (3,058 | 13.1%), and Two or more Races (1,071 | 4.6%).
| Race | # Population | % Population |
| Asian | 264 | 1.1% |
| Black / African American | 3,058 | 13.1% |
| Hawaiian / Pacific | 0 | 0.0% |
| Hispanic or Latino | 931 | 4.0% |
| Native / Alaskan | 159 | 0.7% |
| White / Caucasian | 18,464 | 79.3% |
| Two or more Races | 1,071 | 4.6% |
| Some other Race | 280 | 1.2% |
| Total | 23,296 | 100.0% |
Ancestry in New Kent County
The most populous ancestries reported in New Kent County are English (5,018 | 21.5%), German (3,169 | 13.6%), American (2,986 | 12.8%), Irish (2,980 | 12.8%), and Italian (1,072 | 4.6%), together accounting for 65.4% of all New Kent County residents.
| Ancestry | # Population | % Population |
| African | 151 | 0.6% |
| American | 2,986 | 12.8% |
| Arab | 108 | 0.5% |
| Armenian | 46 | 0.2% |
| Austrian | 48 | 0.2% |
| Basque | 45 | 0.2% |
| Bhutanese | 140 | 0.6% |
| British | 185 | 0.8% |
| Burmese | 42 | 0.2% |
| Canadian | 11 | 0.1% |
| Central American | 330 | 1.4% |
| Central American Indian | 45 | 0.2% |
| Cherokee | 42 | 0.2% |
| Cheyenne | 8 | 0.0% |
| Colombian | 134 | 0.6% |
| Czech | 9 | 0.0% |
| Danish | 105 | 0.4% |
| Dominican | 30 | 0.1% |
| Dutch | 273 | 1.2% |
| Eastern European | 61 | 0.3% |
| Egyptian | 42 | 0.2% |
| English | 5,018 | 21.5% |
| European | 826 | 3.5% |
| Finnish | 30 | 0.1% |
| French | 256 | 1.1% |
| German | 3,169 | 13.6% |
| Greek | 45 | 0.2% |
| Guatemalan | 24 | 0.1% |
| Hungarian | 70 | 0.3% |
| Indian (Asian) | 185 | 0.8% |
| Irish | 2,980 | 12.8% |
| Italian | 1,072 | 4.6% |
| Jamaican | 76 | 0.3% |
| Korean | 101 | 0.4% |
| Lithuanian | 2 | 0.0% |
| Mexican | 190 | 0.8% |
| Moroccan | 48 | 0.2% |
| Northern European | 15 | 0.1% |
| Norwegian | 196 | 0.8% |
| Panamanian | 88 | 0.4% |
| Polish | 667 | 2.9% |
| Portuguese | 6 | 0.0% |
| Puerto Rican | 122 | 0.5% |
| Romanian | 39 | 0.2% |
| Russian | 174 | 0.7% |
| Salvadoran | 218 | 0.9% |
| Samoan | 4 | 0.0% |
| Scandinavian | 81 | 0.4% |
| Scotch-Irish | 354 | 1.5% |
| Scottish | 559 | 2.4% |
| Seminole | 33 | 0.1% |
| Sioux | 32 | 0.1% |
| Slovak | 16 | 0.1% |
| Slovene | 13 | 0.1% |
| South American | 172 | 0.7% |
| Spanish | 87 | 0.4% |
| Sri Lankan | 62 | 0.3% |
| Subsaharan African | 151 | 0.6% |
| Swedish | 130 | 0.6% |
| Swiss | 41 | 0.2% |
| Syrian | 7 | 0.0% |
| Ukrainian | 23 | 0.1% |
| Uruguayan | 38 | 0.2% |
| Welsh | 106 | 0.5% | View All 64 Rows |
Immigrants in New Kent County
The most numerous immigrant groups reported in New Kent County came from Latin America (319 | 1.4%), Europe (254 | 1.1%), Central America (244 | 1.1%), Asia (222 | 0.9%), and Germany (161 | 0.7%), together accounting for 5.2% of all New Kent County residents.
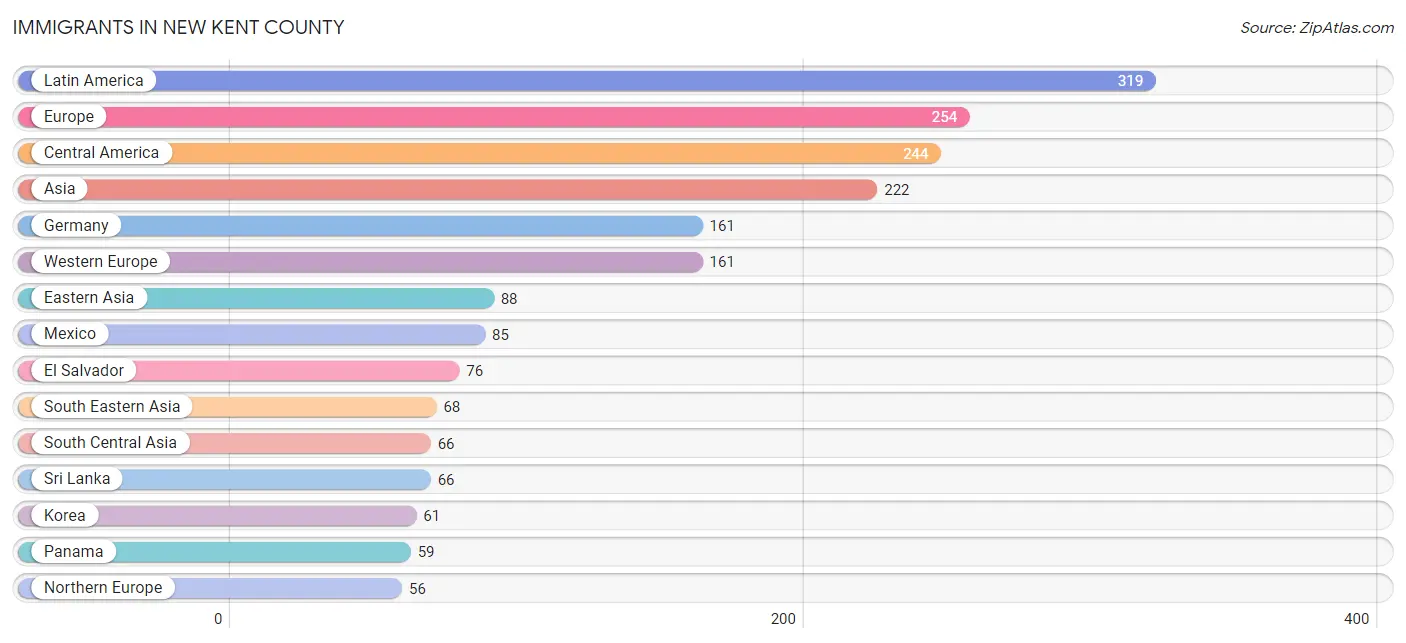
| Immigration Origin | # Population | % Population |
| Africa | 14 | 0.1% |
| Asia | 222 | 0.9% |
| Caribbean | 37 | 0.2% |
| Central America | 244 | 1.1% |
| China | 27 | 0.1% |
| Denmark | 13 | 0.1% |
| Eastern Asia | 88 | 0.4% |
| Eastern Europe | 37 | 0.2% |
| Egypt | 12 | 0.1% |
| El Salvador | 76 | 0.3% |
| England | 15 | 0.1% |
| Europe | 254 | 1.1% |
| Germany | 161 | 0.7% |
| Guatemala | 24 | 0.1% |
| Jamaica | 37 | 0.2% |
| Korea | 61 | 0.3% |
| Latin America | 319 | 1.4% |
| Mexico | 85 | 0.4% |
| Morocco | 2 | 0.0% |
| Northern Africa | 14 | 0.1% |
| Northern Europe | 56 | 0.2% |
| Oceania | 4 | 0.0% |
| Panama | 59 | 0.3% |
| Philippines | 20 | 0.1% |
| Russia | 37 | 0.2% |
| South America | 38 | 0.2% |
| South Central Asia | 66 | 0.3% |
| South Eastern Asia | 68 | 0.3% |
| Sri Lanka | 66 | 0.3% |
| Taiwan | 11 | 0.1% |
| Uruguay | 38 | 0.2% |
| Vietnam | 48 | 0.2% |
| Western Europe | 161 | 0.7% | View All 33 Rows |
Sex and Age in New Kent County
Sex and Age in New Kent County
The most populous age groups in New Kent County are 55 to 59 Years (952 | 7.8%) for men and 60 to 64 Years (1,017 | 9.1%) for women.
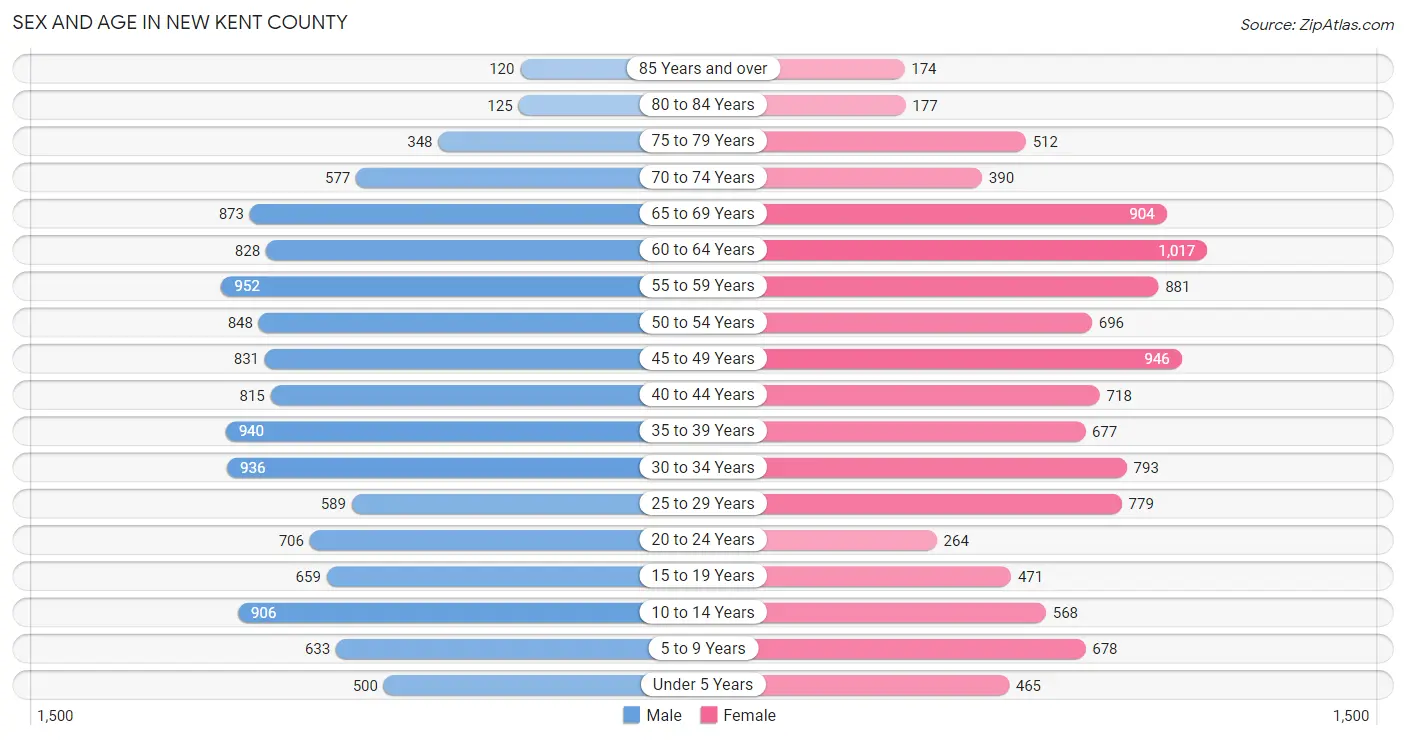
| Age Bracket | Male | Female |
| Under 5 Years | 500 (4.1%) | 465 (4.2%) |
| 5 to 9 Years | 633 (5.2%) | 678 (6.1%) |
| 10 to 14 Years | 906 (7.4%) | 568 (5.1%) |
| 15 to 19 Years | 659 (5.4%) | 471 (4.2%) |
| 20 to 24 Years | 706 (5.8%) | 264 (2.4%) |
| 25 to 29 Years | 589 (4.8%) | 779 (7.0%) |
| 30 to 34 Years | 936 (7.7%) | 793 (7.1%) |
| 35 to 39 Years | 940 (7.7%) | 677 (6.1%) |
| 40 to 44 Years | 815 (6.7%) | 718 (6.5%) |
| 45 to 49 Years | 831 (6.8%) | 946 (8.5%) |
| 50 to 54 Years | 848 (7.0%) | 696 (6.3%) |
| 55 to 59 Years | 952 (7.8%) | 881 (7.9%) |
| 60 to 64 Years | 828 (6.8%) | 1,017 (9.1%) |
| 65 to 69 Years | 873 (7.2%) | 904 (8.1%) |
| 70 to 74 Years | 577 (4.7%) | 390 (3.5%) |
| 75 to 79 Years | 348 (2.9%) | 512 (4.6%) |
| 80 to 84 Years | 125 (1.0%) | 177 (1.6%) |
| 85 Years and over | 120 (1.0%) | 174 (1.6%) |
| Total | 12,186 (100.0%) | 11,110 (100.0%) |
Families and Households in New Kent County
Median Family Size in New Kent County
The median family size in New Kent County is 2.91 persons per family, with married-couple families (5,960 | 86.9%) accounting for the largest median family size of 2.94 persons per family. On the other hand, single male/father families (236 | 3.4%) represent the smallest median family size with 2.04 persons per family.
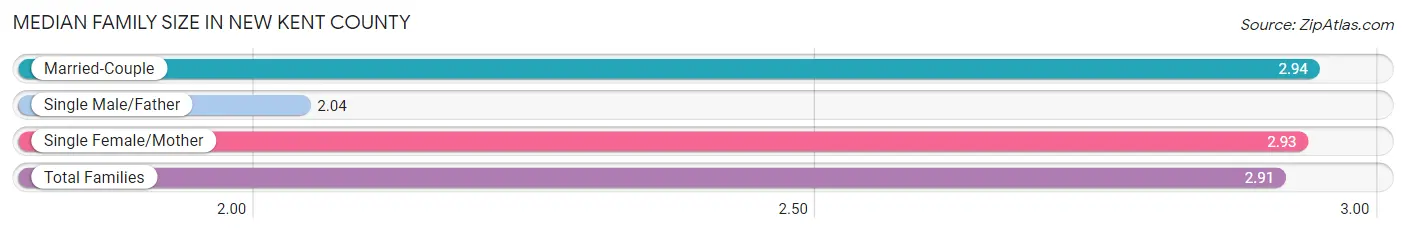
| Family Type | # Families | Family Size |
| Married-Couple | 5,960 (86.9%) | 2.94 |
| Single Male/Father | 236 (3.4%) | 2.04 |
| Single Female/Mother | 660 (9.6%) | 2.93 |
| Total Families | 6,856 (100.0%) | 2.91 |
Median Household Size in New Kent County
The median household size in New Kent County is 2.61 persons per household, with single female/mother households (660 | 7.6%) accounting for the largest median household size of 3.07 persons per household. non-family households (1,819 | 21.0%) represent the smallest median household size with 1.36 persons per household.
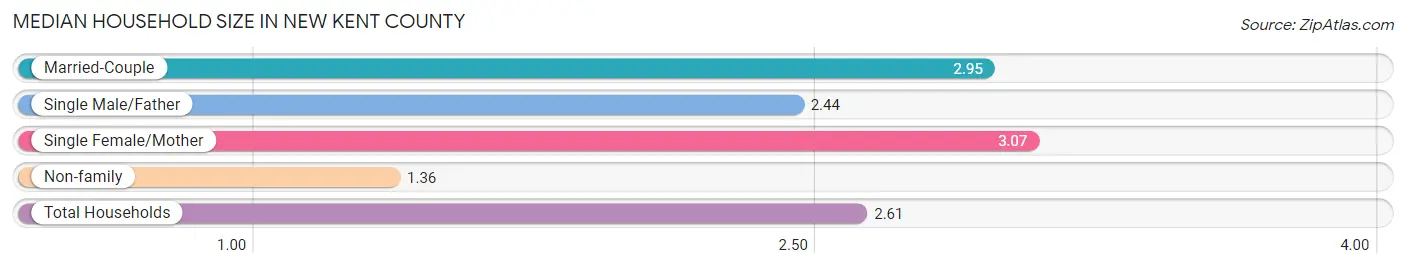
| Household Type | # Households | Household Size |
| Married-Couple | 5,960 (68.7%) | 2.95 |
| Single Male/Father | 236 (2.7%) | 2.44 |
| Single Female/Mother | 660 (7.6%) | 3.07 |
| Non-family | 1,819 (21.0%) | 1.36 |
| Total Households | 8,675 (100.0%) | 2.61 |
Household Size by Marriage Status in New Kent County
Out of a total of 8,675 households in New Kent County, 6,856 (79.0%) are family households, while 1,819 (21.0%) are nonfamily households. The most numerous type of family households are 2-person households, comprising 3,070, and the most common type of nonfamily households are 1-person households, comprising 1,503.
| Household Size | Family Households | Nonfamily Households |
| 1-Person Households | - | 1,503 (17.3%) |
| 2-Person Households | 3,070 (35.4%) | 230 (2.6%) |
| 3-Person Households | 1,698 (19.6%) | 40 (0.5%) |
| 4-Person Households | 1,255 (14.5%) | 0 (0.0%) |
| 5-Person Households | 517 (6.0%) | 46 (0.5%) |
| 6-Person Households | 207 (2.4%) | 0 (0.0%) |
| 7+ Person Households | 109 (1.3%) | 0 (0.0%) |
| Total | 6,856 (79.0%) | 1,819 (21.0%) |
Female Fertility in New Kent County
Fertility by Age in New Kent County
Average fertility rate in New Kent County is 85.0 births per 1,000 women. Women in the age bracket of 20 to 34 years have the highest fertility rate with 171.0 births per 1,000 women. Women in the age bracket of 20 to 34 years acount for 77.1% of all women with births.
| Age Bracket | Women with Births | Births / 1,000 Women |
| 15 to 19 years | 0 (0.0%) | 0.0 |
| 20 to 34 years | 314 (77.1%) | 171.0 |
| 35 to 50 years | 93 (22.9%) | 38.0 |
| Total | 407 (100.0%) | 85.0 |
Fertility by Age by Marriage Status in New Kent County
97.8% of women with births (407) in New Kent County are married. The highest percentage of unmarried women with births falls into 20 to 34 years age bracket with 2.9% of them unmarried at the time of birth, while the lowest percentage of unmarried women with births belong to 35 to 50 years age bracket with 0.0% of them unmarried.
| Age Bracket | Married | Unmarried |
| 15 to 19 years | 0 (0.0%) | 0 (0.0%) |
| 20 to 34 years | 305 (97.1%) | 9 (2.9%) |
| 35 to 50 years | 93 (100.0%) | 0 (0.0%) |
| Total | 398 (97.8%) | 9 (2.2%) |
Fertility by Education in New Kent County
| Educational Attainment | Women with Births | Births / 1,000 Women |
| Less than High School | 0 (0.0%) | 0.0 |
| High School Diploma | 34 (8.4%) | 31.0 |
| College or Associate's Degree | 91 (22.4%) | 66.0 |
| Bachelor's Degree | 182 (44.7%) | 138.0 |
| Graduate Degree | 100 (24.6%) | 194.0 |
| Total | 407 (100.0%) | 85.0 |
Fertility by Education by Marriage Status in New Kent County
2.2% of women with births in New Kent County are unmarried. Women with the educational attainment of high school diploma are most likely to be married with 100.0% of them married at childbirth, while women with the educational attainment of college or associate's degree are least likely to be married with 9.9% of them unmarried at childbirth.
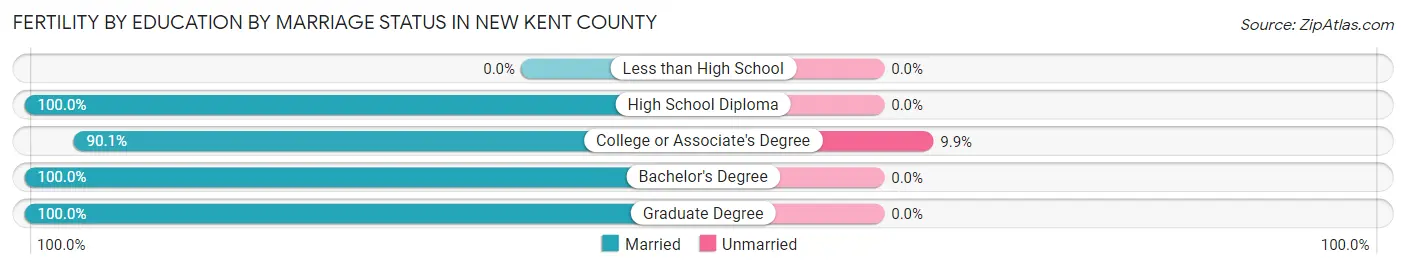
| Educational Attainment | Married | Unmarried |
| Less than High School | 0 (0.0%) | 0 (0.0%) |
| High School Diploma | 34 (100.0%) | 0 (0.0%) |
| College or Associate's Degree | 82 (90.1%) | 9 (9.9%) |
| Bachelor's Degree | 182 (100.0%) | 0 (0.0%) |
| Graduate Degree | 100 (100.0%) | 0 (0.0%) |
| Total | 398 (97.8%) | 9 (2.2%) |
Employment Characteristics in New Kent County
Employment by Class of Employer in New Kent County
Among the 12,083 employed individuals in New Kent County, private company employees (7,611 | 63.0%), local government employees (998 | 8.3%), and state government employees (975 | 8.1%) make up the most common classes of employment.
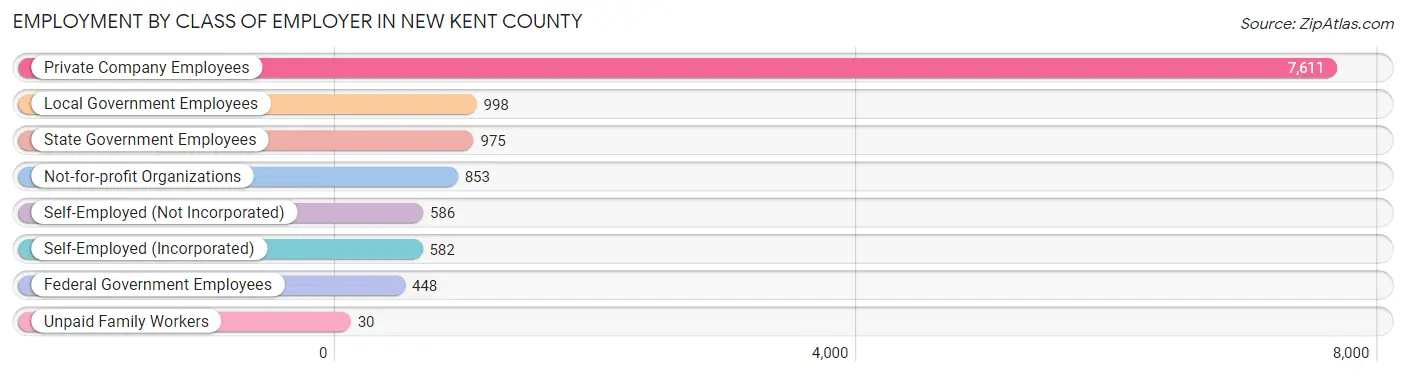
| Employer Class | # Employees | % Employees |
| Private Company Employees | 7,611 | 63.0% |
| Self-Employed (Incorporated) | 582 | 4.8% |
| Self-Employed (Not Incorporated) | 586 | 4.9% |
| Not-for-profit Organizations | 853 | 7.1% |
| Local Government Employees | 998 | 8.3% |
| State Government Employees | 975 | 8.1% |
| Federal Government Employees | 448 | 3.7% |
| Unpaid Family Workers | 30 | 0.3% |
| Total | 12,083 | 100.0% |
Employment Status by Age in New Kent County
According to the labor force statistics for New Kent County, out of the total population over 16 years of age (19,345), 65.5% or 12,671 individuals are in the labor force, with 3.1% or 393 of them unemployed. The age group with the highest labor force participation rate is 45 to 54 years, with 90.1% or 2,992 individuals in the labor force. Within the labor force, the 25 to 29 years age range has the highest percentage of unemployed individuals, with 8.3% or 98 of them being unemployed.
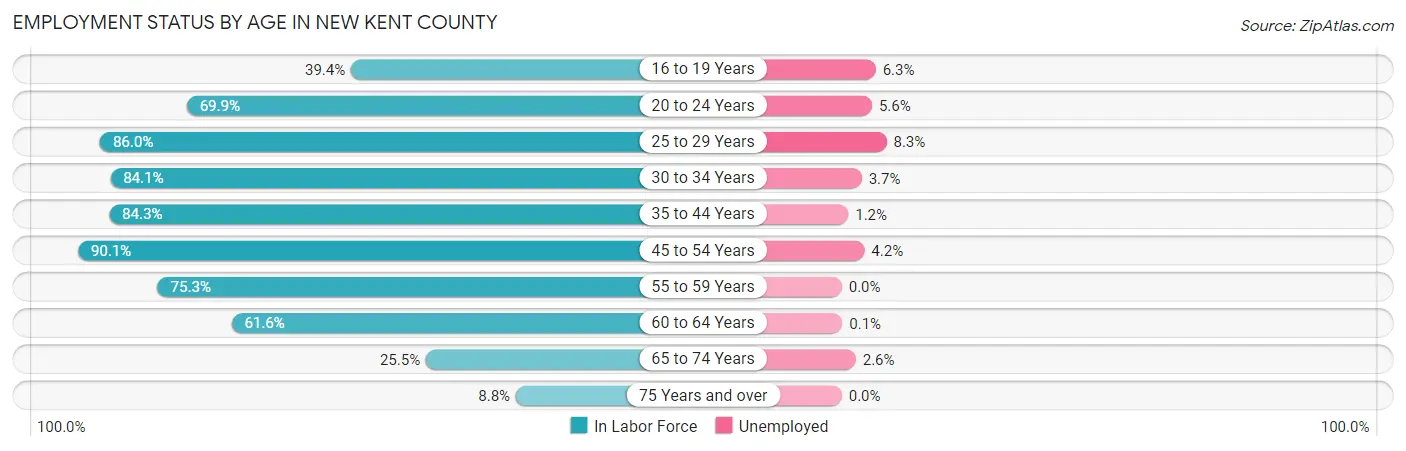
| Age Bracket | In Labor Force | Unemployed |
| 16 to 19 Years | 366 (39.4%) | 23 (6.3%) |
| 20 to 24 Years | 678 (69.9%) | 38 (5.6%) |
| 25 to 29 Years | 1,176 (86.0%) | 98 (8.3%) |
| 30 to 34 Years | 1,454 (84.1%) | 54 (3.7%) |
| 35 to 44 Years | 2,655 (84.3%) | 32 (1.2%) |
| 45 to 54 Years | 2,992 (90.1%) | 126 (4.2%) |
| 55 to 59 Years | 1,380 (75.3%) | 0 (0.0%) |
| 60 to 64 Years | 1,137 (61.6%) | 1 (0.1%) |
| 65 to 74 Years | 700 (25.5%) | 18 (2.6%) |
| 75 Years and over | 128 (8.8%) | 0 (0.0%) |
| Total | 12,671 (65.5%) | 393 (3.1%) |
Employment Status by Educational Attainment in New Kent County
According to labor force statistics for New Kent County, 81.5% of individuals (10,795) out of the total population between 25 and 64 years of age (13,246) are in the labor force, with 2.8% or 302 of them being unemployed. The group with the highest labor force participation rate are those with the educational attainment of bachelor's degree or higher, with 83.9% or 3,918 individuals in the labor force. Within the labor force, individuals with high school diploma education have the highest percentage of unemployment, with 4.2% or 127 of them being unemployed.
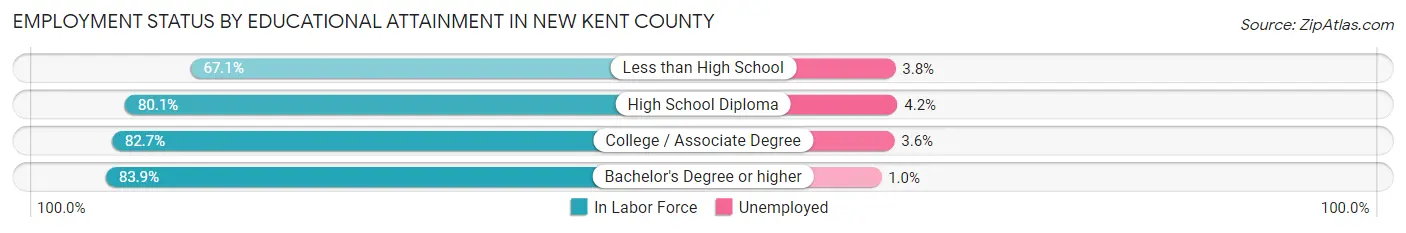
| Educational Attainment | In Labor Force | Unemployed |
| Less than High School | 494 (67.1%) | 28 (3.8%) |
| High School Diploma | 3,017 (80.1%) | 158 (4.2%) |
| College / Associate Degree | 3,368 (82.7%) | 147 (3.6%) |
| Bachelor's Degree or higher | 3,918 (83.9%) | 47 (1.0%) |
| Total | 10,795 (81.5%) | 371 (2.8%) |
Employment Occupations by Sex in New Kent County
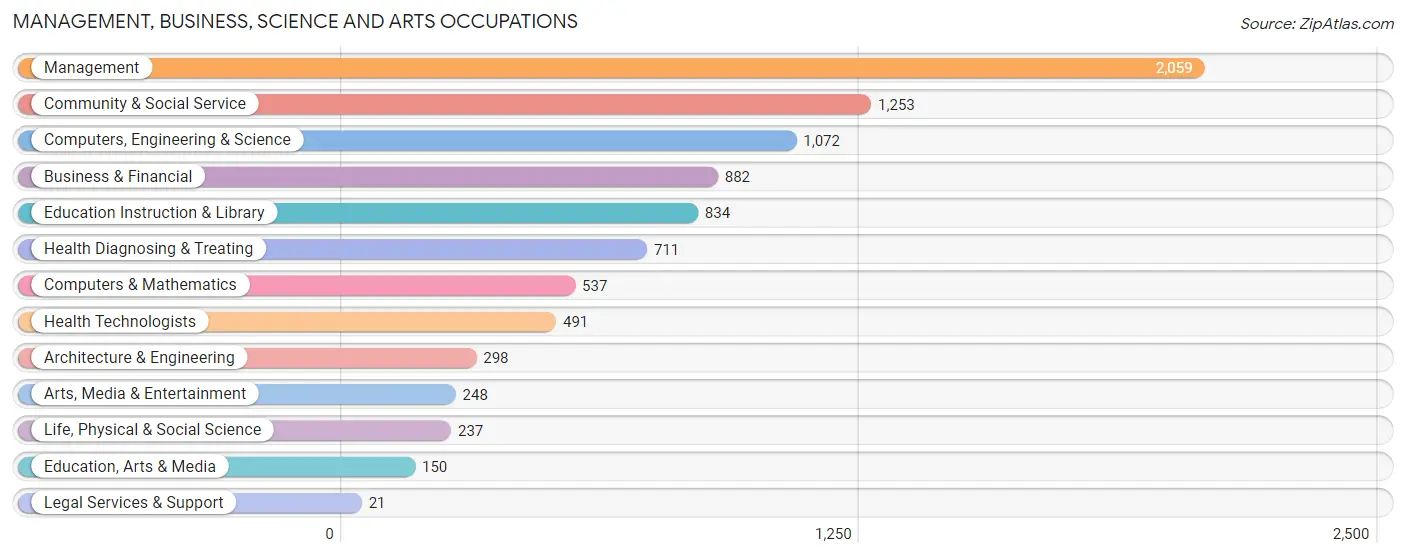
Management, Business, Science and Arts Occupations
The most common Management, Business, Science and Arts occupations in New Kent County are Management (2,059 | 16.9%), Community & Social Service (1,253 | 10.3%), Computers, Engineering & Science (1,072 | 8.8%), Business & Financial (882 | 7.3%), and Education Instruction & Library (834 | 6.9%).
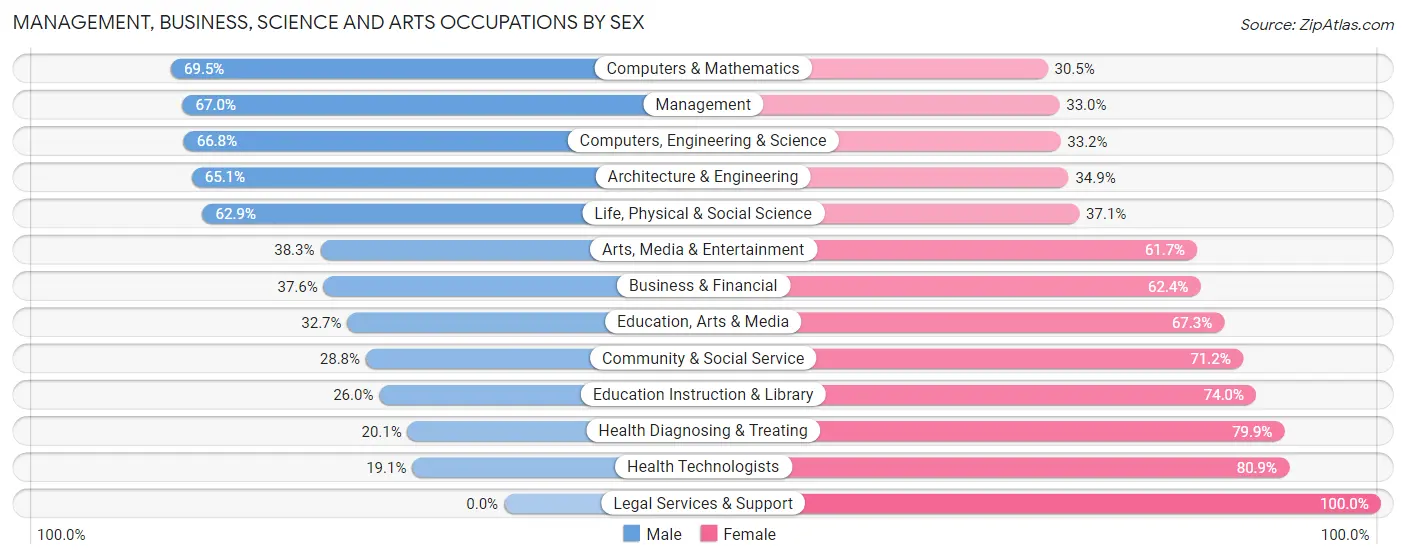
Management, Business, Science and Arts Occupations by Sex
Within the Management, Business, Science and Arts occupations in New Kent County, the most male-oriented occupations are Computers & Mathematics (69.5%), Management (67.0%), and Computers, Engineering & Science (66.8%), while the most female-oriented occupations are Legal Services & Support (100.0%), Health Technologists (80.9%), and Health Diagnosing & Treating (79.9%).
| Occupation | Male | Female |
| Management | 1,380 (67.0%) | 679 (33.0%) |
| Business & Financial | 332 (37.6%) | 550 (62.4%) |
| Computers, Engineering & Science | 716 (66.8%) | 356 (33.2%) |
| Computers & Mathematics | 373 (69.5%) | 164 (30.5%) |
| Architecture & Engineering | 194 (65.1%) | 104 (34.9%) |
| Life, Physical & Social Science | 149 (62.9%) | 88 (37.1%) |
| Community & Social Service | 361 (28.8%) | 892 (71.2%) |
| Education, Arts & Media | 49 (32.7%) | 101 (67.3%) |
| Legal Services & Support | 0 (0.0%) | 21 (100.0%) |
| Education Instruction & Library | 217 (26.0%) | 617 (74.0%) |
| Arts, Media & Entertainment | 95 (38.3%) | 153 (61.7%) |
| Health Diagnosing & Treating | 143 (20.1%) | 568 (79.9%) |
| Health Technologists | 94 (19.1%) | 397 (80.9%) |
| Total (Category) | 2,932 (49.0%) | 3,045 (50.9%) |
| Total (Overall) | 6,733 (55.4%) | 5,424 (44.6%) |
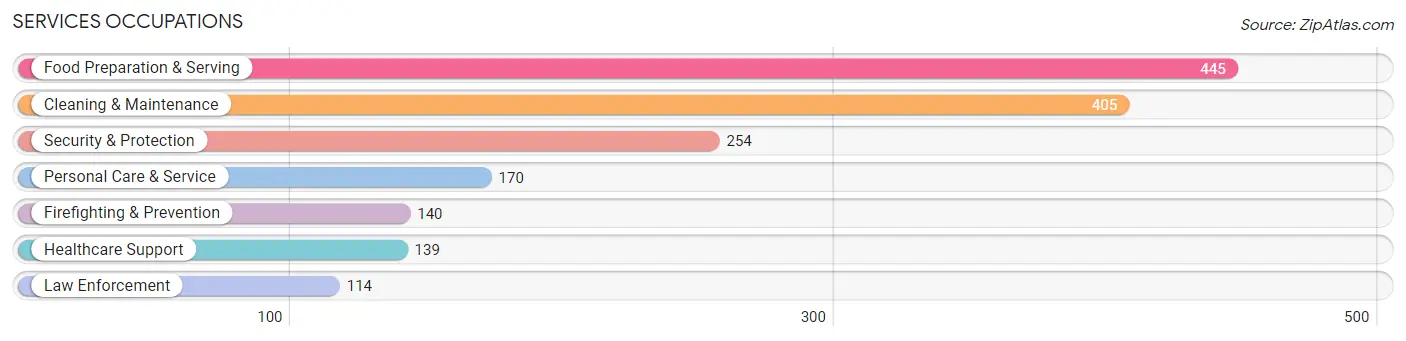
Services Occupations
The most common Services occupations in New Kent County are Food Preparation & Serving (445 | 3.7%), Cleaning & Maintenance (405 | 3.3%), Security & Protection (254 | 2.1%), Personal Care & Service (170 | 1.4%), and Firefighting & Prevention (140 | 1.1%).
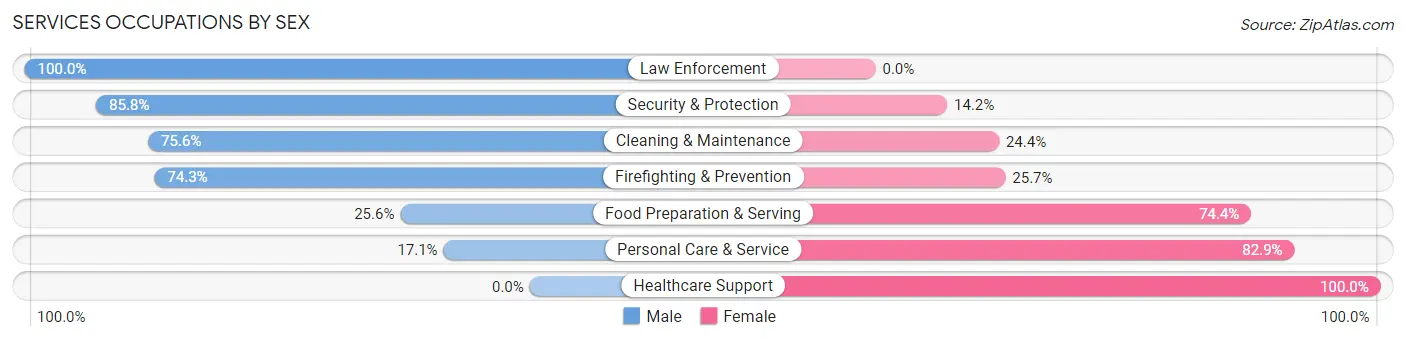
Services Occupations by Sex
Within the Services occupations in New Kent County, the most male-oriented occupations are Law Enforcement (100.0%), Security & Protection (85.8%), and Cleaning & Maintenance (75.6%), while the most female-oriented occupations are Healthcare Support (100.0%), Personal Care & Service (82.9%), and Food Preparation & Serving (74.4%).
| Occupation | Male | Female |
| Healthcare Support | 0 (0.0%) | 139 (100.0%) |
| Security & Protection | 218 (85.8%) | 36 (14.2%) |
| Firefighting & Prevention | 104 (74.3%) | 36 (25.7%) |
| Law Enforcement | 114 (100.0%) | 0 (0.0%) |
| Food Preparation & Serving | 114 (25.6%) | 331 (74.4%) |
| Cleaning & Maintenance | 306 (75.6%) | 99 (24.4%) |
| Personal Care & Service | 29 (17.1%) | 141 (82.9%) |
| Total (Category) | 667 (47.2%) | 746 (52.8%) |
| Total (Overall) | 6,733 (55.4%) | 5,424 (44.6%) |
Sales and Office Occupations
The most common Sales and Office occupations in New Kent County are Sales & Related (1,113 | 9.2%), and Office & Administration (1,085 | 8.9%).

Sales and Office Occupations by Sex

| Occupation | Male | Female |
| Sales & Related | 595 (53.5%) | 518 (46.5%) |
| Office & Administration | 235 (21.7%) | 850 (78.3%) |
| Total (Category) | 830 (37.8%) | 1,368 (62.2%) |
| Total (Overall) | 6,733 (55.4%) | 5,424 (44.6%) |
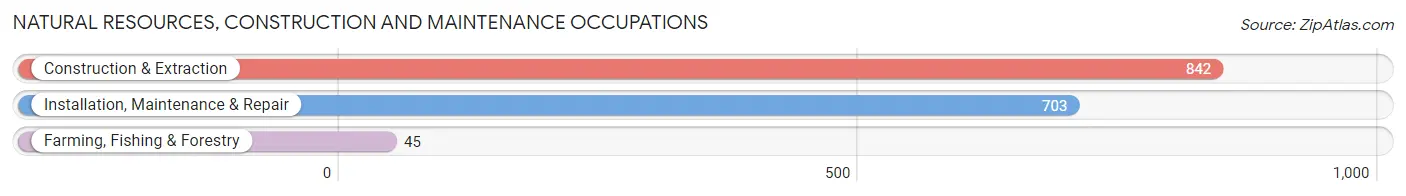
Natural Resources, Construction and Maintenance Occupations
The most common Natural Resources, Construction and Maintenance occupations in New Kent County are Construction & Extraction (842 | 6.9%), Installation, Maintenance & Repair (703 | 5.8%), and Farming, Fishing & Forestry (45 | 0.4%).
Natural Resources, Construction and Maintenance Occupations by Sex
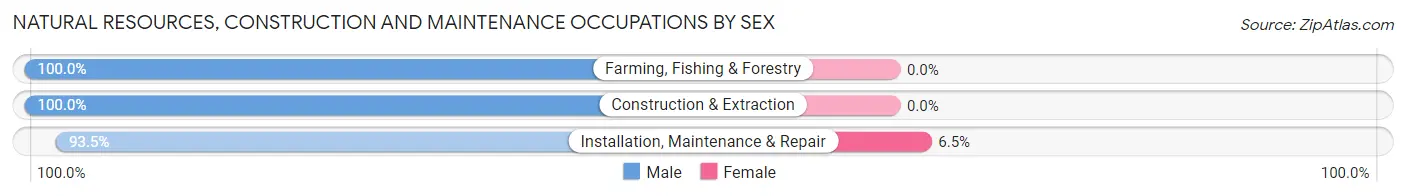
| Occupation | Male | Female |
| Farming, Fishing & Forestry | 45 (100.0%) | 0 (0.0%) |
| Construction & Extraction | 842 (100.0%) | 0 (0.0%) |
| Installation, Maintenance & Repair | 657 (93.5%) | 46 (6.5%) |
| Total (Category) | 1,544 (97.1%) | 46 (2.9%) |
| Total (Overall) | 6,733 (55.4%) | 5,424 (44.6%) |
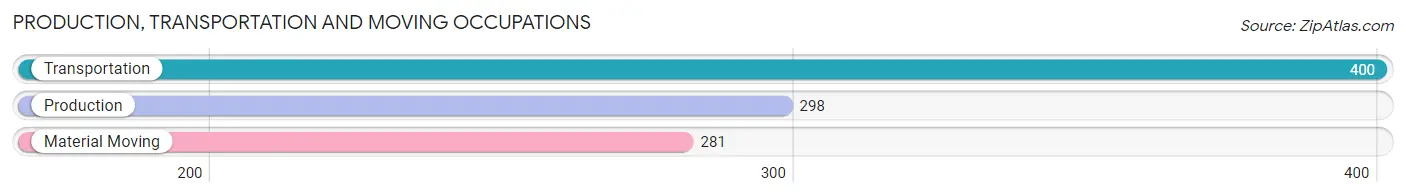
Production, Transportation and Moving Occupations
The most common Production, Transportation and Moving occupations in New Kent County are Transportation (400 | 3.3%), Production (298 | 2.5%), and Material Moving (281 | 2.3%).
Production, Transportation and Moving Occupations by Sex
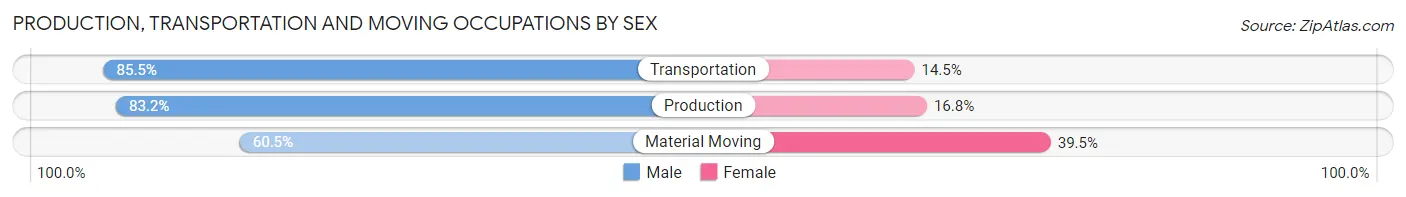
| Occupation | Male | Female |
| Production | 248 (83.2%) | 50 (16.8%) |
| Transportation | 342 (85.5%) | 58 (14.5%) |
| Material Moving | 170 (60.5%) | 111 (39.5%) |
| Total (Category) | 760 (77.6%) | 219 (22.4%) |
| Total (Overall) | 6,733 (55.4%) | 5,424 (44.6%) |
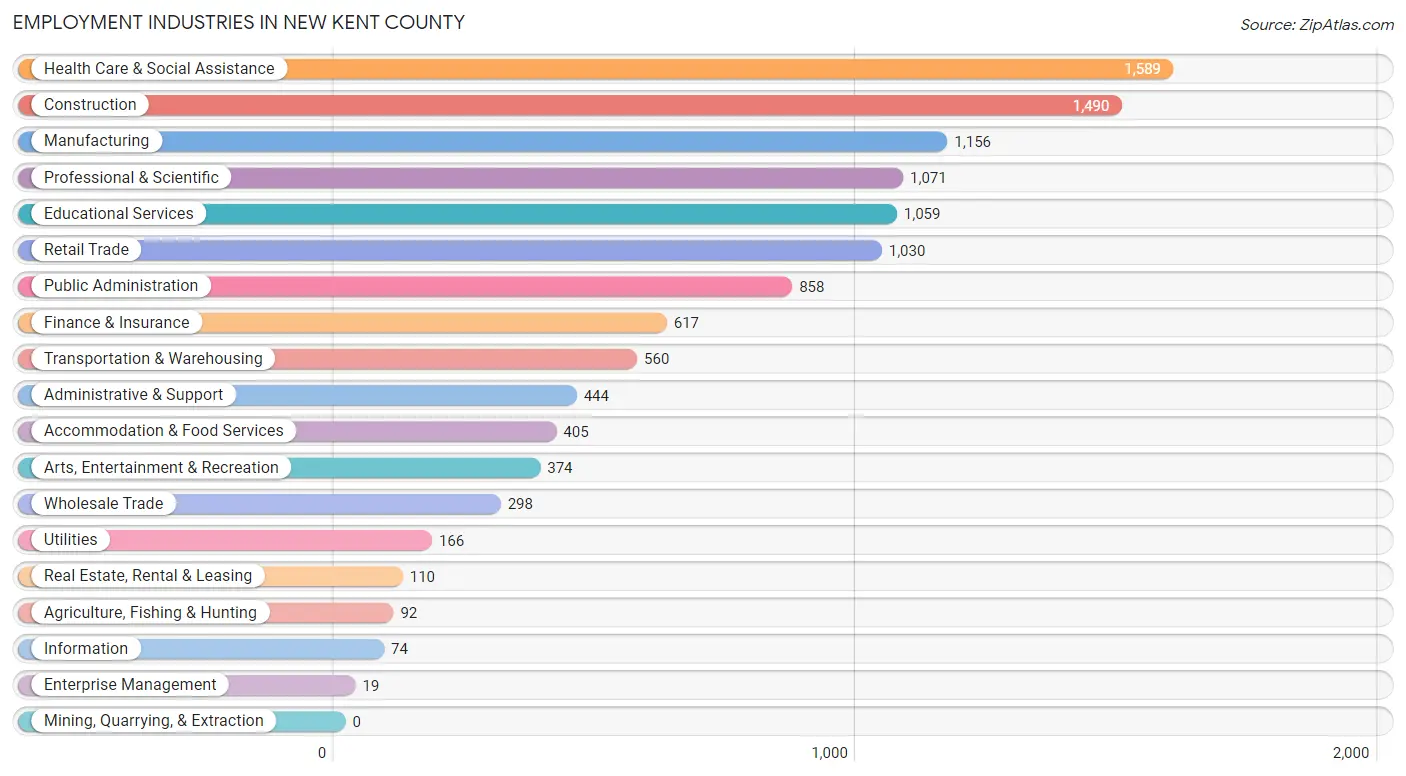
Employment Industries by Sex in New Kent County
Employment Industries in New Kent County
The major employment industries in New Kent County include Health Care & Social Assistance (1,589 | 13.1%), Construction (1,490 | 12.3%), Manufacturing (1,156 | 9.5%), Professional & Scientific (1,071 | 8.8%), and Educational Services (1,059 | 8.7%).
Employment Industries by Sex in New Kent County
The New Kent County industries that see more men than women are Agriculture, Fishing & Hunting (100.0%), Information (100.0%), and Enterprise Management (100.0%), whereas the industries that tend to have a higher number of women are Health Care & Social Assistance (78.6%), Educational Services (74.4%), and Finance & Insurance (72.9%).
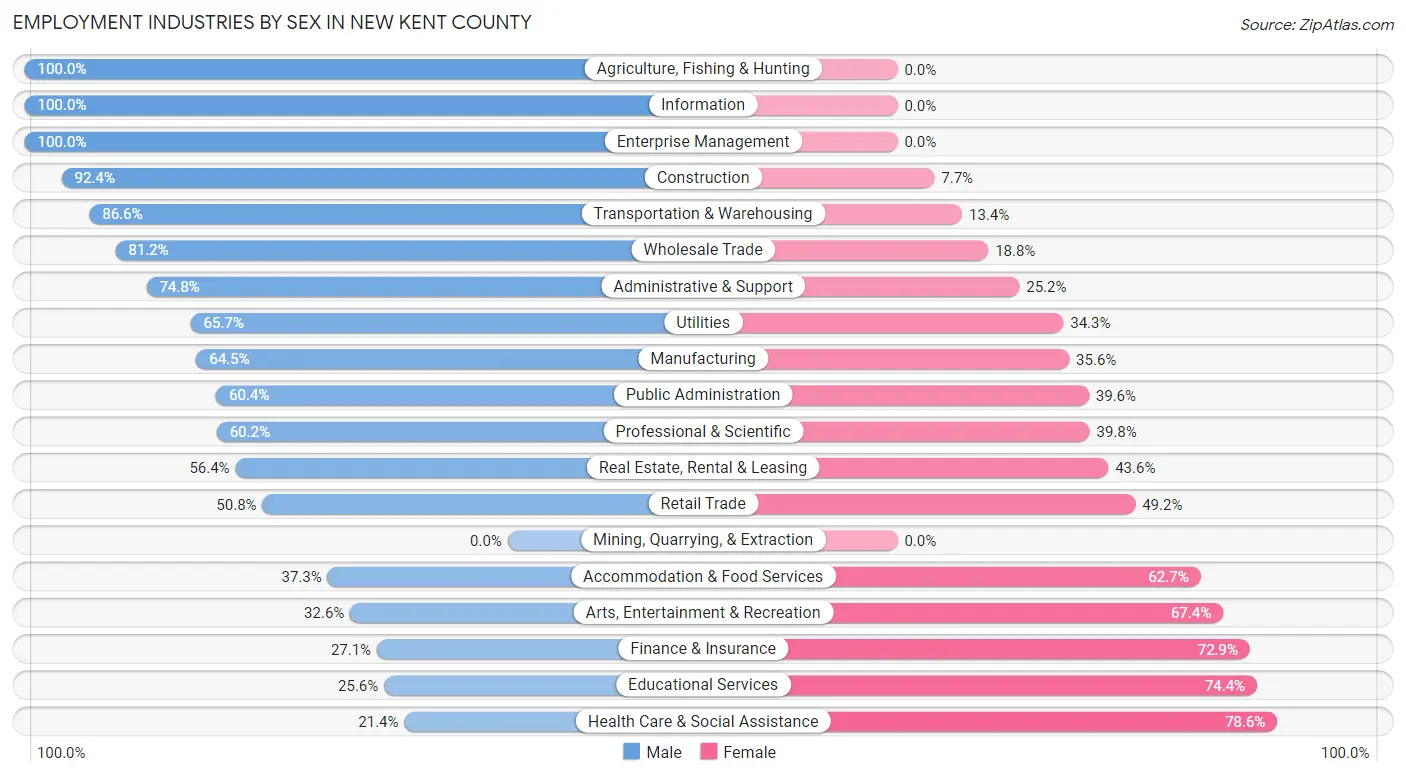
| Industry | Male | Female |
| Agriculture, Fishing & Hunting | 92 (100.0%) | 0 (0.0%) |
| Mining, Quarrying, & Extraction | 0 (0.0%) | 0 (0.0%) |
| Construction | 1,376 (92.3%) | 114 (7.6%) |
| Manufacturing | 745 (64.4%) | 411 (35.5%) |
| Wholesale Trade | 242 (81.2%) | 56 (18.8%) |
| Retail Trade | 523 (50.8%) | 507 (49.2%) |
| Transportation & Warehousing | 485 (86.6%) | 75 (13.4%) |
| Utilities | 109 (65.7%) | 57 (34.3%) |
| Information | 74 (100.0%) | 0 (0.0%) |
| Finance & Insurance | 167 (27.1%) | 450 (72.9%) |
| Real Estate, Rental & Leasing | 62 (56.4%) | 48 (43.6%) |
| Professional & Scientific | 645 (60.2%) | 426 (39.8%) |
| Enterprise Management | 19 (100.0%) | 0 (0.0%) |
| Administrative & Support | 332 (74.8%) | 112 (25.2%) |
| Educational Services | 271 (25.6%) | 788 (74.4%) |
| Health Care & Social Assistance | 340 (21.4%) | 1,249 (78.6%) |
| Arts, Entertainment & Recreation | 122 (32.6%) | 252 (67.4%) |
| Accommodation & Food Services | 151 (37.3%) | 254 (62.7%) |
| Public Administration | 518 (60.4%) | 340 (39.6%) |
| Total | 6,733 (55.4%) | 5,424 (44.6%) |
Education in New Kent County
School Enrollment in New Kent County
The most common levels of schooling among the 4,857 students in New Kent County are high school (1,099 | 22.6%), middle school (1,063 | 21.9%), and elementary school (924 | 19.0%).
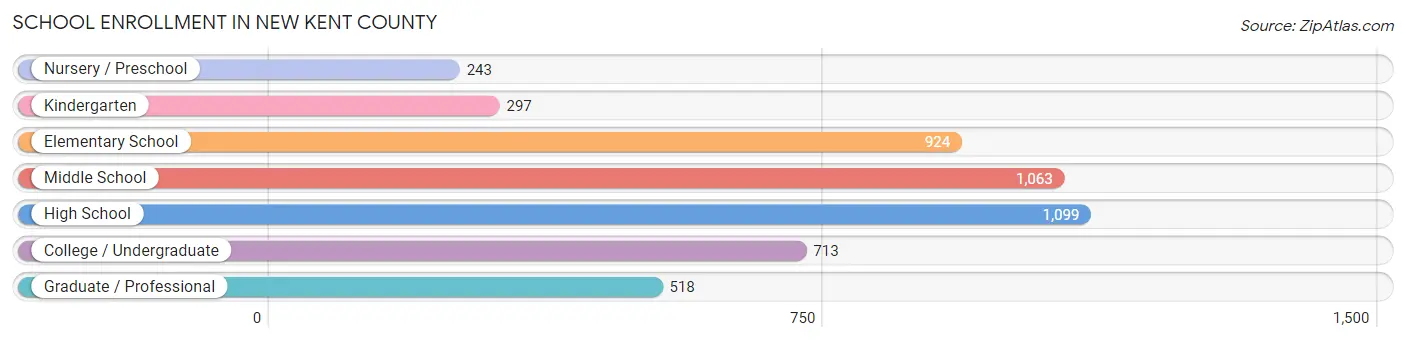
| School Level | # Students | % Students |
| Nursery / Preschool | 243 | 5.0% |
| Kindergarten | 297 | 6.1% |
| Elementary School | 924 | 19.0% |
| Middle School | 1,063 | 21.9% |
| High School | 1,099 | 22.6% |
| College / Undergraduate | 713 | 14.7% |
| Graduate / Professional | 518 | 10.7% |
| Total | 4,857 | 100.0% |
School Enrollment by Age by Funding Source in New Kent County
Out of a total of 4,857 students who are enrolled in schools in New Kent County, 782 (16.1%) attend a private institution, while the remaining 4,075 (83.9%) are enrolled in public schools. The age group of 3 to 4 year olds has the highest likelihood of being enrolled in private schools, with 171 (75.0% in the age bracket) enrolled. Conversely, the age group of 20 to 24 year olds has the lowest likelihood of being enrolled in a private school, with 255 (100.0% in the age bracket) attending a public institution.
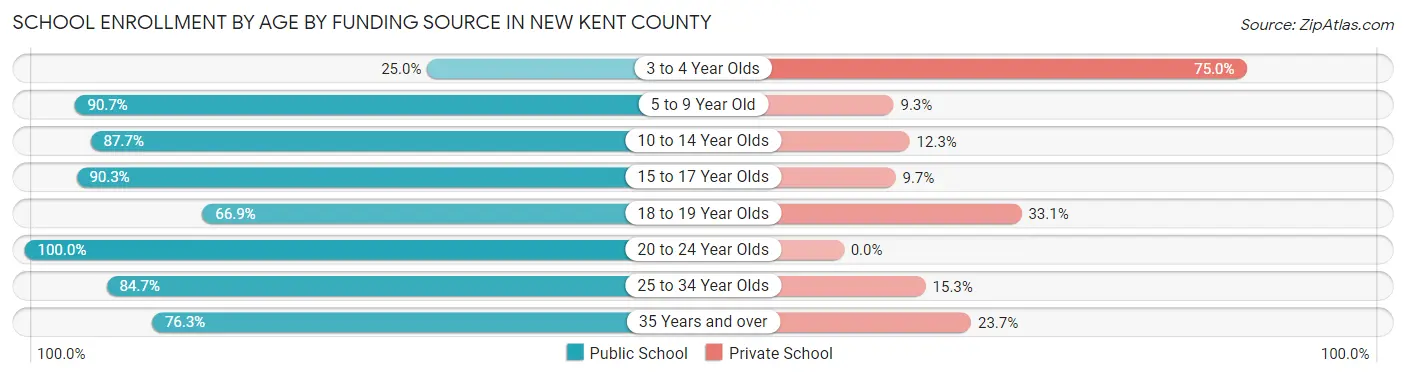
| Age Bracket | Public School | Private School |
| 3 to 4 Year Olds | 57 (25.0%) | 171 (75.0%) |
| 5 to 9 Year Old | 1,054 (90.7%) | 108 (9.3%) |
| 10 to 14 Year Olds | 1,256 (87.7%) | 176 (12.3%) |
| 15 to 17 Year Olds | 589 (90.3%) | 63 (9.7%) |
| 18 to 19 Year Olds | 210 (66.9%) | 104 (33.1%) |
| 20 to 24 Year Olds | 255 (100.0%) | 0 (0.0%) |
| 25 to 34 Year Olds | 322 (84.7%) | 58 (15.3%) |
| 35 Years and over | 331 (76.3%) | 103 (23.7%) |
| Total | 4,075 (83.9%) | 782 (16.1%) |
Educational Attainment by Field of Study in New Kent County
Business (1,800 | 28.8%), education (817 | 13.1%), science & technology (615 | 9.8%), arts & humanities (515 | 8.2%), and social sciences (400 | 6.4%) are the most common fields of study among 6,256 individuals in New Kent County who have obtained a bachelor's degree or higher.
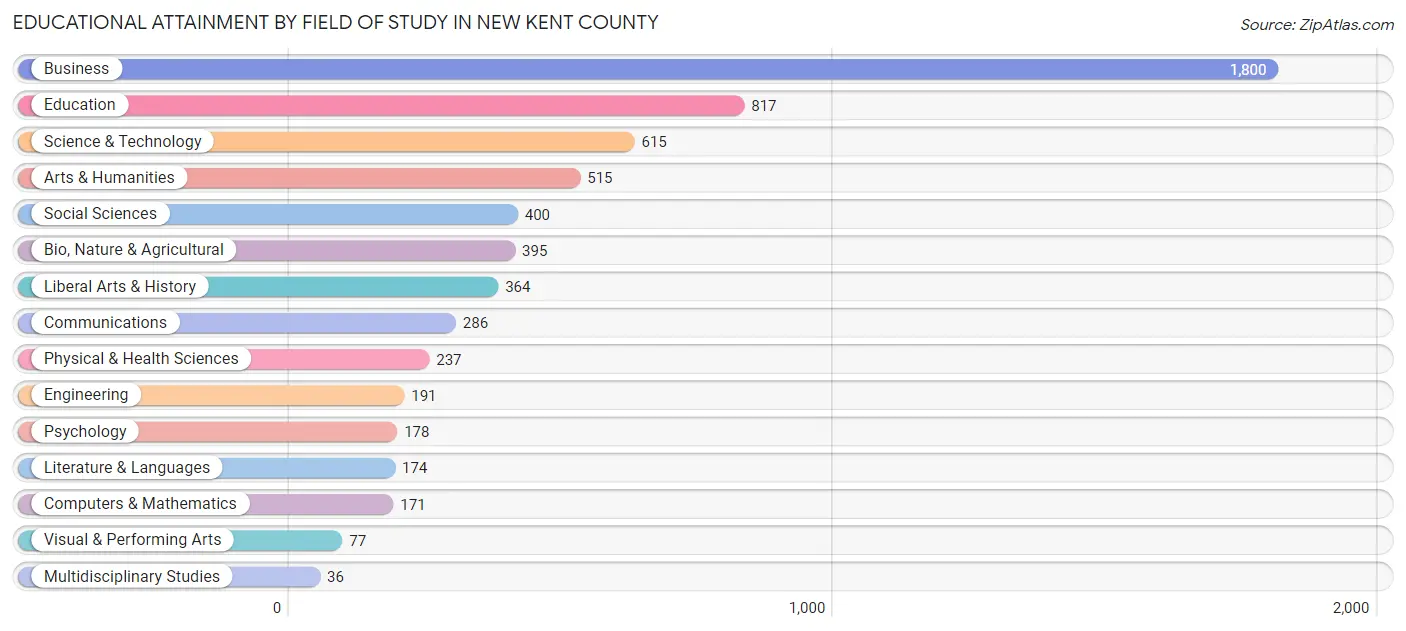
| Field of Study | # Graduates | % Graduates |
| Computers & Mathematics | 171 | 2.7% |
| Bio, Nature & Agricultural | 395 | 6.3% |
| Physical & Health Sciences | 237 | 3.8% |
| Psychology | 178 | 2.9% |
| Social Sciences | 400 | 6.4% |
| Engineering | 191 | 3.0% |
| Multidisciplinary Studies | 36 | 0.6% |
| Science & Technology | 615 | 9.8% |
| Business | 1,800 | 28.8% |
| Education | 817 | 13.1% |
| Literature & Languages | 174 | 2.8% |
| Liberal Arts & History | 364 | 5.8% |
| Visual & Performing Arts | 77 | 1.2% |
| Communications | 286 | 4.6% |
| Arts & Humanities | 515 | 8.2% |
| Total | 6,256 | 100.0% |
Transportation & Commute in New Kent County
Vehicle Availability by Sex in New Kent County
The most prevalent vehicle ownership categories in New Kent County are males with 3 vehicles (2,109, accounting for 31.1%) and females with 3 vehicles (1,553, making up 39.9%).
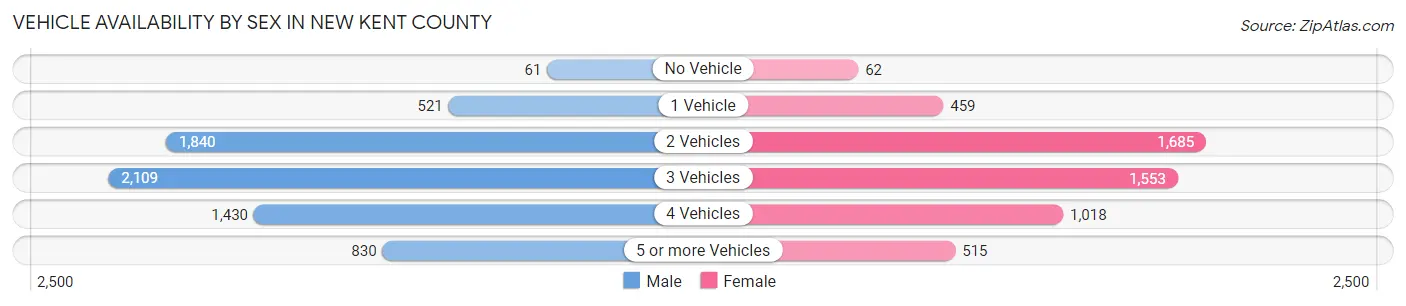
| Vehicles Available | Male | Female |
| No Vehicle | 61 (0.9%) | 62 (1.2%) |
| 1 Vehicle | 521 (7.7%) | 459 (8.7%) |
| 2 Vehicles | 1,840 (27.1%) | 1,685 (31.8%) |
| 3 Vehicles | 2,109 (31.1%) | 1,553 (29.3%) |
| 4 Vehicles | 1,430 (21.1%) | 1,018 (19.2%) |
| 5 or more Vehicles | 830 (12.2%) | 515 (9.7%) |
| Total | 6,791 (100.0%) | 5,292 (100.0%) |
Commute Time in New Kent County
The most frequently occuring commute durations in New Kent County are 30 to 34 minutes (2,436 commuters, 24.6%), 45 to 59 minutes (1,935 commuters, 19.5%), and 20 to 24 minutes (1,289 commuters, 13.0%).
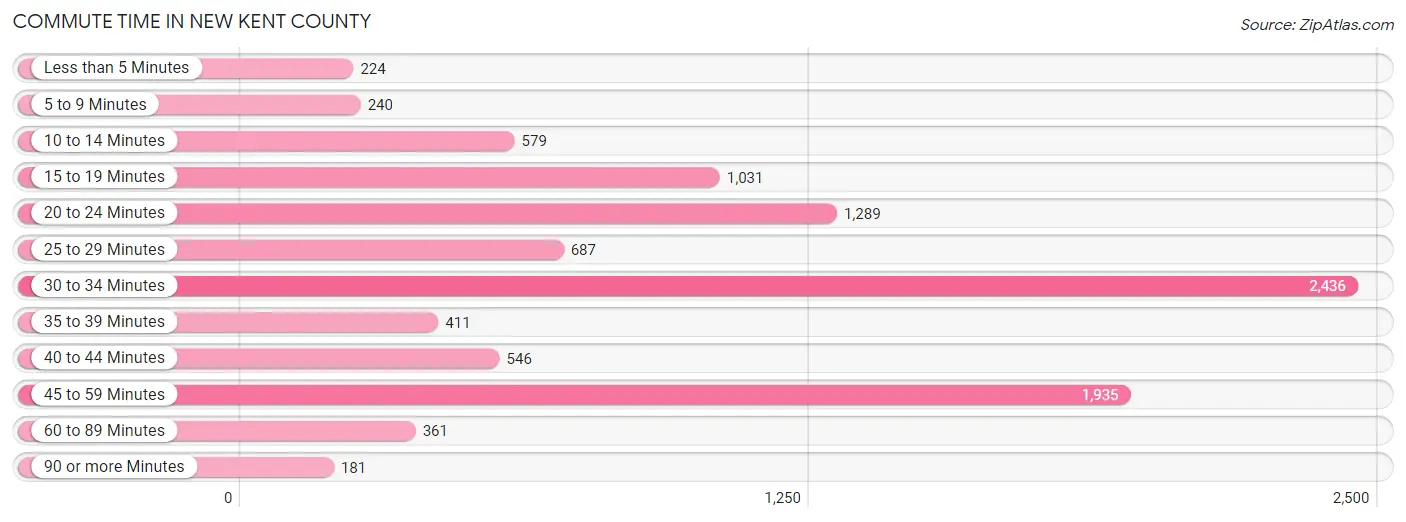
| Commute Time | # Commuters | % Commuters |
| Less than 5 Minutes | 224 | 2.3% |
| 5 to 9 Minutes | 240 | 2.4% |
| 10 to 14 Minutes | 579 | 5.8% |
| 15 to 19 Minutes | 1,031 | 10.4% |
| 20 to 24 Minutes | 1,289 | 13.0% |
| 25 to 29 Minutes | 687 | 6.9% |
| 30 to 34 Minutes | 2,436 | 24.6% |
| 35 to 39 Minutes | 411 | 4.1% |
| 40 to 44 Minutes | 546 | 5.5% |
| 45 to 59 Minutes | 1,935 | 19.5% |
| 60 to 89 Minutes | 361 | 3.6% |
| 90 or more Minutes | 181 | 1.8% |
Commute Time by Sex in New Kent County
The most common commute times in New Kent County are 30 to 34 minutes (1,511 commuters, 26.5%) for males and 45 to 59 minutes (1,011 commuters, 24.0%) for females.
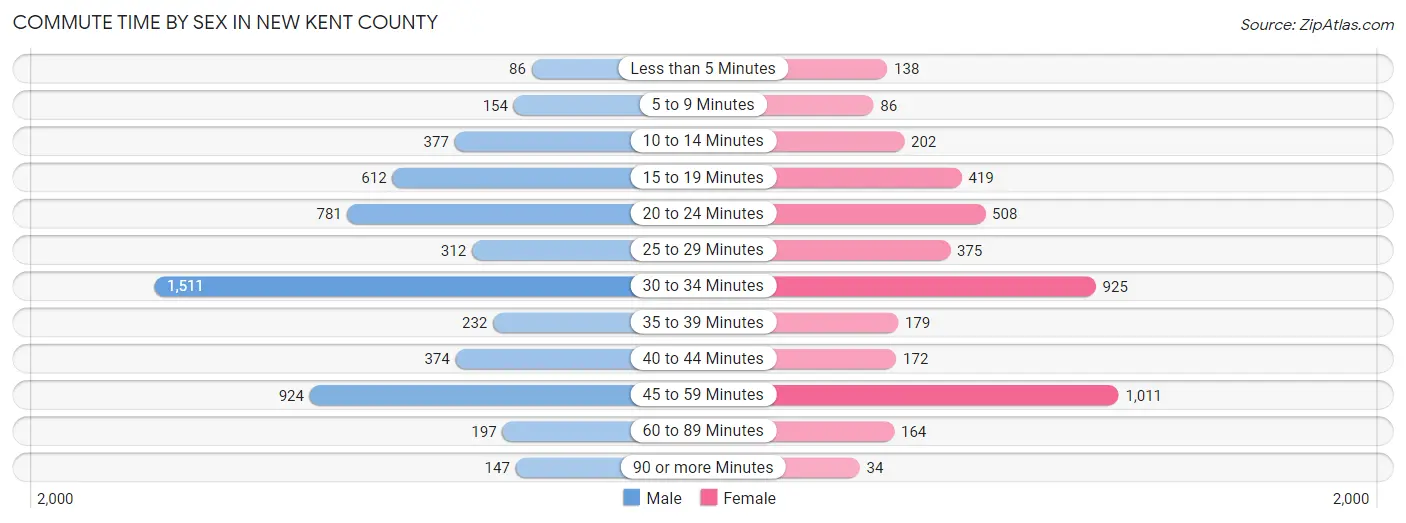
| Commute Time | Male | Female |
| Less than 5 Minutes | 86 (1.5%) | 138 (3.3%) |
| 5 to 9 Minutes | 154 (2.7%) | 86 (2.0%) |
| 10 to 14 Minutes | 377 (6.6%) | 202 (4.8%) |
| 15 to 19 Minutes | 612 (10.7%) | 419 (10.0%) |
| 20 to 24 Minutes | 781 (13.7%) | 508 (12.1%) |
| 25 to 29 Minutes | 312 (5.5%) | 375 (8.9%) |
| 30 to 34 Minutes | 1,511 (26.5%) | 925 (22.0%) |
| 35 to 39 Minutes | 232 (4.1%) | 179 (4.3%) |
| 40 to 44 Minutes | 374 (6.6%) | 172 (4.1%) |
| 45 to 59 Minutes | 924 (16.2%) | 1,011 (24.0%) |
| 60 to 89 Minutes | 197 (3.5%) | 164 (3.9%) |
| 90 or more Minutes | 147 (2.6%) | 34 (0.8%) |
Time of Departure to Work by Sex in New Kent County
The most frequent times of departure to work in New Kent County are 7:00 AM to 7:29 AM (1,214, 21.3%) for males and 7:30 AM to 7:59 AM (787, 18.7%) for females.
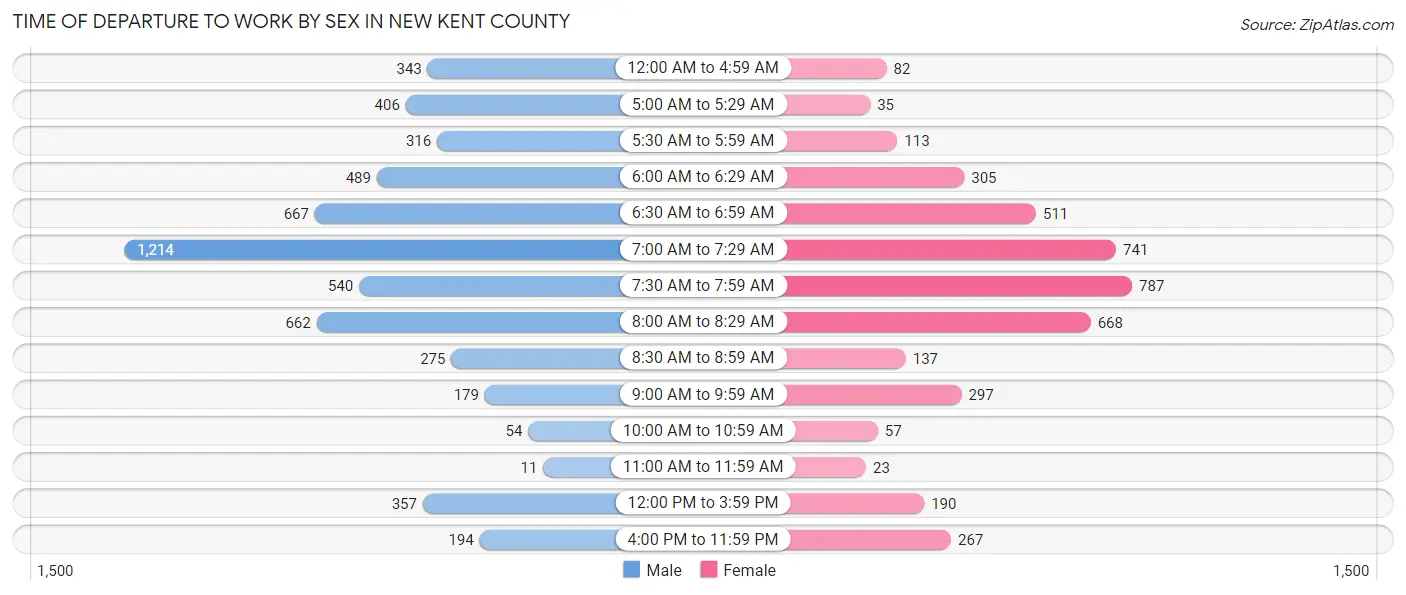
| Time of Departure | Male | Female |
| 12:00 AM to 4:59 AM | 343 (6.0%) | 82 (1.9%) |
| 5:00 AM to 5:29 AM | 406 (7.1%) | 35 (0.8%) |
| 5:30 AM to 5:59 AM | 316 (5.5%) | 113 (2.7%) |
| 6:00 AM to 6:29 AM | 489 (8.6%) | 305 (7.2%) |
| 6:30 AM to 6:59 AM | 667 (11.7%) | 511 (12.1%) |
| 7:00 AM to 7:29 AM | 1,214 (21.3%) | 741 (17.6%) |
| 7:30 AM to 7:59 AM | 540 (9.5%) | 787 (18.7%) |
| 8:00 AM to 8:29 AM | 662 (11.6%) | 668 (15.9%) |
| 8:30 AM to 8:59 AM | 275 (4.8%) | 137 (3.3%) |
| 9:00 AM to 9:59 AM | 179 (3.1%) | 297 (7.0%) |
| 10:00 AM to 10:59 AM | 54 (0.9%) | 57 (1.3%) |
| 11:00 AM to 11:59 AM | 11 (0.2%) | 23 (0.5%) |
| 12:00 PM to 3:59 PM | 357 (6.3%) | 190 (4.5%) |
| 4:00 PM to 11:59 PM | 194 (3.4%) | 267 (6.3%) |
| Total | 5,707 (100.0%) | 4,213 (100.0%) |
Housing Occupancy in New Kent County
Occupancy by Ownership in New Kent County
Of the total 8,675 dwellings in New Kent County, owner-occupied units account for 8,011 (92.3%), while renter-occupied units make up 664 (7.6%).
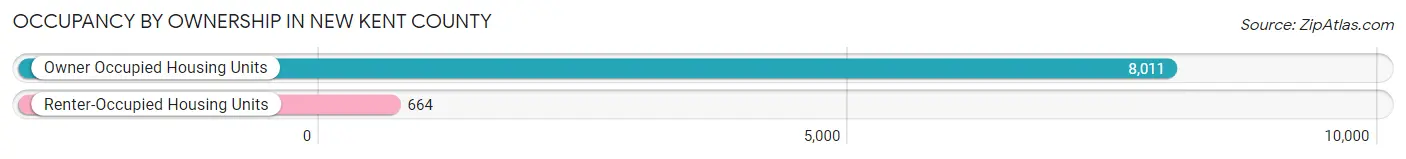
| Occupancy | # Housing Units | % Housing Units |
| Owner Occupied Housing Units | 8,011 | 92.3% |
| Renter-Occupied Housing Units | 664 | 7.6% |
| Total Occupied Housing Units | 8,675 | 100.0% |
Occupancy by Household Size in New Kent County
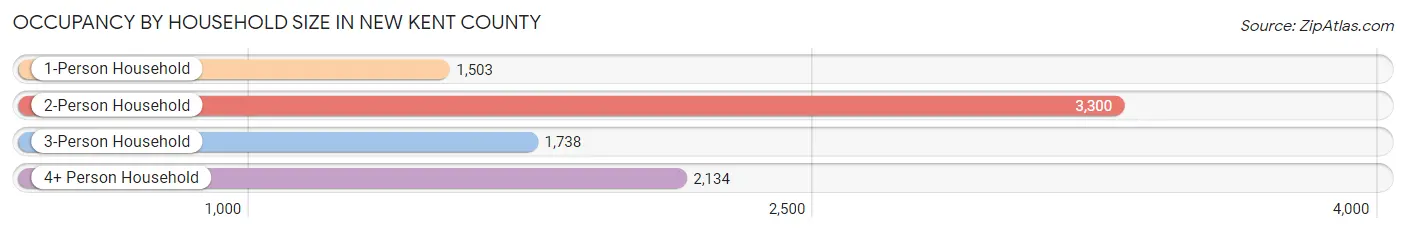
| Household Size | # Housing Units | % Housing Units |
| 1-Person Household | 1,503 | 17.3% |
| 2-Person Household | 3,300 | 38.0% |
| 3-Person Household | 1,738 | 20.0% |
| 4+ Person Household | 2,134 | 24.6% |
| Total Housing Units | 8,675 | 100.0% |
Occupancy by Ownership by Household Size in New Kent County
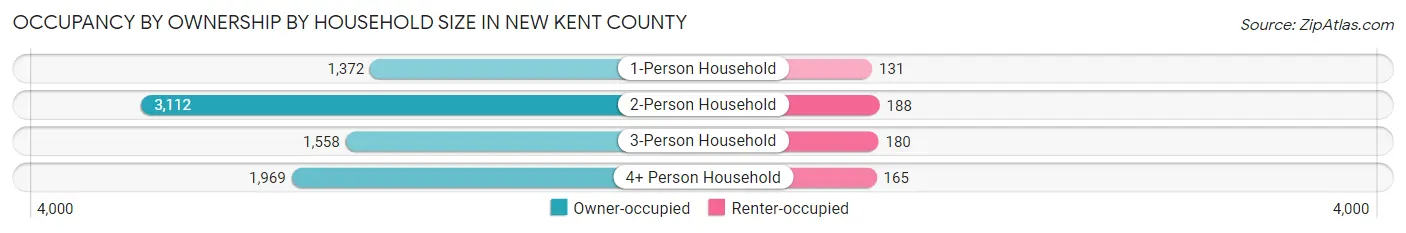
| Household Size | Owner-occupied | Renter-occupied |
| 1-Person Household | 1,372 (91.3%) | 131 (8.7%) |
| 2-Person Household | 3,112 (94.3%) | 188 (5.7%) |
| 3-Person Household | 1,558 (89.6%) | 180 (10.4%) |
| 4+ Person Household | 1,969 (92.3%) | 165 (7.7%) |
| Total Housing Units | 8,011 (92.3%) | 664 (7.6%) |
Occupancy by Educational Attainment in New Kent County
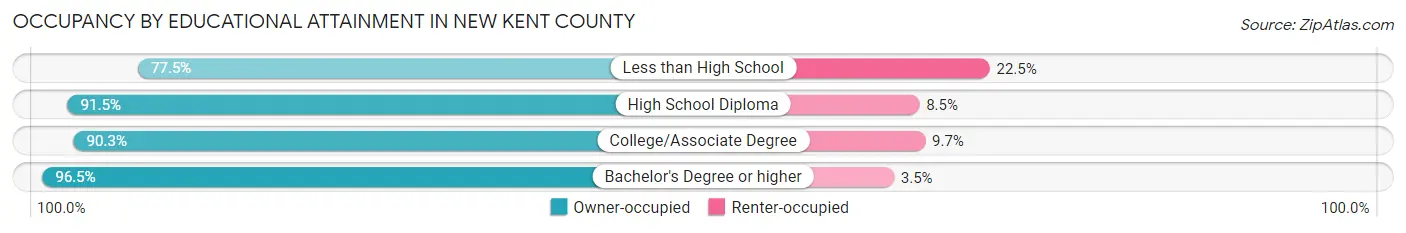
| Household Size | Owner-occupied | Renter-occupied |
| Less than High School | 300 (77.5%) | 87 (22.5%) |
| High School Diploma | 2,023 (91.5%) | 189 (8.5%) |
| College/Associate Degree | 2,552 (90.3%) | 274 (9.7%) |
| Bachelor's Degree or higher | 3,136 (96.5%) | 114 (3.5%) |
Occupancy by Age of Householder in New Kent County
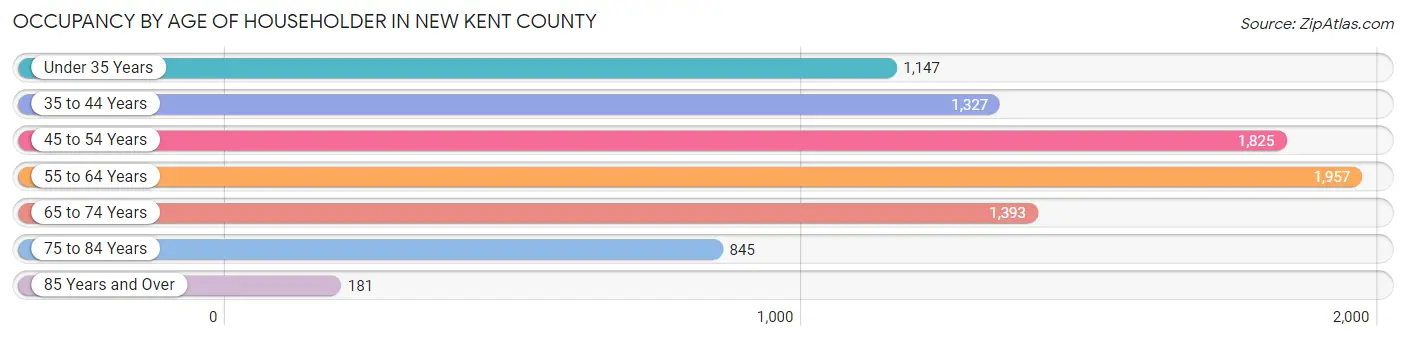
| Age Bracket | # Households | % Households |
| Under 35 Years | 1,147 | 13.2% |
| 35 to 44 Years | 1,327 | 15.3% |
| 45 to 54 Years | 1,825 | 21.0% |
| 55 to 64 Years | 1,957 | 22.6% |
| 65 to 74 Years | 1,393 | 16.1% |
| 75 to 84 Years | 845 | 9.7% |
| 85 Years and Over | 181 | 2.1% |
| Total | 8,675 | 100.0% |
Housing Finances in New Kent County
Median Income by Occupancy in New Kent County
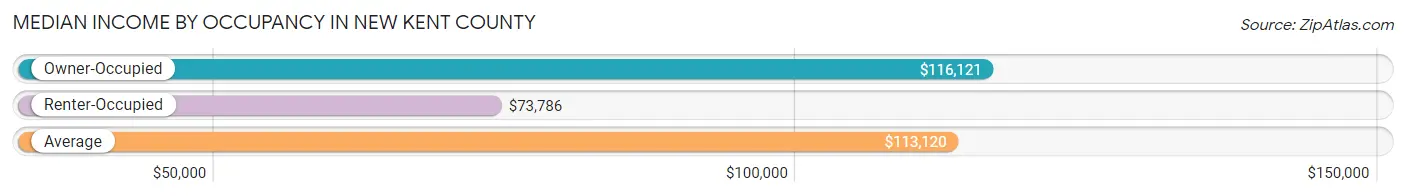
| Occupancy Type | # Households | Median Income |
| Owner-Occupied | 8,011 (92.3%) | $116,121 |
| Renter-Occupied | 664 (7.6%) | $73,786 |
| Average | 8,675 (100.0%) | $113,120 |
Occupancy by Householder Income Bracket in New Kent County
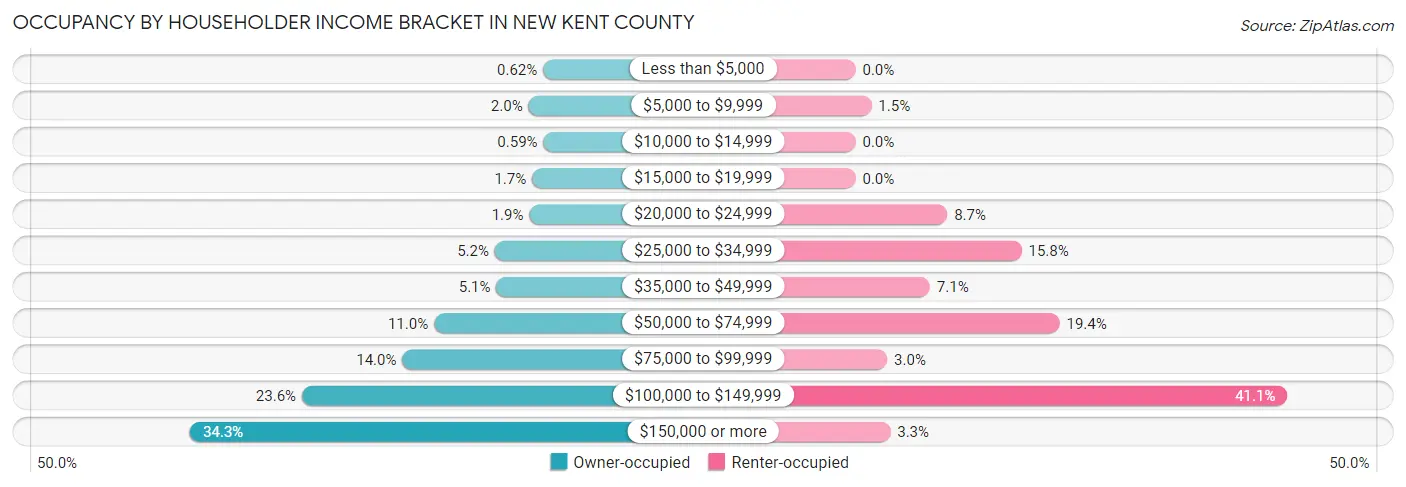
| Income Bracket | Owner-occupied | Renter-occupied |
| Less than $5,000 | 50 (0.6%) | 0 (0.0%) |
| $5,000 to $9,999 | 161 (2.0%) | 10 (1.5%) |
| $10,000 to $14,999 | 47 (0.6%) | 0 (0.0%) |
| $15,000 to $19,999 | 134 (1.7%) | 0 (0.0%) |
| $20,000 to $24,999 | 155 (1.9%) | 58 (8.7%) |
| $25,000 to $34,999 | 418 (5.2%) | 105 (15.8%) |
| $35,000 to $49,999 | 406 (5.1%) | 47 (7.1%) |
| $50,000 to $74,999 | 882 (11.0%) | 129 (19.4%) |
| $75,000 to $99,999 | 1,124 (14.0%) | 20 (3.0%) |
| $100,000 to $149,999 | 1,890 (23.6%) | 273 (41.1%) |
| $150,000 or more | 2,744 (34.3%) | 22 (3.3%) |
| Total | 8,011 (100.0%) | 664 (100.0%) |
Monthly Housing Cost Tiers in New Kent County
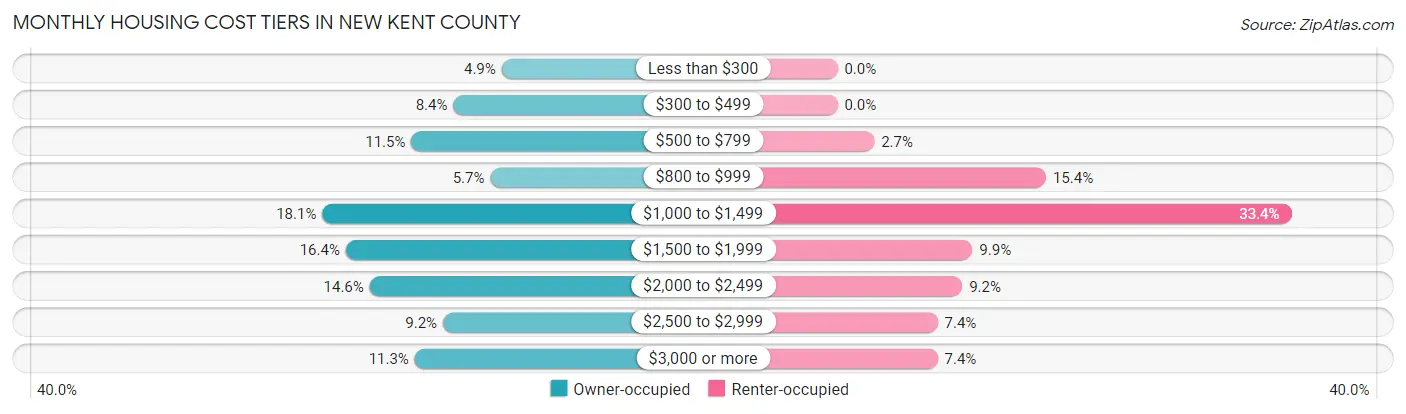
| Monthly Cost | Owner-occupied | Renter-occupied |
| Less than $300 | 390 (4.9%) | 0 (0.0%) |
| $300 to $499 | 675 (8.4%) | 0 (0.0%) |
| $500 to $799 | 923 (11.5%) | 18 (2.7%) |
| $800 to $999 | 457 (5.7%) | 102 (15.4%) |
| $1,000 to $1,499 | 1,448 (18.1%) | 222 (33.4%) |
| $1,500 to $1,999 | 1,310 (16.4%) | 66 (9.9%) |
| $2,000 to $2,499 | 1,169 (14.6%) | 61 (9.2%) |
| $2,500 to $2,999 | 736 (9.2%) | 49 (7.4%) |
| $3,000 or more | 903 (11.3%) | 49 (7.4%) |
| Total | 8,011 (100.0%) | 664 (100.0%) |
Physical Housing Characteristics in New Kent County
Housing Structures in New Kent County
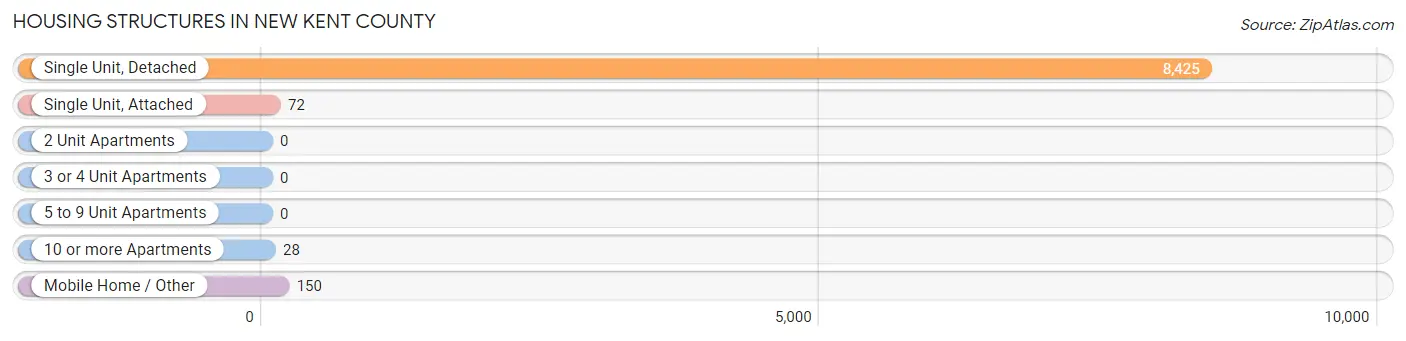
| Structure Type | # Housing Units | % Housing Units |
| Single Unit, Detached | 8,425 | 97.1% |
| Single Unit, Attached | 72 | 0.8% |
| 2 Unit Apartments | 0 | 0.0% |
| 3 or 4 Unit Apartments | 0 | 0.0% |
| 5 to 9 Unit Apartments | 0 | 0.0% |
| 10 or more Apartments | 28 | 0.3% |
| Mobile Home / Other | 150 | 1.7% |
| Total | 8,675 | 100.0% |
Housing Structures by Occupancy in New Kent County
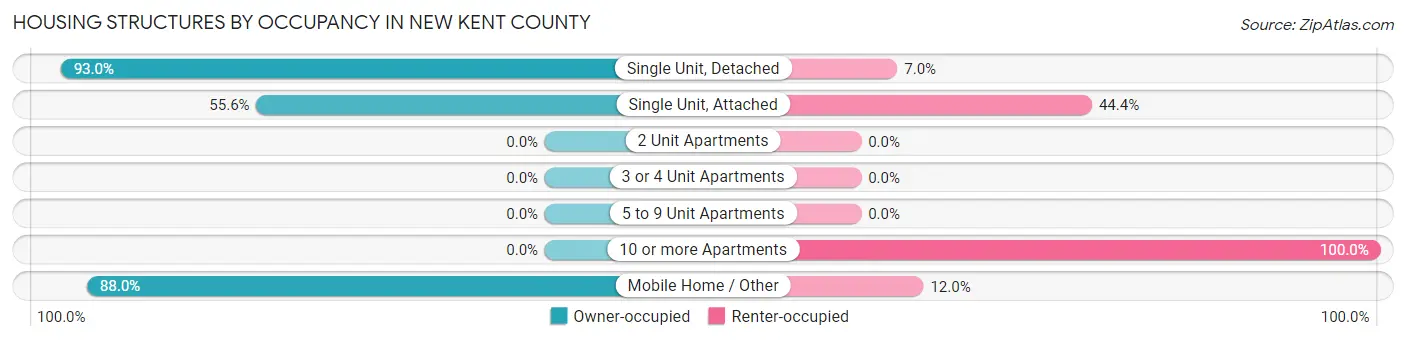
| Structure Type | Owner-occupied | Renter-occupied |
| Single Unit, Detached | 7,839 (93.0%) | 586 (7.0%) |
| Single Unit, Attached | 40 (55.6%) | 32 (44.4%) |
| 2 Unit Apartments | 0 (0.0%) | 0 (0.0%) |
| 3 or 4 Unit Apartments | 0 (0.0%) | 0 (0.0%) |
| 5 to 9 Unit Apartments | 0 (0.0%) | 0 (0.0%) |
| 10 or more Apartments | 0 (0.0%) | 28 (100.0%) |
| Mobile Home / Other | 132 (88.0%) | 18 (12.0%) |
| Total | 8,011 (92.3%) | 664 (7.6%) |
Housing Structures by Number of Rooms in New Kent County
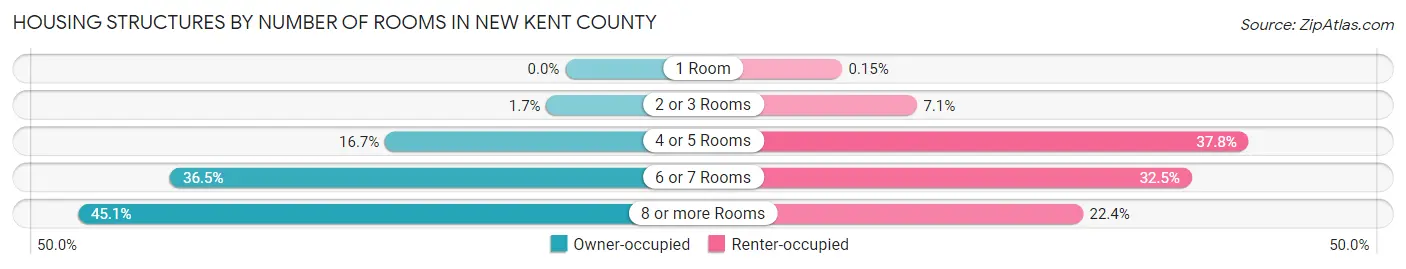
| Number of Rooms | Owner-occupied | Renter-occupied |
| 1 Room | 0 (0.0%) | 1 (0.2%) |
| 2 or 3 Rooms | 139 (1.7%) | 47 (7.1%) |
| 4 or 5 Rooms | 1,335 (16.7%) | 251 (37.8%) |
| 6 or 7 Rooms | 2,927 (36.5%) | 216 (32.5%) |
| 8 or more Rooms | 3,610 (45.1%) | 149 (22.4%) |
| Total | 8,011 (100.0%) | 664 (100.0%) |
Housing Structure by Heating Type in New Kent County
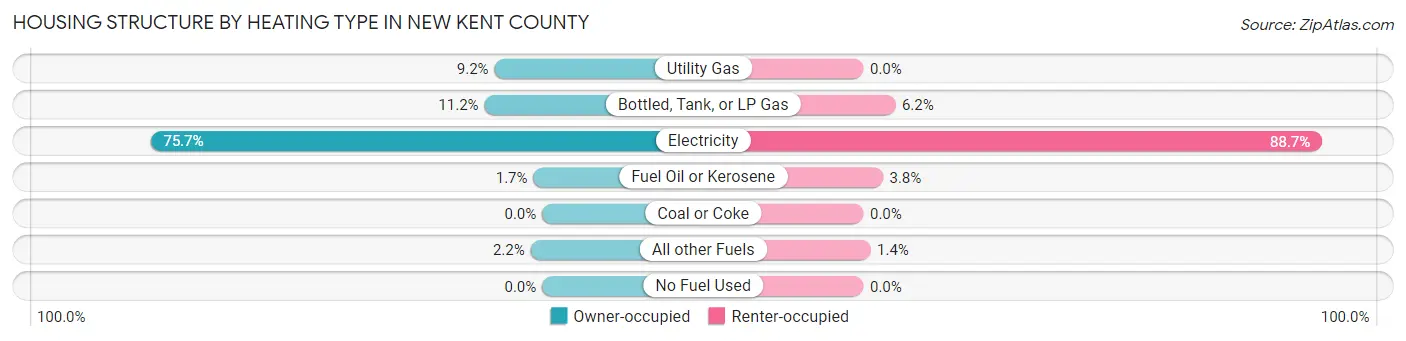
| Heating Type | Owner-occupied | Renter-occupied |
| Utility Gas | 739 (9.2%) | 0 (0.0%) |
| Bottled, Tank, or LP Gas | 893 (11.2%) | 41 (6.2%) |
| Electricity | 6,065 (75.7%) | 589 (88.7%) |
| Fuel Oil or Kerosene | 135 (1.7%) | 25 (3.8%) |
| Coal or Coke | 0 (0.0%) | 0 (0.0%) |
| All other Fuels | 179 (2.2%) | 9 (1.4%) |
| No Fuel Used | 0 (0.0%) | 0 (0.0%) |
| Total | 8,011 (100.0%) | 664 (100.0%) |
Household Vehicle Usage in New Kent County
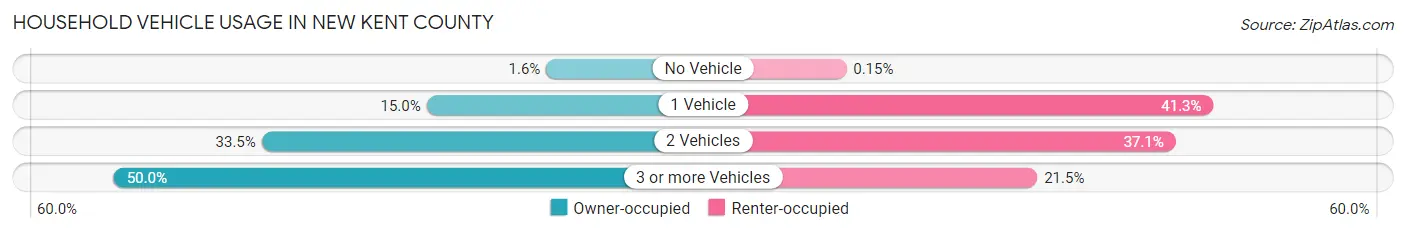
| Vehicles per Household | Owner-occupied | Renter-occupied |
| No Vehicle | 126 (1.6%) | 1 (0.2%) |
| 1 Vehicle | 1,199 (15.0%) | 274 (41.3%) |
| 2 Vehicles | 2,680 (33.5%) | 246 (37.0%) |
| 3 or more Vehicles | 4,006 (50.0%) | 143 (21.5%) |
| Total | 8,011 (100.0%) | 664 (100.0%) |
Real Estate & Mortgages in New Kent County
Real Estate and Mortgage Overview in New Kent County
| Characteristic | Without Mortgage | With Mortgage |
| Housing Units | 2,197 | 5,814 |
| Median Property Value | $336,900 | $359,000 |
| Median Household Income | $70,591 | $2,266 |
| Monthly Housing Costs | $515 | $903 |
| Real Estate Taxes | $2,319 | $100 |
Property Value by Mortgage Status in New Kent County
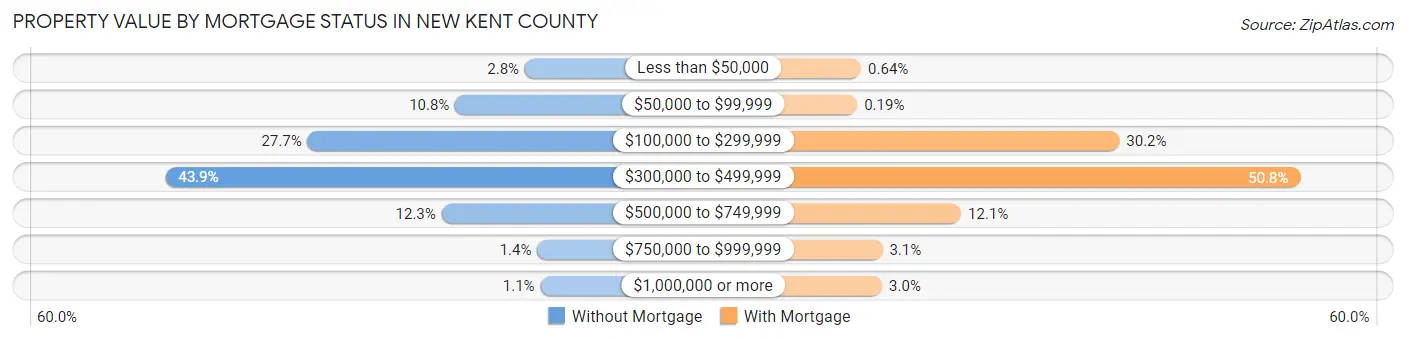
| Property Value | Without Mortgage | With Mortgage |
| Less than $50,000 | 62 (2.8%) | 37 (0.6%) |
| $50,000 to $99,999 | 237 (10.8%) | 11 (0.2%) |
| $100,000 to $299,999 | 608 (27.7%) | 1,753 (30.1%) |
| $300,000 to $499,999 | 965 (43.9%) | 2,955 (50.8%) |
| $500,000 to $749,999 | 271 (12.3%) | 702 (12.1%) |
| $750,000 to $999,999 | 31 (1.4%) | 179 (3.1%) |
| $1,000,000 or more | 23 (1.1%) | 177 (3.0%) |
| Total | 2,197 (100.0%) | 5,814 (100.0%) |
Household Income by Mortgage Status in New Kent County
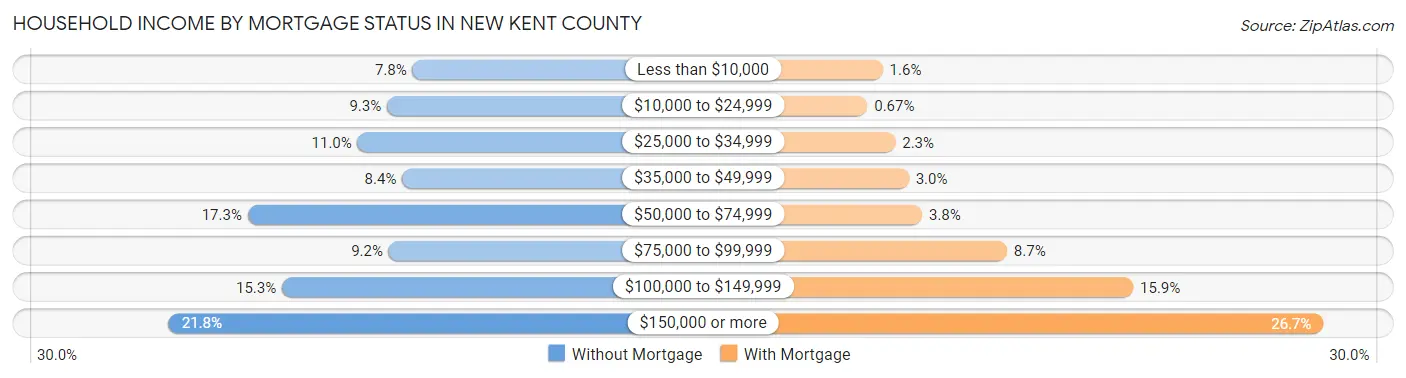
| Household Income | Without Mortgage | With Mortgage |
| Less than $10,000 | 172 (7.8%) | 90 (1.5%) |
| $10,000 to $24,999 | 204 (9.3%) | 39 (0.7%) |
| $25,000 to $34,999 | 241 (11.0%) | 132 (2.3%) |
| $35,000 to $49,999 | 185 (8.4%) | 177 (3.0%) |
| $50,000 to $74,999 | 379 (17.2%) | 221 (3.8%) |
| $75,000 to $99,999 | 202 (9.2%) | 503 (8.6%) |
| $100,000 to $149,999 | 336 (15.3%) | 922 (15.9%) |
| $150,000 or more | 478 (21.8%) | 1,554 (26.7%) |
| Total | 2,197 (100.0%) | 5,814 (100.0%) |
Property Value to Household Income Ratio in New Kent County
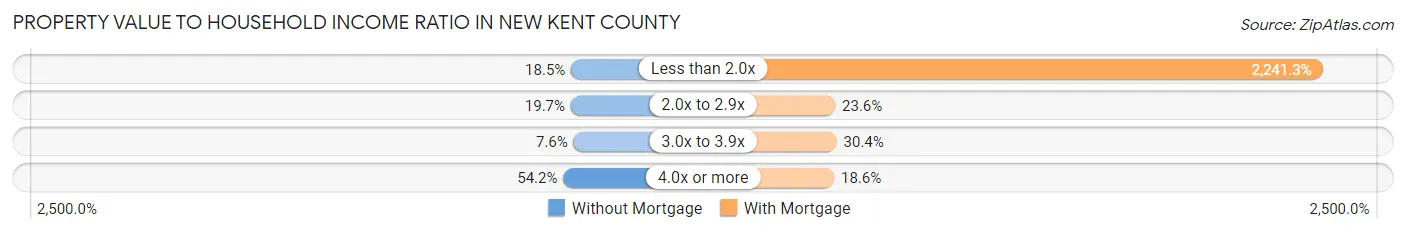
| Value-to-Income Ratio | Without Mortgage | With Mortgage |
| Less than 2.0x | 407 (18.5%) | 130,309 (2,241.3%) |
| 2.0x to 2.9x | 433 (19.7%) | 1,369 (23.5%) |
| 3.0x to 3.9x | 167 (7.6%) | 1,765 (30.4%) |
| 4.0x or more | 1,190 (54.2%) | 1,081 (18.6%) |
| Total | 2,197 (100.0%) | 5,814 (100.0%) |
Real Estate Taxes by Mortgage Status in New Kent County
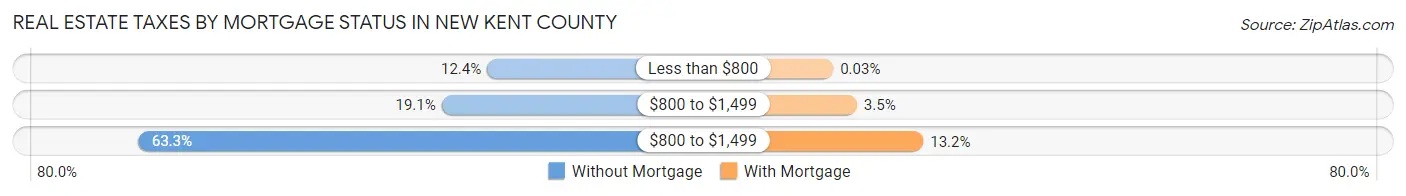
| Property Taxes | Without Mortgage | With Mortgage |
| Less than $800 | 273 (12.4%) | 2 (0.0%) |
| $800 to $1,499 | 419 (19.1%) | 203 (3.5%) |
| $800 to $1,499 | 1,391 (63.3%) | 767 (13.2%) |
| Total | 2,197 (100.0%) | 5,814 (100.0%) |
Health & Disability in New Kent County
Health Insurance Coverage by Age in New Kent County
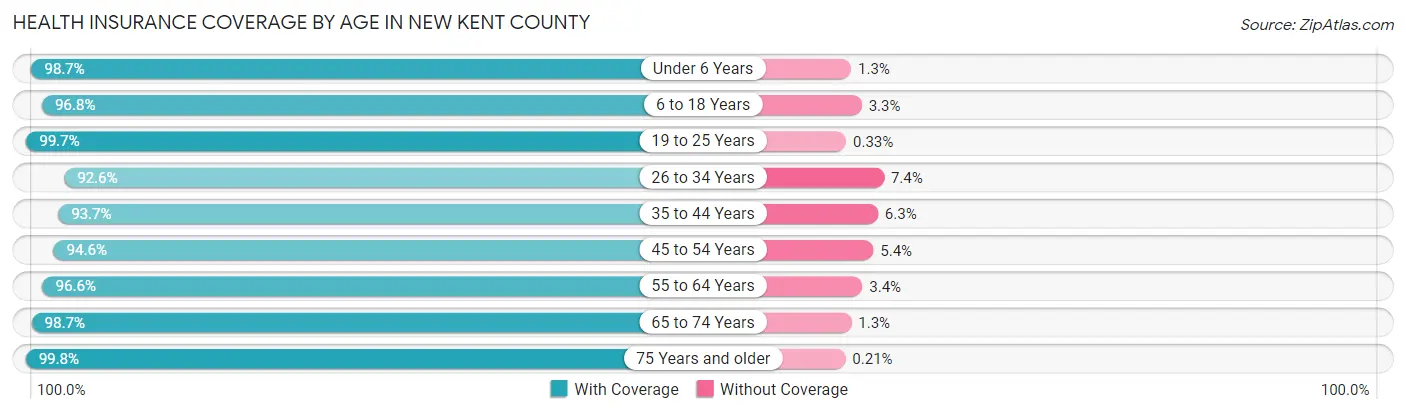
| Age Bracket | With Coverage | Without Coverage |
| Under 6 Years | 1,240 (98.7%) | 16 (1.3%) |
| 6 to 18 Years | 3,275 (96.8%) | 110 (3.3%) |
| 19 to 25 Years | 1,495 (99.7%) | 5 (0.3%) |
| 26 to 34 Years | 2,289 (92.6%) | 183 (7.4%) |
| 35 to 44 Years | 2,780 (93.7%) | 186 (6.3%) |
| 45 to 54 Years | 3,016 (94.6%) | 173 (5.4%) |
| 55 to 64 Years | 3,497 (96.6%) | 122 (3.4%) |
| 65 to 74 Years | 2,684 (98.7%) | 36 (1.3%) |
| 75 Years and older | 1,453 (99.8%) | 3 (0.2%) |
| Total | 21,729 (96.3%) | 834 (3.7%) |
Health Insurance Coverage by Citizenship Status in New Kent County
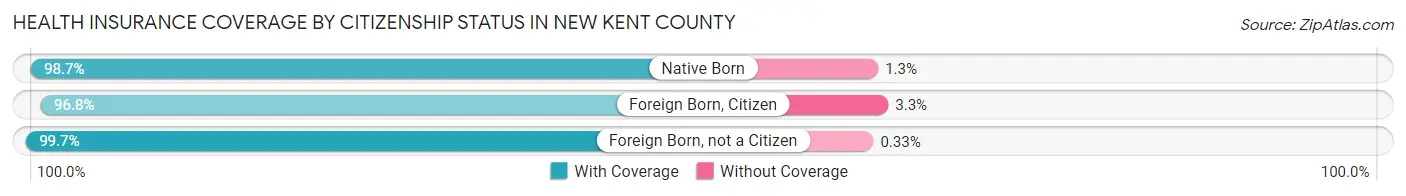
| Citizenship Status | With Coverage | Without Coverage |
| Native Born | 1,240 (98.7%) | 16 (1.3%) |
| Foreign Born, Citizen | 3,275 (96.8%) | 110 (3.3%) |
| Foreign Born, not a Citizen | 1,495 (99.7%) | 5 (0.3%) |
Health Insurance Coverage by Household Income in New Kent County
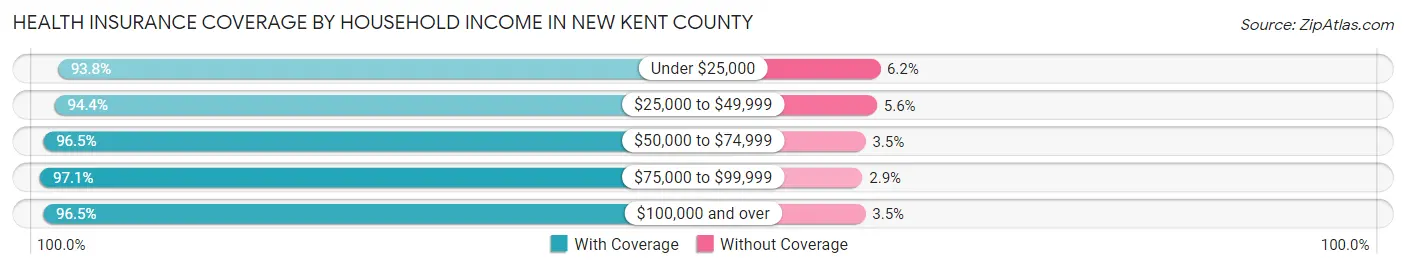
| Household Income | With Coverage | Without Coverage |
| Under $25,000 | 846 (93.8%) | 56 (6.2%) |
| $25,000 to $49,999 | 1,692 (94.4%) | 101 (5.6%) |
| $50,000 to $74,999 | 2,452 (96.5%) | 89 (3.5%) |
| $75,000 to $99,999 | 2,874 (97.1%) | 86 (2.9%) |
| $100,000 and over | 13,835 (96.5%) | 499 (3.5%) |
Public vs Private Health Insurance Coverage by Age in New Kent County
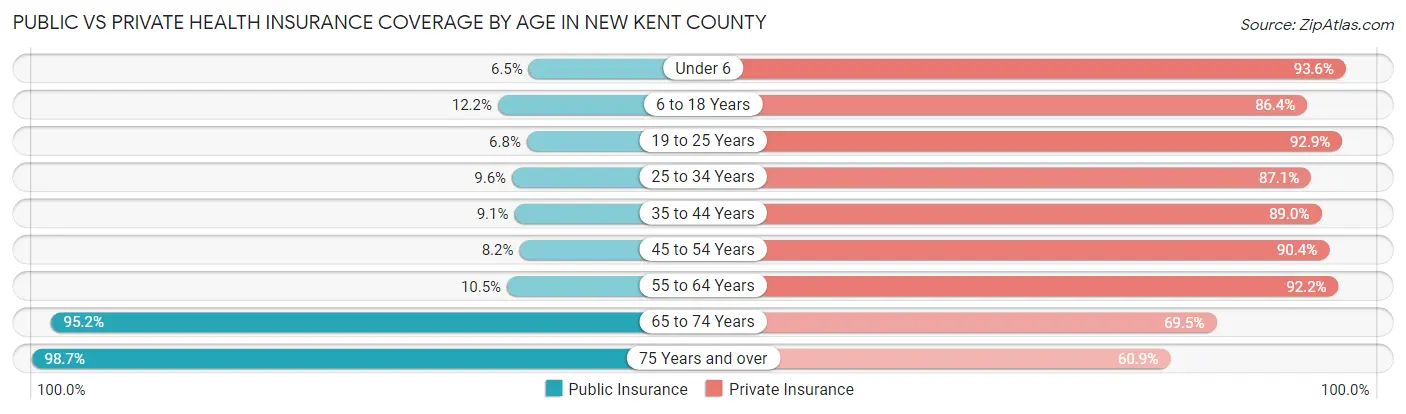
| Age Bracket | Public Insurance | Private Insurance |
| Under 6 | 81 (6.5%) | 1,175 (93.5%) |
| 6 to 18 Years | 412 (12.2%) | 2,924 (86.4%) |
| 19 to 25 Years | 102 (6.8%) | 1,393 (92.9%) |
| 25 to 34 Years | 236 (9.6%) | 2,153 (87.1%) |
| 35 to 44 Years | 270 (9.1%) | 2,639 (89.0%) |
| 45 to 54 Years | 261 (8.2%) | 2,884 (90.4%) |
| 55 to 64 Years | 379 (10.5%) | 3,336 (92.2%) |
| 65 to 74 Years | 2,589 (95.2%) | 1,890 (69.5%) |
| 75 Years and over | 1,437 (98.7%) | 887 (60.9%) |
| Total | 5,767 (25.6%) | 19,281 (85.5%) |
Disability Status by Sex by Age in New Kent County
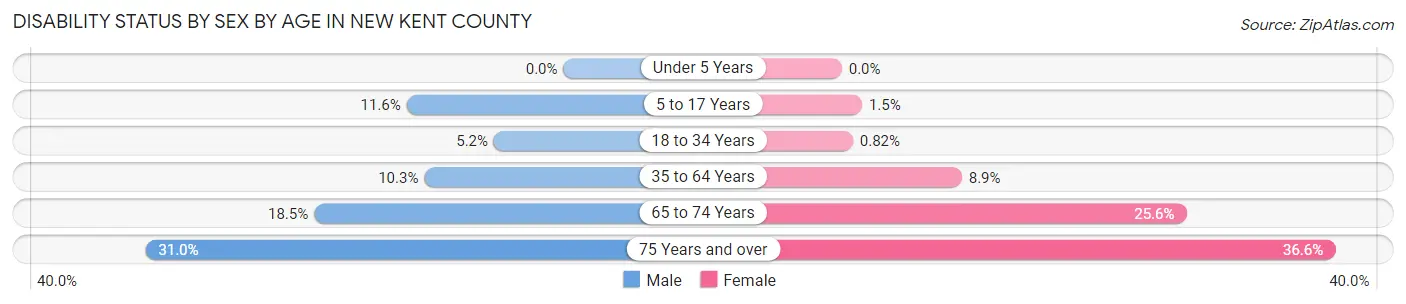
| Age Bracket | Male | Female |
| Under 5 Years | 0 (0.0%) | 0 (0.0%) |
| 5 to 17 Years | 224 (11.6%) | 23 (1.5%) |
| 18 to 34 Years | 115 (5.2%) | 16 (0.8%) |
| 35 to 64 Years | 503 (10.3%) | 437 (8.9%) |
| 65 to 74 Years | 264 (18.5%) | 331 (25.6%) |
| 75 Years and over | 184 (31.0%) | 316 (36.6%) |
Disability Class by Sex by Age in New Kent County
Disability Class: Hearing Difficulty
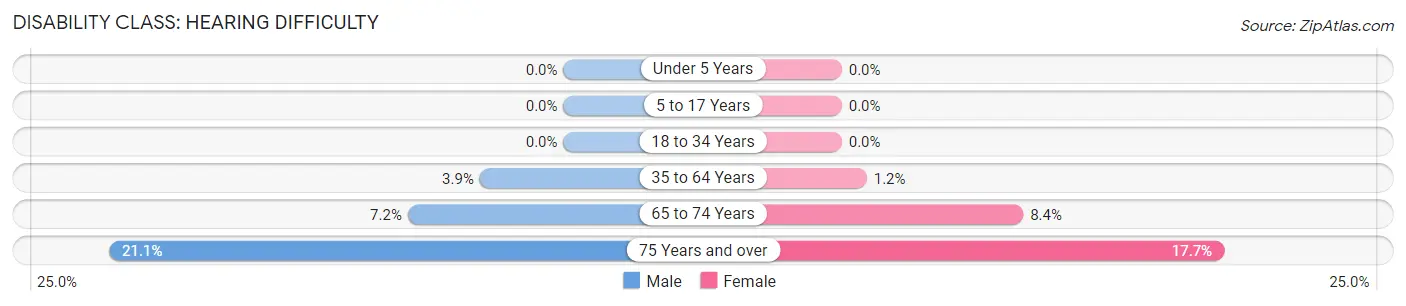
| Age Bracket | Male | Female |
| Under 5 Years | 0 (0.0%) | 0 (0.0%) |
| 5 to 17 Years | 0 (0.0%) | 0 (0.0%) |
| 18 to 34 Years | 0 (0.0%) | 0 (0.0%) |
| 35 to 64 Years | 189 (3.9%) | 57 (1.2%) |
| 65 to 74 Years | 103 (7.2%) | 109 (8.4%) |
| 75 Years and over | 125 (21.1%) | 153 (17.7%) |
Disability Class: Vision Difficulty
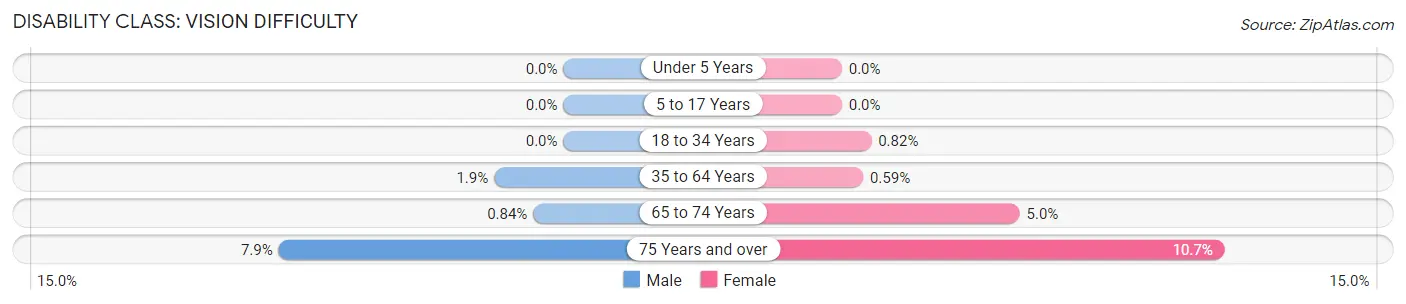
| Age Bracket | Male | Female |
| Under 5 Years | 0 (0.0%) | 0 (0.0%) |
| 5 to 17 Years | 0 (0.0%) | 0 (0.0%) |
| 18 to 34 Years | 0 (0.0%) | 16 (0.8%) |
| 35 to 64 Years | 94 (1.9%) | 29 (0.6%) |
| 65 to 74 Years | 12 (0.8%) | 64 (5.0%) |
| 75 Years and over | 47 (7.9%) | 92 (10.7%) |
Disability Class: Cognitive Difficulty
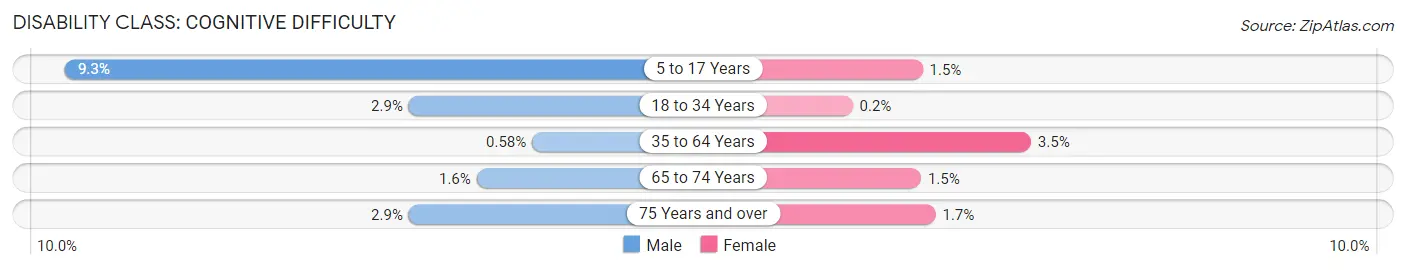
| Age Bracket | Male | Female |
| 5 to 17 Years | 178 (9.2%) | 23 (1.5%) |
| 18 to 34 Years | 64 (2.9%) | 4 (0.2%) |
| 35 to 64 Years | 28 (0.6%) | 172 (3.5%) |
| 65 to 74 Years | 23 (1.6%) | 19 (1.5%) |
| 75 Years and over | 17 (2.9%) | 15 (1.7%) |
Disability Class: Ambulatory Difficulty
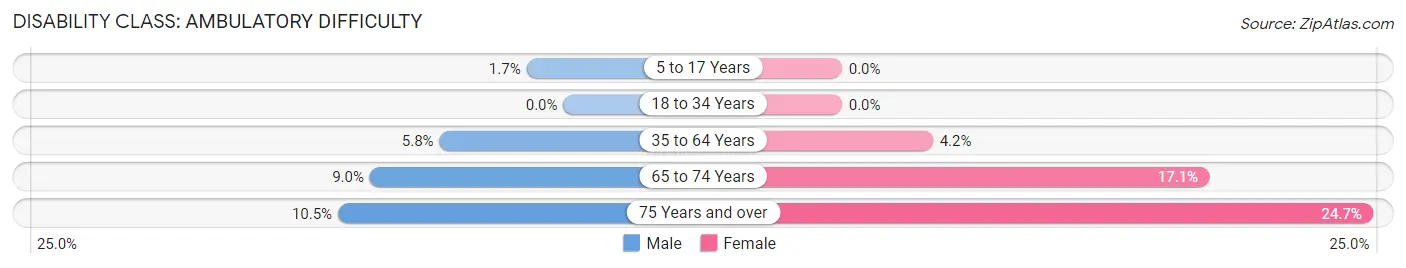
| Age Bracket | Male | Female |
| 5 to 17 Years | 33 (1.7%) | 0 (0.0%) |
| 18 to 34 Years | 0 (0.0%) | 0 (0.0%) |
| 35 to 64 Years | 280 (5.8%) | 207 (4.2%) |
| 65 to 74 Years | 128 (9.0%) | 221 (17.1%) |
| 75 Years and over | 62 (10.5%) | 213 (24.7%) |
Disability Class: Self-Care Difficulty
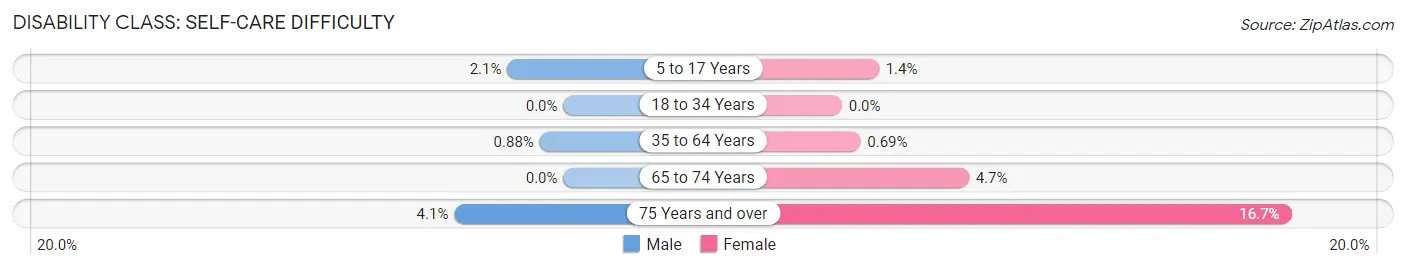
| Age Bracket | Male | Female |
| 5 to 17 Years | 40 (2.1%) | 21 (1.4%) |
| 18 to 34 Years | 0 (0.0%) | 0 (0.0%) |
| 35 to 64 Years | 43 (0.9%) | 34 (0.7%) |
| 65 to 74 Years | 0 (0.0%) | 61 (4.7%) |
| 75 Years and over | 24 (4.1%) | 144 (16.7%) |
Technology Access in New Kent County
Computing Device Access in New Kent County
| Device Type | # Households | % Households |
| Desktop or Laptop | 7,657 | 88.3% |
| Smartphone | 7,997 | 92.2% |
| Tablet | 6,169 | 71.1% |
| No Computing Device | 438 | 5.1% |
| Total | 8,675 | 100.0% |
Internet Access in New Kent County
| Internet Type | # Households | % Households |
| Dial-Up Internet | 29 | 0.3% |
| Broadband Home | 6,064 | 69.9% |
| Cellular Data Only | 1,113 | 12.8% |
| Satellite Internet | 461 | 5.3% |
| No Internet | 935 | 10.8% |
| Total | 8,675 | 100.0% |
New Kent County Summary
Kent County, Virginia is located in the eastern part of the state, just south of the James River. It is bordered by New Kent County to the north, Charles City County to the east, and James City County to the south. The county seat is located in the town of New Kent.
History
The area that is now Kent County was originally part of New Kent County, which was formed in 1654. In 1702, the Virginia General Assembly split New Kent County into two separate counties, naming the new county after the Duke of Kent. The county was officially established in 1720.
During the American Revolution, Kent County was the site of several battles, including the Battle of New Kent Courthouse in 1781. The county was also the site of the Battle of Malvern Hill in 1862, during the Civil War.
Geography
Kent County is located in the eastern part of Virginia, just south of the James River. It is bordered by New Kent County to the north, Charles City County to the east, and James City County to the south. The county has a total area of 246 square miles, of which 241 square miles is land and 5 square miles is water.
The terrain of Kent County is mostly flat, with some rolling hills in the northern part of the county. The county is drained by the Chickahominy River, which flows through the center of the county.
Economy
The economy of Kent County is largely based on agriculture. The county is home to several large farms, which produce a variety of crops, including corn, soybeans, wheat, and hay. The county also has a thriving timber industry, with several sawmills located in the area.
In addition to agriculture and timber, Kent County is home to several manufacturing companies, including a paper mill, a furniture factory, and a plastics plant. The county also has a growing tourism industry, with several wineries, golf courses, and other attractions located in the area.
Demographics
As of the 2010 census, Kent County had a population of 19,197. The racial makeup of the county was 79.3% White, 17.7% African American, 0.4% Native American, 0.7% Asian, 0.1% Pacific Islander, 0.7% from other races, and 1.2% from two or more races. Hispanic or Latino of any race were 2.2% of the population.
The median income for a household in the county was $50,945, and the median income for a family was $60,945. The per capita income for the county was $25,945. About 8.7% of families and 11.2% of the population were below the poverty line, including 15.2% of those under age 18 and 8.2% of those age 65 or over.
Common Questions
What is Per Capita Income in New Kent County?
Per Capita income in New Kent County is $49,666.
What is the Median Family Income in New Kent County?
Median Family Income in New Kent County is $122,910.
What is the Median Household income in New Kent County?
Median Household Income in New Kent County is $113,120.
What is Income or Wage Gap in New Kent County?
Income or Wage Gap in New Kent County is 22.9%.
Women in New Kent County earn 77.1 cents for every dollar earned by a man.
What is Inequality or Gini Index in New Kent County?
Inequality or Gini Index in New Kent County is 0.38.
What is the Total Population of New Kent County?
Total Population of New Kent County is 23,296.
What is the Total Male Population of New Kent County?
Total Male Population of New Kent County is 12,186.
What is the Total Female Population of New Kent County?
Total Female Population of New Kent County is 11,110.
What is the Ratio of Males per 100 Females in New Kent County?
There are 109.68 Males per 100 Females in New Kent County.
What is the Ratio of Females per 100 Males in New Kent County?
There are 91.17 Females per 100 Males in New Kent County.
What is the Median Population Age in New Kent County?
Median Population Age in New Kent County is 43.2 Years.
What is the Average Family Size in New Kent County
Average Family Size in New Kent County is 2.9 People.
What is the Average Household Size in New Kent County
Average Household Size in New Kent County is 2.6 People.
How Large is the Labor Force in New Kent County?
There are 12,671 People in the Labor Forcein in New Kent County.
What is the Percentage of People in the Labor Force in New Kent County?
65.5% of People are in the Labor Force in New Kent County.
What is the Unemployment Rate in New Kent County?
Unemployment Rate in New Kent County is 3.1%.