Nelson County, VA Map & Demographics
Nelson County Map
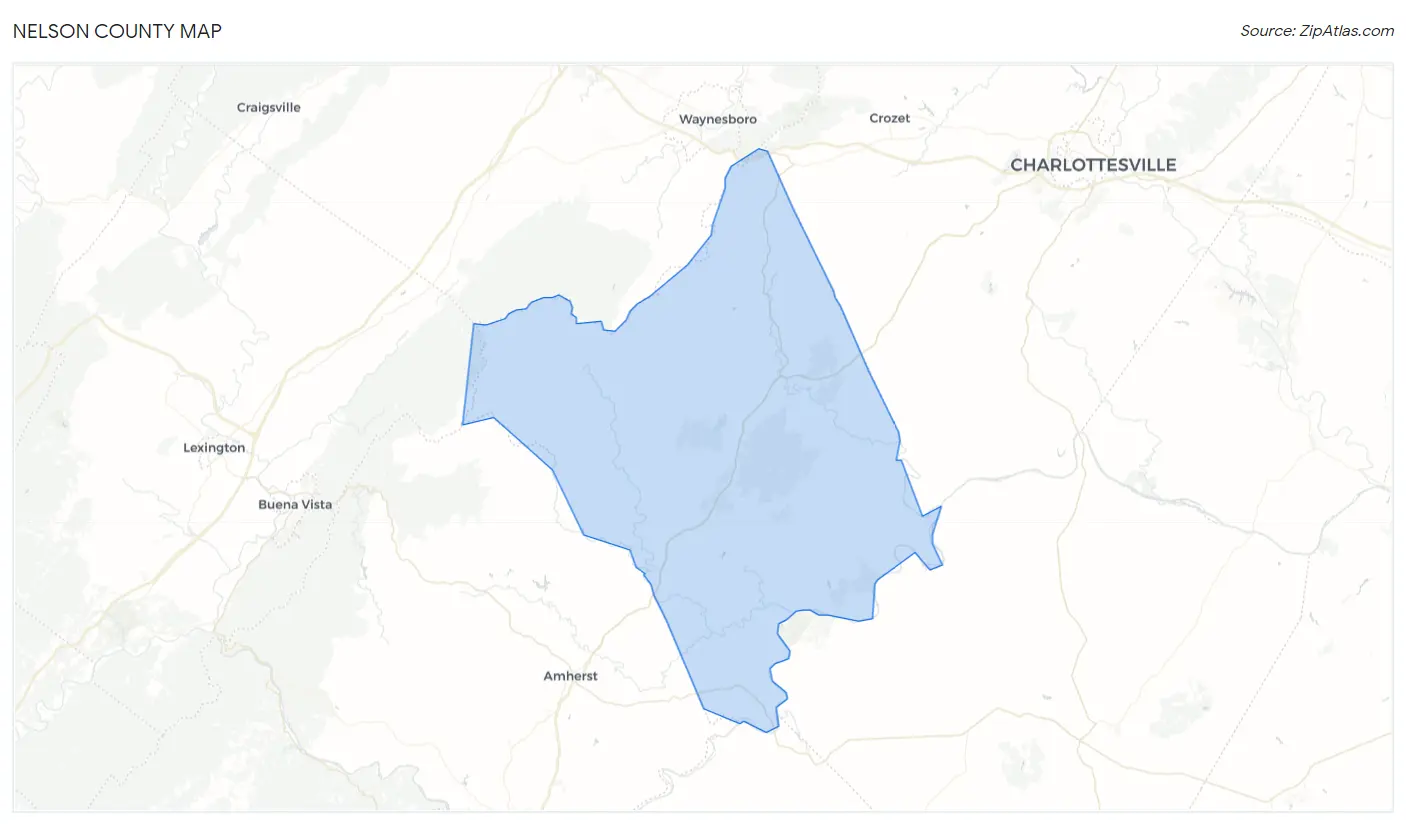
Nelson County Overview
$42,837
PER CAPITA INCOME
$84,974
AVG FAMILY INCOME
$64,028
AVG HOUSEHOLD INCOME
32.9%
WAGE / INCOME GAP [ % ]
67.1¢/ $1
WAGE / INCOME GAP [ $ ]
$10,409
FAMILY INCOME DEFICIT
0.50
INEQUALITY / GINI INDEX
14,773
TOTAL POPULATION
7,463
MALE POPULATION
7,310
FEMALE POPULATION
102.09
MALES / 100 FEMALES
97.95
FEMALES / 100 MALES
50.7
MEDIAN AGE
3.0
AVG FAMILY SIZE
2.4
AVG HOUSEHOLD SIZE
7,071
LABOR FORCE [ PEOPLE ]
56.4%
PERCENT IN LABOR FORCE
3.2%
UNEMPLOYMENT RATE
Nelson County Area Codes
Income in Nelson County
Income Overview in Nelson County
Per Capita Income in Nelson County is $42,837, while median incomes of families and households are $84,974 and $64,028 respectively.
| Characteristic | Number | Measure |
| Per Capita Income | 14,773 | $42,837 |
| Median Family Income | 3,915 | $84,974 |
| Mean Family Income | 3,915 | $125,041 |
| Median Household Income | 6,132 | $64,028 |
| Mean Household Income | 6,132 | $98,854 |
| Income Deficit | 3,915 | $10,409 |
| Wage / Income Gap (%) | 14,773 | 32.85% |
| Wage / Income Gap ($) | 14,773 | 67.15¢ per $1 |
| Gini / Inequality Index | 14,773 | 0.50 |
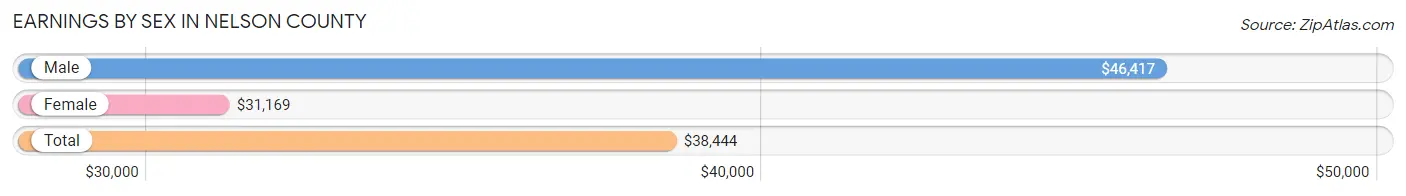
Earnings by Sex in Nelson County
Average Earnings in Nelson County are $38,444, $46,417 for men and $31,169 for women, a difference of 32.9%.
| Sex | Number | Average Earnings |
| Male | 3,977 (53.4%) | $46,417 |
| Female | 3,465 (46.6%) | $31,169 |
| Total | 7,442 (100.0%) | $38,444 |
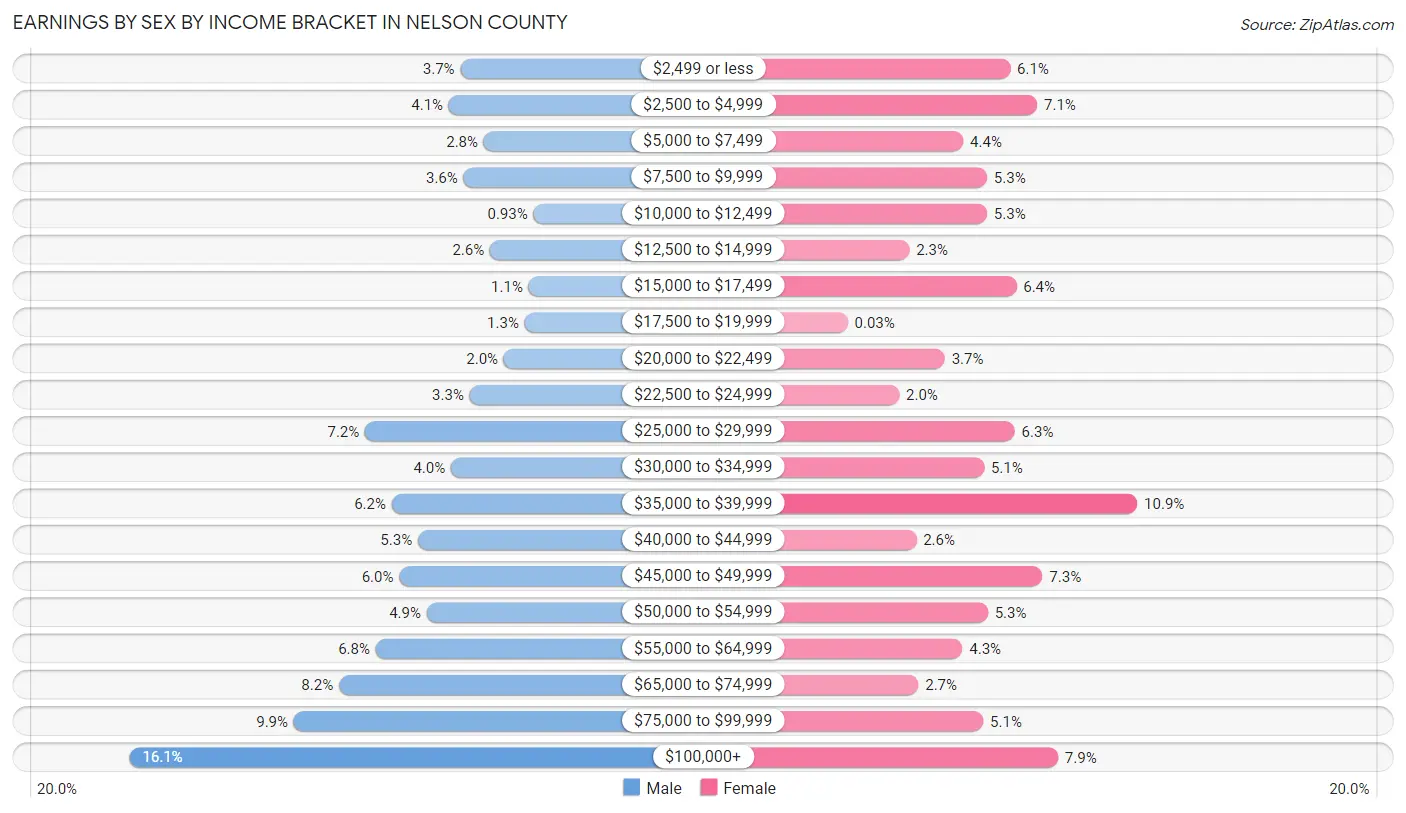
Earnings by Sex by Income Bracket in Nelson County
The most common earnings brackets in Nelson County are $100,000+ for men (639 | 16.1%) and $35,000 to $39,999 for women (377 | 10.9%).
| Income | Male | Female |
| $2,499 or less | 146 (3.7%) | 212 (6.1%) |
| $2,500 to $4,999 | 163 (4.1%) | 247 (7.1%) |
| $5,000 to $7,499 | 111 (2.8%) | 151 (4.4%) |
| $7,500 to $9,999 | 141 (3.5%) | 182 (5.2%) |
| $10,000 to $12,499 | 37 (0.9%) | 182 (5.2%) |
| $12,500 to $14,999 | 102 (2.6%) | 81 (2.3%) |
| $15,000 to $17,499 | 44 (1.1%) | 220 (6.4%) |
| $17,500 to $19,999 | 50 (1.3%) | 1 (0.0%) |
| $20,000 to $22,499 | 81 (2.0%) | 127 (3.7%) |
| $22,500 to $24,999 | 132 (3.3%) | 68 (2.0%) |
| $25,000 to $29,999 | 288 (7.2%) | 218 (6.3%) |
| $30,000 to $34,999 | 160 (4.0%) | 178 (5.1%) |
| $35,000 to $39,999 | 248 (6.2%) | 377 (10.9%) |
| $40,000 to $44,999 | 209 (5.3%) | 90 (2.6%) |
| $45,000 to $49,999 | 237 (6.0%) | 254 (7.3%) |
| $50,000 to $54,999 | 196 (4.9%) | 183 (5.3%) |
| $55,000 to $64,999 | 272 (6.8%) | 150 (4.3%) |
| $65,000 to $74,999 | 327 (8.2%) | 93 (2.7%) |
| $75,000 to $99,999 | 394 (9.9%) | 177 (5.1%) |
| $100,000+ | 639 (16.1%) | 274 (7.9%) |
| Total | 3,977 (100.0%) | 3,465 (100.0%) |
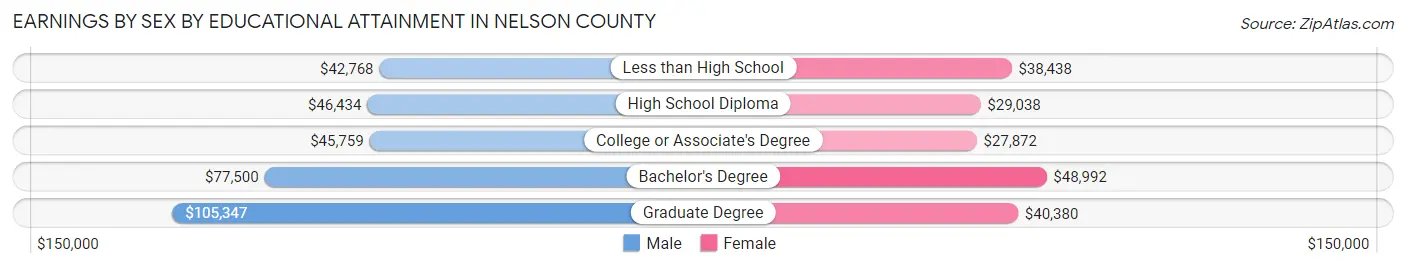
Earnings by Sex by Educational Attainment in Nelson County
Average earnings in Nelson County are $51,573 for men and $35,681 for women, a difference of 30.8%. Men with an educational attainment of graduate degree enjoy the highest average annual earnings of $105,347, while those with less than high school education earn the least with $42,768. Women with an educational attainment of bachelor's degree earn the most with the average annual earnings of $48,992, while those with college or associate's degree education have the smallest earnings of $27,872.
| Educational Attainment | Male Income | Female Income |
| Less than High School | $42,768 | $38,438 |
| High School Diploma | $46,434 | $29,038 |
| College or Associate's Degree | $45,759 | $27,872 |
| Bachelor's Degree | $77,500 | $48,992 |
| Graduate Degree | $105,347 | $40,380 |
| Total | $51,573 | $35,681 |
Family Income in Nelson County
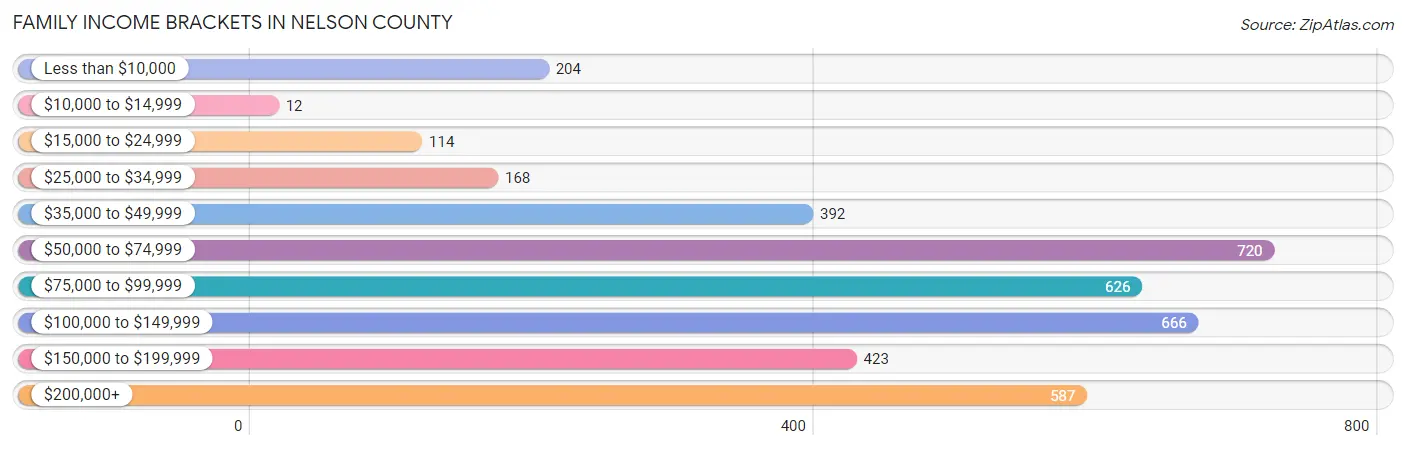
Family Income Brackets in Nelson County
According to the Nelson County family income data, there are 720 families falling into the $50,000 to $74,999 income range, which is the most common income bracket and makes up 18.4% of all families. Conversely, the $10,000 to $14,999 income bracket is the least frequent group with only 12 families (0.3%) belonging to this category.
| Income Bracket | # Families | % Families |
| Less than $10,000 | 204 | 5.2% |
| $10,000 to $14,999 | 12 | 0.3% |
| $15,000 to $24,999 | 114 | 2.9% |
| $25,000 to $34,999 | 168 | 4.3% |
| $35,000 to $49,999 | 392 | 10.0% |
| $50,000 to $74,999 | 720 | 18.4% |
| $75,000 to $99,999 | 626 | 16.0% |
| $100,000 to $149,999 | 666 | 17.0% |
| $150,000 to $199,999 | 423 | 10.8% |
| $200,000+ | 587 | 15.0% |
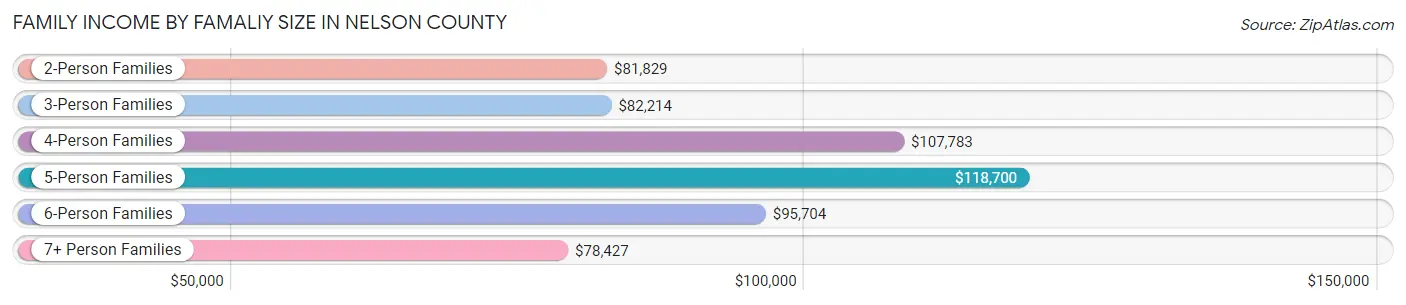
Family Income by Famaliy Size in Nelson County
5-person families (200 | 5.1%) account for the highest median family income in Nelson County with $118,700 per family, while 2-person families (2,361 | 60.3%) have the highest median income of $40,914 per family member.
| Income Bracket | # Families | Median Income |
| 2-Person Families | 2,361 (60.3%) | $81,829 |
| 3-Person Families | 639 (16.3%) | $82,214 |
| 4-Person Families | 453 (11.6%) | $107,783 |
| 5-Person Families | 200 (5.1%) | $118,700 |
| 6-Person Families | 139 (3.5%) | $95,704 |
| 7+ Person Families | 123 (3.1%) | $78,427 |
| Total | 3,915 (100.0%) | $84,974 |
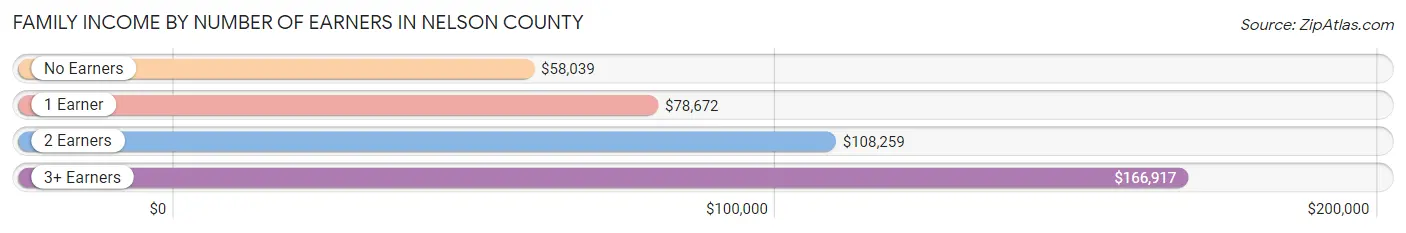
Family Income by Number of Earners in Nelson County
The median family income in Nelson County is $84,974, with families comprising 3+ earners (347) having the highest median family income of $166,917, while families with no earners (920) have the lowest median family income of $58,039, accounting for 8.9% and 23.5% of families, respectively.
| Number of Earners | # Families | Median Income |
| No Earners | 920 (23.5%) | $58,039 |
| 1 Earner | 1,109 (28.3%) | $78,672 |
| 2 Earners | 1,539 (39.3%) | $108,259 |
| 3+ Earners | 347 (8.9%) | $166,917 |
| Total | 3,915 (100.0%) | $84,974 |
Household Income in Nelson County
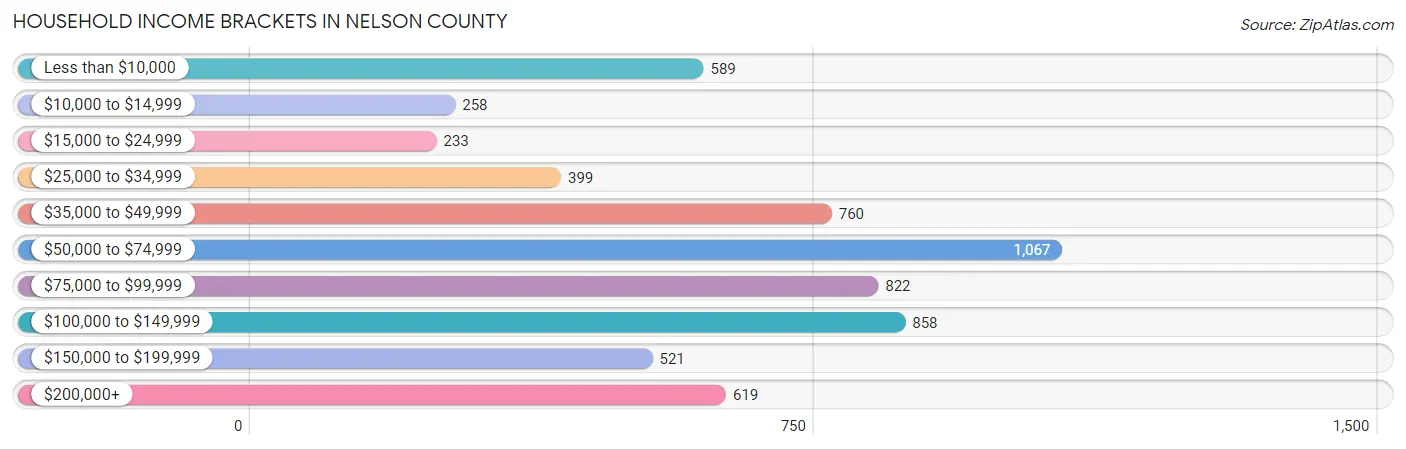
Household Income Brackets in Nelson County
With 1,067 households falling in the category, the $50,000 to $74,999 income range is the most frequent in Nelson County, accounting for 17.4% of all households. In contrast, only 233 households (3.8%) fall into the $15,000 to $24,999 income bracket, making it the least populous group.
| Income Bracket | # Households | % Households |
| Less than $10,000 | 589 | 9.6% |
| $10,000 to $14,999 | 258 | 4.2% |
| $15,000 to $24,999 | 233 | 3.8% |
| $25,000 to $34,999 | 399 | 6.5% |
| $35,000 to $49,999 | 760 | 12.4% |
| $50,000 to $74,999 | 1,067 | 17.4% |
| $75,000 to $99,999 | 822 | 13.4% |
| $100,000 to $149,999 | 858 | 14.0% |
| $150,000 to $199,999 | 521 | 8.5% |
| $200,000+ | 619 | 10.1% |
Household Income by Householder Age in Nelson County
The median household income in Nelson County is $64,028, with the highest median household income of $80,625 found in the 25 to 44 years age bracket for the primary householder. A total of 1,121 households (18.3%) fall into this category. Meanwhile, the 15 to 24 years age bracket for the primary householder has the lowest median household income of $0, with 126 households (2.1%) in this group.
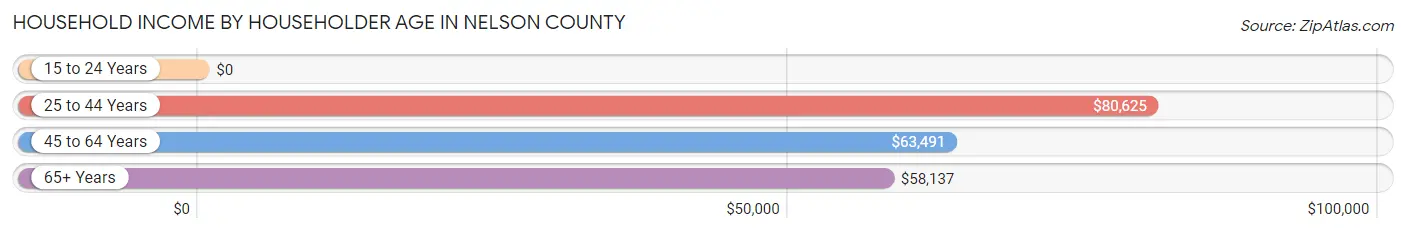
| Income Bracket | # Households | Median Income |
| 15 to 24 Years | 126 (2.1%) | $0 |
| 25 to 44 Years | 1,121 (18.3%) | $80,625 |
| 45 to 64 Years | 2,463 (40.2%) | $63,491 |
| 65+ Years | 2,422 (39.5%) | $58,137 |
| Total | 6,132 (100.0%) | $64,028 |
Poverty in Nelson County
Income Below Poverty by Sex and Age in Nelson County
With 14.0% poverty level for males and 12.5% for females among the residents of Nelson County, 15 year old males and 55 to 64 year old females are the most vulnerable to poverty, with 34 males (100.0%) and 247 females (21.4%) in their respective age groups living below the poverty level.
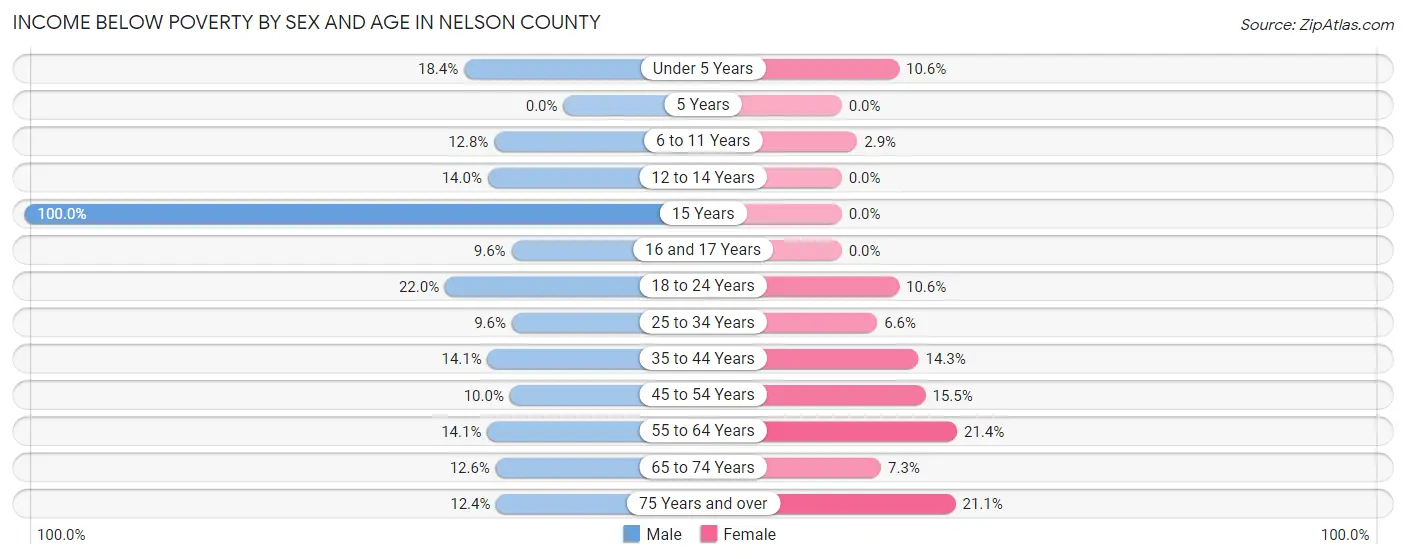
| Age Bracket | Male | Female |
| Under 5 Years | 82 (18.4%) | 27 (10.6%) |
| 5 Years | 0 (0.0%) | 0 (0.0%) |
| 6 to 11 Years | 76 (12.8%) | 14 (2.9%) |
| 12 to 14 Years | 31 (14.0%) | 0 (0.0%) |
| 15 Years | 34 (100.0%) | 0 (0.0%) |
| 16 and 17 Years | 18 (9.6%) | 0 (0.0%) |
| 18 to 24 Years | 147 (22.0%) | 46 (10.6%) |
| 25 to 34 Years | 54 (9.6%) | 50 (6.6%) |
| 35 to 44 Years | 95 (14.1%) | 113 (14.2%) |
| 45 to 54 Years | 91 (10.0%) | 124 (15.5%) |
| 55 to 64 Years | 176 (14.1%) | 247 (21.4%) |
| 65 to 74 Years | 157 (12.6%) | 102 (7.3%) |
| 75 Years and over | 79 (12.4%) | 187 (21.1%) |
| Total | 1,040 (14.0%) | 910 (12.5%) |
Income Above Poverty by Sex and Age in Nelson County
According to the poverty statistics in Nelson County, males aged 5 years and females aged 5 years are the age groups that are most secure financially, with 100.0% of males and 100.0% of females in these age groups living above the poverty line.
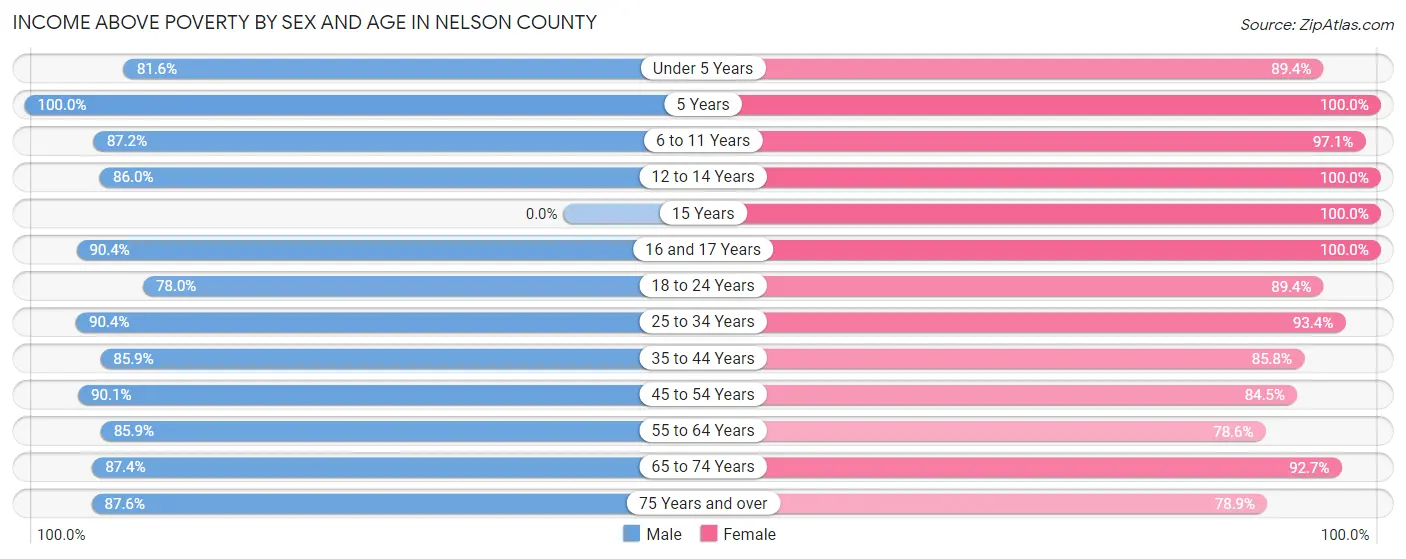
| Age Bracket | Male | Female |
| Under 5 Years | 363 (81.6%) | 227 (89.4%) |
| 5 Years | 7 (100.0%) | 34 (100.0%) |
| 6 to 11 Years | 516 (87.2%) | 471 (97.1%) |
| 12 to 14 Years | 190 (86.0%) | 120 (100.0%) |
| 15 Years | 0 (0.0%) | 38 (100.0%) |
| 16 and 17 Years | 169 (90.4%) | 132 (100.0%) |
| 18 to 24 Years | 522 (78.0%) | 387 (89.4%) |
| 25 to 34 Years | 511 (90.4%) | 709 (93.4%) |
| 35 to 44 Years | 580 (85.9%) | 680 (85.8%) |
| 45 to 54 Years | 824 (90.0%) | 674 (84.5%) |
| 55 to 64 Years | 1,070 (85.9%) | 907 (78.6%) |
| 65 to 74 Years | 1,093 (87.4%) | 1,297 (92.7%) |
| 75 Years and over | 556 (87.6%) | 699 (78.9%) |
| Total | 6,401 (86.0%) | 6,375 (87.5%) |
Income Below Poverty Among Married-Couple Families in Nelson County
The poverty statistics for married-couple families in Nelson County show that 9.1% or 305 of the total 3,348 families live below the poverty line. Families with 5 or more children have the highest poverty rate of 75.0%, comprising of 30 families. On the other hand, families with 1 or 2 children have the lowest poverty rate of 4.0%, which includes 27 families.
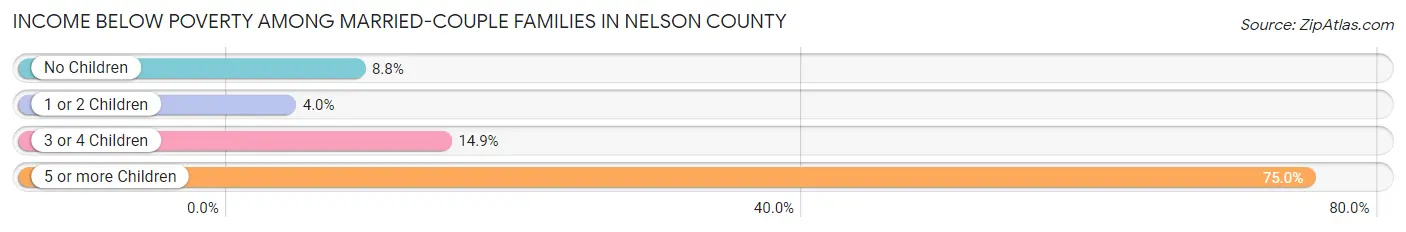
| Children | Above Poverty | Below Poverty |
| No Children | 2,176 (91.2%) | 211 (8.8%) |
| 1 or 2 Children | 645 (96.0%) | 27 (4.0%) |
| 3 or 4 Children | 212 (85.1%) | 37 (14.9%) |
| 5 or more Children | 10 (25.0%) | 30 (75.0%) |
| Total | 3,043 (90.9%) | 305 (9.1%) |
Income Below Poverty Among Single-Parent Households in Nelson County
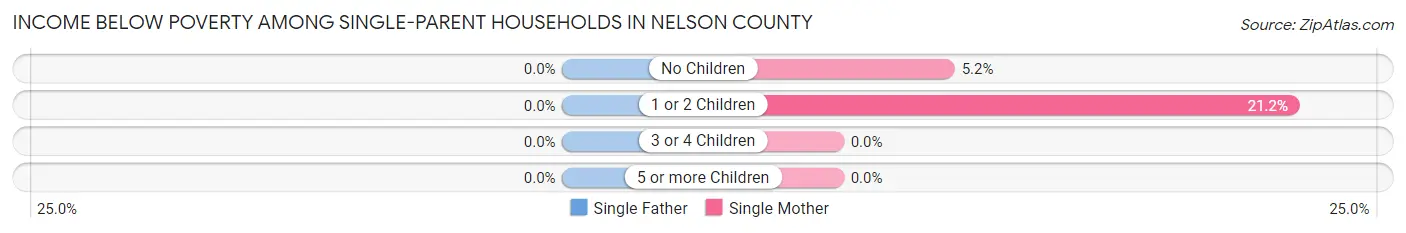
| Children | Single Father | Single Mother |
| No Children | 0 (0.0%) | 12 (5.2%) |
| 1 or 2 Children | 0 (0.0%) | 41 (21.2%) |
| 3 or 4 Children | 0 (0.0%) | 0 (0.0%) |
| 5 or more Children | 0 (0.0%) | 0 (0.0%) |
| Total | 0 (0.0%) | 53 (12.3%) |
Income Below Poverty Among Married-Couple vs Single-Parent Households in Nelson County
The poverty data for Nelson County shows that 305 of the married-couple family households (9.1%) and 53 of the single-parent households (9.3%) are living below the poverty level. Within the married-couple family households, those with 5 or more children have the highest poverty rate, with 30 households (75.0%) falling below the poverty line. Among the single-parent households, those with 1 or 2 children have the highest poverty rate, with 41 household (17.0%) living below poverty.
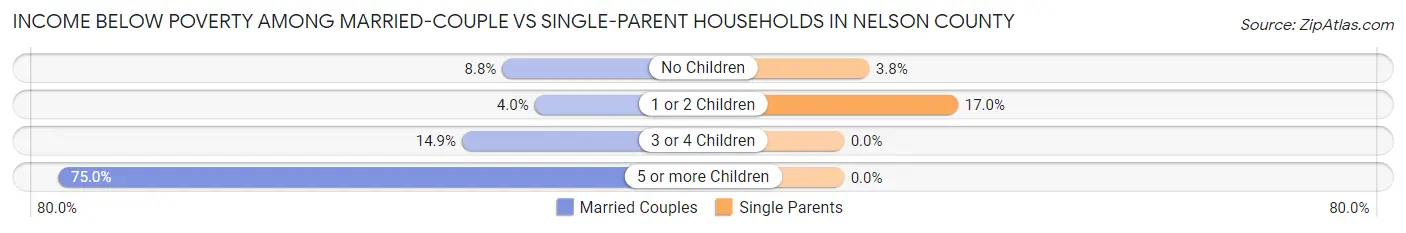
| Children | Married-Couple Families | Single-Parent Households |
| No Children | 211 (8.8%) | 12 (3.8%) |
| 1 or 2 Children | 27 (4.0%) | 41 (17.0%) |
| 3 or 4 Children | 37 (14.9%) | 0 (0.0%) |
| 5 or more Children | 30 (75.0%) | 0 (0.0%) |
| Total | 305 (9.1%) | 53 (9.3%) |
Race in Nelson County
The most populous races in Nelson County are White / Caucasian (12,160 | 82.3%), Black / African American (1,830 | 12.4%), and Hispanic or Latino (677 | 4.6%).
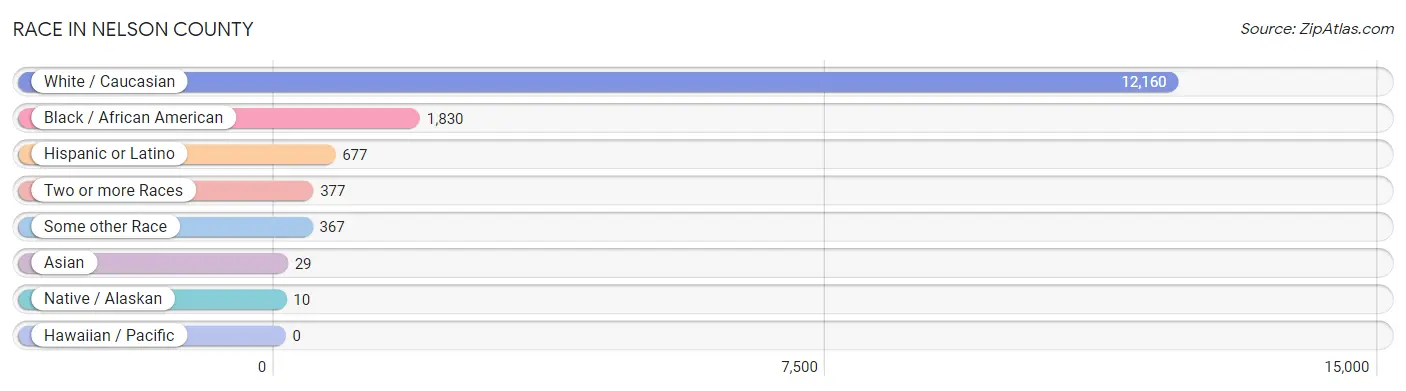
| Race | # Population | % Population |
| Asian | 29 | 0.2% |
| Black / African American | 1,830 | 12.4% |
| Hawaiian / Pacific | 0 | 0.0% |
| Hispanic or Latino | 677 | 4.6% |
| Native / Alaskan | 10 | 0.1% |
| White / Caucasian | 12,160 | 82.3% |
| Two or more Races | 377 | 2.5% |
| Some other Race | 367 | 2.5% |
| Total | 14,773 | 100.0% |
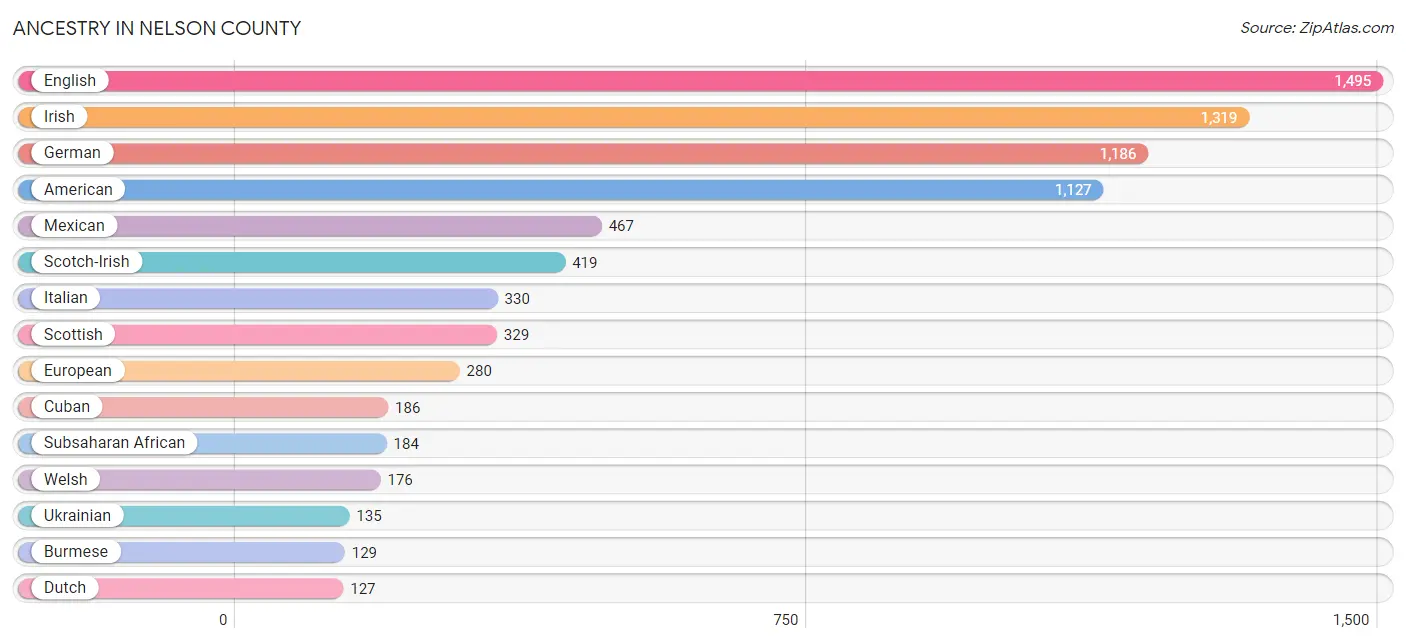
Ancestry in Nelson County
The most populous ancestries reported in Nelson County are English (1,495 | 10.1%), Irish (1,319 | 8.9%), German (1,186 | 8.0%), American (1,127 | 7.6%), and Mexican (467 | 3.2%), together accounting for 37.9% of all Nelson County residents.
| Ancestry | # Population | % Population |
| African | 43 | 0.3% |
| American | 1,127 | 7.6% |
| Armenian | 85 | 0.6% |
| Austrian | 7 | 0.1% |
| British | 76 | 0.5% |
| Burmese | 129 | 0.9% |
| Canadian | 21 | 0.1% |
| Cape Verdean | 34 | 0.2% |
| Cherokee | 40 | 0.3% |
| Croatian | 22 | 0.2% |
| Cuban | 186 | 1.3% |
| Czech | 8 | 0.1% |
| Dutch | 127 | 0.9% |
| Eastern European | 16 | 0.1% |
| English | 1,495 | 10.1% |
| European | 280 | 1.9% |
| Finnish | 11 | 0.1% |
| French | 123 | 0.8% |
| French Canadian | 18 | 0.1% |
| German | 1,186 | 8.0% |
| Hungarian | 46 | 0.3% |
| Irish | 1,319 | 8.9% |
| Italian | 330 | 2.2% |
| Jamaican | 26 | 0.2% |
| Kenyan | 107 | 0.7% |
| Korean | 59 | 0.4% |
| Laotian | 4 | 0.0% |
| Mexican | 467 | 3.2% |
| Navajo | 26 | 0.2% |
| Northern European | 25 | 0.2% |
| Norwegian | 35 | 0.2% |
| Pennsylvania German | 3 | 0.0% |
| Polish | 109 | 0.7% |
| Portuguese | 7 | 0.1% |
| Russian | 78 | 0.5% |
| Scandinavian | 14 | 0.1% |
| Scotch-Irish | 419 | 2.8% |
| Scottish | 329 | 2.2% |
| Serbian | 11 | 0.1% |
| Slavic | 14 | 0.1% |
| Slovak | 10 | 0.1% |
| Slovene | 13 | 0.1% |
| Subsaharan African | 184 | 1.3% |
| Swedish | 27 | 0.2% |
| Swiss | 99 | 0.7% |
| Ukrainian | 135 | 0.9% |
| Welsh | 176 | 1.2% |
| West Indian | 3 | 0.0% | View All 48 Rows |
Immigrants in Nelson County
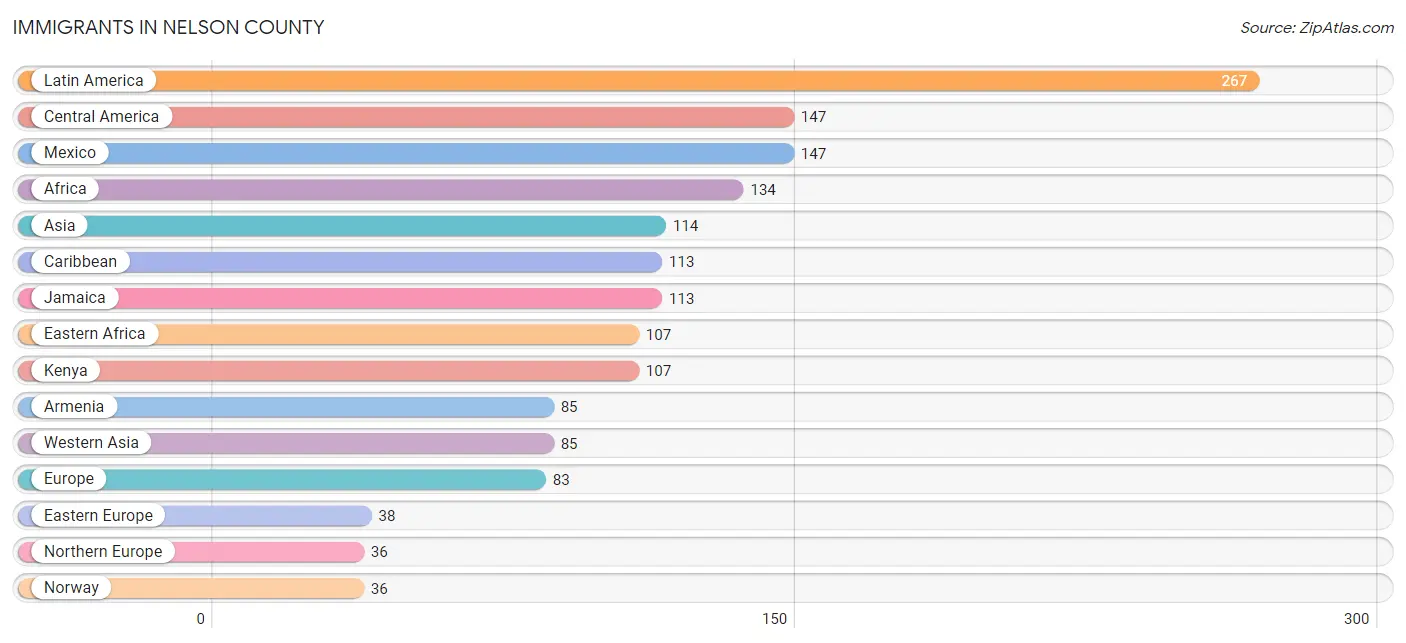
The most numerous immigrant groups reported in Nelson County came from Latin America (267 | 1.8%), Central America (147 | 1.0%), Mexico (147 | 1.0%), Africa (134 | 0.9%), and Asia (114 | 0.8%), together accounting for 5.5% of all Nelson County residents.
| Immigration Origin | # Population | % Population |
| Africa | 134 | 0.9% |
| Armenia | 85 | 0.6% |
| Asia | 114 | 0.8% |
| Canada | 24 | 0.2% |
| Caribbean | 113 | 0.8% |
| Central America | 147 | 1.0% |
| Eastern Africa | 107 | 0.7% |
| Eastern Europe | 38 | 0.3% |
| Europe | 83 | 0.6% |
| Germany | 9 | 0.1% |
| Indonesia | 4 | 0.0% |
| Jamaica | 113 | 0.8% |
| Kenya | 107 | 0.7% |
| Latin America | 267 | 1.8% |
| Mexico | 147 | 1.0% |
| Nigeria | 27 | 0.2% |
| Northern Europe | 36 | 0.2% |
| Norway | 36 | 0.2% |
| Oceania | 8 | 0.1% |
| Philippines | 25 | 0.2% |
| Russia | 15 | 0.1% |
| South America | 7 | 0.1% |
| South Eastern Asia | 29 | 0.2% |
| Ukraine | 23 | 0.2% |
| Venezuela | 7 | 0.1% |
| Western Africa | 27 | 0.2% |
| Western Asia | 85 | 0.6% |
| Western Europe | 9 | 0.1% | View All 28 Rows |
Sex and Age in Nelson County
Sex and Age in Nelson County
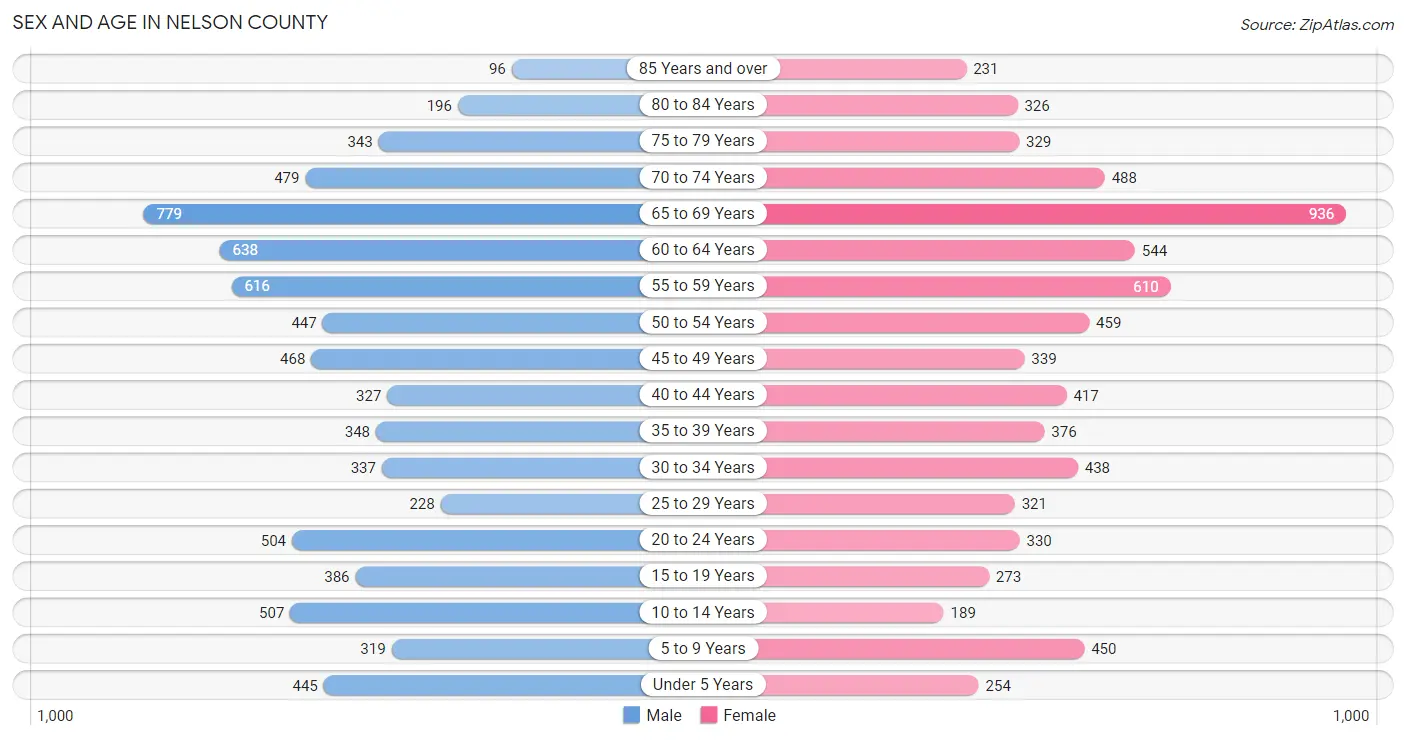
The most populous age groups in Nelson County are 65 to 69 Years (779 | 10.4%) for men and 65 to 69 Years (936 | 12.8%) for women.
| Age Bracket | Male | Female |
| Under 5 Years | 445 (6.0%) | 254 (3.5%) |
| 5 to 9 Years | 319 (4.3%) | 450 (6.2%) |
| 10 to 14 Years | 507 (6.8%) | 189 (2.6%) |
| 15 to 19 Years | 386 (5.2%) | 273 (3.7%) |
| 20 to 24 Years | 504 (6.8%) | 330 (4.5%) |
| 25 to 29 Years | 228 (3.1%) | 321 (4.4%) |
| 30 to 34 Years | 337 (4.5%) | 438 (6.0%) |
| 35 to 39 Years | 348 (4.7%) | 376 (5.1%) |
| 40 to 44 Years | 327 (4.4%) | 417 (5.7%) |
| 45 to 49 Years | 468 (6.3%) | 339 (4.6%) |
| 50 to 54 Years | 447 (6.0%) | 459 (6.3%) |
| 55 to 59 Years | 616 (8.3%) | 610 (8.3%) |
| 60 to 64 Years | 638 (8.6%) | 544 (7.4%) |
| 65 to 69 Years | 779 (10.4%) | 936 (12.8%) |
| 70 to 74 Years | 479 (6.4%) | 488 (6.7%) |
| 75 to 79 Years | 343 (4.6%) | 329 (4.5%) |
| 80 to 84 Years | 196 (2.6%) | 326 (4.5%) |
| 85 Years and over | 96 (1.3%) | 231 (3.2%) |
| Total | 7,463 (100.0%) | 7,310 (100.0%) |
Families and Households in Nelson County
Median Family Size in Nelson County
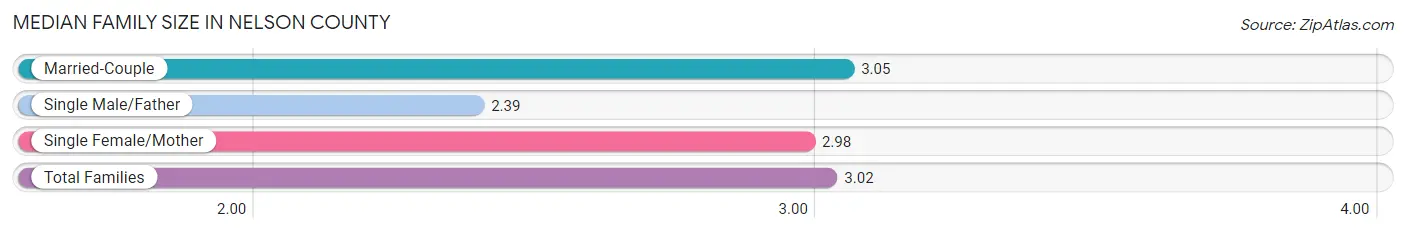
The median family size in Nelson County is 3.02 persons per family, with married-couple families (3,348 | 85.5%) accounting for the largest median family size of 3.05 persons per family. On the other hand, single male/father families (135 | 3.5%) represent the smallest median family size with 2.39 persons per family.
| Family Type | # Families | Family Size |
| Married-Couple | 3,348 (85.5%) | 3.05 |
| Single Male/Father | 135 (3.5%) | 2.39 |
| Single Female/Mother | 432 (11.0%) | 2.98 |
| Total Families | 3,915 (100.0%) | 3.02 |
Median Household Size in Nelson County
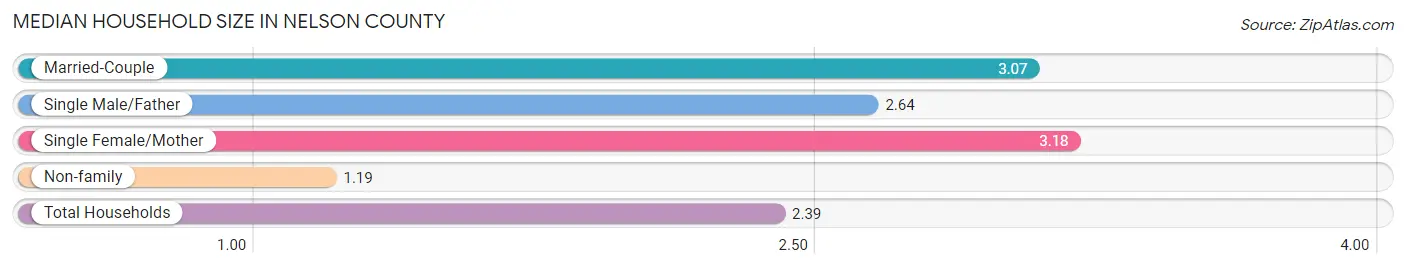
The median household size in Nelson County is 2.39 persons per household, with single female/mother households (432 | 7.0%) accounting for the largest median household size of 3.18 persons per household. non-family households (2,217 | 36.1%) represent the smallest median household size with 1.19 persons per household.
| Household Type | # Households | Household Size |
| Married-Couple | 3,348 (54.6%) | 3.07 |
| Single Male/Father | 135 (2.2%) | 2.64 |
| Single Female/Mother | 432 (7.0%) | 3.18 |
| Non-family | 2,217 (36.1%) | 1.19 |
| Total Households | 6,132 (100.0%) | 2.39 |
Household Size by Marriage Status in Nelson County
Out of a total of 6,132 households in Nelson County, 3,915 (63.8%) are family households, while 2,217 (36.1%) are nonfamily households. The most numerous type of family households are 2-person households, comprising 2,274, and the most common type of nonfamily households are 1-person households, comprising 1,873.
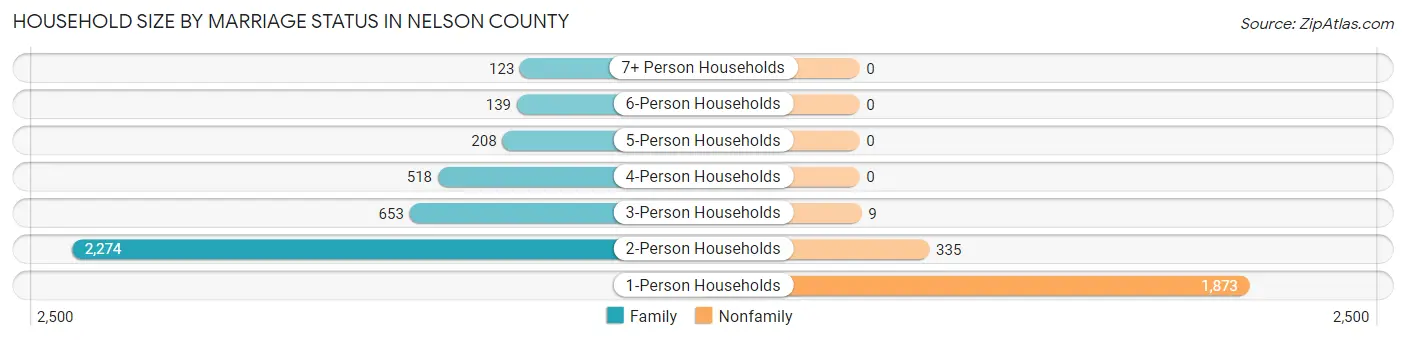
| Household Size | Family Households | Nonfamily Households |
| 1-Person Households | - | 1,873 (30.5%) |
| 2-Person Households | 2,274 (37.1%) | 335 (5.5%) |
| 3-Person Households | 653 (10.6%) | 9 (0.2%) |
| 4-Person Households | 518 (8.5%) | 0 (0.0%) |
| 5-Person Households | 208 (3.4%) | 0 (0.0%) |
| 6-Person Households | 139 (2.3%) | 0 (0.0%) |
| 7+ Person Households | 123 (2.0%) | 0 (0.0%) |
| Total | 3,915 (63.8%) | 2,217 (36.1%) |
Female Fertility in Nelson County
Fertility by Age in Nelson County
Average fertility rate in Nelson County is 96.0 births per 1,000 women. Women in the age bracket of 20 to 34 years have the highest fertility rate with 204.0 births per 1,000 women. Women in the age bracket of 20 to 34 years acount for 88.1% of all women with births.
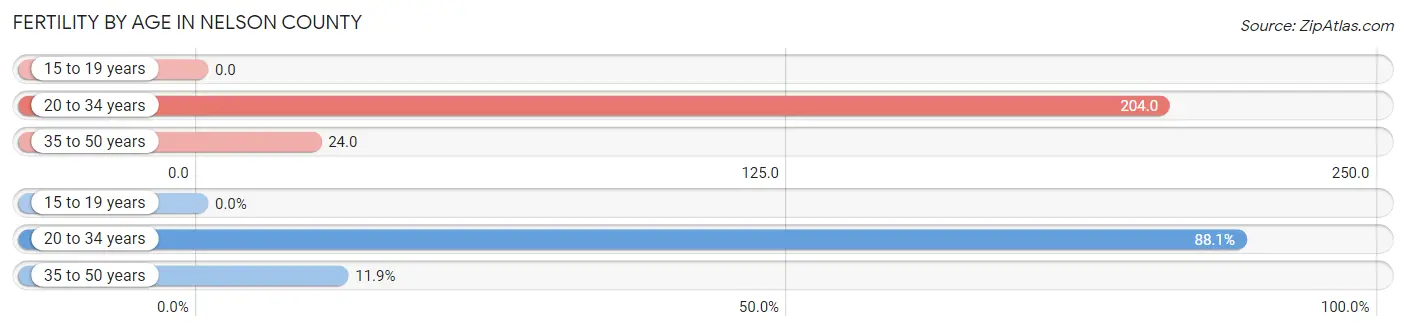
| Age Bracket | Women with Births | Births / 1,000 Women |
| 15 to 19 years | 0 (0.0%) | 0.0 |
| 20 to 34 years | 222 (88.1%) | 204.0 |
| 35 to 50 years | 30 (11.9%) | 24.0 |
| Total | 252 (100.0%) | 96.0 |
Fertility by Age by Marriage Status in Nelson County
54.8% of women with births (252) in Nelson County are married. The highest percentage of unmarried women with births falls into 20 to 34 years age bracket with 51.3% of them unmarried at the time of birth, while the lowest percentage of unmarried women with births belong to 35 to 50 years age bracket with 0.0% of them unmarried.
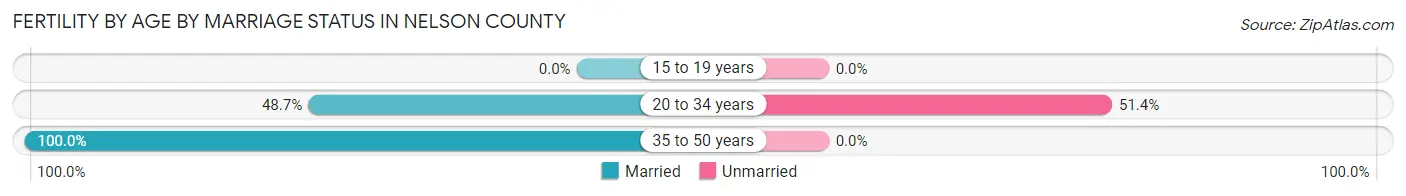
| Age Bracket | Married | Unmarried |
| 15 to 19 years | 0 (0.0%) | 0 (0.0%) |
| 20 to 34 years | 108 (48.6%) | 114 (51.3%) |
| 35 to 50 years | 30 (100.0%) | 0 (0.0%) |
| Total | 138 (54.8%) | 114 (45.2%) |
Fertility by Education in Nelson County
Average fertility rate in Nelson County is 96.0 births per 1,000 women. Women with the education attainment of college or associate's degree have the highest fertility rate of 159.0 births per 1,000 women, while women with the education attainment of graduate degree have the lowest fertility at 18.0 births per 1,000 women. Women with the education attainment of college or associate's degree represent 48.0% of all women with births.
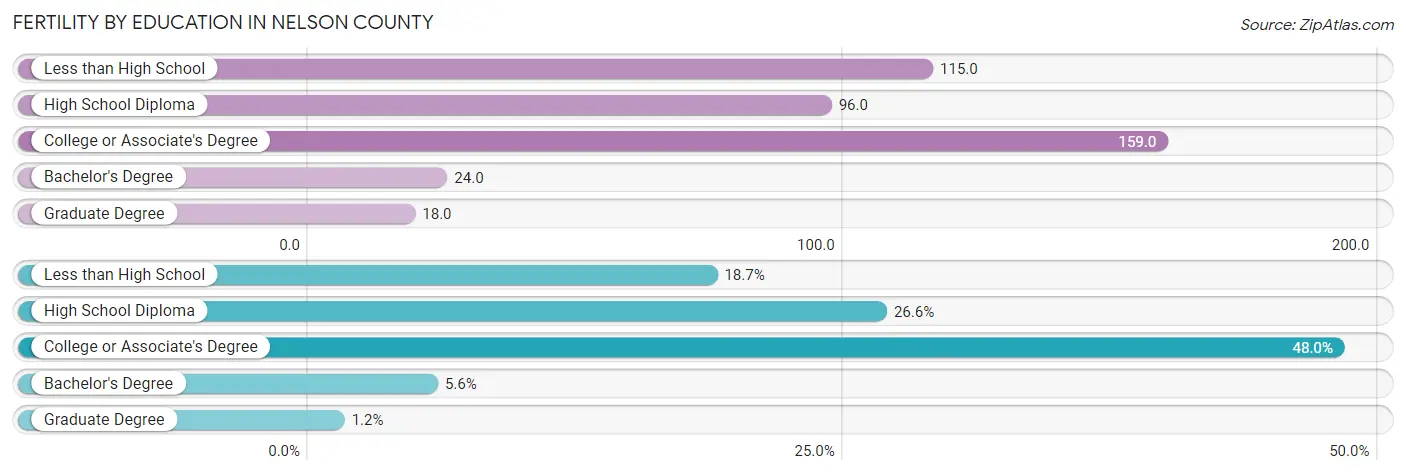
| Educational Attainment | Women with Births | Births / 1,000 Women |
| Less than High School | 47 (18.6%) | 115.0 |
| High School Diploma | 67 (26.6%) | 96.0 |
| College or Associate's Degree | 121 (48.0%) | 159.0 |
| Bachelor's Degree | 14 (5.6%) | 24.0 |
| Graduate Degree | 3 (1.2%) | 18.0 |
| Total | 252 (100.0%) | 96.0 |
Fertility by Education by Marriage Status in Nelson County
45.2% of women with births in Nelson County are unmarried. Women with the educational attainment of less than high school are most likely to be married with 100.0% of them married at childbirth, while women with the educational attainment of college or associate's degree are least likely to be married with 75.2% of them unmarried at childbirth.
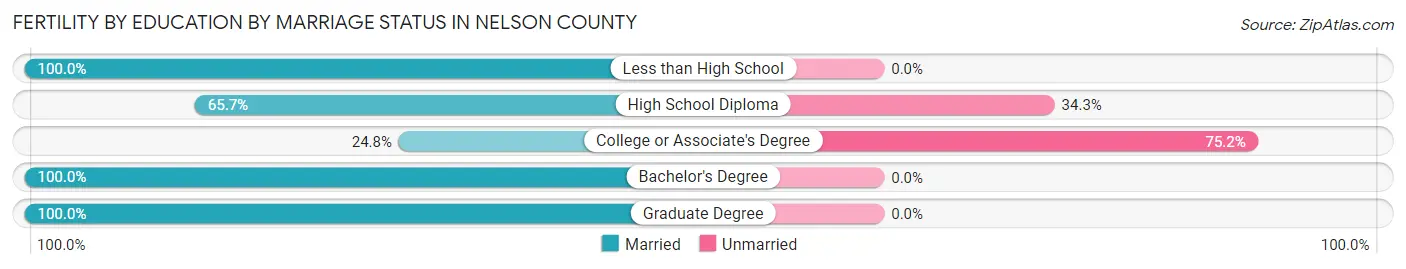
| Educational Attainment | Married | Unmarried |
| Less than High School | 47 (100.0%) | 0 (0.0%) |
| High School Diploma | 44 (65.7%) | 23 (34.3%) |
| College or Associate's Degree | 30 (24.8%) | 91 (75.2%) |
| Bachelor's Degree | 14 (100.0%) | 0 (0.0%) |
| Graduate Degree | 3 (100.0%) | 0 (0.0%) |
| Total | 138 (54.8%) | 114 (45.2%) |
Employment Characteristics in Nelson County
Employment by Class of Employer in Nelson County
Among the 6,495 employed individuals in Nelson County, private company employees (3,763 | 57.9%), self-employed (not incorporated) (788 | 12.1%), and self-employed (incorporated) (527 | 8.1%) make up the most common classes of employment.
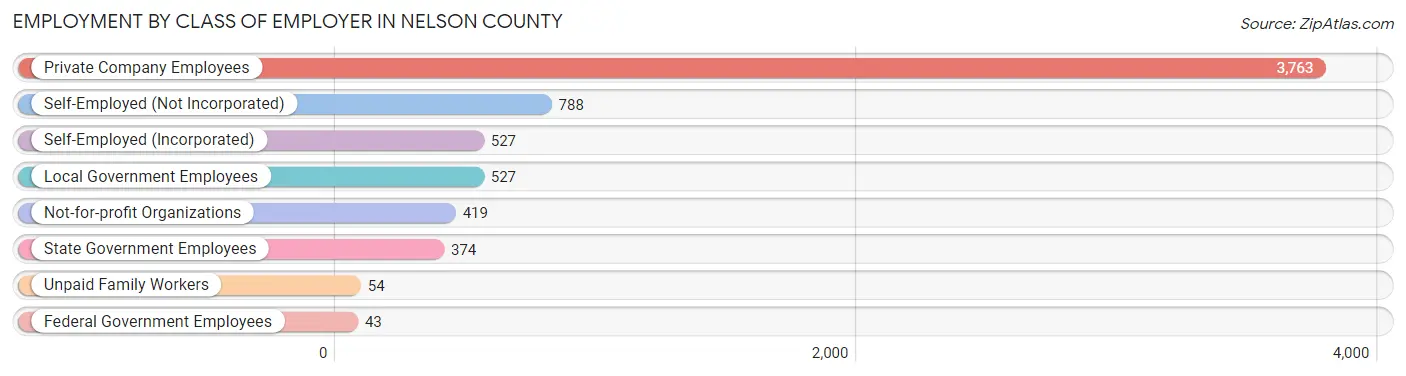
| Employer Class | # Employees | % Employees |
| Private Company Employees | 3,763 | 57.9% |
| Self-Employed (Incorporated) | 527 | 8.1% |
| Self-Employed (Not Incorporated) | 788 | 12.1% |
| Not-for-profit Organizations | 419 | 6.5% |
| Local Government Employees | 527 | 8.1% |
| State Government Employees | 374 | 5.8% |
| Federal Government Employees | 43 | 0.7% |
| Unpaid Family Workers | 54 | 0.8% |
| Total | 6,495 | 100.0% |
Employment Status by Age in Nelson County
According to the labor force statistics for Nelson County, out of the total population over 16 years of age (12,537), 56.4% or 7,071 individuals are in the labor force, with 3.2% or 226 of them unemployed. The age group with the highest labor force participation rate is 30 to 34 years, with 88.1% or 683 individuals in the labor force. Within the labor force, the 75 years and over age range has the highest percentage of unemployed individuals, with 8.0% or 9 of them being unemployed.
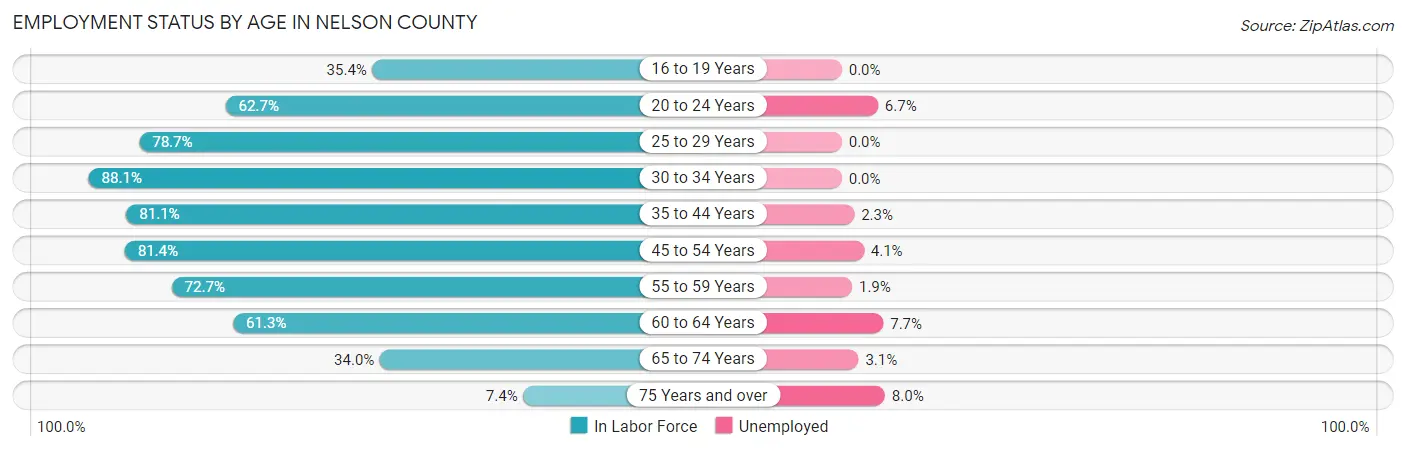
| Age Bracket | In Labor Force | Unemployed |
| 16 to 19 Years | 208 (35.4%) | 0 (0.0%) |
| 20 to 24 Years | 523 (62.7%) | 35 (6.7%) |
| 25 to 29 Years | 432 (78.7%) | 0 (0.0%) |
| 30 to 34 Years | 683 (88.1%) | 0 (0.0%) |
| 35 to 44 Years | 1,191 (81.1%) | 27 (2.3%) |
| 45 to 54 Years | 1,394 (81.4%) | 57 (4.1%) |
| 55 to 59 Years | 891 (72.7%) | 17 (1.9%) |
| 60 to 64 Years | 725 (61.3%) | 56 (7.7%) |
| 65 to 74 Years | 912 (34.0%) | 28 (3.1%) |
| 75 Years and over | 113 (7.4%) | 9 (8.0%) |
| Total | 7,071 (56.4%) | 226 (3.2%) |
Employment Status by Educational Attainment in Nelson County
According to labor force statistics for Nelson County, 76.9% of individuals (5,316) out of the total population between 25 and 64 years of age (6,913) are in the labor force, with 3.0% or 159 of them being unemployed. The group with the highest labor force participation rate are those with the educational attainment of college / associate degree, with 84.8% or 1,238 individuals in the labor force. Within the labor force, individuals with college / associate degree education have the highest percentage of unemployment, with 5.7% or 71 of them being unemployed.
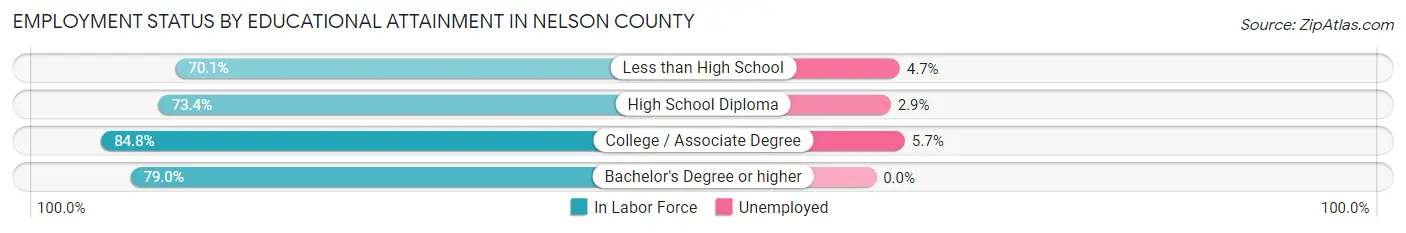
| Educational Attainment | In Labor Force | Unemployed |
| Less than High School | 634 (70.1%) | 43 (4.7%) |
| High School Diploma | 1,948 (73.4%) | 77 (2.9%) |
| College / Associate Degree | 1,238 (84.8%) | 83 (5.7%) |
| Bachelor's Degree or higher | 1,496 (79.0%) | 0 (0.0%) |
| Total | 5,316 (76.9%) | 207 (3.0%) |
Employment Occupations by Sex in Nelson County
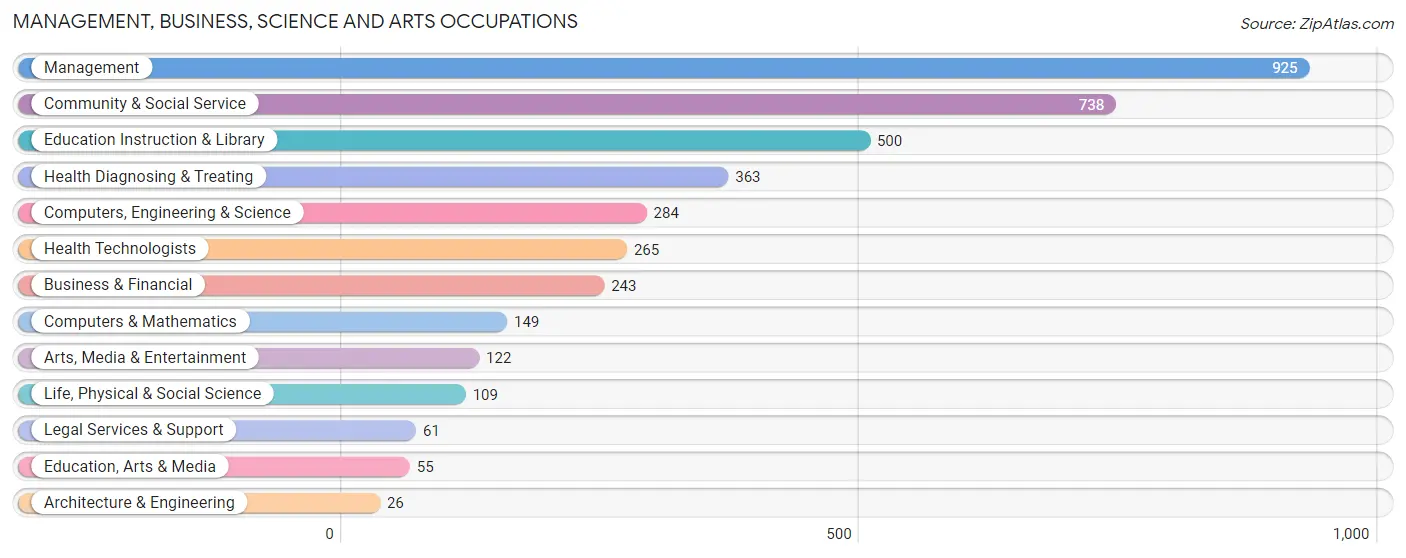
Management, Business, Science and Arts Occupations
The most common Management, Business, Science and Arts occupations in Nelson County are Management (925 | 13.5%), Community & Social Service (738 | 10.8%), Education Instruction & Library (500 | 7.3%), Health Diagnosing & Treating (363 | 5.3%), and Computers, Engineering & Science (284 | 4.2%).
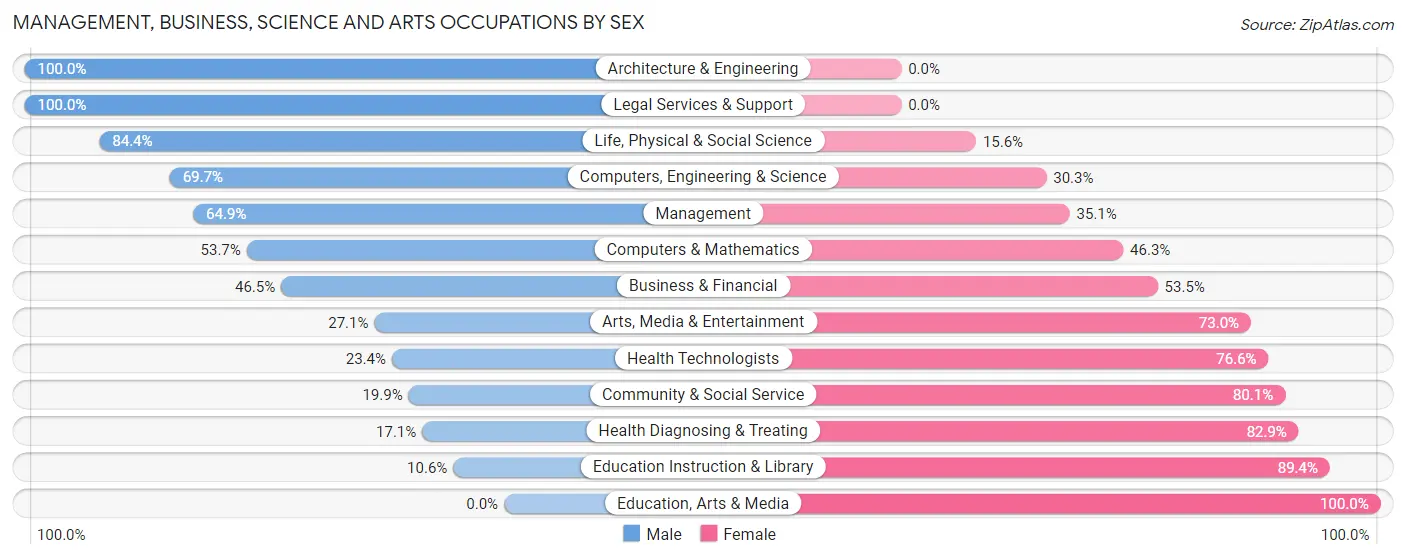
Management, Business, Science and Arts Occupations by Sex
Within the Management, Business, Science and Arts occupations in Nelson County, the most male-oriented occupations are Architecture & Engineering (100.0%), Legal Services & Support (100.0%), and Life, Physical & Social Science (84.4%), while the most female-oriented occupations are Education, Arts & Media (100.0%), Education Instruction & Library (89.4%), and Health Diagnosing & Treating (82.9%).
| Occupation | Male | Female |
| Management | 600 (64.9%) | 325 (35.1%) |
| Business & Financial | 113 (46.5%) | 130 (53.5%) |
| Computers, Engineering & Science | 198 (69.7%) | 86 (30.3%) |
| Computers & Mathematics | 80 (53.7%) | 69 (46.3%) |
| Architecture & Engineering | 26 (100.0%) | 0 (0.0%) |
| Life, Physical & Social Science | 92 (84.4%) | 17 (15.6%) |
| Community & Social Service | 147 (19.9%) | 591 (80.1%) |
| Education, Arts & Media | 0 (0.0%) | 55 (100.0%) |
| Legal Services & Support | 61 (100.0%) | 0 (0.0%) |
| Education Instruction & Library | 53 (10.6%) | 447 (89.4%) |
| Arts, Media & Entertainment | 33 (27.1%) | 89 (73.0%) |
| Health Diagnosing & Treating | 62 (17.1%) | 301 (82.9%) |
| Health Technologists | 62 (23.4%) | 203 (76.6%) |
| Total (Category) | 1,120 (43.9%) | 1,433 (56.1%) |
| Total (Overall) | 3,638 (53.2%) | 3,205 (46.8%) |
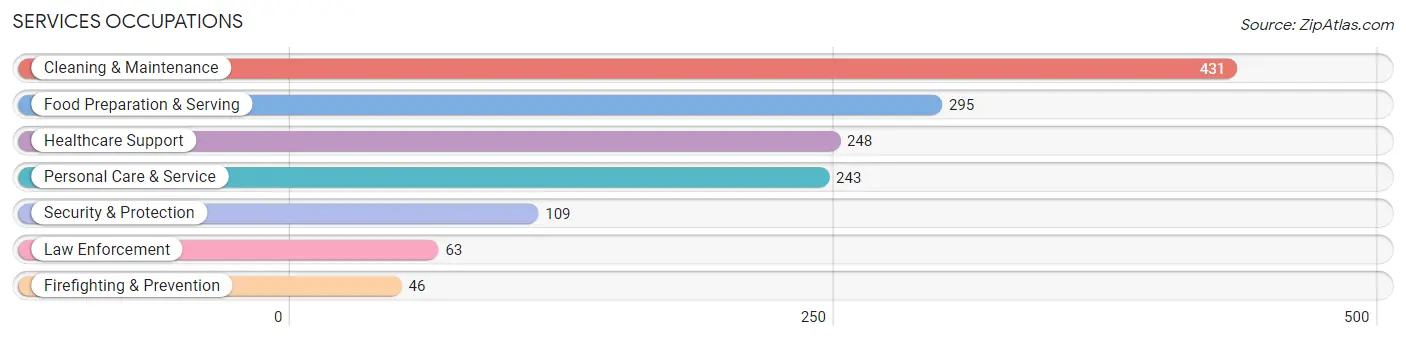
Services Occupations
The most common Services occupations in Nelson County are Cleaning & Maintenance (431 | 6.3%), Food Preparation & Serving (295 | 4.3%), Healthcare Support (248 | 3.6%), Personal Care & Service (243 | 3.5%), and Security & Protection (109 | 1.6%).
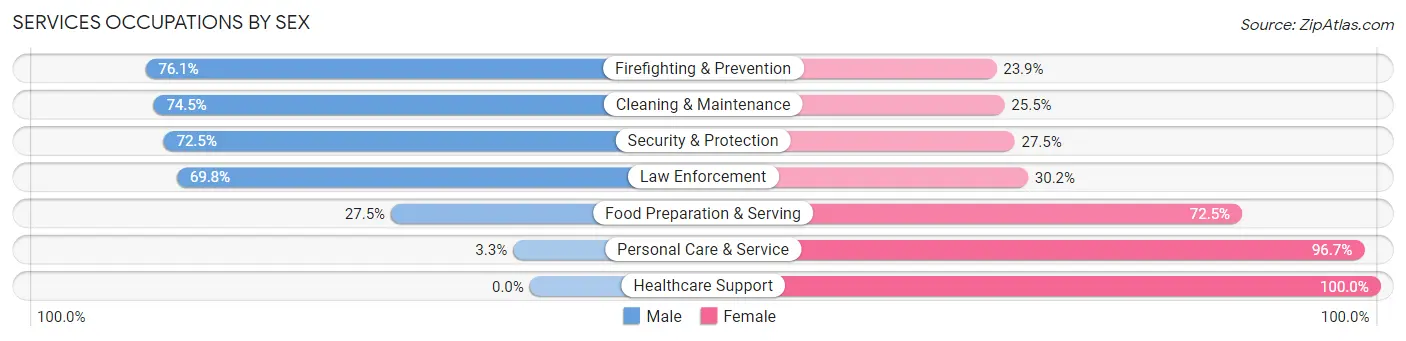
Services Occupations by Sex
Within the Services occupations in Nelson County, the most male-oriented occupations are Firefighting & Prevention (76.1%), Cleaning & Maintenance (74.5%), and Security & Protection (72.5%), while the most female-oriented occupations are Healthcare Support (100.0%), Personal Care & Service (96.7%), and Food Preparation & Serving (72.5%).
| Occupation | Male | Female |
| Healthcare Support | 0 (0.0%) | 248 (100.0%) |
| Security & Protection | 79 (72.5%) | 30 (27.5%) |
| Firefighting & Prevention | 35 (76.1%) | 11 (23.9%) |
| Law Enforcement | 44 (69.8%) | 19 (30.2%) |
| Food Preparation & Serving | 81 (27.5%) | 214 (72.5%) |
| Cleaning & Maintenance | 321 (74.5%) | 110 (25.5%) |
| Personal Care & Service | 8 (3.3%) | 235 (96.7%) |
| Total (Category) | 489 (36.9%) | 837 (63.1%) |
| Total (Overall) | 3,638 (53.2%) | 3,205 (46.8%) |
Sales and Office Occupations
The most common Sales and Office occupations in Nelson County are Office & Administration (741 | 10.8%), and Sales & Related (430 | 6.3%).

Sales and Office Occupations by Sex
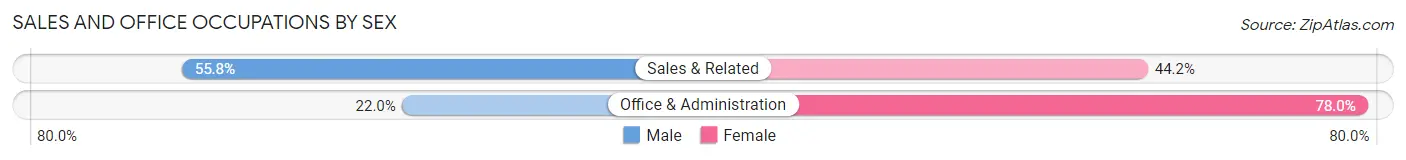
| Occupation | Male | Female |
| Sales & Related | 240 (55.8%) | 190 (44.2%) |
| Office & Administration | 163 (22.0%) | 578 (78.0%) |
| Total (Category) | 403 (34.4%) | 768 (65.6%) |
| Total (Overall) | 3,638 (53.2%) | 3,205 (46.8%) |
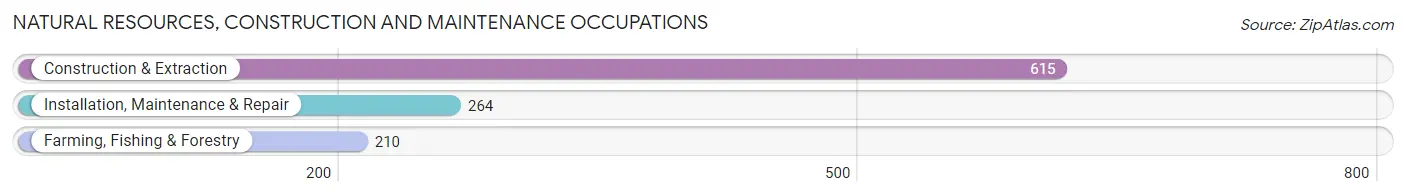
Natural Resources, Construction and Maintenance Occupations
The most common Natural Resources, Construction and Maintenance occupations in Nelson County are Construction & Extraction (615 | 9.0%), Installation, Maintenance & Repair (264 | 3.9%), and Farming, Fishing & Forestry (210 | 3.1%).
Natural Resources, Construction and Maintenance Occupations by Sex
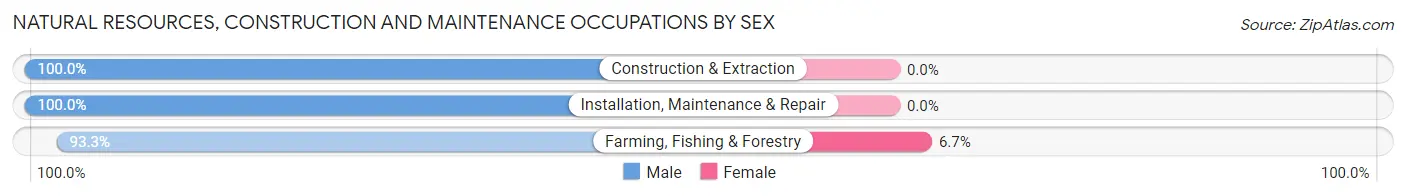
| Occupation | Male | Female |
| Farming, Fishing & Forestry | 196 (93.3%) | 14 (6.7%) |
| Construction & Extraction | 615 (100.0%) | 0 (0.0%) |
| Installation, Maintenance & Repair | 264 (100.0%) | 0 (0.0%) |
| Total (Category) | 1,075 (98.7%) | 14 (1.3%) |
| Total (Overall) | 3,638 (53.2%) | 3,205 (46.8%) |
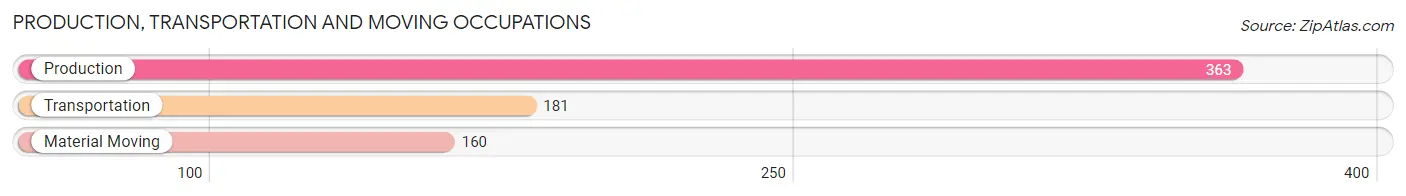
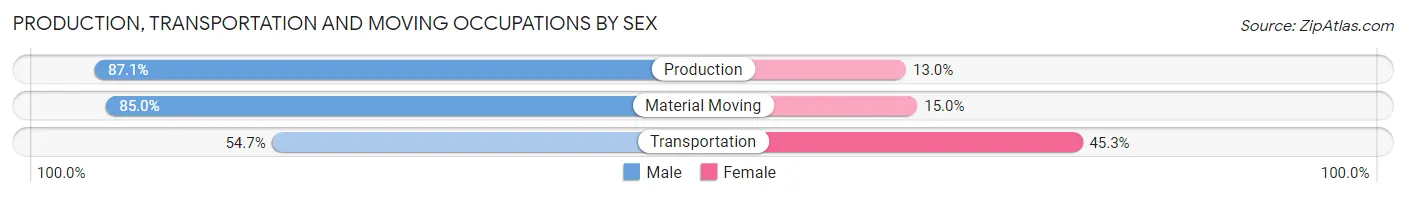
Production, Transportation and Moving Occupations
The most common Production, Transportation and Moving occupations in Nelson County are Production (363 | 5.3%), Transportation (181 | 2.6%), and Material Moving (160 | 2.3%).
Production, Transportation and Moving Occupations by Sex
| Occupation | Male | Female |
| Production | 316 (87.1%) | 47 (13.0%) |
| Transportation | 99 (54.7%) | 82 (45.3%) |
| Material Moving | 136 (85.0%) | 24 (15.0%) |
| Total (Category) | 551 (78.3%) | 153 (21.7%) |
| Total (Overall) | 3,638 (53.2%) | 3,205 (46.8%) |
Employment Industries by Sex in Nelson County
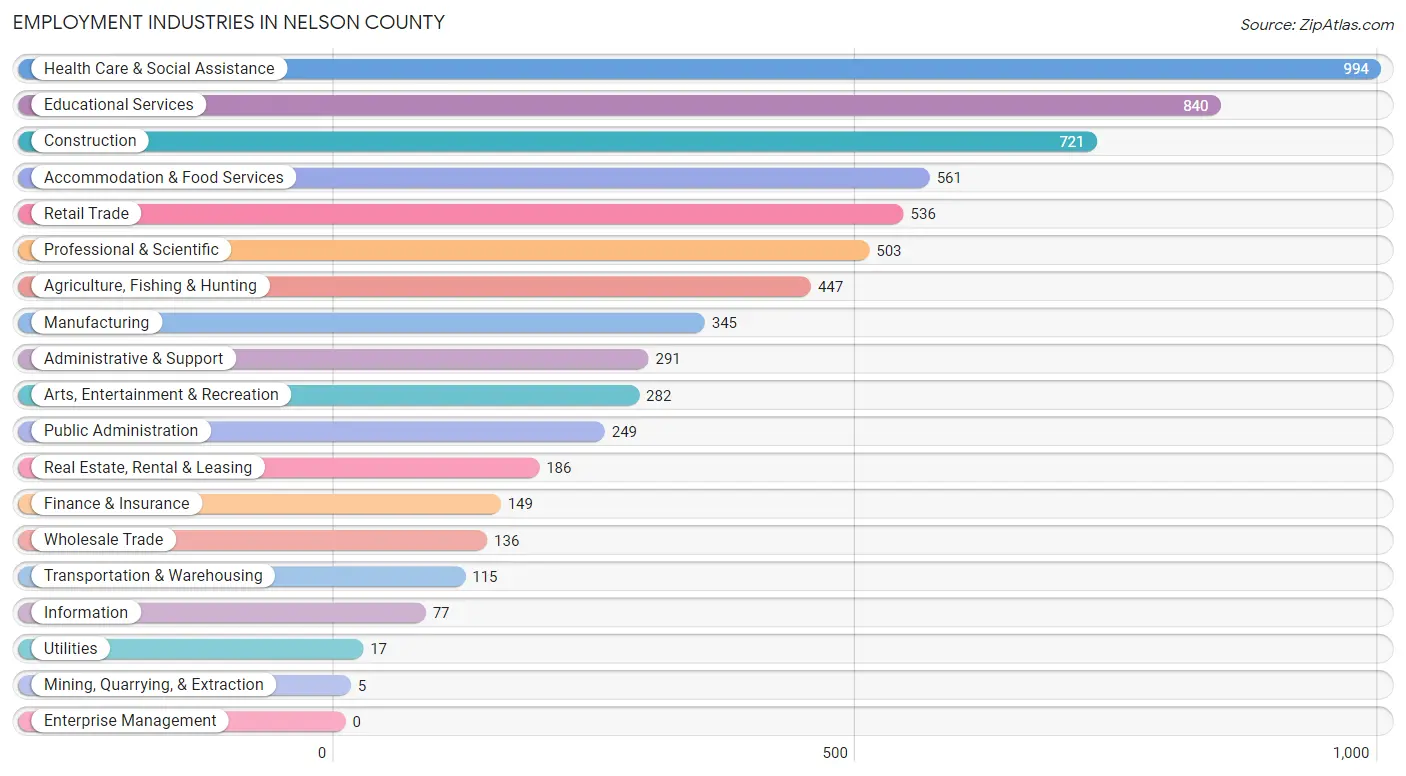
Employment Industries in Nelson County
The major employment industries in Nelson County include Health Care & Social Assistance (994 | 14.5%), Educational Services (840 | 12.3%), Construction (721 | 10.5%), Accommodation & Food Services (561 | 8.2%), and Retail Trade (536 | 7.8%).
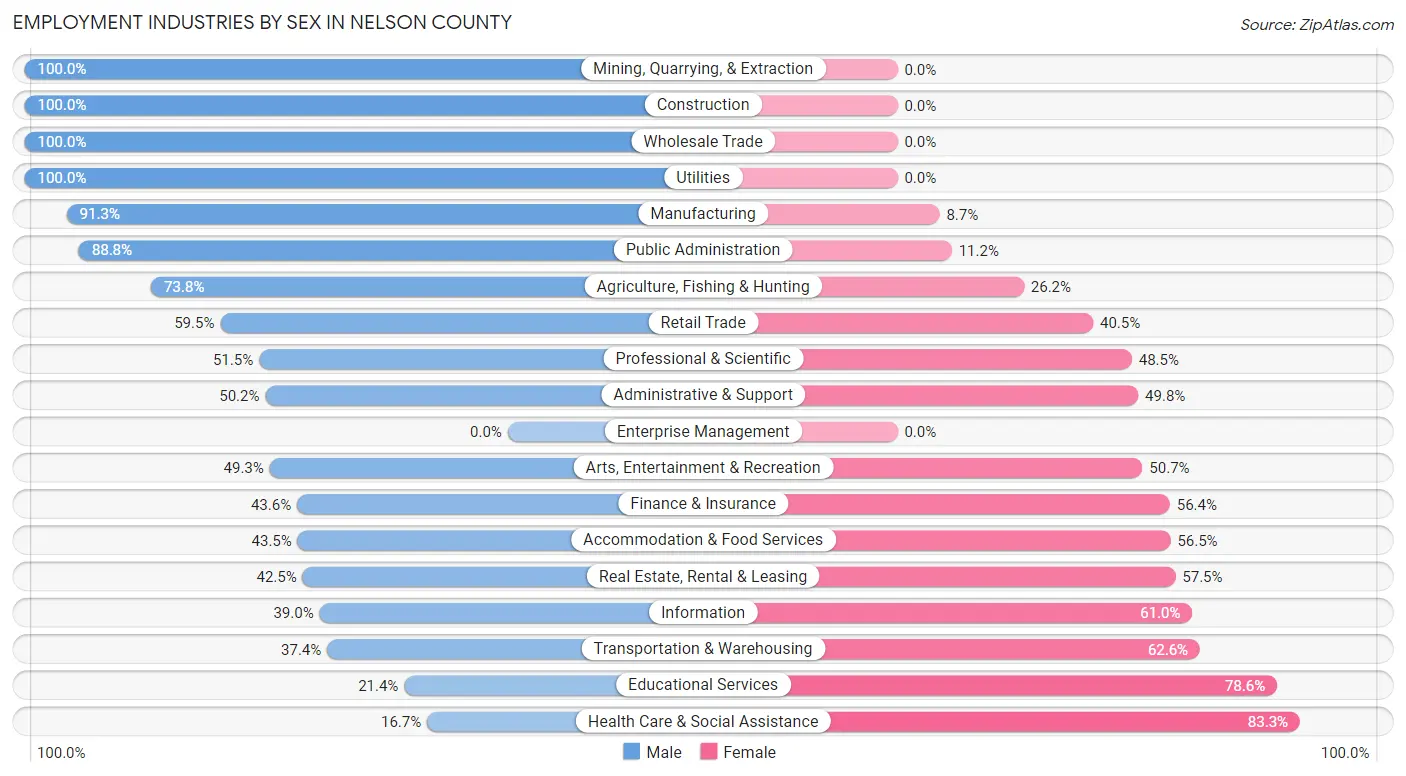
Employment Industries by Sex in Nelson County
The Nelson County industries that see more men than women are Mining, Quarrying, & Extraction (100.0%), Construction (100.0%), and Wholesale Trade (100.0%), whereas the industries that tend to have a higher number of women are Health Care & Social Assistance (83.3%), Educational Services (78.6%), and Transportation & Warehousing (62.6%).
| Industry | Male | Female |
| Agriculture, Fishing & Hunting | 330 (73.8%) | 117 (26.2%) |
| Mining, Quarrying, & Extraction | 5 (100.0%) | 0 (0.0%) |
| Construction | 721 (100.0%) | 0 (0.0%) |
| Manufacturing | 315 (91.3%) | 30 (8.7%) |
| Wholesale Trade | 136 (100.0%) | 0 (0.0%) |
| Retail Trade | 319 (59.5%) | 217 (40.5%) |
| Transportation & Warehousing | 43 (37.4%) | 72 (62.6%) |
| Utilities | 17 (100.0%) | 0 (0.0%) |
| Information | 30 (39.0%) | 47 (61.0%) |
| Finance & Insurance | 65 (43.6%) | 84 (56.4%) |
| Real Estate, Rental & Leasing | 79 (42.5%) | 107 (57.5%) |
| Professional & Scientific | 259 (51.5%) | 244 (48.5%) |
| Enterprise Management | 0 (0.0%) | 0 (0.0%) |
| Administrative & Support | 146 (50.2%) | 145 (49.8%) |
| Educational Services | 180 (21.4%) | 660 (78.6%) |
| Health Care & Social Assistance | 166 (16.7%) | 828 (83.3%) |
| Arts, Entertainment & Recreation | 139 (49.3%) | 143 (50.7%) |
| Accommodation & Food Services | 244 (43.5%) | 317 (56.5%) |
| Public Administration | 221 (88.8%) | 28 (11.2%) |
| Total | 3,638 (53.2%) | 3,205 (46.8%) |
Education in Nelson County
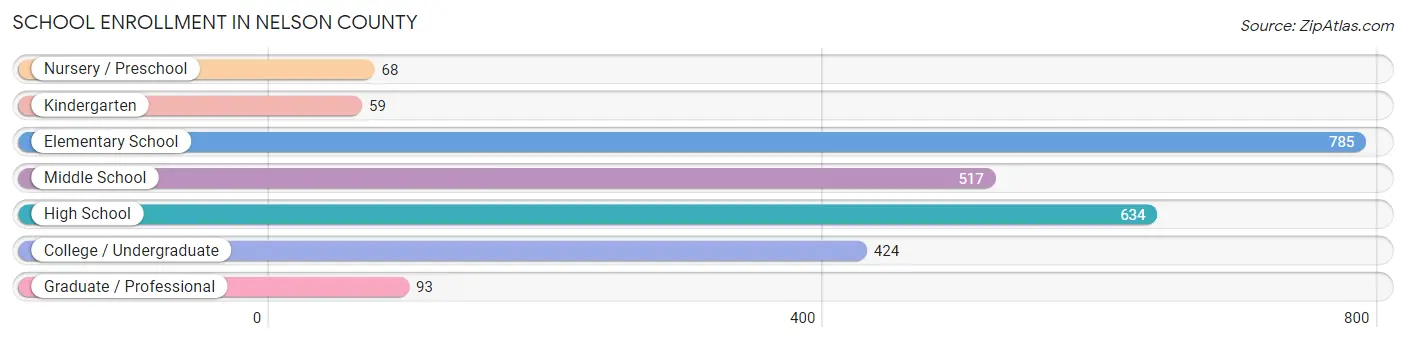
School Enrollment in Nelson County
The most common levels of schooling among the 2,580 students in Nelson County are elementary school (785 | 30.4%), high school (634 | 24.6%), and middle school (517 | 20.0%).
| School Level | # Students | % Students |
| Nursery / Preschool | 68 | 2.6% |
| Kindergarten | 59 | 2.3% |
| Elementary School | 785 | 30.4% |
| Middle School | 517 | 20.0% |
| High School | 634 | 24.6% |
| College / Undergraduate | 424 | 16.4% |
| Graduate / Professional | 93 | 3.6% |
| Total | 2,580 | 100.0% |
School Enrollment by Age by Funding Source in Nelson County
Out of a total of 2,580 students who are enrolled in schools in Nelson County, 379 (14.7%) attend a private institution, while the remaining 2,201 (85.3%) are enrolled in public schools. The age group of 25 to 34 year olds has the highest likelihood of being enrolled in private schools, with 25 (45.5% in the age bracket) enrolled. Conversely, the age group of 10 to 14 year olds has the lowest likelihood of being enrolled in a private school, with 650 (93.5% in the age bracket) attending a public institution.
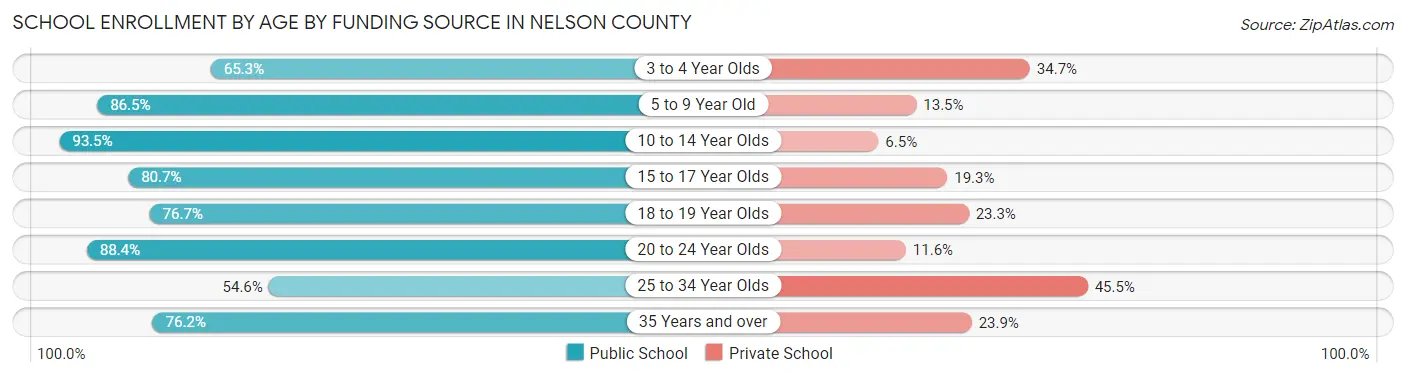
| Age Bracket | Public School | Private School |
| 3 to 4 Year Olds | 32 (65.3%) | 17 (34.7%) |
| 5 to 9 Year Old | 632 (86.5%) | 99 (13.5%) |
| 10 to 14 Year Olds | 650 (93.5%) | 45 (6.5%) |
| 15 to 17 Year Olds | 301 (80.7%) | 72 (19.3%) |
| 18 to 19 Year Olds | 168 (76.7%) | 51 (23.3%) |
| 20 to 24 Year Olds | 290 (88.4%) | 38 (11.6%) |
| 25 to 34 Year Olds | 30 (54.5%) | 25 (45.5%) |
| 35 Years and over | 99 (76.1%) | 31 (23.8%) |
| Total | 2,201 (85.3%) | 379 (14.7%) |
Educational Attainment by Field of Study in Nelson County
Business (616 | 16.9%), education (520 | 14.3%), engineering (323 | 8.9%), social sciences (321 | 8.8%), and science & technology (309 | 8.5%) are the most common fields of study among 3,637 individuals in Nelson County who have obtained a bachelor's degree or higher.
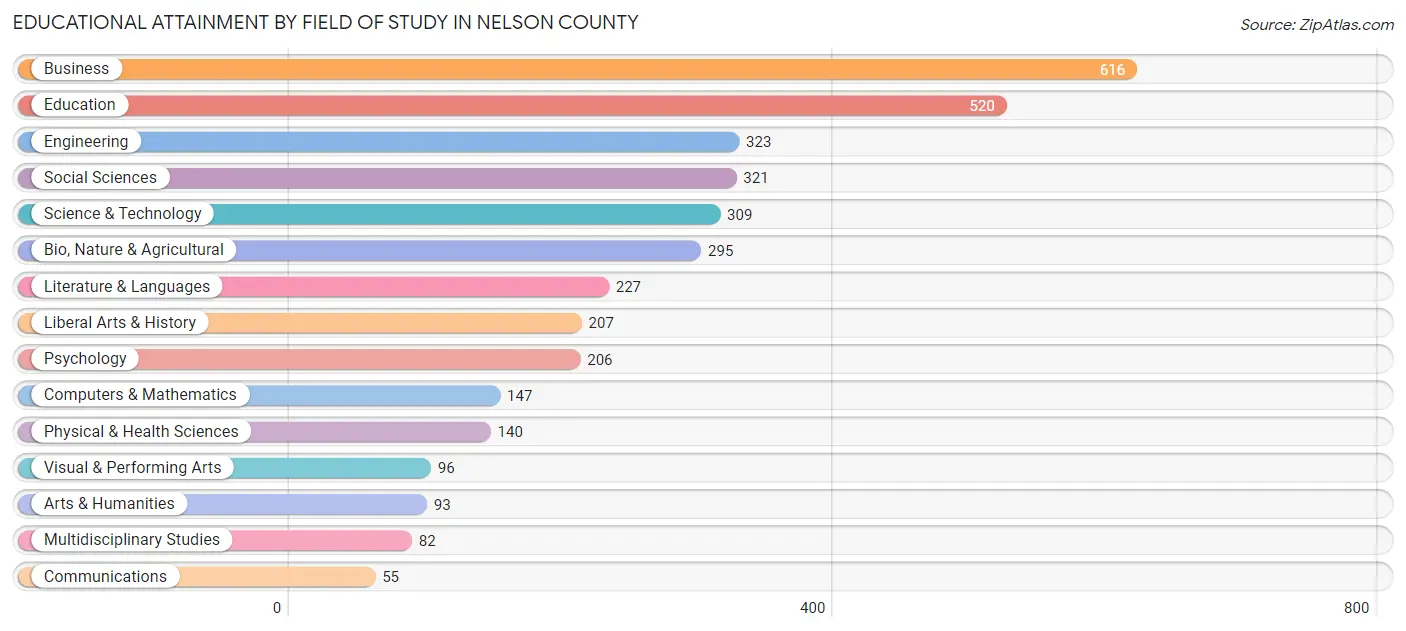
| Field of Study | # Graduates | % Graduates |
| Computers & Mathematics | 147 | 4.0% |
| Bio, Nature & Agricultural | 295 | 8.1% |
| Physical & Health Sciences | 140 | 3.8% |
| Psychology | 206 | 5.7% |
| Social Sciences | 321 | 8.8% |
| Engineering | 323 | 8.9% |
| Multidisciplinary Studies | 82 | 2.2% |
| Science & Technology | 309 | 8.5% |
| Business | 616 | 16.9% |
| Education | 520 | 14.3% |
| Literature & Languages | 227 | 6.2% |
| Liberal Arts & History | 207 | 5.7% |
| Visual & Performing Arts | 96 | 2.6% |
| Communications | 55 | 1.5% |
| Arts & Humanities | 93 | 2.6% |
| Total | 3,637 | 100.0% |
Transportation & Commute in Nelson County
Vehicle Availability by Sex in Nelson County
The most prevalent vehicle ownership categories in Nelson County are males with 2 vehicles (1,211, accounting for 34.4%) and females with 2 vehicles (899, making up 41.1%).
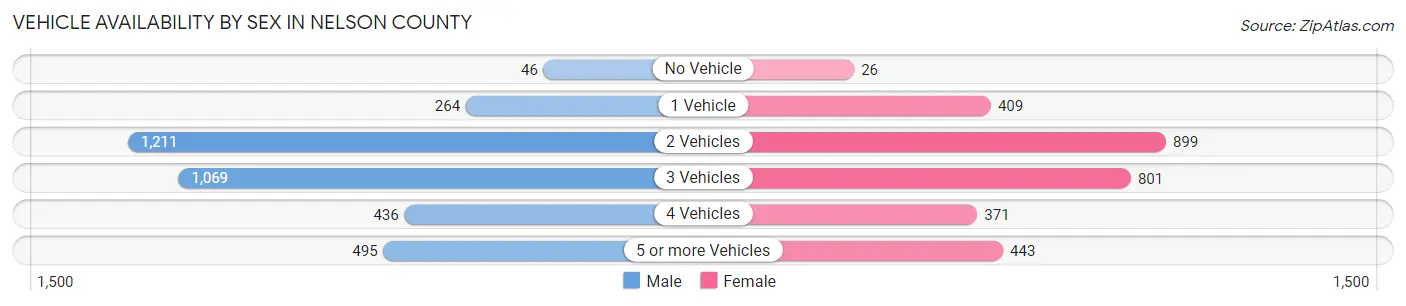
| Vehicles Available | Male | Female |
| No Vehicle | 46 (1.3%) | 26 (0.9%) |
| 1 Vehicle | 264 (7.5%) | 409 (13.9%) |
| 2 Vehicles | 1,211 (34.4%) | 899 (30.5%) |
| 3 Vehicles | 1,069 (30.4%) | 801 (27.2%) |
| 4 Vehicles | 436 (12.4%) | 371 (12.6%) |
| 5 or more Vehicles | 495 (14.1%) | 443 (15.0%) |
| Total | 3,521 (100.0%) | 2,949 (100.0%) |
Commute Time in Nelson County
The most frequently occuring commute durations in Nelson County are 45 to 59 minutes (990 commuters, 19.7%), 10 to 14 minutes (562 commuters, 11.2%), and 30 to 34 minutes (554 commuters, 11.1%).
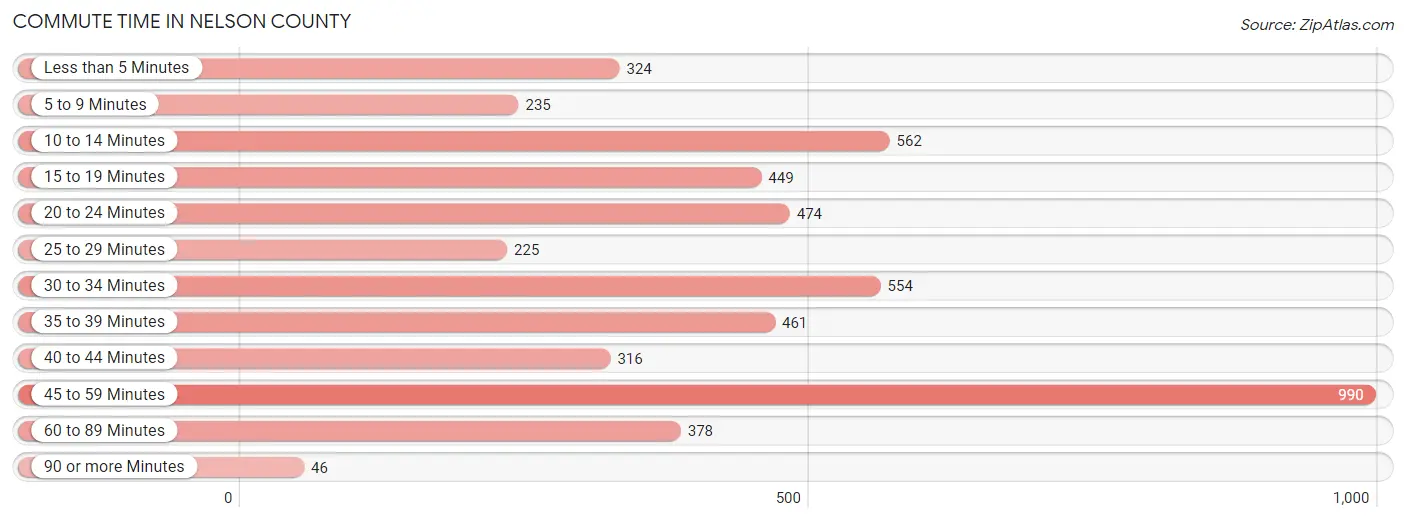
| Commute Time | # Commuters | % Commuters |
| Less than 5 Minutes | 324 | 6.5% |
| 5 to 9 Minutes | 235 | 4.7% |
| 10 to 14 Minutes | 562 | 11.2% |
| 15 to 19 Minutes | 449 | 8.9% |
| 20 to 24 Minutes | 474 | 9.5% |
| 25 to 29 Minutes | 225 | 4.5% |
| 30 to 34 Minutes | 554 | 11.1% |
| 35 to 39 Minutes | 461 | 9.2% |
| 40 to 44 Minutes | 316 | 6.3% |
| 45 to 59 Minutes | 990 | 19.7% |
| 60 to 89 Minutes | 378 | 7.5% |
| 90 or more Minutes | 46 | 0.9% |
Commute Time by Sex in Nelson County
The most common commute times in Nelson County are 45 to 59 minutes (576 commuters, 21.2%) for males and 45 to 59 minutes (414 commuters, 18.0%) for females.
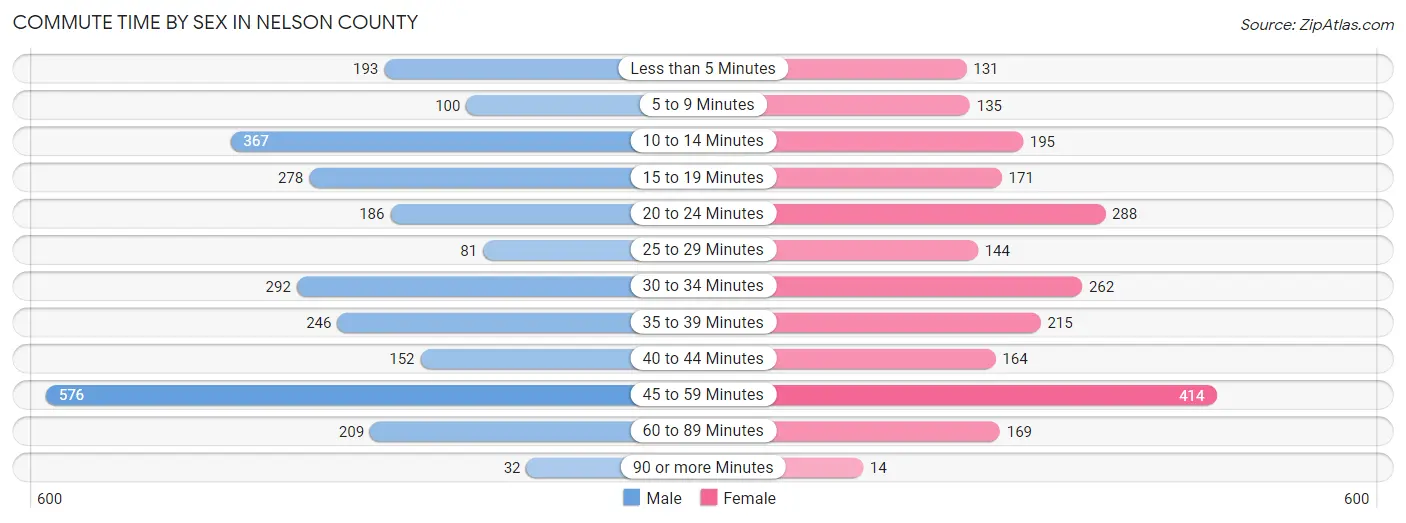
| Commute Time | Male | Female |
| Less than 5 Minutes | 193 (7.1%) | 131 (5.7%) |
| 5 to 9 Minutes | 100 (3.7%) | 135 (5.9%) |
| 10 to 14 Minutes | 367 (13.5%) | 195 (8.5%) |
| 15 to 19 Minutes | 278 (10.2%) | 171 (7.4%) |
| 20 to 24 Minutes | 186 (6.9%) | 288 (12.5%) |
| 25 to 29 Minutes | 81 (3.0%) | 144 (6.3%) |
| 30 to 34 Minutes | 292 (10.8%) | 262 (11.4%) |
| 35 to 39 Minutes | 246 (9.1%) | 215 (9.3%) |
| 40 to 44 Minutes | 152 (5.6%) | 164 (7.1%) |
| 45 to 59 Minutes | 576 (21.2%) | 414 (18.0%) |
| 60 to 89 Minutes | 209 (7.7%) | 169 (7.3%) |
| 90 or more Minutes | 32 (1.2%) | 14 (0.6%) |
Time of Departure to Work by Sex in Nelson County
The most frequent times of departure to work in Nelson County are 7:00 AM to 7:29 AM (469, 17.3%) for males and 7:00 AM to 7:29 AM (677, 29.4%) for females.
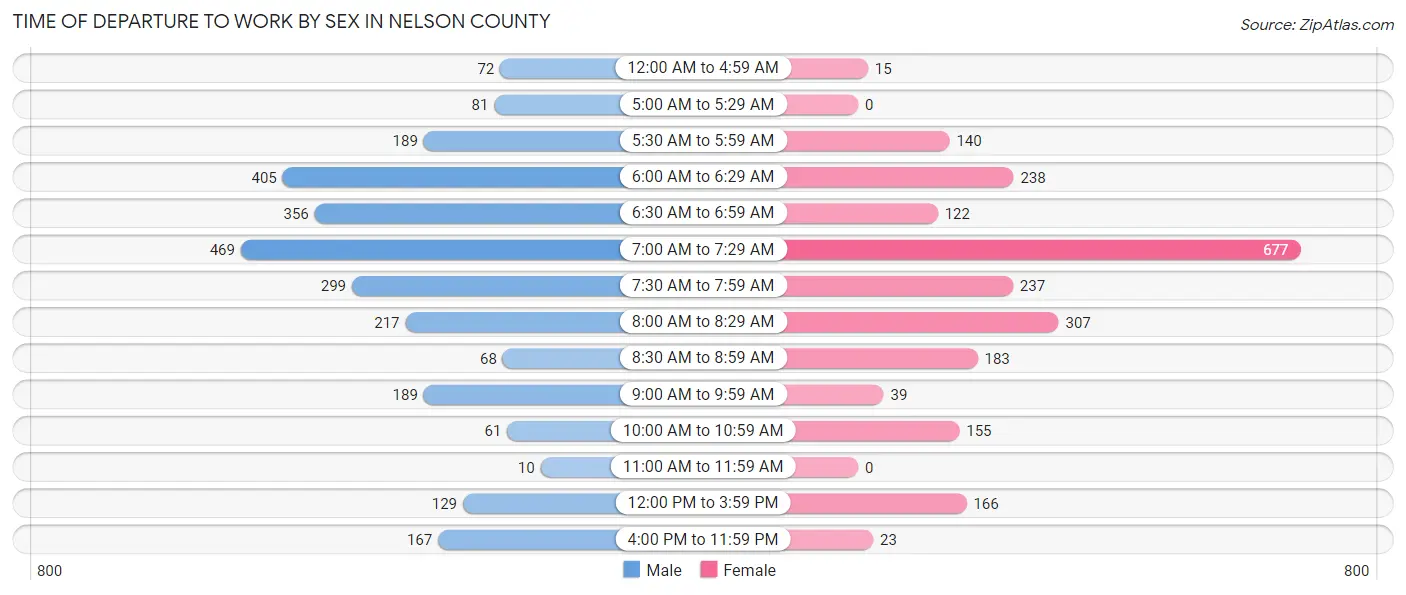
| Time of Departure | Male | Female |
| 12:00 AM to 4:59 AM | 72 (2.6%) | 15 (0.6%) |
| 5:00 AM to 5:29 AM | 81 (3.0%) | 0 (0.0%) |
| 5:30 AM to 5:59 AM | 189 (7.0%) | 140 (6.1%) |
| 6:00 AM to 6:29 AM | 405 (14.9%) | 238 (10.3%) |
| 6:30 AM to 6:59 AM | 356 (13.1%) | 122 (5.3%) |
| 7:00 AM to 7:29 AM | 469 (17.3%) | 677 (29.4%) |
| 7:30 AM to 7:59 AM | 299 (11.0%) | 237 (10.3%) |
| 8:00 AM to 8:29 AM | 217 (8.0%) | 307 (13.3%) |
| 8:30 AM to 8:59 AM | 68 (2.5%) | 183 (8.0%) |
| 9:00 AM to 9:59 AM | 189 (7.0%) | 39 (1.7%) |
| 10:00 AM to 10:59 AM | 61 (2.2%) | 155 (6.7%) |
| 11:00 AM to 11:59 AM | 10 (0.4%) | 0 (0.0%) |
| 12:00 PM to 3:59 PM | 129 (4.8%) | 166 (7.2%) |
| 4:00 PM to 11:59 PM | 167 (6.2%) | 23 (1.0%) |
| Total | 2,712 (100.0%) | 2,302 (100.0%) |
Housing Occupancy in Nelson County
Occupancy by Ownership in Nelson County
Of the total 6,132 dwellings in Nelson County, owner-occupied units account for 4,847 (79.0%), while renter-occupied units make up 1,285 (21.0%).
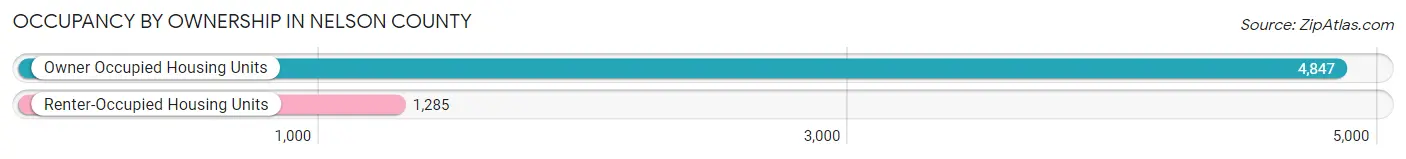
| Occupancy | # Housing Units | % Housing Units |
| Owner Occupied Housing Units | 4,847 | 79.0% |
| Renter-Occupied Housing Units | 1,285 | 21.0% |
| Total Occupied Housing Units | 6,132 | 100.0% |
Occupancy by Household Size in Nelson County
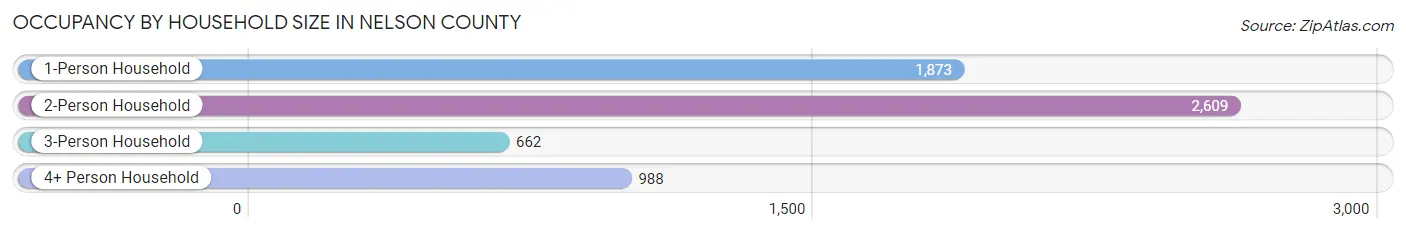
| Household Size | # Housing Units | % Housing Units |
| 1-Person Household | 1,873 | 30.5% |
| 2-Person Household | 2,609 | 42.5% |
| 3-Person Household | 662 | 10.8% |
| 4+ Person Household | 988 | 16.1% |
| Total Housing Units | 6,132 | 100.0% |
Occupancy by Ownership by Household Size in Nelson County
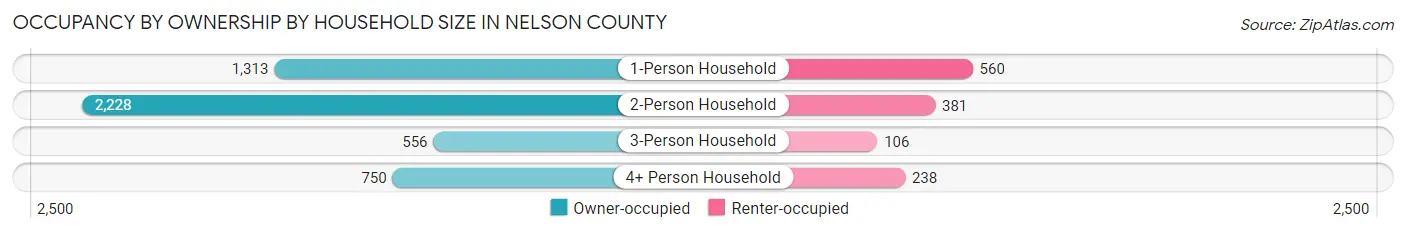
| Household Size | Owner-occupied | Renter-occupied |
| 1-Person Household | 1,313 (70.1%) | 560 (29.9%) |
| 2-Person Household | 2,228 (85.4%) | 381 (14.6%) |
| 3-Person Household | 556 (84.0%) | 106 (16.0%) |
| 4+ Person Household | 750 (75.9%) | 238 (24.1%) |
| Total Housing Units | 4,847 (79.0%) | 1,285 (21.0%) |
Occupancy by Educational Attainment in Nelson County
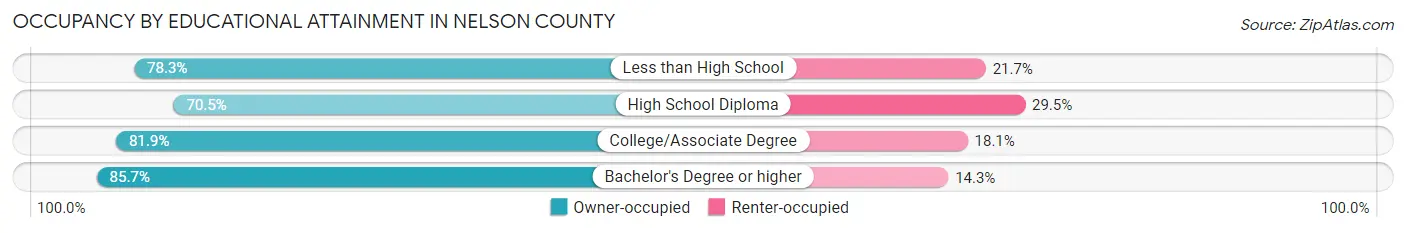
| Household Size | Owner-occupied | Renter-occupied |
| Less than High School | 645 (78.3%) | 179 (21.7%) |
| High School Diploma | 1,385 (70.5%) | 580 (29.5%) |
| College/Associate Degree | 1,034 (81.9%) | 229 (18.1%) |
| Bachelor's Degree or higher | 1,783 (85.7%) | 297 (14.3%) |
Occupancy by Age of Householder in Nelson County
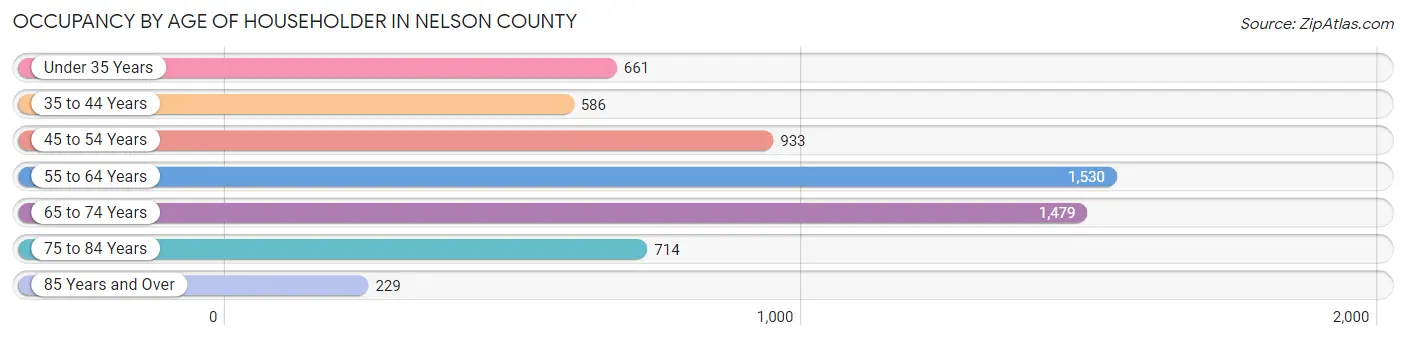
| Age Bracket | # Households | % Households |
| Under 35 Years | 661 | 10.8% |
| 35 to 44 Years | 586 | 9.6% |
| 45 to 54 Years | 933 | 15.2% |
| 55 to 64 Years | 1,530 | 24.9% |
| 65 to 74 Years | 1,479 | 24.1% |
| 75 to 84 Years | 714 | 11.6% |
| 85 Years and Over | 229 | 3.7% |
| Total | 6,132 | 100.0% |
Housing Finances in Nelson County
Median Income by Occupancy in Nelson County
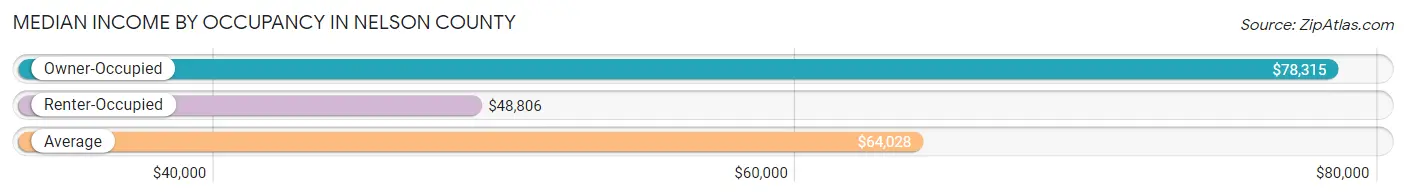
| Occupancy Type | # Households | Median Income |
| Owner-Occupied | 4,847 (79.0%) | $78,315 |
| Renter-Occupied | 1,285 (21.0%) | $48,806 |
| Average | 6,132 (100.0%) | $64,028 |
Occupancy by Householder Income Bracket in Nelson County
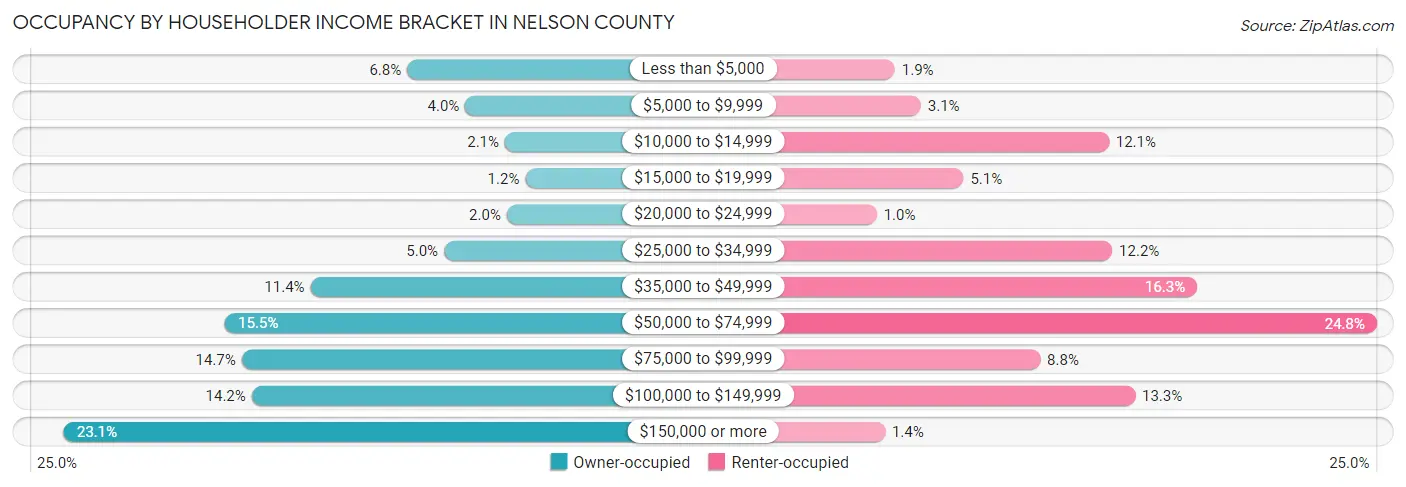
| Income Bracket | Owner-occupied | Renter-occupied |
| Less than $5,000 | 329 (6.8%) | 24 (1.9%) |
| $5,000 to $9,999 | 195 (4.0%) | 40 (3.1%) |
| $10,000 to $14,999 | 103 (2.1%) | 155 (12.1%) |
| $15,000 to $19,999 | 56 (1.2%) | 66 (5.1%) |
| $20,000 to $24,999 | 99 (2.0%) | 13 (1.0%) |
| $25,000 to $34,999 | 244 (5.0%) | 157 (12.2%) |
| $35,000 to $49,999 | 552 (11.4%) | 209 (16.3%) |
| $50,000 to $74,999 | 749 (15.4%) | 319 (24.8%) |
| $75,000 to $99,999 | 711 (14.7%) | 113 (8.8%) |
| $100,000 to $149,999 | 688 (14.2%) | 171 (13.3%) |
| $150,000 or more | 1,121 (23.1%) | 18 (1.4%) |
| Total | 4,847 (100.0%) | 1,285 (100.0%) |
Monthly Housing Cost Tiers in Nelson County
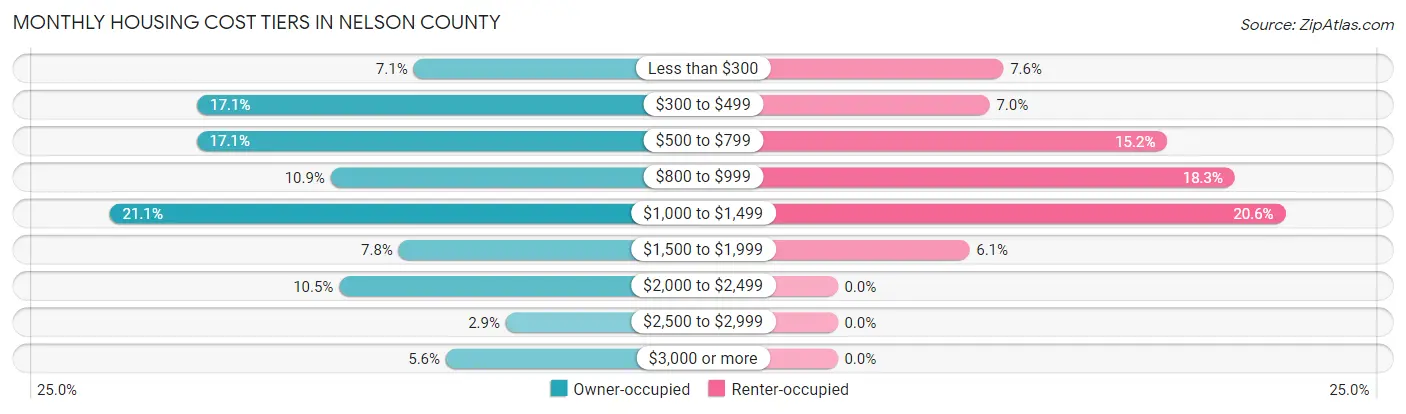
| Monthly Cost | Owner-occupied | Renter-occupied |
| Less than $300 | 344 (7.1%) | 98 (7.6%) |
| $300 to $499 | 827 (17.1%) | 90 (7.0%) |
| $500 to $799 | 828 (17.1%) | 195 (15.2%) |
| $800 to $999 | 529 (10.9%) | 235 (18.3%) |
| $1,000 to $1,499 | 1,022 (21.1%) | 265 (20.6%) |
| $1,500 to $1,999 | 377 (7.8%) | 78 (6.1%) |
| $2,000 to $2,499 | 510 (10.5%) | 0 (0.0%) |
| $2,500 to $2,999 | 138 (2.9%) | 0 (0.0%) |
| $3,000 or more | 272 (5.6%) | 0 (0.0%) |
| Total | 4,847 (100.0%) | 1,285 (100.0%) |
Physical Housing Characteristics in Nelson County
Housing Structures in Nelson County
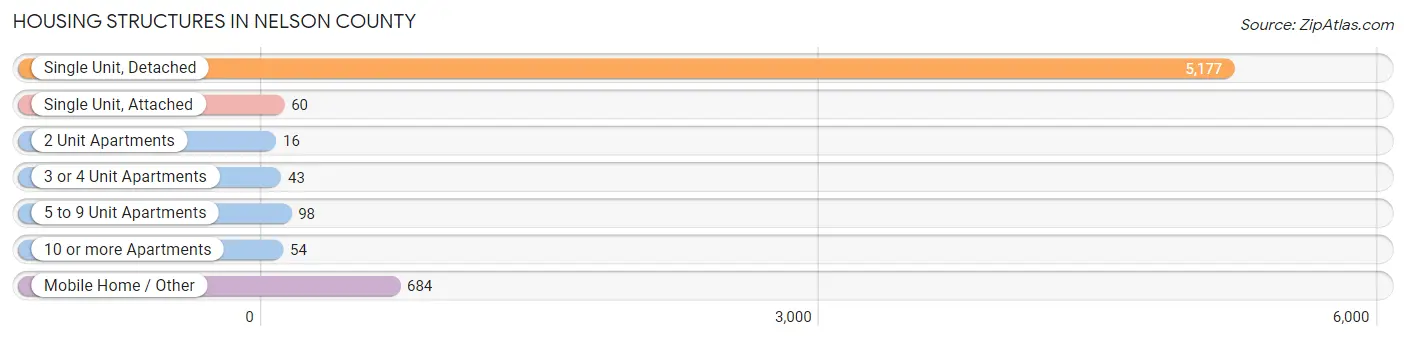
| Structure Type | # Housing Units | % Housing Units |
| Single Unit, Detached | 5,177 | 84.4% |
| Single Unit, Attached | 60 | 1.0% |
| 2 Unit Apartments | 16 | 0.3% |
| 3 or 4 Unit Apartments | 43 | 0.7% |
| 5 to 9 Unit Apartments | 98 | 1.6% |
| 10 or more Apartments | 54 | 0.9% |
| Mobile Home / Other | 684 | 11.2% |
| Total | 6,132 | 100.0% |
Housing Structures by Occupancy in Nelson County
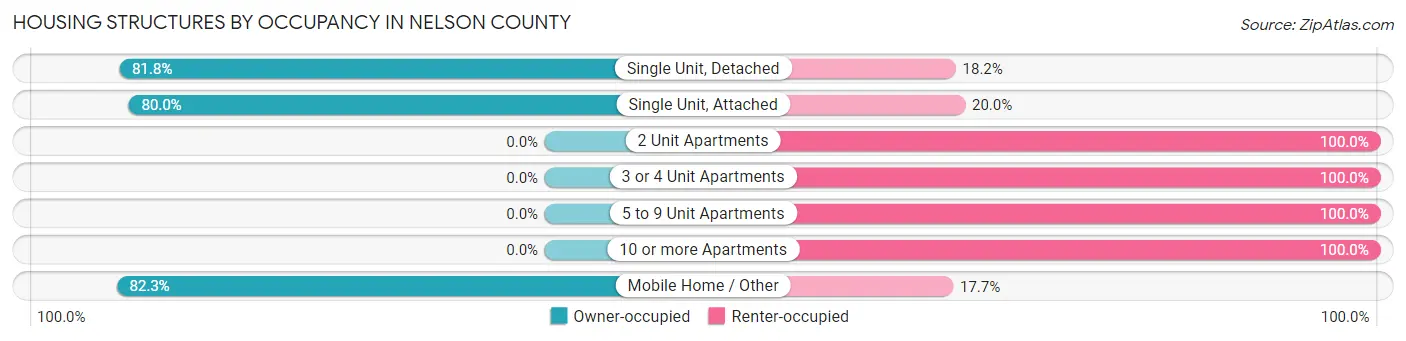
| Structure Type | Owner-occupied | Renter-occupied |
| Single Unit, Detached | 4,236 (81.8%) | 941 (18.2%) |
| Single Unit, Attached | 48 (80.0%) | 12 (20.0%) |
| 2 Unit Apartments | 0 (0.0%) | 16 (100.0%) |
| 3 or 4 Unit Apartments | 0 (0.0%) | 43 (100.0%) |
| 5 to 9 Unit Apartments | 0 (0.0%) | 98 (100.0%) |
| 10 or more Apartments | 0 (0.0%) | 54 (100.0%) |
| Mobile Home / Other | 563 (82.3%) | 121 (17.7%) |
| Total | 4,847 (79.0%) | 1,285 (21.0%) |
Housing Structures by Number of Rooms in Nelson County
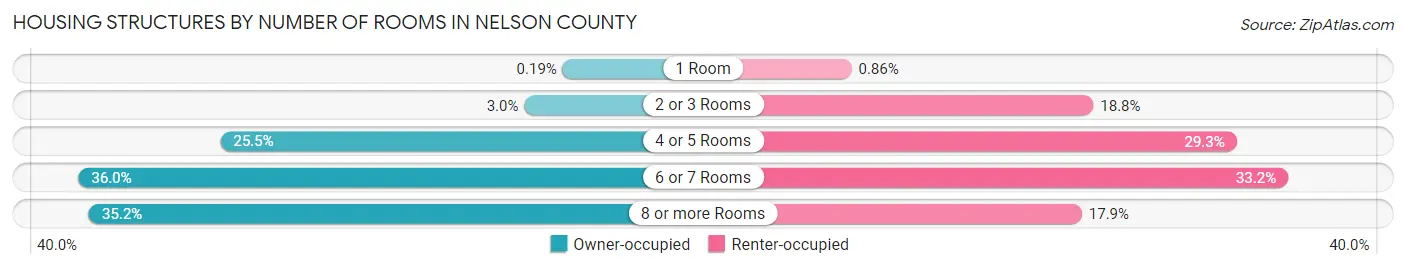
| Number of Rooms | Owner-occupied | Renter-occupied |
| 1 Room | 9 (0.2%) | 11 (0.9%) |
| 2 or 3 Rooms | 147 (3.0%) | 241 (18.8%) |
| 4 or 5 Rooms | 1,237 (25.5%) | 377 (29.3%) |
| 6 or 7 Rooms | 1,746 (36.0%) | 426 (33.2%) |
| 8 or more Rooms | 1,708 (35.2%) | 230 (17.9%) |
| Total | 4,847 (100.0%) | 1,285 (100.0%) |
Housing Structure by Heating Type in Nelson County
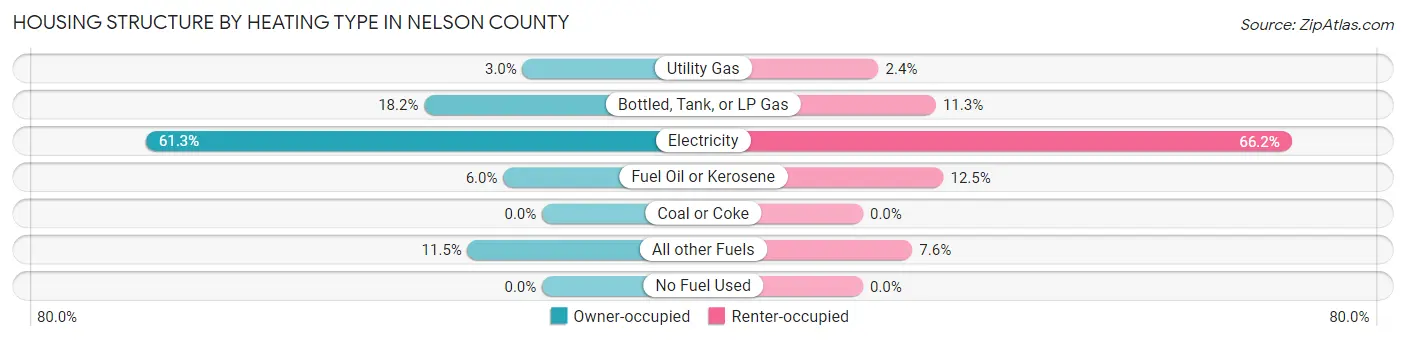
| Heating Type | Owner-occupied | Renter-occupied |
| Utility Gas | 146 (3.0%) | 31 (2.4%) |
| Bottled, Tank, or LP Gas | 883 (18.2%) | 145 (11.3%) |
| Electricity | 2,969 (61.3%) | 851 (66.2%) |
| Fuel Oil or Kerosene | 291 (6.0%) | 160 (12.4%) |
| Coal or Coke | 0 (0.0%) | 0 (0.0%) |
| All other Fuels | 558 (11.5%) | 98 (7.6%) |
| No Fuel Used | 0 (0.0%) | 0 (0.0%) |
| Total | 4,847 (100.0%) | 1,285 (100.0%) |
Household Vehicle Usage in Nelson County
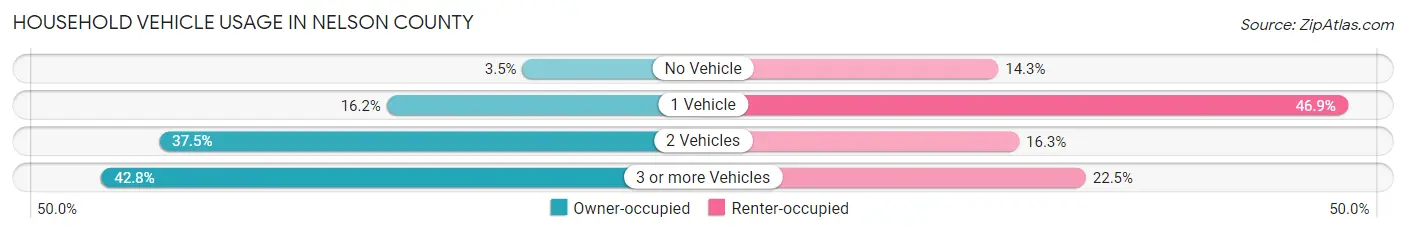
| Vehicles per Household | Owner-occupied | Renter-occupied |
| No Vehicle | 171 (3.5%) | 184 (14.3%) |
| 1 Vehicle | 785 (16.2%) | 603 (46.9%) |
| 2 Vehicles | 1,815 (37.4%) | 209 (16.3%) |
| 3 or more Vehicles | 2,076 (42.8%) | 289 (22.5%) |
| Total | 4,847 (100.0%) | 1,285 (100.0%) |
Real Estate & Mortgages in Nelson County
Real Estate and Mortgage Overview in Nelson County
| Characteristic | Without Mortgage | With Mortgage |
| Housing Units | 1,960 | 2,887 |
| Median Property Value | $299,300 | $263,300 |
| Median Household Income | $62,991 | $834 |
| Monthly Housing Costs | $482 | $272 |
| Real Estate Taxes | $1,493 | $53 |
Property Value by Mortgage Status in Nelson County
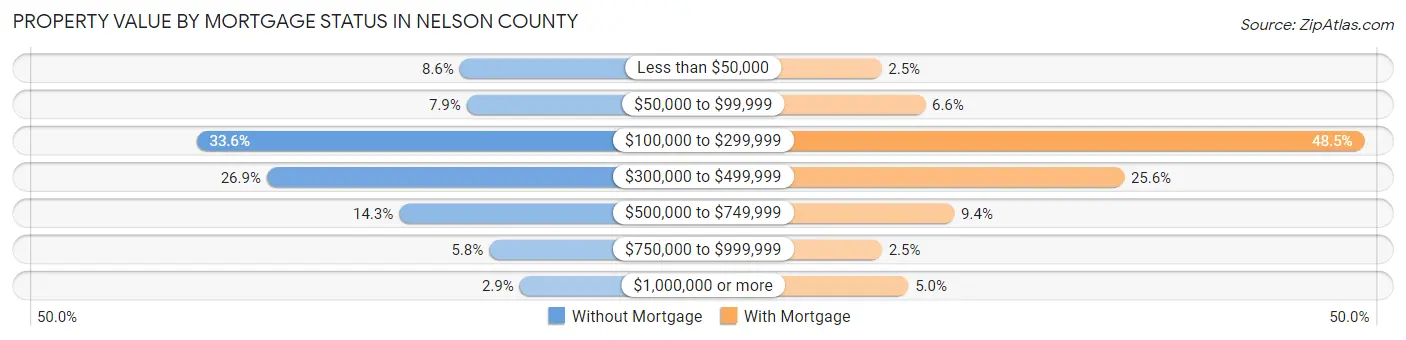
| Property Value | Without Mortgage | With Mortgage |
| Less than $50,000 | 168 (8.6%) | 71 (2.5%) |
| $50,000 to $99,999 | 155 (7.9%) | 191 (6.6%) |
| $100,000 to $299,999 | 659 (33.6%) | 1,399 (48.5%) |
| $300,000 to $499,999 | 528 (26.9%) | 738 (25.6%) |
| $500,000 to $749,999 | 281 (14.3%) | 271 (9.4%) |
| $750,000 to $999,999 | 113 (5.8%) | 72 (2.5%) |
| $1,000,000 or more | 56 (2.9%) | 145 (5.0%) |
| Total | 1,960 (100.0%) | 2,887 (100.0%) |
Household Income by Mortgage Status in Nelson County
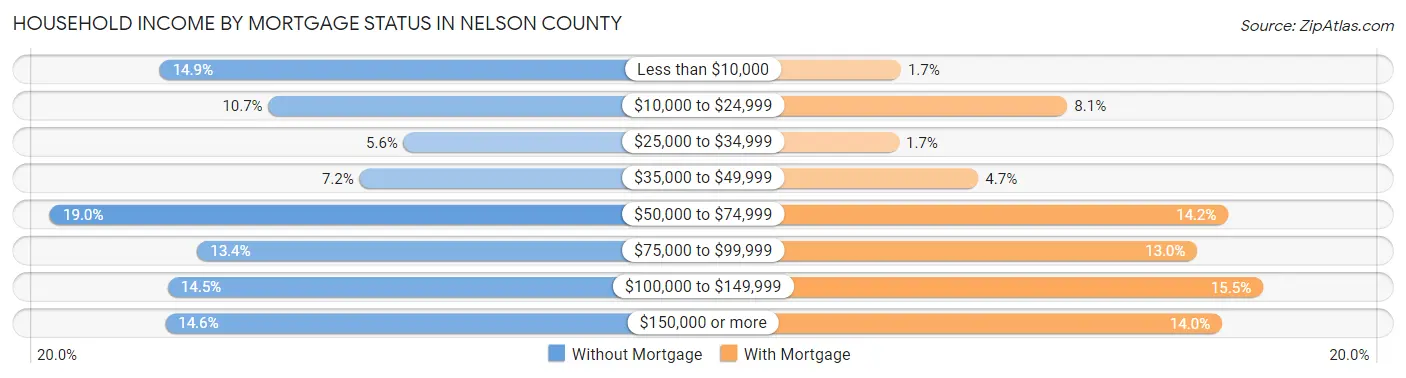
| Household Income | Without Mortgage | With Mortgage |
| Less than $10,000 | 291 (14.8%) | 50 (1.7%) |
| $10,000 to $24,999 | 210 (10.7%) | 233 (8.1%) |
| $25,000 to $34,999 | 109 (5.6%) | 48 (1.7%) |
| $35,000 to $49,999 | 142 (7.2%) | 135 (4.7%) |
| $50,000 to $74,999 | 373 (19.0%) | 410 (14.2%) |
| $75,000 to $99,999 | 263 (13.4%) | 376 (13.0%) |
| $100,000 to $149,999 | 285 (14.5%) | 448 (15.5%) |
| $150,000 or more | 287 (14.6%) | 403 (14.0%) |
| Total | 1,960 (100.0%) | 2,887 (100.0%) |
Property Value to Household Income Ratio in Nelson County
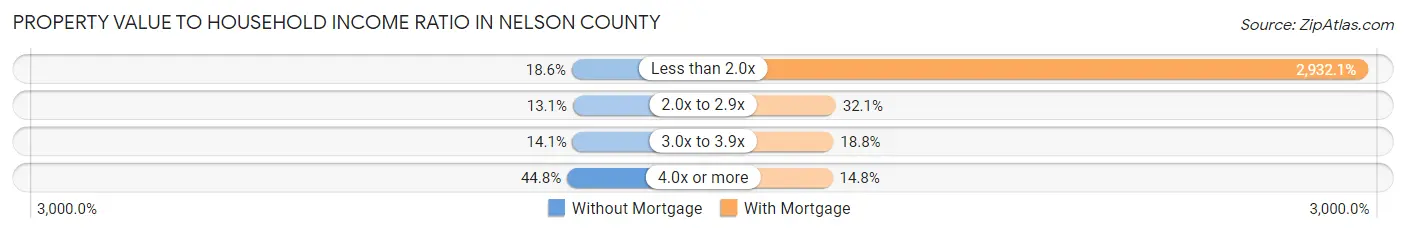
| Value-to-Income Ratio | Without Mortgage | With Mortgage |
| Less than 2.0x | 364 (18.6%) | 84,650 (2,932.1%) |
| 2.0x to 2.9x | 257 (13.1%) | 926 (32.1%) |
| 3.0x to 3.9x | 277 (14.1%) | 544 (18.8%) |
| 4.0x or more | 878 (44.8%) | 426 (14.8%) |
| Total | 1,960 (100.0%) | 2,887 (100.0%) |
Real Estate Taxes by Mortgage Status in Nelson County
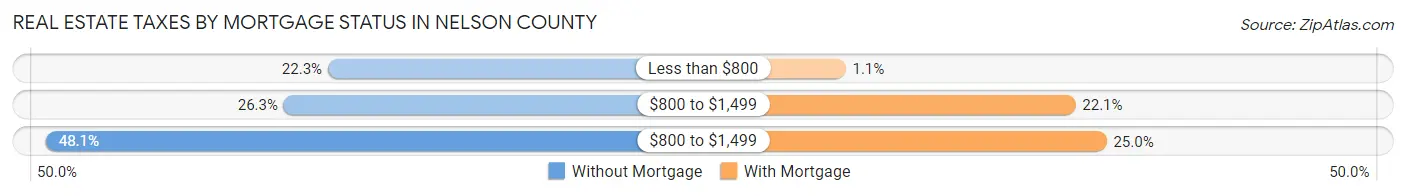
| Property Taxes | Without Mortgage | With Mortgage |
| Less than $800 | 437 (22.3%) | 33 (1.1%) |
| $800 to $1,499 | 516 (26.3%) | 639 (22.1%) |
| $800 to $1,499 | 942 (48.1%) | 721 (25.0%) |
| Total | 1,960 (100.0%) | 2,887 (100.0%) |
Health & Disability in Nelson County
Health Insurance Coverage by Age in Nelson County
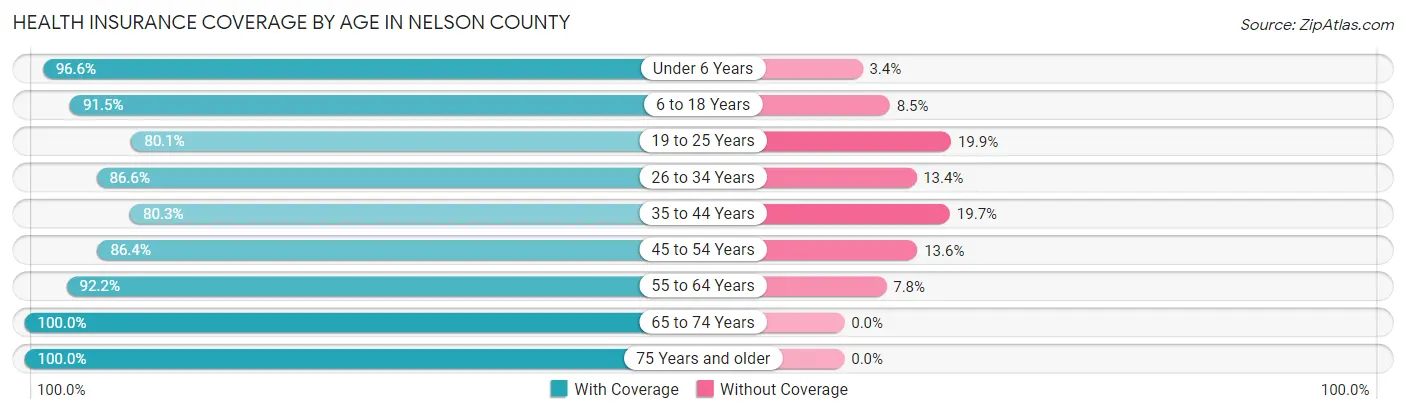
| Age Bracket | With Coverage | Without Coverage |
| Under 6 Years | 715 (96.6%) | 25 (3.4%) |
| 6 to 18 Years | 1,824 (91.5%) | 169 (8.5%) |
| 19 to 25 Years | 785 (80.1%) | 195 (19.9%) |
| 26 to 34 Years | 1,098 (86.6%) | 170 (13.4%) |
| 35 to 44 Years | 1,179 (80.3%) | 289 (19.7%) |
| 45 to 54 Years | 1,480 (86.4%) | 233 (13.6%) |
| 55 to 64 Years | 2,212 (92.2%) | 188 (7.8%) |
| 65 to 74 Years | 2,649 (100.0%) | 0 (0.0%) |
| 75 Years and older | 1,521 (100.0%) | 0 (0.0%) |
| Total | 13,463 (91.4%) | 1,269 (8.6%) |
Health Insurance Coverage by Citizenship Status in Nelson County
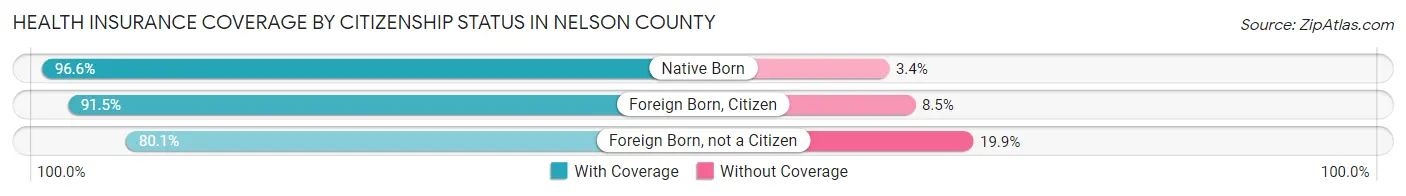
| Citizenship Status | With Coverage | Without Coverage |
| Native Born | 715 (96.6%) | 25 (3.4%) |
| Foreign Born, Citizen | 1,824 (91.5%) | 169 (8.5%) |
| Foreign Born, not a Citizen | 785 (80.1%) | 195 (19.9%) |
Health Insurance Coverage by Household Income in Nelson County
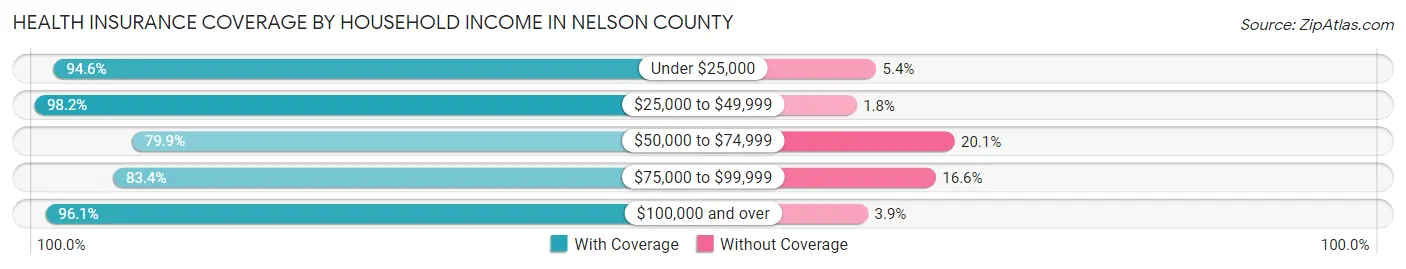
| Household Income | With Coverage | Without Coverage |
| Under $25,000 | 1,471 (94.6%) | 84 (5.4%) |
| $25,000 to $49,999 | 2,344 (98.2%) | 42 (1.8%) |
| $50,000 to $74,999 | 1,937 (79.9%) | 487 (20.1%) |
| $75,000 to $99,999 | 2,117 (83.4%) | 421 (16.6%) |
| $100,000 and over | 5,530 (96.1%) | 224 (3.9%) |
Public vs Private Health Insurance Coverage by Age in Nelson County
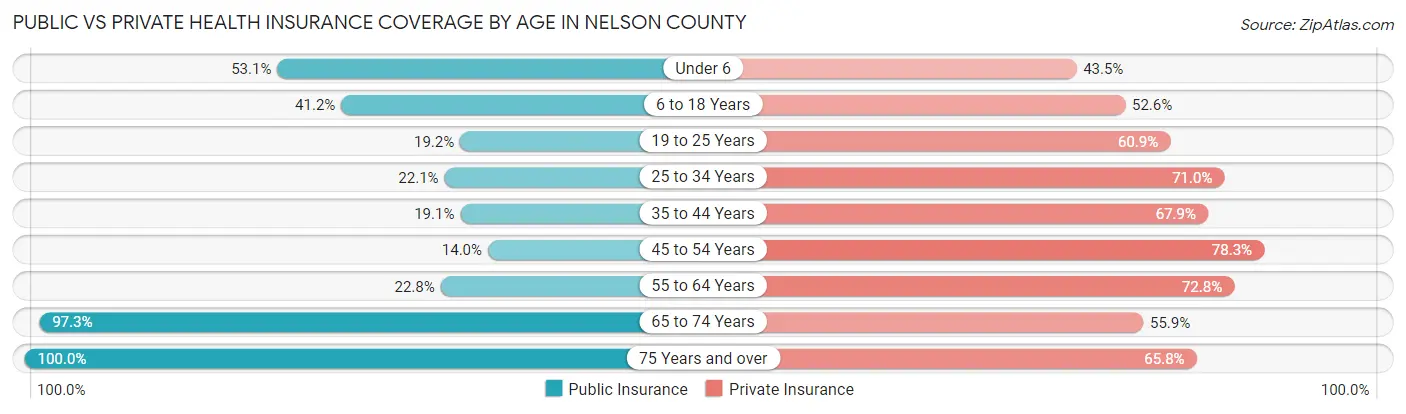
| Age Bracket | Public Insurance | Private Insurance |
| Under 6 | 393 (53.1%) | 322 (43.5%) |
| 6 to 18 Years | 822 (41.2%) | 1,048 (52.6%) |
| 19 to 25 Years | 188 (19.2%) | 597 (60.9%) |
| 25 to 34 Years | 280 (22.1%) | 900 (71.0%) |
| 35 to 44 Years | 281 (19.1%) | 997 (67.9%) |
| 45 to 54 Years | 240 (14.0%) | 1,342 (78.3%) |
| 55 to 64 Years | 547 (22.8%) | 1,747 (72.8%) |
| 65 to 74 Years | 2,577 (97.3%) | 1,481 (55.9%) |
| 75 Years and over | 1,521 (100.0%) | 1,001 (65.8%) |
| Total | 6,849 (46.5%) | 9,435 (64.0%) |
Disability Status by Sex by Age in Nelson County
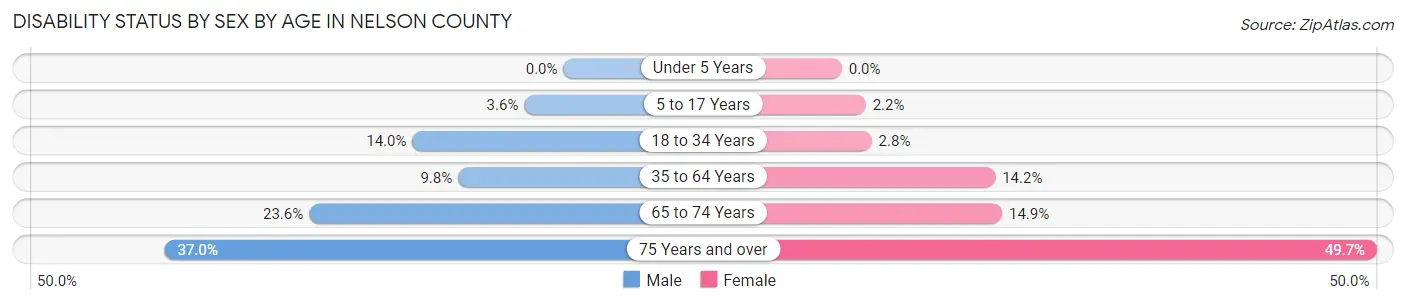
| Age Bracket | Male | Female |
| Under 5 Years | 0 (0.0%) | 0 (0.0%) |
| 5 to 17 Years | 38 (3.6%) | 18 (2.2%) |
| 18 to 34 Years | 173 (14.0%) | 33 (2.8%) |
| 35 to 64 Years | 277 (9.8%) | 391 (14.2%) |
| 65 to 74 Years | 295 (23.6%) | 208 (14.9%) |
| 75 Years and over | 235 (37.0%) | 440 (49.7%) |
Disability Class by Sex by Age in Nelson County
Disability Class: Hearing Difficulty
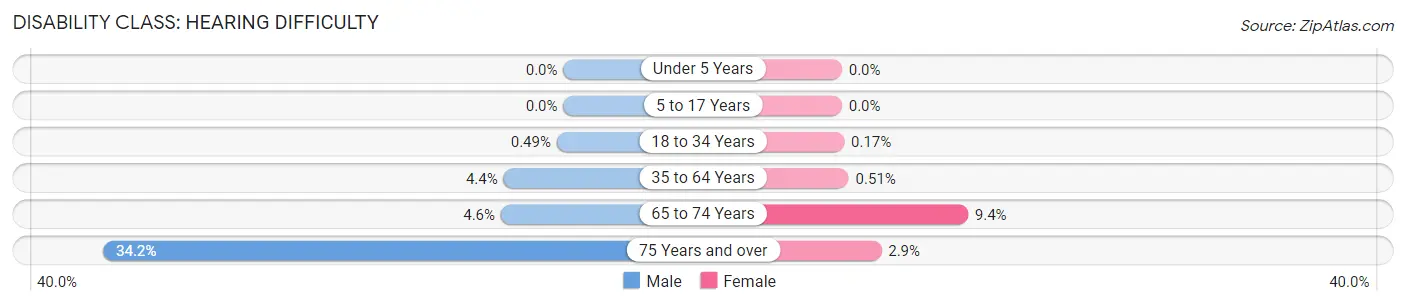
| Age Bracket | Male | Female |
| Under 5 Years | 0 (0.0%) | 0 (0.0%) |
| 5 to 17 Years | 0 (0.0%) | 0 (0.0%) |
| 18 to 34 Years | 6 (0.5%) | 2 (0.2%) |
| 35 to 64 Years | 126 (4.4%) | 14 (0.5%) |
| 65 to 74 Years | 58 (4.6%) | 131 (9.4%) |
| 75 Years and over | 217 (34.2%) | 26 (2.9%) |
Disability Class: Vision Difficulty
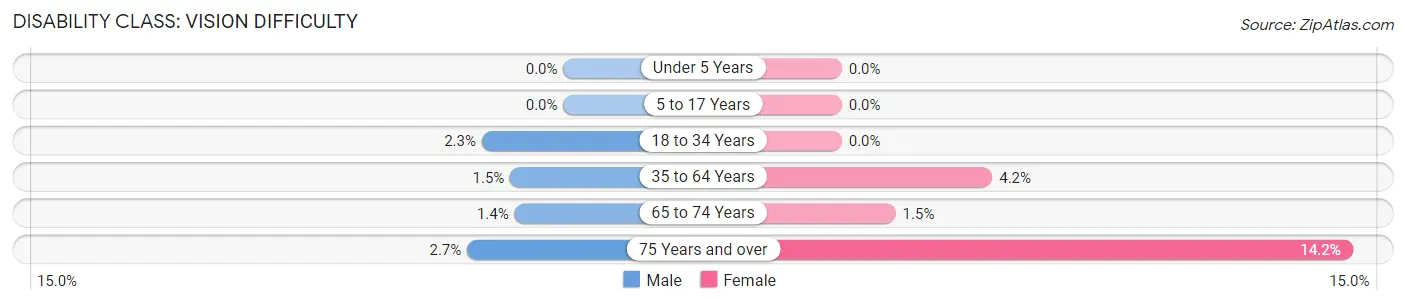
| Age Bracket | Male | Female |
| Under 5 Years | 0 (0.0%) | 0 (0.0%) |
| 5 to 17 Years | 0 (0.0%) | 0 (0.0%) |
| 18 to 34 Years | 28 (2.3%) | 0 (0.0%) |
| 35 to 64 Years | 42 (1.5%) | 115 (4.2%) |
| 65 to 74 Years | 17 (1.4%) | 21 (1.5%) |
| 75 Years and over | 17 (2.7%) | 126 (14.2%) |
Disability Class: Cognitive Difficulty
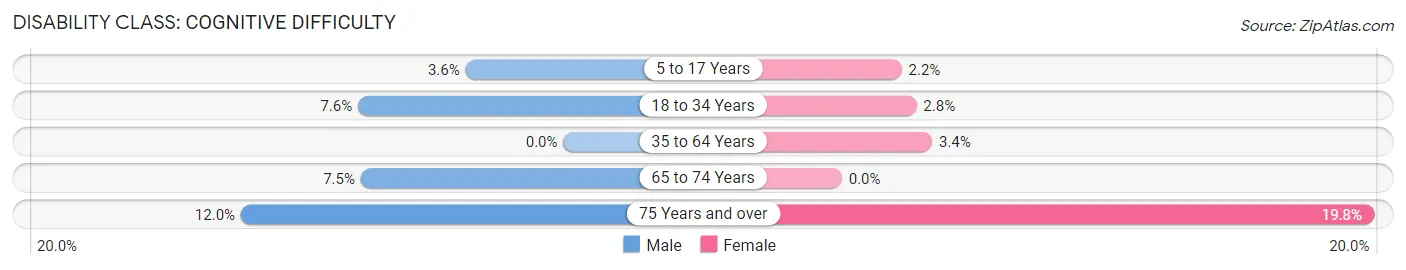
| Age Bracket | Male | Female |
| 5 to 17 Years | 38 (3.6%) | 18 (2.2%) |
| 18 to 34 Years | 94 (7.6%) | 33 (2.8%) |
| 35 to 64 Years | 0 (0.0%) | 92 (3.4%) |
| 65 to 74 Years | 94 (7.5%) | 0 (0.0%) |
| 75 Years and over | 76 (12.0%) | 175 (19.8%) |
Disability Class: Ambulatory Difficulty
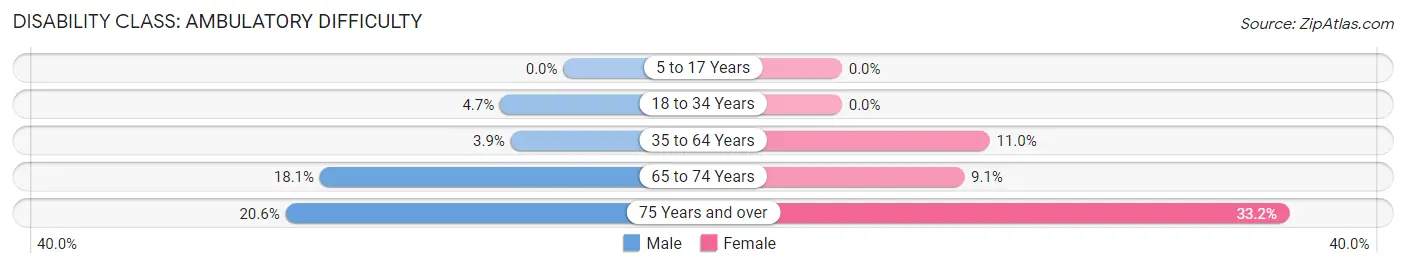
| Age Bracket | Male | Female |
| 5 to 17 Years | 0 (0.0%) | 0 (0.0%) |
| 18 to 34 Years | 58 (4.7%) | 0 (0.0%) |
| 35 to 64 Years | 111 (3.9%) | 301 (11.0%) |
| 65 to 74 Years | 226 (18.1%) | 127 (9.1%) |
| 75 Years and over | 131 (20.6%) | 294 (33.2%) |
Disability Class: Self-Care Difficulty
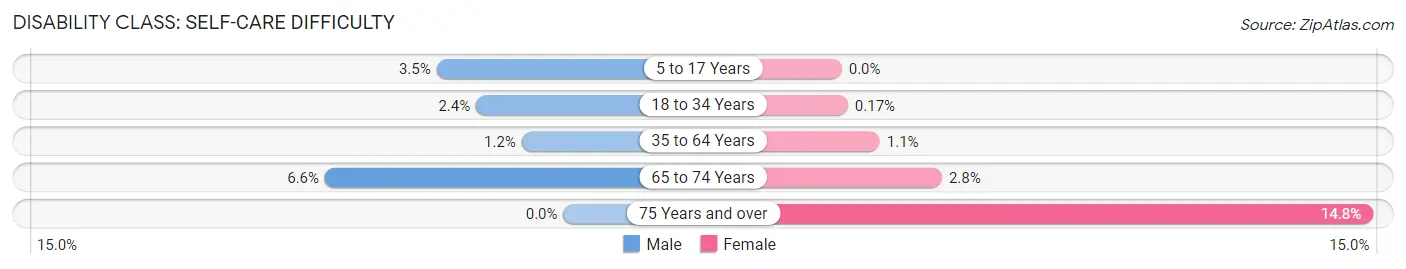
| Age Bracket | Male | Female |
| 5 to 17 Years | 37 (3.5%) | 0 (0.0%) |
| 18 to 34 Years | 30 (2.4%) | 2 (0.2%) |
| 35 to 64 Years | 33 (1.2%) | 29 (1.1%) |
| 65 to 74 Years | 83 (6.6%) | 39 (2.8%) |
| 75 Years and over | 0 (0.0%) | 131 (14.8%) |
Technology Access in Nelson County
Computing Device Access in Nelson County
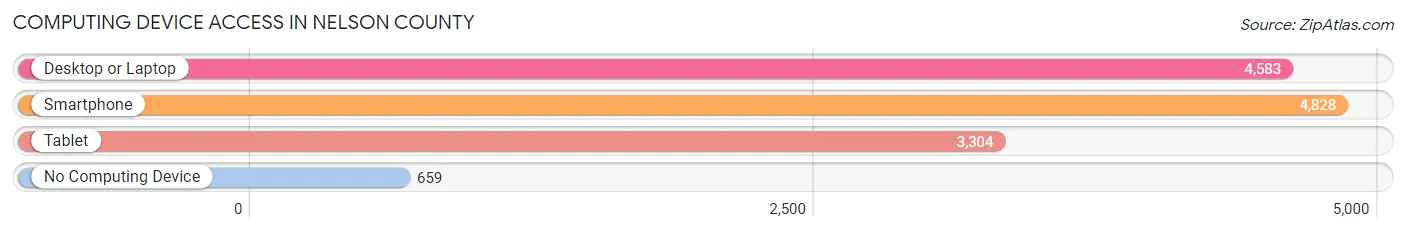
| Device Type | # Households | % Households |
| Desktop or Laptop | 4,583 | 74.7% |
| Smartphone | 4,828 | 78.7% |
| Tablet | 3,304 | 53.9% |
| No Computing Device | 659 | 10.7% |
| Total | 6,132 | 100.0% |
Internet Access in Nelson County
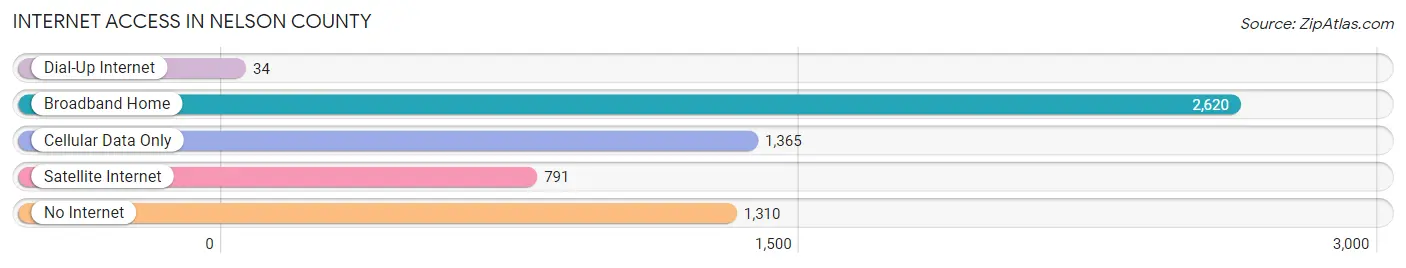
| Internet Type | # Households | % Households |
| Dial-Up Internet | 34 | 0.5% |
| Broadband Home | 2,620 | 42.7% |
| Cellular Data Only | 1,365 | 22.3% |
| Satellite Internet | 791 | 12.9% |
| No Internet | 1,310 | 21.4% |
| Total | 6,132 | 100.0% |
Nelson County Summary
Nelson County, Virginia is located in the foothills of the Blue Ridge Mountains in the central part of the state. It is bordered by Albemarle County to the north, Amherst County to the east, Augusta County to the south, and Rockingham County to the west. The county seat is Lovingston, and the county is home to approximately 15,000 people.
History
Nelson County was formed in 1807 from Amherst County. It was named for Thomas Nelson, Jr., a signer of the Declaration of Independence and Governor of Virginia from 1781 to 1784. The county was home to several Native American tribes, including the Monacan, the Manahoac, and the Saponi.
The county was home to several prominent figures in American history, including Thomas Jefferson, who owned a plantation in the county, and James Madison, who owned a plantation in the county. The county was also home to the first African-American college in the United States, the Hampton Normal and Agricultural Institute, which was founded in 1868.
Geography
Nelson County is located in the foothills of the Blue Ridge Mountains in the central part of the state. It is bordered by Albemarle County to the north, Amherst County to the east, Augusta County to the south, and Rockingham County to the west. The county is home to several mountain peaks, including the Blue Ridge Mountains, the Allegheny Mountains, and the Massanutten Mountains.
The county is home to several rivers, including the James River, the Tye River, and the Maury River. The county is also home to several lakes, including Lake Monocan, Lake Tye, and Lake Maury.
Economy
Nelson County is home to a diverse economy. The county is home to several large employers, including the University of Virginia, the Virginia Department of Transportation, and the Virginia Department of Corrections. The county is also home to several small businesses, including wineries, breweries, and distilleries.
The county is home to several agricultural operations, including cattle, sheep, and poultry farms. The county is also home to several fruit and vegetable farms, as well as several vineyards and wineries.
Demographics
As of the 2010 census, Nelson County had a population of 15,020. The racial makeup of the county was 92.3% White, 4.2% African American, 0.5% Native American, 0.7% Asian, 0.1% Pacific Islander, 0.7% from other races, and 1.5% from two or more races. Hispanic or Latino of any race were 2.3% of the population.
The median income for a household in the county was $45,945, and the median income for a family was $54,945. The per capita income for the county was $25,945. About 10.3% of families and 13.2% of the population were below the poverty line, including 17.2% of those under age 18 and 8.2% of those age 65 or over.
Common Questions
What is Per Capita Income in Nelson County?
Per Capita income in Nelson County is $42,837.
What is the Median Family Income in Nelson County?
Median Family Income in Nelson County is $84,974.
What is the Median Household income in Nelson County?
Median Household Income in Nelson County is $64,028.
What is Income or Wage Gap in Nelson County?
Income or Wage Gap in Nelson County is 32.9%.
Women in Nelson County earn 67.1 cents for every dollar earned by a man.
What is Family Income Deficit in Nelson County?
Family Income Deficit in Nelson County is $10,409.
Families that are below poverty line in Nelson County earn $10,409 less on average than the poverty threshold level.
What is Inequality or Gini Index in Nelson County?
Inequality or Gini Index in Nelson County is 0.50.
What is the Total Population of Nelson County?
Total Population of Nelson County is 14,773.
What is the Total Male Population of Nelson County?
Total Male Population of Nelson County is 7,463.
What is the Total Female Population of Nelson County?
Total Female Population of Nelson County is 7,310.
What is the Ratio of Males per 100 Females in Nelson County?
There are 102.09 Males per 100 Females in Nelson County.
What is the Ratio of Females per 100 Males in Nelson County?
There are 97.95 Females per 100 Males in Nelson County.
What is the Median Population Age in Nelson County?
Median Population Age in Nelson County is 50.7 Years.
What is the Average Family Size in Nelson County
Average Family Size in Nelson County is 3.0 People.
What is the Average Household Size in Nelson County
Average Household Size in Nelson County is 2.4 People.
How Large is the Labor Force in Nelson County?
There are 7,071 People in the Labor Forcein in Nelson County.
What is the Percentage of People in the Labor Force in Nelson County?
56.4% of People are in the Labor Force in Nelson County.
What is the Unemployment Rate in Nelson County?
Unemployment Rate in Nelson County is 3.2%.