Montgomery County, VA Map & Demographics
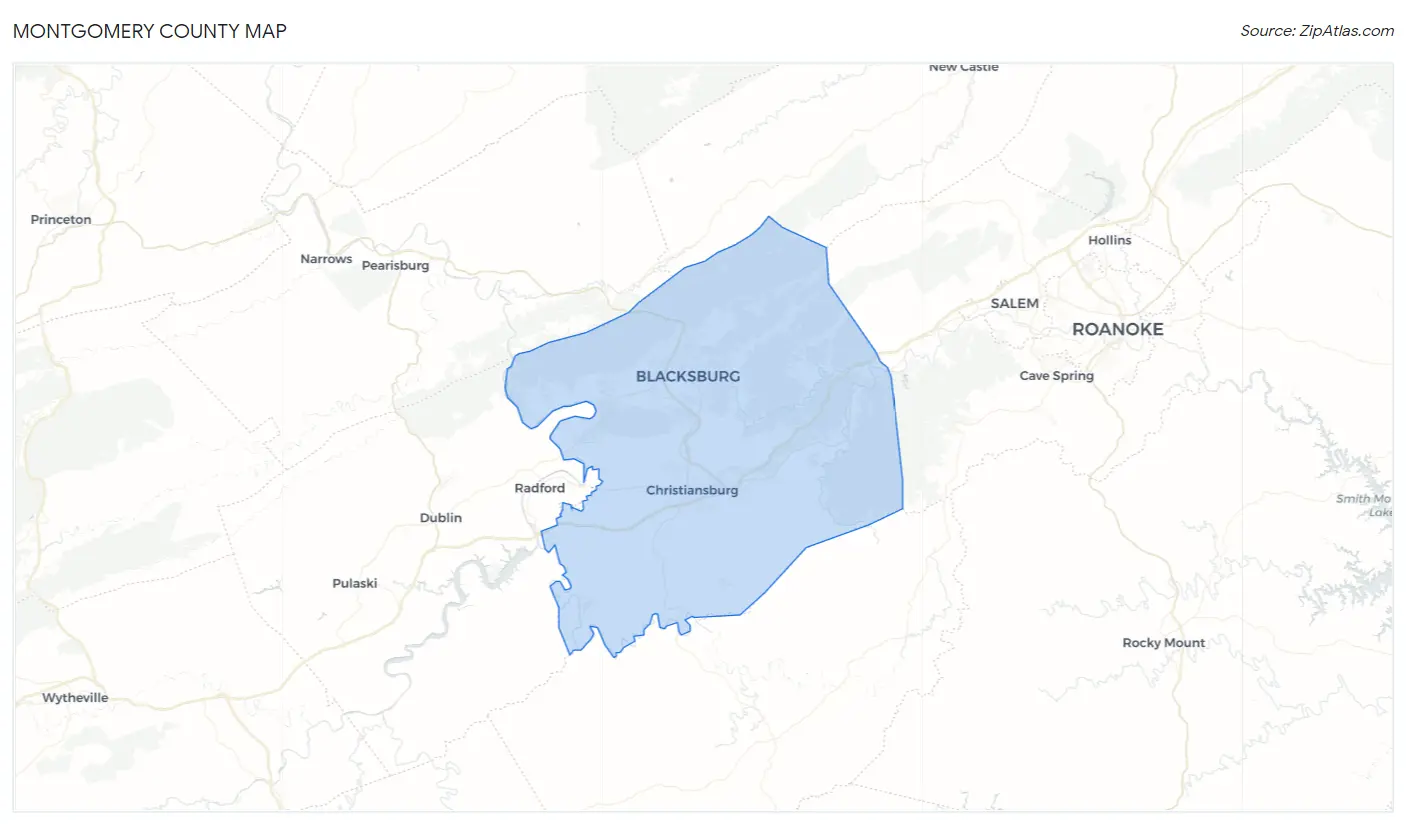
Montgomery County Map
Montgomery County Overview
$32,776
PER CAPITA INCOME
$96,261
AVG FAMILY INCOME
$65,270
AVG HOUSEHOLD INCOME
27.5%
WAGE / INCOME GAP [ % ]
72.5¢/ $1
WAGE / INCOME GAP [ $ ]
$13,504
FAMILY INCOME DEFICIT
0.49
INEQUALITY / GINI INDEX
99,373
TOTAL POPULATION
51,542
MALE POPULATION
47,831
FEMALE POPULATION
107.76
MALES / 100 FEMALES
92.80
FEMALES / 100 MALES
29.7
MEDIAN AGE
2.9
AVG FAMILY SIZE
2.5
AVG HOUSEHOLD SIZE
48,168
LABOR FORCE [ PEOPLE ]
55.9%
PERCENT IN LABOR FORCE
3.3%
UNEMPLOYMENT RATE
Montgomery County Area Codes
Income in Montgomery County
Income Overview in Montgomery County
Per Capita Income in Montgomery County is $32,776, while median incomes of families and households are $96,261 and $65,270 respectively.
| Characteristic | Number | Measure |
| Per Capita Income | 99,373 | $32,776 |
| Median Family Income | 19,180 | $96,261 |
| Mean Family Income | 19,180 | $118,766 |
| Median Household Income | 36,062 | $65,270 |
| Mean Household Income | 36,062 | $85,496 |
| Income Deficit | 19,180 | $13,504 |
| Wage / Income Gap (%) | 99,373 | 27.52% |
| Wage / Income Gap ($) | 99,373 | 72.48¢ per $1 |
| Gini / Inequality Index | 99,373 | 0.49 |
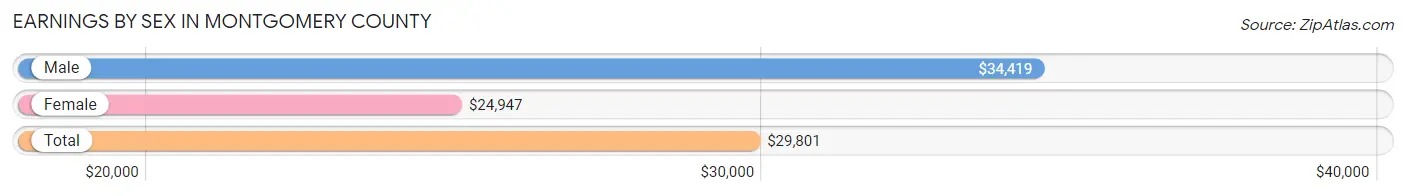
Earnings by Sex in Montgomery County
Average Earnings in Montgomery County are $29,801, $34,419 for men and $24,947 for women, a difference of 27.5%.
| Sex | Number | Average Earnings |
| Male | 30,988 (55.8%) | $34,419 |
| Female | 24,503 (44.2%) | $24,947 |
| Total | 55,491 (100.0%) | $29,801 |
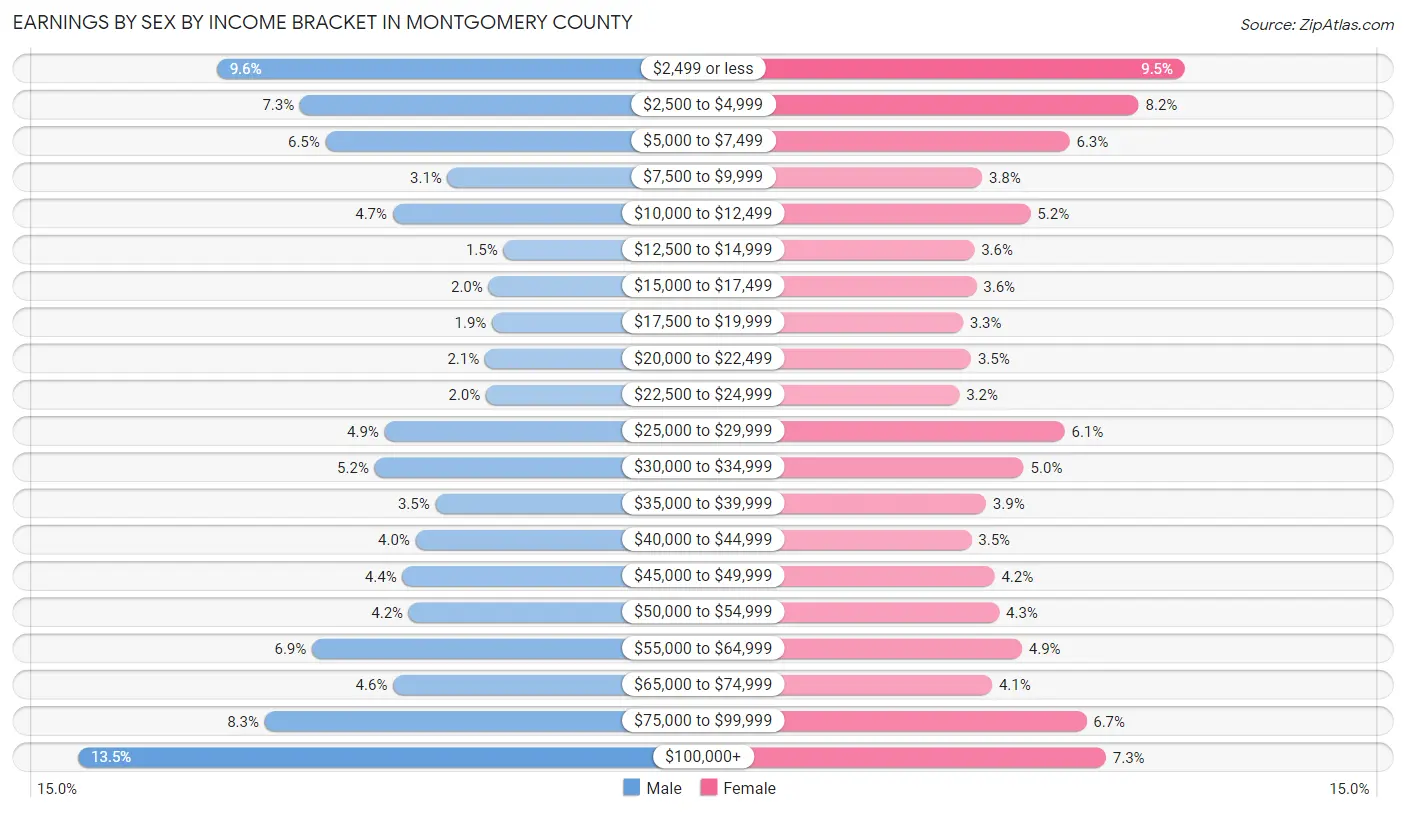
Earnings by Sex by Income Bracket in Montgomery County
The most common earnings brackets in Montgomery County are $100,000+ for men (4,184 | 13.5%) and $2,499 or less for women (2,329 | 9.5%).
| Income | Male | Female |
| $2,499 or less | 2,974 (9.6%) | 2,329 (9.5%) |
| $2,500 to $4,999 | 2,250 (7.3%) | 2,009 (8.2%) |
| $5,000 to $7,499 | 2,027 (6.5%) | 1,535 (6.3%) |
| $7,500 to $9,999 | 964 (3.1%) | 931 (3.8%) |
| $10,000 to $12,499 | 1,442 (4.6%) | 1,265 (5.2%) |
| $12,500 to $14,999 | 478 (1.5%) | 878 (3.6%) |
| $15,000 to $17,499 | 607 (2.0%) | 893 (3.6%) |
| $17,500 to $19,999 | 577 (1.9%) | 798 (3.3%) |
| $20,000 to $22,499 | 637 (2.1%) | 855 (3.5%) |
| $22,500 to $24,999 | 629 (2.0%) | 775 (3.2%) |
| $25,000 to $29,999 | 1,511 (4.9%) | 1,499 (6.1%) |
| $30,000 to $34,999 | 1,598 (5.2%) | 1,217 (5.0%) |
| $35,000 to $39,999 | 1,068 (3.5%) | 957 (3.9%) |
| $40,000 to $44,999 | 1,243 (4.0%) | 858 (3.5%) |
| $45,000 to $49,999 | 1,358 (4.4%) | 1,017 (4.2%) |
| $50,000 to $54,999 | 1,300 (4.2%) | 1,049 (4.3%) |
| $55,000 to $64,999 | 2,145 (6.9%) | 1,205 (4.9%) |
| $65,000 to $74,999 | 1,438 (4.6%) | 1,000 (4.1%) |
| $75,000 to $99,999 | 2,558 (8.3%) | 1,649 (6.7%) |
| $100,000+ | 4,184 (13.5%) | 1,784 (7.3%) |
| Total | 30,988 (100.0%) | 24,503 (100.0%) |
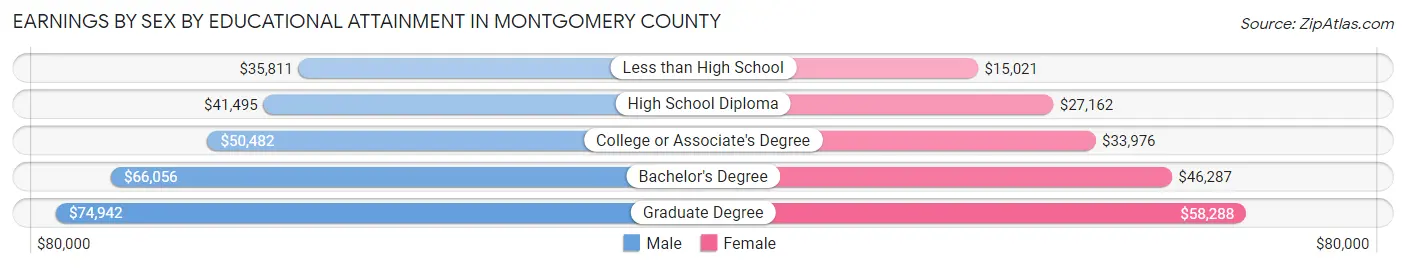
Earnings by Sex by Educational Attainment in Montgomery County
Average earnings in Montgomery County are $54,692 for men and $40,029 for women, a difference of 26.8%. Men with an educational attainment of graduate degree enjoy the highest average annual earnings of $74,942, while those with less than high school education earn the least with $35,811. Women with an educational attainment of graduate degree earn the most with the average annual earnings of $58,288, while those with less than high school education have the smallest earnings of $15,021.
| Educational Attainment | Male Income | Female Income |
| Less than High School | $35,811 | $15,021 |
| High School Diploma | $41,495 | $27,162 |
| College or Associate's Degree | $50,482 | $33,976 |
| Bachelor's Degree | $66,056 | $46,287 |
| Graduate Degree | $74,942 | $58,288 |
| Total | $54,692 | $40,029 |
Family Income in Montgomery County
Family Income Brackets in Montgomery County
According to the Montgomery County family income data, there are 4,258 families falling into the $100,000 to $149,999 income range, which is the most common income bracket and makes up 22.2% of all families. Conversely, the $10,000 to $14,999 income bracket is the least frequent group with only 345 families (1.8%) belonging to this category.
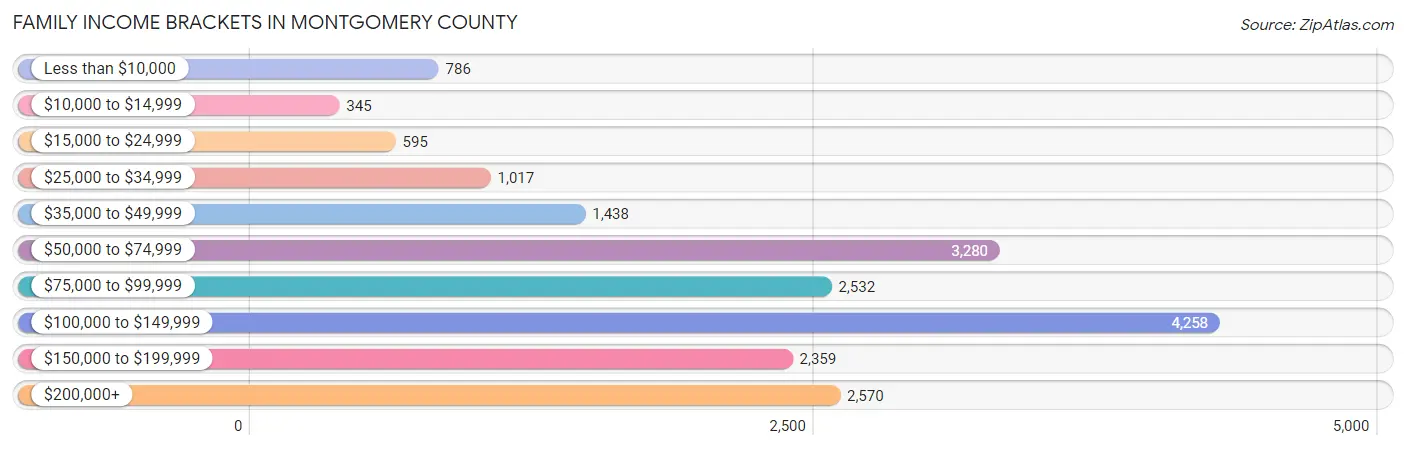
| Income Bracket | # Families | % Families |
| Less than $10,000 | 786 | 4.1% |
| $10,000 to $14,999 | 345 | 1.8% |
| $15,000 to $24,999 | 595 | 3.1% |
| $25,000 to $34,999 | 1,017 | 5.3% |
| $35,000 to $49,999 | 1,438 | 7.5% |
| $50,000 to $74,999 | 3,280 | 17.1% |
| $75,000 to $99,999 | 2,532 | 13.2% |
| $100,000 to $149,999 | 4,258 | 22.2% |
| $150,000 to $199,999 | 2,359 | 12.3% |
| $200,000+ | 2,570 | 13.4% |
Family Income by Famaliy Size in Montgomery County
4-person families (3,340 | 17.4%) account for the highest median family income in Montgomery County with $118,250 per family, while 2-person families (10,038 | 52.3%) have the highest median income of $44,130 per family member.
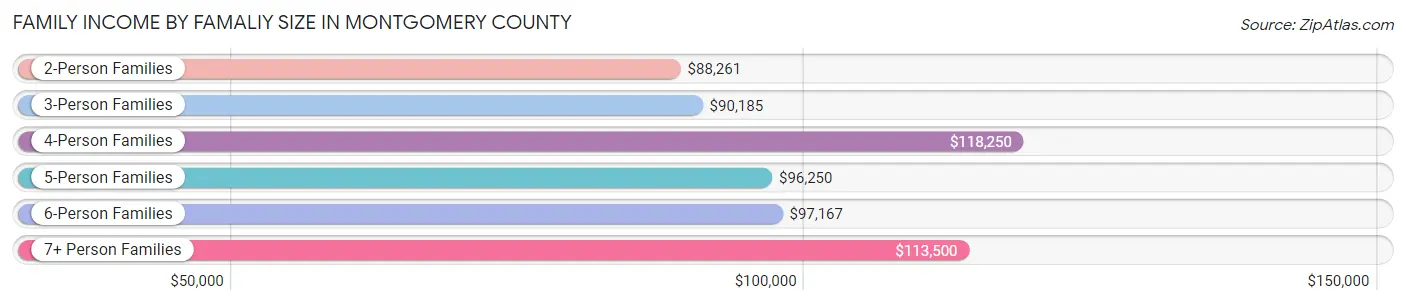
| Income Bracket | # Families | Median Income |
| 2-Person Families | 10,038 (52.3%) | $88,261 |
| 3-Person Families | 4,074 (21.2%) | $90,185 |
| 4-Person Families | 3,340 (17.4%) | $118,250 |
| 5-Person Families | 1,158 (6.0%) | $96,250 |
| 6-Person Families | 366 (1.9%) | $97,167 |
| 7+ Person Families | 204 (1.1%) | $113,500 |
| Total | 19,180 (100.0%) | $96,261 |
Family Income by Number of Earners in Montgomery County
The median family income in Montgomery County is $96,261, with families comprising 3+ earners (1,535) having the highest median family income of $138,516, while families with no earners (2,941) have the lowest median family income of $58,231, accounting for 8.0% and 15.3% of families, respectively.
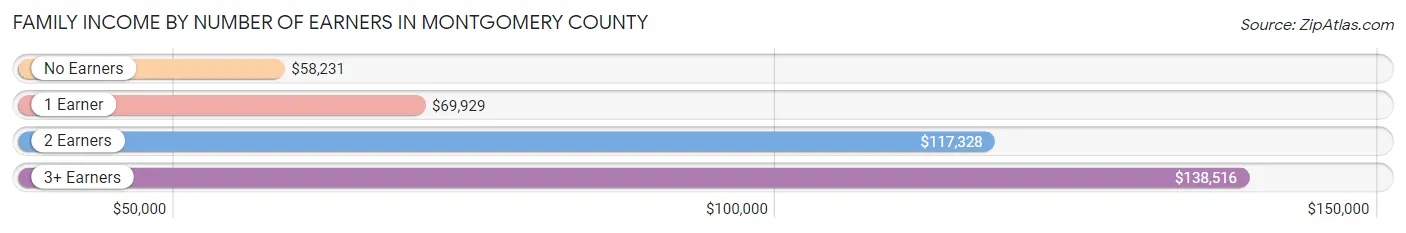
| Number of Earners | # Families | Median Income |
| No Earners | 2,941 (15.3%) | $58,231 |
| 1 Earner | 6,674 (34.8%) | $69,929 |
| 2 Earners | 8,030 (41.9%) | $117,328 |
| 3+ Earners | 1,535 (8.0%) | $138,516 |
| Total | 19,180 (100.0%) | $96,261 |
Household Income in Montgomery County
Household Income Brackets in Montgomery County
With 6,167 households falling in the category, the $50,000 to $74,999 income range is the most frequent in Montgomery County, accounting for 17.1% of all households. In contrast, only 1,262 households (3.5%) fall into the $10,000 to $14,999 income bracket, making it the least populous group.
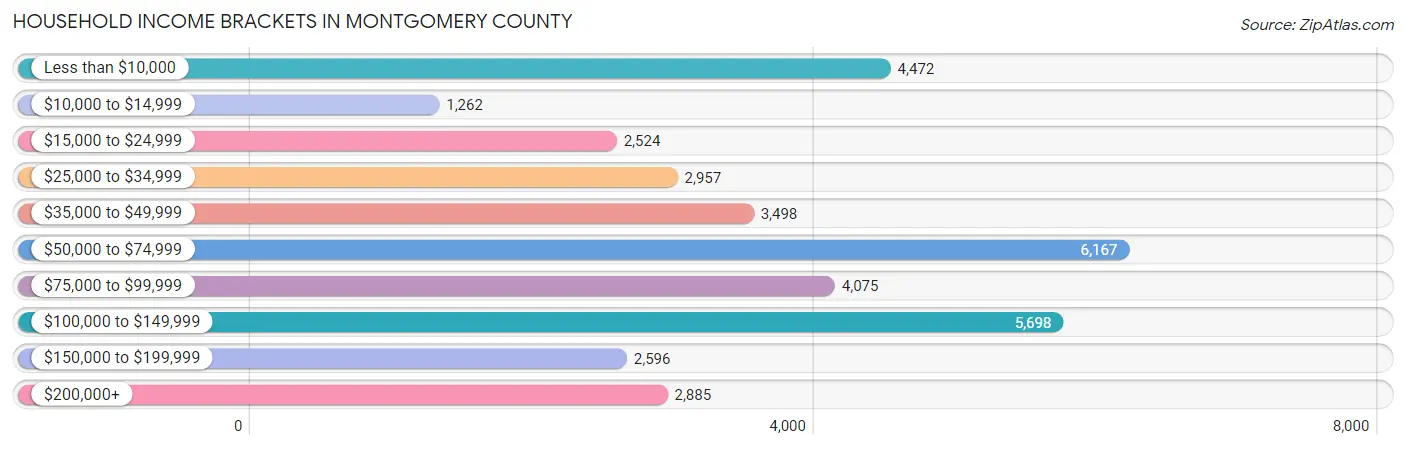
| Income Bracket | # Households | % Households |
| Less than $10,000 | 4,472 | 12.4% |
| $10,000 to $14,999 | 1,262 | 3.5% |
| $15,000 to $24,999 | 2,524 | 7.0% |
| $25,000 to $34,999 | 2,957 | 8.2% |
| $35,000 to $49,999 | 3,498 | 9.7% |
| $50,000 to $74,999 | 6,167 | 17.1% |
| $75,000 to $99,999 | 4,075 | 11.3% |
| $100,000 to $149,999 | 5,698 | 15.8% |
| $150,000 to $199,999 | 2,596 | 7.2% |
| $200,000+ | 2,885 | 8.0% |
Household Income by Householder Age in Montgomery County
The median household income in Montgomery County is $65,270, with the highest median household income of $90,661 found in the 45 to 64 years age bracket for the primary householder. A total of 10,809 households (30.0%) fall into this category. Meanwhile, the 15 to 24 years age bracket for the primary householder has the lowest median household income of $9,825, with 5,205 households (14.4%) in this group.
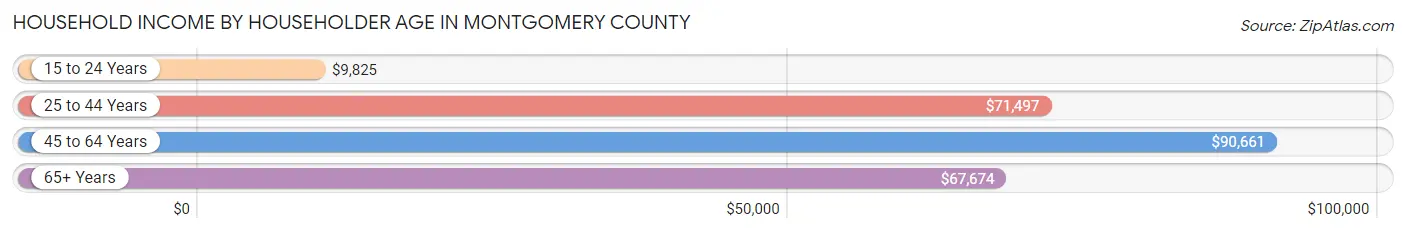
| Income Bracket | # Households | Median Income |
| 15 to 24 Years | 5,205 (14.4%) | $9,825 |
| 25 to 44 Years | 11,960 (33.2%) | $71,497 |
| 45 to 64 Years | 10,809 (30.0%) | $90,661 |
| 65+ Years | 8,088 (22.4%) | $67,674 |
| Total | 36,062 (100.0%) | $65,270 |
Poverty in Montgomery County
Income Below Poverty by Sex and Age in Montgomery County
With 24.9% poverty level for males and 24.9% for females among the residents of Montgomery County, 18 to 24 year old males and 18 to 24 year old females are the most vulnerable to poverty, with 7,754 males (74.3%) and 6,025 females (71.7%) in their respective age groups living below the poverty level.
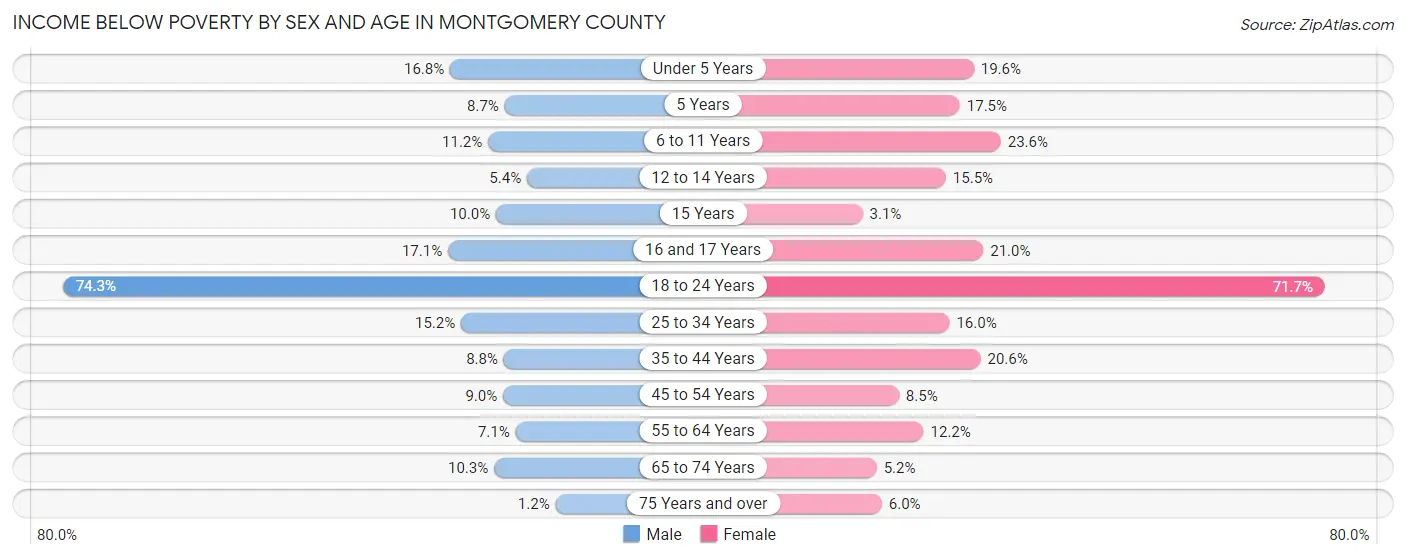
| Age Bracket | Male | Female |
| Under 5 Years | 318 (16.8%) | 361 (19.6%) |
| 5 Years | 33 (8.7%) | 61 (17.5%) |
| 6 to 11 Years | 261 (11.2%) | 657 (23.6%) |
| 12 to 14 Years | 86 (5.4%) | 183 (15.5%) |
| 15 Years | 42 (10.0%) | 10 (3.1%) |
| 16 and 17 Years | 141 (17.1%) | 174 (21.0%) |
| 18 to 24 Years | 7,754 (74.3%) | 6,025 (71.7%) |
| 25 to 34 Years | 998 (15.2%) | 946 (16.0%) |
| 35 to 44 Years | 476 (8.8%) | 1,002 (20.6%) |
| 45 to 54 Years | 456 (8.9%) | 421 (8.5%) |
| 55 to 64 Years | 341 (7.1%) | 606 (12.1%) |
| 65 to 74 Years | 380 (10.3%) | 214 (5.2%) |
| 75 Years and over | 24 (1.2%) | 174 (5.9%) |
| Total | 11,310 (24.9%) | 10,834 (24.9%) |
Income Above Poverty by Sex and Age in Montgomery County
According to the poverty statistics in Montgomery County, males aged 75 years and over and females aged 15 years are the age groups that are most secure financially, with 98.8% of males and 96.9% of females in these age groups living above the poverty line.
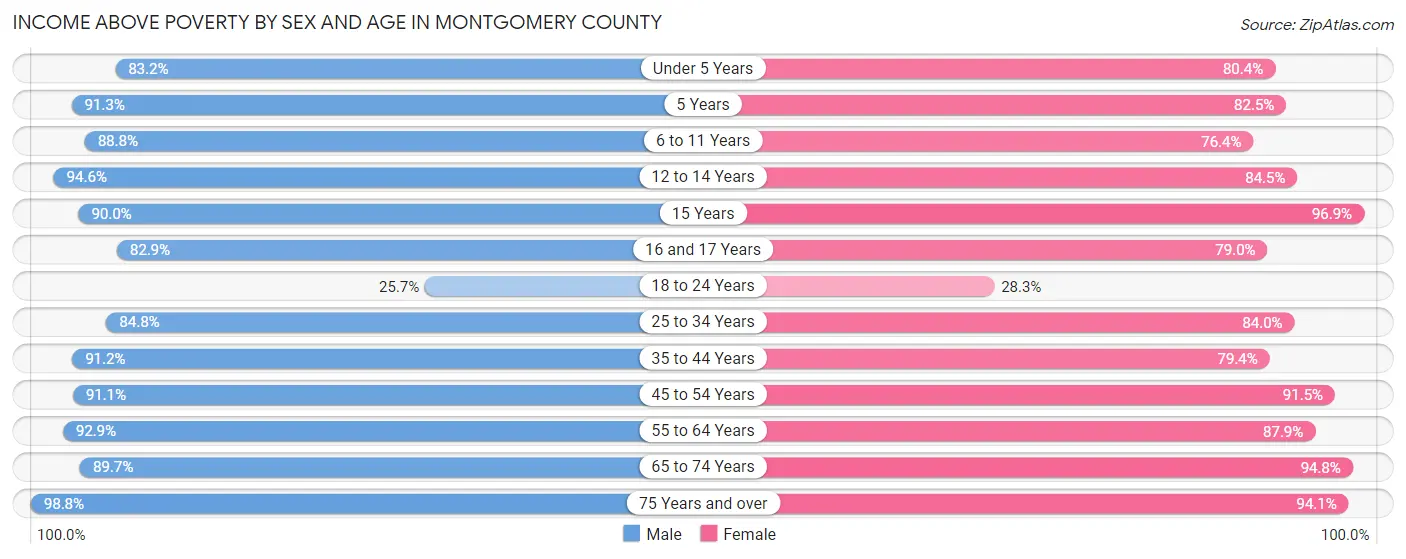
| Age Bracket | Male | Female |
| Under 5 Years | 1,571 (83.2%) | 1,481 (80.4%) |
| 5 Years | 346 (91.3%) | 287 (82.5%) |
| 6 to 11 Years | 2,076 (88.8%) | 2,126 (76.4%) |
| 12 to 14 Years | 1,508 (94.6%) | 1,001 (84.5%) |
| 15 Years | 378 (90.0%) | 314 (96.9%) |
| 16 and 17 Years | 682 (82.9%) | 654 (79.0%) |
| 18 to 24 Years | 2,677 (25.7%) | 2,377 (28.3%) |
| 25 to 34 Years | 5,574 (84.8%) | 4,972 (84.0%) |
| 35 to 44 Years | 4,909 (91.2%) | 3,863 (79.4%) |
| 45 to 54 Years | 4,641 (91.0%) | 4,542 (91.5%) |
| 55 to 64 Years | 4,461 (92.9%) | 4,381 (87.8%) |
| 65 to 74 Years | 3,313 (89.7%) | 3,917 (94.8%) |
| 75 Years and over | 2,034 (98.8%) | 2,748 (94.1%) |
| Total | 34,170 (75.1%) | 32,663 (75.1%) |
Income Below Poverty Among Married-Couple Families in Montgomery County
The poverty statistics for married-couple families in Montgomery County show that 4.6% or 713 of the total 15,622 families live below the poverty line. Families with 5 or more children have the highest poverty rate of 45.8%, comprising of 27 families. On the other hand, families with no children have the lowest poverty rate of 3.1%, which includes 288 families.
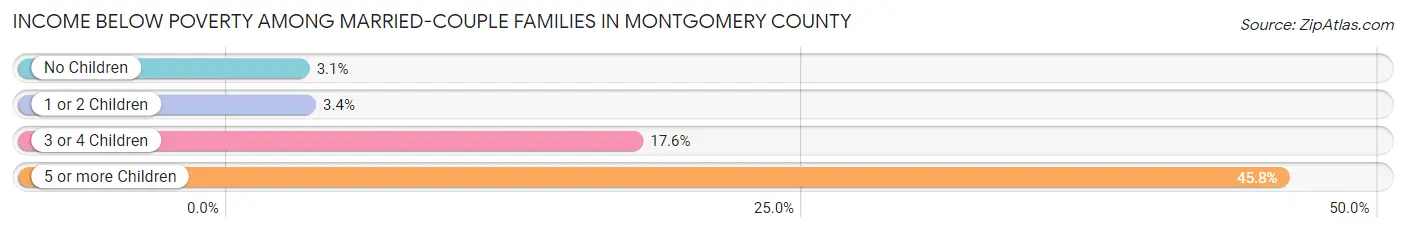
| Children | Above Poverty | Below Poverty |
| No Children | 8,940 (96.9%) | 288 (3.1%) |
| 1 or 2 Children | 4,882 (96.6%) | 172 (3.4%) |
| 3 or 4 Children | 1,055 (82.4%) | 226 (17.6%) |
| 5 or more Children | 32 (54.2%) | 27 (45.8%) |
| Total | 14,909 (95.4%) | 713 (4.6%) |
Income Below Poverty Among Single-Parent Households in Montgomery County
According to the poverty data in Montgomery County, 4.1% or 49 single-father households and 35.6% or 835 single-mother households are living below the poverty line. Among single-father households, those with no children have the highest poverty rate, with 40 households (8.3%) experiencing poverty. Likewise, among single-mother households, those with 3 or 4 children have the highest poverty rate, with 129 households (74.1%) falling below the poverty line.
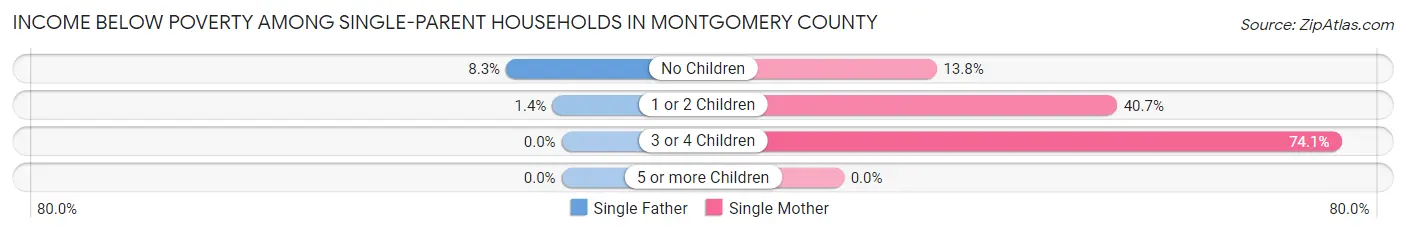
| Children | Single Father | Single Mother |
| No Children | 40 (8.3%) | 92 (13.8%) |
| 1 or 2 Children | 9 (1.4%) | 614 (40.7%) |
| 3 or 4 Children | 0 (0.0%) | 129 (74.1%) |
| 5 or more Children | 0 (0.0%) | 0 (0.0%) |
| Total | 49 (4.1%) | 835 (35.6%) |
Income Below Poverty Among Married-Couple vs Single-Parent Households in Montgomery County
The poverty data for Montgomery County shows that 713 of the married-couple family households (4.6%) and 884 of the single-parent households (24.8%) are living below the poverty level. Within the married-couple family households, those with 5 or more children have the highest poverty rate, with 27 households (45.8%) falling below the poverty line. Among the single-parent households, those with 3 or 4 children have the highest poverty rate, with 129 household (50.6%) living below poverty.
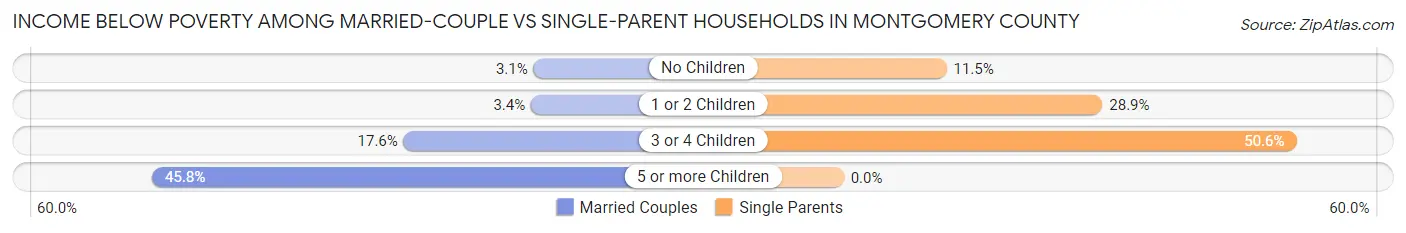
| Children | Married-Couple Families | Single-Parent Households |
| No Children | 288 (3.1%) | 132 (11.5%) |
| 1 or 2 Children | 172 (3.4%) | 623 (28.9%) |
| 3 or 4 Children | 226 (17.6%) | 129 (50.6%) |
| 5 or more Children | 27 (45.8%) | 0 (0.0%) |
| Total | 713 (4.6%) | 884 (24.8%) |
Race in Montgomery County
The most populous races in Montgomery County are White / Caucasian (83,364 | 83.9%), Asian (6,457 | 6.5%), and Black / African American (4,054 | 4.1%).
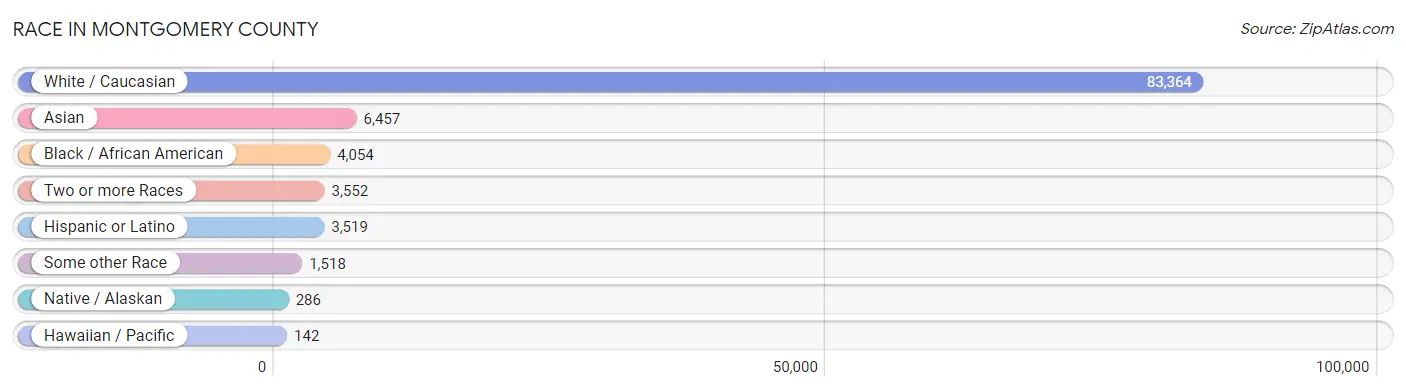
| Race | # Population | % Population |
| Asian | 6,457 | 6.5% |
| Black / African American | 4,054 | 4.1% |
| Hawaiian / Pacific | 142 | 0.1% |
| Hispanic or Latino | 3,519 | 3.5% |
| Native / Alaskan | 286 | 0.3% |
| White / Caucasian | 83,364 | 83.9% |
| Two or more Races | 3,552 | 3.6% |
| Some other Race | 1,518 | 1.5% |
| Total | 99,373 | 100.0% |
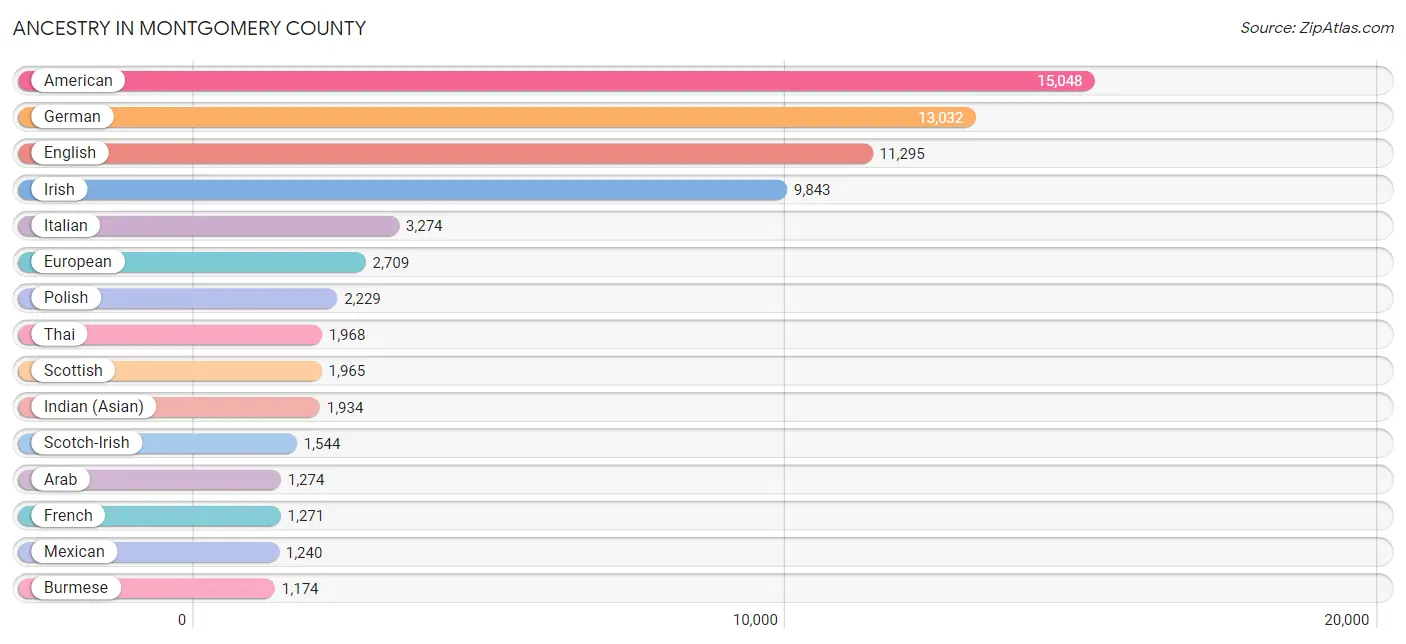
Ancestry in Montgomery County
The most populous ancestries reported in Montgomery County are American (15,048 | 15.1%), German (13,032 | 13.1%), English (11,295 | 11.4%), Irish (9,843 | 9.9%), and Italian (3,274 | 3.3%), together accounting for 52.8% of all Montgomery County residents.
| Ancestry | # Population | % Population |
| Afghan | 1 | 0.0% |
| African | 282 | 0.3% |
| Albanian | 213 | 0.2% |
| American | 15,048 | 15.1% |
| Arab | 1,274 | 1.3% |
| Argentinean | 35 | 0.0% |
| Australian | 27 | 0.0% |
| Austrian | 203 | 0.2% |
| Bangladeshi | 16 | 0.0% |
| Basque | 11 | 0.0% |
| Belgian | 22 | 0.0% |
| Bhutanese | 368 | 0.4% |
| Blackfeet | 39 | 0.0% |
| Bolivian | 42 | 0.0% |
| Brazilian | 193 | 0.2% |
| British | 880 | 0.9% |
| Bulgarian | 4 | 0.0% |
| Burmese | 1,174 | 1.2% |
| Cambodian | 14 | 0.0% |
| Canadian | 184 | 0.2% |
| Central American | 232 | 0.2% |
| Central American Indian | 45 | 0.1% |
| Cherokee | 62 | 0.1% |
| Chilean | 85 | 0.1% |
| Colombian | 145 | 0.2% |
| Costa Rican | 16 | 0.0% |
| Creek | 3 | 0.0% |
| Croatian | 45 | 0.1% |
| Cuban | 48 | 0.1% |
| Czech | 185 | 0.2% |
| Czechoslovakian | 36 | 0.0% |
| Danish | 323 | 0.3% |
| Dominican | 40 | 0.0% |
| Dutch | 742 | 0.7% |
| Eastern European | 195 | 0.2% |
| Ecuadorian | 12 | 0.0% |
| Egyptian | 336 | 0.3% |
| English | 11,295 | 11.4% |
| Estonian | 4 | 0.0% |
| Ethiopian | 39 | 0.0% |
| European | 2,709 | 2.7% |
| Filipino | 34 | 0.0% |
| Finnish | 176 | 0.2% |
| French | 1,271 | 1.3% |
| French Canadian | 334 | 0.3% |
| German | 13,032 | 13.1% |
| Ghanaian | 18 | 0.0% |
| Greek | 214 | 0.2% |
| Guatemalan | 39 | 0.0% |
| Honduran | 101 | 0.1% |
| Hungarian | 209 | 0.2% |
| Indian (Asian) | 1,934 | 1.9% |
| Indonesian | 8 | 0.0% |
| Inupiat | 3 | 0.0% |
| Iranian | 238 | 0.2% |
| Irish | 9,843 | 9.9% |
| Iroquois | 13 | 0.0% |
| Israeli | 8 | 0.0% |
| Italian | 3,274 | 3.3% |
| Jamaican | 302 | 0.3% |
| Jordanian | 11 | 0.0% |
| Korean | 275 | 0.3% |
| Laotian | 5 | 0.0% |
| Latvian | 12 | 0.0% |
| Lebanese | 161 | 0.2% |
| Lithuanian | 109 | 0.1% |
| Lumbee | 4 | 0.0% |
| Malaysian | 17 | 0.0% |
| Maltese | 20 | 0.0% |
| Mexican | 1,240 | 1.3% |
| Mongolian | 15 | 0.0% |
| Native Hawaiian | 182 | 0.2% |
| Nigerian | 11 | 0.0% |
| Northern European | 84 | 0.1% |
| Norwegian | 578 | 0.6% |
| Osage | 4 | 0.0% |
| Pakistani | 150 | 0.2% |
| Palestinian | 18 | 0.0% |
| Pennsylvania German | 29 | 0.0% |
| Peruvian | 39 | 0.0% |
| Polish | 2,229 | 2.2% |
| Portuguese | 308 | 0.3% |
| Puerto Rican | 382 | 0.4% |
| Romanian | 82 | 0.1% |
| Russian | 382 | 0.4% |
| Salvadoran | 76 | 0.1% |
| Samoan | 14 | 0.0% |
| Scandinavian | 216 | 0.2% |
| Scotch-Irish | 1,544 | 1.5% |
| Scottish | 1,965 | 2.0% |
| Serbian | 31 | 0.0% |
| Slavic | 86 | 0.1% |
| Slovak | 98 | 0.1% |
| Slovene | 19 | 0.0% |
| South American | 391 | 0.4% |
| South American Indian | 18 | 0.0% |
| Spaniard | 143 | 0.1% |
| Spanish | 18 | 0.0% |
| Spanish American | 10 | 0.0% |
| Sri Lankan | 548 | 0.5% |
| Subsaharan African | 384 | 0.4% |
| Sudanese | 12 | 0.0% |
| Swedish | 700 | 0.7% |
| Swiss | 191 | 0.2% |
| Thai | 1,968 | 2.0% |
| Tohono O'Odham | 10 | 0.0% |
| Turkish | 142 | 0.1% |
| Ukrainian | 287 | 0.3% |
| Venezuelan | 33 | 0.0% |
| Vietnamese | 27 | 0.0% |
| Welsh | 589 | 0.6% |
| West Indian | 22 | 0.0% |
| Yugoslavian | 179 | 0.2% | View All 113 Rows |
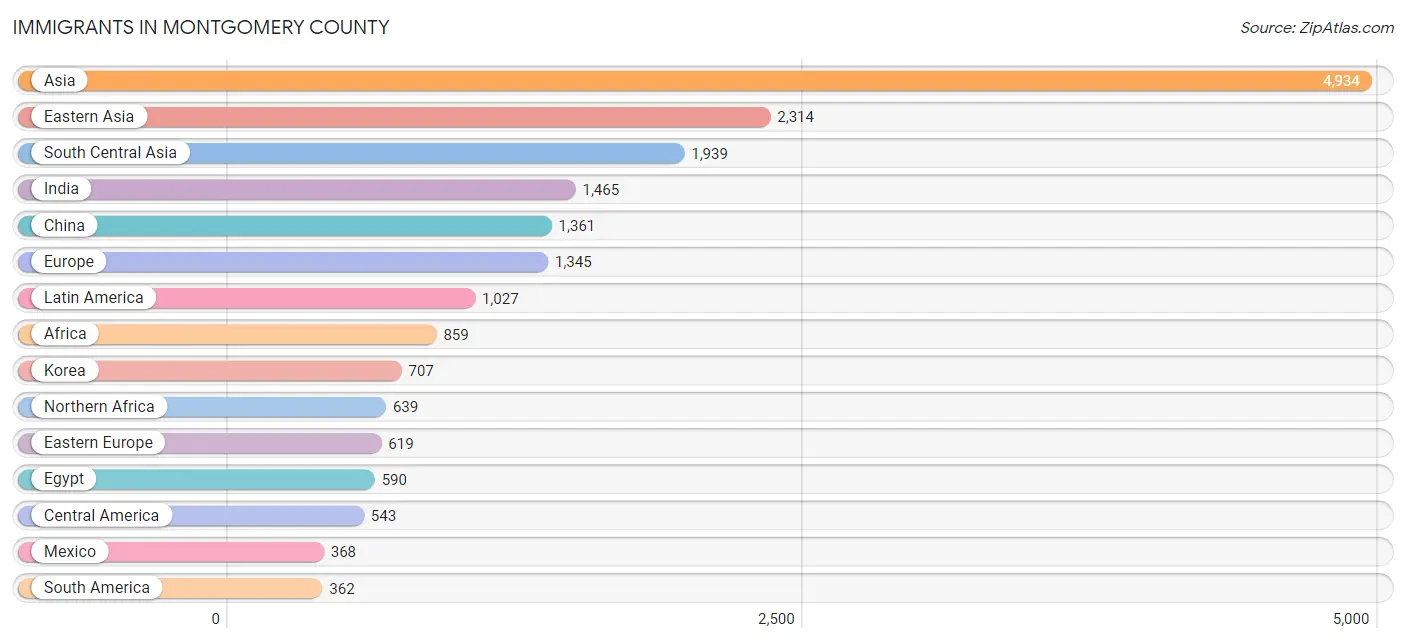
Immigrants in Montgomery County
The most numerous immigrant groups reported in Montgomery County came from Asia (4,934 | 5.0%), Eastern Asia (2,314 | 2.3%), South Central Asia (1,939 | 1.9%), India (1,465 | 1.5%), and China (1,361 | 1.4%), together accounting for 12.1% of all Montgomery County residents.
| Immigration Origin | # Population | % Population |
| Afghanistan | 6 | 0.0% |
| Africa | 859 | 0.9% |
| Albania | 156 | 0.2% |
| Argentina | 13 | 0.0% |
| Asia | 4,934 | 5.0% |
| Australia | 46 | 0.1% |
| Austria | 37 | 0.0% |
| Bangladesh | 152 | 0.2% |
| Barbados | 10 | 0.0% |
| Bolivia | 16 | 0.0% |
| Bosnia and Herzegovina | 53 | 0.1% |
| Brazil | 121 | 0.1% |
| Canada | 293 | 0.3% |
| Caribbean | 122 | 0.1% |
| Central America | 543 | 0.5% |
| China | 1,361 | 1.4% |
| Colombia | 64 | 0.1% |
| Congo | 17 | 0.0% |
| Costa Rica | 16 | 0.0% |
| Czechoslovakia | 9 | 0.0% |
| Dominican Republic | 11 | 0.0% |
| Eastern Africa | 51 | 0.1% |
| Eastern Asia | 2,314 | 2.3% |
| Eastern Europe | 619 | 0.6% |
| Ecuador | 19 | 0.0% |
| Egypt | 590 | 0.6% |
| El Salvador | 40 | 0.0% |
| England | 59 | 0.1% |
| Eritrea | 11 | 0.0% |
| Ethiopia | 29 | 0.0% |
| Europe | 1,345 | 1.3% |
| France | 83 | 0.1% |
| Germany | 145 | 0.2% |
| Ghana | 93 | 0.1% |
| Guatemala | 33 | 0.0% |
| Honduras | 86 | 0.1% |
| Hong Kong | 8 | 0.0% |
| Hungary | 26 | 0.0% |
| India | 1,465 | 1.5% |
| Indonesia | 5 | 0.0% |
| Iran | 172 | 0.2% |
| Iraq | 152 | 0.2% |
| Italy | 151 | 0.2% |
| Jamaica | 67 | 0.1% |
| Japan | 246 | 0.3% |
| Jordan | 43 | 0.0% |
| Kenya | 11 | 0.0% |
| Korea | 707 | 0.7% |
| Kuwait | 5 | 0.0% |
| Latin America | 1,027 | 1.0% |
| Mexico | 368 | 0.4% |
| Middle Africa | 58 | 0.1% |
| Morocco | 18 | 0.0% |
| Nepal | 46 | 0.1% |
| Netherlands | 56 | 0.1% |
| Northern Africa | 639 | 0.6% |
| Northern Europe | 175 | 0.2% |
| Norway | 18 | 0.0% |
| Oceania | 46 | 0.1% |
| Pakistan | 98 | 0.1% |
| Peru | 13 | 0.0% |
| Philippines | 172 | 0.2% |
| Poland | 86 | 0.1% |
| Romania | 33 | 0.0% |
| Russia | 28 | 0.0% |
| Saudi Arabia | 7 | 0.0% |
| Serbia | 6 | 0.0% |
| South Africa | 18 | 0.0% |
| South America | 362 | 0.4% |
| South Central Asia | 1,939 | 1.9% |
| South Eastern Asia | 339 | 0.3% |
| Southern Europe | 230 | 0.2% |
| Spain | 79 | 0.1% |
| Sweden | 56 | 0.1% |
| Taiwan | 7 | 0.0% |
| Thailand | 68 | 0.1% |
| Trinidad and Tobago | 34 | 0.0% |
| Turkey | 86 | 0.1% |
| Ukraine | 21 | 0.0% |
| Venezuela | 116 | 0.1% |
| Vietnam | 94 | 0.1% |
| Western Africa | 93 | 0.1% |
| Western Asia | 293 | 0.3% |
| Western Europe | 321 | 0.3% |
| Zaire | 22 | 0.0% | View All 85 Rows |
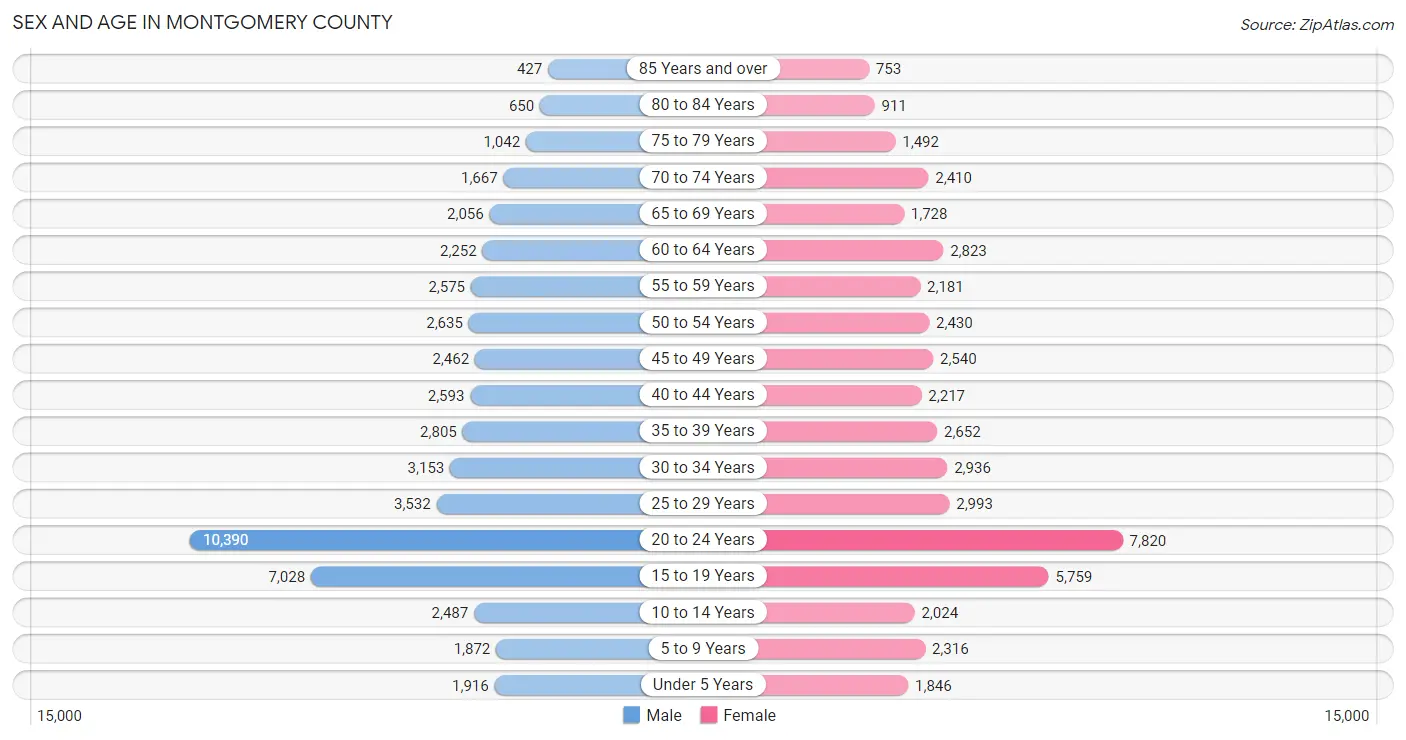
Sex and Age in Montgomery County
Sex and Age in Montgomery County
The most populous age groups in Montgomery County are 20 to 24 Years (10,390 | 20.2%) for men and 20 to 24 Years (7,820 | 16.4%) for women.
| Age Bracket | Male | Female |
| Under 5 Years | 1,916 (3.7%) | 1,846 (3.9%) |
| 5 to 9 Years | 1,872 (3.6%) | 2,316 (4.8%) |
| 10 to 14 Years | 2,487 (4.8%) | 2,024 (4.2%) |
| 15 to 19 Years | 7,028 (13.6%) | 5,759 (12.0%) |
| 20 to 24 Years | 10,390 (20.2%) | 7,820 (16.4%) |
| 25 to 29 Years | 3,532 (6.9%) | 2,993 (6.3%) |
| 30 to 34 Years | 3,153 (6.1%) | 2,936 (6.1%) |
| 35 to 39 Years | 2,805 (5.4%) | 2,652 (5.5%) |
| 40 to 44 Years | 2,593 (5.0%) | 2,217 (4.6%) |
| 45 to 49 Years | 2,462 (4.8%) | 2,540 (5.3%) |
| 50 to 54 Years | 2,635 (5.1%) | 2,430 (5.1%) |
| 55 to 59 Years | 2,575 (5.0%) | 2,181 (4.6%) |
| 60 to 64 Years | 2,252 (4.4%) | 2,823 (5.9%) |
| 65 to 69 Years | 2,056 (4.0%) | 1,728 (3.6%) |
| 70 to 74 Years | 1,667 (3.2%) | 2,410 (5.0%) |
| 75 to 79 Years | 1,042 (2.0%) | 1,492 (3.1%) |
| 80 to 84 Years | 650 (1.3%) | 911 (1.9%) |
| 85 Years and over | 427 (0.8%) | 753 (1.6%) |
| Total | 51,542 (100.0%) | 47,831 (100.0%) |
Families and Households in Montgomery County
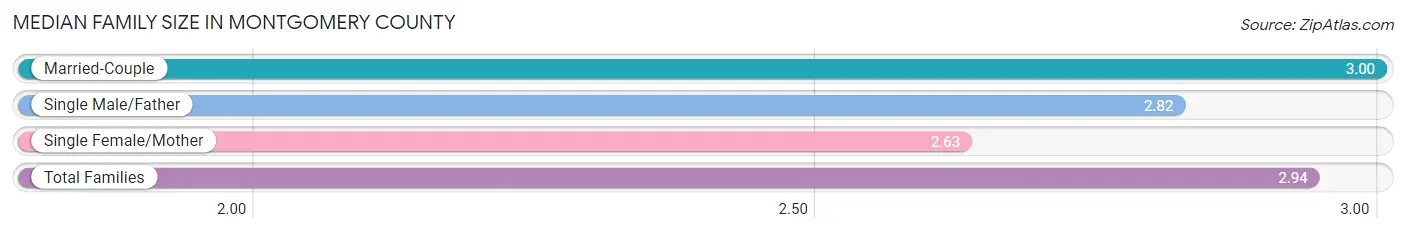
Median Family Size in Montgomery County
The median family size in Montgomery County is 2.94 persons per family, with married-couple families (15,622 | 81.5%) accounting for the largest median family size of 3 persons per family. On the other hand, single female/mother families (2,348 | 12.2%) represent the smallest median family size with 2.63 persons per family.
| Family Type | # Families | Family Size |
| Married-Couple | 15,622 (81.5%) | 3.00 |
| Single Male/Father | 1,210 (6.3%) | 2.82 |
| Single Female/Mother | 2,348 (12.2%) | 2.63 |
| Total Families | 19,180 (100.0%) | 2.94 |
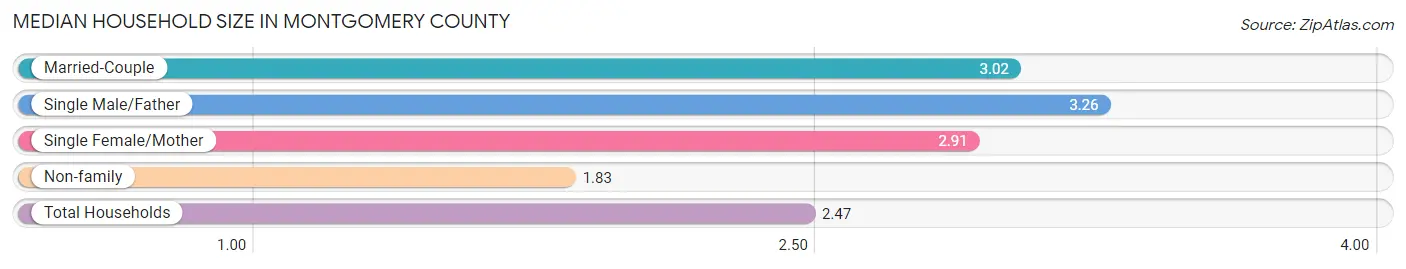
Median Household Size in Montgomery County
The median household size in Montgomery County is 2.47 persons per household, with single male/father households (1,210 | 3.4%) accounting for the largest median household size of 3.26 persons per household. non-family households (16,882 | 46.8%) represent the smallest median household size with 1.83 persons per household.
| Household Type | # Households | Household Size |
| Married-Couple | 15,622 (43.3%) | 3.02 |
| Single Male/Father | 1,210 (3.4%) | 3.26 |
| Single Female/Mother | 2,348 (6.5%) | 2.91 |
| Non-family | 16,882 (46.8%) | 1.83 |
| Total Households | 36,062 (100.0%) | 2.47 |
Household Size by Marriage Status in Montgomery County
Out of a total of 36,062 households in Montgomery County, 19,180 (53.2%) are family households, while 16,882 (46.8%) are nonfamily households. The most numerous type of family households are 2-person households, comprising 9,488, and the most common type of nonfamily households are 1-person households, comprising 10,582.
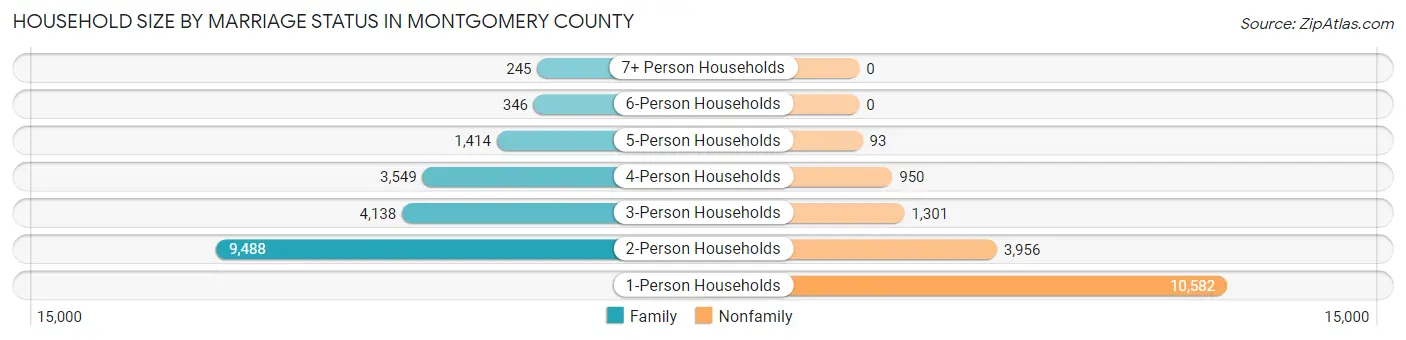
| Household Size | Family Households | Nonfamily Households |
| 1-Person Households | - | 10,582 (29.3%) |
| 2-Person Households | 9,488 (26.3%) | 3,956 (11.0%) |
| 3-Person Households | 4,138 (11.5%) | 1,301 (3.6%) |
| 4-Person Households | 3,549 (9.8%) | 950 (2.6%) |
| 5-Person Households | 1,414 (3.9%) | 93 (0.3%) |
| 6-Person Households | 346 (1.0%) | 0 (0.0%) |
| 7+ Person Households | 245 (0.7%) | 0 (0.0%) |
| Total | 19,180 (53.2%) | 16,882 (46.8%) |
Female Fertility in Montgomery County
Fertility by Age in Montgomery County
Average fertility rate in Montgomery County is 20.0 births per 1,000 women. Women in the age bracket of 20 to 34 years have the highest fertility rate with 29.0 births per 1,000 women. Women in the age bracket of 20 to 34 years acount for 70.2% of all women with births.
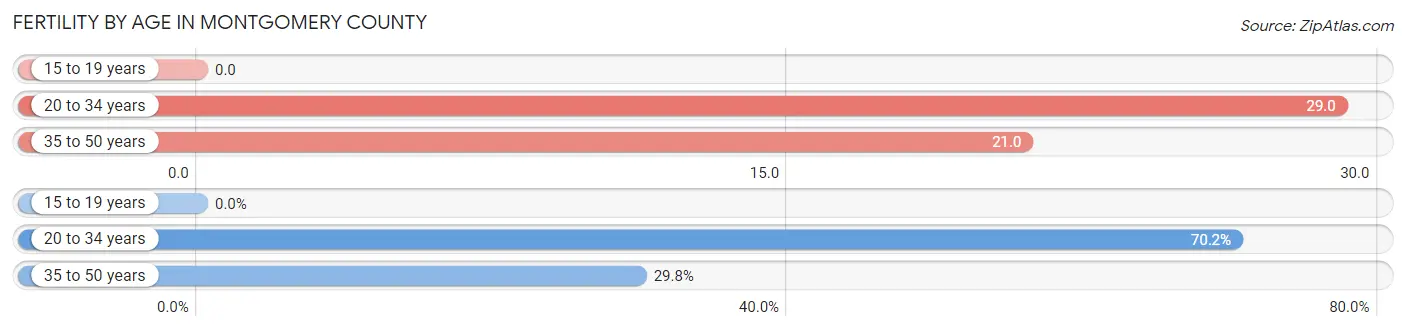
| Age Bracket | Women with Births | Births / 1,000 Women |
| 15 to 19 years | 0 (0.0%) | 0.0 |
| 20 to 34 years | 394 (70.2%) | 29.0 |
| 35 to 50 years | 167 (29.8%) | 21.0 |
| Total | 561 (100.0%) | 20.0 |
Fertility by Age by Marriage Status in Montgomery County
84.8% of women with births (561) in Montgomery County are married. The highest percentage of unmarried women with births falls into 20 to 34 years age bracket with 21.6% of them unmarried at the time of birth, while the lowest percentage of unmarried women with births belong to 35 to 50 years age bracket with 0.0% of them unmarried.
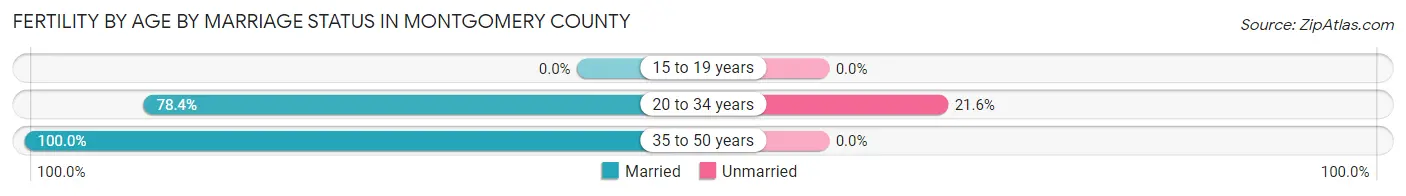
| Age Bracket | Married | Unmarried |
| 15 to 19 years | 0 (0.0%) | 0 (0.0%) |
| 20 to 34 years | 309 (78.4%) | 85 (21.6%) |
| 35 to 50 years | 167 (100.0%) | 0 (0.0%) |
| Total | 476 (84.9%) | 85 (15.1%) |
Fertility by Education in Montgomery County
Average fertility rate in Montgomery County is 20.0 births per 1,000 women. Women with the education attainment of graduate degree have the highest fertility rate of 44.0 births per 1,000 women, while women with the education attainment of less than high school have the lowest fertility at 5.0 births per 1,000 women. Women with the education attainment of graduate degree represent 31.9% of all women with births.
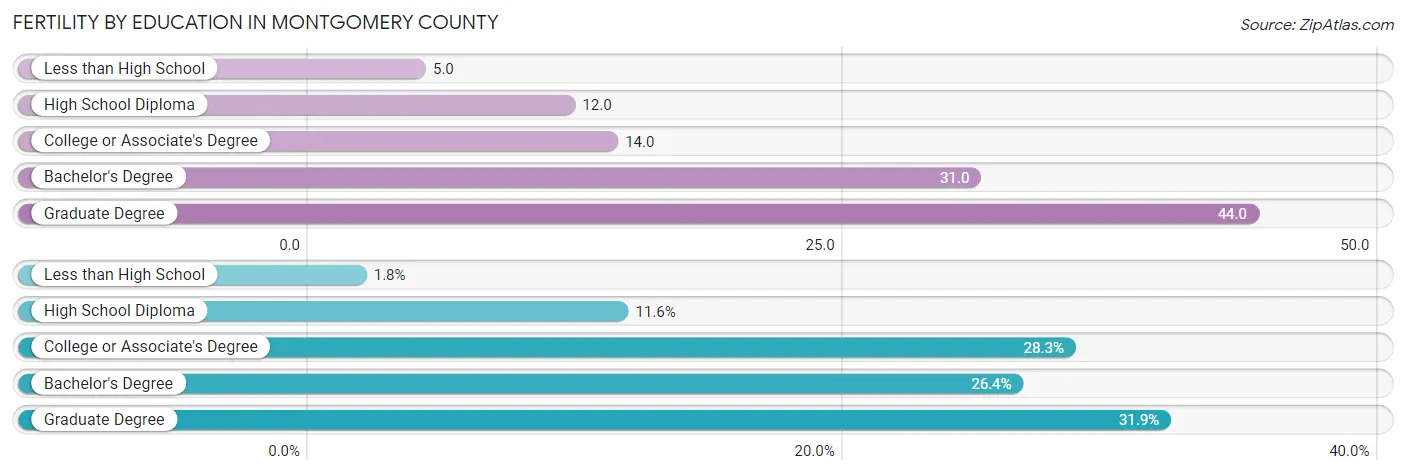
| Educational Attainment | Women with Births | Births / 1,000 Women |
| Less than High School | 10 (1.8%) | 5.0 |
| High School Diploma | 65 (11.6%) | 12.0 |
| College or Associate's Degree | 159 (28.3%) | 14.0 |
| Bachelor's Degree | 148 (26.4%) | 31.0 |
| Graduate Degree | 179 (31.9%) | 44.0 |
| Total | 561 (100.0%) | 20.0 |
Fertility by Education by Marriage Status in Montgomery County
15.1% of women with births in Montgomery County are unmarried. Women with the educational attainment of graduate degree are most likely to be married with 100.0% of them married at childbirth, while women with the educational attainment of less than high school are least likely to be married with 100.0% of them unmarried at childbirth.
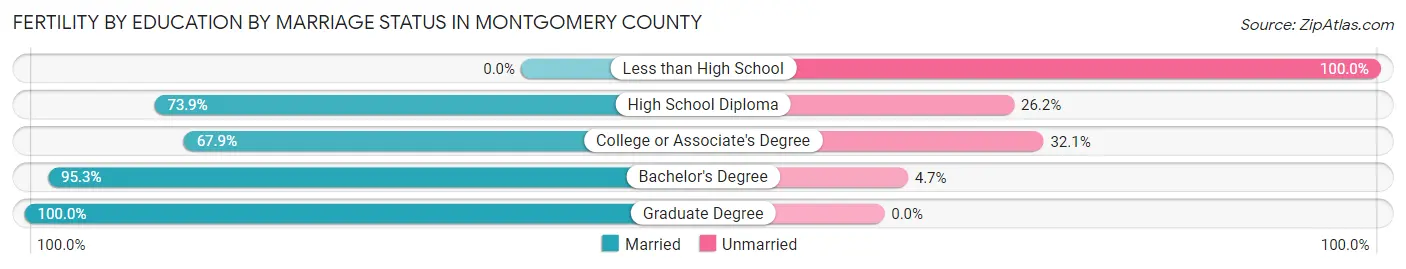
| Educational Attainment | Married | Unmarried |
| Less than High School | 0 (0.0%) | 10 (100.0%) |
| High School Diploma | 48 (73.9%) | 17 (26.2%) |
| College or Associate's Degree | 108 (67.9%) | 51 (32.1%) |
| Bachelor's Degree | 141 (95.3%) | 7 (4.7%) |
| Graduate Degree | 179 (100.0%) | 0 (0.0%) |
| Total | 476 (84.9%) | 85 (15.1%) |
Employment Characteristics in Montgomery County
Employment by Class of Employer in Montgomery County
Among the 45,188 employed individuals in Montgomery County, private company employees (25,267 | 55.9%), state government employees (8,778 | 19.4%), and not-for-profit organizations (4,229 | 9.4%) make up the most common classes of employment.
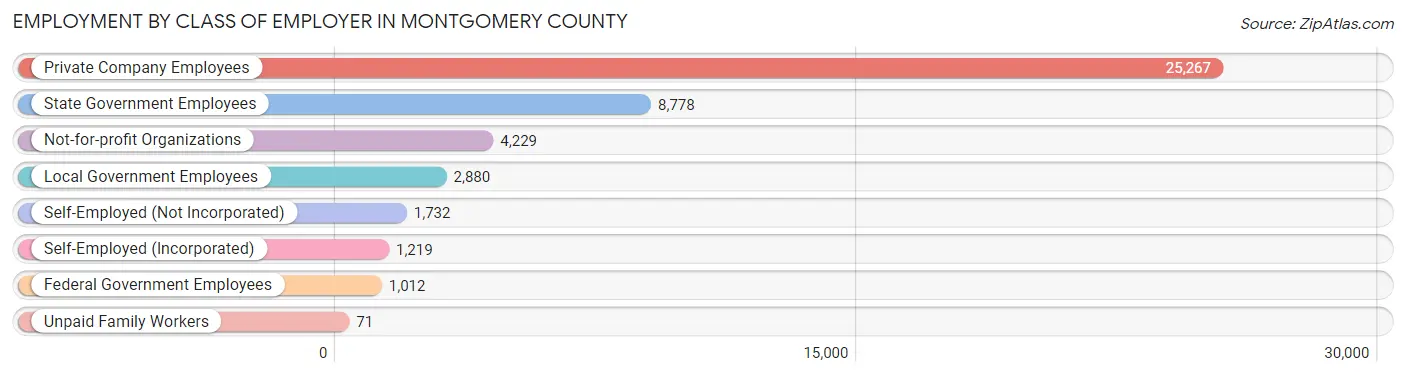
| Employer Class | # Employees | % Employees |
| Private Company Employees | 25,267 | 55.9% |
| Self-Employed (Incorporated) | 1,219 | 2.7% |
| Self-Employed (Not Incorporated) | 1,732 | 3.8% |
| Not-for-profit Organizations | 4,229 | 9.4% |
| Local Government Employees | 2,880 | 6.4% |
| State Government Employees | 8,778 | 19.4% |
| Federal Government Employees | 1,012 | 2.2% |
| Unpaid Family Workers | 71 | 0.2% |
| Total | 45,188 | 100.0% |
Employment Status by Age in Montgomery County
According to the labor force statistics for Montgomery County, out of the total population over 16 years of age (86,168), 55.9% or 48,168 individuals are in the labor force, with 3.3% or 1,590 of them unemployed. The age group with the highest labor force participation rate is 30 to 34 years, with 84.1% or 5,121 individuals in the labor force. Within the labor force, the 20 to 24 years age range has the highest percentage of unemployed individuals, with 7.3% or 598 of them being unemployed.
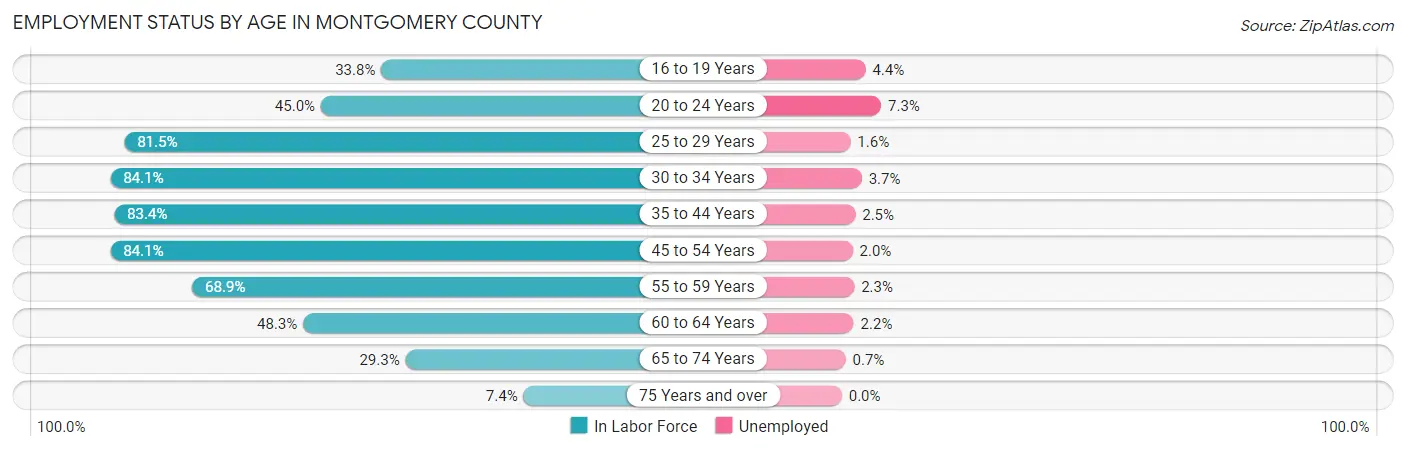
| Age Bracket | In Labor Force | Unemployed |
| 16 to 19 Years | 4,071 (33.8%) | 179 (4.4%) |
| 20 to 24 Years | 8,194 (45.0%) | 598 (7.3%) |
| 25 to 29 Years | 5,318 (81.5%) | 85 (1.6%) |
| 30 to 34 Years | 5,121 (84.1%) | 189 (3.7%) |
| 35 to 44 Years | 8,563 (83.4%) | 214 (2.5%) |
| 45 to 54 Years | 8,466 (84.1%) | 169 (2.0%) |
| 55 to 59 Years | 3,277 (68.9%) | 75 (2.3%) |
| 60 to 64 Years | 2,451 (48.3%) | 54 (2.2%) |
| 65 to 74 Years | 2,303 (29.3%) | 16 (0.7%) |
| 75 Years and over | 390 (7.4%) | 0 (0.0%) |
| Total | 48,168 (55.9%) | 1,590 (3.3%) |
Employment Status by Educational Attainment in Montgomery County
According to labor force statistics for Montgomery County, 77.6% of individuals (33,197) out of the total population between 25 and 64 years of age (42,779) are in the labor force, with 2.4% or 797 of them being unemployed. The group with the highest labor force participation rate are those with the educational attainment of bachelor's degree or higher, with 86.6% or 17,635 individuals in the labor force. Within the labor force, individuals with less than high school education have the highest percentage of unemployment, with 18.2% or 161 of them being unemployed.
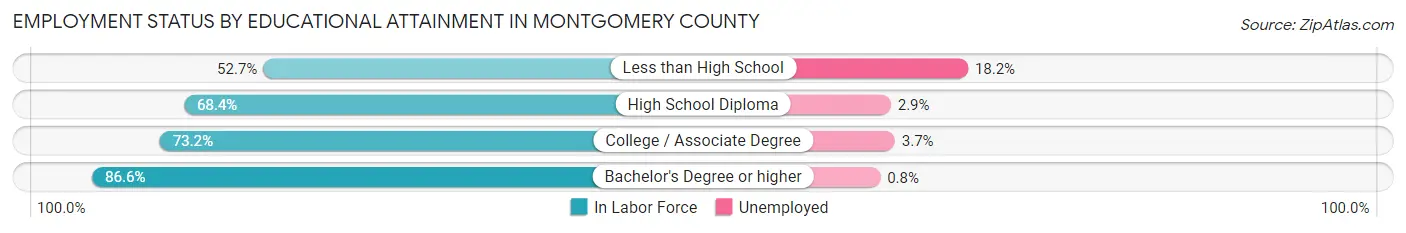
| Educational Attainment | In Labor Force | Unemployed |
| Less than High School | 882 (52.7%) | 305 (18.2%) |
| High School Diploma | 6,981 (68.4%) | 296 (2.9%) |
| College / Associate Degree | 7,712 (73.2%) | 390 (3.7%) |
| Bachelor's Degree or higher | 17,635 (86.6%) | 163 (0.8%) |
| Total | 33,197 (77.6%) | 1,027 (2.4%) |
Employment Occupations by Sex in Montgomery County
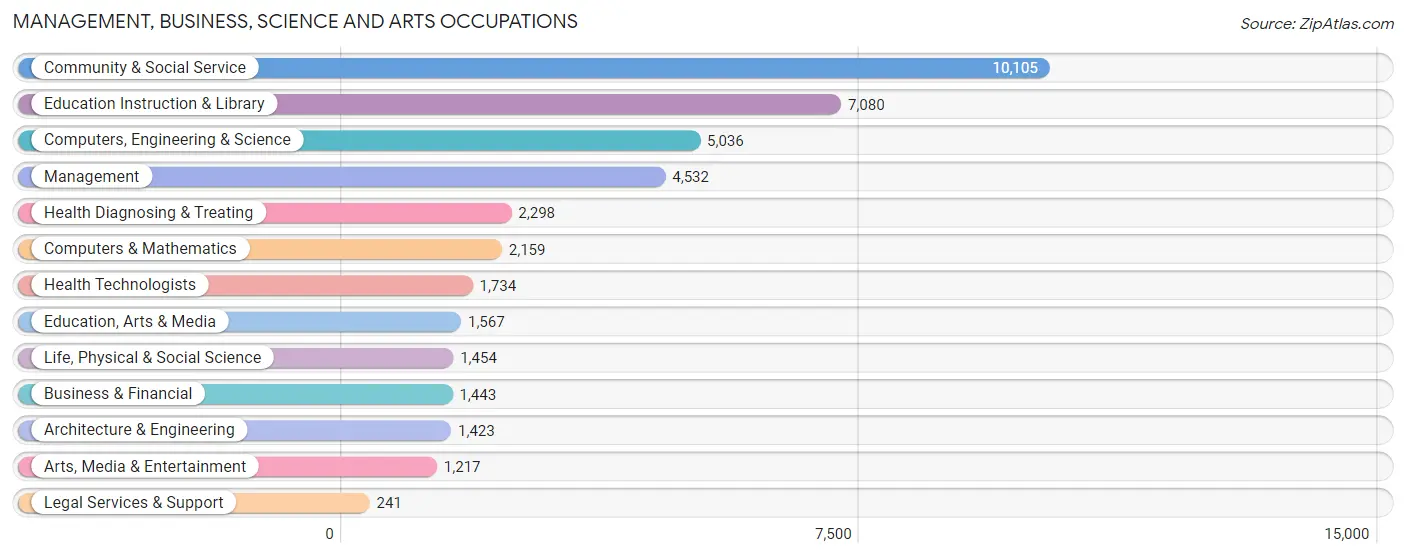
Management, Business, Science and Arts Occupations
The most common Management, Business, Science and Arts occupations in Montgomery County are Community & Social Service (10,105 | 21.8%), Education Instruction & Library (7,080 | 15.3%), Computers, Engineering & Science (5,036 | 10.8%), Management (4,532 | 9.8%), and Health Diagnosing & Treating (2,298 | 5.0%).
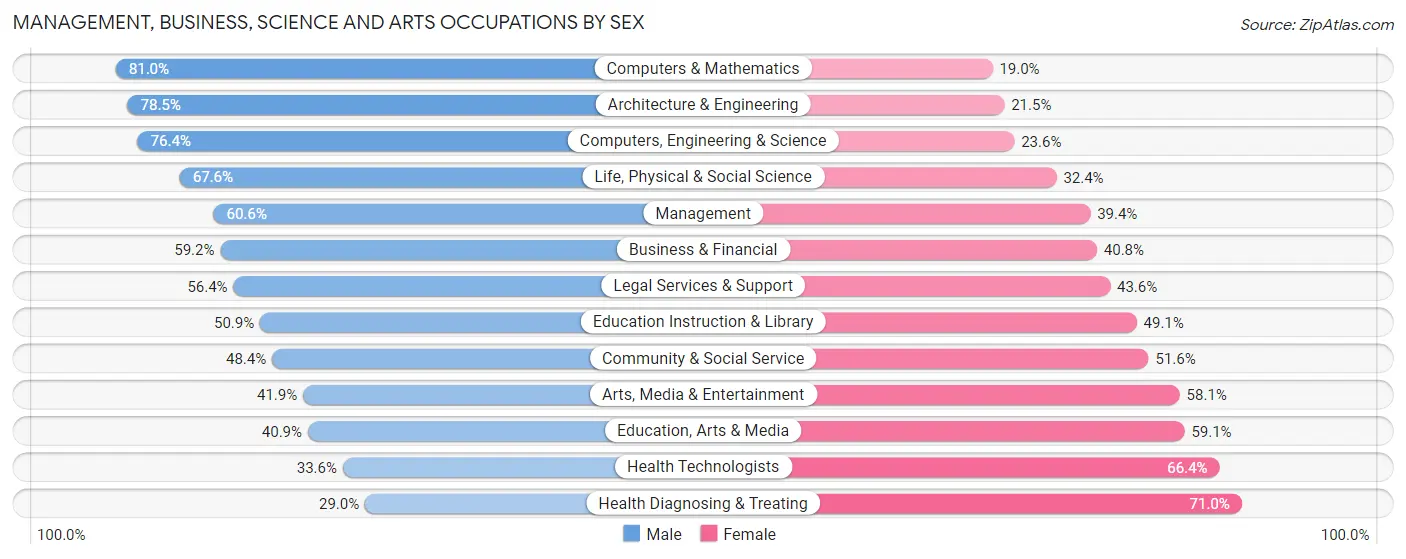
Management, Business, Science and Arts Occupations by Sex
Within the Management, Business, Science and Arts occupations in Montgomery County, the most male-oriented occupations are Computers & Mathematics (81.0%), Architecture & Engineering (78.5%), and Computers, Engineering & Science (76.4%), while the most female-oriented occupations are Health Diagnosing & Treating (71.0%), Health Technologists (66.4%), and Education, Arts & Media (59.1%).
| Occupation | Male | Female |
| Management | 2,745 (60.6%) | 1,787 (39.4%) |
| Business & Financial | 854 (59.2%) | 589 (40.8%) |
| Computers, Engineering & Science | 3,848 (76.4%) | 1,188 (23.6%) |
| Computers & Mathematics | 1,748 (81.0%) | 411 (19.0%) |
| Architecture & Engineering | 1,117 (78.5%) | 306 (21.5%) |
| Life, Physical & Social Science | 983 (67.6%) | 471 (32.4%) |
| Community & Social Service | 4,890 (48.4%) | 5,215 (51.6%) |
| Education, Arts & Media | 641 (40.9%) | 926 (59.1%) |
| Legal Services & Support | 136 (56.4%) | 105 (43.6%) |
| Education Instruction & Library | 3,603 (50.9%) | 3,477 (49.1%) |
| Arts, Media & Entertainment | 510 (41.9%) | 707 (58.1%) |
| Health Diagnosing & Treating | 666 (29.0%) | 1,632 (71.0%) |
| Health Technologists | 583 (33.6%) | 1,151 (66.4%) |
| Total (Category) | 13,003 (55.5%) | 10,411 (44.5%) |
| Total (Overall) | 26,093 (56.2%) | 20,311 (43.8%) |
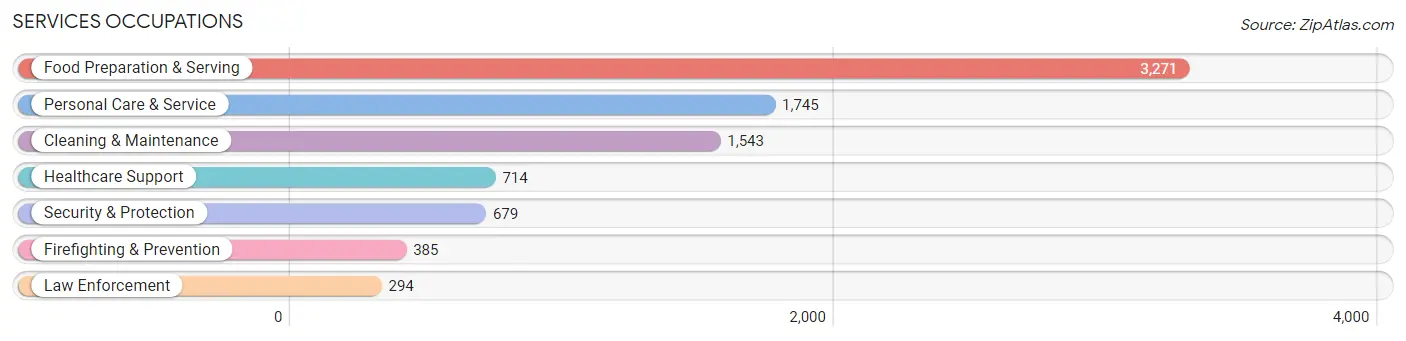
Services Occupations
The most common Services occupations in Montgomery County are Food Preparation & Serving (3,271 | 7.0%), Personal Care & Service (1,745 | 3.8%), Cleaning & Maintenance (1,543 | 3.3%), Healthcare Support (714 | 1.5%), and Security & Protection (679 | 1.5%).
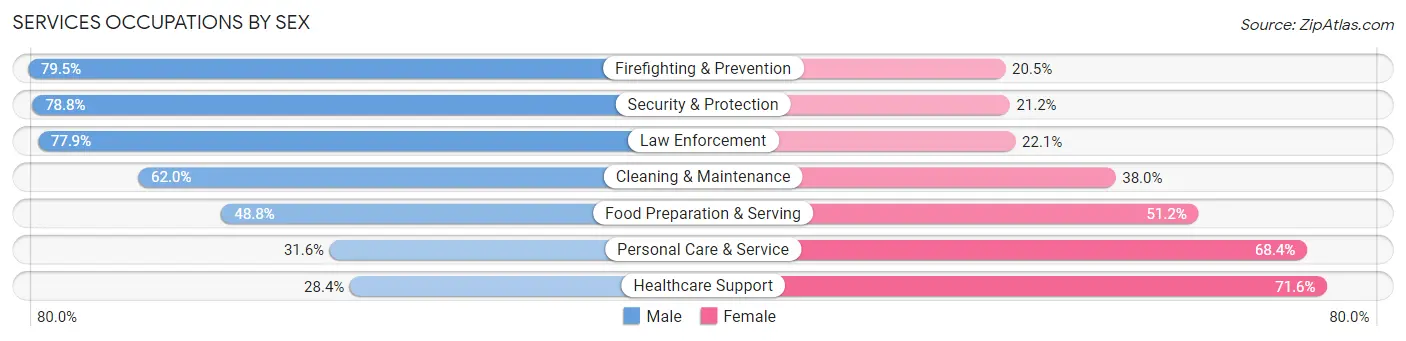
Services Occupations by Sex
Within the Services occupations in Montgomery County, the most male-oriented occupations are Firefighting & Prevention (79.5%), Security & Protection (78.8%), and Law Enforcement (77.9%), while the most female-oriented occupations are Healthcare Support (71.6%), Personal Care & Service (68.4%), and Food Preparation & Serving (51.2%).
| Occupation | Male | Female |
| Healthcare Support | 203 (28.4%) | 511 (71.6%) |
| Security & Protection | 535 (78.8%) | 144 (21.2%) |
| Firefighting & Prevention | 306 (79.5%) | 79 (20.5%) |
| Law Enforcement | 229 (77.9%) | 65 (22.1%) |
| Food Preparation & Serving | 1,597 (48.8%) | 1,674 (51.2%) |
| Cleaning & Maintenance | 957 (62.0%) | 586 (38.0%) |
| Personal Care & Service | 552 (31.6%) | 1,193 (68.4%) |
| Total (Category) | 3,844 (48.3%) | 4,108 (51.7%) |
| Total (Overall) | 26,093 (56.2%) | 20,311 (43.8%) |
Sales and Office Occupations
The most common Sales and Office occupations in Montgomery County are Sales & Related (4,244 | 9.1%), and Office & Administration (3,766 | 8.1%).
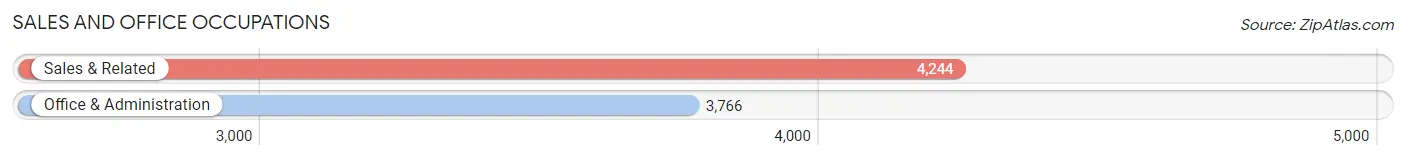
Sales and Office Occupations by Sex
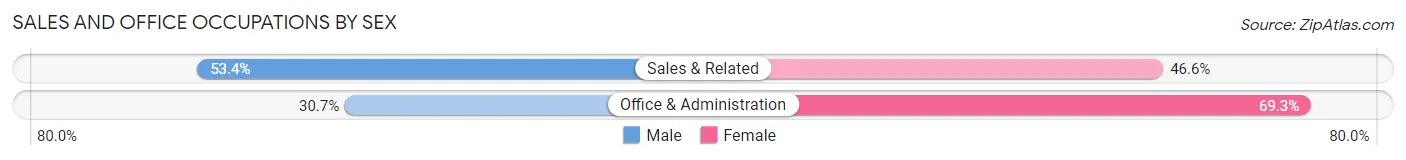
| Occupation | Male | Female |
| Sales & Related | 2,268 (53.4%) | 1,976 (46.6%) |
| Office & Administration | 1,156 (30.7%) | 2,610 (69.3%) |
| Total (Category) | 3,424 (42.7%) | 4,586 (57.3%) |
| Total (Overall) | 26,093 (56.2%) | 20,311 (43.8%) |
Natural Resources, Construction and Maintenance Occupations
The most common Natural Resources, Construction and Maintenance occupations in Montgomery County are Installation, Maintenance & Repair (1,340 | 2.9%), Construction & Extraction (1,304 | 2.8%), and Farming, Fishing & Forestry (143 | 0.3%).
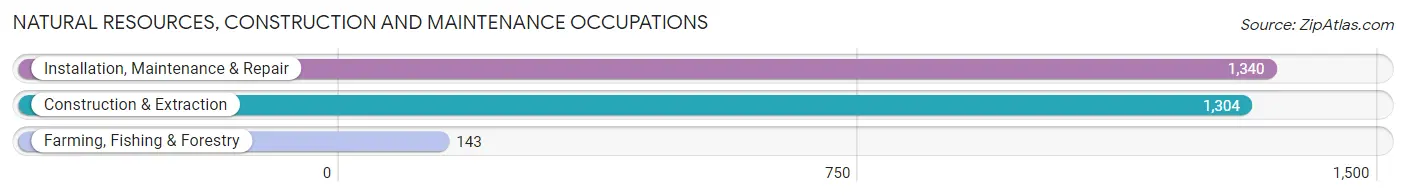
Natural Resources, Construction and Maintenance Occupations by Sex
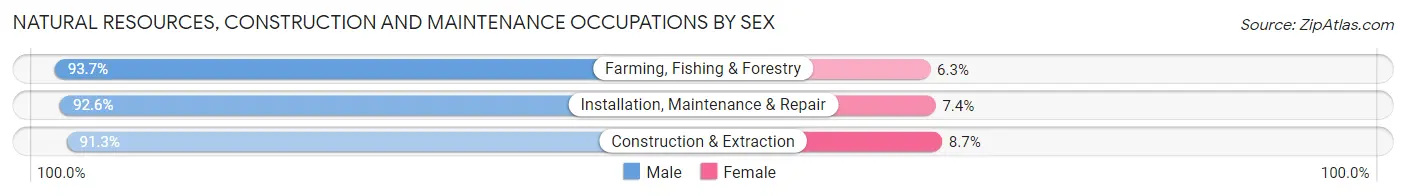
| Occupation | Male | Female |
| Farming, Fishing & Forestry | 134 (93.7%) | 9 (6.3%) |
| Construction & Extraction | 1,190 (91.3%) | 114 (8.7%) |
| Installation, Maintenance & Repair | 1,241 (92.6%) | 99 (7.4%) |
| Total (Category) | 2,565 (92.0%) | 222 (8.0%) |
| Total (Overall) | 26,093 (56.2%) | 20,311 (43.8%) |
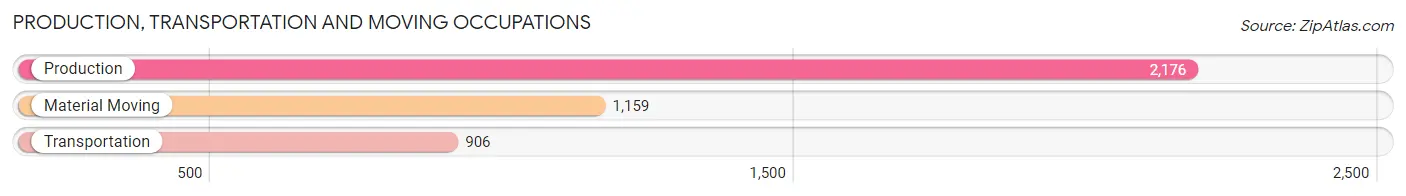
Production, Transportation and Moving Occupations
The most common Production, Transportation and Moving occupations in Montgomery County are Production (2,176 | 4.7%), Material Moving (1,159 | 2.5%), and Transportation (906 | 1.9%).
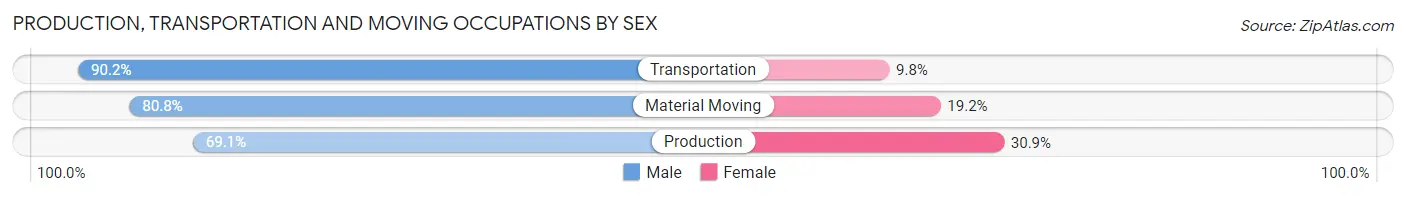
Production, Transportation and Moving Occupations by Sex
| Occupation | Male | Female |
| Production | 1,504 (69.1%) | 672 (30.9%) |
| Transportation | 817 (90.2%) | 89 (9.8%) |
| Material Moving | 936 (80.8%) | 223 (19.2%) |
| Total (Category) | 3,257 (76.8%) | 984 (23.2%) |
| Total (Overall) | 26,093 (56.2%) | 20,311 (43.8%) |
Employment Industries by Sex in Montgomery County
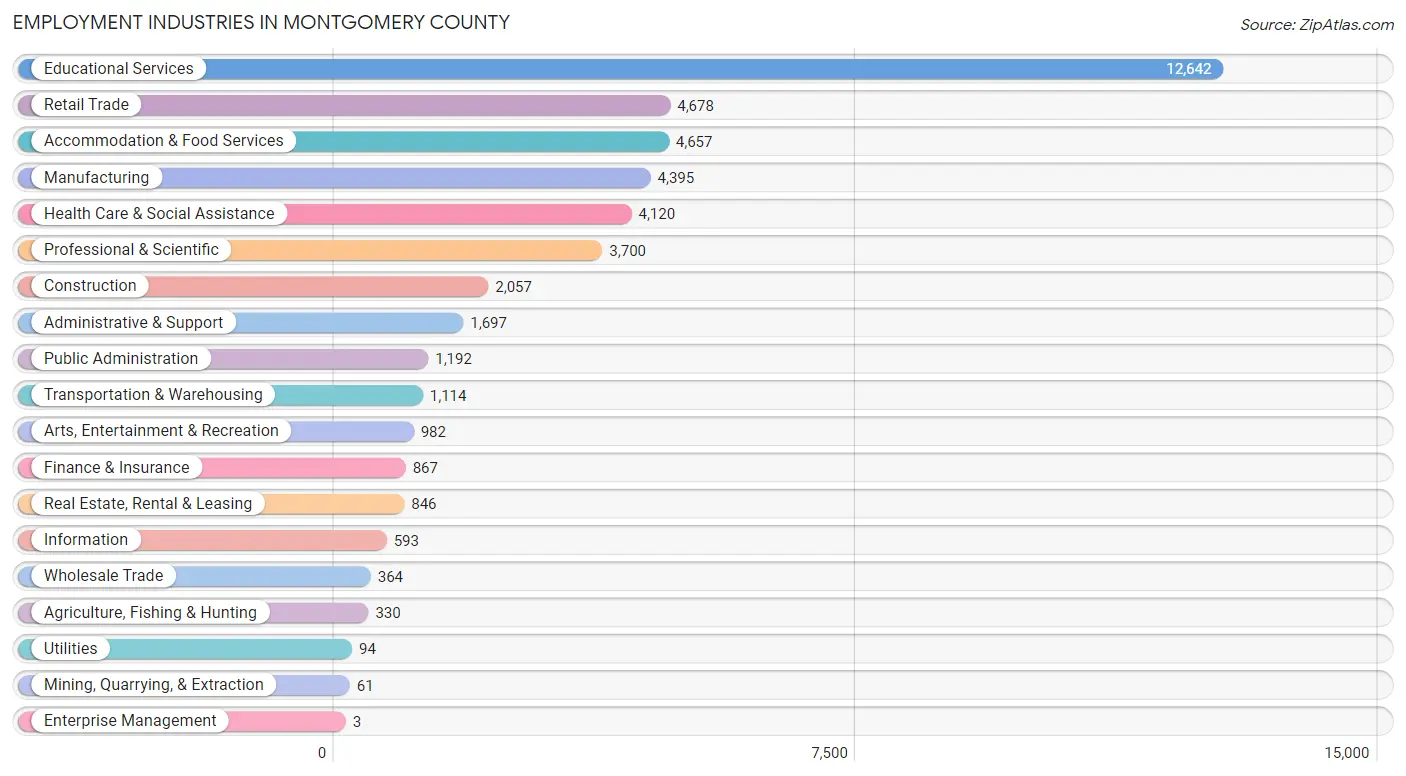
Employment Industries in Montgomery County
The major employment industries in Montgomery County include Educational Services (12,642 | 27.2%), Retail Trade (4,678 | 10.1%), Accommodation & Food Services (4,657 | 10.0%), Manufacturing (4,395 | 9.5%), and Health Care & Social Assistance (4,120 | 8.9%).
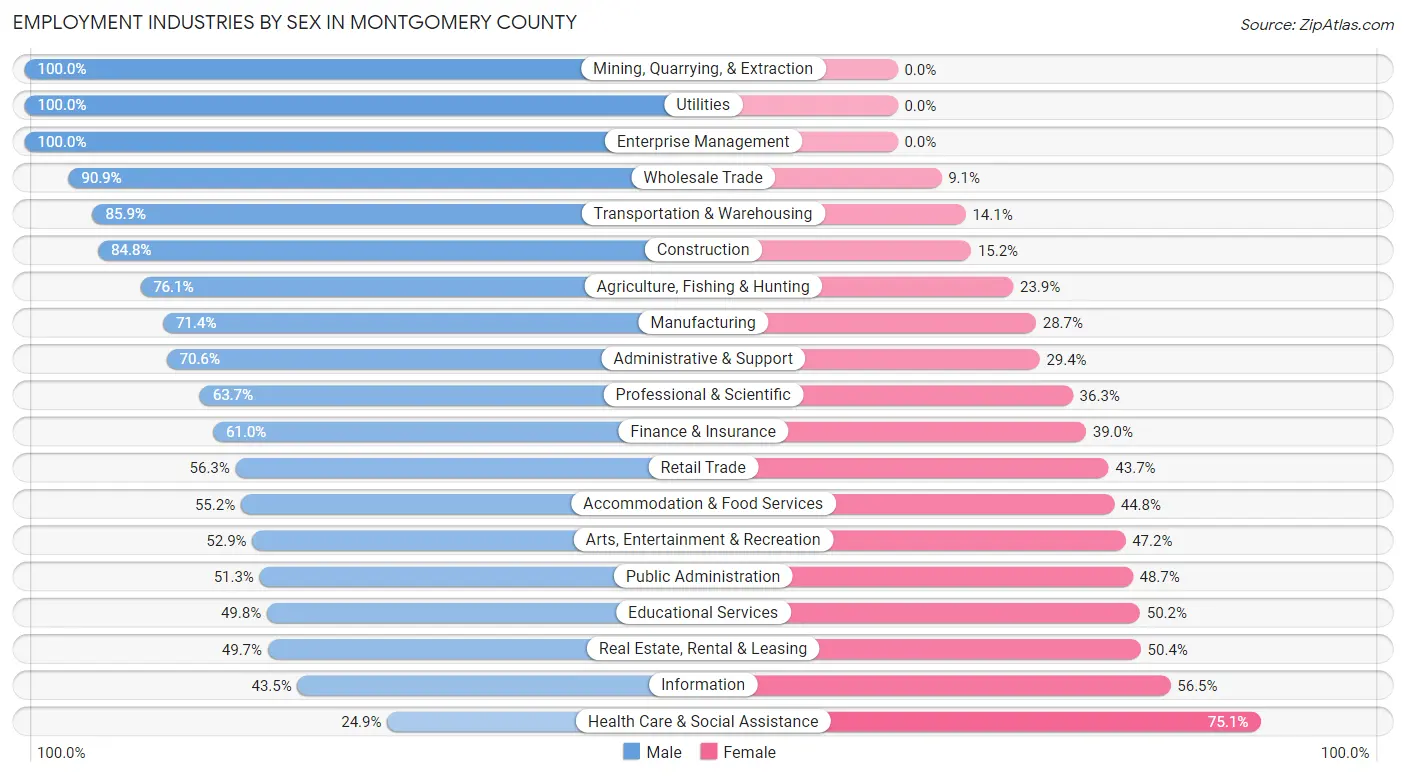
Employment Industries by Sex in Montgomery County
The Montgomery County industries that see more men than women are Mining, Quarrying, & Extraction (100.0%), Utilities (100.0%), and Enterprise Management (100.0%), whereas the industries that tend to have a higher number of women are Health Care & Social Assistance (75.1%), Information (56.5%), and Real Estate, Rental & Leasing (50.3%).
| Industry | Male | Female |
| Agriculture, Fishing & Hunting | 251 (76.1%) | 79 (23.9%) |
| Mining, Quarrying, & Extraction | 61 (100.0%) | 0 (0.0%) |
| Construction | 1,744 (84.8%) | 313 (15.2%) |
| Manufacturing | 3,136 (71.4%) | 1,259 (28.6%) |
| Wholesale Trade | 331 (90.9%) | 33 (9.1%) |
| Retail Trade | 2,635 (56.3%) | 2,043 (43.7%) |
| Transportation & Warehousing | 957 (85.9%) | 157 (14.1%) |
| Utilities | 94 (100.0%) | 0 (0.0%) |
| Information | 258 (43.5%) | 335 (56.5%) |
| Finance & Insurance | 529 (61.0%) | 338 (39.0%) |
| Real Estate, Rental & Leasing | 420 (49.6%) | 426 (50.3%) |
| Professional & Scientific | 2,358 (63.7%) | 1,342 (36.3%) |
| Enterprise Management | 3 (100.0%) | 0 (0.0%) |
| Administrative & Support | 1,198 (70.6%) | 499 (29.4%) |
| Educational Services | 6,299 (49.8%) | 6,343 (50.2%) |
| Health Care & Social Assistance | 1,027 (24.9%) | 3,093 (75.1%) |
| Arts, Entertainment & Recreation | 519 (52.8%) | 463 (47.1%) |
| Accommodation & Food Services | 2,571 (55.2%) | 2,086 (44.8%) |
| Public Administration | 612 (51.3%) | 580 (48.7%) |
| Total | 26,093 (56.2%) | 20,311 (43.8%) |
Education in Montgomery County
School Enrollment in Montgomery County
The most common levels of schooling among the 41,282 students in Montgomery County are college / undergraduate (25,533 | 61.9%), graduate / professional (3,986 | 9.7%), and elementary school (3,554 | 8.6%).
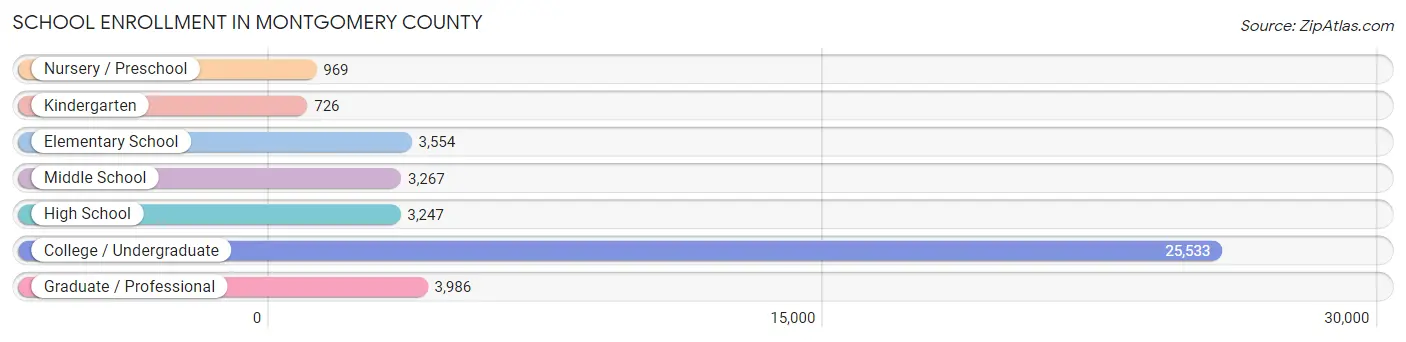
| School Level | # Students | % Students |
| Nursery / Preschool | 969 | 2.4% |
| Kindergarten | 726 | 1.8% |
| Elementary School | 3,554 | 8.6% |
| Middle School | 3,267 | 7.9% |
| High School | 3,247 | 7.9% |
| College / Undergraduate | 25,533 | 61.9% |
| Graduate / Professional | 3,986 | 9.7% |
| Total | 41,282 | 100.0% |
School Enrollment by Age by Funding Source in Montgomery County
Out of a total of 41,282 students who are enrolled in schools in Montgomery County, 2,436 (5.9%) attend a private institution, while the remaining 38,846 (94.1%) are enrolled in public schools. The age group of 3 to 4 year olds has the highest likelihood of being enrolled in private schools, with 318 (40.3% in the age bracket) enrolled. Conversely, the age group of 18 to 19 year olds has the lowest likelihood of being enrolled in a private school, with 9,702 (98.5% in the age bracket) attending a public institution.
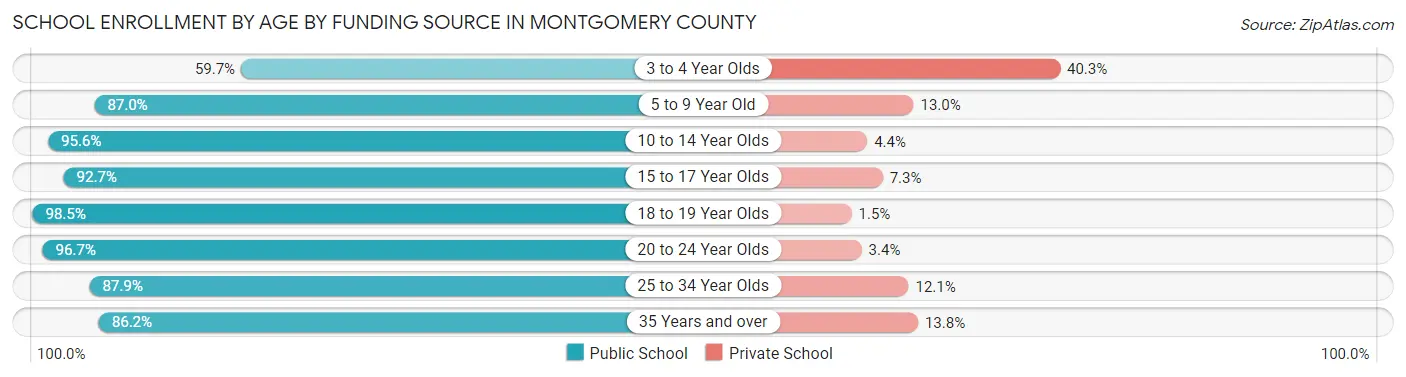
| Age Bracket | Public School | Private School |
| 3 to 4 Year Olds | 471 (59.7%) | 318 (40.3%) |
| 5 to 9 Year Old | 3,439 (87.0%) | 515 (13.0%) |
| 10 to 14 Year Olds | 4,156 (95.6%) | 191 (4.4%) |
| 15 to 17 Year Olds | 2,321 (92.7%) | 182 (7.3%) |
| 18 to 19 Year Olds | 9,702 (98.5%) | 146 (1.5%) |
| 20 to 24 Year Olds | 14,597 (96.7%) | 506 (3.4%) |
| 25 to 34 Year Olds | 2,952 (87.9%) | 406 (12.1%) |
| 35 Years and over | 1,189 (86.2%) | 191 (13.8%) |
| Total | 38,846 (94.1%) | 2,436 (5.9%) |
Educational Attainment by Field of Study in Montgomery County
Engineering (3,807 | 13.6%), business (3,308 | 11.8%), bio, nature & agricultural (2,805 | 10.0%), education (2,551 | 9.1%), and science & technology (2,030 | 7.2%) are the most common fields of study among 28,064 individuals in Montgomery County who have obtained a bachelor's degree or higher.
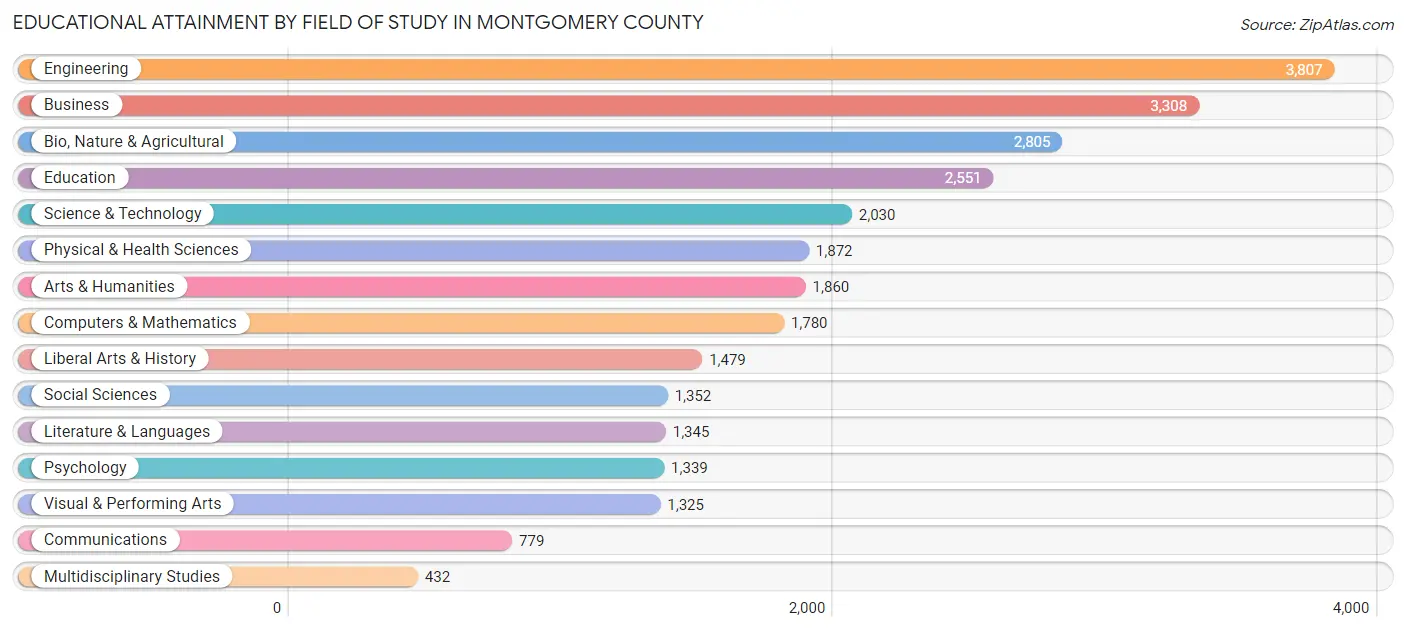
| Field of Study | # Graduates | % Graduates |
| Computers & Mathematics | 1,780 | 6.3% |
| Bio, Nature & Agricultural | 2,805 | 10.0% |
| Physical & Health Sciences | 1,872 | 6.7% |
| Psychology | 1,339 | 4.8% |
| Social Sciences | 1,352 | 4.8% |
| Engineering | 3,807 | 13.6% |
| Multidisciplinary Studies | 432 | 1.5% |
| Science & Technology | 2,030 | 7.2% |
| Business | 3,308 | 11.8% |
| Education | 2,551 | 9.1% |
| Literature & Languages | 1,345 | 4.8% |
| Liberal Arts & History | 1,479 | 5.3% |
| Visual & Performing Arts | 1,325 | 4.7% |
| Communications | 779 | 2.8% |
| Arts & Humanities | 1,860 | 6.6% |
| Total | 28,064 | 100.0% |
Transportation & Commute in Montgomery County
Vehicle Availability by Sex in Montgomery County
The most prevalent vehicle ownership categories in Montgomery County are males with 2 vehicles (9,977, accounting for 43.6%) and females with 2 vehicles (8,245, making up 52.0%).
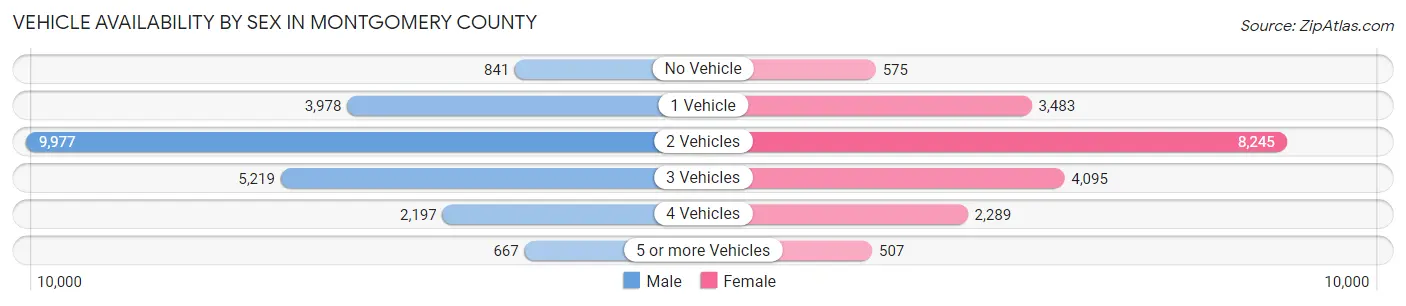
| Vehicles Available | Male | Female |
| No Vehicle | 841 (3.7%) | 575 (3.0%) |
| 1 Vehicle | 3,978 (17.4%) | 3,483 (18.1%) |
| 2 Vehicles | 9,977 (43.6%) | 8,245 (43.0%) |
| 3 Vehicles | 5,219 (22.8%) | 4,095 (21.3%) |
| 4 Vehicles | 2,197 (9.6%) | 2,289 (11.9%) |
| 5 or more Vehicles | 667 (2.9%) | 507 (2.6%) |
| Total | 22,879 (100.0%) | 19,194 (100.0%) |
Commute Time in Montgomery County
The most frequently occuring commute durations in Montgomery County are 10 to 14 minutes (9,854 commuters, 24.2%), 15 to 19 minutes (8,762 commuters, 21.6%), and 5 to 9 minutes (6,442 commuters, 15.9%).
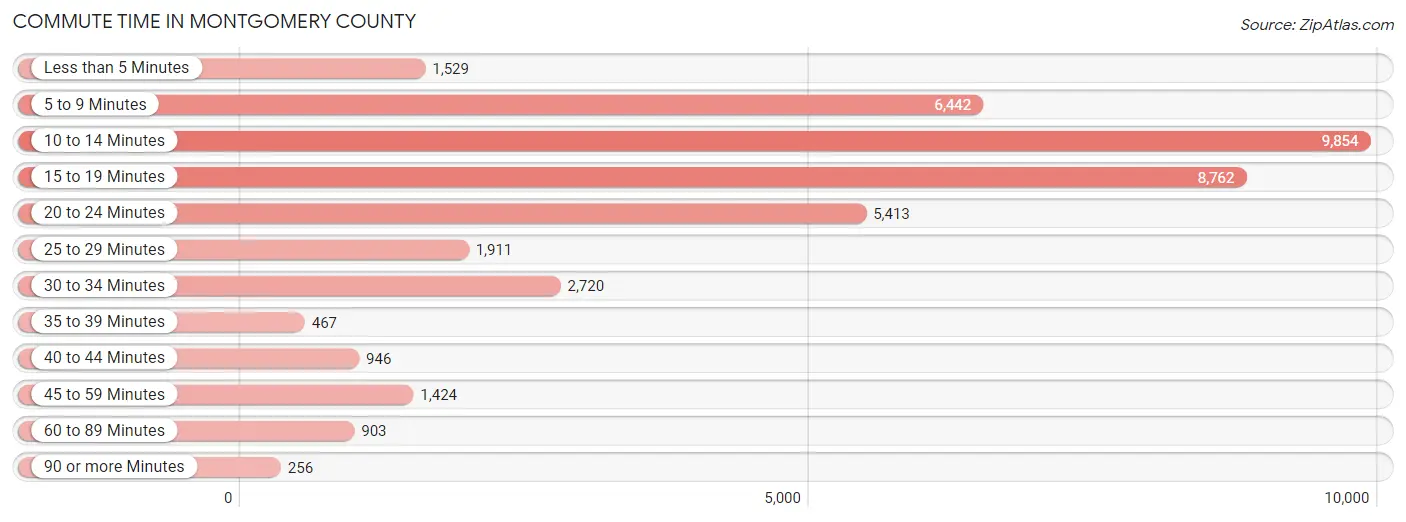
| Commute Time | # Commuters | % Commuters |
| Less than 5 Minutes | 1,529 | 3.8% |
| 5 to 9 Minutes | 6,442 | 15.9% |
| 10 to 14 Minutes | 9,854 | 24.2% |
| 15 to 19 Minutes | 8,762 | 21.6% |
| 20 to 24 Minutes | 5,413 | 13.3% |
| 25 to 29 Minutes | 1,911 | 4.7% |
| 30 to 34 Minutes | 2,720 | 6.7% |
| 35 to 39 Minutes | 467 | 1.1% |
| 40 to 44 Minutes | 946 | 2.3% |
| 45 to 59 Minutes | 1,424 | 3.5% |
| 60 to 89 Minutes | 903 | 2.2% |
| 90 or more Minutes | 256 | 0.6% |
Commute Time by Sex in Montgomery County
The most common commute times in Montgomery County are 10 to 14 minutes (5,413 commuters, 23.8%) for males and 10 to 14 minutes (4,441 commuters, 24.8%) for females.
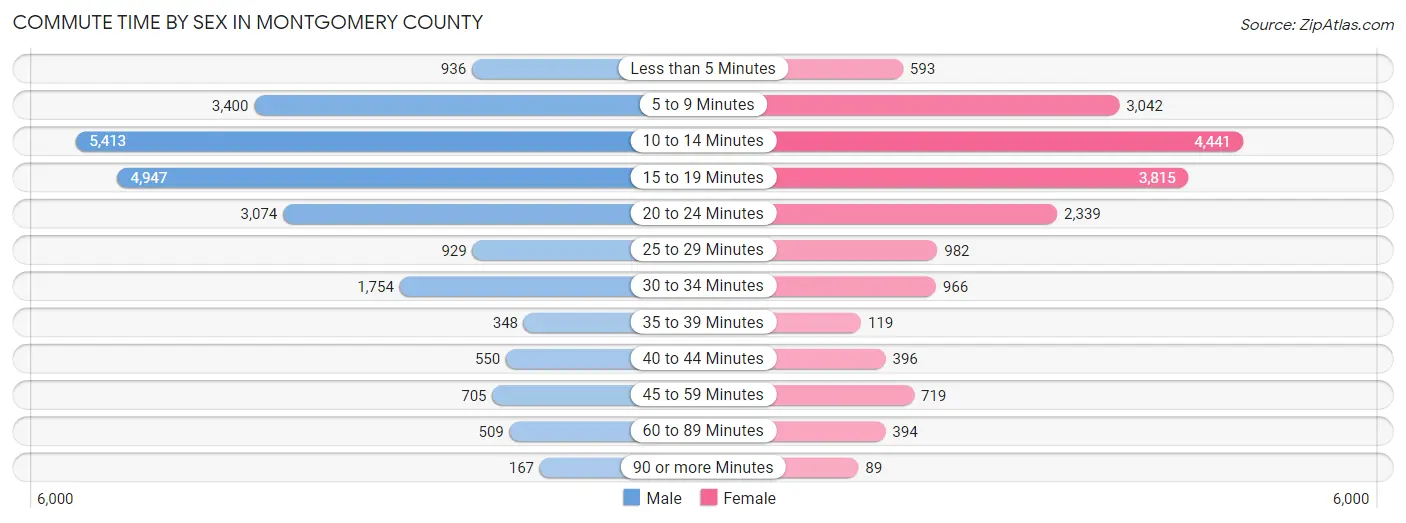
| Commute Time | Male | Female |
| Less than 5 Minutes | 936 (4.1%) | 593 (3.3%) |
| 5 to 9 Minutes | 3,400 (15.0%) | 3,042 (17.0%) |
| 10 to 14 Minutes | 5,413 (23.8%) | 4,441 (24.8%) |
| 15 to 19 Minutes | 4,947 (21.8%) | 3,815 (21.3%) |
| 20 to 24 Minutes | 3,074 (13.5%) | 2,339 (13.1%) |
| 25 to 29 Minutes | 929 (4.1%) | 982 (5.5%) |
| 30 to 34 Minutes | 1,754 (7.7%) | 966 (5.4%) |
| 35 to 39 Minutes | 348 (1.5%) | 119 (0.7%) |
| 40 to 44 Minutes | 550 (2.4%) | 396 (2.2%) |
| 45 to 59 Minutes | 705 (3.1%) | 719 (4.0%) |
| 60 to 89 Minutes | 509 (2.2%) | 394 (2.2%) |
| 90 or more Minutes | 167 (0.7%) | 89 (0.5%) |
Time of Departure to Work by Sex in Montgomery County
The most frequent times of departure to work in Montgomery County are 8:00 AM to 8:29 AM (3,334, 14.7%) for males and 8:00 AM to 8:29 AM (3,326, 18.6%) for females.
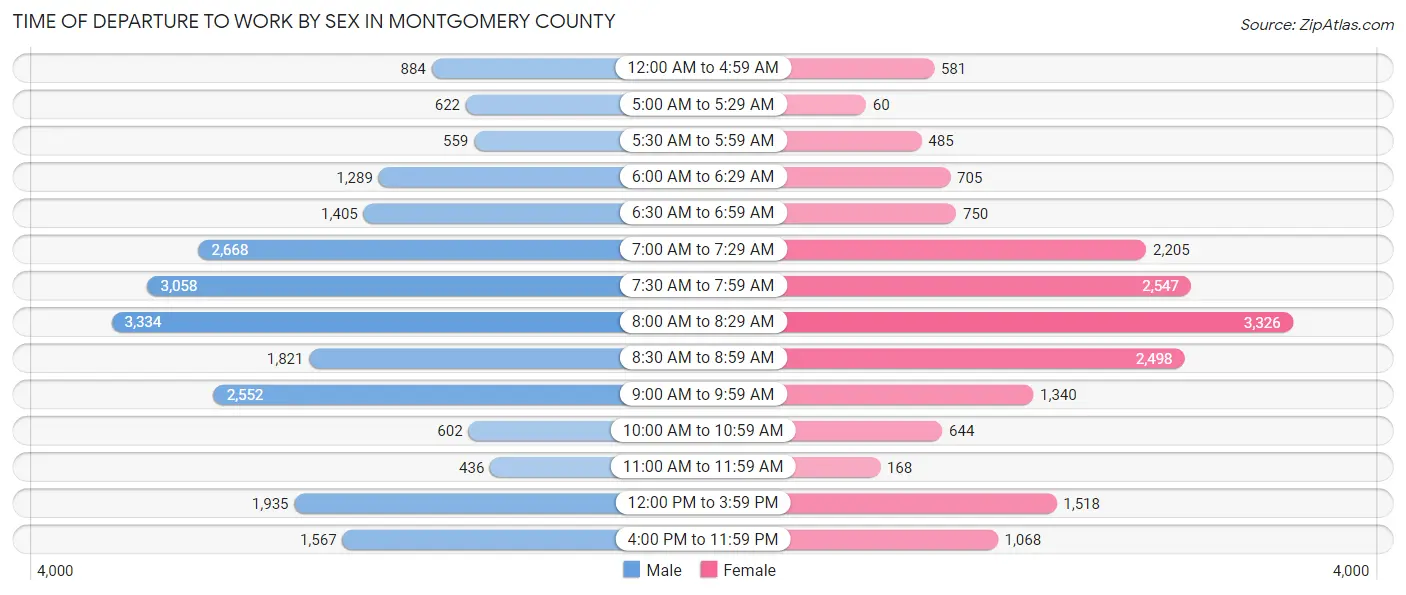
| Time of Departure | Male | Female |
| 12:00 AM to 4:59 AM | 884 (3.9%) | 581 (3.3%) |
| 5:00 AM to 5:29 AM | 622 (2.7%) | 60 (0.3%) |
| 5:30 AM to 5:59 AM | 559 (2.5%) | 485 (2.7%) |
| 6:00 AM to 6:29 AM | 1,289 (5.7%) | 705 (3.9%) |
| 6:30 AM to 6:59 AM | 1,405 (6.2%) | 750 (4.2%) |
| 7:00 AM to 7:29 AM | 2,668 (11.7%) | 2,205 (12.3%) |
| 7:30 AM to 7:59 AM | 3,058 (13.5%) | 2,547 (14.2%) |
| 8:00 AM to 8:29 AM | 3,334 (14.7%) | 3,326 (18.6%) |
| 8:30 AM to 8:59 AM | 1,821 (8.0%) | 2,498 (14.0%) |
| 9:00 AM to 9:59 AM | 2,552 (11.2%) | 1,340 (7.5%) |
| 10:00 AM to 10:59 AM | 602 (2.6%) | 644 (3.6%) |
| 11:00 AM to 11:59 AM | 436 (1.9%) | 168 (0.9%) |
| 12:00 PM to 3:59 PM | 1,935 (8.5%) | 1,518 (8.5%) |
| 4:00 PM to 11:59 PM | 1,567 (6.9%) | 1,068 (6.0%) |
| Total | 22,732 (100.0%) | 17,895 (100.0%) |
Housing Occupancy in Montgomery County
Occupancy by Ownership in Montgomery County
Of the total 36,062 dwellings in Montgomery County, owner-occupied units account for 19,814 (54.9%), while renter-occupied units make up 16,248 (45.1%).
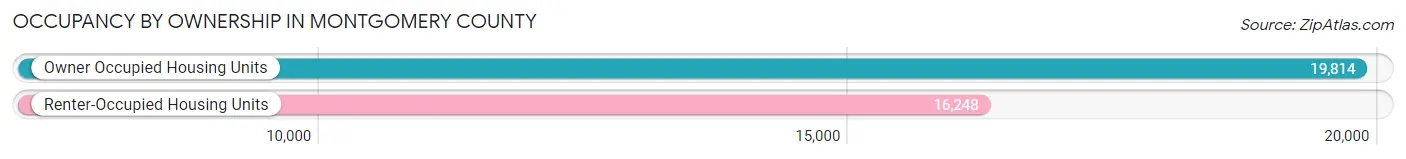
| Occupancy | # Housing Units | % Housing Units |
| Owner Occupied Housing Units | 19,814 | 54.9% |
| Renter-Occupied Housing Units | 16,248 | 45.1% |
| Total Occupied Housing Units | 36,062 | 100.0% |
Occupancy by Household Size in Montgomery County
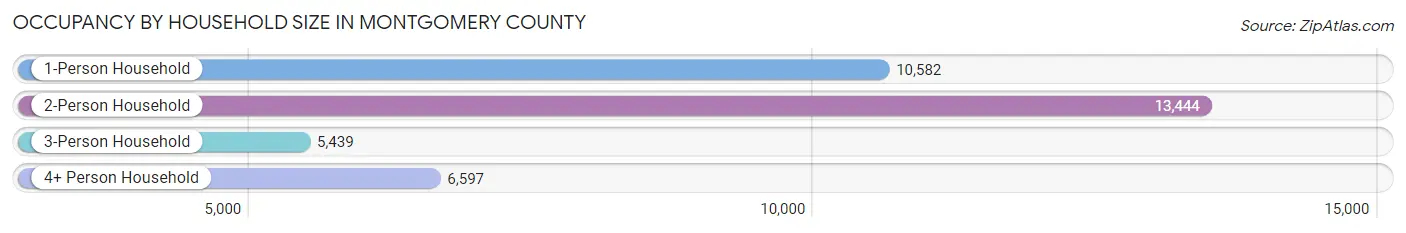
| Household Size | # Housing Units | % Housing Units |
| 1-Person Household | 10,582 | 29.3% |
| 2-Person Household | 13,444 | 37.3% |
| 3-Person Household | 5,439 | 15.1% |
| 4+ Person Household | 6,597 | 18.3% |
| Total Housing Units | 36,062 | 100.0% |
Occupancy by Ownership by Household Size in Montgomery County
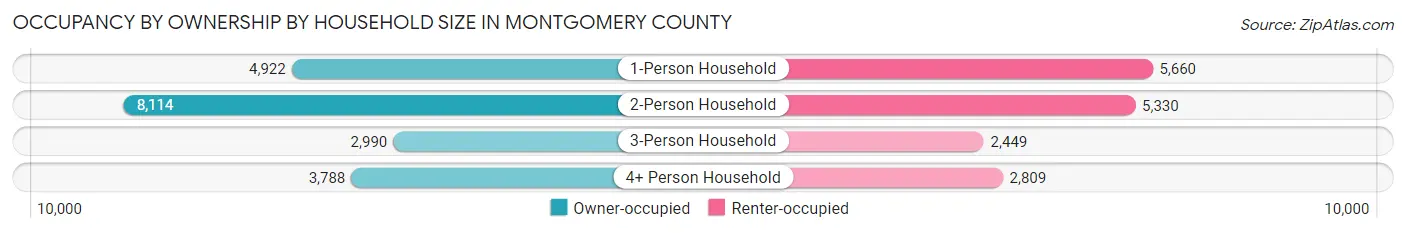
| Household Size | Owner-occupied | Renter-occupied |
| 1-Person Household | 4,922 (46.5%) | 5,660 (53.5%) |
| 2-Person Household | 8,114 (60.4%) | 5,330 (39.7%) |
| 3-Person Household | 2,990 (55.0%) | 2,449 (45.0%) |
| 4+ Person Household | 3,788 (57.4%) | 2,809 (42.6%) |
| Total Housing Units | 19,814 (54.9%) | 16,248 (45.1%) |
Occupancy by Educational Attainment in Montgomery County
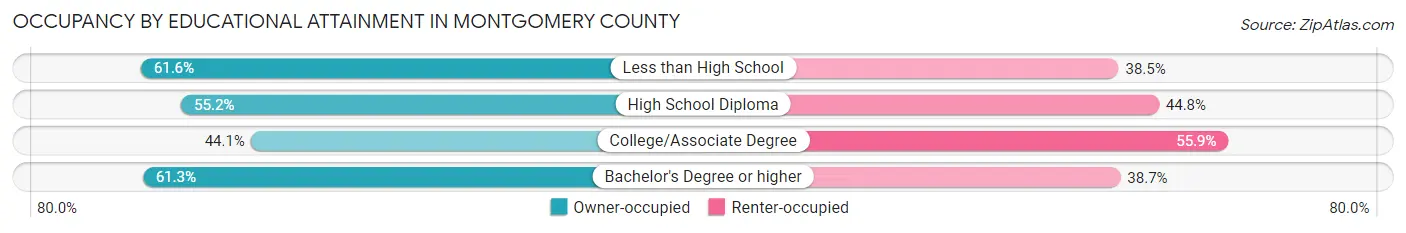
| Household Size | Owner-occupied | Renter-occupied |
| Less than High School | 935 (61.6%) | 584 (38.5%) |
| High School Diploma | 3,624 (55.2%) | 2,946 (44.8%) |
| College/Associate Degree | 4,847 (44.1%) | 6,135 (55.9%) |
| Bachelor's Degree or higher | 10,408 (61.3%) | 6,583 (38.7%) |
Occupancy by Age of Householder in Montgomery County
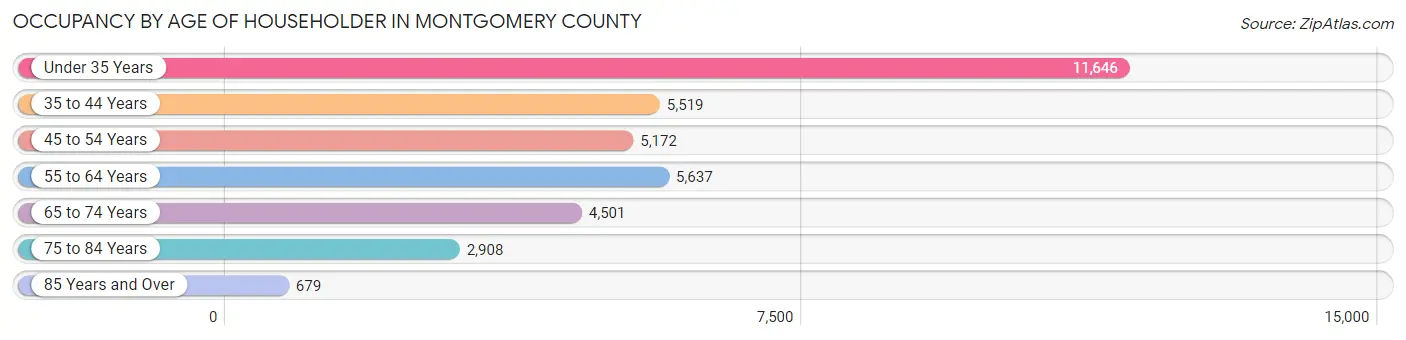
| Age Bracket | # Households | % Households |
| Under 35 Years | 11,646 | 32.3% |
| 35 to 44 Years | 5,519 | 15.3% |
| 45 to 54 Years | 5,172 | 14.3% |
| 55 to 64 Years | 5,637 | 15.6% |
| 65 to 74 Years | 4,501 | 12.5% |
| 75 to 84 Years | 2,908 | 8.1% |
| 85 Years and Over | 679 | 1.9% |
| Total | 36,062 | 100.0% |
Housing Finances in Montgomery County
Median Income by Occupancy in Montgomery County
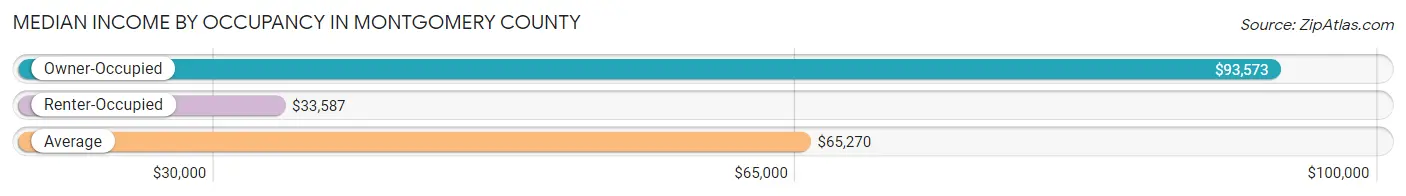
| Occupancy Type | # Households | Median Income |
| Owner-Occupied | 19,814 (54.9%) | $93,573 |
| Renter-Occupied | 16,248 (45.1%) | $33,587 |
| Average | 36,062 (100.0%) | $65,270 |
Occupancy by Householder Income Bracket in Montgomery County

| Income Bracket | Owner-occupied | Renter-occupied |
| Less than $5,000 | 303 (1.5%) | 2,911 (17.9%) |
| $5,000 to $9,999 | 271 (1.4%) | 1,003 (6.2%) |
| $10,000 to $14,999 | 234 (1.2%) | 1,013 (6.2%) |
| $15,000 to $19,999 | 422 (2.1%) | 886 (5.4%) |
| $20,000 to $24,999 | 478 (2.4%) | 741 (4.6%) |
| $25,000 to $34,999 | 1,119 (5.7%) | 1,821 (11.2%) |
| $35,000 to $49,999 | 1,732 (8.7%) | 1,755 (10.8%) |
| $50,000 to $74,999 | 3,120 (15.8%) | 3,030 (18.6%) |
| $75,000 to $99,999 | 2,839 (14.3%) | 1,230 (7.6%) |
| $100,000 to $149,999 | 4,388 (22.2%) | 1,308 (8.1%) |
| $150,000 or more | 4,908 (24.8%) | 550 (3.4%) |
| Total | 19,814 (100.0%) | 16,248 (100.0%) |
Monthly Housing Cost Tiers in Montgomery County
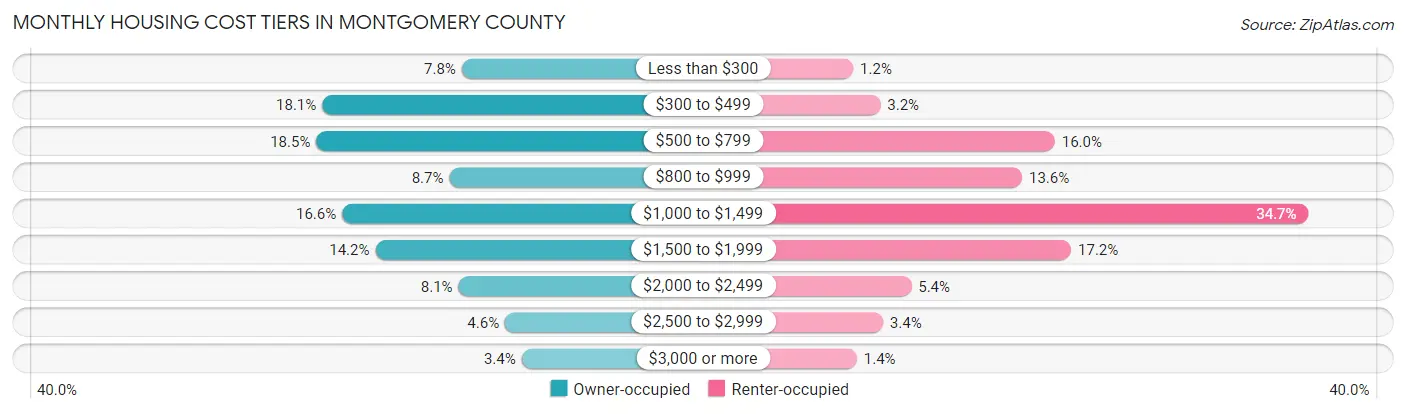
| Monthly Cost | Owner-occupied | Renter-occupied |
| Less than $300 | 1,548 (7.8%) | 188 (1.2%) |
| $300 to $499 | 3,584 (18.1%) | 513 (3.2%) |
| $500 to $799 | 3,670 (18.5%) | 2,602 (16.0%) |
| $800 to $999 | 1,727 (8.7%) | 2,209 (13.6%) |
| $1,000 to $1,499 | 3,293 (16.6%) | 5,634 (34.7%) |
| $1,500 to $1,999 | 2,808 (14.2%) | 2,797 (17.2%) |
| $2,000 to $2,499 | 1,596 (8.1%) | 884 (5.4%) |
| $2,500 to $2,999 | 915 (4.6%) | 544 (3.4%) |
| $3,000 or more | 673 (3.4%) | 233 (1.4%) |
| Total | 19,814 (100.0%) | 16,248 (100.0%) |
Physical Housing Characteristics in Montgomery County
Housing Structures in Montgomery County
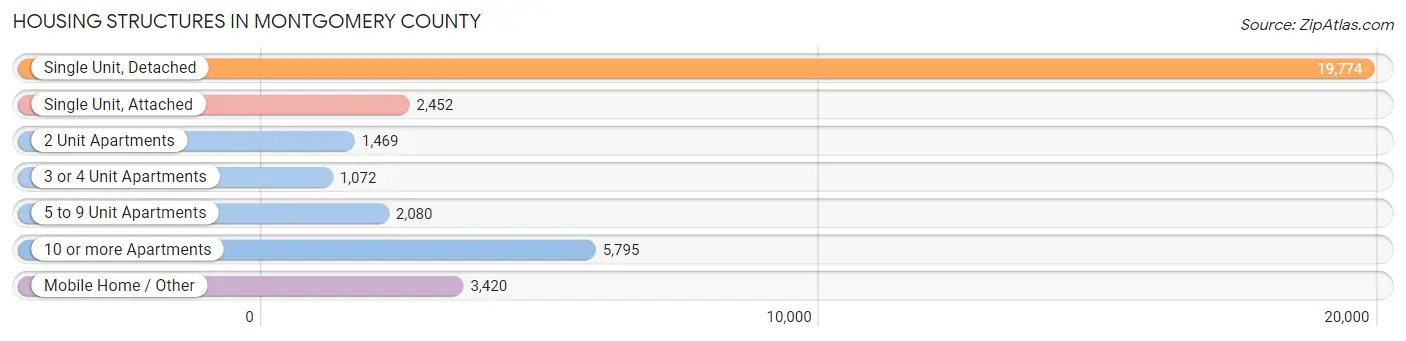
| Structure Type | # Housing Units | % Housing Units |
| Single Unit, Detached | 19,774 | 54.8% |
| Single Unit, Attached | 2,452 | 6.8% |
| 2 Unit Apartments | 1,469 | 4.1% |
| 3 or 4 Unit Apartments | 1,072 | 3.0% |
| 5 to 9 Unit Apartments | 2,080 | 5.8% |
| 10 or more Apartments | 5,795 | 16.1% |
| Mobile Home / Other | 3,420 | 9.5% |
| Total | 36,062 | 100.0% |
Housing Structures by Occupancy in Montgomery County
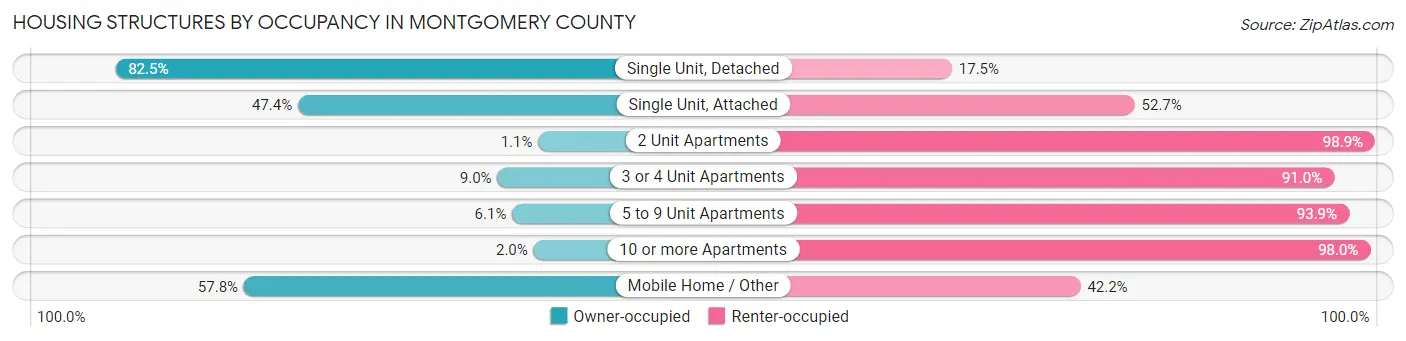
| Structure Type | Owner-occupied | Renter-occupied |
| Single Unit, Detached | 16,322 (82.5%) | 3,452 (17.5%) |
| Single Unit, Attached | 1,161 (47.3%) | 1,291 (52.6%) |
| 2 Unit Apartments | 16 (1.1%) | 1,453 (98.9%) |
| 3 or 4 Unit Apartments | 96 (9.0%) | 976 (91.0%) |
| 5 to 9 Unit Apartments | 127 (6.1%) | 1,953 (93.9%) |
| 10 or more Apartments | 116 (2.0%) | 5,679 (98.0%) |
| Mobile Home / Other | 1,976 (57.8%) | 1,444 (42.2%) |
| Total | 19,814 (54.9%) | 16,248 (45.1%) |
Housing Structures by Number of Rooms in Montgomery County
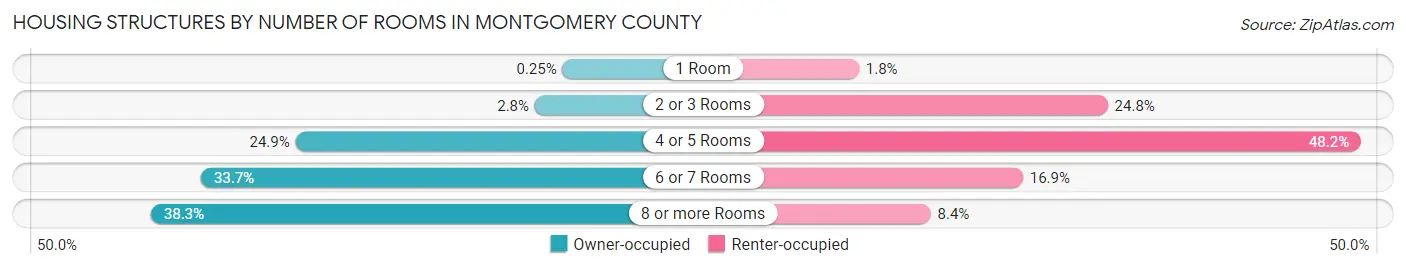
| Number of Rooms | Owner-occupied | Renter-occupied |
| 1 Room | 49 (0.3%) | 285 (1.8%) |
| 2 or 3 Rooms | 557 (2.8%) | 4,023 (24.8%) |
| 4 or 5 Rooms | 4,941 (24.9%) | 7,830 (48.2%) |
| 6 or 7 Rooms | 6,675 (33.7%) | 2,747 (16.9%) |
| 8 or more Rooms | 7,592 (38.3%) | 1,363 (8.4%) |
| Total | 19,814 (100.0%) | 16,248 (100.0%) |
Housing Structure by Heating Type in Montgomery County
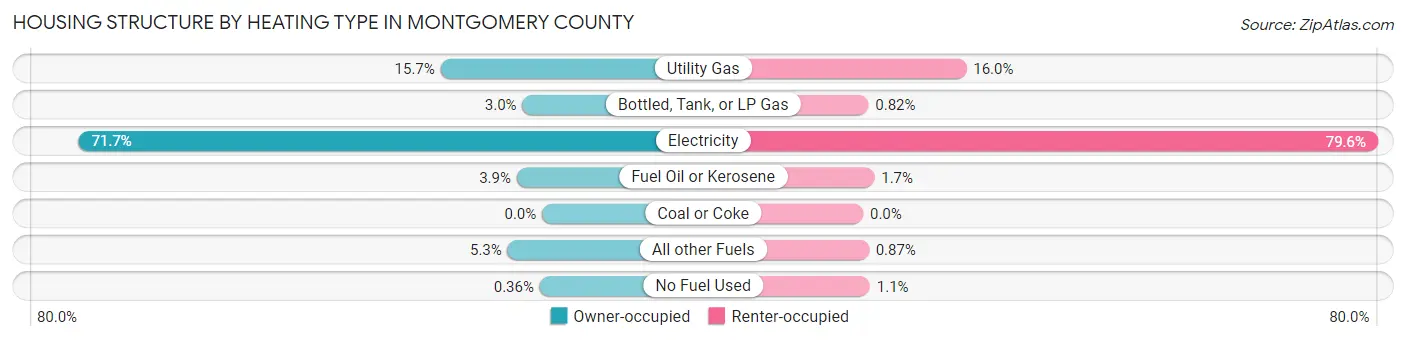
| Heating Type | Owner-occupied | Renter-occupied |
| Utility Gas | 3,108 (15.7%) | 2,593 (16.0%) |
| Bottled, Tank, or LP Gas | 603 (3.0%) | 133 (0.8%) |
| Electricity | 14,201 (71.7%) | 12,928 (79.6%) |
| Fuel Oil or Kerosene | 775 (3.9%) | 282 (1.7%) |
| Coal or Coke | 0 (0.0%) | 0 (0.0%) |
| All other Fuels | 1,056 (5.3%) | 141 (0.9%) |
| No Fuel Used | 71 (0.4%) | 171 (1.1%) |
| Total | 19,814 (100.0%) | 16,248 (100.0%) |
Household Vehicle Usage in Montgomery County
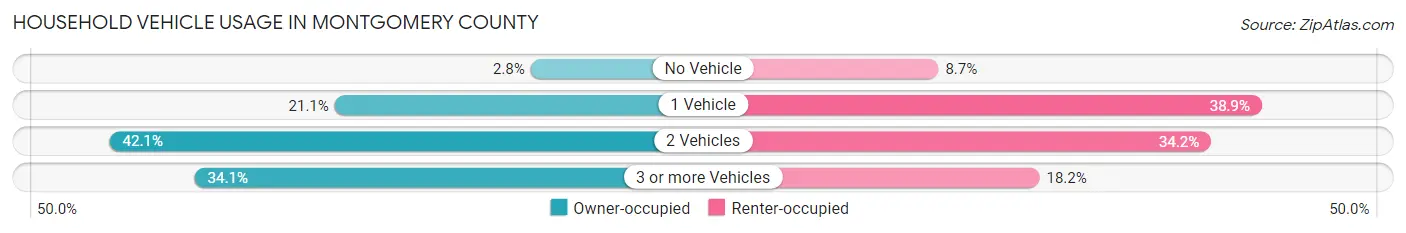
| Vehicles per Household | Owner-occupied | Renter-occupied |
| No Vehicle | 549 (2.8%) | 1,419 (8.7%) |
| 1 Vehicle | 4,172 (21.1%) | 6,322 (38.9%) |
| 2 Vehicles | 8,333 (42.1%) | 5,554 (34.2%) |
| 3 or more Vehicles | 6,760 (34.1%) | 2,953 (18.2%) |
| Total | 19,814 (100.0%) | 16,248 (100.0%) |
Real Estate & Mortgages in Montgomery County
Real Estate and Mortgage Overview in Montgomery County
| Characteristic | Without Mortgage | With Mortgage |
| Housing Units | 9,555 | 10,259 |
| Median Property Value | $259,200 | $280,000 |
| Median Household Income | $76,745 | $3,189 |
| Monthly Housing Costs | $481 | $544 |
| Real Estate Taxes | $2,092 | $121 |
Property Value by Mortgage Status in Montgomery County
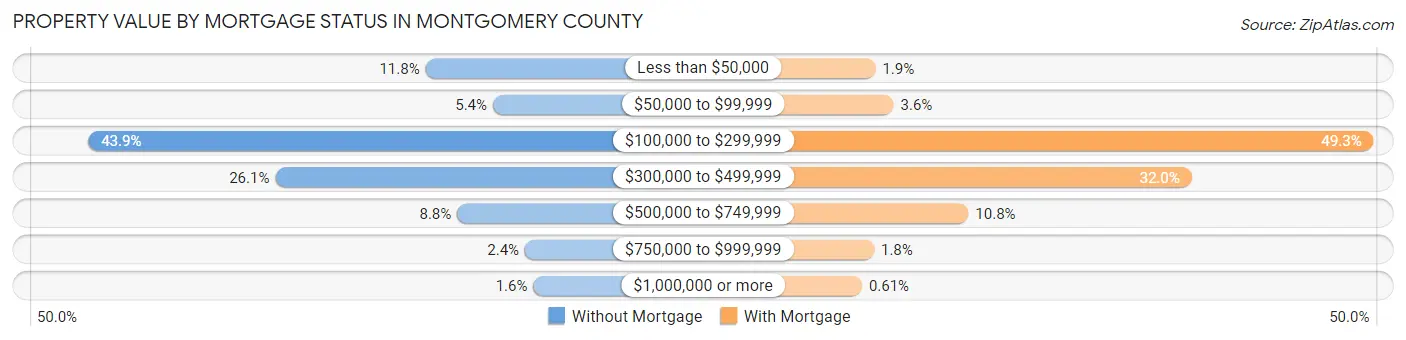
| Property Value | Without Mortgage | With Mortgage |
| Less than $50,000 | 1,129 (11.8%) | 195 (1.9%) |
| $50,000 to $99,999 | 516 (5.4%) | 371 (3.6%) |
| $100,000 to $299,999 | 4,198 (43.9%) | 5,061 (49.3%) |
| $300,000 to $499,999 | 2,497 (26.1%) | 3,285 (32.0%) |
| $500,000 to $749,999 | 842 (8.8%) | 1,103 (10.7%) |
| $750,000 to $999,999 | 225 (2.4%) | 181 (1.8%) |
| $1,000,000 or more | 148 (1.5%) | 63 (0.6%) |
| Total | 9,555 (100.0%) | 10,259 (100.0%) |
Household Income by Mortgage Status in Montgomery County
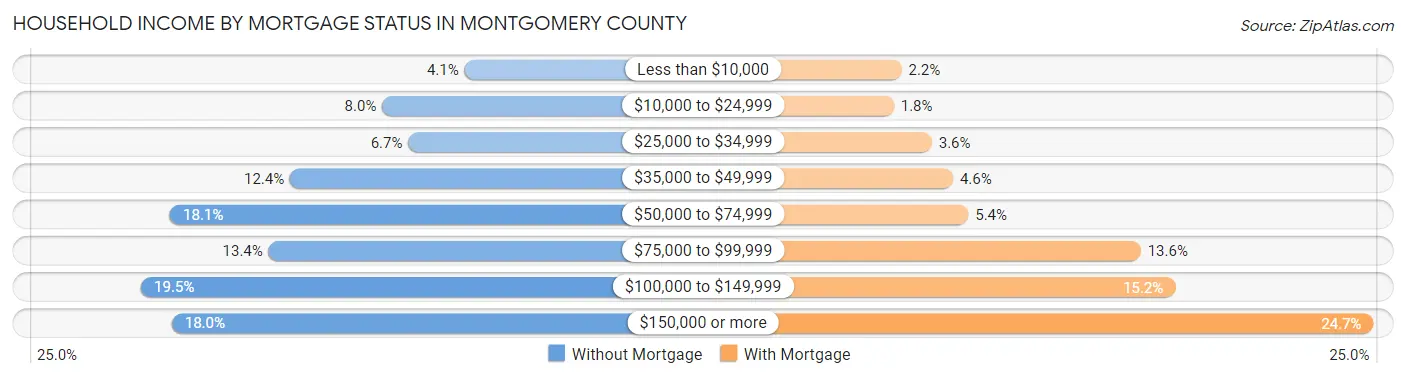
| Household Income | Without Mortgage | With Mortgage |
| Less than $10,000 | 387 (4.1%) | 225 (2.2%) |
| $10,000 to $24,999 | 762 (8.0%) | 187 (1.8%) |
| $25,000 to $34,999 | 643 (6.7%) | 372 (3.6%) |
| $35,000 to $49,999 | 1,181 (12.4%) | 476 (4.6%) |
| $50,000 to $74,999 | 1,727 (18.1%) | 551 (5.4%) |
| $75,000 to $99,999 | 1,278 (13.4%) | 1,393 (13.6%) |
| $100,000 to $149,999 | 1,858 (19.5%) | 1,561 (15.2%) |
| $150,000 or more | 1,719 (18.0%) | 2,530 (24.7%) |
| Total | 9,555 (100.0%) | 10,259 (100.0%) |
Property Value to Household Income Ratio in Montgomery County
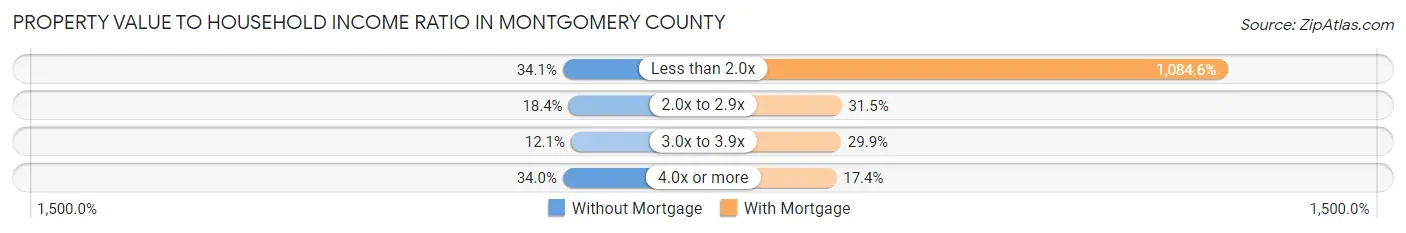
| Value-to-Income Ratio | Without Mortgage | With Mortgage |
| Less than 2.0x | 3,258 (34.1%) | 111,272 (1,084.6%) |
| 2.0x to 2.9x | 1,761 (18.4%) | 3,232 (31.5%) |
| 3.0x to 3.9x | 1,159 (12.1%) | 3,062 (29.8%) |
| 4.0x or more | 3,249 (34.0%) | 1,788 (17.4%) |
| Total | 9,555 (100.0%) | 10,259 (100.0%) |
Real Estate Taxes by Mortgage Status in Montgomery County
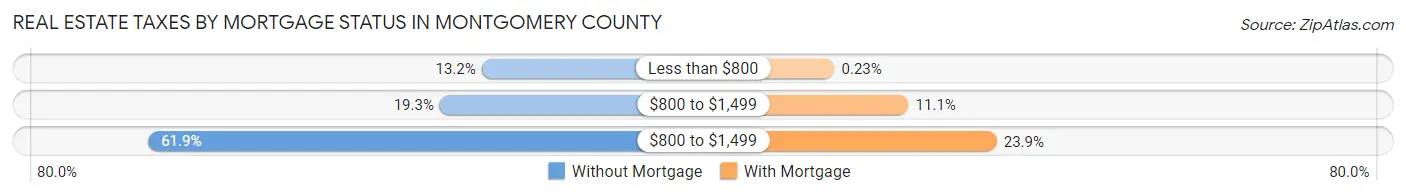
| Property Taxes | Without Mortgage | With Mortgage |
| Less than $800 | 1,264 (13.2%) | 24 (0.2%) |
| $800 to $1,499 | 1,848 (19.3%) | 1,134 (11.1%) |
| $800 to $1,499 | 5,917 (61.9%) | 2,455 (23.9%) |
| Total | 9,555 (100.0%) | 10,259 (100.0%) |
Health & Disability in Montgomery County
Health Insurance Coverage by Age in Montgomery County
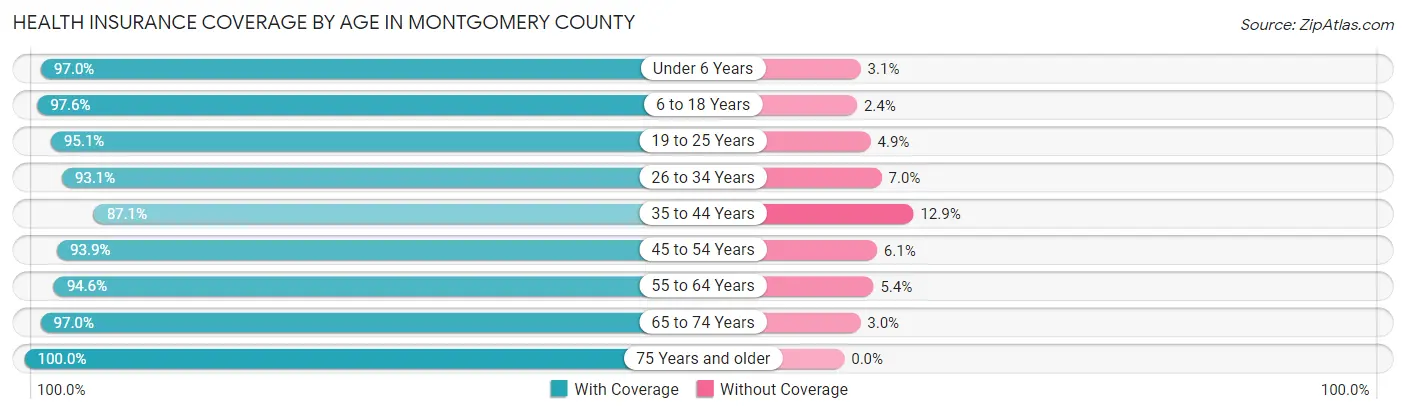
| Age Bracket | With Coverage | Without Coverage |
| Under 6 Years | 4,352 (97.0%) | 137 (3.0%) |
| 6 to 18 Years | 14,862 (97.6%) | 360 (2.4%) |
| 19 to 25 Years | 23,816 (95.1%) | 1,230 (4.9%) |
| 26 to 34 Years | 10,403 (93.0%) | 777 (7.0%) |
| 35 to 44 Years | 8,905 (87.1%) | 1,319 (12.9%) |
| 45 to 54 Years | 9,366 (93.9%) | 606 (6.1%) |
| 55 to 64 Years | 9,256 (94.6%) | 533 (5.4%) |
| 65 to 74 Years | 7,590 (97.0%) | 234 (3.0%) |
| 75 Years and older | 4,980 (100.0%) | 0 (0.0%) |
| Total | 93,530 (94.7%) | 5,196 (5.3%) |
Health Insurance Coverage by Citizenship Status in Montgomery County
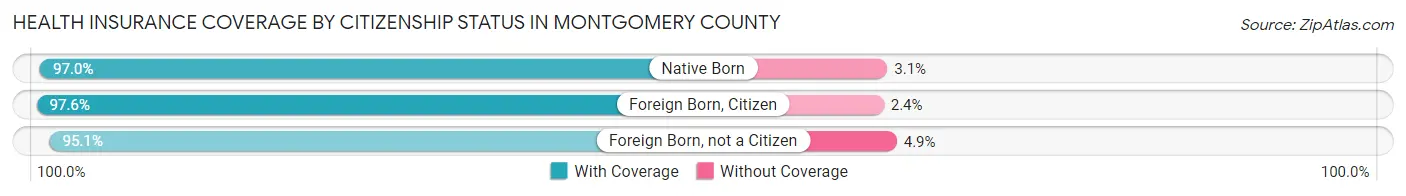
| Citizenship Status | With Coverage | Without Coverage |
| Native Born | 4,352 (97.0%) | 137 (3.0%) |
| Foreign Born, Citizen | 14,862 (97.6%) | 360 (2.4%) |
| Foreign Born, not a Citizen | 23,816 (95.1%) | 1,230 (4.9%) |
Health Insurance Coverage by Household Income in Montgomery County
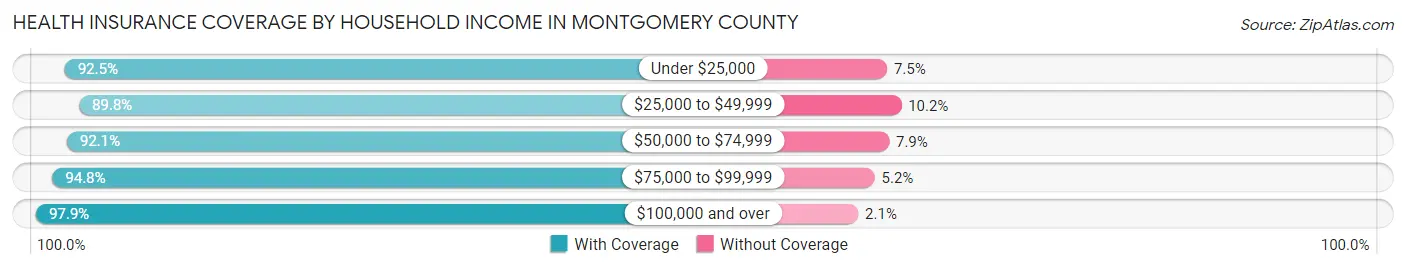
| Household Income | With Coverage | Without Coverage |
| Under $25,000 | 17,990 (92.5%) | 1,464 (7.5%) |
| $25,000 to $49,999 | 12,133 (89.8%) | 1,377 (10.2%) |
| $50,000 to $74,999 | 12,349 (92.1%) | 1,061 (7.9%) |
| $75,000 to $99,999 | 9,484 (94.8%) | 521 (5.2%) |
| $100,000 and over | 31,752 (97.9%) | 690 (2.1%) |
Public vs Private Health Insurance Coverage by Age in Montgomery County
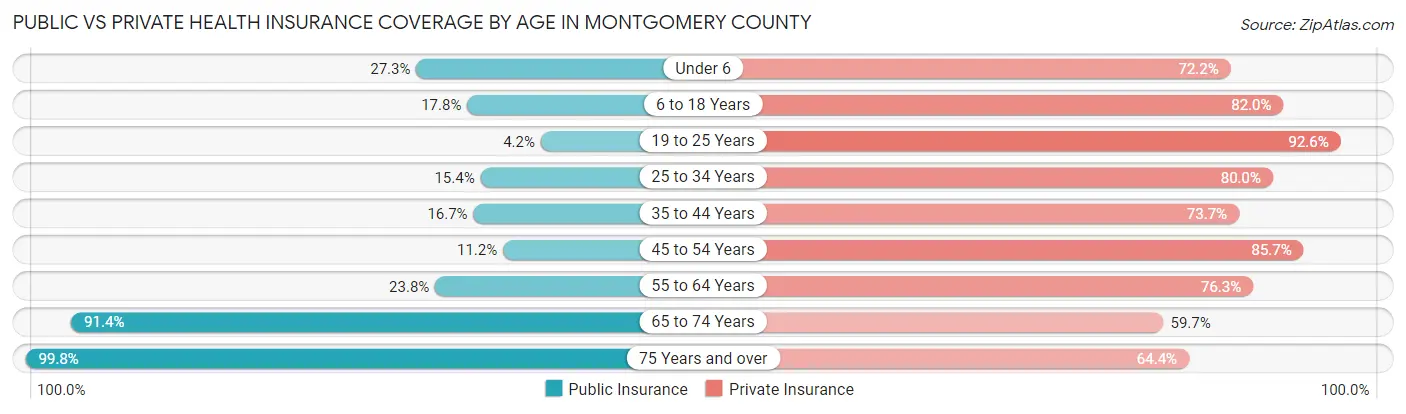
| Age Bracket | Public Insurance | Private Insurance |
| Under 6 | 1,225 (27.3%) | 3,239 (72.2%) |
| 6 to 18 Years | 2,716 (17.8%) | 12,475 (82.0%) |
| 19 to 25 Years | 1,050 (4.2%) | 23,186 (92.6%) |
| 25 to 34 Years | 1,719 (15.4%) | 8,943 (80.0%) |
| 35 to 44 Years | 1,706 (16.7%) | 7,535 (73.7%) |
| 45 to 54 Years | 1,116 (11.2%) | 8,546 (85.7%) |
| 55 to 64 Years | 2,330 (23.8%) | 7,471 (76.3%) |
| 65 to 74 Years | 7,147 (91.3%) | 4,673 (59.7%) |
| 75 Years and over | 4,972 (99.8%) | 3,208 (64.4%) |
| Total | 23,981 (24.3%) | 79,276 (80.3%) |
Disability Status by Sex by Age in Montgomery County
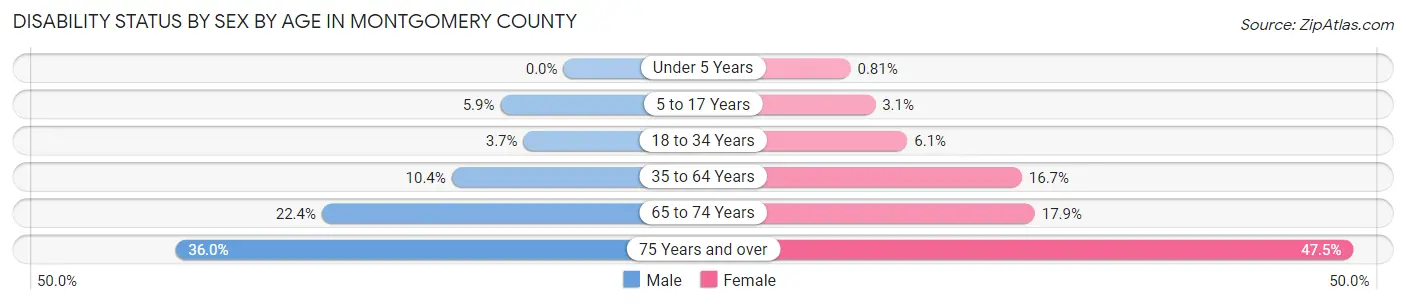
| Age Bracket | Male | Female |
| Under 5 Years | 0 (0.0%) | 15 (0.8%) |
| 5 to 17 Years | 330 (5.9%) | 173 (3.1%) |
| 18 to 34 Years | 843 (3.7%) | 1,109 (6.1%) |
| 35 to 64 Years | 1,577 (10.4%) | 2,469 (16.7%) |
| 65 to 74 Years | 828 (22.4%) | 740 (17.9%) |
| 75 Years and over | 741 (36.0%) | 1,387 (47.5%) |
Disability Class by Sex by Age in Montgomery County
Disability Class: Hearing Difficulty
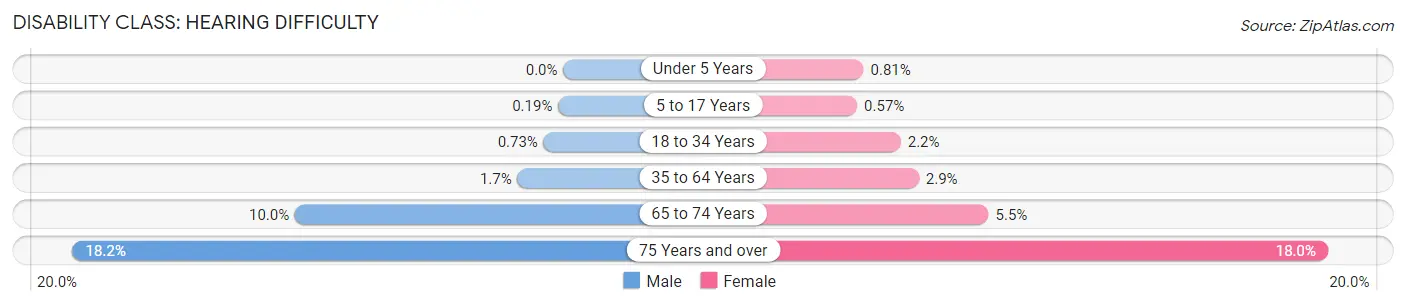
| Age Bracket | Male | Female |
| Under 5 Years | 0 (0.0%) | 15 (0.8%) |
| 5 to 17 Years | 11 (0.2%) | 32 (0.6%) |
| 18 to 34 Years | 165 (0.7%) | 399 (2.2%) |
| 35 to 64 Years | 259 (1.7%) | 423 (2.9%) |
| 65 to 74 Years | 368 (10.0%) | 225 (5.4%) |
| 75 Years and over | 375 (18.2%) | 527 (18.0%) |
Disability Class: Vision Difficulty
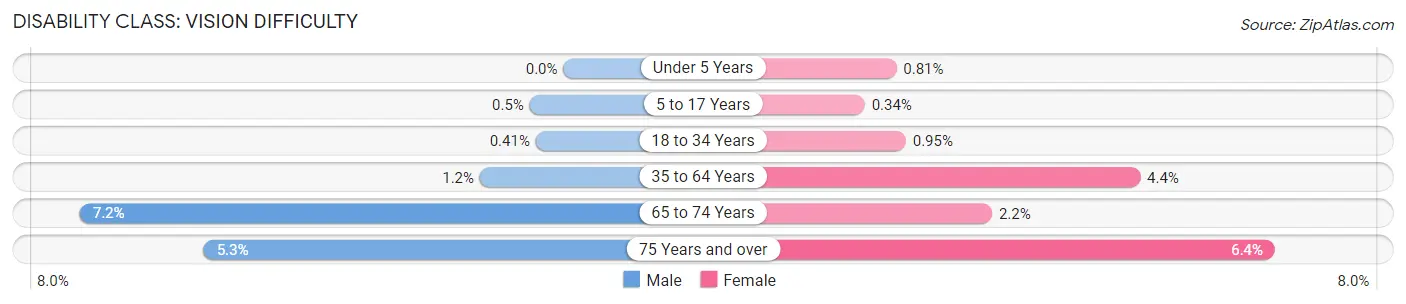
| Age Bracket | Male | Female |
| Under 5 Years | 0 (0.0%) | 15 (0.8%) |
| 5 to 17 Years | 28 (0.5%) | 19 (0.3%) |
| 18 to 34 Years | 94 (0.4%) | 174 (0.9%) |
| 35 to 64 Years | 189 (1.2%) | 655 (4.4%) |
| 65 to 74 Years | 265 (7.2%) | 92 (2.2%) |
| 75 Years and over | 110 (5.3%) | 188 (6.4%) |
Disability Class: Cognitive Difficulty
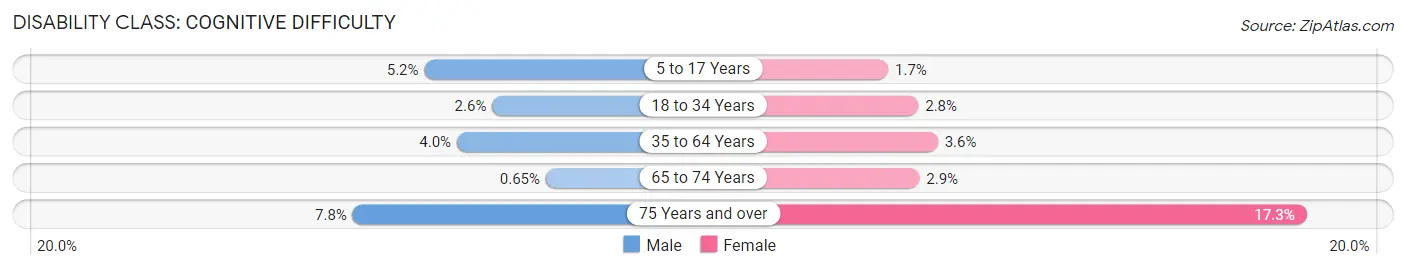
| Age Bracket | Male | Female |
| 5 to 17 Years | 291 (5.2%) | 96 (1.7%) |
| 18 to 34 Years | 599 (2.6%) | 518 (2.8%) |
| 35 to 64 Years | 601 (4.0%) | 526 (3.6%) |
| 65 to 74 Years | 24 (0.6%) | 119 (2.9%) |
| 75 Years and over | 161 (7.8%) | 504 (17.2%) |
Disability Class: Ambulatory Difficulty
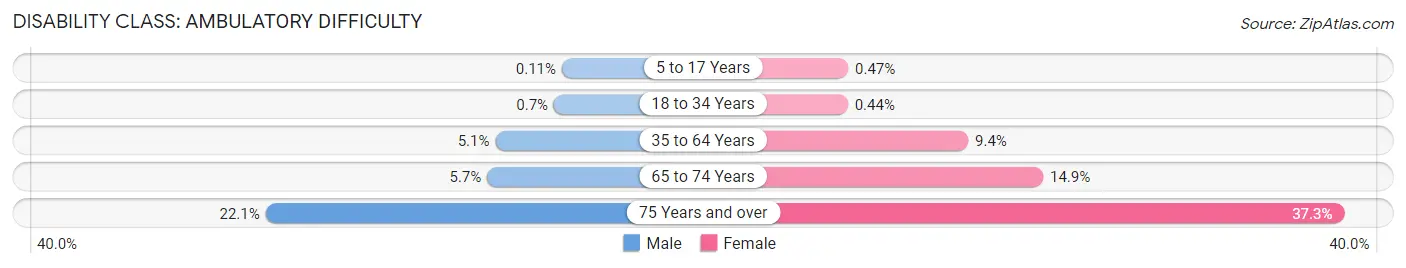
| Age Bracket | Male | Female |
| 5 to 17 Years | 6 (0.1%) | 26 (0.5%) |
| 18 to 34 Years | 159 (0.7%) | 81 (0.4%) |
| 35 to 64 Years | 769 (5.1%) | 1,385 (9.4%) |
| 65 to 74 Years | 209 (5.7%) | 617 (14.9%) |
| 75 Years and over | 455 (22.1%) | 1,090 (37.3%) |
Disability Class: Self-Care Difficulty
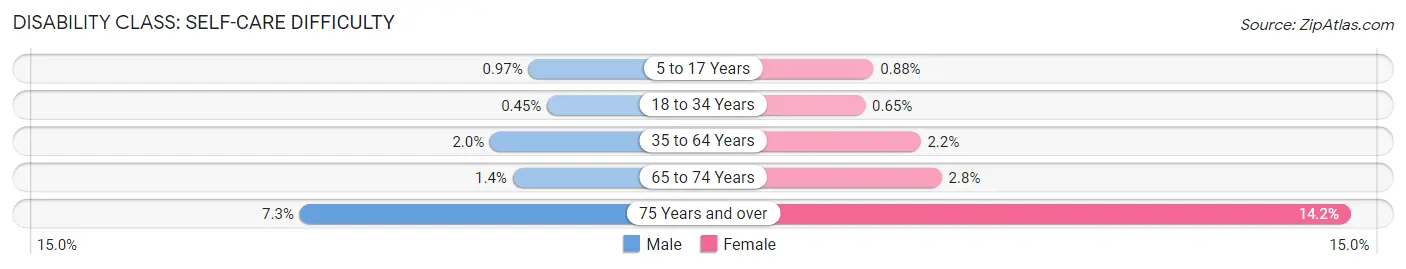
| Age Bracket | Male | Female |
| 5 to 17 Years | 55 (1.0%) | 49 (0.9%) |
| 18 to 34 Years | 103 (0.4%) | 118 (0.6%) |
| 35 to 64 Years | 311 (2.0%) | 323 (2.2%) |
| 65 to 74 Years | 52 (1.4%) | 115 (2.8%) |
| 75 Years and over | 151 (7.3%) | 414 (14.2%) |
Technology Access in Montgomery County
Computing Device Access in Montgomery County
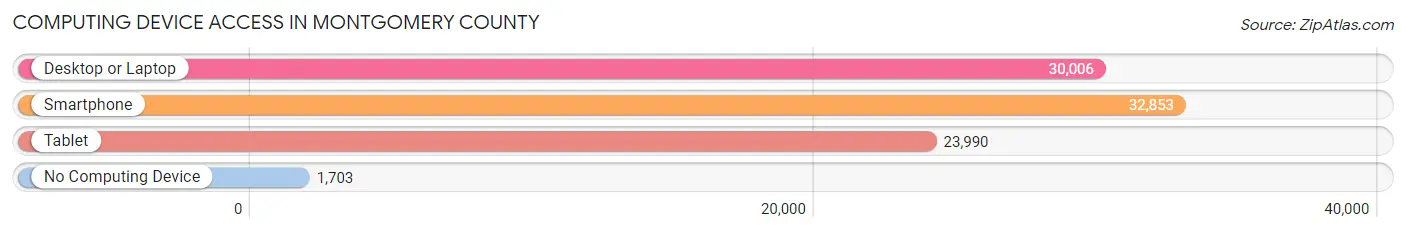
| Device Type | # Households | % Households |
| Desktop or Laptop | 30,006 | 83.2% |
| Smartphone | 32,853 | 91.1% |
| Tablet | 23,990 | 66.5% |
| No Computing Device | 1,703 | 4.7% |
| Total | 36,062 | 100.0% |
Internet Access in Montgomery County
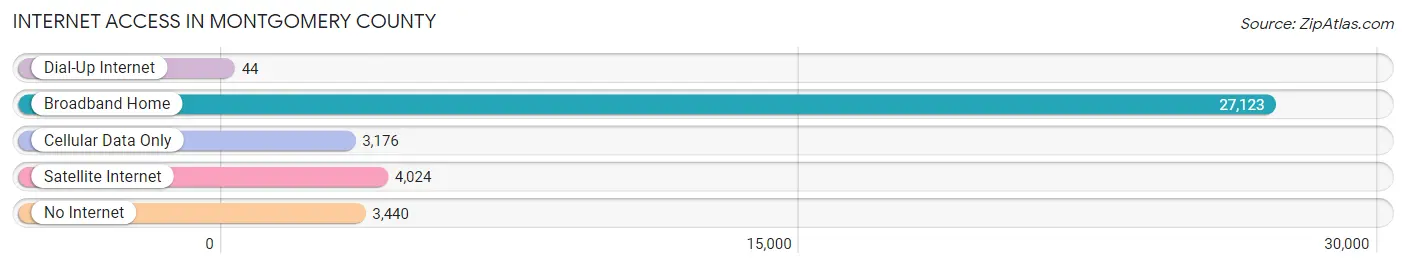
| Internet Type | # Households | % Households |
| Dial-Up Internet | 44 | 0.1% |
| Broadband Home | 27,123 | 75.2% |
| Cellular Data Only | 3,176 | 8.8% |
| Satellite Internet | 4,024 | 11.2% |
| No Internet | 3,440 | 9.5% |
| Total | 36,062 | 100.0% |
Montgomery County Summary
Montgomery County, Virginia is located in the southwestern part of the state, and is part of the New River Valley region. It is bordered by Floyd County to the north, Pulaski County to the east, Giles County to the south, and the city of Radford to the west. The county seat is Christiansburg, and the county is home to a population of 94,392 people, according to the 2019 U.S. Census.
History
Montgomery County was formed in 1777 from Fincastle County, and was named for General Richard Montgomery, who was killed in the Battle of Quebec during the Revolutionary War. The county was originally part of the area known as the “Great Valley”, which was a major route for settlers moving west. The county was home to several Native American tribes, including the Monacan, Tutelo, and Saponi.
The county was home to several prominent figures in American history, including Thomas Jefferson, who owned a plantation in the county, and George Washington, who visited the area in 1748. The county was also home to several Civil War battles, including the Battle of New River Bridge and the Battle of Christiansburg.
Geography
Montgomery County is located in the Appalachian Mountains, and is part of the Ridge and Valley region. The county is home to several mountain ranges, including the Blue Ridge Mountains, the Allegheny Mountains, and the Appalachian Plateau. The county is also home to several rivers, including the New River, the Roanoke River, and the Little River.
The county is home to several state parks, including Claytor Lake State Park, New River Trail State Park, and Douthat State Park. The county is also home to several national forests, including the George Washington and Jefferson National Forests.
Economy
Montgomery County is home to a diverse economy, with a variety of industries, including manufacturing, healthcare, education, and tourism. The county is home to several major employers, including Volvo Trucks, Carilion Clinic, and Virginia Tech. The county is also home to several small businesses, including restaurants, retail stores, and farms.
The county is home to several major transportation routes, including Interstate 81, U.S. Route 11, and U.S. Route 460. The county is also home to several airports, including the Roanoke-Blacksburg Regional Airport and the New River Valley Airport.
Demographics
According to the 2019 U.S. Census, Montgomery County has a population of 94,392 people, with a median age of 38.7 years. The population is made up of 48.3% male and 51.7% female. The racial makeup of the county is 87.3% White, 8.2% Black or African American, 0.7% Native American, 1.7% Asian, 0.1% Pacific Islander, 0.7% from other races, and 1.5% from two or more races. The county is also home to a large Hispanic or Latino population, making up 6.2% of the population.
The median household income in Montgomery County is $50,945, and the median family income is $63,945. The county is home to a large number of college-educated individuals, with 36.2% of the population having a bachelor’s degree or higher. The county is also home to a large number of veterans, with 8.3% of the population having served in the military.
Common Questions
What is Per Capita Income in Montgomery County?
Per Capita income in Montgomery County is $32,776.
What is the Median Family Income in Montgomery County?
Median Family Income in Montgomery County is $96,261.
What is the Median Household income in Montgomery County?
Median Household Income in Montgomery County is $65,270.
What is Income or Wage Gap in Montgomery County?
Income or Wage Gap in Montgomery County is 27.5%.
Women in Montgomery County earn 72.5 cents for every dollar earned by a man.
What is Family Income Deficit in Montgomery County?
Family Income Deficit in Montgomery County is $13,504.
Families that are below poverty line in Montgomery County earn $13,504 less on average than the poverty threshold level.
What is Inequality or Gini Index in Montgomery County?
Inequality or Gini Index in Montgomery County is 0.49.
What is the Total Population of Montgomery County?
Total Population of Montgomery County is 99,373.
What is the Total Male Population of Montgomery County?
Total Male Population of Montgomery County is 51,542.
What is the Total Female Population of Montgomery County?
Total Female Population of Montgomery County is 47,831.
What is the Ratio of Males per 100 Females in Montgomery County?
There are 107.76 Males per 100 Females in Montgomery County.
What is the Ratio of Females per 100 Males in Montgomery County?
There are 92.80 Females per 100 Males in Montgomery County.
What is the Median Population Age in Montgomery County?
Median Population Age in Montgomery County is 29.7 Years.
What is the Average Family Size in Montgomery County
Average Family Size in Montgomery County is 2.9 People.
What is the Average Household Size in Montgomery County
Average Household Size in Montgomery County is 2.5 People.
How Large is the Labor Force in Montgomery County?
There are 48,168 People in the Labor Forcein in Montgomery County.
What is the Percentage of People in the Labor Force in Montgomery County?
55.9% of People are in the Labor Force in Montgomery County.
What is the Unemployment Rate in Montgomery County?
Unemployment Rate in Montgomery County is 3.3%.