Middlesex County, VA Map & Demographics
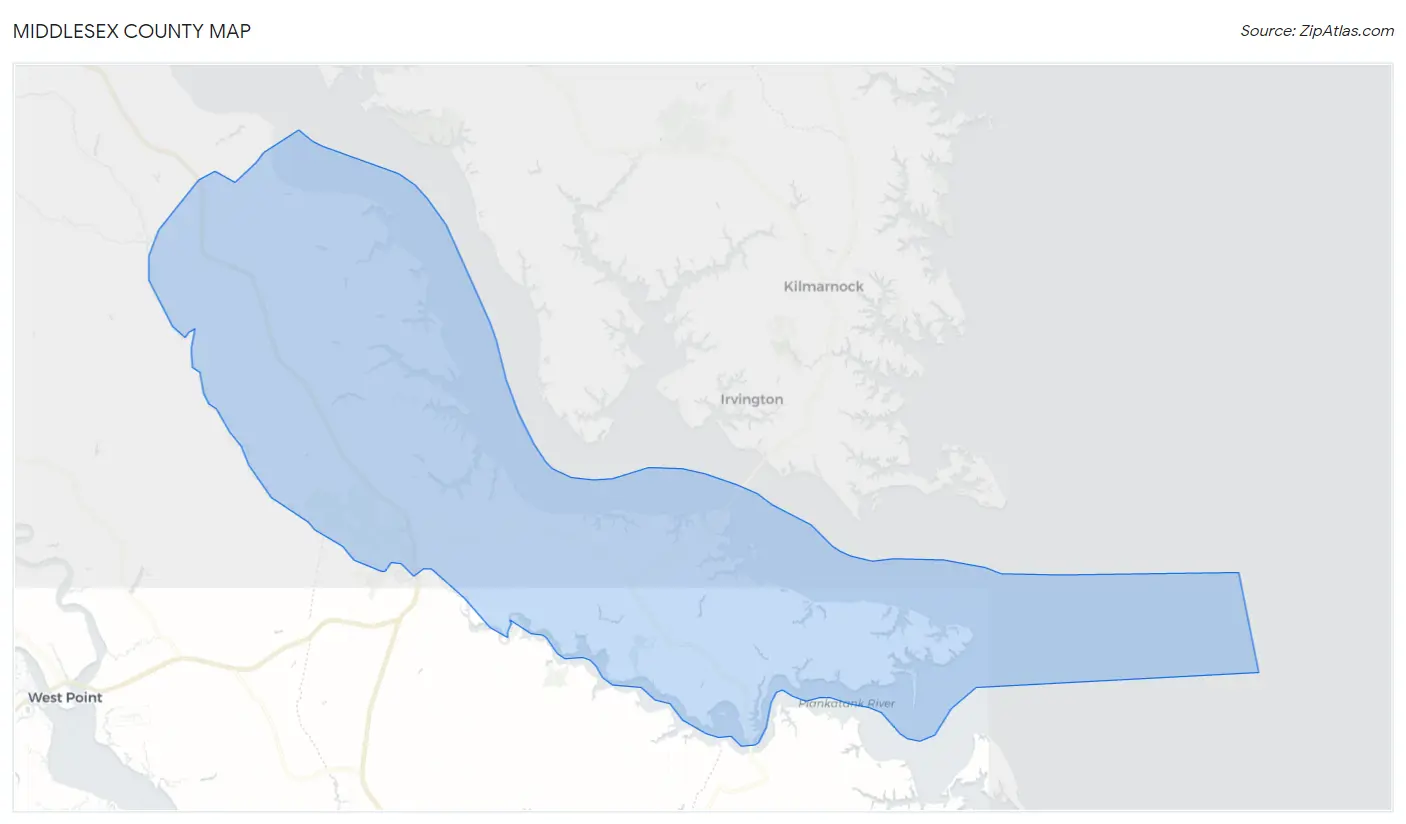
Middlesex County Map
Middlesex County Overview
$39,111
PER CAPITA INCOME
$88,661
AVG FAMILY INCOME
$69,389
AVG HOUSEHOLD INCOME
47.3%
WAGE / INCOME GAP [ % ]
52.7¢/ $1
WAGE / INCOME GAP [ $ ]
0.41
INEQUALITY / GINI INDEX
10,738
TOTAL POPULATION
5,360
MALE POPULATION
5,378
FEMALE POPULATION
99.67
MALES / 100 FEMALES
100.34
FEMALES / 100 MALES
54.9
MEDIAN AGE
2.6
AVG FAMILY SIZE
2.2
AVG HOUSEHOLD SIZE
4,722
LABOR FORCE [ PEOPLE ]
51.4%
PERCENT IN LABOR FORCE
4.6%
UNEMPLOYMENT RATE
Middlesex County Area Codes
Income in Middlesex County
Income Overview in Middlesex County
Per Capita Income in Middlesex County is $39,111, while median incomes of families and households are $88,661 and $69,389 respectively.
| Characteristic | Number | Measure |
| Per Capita Income | 10,738 | $39,111 |
| Median Family Income | 3,000 | $88,661 |
| Mean Family Income | 3,000 | $101,097 |
| Median Household Income | 4,714 | $69,389 |
| Mean Household Income | 4,714 | $87,623 |
| Income Deficit | 3,000 | $0 |
| Wage / Income Gap (%) | 10,738 | 47.33% |
| Wage / Income Gap ($) | 10,738 | 52.67¢ per $1 |
| Gini / Inequality Index | 10,738 | 0.41 |
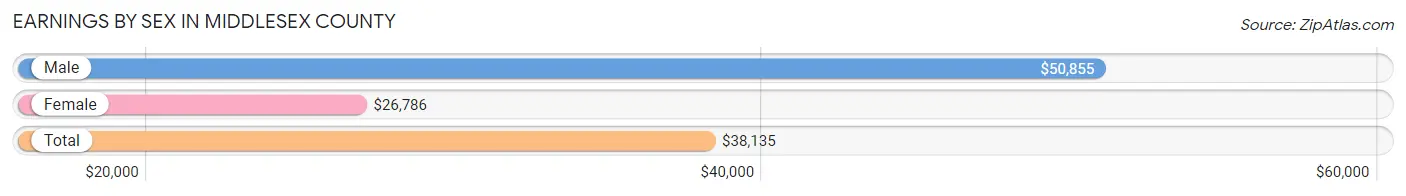
Earnings by Sex in Middlesex County
Average Earnings in Middlesex County are $38,135, $50,855 for men and $26,786 for women, a difference of 47.3%.
| Sex | Number | Average Earnings |
| Male | 2,720 (54.3%) | $50,855 |
| Female | 2,292 (45.7%) | $26,786 |
| Total | 5,012 (100.0%) | $38,135 |
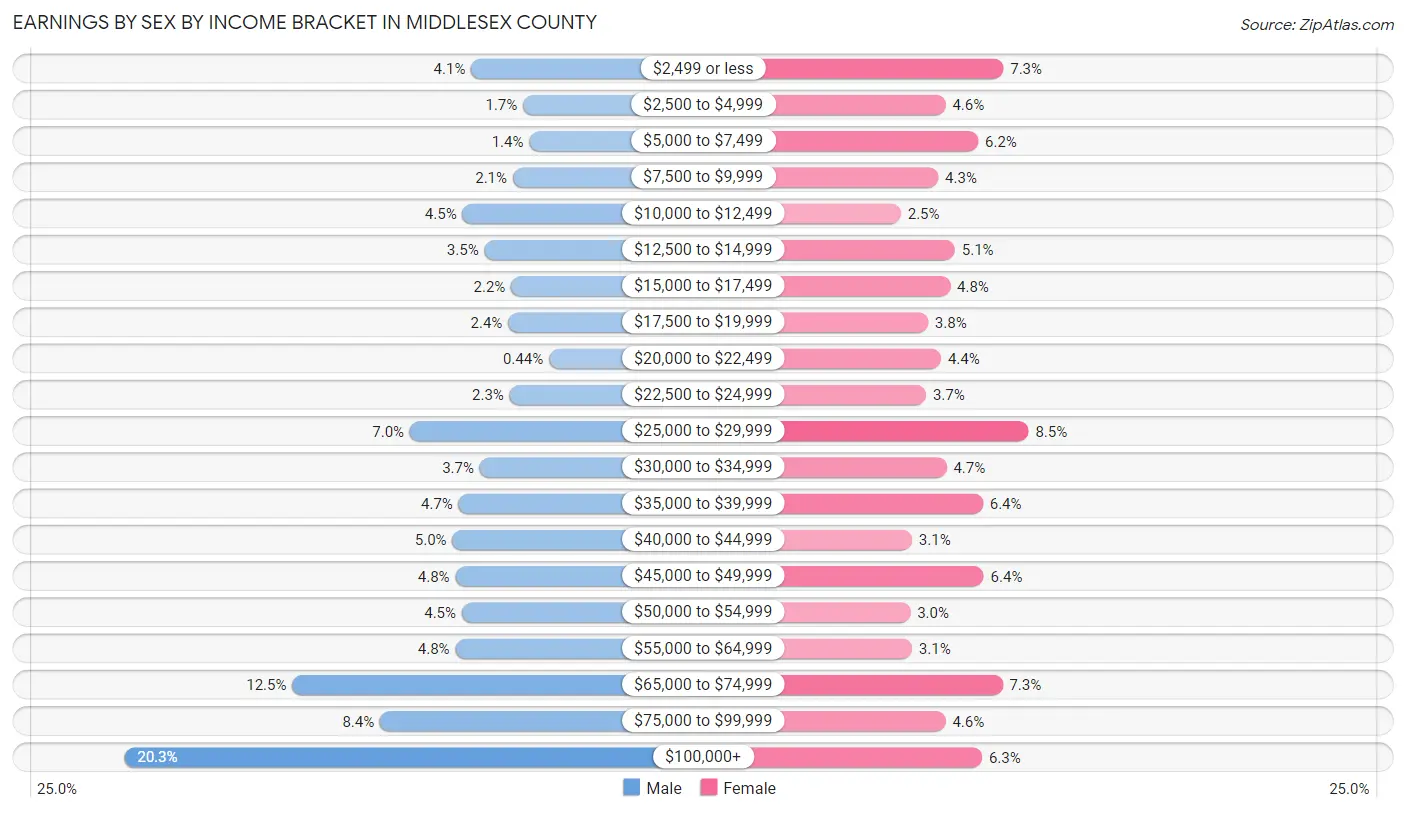
Earnings by Sex by Income Bracket in Middlesex County
The most common earnings brackets in Middlesex County are $100,000+ for men (553 | 20.3%) and $25,000 to $29,999 for women (195 | 8.5%).
| Income | Male | Female |
| $2,499 or less | 111 (4.1%) | 168 (7.3%) |
| $2,500 to $4,999 | 45 (1.7%) | 106 (4.6%) |
| $5,000 to $7,499 | 37 (1.4%) | 141 (6.1%) |
| $7,500 to $9,999 | 58 (2.1%) | 98 (4.3%) |
| $10,000 to $12,499 | 122 (4.5%) | 58 (2.5%) |
| $12,500 to $14,999 | 94 (3.5%) | 116 (5.1%) |
| $15,000 to $17,499 | 60 (2.2%) | 111 (4.8%) |
| $17,500 to $19,999 | 64 (2.4%) | 87 (3.8%) |
| $20,000 to $22,499 | 12 (0.4%) | 101 (4.4%) |
| $22,500 to $24,999 | 62 (2.3%) | 85 (3.7%) |
| $25,000 to $29,999 | 189 (7.0%) | 195 (8.5%) |
| $30,000 to $34,999 | 100 (3.7%) | 107 (4.7%) |
| $35,000 to $39,999 | 127 (4.7%) | 146 (6.4%) |
| $40,000 to $44,999 | 135 (5.0%) | 70 (3.0%) |
| $45,000 to $49,999 | 131 (4.8%) | 147 (6.4%) |
| $50,000 to $54,999 | 123 (4.5%) | 68 (3.0%) |
| $55,000 to $64,999 | 131 (4.8%) | 70 (3.0%) |
| $65,000 to $74,999 | 339 (12.5%) | 167 (7.3%) |
| $75,000 to $99,999 | 227 (8.4%) | 106 (4.6%) |
| $100,000+ | 553 (20.3%) | 145 (6.3%) |
| Total | 2,720 (100.0%) | 2,292 (100.0%) |
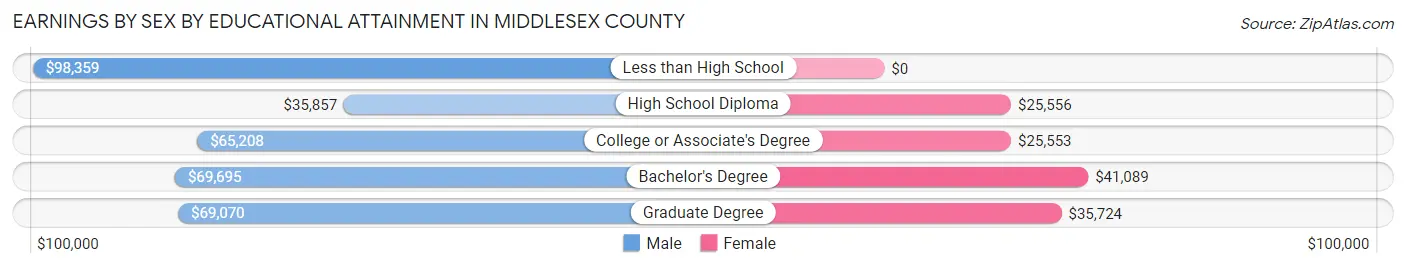
Earnings by Sex by Educational Attainment in Middlesex County
Average earnings in Middlesex County are $56,125 for men and $30,636 for women, a difference of 45.4%. Men with an educational attainment of less than high school enjoy the highest average annual earnings of $98,359, while those with high school diploma education earn the least with $35,857. Women with an educational attainment of bachelor's degree earn the most with the average annual earnings of $41,089, while those with college or associate's degree education have the smallest earnings of $25,553.
| Educational Attainment | Male Income | Female Income |
| Less than High School | $98,359 | $0 |
| High School Diploma | $35,857 | $25,556 |
| College or Associate's Degree | $65,208 | $25,553 |
| Bachelor's Degree | $69,695 | $41,089 |
| Graduate Degree | $69,070 | $35,724 |
| Total | $56,125 | $30,636 |
Family Income in Middlesex County
Family Income Brackets in Middlesex County
According to the Middlesex County family income data, there are 741 families falling into the $100,000 to $149,999 income range, which is the most common income bracket and makes up 24.7% of all families. Conversely, the $10,000 to $14,999 income bracket is the least frequent group with only 48 families (1.6%) belonging to this category.
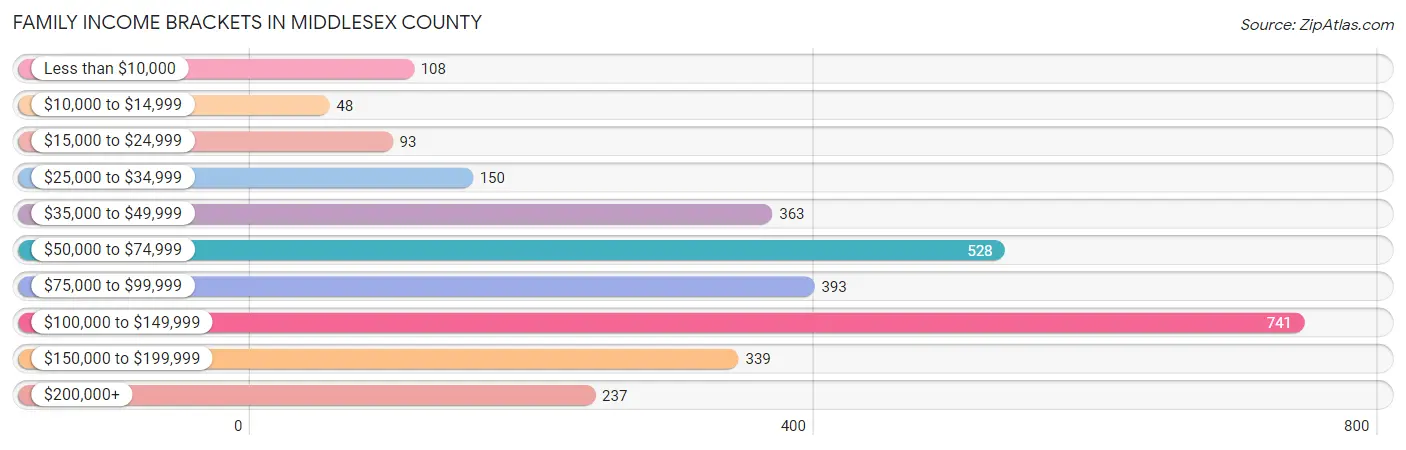
| Income Bracket | # Families | % Families |
| Less than $10,000 | 108 | 3.6% |
| $10,000 to $14,999 | 48 | 1.6% |
| $15,000 to $24,999 | 93 | 3.1% |
| $25,000 to $34,999 | 150 | 5.0% |
| $35,000 to $49,999 | 363 | 12.1% |
| $50,000 to $74,999 | 528 | 17.6% |
| $75,000 to $99,999 | 393 | 13.1% |
| $100,000 to $149,999 | 741 | 24.7% |
| $150,000 to $199,999 | 339 | 11.3% |
| $200,000+ | 237 | 7.9% |
Family Income by Famaliy Size in Middlesex County
6-person families (105 | 3.5%) account for the highest median family income in Middlesex County with $158,821 per family, while 2-person families (2,051 | 68.4%) have the highest median income of $42,156 per family member.
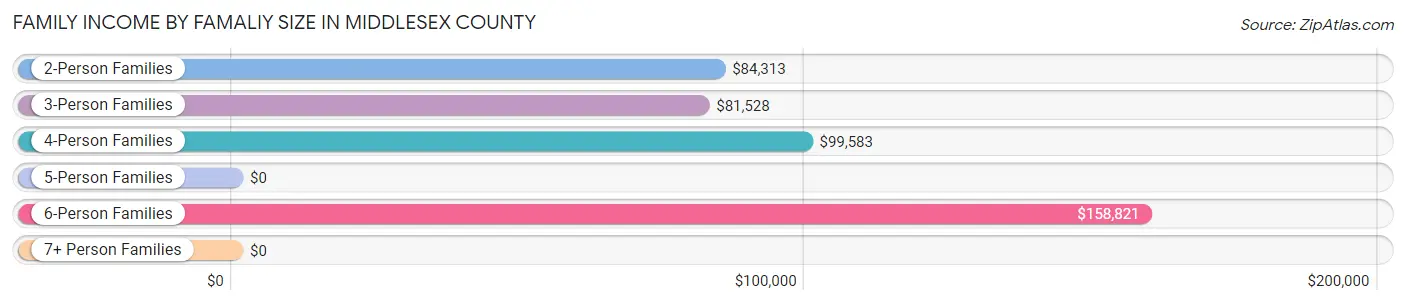
| Income Bracket | # Families | Median Income |
| 2-Person Families | 2,051 (68.4%) | $84,313 |
| 3-Person Families | 426 (14.2%) | $81,528 |
| 4-Person Families | 323 (10.8%) | $99,583 |
| 5-Person Families | 95 (3.2%) | $0 |
| 6-Person Families | 105 (3.5%) | $158,821 |
| 7+ Person Families | 0 (0.0%) | $0 |
| Total | 3,000 (100.0%) | $88,661 |
Family Income by Number of Earners in Middlesex County
The median family income in Middlesex County is $88,661, with families comprising 3+ earners (189) having the highest median family income of $123,542, while families with no earners (897) have the lowest median family income of $61,719, accounting for 6.3% and 29.9% of families, respectively.
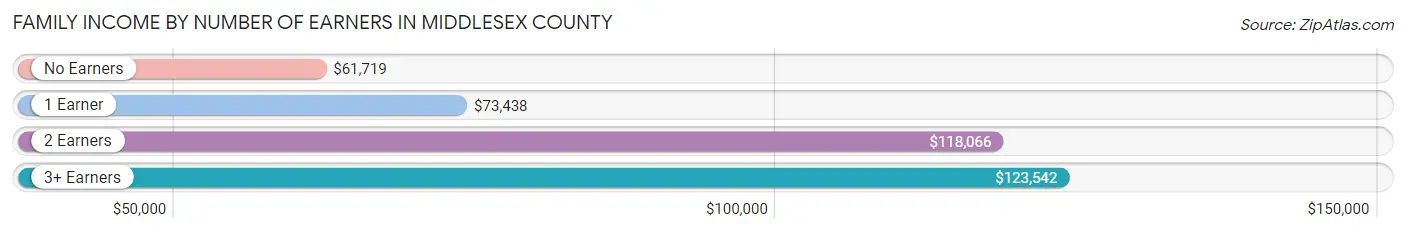
| Number of Earners | # Families | Median Income |
| No Earners | 897 (29.9%) | $61,719 |
| 1 Earner | 870 (29.0%) | $73,438 |
| 2 Earners | 1,044 (34.8%) | $118,066 |
| 3+ Earners | 189 (6.3%) | $123,542 |
| Total | 3,000 (100.0%) | $88,661 |
Household Income in Middlesex County
Household Income Brackets in Middlesex County
With 985 households falling in the category, the $100,000 to $149,999 income range is the most frequent in Middlesex County, accounting for 20.9% of all households. In contrast, only 141 households (3.0%) fall into the $10,000 to $14,999 income bracket, making it the least populous group.
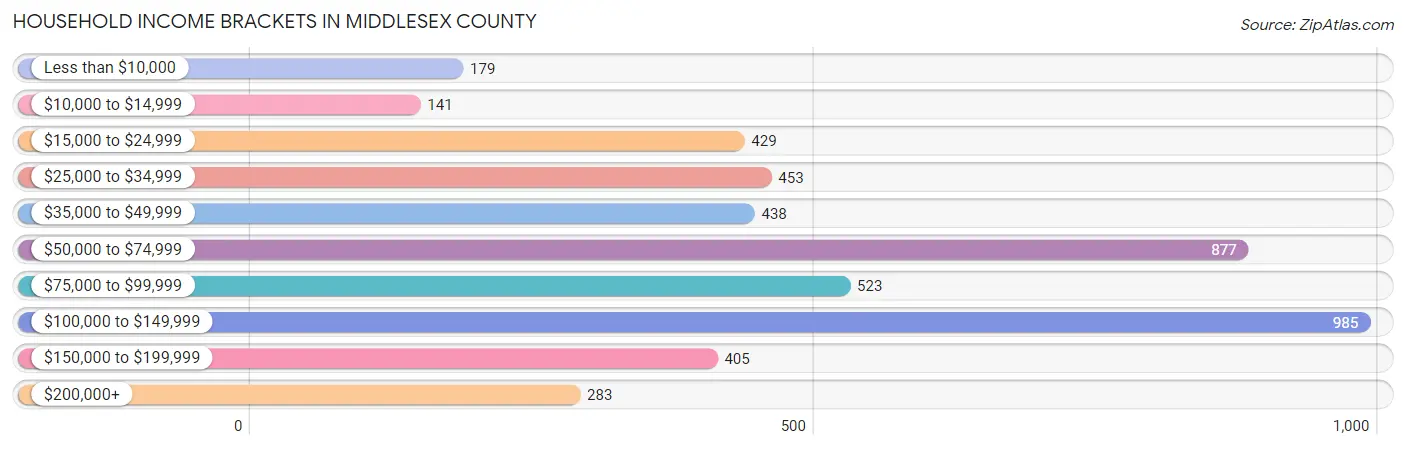
| Income Bracket | # Households | % Households |
| Less than $10,000 | 179 | 3.8% |
| $10,000 to $14,999 | 141 | 3.0% |
| $15,000 to $24,999 | 429 | 9.1% |
| $25,000 to $34,999 | 453 | 9.6% |
| $35,000 to $49,999 | 438 | 9.3% |
| $50,000 to $74,999 | 877 | 18.6% |
| $75,000 to $99,999 | 523 | 11.1% |
| $100,000 to $149,999 | 985 | 20.9% |
| $150,000 to $199,999 | 405 | 8.6% |
| $200,000+ | 283 | 6.0% |
Household Income by Householder Age in Middlesex County
The median household income in Middlesex County is $69,389, with the highest median household income of $101,023 found in the 25 to 44 years age bracket for the primary householder. A total of 735 households (15.6%) fall into this category. Meanwhile, the 65+ years age bracket for the primary householder has the lowest median household income of $56,861, with 2,337 households (49.6%) in this group.
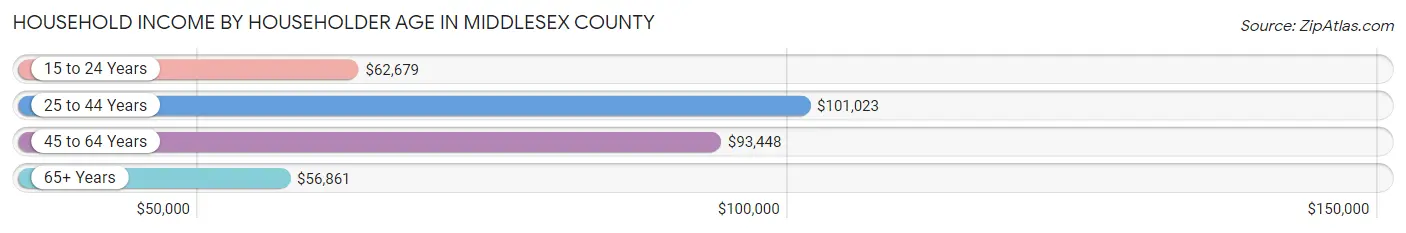
| Income Bracket | # Households | Median Income |
| 15 to 24 Years | 132 (2.8%) | $62,679 |
| 25 to 44 Years | 735 (15.6%) | $101,023 |
| 45 to 64 Years | 1,510 (32.0%) | $93,448 |
| 65+ Years | 2,337 (49.6%) | $56,861 |
| Total | 4,714 (100.0%) | $69,389 |
Poverty in Middlesex County
Income Below Poverty by Sex and Age in Middlesex County
With 7.4% poverty level for males and 11.8% for females among the residents of Middlesex County, 5 year old males and 25 to 34 year old females are the most vulnerable to poverty, with 24 males (54.5%) and 145 females (31.2%) in their respective age groups living below the poverty level.
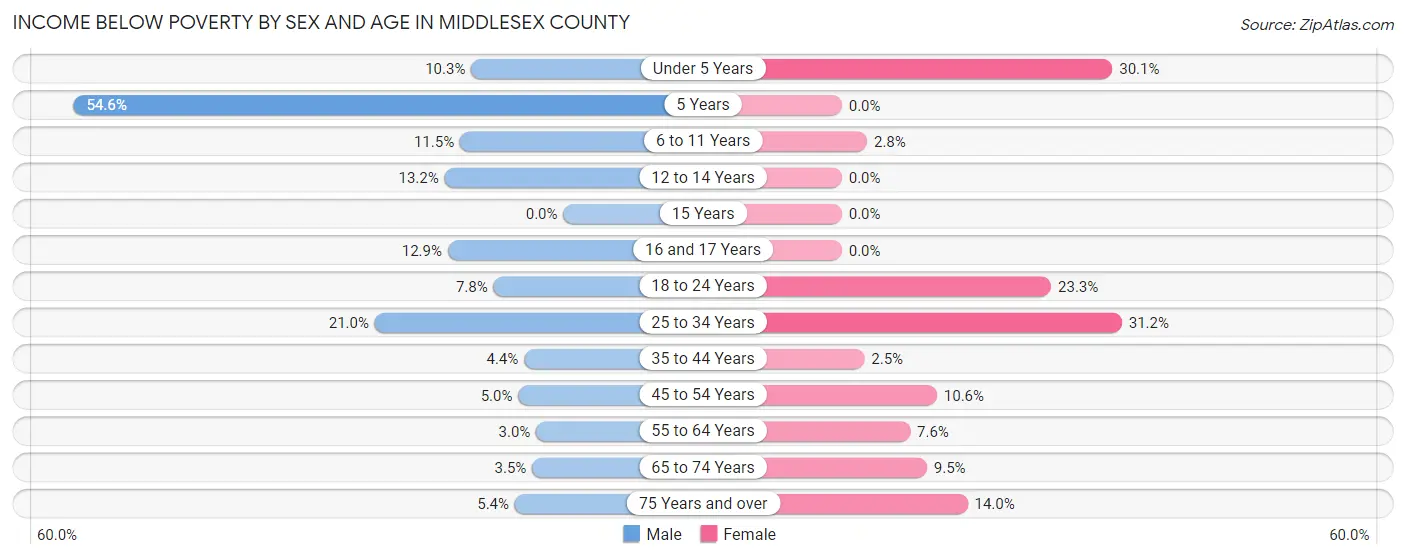
| Age Bracket | Male | Female |
| Under 5 Years | 12 (10.3%) | 47 (30.1%) |
| 5 Years | 24 (54.5%) | 0 (0.0%) |
| 6 to 11 Years | 32 (11.5%) | 10 (2.8%) |
| 12 to 14 Years | 25 (13.2%) | 0 (0.0%) |
| 15 Years | 0 (0.0%) | 0 (0.0%) |
| 16 and 17 Years | 13 (12.9%) | 0 (0.0%) |
| 18 to 24 Years | 22 (7.8%) | 76 (23.3%) |
| 25 to 34 Years | 97 (21.0%) | 145 (31.2%) |
| 35 to 44 Years | 19 (4.4%) | 11 (2.5%) |
| 45 to 54 Years | 30 (5.0%) | 56 (10.6%) |
| 55 to 64 Years | 24 (3.0%) | 70 (7.6%) |
| 65 to 74 Years | 30 (3.5%) | 99 (9.5%) |
| 75 Years and over | 43 (5.4%) | 105 (14.0%) |
| Total | 371 (7.4%) | 619 (11.8%) |
Income Above Poverty by Sex and Age in Middlesex County
According to the poverty statistics in Middlesex County, males aged 15 years and females aged 5 years are the age groups that are most secure financially, with 100.0% of males and 100.0% of females in these age groups living above the poverty line.
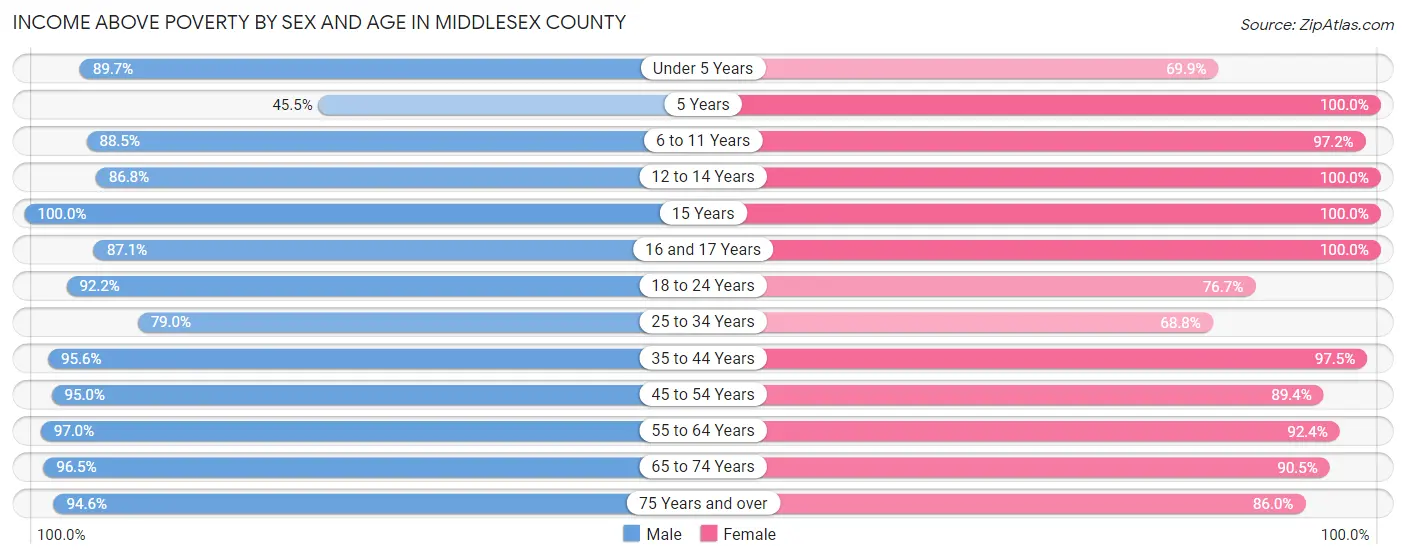
| Age Bracket | Male | Female |
| Under 5 Years | 105 (89.7%) | 109 (69.9%) |
| 5 Years | 20 (45.5%) | 38 (100.0%) |
| 6 to 11 Years | 246 (88.5%) | 346 (97.2%) |
| 12 to 14 Years | 164 (86.8%) | 112 (100.0%) |
| 15 Years | 75 (100.0%) | 40 (100.0%) |
| 16 and 17 Years | 88 (87.1%) | 47 (100.0%) |
| 18 to 24 Years | 261 (92.2%) | 250 (76.7%) |
| 25 to 34 Years | 365 (79.0%) | 320 (68.8%) |
| 35 to 44 Years | 416 (95.6%) | 428 (97.5%) |
| 45 to 54 Years | 568 (95.0%) | 473 (89.4%) |
| 55 to 64 Years | 769 (97.0%) | 850 (92.4%) |
| 65 to 74 Years | 835 (96.5%) | 946 (90.5%) |
| 75 Years and over | 753 (94.6%) | 645 (86.0%) |
| Total | 4,665 (92.6%) | 4,604 (88.1%) |
Income Below Poverty Among Married-Couple Families in Middlesex County
The poverty statistics for married-couple families in Middlesex County show that 3.6% or 89 of the total 2,460 families live below the poverty line. Families with 3 or 4 children have the highest poverty rate of 9.9%, comprising of 9 families. On the other hand, families with no children have the lowest poverty rate of 2.3%, which includes 44 families.
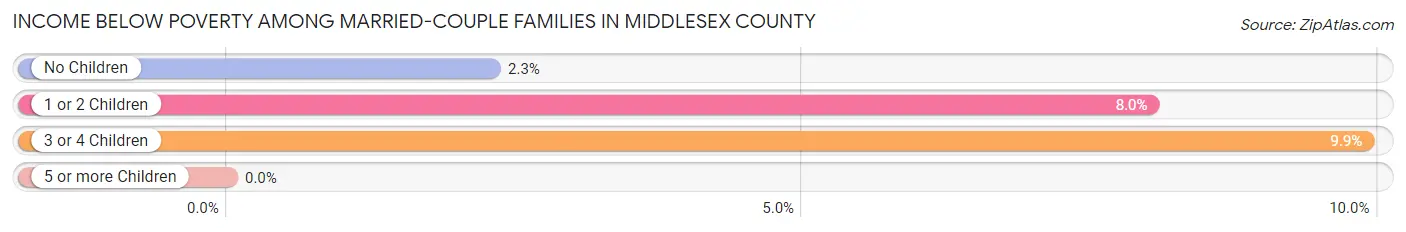
| Children | Above Poverty | Below Poverty |
| No Children | 1,876 (97.7%) | 44 (2.3%) |
| 1 or 2 Children | 413 (92.0%) | 36 (8.0%) |
| 3 or 4 Children | 82 (90.1%) | 9 (9.9%) |
| 5 or more Children | 0 (0.0%) | 0 (0.0%) |
| Total | 2,371 (96.4%) | 89 (3.6%) |
Income Below Poverty Among Single-Parent Households in Middlesex County
According to the poverty data in Middlesex County, 8.8% or 13 single-father households and 28.8% or 113 single-mother households are living below the poverty line. Among single-father households, those with no children have the highest poverty rate, with 6 households (21.4%) experiencing poverty. Likewise, among single-mother households, those with 1 or 2 children have the highest poverty rate, with 62 households (44.0%) falling below the poverty line.
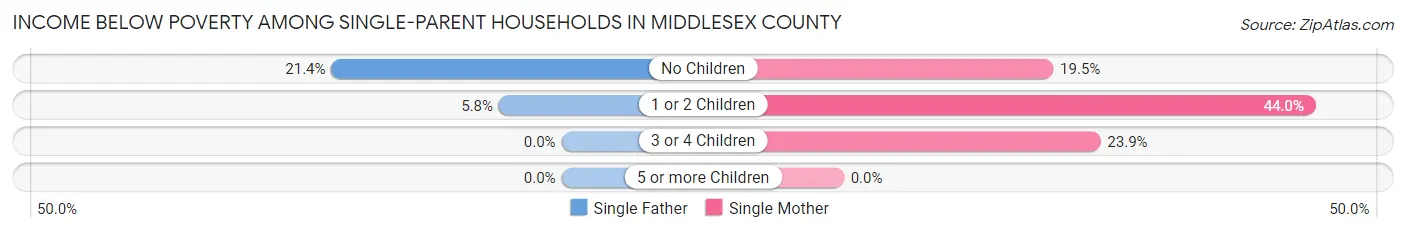
| Children | Single Father | Single Mother |
| No Children | 6 (21.4%) | 40 (19.5%) |
| 1 or 2 Children | 7 (5.8%) | 62 (44.0%) |
| 3 or 4 Children | 0 (0.0%) | 11 (23.9%) |
| 5 or more Children | 0 (0.0%) | 0 (0.0%) |
| Total | 13 (8.8%) | 113 (28.8%) |
Income Below Poverty Among Married-Couple vs Single-Parent Households in Middlesex County
The poverty data for Middlesex County shows that 89 of the married-couple family households (3.6%) and 126 of the single-parent households (23.3%) are living below the poverty level. Within the married-couple family households, those with 3 or 4 children have the highest poverty rate, with 9 households (9.9%) falling below the poverty line. Among the single-parent households, those with 1 or 2 children have the highest poverty rate, with 69 household (26.4%) living below poverty.
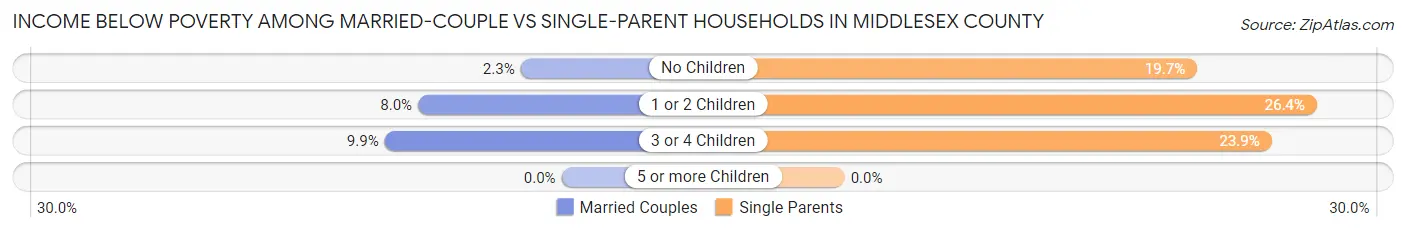
| Children | Married-Couple Families | Single-Parent Households |
| No Children | 44 (2.3%) | 46 (19.7%) |
| 1 or 2 Children | 36 (8.0%) | 69 (26.4%) |
| 3 or 4 Children | 9 (9.9%) | 11 (23.9%) |
| 5 or more Children | 0 (0.0%) | 0 (0.0%) |
| Total | 89 (3.6%) | 126 (23.3%) |
Race in Middlesex County
The most populous races in Middlesex County are White / Caucasian (8,479 | 79.0%), Black / African American (1,588 | 14.8%), and Two or more Races (361 | 3.4%).
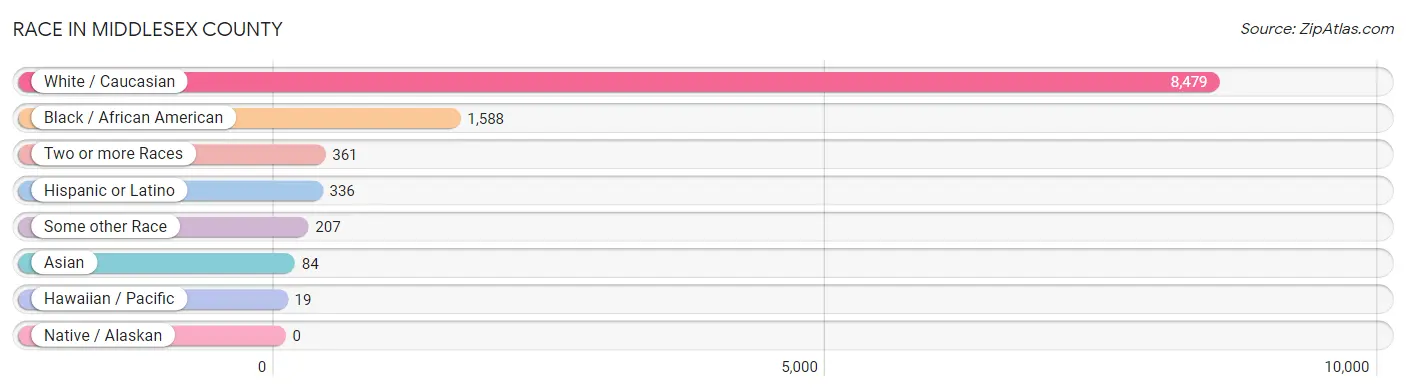
| Race | # Population | % Population |
| Asian | 84 | 0.8% |
| Black / African American | 1,588 | 14.8% |
| Hawaiian / Pacific | 19 | 0.2% |
| Hispanic or Latino | 336 | 3.1% |
| Native / Alaskan | 0 | 0.0% |
| White / Caucasian | 8,479 | 79.0% |
| Two or more Races | 361 | 3.4% |
| Some other Race | 207 | 1.9% |
| Total | 10,738 | 100.0% |
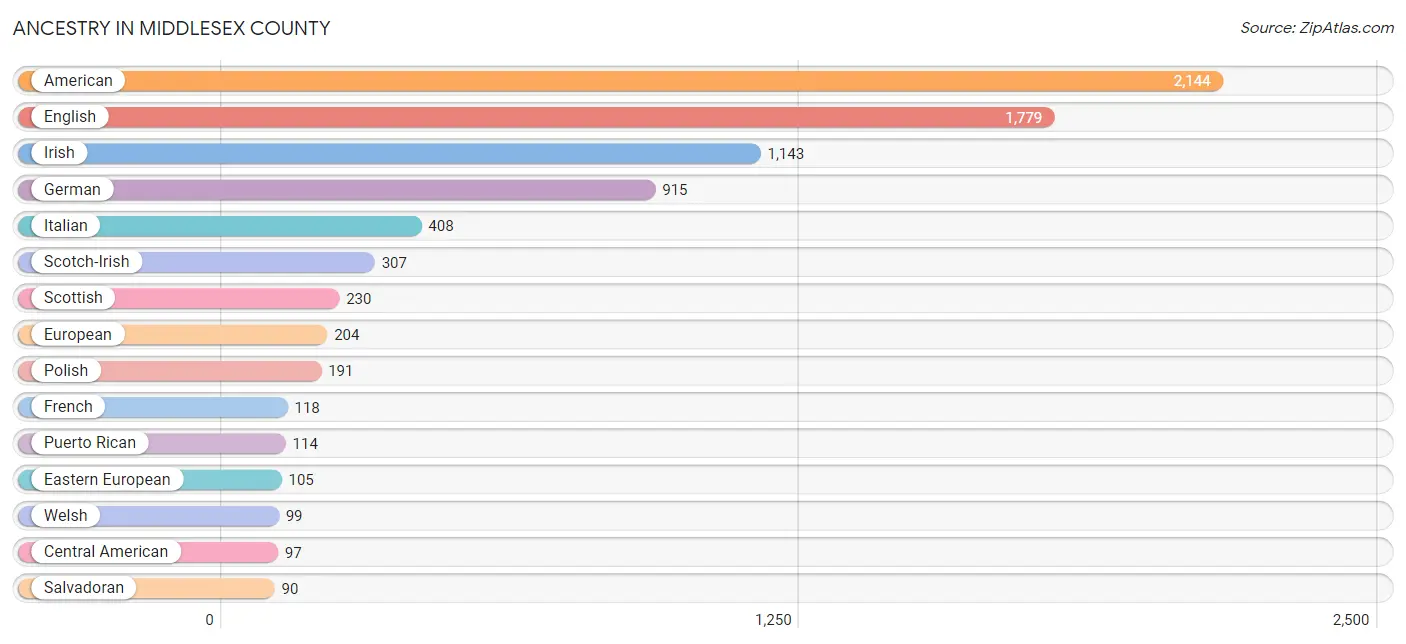
Ancestry in Middlesex County
The most populous ancestries reported in Middlesex County are American (2,144 | 20.0%), English (1,779 | 16.6%), Irish (1,143 | 10.6%), German (915 | 8.5%), and Italian (408 | 3.8%), together accounting for 59.5% of all Middlesex County residents.
| Ancestry | # Population | % Population |
| African | 6 | 0.1% |
| American | 2,144 | 20.0% |
| Belgian | 8 | 0.1% |
| Bolivian | 6 | 0.1% |
| British | 46 | 0.4% |
| Burmese | 3 | 0.0% |
| Canadian | 19 | 0.2% |
| Central American | 97 | 0.9% |
| Cherokee | 64 | 0.6% |
| Croatian | 5 | 0.1% |
| Czech | 7 | 0.1% |
| Danish | 13 | 0.1% |
| Dutch | 34 | 0.3% |
| Eastern European | 105 | 1.0% |
| English | 1,779 | 16.6% |
| European | 204 | 1.9% |
| Finnish | 21 | 0.2% |
| French | 118 | 1.1% |
| French Canadian | 44 | 0.4% |
| German | 915 | 8.5% |
| Honduran | 7 | 0.1% |
| Hungarian | 6 | 0.1% |
| Indian (Asian) | 23 | 0.2% |
| Irish | 1,143 | 10.6% |
| Italian | 408 | 3.8% |
| Laotian | 6 | 0.1% |
| Lithuanian | 9 | 0.1% |
| Mexican | 62 | 0.6% |
| Northern European | 17 | 0.2% |
| Norwegian | 67 | 0.6% |
| Polish | 191 | 1.8% |
| Portuguese | 19 | 0.2% |
| Puerto Rican | 114 | 1.1% |
| Russian | 20 | 0.2% |
| Salvadoran | 90 | 0.8% |
| Scandinavian | 9 | 0.1% |
| Scotch-Irish | 307 | 2.9% |
| Scottish | 230 | 2.1% |
| Sioux | 13 | 0.1% |
| Slovak | 54 | 0.5% |
| South American | 6 | 0.1% |
| Spaniard | 6 | 0.1% |
| Sri Lankan | 4 | 0.0% |
| Subsaharan African | 6 | 0.1% |
| Swedish | 54 | 0.5% |
| Swiss | 7 | 0.1% |
| Thai | 11 | 0.1% |
| Ukrainian | 7 | 0.1% |
| Welsh | 99 | 0.9% |
| Yugoslavian | 13 | 0.1% | View All 50 Rows |
Immigrants in Middlesex County
The most numerous immigrant groups reported in Middlesex County came from Latin America (160 | 1.5%), Central America (155 | 1.4%), Europe (123 | 1.1%), El Salvador (90 | 0.8%), and Asia (65 | 0.6%), together accounting for 5.5% of all Middlesex County residents.
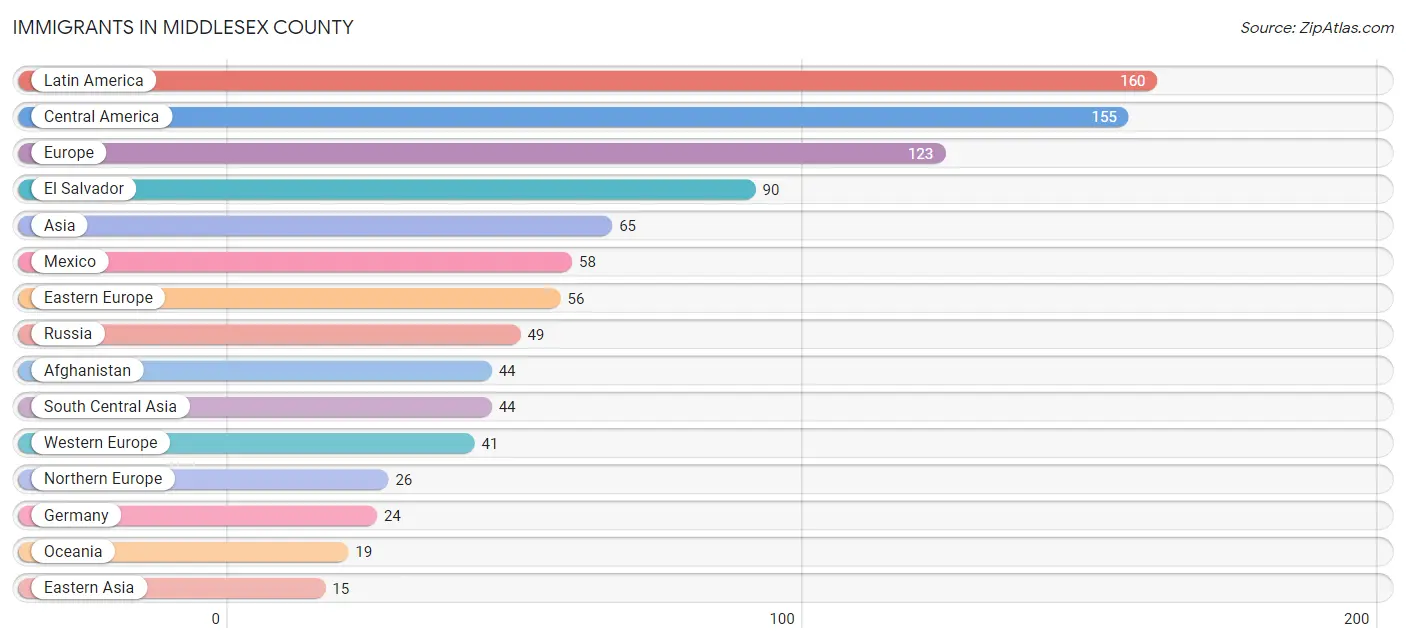
| Immigration Origin | # Population | % Population |
| Afghanistan | 44 | 0.4% |
| Asia | 65 | 0.6% |
| Belgium | 8 | 0.1% |
| Canada | 14 | 0.1% |
| Caribbean | 5 | 0.1% |
| Central America | 155 | 1.4% |
| China | 12 | 0.1% |
| Eastern Asia | 15 | 0.1% |
| Eastern Europe | 56 | 0.5% |
| El Salvador | 90 | 0.8% |
| England | 10 | 0.1% |
| Europe | 123 | 1.1% |
| Germany | 24 | 0.2% |
| Honduras | 7 | 0.1% |
| Indonesia | 6 | 0.1% |
| Korea | 3 | 0.0% |
| Latin America | 160 | 1.5% |
| Mexico | 58 | 0.5% |
| Netherlands | 9 | 0.1% |
| Northern Europe | 26 | 0.2% |
| Oceania | 19 | 0.2% |
| Russia | 49 | 0.5% |
| Scotland | 7 | 0.1% |
| South Central Asia | 44 | 0.4% |
| South Eastern Asia | 6 | 0.1% |
| Trinidad and Tobago | 5 | 0.1% |
| Ukraine | 7 | 0.1% |
| Western Europe | 41 | 0.4% | View All 28 Rows |
Sex and Age in Middlesex County
Sex and Age in Middlesex County
The most populous age groups in Middlesex County are 65 to 69 Years (492 | 9.2%) for men and 60 to 64 Years (576 | 10.7%) for women.
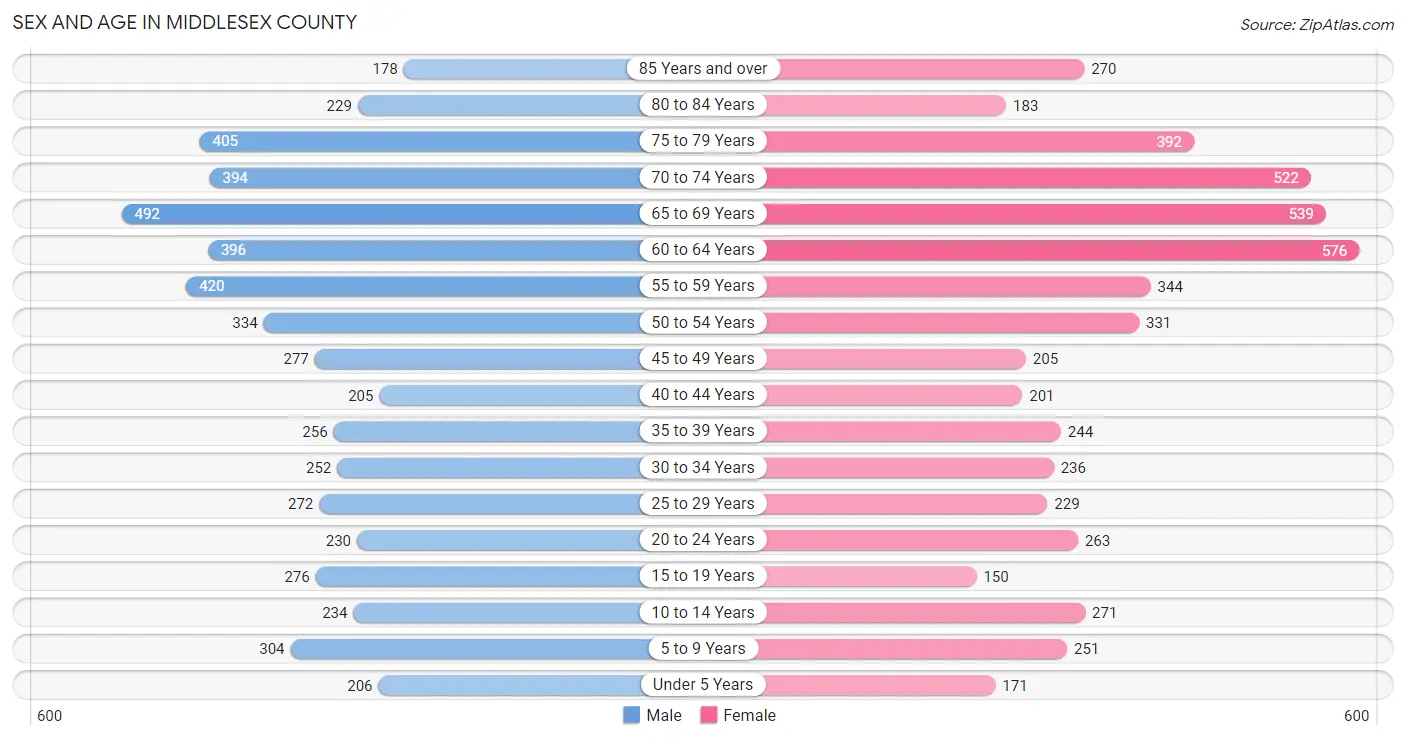
| Age Bracket | Male | Female |
| Under 5 Years | 206 (3.8%) | 171 (3.2%) |
| 5 to 9 Years | 304 (5.7%) | 251 (4.7%) |
| 10 to 14 Years | 234 (4.4%) | 271 (5.0%) |
| 15 to 19 Years | 276 (5.1%) | 150 (2.8%) |
| 20 to 24 Years | 230 (4.3%) | 263 (4.9%) |
| 25 to 29 Years | 272 (5.1%) | 229 (4.3%) |
| 30 to 34 Years | 252 (4.7%) | 236 (4.4%) |
| 35 to 39 Years | 256 (4.8%) | 244 (4.5%) |
| 40 to 44 Years | 205 (3.8%) | 201 (3.7%) |
| 45 to 49 Years | 277 (5.2%) | 205 (3.8%) |
| 50 to 54 Years | 334 (6.2%) | 331 (6.1%) |
| 55 to 59 Years | 420 (7.8%) | 344 (6.4%) |
| 60 to 64 Years | 396 (7.4%) | 576 (10.7%) |
| 65 to 69 Years | 492 (9.2%) | 539 (10.0%) |
| 70 to 74 Years | 394 (7.3%) | 522 (9.7%) |
| 75 to 79 Years | 405 (7.6%) | 392 (7.3%) |
| 80 to 84 Years | 229 (4.3%) | 183 (3.4%) |
| 85 Years and over | 178 (3.3%) | 270 (5.0%) |
| Total | 5,360 (100.0%) | 5,378 (100.0%) |
Families and Households in Middlesex County
Median Family Size in Middlesex County
The median family size in Middlesex County is 2.64 persons per family, with single male/father families (148 | 4.9%) accounting for the largest median family size of 3.07 persons per family. On the other hand, married-couple families (2,460 | 82.0%) represent the smallest median family size with 2.61 persons per family.
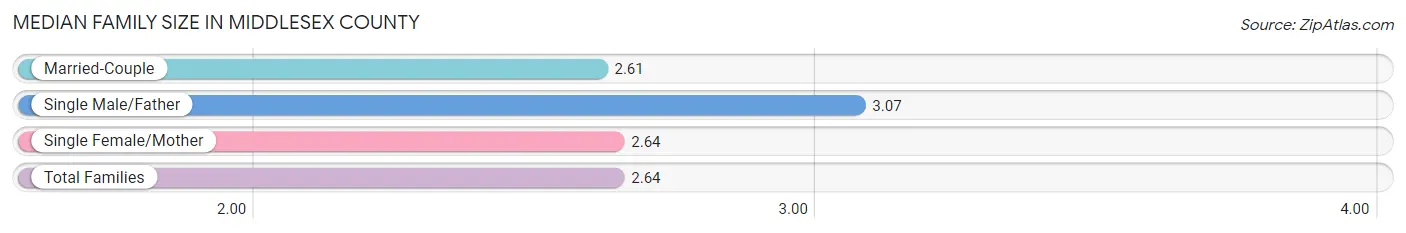
| Family Type | # Families | Family Size |
| Married-Couple | 2,460 (82.0%) | 2.61 |
| Single Male/Father | 148 (4.9%) | 3.07 |
| Single Female/Mother | 392 (13.1%) | 2.64 |
| Total Families | 3,000 (100.0%) | 2.64 |
Median Household Size in Middlesex County
The median household size in Middlesex County is 2.19 persons per household, with single male/father households (148 | 3.1%) accounting for the largest median household size of 3.45 persons per household. non-family households (1,714 | 36.4%) represent the smallest median household size with 1.27 persons per household.
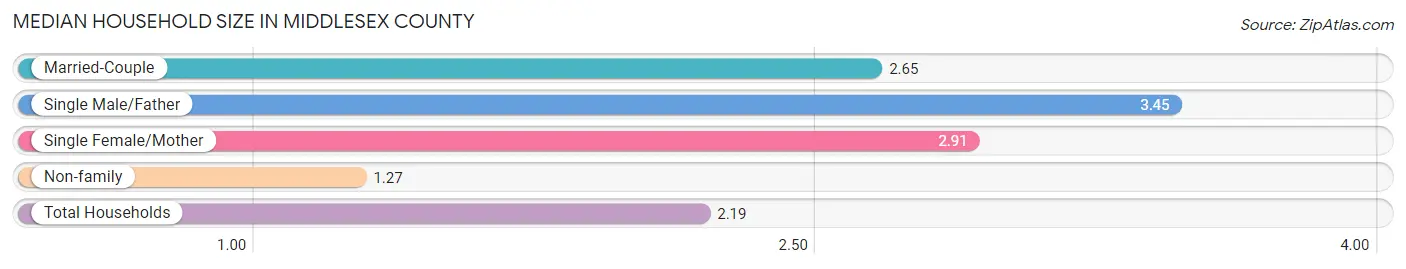
| Household Type | # Households | Household Size |
| Married-Couple | 2,460 (52.2%) | 2.65 |
| Single Male/Father | 148 (3.1%) | 3.45 |
| Single Female/Mother | 392 (8.3%) | 2.91 |
| Non-family | 1,714 (36.4%) | 1.27 |
| Total Households | 4,714 (100.0%) | 2.19 |
Household Size by Marriage Status in Middlesex County
Out of a total of 4,714 households in Middlesex County, 3,000 (63.6%) are family households, while 1,714 (36.4%) are nonfamily households. The most numerous type of family households are 2-person households, comprising 1,909, and the most common type of nonfamily households are 1-person households, comprising 1,439.
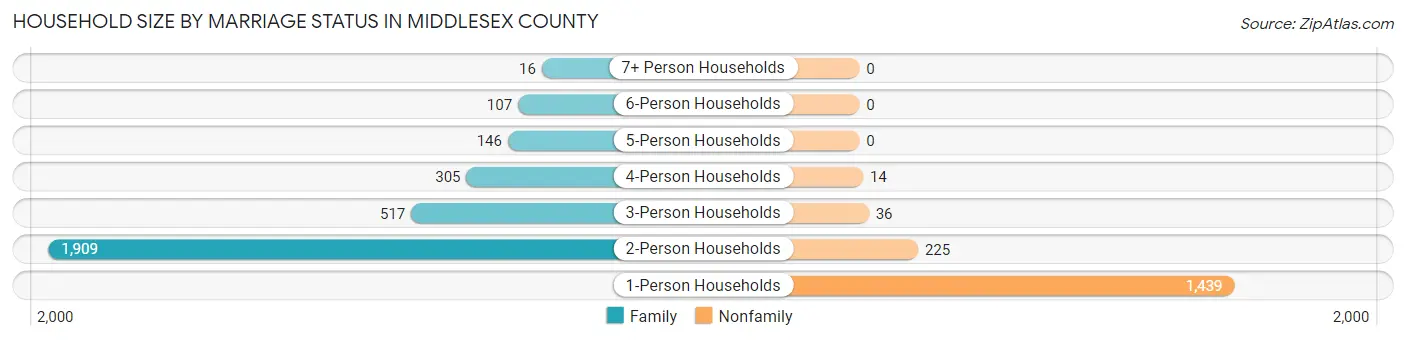
| Household Size | Family Households | Nonfamily Households |
| 1-Person Households | - | 1,439 (30.5%) |
| 2-Person Households | 1,909 (40.5%) | 225 (4.8%) |
| 3-Person Households | 517 (11.0%) | 36 (0.8%) |
| 4-Person Households | 305 (6.5%) | 14 (0.3%) |
| 5-Person Households | 146 (3.1%) | 0 (0.0%) |
| 6-Person Households | 107 (2.3%) | 0 (0.0%) |
| 7+ Person Households | 16 (0.3%) | 0 (0.0%) |
| Total | 3,000 (63.6%) | 1,714 (36.4%) |
Female Fertility in Middlesex County
Fertility by Age in Middlesex County
Average fertility rate in Middlesex County is 22.0 births per 1,000 women. Women in the age bracket of 35 to 50 years have the highest fertility rate with 34.0 births per 1,000 women. Women in the age bracket of 35 to 50 years acount for 67.6% of all women with births.
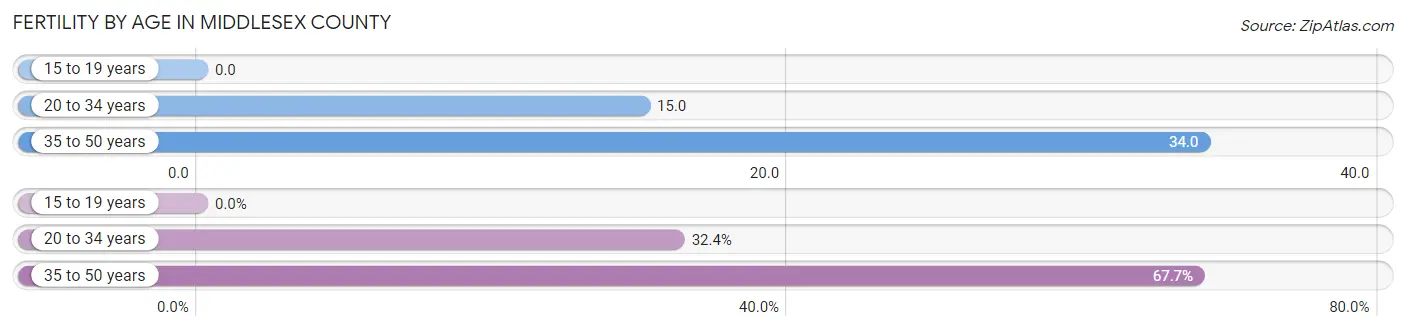
| Age Bracket | Women with Births | Births / 1,000 Women |
| 15 to 19 years | 0 (0.0%) | 0.0 |
| 20 to 34 years | 11 (32.4%) | 15.0 |
| 35 to 50 years | 23 (67.6%) | 34.0 |
| Total | 34 (100.0%) | 22.0 |
Fertility by Age by Marriage Status in Middlesex County
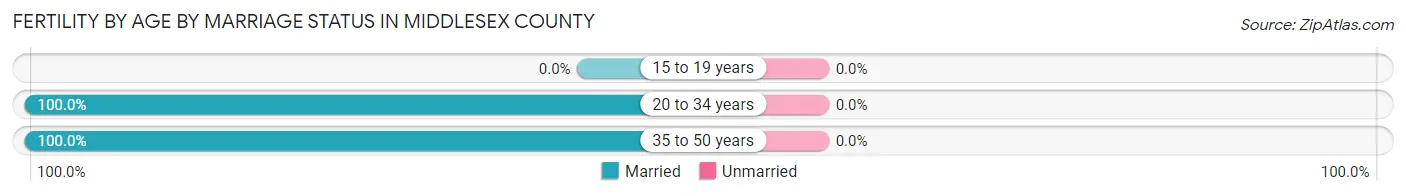
| Age Bracket | Married | Unmarried |
| 15 to 19 years | 0 (0.0%) | 0 (0.0%) |
| 20 to 34 years | 11 (100.0%) | 0 (0.0%) |
| 35 to 50 years | 23 (100.0%) | 0 (0.0%) |
| Total | 34 (100.0%) | 0 (0.0%) |
Fertility by Education in Middlesex County
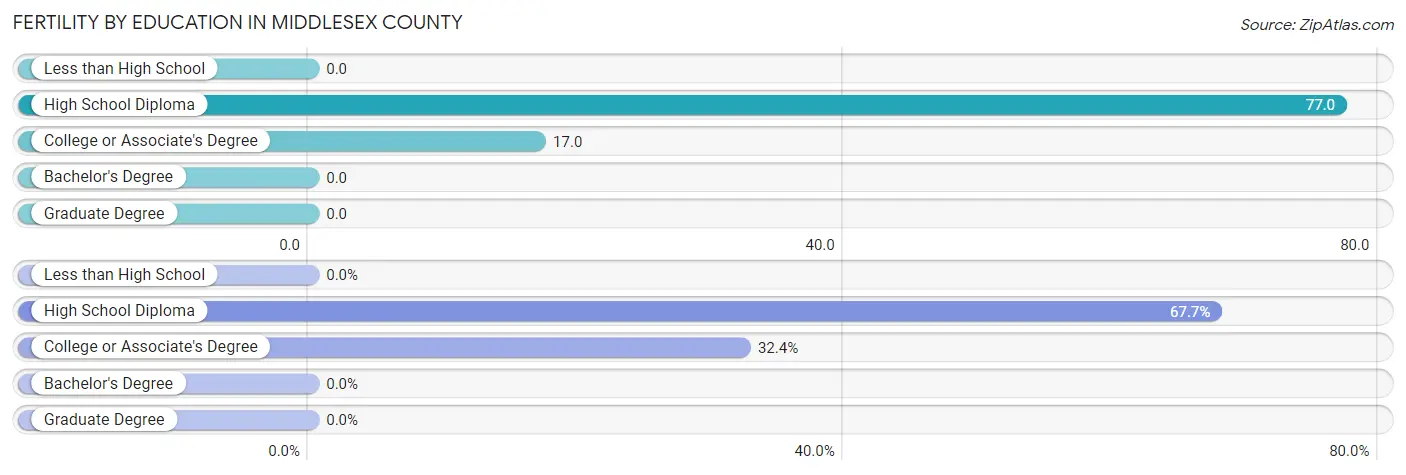
| Educational Attainment | Women with Births | Births / 1,000 Women |
| Less than High School | 0 (0.0%) | 0.0 |
| High School Diploma | 23 (67.6%) | 77.0 |
| College or Associate's Degree | 11 (32.4%) | 17.0 |
| Bachelor's Degree | 0 (0.0%) | 0.0 |
| Graduate Degree | 0 (0.0%) | 0.0 |
| Total | 34 (100.0%) | 22.0 |
Fertility by Education by Marriage Status in Middlesex County
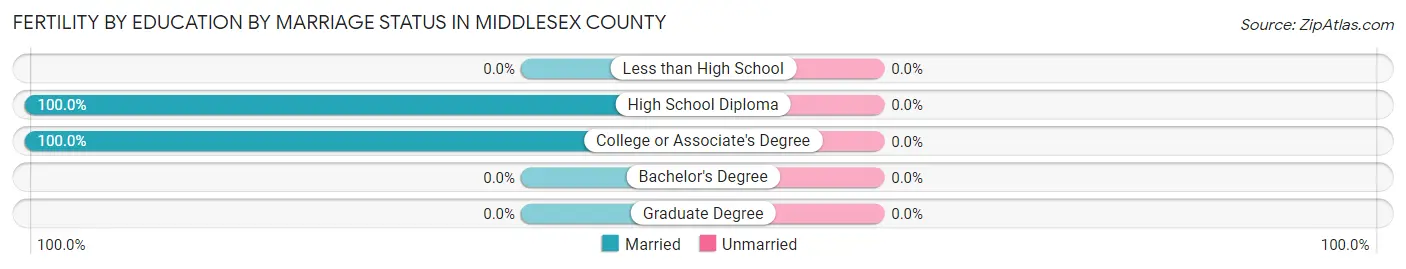
| Educational Attainment | Married | Unmarried |
| Less than High School | 0 (0.0%) | 0 (0.0%) |
| High School Diploma | 23 (100.0%) | 0 (0.0%) |
| College or Associate's Degree | 11 (100.0%) | 0 (0.0%) |
| Bachelor's Degree | 0 (0.0%) | 0 (0.0%) |
| Graduate Degree | 0 (0.0%) | 0 (0.0%) |
| Total | 34 (100.0%) | 0 (0.0%) |
Employment Characteristics in Middlesex County
Employment by Class of Employer in Middlesex County
Among the 4,437 employed individuals in Middlesex County, private company employees (2,730 | 61.5%), local government employees (367 | 8.3%), and self-employed (not incorporated) (357 | 8.1%) make up the most common classes of employment.
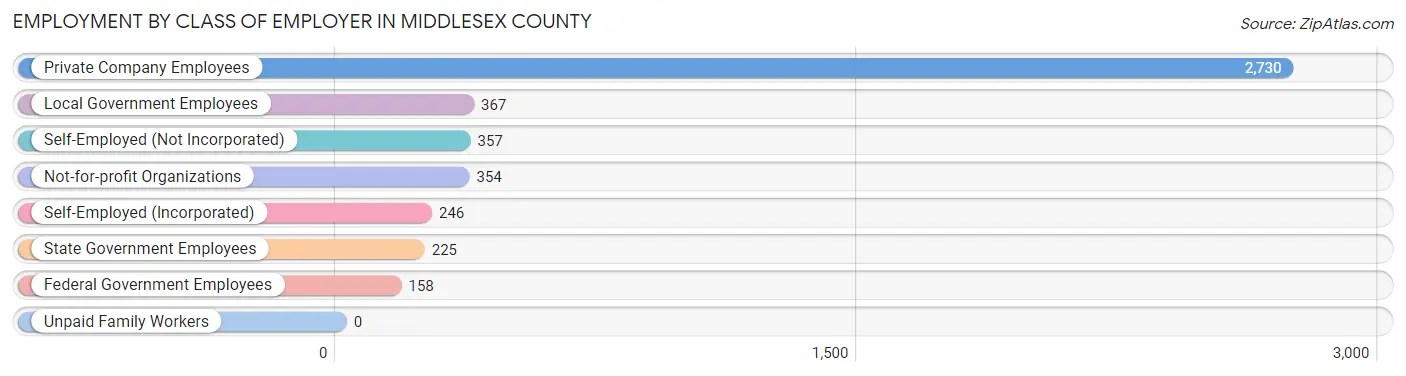
| Employer Class | # Employees | % Employees |
| Private Company Employees | 2,730 | 61.5% |
| Self-Employed (Incorporated) | 246 | 5.5% |
| Self-Employed (Not Incorporated) | 357 | 8.1% |
| Not-for-profit Organizations | 354 | 8.0% |
| Local Government Employees | 367 | 8.3% |
| State Government Employees | 225 | 5.1% |
| Federal Government Employees | 158 | 3.6% |
| Unpaid Family Workers | 0 | 0.0% |
| Total | 4,437 | 100.0% |
Employment Status by Age in Middlesex County
According to the labor force statistics for Middlesex County, out of the total population over 16 years of age (9,186), 51.4% or 4,722 individuals are in the labor force, with 4.6% or 217 of them unemployed. The age group with the highest labor force participation rate is 25 to 29 years, with 79.2% or 397 individuals in the labor force. Within the labor force, the 30 to 34 years age range has the highest percentage of unemployed individuals, with 14.1% or 50 of them being unemployed.
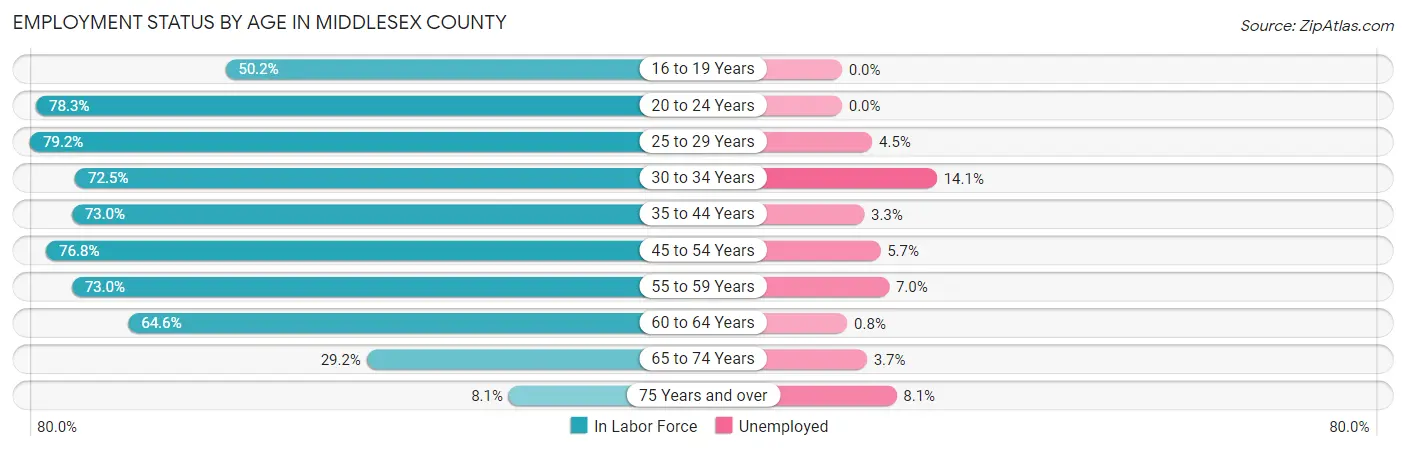
| Age Bracket | In Labor Force | Unemployed |
| 16 to 19 Years | 156 (50.2%) | 0 (0.0%) |
| 20 to 24 Years | 386 (78.3%) | 0 (0.0%) |
| 25 to 29 Years | 397 (79.2%) | 18 (4.5%) |
| 30 to 34 Years | 354 (72.5%) | 50 (14.1%) |
| 35 to 44 Years | 661 (73.0%) | 22 (3.3%) |
| 45 to 54 Years | 881 (76.8%) | 50 (5.7%) |
| 55 to 59 Years | 558 (73.0%) | 39 (7.0%) |
| 60 to 64 Years | 628 (64.6%) | 5 (0.8%) |
| 65 to 74 Years | 569 (29.2%) | 21 (3.7%) |
| 75 Years and over | 134 (8.1%) | 11 (8.1%) |
| Total | 4,722 (51.4%) | 217 (4.6%) |
Employment Status by Educational Attainment in Middlesex County
According to labor force statistics for Middlesex County, 72.8% of individuals (3,478) out of the total population between 25 and 64 years of age (4,778) are in the labor force, with 5.3% or 184 of them being unemployed. The group with the highest labor force participation rate are those with the educational attainment of bachelor's degree or higher, with 80.6% or 953 individuals in the labor force. Within the labor force, individuals with college / associate degree education have the highest percentage of unemployment, with 8.5% or 111 of them being unemployed.
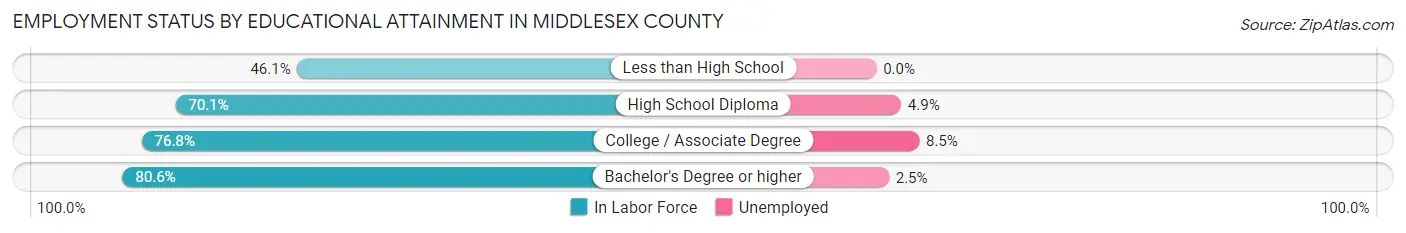
| Educational Attainment | In Labor Force | Unemployed |
| Less than High School | 209 (46.1%) | 0 (0.0%) |
| High School Diploma | 1,007 (70.1%) | 70 (4.9%) |
| College / Associate Degree | 1,310 (76.8%) | 145 (8.5%) |
| Bachelor's Degree or higher | 953 (80.6%) | 30 (2.5%) |
| Total | 3,478 (72.8%) | 253 (5.3%) |
Employment Occupations by Sex in Middlesex County
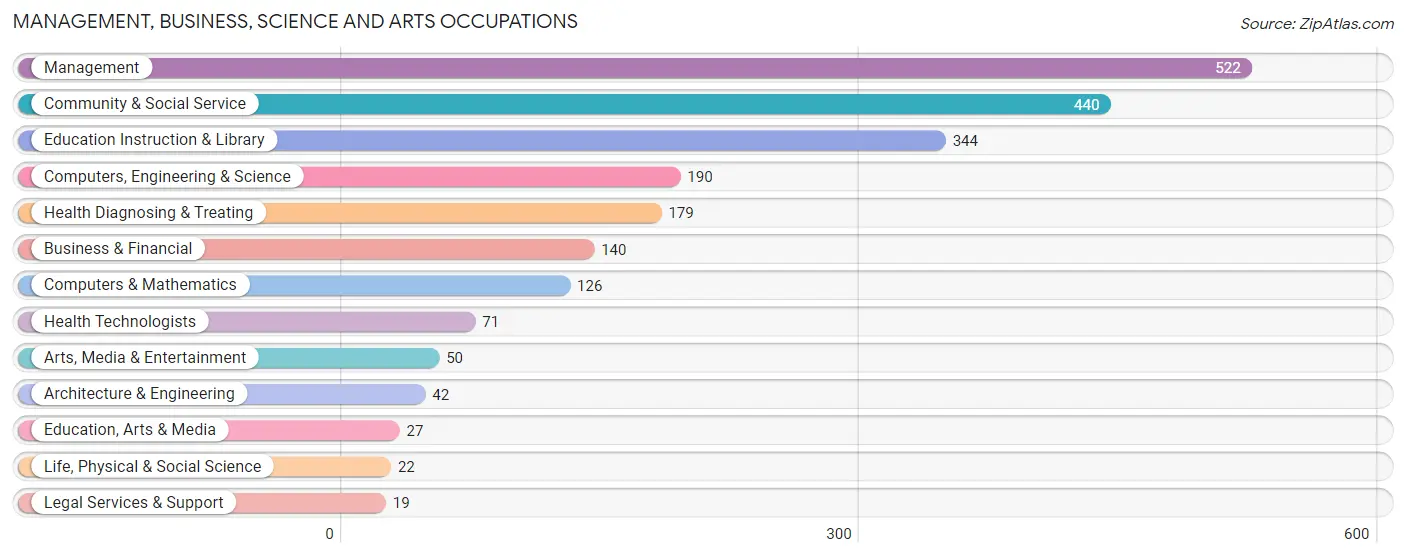
Management, Business, Science and Arts Occupations
The most common Management, Business, Science and Arts occupations in Middlesex County are Management (522 | 11.6%), Community & Social Service (440 | 9.8%), Education Instruction & Library (344 | 7.6%), Computers, Engineering & Science (190 | 4.2%), and Health Diagnosing & Treating (179 | 4.0%).
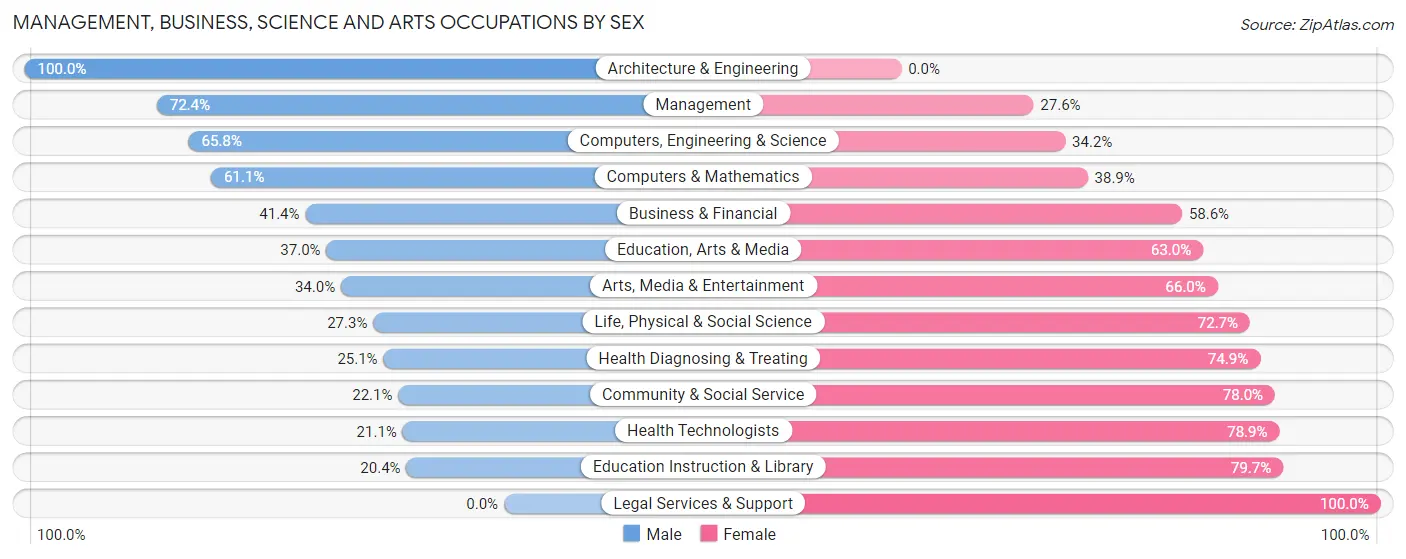
Management, Business, Science and Arts Occupations by Sex
Within the Management, Business, Science and Arts occupations in Middlesex County, the most male-oriented occupations are Architecture & Engineering (100.0%), Management (72.4%), and Computers, Engineering & Science (65.8%), while the most female-oriented occupations are Legal Services & Support (100.0%), Education Instruction & Library (79.6%), and Health Technologists (78.9%).
| Occupation | Male | Female |
| Management | 378 (72.4%) | 144 (27.6%) |
| Business & Financial | 58 (41.4%) | 82 (58.6%) |
| Computers, Engineering & Science | 125 (65.8%) | 65 (34.2%) |
| Computers & Mathematics | 77 (61.1%) | 49 (38.9%) |
| Architecture & Engineering | 42 (100.0%) | 0 (0.0%) |
| Life, Physical & Social Science | 6 (27.3%) | 16 (72.7%) |
| Community & Social Service | 97 (22.1%) | 343 (77.9%) |
| Education, Arts & Media | 10 (37.0%) | 17 (63.0%) |
| Legal Services & Support | 0 (0.0%) | 19 (100.0%) |
| Education Instruction & Library | 70 (20.3%) | 274 (79.6%) |
| Arts, Media & Entertainment | 17 (34.0%) | 33 (66.0%) |
| Health Diagnosing & Treating | 45 (25.1%) | 134 (74.9%) |
| Health Technologists | 15 (21.1%) | 56 (78.9%) |
| Total (Category) | 703 (47.8%) | 768 (52.2%) |
| Total (Overall) | 2,412 (53.5%) | 2,097 (46.5%) |
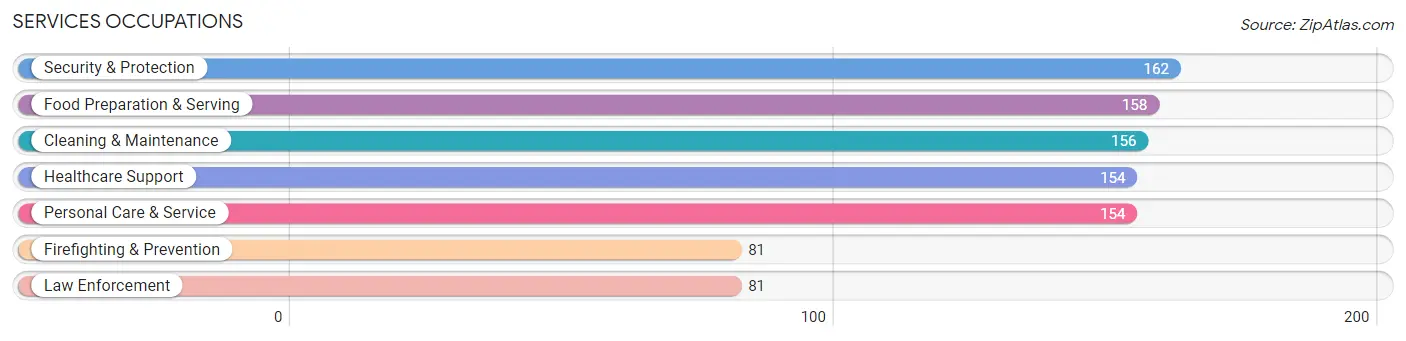
Services Occupations
The most common Services occupations in Middlesex County are Security & Protection (162 | 3.6%), Food Preparation & Serving (158 | 3.5%), Cleaning & Maintenance (156 | 3.5%), Healthcare Support (154 | 3.4%), and Personal Care & Service (154 | 3.4%).
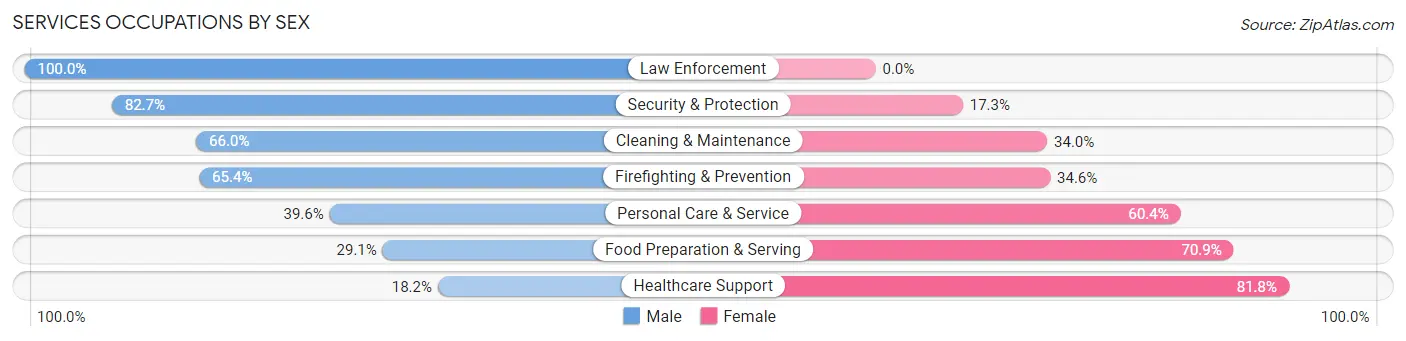
Services Occupations by Sex
Within the Services occupations in Middlesex County, the most male-oriented occupations are Law Enforcement (100.0%), Security & Protection (82.7%), and Cleaning & Maintenance (66.0%), while the most female-oriented occupations are Healthcare Support (81.8%), Food Preparation & Serving (70.9%), and Personal Care & Service (60.4%).
| Occupation | Male | Female |
| Healthcare Support | 28 (18.2%) | 126 (81.8%) |
| Security & Protection | 134 (82.7%) | 28 (17.3%) |
| Firefighting & Prevention | 53 (65.4%) | 28 (34.6%) |
| Law Enforcement | 81 (100.0%) | 0 (0.0%) |
| Food Preparation & Serving | 46 (29.1%) | 112 (70.9%) |
| Cleaning & Maintenance | 103 (66.0%) | 53 (34.0%) |
| Personal Care & Service | 61 (39.6%) | 93 (60.4%) |
| Total (Category) | 372 (47.4%) | 412 (52.5%) |
| Total (Overall) | 2,412 (53.5%) | 2,097 (46.5%) |
Sales and Office Occupations
The most common Sales and Office occupations in Middlesex County are Sales & Related (791 | 17.5%), and Office & Administration (419 | 9.3%).
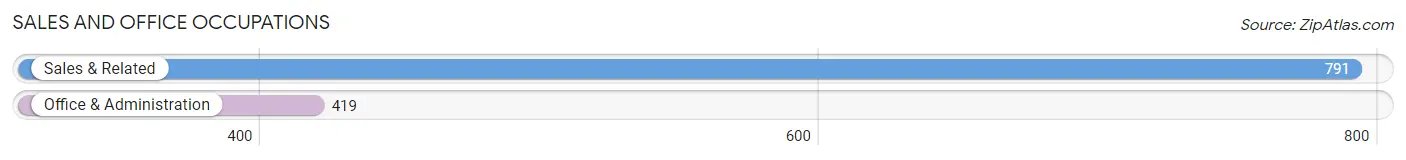
Sales and Office Occupations by Sex
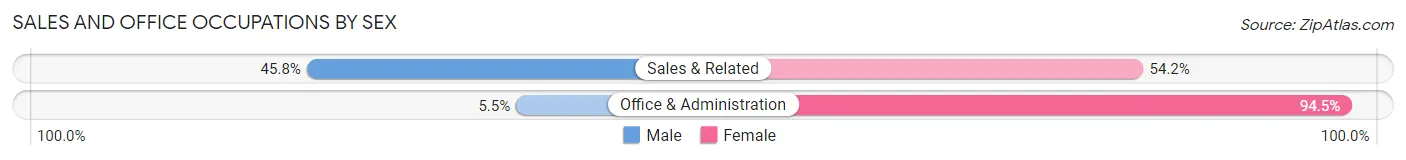
| Occupation | Male | Female |
| Sales & Related | 362 (45.8%) | 429 (54.2%) |
| Office & Administration | 23 (5.5%) | 396 (94.5%) |
| Total (Category) | 385 (31.8%) | 825 (68.2%) |
| Total (Overall) | 2,412 (53.5%) | 2,097 (46.5%) |
Natural Resources, Construction and Maintenance Occupations
The most common Natural Resources, Construction and Maintenance occupations in Middlesex County are Construction & Extraction (274 | 6.1%), Installation, Maintenance & Repair (270 | 6.0%), and Farming, Fishing & Forestry (28 | 0.6%).
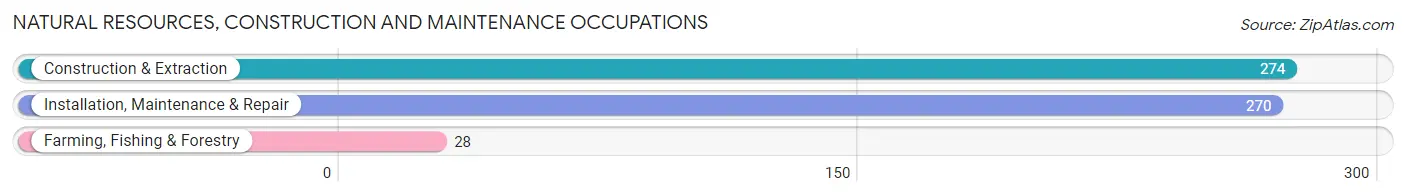
Natural Resources, Construction and Maintenance Occupations by Sex
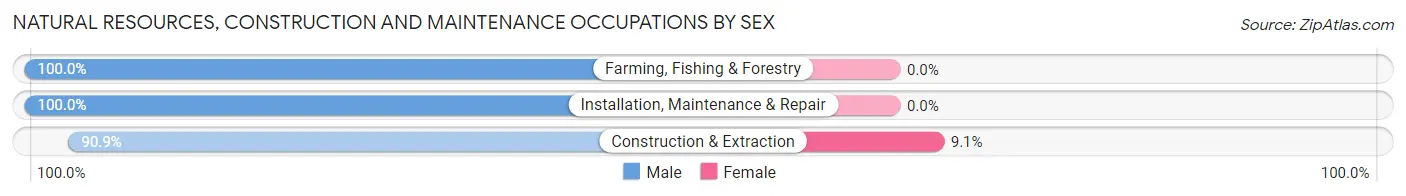
| Occupation | Male | Female |
| Farming, Fishing & Forestry | 28 (100.0%) | 0 (0.0%) |
| Construction & Extraction | 249 (90.9%) | 25 (9.1%) |
| Installation, Maintenance & Repair | 270 (100.0%) | 0 (0.0%) |
| Total (Category) | 547 (95.6%) | 25 (4.4%) |
| Total (Overall) | 2,412 (53.5%) | 2,097 (46.5%) |
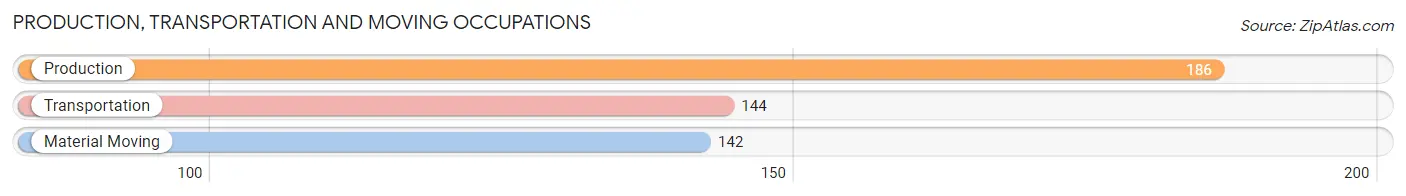
Production, Transportation and Moving Occupations
The most common Production, Transportation and Moving occupations in Middlesex County are Production (186 | 4.1%), Transportation (144 | 3.2%), and Material Moving (142 | 3.2%).
Production, Transportation and Moving Occupations by Sex
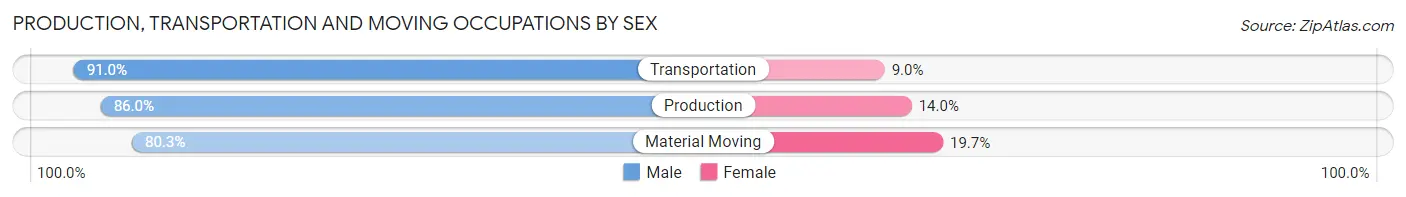
| Occupation | Male | Female |
| Production | 160 (86.0%) | 26 (14.0%) |
| Transportation | 131 (91.0%) | 13 (9.0%) |
| Material Moving | 114 (80.3%) | 28 (19.7%) |
| Total (Category) | 405 (85.8%) | 67 (14.2%) |
| Total (Overall) | 2,412 (53.5%) | 2,097 (46.5%) |
Employment Industries by Sex in Middlesex County
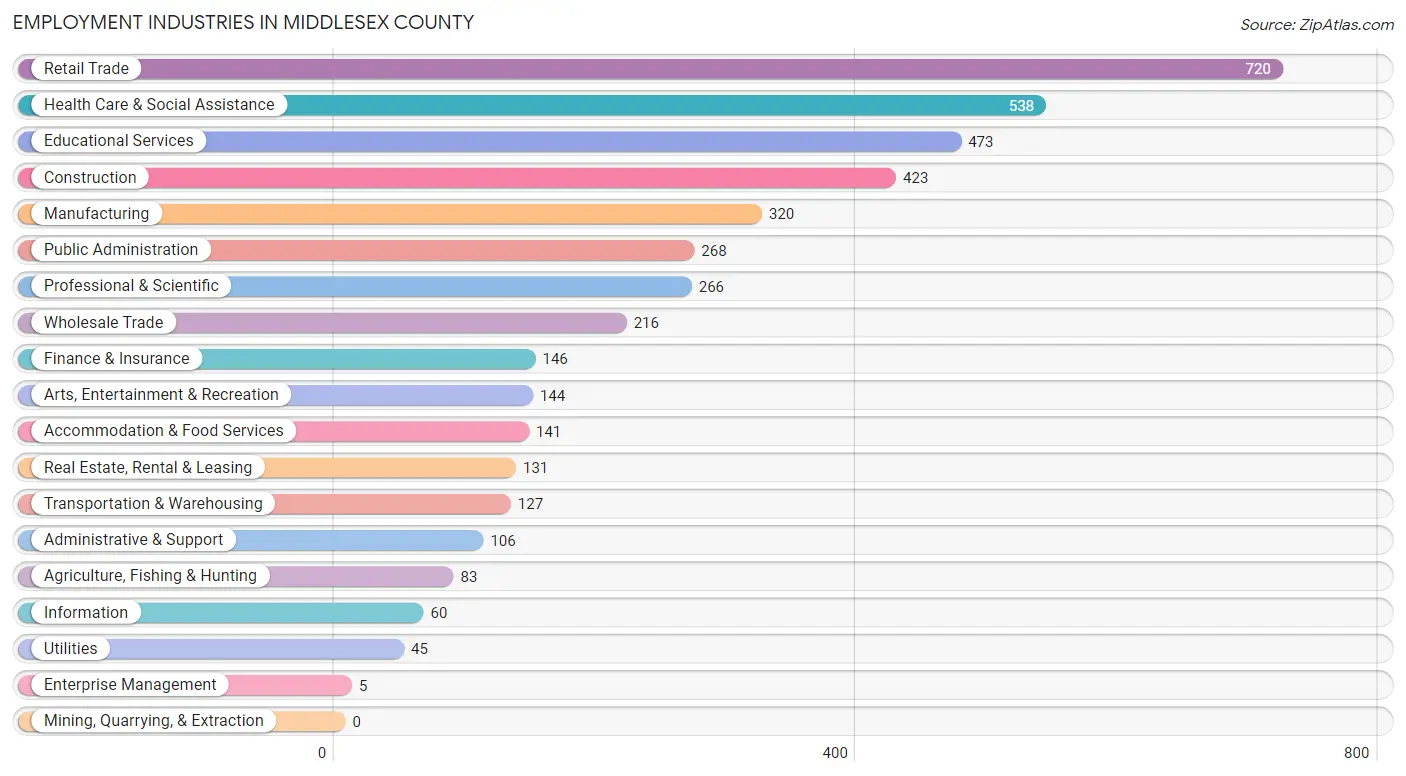
Employment Industries in Middlesex County
The major employment industries in Middlesex County include Retail Trade (720 | 16.0%), Health Care & Social Assistance (538 | 11.9%), Educational Services (473 | 10.5%), Construction (423 | 9.4%), and Manufacturing (320 | 7.1%).
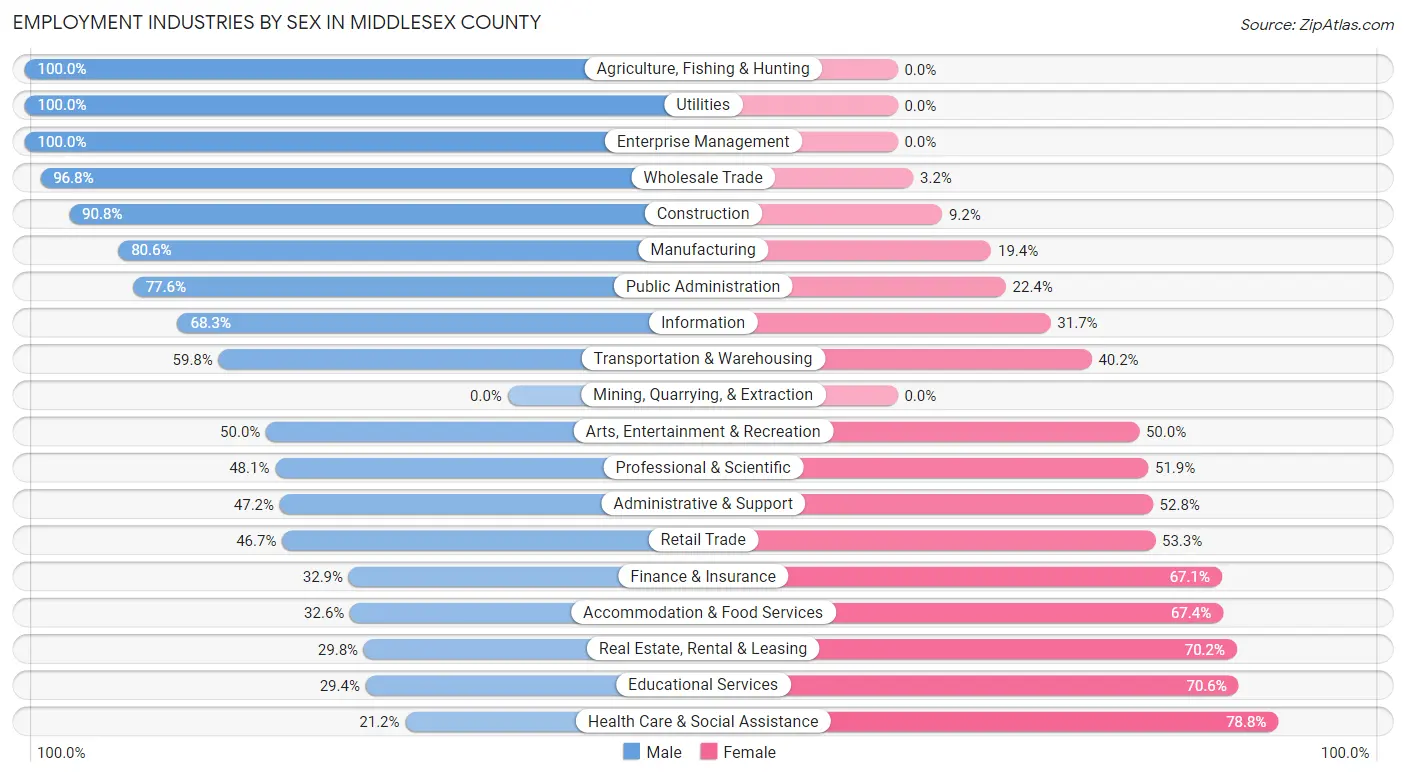
Employment Industries by Sex in Middlesex County
The Middlesex County industries that see more men than women are Agriculture, Fishing & Hunting (100.0%), Utilities (100.0%), and Enterprise Management (100.0%), whereas the industries that tend to have a higher number of women are Health Care & Social Assistance (78.8%), Educational Services (70.6%), and Real Estate, Rental & Leasing (70.2%).
| Industry | Male | Female |
| Agriculture, Fishing & Hunting | 83 (100.0%) | 0 (0.0%) |
| Mining, Quarrying, & Extraction | 0 (0.0%) | 0 (0.0%) |
| Construction | 384 (90.8%) | 39 (9.2%) |
| Manufacturing | 258 (80.6%) | 62 (19.4%) |
| Wholesale Trade | 209 (96.8%) | 7 (3.2%) |
| Retail Trade | 336 (46.7%) | 384 (53.3%) |
| Transportation & Warehousing | 76 (59.8%) | 51 (40.2%) |
| Utilities | 45 (100.0%) | 0 (0.0%) |
| Information | 41 (68.3%) | 19 (31.7%) |
| Finance & Insurance | 48 (32.9%) | 98 (67.1%) |
| Real Estate, Rental & Leasing | 39 (29.8%) | 92 (70.2%) |
| Professional & Scientific | 128 (48.1%) | 138 (51.9%) |
| Enterprise Management | 5 (100.0%) | 0 (0.0%) |
| Administrative & Support | 50 (47.2%) | 56 (52.8%) |
| Educational Services | 139 (29.4%) | 334 (70.6%) |
| Health Care & Social Assistance | 114 (21.2%) | 424 (78.8%) |
| Arts, Entertainment & Recreation | 72 (50.0%) | 72 (50.0%) |
| Accommodation & Food Services | 46 (32.6%) | 95 (67.4%) |
| Public Administration | 208 (77.6%) | 60 (22.4%) |
| Total | 2,412 (53.5%) | 2,097 (46.5%) |
Education in Middlesex County
School Enrollment in Middlesex County
The most common levels of schooling among the 1,791 students in Middlesex County are elementary school (491 | 27.4%), high school (385 | 21.5%), and college / undergraduate (355 | 19.8%).
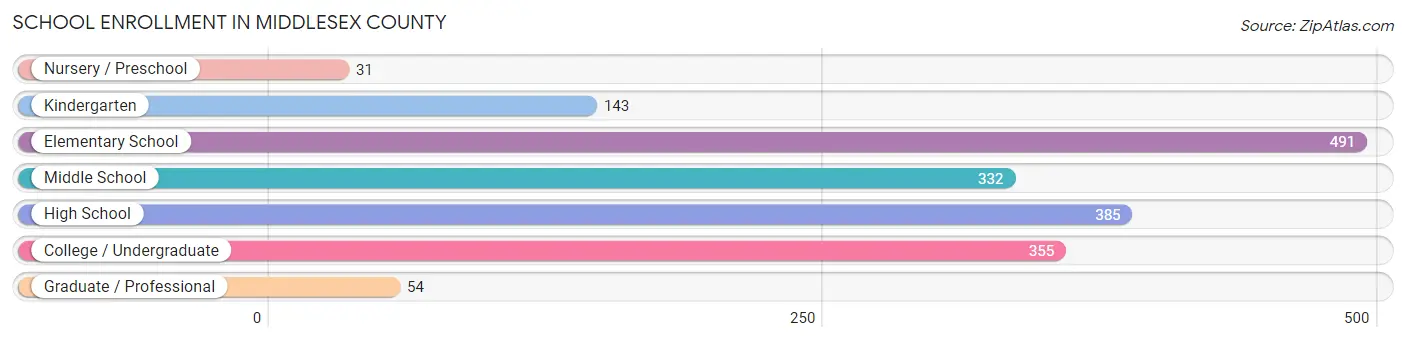
| School Level | # Students | % Students |
| Nursery / Preschool | 31 | 1.7% |
| Kindergarten | 143 | 8.0% |
| Elementary School | 491 | 27.4% |
| Middle School | 332 | 18.5% |
| High School | 385 | 21.5% |
| College / Undergraduate | 355 | 19.8% |
| Graduate / Professional | 54 | 3.0% |
| Total | 1,791 | 100.0% |
School Enrollment by Age by Funding Source in Middlesex County
Out of a total of 1,791 students who are enrolled in schools in Middlesex County, 206 (11.5%) attend a private institution, while the remaining 1,585 (88.5%) are enrolled in public schools. The age group of 35 years and over has the highest likelihood of being enrolled in private schools, with 61 (64.9% in the age bracket) enrolled. Conversely, the age group of 5 to 9 year old has the lowest likelihood of being enrolled in a private school, with 523 (98.1% in the age bracket) attending a public institution.
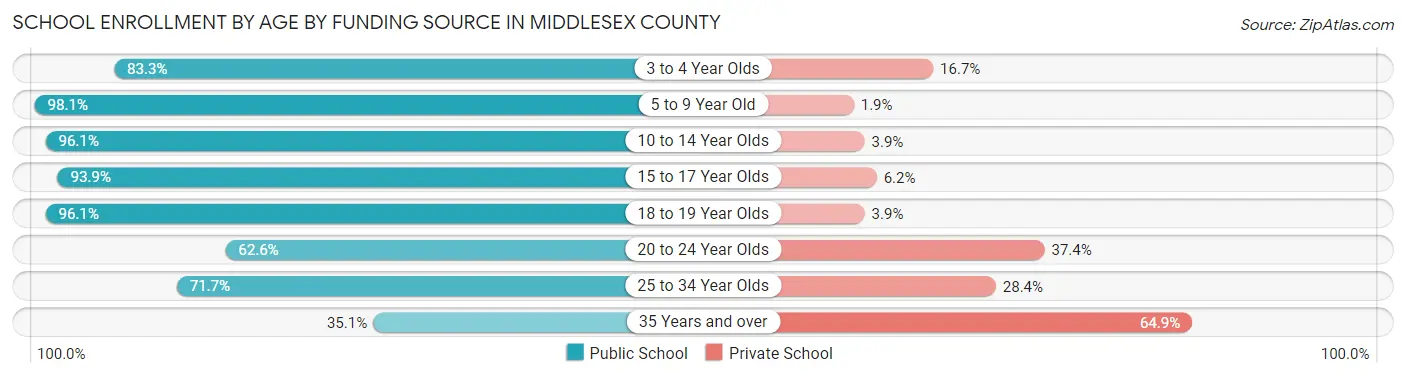
| Age Bracket | Public School | Private School |
| 3 to 4 Year Olds | 40 (83.3%) | 8 (16.7%) |
| 5 to 9 Year Old | 523 (98.1%) | 10 (1.9%) |
| 10 to 14 Year Olds | 444 (96.1%) | 18 (3.9%) |
| 15 to 17 Year Olds | 244 (93.9%) | 16 (6.1%) |
| 18 to 19 Year Olds | 123 (96.1%) | 5 (3.9%) |
| 20 to 24 Year Olds | 87 (62.6%) | 52 (37.4%) |
| 25 to 34 Year Olds | 91 (71.7%) | 36 (28.3%) |
| 35 Years and over | 33 (35.1%) | 61 (64.9%) |
| Total | 1,585 (88.5%) | 206 (11.5%) |
Educational Attainment by Field of Study in Middlesex County
Business (445 | 17.2%), education (306 | 11.8%), science & technology (260 | 10.1%), liberal arts & history (253 | 9.8%), and arts & humanities (200 | 7.7%) are the most common fields of study among 2,584 individuals in Middlesex County who have obtained a bachelor's degree or higher.
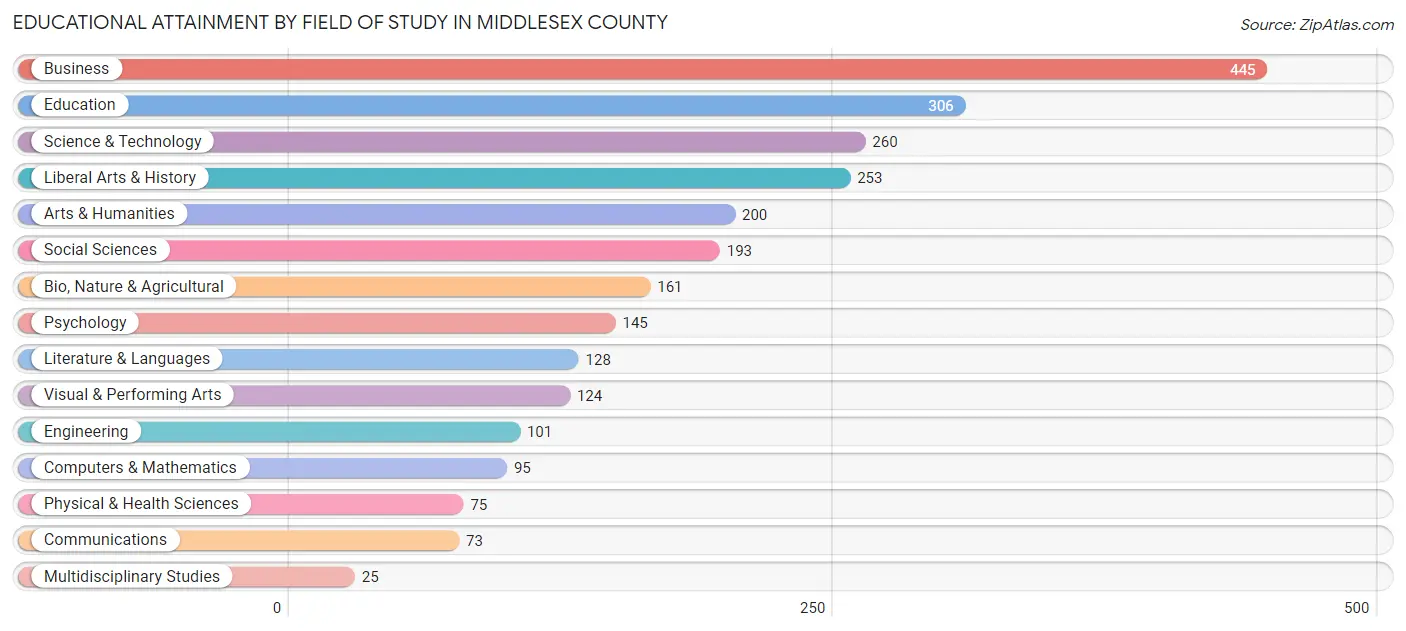
| Field of Study | # Graduates | % Graduates |
| Computers & Mathematics | 95 | 3.7% |
| Bio, Nature & Agricultural | 161 | 6.2% |
| Physical & Health Sciences | 75 | 2.9% |
| Psychology | 145 | 5.6% |
| Social Sciences | 193 | 7.5% |
| Engineering | 101 | 3.9% |
| Multidisciplinary Studies | 25 | 1.0% |
| Science & Technology | 260 | 10.1% |
| Business | 445 | 17.2% |
| Education | 306 | 11.8% |
| Literature & Languages | 128 | 5.0% |
| Liberal Arts & History | 253 | 9.8% |
| Visual & Performing Arts | 124 | 4.8% |
| Communications | 73 | 2.8% |
| Arts & Humanities | 200 | 7.7% |
| Total | 2,584 | 100.0% |
Transportation & Commute in Middlesex County
Vehicle Availability by Sex in Middlesex County
The most prevalent vehicle ownership categories in Middlesex County are males with 2 vehicles (886, accounting for 37.3%) and females with 2 vehicles (654, making up 43.4%).
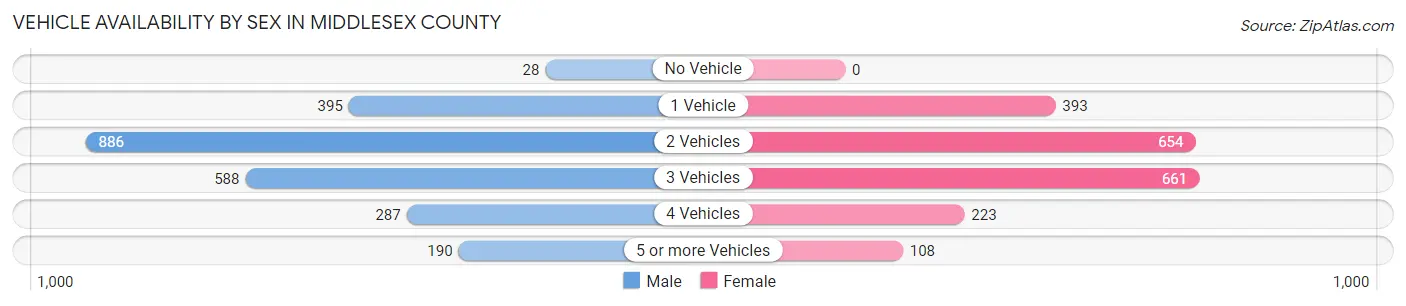
| Vehicles Available | Male | Female |
| No Vehicle | 28 (1.2%) | 0 (0.0%) |
| 1 Vehicle | 395 (16.6%) | 393 (19.3%) |
| 2 Vehicles | 886 (37.3%) | 654 (32.1%) |
| 3 Vehicles | 588 (24.8%) | 661 (32.4%) |
| 4 Vehicles | 287 (12.1%) | 223 (10.9%) |
| 5 or more Vehicles | 190 (8.0%) | 108 (5.3%) |
| Total | 2,374 (100.0%) | 2,039 (100.0%) |
Commute Time in Middlesex County
The most frequently occuring commute durations in Middlesex County are 20 to 24 minutes (544 commuters, 14.7%), 15 to 19 minutes (488 commuters, 13.2%), and 60 to 89 minutes (424 commuters, 11.5%).
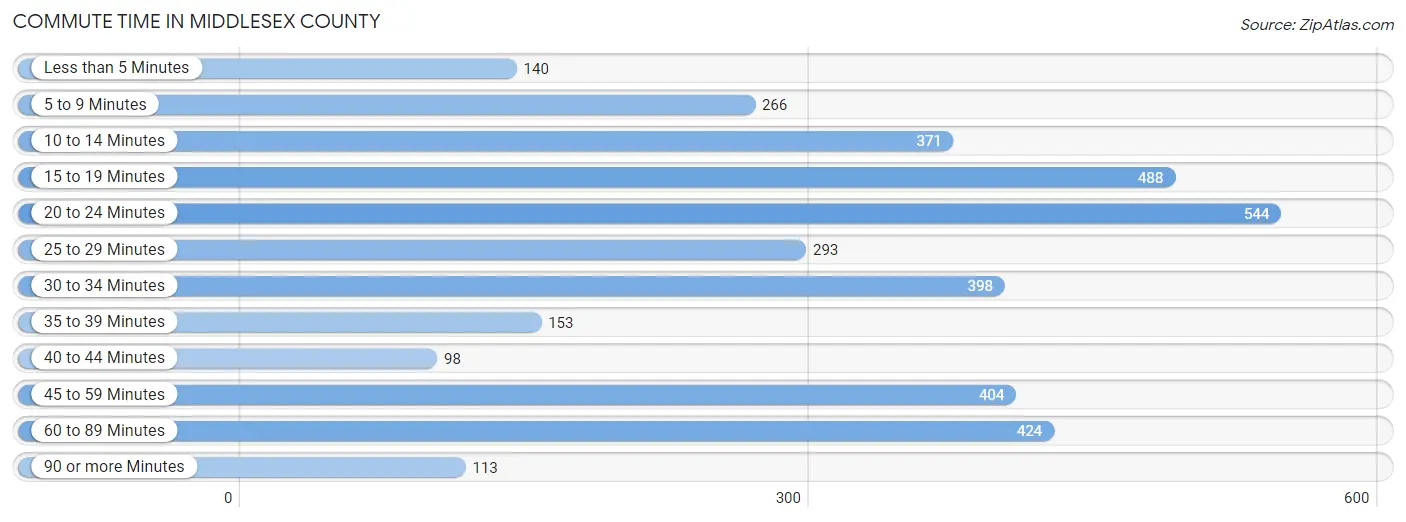
| Commute Time | # Commuters | % Commuters |
| Less than 5 Minutes | 140 | 3.8% |
| 5 to 9 Minutes | 266 | 7.2% |
| 10 to 14 Minutes | 371 | 10.1% |
| 15 to 19 Minutes | 488 | 13.2% |
| 20 to 24 Minutes | 544 | 14.7% |
| 25 to 29 Minutes | 293 | 7.9% |
| 30 to 34 Minutes | 398 | 10.8% |
| 35 to 39 Minutes | 153 | 4.1% |
| 40 to 44 Minutes | 98 | 2.6% |
| 45 to 59 Minutes | 404 | 10.9% |
| 60 to 89 Minutes | 424 | 11.5% |
| 90 or more Minutes | 113 | 3.1% |
Commute Time by Sex in Middlesex County
The most common commute times in Middlesex County are 20 to 24 minutes (314 commuters, 16.0%) for males and 15 to 19 minutes (285 commuters, 16.5%) for females.
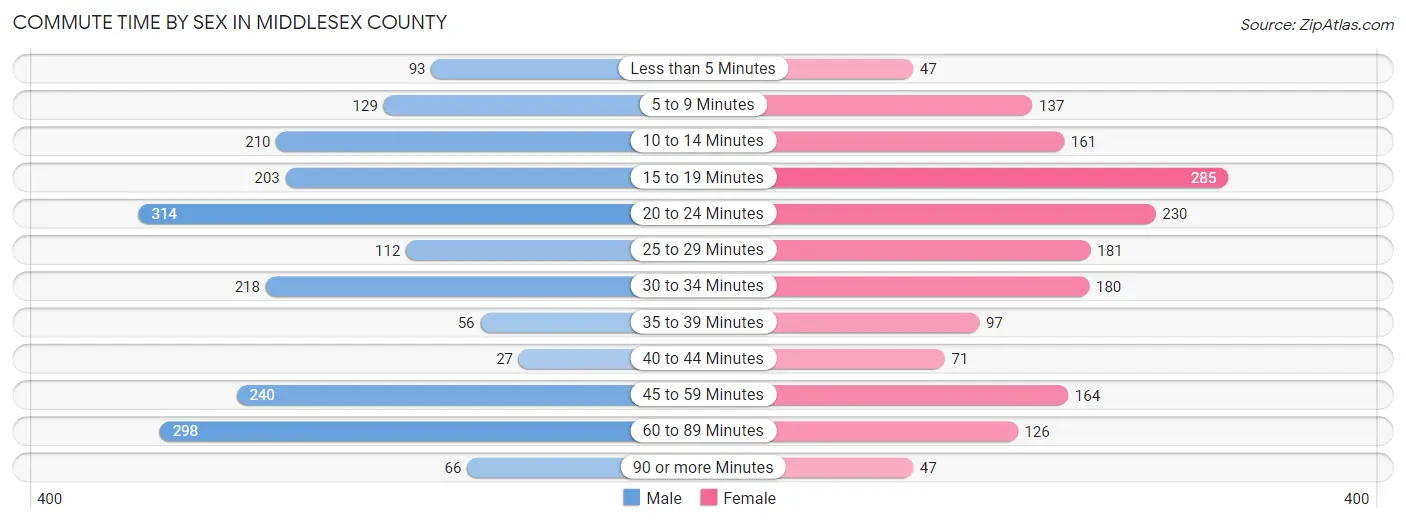
| Commute Time | Male | Female |
| Less than 5 Minutes | 93 (4.7%) | 47 (2.7%) |
| 5 to 9 Minutes | 129 (6.6%) | 137 (7.9%) |
| 10 to 14 Minutes | 210 (10.7%) | 161 (9.3%) |
| 15 to 19 Minutes | 203 (10.3%) | 285 (16.5%) |
| 20 to 24 Minutes | 314 (16.0%) | 230 (13.3%) |
| 25 to 29 Minutes | 112 (5.7%) | 181 (10.5%) |
| 30 to 34 Minutes | 218 (11.1%) | 180 (10.4%) |
| 35 to 39 Minutes | 56 (2.9%) | 97 (5.6%) |
| 40 to 44 Minutes | 27 (1.4%) | 71 (4.1%) |
| 45 to 59 Minutes | 240 (12.2%) | 164 (9.5%) |
| 60 to 89 Minutes | 298 (15.2%) | 126 (7.3%) |
| 90 or more Minutes | 66 (3.4%) | 47 (2.7%) |
Time of Departure to Work by Sex in Middlesex County
The most frequent times of departure to work in Middlesex County are 6:00 AM to 6:29 AM (396, 20.1%) for males and 7:00 AM to 7:29 AM (411, 23.8%) for females.
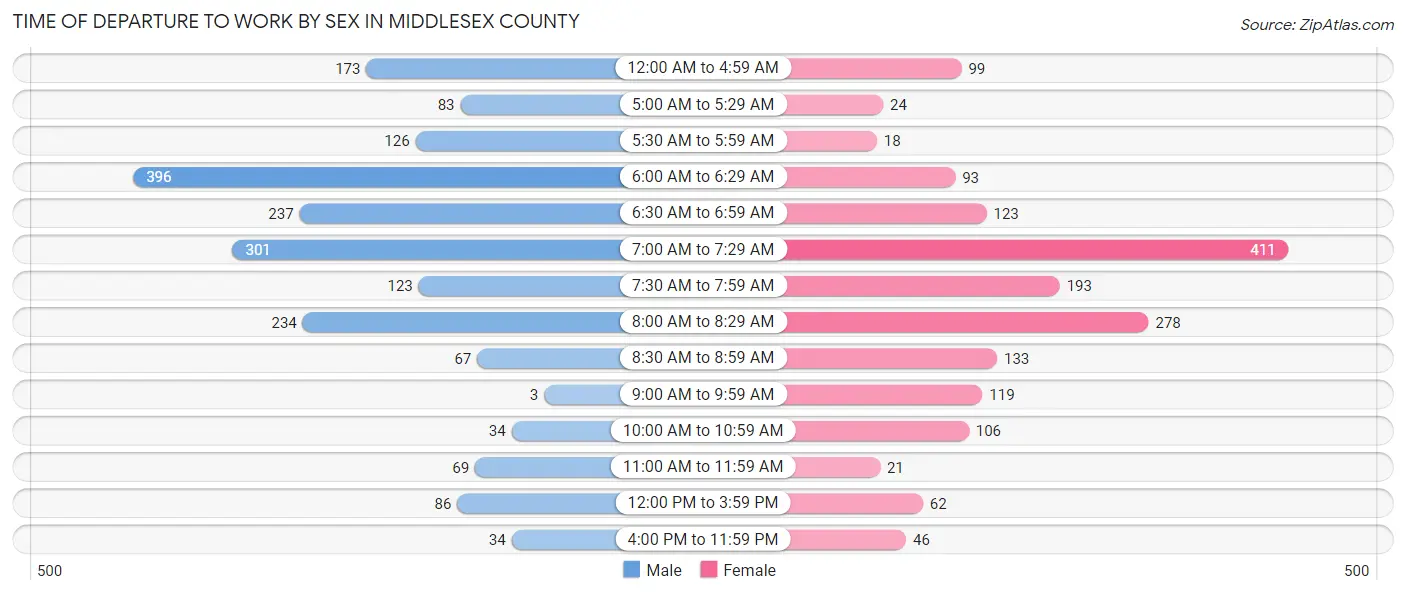
| Time of Departure | Male | Female |
| 12:00 AM to 4:59 AM | 173 (8.8%) | 99 (5.7%) |
| 5:00 AM to 5:29 AM | 83 (4.2%) | 24 (1.4%) |
| 5:30 AM to 5:59 AM | 126 (6.4%) | 18 (1.0%) |
| 6:00 AM to 6:29 AM | 396 (20.1%) | 93 (5.4%) |
| 6:30 AM to 6:59 AM | 237 (12.0%) | 123 (7.1%) |
| 7:00 AM to 7:29 AM | 301 (15.3%) | 411 (23.8%) |
| 7:30 AM to 7:59 AM | 123 (6.3%) | 193 (11.2%) |
| 8:00 AM to 8:29 AM | 234 (11.9%) | 278 (16.1%) |
| 8:30 AM to 8:59 AM | 67 (3.4%) | 133 (7.7%) |
| 9:00 AM to 9:59 AM | 3 (0.2%) | 119 (6.9%) |
| 10:00 AM to 10:59 AM | 34 (1.7%) | 106 (6.1%) |
| 11:00 AM to 11:59 AM | 69 (3.5%) | 21 (1.2%) |
| 12:00 PM to 3:59 PM | 86 (4.4%) | 62 (3.6%) |
| 4:00 PM to 11:59 PM | 34 (1.7%) | 46 (2.7%) |
| Total | 1,966 (100.0%) | 1,726 (100.0%) |
Housing Occupancy in Middlesex County
Occupancy by Ownership in Middlesex County
Of the total 4,714 dwellings in Middlesex County, owner-occupied units account for 3,976 (84.3%), while renter-occupied units make up 738 (15.7%).
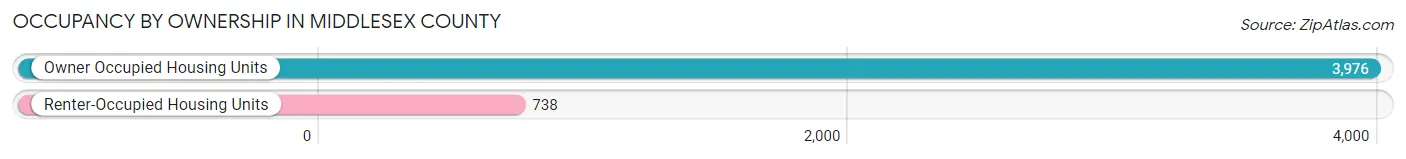
| Occupancy | # Housing Units | % Housing Units |
| Owner Occupied Housing Units | 3,976 | 84.3% |
| Renter-Occupied Housing Units | 738 | 15.7% |
| Total Occupied Housing Units | 4,714 | 100.0% |
Occupancy by Household Size in Middlesex County
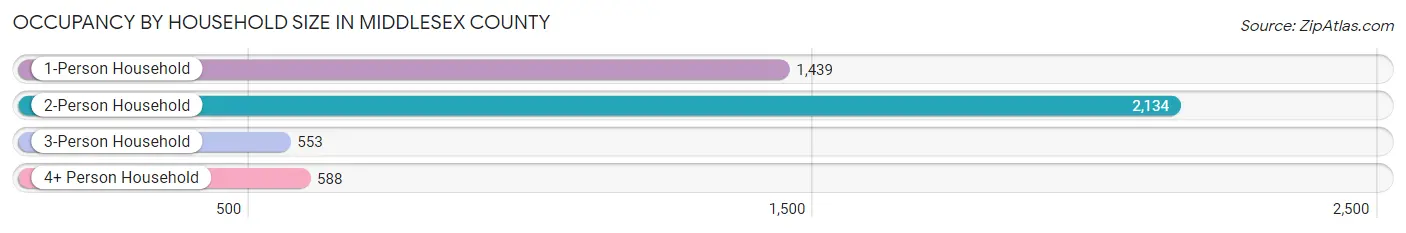
| Household Size | # Housing Units | % Housing Units |
| 1-Person Household | 1,439 | 30.5% |
| 2-Person Household | 2,134 | 45.3% |
| 3-Person Household | 553 | 11.7% |
| 4+ Person Household | 588 | 12.5% |
| Total Housing Units | 4,714 | 100.0% |
Occupancy by Ownership by Household Size in Middlesex County
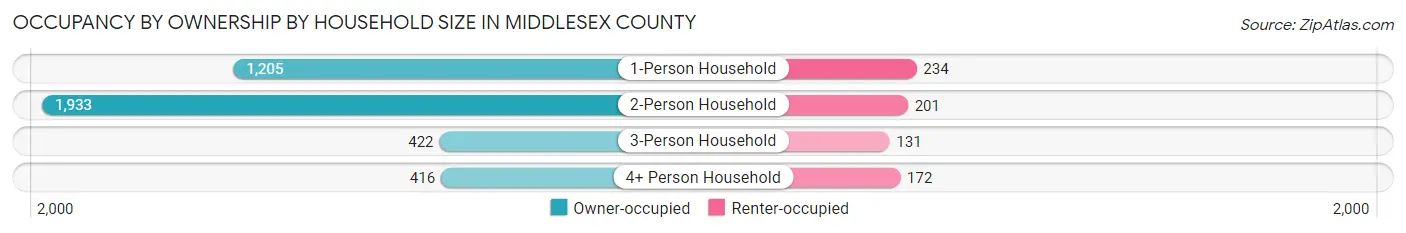
| Household Size | Owner-occupied | Renter-occupied |
| 1-Person Household | 1,205 (83.7%) | 234 (16.3%) |
| 2-Person Household | 1,933 (90.6%) | 201 (9.4%) |
| 3-Person Household | 422 (76.3%) | 131 (23.7%) |
| 4+ Person Household | 416 (70.8%) | 172 (29.2%) |
| Total Housing Units | 3,976 (84.3%) | 738 (15.7%) |
Occupancy by Educational Attainment in Middlesex County
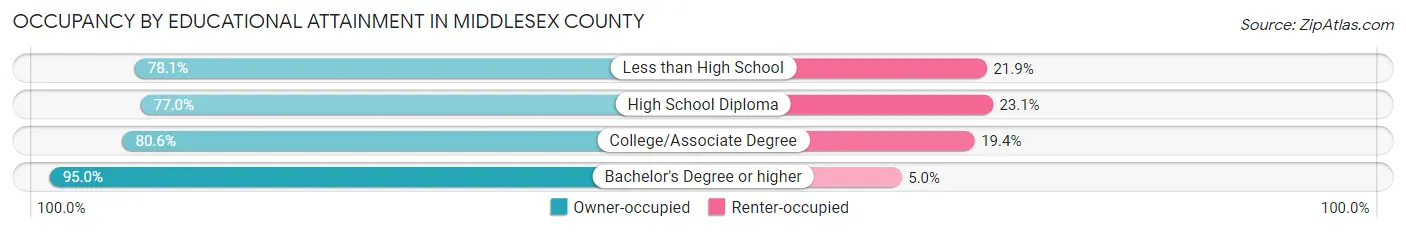
| Household Size | Owner-occupied | Renter-occupied |
| Less than High School | 393 (78.1%) | 110 (21.9%) |
| High School Diploma | 768 (76.9%) | 230 (23.1%) |
| College/Associate Degree | 1,326 (80.6%) | 320 (19.4%) |
| Bachelor's Degree or higher | 1,489 (95.0%) | 78 (5.0%) |
Occupancy by Age of Householder in Middlesex County
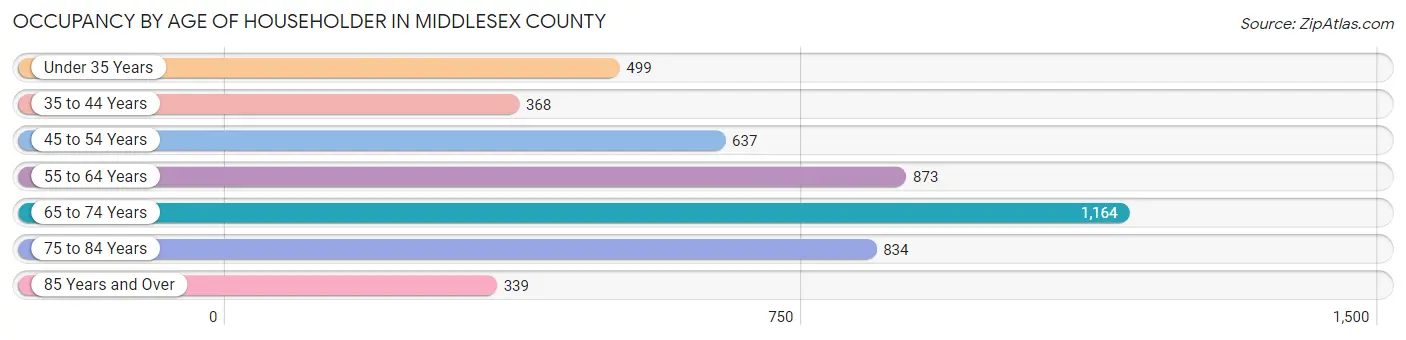
| Age Bracket | # Households | % Households |
| Under 35 Years | 499 | 10.6% |
| 35 to 44 Years | 368 | 7.8% |
| 45 to 54 Years | 637 | 13.5% |
| 55 to 64 Years | 873 | 18.5% |
| 65 to 74 Years | 1,164 | 24.7% |
| 75 to 84 Years | 834 | 17.7% |
| 85 Years and Over | 339 | 7.2% |
| Total | 4,714 | 100.0% |
Housing Finances in Middlesex County
Median Income by Occupancy in Middlesex County
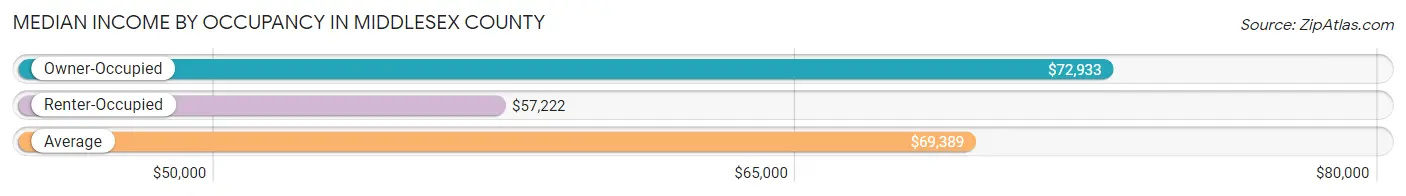
| Occupancy Type | # Households | Median Income |
| Owner-Occupied | 3,976 (84.3%) | $72,933 |
| Renter-Occupied | 738 (15.7%) | $57,222 |
| Average | 4,714 (100.0%) | $69,389 |
Occupancy by Householder Income Bracket in Middlesex County
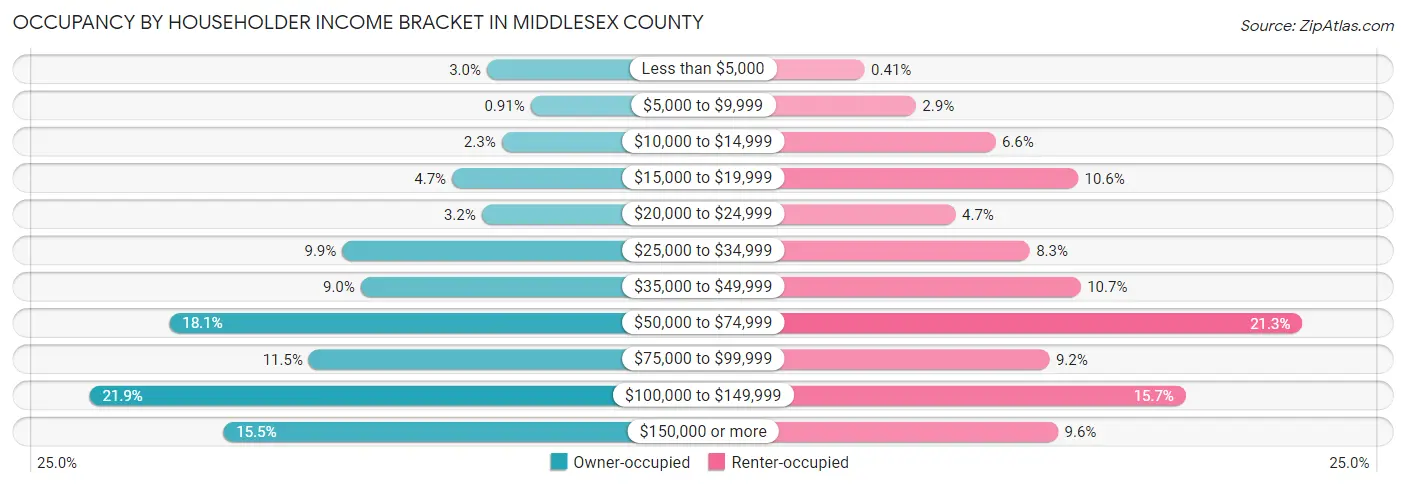
| Income Bracket | Owner-occupied | Renter-occupied |
| Less than $5,000 | 119 (3.0%) | 3 (0.4%) |
| $5,000 to $9,999 | 36 (0.9%) | 21 (2.9%) |
| $10,000 to $14,999 | 91 (2.3%) | 49 (6.6%) |
| $15,000 to $19,999 | 185 (4.6%) | 78 (10.6%) |
| $20,000 to $24,999 | 129 (3.2%) | 35 (4.7%) |
| $25,000 to $34,999 | 393 (9.9%) | 61 (8.3%) |
| $35,000 to $49,999 | 358 (9.0%) | 79 (10.7%) |
| $50,000 to $74,999 | 720 (18.1%) | 157 (21.3%) |
| $75,000 to $99,999 | 456 (11.5%) | 68 (9.2%) |
| $100,000 to $149,999 | 871 (21.9%) | 116 (15.7%) |
| $150,000 or more | 618 (15.5%) | 71 (9.6%) |
| Total | 3,976 (100.0%) | 738 (100.0%) |
Monthly Housing Cost Tiers in Middlesex County
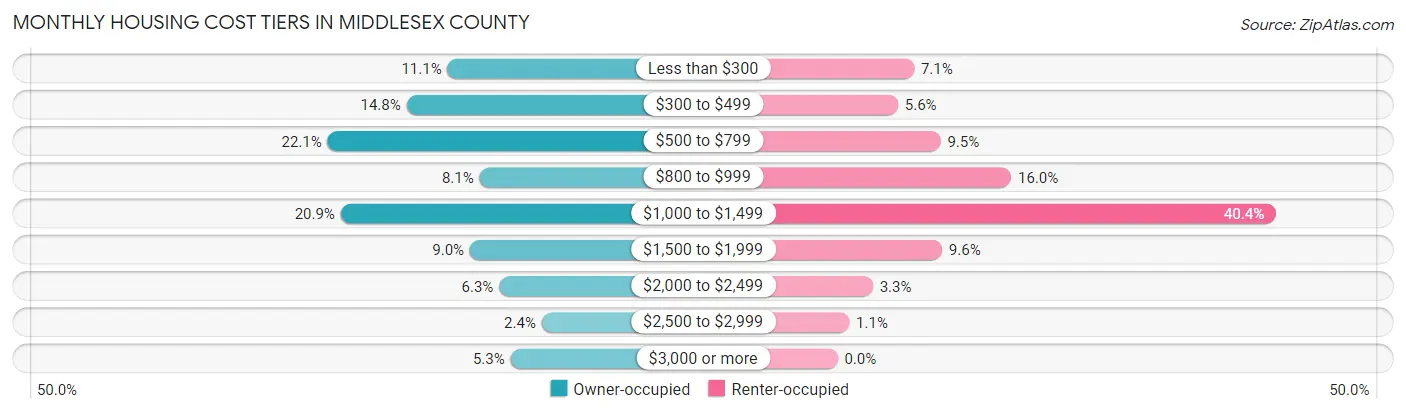
| Monthly Cost | Owner-occupied | Renter-occupied |
| Less than $300 | 440 (11.1%) | 52 (7.0%) |
| $300 to $499 | 590 (14.8%) | 41 (5.6%) |
| $500 to $799 | 879 (22.1%) | 70 (9.5%) |
| $800 to $999 | 323 (8.1%) | 118 (16.0%) |
| $1,000 to $1,499 | 831 (20.9%) | 298 (40.4%) |
| $1,500 to $1,999 | 358 (9.0%) | 71 (9.6%) |
| $2,000 to $2,499 | 251 (6.3%) | 24 (3.3%) |
| $2,500 to $2,999 | 95 (2.4%) | 8 (1.1%) |
| $3,000 or more | 209 (5.3%) | 0 (0.0%) |
| Total | 3,976 (100.0%) | 738 (100.0%) |
Physical Housing Characteristics in Middlesex County
Housing Structures in Middlesex County
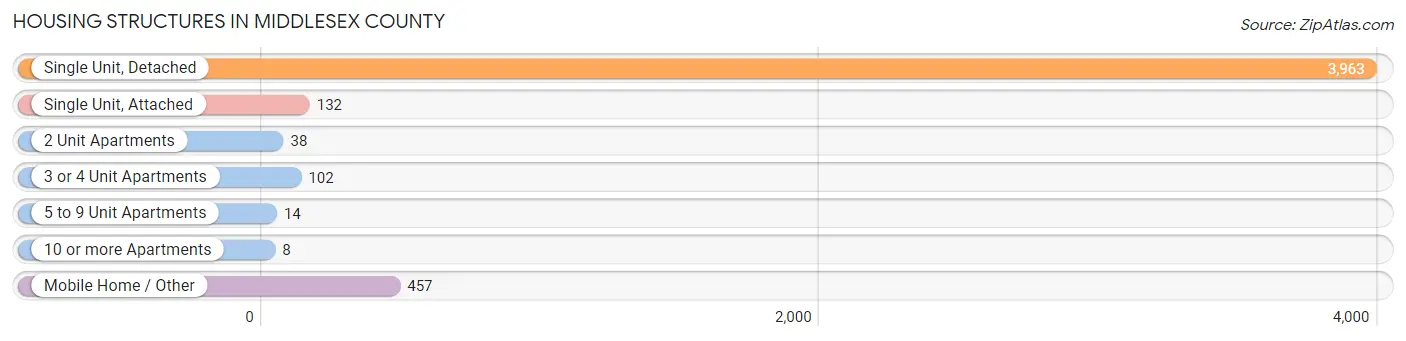
| Structure Type | # Housing Units | % Housing Units |
| Single Unit, Detached | 3,963 | 84.1% |
| Single Unit, Attached | 132 | 2.8% |
| 2 Unit Apartments | 38 | 0.8% |
| 3 or 4 Unit Apartments | 102 | 2.2% |
| 5 to 9 Unit Apartments | 14 | 0.3% |
| 10 or more Apartments | 8 | 0.2% |
| Mobile Home / Other | 457 | 9.7% |
| Total | 4,714 | 100.0% |
Housing Structures by Occupancy in Middlesex County
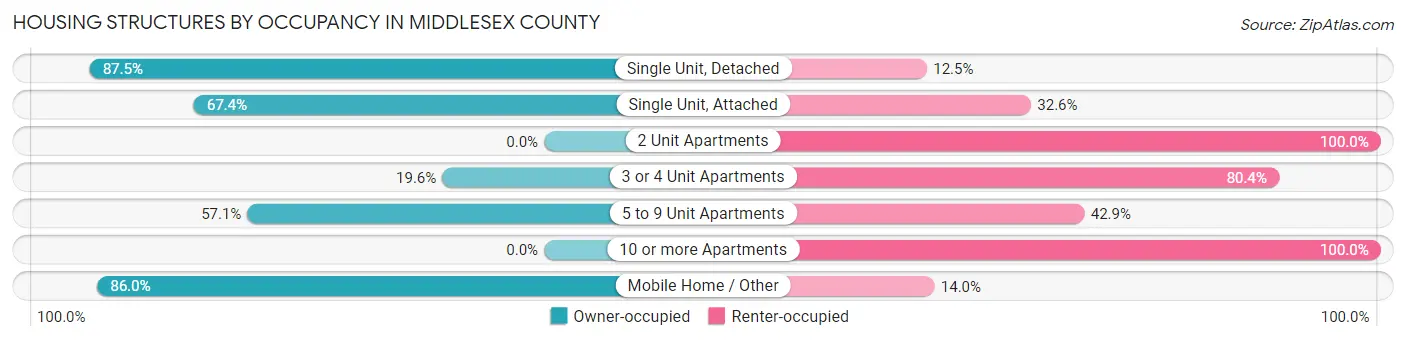
| Structure Type | Owner-occupied | Renter-occupied |
| Single Unit, Detached | 3,466 (87.5%) | 497 (12.5%) |
| Single Unit, Attached | 89 (67.4%) | 43 (32.6%) |
| 2 Unit Apartments | 0 (0.0%) | 38 (100.0%) |
| 3 or 4 Unit Apartments | 20 (19.6%) | 82 (80.4%) |
| 5 to 9 Unit Apartments | 8 (57.1%) | 6 (42.9%) |
| 10 or more Apartments | 0 (0.0%) | 8 (100.0%) |
| Mobile Home / Other | 393 (86.0%) | 64 (14.0%) |
| Total | 3,976 (84.3%) | 738 (15.7%) |
Housing Structures by Number of Rooms in Middlesex County
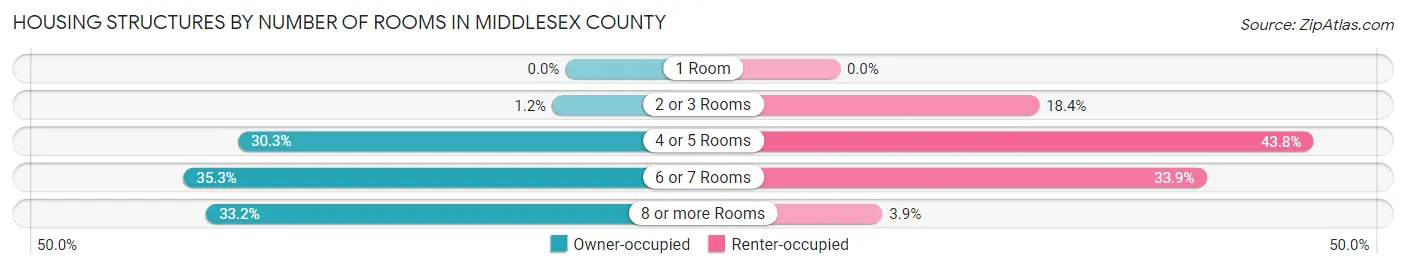
| Number of Rooms | Owner-occupied | Renter-occupied |
| 1 Room | 0 (0.0%) | 0 (0.0%) |
| 2 or 3 Rooms | 49 (1.2%) | 136 (18.4%) |
| 4 or 5 Rooms | 1,203 (30.3%) | 323 (43.8%) |
| 6 or 7 Rooms | 1,404 (35.3%) | 250 (33.9%) |
| 8 or more Rooms | 1,320 (33.2%) | 29 (3.9%) |
| Total | 3,976 (100.0%) | 738 (100.0%) |
Housing Structure by Heating Type in Middlesex County
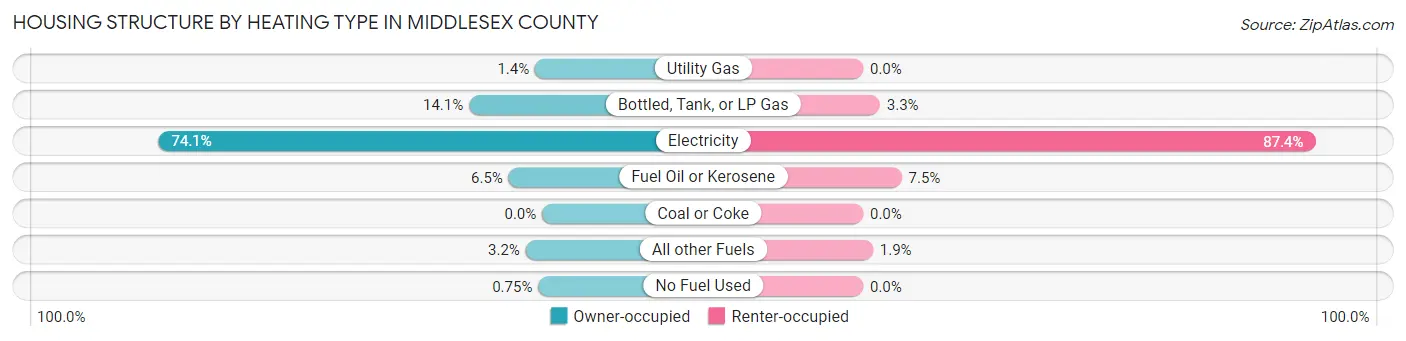
| Heating Type | Owner-occupied | Renter-occupied |
| Utility Gas | 54 (1.4%) | 0 (0.0%) |
| Bottled, Tank, or LP Gas | 561 (14.1%) | 24 (3.3%) |
| Electricity | 2,948 (74.1%) | 645 (87.4%) |
| Fuel Oil or Kerosene | 257 (6.5%) | 55 (7.4%) |
| Coal or Coke | 0 (0.0%) | 0 (0.0%) |
| All other Fuels | 126 (3.2%) | 14 (1.9%) |
| No Fuel Used | 30 (0.7%) | 0 (0.0%) |
| Total | 3,976 (100.0%) | 738 (100.0%) |
Household Vehicle Usage in Middlesex County
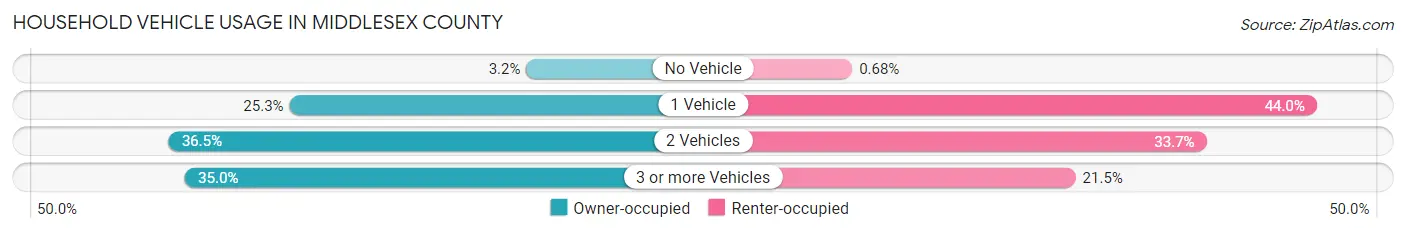
| Vehicles per Household | Owner-occupied | Renter-occupied |
| No Vehicle | 126 (3.2%) | 5 (0.7%) |
| 1 Vehicle | 1,005 (25.3%) | 325 (44.0%) |
| 2 Vehicles | 1,453 (36.5%) | 249 (33.7%) |
| 3 or more Vehicles | 1,392 (35.0%) | 159 (21.5%) |
| Total | 3,976 (100.0%) | 738 (100.0%) |
Real Estate & Mortgages in Middlesex County
Real Estate and Mortgage Overview in Middlesex County
| Characteristic | Without Mortgage | With Mortgage |
| Housing Units | 2,029 | 1,947 |
| Median Property Value | $284,400 | $292,500 |
| Median Household Income | $64,132 | $395 |
| Monthly Housing Costs | $495 | $189 |
| Real Estate Taxes | $1,717 | $37 |
Property Value by Mortgage Status in Middlesex County
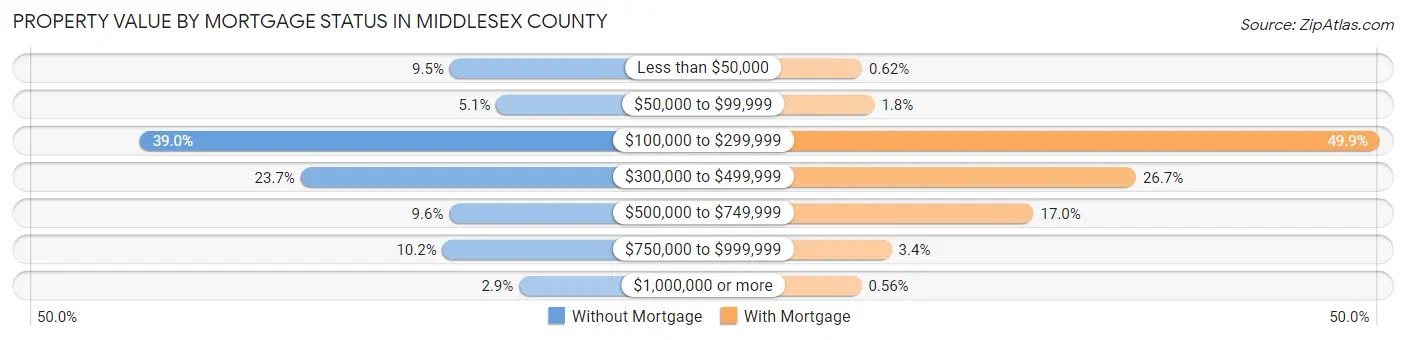
| Property Value | Without Mortgage | With Mortgage |
| Less than $50,000 | 193 (9.5%) | 12 (0.6%) |
| $50,000 to $99,999 | 103 (5.1%) | 35 (1.8%) |
| $100,000 to $299,999 | 792 (39.0%) | 972 (49.9%) |
| $300,000 to $499,999 | 481 (23.7%) | 520 (26.7%) |
| $500,000 to $749,999 | 194 (9.6%) | 330 (17.0%) |
| $750,000 to $999,999 | 207 (10.2%) | 67 (3.4%) |
| $1,000,000 or more | 59 (2.9%) | 11 (0.6%) |
| Total | 2,029 (100.0%) | 1,947 (100.0%) |
Household Income by Mortgage Status in Middlesex County
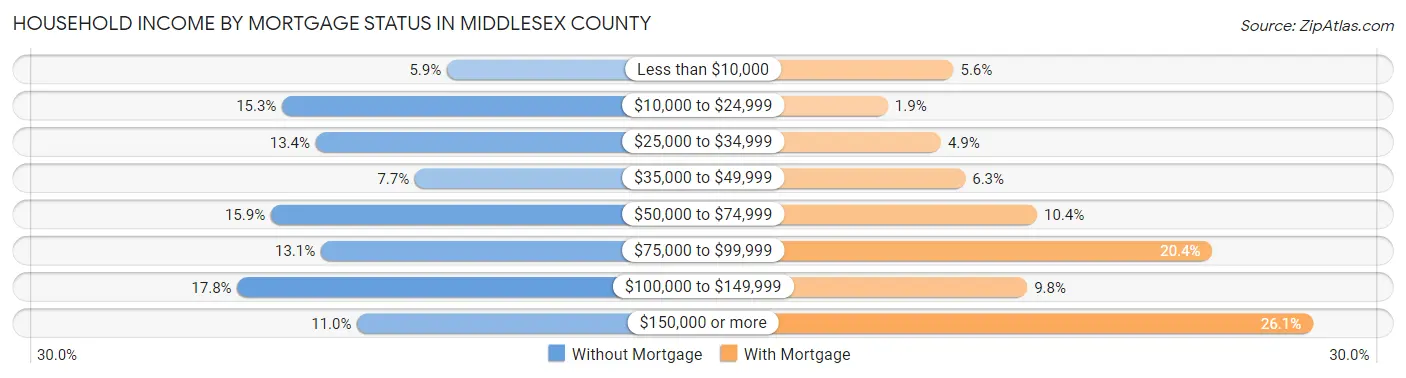
| Household Income | Without Mortgage | With Mortgage |
| Less than $10,000 | 119 (5.9%) | 109 (5.6%) |
| $10,000 to $24,999 | 310 (15.3%) | 36 (1.8%) |
| $25,000 to $34,999 | 271 (13.4%) | 95 (4.9%) |
| $35,000 to $49,999 | 156 (7.7%) | 122 (6.3%) |
| $50,000 to $74,999 | 323 (15.9%) | 202 (10.4%) |
| $75,000 to $99,999 | 265 (13.1%) | 397 (20.4%) |
| $100,000 to $149,999 | 362 (17.8%) | 191 (9.8%) |
| $150,000 or more | 223 (11.0%) | 509 (26.1%) |
| Total | 2,029 (100.0%) | 1,947 (100.0%) |
Property Value to Household Income Ratio in Middlesex County
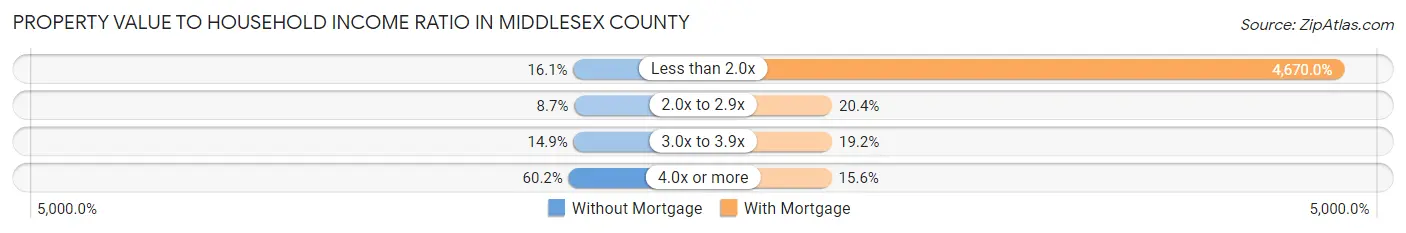
| Value-to-Income Ratio | Without Mortgage | With Mortgage |
| Less than 2.0x | 327 (16.1%) | 90,924 (4,670.0%) |
| 2.0x to 2.9x | 177 (8.7%) | 398 (20.4%) |
| 3.0x to 3.9x | 303 (14.9%) | 374 (19.2%) |
| 4.0x or more | 1,222 (60.2%) | 304 (15.6%) |
| Total | 2,029 (100.0%) | 1,947 (100.0%) |
Real Estate Taxes by Mortgage Status in Middlesex County
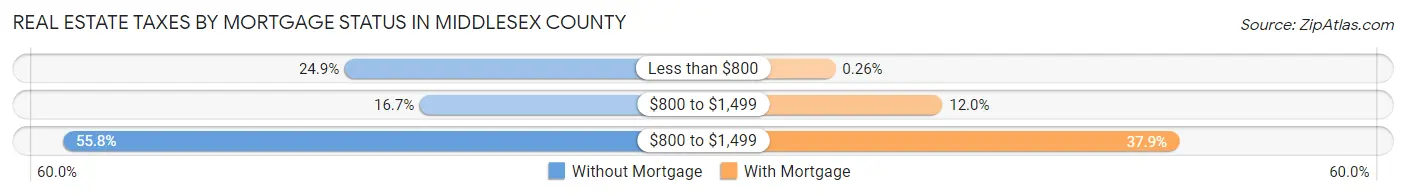
| Property Taxes | Without Mortgage | With Mortgage |
| Less than $800 | 505 (24.9%) | 5 (0.3%) |
| $800 to $1,499 | 338 (16.7%) | 233 (12.0%) |
| $800 to $1,499 | 1,132 (55.8%) | 738 (37.9%) |
| Total | 2,029 (100.0%) | 1,947 (100.0%) |
Health & Disability in Middlesex County
Health Insurance Coverage by Age in Middlesex County
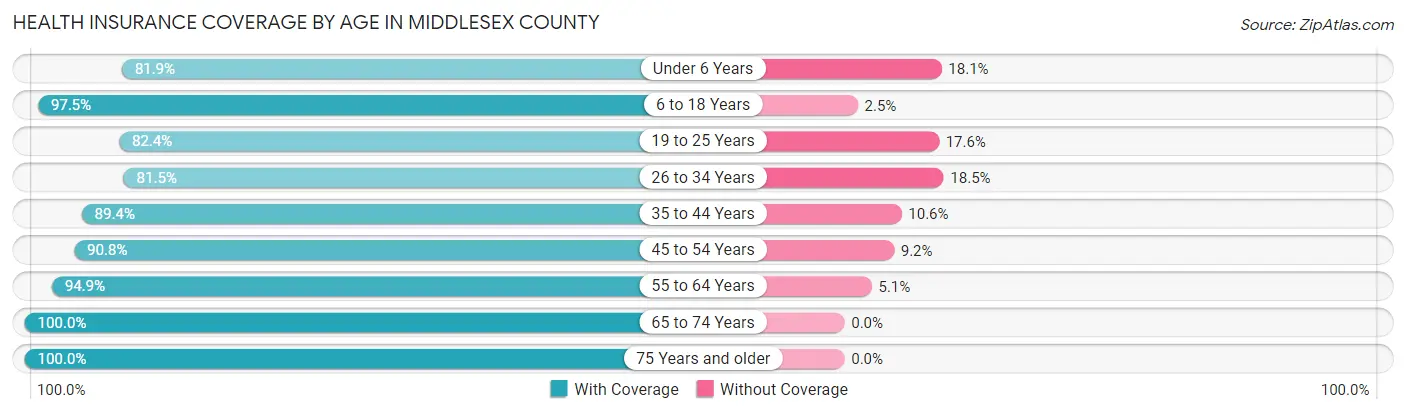
| Age Bracket | With Coverage | Without Coverage |
| Under 6 Years | 389 (81.9%) | 86 (18.1%) |
| 6 to 18 Years | 1,256 (97.5%) | 32 (2.5%) |
| 19 to 25 Years | 487 (82.4%) | 104 (17.6%) |
| 26 to 34 Years | 719 (81.5%) | 163 (18.5%) |
| 35 to 44 Years | 781 (89.4%) | 93 (10.6%) |
| 45 to 54 Years | 1,023 (90.8%) | 104 (9.2%) |
| 55 to 64 Years | 1,626 (94.9%) | 87 (5.1%) |
| 65 to 74 Years | 1,910 (100.0%) | 0 (0.0%) |
| 75 Years and older | 1,546 (100.0%) | 0 (0.0%) |
| Total | 9,737 (93.6%) | 669 (6.4%) |
Health Insurance Coverage by Citizenship Status in Middlesex County
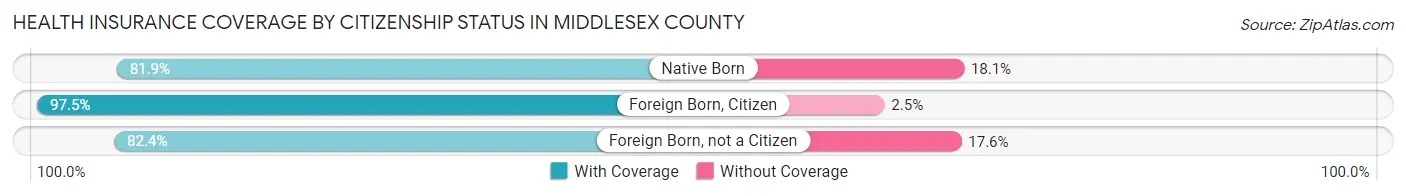
| Citizenship Status | With Coverage | Without Coverage |
| Native Born | 389 (81.9%) | 86 (18.1%) |
| Foreign Born, Citizen | 1,256 (97.5%) | 32 (2.5%) |
| Foreign Born, not a Citizen | 487 (82.4%) | 104 (17.6%) |
Health Insurance Coverage by Household Income in Middlesex County
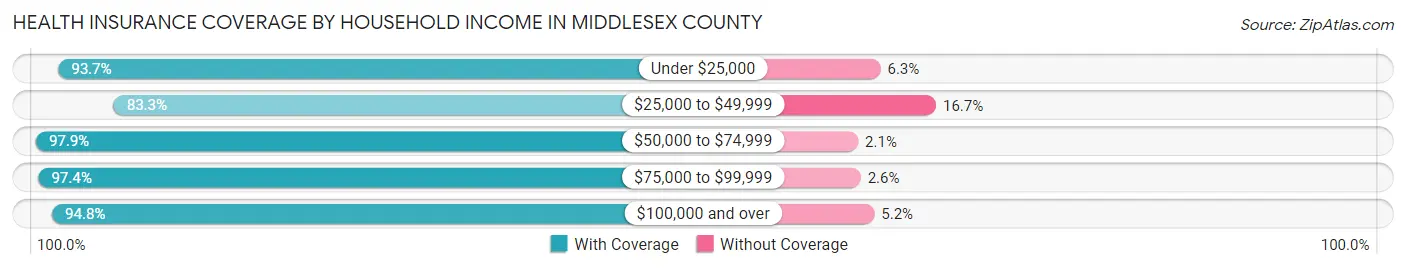
| Household Income | With Coverage | Without Coverage |
| Under $25,000 | 1,022 (93.7%) | 69 (6.3%) |
| $25,000 to $49,999 | 1,449 (83.3%) | 291 (16.7%) |
| $50,000 to $74,999 | 1,607 (97.9%) | 35 (2.1%) |
| $75,000 to $99,999 | 1,378 (97.4%) | 37 (2.6%) |
| $100,000 and over | 4,218 (94.8%) | 230 (5.2%) |
Public vs Private Health Insurance Coverage by Age in Middlesex County
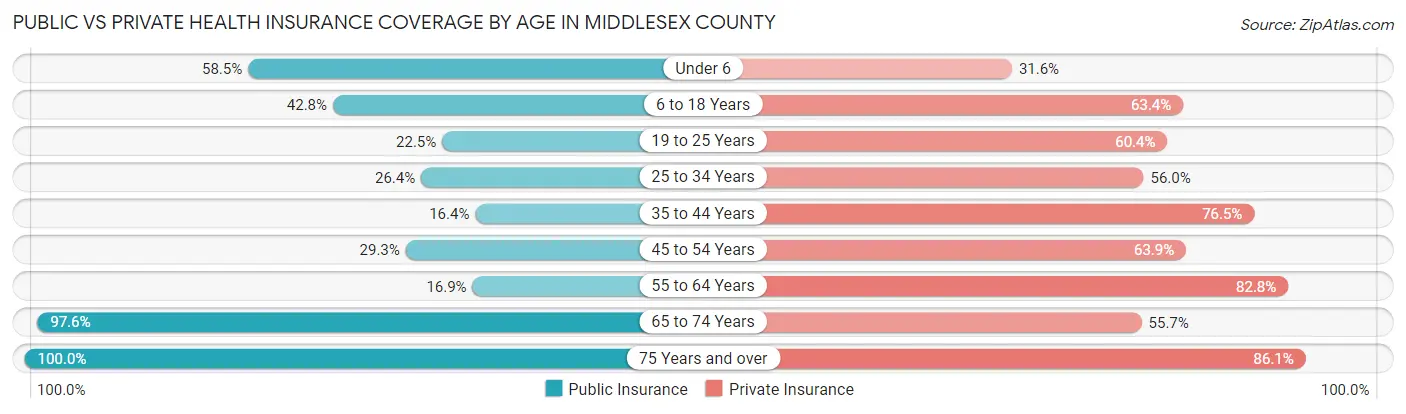
| Age Bracket | Public Insurance | Private Insurance |
| Under 6 | 278 (58.5%) | 150 (31.6%) |
| 6 to 18 Years | 551 (42.8%) | 816 (63.3%) |
| 19 to 25 Years | 133 (22.5%) | 357 (60.4%) |
| 25 to 34 Years | 233 (26.4%) | 494 (56.0%) |
| 35 to 44 Years | 143 (16.4%) | 669 (76.5%) |
| 45 to 54 Years | 330 (29.3%) | 720 (63.9%) |
| 55 to 64 Years | 289 (16.9%) | 1,419 (82.8%) |
| 65 to 74 Years | 1,865 (97.6%) | 1,063 (55.6%) |
| 75 Years and over | 1,546 (100.0%) | 1,331 (86.1%) |
| Total | 5,368 (51.6%) | 7,019 (67.4%) |
Disability Status by Sex by Age in Middlesex County
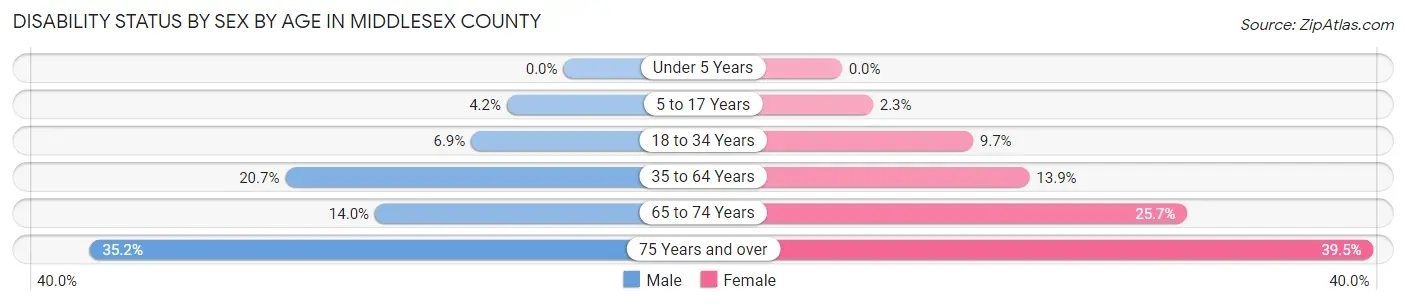
| Age Bracket | Male | Female |
| Under 5 Years | 0 (0.0%) | 0 (0.0%) |
| 5 to 17 Years | 30 (4.2%) | 14 (2.3%) |
| 18 to 34 Years | 51 (6.9%) | 77 (9.7%) |
| 35 to 64 Years | 377 (20.6%) | 263 (13.9%) |
| 65 to 74 Years | 121 (14.0%) | 268 (25.7%) |
| 75 Years and over | 280 (35.2%) | 296 (39.5%) |
Disability Class by Sex by Age in Middlesex County
Disability Class: Hearing Difficulty
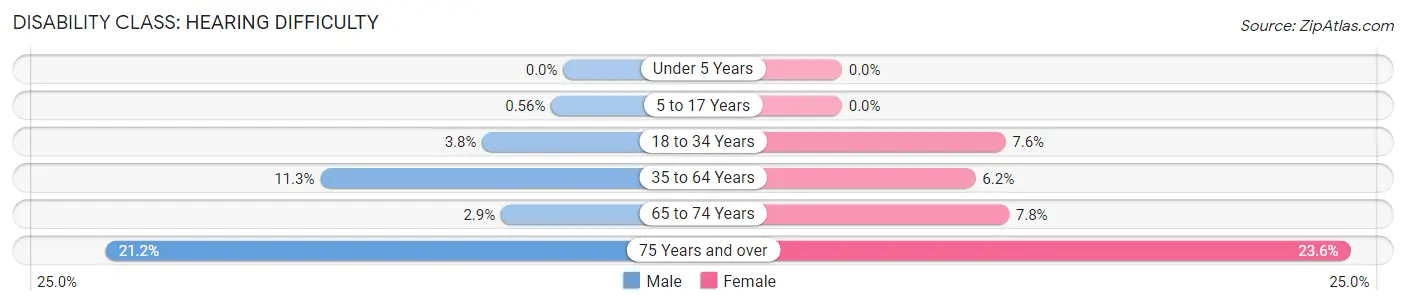
| Age Bracket | Male | Female |
| Under 5 Years | 0 (0.0%) | 0 (0.0%) |
| 5 to 17 Years | 4 (0.6%) | 0 (0.0%) |
| 18 to 34 Years | 28 (3.8%) | 60 (7.6%) |
| 35 to 64 Years | 206 (11.3%) | 117 (6.2%) |
| 65 to 74 Years | 25 (2.9%) | 81 (7.7%) |
| 75 Years and over | 169 (21.2%) | 177 (23.6%) |
Disability Class: Vision Difficulty
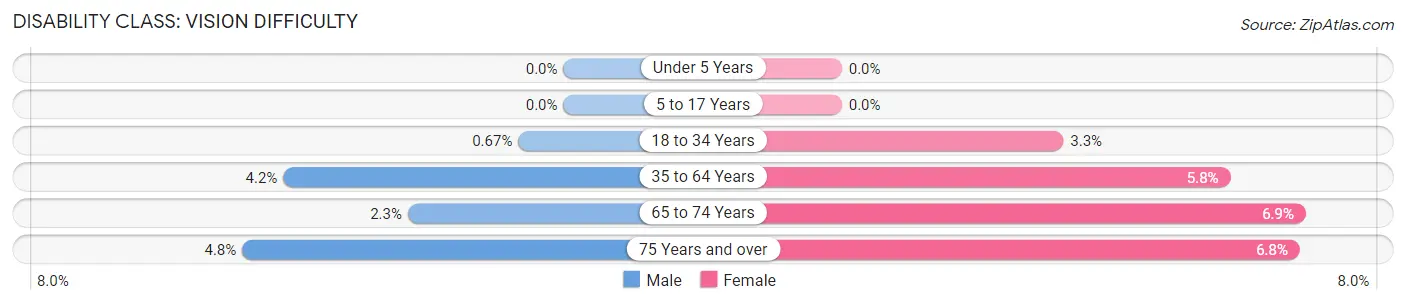
| Age Bracket | Male | Female |
| Under 5 Years | 0 (0.0%) | 0 (0.0%) |
| 5 to 17 Years | 0 (0.0%) | 0 (0.0%) |
| 18 to 34 Years | 5 (0.7%) | 26 (3.3%) |
| 35 to 64 Years | 76 (4.2%) | 109 (5.8%) |
| 65 to 74 Years | 20 (2.3%) | 72 (6.9%) |
| 75 Years and over | 38 (4.8%) | 51 (6.8%) |
Disability Class: Cognitive Difficulty
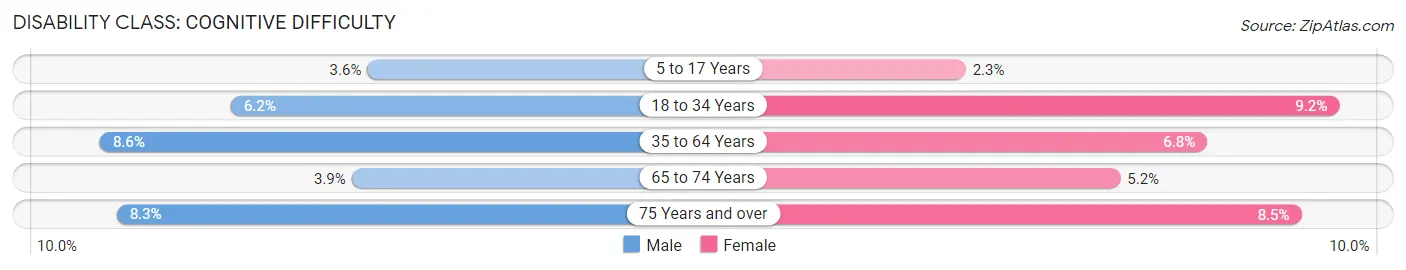
| Age Bracket | Male | Female |
| 5 to 17 Years | 26 (3.6%) | 14 (2.3%) |
| 18 to 34 Years | 46 (6.2%) | 73 (9.2%) |
| 35 to 64 Years | 157 (8.6%) | 128 (6.8%) |
| 65 to 74 Years | 34 (3.9%) | 54 (5.2%) |
| 75 Years and over | 66 (8.3%) | 64 (8.5%) |
Disability Class: Ambulatory Difficulty
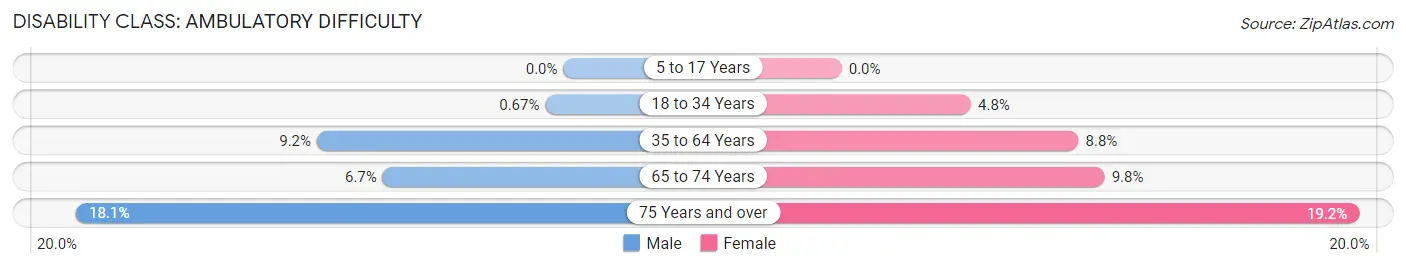
| Age Bracket | Male | Female |
| 5 to 17 Years | 0 (0.0%) | 0 (0.0%) |
| 18 to 34 Years | 5 (0.7%) | 38 (4.8%) |
| 35 to 64 Years | 167 (9.1%) | 166 (8.8%) |
| 65 to 74 Years | 58 (6.7%) | 102 (9.8%) |
| 75 Years and over | 144 (18.1%) | 144 (19.2%) |
Disability Class: Self-Care Difficulty
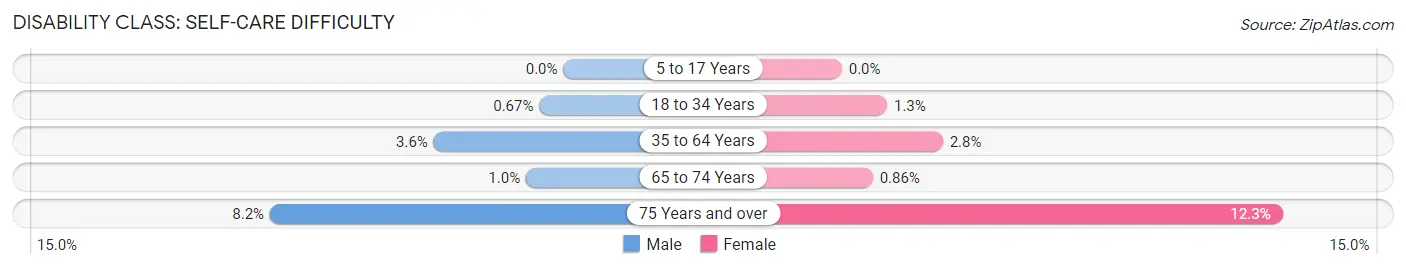
| Age Bracket | Male | Female |
| 5 to 17 Years | 0 (0.0%) | 0 (0.0%) |
| 18 to 34 Years | 5 (0.7%) | 10 (1.3%) |
| 35 to 64 Years | 66 (3.6%) | 53 (2.8%) |
| 65 to 74 Years | 9 (1.0%) | 9 (0.9%) |
| 75 Years and over | 65 (8.2%) | 92 (12.3%) |
Technology Access in Middlesex County
Computing Device Access in Middlesex County
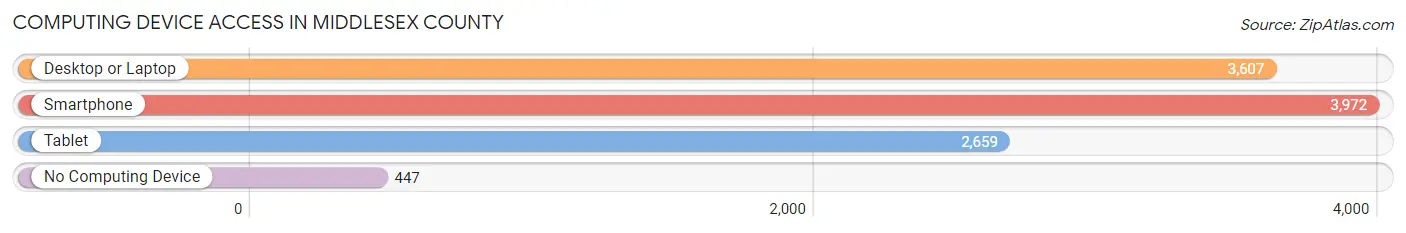
| Device Type | # Households | % Households |
| Desktop or Laptop | 3,607 | 76.5% |
| Smartphone | 3,972 | 84.3% |
| Tablet | 2,659 | 56.4% |
| No Computing Device | 447 | 9.5% |
| Total | 4,714 | 100.0% |
Internet Access in Middlesex County
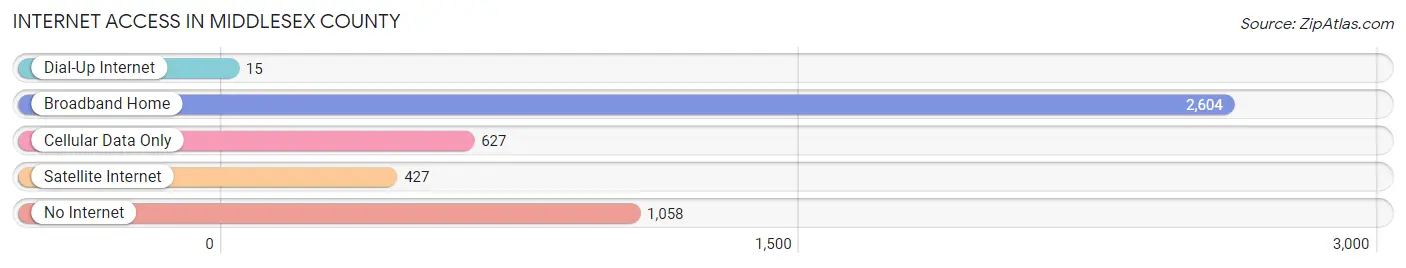
| Internet Type | # Households | % Households |
| Dial-Up Internet | 15 | 0.3% |
| Broadband Home | 2,604 | 55.2% |
| Cellular Data Only | 627 | 13.3% |
| Satellite Internet | 427 | 9.1% |
| No Internet | 1,058 | 22.4% |
| Total | 4,714 | 100.0% |
Middlesex County Summary
Middlesex County, Virginia is located in the Middle Peninsula region of the Commonwealth of Virginia. It is bordered by the Rappahannock River to the north, the Chesapeake Bay to the east, and the Piankatank River to the south. The county seat is Saluda, and the county is home to approximately 10,000 people.
History
Middlesex County was established in 1673 from a portion of Lancaster County. It was named for the English county of Middlesex, which was the birthplace of the Virginia Company of London's first treasurer, Sir Thomas Smith. The county was originally part of the Virginia Colony, and was one of the eight original shires of Virginia.
During the American Revolution, the county was the site of several battles, including the Battle of the Hook in 1781. The county was also the site of the first naval battle of the Revolution, the Battle of the Chesapeake.
In the 19th century, the county was home to several prominent families, including the Taylors, the Carters, and the Washingtons. The county was also home to several prominent African-American families, including the Burwells, the Bowdens, and the Washingtons.
Geography
Middlesex County is located in the Middle Peninsula region of Virginia. It is bordered by the Rappahannock River to the north, the Chesapeake Bay to the east, and the Piankatank River to the south. The county is home to several rivers, including the Rappahannock, the Piankatank, and the Mattaponi.
The county is mostly rural, with a few small towns and villages. The largest town is Saluda, which is the county seat. Other towns include Urbanna, Hartfield, and Deltaville.
The county is home to several state parks, including Belle Isle State Park, Chippokes Plantation State Park, and York River State Park.
Economy
Middlesex County is largely rural, and the economy is largely based on agriculture and fishing. The county is home to several farms, including dairy farms, beef farms, and vegetable farms. The county is also home to several seafood processing plants, which process oysters, crabs, and other seafood.
The county is also home to several small businesses, including restaurants, retail stores, and boat repair shops. The county is also home to several marinas, which provide boat storage and repair services.
Demographics
As of the 2010 census, the population of Middlesex County was 10,068. The population is largely white (87.3%), with African-Americans making up 8.2% of the population. Other racial groups include Native Americans (1.2%), Asians (1.1%), and Hispanics (1.1%).
The median household income in the county is $50,845, and the median family income is $60,945. The per capita income is $25,945. The unemployment rate is 4.2%.
Conclusion
Middlesex County, Virginia is a rural county located in the Middle Peninsula region of the Commonwealth of Virginia. It is bordered by the Rappahannock River to the north, the Chesapeake Bay to the east, and the Piankatank River to the south. The county is home to several small towns and villages, and the economy is largely based on agriculture and fishing. The population of the county is largely white, with African-Americans making up 8.2% of the population. The median household income in the county is $50,845, and the unemployment rate is 4.2%.
Common Questions
What is Per Capita Income in Middlesex County?
Per Capita income in Middlesex County is $39,111.
What is the Median Family Income in Middlesex County?
Median Family Income in Middlesex County is $88,661.
What is the Median Household income in Middlesex County?
Median Household Income in Middlesex County is $69,389.
What is Income or Wage Gap in Middlesex County?
Income or Wage Gap in Middlesex County is 47.3%.
Women in Middlesex County earn 52.7 cents for every dollar earned by a man.
What is Inequality or Gini Index in Middlesex County?
Inequality or Gini Index in Middlesex County is 0.41.
What is the Total Population of Middlesex County?
Total Population of Middlesex County is 10,738.
What is the Total Male Population of Middlesex County?
Total Male Population of Middlesex County is 5,360.
What is the Total Female Population of Middlesex County?
Total Female Population of Middlesex County is 5,378.
What is the Ratio of Males per 100 Females in Middlesex County?
There are 99.67 Males per 100 Females in Middlesex County.
What is the Ratio of Females per 100 Males in Middlesex County?
There are 100.34 Females per 100 Males in Middlesex County.
What is the Median Population Age in Middlesex County?
Median Population Age in Middlesex County is 54.9 Years.
What is the Average Family Size in Middlesex County
Average Family Size in Middlesex County is 2.6 People.
What is the Average Household Size in Middlesex County
Average Household Size in Middlesex County is 2.2 People.
How Large is the Labor Force in Middlesex County?
There are 4,722 People in the Labor Forcein in Middlesex County.
What is the Percentage of People in the Labor Force in Middlesex County?
51.4% of People are in the Labor Force in Middlesex County.
What is the Unemployment Rate in Middlesex County?
Unemployment Rate in Middlesex County is 4.6%.