Mecklenburg County, VA Map & Demographics
Mecklenburg County Overview
$31,010
PER CAPITA INCOME
$69,671
AVG FAMILY INCOME
$51,265
AVG HOUSEHOLD INCOME
28.4%
WAGE / INCOME GAP [ % ]
71.6¢/ $1
WAGE / INCOME GAP [ $ ]
$10,492
FAMILY INCOME DEFICIT
0.48
INEQUALITY / GINI INDEX
30,367
TOTAL POPULATION
15,032
MALE POPULATION
15,335
FEMALE POPULATION
98.02
MALES / 100 FEMALES
102.02
FEMALES / 100 MALES
48.6
MEDIAN AGE
2.9
AVG FAMILY SIZE
2.2
AVG HOUSEHOLD SIZE
13,053
LABOR FORCE [ PEOPLE ]
51.3%
PERCENT IN LABOR FORCE
3.6%
UNEMPLOYMENT RATE
Mecklenburg County Area Codes
Income in Mecklenburg County
Income Overview in Mecklenburg County
Per Capita Income in Mecklenburg County is $31,010, while median incomes of families and households are $69,671 and $51,265 respectively.
| Characteristic | Number | Measure |
| Per Capita Income | 30,367 | $31,010 |
| Median Family Income | 7,860 | $69,671 |
| Mean Family Income | 7,860 | $84,631 |
| Median Household Income | 13,037 | $51,265 |
| Mean Household Income | 13,037 | $70,108 |
| Income Deficit | 7,860 | $10,492 |
| Wage / Income Gap (%) | 30,367 | 28.40% |
| Wage / Income Gap ($) | 30,367 | 71.60¢ per $1 |
| Gini / Inequality Index | 30,367 | 0.48 |
Earnings by Sex in Mecklenburg County
Average Earnings in Mecklenburg County are $36,691, $41,952 for men and $30,038 for women, a difference of 28.4%.
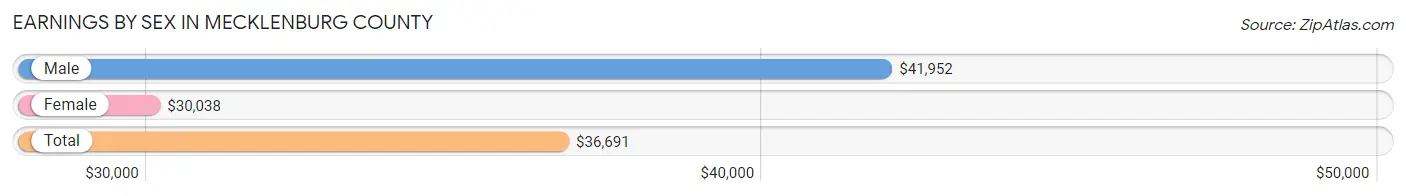
| Sex | Number | Average Earnings |
| Male | 7,157 (52.4%) | $41,952 |
| Female | 6,488 (47.5%) | $30,038 |
| Total | 13,645 (100.0%) | $36,691 |
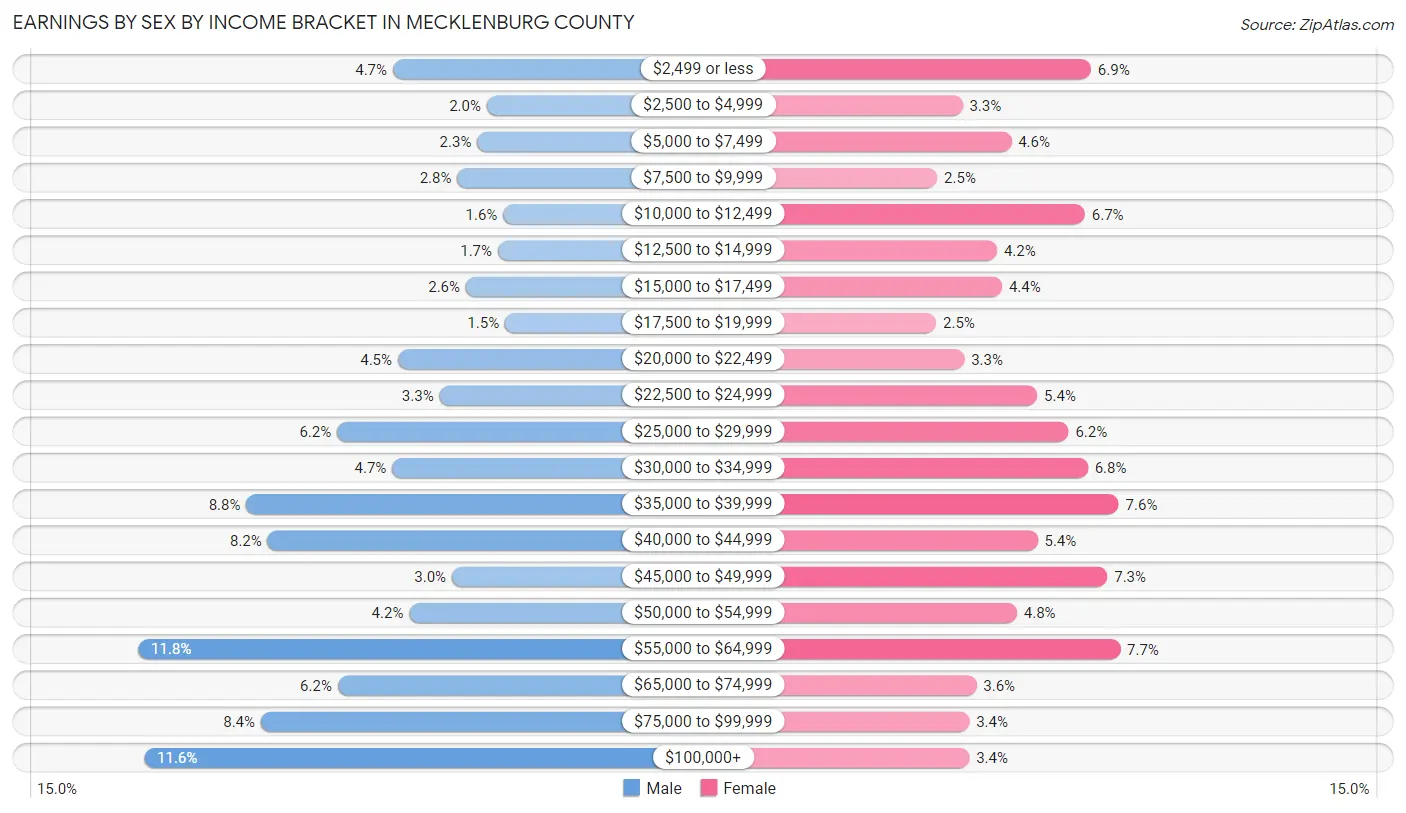
Earnings by Sex by Income Bracket in Mecklenburg County
The most common earnings brackets in Mecklenburg County are $55,000 to $64,999 for men (845 | 11.8%) and $55,000 to $64,999 for women (498 | 7.7%).
| Income | Male | Female |
| $2,499 or less | 333 (4.6%) | 445 (6.9%) |
| $2,500 to $4,999 | 144 (2.0%) | 211 (3.3%) |
| $5,000 to $7,499 | 163 (2.3%) | 300 (4.6%) |
| $7,500 to $9,999 | 203 (2.8%) | 165 (2.5%) |
| $10,000 to $12,499 | 111 (1.5%) | 434 (6.7%) |
| $12,500 to $14,999 | 122 (1.7%) | 274 (4.2%) |
| $15,000 to $17,499 | 186 (2.6%) | 283 (4.4%) |
| $17,500 to $19,999 | 107 (1.5%) | 163 (2.5%) |
| $20,000 to $22,499 | 323 (4.5%) | 214 (3.3%) |
| $22,500 to $24,999 | 239 (3.3%) | 347 (5.3%) |
| $25,000 to $29,999 | 445 (6.2%) | 404 (6.2%) |
| $30,000 to $34,999 | 334 (4.7%) | 439 (6.8%) |
| $35,000 to $39,999 | 628 (8.8%) | 496 (7.6%) |
| $40,000 to $44,999 | 585 (8.2%) | 348 (5.4%) |
| $45,000 to $49,999 | 214 (3.0%) | 475 (7.3%) |
| $50,000 to $54,999 | 300 (4.2%) | 310 (4.8%) |
| $55,000 to $64,999 | 845 (11.8%) | 498 (7.7%) |
| $65,000 to $74,999 | 444 (6.2%) | 236 (3.6%) |
| $75,000 to $99,999 | 598 (8.4%) | 223 (3.4%) |
| $100,000+ | 833 (11.6%) | 223 (3.4%) |
| Total | 7,157 (100.0%) | 6,488 (100.0%) |
Earnings by Sex by Educational Attainment in Mecklenburg County
Average earnings in Mecklenburg County are $44,676 for men and $33,082 for women, a difference of 26.0%. Men with an educational attainment of graduate degree enjoy the highest average annual earnings of $112,813, while those with less than high school education earn the least with $25,272. Women with an educational attainment of graduate degree earn the most with the average annual earnings of $49,894, while those with less than high school education have the smallest earnings of $14,514.
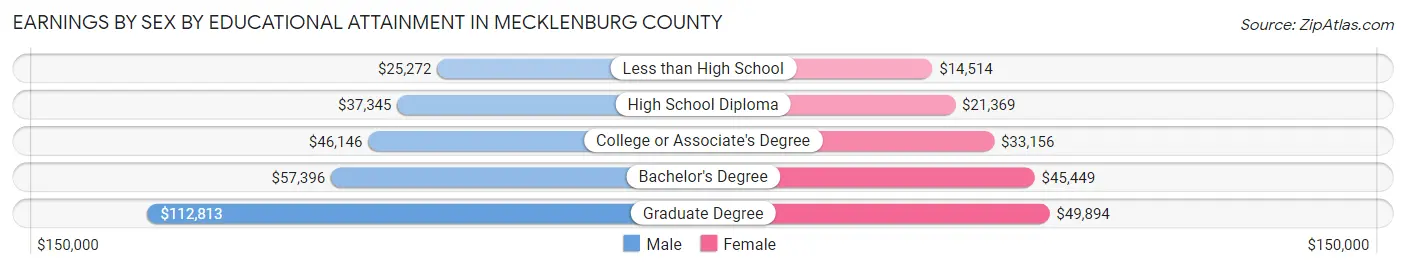
| Educational Attainment | Male Income | Female Income |
| Less than High School | $25,272 | $14,514 |
| High School Diploma | $37,345 | $21,369 |
| College or Associate's Degree | $46,146 | $33,156 |
| Bachelor's Degree | $57,396 | $45,449 |
| Graduate Degree | $112,813 | $49,894 |
| Total | $44,676 | $33,082 |
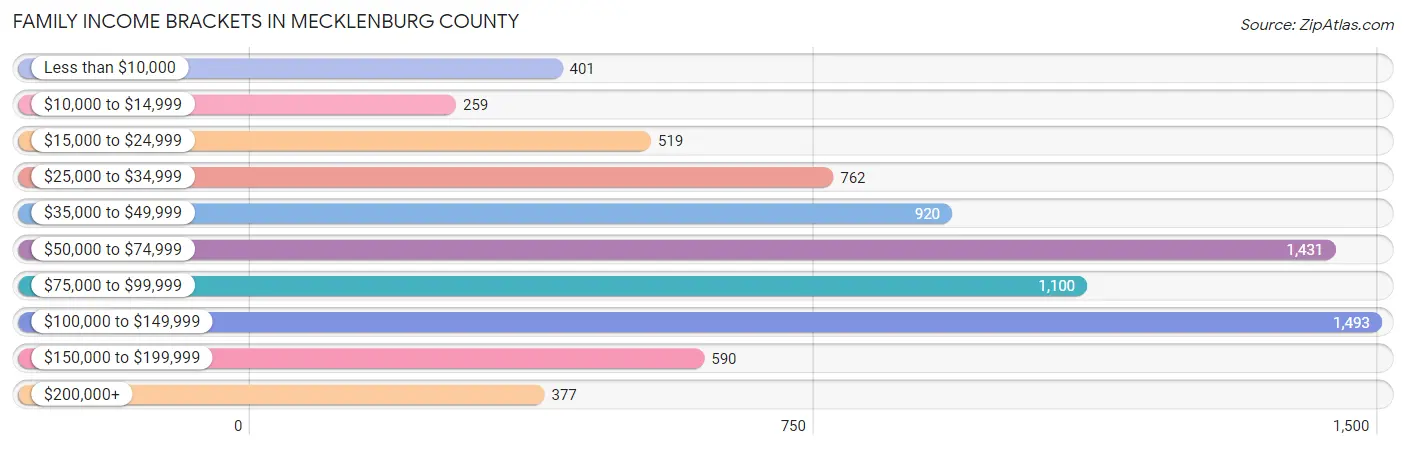
Family Income in Mecklenburg County
Family Income Brackets in Mecklenburg County
According to the Mecklenburg County family income data, there are 1,493 families falling into the $100,000 to $149,999 income range, which is the most common income bracket and makes up 19.0% of all families. Conversely, the $10,000 to $14,999 income bracket is the least frequent group with only 259 families (3.3%) belonging to this category.
| Income Bracket | # Families | % Families |
| Less than $10,000 | 401 | 5.1% |
| $10,000 to $14,999 | 259 | 3.3% |
| $15,000 to $24,999 | 519 | 6.6% |
| $25,000 to $34,999 | 762 | 9.7% |
| $35,000 to $49,999 | 920 | 11.7% |
| $50,000 to $74,999 | 1,431 | 18.2% |
| $75,000 to $99,999 | 1,100 | 14.0% |
| $100,000 to $149,999 | 1,493 | 19.0% |
| $150,000 to $199,999 | 590 | 7.5% |
| $200,000+ | 377 | 4.8% |
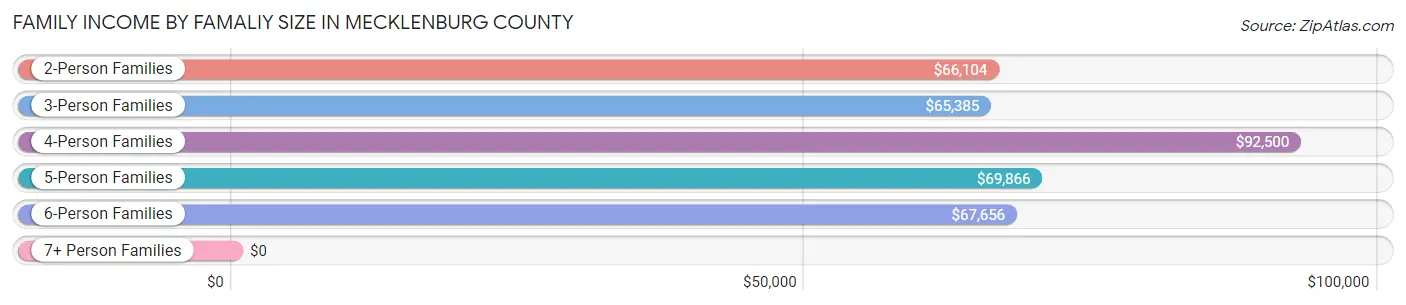
Family Income by Famaliy Size in Mecklenburg County
4-person families (1,038 | 13.2%) account for the highest median family income in Mecklenburg County with $92,500 per family, while 2-person families (4,675 | 59.5%) have the highest median income of $33,052 per family member.
| Income Bracket | # Families | Median Income |
| 2-Person Families | 4,675 (59.5%) | $66,104 |
| 3-Person Families | 1,598 (20.3%) | $65,385 |
| 4-Person Families | 1,038 (13.2%) | $92,500 |
| 5-Person Families | 379 (4.8%) | $69,866 |
| 6-Person Families | 110 (1.4%) | $67,656 |
| 7+ Person Families | 60 (0.8%) | $0 |
| Total | 7,860 (100.0%) | $69,671 |
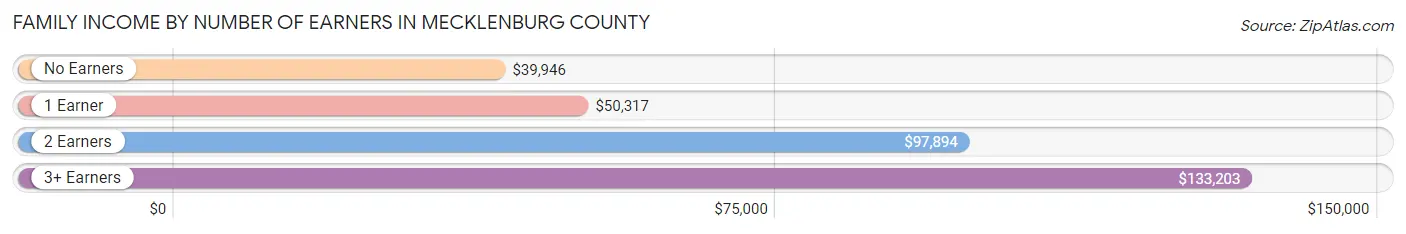
Family Income by Number of Earners in Mecklenburg County
The median family income in Mecklenburg County is $69,671, with families comprising 3+ earners (664) having the highest median family income of $133,203, while families with no earners (1,909) have the lowest median family income of $39,946, accounting for 8.5% and 24.3% of families, respectively.
| Number of Earners | # Families | Median Income |
| No Earners | 1,909 (24.3%) | $39,946 |
| 1 Earner | 2,716 (34.5%) | $50,317 |
| 2 Earners | 2,571 (32.7%) | $97,894 |
| 3+ Earners | 664 (8.5%) | $133,203 |
| Total | 7,860 (100.0%) | $69,671 |
Household Income in Mecklenburg County
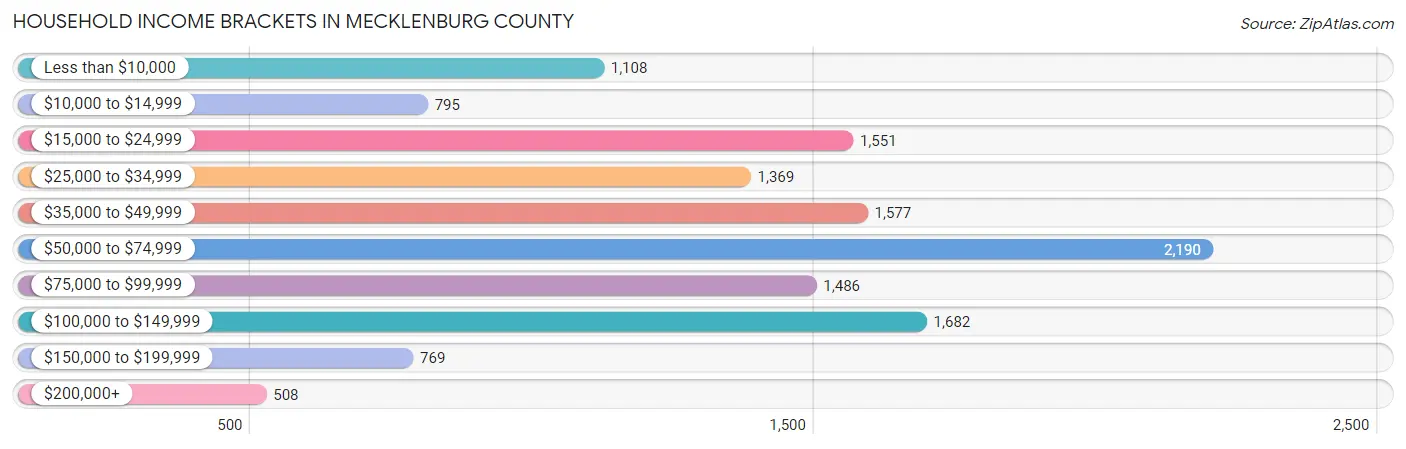
Household Income Brackets in Mecklenburg County
With 2,190 households falling in the category, the $50,000 to $74,999 income range is the most frequent in Mecklenburg County, accounting for 16.8% of all households. In contrast, only 508 households (3.9%) fall into the $200,000+ income bracket, making it the least populous group.
| Income Bracket | # Households | % Households |
| Less than $10,000 | 1,108 | 8.5% |
| $10,000 to $14,999 | 795 | 6.1% |
| $15,000 to $24,999 | 1,551 | 11.9% |
| $25,000 to $34,999 | 1,369 | 10.5% |
| $35,000 to $49,999 | 1,577 | 12.1% |
| $50,000 to $74,999 | 2,190 | 16.8% |
| $75,000 to $99,999 | 1,486 | 11.4% |
| $100,000 to $149,999 | 1,682 | 12.9% |
| $150,000 to $199,999 | 769 | 5.9% |
| $200,000+ | 508 | 3.9% |
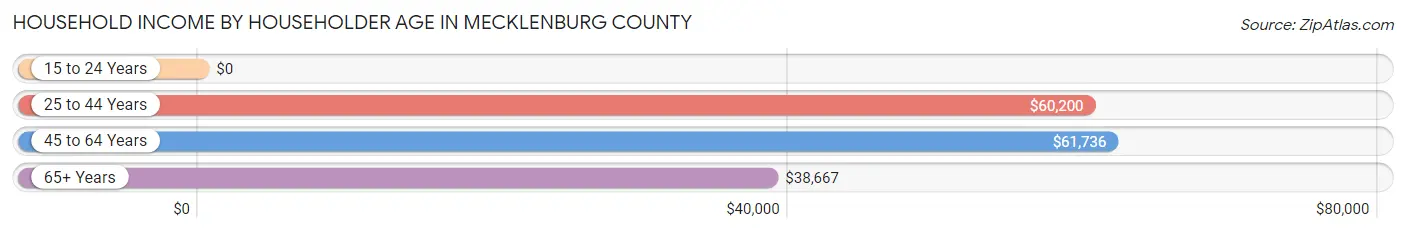
Household Income by Householder Age in Mecklenburg County
The median household income in Mecklenburg County is $51,265, with the highest median household income of $61,736 found in the 45 to 64 years age bracket for the primary householder. A total of 4,758 households (36.5%) fall into this category. Meanwhile, the 15 to 24 years age bracket for the primary householder has the lowest median household income of $0, with 360 households (2.8%) in this group.
| Income Bracket | # Households | Median Income |
| 15 to 24 Years | 360 (2.8%) | $0 |
| 25 to 44 Years | 2,821 (21.6%) | $60,200 |
| 45 to 64 Years | 4,758 (36.5%) | $61,736 |
| 65+ Years | 5,098 (39.1%) | $38,667 |
| Total | 13,037 (100.0%) | $51,265 |
Poverty in Mecklenburg County
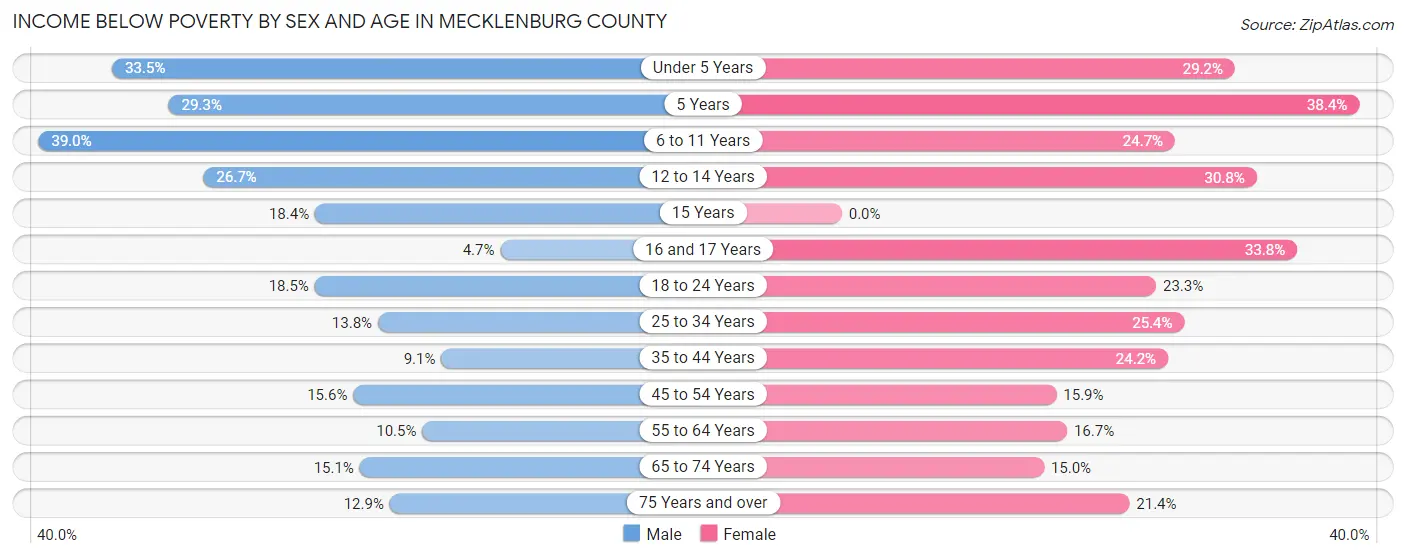
Income Below Poverty by Sex and Age in Mecklenburg County
With 16.5% poverty level for males and 21.0% for females among the residents of Mecklenburg County, 6 to 11 year old males and 5 year old females are the most vulnerable to poverty, with 320 males (39.0%) and 53 females (38.4%) in their respective age groups living below the poverty level.
| Age Bracket | Male | Female |
| Under 5 Years | 259 (33.5%) | 206 (29.2%) |
| 5 Years | 34 (29.3%) | 53 (38.4%) |
| 6 to 11 Years | 320 (39.0%) | 163 (24.7%) |
| 12 to 14 Years | 155 (26.7%) | 215 (30.8%) |
| 15 Years | 45 (18.4%) | 0 (0.0%) |
| 16 and 17 Years | 18 (4.7%) | 97 (33.8%) |
| 18 to 24 Years | 194 (18.5%) | 238 (23.3%) |
| 25 to 34 Years | 235 (13.8%) | 382 (25.4%) |
| 35 to 44 Years | 118 (9.1%) | 361 (24.2%) |
| 45 to 54 Years | 250 (15.6%) | 287 (15.9%) |
| 55 to 64 Years | 245 (10.5%) | 416 (16.7%) |
| 65 to 74 Years | 322 (15.1%) | 348 (15.0%) |
| 75 Years and over | 171 (12.9%) | 376 (21.3%) |
| Total | 2,366 (16.5%) | 3,142 (21.0%) |
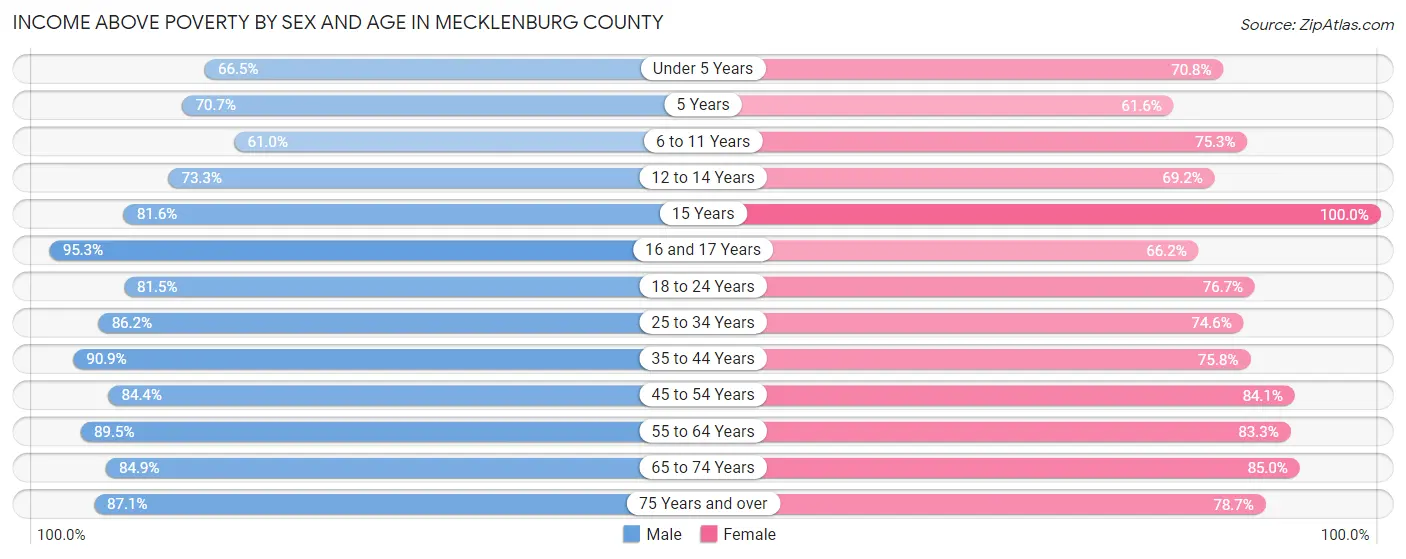
Income Above Poverty by Sex and Age in Mecklenburg County
According to the poverty statistics in Mecklenburg County, males aged 16 and 17 years and females aged 15 years are the age groups that are most secure financially, with 95.3% of males and 100.0% of females in these age groups living above the poverty line.
| Age Bracket | Male | Female |
| Under 5 Years | 514 (66.5%) | 500 (70.8%) |
| 5 Years | 82 (70.7%) | 85 (61.6%) |
| 6 to 11 Years | 501 (61.0%) | 496 (75.3%) |
| 12 to 14 Years | 425 (73.3%) | 483 (69.2%) |
| 15 Years | 199 (81.6%) | 103 (100.0%) |
| 16 and 17 Years | 367 (95.3%) | 190 (66.2%) |
| 18 to 24 Years | 857 (81.5%) | 782 (76.7%) |
| 25 to 34 Years | 1,471 (86.2%) | 1,120 (74.6%) |
| 35 to 44 Years | 1,184 (90.9%) | 1,130 (75.8%) |
| 45 to 54 Years | 1,353 (84.4%) | 1,515 (84.1%) |
| 55 to 64 Years | 2,095 (89.5%) | 2,072 (83.3%) |
| 65 to 74 Years | 1,807 (84.9%) | 1,970 (85.0%) |
| 75 Years and over | 1,156 (87.1%) | 1,385 (78.6%) |
| Total | 12,011 (83.5%) | 11,831 (79.0%) |
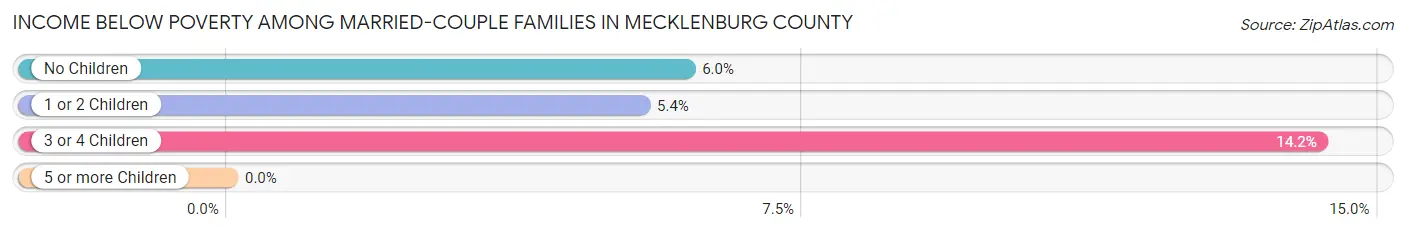
Income Below Poverty Among Married-Couple Families in Mecklenburg County
The poverty statistics for married-couple families in Mecklenburg County show that 6.3% or 340 of the total 5,372 families live below the poverty line. Families with 3 or 4 children have the highest poverty rate of 14.2%, comprising of 43 families. On the other hand, families with 5 or more children have the lowest poverty rate of 0.0%, which includes 0 families.
| Children | Above Poverty | Below Poverty |
| No Children | 3,856 (94.0%) | 245 (6.0%) |
| 1 or 2 Children | 915 (94.6%) | 52 (5.4%) |
| 3 or 4 Children | 259 (85.8%) | 43 (14.2%) |
| 5 or more Children | 2 (100.0%) | 0 (0.0%) |
| Total | 5,032 (93.7%) | 340 (6.3%) |
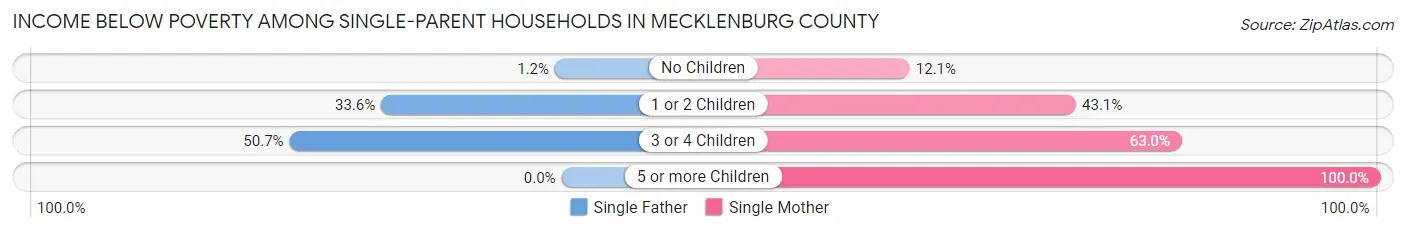
Income Below Poverty Among Single-Parent Households in Mecklenburg County
According to the poverty data in Mecklenburg County, 23.1% or 204 single-father households and 32.9% or 528 single-mother households are living below the poverty line. Among single-father households, those with 3 or 4 children have the highest poverty rate, with 37 households (50.7%) experiencing poverty. Likewise, among single-mother households, those with 5 or more children have the highest poverty rate, with 22 households (100.0%) falling below the poverty line.
| Children | Single Father | Single Mother |
| No Children | 4 (1.2%) | 79 (12.1%) |
| 1 or 2 Children | 163 (33.6%) | 347 (43.1%) |
| 3 or 4 Children | 37 (50.7%) | 80 (63.0%) |
| 5 or more Children | 0 (0.0%) | 22 (100.0%) |
| Total | 204 (23.1%) | 528 (32.9%) |
Income Below Poverty Among Married-Couple vs Single-Parent Households in Mecklenburg County
The poverty data for Mecklenburg County shows that 340 of the married-couple family households (6.3%) and 732 of the single-parent households (29.4%) are living below the poverty level. Within the married-couple family households, those with 3 or 4 children have the highest poverty rate, with 43 households (14.2%) falling below the poverty line. Among the single-parent households, those with 5 or more children have the highest poverty rate, with 22 household (100.0%) living below poverty.
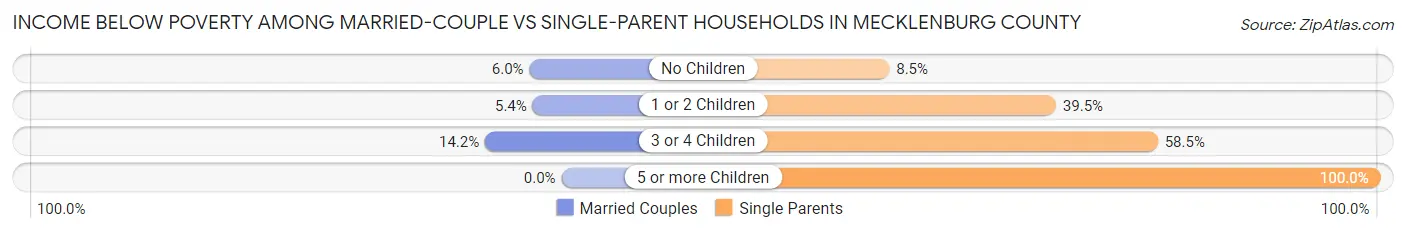
| Children | Married-Couple Families | Single-Parent Households |
| No Children | 245 (6.0%) | 83 (8.5%) |
| 1 or 2 Children | 52 (5.4%) | 510 (39.5%) |
| 3 or 4 Children | 43 (14.2%) | 117 (58.5%) |
| 5 or more Children | 0 (0.0%) | 22 (100.0%) |
| Total | 340 (6.3%) | 732 (29.4%) |
Race in Mecklenburg County
The most populous races in Mecklenburg County are White / Caucasian (18,941 | 62.4%), Black / African American (10,123 | 33.3%), and Hispanic or Latino (941 | 3.1%).
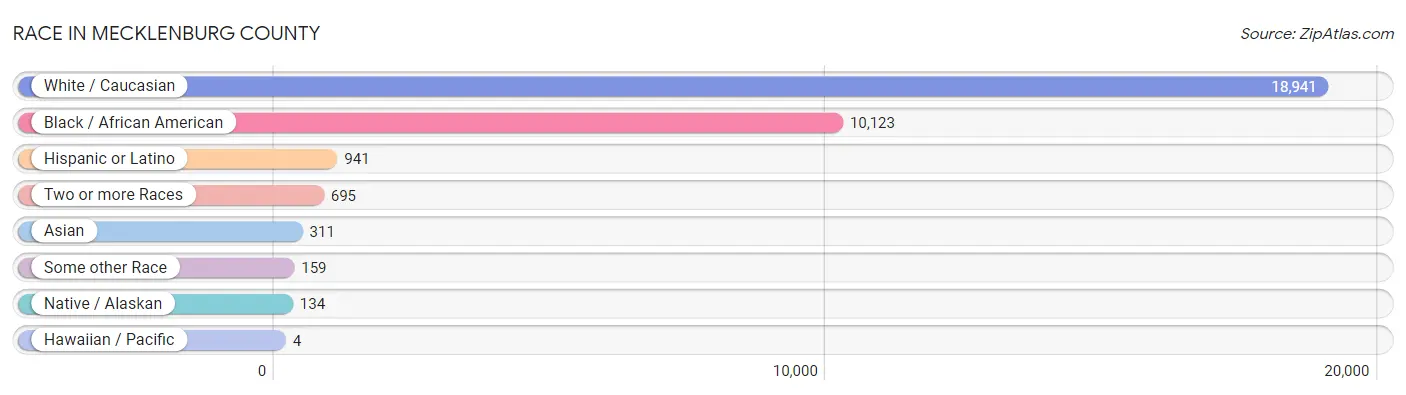
| Race | # Population | % Population |
| Asian | 311 | 1.0% |
| Black / African American | 10,123 | 33.3% |
| Hawaiian / Pacific | 4 | 0.0% |
| Hispanic or Latino | 941 | 3.1% |
| Native / Alaskan | 134 | 0.4% |
| White / Caucasian | 18,941 | 62.4% |
| Two or more Races | 695 | 2.3% |
| Some other Race | 159 | 0.5% |
| Total | 30,367 | 100.0% |
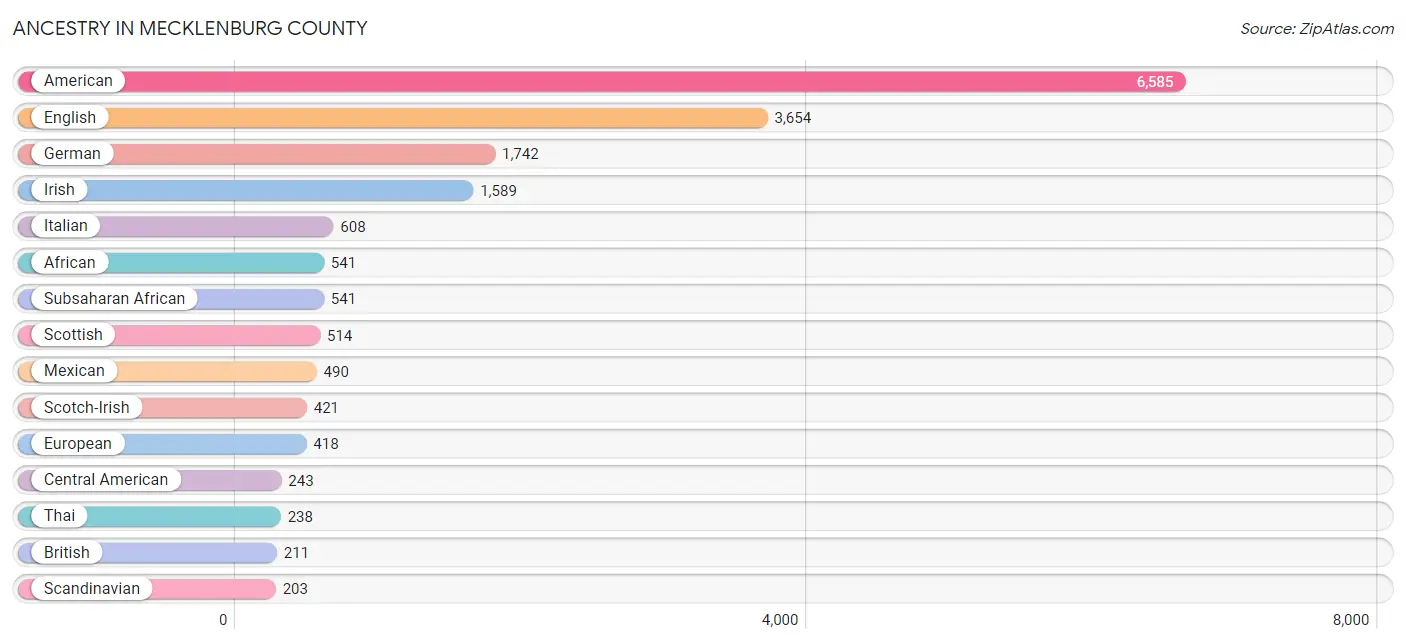
Ancestry in Mecklenburg County
The most populous ancestries reported in Mecklenburg County are American (6,585 | 21.7%), English (3,654 | 12.0%), German (1,742 | 5.7%), Irish (1,589 | 5.2%), and Italian (608 | 2.0%), together accounting for 46.7% of all Mecklenburg County residents.
| Ancestry | # Population | % Population |
| African | 541 | 1.8% |
| Albanian | 8 | 0.0% |
| American | 6,585 | 21.7% |
| Apache | 4 | 0.0% |
| Arab | 86 | 0.3% |
| Austrian | 19 | 0.1% |
| Bhutanese | 2 | 0.0% |
| Blackfeet | 7 | 0.0% |
| Bolivian | 2 | 0.0% |
| Brazilian | 3 | 0.0% |
| British | 211 | 0.7% |
| Burmese | 4 | 0.0% |
| Canadian | 3 | 0.0% |
| Central American | 243 | 0.8% |
| Cherokee | 57 | 0.2% |
| Choctaw | 17 | 0.1% |
| Cuban | 8 | 0.0% |
| Czech | 6 | 0.0% |
| Danish | 13 | 0.0% |
| Delaware | 78 | 0.3% |
| Dutch | 112 | 0.4% |
| Eastern European | 14 | 0.1% |
| Ecuadorian | 3 | 0.0% |
| English | 3,654 | 12.0% |
| European | 418 | 1.4% |
| Finnish | 13 | 0.0% |
| French | 135 | 0.4% |
| French Canadian | 98 | 0.3% |
| German | 1,742 | 5.7% |
| Greek | 6 | 0.0% |
| Guamanian / Chamorro | 6 | 0.0% |
| Guatemalan | 43 | 0.1% |
| Haitian | 11 | 0.0% |
| Honduran | 6 | 0.0% |
| Hungarian | 81 | 0.3% |
| Indian (Asian) | 1 | 0.0% |
| Irish | 1,589 | 5.2% |
| Italian | 608 | 2.0% |
| Jamaican | 2 | 0.0% |
| Korean | 86 | 0.3% |
| Lebanese | 30 | 0.1% |
| Lithuanian | 3 | 0.0% |
| Lumbee | 2 | 0.0% |
| Mexican | 490 | 1.6% |
| Mexican American Indian | 6 | 0.0% |
| Norwegian | 106 | 0.4% |
| Pakistani | 3 | 0.0% |
| Panamanian | 20 | 0.1% |
| Peruvian | 3 | 0.0% |
| Polish | 153 | 0.5% |
| Portuguese | 95 | 0.3% |
| Puerto Rican | 176 | 0.6% |
| Romanian | 19 | 0.1% |
| Russian | 20 | 0.1% |
| Salvadoran | 174 | 0.6% |
| Scandinavian | 203 | 0.7% |
| Scotch-Irish | 421 | 1.4% |
| Scottish | 514 | 1.7% |
| Slavic | 3 | 0.0% |
| Slovak | 14 | 0.1% |
| South American | 8 | 0.0% |
| Spaniard | 7 | 0.0% |
| Subsaharan African | 541 | 1.8% |
| Swedish | 39 | 0.1% |
| Swiss | 8 | 0.0% |
| Syrian | 7 | 0.0% |
| Thai | 238 | 0.8% |
| Trinidadian and Tobagonian | 3 | 0.0% |
| Turkish | 3 | 0.0% |
| Ukrainian | 36 | 0.1% |
| Welsh | 140 | 0.5% |
| Yaqui | 4 | 0.0% |
| Yup'ik | 8 | 0.0% | View All 73 Rows |
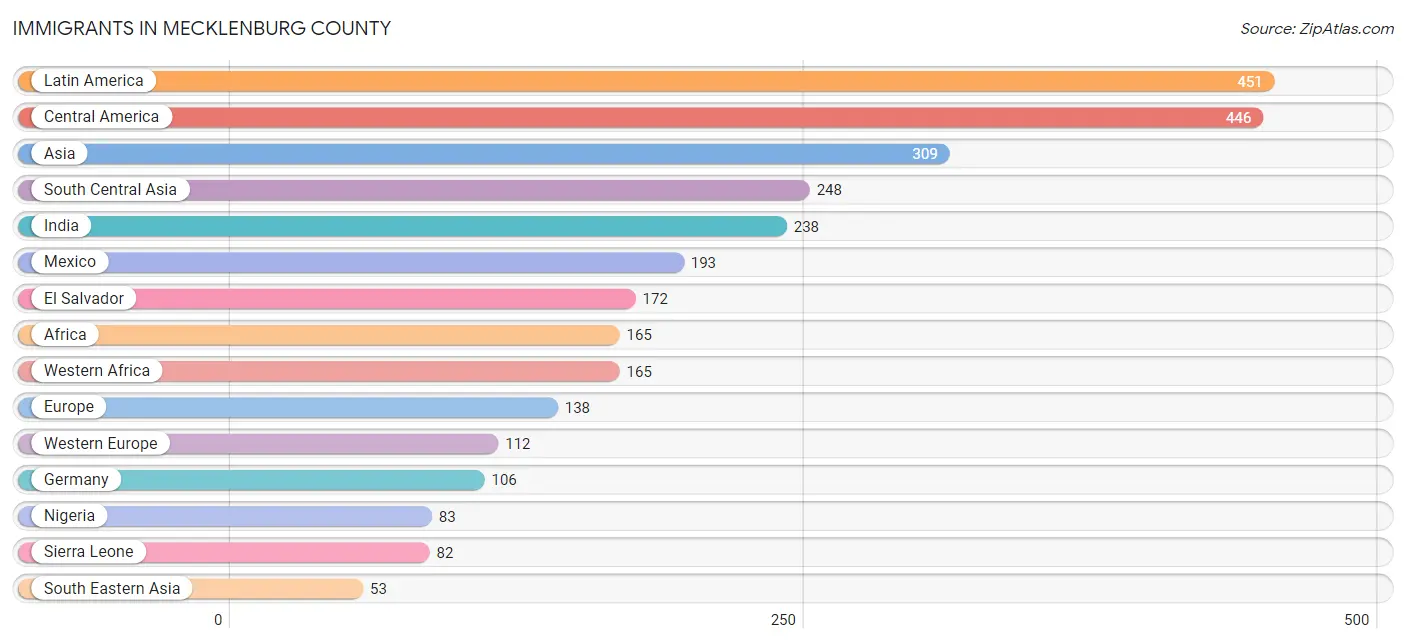
Immigrants in Mecklenburg County
The most numerous immigrant groups reported in Mecklenburg County came from Latin America (451 | 1.5%), Central America (446 | 1.5%), Asia (309 | 1.0%), South Central Asia (248 | 0.8%), and India (238 | 0.8%), together accounting for 5.6% of all Mecklenburg County residents.
| Immigration Origin | # Population | % Population |
| Africa | 165 | 0.5% |
| Asia | 309 | 1.0% |
| Bolivia | 2 | 0.0% |
| Canada | 4 | 0.0% |
| Central America | 446 | 1.5% |
| China | 1 | 0.0% |
| Eastern Asia | 5 | 0.0% |
| El Salvador | 172 | 0.6% |
| Europe | 138 | 0.4% |
| France | 6 | 0.0% |
| Germany | 106 | 0.4% |
| Guatemala | 36 | 0.1% |
| Honduras | 27 | 0.1% |
| India | 238 | 0.8% |
| Iran | 10 | 0.0% |
| Italy | 19 | 0.1% |
| Korea | 4 | 0.0% |
| Latin America | 451 | 1.5% |
| Mexico | 193 | 0.6% |
| Nigeria | 83 | 0.3% |
| Northern Europe | 7 | 0.0% |
| Panama | 18 | 0.1% |
| Peru | 3 | 0.0% |
| Philippines | 51 | 0.2% |
| Scotland | 2 | 0.0% |
| Sierra Leone | 82 | 0.3% |
| South America | 5 | 0.0% |
| South Central Asia | 248 | 0.8% |
| South Eastern Asia | 53 | 0.2% |
| Southern Europe | 19 | 0.1% |
| Thailand | 2 | 0.0% |
| Western Africa | 165 | 0.5% |
| Western Asia | 3 | 0.0% |
| Western Europe | 112 | 0.4% |
| Yemen | 3 | 0.0% | View All 35 Rows |
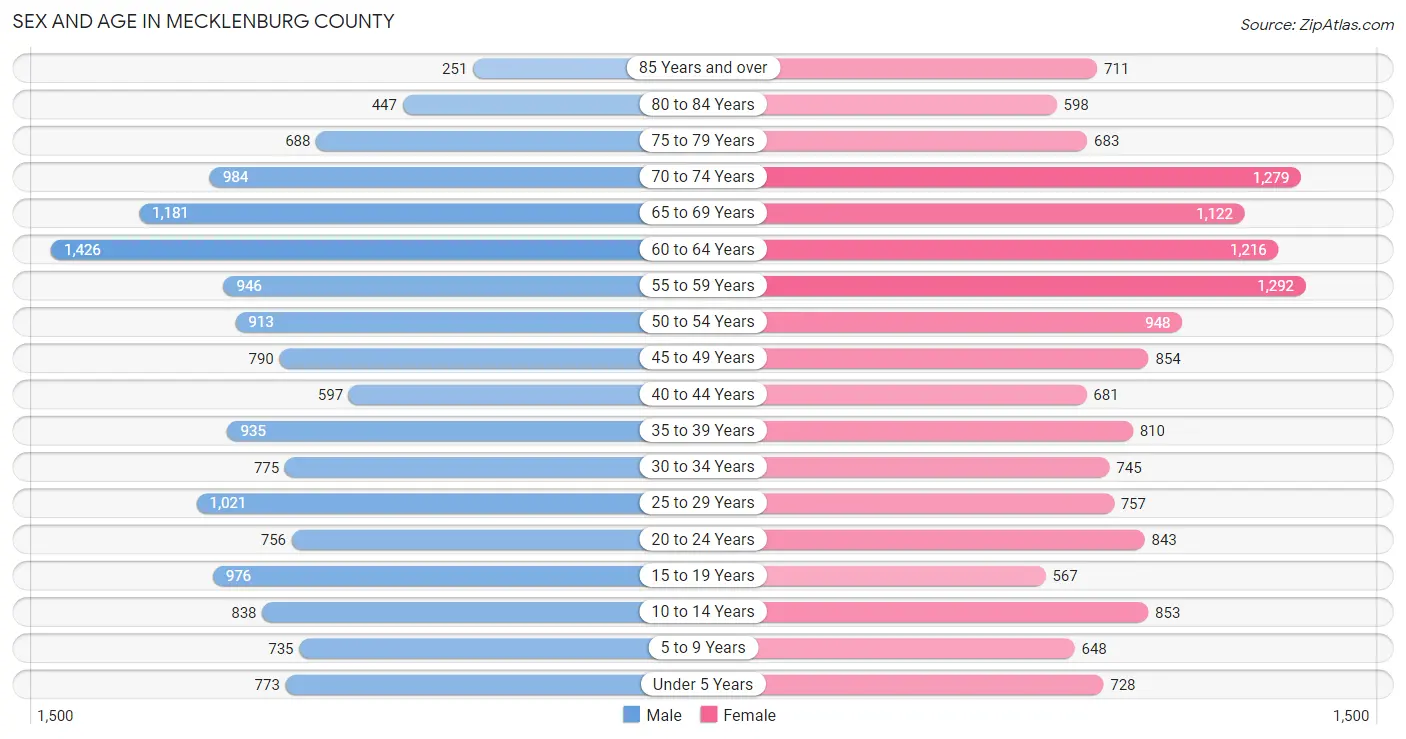
Sex and Age in Mecklenburg County
Sex and Age in Mecklenburg County
The most populous age groups in Mecklenburg County are 60 to 64 Years (1,426 | 9.5%) for men and 55 to 59 Years (1,292 | 8.4%) for women.
| Age Bracket | Male | Female |
| Under 5 Years | 773 (5.1%) | 728 (4.8%) |
| 5 to 9 Years | 735 (4.9%) | 648 (4.2%) |
| 10 to 14 Years | 838 (5.6%) | 853 (5.6%) |
| 15 to 19 Years | 976 (6.5%) | 567 (3.7%) |
| 20 to 24 Years | 756 (5.0%) | 843 (5.5%) |
| 25 to 29 Years | 1,021 (6.8%) | 757 (4.9%) |
| 30 to 34 Years | 775 (5.2%) | 745 (4.9%) |
| 35 to 39 Years | 935 (6.2%) | 810 (5.3%) |
| 40 to 44 Years | 597 (4.0%) | 681 (4.4%) |
| 45 to 49 Years | 790 (5.3%) | 854 (5.6%) |
| 50 to 54 Years | 913 (6.1%) | 948 (6.2%) |
| 55 to 59 Years | 946 (6.3%) | 1,292 (8.4%) |
| 60 to 64 Years | 1,426 (9.5%) | 1,216 (7.9%) |
| 65 to 69 Years | 1,181 (7.9%) | 1,122 (7.3%) |
| 70 to 74 Years | 984 (6.6%) | 1,279 (8.3%) |
| 75 to 79 Years | 688 (4.6%) | 683 (4.4%) |
| 80 to 84 Years | 447 (3.0%) | 598 (3.9%) |
| 85 Years and over | 251 (1.7%) | 711 (4.6%) |
| Total | 15,032 (100.0%) | 15,335 (100.0%) |
Families and Households in Mecklenburg County
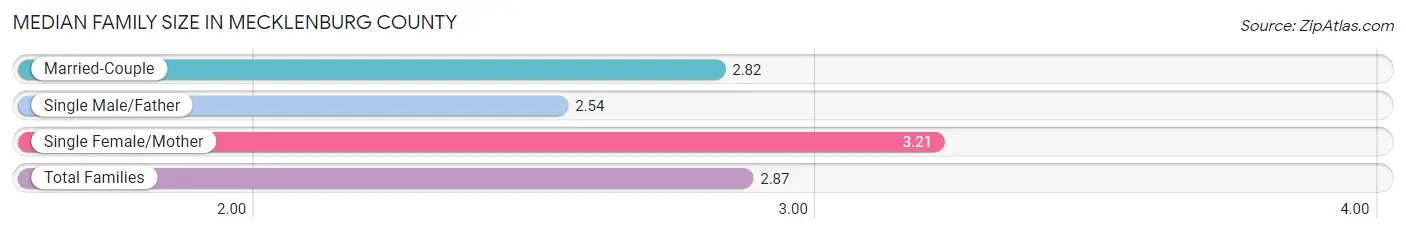
Median Family Size in Mecklenburg County
The median family size in Mecklenburg County is 2.87 persons per family, with single female/mother families (1,605 | 20.4%) accounting for the largest median family size of 3.21 persons per family. On the other hand, single male/father families (883 | 11.2%) represent the smallest median family size with 2.54 persons per family.
| Family Type | # Families | Family Size |
| Married-Couple | 5,372 (68.3%) | 2.82 |
| Single Male/Father | 883 (11.2%) | 2.54 |
| Single Female/Mother | 1,605 (20.4%) | 3.21 |
| Total Families | 7,860 (100.0%) | 2.87 |
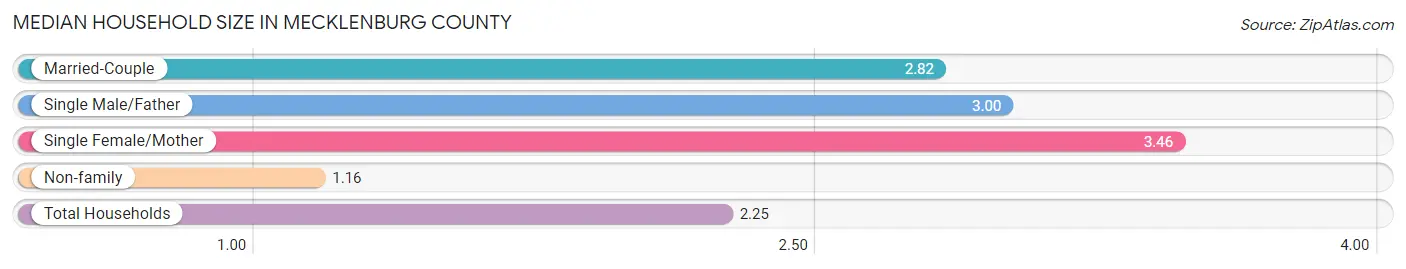
Median Household Size in Mecklenburg County
The median household size in Mecklenburg County is 2.25 persons per household, with single female/mother households (1,605 | 12.3%) accounting for the largest median household size of 3.46 persons per household. non-family households (5,177 | 39.7%) represent the smallest median household size with 1.16 persons per household.
| Household Type | # Households | Household Size |
| Married-Couple | 5,372 (41.2%) | 2.82 |
| Single Male/Father | 883 (6.8%) | 3.00 |
| Single Female/Mother | 1,605 (12.3%) | 3.46 |
| Non-family | 5,177 (39.7%) | 1.16 |
| Total Households | 13,037 (100.0%) | 2.25 |
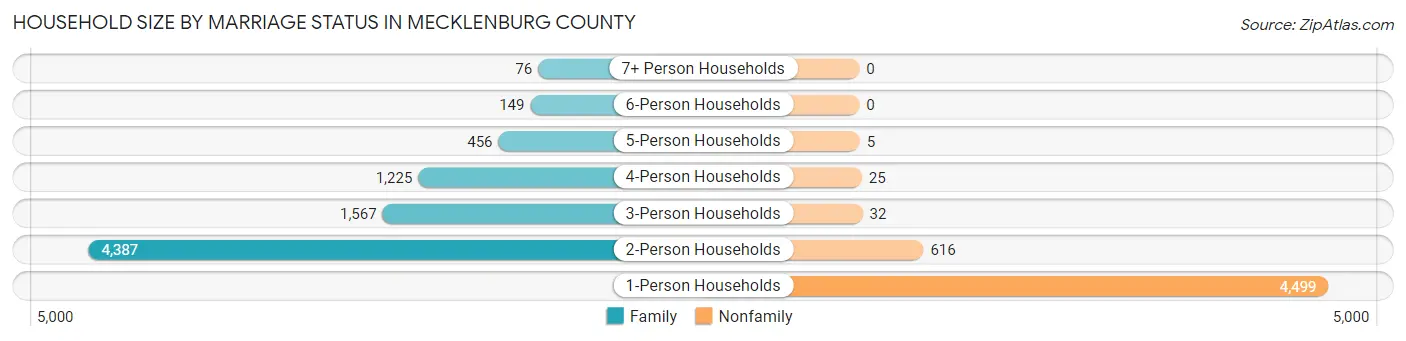
Household Size by Marriage Status in Mecklenburg County
Out of a total of 13,037 households in Mecklenburg County, 7,860 (60.3%) are family households, while 5,177 (39.7%) are nonfamily households. The most numerous type of family households are 2-person households, comprising 4,387, and the most common type of nonfamily households are 1-person households, comprising 4,499.
| Household Size | Family Households | Nonfamily Households |
| 1-Person Households | - | 4,499 (34.5%) |
| 2-Person Households | 4,387 (33.7%) | 616 (4.7%) |
| 3-Person Households | 1,567 (12.0%) | 32 (0.3%) |
| 4-Person Households | 1,225 (9.4%) | 25 (0.2%) |
| 5-Person Households | 456 (3.5%) | 5 (0.0%) |
| 6-Person Households | 149 (1.1%) | 0 (0.0%) |
| 7+ Person Households | 76 (0.6%) | 0 (0.0%) |
| Total | 7,860 (60.3%) | 5,177 (39.7%) |
Female Fertility in Mecklenburg County
Fertility by Age in Mecklenburg County
Average fertility rate in Mecklenburg County is 47.0 births per 1,000 women. Women in the age bracket of 20 to 34 years have the highest fertility rate with 100.0 births per 1,000 women. Women in the age bracket of 20 to 34 years acount for 89.7% of all women with births.
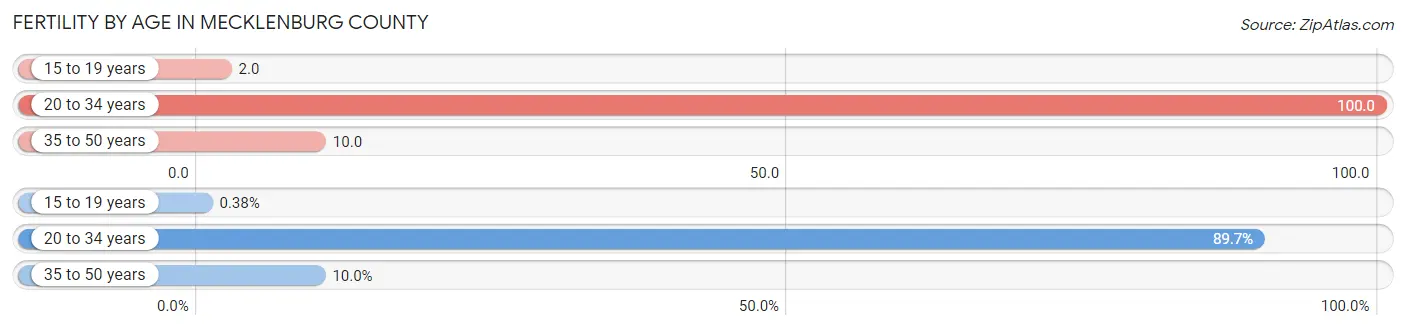
| Age Bracket | Women with Births | Births / 1,000 Women |
| 15 to 19 years | 1 (0.4%) | 2.0 |
| 20 to 34 years | 234 (89.7%) | 100.0 |
| 35 to 50 years | 26 (10.0%) | 10.0 |
| Total | 261 (100.0%) | 47.0 |
Fertility by Age by Marriage Status in Mecklenburg County
42.5% of women with births (261) in Mecklenburg County are married. The highest percentage of unmarried women with births falls into 15 to 19 years age bracket with 100.0% of them unmarried at the time of birth, while the lowest percentage of unmarried women with births belong to 35 to 50 years age bracket with 7.7% of them unmarried.
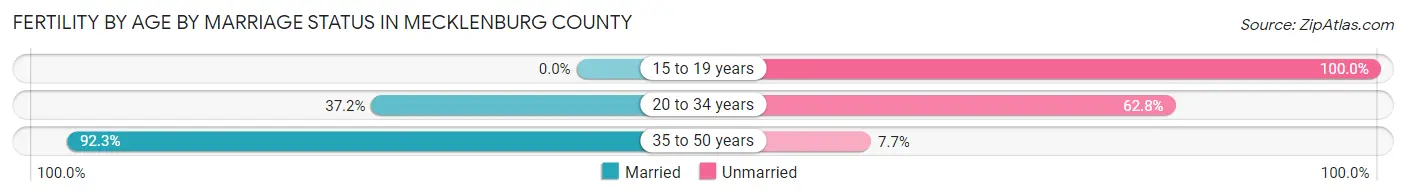
| Age Bracket | Married | Unmarried |
| 15 to 19 years | 0 (0.0%) | 1 (100.0%) |
| 20 to 34 years | 87 (37.2%) | 147 (62.8%) |
| 35 to 50 years | 24 (92.3%) | 2 (7.7%) |
| Total | 111 (42.5%) | 150 (57.5%) |
Fertility by Education in Mecklenburg County
Average fertility rate in Mecklenburg County is 47.0 births per 1,000 women. Women with the education attainment of college or associate's degree have the highest fertility rate of 76.0 births per 1,000 women, while women with the education attainment of high school diploma have the lowest fertility at 30.0 births per 1,000 women. Women with the education attainment of college or associate's degree represent 55.6% of all women with births.
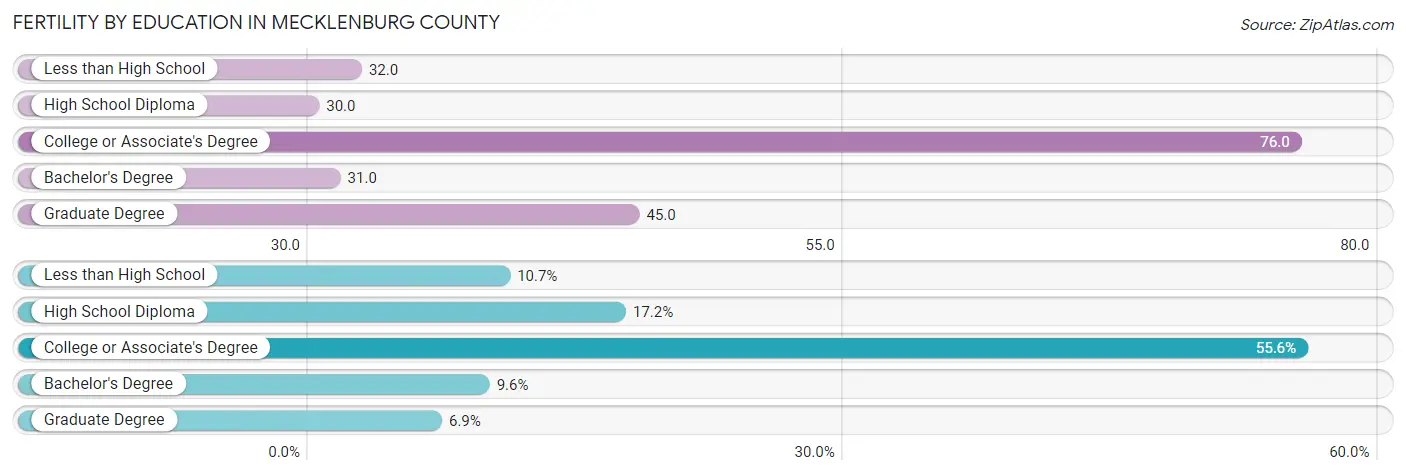
| Educational Attainment | Women with Births | Births / 1,000 Women |
| Less than High School | 28 (10.7%) | 32.0 |
| High School Diploma | 45 (17.2%) | 30.0 |
| College or Associate's Degree | 145 (55.6%) | 76.0 |
| Bachelor's Degree | 25 (9.6%) | 31.0 |
| Graduate Degree | 18 (6.9%) | 45.0 |
| Total | 261 (100.0%) | 47.0 |
Fertility by Education by Marriage Status in Mecklenburg County
57.5% of women with births in Mecklenburg County are unmarried. Women with the educational attainment of bachelor's degree are most likely to be married with 100.0% of them married at childbirth, while women with the educational attainment of high school diploma are least likely to be married with 97.8% of them unmarried at childbirth.
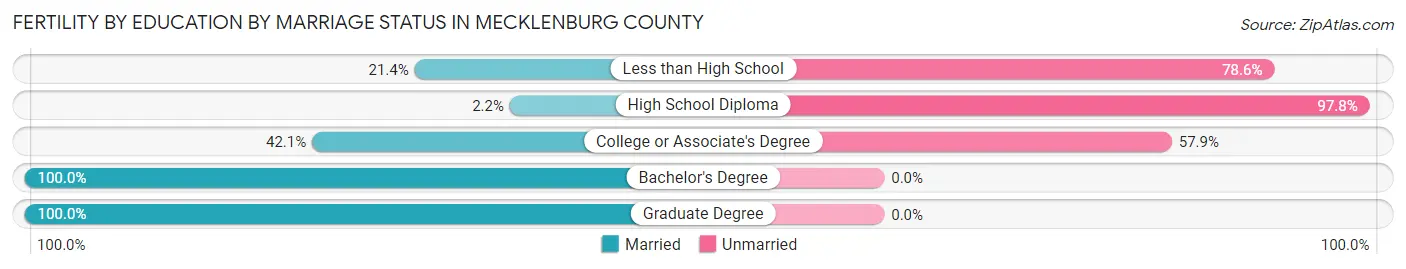
| Educational Attainment | Married | Unmarried |
| Less than High School | 6 (21.4%) | 22 (78.6%) |
| High School Diploma | 1 (2.2%) | 44 (97.8%) |
| College or Associate's Degree | 61 (42.1%) | 84 (57.9%) |
| Bachelor's Degree | 25 (100.0%) | 0 (0.0%) |
| Graduate Degree | 18 (100.0%) | 0 (0.0%) |
| Total | 111 (42.5%) | 150 (57.5%) |
Employment Characteristics in Mecklenburg County
Employment by Class of Employer in Mecklenburg County
Among the 12,273 employed individuals in Mecklenburg County, private company employees (7,674 | 62.5%), local government employees (1,360 | 11.1%), and state government employees (1,212 | 9.9%) make up the most common classes of employment.
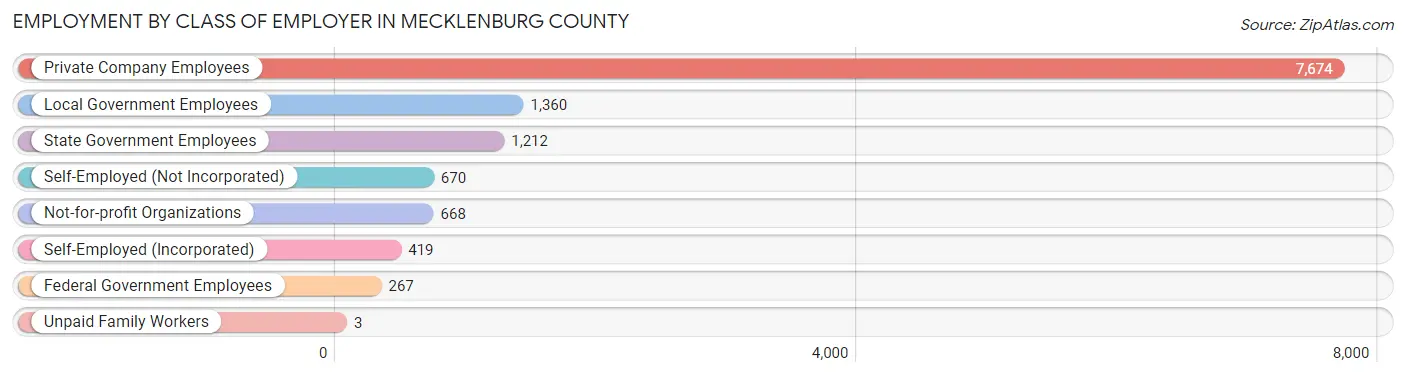
| Employer Class | # Employees | % Employees |
| Private Company Employees | 7,674 | 62.5% |
| Self-Employed (Incorporated) | 419 | 3.4% |
| Self-Employed (Not Incorporated) | 670 | 5.5% |
| Not-for-profit Organizations | 668 | 5.4% |
| Local Government Employees | 1,360 | 11.1% |
| State Government Employees | 1,212 | 9.9% |
| Federal Government Employees | 267 | 2.2% |
| Unpaid Family Workers | 3 | 0.0% |
| Total | 12,273 | 100.0% |
Employment Status by Age in Mecklenburg County
According to the labor force statistics for Mecklenburg County, out of the total population over 16 years of age (25,445), 51.3% or 13,053 individuals are in the labor force, with 3.6% or 470 of them unemployed. The age group with the highest labor force participation rate is 30 to 34 years, with 80.2% or 1,219 individuals in the labor force. Within the labor force, the 20 to 24 years age range has the highest percentage of unemployed individuals, with 11.2% or 111 of them being unemployed.
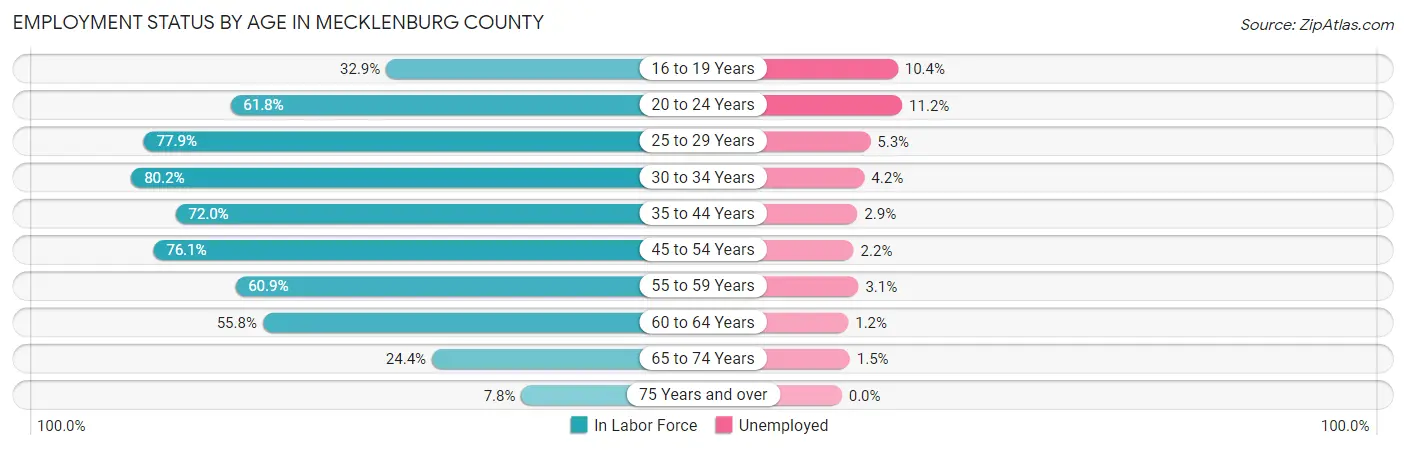
| Age Bracket | In Labor Force | Unemployed |
| 16 to 19 Years | 393 (32.9%) | 41 (10.4%) |
| 20 to 24 Years | 988 (61.8%) | 111 (11.2%) |
| 25 to 29 Years | 1,385 (77.9%) | 73 (5.3%) |
| 30 to 34 Years | 1,219 (80.2%) | 51 (4.2%) |
| 35 to 44 Years | 2,177 (72.0%) | 63 (2.9%) |
| 45 to 54 Years | 2,667 (76.1%) | 59 (2.2%) |
| 55 to 59 Years | 1,363 (60.9%) | 42 (3.1%) |
| 60 to 64 Years | 1,474 (55.8%) | 18 (1.2%) |
| 65 to 74 Years | 1,114 (24.4%) | 17 (1.5%) |
| 75 Years and over | 263 (7.8%) | 0 (0.0%) |
| Total | 13,053 (51.3%) | 470 (3.6%) |
Employment Status by Educational Attainment in Mecklenburg County
According to labor force statistics for Mecklenburg County, 69.9% of individuals (10,279) out of the total population between 25 and 64 years of age (14,706) are in the labor force, with 3.0% or 308 of them being unemployed. The group with the highest labor force participation rate are those with the educational attainment of bachelor's degree or higher, with 87.6% or 3,002 individuals in the labor force. Within the labor force, individuals with less than high school education have the highest percentage of unemployment, with 7.8% or 70 of them being unemployed.
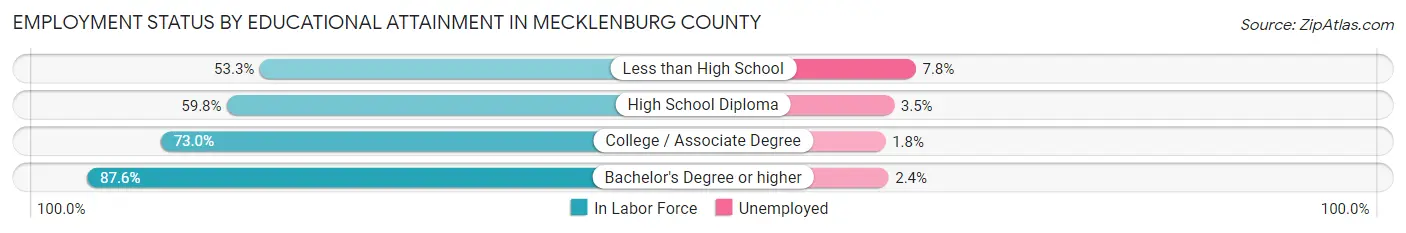
| Educational Attainment | In Labor Force | Unemployed |
| Less than High School | 897 (53.3%) | 131 (7.8%) |
| High School Diploma | 2,811 (59.8%) | 165 (3.5%) |
| College / Associate Degree | 3,574 (73.0%) | 88 (1.8%) |
| Bachelor's Degree or higher | 3,002 (87.6%) | 82 (2.4%) |
| Total | 10,279 (69.9%) | 441 (3.0%) |
Employment Occupations by Sex in Mecklenburg County
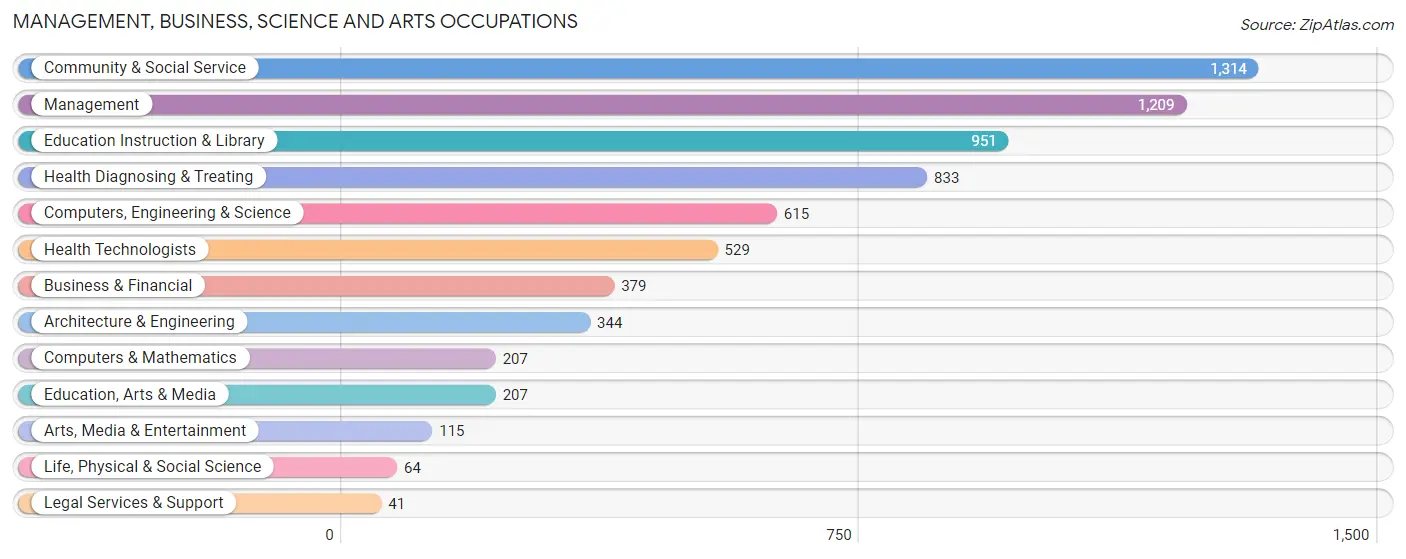
Management, Business, Science and Arts Occupations
The most common Management, Business, Science and Arts occupations in Mecklenburg County are Community & Social Service (1,314 | 10.5%), Management (1,209 | 9.6%), Education Instruction & Library (951 | 7.6%), Health Diagnosing & Treating (833 | 6.6%), and Computers, Engineering & Science (615 | 4.9%).
Management, Business, Science and Arts Occupations by Sex
Within the Management, Business, Science and Arts occupations in Mecklenburg County, the most male-oriented occupations are Architecture & Engineering (100.0%), Computers, Engineering & Science (88.6%), and Computers & Mathematics (78.3%), while the most female-oriented occupations are Legal Services & Support (95.1%), Education Instruction & Library (89.5%), and Community & Social Service (83.4%).
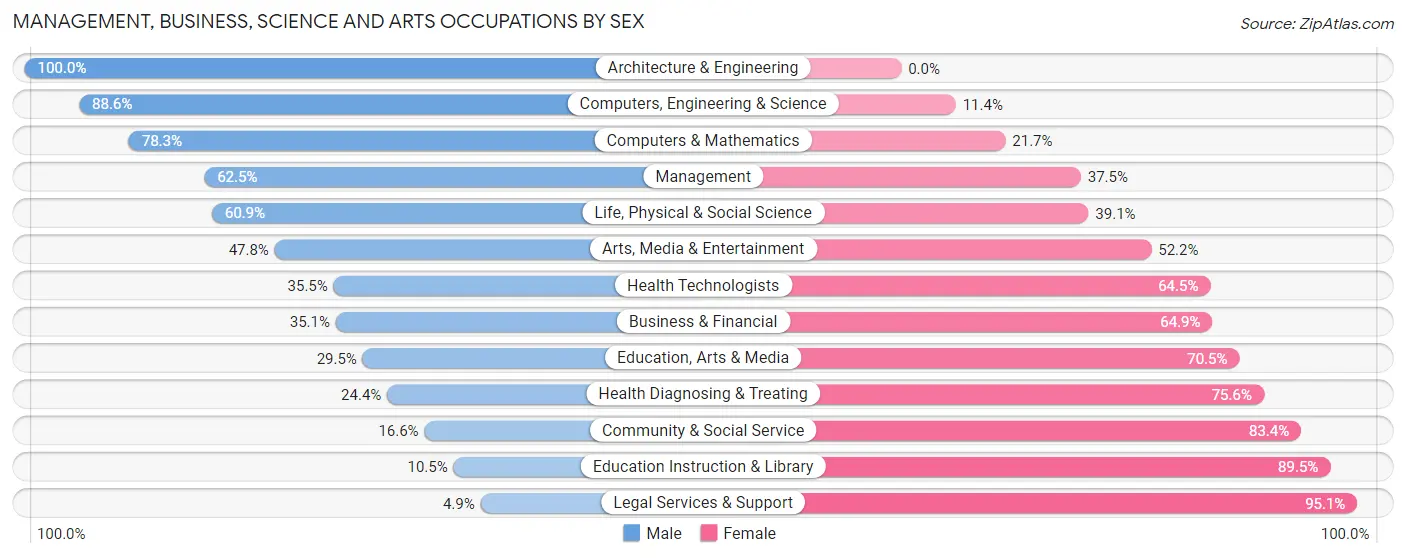
| Occupation | Male | Female |
| Management | 756 (62.5%) | 453 (37.5%) |
| Business & Financial | 133 (35.1%) | 246 (64.9%) |
| Computers, Engineering & Science | 545 (88.6%) | 70 (11.4%) |
| Computers & Mathematics | 162 (78.3%) | 45 (21.7%) |
| Architecture & Engineering | 344 (100.0%) | 0 (0.0%) |
| Life, Physical & Social Science | 39 (60.9%) | 25 (39.1%) |
| Community & Social Service | 218 (16.6%) | 1,096 (83.4%) |
| Education, Arts & Media | 61 (29.5%) | 146 (70.5%) |
| Legal Services & Support | 2 (4.9%) | 39 (95.1%) |
| Education Instruction & Library | 100 (10.5%) | 851 (89.5%) |
| Arts, Media & Entertainment | 55 (47.8%) | 60 (52.2%) |
| Health Diagnosing & Treating | 203 (24.4%) | 630 (75.6%) |
| Health Technologists | 188 (35.5%) | 341 (64.5%) |
| Total (Category) | 1,855 (42.6%) | 2,495 (57.4%) |
| Total (Overall) | 6,573 (52.3%) | 5,988 (47.7%) |
Services Occupations
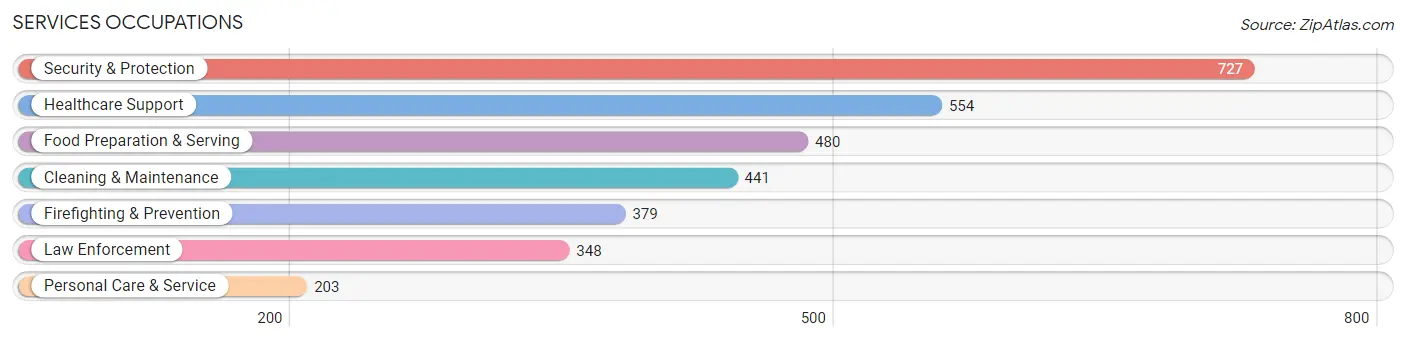
The most common Services occupations in Mecklenburg County are Security & Protection (727 | 5.8%), Healthcare Support (554 | 4.4%), Food Preparation & Serving (480 | 3.8%), Cleaning & Maintenance (441 | 3.5%), and Firefighting & Prevention (379 | 3.0%).
Services Occupations by Sex
Within the Services occupations in Mecklenburg County, the most male-oriented occupations are Law Enforcement (77.6%), Cleaning & Maintenance (68.5%), and Security & Protection (66.3%), while the most female-oriented occupations are Healthcare Support (91.7%), Food Preparation & Serving (74.0%), and Personal Care & Service (50.7%).
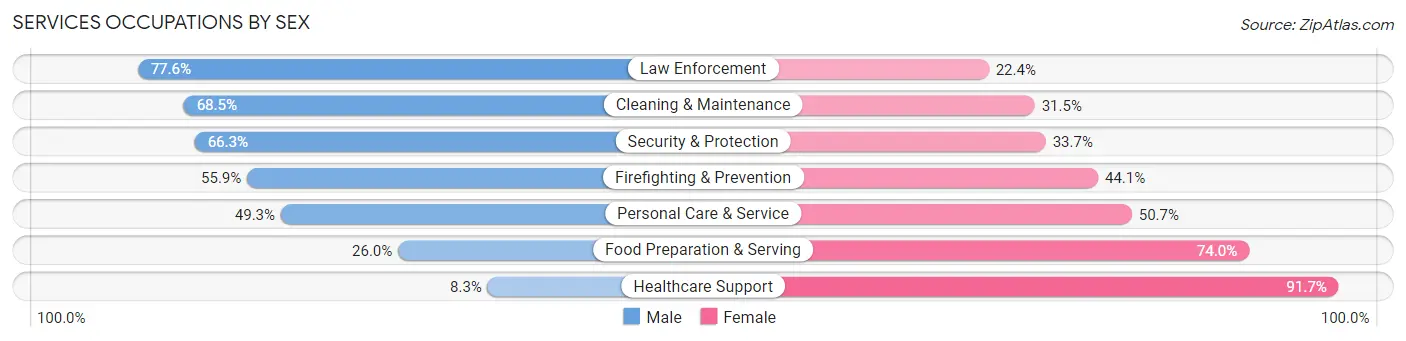
| Occupation | Male | Female |
| Healthcare Support | 46 (8.3%) | 508 (91.7%) |
| Security & Protection | 482 (66.3%) | 245 (33.7%) |
| Firefighting & Prevention | 212 (55.9%) | 167 (44.1%) |
| Law Enforcement | 270 (77.6%) | 78 (22.4%) |
| Food Preparation & Serving | 125 (26.0%) | 355 (74.0%) |
| Cleaning & Maintenance | 302 (68.5%) | 139 (31.5%) |
| Personal Care & Service | 100 (49.3%) | 103 (50.7%) |
| Total (Category) | 1,055 (43.9%) | 1,350 (56.1%) |
| Total (Overall) | 6,573 (52.3%) | 5,988 (47.7%) |
Sales and Office Occupations
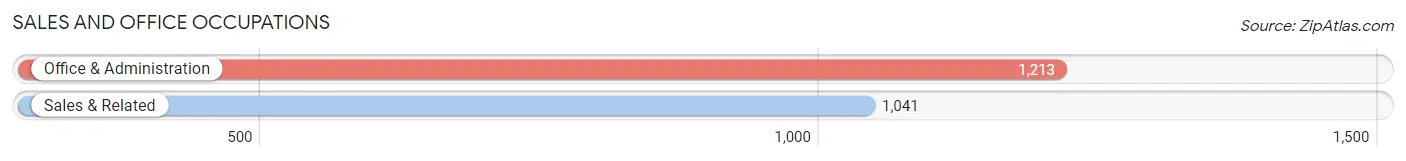
The most common Sales and Office occupations in Mecklenburg County are Office & Administration (1,213 | 9.7%), and Sales & Related (1,041 | 8.3%).
Sales and Office Occupations by Sex

| Occupation | Male | Female |
| Sales & Related | 572 (54.9%) | 469 (45.1%) |
| Office & Administration | 216 (17.8%) | 997 (82.2%) |
| Total (Category) | 788 (35.0%) | 1,466 (65.0%) |
| Total (Overall) | 6,573 (52.3%) | 5,988 (47.7%) |
Natural Resources, Construction and Maintenance Occupations
The most common Natural Resources, Construction and Maintenance occupations in Mecklenburg County are Construction & Extraction (650 | 5.2%), Installation, Maintenance & Repair (476 | 3.8%), and Farming, Fishing & Forestry (81 | 0.6%).
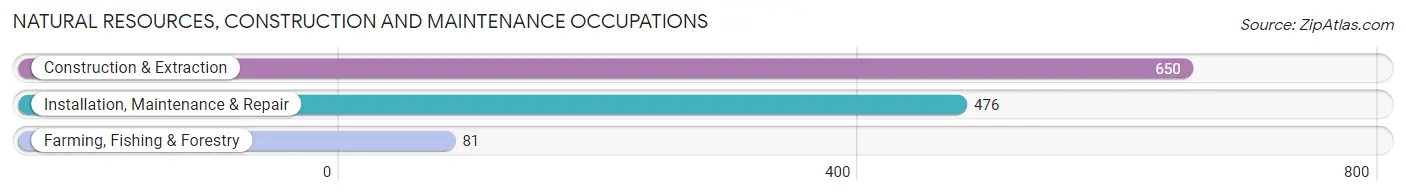
Natural Resources, Construction and Maintenance Occupations by Sex

| Occupation | Male | Female |
| Farming, Fishing & Forestry | 81 (100.0%) | 0 (0.0%) |
| Construction & Extraction | 650 (100.0%) | 0 (0.0%) |
| Installation, Maintenance & Repair | 455 (95.6%) | 21 (4.4%) |
| Total (Category) | 1,186 (98.3%) | 21 (1.7%) |
| Total (Overall) | 6,573 (52.3%) | 5,988 (47.7%) |
Production, Transportation and Moving Occupations
The most common Production, Transportation and Moving occupations in Mecklenburg County are Transportation (860 | 6.9%), Production (810 | 6.5%), and Material Moving (675 | 5.4%).
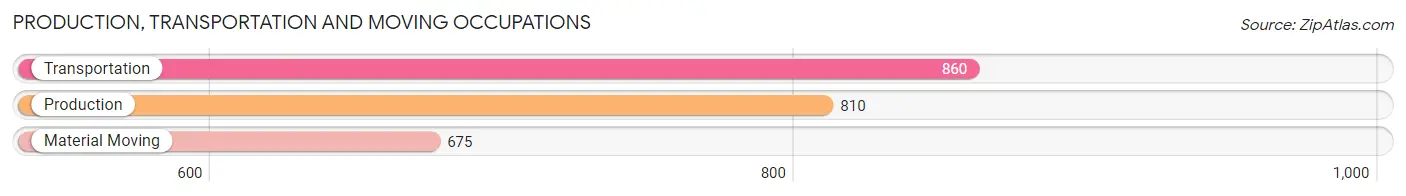
Production, Transportation and Moving Occupations by Sex
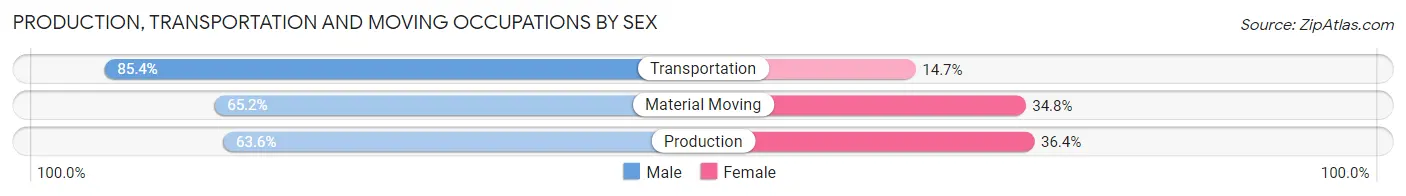
| Occupation | Male | Female |
| Production | 515 (63.6%) | 295 (36.4%) |
| Transportation | 734 (85.4%) | 126 (14.6%) |
| Material Moving | 440 (65.2%) | 235 (34.8%) |
| Total (Category) | 1,689 (72.0%) | 656 (28.0%) |
| Total (Overall) | 6,573 (52.3%) | 5,988 (47.7%) |
Employment Industries by Sex in Mecklenburg County
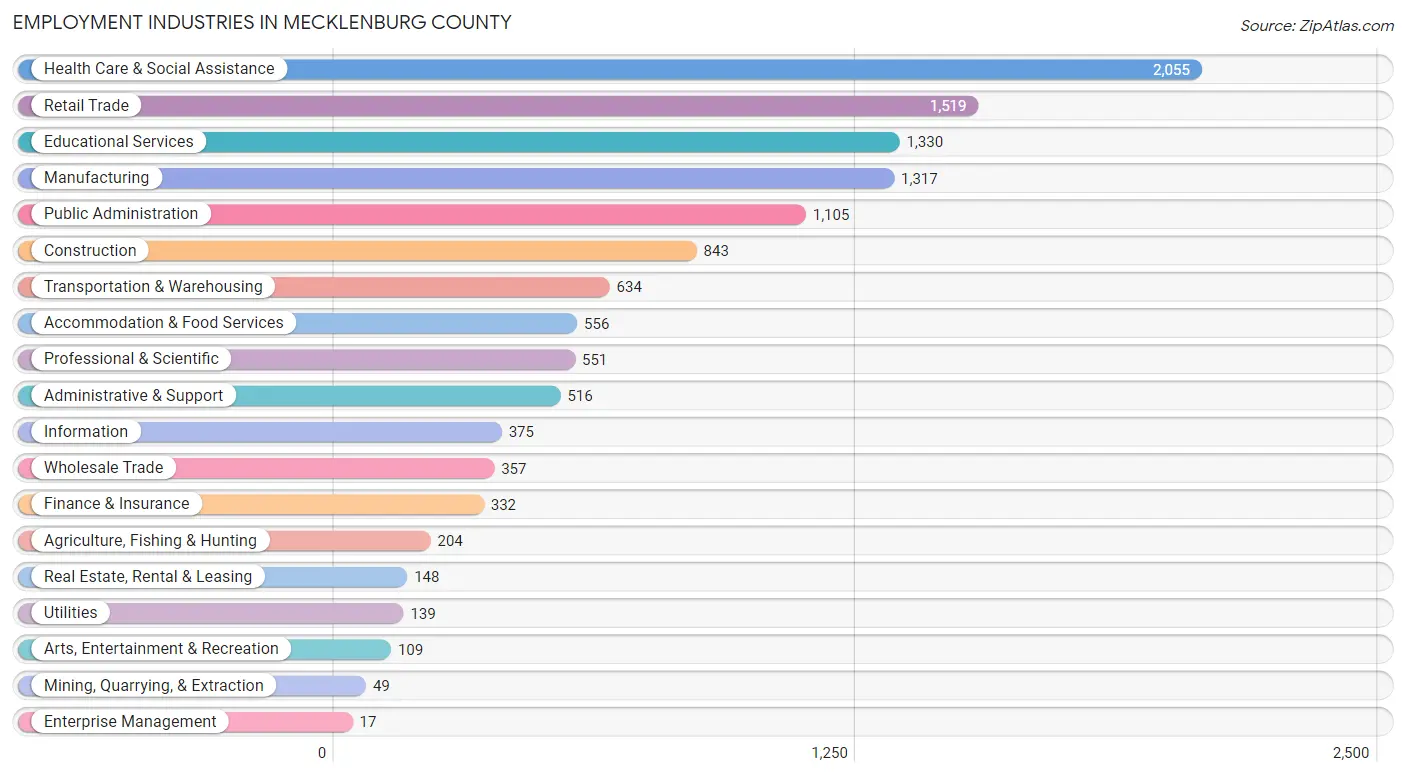
Employment Industries in Mecklenburg County
The major employment industries in Mecklenburg County include Health Care & Social Assistance (2,055 | 16.4%), Retail Trade (1,519 | 12.1%), Educational Services (1,330 | 10.6%), Manufacturing (1,317 | 10.5%), and Public Administration (1,105 | 8.8%).
Employment Industries by Sex in Mecklenburg County
The Mecklenburg County industries that see more men than women are Mining, Quarrying, & Extraction (100.0%), Agriculture, Fishing & Hunting (94.6%), and Construction (94.5%), whereas the industries that tend to have a higher number of women are Enterprise Management (100.0%), Health Care & Social Assistance (83.5%), and Educational Services (82.7%).
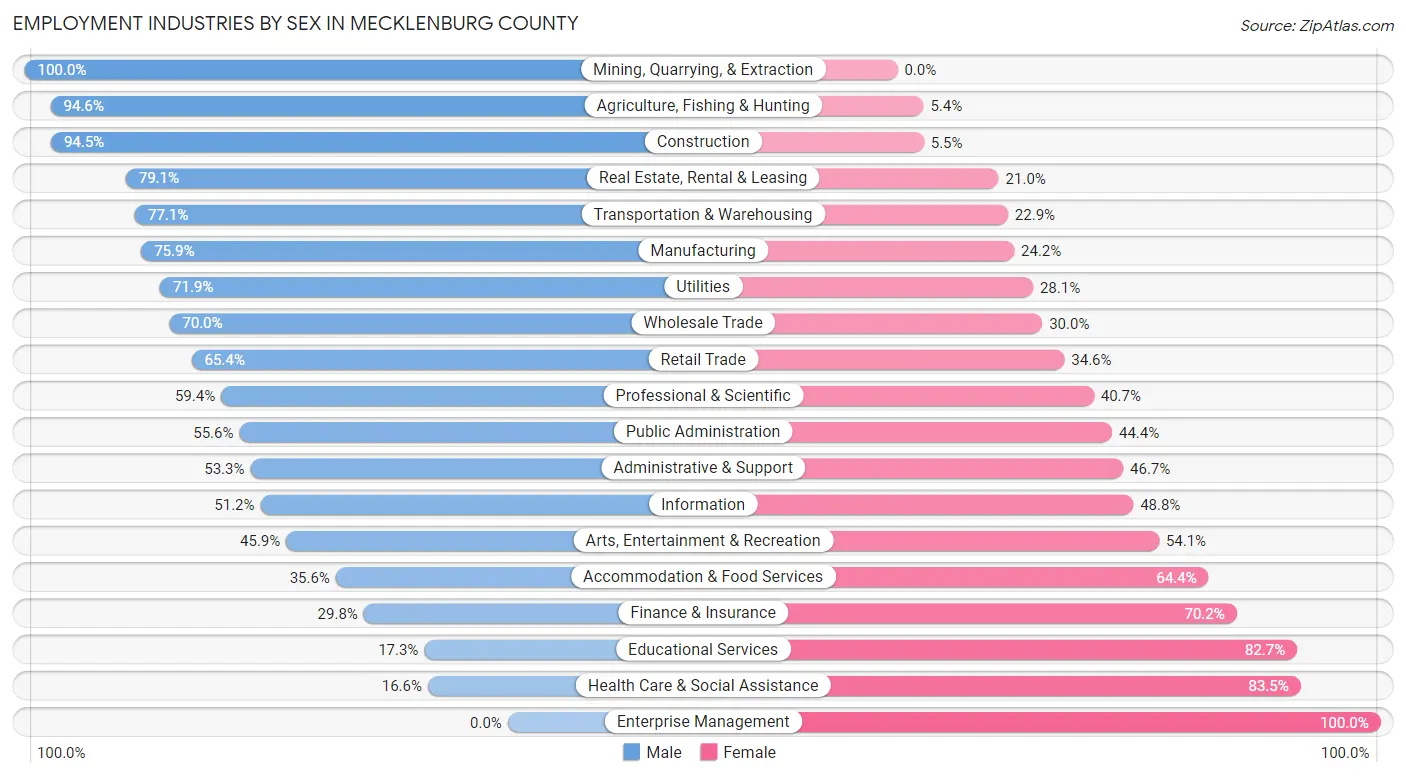
| Industry | Male | Female |
| Agriculture, Fishing & Hunting | 193 (94.6%) | 11 (5.4%) |
| Mining, Quarrying, & Extraction | 49 (100.0%) | 0 (0.0%) |
| Construction | 797 (94.5%) | 46 (5.5%) |
| Manufacturing | 999 (75.8%) | 318 (24.1%) |
| Wholesale Trade | 250 (70.0%) | 107 (30.0%) |
| Retail Trade | 994 (65.4%) | 525 (34.6%) |
| Transportation & Warehousing | 489 (77.1%) | 145 (22.9%) |
| Utilities | 100 (71.9%) | 39 (28.1%) |
| Information | 192 (51.2%) | 183 (48.8%) |
| Finance & Insurance | 99 (29.8%) | 233 (70.2%) |
| Real Estate, Rental & Leasing | 117 (79.0%) | 31 (20.9%) |
| Professional & Scientific | 327 (59.4%) | 224 (40.6%) |
| Enterprise Management | 0 (0.0%) | 17 (100.0%) |
| Administrative & Support | 275 (53.3%) | 241 (46.7%) |
| Educational Services | 230 (17.3%) | 1,100 (82.7%) |
| Health Care & Social Assistance | 340 (16.6%) | 1,715 (83.5%) |
| Arts, Entertainment & Recreation | 50 (45.9%) | 59 (54.1%) |
| Accommodation & Food Services | 198 (35.6%) | 358 (64.4%) |
| Public Administration | 614 (55.6%) | 491 (44.4%) |
| Total | 6,573 (52.3%) | 5,988 (47.7%) |
Education in Mecklenburg County
School Enrollment in Mecklenburg County
The most common levels of schooling among the 5,394 students in Mecklenburg County are middle school (1,391 | 25.8%), high school (1,381 | 25.6%), and elementary school (981 | 18.2%).
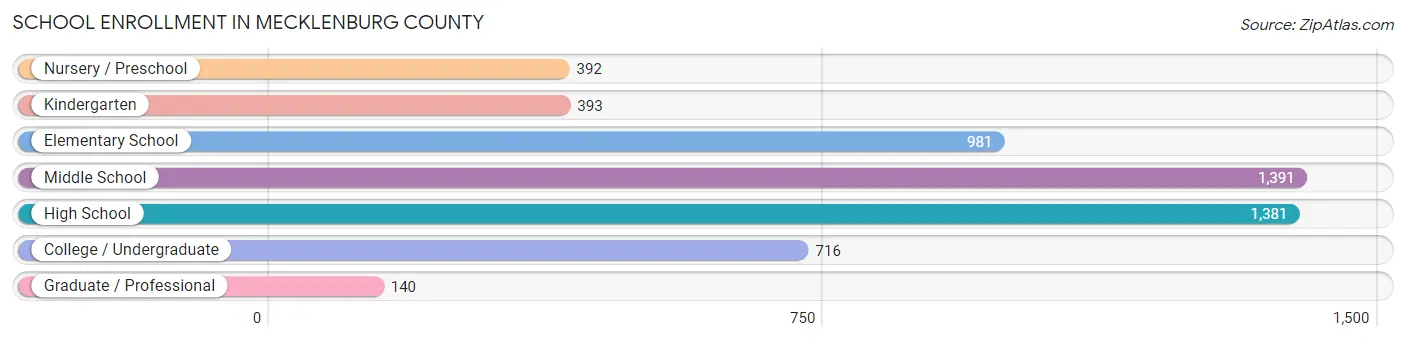
| School Level | # Students | % Students |
| Nursery / Preschool | 392 | 7.3% |
| Kindergarten | 393 | 7.3% |
| Elementary School | 981 | 18.2% |
| Middle School | 1,391 | 25.8% |
| High School | 1,381 | 25.6% |
| College / Undergraduate | 716 | 13.3% |
| Graduate / Professional | 140 | 2.6% |
| Total | 5,394 | 100.0% |
School Enrollment by Age by Funding Source in Mecklenburg County
Out of a total of 5,394 students who are enrolled in schools in Mecklenburg County, 788 (14.6%) attend a private institution, while the remaining 4,606 (85.4%) are enrolled in public schools. The age group of 3 to 4 year olds has the highest likelihood of being enrolled in private schools, with 236 (72.6% in the age bracket) enrolled. Conversely, the age group of 5 to 9 year old has the lowest likelihood of being enrolled in a private school, with 1,265 (94.8% in the age bracket) attending a public institution.
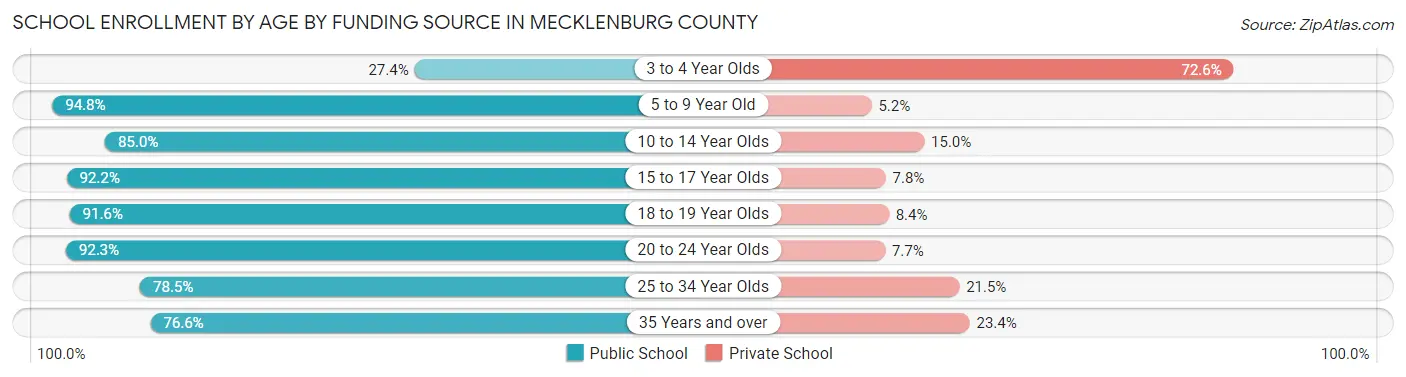
| Age Bracket | Public School | Private School |
| 3 to 4 Year Olds | 89 (27.4%) | 236 (72.6%) |
| 5 to 9 Year Old | 1,265 (94.8%) | 69 (5.2%) |
| 10 to 14 Year Olds | 1,390 (85.0%) | 245 (15.0%) |
| 15 to 17 Year Olds | 932 (92.2%) | 79 (7.8%) |
| 18 to 19 Year Olds | 284 (91.6%) | 26 (8.4%) |
| 20 to 24 Year Olds | 276 (92.3%) | 23 (7.7%) |
| 25 to 34 Year Olds | 62 (78.5%) | 17 (21.5%) |
| 35 Years and over | 307 (76.6%) | 94 (23.4%) |
| Total | 4,606 (85.4%) | 788 (14.6%) |
Educational Attainment by Field of Study in Mecklenburg County
Business (970 | 19.4%), education (870 | 17.4%), science & technology (529 | 10.6%), bio, nature & agricultural (493 | 9.9%), and engineering (478 | 9.6%) are the most common fields of study among 4,993 individuals in Mecklenburg County who have obtained a bachelor's degree or higher.
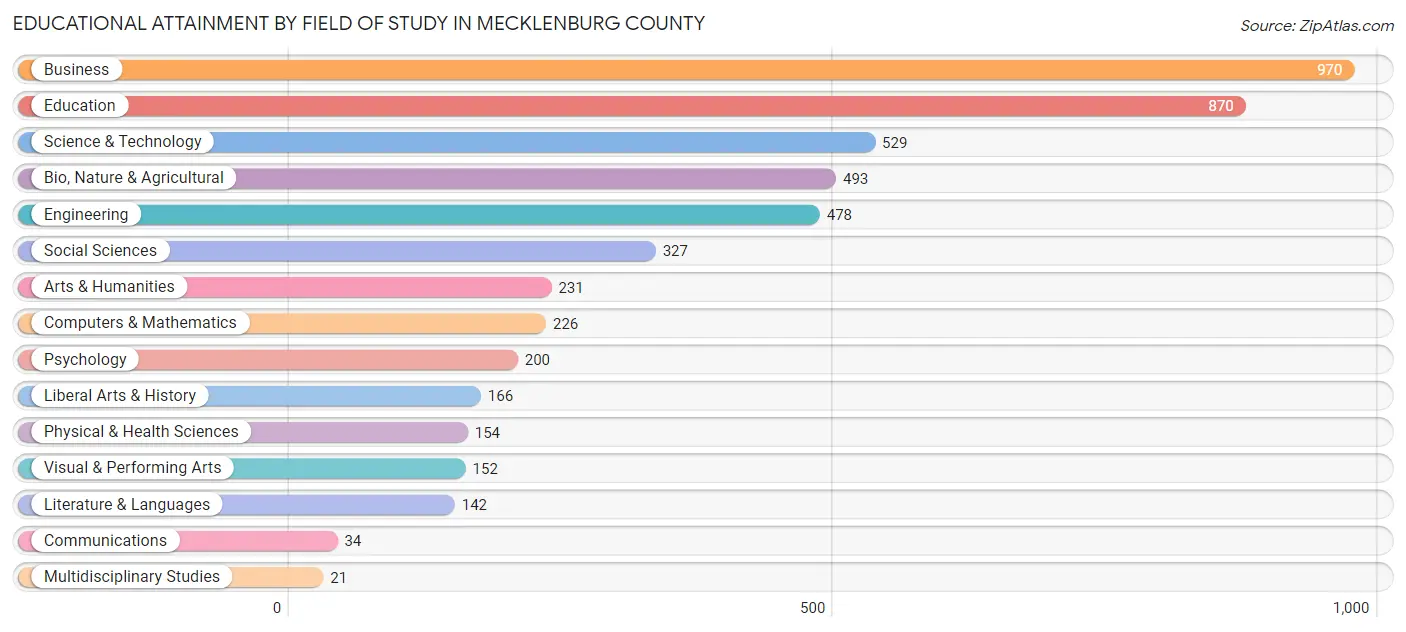
| Field of Study | # Graduates | % Graduates |
| Computers & Mathematics | 226 | 4.5% |
| Bio, Nature & Agricultural | 493 | 9.9% |
| Physical & Health Sciences | 154 | 3.1% |
| Psychology | 200 | 4.0% |
| Social Sciences | 327 | 6.6% |
| Engineering | 478 | 9.6% |
| Multidisciplinary Studies | 21 | 0.4% |
| Science & Technology | 529 | 10.6% |
| Business | 970 | 19.4% |
| Education | 870 | 17.4% |
| Literature & Languages | 142 | 2.8% |
| Liberal Arts & History | 166 | 3.3% |
| Visual & Performing Arts | 152 | 3.0% |
| Communications | 34 | 0.7% |
| Arts & Humanities | 231 | 4.6% |
| Total | 4,993 | 100.0% |
Transportation & Commute in Mecklenburg County
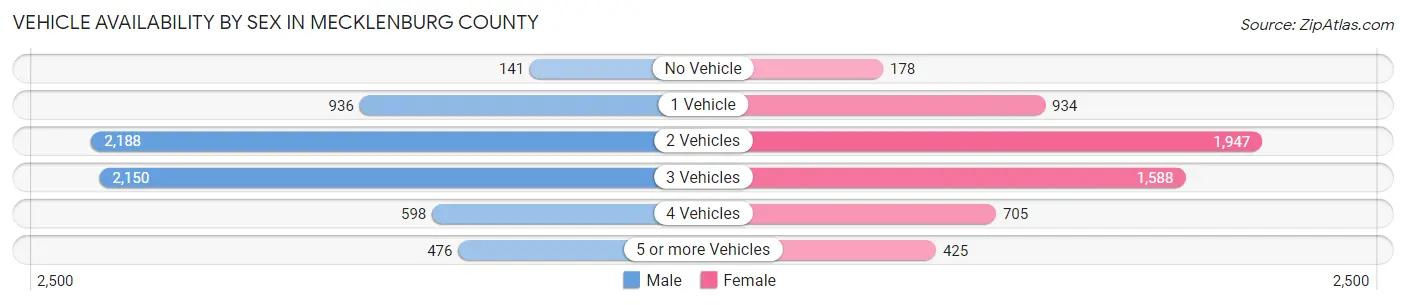
Vehicle Availability by Sex in Mecklenburg County
The most prevalent vehicle ownership categories in Mecklenburg County are males with 2 vehicles (2,188, accounting for 33.7%) and females with 2 vehicles (1,947, making up 37.9%).
| Vehicles Available | Male | Female |
| No Vehicle | 141 (2.2%) | 178 (3.1%) |
| 1 Vehicle | 936 (14.4%) | 934 (16.2%) |
| 2 Vehicles | 2,188 (33.7%) | 1,947 (33.7%) |
| 3 Vehicles | 2,150 (33.1%) | 1,588 (27.5%) |
| 4 Vehicles | 598 (9.2%) | 705 (12.2%) |
| 5 or more Vehicles | 476 (7.3%) | 425 (7.4%) |
| Total | 6,489 (100.0%) | 5,777 (100.0%) |
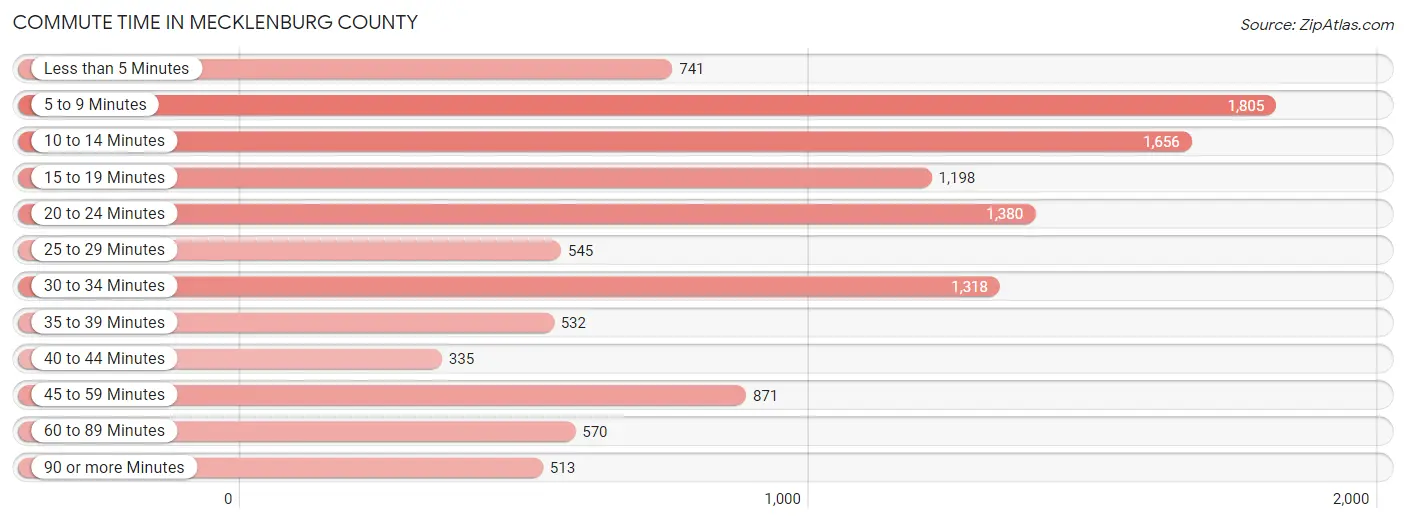
Commute Time in Mecklenburg County
The most frequently occuring commute durations in Mecklenburg County are 5 to 9 minutes (1,805 commuters, 15.7%), 10 to 14 minutes (1,656 commuters, 14.4%), and 20 to 24 minutes (1,380 commuters, 12.0%).
| Commute Time | # Commuters | % Commuters |
| Less than 5 Minutes | 741 | 6.5% |
| 5 to 9 Minutes | 1,805 | 15.7% |
| 10 to 14 Minutes | 1,656 | 14.4% |
| 15 to 19 Minutes | 1,198 | 10.4% |
| 20 to 24 Minutes | 1,380 | 12.0% |
| 25 to 29 Minutes | 545 | 4.8% |
| 30 to 34 Minutes | 1,318 | 11.5% |
| 35 to 39 Minutes | 532 | 4.6% |
| 40 to 44 Minutes | 335 | 2.9% |
| 45 to 59 Minutes | 871 | 7.6% |
| 60 to 89 Minutes | 570 | 5.0% |
| 90 or more Minutes | 513 | 4.5% |
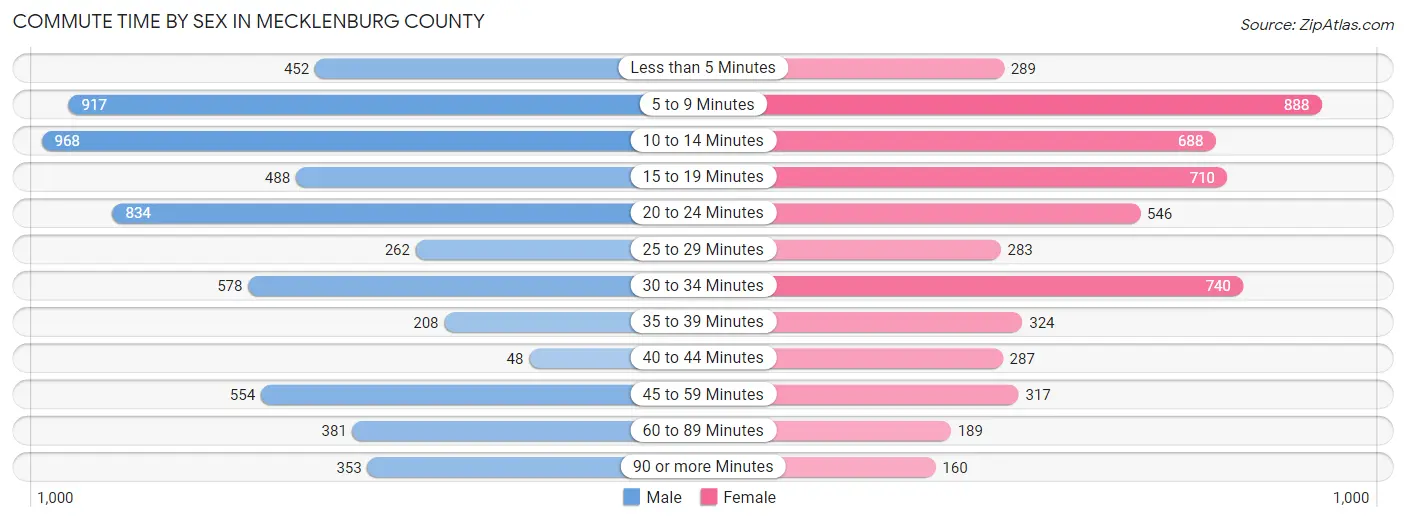
Commute Time by Sex in Mecklenburg County
The most common commute times in Mecklenburg County are 10 to 14 minutes (968 commuters, 16.0%) for males and 5 to 9 minutes (888 commuters, 16.4%) for females.
| Commute Time | Male | Female |
| Less than 5 Minutes | 452 (7.5%) | 289 (5.3%) |
| 5 to 9 Minutes | 917 (15.2%) | 888 (16.4%) |
| 10 to 14 Minutes | 968 (16.0%) | 688 (12.7%) |
| 15 to 19 Minutes | 488 (8.1%) | 710 (13.1%) |
| 20 to 24 Minutes | 834 (13.8%) | 546 (10.1%) |
| 25 to 29 Minutes | 262 (4.3%) | 283 (5.2%) |
| 30 to 34 Minutes | 578 (9.6%) | 740 (13.7%) |
| 35 to 39 Minutes | 208 (3.4%) | 324 (6.0%) |
| 40 to 44 Minutes | 48 (0.8%) | 287 (5.3%) |
| 45 to 59 Minutes | 554 (9.2%) | 317 (5.9%) |
| 60 to 89 Minutes | 381 (6.3%) | 189 (3.5%) |
| 90 or more Minutes | 353 (5.8%) | 160 (2.9%) |
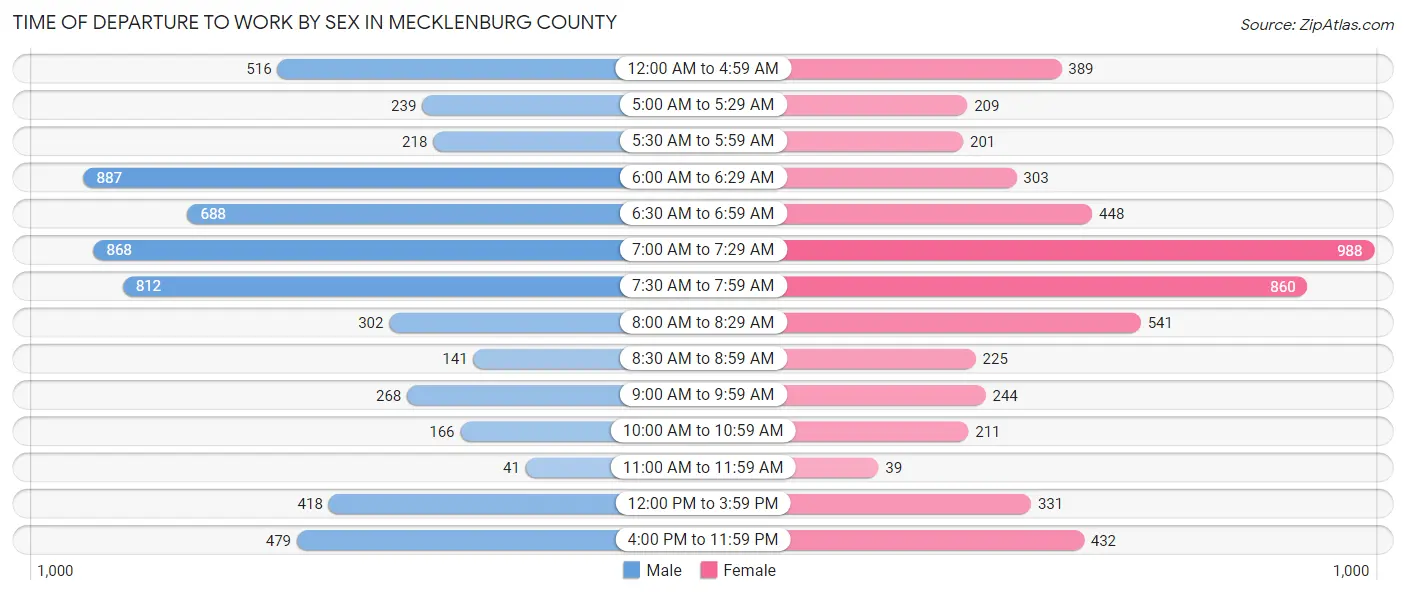
Time of Departure to Work by Sex in Mecklenburg County
The most frequent times of departure to work in Mecklenburg County are 6:00 AM to 6:29 AM (887, 14.7%) for males and 7:00 AM to 7:29 AM (988, 18.2%) for females.
| Time of Departure | Male | Female |
| 12:00 AM to 4:59 AM | 516 (8.5%) | 389 (7.2%) |
| 5:00 AM to 5:29 AM | 239 (4.0%) | 209 (3.9%) |
| 5:30 AM to 5:59 AM | 218 (3.6%) | 201 (3.7%) |
| 6:00 AM to 6:29 AM | 887 (14.7%) | 303 (5.6%) |
| 6:30 AM to 6:59 AM | 688 (11.4%) | 448 (8.3%) |
| 7:00 AM to 7:29 AM | 868 (14.4%) | 988 (18.2%) |
| 7:30 AM to 7:59 AM | 812 (13.4%) | 860 (15.9%) |
| 8:00 AM to 8:29 AM | 302 (5.0%) | 541 (10.0%) |
| 8:30 AM to 8:59 AM | 141 (2.3%) | 225 (4.2%) |
| 9:00 AM to 9:59 AM | 268 (4.4%) | 244 (4.5%) |
| 10:00 AM to 10:59 AM | 166 (2.8%) | 211 (3.9%) |
| 11:00 AM to 11:59 AM | 41 (0.7%) | 39 (0.7%) |
| 12:00 PM to 3:59 PM | 418 (6.9%) | 331 (6.1%) |
| 4:00 PM to 11:59 PM | 479 (7.9%) | 432 (8.0%) |
| Total | 6,043 (100.0%) | 5,421 (100.0%) |
Housing Occupancy in Mecklenburg County
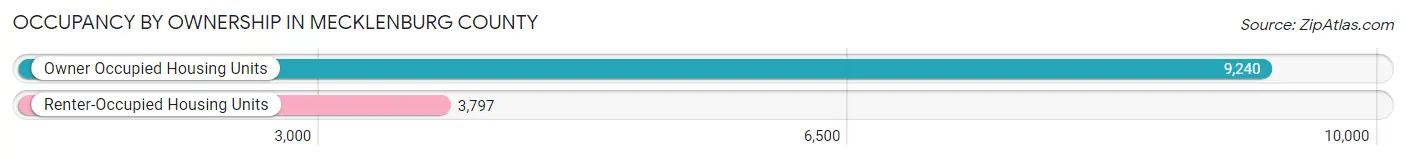
Occupancy by Ownership in Mecklenburg County
Of the total 13,037 dwellings in Mecklenburg County, owner-occupied units account for 9,240 (70.9%), while renter-occupied units make up 3,797 (29.1%).
| Occupancy | # Housing Units | % Housing Units |
| Owner Occupied Housing Units | 9,240 | 70.9% |
| Renter-Occupied Housing Units | 3,797 | 29.1% |
| Total Occupied Housing Units | 13,037 | 100.0% |
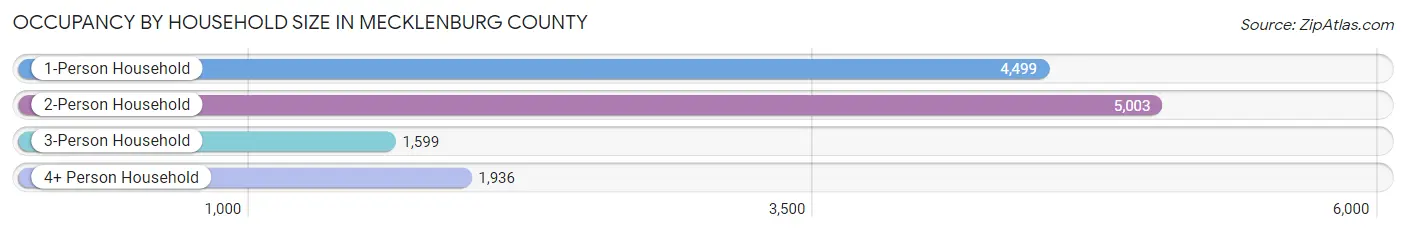
Occupancy by Household Size in Mecklenburg County
| Household Size | # Housing Units | % Housing Units |
| 1-Person Household | 4,499 | 34.5% |
| 2-Person Household | 5,003 | 38.4% |
| 3-Person Household | 1,599 | 12.3% |
| 4+ Person Household | 1,936 | 14.8% |
| Total Housing Units | 13,037 | 100.0% |
Occupancy by Ownership by Household Size in Mecklenburg County
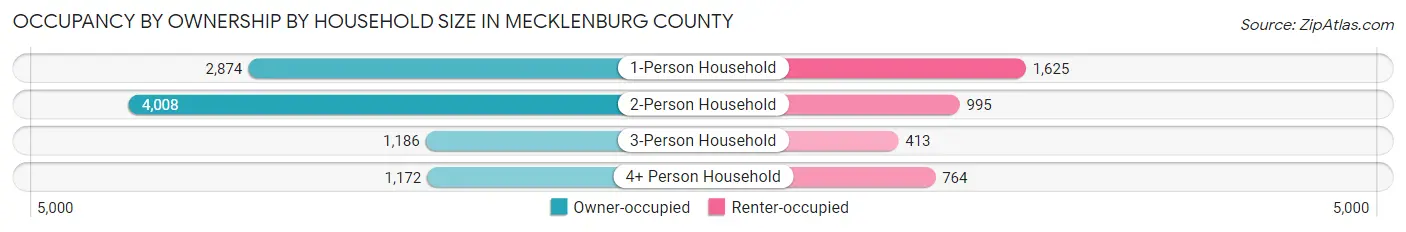
| Household Size | Owner-occupied | Renter-occupied |
| 1-Person Household | 2,874 (63.9%) | 1,625 (36.1%) |
| 2-Person Household | 4,008 (80.1%) | 995 (19.9%) |
| 3-Person Household | 1,186 (74.2%) | 413 (25.8%) |
| 4+ Person Household | 1,172 (60.5%) | 764 (39.5%) |
| Total Housing Units | 9,240 (70.9%) | 3,797 (29.1%) |
Occupancy by Educational Attainment in Mecklenburg County
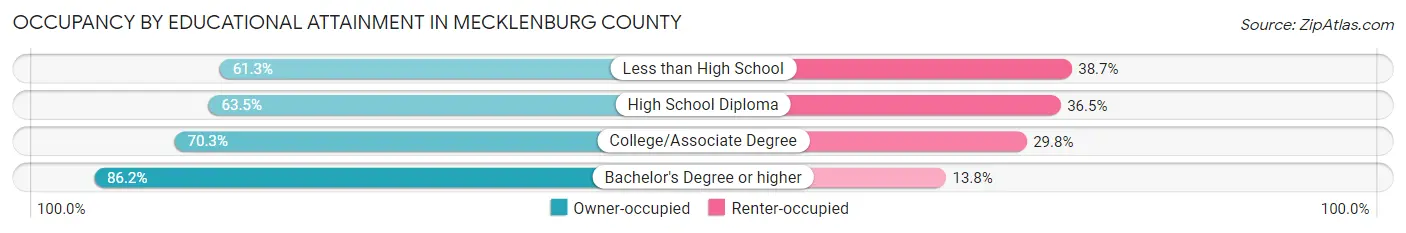
| Household Size | Owner-occupied | Renter-occupied |
| Less than High School | 995 (61.3%) | 628 (38.7%) |
| High School Diploma | 2,562 (63.5%) | 1,472 (36.5%) |
| College/Associate Degree | 2,994 (70.3%) | 1,268 (29.7%) |
| Bachelor's Degree or higher | 2,689 (86.2%) | 429 (13.8%) |
Occupancy by Age of Householder in Mecklenburg County
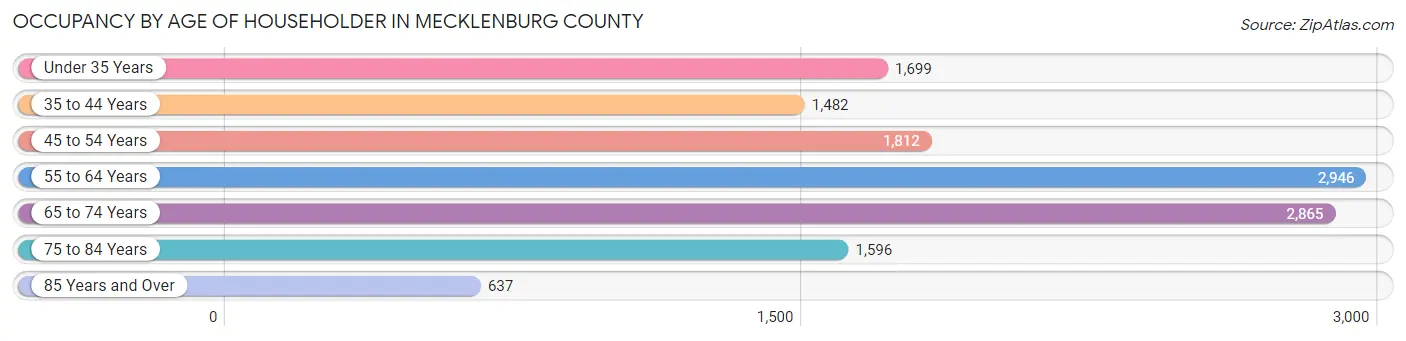
| Age Bracket | # Households | % Households |
| Under 35 Years | 1,699 | 13.0% |
| 35 to 44 Years | 1,482 | 11.4% |
| 45 to 54 Years | 1,812 | 13.9% |
| 55 to 64 Years | 2,946 | 22.6% |
| 65 to 74 Years | 2,865 | 22.0% |
| 75 to 84 Years | 1,596 | 12.2% |
| 85 Years and Over | 637 | 4.9% |
| Total | 13,037 | 100.0% |
Housing Finances in Mecklenburg County
Median Income by Occupancy in Mecklenburg County
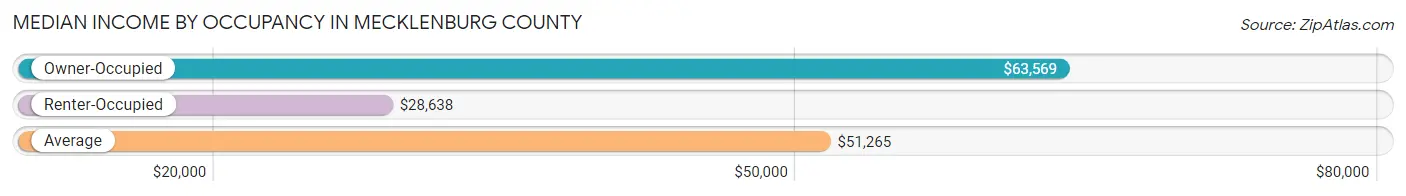
| Occupancy Type | # Households | Median Income |
| Owner-Occupied | 9,240 (70.9%) | $63,569 |
| Renter-Occupied | 3,797 (29.1%) | $28,638 |
| Average | 13,037 (100.0%) | $51,265 |
Occupancy by Householder Income Bracket in Mecklenburg County
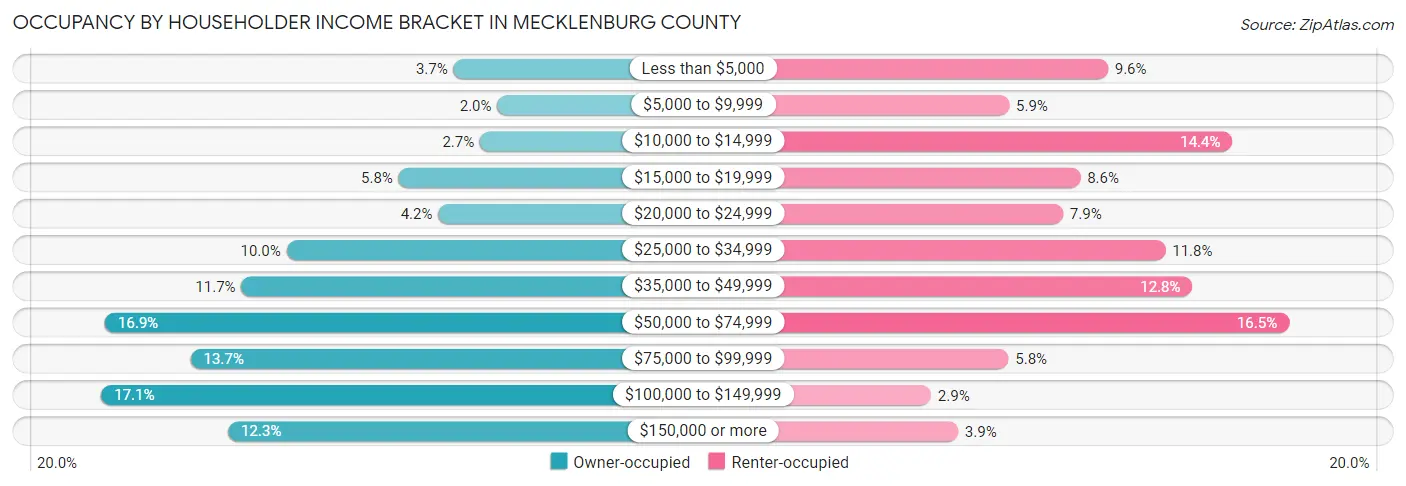
| Income Bracket | Owner-occupied | Renter-occupied |
| Less than $5,000 | 338 (3.7%) | 365 (9.6%) |
| $5,000 to $9,999 | 184 (2.0%) | 222 (5.9%) |
| $10,000 to $14,999 | 245 (2.6%) | 545 (14.3%) |
| $15,000 to $19,999 | 531 (5.8%) | 325 (8.6%) |
| $20,000 to $24,999 | 392 (4.2%) | 300 (7.9%) |
| $25,000 to $34,999 | 926 (10.0%) | 448 (11.8%) |
| $35,000 to $49,999 | 1,085 (11.7%) | 487 (12.8%) |
| $50,000 to $74,999 | 1,565 (16.9%) | 627 (16.5%) |
| $75,000 to $99,999 | 1,264 (13.7%) | 221 (5.8%) |
| $100,000 to $149,999 | 1,578 (17.1%) | 109 (2.9%) |
| $150,000 or more | 1,132 (12.2%) | 148 (3.9%) |
| Total | 9,240 (100.0%) | 3,797 (100.0%) |
Monthly Housing Cost Tiers in Mecklenburg County
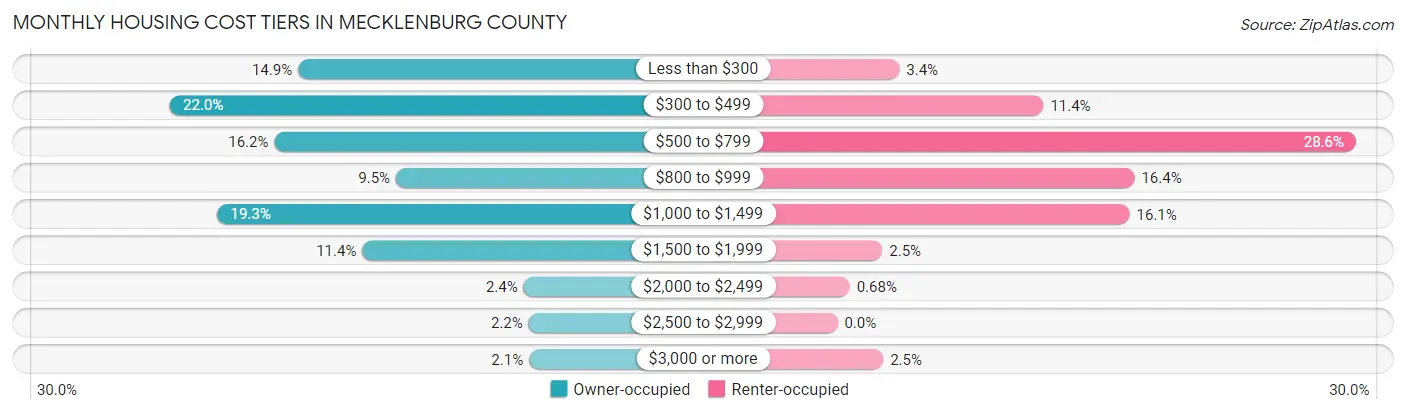
| Monthly Cost | Owner-occupied | Renter-occupied |
| Less than $300 | 1,377 (14.9%) | 130 (3.4%) |
| $300 to $499 | 2,029 (22.0%) | 432 (11.4%) |
| $500 to $799 | 1,498 (16.2%) | 1,087 (28.6%) |
| $800 to $999 | 877 (9.5%) | 623 (16.4%) |
| $1,000 to $1,499 | 1,787 (19.3%) | 613 (16.1%) |
| $1,500 to $1,999 | 1,049 (11.4%) | 94 (2.5%) |
| $2,000 to $2,499 | 225 (2.4%) | 26 (0.7%) |
| $2,500 to $2,999 | 200 (2.2%) | 0 (0.0%) |
| $3,000 or more | 198 (2.1%) | 96 (2.5%) |
| Total | 9,240 (100.0%) | 3,797 (100.0%) |
Physical Housing Characteristics in Mecklenburg County
Housing Structures in Mecklenburg County
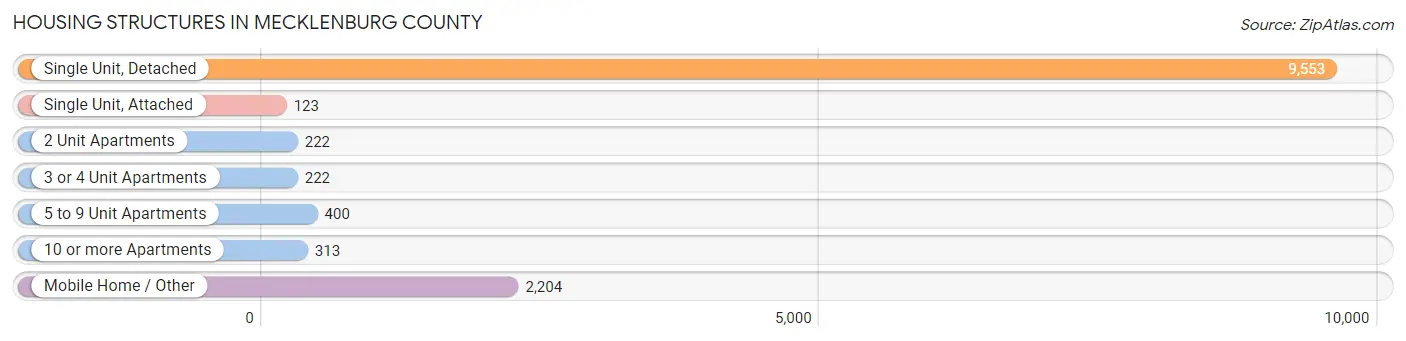
| Structure Type | # Housing Units | % Housing Units |
| Single Unit, Detached | 9,553 | 73.3% |
| Single Unit, Attached | 123 | 0.9% |
| 2 Unit Apartments | 222 | 1.7% |
| 3 or 4 Unit Apartments | 222 | 1.7% |
| 5 to 9 Unit Apartments | 400 | 3.1% |
| 10 or more Apartments | 313 | 2.4% |
| Mobile Home / Other | 2,204 | 16.9% |
| Total | 13,037 | 100.0% |
Housing Structures by Occupancy in Mecklenburg County
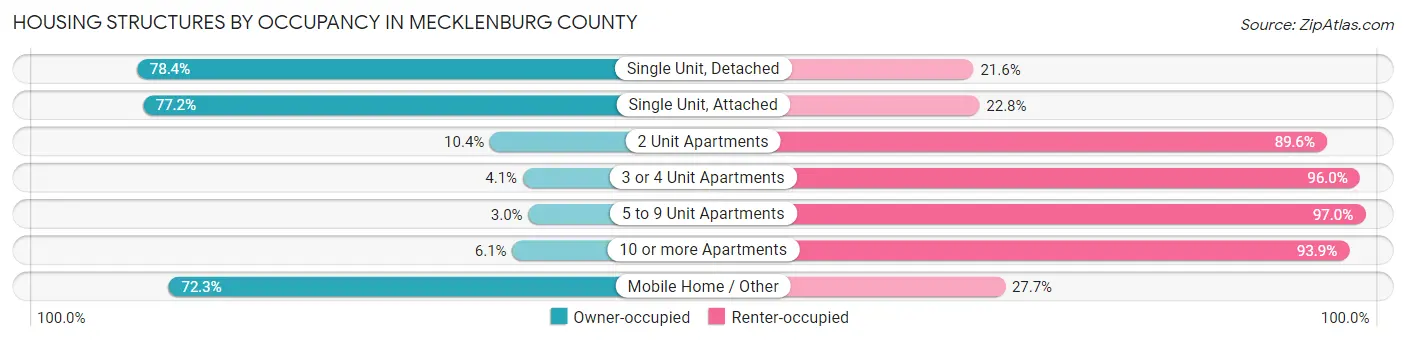
| Structure Type | Owner-occupied | Renter-occupied |
| Single Unit, Detached | 7,488 (78.4%) | 2,065 (21.6%) |
| Single Unit, Attached | 95 (77.2%) | 28 (22.8%) |
| 2 Unit Apartments | 23 (10.4%) | 199 (89.6%) |
| 3 or 4 Unit Apartments | 9 (4.1%) | 213 (96.0%) |
| 5 to 9 Unit Apartments | 12 (3.0%) | 388 (97.0%) |
| 10 or more Apartments | 19 (6.1%) | 294 (93.9%) |
| Mobile Home / Other | 1,594 (72.3%) | 610 (27.7%) |
| Total | 9,240 (70.9%) | 3,797 (29.1%) |
Housing Structures by Number of Rooms in Mecklenburg County
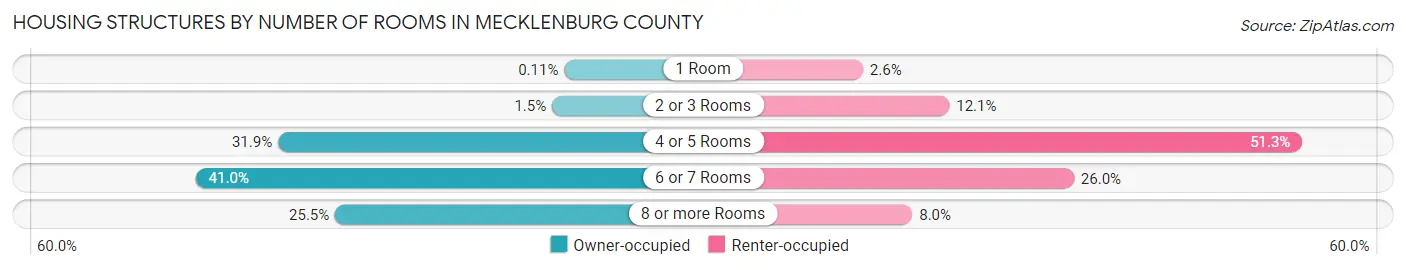
| Number of Rooms | Owner-occupied | Renter-occupied |
| 1 Room | 10 (0.1%) | 97 (2.5%) |
| 2 or 3 Rooms | 135 (1.5%) | 461 (12.1%) |
| 4 or 5 Rooms | 2,946 (31.9%) | 1,948 (51.3%) |
| 6 or 7 Rooms | 3,789 (41.0%) | 986 (26.0%) |
| 8 or more Rooms | 2,360 (25.5%) | 305 (8.0%) |
| Total | 9,240 (100.0%) | 3,797 (100.0%) |
Housing Structure by Heating Type in Mecklenburg County
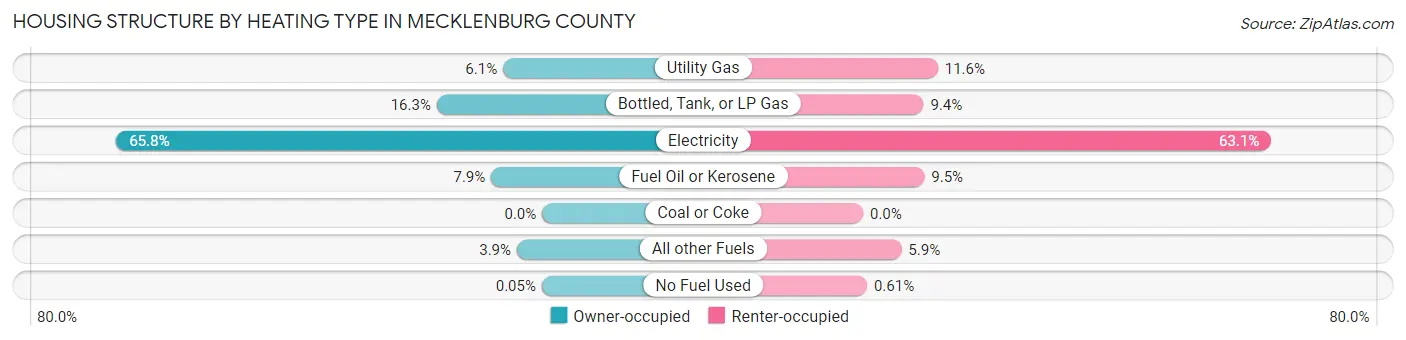
| Heating Type | Owner-occupied | Renter-occupied |
| Utility Gas | 559 (6.0%) | 439 (11.6%) |
| Bottled, Tank, or LP Gas | 1,505 (16.3%) | 355 (9.3%) |
| Electricity | 6,083 (65.8%) | 2,395 (63.1%) |
| Fuel Oil or Kerosene | 728 (7.9%) | 360 (9.5%) |
| Coal or Coke | 0 (0.0%) | 0 (0.0%) |
| All other Fuels | 360 (3.9%) | 225 (5.9%) |
| No Fuel Used | 5 (0.1%) | 23 (0.6%) |
| Total | 9,240 (100.0%) | 3,797 (100.0%) |
Household Vehicle Usage in Mecklenburg County
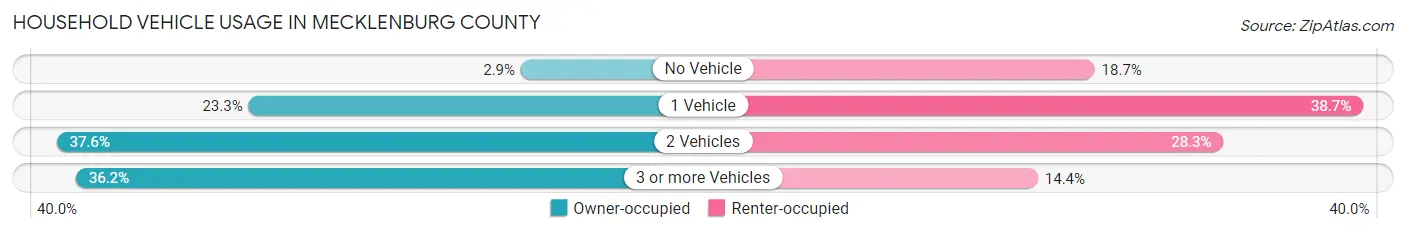
| Vehicles per Household | Owner-occupied | Renter-occupied |
| No Vehicle | 272 (2.9%) | 708 (18.6%) |
| 1 Vehicle | 2,151 (23.3%) | 1,469 (38.7%) |
| 2 Vehicles | 3,475 (37.6%) | 1,073 (28.3%) |
| 3 or more Vehicles | 3,342 (36.2%) | 547 (14.4%) |
| Total | 9,240 (100.0%) | 3,797 (100.0%) |
Real Estate & Mortgages in Mecklenburg County
Real Estate and Mortgage Overview in Mecklenburg County
| Characteristic | Without Mortgage | With Mortgage |
| Housing Units | 4,712 | 4,528 |
| Median Property Value | $119,900 | $191,300 |
| Median Household Income | $45,091 | $753 |
| Monthly Housing Costs | $405 | $173 |
| Real Estate Taxes | $718 | $97 |
Property Value by Mortgage Status in Mecklenburg County
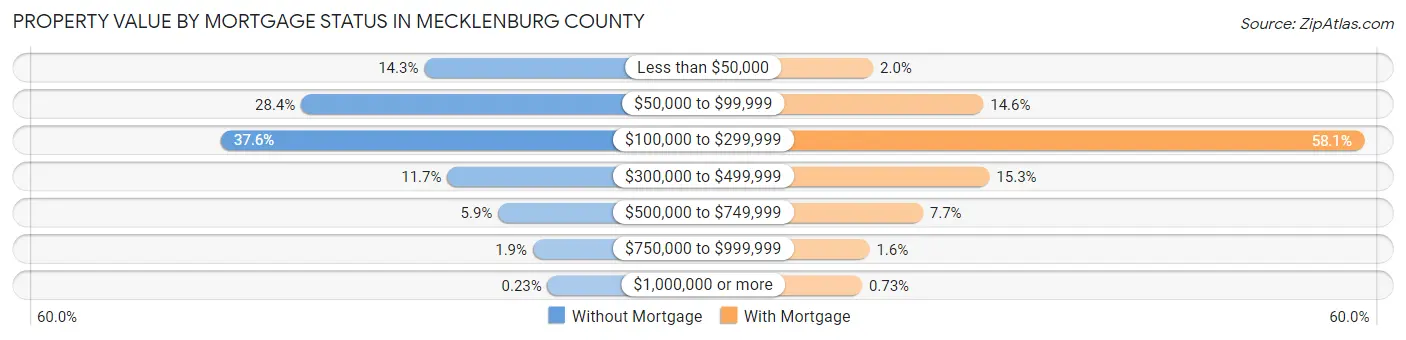
| Property Value | Without Mortgage | With Mortgage |
| Less than $50,000 | 675 (14.3%) | 91 (2.0%) |
| $50,000 to $99,999 | 1,338 (28.4%) | 661 (14.6%) |
| $100,000 to $299,999 | 1,770 (37.6%) | 2,630 (58.1%) |
| $300,000 to $499,999 | 551 (11.7%) | 693 (15.3%) |
| $500,000 to $749,999 | 277 (5.9%) | 348 (7.7%) |
| $750,000 to $999,999 | 90 (1.9%) | 72 (1.6%) |
| $1,000,000 or more | 11 (0.2%) | 33 (0.7%) |
| Total | 4,712 (100.0%) | 4,528 (100.0%) |
Household Income by Mortgage Status in Mecklenburg County
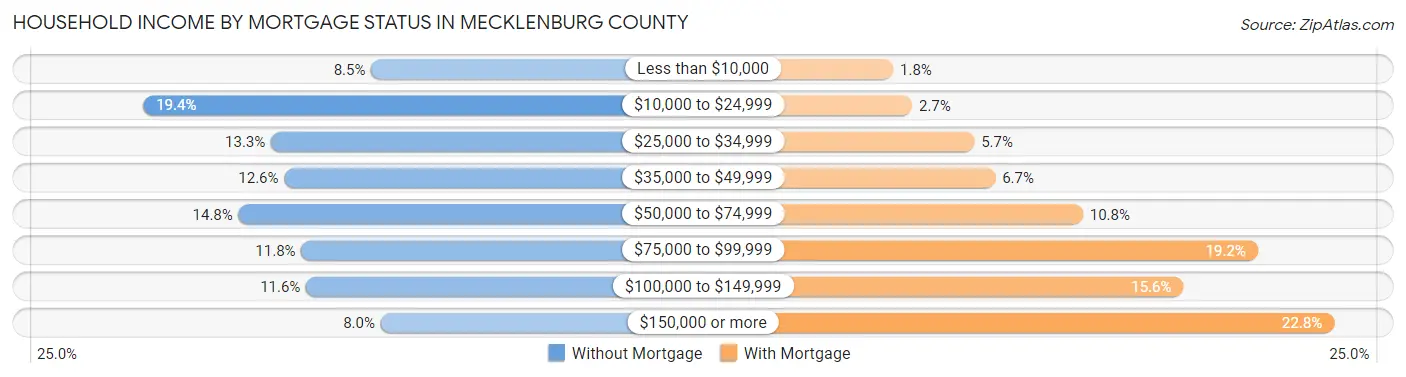
| Household Income | Without Mortgage | With Mortgage |
| Less than $10,000 | 400 (8.5%) | 81 (1.8%) |
| $10,000 to $24,999 | 912 (19.4%) | 122 (2.7%) |
| $25,000 to $34,999 | 625 (13.3%) | 256 (5.7%) |
| $35,000 to $49,999 | 595 (12.6%) | 301 (6.7%) |
| $50,000 to $74,999 | 698 (14.8%) | 490 (10.8%) |
| $75,000 to $99,999 | 557 (11.8%) | 867 (19.2%) |
| $100,000 to $149,999 | 546 (11.6%) | 707 (15.6%) |
| $150,000 or more | 379 (8.0%) | 1,032 (22.8%) |
| Total | 4,712 (100.0%) | 4,528 (100.0%) |
Property Value to Household Income Ratio in Mecklenburg County
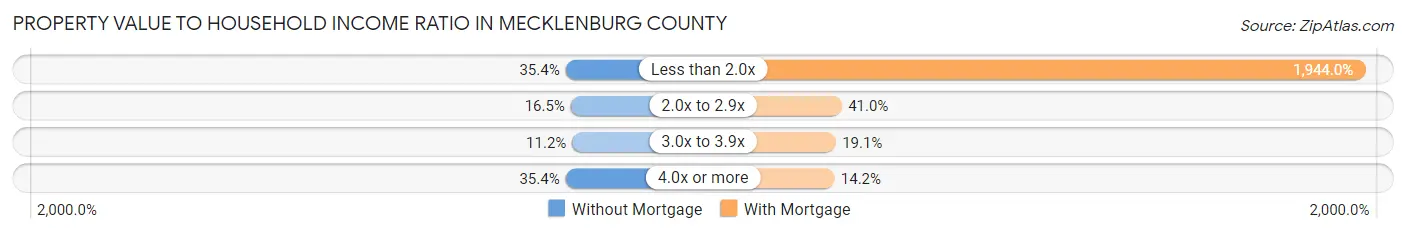
| Value-to-Income Ratio | Without Mortgage | With Mortgage |
| Less than 2.0x | 1,667 (35.4%) | 88,026 (1,944.0%) |
| 2.0x to 2.9x | 778 (16.5%) | 1,855 (41.0%) |
| 3.0x to 3.9x | 527 (11.2%) | 865 (19.1%) |
| 4.0x or more | 1,669 (35.4%) | 645 (14.2%) |
| Total | 4,712 (100.0%) | 4,528 (100.0%) |
Real Estate Taxes by Mortgage Status in Mecklenburg County
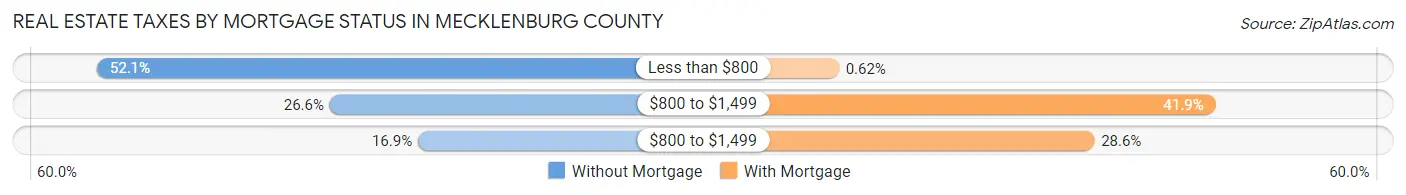
| Property Taxes | Without Mortgage | With Mortgage |
| Less than $800 | 2,454 (52.1%) | 28 (0.6%) |
| $800 to $1,499 | 1,251 (26.6%) | 1,898 (41.9%) |
| $800 to $1,499 | 796 (16.9%) | 1,296 (28.6%) |
| Total | 4,712 (100.0%) | 4,528 (100.0%) |
Health & Disability in Mecklenburg County
Health Insurance Coverage by Age in Mecklenburg County
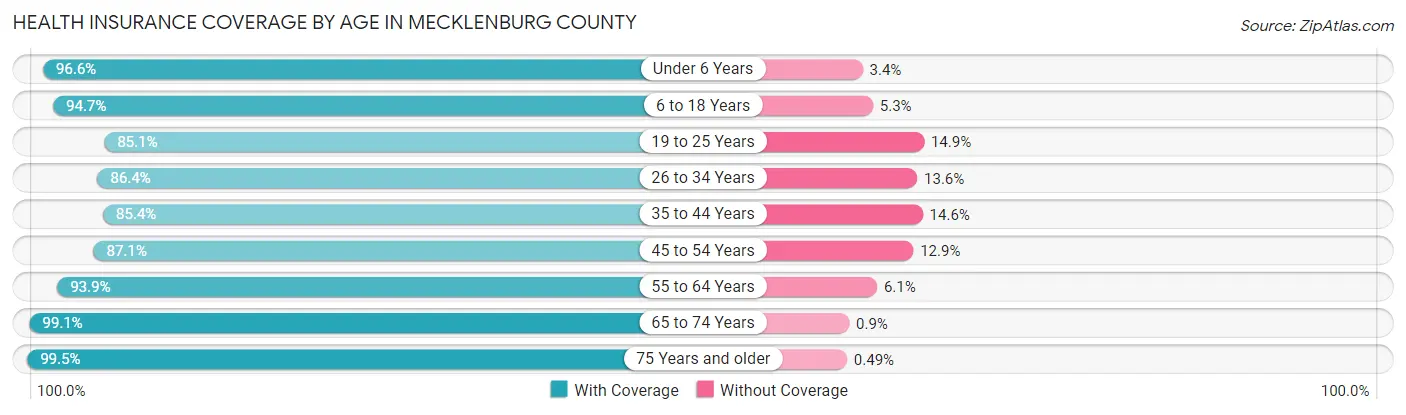
| Age Bracket | With Coverage | Without Coverage |
| Under 6 Years | 1,695 (96.6%) | 60 (3.4%) |
| 6 to 18 Years | 3,913 (94.7%) | 220 (5.3%) |
| 19 to 25 Years | 1,770 (85.1%) | 309 (14.9%) |
| 26 to 34 Years | 2,502 (86.4%) | 393 (13.6%) |
| 35 to 44 Years | 2,385 (85.4%) | 408 (14.6%) |
| 45 to 54 Years | 2,967 (87.1%) | 438 (12.9%) |
| 55 to 64 Years | 4,534 (93.9%) | 294 (6.1%) |
| 65 to 74 Years | 4,407 (99.1%) | 40 (0.9%) |
| 75 Years and older | 3,073 (99.5%) | 15 (0.5%) |
| Total | 27,246 (92.6%) | 2,177 (7.4%) |
Health Insurance Coverage by Citizenship Status in Mecklenburg County
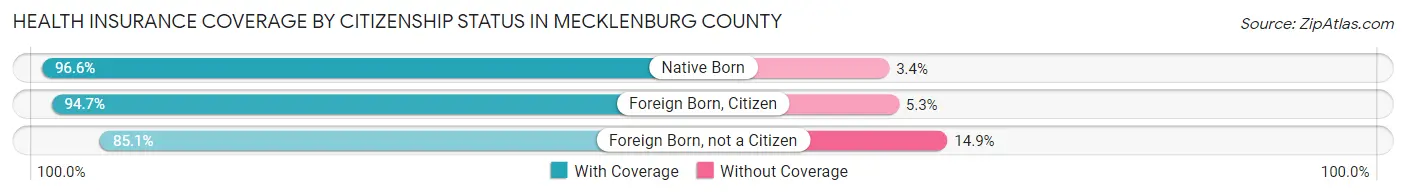
| Citizenship Status | With Coverage | Without Coverage |
| Native Born | 1,695 (96.6%) | 60 (3.4%) |
| Foreign Born, Citizen | 3,913 (94.7%) | 220 (5.3%) |
| Foreign Born, not a Citizen | 1,770 (85.1%) | 309 (14.9%) |
Health Insurance Coverage by Household Income in Mecklenburg County
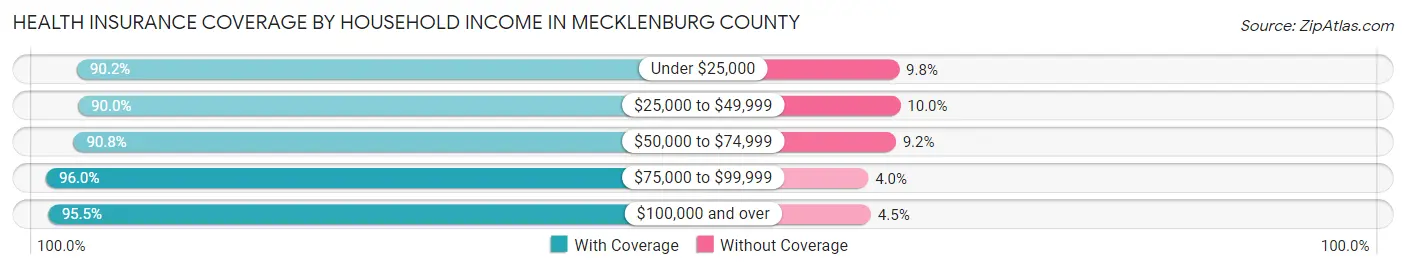
| Household Income | With Coverage | Without Coverage |
| Under $25,000 | 5,206 (90.2%) | 566 (9.8%) |
| $25,000 to $49,999 | 5,109 (90.0%) | 570 (10.0%) |
| $50,000 to $74,999 | 4,897 (90.8%) | 494 (9.2%) |
| $75,000 to $99,999 | 3,786 (96.0%) | 159 (4.0%) |
| $100,000 and over | 8,163 (95.5%) | 386 (4.5%) |
Public vs Private Health Insurance Coverage by Age in Mecklenburg County
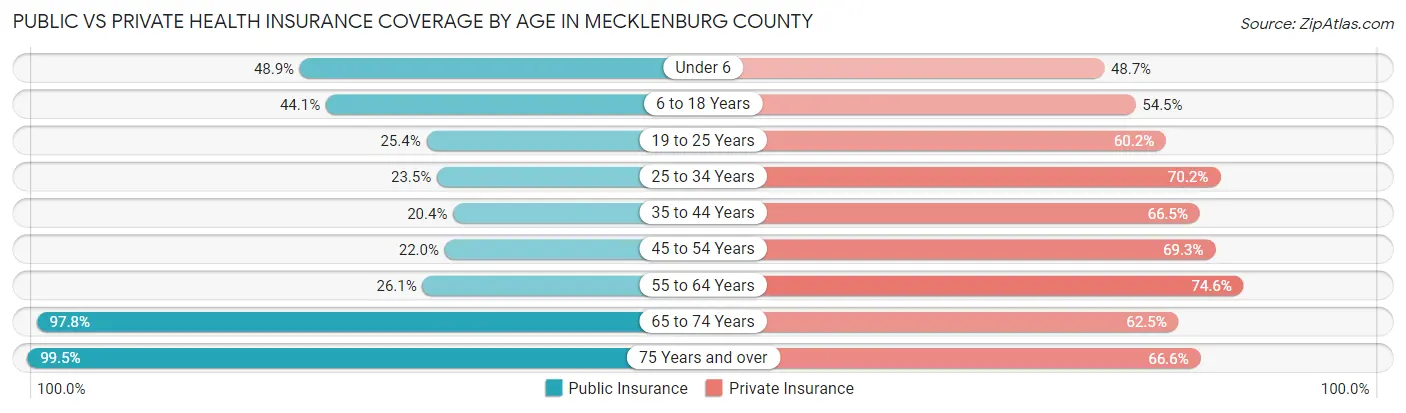
| Age Bracket | Public Insurance | Private Insurance |
| Under 6 | 858 (48.9%) | 854 (48.7%) |
| 6 to 18 Years | 1,821 (44.1%) | 2,252 (54.5%) |
| 19 to 25 Years | 528 (25.4%) | 1,251 (60.2%) |
| 25 to 34 Years | 679 (23.4%) | 2,033 (70.2%) |
| 35 to 44 Years | 571 (20.4%) | 1,856 (66.4%) |
| 45 to 54 Years | 749 (22.0%) | 2,360 (69.3%) |
| 55 to 64 Years | 1,262 (26.1%) | 3,601 (74.6%) |
| 65 to 74 Years | 4,348 (97.8%) | 2,780 (62.5%) |
| 75 Years and over | 3,073 (99.5%) | 2,056 (66.6%) |
| Total | 13,889 (47.2%) | 19,043 (64.7%) |
Disability Status by Sex by Age in Mecklenburg County
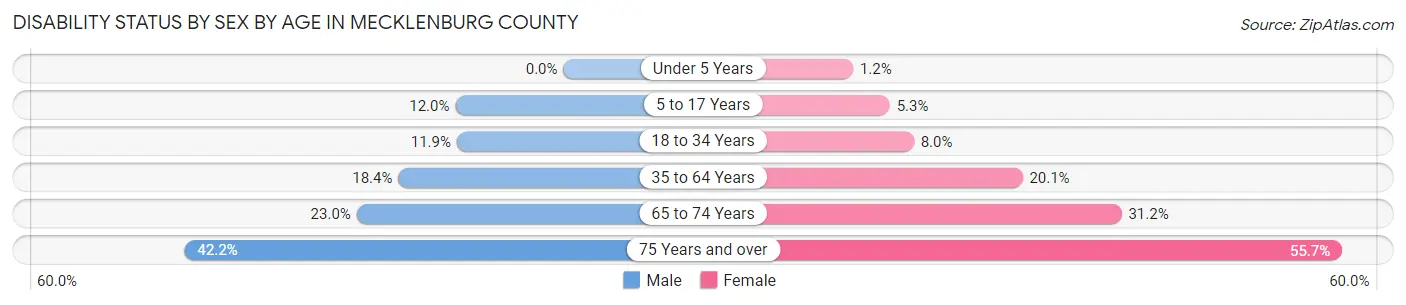
| Age Bracket | Male | Female |
| Under 5 Years | 0 (0.0%) | 9 (1.2%) |
| 5 to 17 Years | 265 (12.0%) | 101 (5.3%) |
| 18 to 34 Years | 326 (11.9%) | 202 (8.0%) |
| 35 to 64 Years | 964 (18.4%) | 1,163 (20.1%) |
| 65 to 74 Years | 490 (23.0%) | 722 (31.1%) |
| 75 Years and over | 560 (42.2%) | 981 (55.7%) |
Disability Class by Sex by Age in Mecklenburg County
Disability Class: Hearing Difficulty
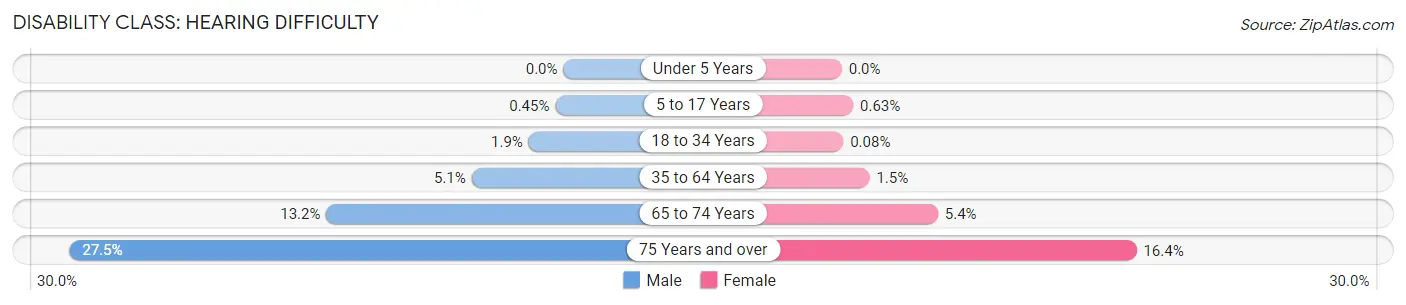
| Age Bracket | Male | Female |
| Under 5 Years | 0 (0.0%) | 0 (0.0%) |
| 5 to 17 Years | 10 (0.4%) | 12 (0.6%) |
| 18 to 34 Years | 53 (1.9%) | 2 (0.1%) |
| 35 to 64 Years | 268 (5.1%) | 89 (1.5%) |
| 65 to 74 Years | 281 (13.2%) | 124 (5.3%) |
| 75 Years and over | 365 (27.5%) | 289 (16.4%) |
Disability Class: Vision Difficulty
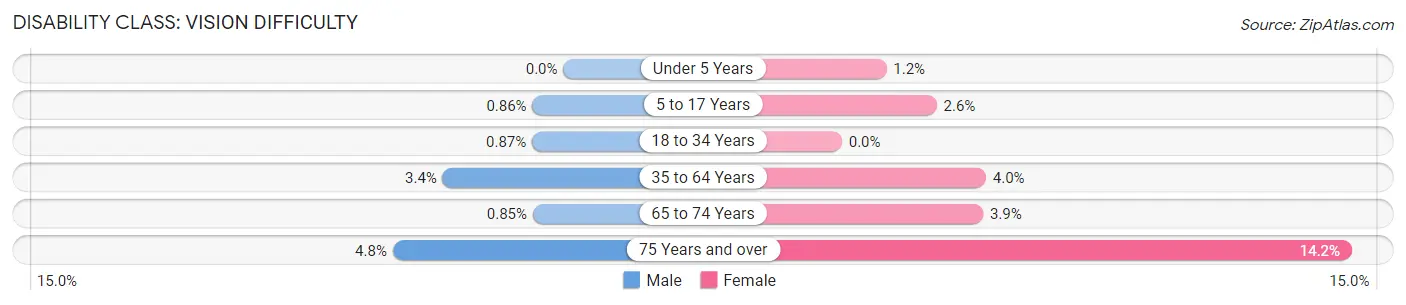
| Age Bracket | Male | Female |
| Under 5 Years | 0 (0.0%) | 9 (1.2%) |
| 5 to 17 Years | 19 (0.9%) | 50 (2.6%) |
| 18 to 34 Years | 24 (0.9%) | 0 (0.0%) |
| 35 to 64 Years | 176 (3.4%) | 232 (4.0%) |
| 65 to 74 Years | 18 (0.9%) | 91 (3.9%) |
| 75 Years and over | 63 (4.8%) | 250 (14.2%) |
Disability Class: Cognitive Difficulty
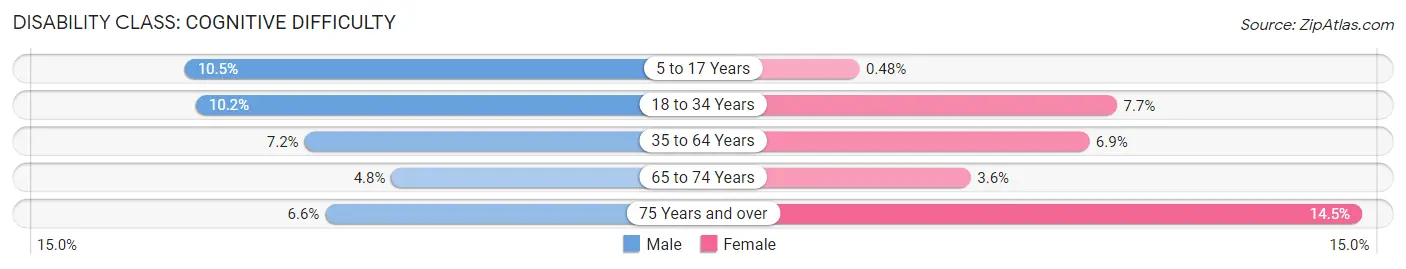
| Age Bracket | Male | Female |
| 5 to 17 Years | 232 (10.5%) | 9 (0.5%) |
| 18 to 34 Years | 281 (10.2%) | 193 (7.6%) |
| 35 to 64 Years | 378 (7.2%) | 398 (6.9%) |
| 65 to 74 Years | 102 (4.8%) | 83 (3.6%) |
| 75 Years and over | 88 (6.6%) | 255 (14.5%) |
Disability Class: Ambulatory Difficulty
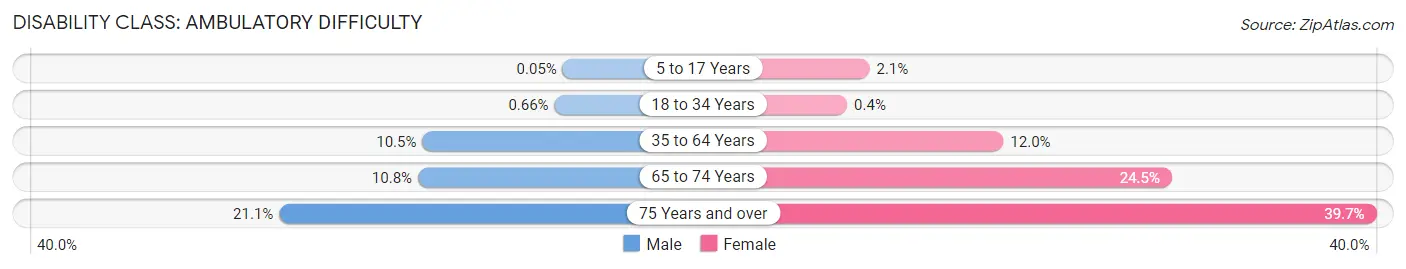
| Age Bracket | Male | Female |
| 5 to 17 Years | 1 (0.1%) | 39 (2.1%) |
| 18 to 34 Years | 18 (0.7%) | 10 (0.4%) |
| 35 to 64 Years | 549 (10.5%) | 694 (12.0%) |
| 65 to 74 Years | 230 (10.8%) | 568 (24.5%) |
| 75 Years and over | 280 (21.1%) | 699 (39.7%) |
Disability Class: Self-Care Difficulty
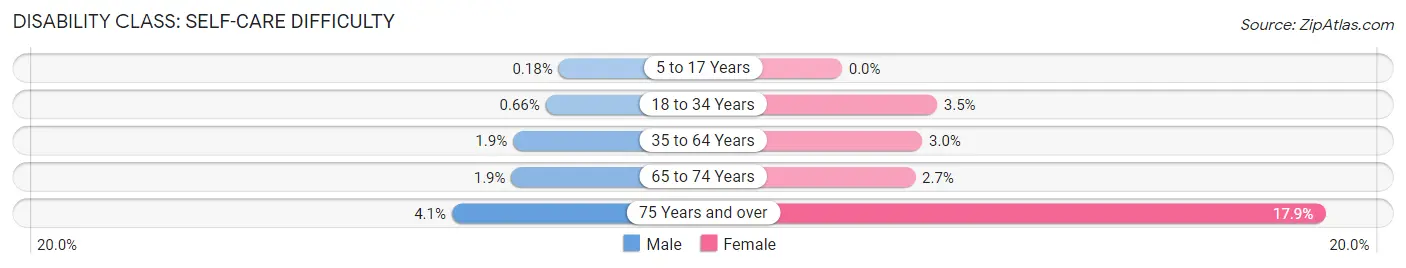
| Age Bracket | Male | Female |
| 5 to 17 Years | 4 (0.2%) | 0 (0.0%) |
| 18 to 34 Years | 18 (0.7%) | 89 (3.5%) |
| 35 to 64 Years | 98 (1.9%) | 172 (3.0%) |
| 65 to 74 Years | 41 (1.9%) | 63 (2.7%) |
| 75 Years and over | 55 (4.1%) | 316 (17.9%) |
Technology Access in Mecklenburg County
Computing Device Access in Mecklenburg County
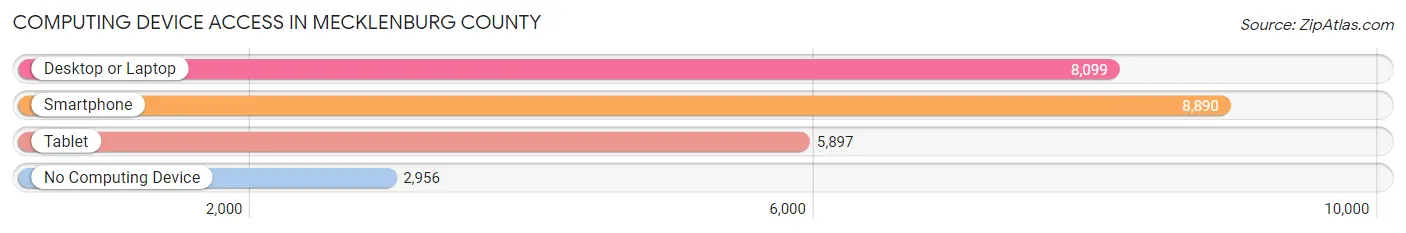
| Device Type | # Households | % Households |
| Desktop or Laptop | 8,099 | 62.1% |
| Smartphone | 8,890 | 68.2% |
| Tablet | 5,897 | 45.2% |
| No Computing Device | 2,956 | 22.7% |
| Total | 13,037 | 100.0% |
Internet Access in Mecklenburg County
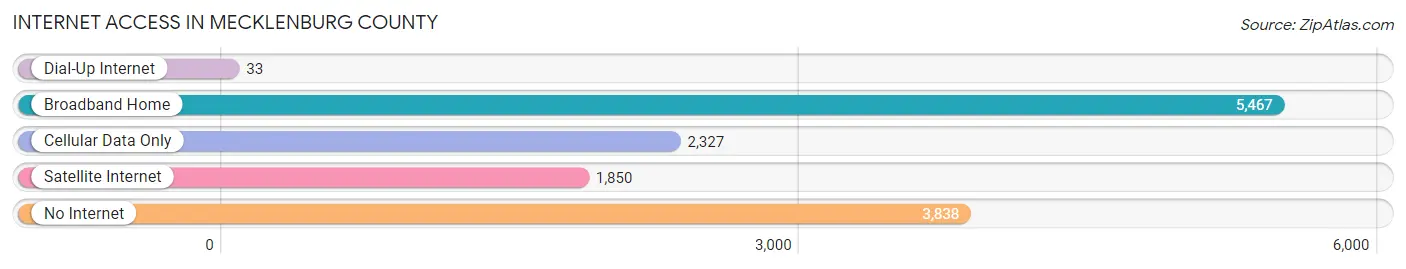
| Internet Type | # Households | % Households |
| Dial-Up Internet | 33 | 0.3% |
| Broadband Home | 5,467 | 41.9% |
| Cellular Data Only | 2,327 | 17.8% |
| Satellite Internet | 1,850 | 14.2% |
| No Internet | 3,838 | 29.4% |
| Total | 13,037 | 100.0% |
Mecklenburg County Summary
Mecklenburg County, Virginia is located in the south-central part of the state, and is bordered by the counties of Brunswick, Lunenburg, Charlotte, and Halifax. It is part of the Southside region of Virginia, and is home to a population of approximately 32,000 people. The county seat is Boydton, and the county is named after the German city of Mecklenburg-Vorpommern.
History
Mecklenburg County was formed in 1765 from Lunenburg County. It was named after the German city of Mecklenburg-Vorpommern, which was the birthplace of the county’s first settler, John Mecklenburg. The county was originally part of the Virginia Colony, and was one of the first counties to be established in the state.
During the American Revolution, Mecklenburg County was the site of several battles, including the Battle of Mecklenburg, which was fought in 1781. The county was also the site of the Battle of Boydton Plank Road, which was fought in 1864 during the Civil War.
Geography
Mecklenburg County is located in the south-central part of Virginia, and is bordered by the counties of Brunswick, Lunenburg, Charlotte, and Halifax. It is part of the Southside region of Virginia, and is home to a population of approximately 32,000 people. The county seat is Boydton, and the county is named after the German city of Mecklenburg-Vorpommern.
The county is mostly rural, with a few small towns and villages scattered throughout. The terrain is mostly flat, with some rolling hills in the northern part of the county. The county is home to several lakes, including Lake Gaston, Lake Mecklenburg, and Lake Smith Mountain.
Economy
Mecklenburg County’s economy is largely based on agriculture, with tobacco, corn, soybeans, and cotton being the main crops. The county is also home to several manufacturing companies, including a furniture factory, a paper mill, and a textile mill.
The county is also home to several tourist attractions, including the Mecklenburg County Historical Museum, the Mecklenburg County Courthouse, and the Mecklenburg County Fairgrounds.
Demographics
As of the 2010 census, Mecklenburg County had a population of 32,039 people. The racial makeup of the county was 79.3% White, 17.7% African American, 0.3% Native American, 0.3% Asian, 0.1% Pacific Islander, 1.2% from other races, and 1.4% from two or more races. Hispanic or Latino of any race were 2.7% of the population.
The median income for a household in the county was $37,845, and the median income for a family was $45,813. The per capita income for the county was $19,845. About 16.2% of families and 19.7% of the population were below the poverty line, including 28.2% of those under age 18 and 11.2% of those age 65 or over.
Common Questions
What is Per Capita Income in Mecklenburg County?
Per Capita income in Mecklenburg County is $31,010.
What is the Median Family Income in Mecklenburg County?
Median Family Income in Mecklenburg County is $69,671.
What is the Median Household income in Mecklenburg County?
Median Household Income in Mecklenburg County is $51,265.
What is Income or Wage Gap in Mecklenburg County?
Income or Wage Gap in Mecklenburg County is 28.4%.
Women in Mecklenburg County earn 71.6 cents for every dollar earned by a man.
What is Family Income Deficit in Mecklenburg County?
Family Income Deficit in Mecklenburg County is $10,492.
Families that are below poverty line in Mecklenburg County earn $10,492 less on average than the poverty threshold level.
What is Inequality or Gini Index in Mecklenburg County?
Inequality or Gini Index in Mecklenburg County is 0.48.
What is the Total Population of Mecklenburg County?
Total Population of Mecklenburg County is 30,367.
What is the Total Male Population of Mecklenburg County?
Total Male Population of Mecklenburg County is 15,032.
What is the Total Female Population of Mecklenburg County?
Total Female Population of Mecklenburg County is 15,335.
What is the Ratio of Males per 100 Females in Mecklenburg County?
There are 98.02 Males per 100 Females in Mecklenburg County.
What is the Ratio of Females per 100 Males in Mecklenburg County?
There are 102.02 Females per 100 Males in Mecklenburg County.
What is the Median Population Age in Mecklenburg County?
Median Population Age in Mecklenburg County is 48.6 Years.
What is the Average Family Size in Mecklenburg County
Average Family Size in Mecklenburg County is 2.9 People.
What is the Average Household Size in Mecklenburg County
Average Household Size in Mecklenburg County is 2.2 People.
How Large is the Labor Force in Mecklenburg County?
There are 13,053 People in the Labor Forcein in Mecklenburg County.
What is the Percentage of People in the Labor Force in Mecklenburg County?
51.3% of People are in the Labor Force in Mecklenburg County.
What is the Unemployment Rate in Mecklenburg County?
Unemployment Rate in Mecklenburg County is 3.6%.