Mathews County, VA Map & Demographics
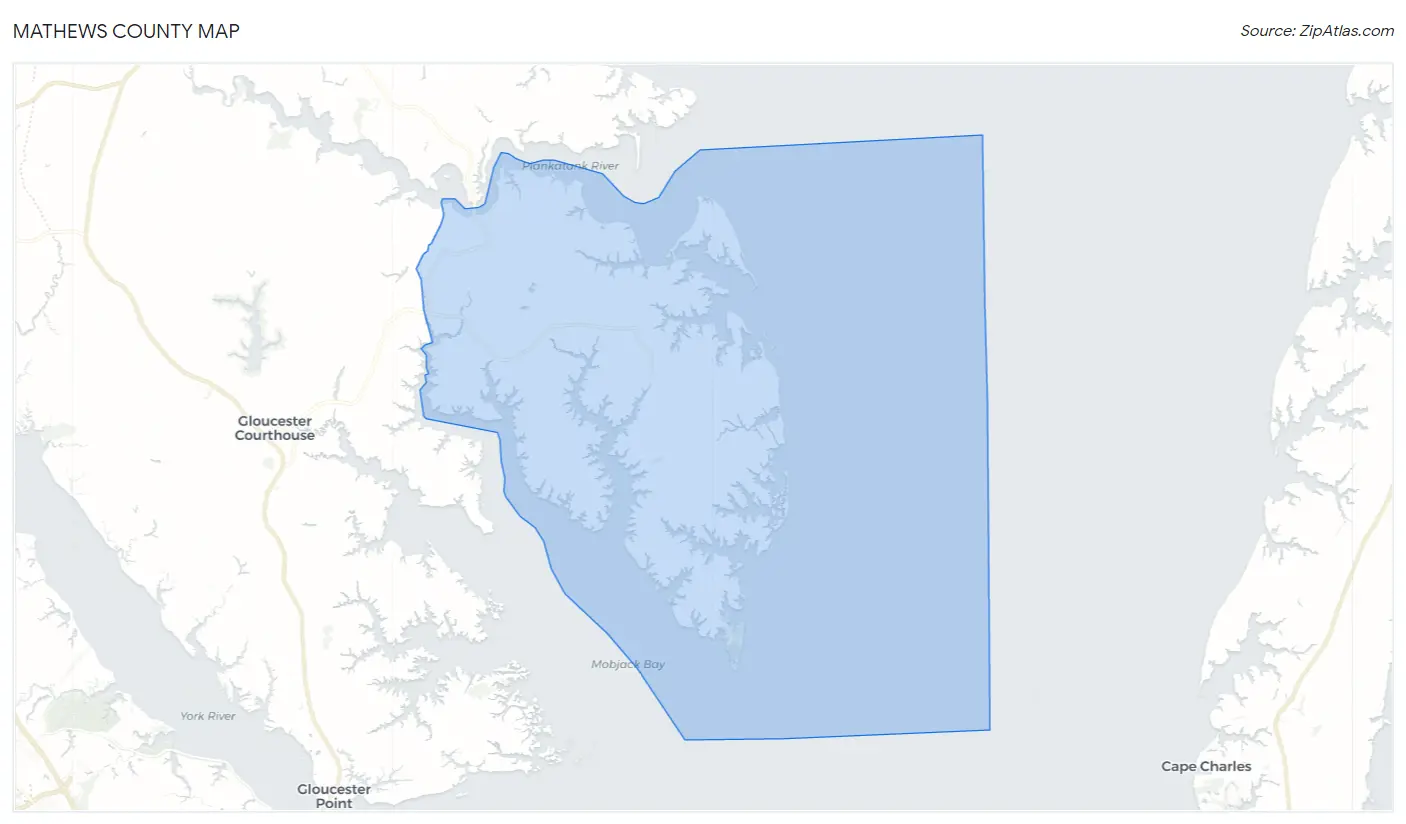
Mathews County Map
Mathews County Overview
$48,173
PER CAPITA INCOME
$92,241
AVG FAMILY INCOME
$79,054
AVG HOUSEHOLD INCOME
3.7%
WAGE / INCOME GAP [ % ]
96.3¢/ $1
WAGE / INCOME GAP [ $ ]
0.44
INEQUALITY / GINI INDEX
8,537
TOTAL POPULATION
4,124
MALE POPULATION
4,413
FEMALE POPULATION
93.45
MALES / 100 FEMALES
107.01
FEMALES / 100 MALES
53.7
MEDIAN AGE
2.9
AVG FAMILY SIZE
2.2
AVG HOUSEHOLD SIZE
3,601
LABOR FORCE [ PEOPLE ]
47.6%
PERCENT IN LABOR FORCE
8.2%
UNEMPLOYMENT RATE
Mathews County Area Codes
Income in Mathews County
Income Overview in Mathews County
Per Capita Income in Mathews County is $48,173, while median incomes of families and households are $92,241 and $79,054 respectively.
| Characteristic | Number | Measure |
| Per Capita Income | 8,537 | $48,173 |
| Median Family Income | 2,236 | $92,241 |
| Mean Family Income | 2,236 | $122,704 |
| Median Household Income | 3,742 | $79,054 |
| Mean Household Income | 3,742 | $106,779 |
| Income Deficit | 2,236 | $0 |
| Wage / Income Gap (%) | 8,537 | 3.66% |
| Wage / Income Gap ($) | 8,537 | 96.34¢ per $1 |
| Gini / Inequality Index | 8,537 | 0.44 |
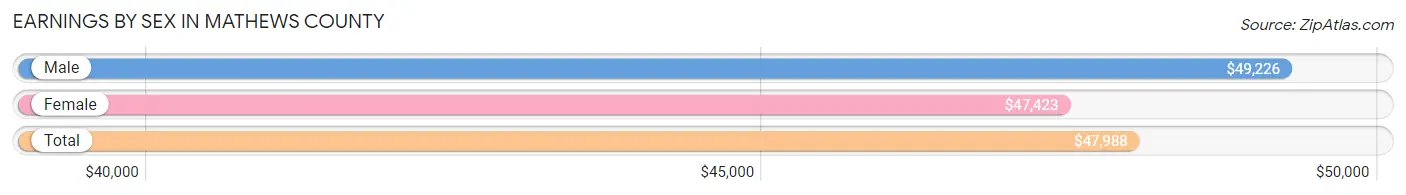
Earnings by Sex in Mathews County
Average Earnings in Mathews County are $47,988, $49,226 for men and $47,423 for women, a difference of 3.7%.
| Sex | Number | Average Earnings |
| Male | 2,068 (55.1%) | $49,226 |
| Female | 1,685 (44.9%) | $47,423 |
| Total | 3,753 (100.0%) | $47,988 |
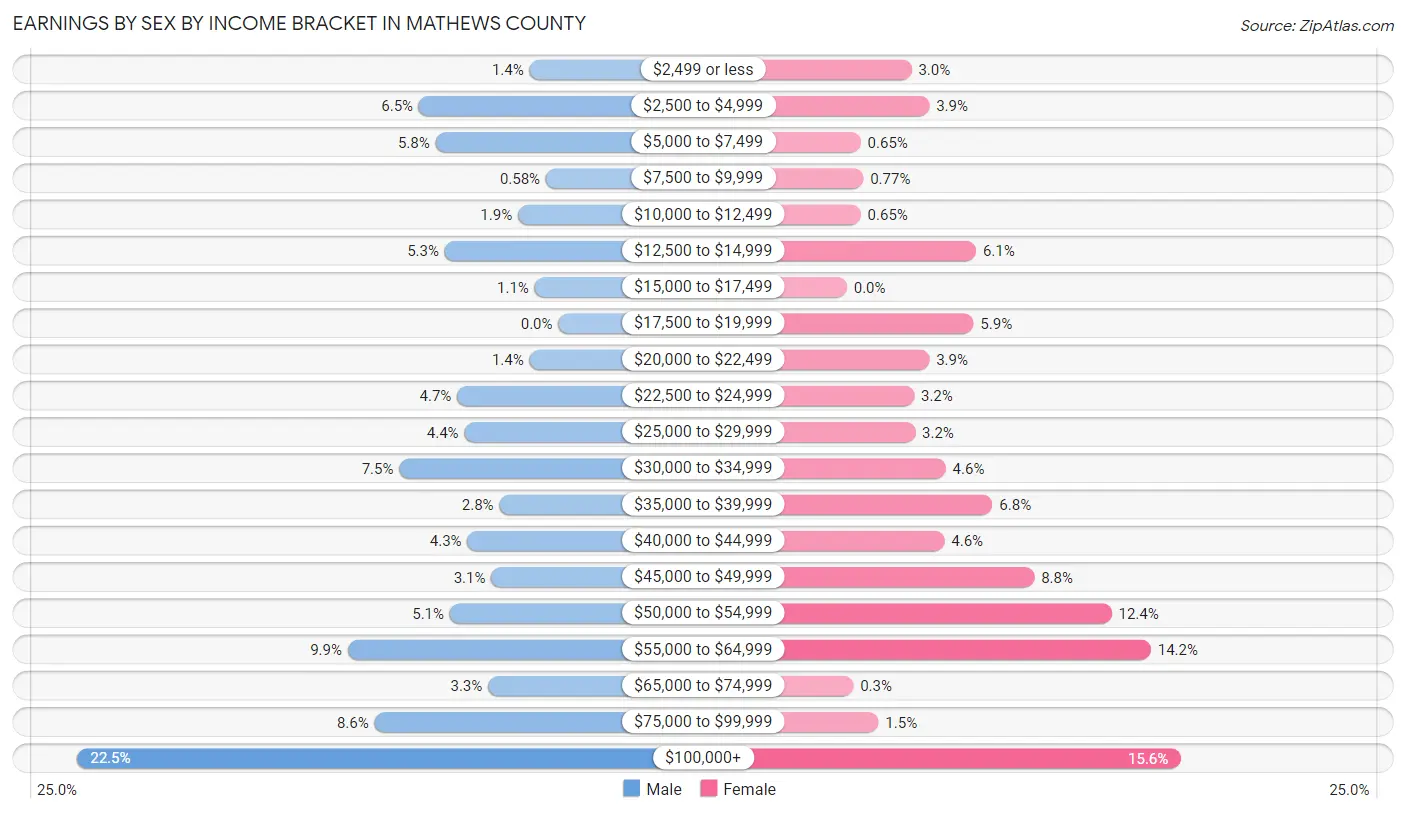
Earnings by Sex by Income Bracket in Mathews County
The most common earnings brackets in Mathews County are $100,000+ for men (466 | 22.5%) and $100,000+ for women (263 | 15.6%).
| Income | Male | Female |
| $2,499 or less | 28 (1.3%) | 51 (3.0%) |
| $2,500 to $4,999 | 135 (6.5%) | 65 (3.9%) |
| $5,000 to $7,499 | 119 (5.8%) | 11 (0.6%) |
| $7,500 to $9,999 | 12 (0.6%) | 13 (0.8%) |
| $10,000 to $12,499 | 39 (1.9%) | 11 (0.6%) |
| $12,500 to $14,999 | 110 (5.3%) | 102 (6.0%) |
| $15,000 to $17,499 | 23 (1.1%) | 0 (0.0%) |
| $17,500 to $19,999 | 0 (0.0%) | 100 (5.9%) |
| $20,000 to $22,499 | 28 (1.3%) | 65 (3.9%) |
| $22,500 to $24,999 | 98 (4.7%) | 53 (3.2%) |
| $25,000 to $29,999 | 91 (4.4%) | 54 (3.2%) |
| $30,000 to $34,999 | 154 (7.4%) | 78 (4.6%) |
| $35,000 to $39,999 | 57 (2.8%) | 115 (6.8%) |
| $40,000 to $44,999 | 88 (4.3%) | 77 (4.6%) |
| $45,000 to $49,999 | 65 (3.1%) | 148 (8.8%) |
| $50,000 to $54,999 | 105 (5.1%) | 209 (12.4%) |
| $55,000 to $64,999 | 204 (9.9%) | 240 (14.2%) |
| $65,000 to $74,999 | 68 (3.3%) | 5 (0.3%) |
| $75,000 to $99,999 | 178 (8.6%) | 25 (1.5%) |
| $100,000+ | 466 (22.5%) | 263 (15.6%) |
| Total | 2,068 (100.0%) | 1,685 (100.0%) |
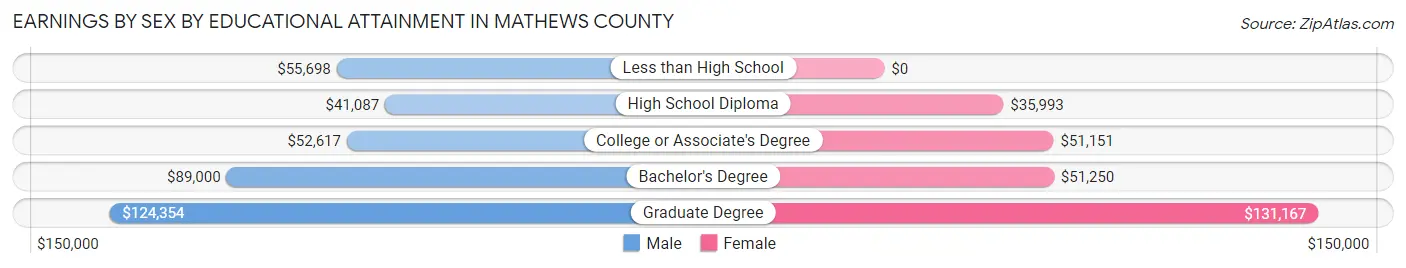
Earnings by Sex by Educational Attainment in Mathews County
Average earnings in Mathews County are $57,136 for men and $48,648 for women, a difference of 14.9%. Men with an educational attainment of graduate degree enjoy the highest average annual earnings of $124,354, while those with high school diploma education earn the least with $41,087. Women with an educational attainment of graduate degree earn the most with the average annual earnings of $131,167, while those with high school diploma education have the smallest earnings of $35,993.
| Educational Attainment | Male Income | Female Income |
| Less than High School | $55,698 | $0 |
| High School Diploma | $41,087 | $35,993 |
| College or Associate's Degree | $52,617 | $51,151 |
| Bachelor's Degree | $89,000 | $51,250 |
| Graduate Degree | $124,354 | $131,167 |
| Total | $57,136 | $48,648 |
Family Income in Mathews County
Family Income Brackets in Mathews County
According to the Mathews County family income data, there are 494 families falling into the $50,000 to $74,999 income range, which is the most common income bracket and makes up 22.1% of all families. Conversely, the $10,000 to $14,999 income bracket is the least frequent group with only 9 families (0.4%) belonging to this category.
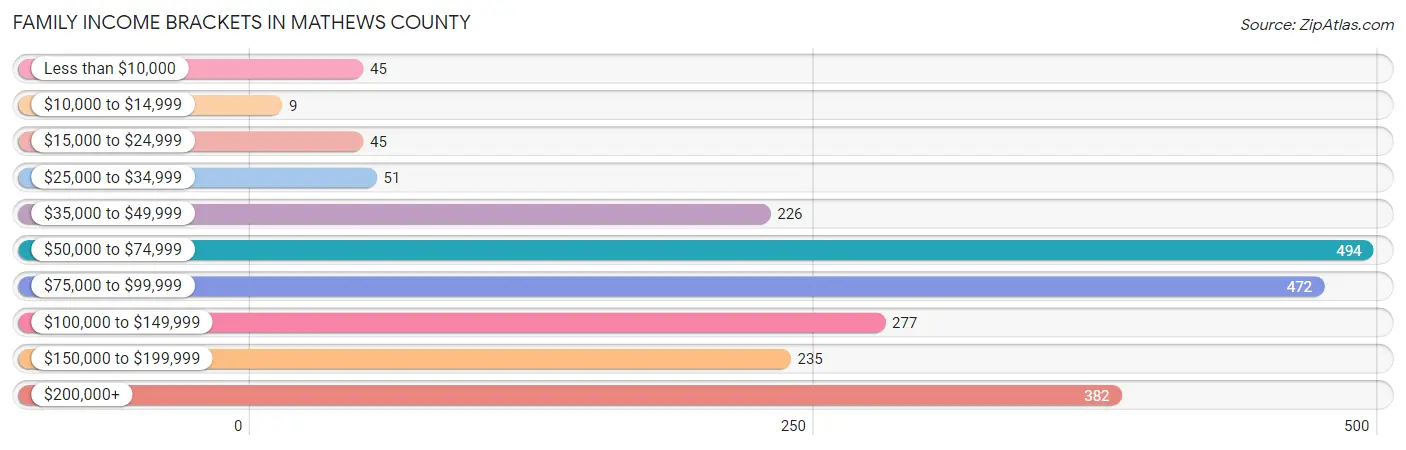
| Income Bracket | # Families | % Families |
| Less than $10,000 | 45 | 2.0% |
| $10,000 to $14,999 | 9 | 0.4% |
| $15,000 to $24,999 | 45 | 2.0% |
| $25,000 to $34,999 | 51 | 2.3% |
| $35,000 to $49,999 | 226 | 10.1% |
| $50,000 to $74,999 | 494 | 22.1% |
| $75,000 to $99,999 | 472 | 21.1% |
| $100,000 to $149,999 | 277 | 12.4% |
| $150,000 to $199,999 | 235 | 10.5% |
| $200,000+ | 382 | 17.1% |
Family Income by Famaliy Size in Mathews County
4-person families (390 | 17.4%) account for the highest median family income in Mathews County with $112,442 per family, while 2-person families (1,352 | 60.5%) have the highest median income of $43,834 per family member.
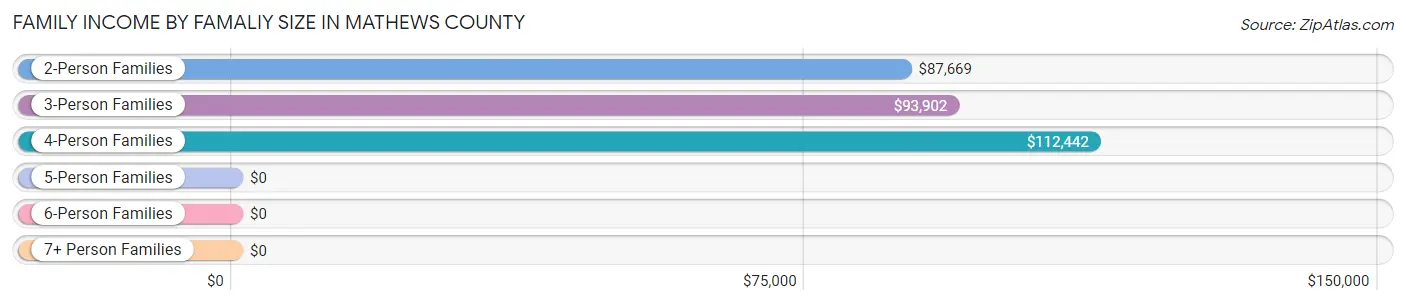
| Income Bracket | # Families | Median Income |
| 2-Person Families | 1,352 (60.5%) | $87,669 |
| 3-Person Families | 389 (17.4%) | $93,902 |
| 4-Person Families | 390 (17.4%) | $112,442 |
| 5-Person Families | 32 (1.4%) | $0 |
| 6-Person Families | 60 (2.7%) | $0 |
| 7+ Person Families | 13 (0.6%) | $0 |
| Total | 2,236 (100.0%) | $92,241 |
Family Income by Number of Earners in Mathews County
The median family income in Mathews County is $92,241, with families comprising 3+ earners (189) having the highest median family income of $158,942, while families with 1 earner (850) have the lowest median family income of $74,321, accounting for 8.5% and 38.0% of families, respectively.
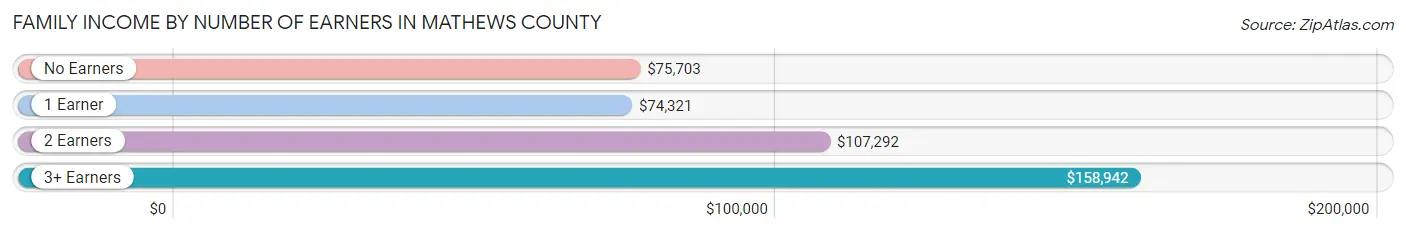
| Number of Earners | # Families | Median Income |
| No Earners | 518 (23.2%) | $75,703 |
| 1 Earner | 850 (38.0%) | $74,321 |
| 2 Earners | 679 (30.4%) | $107,292 |
| 3+ Earners | 189 (8.5%) | $158,942 |
| Total | 2,236 (100.0%) | $92,241 |
Household Income in Mathews County
Household Income Brackets in Mathews County
With 685 households falling in the category, the $50,000 to $74,999 income range is the most frequent in Mathews County, accounting for 18.3% of all households. In contrast, only 34 households (0.9%) fall into the $10,000 to $14,999 income bracket, making it the least populous group.
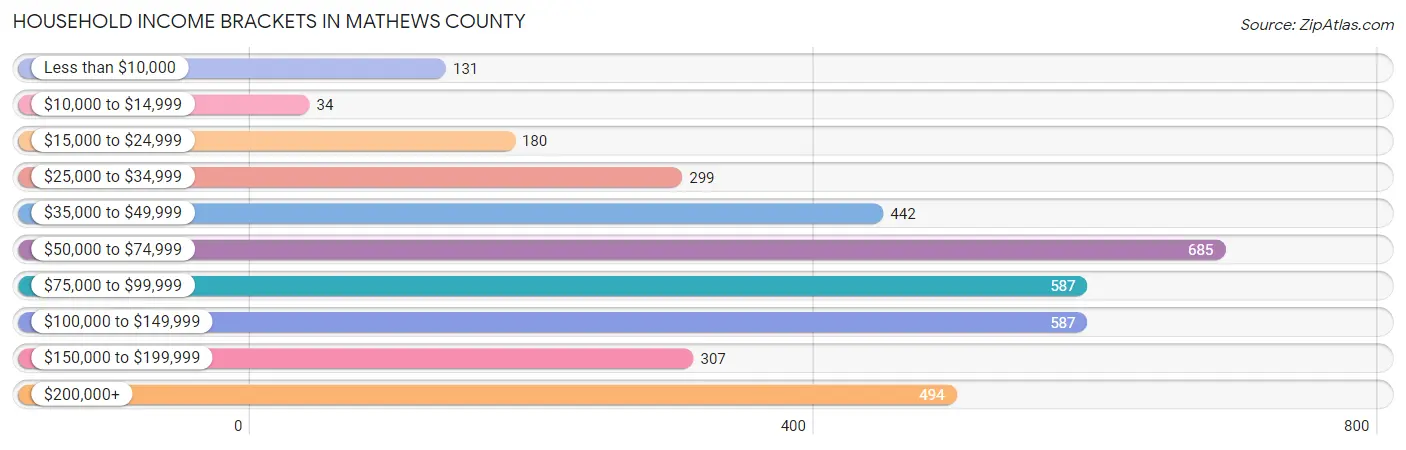
| Income Bracket | # Households | % Households |
| Less than $10,000 | 131 | 3.5% |
| $10,000 to $14,999 | 34 | 0.9% |
| $15,000 to $24,999 | 180 | 4.8% |
| $25,000 to $34,999 | 299 | 8.0% |
| $35,000 to $49,999 | 442 | 11.8% |
| $50,000 to $74,999 | 685 | 18.3% |
| $75,000 to $99,999 | 587 | 15.7% |
| $100,000 to $149,999 | 587 | 15.7% |
| $150,000 to $199,999 | 307 | 8.2% |
| $200,000+ | 494 | 13.2% |
Household Income by Householder Age in Mathews County
The median household income in Mathews County is $79,054, with the highest median household income of $88,355 found in the 45 to 64 years age bracket for the primary householder. A total of 1,407 households (37.6%) fall into this category. Meanwhile, the 15 to 24 years age bracket for the primary householder has the lowest median household income of $0, with 58 households (1.5%) in this group.
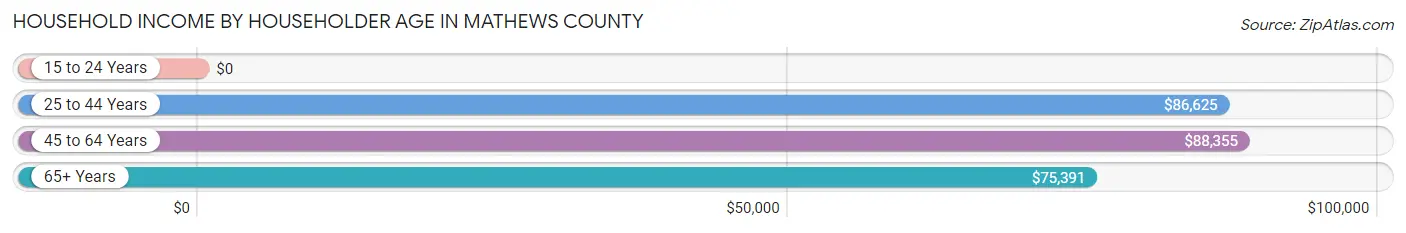
| Income Bracket | # Households | Median Income |
| 15 to 24 Years | 58 (1.5%) | $0 |
| 25 to 44 Years | 481 (12.9%) | $86,625 |
| 45 to 64 Years | 1,407 (37.6%) | $88,355 |
| 65+ Years | 1,796 (48.0%) | $75,391 |
| Total | 3,742 (100.0%) | $79,054 |
Poverty in Mathews County
Income Below Poverty by Sex and Age in Mathews County
With 8.4% poverty level for males and 5.4% for females among the residents of Mathews County, 16 and 17 year old males and under 5 year old females are the most vulnerable to poverty, with 94 males (57.3%) and 49 females (36.0%) in their respective age groups living below the poverty level.
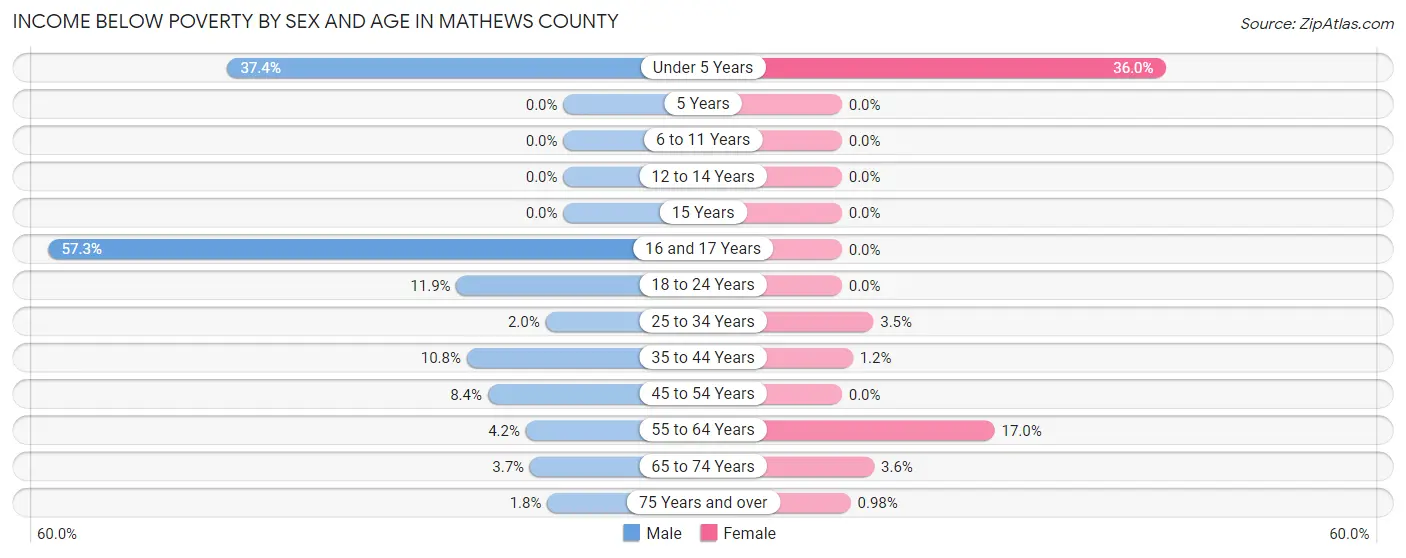
| Age Bracket | Male | Female |
| Under 5 Years | 49 (37.4%) | 49 (36.0%) |
| 5 Years | 0 (0.0%) | 0 (0.0%) |
| 6 to 11 Years | 0 (0.0%) | 0 (0.0%) |
| 12 to 14 Years | 0 (0.0%) | 0 (0.0%) |
| 15 Years | 0 (0.0%) | 0 (0.0%) |
| 16 and 17 Years | 94 (57.3%) | 0 (0.0%) |
| 18 to 24 Years | 48 (11.9%) | 0 (0.0%) |
| 25 to 34 Years | 4 (2.0%) | 8 (3.5%) |
| 35 to 44 Years | 43 (10.7%) | 4 (1.2%) |
| 45 to 54 Years | 46 (8.4%) | 0 (0.0%) |
| 55 to 64 Years | 28 (4.2%) | 139 (17.0%) |
| 65 to 74 Years | 23 (3.7%) | 27 (3.6%) |
| 75 Years and over | 9 (1.8%) | 7 (1.0%) |
| Total | 344 (8.4%) | 234 (5.4%) |
Income Above Poverty by Sex and Age in Mathews County
According to the poverty statistics in Mathews County, males aged 5 years and females aged 5 years are the age groups that are most secure financially, with 100.0% of males and 100.0% of females in these age groups living above the poverty line.
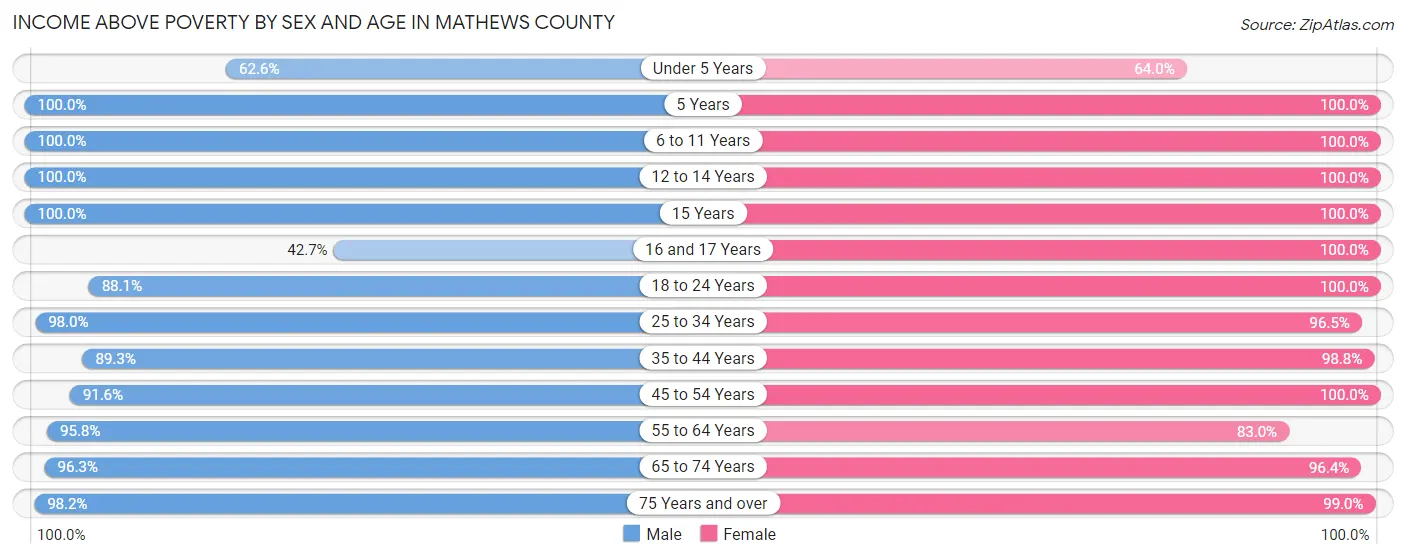
| Age Bracket | Male | Female |
| Under 5 Years | 82 (62.6%) | 87 (64.0%) |
| 5 Years | 59 (100.0%) | 60 (100.0%) |
| 6 to 11 Years | 282 (100.0%) | 60 (100.0%) |
| 12 to 14 Years | 83 (100.0%) | 81 (100.0%) |
| 15 Years | 43 (100.0%) | 36 (100.0%) |
| 16 and 17 Years | 70 (42.7%) | 156 (100.0%) |
| 18 to 24 Years | 355 (88.1%) | 352 (100.0%) |
| 25 to 34 Years | 198 (98.0%) | 220 (96.5%) |
| 35 to 44 Years | 357 (89.2%) | 324 (98.8%) |
| 45 to 54 Years | 501 (91.6%) | 627 (100.0%) |
| 55 to 64 Years | 642 (95.8%) | 678 (83.0%) |
| 65 to 74 Years | 595 (96.3%) | 724 (96.4%) |
| 75 Years and over | 495 (98.2%) | 709 (99.0%) |
| Total | 3,762 (91.6%) | 4,114 (94.6%) |
Income Below Poverty Among Married-Couple Families in Mathews County
The poverty statistics for married-couple families in Mathews County show that 0.9% or 19 of the total 2,001 families live below the poverty line. Families with no children have the highest poverty rate of 1.3%, comprising of 19 families. On the other hand, families with 1 or 2 children have the lowest poverty rate of 0.0%, which includes 0 families.
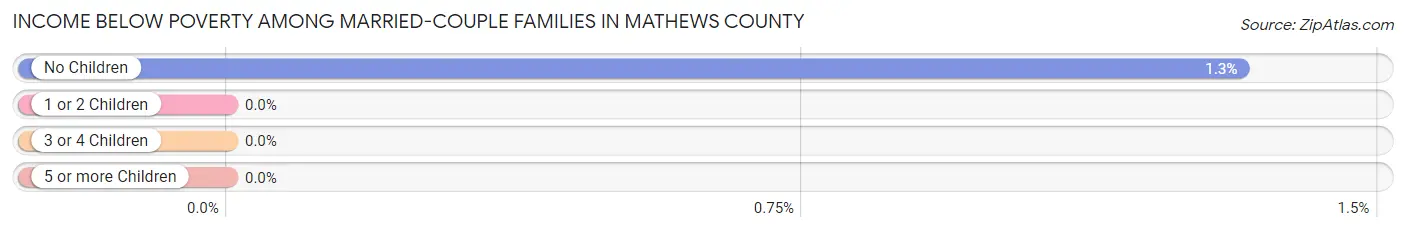
| Children | Above Poverty | Below Poverty |
| No Children | 1,420 (98.7%) | 19 (1.3%) |
| 1 or 2 Children | 457 (100.0%) | 0 (0.0%) |
| 3 or 4 Children | 105 (100.0%) | 0 (0.0%) |
| 5 or more Children | 0 (0.0%) | 0 (0.0%) |
| Total | 1,982 (99.1%) | 19 (0.9%) |
Income Below Poverty Among Single-Parent Households in Mathews County
According to the poverty data in Mathews County, 66.7% or 44 single-father households and 5.9% or 10 single-mother households are living below the poverty line. Among single-father households, those with 1 or 2 children have the highest poverty rate, with 44 households (100.0%) experiencing poverty. Likewise, among single-mother households, those with no children have the highest poverty rate, with 10 households (9.6%) falling below the poverty line.
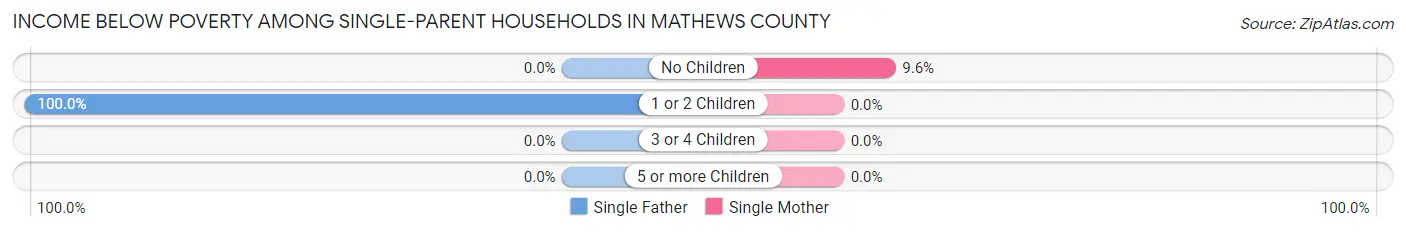
| Children | Single Father | Single Mother |
| No Children | 0 (0.0%) | 10 (9.6%) |
| 1 or 2 Children | 44 (100.0%) | 0 (0.0%) |
| 3 or 4 Children | 0 (0.0%) | 0 (0.0%) |
| 5 or more Children | 0 (0.0%) | 0 (0.0%) |
| Total | 44 (66.7%) | 10 (5.9%) |
Income Below Poverty Among Married-Couple vs Single-Parent Households in Mathews County
The poverty data for Mathews County shows that 19 of the married-couple family households (0.9%) and 54 of the single-parent households (23.0%) are living below the poverty level. Within the married-couple family households, those with no children have the highest poverty rate, with 19 households (1.3%) falling below the poverty line. Among the single-parent households, those with 1 or 2 children have the highest poverty rate, with 44 household (53.0%) living below poverty.
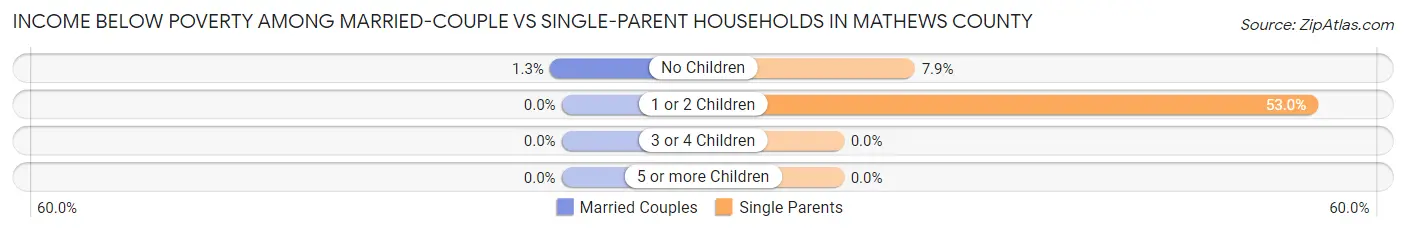
| Children | Married-Couple Families | Single-Parent Households |
| No Children | 19 (1.3%) | 10 (7.9%) |
| 1 or 2 Children | 0 (0.0%) | 44 (53.0%) |
| 3 or 4 Children | 0 (0.0%) | 0 (0.0%) |
| 5 or more Children | 0 (0.0%) | 0 (0.0%) |
| Total | 19 (0.9%) | 54 (23.0%) |
Race in Mathews County
The most populous races in Mathews County are White / Caucasian (7,412 | 86.8%), Black / African American (767 | 9.0%), and Two or more Races (297 | 3.5%).
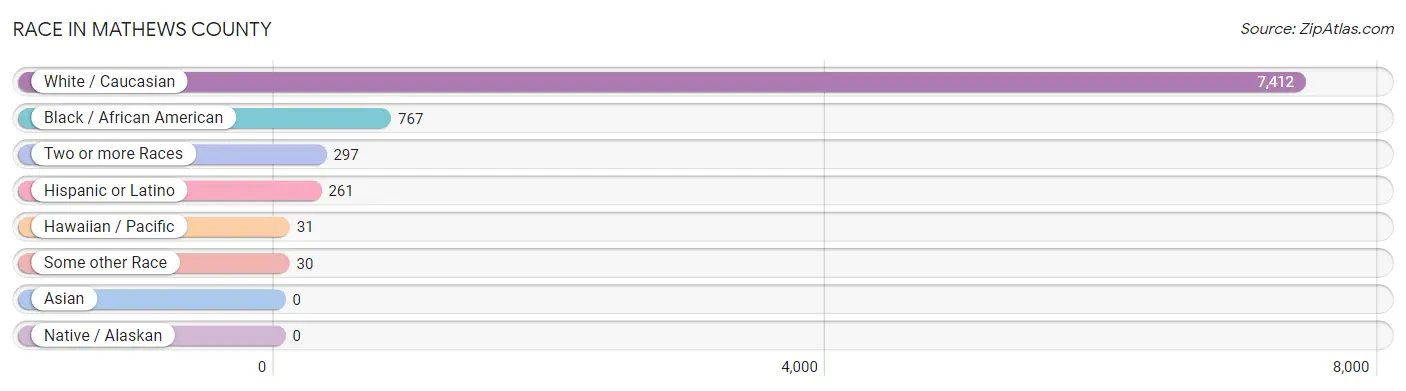
| Race | # Population | % Population |
| Asian | 0 | 0.0% |
| Black / African American | 767 | 9.0% |
| Hawaiian / Pacific | 31 | 0.4% |
| Hispanic or Latino | 261 | 3.1% |
| Native / Alaskan | 0 | 0.0% |
| White / Caucasian | 7,412 | 86.8% |
| Two or more Races | 297 | 3.5% |
| Some other Race | 30 | 0.4% |
| Total | 8,537 | 100.0% |
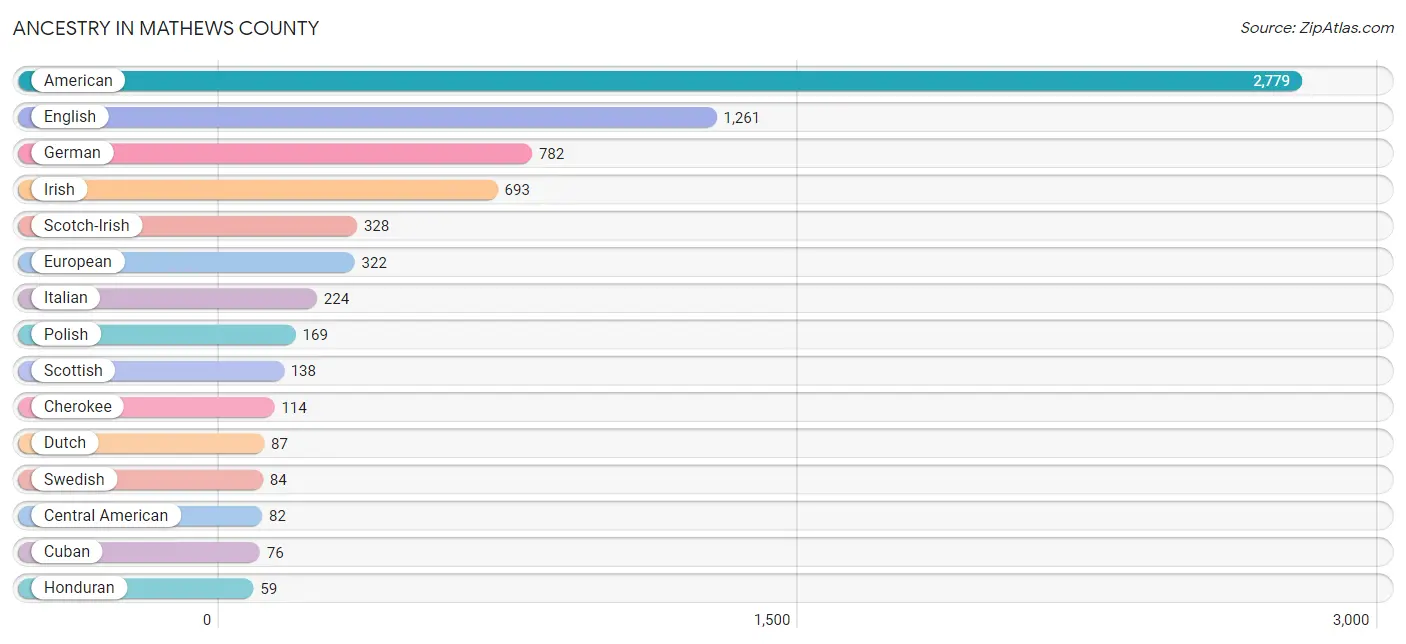
Ancestry in Mathews County
The most populous ancestries reported in Mathews County are American (2,779 | 32.6%), English (1,261 | 14.8%), German (782 | 9.2%), Irish (693 | 8.1%), and Scotch-Irish (328 | 3.8%), together accounting for 68.4% of all Mathews County residents.
| Ancestry | # Population | % Population |
| African | 24 | 0.3% |
| American | 2,779 | 32.6% |
| Austrian | 15 | 0.2% |
| Bolivian | 39 | 0.5% |
| Burmese | 4 | 0.1% |
| Central American | 82 | 1.0% |
| Cherokee | 114 | 1.3% |
| Cuban | 76 | 0.9% |
| Danish | 29 | 0.3% |
| Dutch | 87 | 1.0% |
| Eastern European | 58 | 0.7% |
| English | 1,261 | 14.8% |
| European | 322 | 3.8% |
| French | 40 | 0.5% |
| German | 782 | 9.2% |
| Honduran | 59 | 0.7% |
| Irish | 693 | 8.1% |
| Italian | 224 | 2.6% |
| Lithuanian | 9 | 0.1% |
| Mexican | 15 | 0.2% |
| Native Hawaiian | 31 | 0.4% |
| Northern European | 37 | 0.4% |
| Norwegian | 48 | 0.6% |
| Polish | 169 | 2.0% |
| Puerto Rican | 20 | 0.2% |
| Russian | 48 | 0.6% |
| Salvadoran | 23 | 0.3% |
| Scotch-Irish | 328 | 3.8% |
| Scottish | 138 | 1.6% |
| South American | 39 | 0.5% |
| Spaniard | 24 | 0.3% |
| Subsaharan African | 24 | 0.3% |
| Swedish | 84 | 1.0% |
| Swiss | 12 | 0.1% |
| Thai | 10 | 0.1% |
| Welsh | 18 | 0.2% | View All 36 Rows |
Immigrants in Mathews County
The most numerous immigrant groups reported in Mathews County came from Latin America (81 | 0.9%), Central America (65 | 0.8%), Honduras (59 | 0.7%), Bolivia (16 | 0.2%), and South America (16 | 0.2%), together accounting for 2.8% of all Mathews County residents.
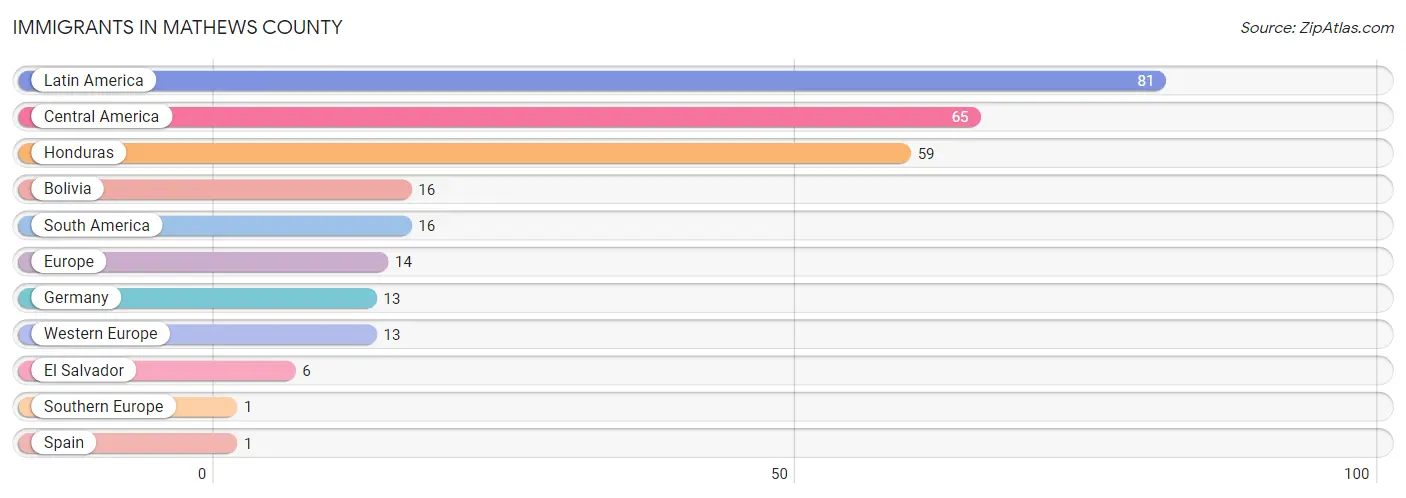
| Immigration Origin | # Population | % Population |
| Bolivia | 16 | 0.2% |
| Central America | 65 | 0.8% |
| El Salvador | 6 | 0.1% |
| Europe | 14 | 0.2% |
| Germany | 13 | 0.2% |
| Honduras | 59 | 0.7% |
| Latin America | 81 | 0.9% |
| South America | 16 | 0.2% |
| Southern Europe | 1 | 0.0% |
| Spain | 1 | 0.0% |
| Western Europe | 13 | 0.2% | View All 11 Rows |
Sex and Age in Mathews County
Sex and Age in Mathews County
The most populous age groups in Mathews County are 55 to 59 Years (382 | 9.3%) for men and 60 to 64 Years (544 | 12.3%) for women.
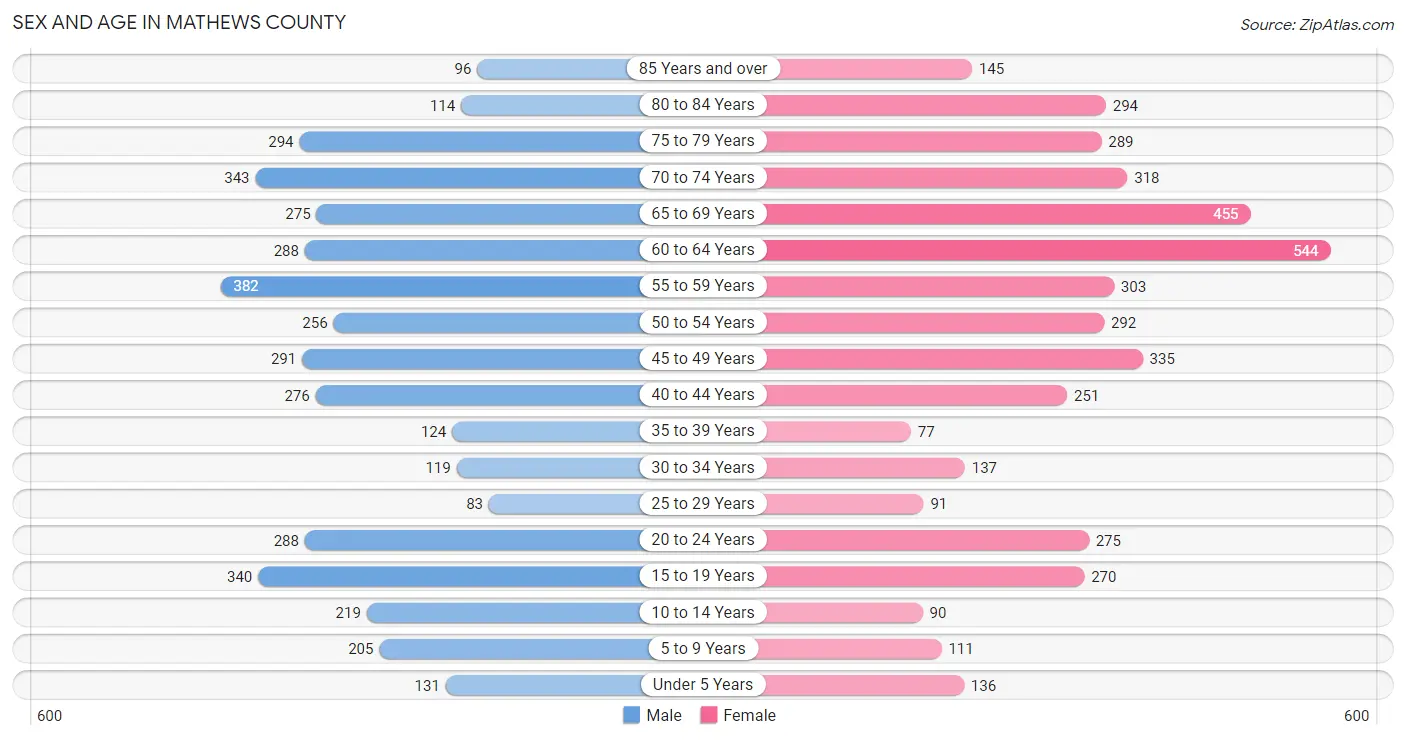
| Age Bracket | Male | Female |
| Under 5 Years | 131 (3.2%) | 136 (3.1%) |
| 5 to 9 Years | 205 (5.0%) | 111 (2.5%) |
| 10 to 14 Years | 219 (5.3%) | 90 (2.0%) |
| 15 to 19 Years | 340 (8.2%) | 270 (6.1%) |
| 20 to 24 Years | 288 (7.0%) | 275 (6.2%) |
| 25 to 29 Years | 83 (2.0%) | 91 (2.1%) |
| 30 to 34 Years | 119 (2.9%) | 137 (3.1%) |
| 35 to 39 Years | 124 (3.0%) | 77 (1.7%) |
| 40 to 44 Years | 276 (6.7%) | 251 (5.7%) |
| 45 to 49 Years | 291 (7.1%) | 335 (7.6%) |
| 50 to 54 Years | 256 (6.2%) | 292 (6.6%) |
| 55 to 59 Years | 382 (9.3%) | 303 (6.9%) |
| 60 to 64 Years | 288 (7.0%) | 544 (12.3%) |
| 65 to 69 Years | 275 (6.7%) | 455 (10.3%) |
| 70 to 74 Years | 343 (8.3%) | 318 (7.2%) |
| 75 to 79 Years | 294 (7.1%) | 289 (6.6%) |
| 80 to 84 Years | 114 (2.8%) | 294 (6.7%) |
| 85 Years and over | 96 (2.3%) | 145 (3.3%) |
| Total | 4,124 (100.0%) | 4,413 (100.0%) |
Families and Households in Mathews County
Median Family Size in Mathews County
The median family size in Mathews County is 2.87 persons per family, with single female/mother families (169 | 7.6%) accounting for the largest median family size of 2.96 persons per family. On the other hand, married-couple families (2,001 | 89.5%) represent the smallest median family size with 2.86 persons per family.
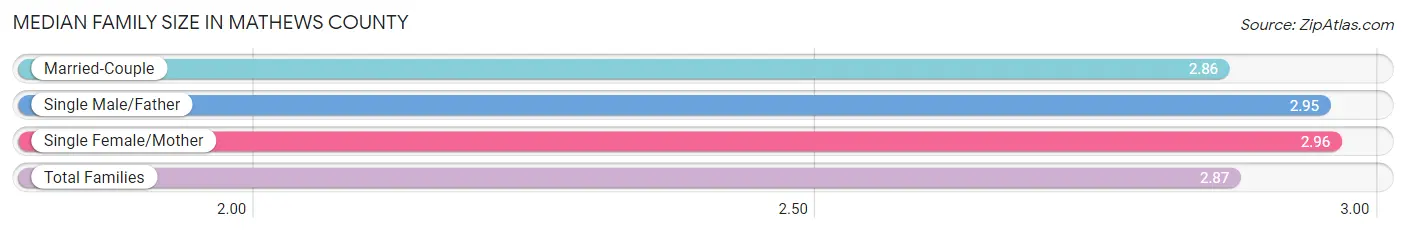
| Family Type | # Families | Family Size |
| Married-Couple | 2,001 (89.5%) | 2.86 |
| Single Male/Father | 66 (2.9%) | 2.95 |
| Single Female/Mother | 169 (7.6%) | 2.96 |
| Total Families | 2,236 (100.0%) | 2.87 |
Median Household Size in Mathews County
The median household size in Mathews County is 2.24 persons per household, with single male/father households (66 | 1.8%) accounting for the largest median household size of 3.76 persons per household. non-family households (1,506 | 40.3%) represent the smallest median household size with 1.17 persons per household.
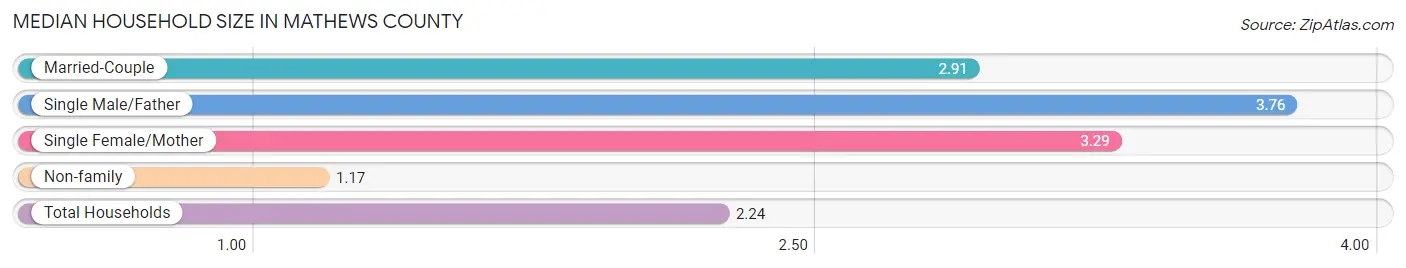
| Household Type | # Households | Household Size |
| Married-Couple | 2,001 (53.5%) | 2.91 |
| Single Male/Father | 66 (1.8%) | 3.76 |
| Single Female/Mother | 169 (4.5%) | 3.29 |
| Non-family | 1,506 (40.3%) | 1.17 |
| Total Households | 3,742 (100.0%) | 2.24 |
Household Size by Marriage Status in Mathews County
Out of a total of 3,742 households in Mathews County, 2,236 (59.8%) are family households, while 1,506 (40.3%) are nonfamily households. The most numerous type of family households are 2-person households, comprising 1,289, and the most common type of nonfamily households are 1-person households, comprising 1,252.
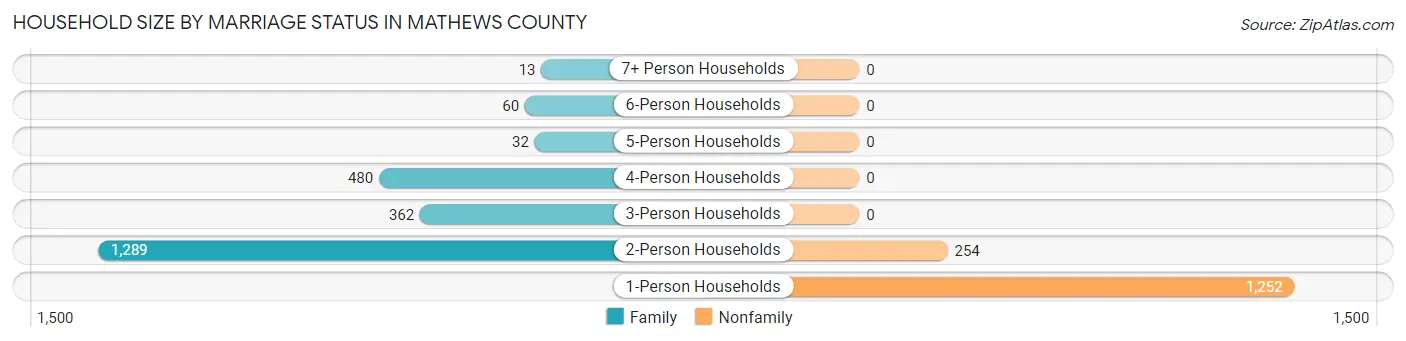
| Household Size | Family Households | Nonfamily Households |
| 1-Person Households | - | 1,252 (33.5%) |
| 2-Person Households | 1,289 (34.4%) | 254 (6.8%) |
| 3-Person Households | 362 (9.7%) | 0 (0.0%) |
| 4-Person Households | 480 (12.8%) | 0 (0.0%) |
| 5-Person Households | 32 (0.9%) | 0 (0.0%) |
| 6-Person Households | 60 (1.6%) | 0 (0.0%) |
| 7+ Person Households | 13 (0.4%) | 0 (0.0%) |
| Total | 2,236 (59.8%) | 1,506 (40.3%) |
Female Fertility in Mathews County
Fertility by Age in Mathews County
Average fertility rate in Mathews County is 3.0 births per 1,000 women. Women in the age bracket of 20 to 34 years have the highest fertility rate with 8.0 births per 1,000 women. Women in the age bracket of 20 to 34 years acount for 100.0% of all women with births.
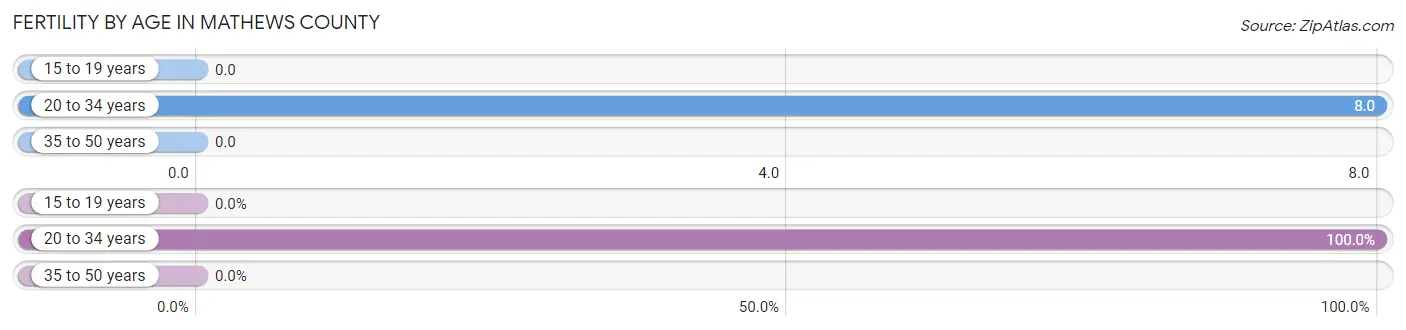
| Age Bracket | Women with Births | Births / 1,000 Women |
| 15 to 19 years | 0 (0.0%) | 0.0 |
| 20 to 34 years | 4 (100.0%) | 8.0 |
| 35 to 50 years | 0 (0.0%) | 0.0 |
| Total | 4 (100.0%) | 3.0 |
Fertility by Age by Marriage Status in Mathews County
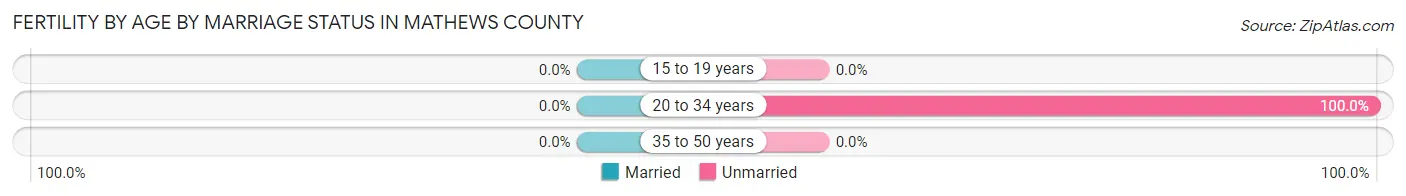
| Age Bracket | Married | Unmarried |
| 15 to 19 years | 0 (0.0%) | 0 (0.0%) |
| 20 to 34 years | 0 (0.0%) | 4 (100.0%) |
| 35 to 50 years | 0 (0.0%) | 0 (0.0%) |
| Total | 0 (0.0%) | 4 (100.0%) |
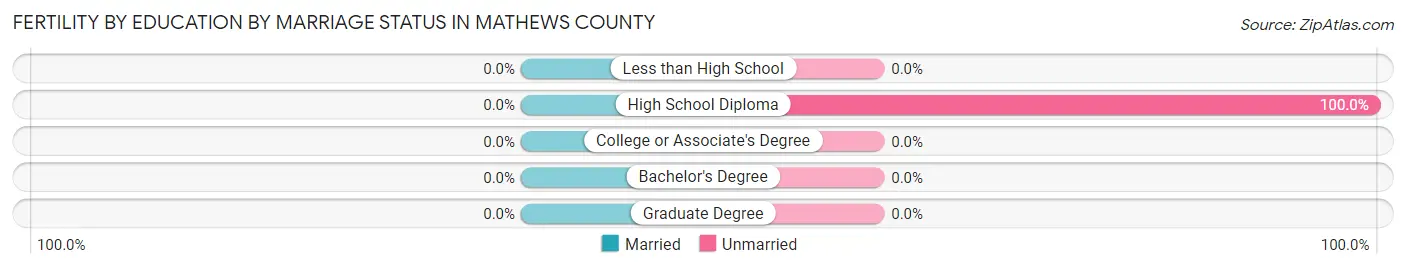
Fertility by Education in Mathews County
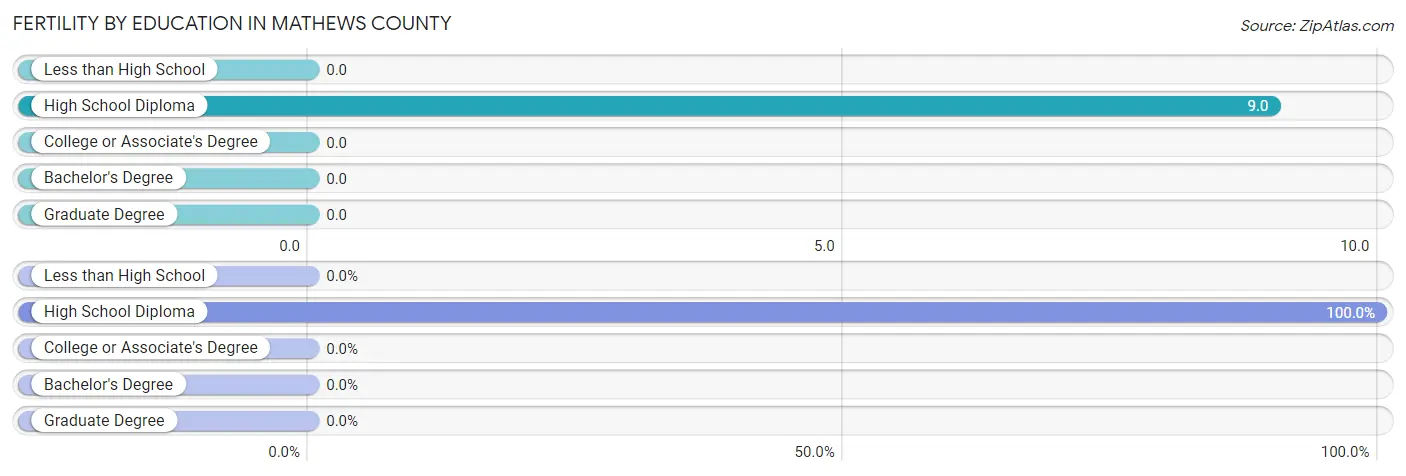
| Educational Attainment | Women with Births | Births / 1,000 Women |
| Less than High School | 0 (0.0%) | 0.0 |
| High School Diploma | 4 (100.0%) | 9.0 |
| College or Associate's Degree | 0 (0.0%) | 0.0 |
| Bachelor's Degree | 0 (0.0%) | 0.0 |
| Graduate Degree | 0 (0.0%) | 0.0 |
| Total | 4 (100.0%) | 3.0 |
Fertility by Education by Marriage Status in Mathews County
| Educational Attainment | Married | Unmarried |
| Less than High School | 0 (0.0%) | 0 (0.0%) |
| High School Diploma | 0 (0.0%) | 4 (100.0%) |
| College or Associate's Degree | 0 (0.0%) | 0 (0.0%) |
| Bachelor's Degree | 0 (0.0%) | 0 (0.0%) |
| Graduate Degree | 0 (0.0%) | 0 (0.0%) |
| Total | 0 (0.0%) | 4 (100.0%) |
Employment Characteristics in Mathews County
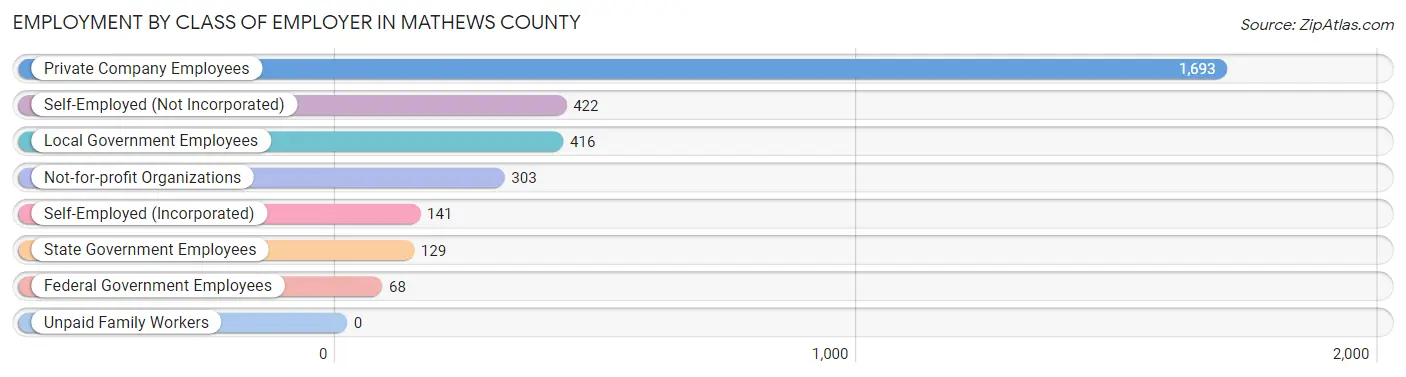
Employment by Class of Employer in Mathews County
Among the 3,172 employed individuals in Mathews County, private company employees (1,693 | 53.4%), self-employed (not incorporated) (422 | 13.3%), and local government employees (416 | 13.1%) make up the most common classes of employment.
| Employer Class | # Employees | % Employees |
| Private Company Employees | 1,693 | 53.4% |
| Self-Employed (Incorporated) | 141 | 4.4% |
| Self-Employed (Not Incorporated) | 422 | 13.3% |
| Not-for-profit Organizations | 303 | 9.6% |
| Local Government Employees | 416 | 13.1% |
| State Government Employees | 129 | 4.1% |
| Federal Government Employees | 68 | 2.1% |
| Unpaid Family Workers | 0 | 0.0% |
| Total | 3,172 | 100.0% |
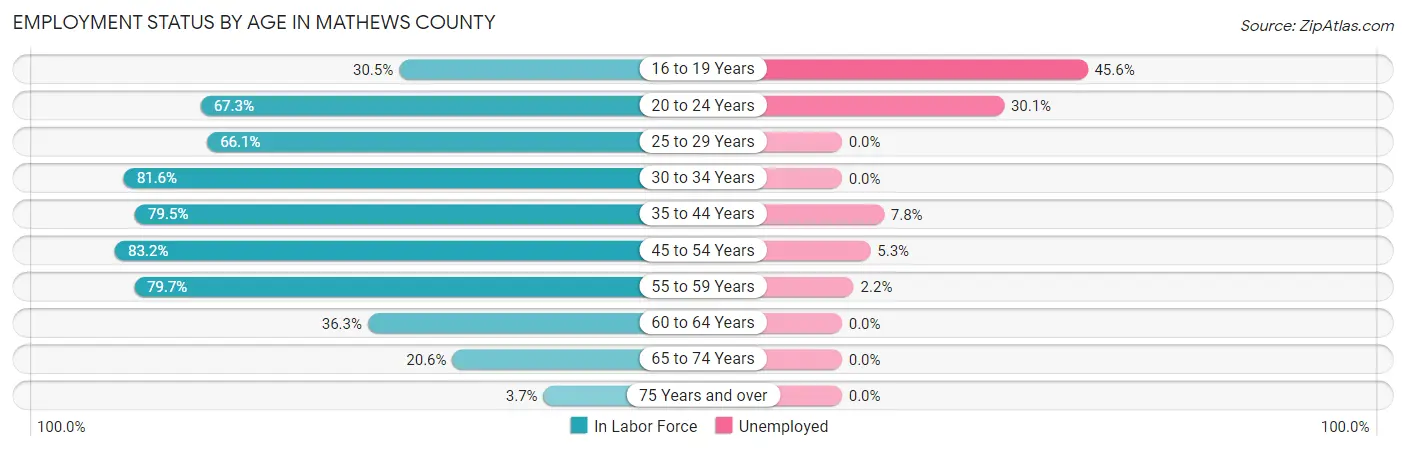
Employment Status by Age in Mathews County
According to the labor force statistics for Mathews County, out of the total population over 16 years of age (7,566), 47.6% or 3,601 individuals are in the labor force, with 8.2% or 295 of them unemployed. The age group with the highest labor force participation rate is 45 to 54 years, with 83.2% or 977 individuals in the labor force. Within the labor force, the 16 to 19 years age range has the highest percentage of unemployed individuals, with 45.6% or 74 of them being unemployed.
| Age Bracket | In Labor Force | Unemployed |
| 16 to 19 Years | 162 (30.5%) | 74 (45.6%) |
| 20 to 24 Years | 379 (67.3%) | 114 (30.1%) |
| 25 to 29 Years | 115 (66.1%) | 0 (0.0%) |
| 30 to 34 Years | 209 (81.6%) | 0 (0.0%) |
| 35 to 44 Years | 579 (79.5%) | 45 (7.8%) |
| 45 to 54 Years | 977 (83.2%) | 52 (5.3%) |
| 55 to 59 Years | 546 (79.7%) | 12 (2.2%) |
| 60 to 64 Years | 302 (36.3%) | 0 (0.0%) |
| 65 to 74 Years | 287 (20.6%) | 0 (0.0%) |
| 75 Years and over | 46 (3.7%) | 0 (0.0%) |
| Total | 3,601 (47.6%) | 295 (8.2%) |
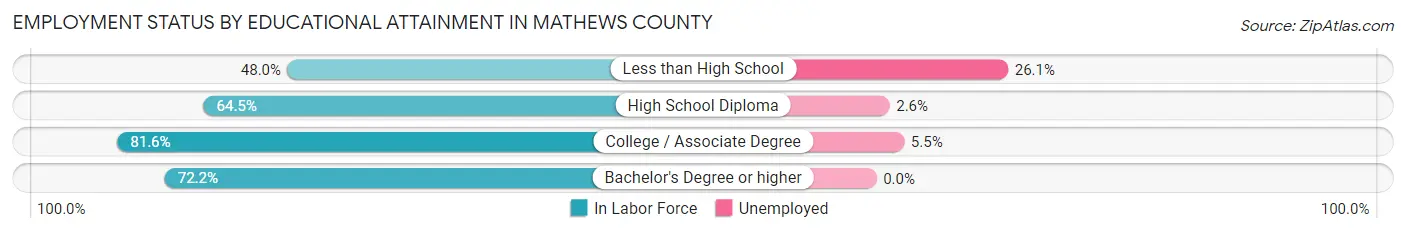
Employment Status by Educational Attainment in Mathews County
According to labor force statistics for Mathews County, 70.9% of individuals (2,729) out of the total population between 25 and 64 years of age (3,849) are in the labor force, with 4.0% or 109 of them being unemployed. The group with the highest labor force participation rate are those with the educational attainment of college / associate degree, with 81.6% or 955 individuals in the labor force. Within the labor force, individuals with less than high school education have the highest percentage of unemployment, with 26.1% or 37 of them being unemployed.
| Educational Attainment | In Labor Force | Unemployed |
| Less than High School | 142 (48.0%) | 77 (26.1%) |
| High School Diploma | 759 (64.5%) | 31 (2.6%) |
| College / Associate Degree | 955 (81.6%) | 64 (5.5%) |
| Bachelor's Degree or higher | 871 (72.2%) | 0 (0.0%) |
| Total | 2,729 (70.9%) | 154 (4.0%) |
Employment Occupations by Sex in Mathews County
Management, Business, Science and Arts Occupations
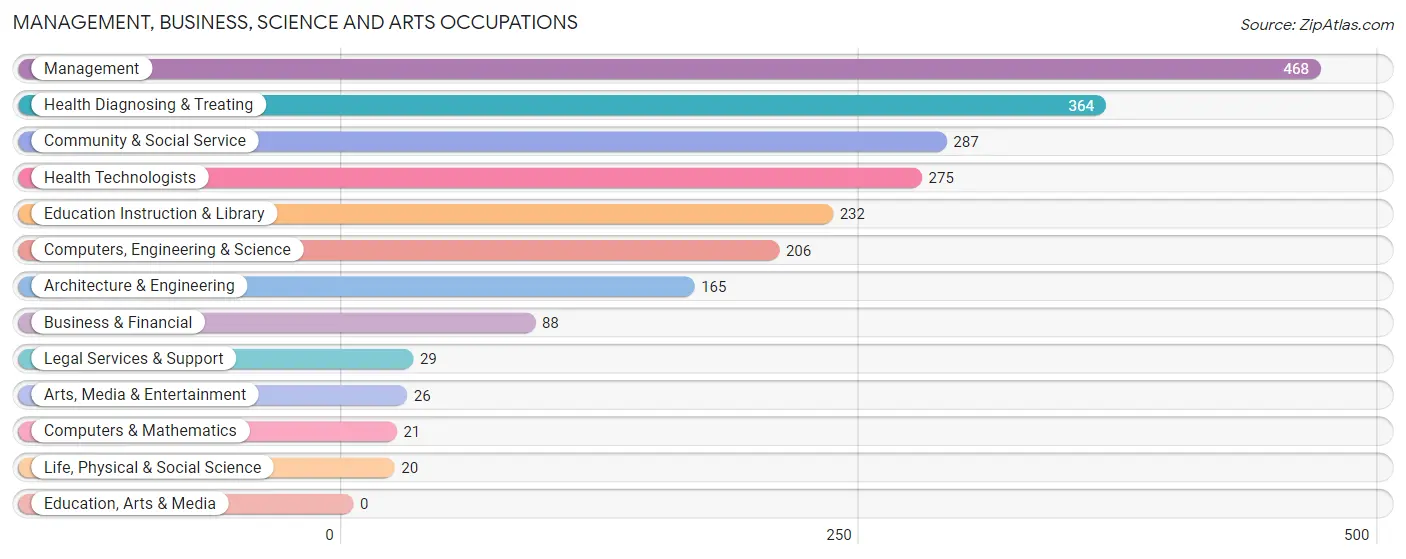
The most common Management, Business, Science and Arts occupations in Mathews County are Management (468 | 14.2%), Health Diagnosing & Treating (364 | 11.1%), Community & Social Service (287 | 8.7%), Health Technologists (275 | 8.4%), and Education Instruction & Library (232 | 7.1%).
Management, Business, Science and Arts Occupations by Sex
Within the Management, Business, Science and Arts occupations in Mathews County, the most male-oriented occupations are Computers & Mathematics (100.0%), Life, Physical & Social Science (100.0%), and Computers, Engineering & Science (72.8%), while the most female-oriented occupations are Legal Services & Support (100.0%), Health Technologists (93.4%), and Education Instruction & Library (84.5%).
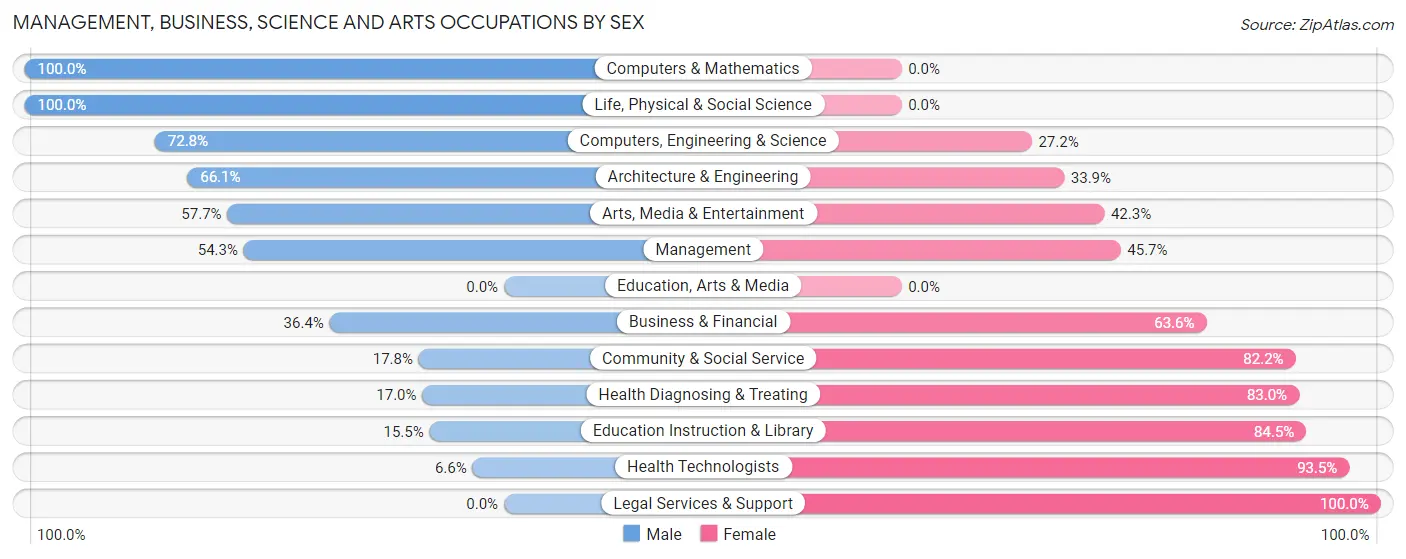
| Occupation | Male | Female |
| Management | 254 (54.3%) | 214 (45.7%) |
| Business & Financial | 32 (36.4%) | 56 (63.6%) |
| Computers, Engineering & Science | 150 (72.8%) | 56 (27.2%) |
| Computers & Mathematics | 21 (100.0%) | 0 (0.0%) |
| Architecture & Engineering | 109 (66.1%) | 56 (33.9%) |
| Life, Physical & Social Science | 20 (100.0%) | 0 (0.0%) |
| Community & Social Service | 51 (17.8%) | 236 (82.2%) |
| Education, Arts & Media | 0 (0.0%) | 0 (0.0%) |
| Legal Services & Support | 0 (0.0%) | 29 (100.0%) |
| Education Instruction & Library | 36 (15.5%) | 196 (84.5%) |
| Arts, Media & Entertainment | 15 (57.7%) | 11 (42.3%) |
| Health Diagnosing & Treating | 62 (17.0%) | 302 (83.0%) |
| Health Technologists | 18 (6.6%) | 257 (93.4%) |
| Total (Category) | 549 (38.9%) | 864 (61.2%) |
| Total (Overall) | 1,742 (53.0%) | 1,542 (46.9%) |
Services Occupations
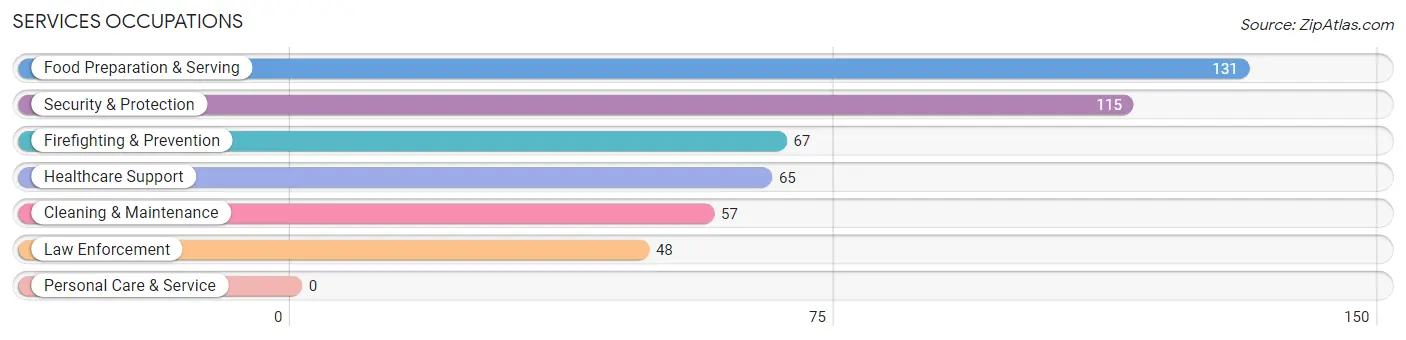
The most common Services occupations in Mathews County are Food Preparation & Serving (131 | 4.0%), Security & Protection (115 | 3.5%), Firefighting & Prevention (67 | 2.0%), Healthcare Support (65 | 2.0%), and Cleaning & Maintenance (57 | 1.7%).
Services Occupations by Sex
Within the Services occupations in Mathews County, the most male-oriented occupations are Law Enforcement (100.0%), Cleaning & Maintenance (100.0%), and Security & Protection (76.5%), while the most female-oriented occupations are Healthcare Support (100.0%), Food Preparation & Serving (77.9%), and Firefighting & Prevention (40.3%).
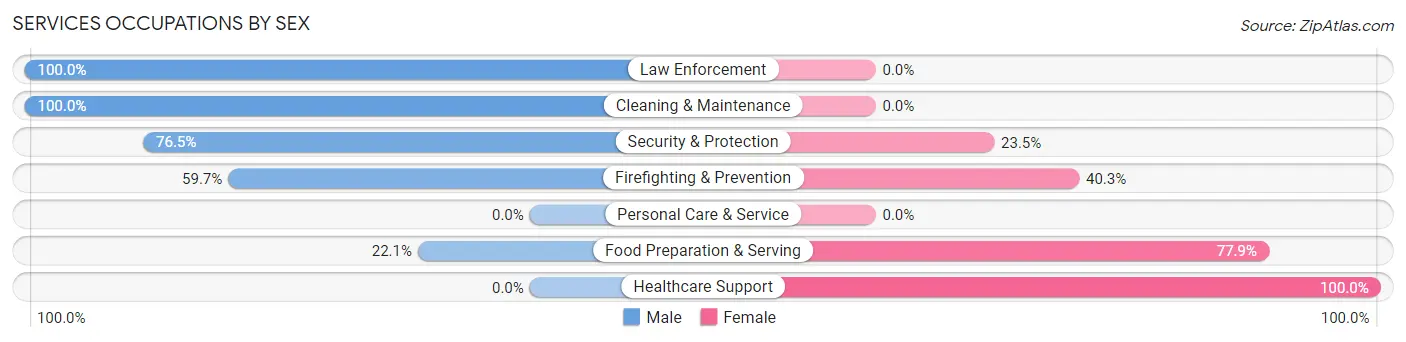
| Occupation | Male | Female |
| Healthcare Support | 0 (0.0%) | 65 (100.0%) |
| Security & Protection | 88 (76.5%) | 27 (23.5%) |
| Firefighting & Prevention | 40 (59.7%) | 27 (40.3%) |
| Law Enforcement | 48 (100.0%) | 0 (0.0%) |
| Food Preparation & Serving | 29 (22.1%) | 102 (77.9%) |
| Cleaning & Maintenance | 57 (100.0%) | 0 (0.0%) |
| Personal Care & Service | 0 (0.0%) | 0 (0.0%) |
| Total (Category) | 174 (47.3%) | 194 (52.7%) |
| Total (Overall) | 1,742 (53.0%) | 1,542 (46.9%) |
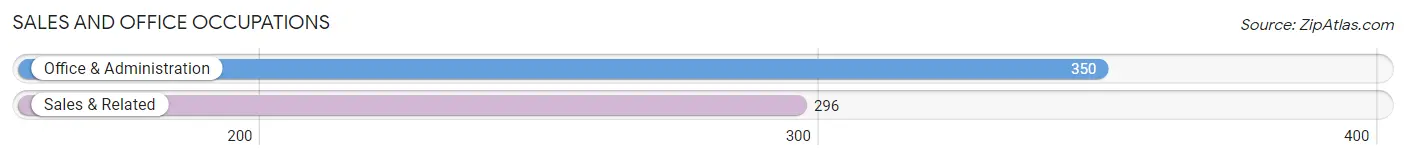
Sales and Office Occupations
The most common Sales and Office occupations in Mathews County are Office & Administration (350 | 10.7%), and Sales & Related (296 | 9.0%).
Sales and Office Occupations by Sex
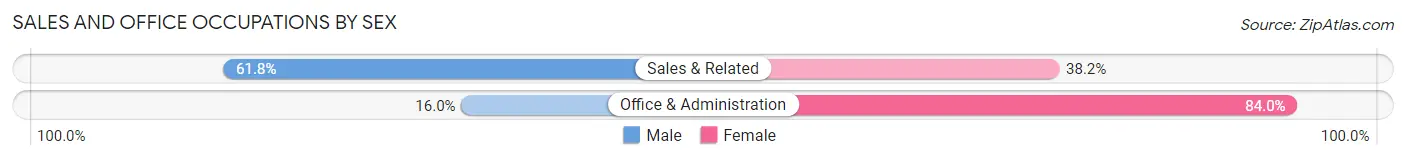
| Occupation | Male | Female |
| Sales & Related | 183 (61.8%) | 113 (38.2%) |
| Office & Administration | 56 (16.0%) | 294 (84.0%) |
| Total (Category) | 239 (37.0%) | 407 (63.0%) |
| Total (Overall) | 1,742 (53.0%) | 1,542 (46.9%) |
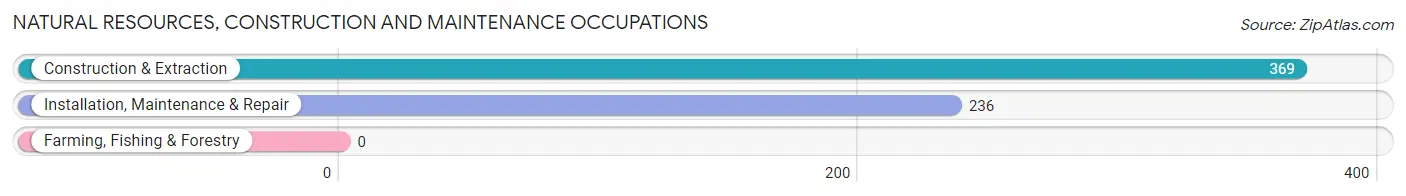
Natural Resources, Construction and Maintenance Occupations
The most common Natural Resources, Construction and Maintenance occupations in Mathews County are Construction & Extraction (369 | 11.2%), and Installation, Maintenance & Repair (236 | 7.2%).
Natural Resources, Construction and Maintenance Occupations by Sex
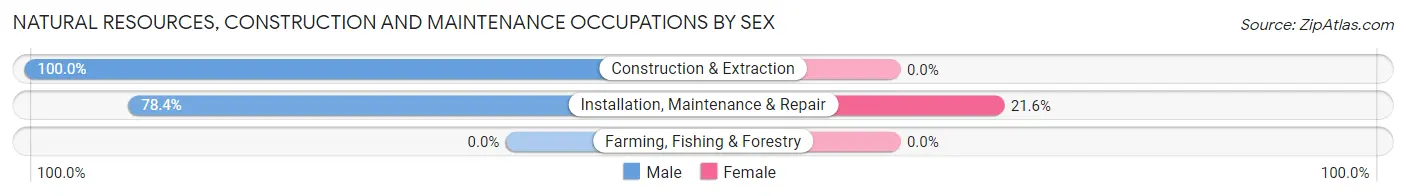
| Occupation | Male | Female |
| Farming, Fishing & Forestry | 0 (0.0%) | 0 (0.0%) |
| Construction & Extraction | 369 (100.0%) | 0 (0.0%) |
| Installation, Maintenance & Repair | 185 (78.4%) | 51 (21.6%) |
| Total (Category) | 554 (91.6%) | 51 (8.4%) |
| Total (Overall) | 1,742 (53.0%) | 1,542 (46.9%) |
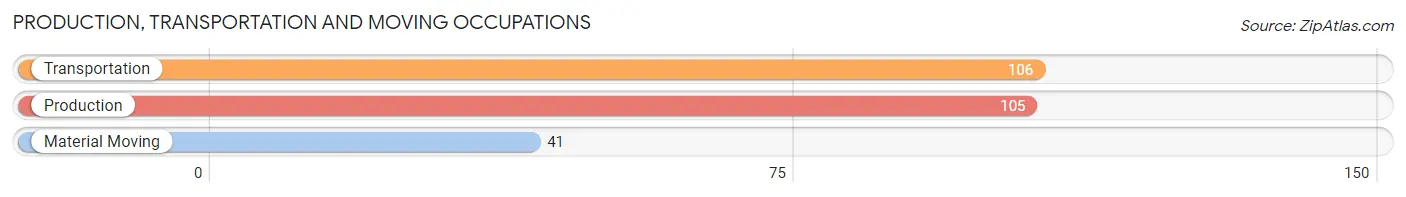
Production, Transportation and Moving Occupations
The most common Production, Transportation and Moving occupations in Mathews County are Transportation (106 | 3.2%), Production (105 | 3.2%), and Material Moving (41 | 1.3%).
Production, Transportation and Moving Occupations by Sex
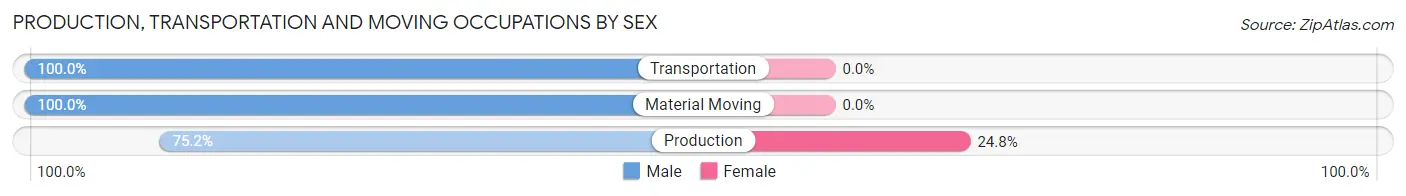
| Occupation | Male | Female |
| Production | 79 (75.2%) | 26 (24.8%) |
| Transportation | 106 (100.0%) | 0 (0.0%) |
| Material Moving | 41 (100.0%) | 0 (0.0%) |
| Total (Category) | 226 (89.7%) | 26 (10.3%) |
| Total (Overall) | 1,742 (53.0%) | 1,542 (46.9%) |
Employment Industries by Sex in Mathews County
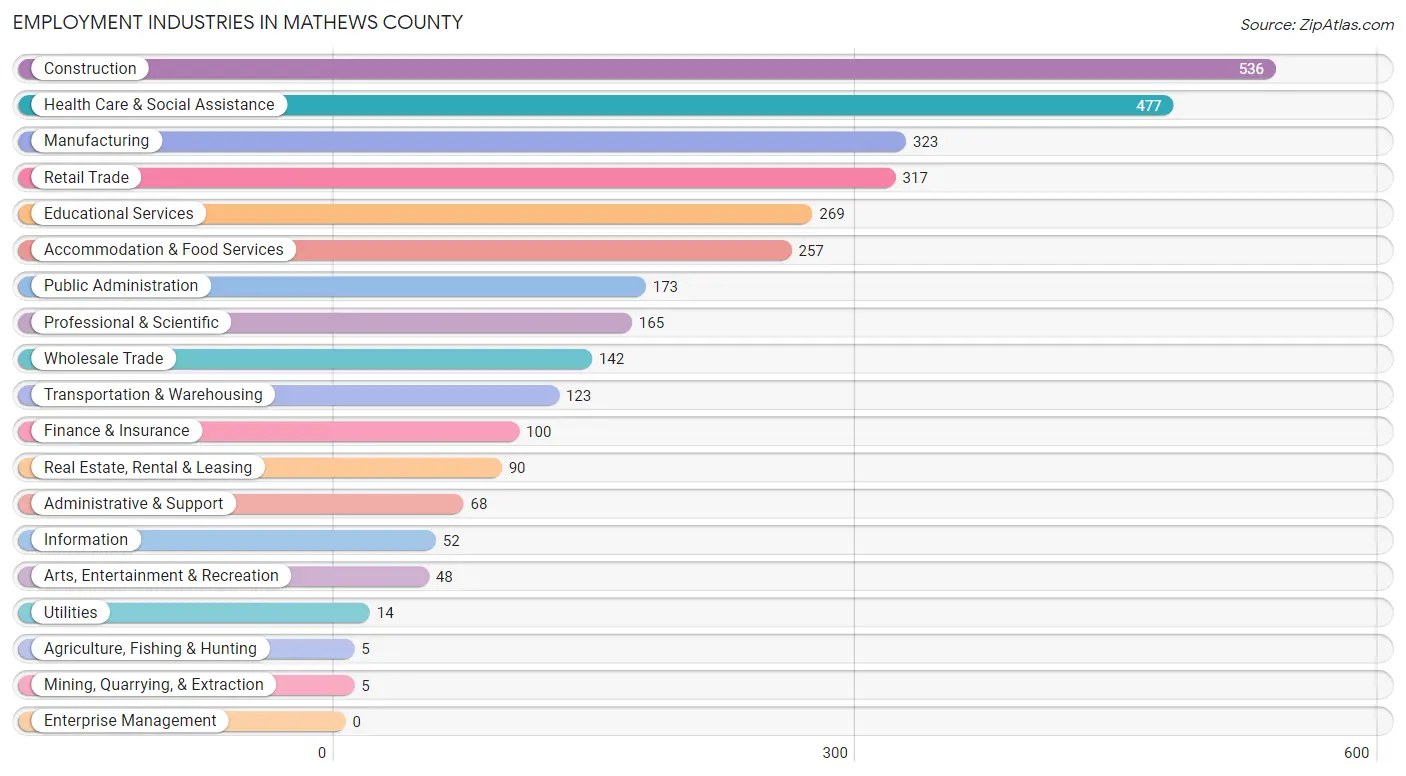
Employment Industries in Mathews County
The major employment industries in Mathews County include Construction (536 | 16.3%), Health Care & Social Assistance (477 | 14.5%), Manufacturing (323 | 9.8%), Retail Trade (317 | 9.7%), and Educational Services (269 | 8.2%).
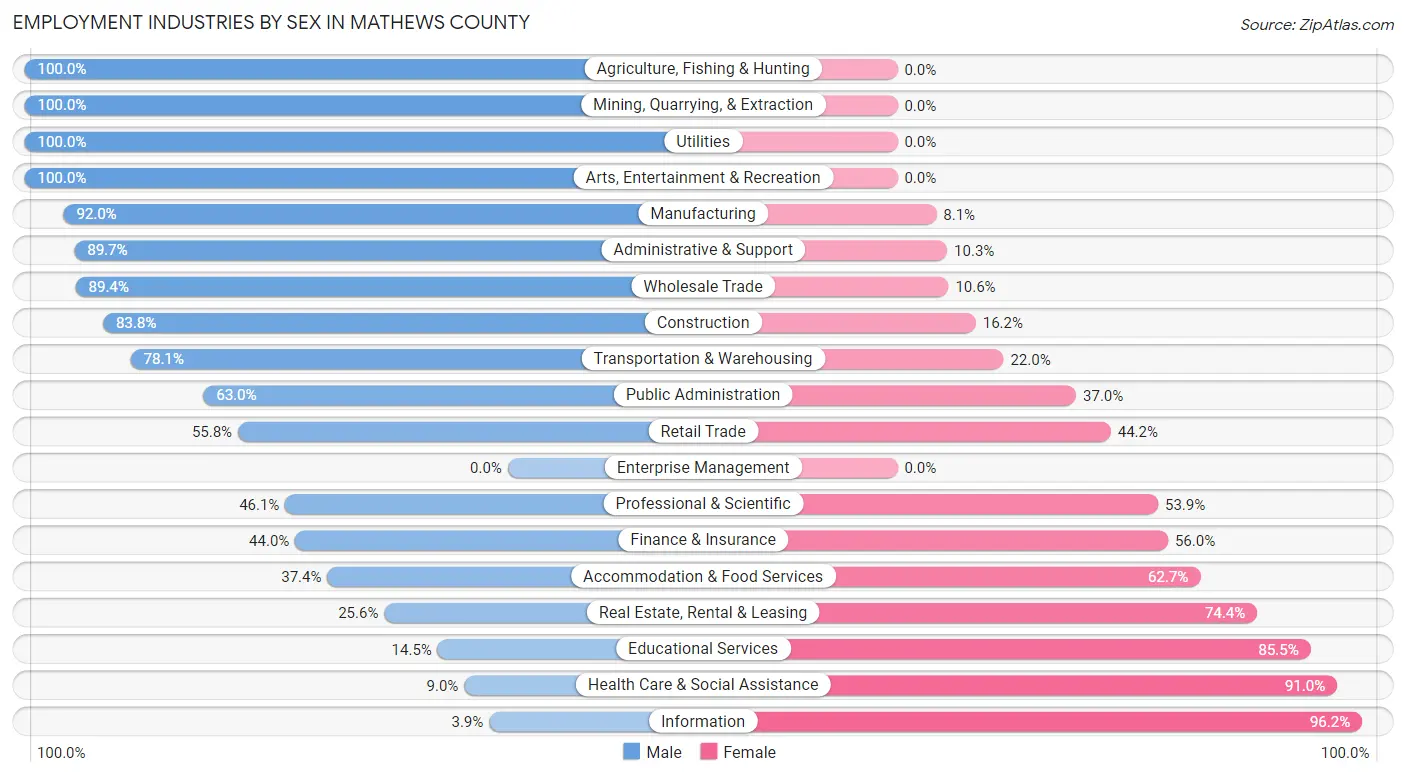
Employment Industries by Sex in Mathews County
The Mathews County industries that see more men than women are Agriculture, Fishing & Hunting (100.0%), Mining, Quarrying, & Extraction (100.0%), and Utilities (100.0%), whereas the industries that tend to have a higher number of women are Information (96.2%), Health Care & Social Assistance (91.0%), and Educational Services (85.5%).
| Industry | Male | Female |
| Agriculture, Fishing & Hunting | 5 (100.0%) | 0 (0.0%) |
| Mining, Quarrying, & Extraction | 5 (100.0%) | 0 (0.0%) |
| Construction | 449 (83.8%) | 87 (16.2%) |
| Manufacturing | 297 (91.9%) | 26 (8.1%) |
| Wholesale Trade | 127 (89.4%) | 15 (10.6%) |
| Retail Trade | 177 (55.8%) | 140 (44.2%) |
| Transportation & Warehousing | 96 (78.0%) | 27 (22.0%) |
| Utilities | 14 (100.0%) | 0 (0.0%) |
| Information | 2 (3.8%) | 50 (96.2%) |
| Finance & Insurance | 44 (44.0%) | 56 (56.0%) |
| Real Estate, Rental & Leasing | 23 (25.6%) | 67 (74.4%) |
| Professional & Scientific | 76 (46.1%) | 89 (53.9%) |
| Enterprise Management | 0 (0.0%) | 0 (0.0%) |
| Administrative & Support | 61 (89.7%) | 7 (10.3%) |
| Educational Services | 39 (14.5%) | 230 (85.5%) |
| Health Care & Social Assistance | 43 (9.0%) | 434 (91.0%) |
| Arts, Entertainment & Recreation | 48 (100.0%) | 0 (0.0%) |
| Accommodation & Food Services | 96 (37.3%) | 161 (62.6%) |
| Public Administration | 109 (63.0%) | 64 (37.0%) |
| Total | 1,742 (53.0%) | 1,542 (46.9%) |
Education in Mathews County
School Enrollment in Mathews County
The most common levels of schooling among the 1,234 students in Mathews County are high school (564 | 45.7%), elementary school (237 | 19.2%), and middle school (202 | 16.4%).
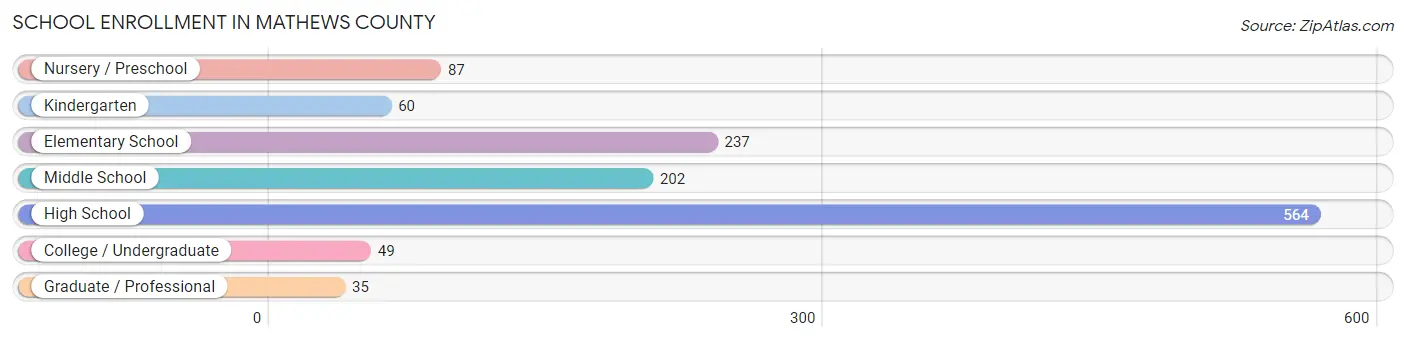
| School Level | # Students | % Students |
| Nursery / Preschool | 87 | 7.0% |
| Kindergarten | 60 | 4.9% |
| Elementary School | 237 | 19.2% |
| Middle School | 202 | 16.4% |
| High School | 564 | 45.7% |
| College / Undergraduate | 49 | 4.0% |
| Graduate / Professional | 35 | 2.8% |
| Total | 1,234 | 100.0% |
School Enrollment by Age by Funding Source in Mathews County
Out of a total of 1,234 students who are enrolled in schools in Mathews County, 292 (23.7%) attend a private institution, while the remaining 942 (76.3%) are enrolled in public schools. The age group of 3 to 4 year olds has the highest likelihood of being enrolled in private schools, with 74 (100.0% in the age bracket) enrolled. Conversely, the age group of 10 to 14 year olds has the lowest likelihood of being enrolled in a private school, with 253 (100.0% in the age bracket) attending a public institution.
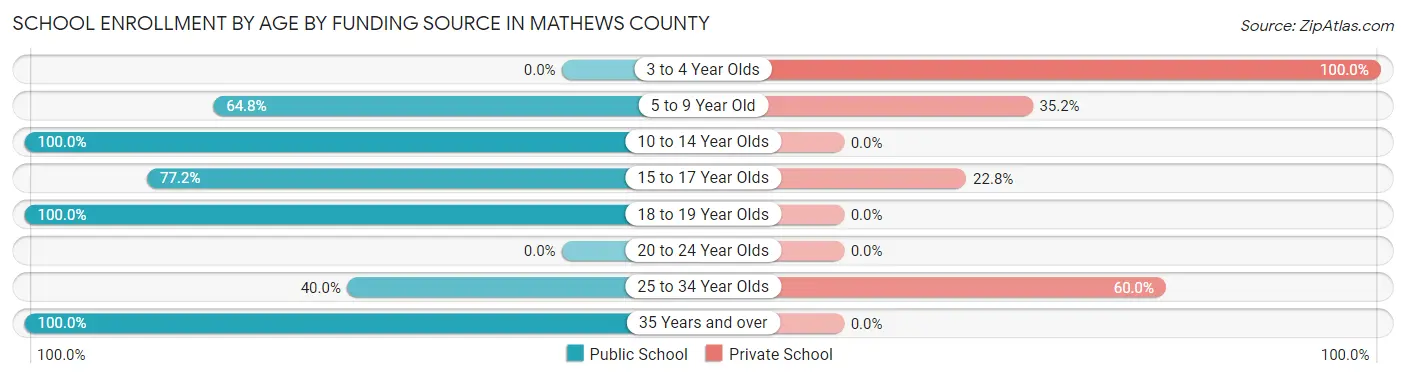
| Age Bracket | Public School | Private School |
| 3 to 4 Year Olds | 0 (0.0%) | 74 (100.0%) |
| 5 to 9 Year Old | 201 (64.8%) | 109 (35.2%) |
| 10 to 14 Year Olds | 253 (100.0%) | 0 (0.0%) |
| 15 to 17 Year Olds | 308 (77.2%) | 91 (22.8%) |
| 18 to 19 Year Olds | 133 (100.0%) | 0 (0.0%) |
| 20 to 24 Year Olds | 0 (0.0%) | 0 (0.0%) |
| 25 to 34 Year Olds | 12 (40.0%) | 18 (60.0%) |
| 35 Years and over | 35 (100.0%) | 0 (0.0%) |
| Total | 942 (76.3%) | 292 (23.7%) |
Educational Attainment by Field of Study in Mathews County
Education (373 | 17.5%), business (366 | 17.2%), social sciences (271 | 12.7%), science & technology (221 | 10.4%), and engineering (165 | 7.7%) are the most common fields of study among 2,133 individuals in Mathews County who have obtained a bachelor's degree or higher.
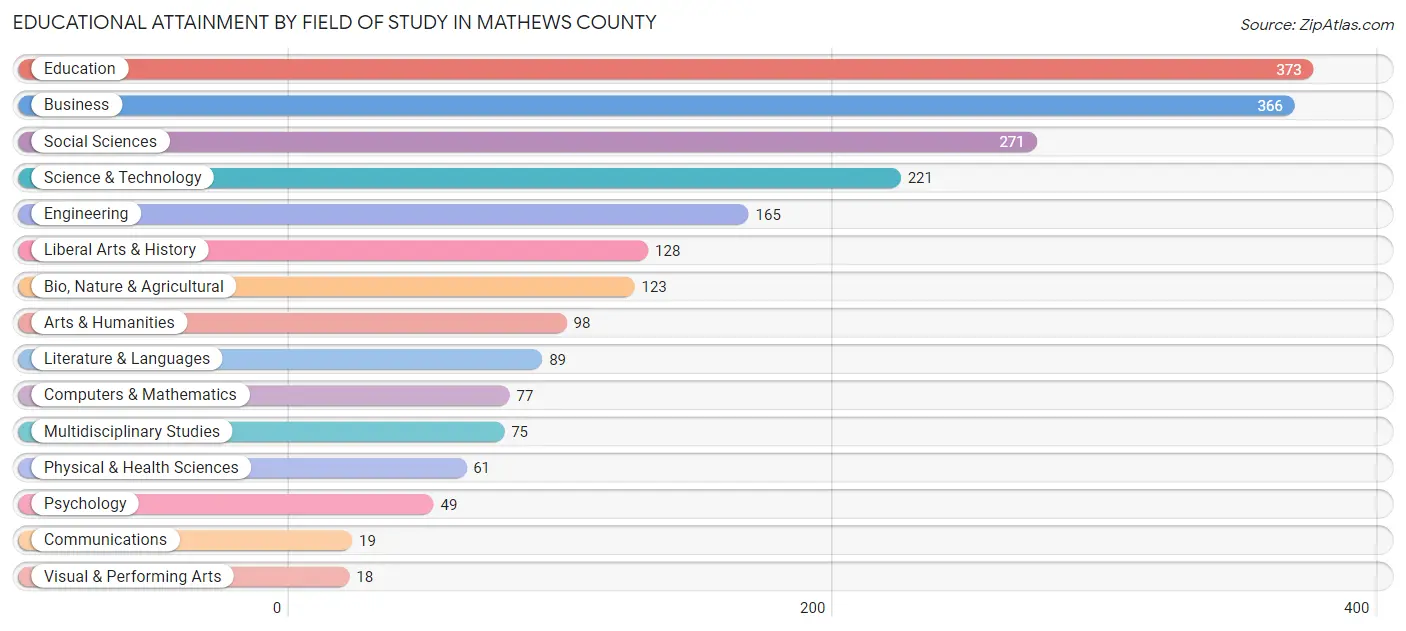
| Field of Study | # Graduates | % Graduates |
| Computers & Mathematics | 77 | 3.6% |
| Bio, Nature & Agricultural | 123 | 5.8% |
| Physical & Health Sciences | 61 | 2.9% |
| Psychology | 49 | 2.3% |
| Social Sciences | 271 | 12.7% |
| Engineering | 165 | 7.7% |
| Multidisciplinary Studies | 75 | 3.5% |
| Science & Technology | 221 | 10.4% |
| Business | 366 | 17.2% |
| Education | 373 | 17.5% |
| Literature & Languages | 89 | 4.2% |
| Liberal Arts & History | 128 | 6.0% |
| Visual & Performing Arts | 18 | 0.8% |
| Communications | 19 | 0.9% |
| Arts & Humanities | 98 | 4.6% |
| Total | 2,133 | 100.0% |
Transportation & Commute in Mathews County
Vehicle Availability by Sex in Mathews County
The most prevalent vehicle ownership categories in Mathews County are males with 3 vehicles (547, accounting for 33.6%) and females with 3 vehicles (430, making up 36.0%).
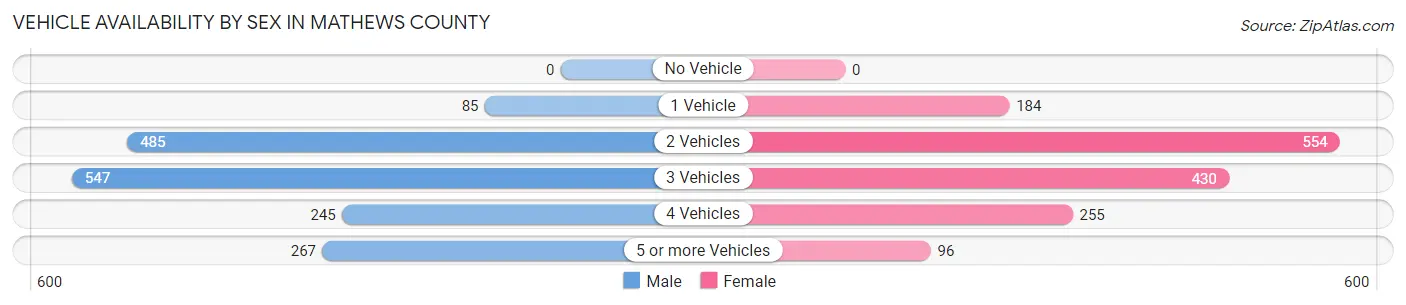
| Vehicles Available | Male | Female |
| No Vehicle | 0 (0.0%) | 0 (0.0%) |
| 1 Vehicle | 85 (5.2%) | 184 (12.1%) |
| 2 Vehicles | 485 (29.8%) | 554 (36.5%) |
| 3 Vehicles | 547 (33.6%) | 430 (28.3%) |
| 4 Vehicles | 245 (15.0%) | 255 (16.8%) |
| 5 or more Vehicles | 267 (16.4%) | 96 (6.3%) |
| Total | 1,629 (100.0%) | 1,519 (100.0%) |
Commute Time in Mathews County
The most frequently occuring commute durations in Mathews County are 60 to 89 minutes (726 commuters, 26.8%), 30 to 34 minutes (480 commuters, 17.7%), and 15 to 19 minutes (265 commuters, 9.8%).
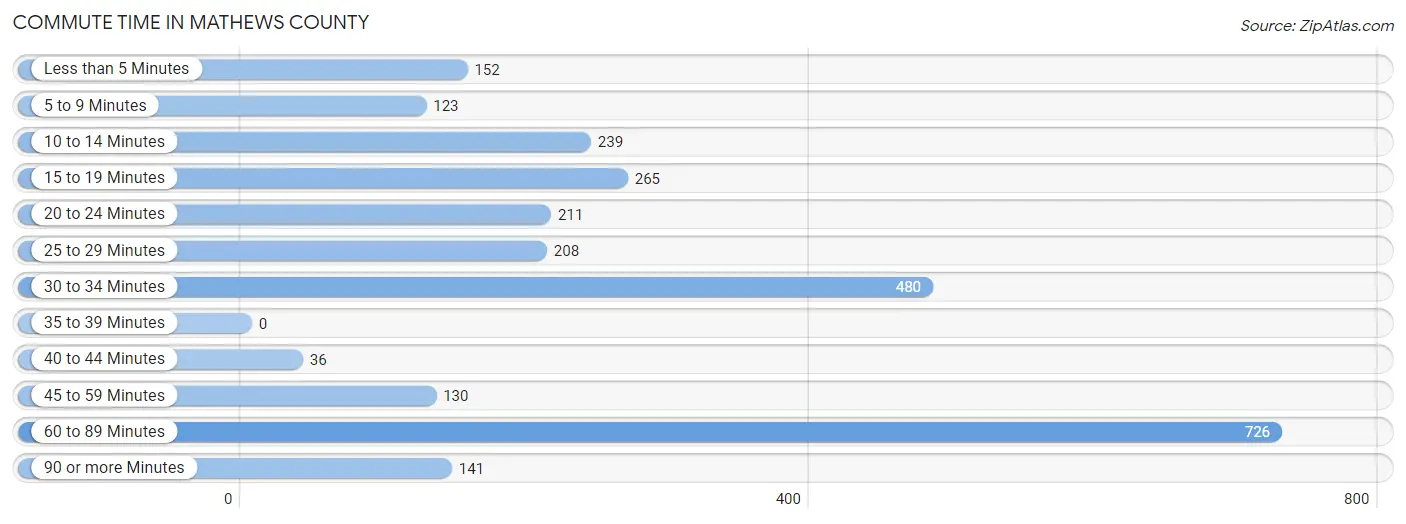
| Commute Time | # Commuters | % Commuters |
| Less than 5 Minutes | 152 | 5.6% |
| 5 to 9 Minutes | 123 | 4.5% |
| 10 to 14 Minutes | 239 | 8.8% |
| 15 to 19 Minutes | 265 | 9.8% |
| 20 to 24 Minutes | 211 | 7.8% |
| 25 to 29 Minutes | 208 | 7.7% |
| 30 to 34 Minutes | 480 | 17.7% |
| 35 to 39 Minutes | 0 | 0.0% |
| 40 to 44 Minutes | 36 | 1.3% |
| 45 to 59 Minutes | 130 | 4.8% |
| 60 to 89 Minutes | 726 | 26.8% |
| 90 or more Minutes | 141 | 5.2% |
Commute Time by Sex in Mathews County
The most common commute times in Mathews County are 60 to 89 minutes (445 commuters, 30.1%) for males and 60 to 89 minutes (281 commuters, 22.8%) for females.
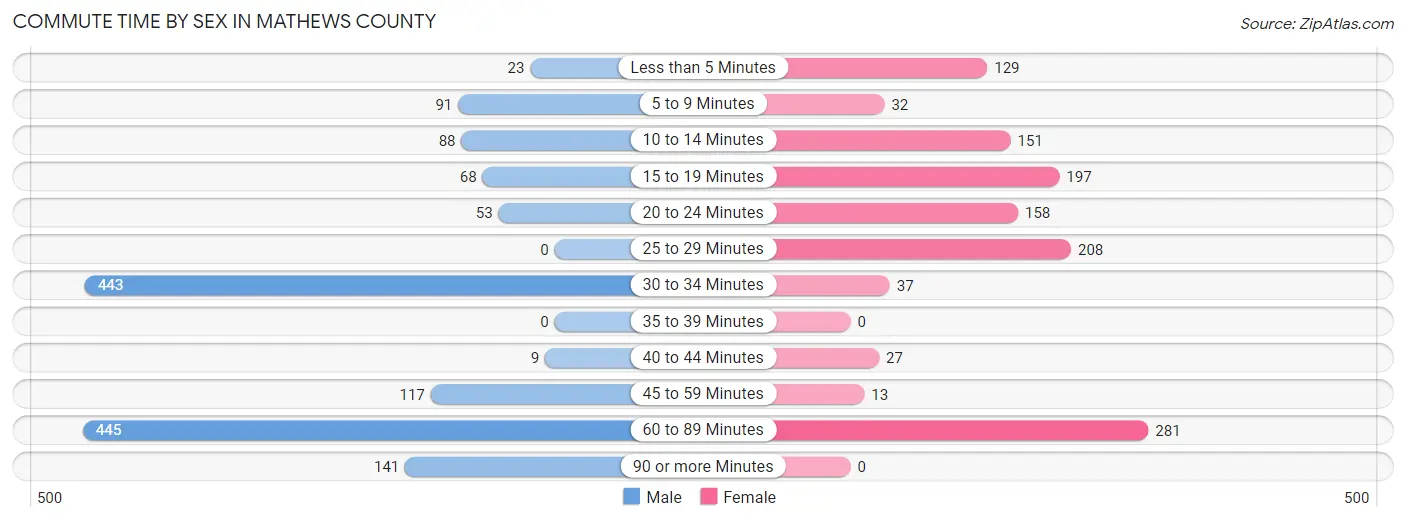
| Commute Time | Male | Female |
| Less than 5 Minutes | 23 (1.6%) | 129 (10.5%) |
| 5 to 9 Minutes | 91 (6.2%) | 32 (2.6%) |
| 10 to 14 Minutes | 88 (5.9%) | 151 (12.2%) |
| 15 to 19 Minutes | 68 (4.6%) | 197 (16.0%) |
| 20 to 24 Minutes | 53 (3.6%) | 158 (12.8%) |
| 25 to 29 Minutes | 0 (0.0%) | 208 (16.9%) |
| 30 to 34 Minutes | 443 (30.0%) | 37 (3.0%) |
| 35 to 39 Minutes | 0 (0.0%) | 0 (0.0%) |
| 40 to 44 Minutes | 9 (0.6%) | 27 (2.2%) |
| 45 to 59 Minutes | 117 (7.9%) | 13 (1.1%) |
| 60 to 89 Minutes | 445 (30.1%) | 281 (22.8%) |
| 90 or more Minutes | 141 (9.5%) | 0 (0.0%) |
Time of Departure to Work by Sex in Mathews County
The most frequent times of departure to work in Mathews County are 6:00 AM to 6:29 AM (352, 23.8%) for males and 7:30 AM to 7:59 AM (252, 20.4%) for females.
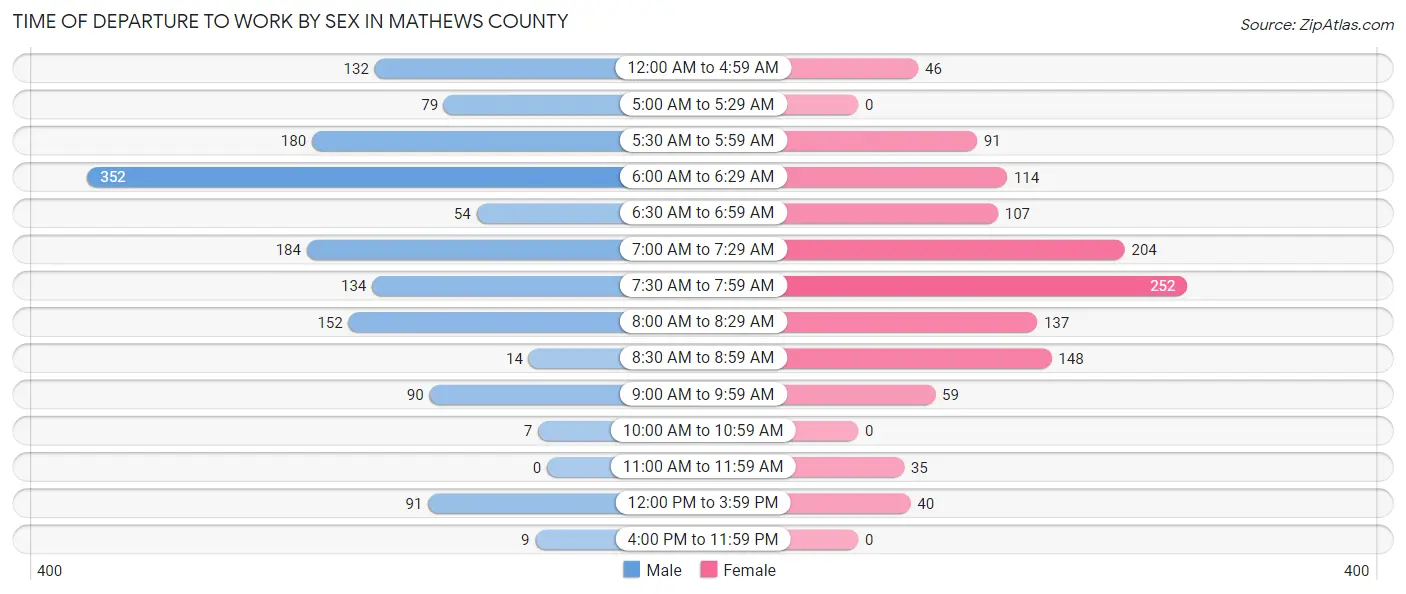
| Time of Departure | Male | Female |
| 12:00 AM to 4:59 AM | 132 (8.9%) | 46 (3.7%) |
| 5:00 AM to 5:29 AM | 79 (5.3%) | 0 (0.0%) |
| 5:30 AM to 5:59 AM | 180 (12.2%) | 91 (7.4%) |
| 6:00 AM to 6:29 AM | 352 (23.8%) | 114 (9.2%) |
| 6:30 AM to 6:59 AM | 54 (3.6%) | 107 (8.7%) |
| 7:00 AM to 7:29 AM | 184 (12.4%) | 204 (16.6%) |
| 7:30 AM to 7:59 AM | 134 (9.1%) | 252 (20.4%) |
| 8:00 AM to 8:29 AM | 152 (10.3%) | 137 (11.1%) |
| 8:30 AM to 8:59 AM | 14 (0.9%) | 148 (12.0%) |
| 9:00 AM to 9:59 AM | 90 (6.1%) | 59 (4.8%) |
| 10:00 AM to 10:59 AM | 7 (0.5%) | 0 (0.0%) |
| 11:00 AM to 11:59 AM | 0 (0.0%) | 35 (2.8%) |
| 12:00 PM to 3:59 PM | 91 (6.2%) | 40 (3.2%) |
| 4:00 PM to 11:59 PM | 9 (0.6%) | 0 (0.0%) |
| Total | 1,478 (100.0%) | 1,233 (100.0%) |
Housing Occupancy in Mathews County
Occupancy by Ownership in Mathews County
Of the total 3,742 dwellings in Mathews County, owner-occupied units account for 3,137 (83.8%), while renter-occupied units make up 605 (16.2%).
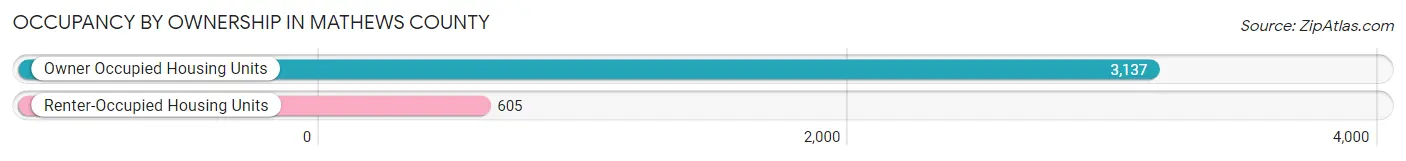
| Occupancy | # Housing Units | % Housing Units |
| Owner Occupied Housing Units | 3,137 | 83.8% |
| Renter-Occupied Housing Units | 605 | 16.2% |
| Total Occupied Housing Units | 3,742 | 100.0% |
Occupancy by Household Size in Mathews County
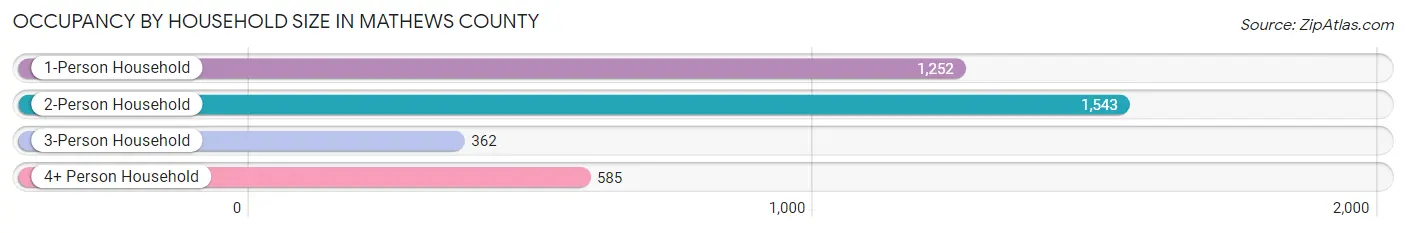
| Household Size | # Housing Units | % Housing Units |
| 1-Person Household | 1,252 | 33.5% |
| 2-Person Household | 1,543 | 41.2% |
| 3-Person Household | 362 | 9.7% |
| 4+ Person Household | 585 | 15.6% |
| Total Housing Units | 3,742 | 100.0% |
Occupancy by Ownership by Household Size in Mathews County
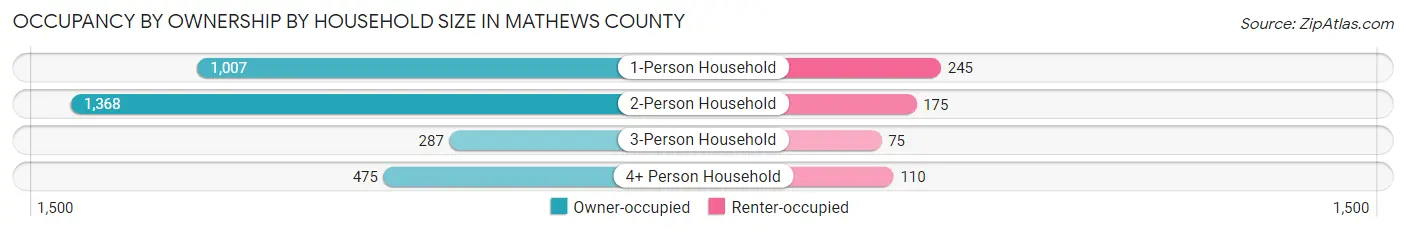
| Household Size | Owner-occupied | Renter-occupied |
| 1-Person Household | 1,007 (80.4%) | 245 (19.6%) |
| 2-Person Household | 1,368 (88.7%) | 175 (11.3%) |
| 3-Person Household | 287 (79.3%) | 75 (20.7%) |
| 4+ Person Household | 475 (81.2%) | 110 (18.8%) |
| Total Housing Units | 3,137 (83.8%) | 605 (16.2%) |
Occupancy by Educational Attainment in Mathews County
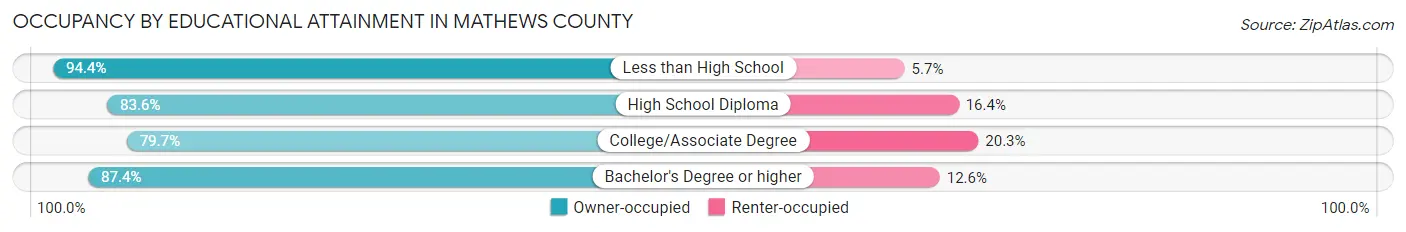
| Household Size | Owner-occupied | Renter-occupied |
| Less than High School | 167 (94.4%) | 10 (5.7%) |
| High School Diploma | 1,001 (83.6%) | 196 (16.4%) |
| College/Associate Degree | 1,047 (79.7%) | 266 (20.3%) |
| Bachelor's Degree or higher | 922 (87.4%) | 133 (12.6%) |
Occupancy by Age of Householder in Mathews County
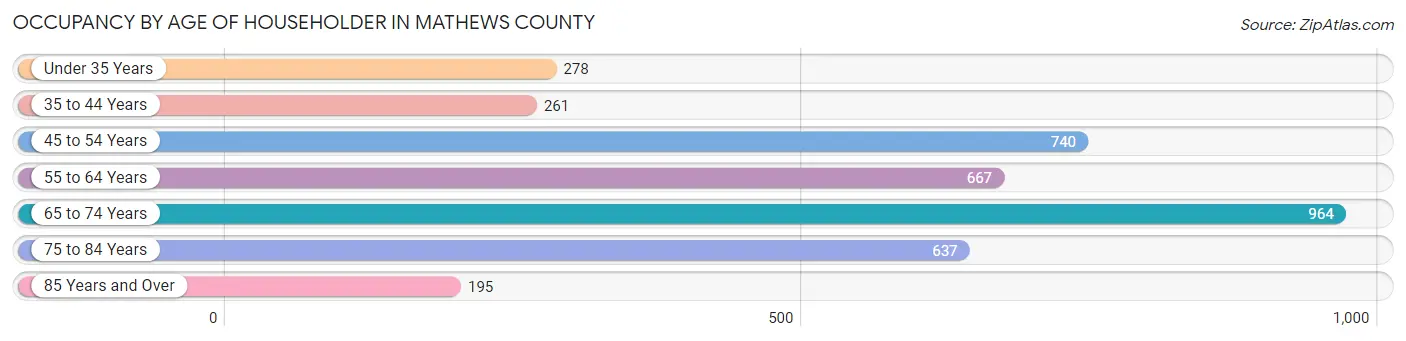
| Age Bracket | # Households | % Households |
| Under 35 Years | 278 | 7.4% |
| 35 to 44 Years | 261 | 7.0% |
| 45 to 54 Years | 740 | 19.8% |
| 55 to 64 Years | 667 | 17.8% |
| 65 to 74 Years | 964 | 25.8% |
| 75 to 84 Years | 637 | 17.0% |
| 85 Years and Over | 195 | 5.2% |
| Total | 3,742 | 100.0% |
Housing Finances in Mathews County
Median Income by Occupancy in Mathews County
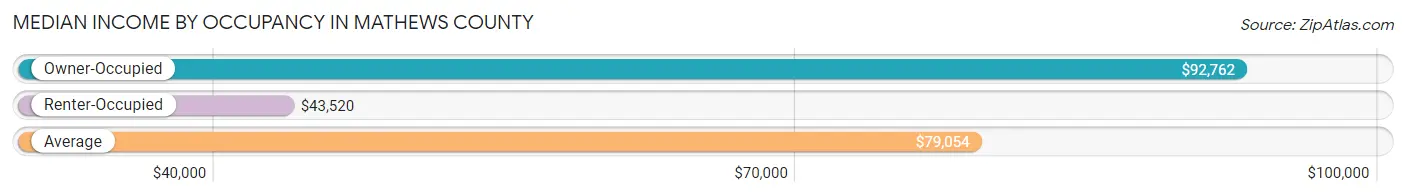
| Occupancy Type | # Households | Median Income |
| Owner-Occupied | 3,137 (83.8%) | $92,762 |
| Renter-Occupied | 605 (16.2%) | $43,520 |
| Average | 3,742 (100.0%) | $79,054 |
Occupancy by Householder Income Bracket in Mathews County
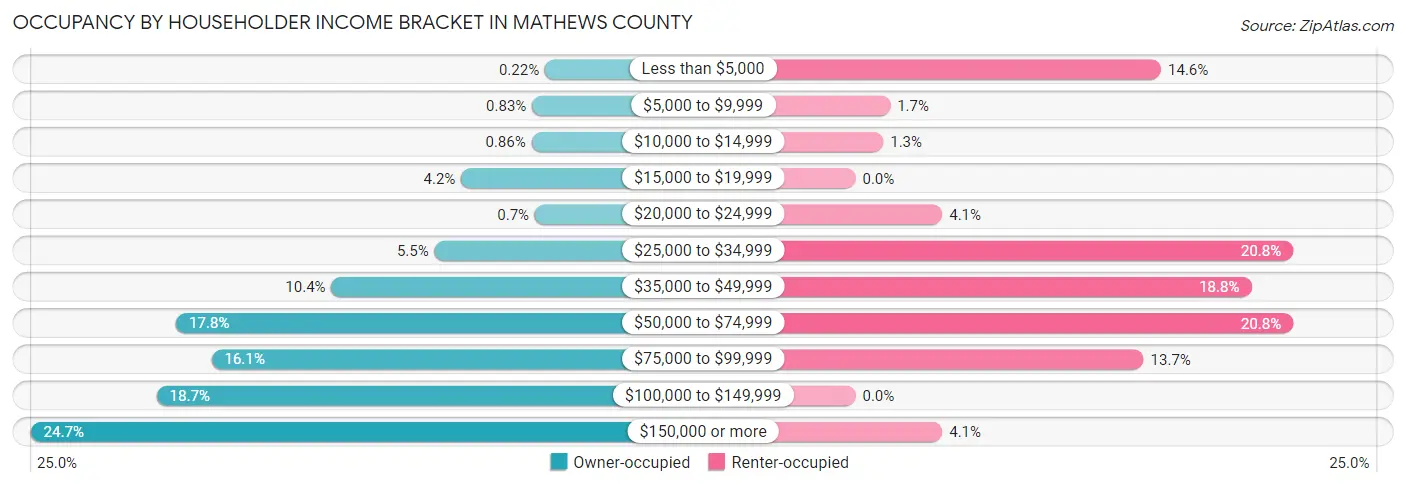
| Income Bracket | Owner-occupied | Renter-occupied |
| Less than $5,000 | 7 (0.2%) | 88 (14.5%) |
| $5,000 to $9,999 | 26 (0.8%) | 10 (1.7%) |
| $10,000 to $14,999 | 27 (0.9%) | 8 (1.3%) |
| $15,000 to $19,999 | 132 (4.2%) | 0 (0.0%) |
| $20,000 to $24,999 | 22 (0.7%) | 25 (4.1%) |
| $25,000 to $34,999 | 172 (5.5%) | 126 (20.8%) |
| $35,000 to $49,999 | 326 (10.4%) | 114 (18.8%) |
| $50,000 to $74,999 | 558 (17.8%) | 126 (20.8%) |
| $75,000 to $99,999 | 505 (16.1%) | 83 (13.7%) |
| $100,000 to $149,999 | 587 (18.7%) | 0 (0.0%) |
| $150,000 or more | 775 (24.7%) | 25 (4.1%) |
| Total | 3,137 (100.0%) | 605 (100.0%) |
Monthly Housing Cost Tiers in Mathews County
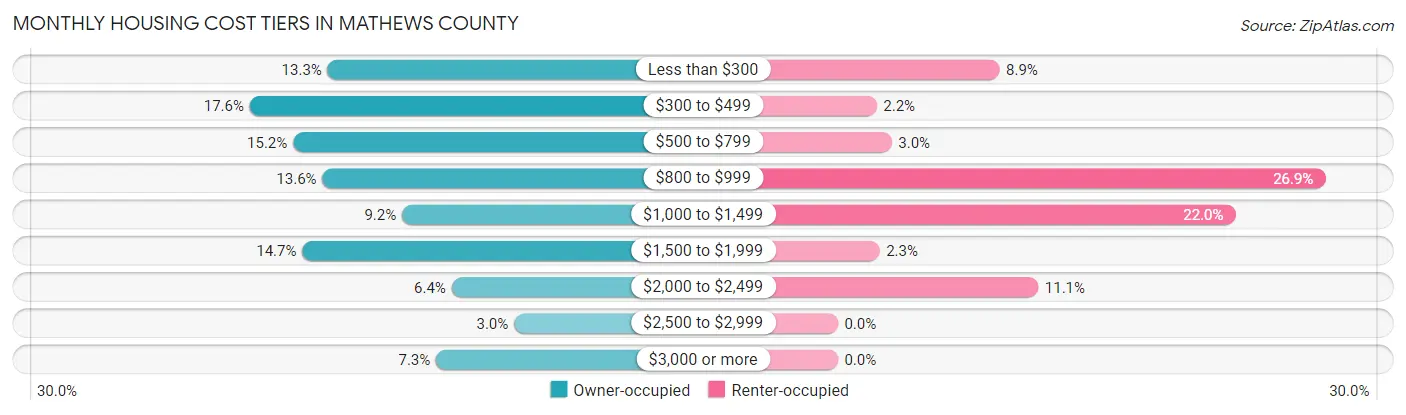
| Monthly Cost | Owner-occupied | Renter-occupied |
| Less than $300 | 416 (13.3%) | 54 (8.9%) |
| $300 to $499 | 551 (17.6%) | 13 (2.1%) |
| $500 to $799 | 476 (15.2%) | 18 (3.0%) |
| $800 to $999 | 425 (13.6%) | 163 (26.9%) |
| $1,000 to $1,499 | 287 (9.1%) | 133 (22.0%) |
| $1,500 to $1,999 | 460 (14.7%) | 14 (2.3%) |
| $2,000 to $2,499 | 201 (6.4%) | 67 (11.1%) |
| $2,500 to $2,999 | 93 (3.0%) | 0 (0.0%) |
| $3,000 or more | 228 (7.3%) | 0 (0.0%) |
| Total | 3,137 (100.0%) | 605 (100.0%) |
Physical Housing Characteristics in Mathews County
Housing Structures in Mathews County
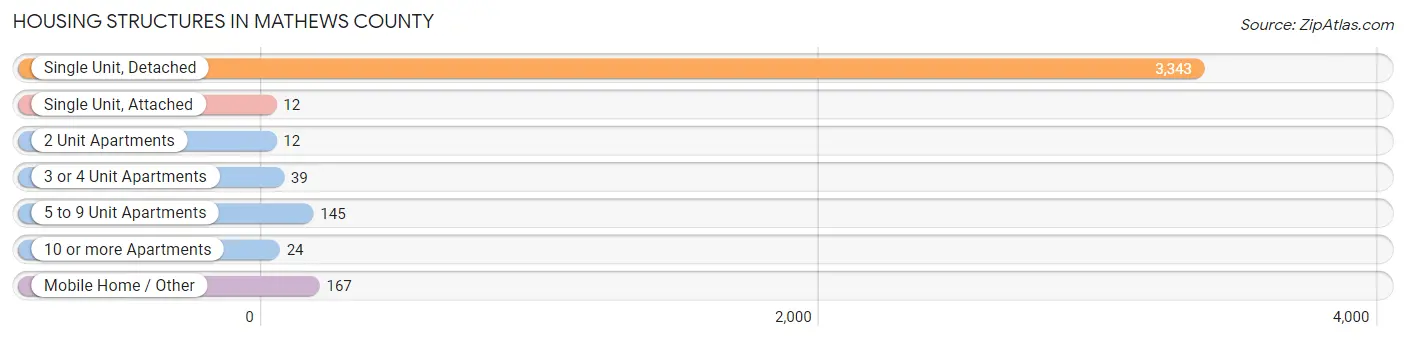
| Structure Type | # Housing Units | % Housing Units |
| Single Unit, Detached | 3,343 | 89.3% |
| Single Unit, Attached | 12 | 0.3% |
| 2 Unit Apartments | 12 | 0.3% |
| 3 or 4 Unit Apartments | 39 | 1.0% |
| 5 to 9 Unit Apartments | 145 | 3.9% |
| 10 or more Apartments | 24 | 0.6% |
| Mobile Home / Other | 167 | 4.5% |
| Total | 3,742 | 100.0% |
Housing Structures by Occupancy in Mathews County
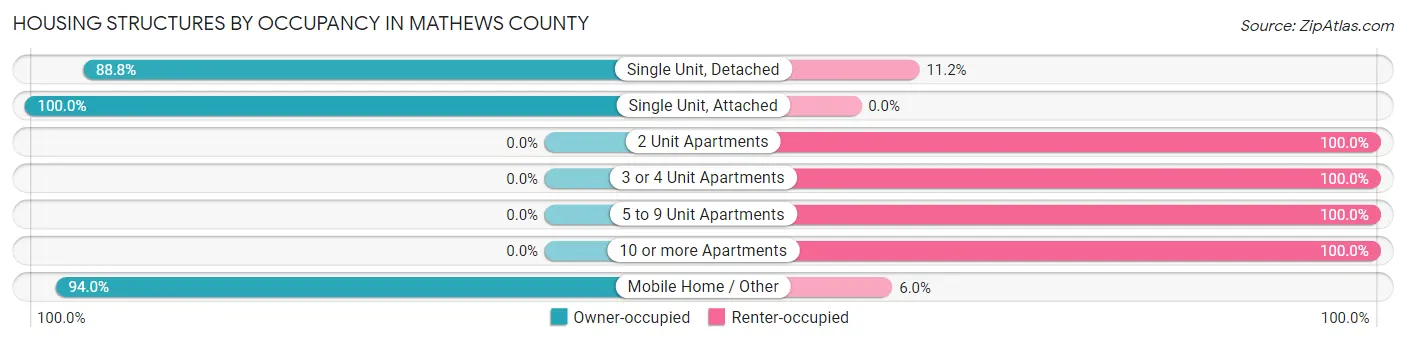
| Structure Type | Owner-occupied | Renter-occupied |
| Single Unit, Detached | 2,968 (88.8%) | 375 (11.2%) |
| Single Unit, Attached | 12 (100.0%) | 0 (0.0%) |
| 2 Unit Apartments | 0 (0.0%) | 12 (100.0%) |
| 3 or 4 Unit Apartments | 0 (0.0%) | 39 (100.0%) |
| 5 to 9 Unit Apartments | 0 (0.0%) | 145 (100.0%) |
| 10 or more Apartments | 0 (0.0%) | 24 (100.0%) |
| Mobile Home / Other | 157 (94.0%) | 10 (6.0%) |
| Total | 3,137 (83.8%) | 605 (16.2%) |
Housing Structures by Number of Rooms in Mathews County
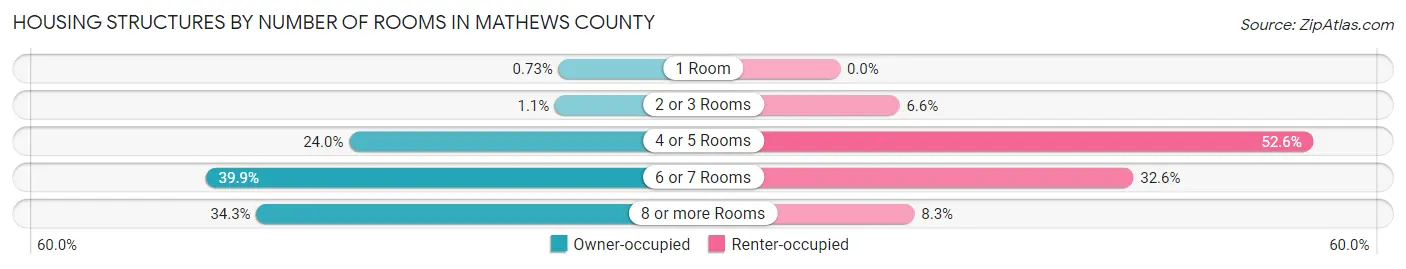
| Number of Rooms | Owner-occupied | Renter-occupied |
| 1 Room | 23 (0.7%) | 0 (0.0%) |
| 2 or 3 Rooms | 35 (1.1%) | 40 (6.6%) |
| 4 or 5 Rooms | 752 (24.0%) | 318 (52.6%) |
| 6 or 7 Rooms | 1,252 (39.9%) | 197 (32.6%) |
| 8 or more Rooms | 1,075 (34.3%) | 50 (8.3%) |
| Total | 3,137 (100.0%) | 605 (100.0%) |
Housing Structure by Heating Type in Mathews County
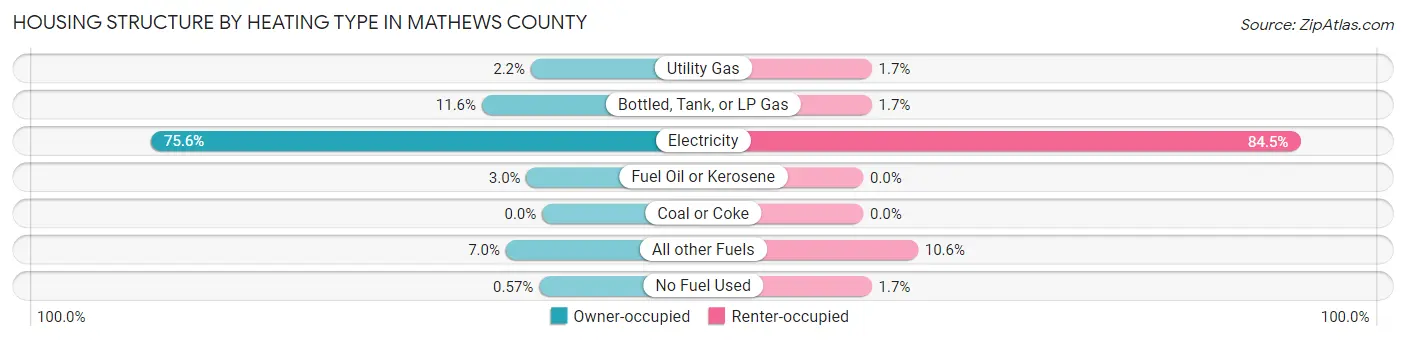
| Heating Type | Owner-occupied | Renter-occupied |
| Utility Gas | 68 (2.2%) | 10 (1.7%) |
| Bottled, Tank, or LP Gas | 365 (11.6%) | 10 (1.7%) |
| Electricity | 2,371 (75.6%) | 511 (84.5%) |
| Fuel Oil or Kerosene | 95 (3.0%) | 0 (0.0%) |
| Coal or Coke | 0 (0.0%) | 0 (0.0%) |
| All other Fuels | 220 (7.0%) | 64 (10.6%) |
| No Fuel Used | 18 (0.6%) | 10 (1.7%) |
| Total | 3,137 (100.0%) | 605 (100.0%) |
Household Vehicle Usage in Mathews County
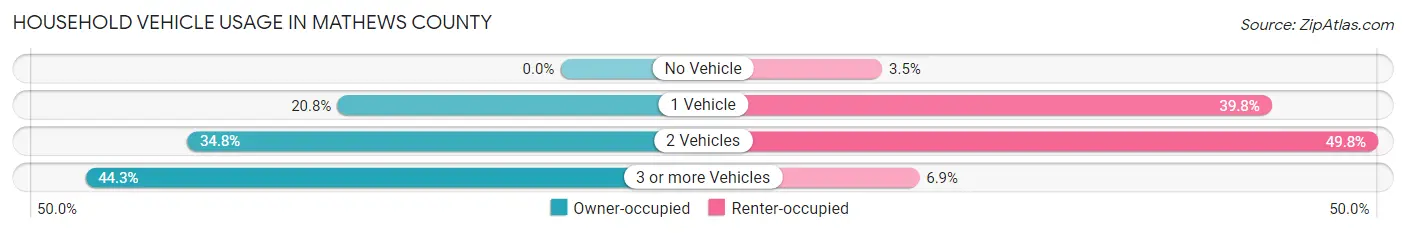
| Vehicles per Household | Owner-occupied | Renter-occupied |
| No Vehicle | 0 (0.0%) | 21 (3.5%) |
| 1 Vehicle | 653 (20.8%) | 241 (39.8%) |
| 2 Vehicles | 1,093 (34.8%) | 301 (49.7%) |
| 3 or more Vehicles | 1,391 (44.3%) | 42 (6.9%) |
| Total | 3,137 (100.0%) | 605 (100.0%) |
Real Estate & Mortgages in Mathews County
Real Estate and Mortgage Overview in Mathews County
| Characteristic | Without Mortgage | With Mortgage |
| Housing Units | 1,727 | 1,410 |
| Median Property Value | $360,900 | $348,300 |
| Median Household Income | $66,596 | $509 |
| Monthly Housing Costs | $465 | $228 |
| Real Estate Taxes | $1,809 | $5 |
Property Value by Mortgage Status in Mathews County
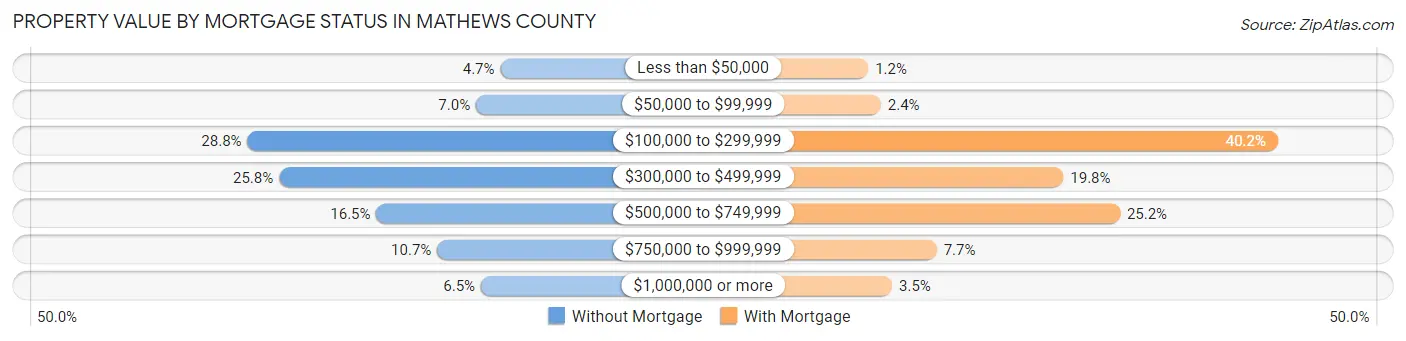
| Property Value | Without Mortgage | With Mortgage |
| Less than $50,000 | 81 (4.7%) | 17 (1.2%) |
| $50,000 to $99,999 | 121 (7.0%) | 34 (2.4%) |
| $100,000 to $299,999 | 497 (28.8%) | 567 (40.2%) |
| $300,000 to $499,999 | 445 (25.8%) | 279 (19.8%) |
| $500,000 to $749,999 | 285 (16.5%) | 355 (25.2%) |
| $750,000 to $999,999 | 185 (10.7%) | 109 (7.7%) |
| $1,000,000 or more | 113 (6.5%) | 49 (3.5%) |
| Total | 1,727 (100.0%) | 1,410 (100.0%) |
Household Income by Mortgage Status in Mathews County
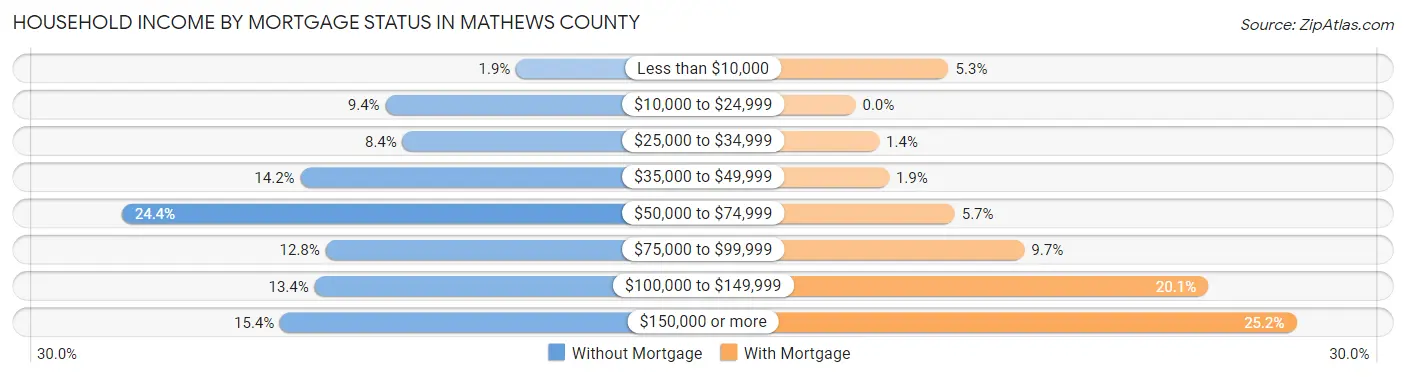
| Household Income | Without Mortgage | With Mortgage |
| Less than $10,000 | 33 (1.9%) | 75 (5.3%) |
| $10,000 to $24,999 | 162 (9.4%) | 0 (0.0%) |
| $25,000 to $34,999 | 145 (8.4%) | 19 (1.3%) |
| $35,000 to $49,999 | 246 (14.2%) | 27 (1.9%) |
| $50,000 to $74,999 | 422 (24.4%) | 80 (5.7%) |
| $75,000 to $99,999 | 221 (12.8%) | 136 (9.7%) |
| $100,000 to $149,999 | 232 (13.4%) | 284 (20.1%) |
| $150,000 or more | 266 (15.4%) | 355 (25.2%) |
| Total | 1,727 (100.0%) | 1,410 (100.0%) |
Property Value to Household Income Ratio in Mathews County
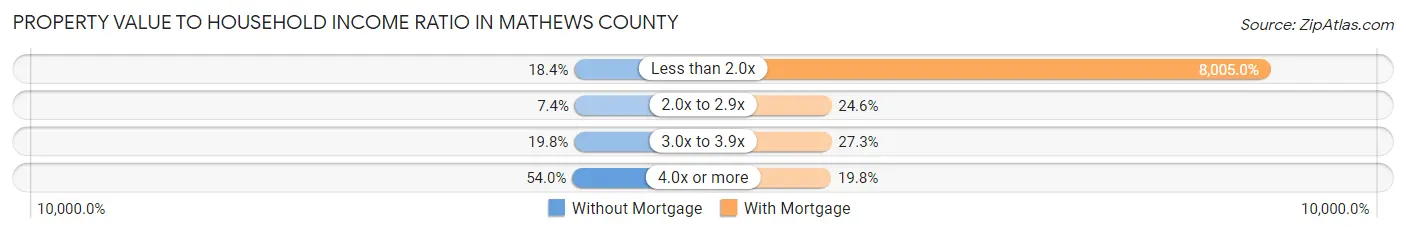
| Value-to-Income Ratio | Without Mortgage | With Mortgage |
| Less than 2.0x | 318 (18.4%) | 112,870 (8,005.0%) |
| 2.0x to 2.9x | 128 (7.4%) | 347 (24.6%) |
| 3.0x to 3.9x | 341 (19.8%) | 385 (27.3%) |
| 4.0x or more | 933 (54.0%) | 279 (19.8%) |
| Total | 1,727 (100.0%) | 1,410 (100.0%) |
Real Estate Taxes by Mortgage Status in Mathews County
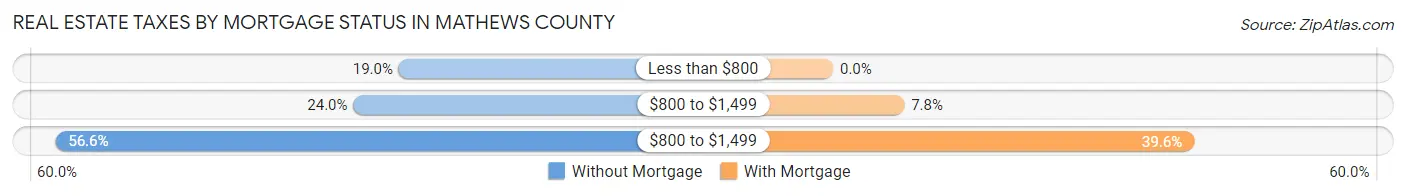
| Property Taxes | Without Mortgage | With Mortgage |
| Less than $800 | 328 (19.0%) | 0 (0.0%) |
| $800 to $1,499 | 414 (24.0%) | 110 (7.8%) |
| $800 to $1,499 | 978 (56.6%) | 558 (39.6%) |
| Total | 1,727 (100.0%) | 1,410 (100.0%) |
Health & Disability in Mathews County
Health Insurance Coverage by Age in Mathews County
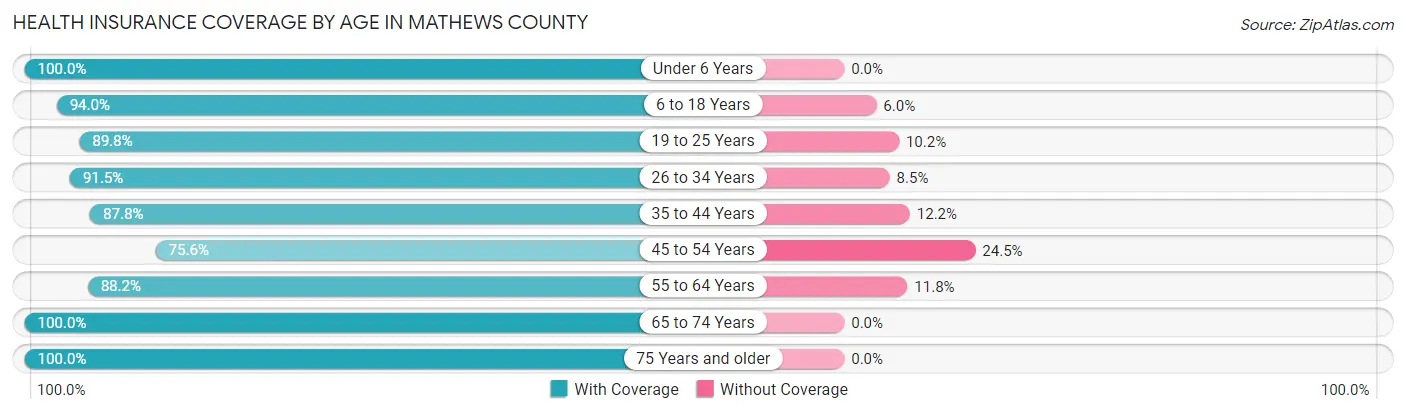
| Age Bracket | With Coverage | Without Coverage |
| Under 6 Years | 386 (100.0%) | 0 (0.0%) |
| 6 to 18 Years | 958 (94.0%) | 61 (6.0%) |
| 19 to 25 Years | 590 (89.8%) | 67 (10.2%) |
| 26 to 34 Years | 368 (91.5%) | 34 (8.5%) |
| 35 to 44 Years | 639 (87.8%) | 89 (12.2%) |
| 45 to 54 Years | 887 (75.5%) | 287 (24.4%) |
| 55 to 64 Years | 1,312 (88.2%) | 175 (11.8%) |
| 65 to 74 Years | 1,369 (100.0%) | 0 (0.0%) |
| 75 Years and older | 1,220 (100.0%) | 0 (0.0%) |
| Total | 7,729 (91.5%) | 713 (8.5%) |
Health Insurance Coverage by Citizenship Status in Mathews County
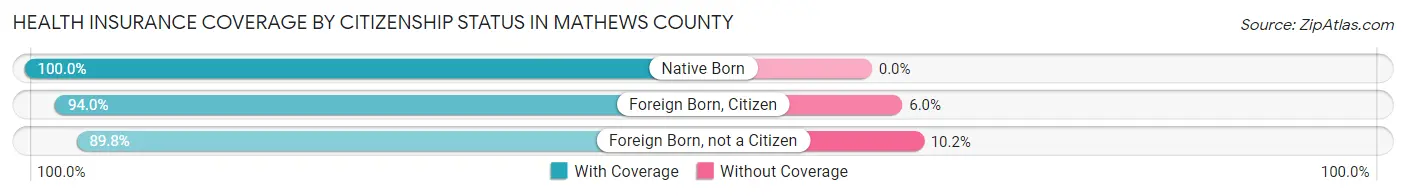
| Citizenship Status | With Coverage | Without Coverage |
| Native Born | 386 (100.0%) | 0 (0.0%) |
| Foreign Born, Citizen | 958 (94.0%) | 61 (6.0%) |
| Foreign Born, not a Citizen | 590 (89.8%) | 67 (10.2%) |
Health Insurance Coverage by Household Income in Mathews County
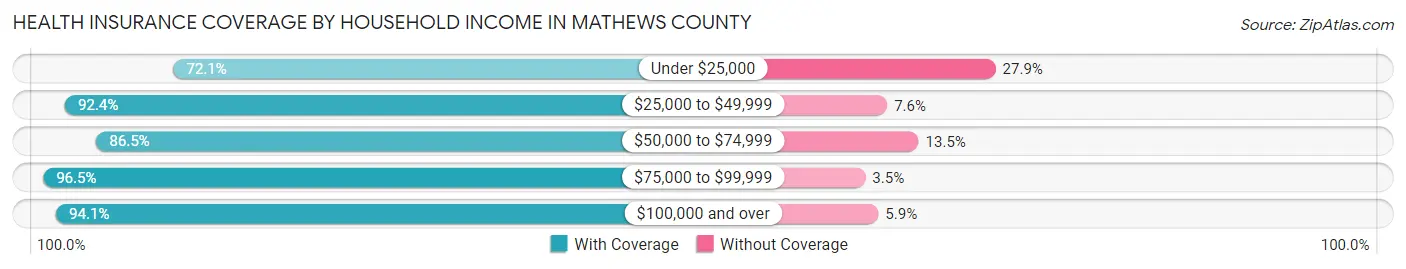
| Household Income | With Coverage | Without Coverage |
| Under $25,000 | 331 (72.1%) | 128 (27.9%) |
| $25,000 to $49,999 | 1,197 (92.4%) | 98 (7.6%) |
| $50,000 to $74,999 | 1,472 (86.5%) | 229 (13.5%) |
| $75,000 to $99,999 | 1,326 (96.5%) | 48 (3.5%) |
| $100,000 and over | 3,335 (94.1%) | 210 (5.9%) |
Public vs Private Health Insurance Coverage by Age in Mathews County
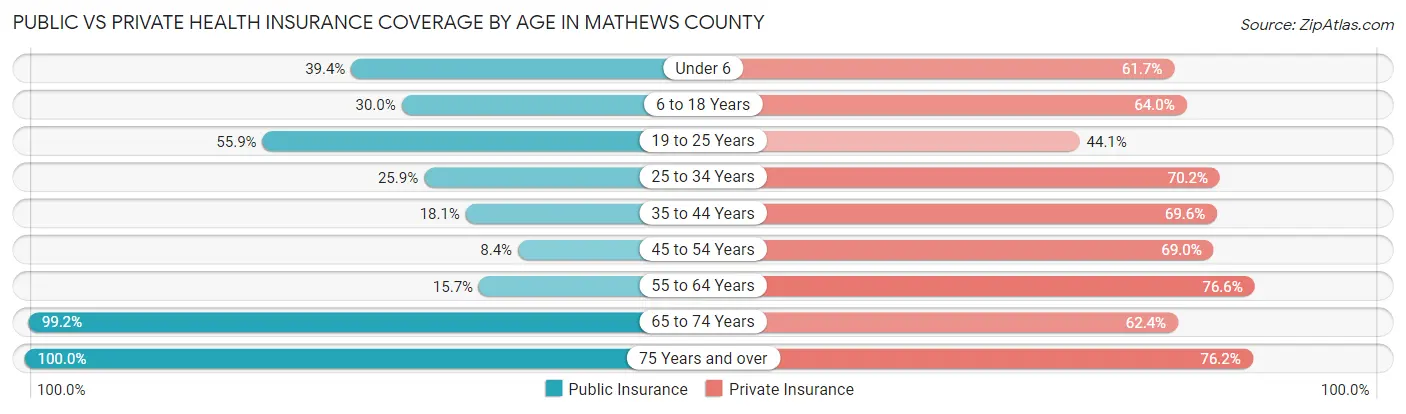
| Age Bracket | Public Insurance | Private Insurance |
| Under 6 | 152 (39.4%) | 238 (61.7%) |
| 6 to 18 Years | 306 (30.0%) | 652 (64.0%) |
| 19 to 25 Years | 367 (55.9%) | 290 (44.1%) |
| 25 to 34 Years | 104 (25.9%) | 282 (70.2%) |
| 35 to 44 Years | 132 (18.1%) | 507 (69.6%) |
| 45 to 54 Years | 99 (8.4%) | 810 (69.0%) |
| 55 to 64 Years | 233 (15.7%) | 1,139 (76.6%) |
| 65 to 74 Years | 1,358 (99.2%) | 854 (62.4%) |
| 75 Years and over | 1,220 (100.0%) | 930 (76.2%) |
| Total | 3,971 (47.0%) | 5,702 (67.5%) |
Disability Status by Sex by Age in Mathews County
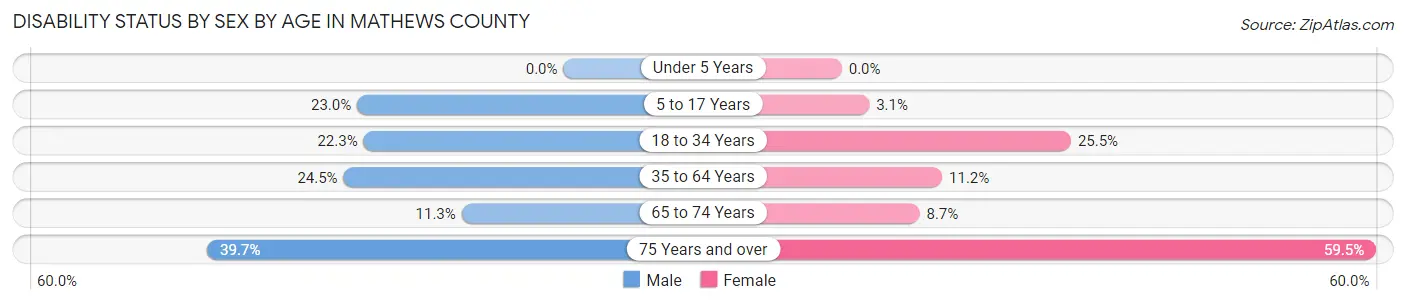
| Age Bracket | Male | Female |
| Under 5 Years | 0 (0.0%) | 0 (0.0%) |
| 5 to 17 Years | 145 (23.0%) | 12 (3.0%) |
| 18 to 34 Years | 132 (22.3%) | 148 (25.5%) |
| 35 to 64 Years | 396 (24.5%) | 198 (11.2%) |
| 65 to 74 Years | 70 (11.3%) | 65 (8.7%) |
| 75 Years and over | 200 (39.7%) | 426 (59.5%) |
Disability Class by Sex by Age in Mathews County
Disability Class: Hearing Difficulty
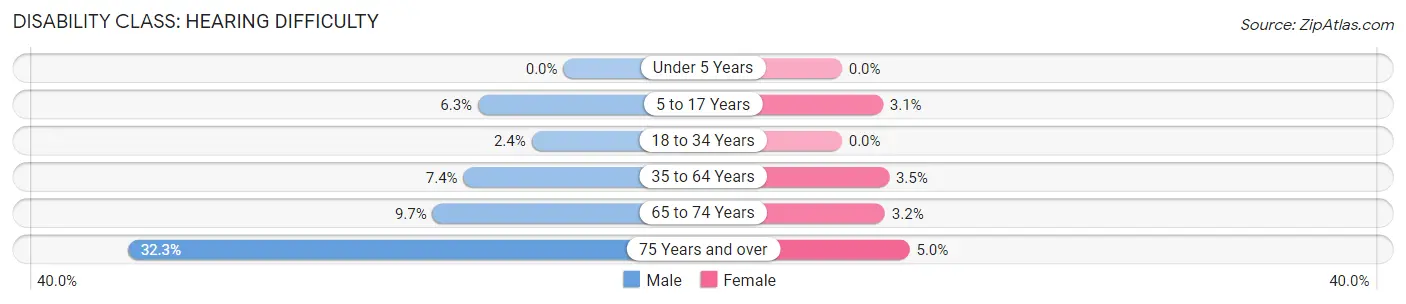
| Age Bracket | Male | Female |
| Under 5 Years | 0 (0.0%) | 0 (0.0%) |
| 5 to 17 Years | 40 (6.3%) | 12 (3.0%) |
| 18 to 34 Years | 14 (2.4%) | 0 (0.0%) |
| 35 to 64 Years | 120 (7.4%) | 62 (3.5%) |
| 65 to 74 Years | 60 (9.7%) | 24 (3.2%) |
| 75 Years and over | 163 (32.3%) | 36 (5.0%) |
Disability Class: Vision Difficulty
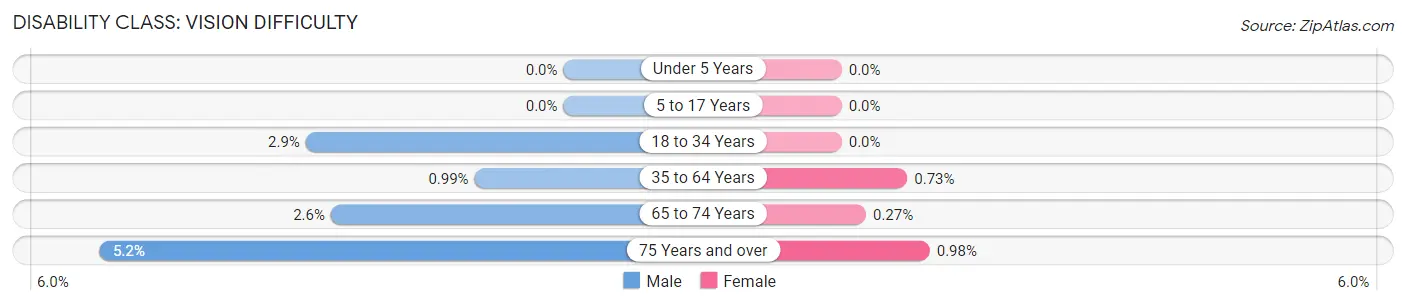
| Age Bracket | Male | Female |
| Under 5 Years | 0 (0.0%) | 0 (0.0%) |
| 5 to 17 Years | 0 (0.0%) | 0 (0.0%) |
| 18 to 34 Years | 17 (2.9%) | 0 (0.0%) |
| 35 to 64 Years | 16 (1.0%) | 13 (0.7%) |
| 65 to 74 Years | 16 (2.6%) | 2 (0.3%) |
| 75 Years and over | 26 (5.2%) | 7 (1.0%) |
Disability Class: Cognitive Difficulty
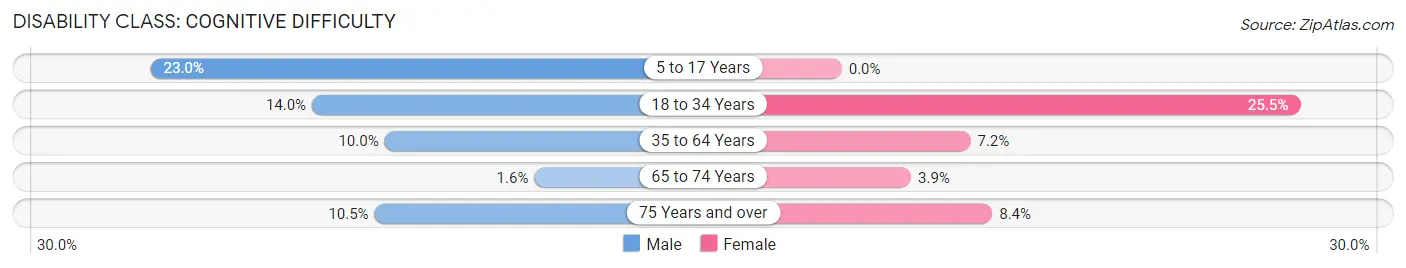
| Age Bracket | Male | Female |
| 5 to 17 Years | 145 (23.0%) | 0 (0.0%) |
| 18 to 34 Years | 83 (14.0%) | 148 (25.5%) |
| 35 to 64 Years | 161 (10.0%) | 127 (7.2%) |
| 65 to 74 Years | 10 (1.6%) | 29 (3.9%) |
| 75 Years and over | 53 (10.5%) | 60 (8.4%) |
Disability Class: Ambulatory Difficulty
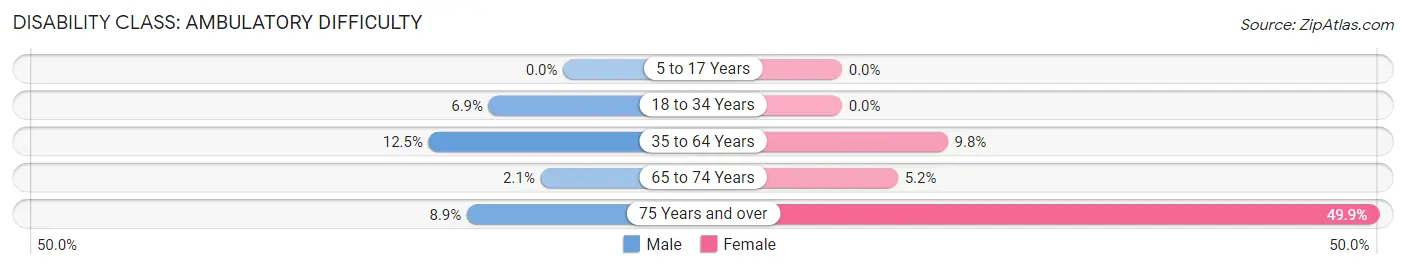
| Age Bracket | Male | Female |
| 5 to 17 Years | 0 (0.0%) | 0 (0.0%) |
| 18 to 34 Years | 41 (6.9%) | 0 (0.0%) |
| 35 to 64 Years | 202 (12.5%) | 174 (9.8%) |
| 65 to 74 Years | 13 (2.1%) | 39 (5.2%) |
| 75 Years and over | 45 (8.9%) | 357 (49.9%) |
Disability Class: Self-Care Difficulty
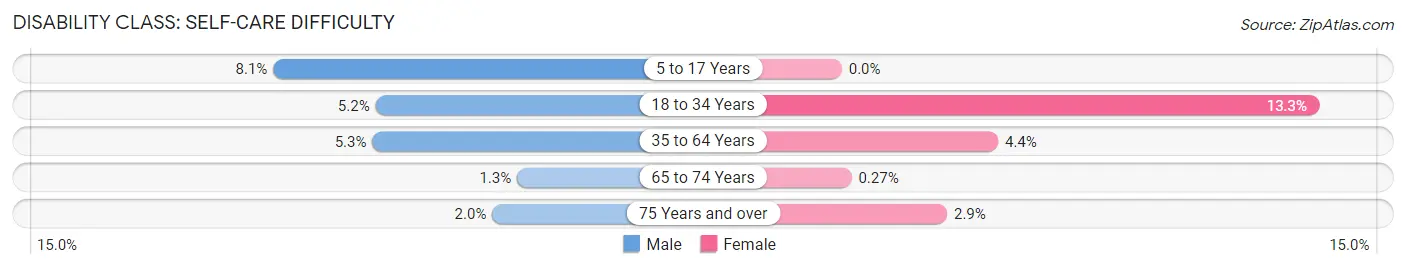
| Age Bracket | Male | Female |
| 5 to 17 Years | 51 (8.1%) | 0 (0.0%) |
| 18 to 34 Years | 31 (5.2%) | 77 (13.3%) |
| 35 to 64 Years | 86 (5.3%) | 77 (4.3%) |
| 65 to 74 Years | 8 (1.3%) | 2 (0.3%) |
| 75 Years and over | 10 (2.0%) | 21 (2.9%) |
Technology Access in Mathews County
Computing Device Access in Mathews County
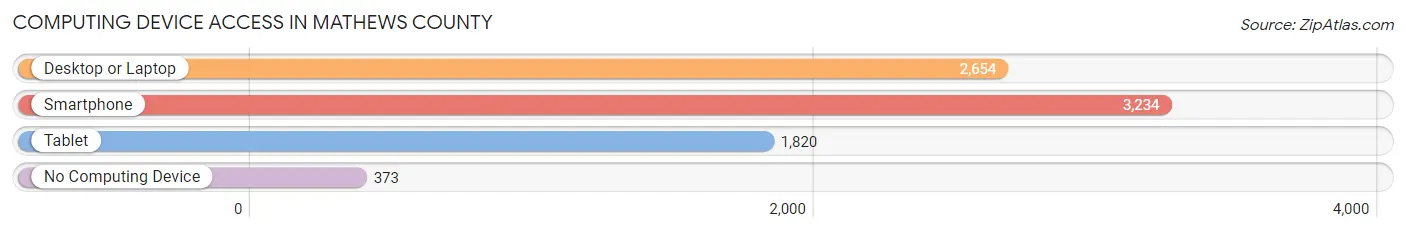
| Device Type | # Households | % Households |
| Desktop or Laptop | 2,654 | 70.9% |
| Smartphone | 3,234 | 86.4% |
| Tablet | 1,820 | 48.6% |
| No Computing Device | 373 | 10.0% |
| Total | 3,742 | 100.0% |
Internet Access in Mathews County
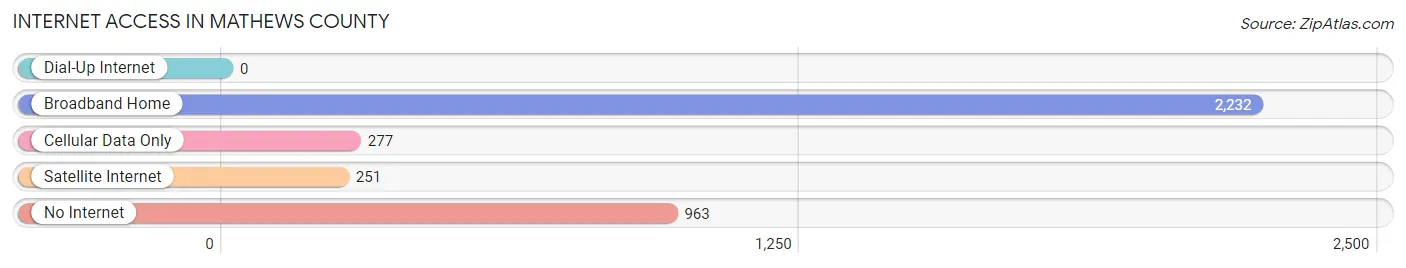
| Internet Type | # Households | % Households |
| Dial-Up Internet | 0 | 0.0% |
| Broadband Home | 2,232 | 59.7% |
| Cellular Data Only | 277 | 7.4% |
| Satellite Internet | 251 | 6.7% |
| No Internet | 963 | 25.7% |
| Total | 3,742 | 100.0% |
Mathews County Summary
Mathews County is a county located in the eastern part of the Commonwealth of Virginia. It is part of the Hampton Roads metropolitan area. As of the 2010 census, the population was 8,978. The county seat is Mathews.
Geography
Mathews County is located on the Middle Peninsula, a subregion of the Virginia Peninsula, in the eastern part of the Commonwealth of Virginia. It is bordered by Gloucester County to the north, Middlesex County to the east, and the Chesapeake Bay to the south and west. The county has a total area of 151 square miles, of which, 144 square miles is land and 7 square miles (4.6%) is water.
The county is located on the western shore of the Chesapeake Bay, and is home to several small islands, including Gwynn's Island, which is the largest. The county is also home to several creeks, including the East, West, and North Rivers, as well as the Mobjack Bay.
History
Mathews County was formed in 1791 from Gloucester County. It was named for Brigadier General Thomas Mathews, a Revolutionary War hero who was killed in the Battle of Guilford Courthouse in 1781.
The county was home to several Native American tribes prior to European settlement, including the Powhatan, the Rappahannock, and the Nottoway. The first European settlers arrived in the area in the early 1600s, and the county was officially established in 1791.
Economy
Mathews County is a largely rural county, with a population of just under 9,000 people. The county is home to several small towns, including Mathews, Cobbs Creek, and Port Haywood. The county is also home to several small businesses, including seafood processing plants, boatyards, and marinas.
The county is also home to several large employers, including the Naval Weapons Station Yorktown, which is the largest employer in the county. Other major employers include the Mathews County Public Schools, the Mathews County Sheriff's Office, and the Mathews County Health Department.
Demographics
As of the 2010 census, there were 8,978 people, 3,717 households, and 2,541 families residing in the county. The population density was 62.2 people per square mile. There were 4,093 housing units at an average density of 28.3 per square mile. The racial makeup of the county was 87.3% White, 9.2% Black or African American, 0.4% Native American, 0.7% Asian, 0.1% Pacific Islander, 0.7% from other races, and 1.6% from two or more races.
The median income for a household in the county was $45,945, and the median income for a family was $54,945. The per capita income for the county was $22,945. About 8.7% of families and 11.2% of the population were below the poverty line, including 15.2% of those under age 18 and 8.2% of those age 65 or over.
Mathews County is a largely rural county, with a population that is largely white and of English descent. The county is home to several small towns, and is largely dependent on the seafood industry for its economic stability. The county is also home to several large employers, including the Naval Weapons Station Yorktown, which is the largest employer in the county.
Common Questions
What is Per Capita Income in Mathews County?
Per Capita income in Mathews County is $48,173.
What is the Median Family Income in Mathews County?
Median Family Income in Mathews County is $92,241.
What is the Median Household income in Mathews County?
Median Household Income in Mathews County is $79,054.
What is Income or Wage Gap in Mathews County?
Income or Wage Gap in Mathews County is 3.7%.
Women in Mathews County earn 96.3 cents for every dollar earned by a man.
What is Inequality or Gini Index in Mathews County?
Inequality or Gini Index in Mathews County is 0.44.
What is the Total Population of Mathews County?
Total Population of Mathews County is 8,537.
What is the Total Male Population of Mathews County?
Total Male Population of Mathews County is 4,124.
What is the Total Female Population of Mathews County?
Total Female Population of Mathews County is 4,413.
What is the Ratio of Males per 100 Females in Mathews County?
There are 93.45 Males per 100 Females in Mathews County.
What is the Ratio of Females per 100 Males in Mathews County?
There are 107.01 Females per 100 Males in Mathews County.
What is the Median Population Age in Mathews County?
Median Population Age in Mathews County is 53.7 Years.
What is the Average Family Size in Mathews County
Average Family Size in Mathews County is 2.9 People.
What is the Average Household Size in Mathews County
Average Household Size in Mathews County is 2.2 People.
How Large is the Labor Force in Mathews County?
There are 3,601 People in the Labor Forcein in Mathews County.
What is the Percentage of People in the Labor Force in Mathews County?
47.6% of People are in the Labor Force in Mathews County.
What is the Unemployment Rate in Mathews County?
Unemployment Rate in Mathews County is 8.2%.