Lunenburg County, VA Map & Demographics
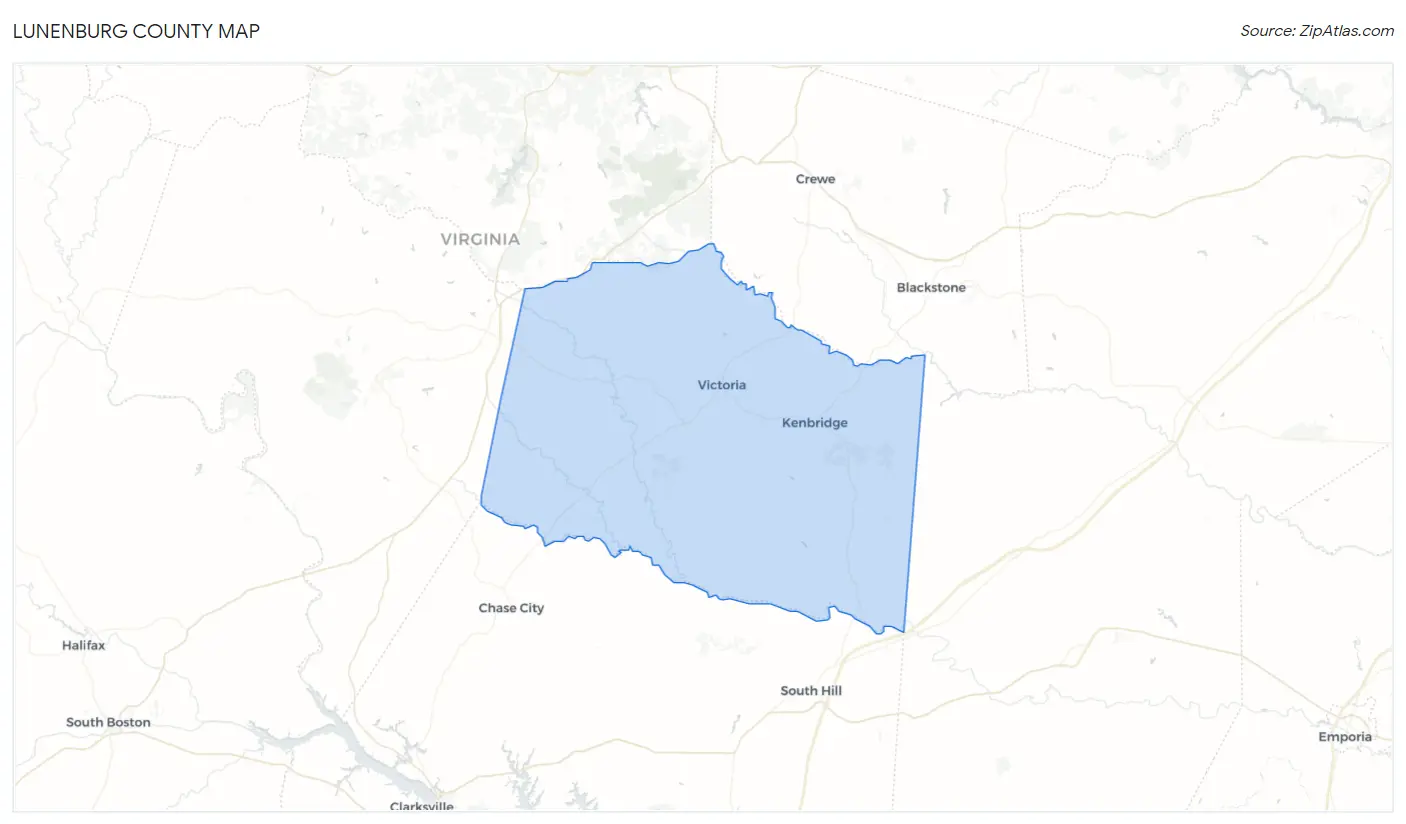
Lunenburg County Map
Lunenburg County Overview
$26,486
PER CAPITA INCOME
$68,917
AVG FAMILY INCOME
$54,438
AVG HOUSEHOLD INCOME
30.1%
WAGE / INCOME GAP [ % ]
69.9¢/ $1
WAGE / INCOME GAP [ $ ]
$8,500
FAMILY INCOME DEFICIT
0.41
INEQUALITY / GINI INDEX
11,988
TOTAL POPULATION
6,285
MALE POPULATION
5,703
FEMALE POPULATION
110.21
MALES / 100 FEMALES
90.74
FEMALES / 100 MALES
44.0
MEDIAN AGE
3.1
AVG FAMILY SIZE
2.4
AVG HOUSEHOLD SIZE
4,854
LABOR FORCE [ PEOPLE ]
49.4%
PERCENT IN LABOR FORCE
4.0%
UNEMPLOYMENT RATE
Lunenburg County Area Codes
Income in Lunenburg County
Income Overview in Lunenburg County
Per Capita Income in Lunenburg County is $26,486, while median incomes of families and households are $68,917 and $54,438 respectively.
| Characteristic | Number | Measure |
| Per Capita Income | 11,988 | $26,486 |
| Median Family Income | 2,997 | $68,917 |
| Mean Family Income | 2,997 | $76,739 |
| Median Household Income | 4,566 | $54,438 |
| Mean Household Income | 4,566 | $65,633 |
| Income Deficit | 2,997 | $8,500 |
| Wage / Income Gap (%) | 11,988 | 30.08% |
| Wage / Income Gap ($) | 11,988 | 69.92¢ per $1 |
| Gini / Inequality Index | 11,988 | 0.41 |
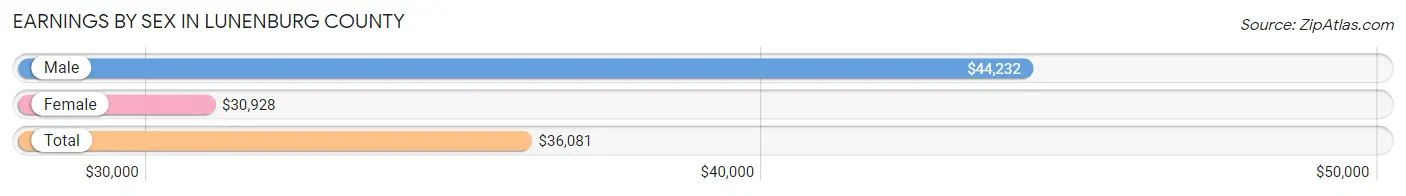
Earnings by Sex in Lunenburg County
Average Earnings in Lunenburg County are $36,081, $44,232 for men and $30,928 for women, a difference of 30.1%.
| Sex | Number | Average Earnings |
| Male | 2,791 (54.0%) | $44,232 |
| Female | 2,373 (46.0%) | $30,928 |
| Total | 5,164 (100.0%) | $36,081 |
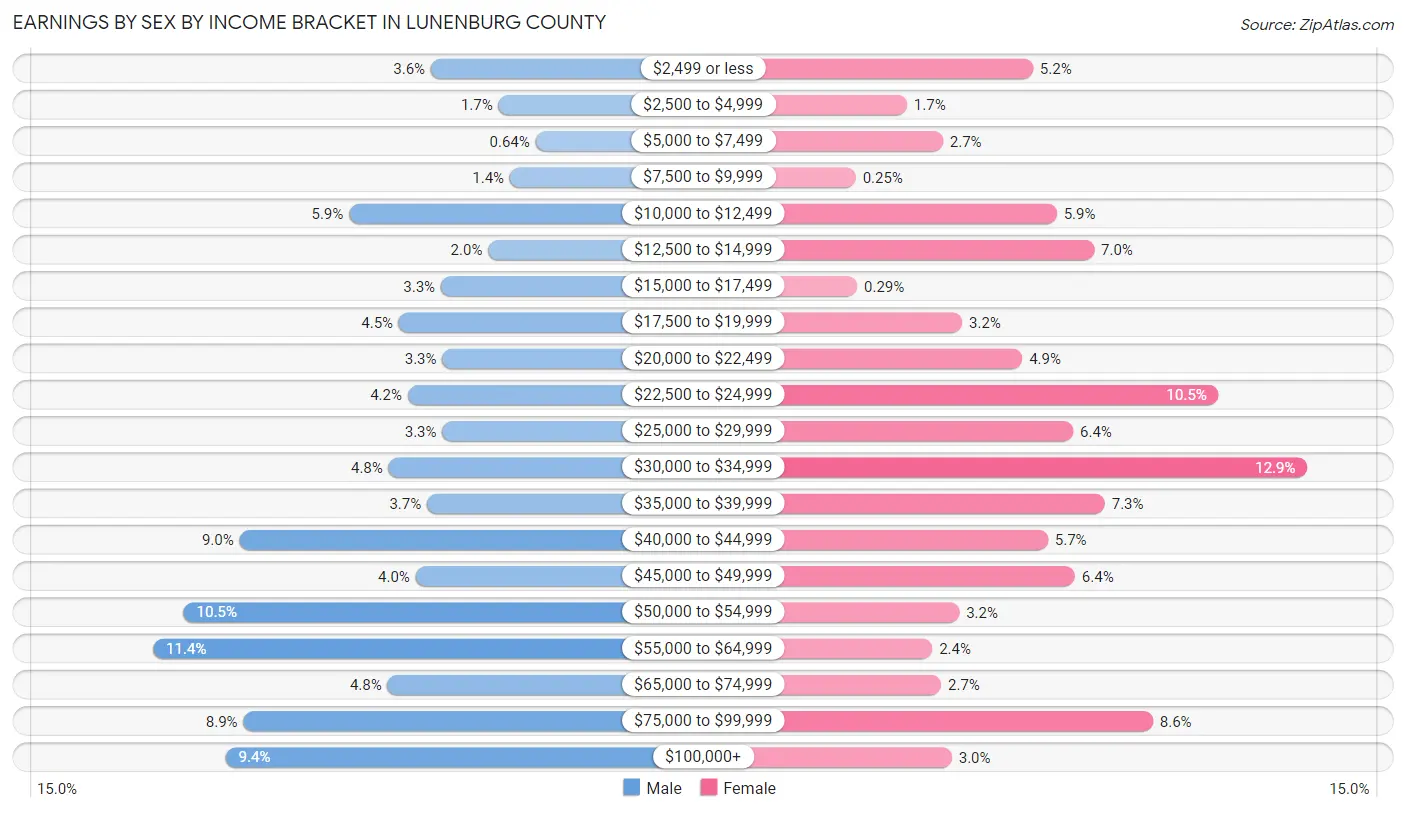
Earnings by Sex by Income Bracket in Lunenburg County
The most common earnings brackets in Lunenburg County are $55,000 to $64,999 for men (318 | 11.4%) and $30,000 to $34,999 for women (307 | 12.9%).
| Income | Male | Female |
| $2,499 or less | 100 (3.6%) | 124 (5.2%) |
| $2,500 to $4,999 | 47 (1.7%) | 40 (1.7%) |
| $5,000 to $7,499 | 18 (0.6%) | 64 (2.7%) |
| $7,500 to $9,999 | 38 (1.4%) | 6 (0.3%) |
| $10,000 to $12,499 | 164 (5.9%) | 140 (5.9%) |
| $12,500 to $14,999 | 55 (2.0%) | 165 (7.0%) |
| $15,000 to $17,499 | 92 (3.3%) | 7 (0.3%) |
| $17,500 to $19,999 | 125 (4.5%) | 77 (3.2%) |
| $20,000 to $22,499 | 91 (3.3%) | 117 (4.9%) |
| $22,500 to $24,999 | 118 (4.2%) | 248 (10.4%) |
| $25,000 to $29,999 | 91 (3.3%) | 151 (6.4%) |
| $30,000 to $34,999 | 133 (4.8%) | 307 (12.9%) |
| $35,000 to $39,999 | 103 (3.7%) | 172 (7.2%) |
| $40,000 to $44,999 | 250 (9.0%) | 134 (5.7%) |
| $45,000 to $49,999 | 112 (4.0%) | 152 (6.4%) |
| $50,000 to $54,999 | 294 (10.5%) | 75 (3.2%) |
| $55,000 to $64,999 | 318 (11.4%) | 57 (2.4%) |
| $65,000 to $74,999 | 134 (4.8%) | 63 (2.6%) |
| $75,000 to $99,999 | 247 (8.8%) | 204 (8.6%) |
| $100,000+ | 261 (9.3%) | 70 (2.9%) |
| Total | 2,791 (100.0%) | 2,373 (100.0%) |
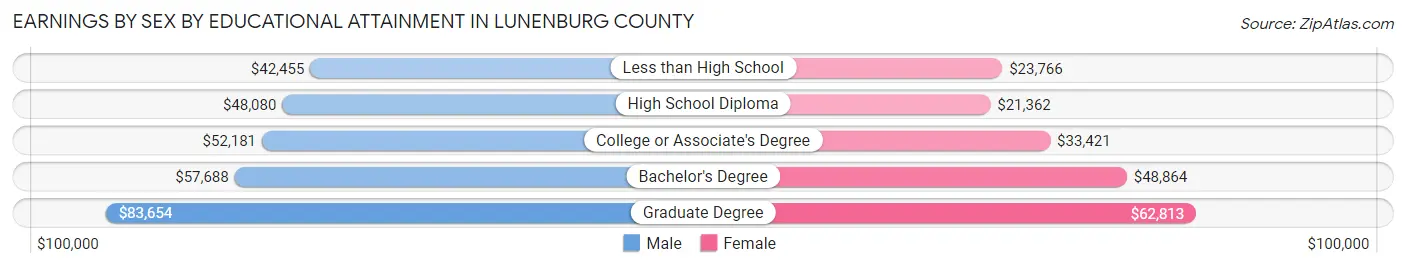
Earnings by Sex by Educational Attainment in Lunenburg County
Average earnings in Lunenburg County are $50,368 for men and $32,689 for women, a difference of 35.1%. Men with an educational attainment of graduate degree enjoy the highest average annual earnings of $83,654, while those with less than high school education earn the least with $42,455. Women with an educational attainment of graduate degree earn the most with the average annual earnings of $62,813, while those with high school diploma education have the smallest earnings of $21,362.
| Educational Attainment | Male Income | Female Income |
| Less than High School | $42,455 | $23,766 |
| High School Diploma | $48,080 | $21,362 |
| College or Associate's Degree | $52,181 | $33,421 |
| Bachelor's Degree | $57,688 | $48,864 |
| Graduate Degree | $83,654 | $62,813 |
| Total | $50,368 | $32,689 |
Family Income in Lunenburg County
Family Income Brackets in Lunenburg County
According to the Lunenburg County family income data, there are 737 families falling into the $50,000 to $74,999 income range, which is the most common income bracket and makes up 24.6% of all families. Conversely, the less than $10,000 income bracket is the least frequent group with only 48 families (1.6%) belonging to this category.
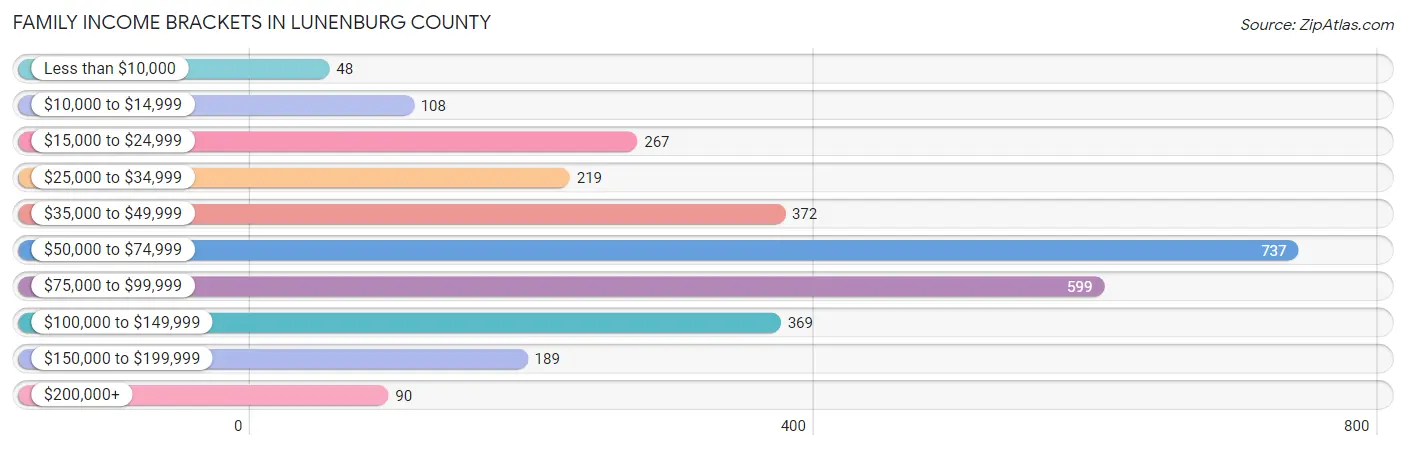
| Income Bracket | # Families | % Families |
| Less than $10,000 | 48 | 1.6% |
| $10,000 to $14,999 | 108 | 3.6% |
| $15,000 to $24,999 | 267 | 8.9% |
| $25,000 to $34,999 | 219 | 7.3% |
| $35,000 to $49,999 | 372 | 12.4% |
| $50,000 to $74,999 | 737 | 24.6% |
| $75,000 to $99,999 | 599 | 20.0% |
| $100,000 to $149,999 | 369 | 12.3% |
| $150,000 to $199,999 | 189 | 6.3% |
| $200,000+ | 90 | 3.0% |
Family Income by Famaliy Size in Lunenburg County
6-person families (46 | 1.5%) account for the highest median family income in Lunenburg County with $98,000 per family, while 2-person families (1,523 | 50.8%) have the highest median income of $31,002 per family member.
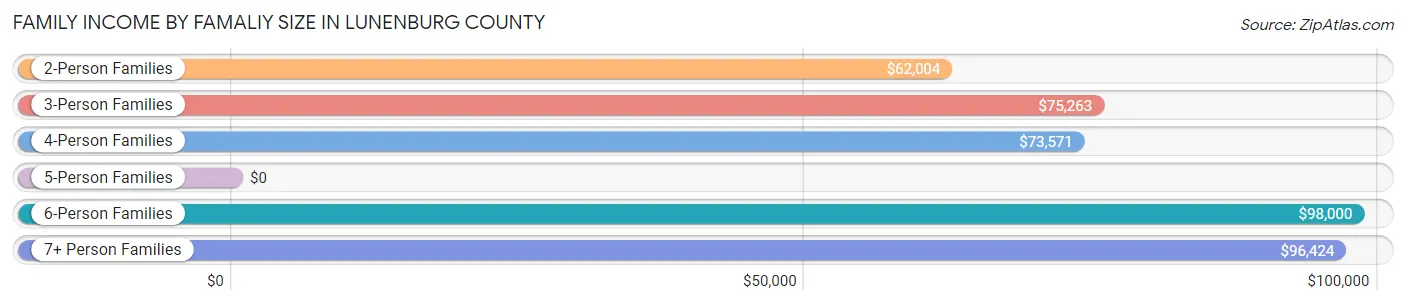
| Income Bracket | # Families | Median Income |
| 2-Person Families | 1,523 (50.8%) | $62,004 |
| 3-Person Families | 796 (26.6%) | $75,263 |
| 4-Person Families | 350 (11.7%) | $73,571 |
| 5-Person Families | 209 (7.0%) | $0 |
| 6-Person Families | 46 (1.5%) | $98,000 |
| 7+ Person Families | 73 (2.4%) | $96,424 |
| Total | 2,997 (100.0%) | $68,917 |
Family Income by Number of Earners in Lunenburg County
The median family income in Lunenburg County is $68,917, with families comprising 3+ earners (278) having the highest median family income of $120,714, while families with no earners (572) have the lowest median family income of $30,183, accounting for 9.3% and 19.1% of families, respectively.
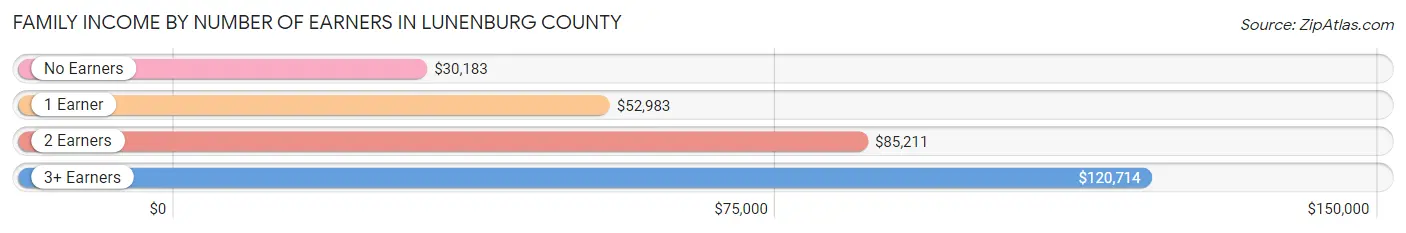
| Number of Earners | # Families | Median Income |
| No Earners | 572 (19.1%) | $30,183 |
| 1 Earner | 1,143 (38.1%) | $52,983 |
| 2 Earners | 1,004 (33.5%) | $85,211 |
| 3+ Earners | 278 (9.3%) | $120,714 |
| Total | 2,997 (100.0%) | $68,917 |
Household Income in Lunenburg County
Household Income Brackets in Lunenburg County
With 977 households falling in the category, the $50,000 to $74,999 income range is the most frequent in Lunenburg County, accounting for 21.4% of all households. In contrast, only 105 households (2.3%) fall into the $200,000+ income bracket, making it the least populous group.
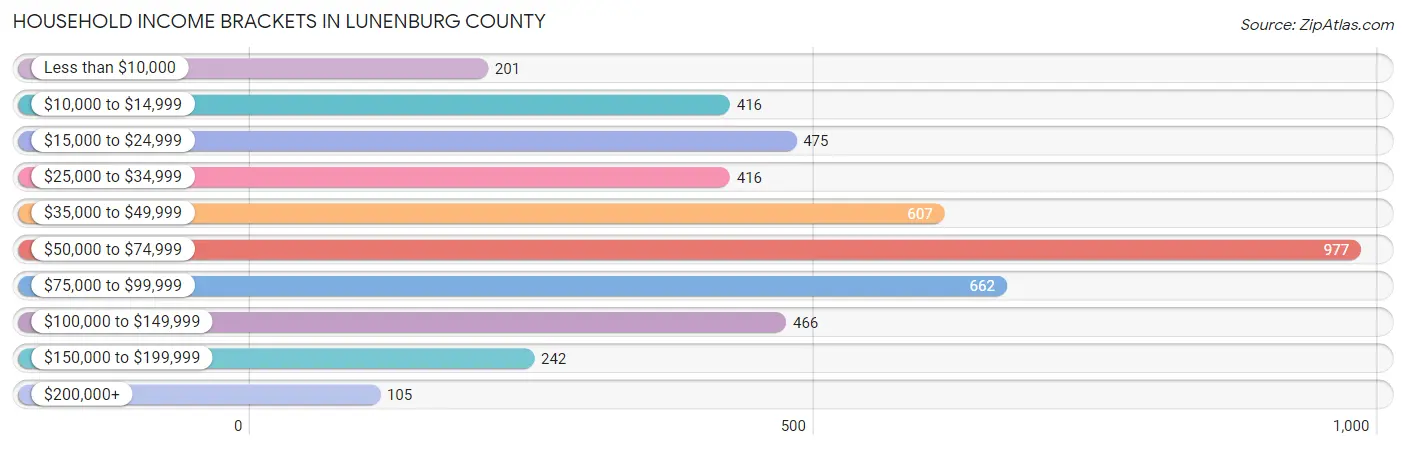
| Income Bracket | # Households | % Households |
| Less than $10,000 | 201 | 4.4% |
| $10,000 to $14,999 | 416 | 9.1% |
| $15,000 to $24,999 | 475 | 10.4% |
| $25,000 to $34,999 | 416 | 9.1% |
| $35,000 to $49,999 | 607 | 13.3% |
| $50,000 to $74,999 | 977 | 21.4% |
| $75,000 to $99,999 | 662 | 14.5% |
| $100,000 to $149,999 | 466 | 10.2% |
| $150,000 to $199,999 | 242 | 5.3% |
| $200,000+ | 105 | 2.3% |
Household Income by Householder Age in Lunenburg County
The median household income in Lunenburg County is $54,438, with the highest median household income of $68,287 found in the 25 to 44 years age bracket for the primary householder. A total of 1,063 households (23.3%) fall into this category. Meanwhile, the 15 to 24 years age bracket for the primary householder has the lowest median household income of $0, with 82 households (1.8%) in this group.
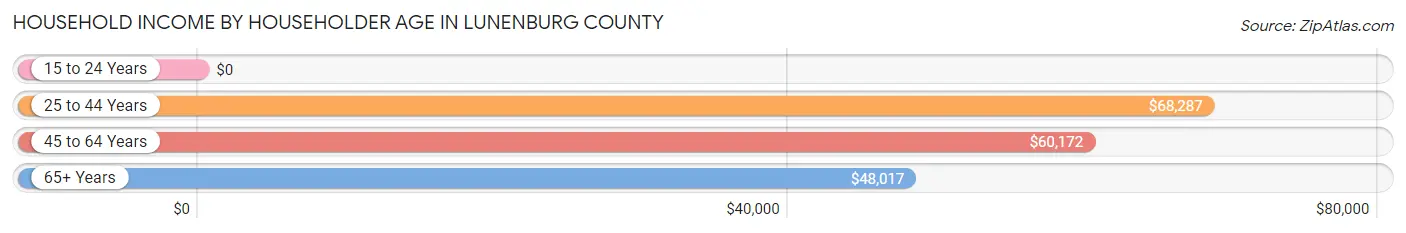
| Income Bracket | # Households | Median Income |
| 15 to 24 Years | 82 (1.8%) | $0 |
| 25 to 44 Years | 1,063 (23.3%) | $68,287 |
| 45 to 64 Years | 1,726 (37.8%) | $60,172 |
| 65+ Years | 1,695 (37.1%) | $48,017 |
| Total | 4,566 (100.0%) | $54,438 |
Poverty in Lunenburg County
Income Below Poverty by Sex and Age in Lunenburg County
With 11.3% poverty level for males and 14.7% for females among the residents of Lunenburg County, under 5 year old males and 15 year old females are the most vulnerable to poverty, with 83 males (27.9%) and 63 females (52.5%) in their respective age groups living below the poverty level.
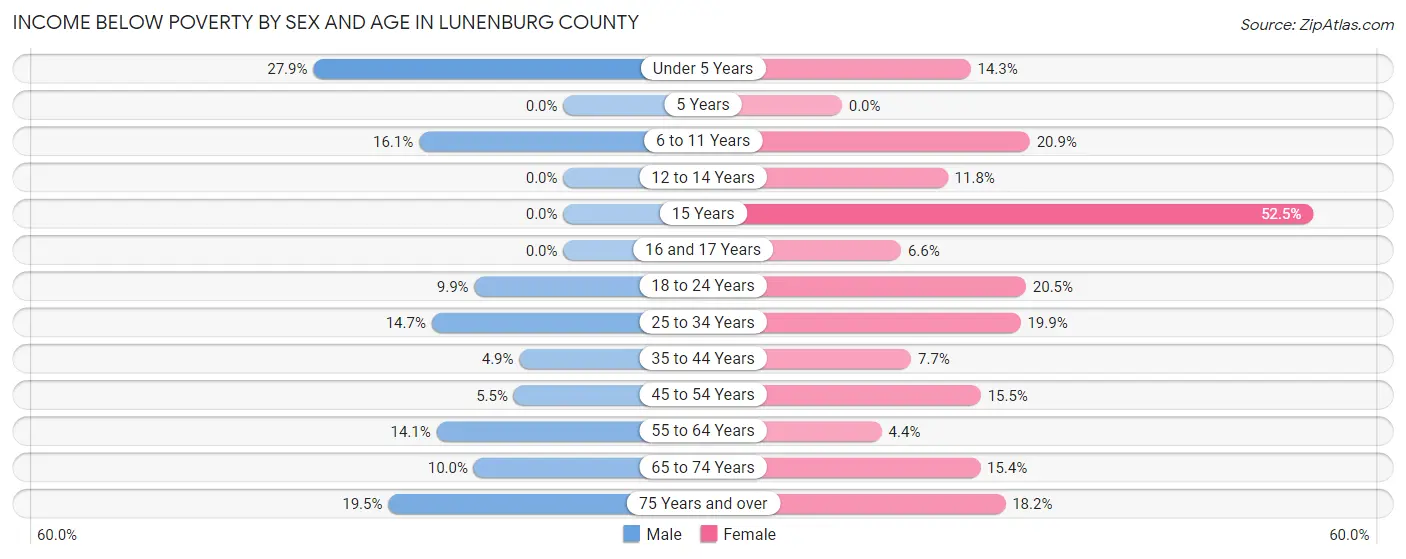
| Age Bracket | Male | Female |
| Under 5 Years | 83 (27.9%) | 39 (14.3%) |
| 5 Years | 0 (0.0%) | 0 (0.0%) |
| 6 to 11 Years | 72 (16.1%) | 72 (20.9%) |
| 12 to 14 Years | 0 (0.0%) | 29 (11.8%) |
| 15 Years | 0 (0.0%) | 63 (52.5%) |
| 16 and 17 Years | 0 (0.0%) | 6 (6.6%) |
| 18 to 24 Years | 39 (9.9%) | 82 (20.5%) |
| 25 to 34 Years | 73 (14.7%) | 122 (19.9%) |
| 35 to 44 Years | 33 (4.9%) | 48 (7.7%) |
| 45 to 54 Years | 35 (5.5%) | 97 (15.5%) |
| 55 to 64 Years | 110 (14.1%) | 38 (4.4%) |
| 65 to 74 Years | 77 (10.0%) | 126 (15.4%) |
| 75 Years and over | 86 (19.5%) | 115 (18.2%) |
| Total | 608 (11.3%) | 837 (14.7%) |
Income Above Poverty by Sex and Age in Lunenburg County
According to the poverty statistics in Lunenburg County, males aged 5 years and females aged 5 years are the age groups that are most secure financially, with 100.0% of males and 100.0% of females in these age groups living above the poverty line.
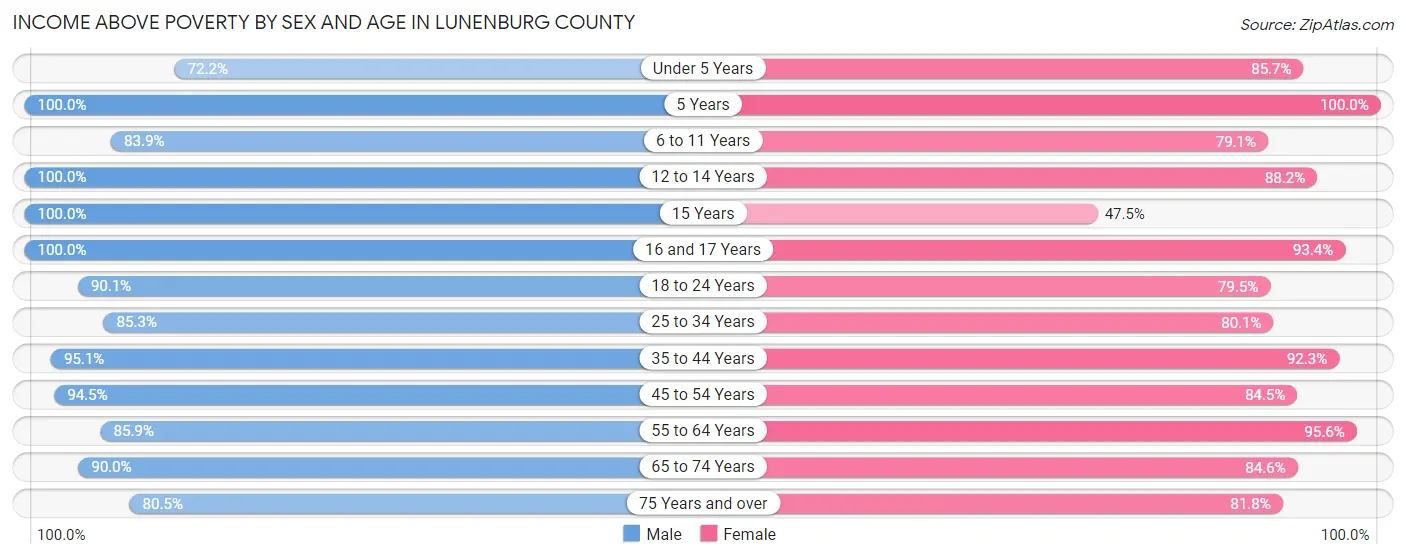
| Age Bracket | Male | Female |
| Under 5 Years | 215 (72.2%) | 233 (85.7%) |
| 5 Years | 39 (100.0%) | 62 (100.0%) |
| 6 to 11 Years | 376 (83.9%) | 272 (79.1%) |
| 12 to 14 Years | 226 (100.0%) | 217 (88.2%) |
| 15 Years | 87 (100.0%) | 57 (47.5%) |
| 16 and 17 Years | 91 (100.0%) | 85 (93.4%) |
| 18 to 24 Years | 355 (90.1%) | 318 (79.5%) |
| 25 to 34 Years | 425 (85.3%) | 491 (80.1%) |
| 35 to 44 Years | 640 (95.1%) | 574 (92.3%) |
| 45 to 54 Years | 599 (94.5%) | 530 (84.5%) |
| 55 to 64 Years | 669 (85.9%) | 818 (95.6%) |
| 65 to 74 Years | 695 (90.0%) | 692 (84.6%) |
| 75 Years and over | 355 (80.5%) | 517 (81.8%) |
| Total | 4,772 (88.7%) | 4,866 (85.3%) |
Income Below Poverty Among Married-Couple Families in Lunenburg County
The poverty statistics for married-couple families in Lunenburg County show that 1.2% or 27 of the total 2,177 families live below the poverty line. Families with 1 or 2 children have the highest poverty rate of 1.8%, comprising of 9 families. On the other hand, families with 3 or 4 children have the lowest poverty rate of 0.0%, which includes 0 families.
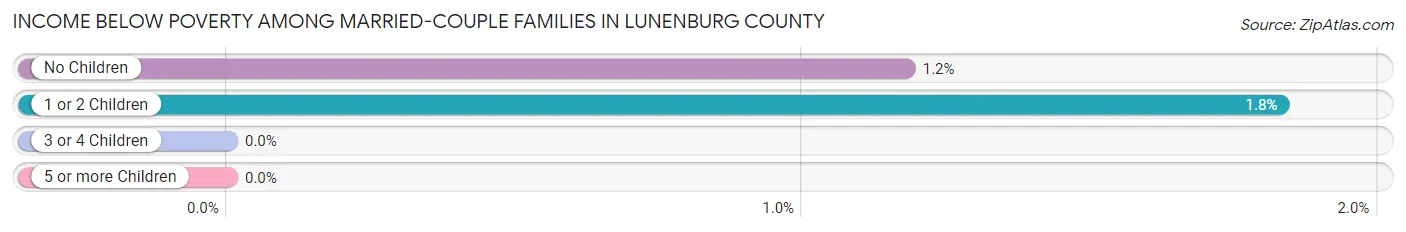
| Children | Above Poverty | Below Poverty |
| No Children | 1,501 (98.8%) | 18 (1.2%) |
| 1 or 2 Children | 483 (98.2%) | 9 (1.8%) |
| 3 or 4 Children | 114 (100.0%) | 0 (0.0%) |
| 5 or more Children | 52 (100.0%) | 0 (0.0%) |
| Total | 2,150 (98.8%) | 27 (1.2%) |
Income Below Poverty Among Single-Parent Households in Lunenburg County
According to the poverty data in Lunenburg County, 25.3% or 56 single-father households and 39.2% or 235 single-mother households are living below the poverty line. Among single-father households, those with 1 or 2 children have the highest poverty rate, with 56 households (60.9%) experiencing poverty. Likewise, among single-mother households, those with 3 or 4 children have the highest poverty rate, with 83 households (50.3%) falling below the poverty line.
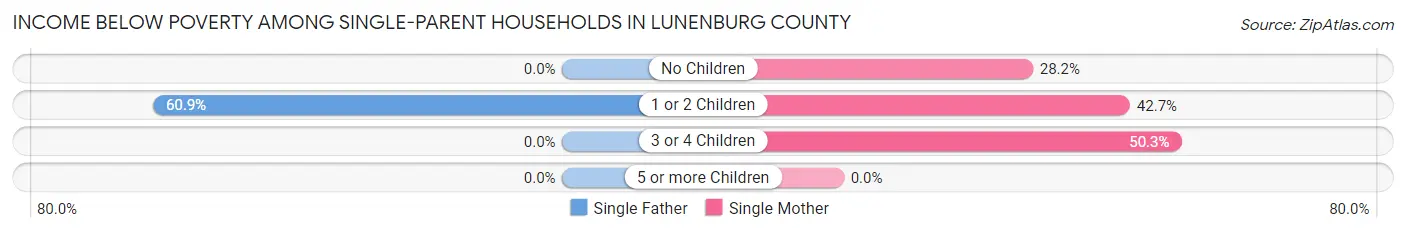
| Children | Single Father | Single Mother |
| No Children | 0 (0.0%) | 62 (28.2%) |
| 1 or 2 Children | 56 (60.9%) | 90 (42.6%) |
| 3 or 4 Children | 0 (0.0%) | 83 (50.3%) |
| 5 or more Children | 0 (0.0%) | 0 (0.0%) |
| Total | 56 (25.3%) | 235 (39.2%) |
Income Below Poverty Among Married-Couple vs Single-Parent Households in Lunenburg County
The poverty data for Lunenburg County shows that 27 of the married-couple family households (1.2%) and 291 of the single-parent households (35.5%) are living below the poverty level. Within the married-couple family households, those with 1 or 2 children have the highest poverty rate, with 9 households (1.8%) falling below the poverty line. Among the single-parent households, those with 3 or 4 children have the highest poverty rate, with 83 household (48.8%) living below poverty.
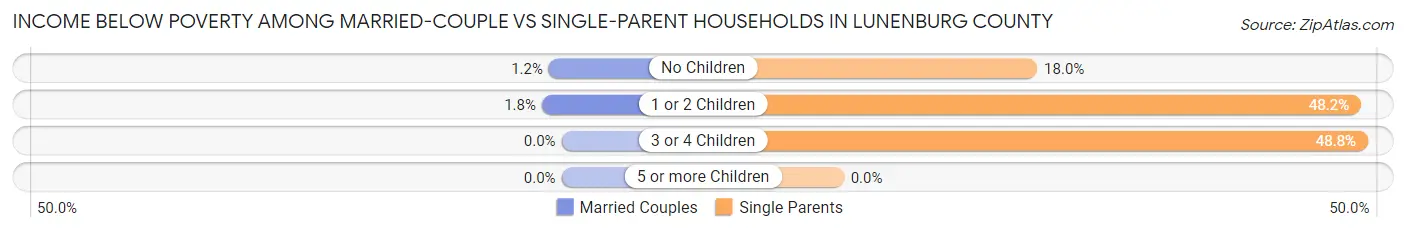
| Children | Married-Couple Families | Single-Parent Households |
| No Children | 18 (1.2%) | 62 (18.0%) |
| 1 or 2 Children | 9 (1.8%) | 146 (48.2%) |
| 3 or 4 Children | 0 (0.0%) | 83 (48.8%) |
| 5 or more Children | 0 (0.0%) | 0 (0.0%) |
| Total | 27 (1.2%) | 291 (35.5%) |
Race in Lunenburg County
The most populous races in Lunenburg County are White / Caucasian (7,022 | 58.6%), Black / African American (3,929 | 32.8%), and Hispanic or Latino (730 | 6.1%).
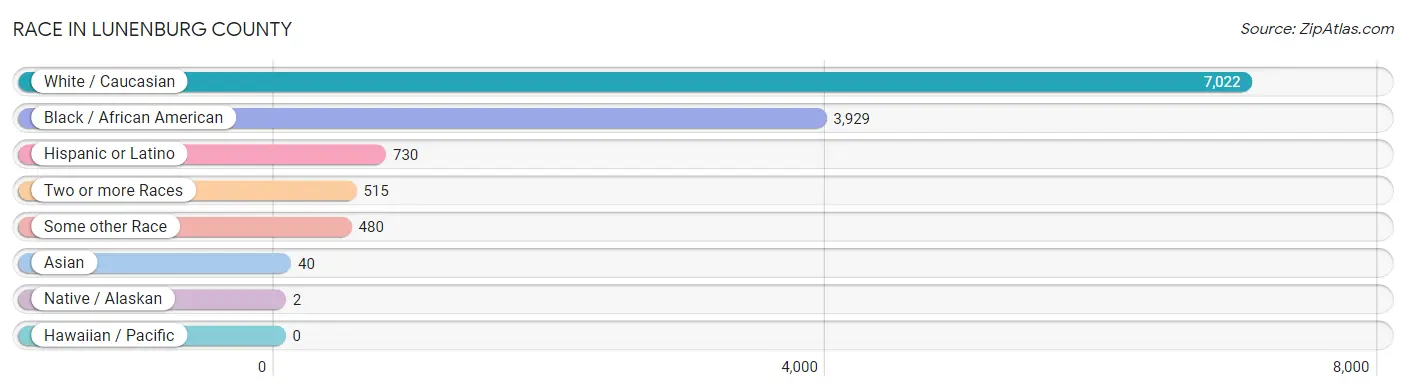
| Race | # Population | % Population |
| Asian | 40 | 0.3% |
| Black / African American | 3,929 | 32.8% |
| Hawaiian / Pacific | 0 | 0.0% |
| Hispanic or Latino | 730 | 6.1% |
| Native / Alaskan | 2 | 0.0% |
| White / Caucasian | 7,022 | 58.6% |
| Two or more Races | 515 | 4.3% |
| Some other Race | 480 | 4.0% |
| Total | 11,988 | 100.0% |
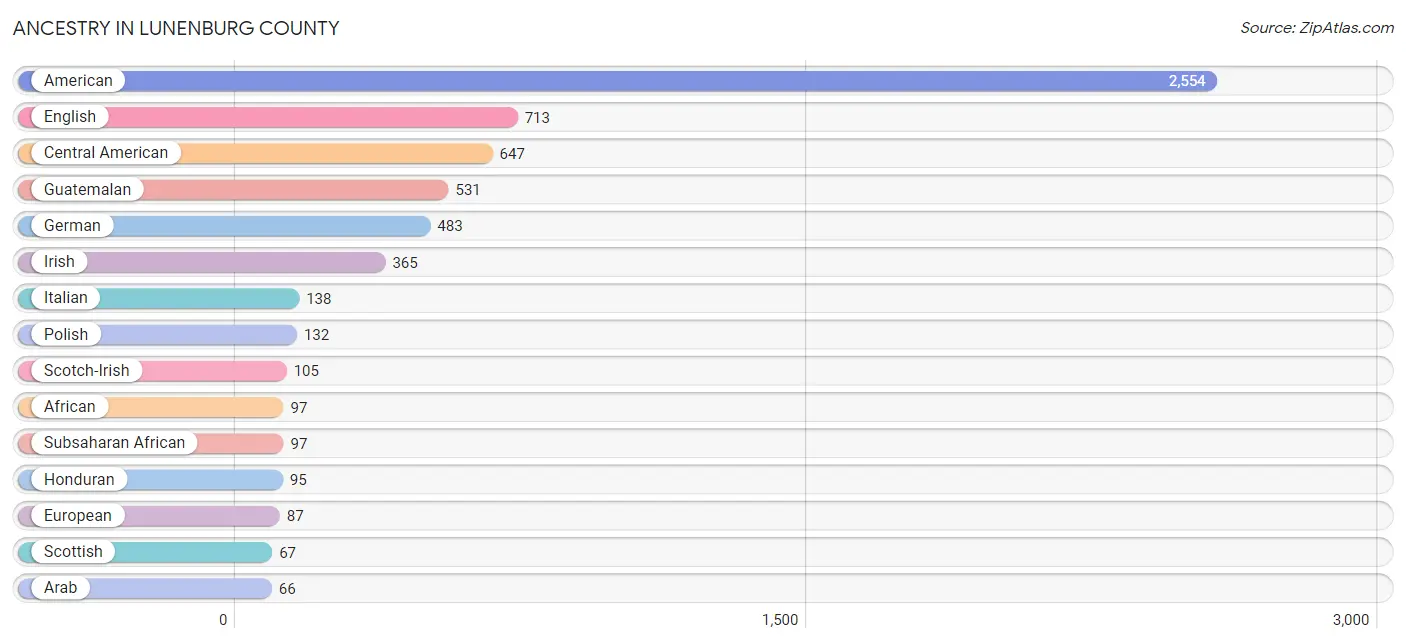
Ancestry in Lunenburg County
The most populous ancestries reported in Lunenburg County are American (2,554 | 21.3%), English (713 | 5.9%), Central American (647 | 5.4%), Guatemalan (531 | 4.4%), and German (483 | 4.0%), together accounting for 41.1% of all Lunenburg County residents.
| Ancestry | # Population | % Population |
| African | 97 | 0.8% |
| Albanian | 42 | 0.4% |
| American | 2,554 | 21.3% |
| Arab | 66 | 0.5% |
| Austrian | 18 | 0.2% |
| British | 23 | 0.2% |
| Central American | 647 | 5.4% |
| Cherokee | 44 | 0.4% |
| Choctaw | 1 | 0.0% |
| Czechoslovakian | 12 | 0.1% |
| Dutch | 37 | 0.3% |
| English | 713 | 5.9% |
| European | 87 | 0.7% |
| French | 23 | 0.2% |
| German | 483 | 4.0% |
| Guatemalan | 531 | 4.4% |
| Honduran | 95 | 0.8% |
| Irish | 365 | 3.0% |
| Italian | 138 | 1.1% |
| Jamaican | 31 | 0.3% |
| Korean | 37 | 0.3% |
| Lebanese | 13 | 0.1% |
| Mexican | 29 | 0.2% |
| Moroccan | 6 | 0.1% |
| Native Hawaiian | 10 | 0.1% |
| Northern European | 32 | 0.3% |
| Norwegian | 26 | 0.2% |
| Panamanian | 8 | 0.1% |
| Polish | 132 | 1.1% |
| Puerto Rican | 33 | 0.3% |
| Romanian | 13 | 0.1% |
| Russian | 4 | 0.0% |
| Salvadoran | 13 | 0.1% |
| Scotch-Irish | 105 | 0.9% |
| Scottish | 67 | 0.6% |
| Slovak | 21 | 0.2% |
| Subsaharan African | 97 | 0.8% |
| Swedish | 7 | 0.1% |
| Swiss | 4 | 0.0% |
| Thai | 3 | 0.0% |
| Turkish | 3 | 0.0% |
| Ukrainian | 28 | 0.2% |
| Welsh | 65 | 0.5% | View All 43 Rows |
Immigrants in Lunenburg County
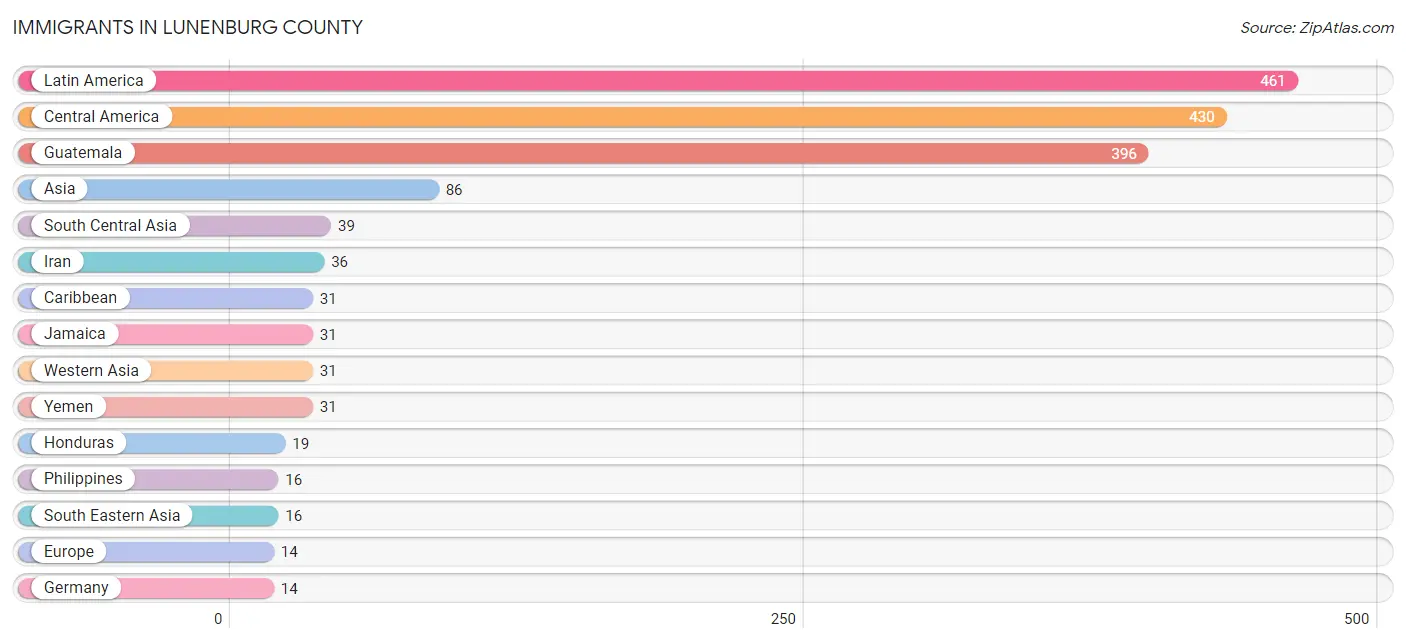
The most numerous immigrant groups reported in Lunenburg County came from Latin America (461 | 3.8%), Central America (430 | 3.6%), Guatemala (396 | 3.3%), Asia (86 | 0.7%), and South Central Asia (39 | 0.3%), together accounting for 11.8% of all Lunenburg County residents.
| Immigration Origin | # Population | % Population |
| Asia | 86 | 0.7% |
| Caribbean | 31 | 0.3% |
| Central America | 430 | 3.6% |
| El Salvador | 5 | 0.0% |
| Europe | 14 | 0.1% |
| Germany | 14 | 0.1% |
| Guatemala | 396 | 3.3% |
| Honduras | 19 | 0.2% |
| India | 3 | 0.0% |
| Iran | 36 | 0.3% |
| Jamaica | 31 | 0.3% |
| Latin America | 461 | 3.8% |
| Mexico | 10 | 0.1% |
| Philippines | 16 | 0.1% |
| South Central Asia | 39 | 0.3% |
| South Eastern Asia | 16 | 0.1% |
| Western Asia | 31 | 0.3% |
| Western Europe | 14 | 0.1% |
| Yemen | 31 | 0.3% | View All 19 Rows |
Sex and Age in Lunenburg County
Sex and Age in Lunenburg County
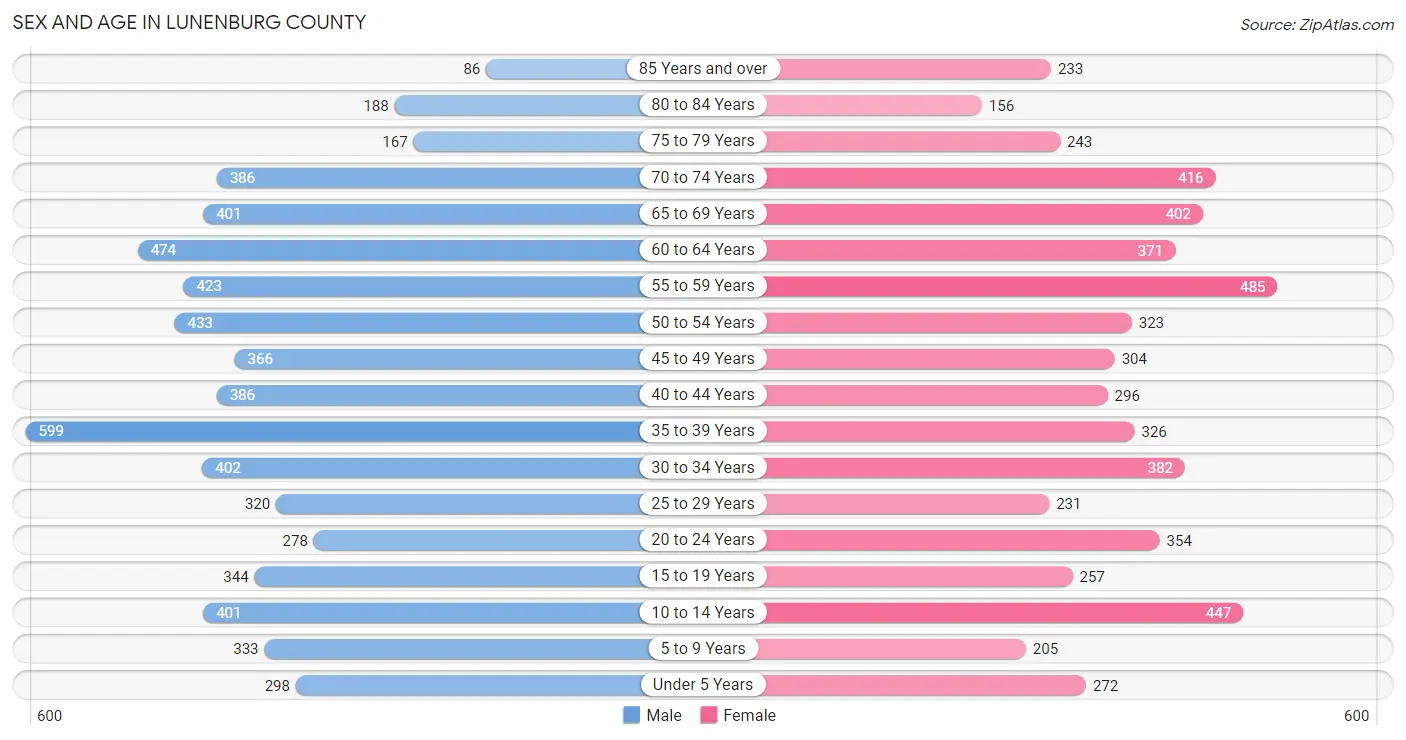
The most populous age groups in Lunenburg County are 35 to 39 Years (599 | 9.5%) for men and 55 to 59 Years (485 | 8.5%) for women.
| Age Bracket | Male | Female |
| Under 5 Years | 298 (4.7%) | 272 (4.8%) |
| 5 to 9 Years | 333 (5.3%) | 205 (3.6%) |
| 10 to 14 Years | 401 (6.4%) | 447 (7.8%) |
| 15 to 19 Years | 344 (5.5%) | 257 (4.5%) |
| 20 to 24 Years | 278 (4.4%) | 354 (6.2%) |
| 25 to 29 Years | 320 (5.1%) | 231 (4.1%) |
| 30 to 34 Years | 402 (6.4%) | 382 (6.7%) |
| 35 to 39 Years | 599 (9.5%) | 326 (5.7%) |
| 40 to 44 Years | 386 (6.1%) | 296 (5.2%) |
| 45 to 49 Years | 366 (5.8%) | 304 (5.3%) |
| 50 to 54 Years | 433 (6.9%) | 323 (5.7%) |
| 55 to 59 Years | 423 (6.7%) | 485 (8.5%) |
| 60 to 64 Years | 474 (7.5%) | 371 (6.5%) |
| 65 to 69 Years | 401 (6.4%) | 402 (7.0%) |
| 70 to 74 Years | 386 (6.1%) | 416 (7.3%) |
| 75 to 79 Years | 167 (2.7%) | 243 (4.3%) |
| 80 to 84 Years | 188 (3.0%) | 156 (2.7%) |
| 85 Years and over | 86 (1.4%) | 233 (4.1%) |
| Total | 6,285 (100.0%) | 5,703 (100.0%) |
Families and Households in Lunenburg County
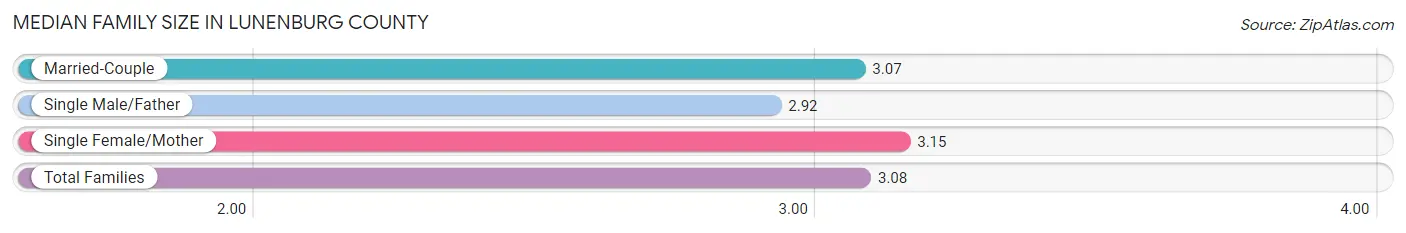
Median Family Size in Lunenburg County
The median family size in Lunenburg County is 3.08 persons per family, with single female/mother families (599 | 20.0%) accounting for the largest median family size of 3.15 persons per family. On the other hand, single male/father families (221 | 7.4%) represent the smallest median family size with 2.92 persons per family.
| Family Type | # Families | Family Size |
| Married-Couple | 2,177 (72.6%) | 3.07 |
| Single Male/Father | 221 (7.4%) | 2.92 |
| Single Female/Mother | 599 (20.0%) | 3.15 |
| Total Families | 2,997 (100.0%) | 3.08 |
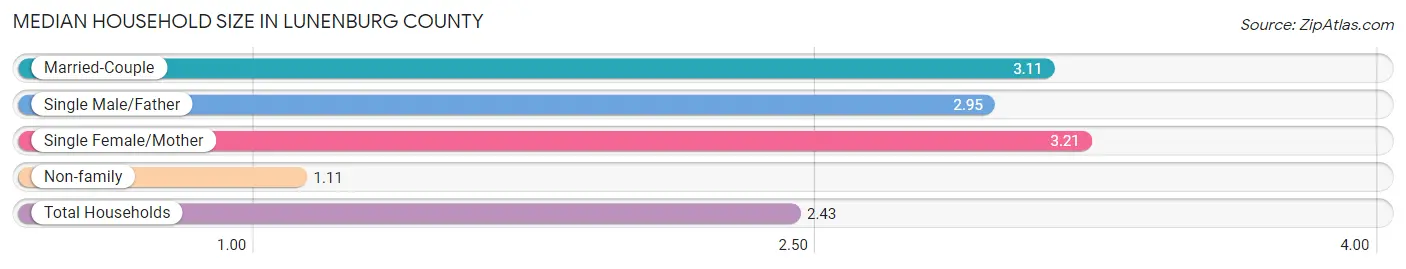
Median Household Size in Lunenburg County
The median household size in Lunenburg County is 2.43 persons per household, with single female/mother households (599 | 13.1%) accounting for the largest median household size of 3.21 persons per household. non-family households (1,569 | 34.4%) represent the smallest median household size with 1.11 persons per household.
| Household Type | # Households | Household Size |
| Married-Couple | 2,177 (47.7%) | 3.11 |
| Single Male/Father | 221 (4.8%) | 2.95 |
| Single Female/Mother | 599 (13.1%) | 3.21 |
| Non-family | 1,569 (34.4%) | 1.11 |
| Total Households | 4,566 (100.0%) | 2.43 |
Household Size by Marriage Status in Lunenburg County
Out of a total of 4,566 households in Lunenburg County, 2,997 (65.6%) are family households, while 1,569 (34.4%) are nonfamily households. The most numerous type of family households are 2-person households, comprising 1,522, and the most common type of nonfamily households are 1-person households, comprising 1,410.
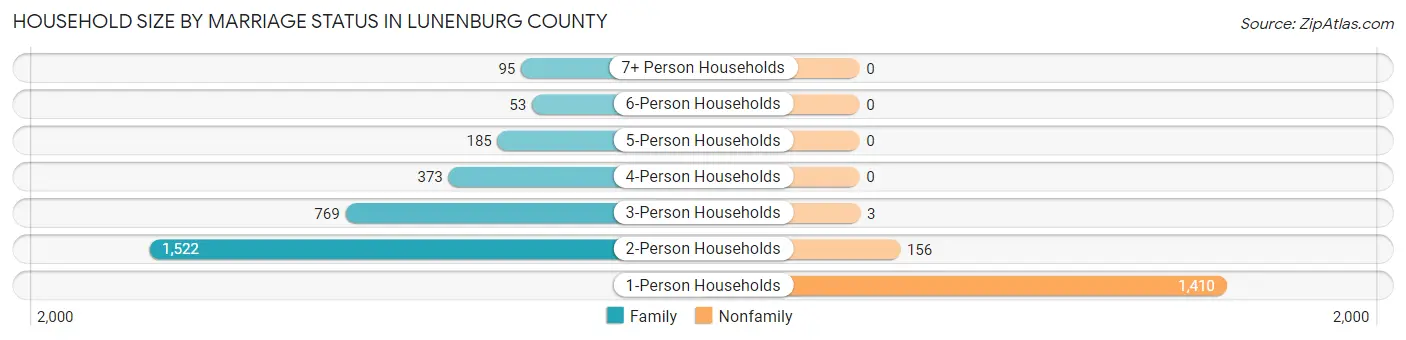
| Household Size | Family Households | Nonfamily Households |
| 1-Person Households | - | 1,410 (30.9%) |
| 2-Person Households | 1,522 (33.3%) | 156 (3.4%) |
| 3-Person Households | 769 (16.8%) | 3 (0.1%) |
| 4-Person Households | 373 (8.2%) | 0 (0.0%) |
| 5-Person Households | 185 (4.1%) | 0 (0.0%) |
| 6-Person Households | 53 (1.2%) | 0 (0.0%) |
| 7+ Person Households | 95 (2.1%) | 0 (0.0%) |
| Total | 2,997 (65.6%) | 1,569 (34.4%) |
Female Fertility in Lunenburg County
Fertility by Age in Lunenburg County
Average fertility rate in Lunenburg County is 45.0 births per 1,000 women. Women in the age bracket of 20 to 34 years have the highest fertility rate with 108.0 births per 1,000 women. Women in the age bracket of 20 to 34 years acount for 100.0% of all women with births.
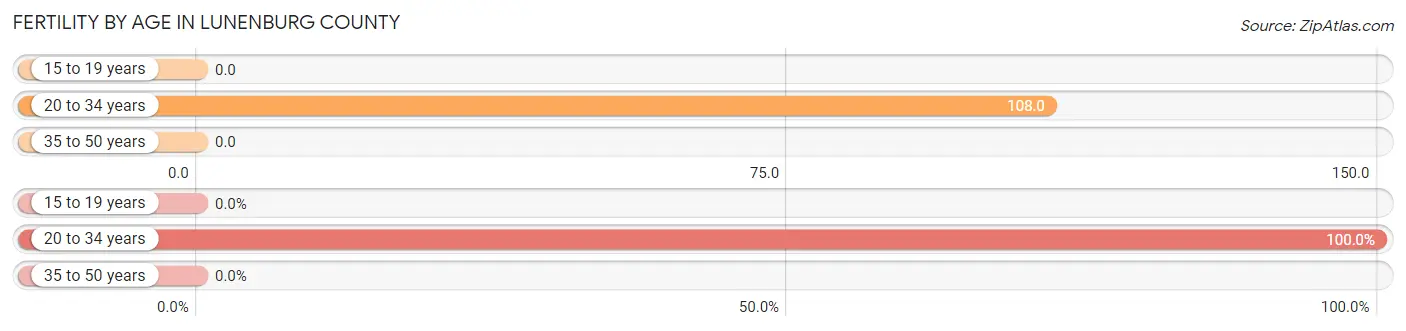
| Age Bracket | Women with Births | Births / 1,000 Women |
| 15 to 19 years | 0 (0.0%) | 0.0 |
| 20 to 34 years | 104 (100.0%) | 108.0 |
| 35 to 50 years | 0 (0.0%) | 0.0 |
| Total | 104 (100.0%) | 45.0 |
Fertility by Age by Marriage Status in Lunenburg County
64.4% of women with births (104) in Lunenburg County are married. The highest percentage of unmarried women with births falls into 20 to 34 years age bracket with 35.6% of them unmarried at the time of birth, while the lowest percentage of unmarried women with births belong to 20 to 34 years age bracket with 35.6% of them unmarried.
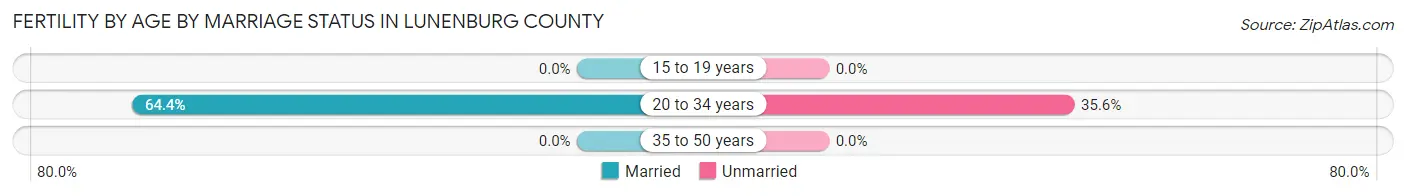
| Age Bracket | Married | Unmarried |
| 15 to 19 years | 0 (0.0%) | 0 (0.0%) |
| 20 to 34 years | 67 (64.4%) | 37 (35.6%) |
| 35 to 50 years | 0 (0.0%) | 0 (0.0%) |
| Total | 67 (64.4%) | 37 (35.6%) |
Fertility by Education in Lunenburg County
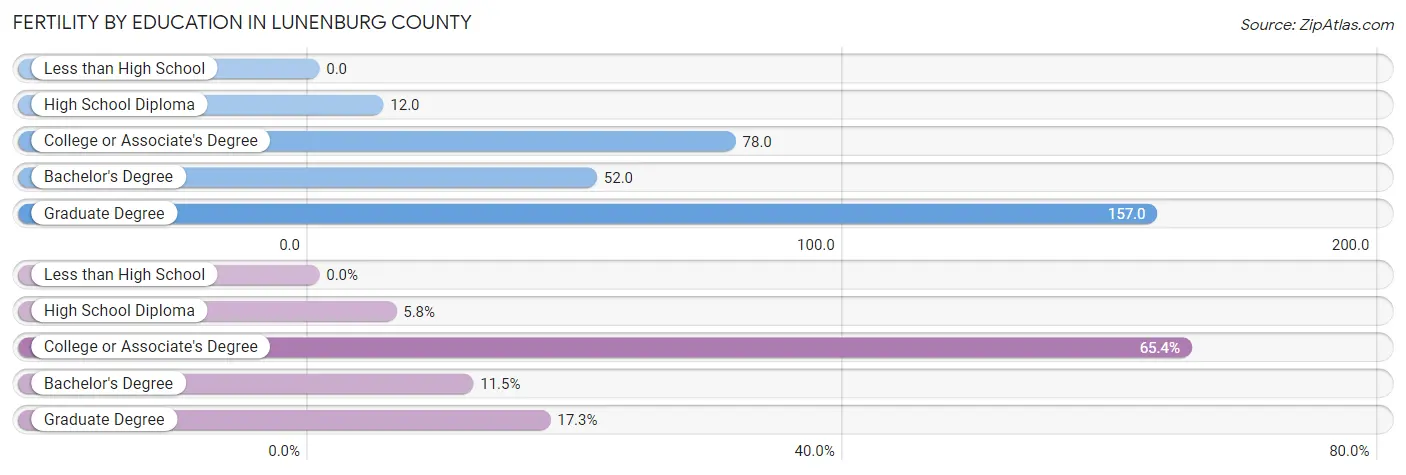
| Educational Attainment | Women with Births | Births / 1,000 Women |
| Less than High School | 0 (0.0%) | 0.0 |
| High School Diploma | 6 (5.8%) | 12.0 |
| College or Associate's Degree | 68 (65.4%) | 78.0 |
| Bachelor's Degree | 12 (11.5%) | 52.0 |
| Graduate Degree | 18 (17.3%) | 157.0 |
| Total | 104 (100.0%) | 45.0 |
Fertility by Education by Marriage Status in Lunenburg County
35.6% of women with births in Lunenburg County are unmarried. Women with the educational attainment of college or associate's degree are most likely to be married with 80.9% of them married at childbirth, while women with the educational attainment of bachelor's degree are least likely to be married with 100.0% of them unmarried at childbirth.
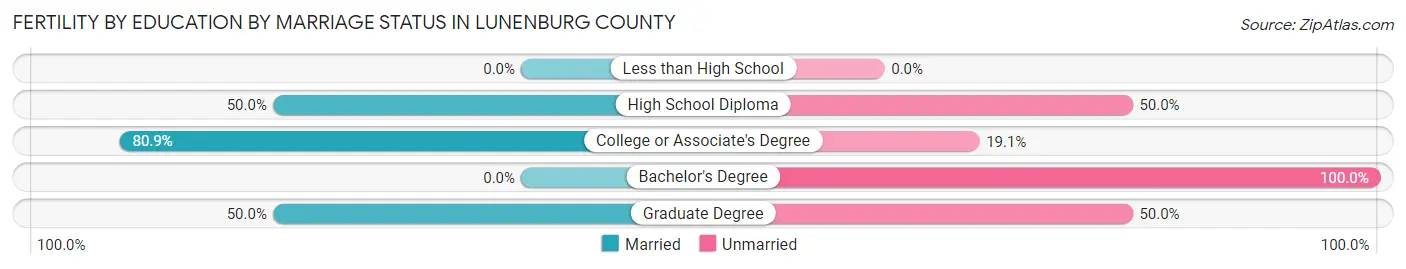
| Educational Attainment | Married | Unmarried |
| Less than High School | 0 (0.0%) | 0 (0.0%) |
| High School Diploma | 3 (50.0%) | 3 (50.0%) |
| College or Associate's Degree | 55 (80.9%) | 13 (19.1%) |
| Bachelor's Degree | 0 (0.0%) | 12 (100.0%) |
| Graduate Degree | 9 (50.0%) | 9 (50.0%) |
| Total | 67 (64.4%) | 37 (35.6%) |
Employment Characteristics in Lunenburg County
Employment by Class of Employer in Lunenburg County
Among the 4,556 employed individuals in Lunenburg County, private company employees (2,801 | 61.5%), local government employees (457 | 10.0%), and state government employees (452 | 9.9%) make up the most common classes of employment.
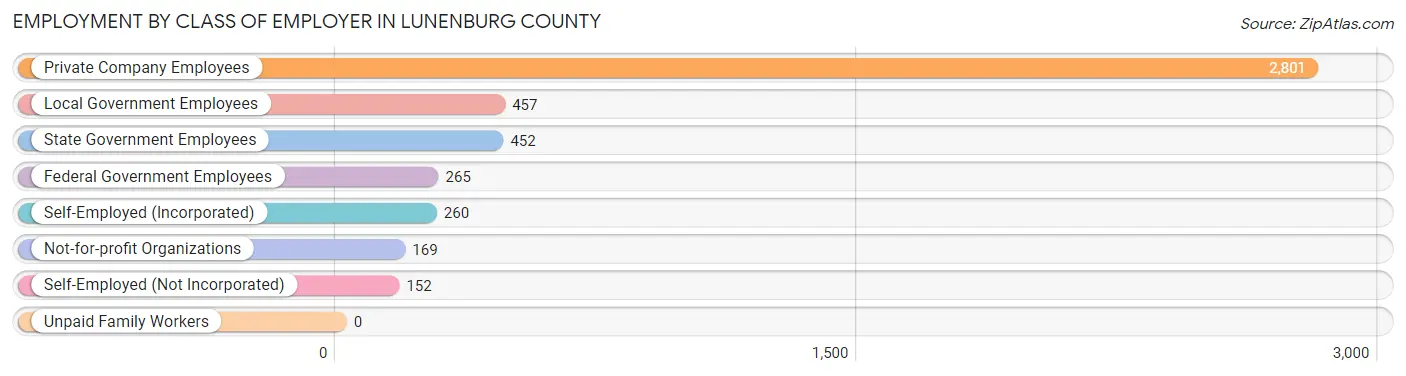
| Employer Class | # Employees | % Employees |
| Private Company Employees | 2,801 | 61.5% |
| Self-Employed (Incorporated) | 260 | 5.7% |
| Self-Employed (Not Incorporated) | 152 | 3.3% |
| Not-for-profit Organizations | 169 | 3.7% |
| Local Government Employees | 457 | 10.0% |
| State Government Employees | 452 | 9.9% |
| Federal Government Employees | 265 | 5.8% |
| Unpaid Family Workers | 0 | 0.0% |
| Total | 4,556 | 100.0% |
Employment Status by Age in Lunenburg County
According to the labor force statistics for Lunenburg County, out of the total population over 16 years of age (9,825), 49.4% or 4,854 individuals are in the labor force, with 4.0% or 194 of them unemployed. The age group with the highest labor force participation rate is 30 to 34 years, with 77.8% or 610 individuals in the labor force. Within the labor force, the 25 to 29 years age range has the highest percentage of unemployed individuals, with 8.4% or 28 of them being unemployed.
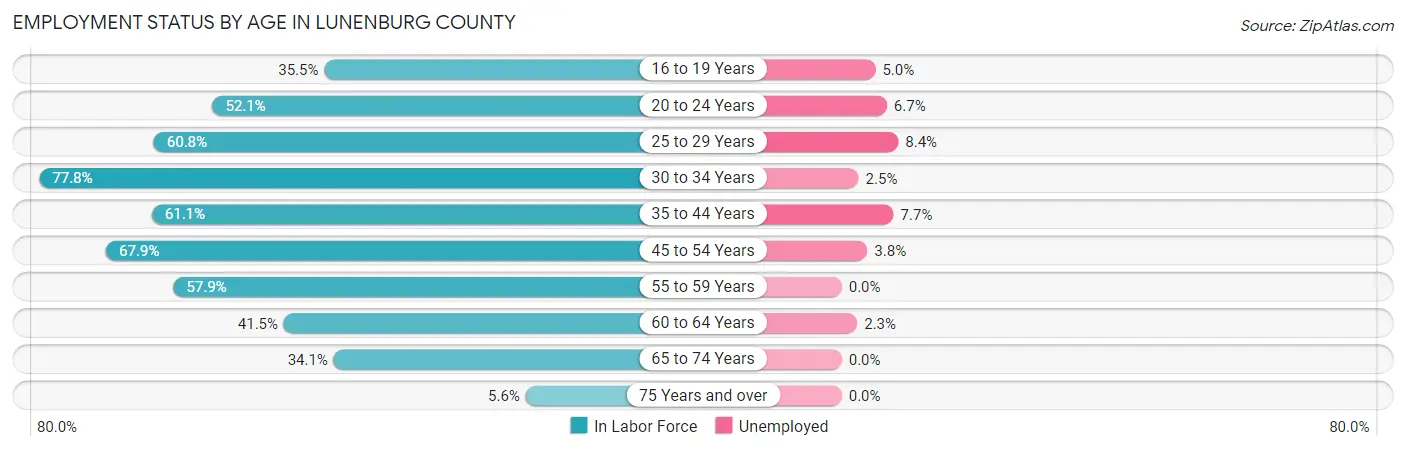
| Age Bracket | In Labor Force | Unemployed |
| 16 to 19 Years | 140 (35.5%) | 7 (5.0%) |
| 20 to 24 Years | 329 (52.1%) | 22 (6.7%) |
| 25 to 29 Years | 335 (60.8%) | 28 (8.4%) |
| 30 to 34 Years | 610 (77.8%) | 15 (2.5%) |
| 35 to 44 Years | 982 (61.1%) | 76 (7.7%) |
| 45 to 54 Years | 968 (67.9%) | 37 (3.8%) |
| 55 to 59 Years | 526 (57.9%) | 0 (0.0%) |
| 60 to 64 Years | 351 (41.5%) | 8 (2.3%) |
| 65 to 74 Years | 547 (34.1%) | 0 (0.0%) |
| 75 Years and over | 60 (5.6%) | 0 (0.0%) |
| Total | 4,854 (49.4%) | 194 (4.0%) |
Employment Status by Educational Attainment in Lunenburg County
According to labor force statistics for Lunenburg County, 61.6% of individuals (3,771) out of the total population between 25 and 64 years of age (6,121) are in the labor force, with 4.3% or 162 of them being unemployed. The group with the highest labor force participation rate are those with the educational attainment of bachelor's degree or higher, with 80.3% or 527 individuals in the labor force. Within the labor force, individuals with bachelor's degree or higher education have the highest percentage of unemployment, with 7.4% or 39 of them being unemployed.

| Educational Attainment | In Labor Force | Unemployed |
| Less than High School | 483 (41.5%) | 5 (0.4%) |
| High School Diploma | 1,351 (58.1%) | 140 (6.0%) |
| College / Associate Degree | 1,411 (71.4%) | 59 (3.0%) |
| Bachelor's Degree or higher | 527 (80.3%) | 49 (7.4%) |
| Total | 3,771 (61.6%) | 263 (4.3%) |
Employment Occupations by Sex in Lunenburg County
Management, Business, Science and Arts Occupations
The most common Management, Business, Science and Arts occupations in Lunenburg County are Management (408 | 8.8%), Health Diagnosing & Treating (304 | 6.5%), Computers, Engineering & Science (252 | 5.4%), Architecture & Engineering (188 | 4.0%), and Community & Social Service (184 | 4.0%).
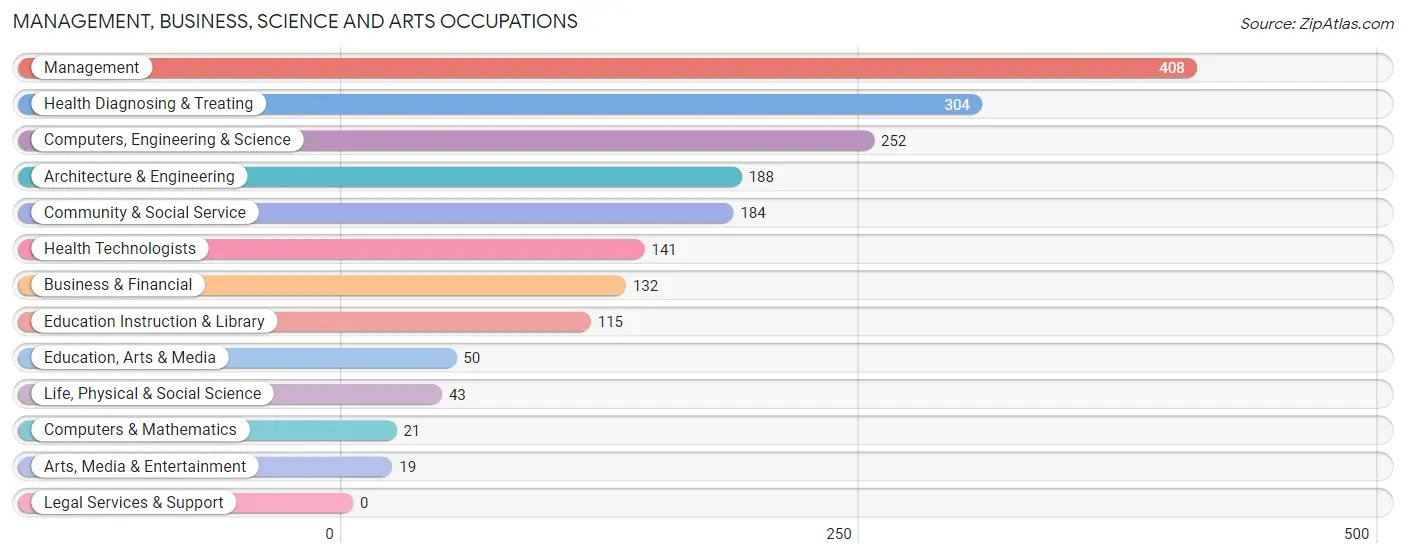
Management, Business, Science and Arts Occupations by Sex
Within the Management, Business, Science and Arts occupations in Lunenburg County, the most male-oriented occupations are Computers & Mathematics (100.0%), Architecture & Engineering (89.9%), and Computers, Engineering & Science (79.4%), while the most female-oriented occupations are Arts, Media & Entertainment (100.0%), Health Technologists (98.6%), and Health Diagnosing & Treating (91.4%).
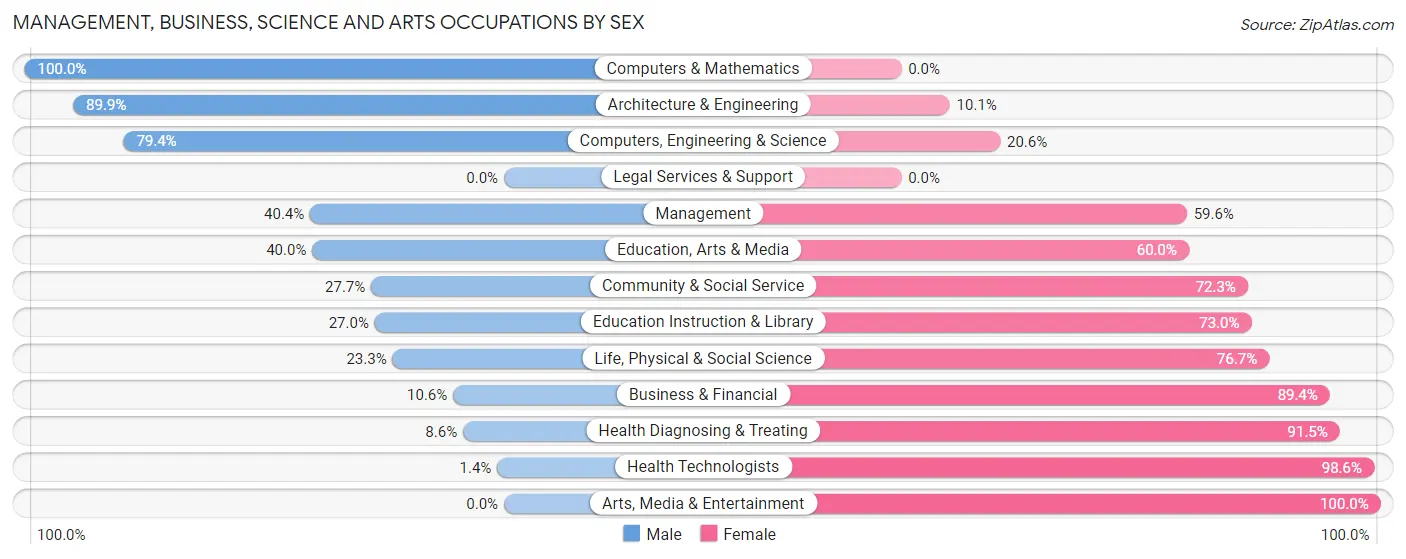
| Occupation | Male | Female |
| Management | 165 (40.4%) | 243 (59.6%) |
| Business & Financial | 14 (10.6%) | 118 (89.4%) |
| Computers, Engineering & Science | 200 (79.4%) | 52 (20.6%) |
| Computers & Mathematics | 21 (100.0%) | 0 (0.0%) |
| Architecture & Engineering | 169 (89.9%) | 19 (10.1%) |
| Life, Physical & Social Science | 10 (23.3%) | 33 (76.7%) |
| Community & Social Service | 51 (27.7%) | 133 (72.3%) |
| Education, Arts & Media | 20 (40.0%) | 30 (60.0%) |
| Legal Services & Support | 0 (0.0%) | 0 (0.0%) |
| Education Instruction & Library | 31 (27.0%) | 84 (73.0%) |
| Arts, Media & Entertainment | 0 (0.0%) | 19 (100.0%) |
| Health Diagnosing & Treating | 26 (8.6%) | 278 (91.4%) |
| Health Technologists | 2 (1.4%) | 139 (98.6%) |
| Total (Category) | 456 (35.6%) | 824 (64.4%) |
| Total (Overall) | 2,599 (55.8%) | 2,057 (44.2%) |
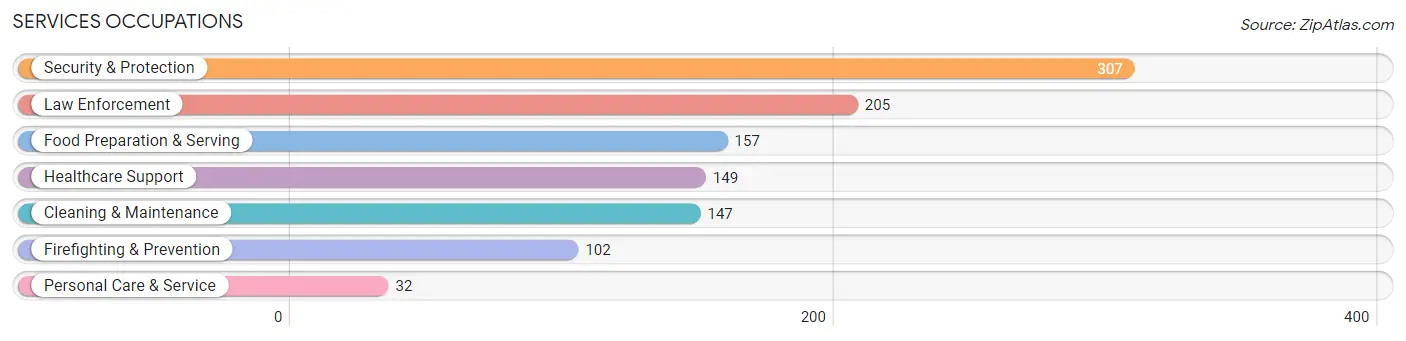
Services Occupations
The most common Services occupations in Lunenburg County are Security & Protection (307 | 6.6%), Law Enforcement (205 | 4.4%), Food Preparation & Serving (157 | 3.4%), Healthcare Support (149 | 3.2%), and Cleaning & Maintenance (147 | 3.2%).
Services Occupations by Sex
Within the Services occupations in Lunenburg County, the most male-oriented occupations are Cleaning & Maintenance (80.9%), Food Preparation & Serving (59.9%), and Law Enforcement (43.4%), while the most female-oriented occupations are Healthcare Support (88.6%), Firefighting & Prevention (80.4%), and Personal Care & Service (78.1%).
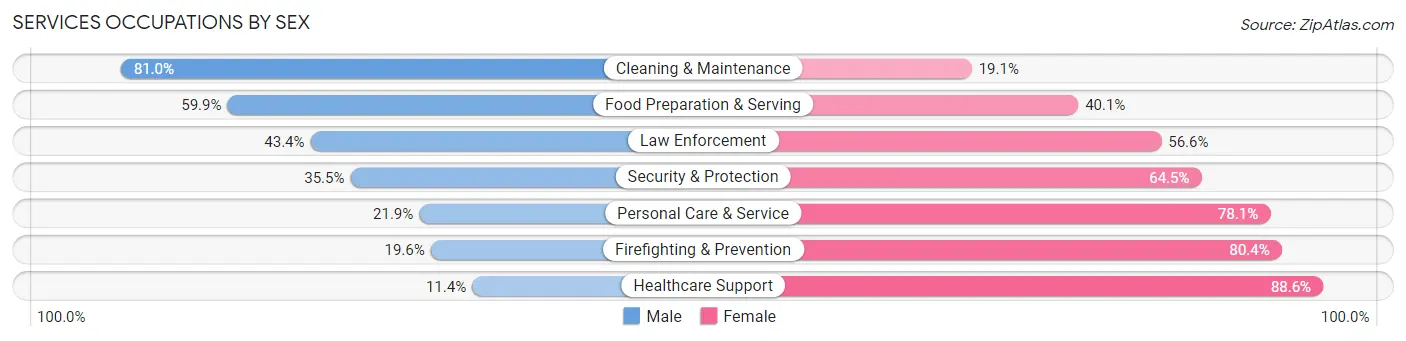
| Occupation | Male | Female |
| Healthcare Support | 17 (11.4%) | 132 (88.6%) |
| Security & Protection | 109 (35.5%) | 198 (64.5%) |
| Firefighting & Prevention | 20 (19.6%) | 82 (80.4%) |
| Law Enforcement | 89 (43.4%) | 116 (56.6%) |
| Food Preparation & Serving | 94 (59.9%) | 63 (40.1%) |
| Cleaning & Maintenance | 119 (80.9%) | 28 (19.1%) |
| Personal Care & Service | 7 (21.9%) | 25 (78.1%) |
| Total (Category) | 346 (43.7%) | 446 (56.3%) |
| Total (Overall) | 2,599 (55.8%) | 2,057 (44.2%) |
Sales and Office Occupations
The most common Sales and Office occupations in Lunenburg County are Office & Administration (444 | 9.5%), and Sales & Related (392 | 8.4%).

Sales and Office Occupations by Sex

| Occupation | Male | Female |
| Sales & Related | 233 (59.4%) | 159 (40.6%) |
| Office & Administration | 159 (35.8%) | 285 (64.2%) |
| Total (Category) | 392 (46.9%) | 444 (53.1%) |
| Total (Overall) | 2,599 (55.8%) | 2,057 (44.2%) |
Natural Resources, Construction and Maintenance Occupations
The most common Natural Resources, Construction and Maintenance occupations in Lunenburg County are Construction & Extraction (435 | 9.3%), Installation, Maintenance & Repair (292 | 6.3%), and Farming, Fishing & Forestry (36 | 0.8%).

Natural Resources, Construction and Maintenance Occupations by Sex

| Occupation | Male | Female |
| Farming, Fishing & Forestry | 36 (100.0%) | 0 (0.0%) |
| Construction & Extraction | 435 (100.0%) | 0 (0.0%) |
| Installation, Maintenance & Repair | 290 (99.3%) | 2 (0.7%) |
| Total (Category) | 761 (99.7%) | 2 (0.3%) |
| Total (Overall) | 2,599 (55.8%) | 2,057 (44.2%) |
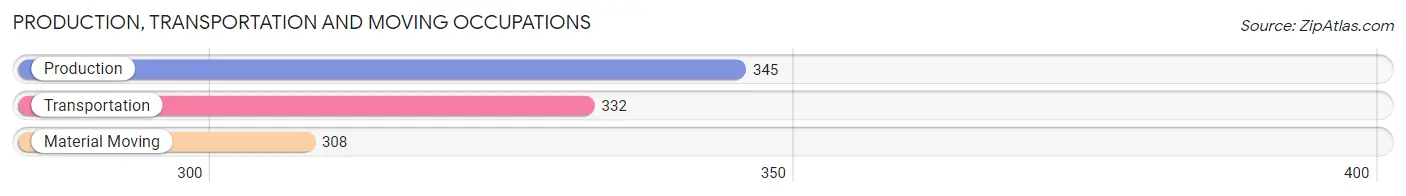
Production, Transportation and Moving Occupations
The most common Production, Transportation and Moving occupations in Lunenburg County are Production (345 | 7.4%), Transportation (332 | 7.1%), and Material Moving (308 | 6.6%).
Production, Transportation and Moving Occupations by Sex

| Occupation | Male | Female |
| Production | 203 (58.8%) | 142 (41.2%) |
| Transportation | 317 (95.5%) | 15 (4.5%) |
| Material Moving | 124 (40.3%) | 184 (59.7%) |
| Total (Category) | 644 (65.4%) | 341 (34.6%) |
| Total (Overall) | 2,599 (55.8%) | 2,057 (44.2%) |
Employment Industries by Sex in Lunenburg County
Employment Industries in Lunenburg County
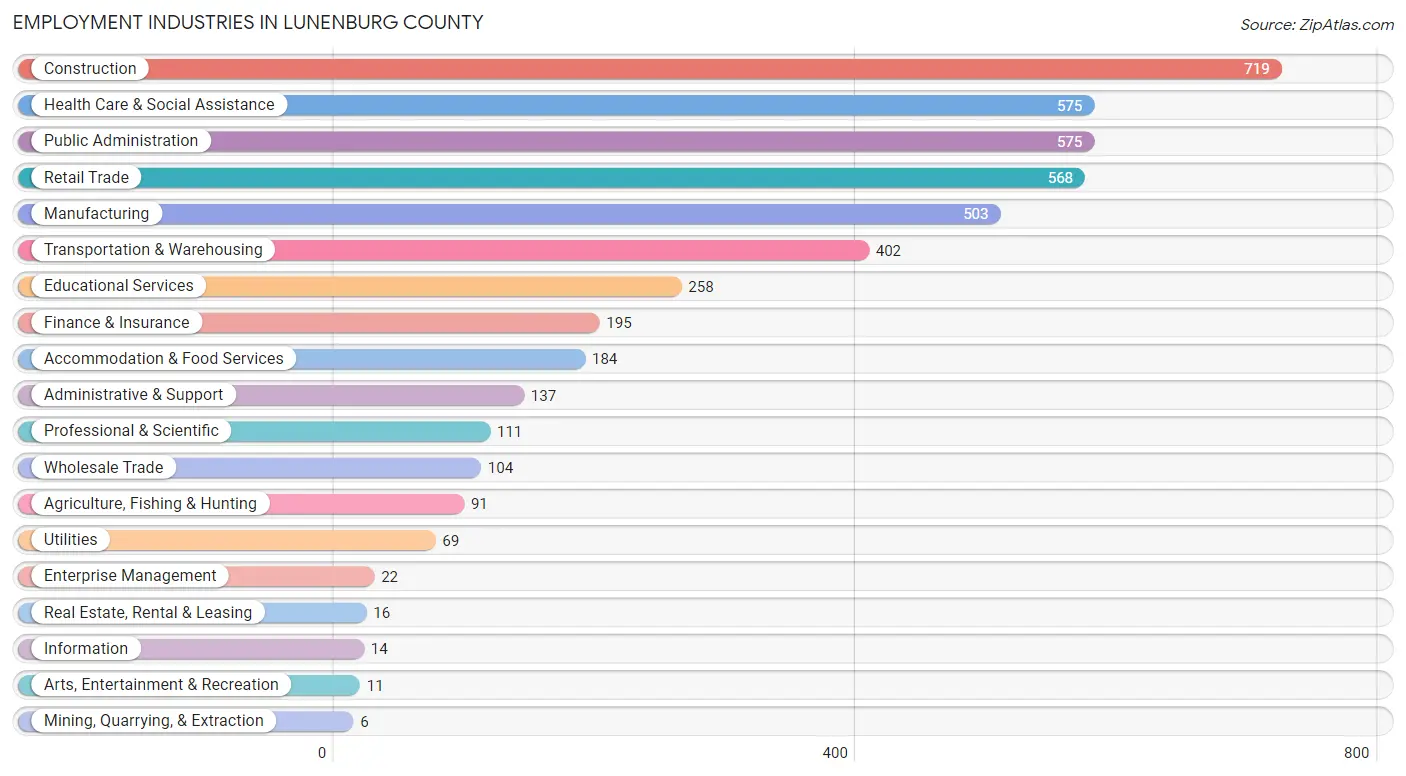
The major employment industries in Lunenburg County include Construction (719 | 15.4%), Health Care & Social Assistance (575 | 12.3%), Public Administration (575 | 12.3%), Retail Trade (568 | 12.2%), and Manufacturing (503 | 10.8%).
Employment Industries by Sex in Lunenburg County
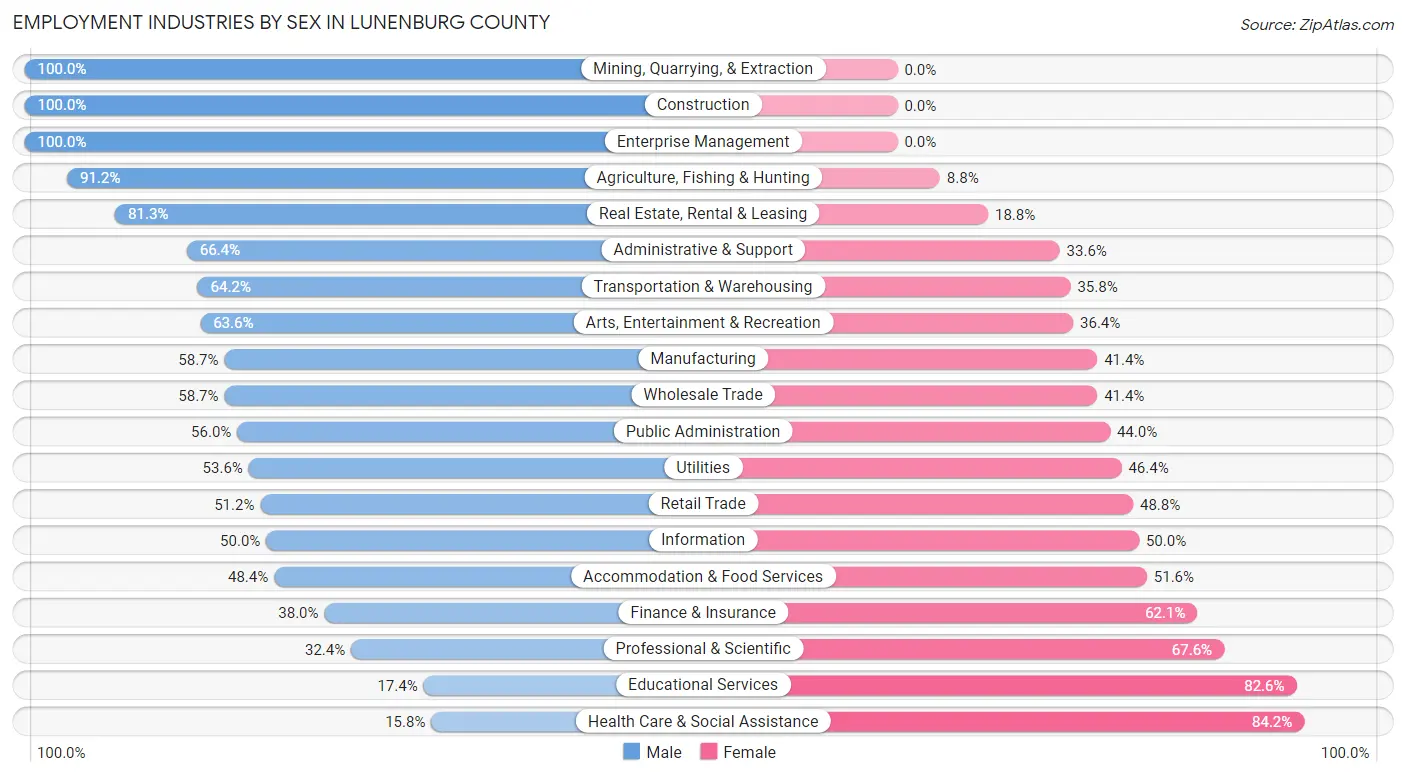
The Lunenburg County industries that see more men than women are Mining, Quarrying, & Extraction (100.0%), Construction (100.0%), and Enterprise Management (100.0%), whereas the industries that tend to have a higher number of women are Health Care & Social Assistance (84.2%), Educational Services (82.6%), and Professional & Scientific (67.6%).
| Industry | Male | Female |
| Agriculture, Fishing & Hunting | 83 (91.2%) | 8 (8.8%) |
| Mining, Quarrying, & Extraction | 6 (100.0%) | 0 (0.0%) |
| Construction | 719 (100.0%) | 0 (0.0%) |
| Manufacturing | 295 (58.7%) | 208 (41.3%) |
| Wholesale Trade | 61 (58.7%) | 43 (41.3%) |
| Retail Trade | 291 (51.2%) | 277 (48.8%) |
| Transportation & Warehousing | 258 (64.2%) | 144 (35.8%) |
| Utilities | 37 (53.6%) | 32 (46.4%) |
| Information | 7 (50.0%) | 7 (50.0%) |
| Finance & Insurance | 74 (38.0%) | 121 (62.1%) |
| Real Estate, Rental & Leasing | 13 (81.2%) | 3 (18.8%) |
| Professional & Scientific | 36 (32.4%) | 75 (67.6%) |
| Enterprise Management | 22 (100.0%) | 0 (0.0%) |
| Administrative & Support | 91 (66.4%) | 46 (33.6%) |
| Educational Services | 45 (17.4%) | 213 (82.6%) |
| Health Care & Social Assistance | 91 (15.8%) | 484 (84.2%) |
| Arts, Entertainment & Recreation | 7 (63.6%) | 4 (36.4%) |
| Accommodation & Food Services | 89 (48.4%) | 95 (51.6%) |
| Public Administration | 322 (56.0%) | 253 (44.0%) |
| Total | 2,599 (55.8%) | 2,057 (44.2%) |
Education in Lunenburg County
School Enrollment in Lunenburg County
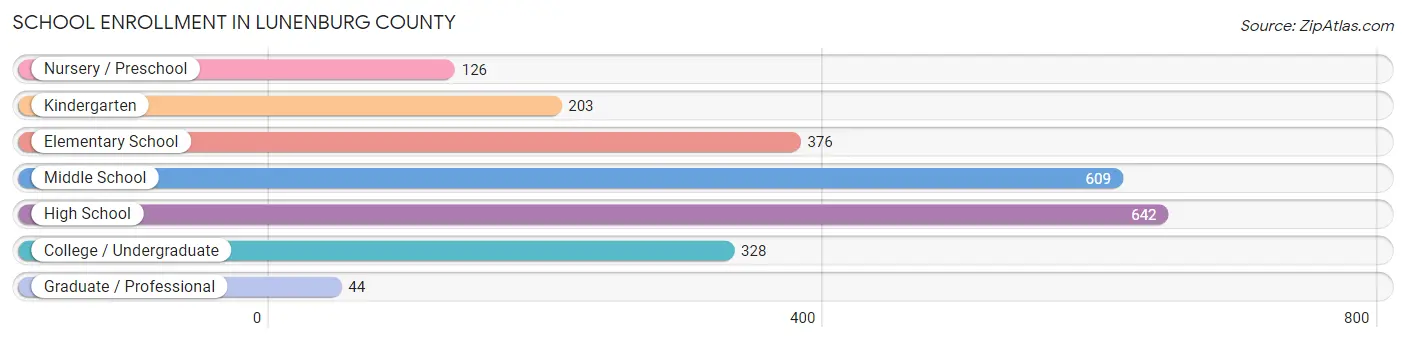
The most common levels of schooling among the 2,328 students in Lunenburg County are high school (642 | 27.6%), middle school (609 | 26.2%), and elementary school (376 | 16.2%).
| School Level | # Students | % Students |
| Nursery / Preschool | 126 | 5.4% |
| Kindergarten | 203 | 8.7% |
| Elementary School | 376 | 16.2% |
| Middle School | 609 | 26.2% |
| High School | 642 | 27.6% |
| College / Undergraduate | 328 | 14.1% |
| Graduate / Professional | 44 | 1.9% |
| Total | 2,328 | 100.0% |
School Enrollment by Age by Funding Source in Lunenburg County
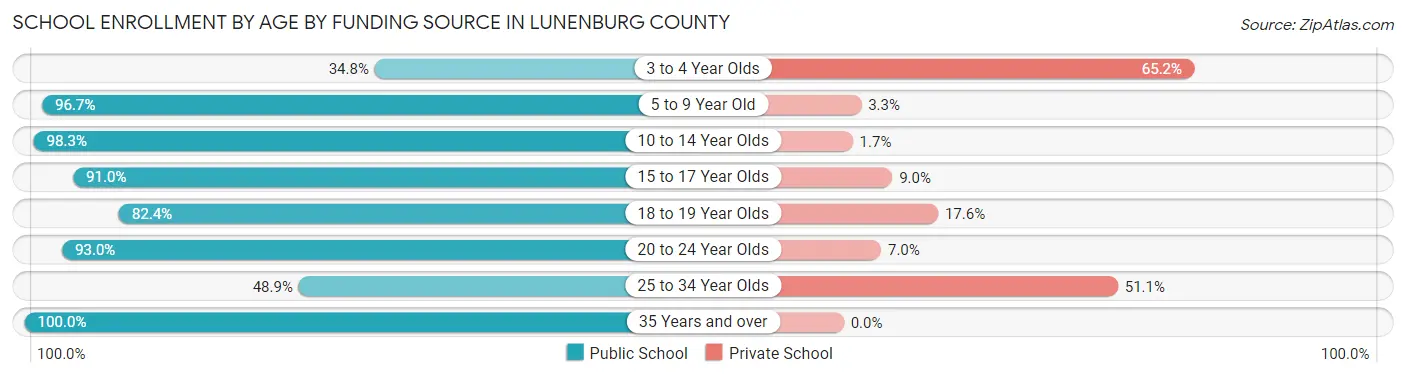
Out of a total of 2,328 students who are enrolled in schools in Lunenburg County, 198 (8.5%) attend a private institution, while the remaining 2,130 (91.5%) are enrolled in public schools. The age group of 3 to 4 year olds has the highest likelihood of being enrolled in private schools, with 75 (65.2% in the age bracket) enrolled. Conversely, the age group of 35 years and over has the lowest likelihood of being enrolled in a private school, with 72 (100.0% in the age bracket) attending a public institution.
| Age Bracket | Public School | Private School |
| 3 to 4 Year Olds | 40 (34.8%) | 75 (65.2%) |
| 5 to 9 Year Old | 505 (96.7%) | 17 (3.3%) |
| 10 to 14 Year Olds | 824 (98.3%) | 14 (1.7%) |
| 15 to 17 Year Olds | 352 (91.0%) | 35 (9.0%) |
| 18 to 19 Year Olds | 61 (82.4%) | 13 (17.6%) |
| 20 to 24 Year Olds | 254 (93.0%) | 19 (7.0%) |
| 25 to 34 Year Olds | 23 (48.9%) | 24 (51.1%) |
| 35 Years and over | 72 (100.0%) | 0 (0.0%) |
| Total | 2,130 (91.5%) | 198 (8.5%) |
Educational Attainment by Field of Study in Lunenburg County
Business (212 | 20.5%), arts & humanities (146 | 14.1%), social sciences (126 | 12.2%), liberal arts & history (100 | 9.7%), and education (97 | 9.4%) are the most common fields of study among 1,036 individuals in Lunenburg County who have obtained a bachelor's degree or higher.
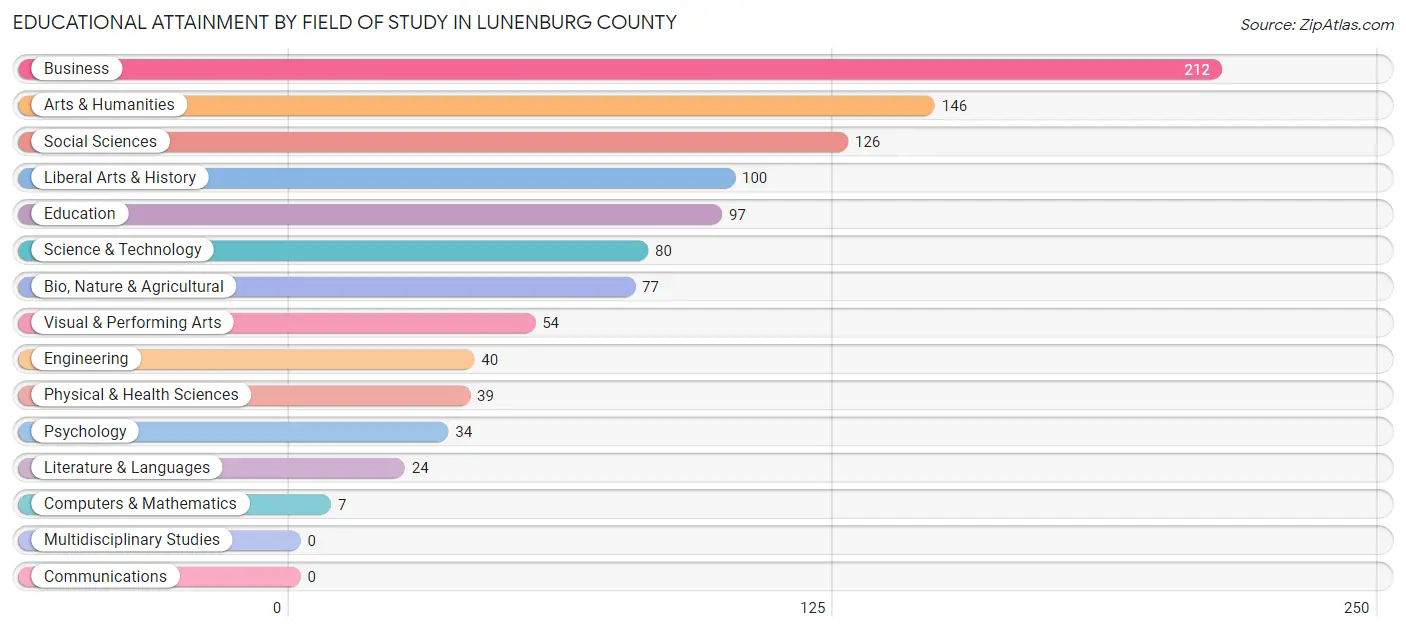
| Field of Study | # Graduates | % Graduates |
| Computers & Mathematics | 7 | 0.7% |
| Bio, Nature & Agricultural | 77 | 7.4% |
| Physical & Health Sciences | 39 | 3.8% |
| Psychology | 34 | 3.3% |
| Social Sciences | 126 | 12.2% |
| Engineering | 40 | 3.9% |
| Multidisciplinary Studies | 0 | 0.0% |
| Science & Technology | 80 | 7.7% |
| Business | 212 | 20.5% |
| Education | 97 | 9.4% |
| Literature & Languages | 24 | 2.3% |
| Liberal Arts & History | 100 | 9.7% |
| Visual & Performing Arts | 54 | 5.2% |
| Communications | 0 | 0.0% |
| Arts & Humanities | 146 | 14.1% |
| Total | 1,036 | 100.0% |
Transportation & Commute in Lunenburg County
Vehicle Availability by Sex in Lunenburg County
The most prevalent vehicle ownership categories in Lunenburg County are males with 3 vehicles (631, accounting for 24.5%) and females with 3 vehicles (332, making up 32.0%).
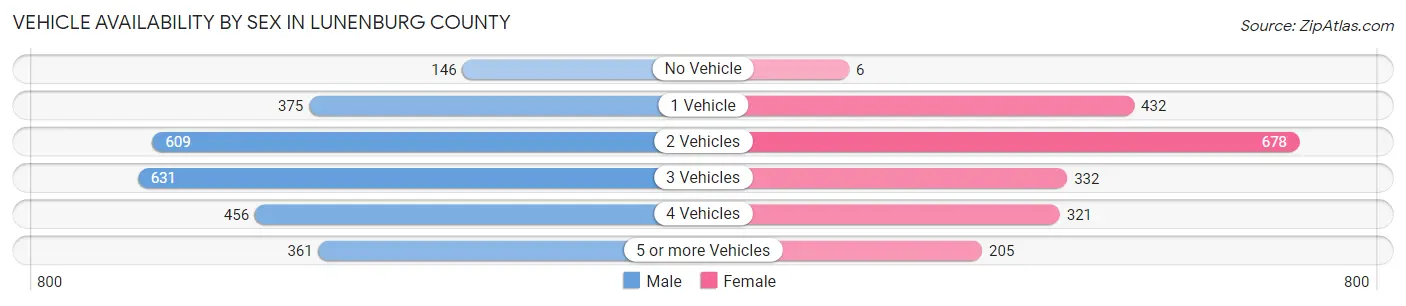
| Vehicles Available | Male | Female |
| No Vehicle | 146 (5.7%) | 6 (0.3%) |
| 1 Vehicle | 375 (14.5%) | 432 (21.9%) |
| 2 Vehicles | 609 (23.6%) | 678 (34.4%) |
| 3 Vehicles | 631 (24.5%) | 332 (16.8%) |
| 4 Vehicles | 456 (17.7%) | 321 (16.3%) |
| 5 or more Vehicles | 361 (14.0%) | 205 (10.4%) |
| Total | 2,578 (100.0%) | 1,974 (100.0%) |
Commute Time in Lunenburg County
The most frequently occuring commute durations in Lunenburg County are 15 to 19 minutes (619 commuters, 14.3%), 45 to 59 minutes (599 commuters, 13.9%), and 20 to 24 minutes (549 commuters, 12.7%).
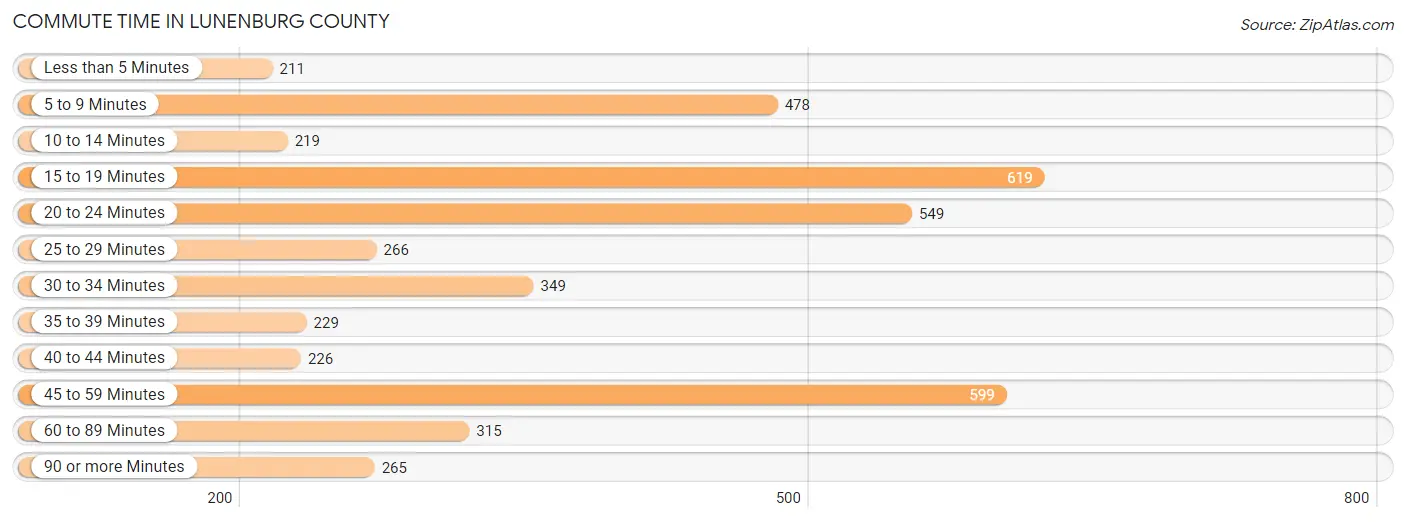
| Commute Time | # Commuters | % Commuters |
| Less than 5 Minutes | 211 | 4.9% |
| 5 to 9 Minutes | 478 | 11.1% |
| 10 to 14 Minutes | 219 | 5.1% |
| 15 to 19 Minutes | 619 | 14.3% |
| 20 to 24 Minutes | 549 | 12.7% |
| 25 to 29 Minutes | 266 | 6.1% |
| 30 to 34 Minutes | 349 | 8.1% |
| 35 to 39 Minutes | 229 | 5.3% |
| 40 to 44 Minutes | 226 | 5.2% |
| 45 to 59 Minutes | 599 | 13.9% |
| 60 to 89 Minutes | 315 | 7.3% |
| 90 or more Minutes | 265 | 6.1% |
Commute Time by Sex in Lunenburg County
The most common commute times in Lunenburg County are 45 to 59 minutes (477 commuters, 19.5%) for males and 15 to 19 minutes (393 commuters, 21.0%) for females.
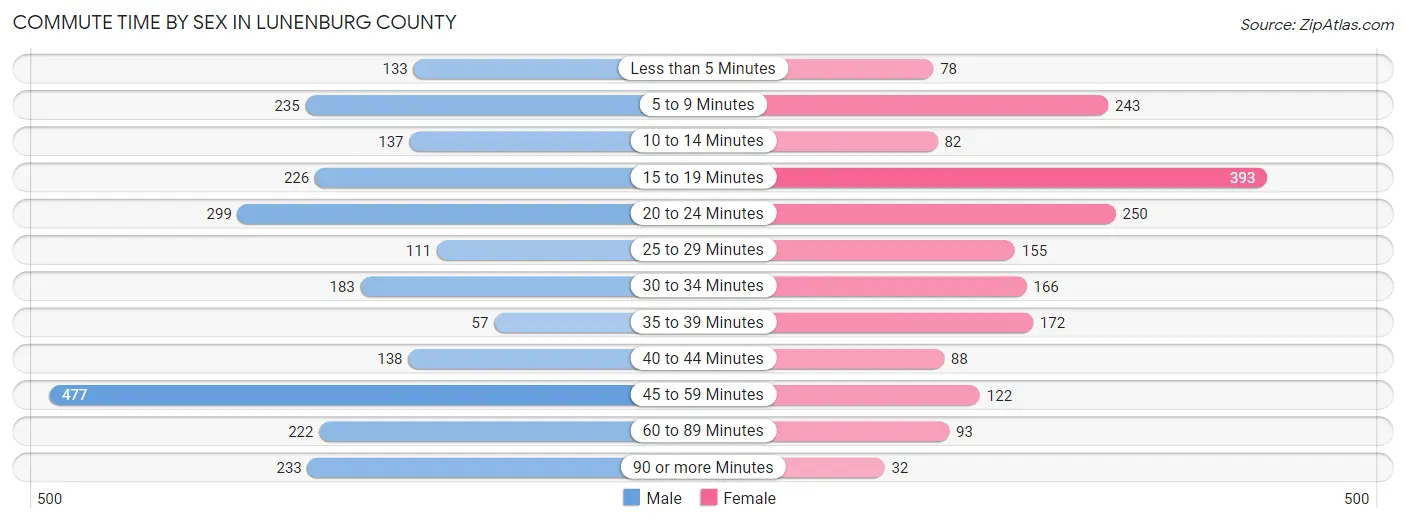
| Commute Time | Male | Female |
| Less than 5 Minutes | 133 (5.4%) | 78 (4.2%) |
| 5 to 9 Minutes | 235 (9.6%) | 243 (13.0%) |
| 10 to 14 Minutes | 137 (5.6%) | 82 (4.4%) |
| 15 to 19 Minutes | 226 (9.2%) | 393 (21.0%) |
| 20 to 24 Minutes | 299 (12.2%) | 250 (13.3%) |
| 25 to 29 Minutes | 111 (4.5%) | 155 (8.3%) |
| 30 to 34 Minutes | 183 (7.5%) | 166 (8.9%) |
| 35 to 39 Minutes | 57 (2.3%) | 172 (9.2%) |
| 40 to 44 Minutes | 138 (5.6%) | 88 (4.7%) |
| 45 to 59 Minutes | 477 (19.5%) | 122 (6.5%) |
| 60 to 89 Minutes | 222 (9.1%) | 93 (5.0%) |
| 90 or more Minutes | 233 (9.5%) | 32 (1.7%) |
Time of Departure to Work by Sex in Lunenburg County
The most frequent times of departure to work in Lunenburg County are 6:00 AM to 6:29 AM (371, 15.1%) for males and 7:00 AM to 7:29 AM (380, 20.3%) for females.
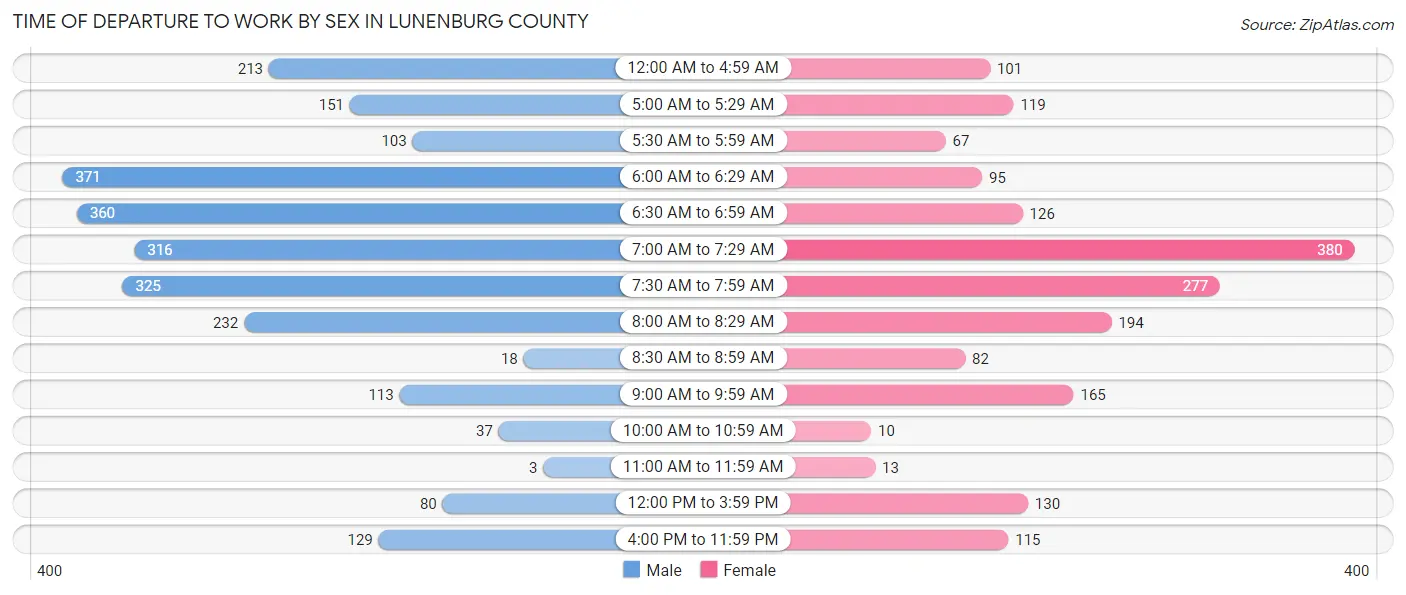
| Time of Departure | Male | Female |
| 12:00 AM to 4:59 AM | 213 (8.7%) | 101 (5.4%) |
| 5:00 AM to 5:29 AM | 151 (6.2%) | 119 (6.4%) |
| 5:30 AM to 5:59 AM | 103 (4.2%) | 67 (3.6%) |
| 6:00 AM to 6:29 AM | 371 (15.1%) | 95 (5.1%) |
| 6:30 AM to 6:59 AM | 360 (14.7%) | 126 (6.7%) |
| 7:00 AM to 7:29 AM | 316 (12.9%) | 380 (20.3%) |
| 7:30 AM to 7:59 AM | 325 (13.3%) | 277 (14.8%) |
| 8:00 AM to 8:29 AM | 232 (9.5%) | 194 (10.3%) |
| 8:30 AM to 8:59 AM | 18 (0.7%) | 82 (4.4%) |
| 9:00 AM to 9:59 AM | 113 (4.6%) | 165 (8.8%) |
| 10:00 AM to 10:59 AM | 37 (1.5%) | 10 (0.5%) |
| 11:00 AM to 11:59 AM | 3 (0.1%) | 13 (0.7%) |
| 12:00 PM to 3:59 PM | 80 (3.3%) | 130 (6.9%) |
| 4:00 PM to 11:59 PM | 129 (5.3%) | 115 (6.1%) |
| Total | 2,451 (100.0%) | 1,874 (100.0%) |
Housing Occupancy in Lunenburg County
Occupancy by Ownership in Lunenburg County
Of the total 4,566 dwellings in Lunenburg County, owner-occupied units account for 3,188 (69.8%), while renter-occupied units make up 1,378 (30.2%).
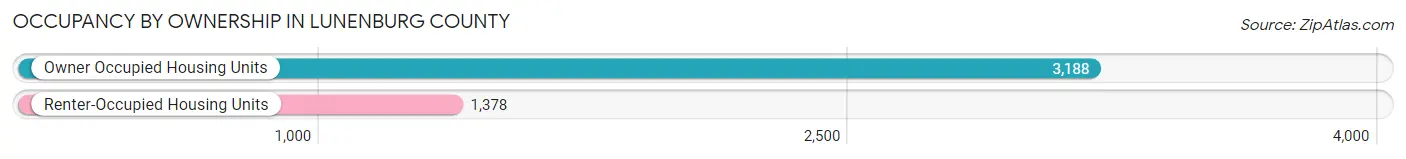
| Occupancy | # Housing Units | % Housing Units |
| Owner Occupied Housing Units | 3,188 | 69.8% |
| Renter-Occupied Housing Units | 1,378 | 30.2% |
| Total Occupied Housing Units | 4,566 | 100.0% |
Occupancy by Household Size in Lunenburg County
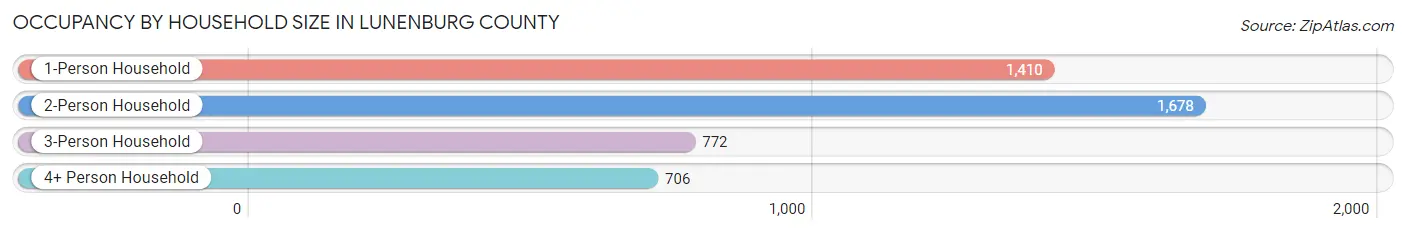
| Household Size | # Housing Units | % Housing Units |
| 1-Person Household | 1,410 | 30.9% |
| 2-Person Household | 1,678 | 36.7% |
| 3-Person Household | 772 | 16.9% |
| 4+ Person Household | 706 | 15.5% |
| Total Housing Units | 4,566 | 100.0% |
Occupancy by Ownership by Household Size in Lunenburg County
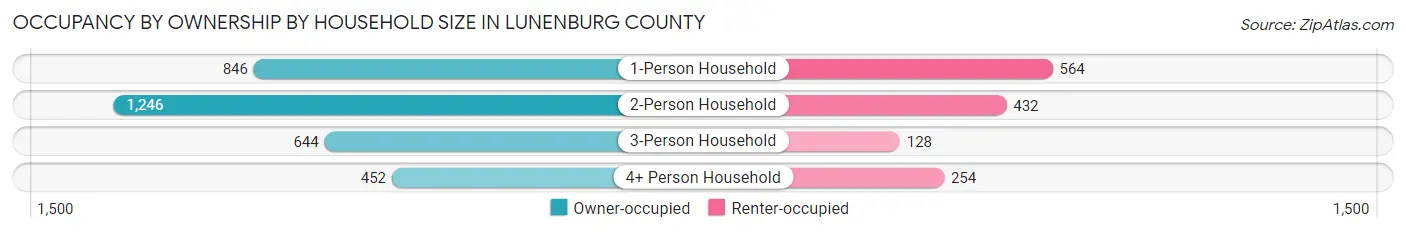
| Household Size | Owner-occupied | Renter-occupied |
| 1-Person Household | 846 (60.0%) | 564 (40.0%) |
| 2-Person Household | 1,246 (74.3%) | 432 (25.7%) |
| 3-Person Household | 644 (83.4%) | 128 (16.6%) |
| 4+ Person Household | 452 (64.0%) | 254 (36.0%) |
| Total Housing Units | 3,188 (69.8%) | 1,378 (30.2%) |
Occupancy by Educational Attainment in Lunenburg County
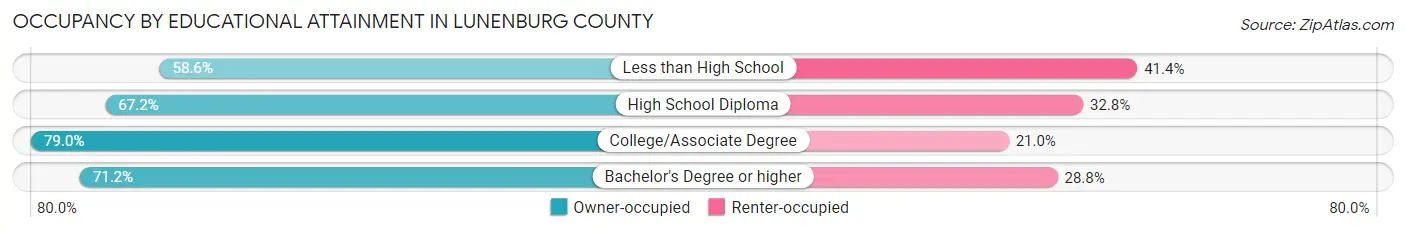
| Household Size | Owner-occupied | Renter-occupied |
| Less than High School | 532 (58.6%) | 376 (41.4%) |
| High School Diploma | 1,046 (67.2%) | 511 (32.8%) |
| College/Associate Degree | 1,157 (79.0%) | 308 (21.0%) |
| Bachelor's Degree or higher | 453 (71.2%) | 183 (28.8%) |
Occupancy by Age of Householder in Lunenburg County
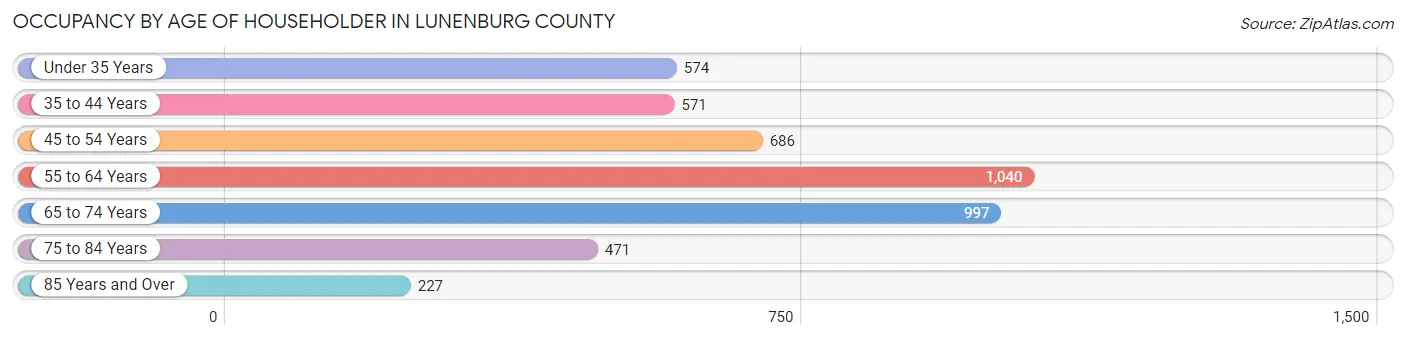
| Age Bracket | # Households | % Households |
| Under 35 Years | 574 | 12.6% |
| 35 to 44 Years | 571 | 12.5% |
| 45 to 54 Years | 686 | 15.0% |
| 55 to 64 Years | 1,040 | 22.8% |
| 65 to 74 Years | 997 | 21.8% |
| 75 to 84 Years | 471 | 10.3% |
| 85 Years and Over | 227 | 5.0% |
| Total | 4,566 | 100.0% |
Housing Finances in Lunenburg County
Median Income by Occupancy in Lunenburg County
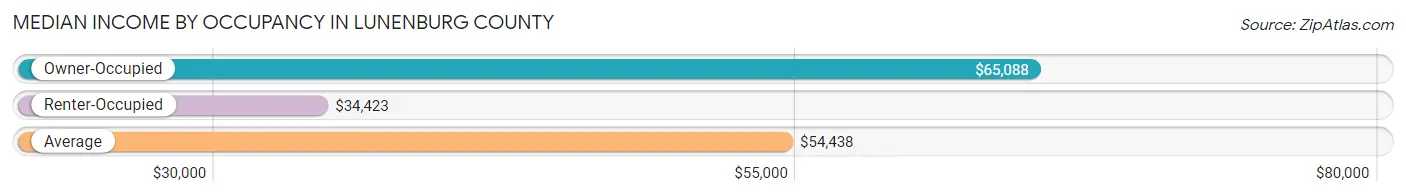
| Occupancy Type | # Households | Median Income |
| Owner-Occupied | 3,188 (69.8%) | $65,088 |
| Renter-Occupied | 1,378 (30.2%) | $34,423 |
| Average | 4,566 (100.0%) | $54,438 |
Occupancy by Householder Income Bracket in Lunenburg County
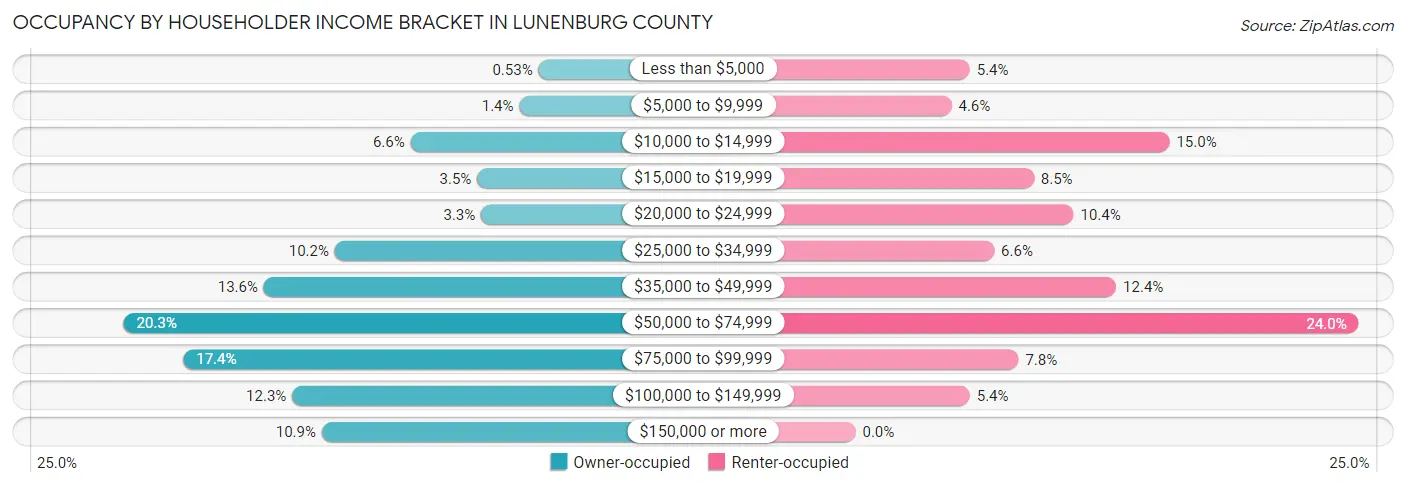
| Income Bracket | Owner-occupied | Renter-occupied |
| Less than $5,000 | 17 (0.5%) | 75 (5.4%) |
| $5,000 to $9,999 | 46 (1.4%) | 63 (4.6%) |
| $10,000 to $14,999 | 211 (6.6%) | 206 (14.9%) |
| $15,000 to $19,999 | 110 (3.5%) | 117 (8.5%) |
| $20,000 to $24,999 | 104 (3.3%) | 143 (10.4%) |
| $25,000 to $34,999 | 326 (10.2%) | 91 (6.6%) |
| $35,000 to $49,999 | 434 (13.6%) | 171 (12.4%) |
| $50,000 to $74,999 | 647 (20.3%) | 330 (23.9%) |
| $75,000 to $99,999 | 556 (17.4%) | 107 (7.8%) |
| $100,000 to $149,999 | 391 (12.3%) | 75 (5.4%) |
| $150,000 or more | 346 (10.8%) | 0 (0.0%) |
| Total | 3,188 (100.0%) | 1,378 (100.0%) |
Monthly Housing Cost Tiers in Lunenburg County
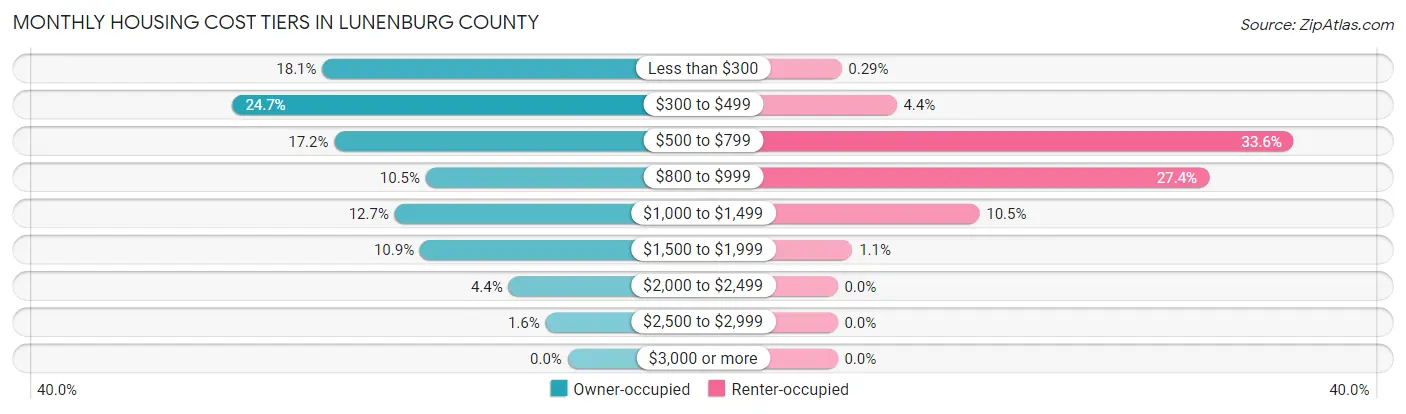
| Monthly Cost | Owner-occupied | Renter-occupied |
| Less than $300 | 576 (18.1%) | 4 (0.3%) |
| $300 to $499 | 787 (24.7%) | 60 (4.3%) |
| $500 to $799 | 548 (17.2%) | 463 (33.6%) |
| $800 to $999 | 333 (10.4%) | 377 (27.4%) |
| $1,000 to $1,499 | 406 (12.7%) | 144 (10.4%) |
| $1,500 to $1,999 | 347 (10.9%) | 15 (1.1%) |
| $2,000 to $2,499 | 139 (4.4%) | 0 (0.0%) |
| $2,500 to $2,999 | 52 (1.6%) | 0 (0.0%) |
| $3,000 or more | 0 (0.0%) | 0 (0.0%) |
| Total | 3,188 (100.0%) | 1,378 (100.0%) |
Physical Housing Characteristics in Lunenburg County
Housing Structures in Lunenburg County
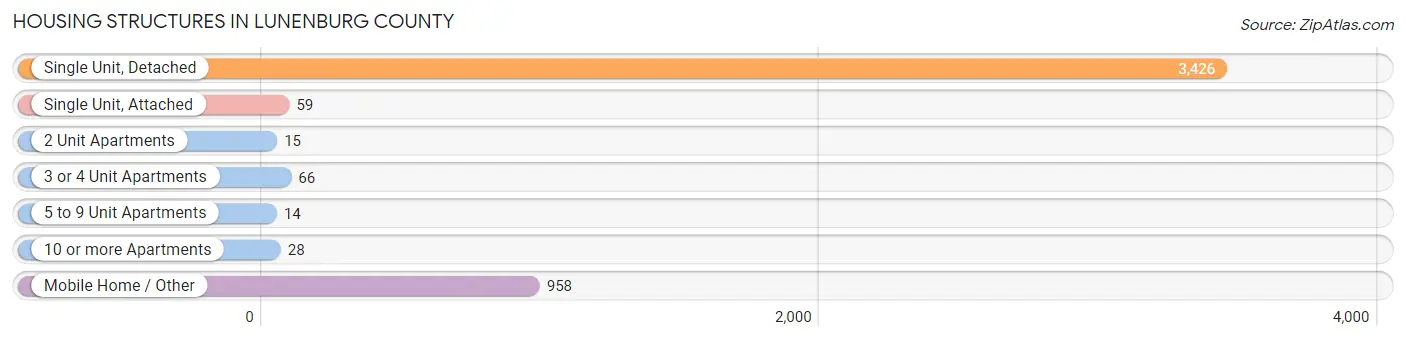
| Structure Type | # Housing Units | % Housing Units |
| Single Unit, Detached | 3,426 | 75.0% |
| Single Unit, Attached | 59 | 1.3% |
| 2 Unit Apartments | 15 | 0.3% |
| 3 or 4 Unit Apartments | 66 | 1.5% |
| 5 to 9 Unit Apartments | 14 | 0.3% |
| 10 or more Apartments | 28 | 0.6% |
| Mobile Home / Other | 958 | 21.0% |
| Total | 4,566 | 100.0% |
Housing Structures by Occupancy in Lunenburg County
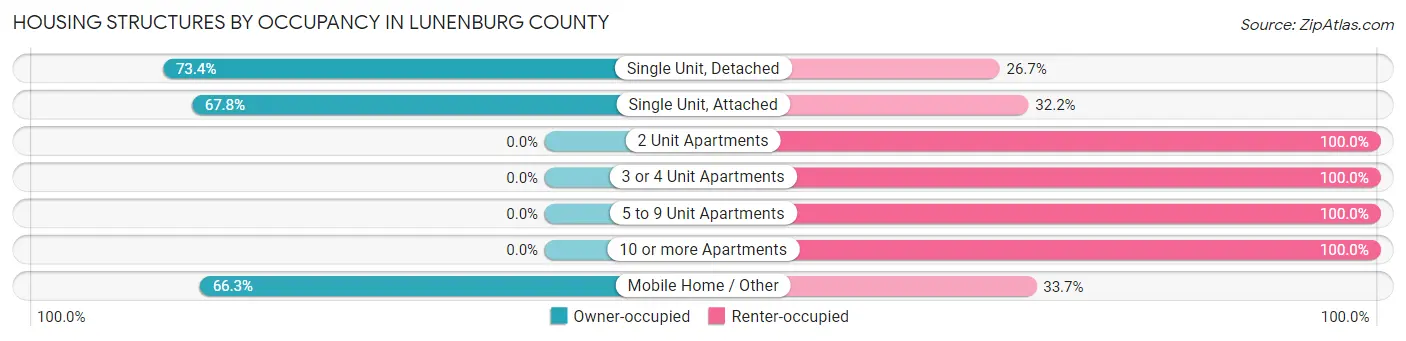
| Structure Type | Owner-occupied | Renter-occupied |
| Single Unit, Detached | 2,513 (73.4%) | 913 (26.7%) |
| Single Unit, Attached | 40 (67.8%) | 19 (32.2%) |
| 2 Unit Apartments | 0 (0.0%) | 15 (100.0%) |
| 3 or 4 Unit Apartments | 0 (0.0%) | 66 (100.0%) |
| 5 to 9 Unit Apartments | 0 (0.0%) | 14 (100.0%) |
| 10 or more Apartments | 0 (0.0%) | 28 (100.0%) |
| Mobile Home / Other | 635 (66.3%) | 323 (33.7%) |
| Total | 3,188 (69.8%) | 1,378 (30.2%) |
Housing Structures by Number of Rooms in Lunenburg County
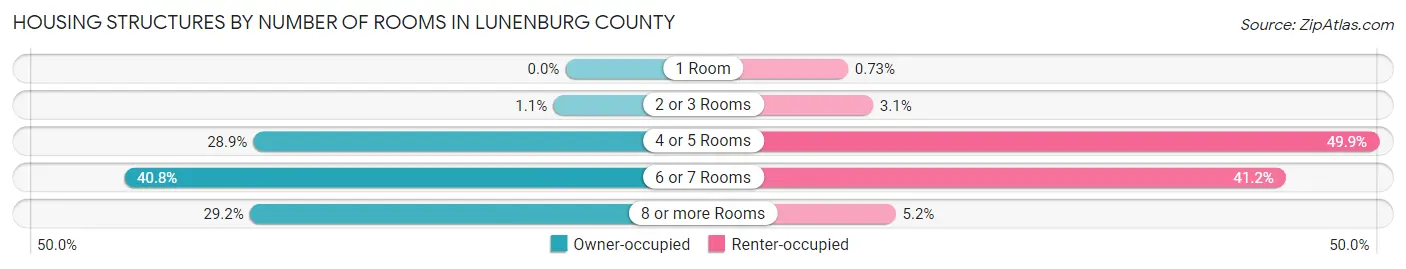
| Number of Rooms | Owner-occupied | Renter-occupied |
| 1 Room | 0 (0.0%) | 10 (0.7%) |
| 2 or 3 Rooms | 36 (1.1%) | 42 (3.0%) |
| 4 or 5 Rooms | 920 (28.9%) | 687 (49.8%) |
| 6 or 7 Rooms | 1,301 (40.8%) | 568 (41.2%) |
| 8 or more Rooms | 931 (29.2%) | 71 (5.1%) |
| Total | 3,188 (100.0%) | 1,378 (100.0%) |
Housing Structure by Heating Type in Lunenburg County
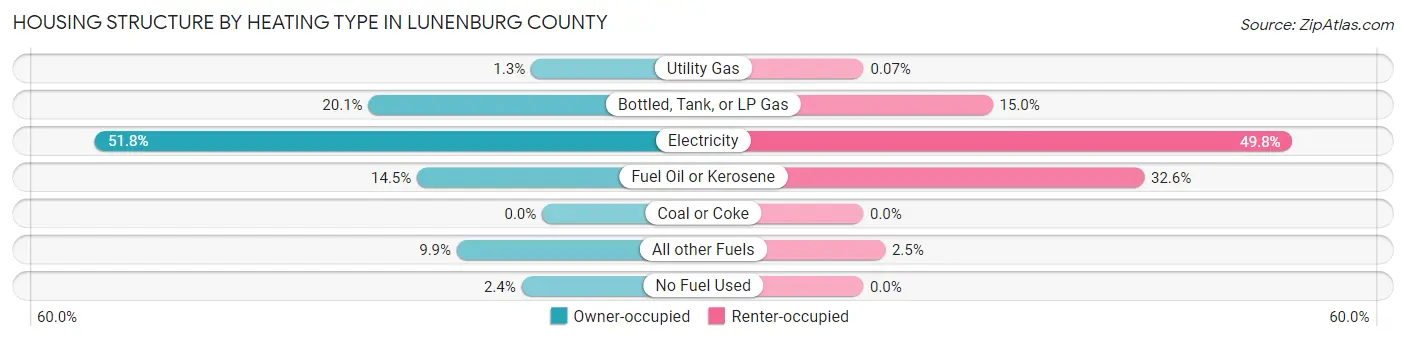
| Heating Type | Owner-occupied | Renter-occupied |
| Utility Gas | 41 (1.3%) | 1 (0.1%) |
| Bottled, Tank, or LP Gas | 642 (20.1%) | 207 (15.0%) |
| Electricity | 1,652 (51.8%) | 686 (49.8%) |
| Fuel Oil or Kerosene | 462 (14.5%) | 449 (32.6%) |
| Coal or Coke | 0 (0.0%) | 0 (0.0%) |
| All other Fuels | 315 (9.9%) | 35 (2.5%) |
| No Fuel Used | 76 (2.4%) | 0 (0.0%) |
| Total | 3,188 (100.0%) | 1,378 (100.0%) |
Household Vehicle Usage in Lunenburg County
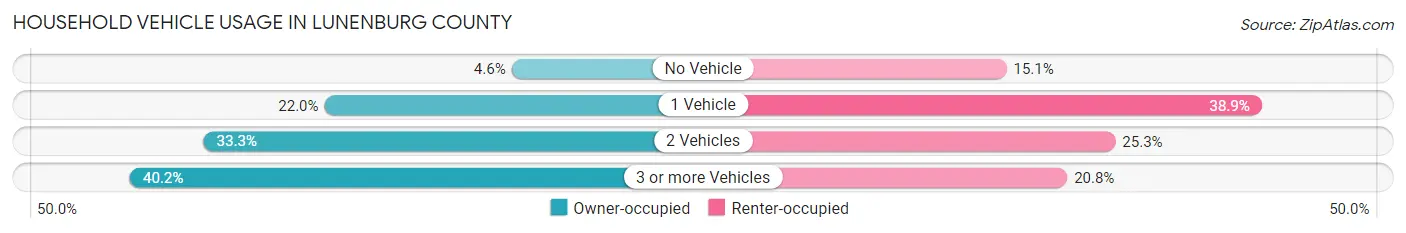
| Vehicles per Household | Owner-occupied | Renter-occupied |
| No Vehicle | 145 (4.5%) | 208 (15.1%) |
| 1 Vehicle | 702 (22.0%) | 536 (38.9%) |
| 2 Vehicles | 1,061 (33.3%) | 348 (25.3%) |
| 3 or more Vehicles | 1,280 (40.2%) | 286 (20.7%) |
| Total | 3,188 (100.0%) | 1,378 (100.0%) |
Real Estate & Mortgages in Lunenburg County
Real Estate and Mortgage Overview in Lunenburg County
| Characteristic | Without Mortgage | With Mortgage |
| Housing Units | 1,775 | 1,413 |
| Median Property Value | $136,000 | $151,000 |
| Median Household Income | $59,097 | $201 |
| Monthly Housing Costs | $380 | $0 |
| Real Estate Taxes | $550 | $10 |
Property Value by Mortgage Status in Lunenburg County
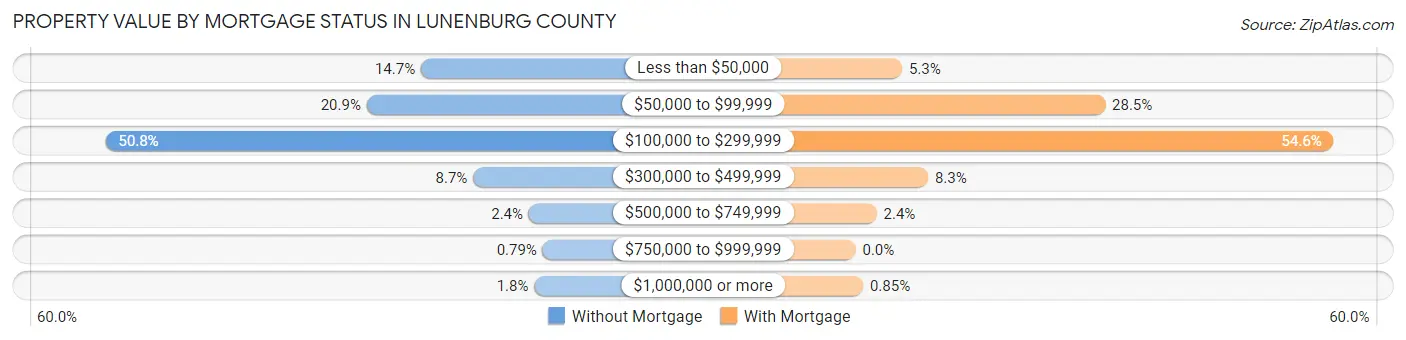
| Property Value | Without Mortgage | With Mortgage |
| Less than $50,000 | 261 (14.7%) | 75 (5.3%) |
| $50,000 to $99,999 | 371 (20.9%) | 403 (28.5%) |
| $100,000 to $299,999 | 901 (50.8%) | 772 (54.6%) |
| $300,000 to $499,999 | 155 (8.7%) | 117 (8.3%) |
| $500,000 to $749,999 | 42 (2.4%) | 34 (2.4%) |
| $750,000 to $999,999 | 14 (0.8%) | 0 (0.0%) |
| $1,000,000 or more | 31 (1.8%) | 12 (0.9%) |
| Total | 1,775 (100.0%) | 1,413 (100.0%) |
Household Income by Mortgage Status in Lunenburg County
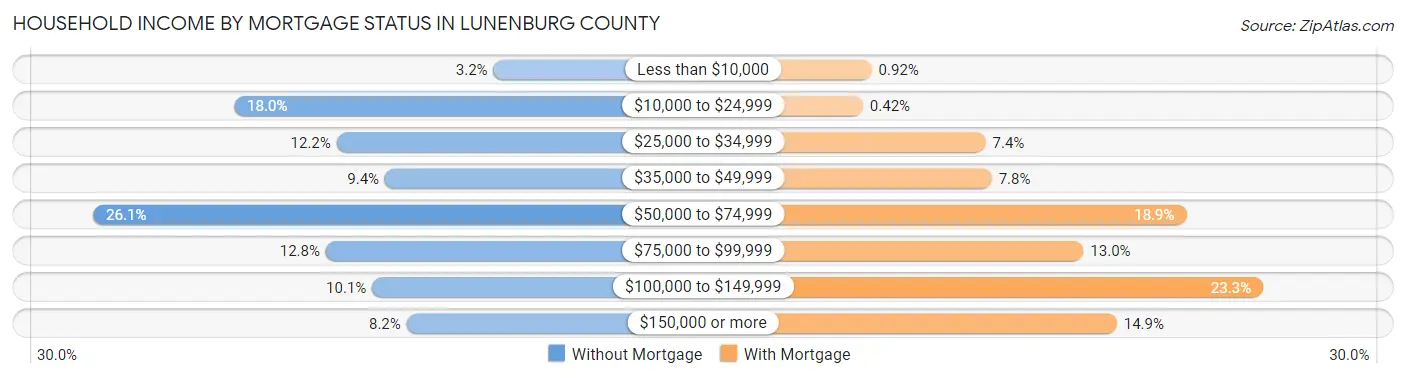
| Household Income | Without Mortgage | With Mortgage |
| Less than $10,000 | 57 (3.2%) | 13 (0.9%) |
| $10,000 to $24,999 | 320 (18.0%) | 6 (0.4%) |
| $25,000 to $34,999 | 216 (12.2%) | 105 (7.4%) |
| $35,000 to $49,999 | 167 (9.4%) | 110 (7.8%) |
| $50,000 to $74,999 | 463 (26.1%) | 267 (18.9%) |
| $75,000 to $99,999 | 227 (12.8%) | 184 (13.0%) |
| $100,000 to $149,999 | 180 (10.1%) | 329 (23.3%) |
| $150,000 or more | 145 (8.2%) | 211 (14.9%) |
| Total | 1,775 (100.0%) | 1,413 (100.0%) |
Property Value to Household Income Ratio in Lunenburg County
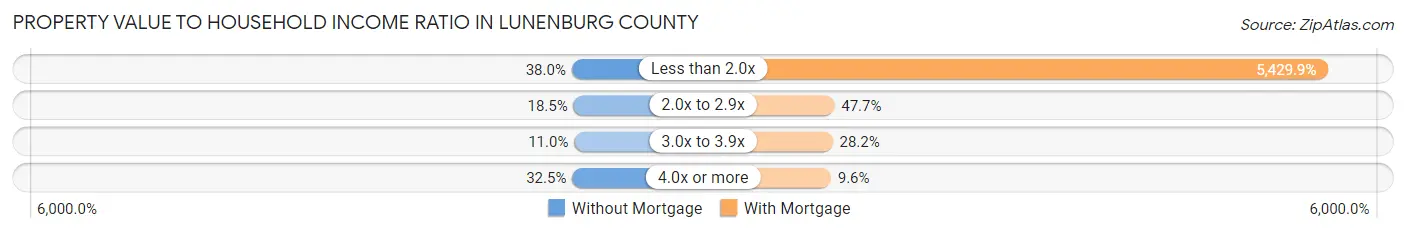
| Value-to-Income Ratio | Without Mortgage | With Mortgage |
| Less than 2.0x | 674 (38.0%) | 76,725 (5,429.9%) |
| 2.0x to 2.9x | 329 (18.5%) | 674 (47.7%) |
| 3.0x to 3.9x | 195 (11.0%) | 398 (28.2%) |
| 4.0x or more | 577 (32.5%) | 136 (9.6%) |
| Total | 1,775 (100.0%) | 1,413 (100.0%) |
Real Estate Taxes by Mortgage Status in Lunenburg County

| Property Taxes | Without Mortgage | With Mortgage |
| Less than $800 | 1,166 (65.7%) | 0 (0.0%) |
| $800 to $1,499 | 301 (17.0%) | 834 (59.0%) |
| $800 to $1,499 | 242 (13.6%) | 375 (26.5%) |
| Total | 1,775 (100.0%) | 1,413 (100.0%) |
Health & Disability in Lunenburg County
Health Insurance Coverage by Age in Lunenburg County
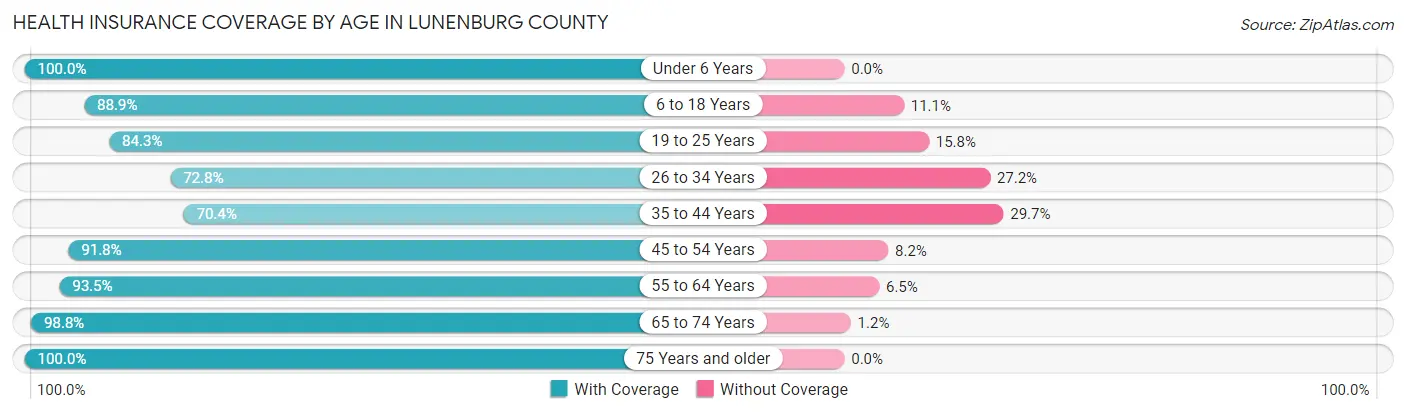
| Age Bracket | With Coverage | Without Coverage |
| Under 6 Years | 671 (100.0%) | 0 (0.0%) |
| 6 to 18 Years | 1,611 (88.9%) | 201 (11.1%) |
| 19 to 25 Years | 642 (84.3%) | 120 (15.8%) |
| 26 to 34 Years | 732 (72.8%) | 273 (27.2%) |
| 35 to 44 Years | 911 (70.4%) | 384 (29.6%) |
| 45 to 54 Years | 1,158 (91.8%) | 103 (8.2%) |
| 55 to 64 Years | 1,529 (93.5%) | 106 (6.5%) |
| 65 to 74 Years | 1,571 (98.8%) | 19 (1.2%) |
| 75 Years and older | 1,073 (100.0%) | 0 (0.0%) |
| Total | 9,898 (89.1%) | 1,206 (10.9%) |
Health Insurance Coverage by Citizenship Status in Lunenburg County

| Citizenship Status | With Coverage | Without Coverage |
| Native Born | 671 (100.0%) | 0 (0.0%) |
| Foreign Born, Citizen | 1,611 (88.9%) | 201 (11.1%) |
| Foreign Born, not a Citizen | 642 (84.3%) | 120 (15.8%) |
Health Insurance Coverage by Household Income in Lunenburg County

| Household Income | With Coverage | Without Coverage |
| Under $25,000 | 1,539 (85.7%) | 257 (14.3%) |
| $25,000 to $49,999 | 2,182 (95.0%) | 115 (5.0%) |
| $50,000 to $74,999 | 1,969 (85.7%) | 329 (14.3%) |
| $75,000 to $99,999 | 1,607 (81.2%) | 371 (18.8%) |
| $100,000 and over | 2,590 (95.2%) | 130 (4.8%) |
Public vs Private Health Insurance Coverage by Age in Lunenburg County
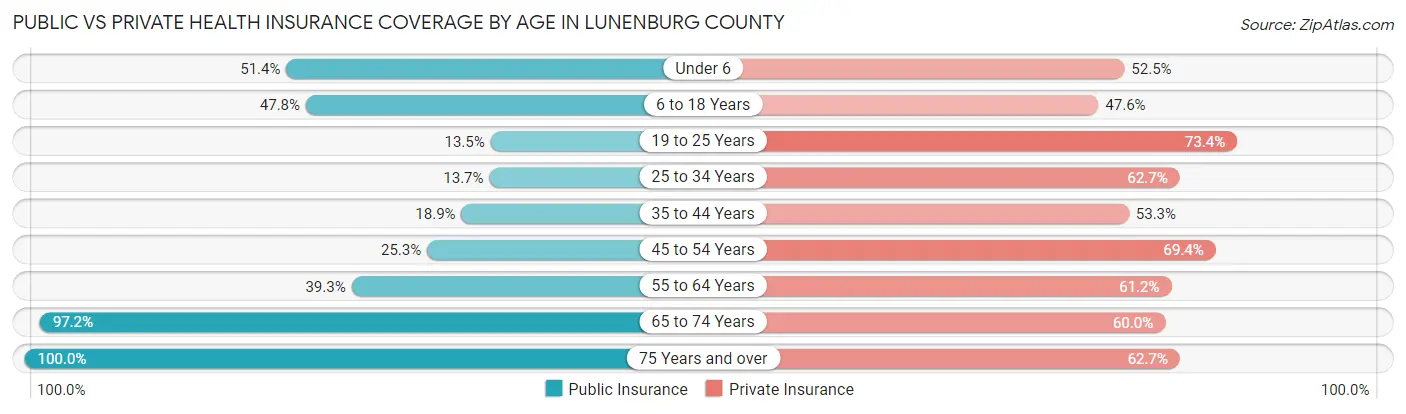
| Age Bracket | Public Insurance | Private Insurance |
| Under 6 | 345 (51.4%) | 352 (52.5%) |
| 6 to 18 Years | 866 (47.8%) | 863 (47.6%) |
| 19 to 25 Years | 103 (13.5%) | 559 (73.4%) |
| 25 to 34 Years | 138 (13.7%) | 630 (62.7%) |
| 35 to 44 Years | 245 (18.9%) | 690 (53.3%) |
| 45 to 54 Years | 319 (25.3%) | 875 (69.4%) |
| 55 to 64 Years | 643 (39.3%) | 1,000 (61.2%) |
| 65 to 74 Years | 1,545 (97.2%) | 954 (60.0%) |
| 75 Years and over | 1,073 (100.0%) | 673 (62.7%) |
| Total | 5,277 (47.5%) | 6,596 (59.4%) |
Disability Status by Sex by Age in Lunenburg County
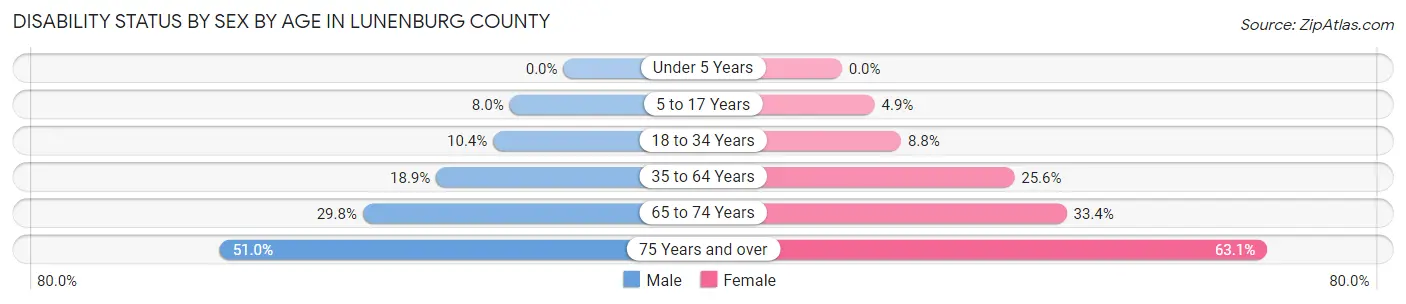
| Age Bracket | Male | Female |
| Under 5 Years | 0 (0.0%) | 0 (0.0%) |
| 5 to 17 Years | 73 (8.0%) | 42 (4.9%) |
| 18 to 34 Years | 93 (10.4%) | 89 (8.8%) |
| 35 to 64 Years | 394 (18.9%) | 539 (25.6%) |
| 65 to 74 Years | 230 (29.8%) | 273 (33.4%) |
| 75 Years and over | 225 (51.0%) | 399 (63.1%) |
Disability Class by Sex by Age in Lunenburg County
Disability Class: Hearing Difficulty
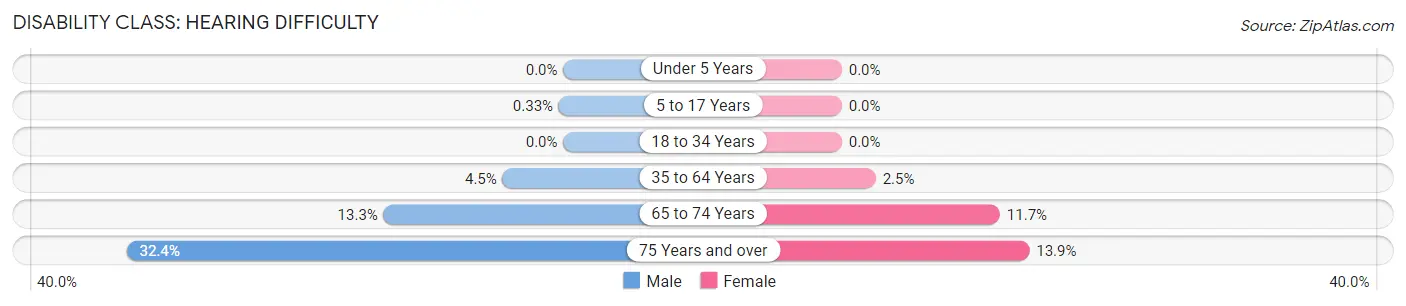
| Age Bracket | Male | Female |
| Under 5 Years | 0 (0.0%) | 0 (0.0%) |
| 5 to 17 Years | 3 (0.3%) | 0 (0.0%) |
| 18 to 34 Years | 0 (0.0%) | 0 (0.0%) |
| 35 to 64 Years | 94 (4.5%) | 53 (2.5%) |
| 65 to 74 Years | 103 (13.3%) | 96 (11.7%) |
| 75 Years and over | 143 (32.4%) | 88 (13.9%) |
Disability Class: Vision Difficulty
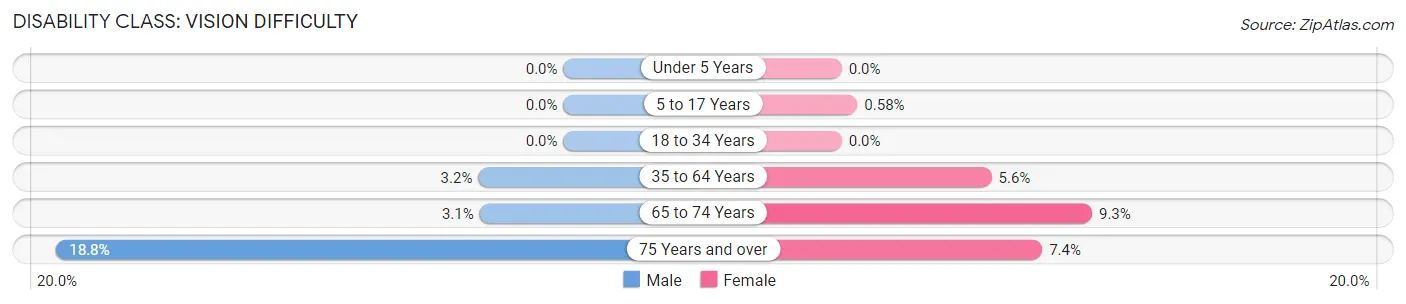
| Age Bracket | Male | Female |
| Under 5 Years | 0 (0.0%) | 0 (0.0%) |
| 5 to 17 Years | 0 (0.0%) | 5 (0.6%) |
| 18 to 34 Years | 0 (0.0%) | 0 (0.0%) |
| 35 to 64 Years | 66 (3.2%) | 117 (5.6%) |
| 65 to 74 Years | 24 (3.1%) | 76 (9.3%) |
| 75 Years and over | 83 (18.8%) | 47 (7.4%) |
Disability Class: Cognitive Difficulty
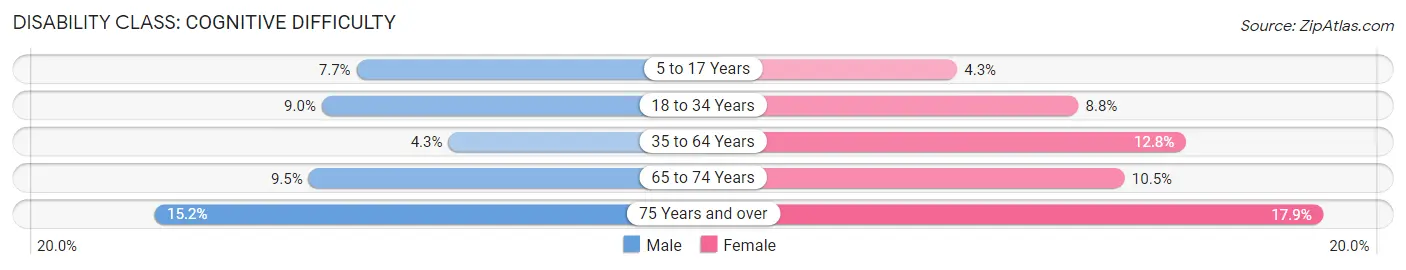
| Age Bracket | Male | Female |
| 5 to 17 Years | 70 (7.7%) | 37 (4.3%) |
| 18 to 34 Years | 80 (9.0%) | 89 (8.8%) |
| 35 to 64 Years | 89 (4.3%) | 269 (12.8%) |
| 65 to 74 Years | 73 (9.5%) | 86 (10.5%) |
| 75 Years and over | 67 (15.2%) | 113 (17.9%) |
Disability Class: Ambulatory Difficulty
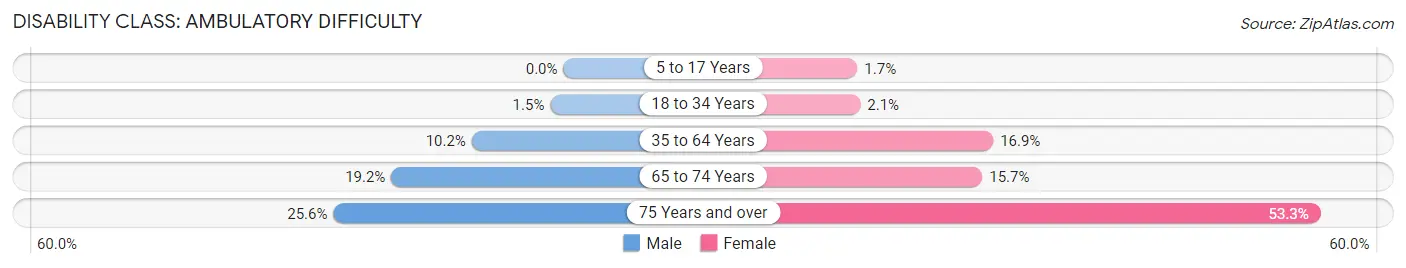
| Age Bracket | Male | Female |
| 5 to 17 Years | 0 (0.0%) | 15 (1.7%) |
| 18 to 34 Years | 13 (1.5%) | 21 (2.1%) |
| 35 to 64 Years | 213 (10.2%) | 355 (16.9%) |
| 65 to 74 Years | 148 (19.2%) | 128 (15.7%) |
| 75 Years and over | 113 (25.6%) | 337 (53.3%) |
Disability Class: Self-Care Difficulty
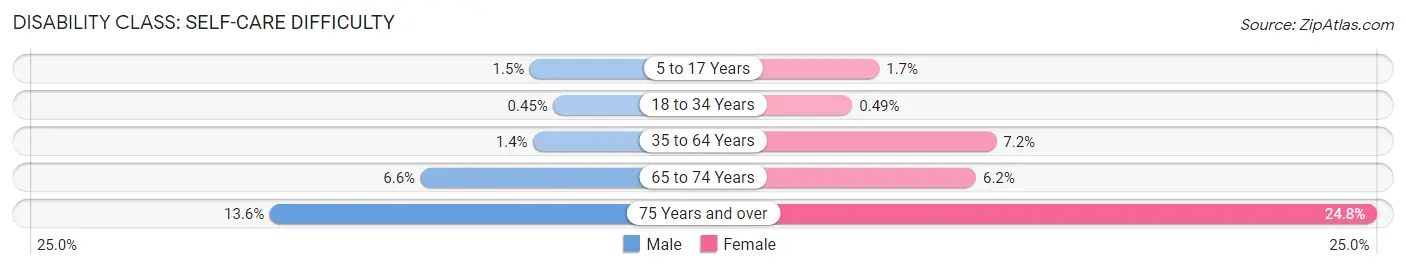
| Age Bracket | Male | Female |
| 5 to 17 Years | 14 (1.5%) | 15 (1.7%) |
| 18 to 34 Years | 4 (0.4%) | 5 (0.5%) |
| 35 to 64 Years | 29 (1.4%) | 151 (7.2%) |
| 65 to 74 Years | 51 (6.6%) | 51 (6.2%) |
| 75 Years and over | 60 (13.6%) | 157 (24.8%) |
Technology Access in Lunenburg County
Computing Device Access in Lunenburg County
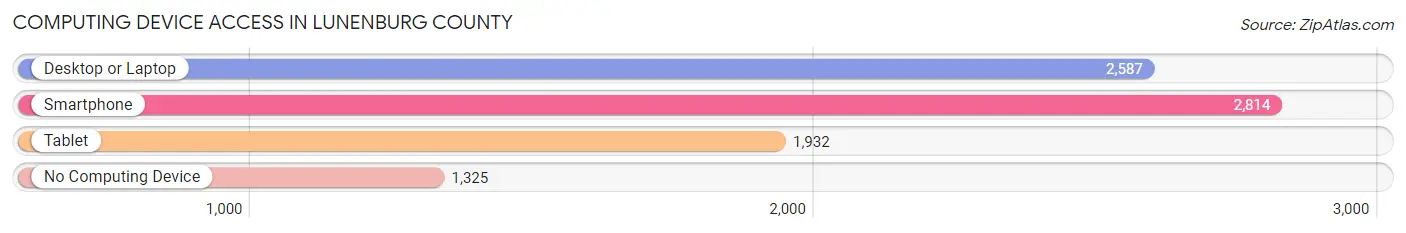
| Device Type | # Households | % Households |
| Desktop or Laptop | 2,587 | 56.7% |
| Smartphone | 2,814 | 61.6% |
| Tablet | 1,932 | 42.3% |
| No Computing Device | 1,325 | 29.0% |
| Total | 4,566 | 100.0% |
Internet Access in Lunenburg County
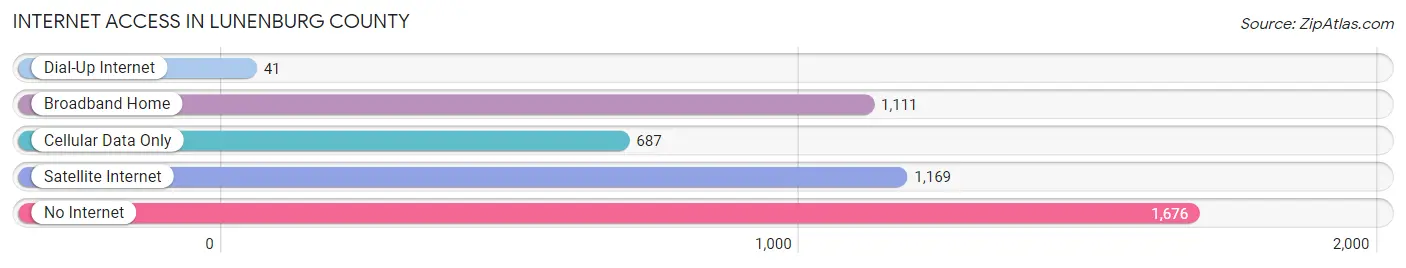
| Internet Type | # Households | % Households |
| Dial-Up Internet | 41 | 0.9% |
| Broadband Home | 1,111 | 24.3% |
| Cellular Data Only | 687 | 15.0% |
| Satellite Internet | 1,169 | 25.6% |
| No Internet | 1,676 | 36.7% |
| Total | 4,566 | 100.0% |
Lunenburg County Summary
Lunenburg County, Virginia is located in the south-central part of the state, and is bordered by Charlotte County to the north, Mecklenburg County to the east, Brunswick County to the south, and Nottoway County to the west. The county seat is Lunenburg, and the county is part of the Southside Virginia region. The county was established in 1746 and named for the Duke of Brunswick-Lunenburg.
Geography
Lunenburg County covers an area of 437 square miles, of which 434 square miles is land and 3 square miles is water. The terrain is generally flat, with some rolling hills in the northern part of the county. The county is drained by the Meherrin River, which flows through the center of the county. The county is also home to several small lakes, including Lake Gaston, Lake Chesdin, and Lake Gaston.
The climate of Lunenburg County is humid subtropical, with hot, humid summers and mild winters. The average annual temperature is around 60°F, and the average annual precipitation is around 45 inches.
Demographics
As of the 2010 census, the population of Lunenburg County was 12,914, an increase of 8.3% from the 2000 census. The population density was 29.5 people per square mile. The racial makeup of the county was 68.3% White, 28.3% African American, 0.4% Native American, 0.3% Asian, 0.1% Pacific Islander, 0.7% from other races, and 1.9% from two or more races. Hispanic or Latino of any race were 1.9% of the population.
The median household income in Lunenburg County was $37,945, and the median family income was $45,938. The per capita income was $18,945. About 17.3% of the population was below the poverty line.
Economy
The economy of Lunenburg County is largely based on agriculture and manufacturing. The county is home to several large farms, which produce a variety of crops, including corn, soybeans, wheat, and hay. The county is also home to several manufacturing companies, which produce a variety of products, including furniture, textiles, and automotive parts.
The county is also home to several tourist attractions, including the Meherrin River State Park, the Lunenburg County Historical Society Museum, and the Lunenburg County Courthouse.
History
Lunenburg County was established in 1746 and named for the Duke of Brunswick-Lunenburg. The county was originally part of Brunswick County, but was split off in 1748. The county seat was originally located in the town of Lunenburg, but was moved to Victoria in 1872.
The county was home to several prominent figures in American history, including Thomas Jefferson, who was born in the county in 1743. The county was also home to several prominent Civil War figures, including Confederate General Robert E. Lee, who was born in the county in 1807.
Lunenburg County has a long history of racial segregation, and the county was the site of several civil rights protests in the 1960s. The county was also the site of a major civil rights march in 1965, which was led by Martin Luther King Jr.
Conclusion
Lunenburg County, Virginia is a rural county located in the south-central part of the state. The county is home to a diverse population, and the economy is largely based on agriculture and manufacturing. The county has a long history, and was the site of several important events in American history, including the civil rights march led by Martin Luther King Jr. in 1965.
Common Questions
What is Per Capita Income in Lunenburg County?
Per Capita income in Lunenburg County is $26,486.
What is the Median Family Income in Lunenburg County?
Median Family Income in Lunenburg County is $68,917.
What is the Median Household income in Lunenburg County?
Median Household Income in Lunenburg County is $54,438.
What is Income or Wage Gap in Lunenburg County?
Income or Wage Gap in Lunenburg County is 30.1%.
Women in Lunenburg County earn 69.9 cents for every dollar earned by a man.
What is Family Income Deficit in Lunenburg County?
Family Income Deficit in Lunenburg County is $8,500.
Families that are below poverty line in Lunenburg County earn $8,500 less on average than the poverty threshold level.
What is Inequality or Gini Index in Lunenburg County?
Inequality or Gini Index in Lunenburg County is 0.41.
What is the Total Population of Lunenburg County?
Total Population of Lunenburg County is 11,988.
What is the Total Male Population of Lunenburg County?
Total Male Population of Lunenburg County is 6,285.
What is the Total Female Population of Lunenburg County?
Total Female Population of Lunenburg County is 5,703.
What is the Ratio of Males per 100 Females in Lunenburg County?
There are 110.21 Males per 100 Females in Lunenburg County.
What is the Ratio of Females per 100 Males in Lunenburg County?
There are 90.74 Females per 100 Males in Lunenburg County.
What is the Median Population Age in Lunenburg County?
Median Population Age in Lunenburg County is 44.0 Years.
What is the Average Family Size in Lunenburg County
Average Family Size in Lunenburg County is 3.1 People.
What is the Average Household Size in Lunenburg County
Average Household Size in Lunenburg County is 2.4 People.
How Large is the Labor Force in Lunenburg County?
There are 4,854 People in the Labor Forcein in Lunenburg County.
What is the Percentage of People in the Labor Force in Lunenburg County?
49.4% of People are in the Labor Force in Lunenburg County.
What is the Unemployment Rate in Lunenburg County?
Unemployment Rate in Lunenburg County is 4.0%.