Louisa County, VA Map & Demographics
Louisa County Map
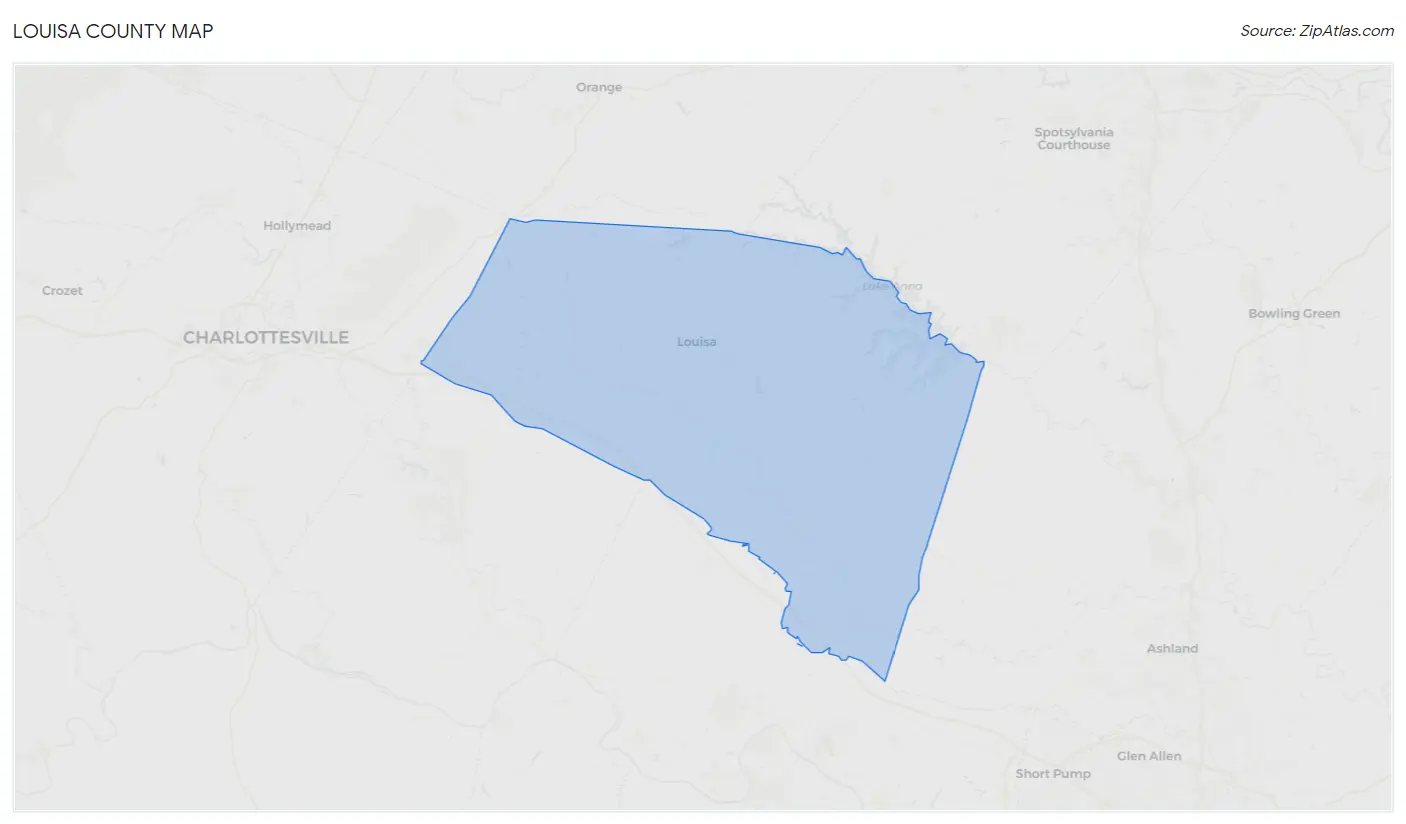
Louisa County Overview
$40,803
PER CAPITA INCOME
$93,231
AVG FAMILY INCOME
$76,594
AVG HOUSEHOLD INCOME
23.7%
WAGE / INCOME GAP [ % ]
76.3¢/ $1
WAGE / INCOME GAP [ $ ]
0.45
INEQUALITY / GINI INDEX
38,106
TOTAL POPULATION
19,078
MALE POPULATION
19,028
FEMALE POPULATION
100.26
MALES / 100 FEMALES
99.74
FEMALES / 100 MALES
45.0
MEDIAN AGE
3.0
AVG FAMILY SIZE
2.6
AVG HOUSEHOLD SIZE
19,188
LABOR FORCE [ PEOPLE ]
61.3%
PERCENT IN LABOR FORCE
6.4%
UNEMPLOYMENT RATE
Louisa County Area Codes
Income in Louisa County
Income Overview in Louisa County
Per Capita Income in Louisa County is $40,803, while median incomes of families and households are $93,231 and $76,594 respectively.
| Characteristic | Number | Measure |
| Per Capita Income | 38,106 | $40,803 |
| Median Family Income | 10,554 | $93,231 |
| Mean Family Income | 10,554 | $117,787 |
| Median Household Income | 14,642 | $76,594 |
| Mean Household Income | 14,642 | $103,128 |
| Income Deficit | 10,554 | $0 |
| Wage / Income Gap (%) | 38,106 | 23.72% |
| Wage / Income Gap ($) | 38,106 | 76.28¢ per $1 |
| Gini / Inequality Index | 38,106 | 0.45 |
Earnings by Sex in Louisa County
Average Earnings in Louisa County are $41,030, $44,276 for men and $33,772 for women, a difference of 23.7%.
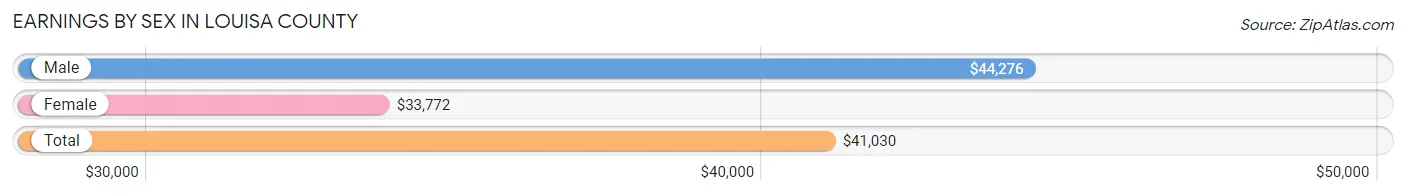
| Sex | Number | Average Earnings |
| Male | 10,749 (53.3%) | $44,276 |
| Female | 9,426 (46.7%) | $33,772 |
| Total | 20,175 (100.0%) | $41,030 |
Earnings by Sex by Income Bracket in Louisa County
The most common earnings brackets in Louisa County are $100,000+ for men (1,653 | 15.4%) and $25,000 to $29,999 for women (886 | 9.4%).
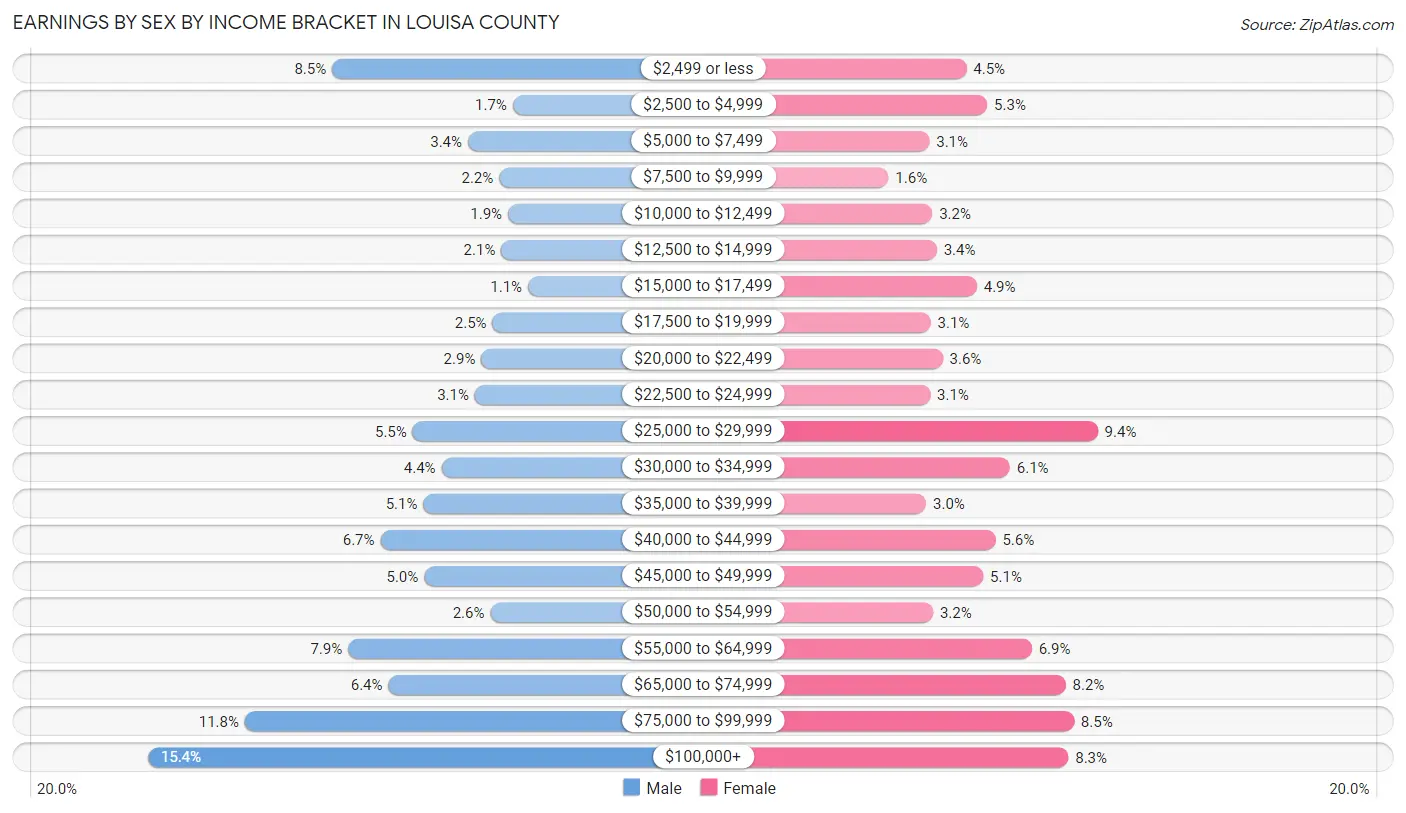
| Income | Male | Female |
| $2,499 or less | 912 (8.5%) | 422 (4.5%) |
| $2,500 to $4,999 | 184 (1.7%) | 496 (5.3%) |
| $5,000 to $7,499 | 364 (3.4%) | 291 (3.1%) |
| $7,500 to $9,999 | 239 (2.2%) | 147 (1.6%) |
| $10,000 to $12,499 | 203 (1.9%) | 302 (3.2%) |
| $12,500 to $14,999 | 230 (2.1%) | 318 (3.4%) |
| $15,000 to $17,499 | 123 (1.1%) | 459 (4.9%) |
| $17,500 to $19,999 | 265 (2.5%) | 296 (3.1%) |
| $20,000 to $22,499 | 311 (2.9%) | 338 (3.6%) |
| $22,500 to $24,999 | 336 (3.1%) | 294 (3.1%) |
| $25,000 to $29,999 | 587 (5.5%) | 886 (9.4%) |
| $30,000 to $34,999 | 471 (4.4%) | 576 (6.1%) |
| $35,000 to $39,999 | 544 (5.1%) | 280 (3.0%) |
| $40,000 to $44,999 | 717 (6.7%) | 525 (5.6%) |
| $45,000 to $49,999 | 541 (5.0%) | 482 (5.1%) |
| $50,000 to $54,999 | 274 (2.5%) | 304 (3.2%) |
| $55,000 to $64,999 | 847 (7.9%) | 653 (6.9%) |
| $65,000 to $74,999 | 685 (6.4%) | 773 (8.2%) |
| $75,000 to $99,999 | 1,263 (11.7%) | 802 (8.5%) |
| $100,000+ | 1,653 (15.4%) | 782 (8.3%) |
| Total | 10,749 (100.0%) | 9,426 (100.0%) |
Earnings by Sex by Educational Attainment in Louisa County
Average earnings in Louisa County are $51,174 for men and $41,418 for women, a difference of 19.1%. Men with an educational attainment of bachelor's degree enjoy the highest average annual earnings of $78,563, while those with less than high school education earn the least with $29,315. Women with an educational attainment of graduate degree earn the most with the average annual earnings of $67,672, while those with less than high school education have the smallest earnings of $28,158.
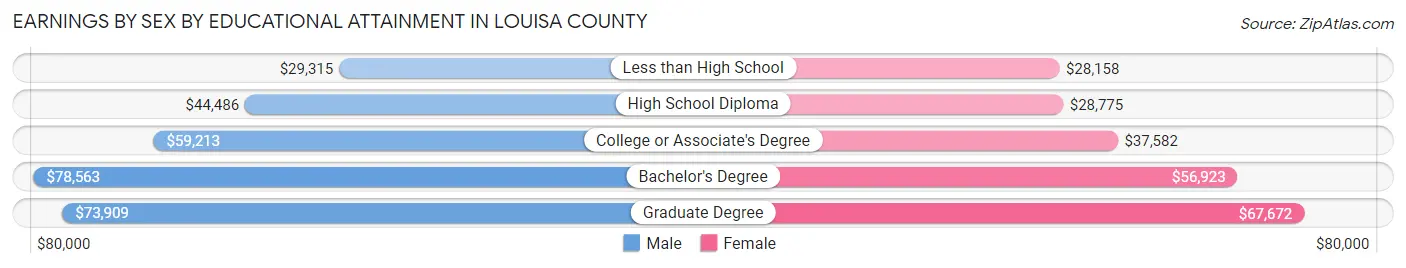
| Educational Attainment | Male Income | Female Income |
| Less than High School | $29,315 | $28,158 |
| High School Diploma | $44,486 | $28,775 |
| College or Associate's Degree | $59,213 | $37,582 |
| Bachelor's Degree | $78,563 | $56,923 |
| Graduate Degree | $73,909 | $67,672 |
| Total | $51,174 | $41,418 |
Family Income in Louisa County
Family Income Brackets in Louisa County
According to the Louisa County family income data, there are 2,491 families falling into the $100,000 to $149,999 income range, which is the most common income bracket and makes up 23.6% of all families. Conversely, the less than $10,000 income bracket is the least frequent group with only 74 families (0.7%) belonging to this category.
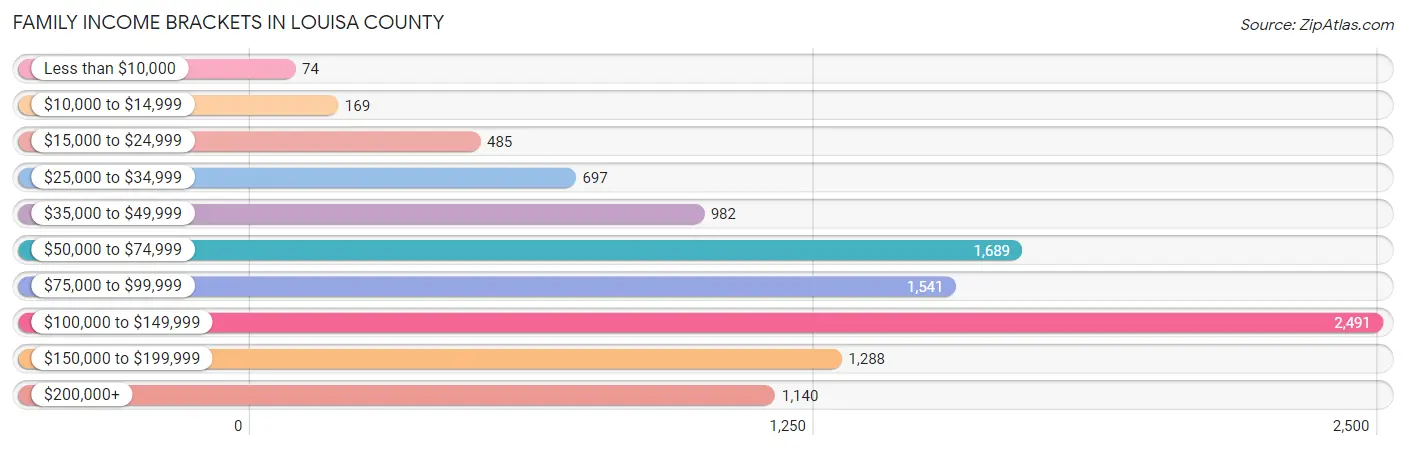
| Income Bracket | # Families | % Families |
| Less than $10,000 | 74 | 0.7% |
| $10,000 to $14,999 | 169 | 1.6% |
| $15,000 to $24,999 | 485 | 4.6% |
| $25,000 to $34,999 | 697 | 6.6% |
| $35,000 to $49,999 | 982 | 9.3% |
| $50,000 to $74,999 | 1,689 | 16.0% |
| $75,000 to $99,999 | 1,541 | 14.6% |
| $100,000 to $149,999 | 2,491 | 23.6% |
| $150,000 to $199,999 | 1,288 | 12.2% |
| $200,000+ | 1,140 | 10.8% |
Family Income by Famaliy Size in Louisa County
6-person families (194 | 1.8%) account for the highest median family income in Louisa County with $121,382 per family, while 2-person families (5,446 | 51.6%) have the highest median income of $41,974 per family member.
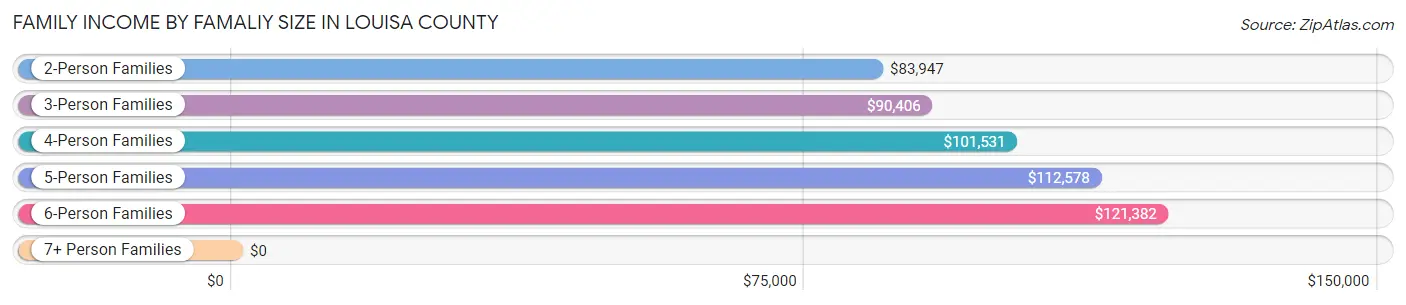
| Income Bracket | # Families | Median Income |
| 2-Person Families | 5,446 (51.6%) | $83,947 |
| 3-Person Families | 2,071 (19.6%) | $90,406 |
| 4-Person Families | 1,882 (17.8%) | $101,531 |
| 5-Person Families | 901 (8.5%) | $112,578 |
| 6-Person Families | 194 (1.8%) | $121,382 |
| 7+ Person Families | 60 (0.6%) | $0 |
| Total | 10,554 (100.0%) | $93,231 |
Family Income by Number of Earners in Louisa County
The median family income in Louisa County is $93,231, with families comprising 3+ earners (1,203) having the highest median family income of $157,755, while families with no earners (1,528) have the lowest median family income of $62,237, accounting for 11.4% and 14.5% of families, respectively.
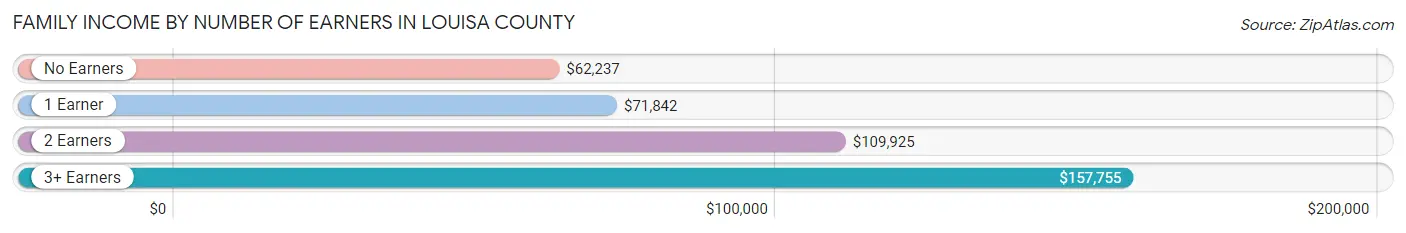
| Number of Earners | # Families | Median Income |
| No Earners | 1,528 (14.5%) | $62,237 |
| 1 Earner | 3,588 (34.0%) | $71,842 |
| 2 Earners | 4,235 (40.1%) | $109,925 |
| 3+ Earners | 1,203 (11.4%) | $157,755 |
| Total | 10,554 (100.0%) | $93,231 |
Household Income in Louisa County
Household Income Brackets in Louisa County
With 2,870 households falling in the category, the $100,000 to $149,999 income range is the most frequent in Louisa County, accounting for 19.6% of all households. In contrast, only 278 households (1.9%) fall into the less than $10,000 income bracket, making it the least populous group.
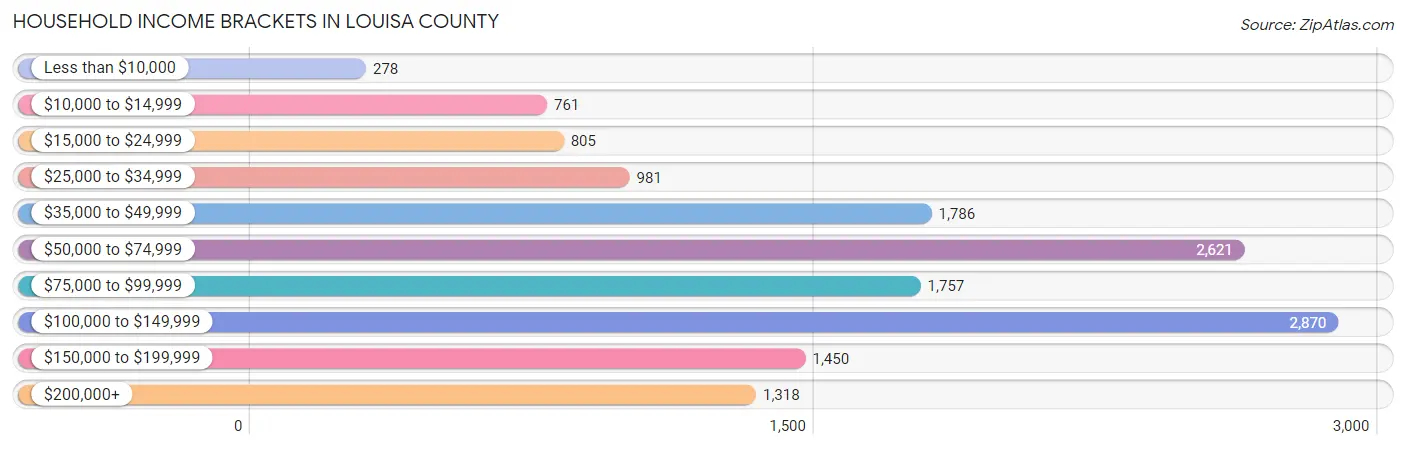
| Income Bracket | # Households | % Households |
| Less than $10,000 | 278 | 1.9% |
| $10,000 to $14,999 | 761 | 5.2% |
| $15,000 to $24,999 | 805 | 5.5% |
| $25,000 to $34,999 | 981 | 6.7% |
| $35,000 to $49,999 | 1,786 | 12.2% |
| $50,000 to $74,999 | 2,621 | 17.9% |
| $75,000 to $99,999 | 1,757 | 12.0% |
| $100,000 to $149,999 | 2,870 | 19.6% |
| $150,000 to $199,999 | 1,450 | 9.9% |
| $200,000+ | 1,318 | 9.0% |
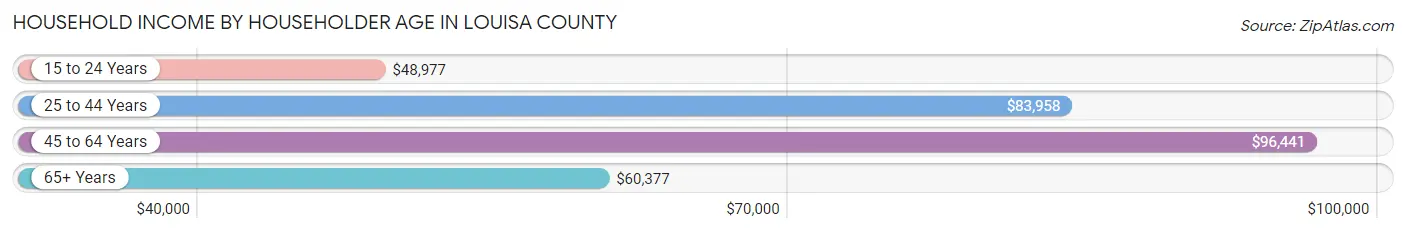
Household Income by Householder Age in Louisa County
The median household income in Louisa County is $76,594, with the highest median household income of $96,441 found in the 45 to 64 years age bracket for the primary householder. A total of 6,052 households (41.3%) fall into this category. Meanwhile, the 15 to 24 years age bracket for the primary householder has the lowest median household income of $48,977, with 236 households (1.6%) in this group.
| Income Bracket | # Households | Median Income |
| 15 to 24 Years | 236 (1.6%) | $48,977 |
| 25 to 44 Years | 3,711 (25.3%) | $83,958 |
| 45 to 64 Years | 6,052 (41.3%) | $96,441 |
| 65+ Years | 4,643 (31.7%) | $60,377 |
| Total | 14,642 (100.0%) | $76,594 |
Poverty in Louisa County
Income Below Poverty by Sex and Age in Louisa County
With 9.3% poverty level for males and 12.5% for females among the residents of Louisa County, under 5 year old males and under 5 year old females are the most vulnerable to poverty, with 199 males (19.1%) and 205 females (22.2%) in their respective age groups living below the poverty level.
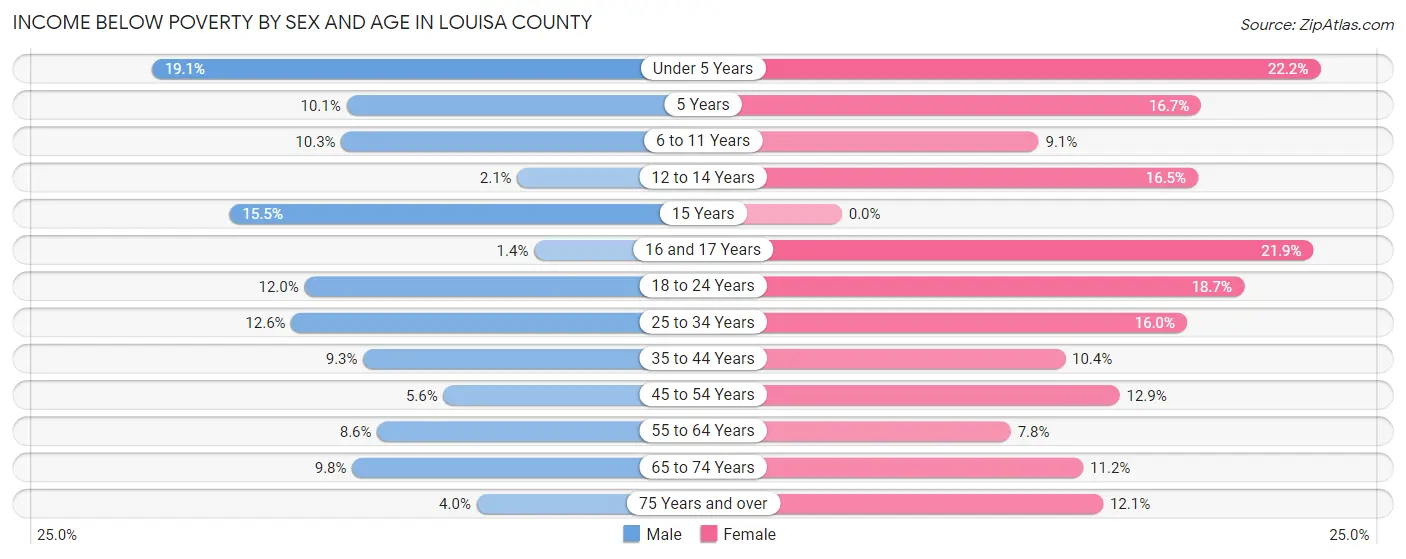
| Age Bracket | Male | Female |
| Under 5 Years | 199 (19.1%) | 205 (22.2%) |
| 5 Years | 16 (10.1%) | 23 (16.7%) |
| 6 to 11 Years | 130 (10.3%) | 117 (9.1%) |
| 12 to 14 Years | 15 (2.1%) | 110 (16.5%) |
| 15 Years | 46 (15.5%) | 0 (0.0%) |
| 16 and 17 Years | 6 (1.3%) | 79 (21.9%) |
| 18 to 24 Years | 170 (12.0%) | 218 (18.6%) |
| 25 to 34 Years | 279 (12.6%) | 338 (16.0%) |
| 35 to 44 Years | 208 (9.3%) | 240 (10.4%) |
| 45 to 54 Years | 133 (5.6%) | 316 (12.9%) |
| 55 to 64 Years | 272 (8.6%) | 259 (7.8%) |
| 65 to 74 Years | 234 (9.8%) | 278 (11.2%) |
| 75 Years and over | 52 (4.0%) | 177 (12.1%) |
| Total | 1,760 (9.3%) | 2,360 (12.5%) |
Income Above Poverty by Sex and Age in Louisa County
According to the poverty statistics in Louisa County, males aged 16 and 17 years and females aged 15 years are the age groups that are most secure financially, with 98.7% of males and 100.0% of females in these age groups living above the poverty line.
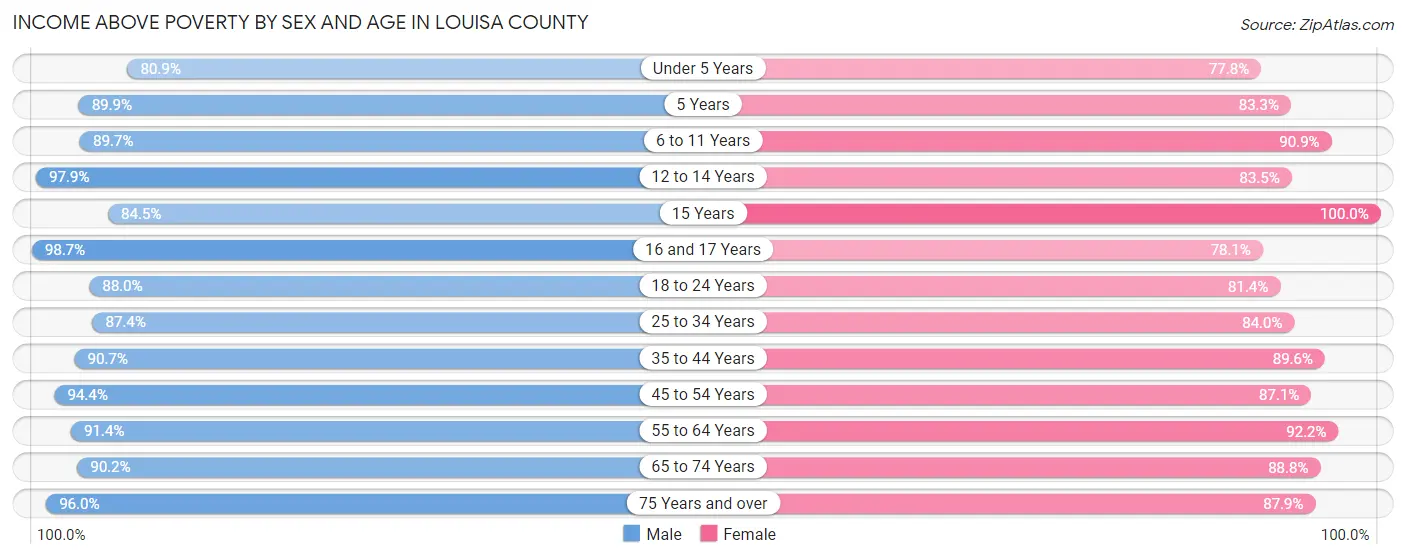
| Age Bracket | Male | Female |
| Under 5 Years | 843 (80.9%) | 719 (77.8%) |
| 5 Years | 143 (89.9%) | 115 (83.3%) |
| 6 to 11 Years | 1,132 (89.7%) | 1,165 (90.9%) |
| 12 to 14 Years | 688 (97.9%) | 556 (83.5%) |
| 15 Years | 251 (84.5%) | 268 (100.0%) |
| 16 and 17 Years | 439 (98.7%) | 282 (78.1%) |
| 18 to 24 Years | 1,246 (88.0%) | 951 (81.4%) |
| 25 to 34 Years | 1,932 (87.4%) | 1,773 (84.0%) |
| 35 to 44 Years | 2,034 (90.7%) | 2,076 (89.6%) |
| 45 to 54 Years | 2,260 (94.4%) | 2,136 (87.1%) |
| 55 to 64 Years | 2,878 (91.4%) | 3,046 (92.2%) |
| 65 to 74 Years | 2,156 (90.2%) | 2,205 (88.8%) |
| 75 Years and over | 1,241 (96.0%) | 1,283 (87.9%) |
| Total | 17,243 (90.7%) | 16,575 (87.5%) |
Income Below Poverty Among Married-Couple Families in Louisa County
The poverty statistics for married-couple families in Louisa County show that 3.7% or 320 of the total 8,588 families live below the poverty line. Families with 3 or 4 children have the highest poverty rate of 6.5%, comprising of 37 families. On the other hand, families with 5 or more children have the lowest poverty rate of 0.0%, which includes 0 families.
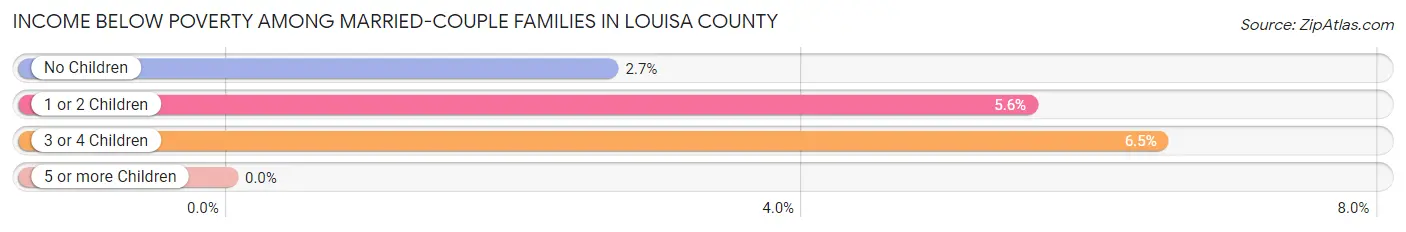
| Children | Above Poverty | Below Poverty |
| No Children | 5,400 (97.4%) | 147 (2.6%) |
| 1 or 2 Children | 2,306 (94.4%) | 136 (5.6%) |
| 3 or 4 Children | 534 (93.5%) | 37 (6.5%) |
| 5 or more Children | 28 (100.0%) | 0 (0.0%) |
| Total | 8,268 (96.3%) | 320 (3.7%) |
Income Below Poverty Among Single-Parent Households in Louisa County
According to the poverty data in Louisa County, 4.0% or 22 single-father households and 28.2% or 400 single-mother households are living below the poverty line. Among single-father households, those with 1 or 2 children have the highest poverty rate, with 18 households (6.5%) experiencing poverty. Likewise, among single-mother households, those with 3 or 4 children have the highest poverty rate, with 84 households (45.7%) falling below the poverty line.
| Children | Single Father | Single Mother |
| No Children | 4 (1.6%) | 122 (17.5%) |
| 1 or 2 Children | 18 (6.5%) | 194 (36.1%) |
| 3 or 4 Children | 0 (0.0%) | 84 (45.7%) |
| 5 or more Children | 0 (0.0%) | 0 (0.0%) |
| Total | 22 (4.0%) | 400 (28.2%) |
Income Below Poverty Among Married-Couple vs Single-Parent Households in Louisa County
The poverty data for Louisa County shows that 320 of the married-couple family households (3.7%) and 422 of the single-parent households (21.5%) are living below the poverty level. Within the married-couple family households, those with 3 or 4 children have the highest poverty rate, with 37 households (6.5%) falling below the poverty line. Among the single-parent households, those with 3 or 4 children have the highest poverty rate, with 84 household (41.2%) living below poverty.
| Children | Married-Couple Families | Single-Parent Households |
| No Children | 147 (2.6%) | 126 (13.3%) |
| 1 or 2 Children | 136 (5.6%) | 212 (26.0%) |
| 3 or 4 Children | 37 (6.5%) | 84 (41.2%) |
| 5 or more Children | 0 (0.0%) | 0 (0.0%) |
| Total | 320 (3.7%) | 422 (21.5%) |
Race in Louisa County
The most populous races in Louisa County are White / Caucasian (29,805 | 78.2%), Black / African American (5,130 | 13.5%), and Two or more Races (2,393 | 6.3%).
| Race | # Population | % Population |
| Asian | 185 | 0.5% |
| Black / African American | 5,130 | 13.5% |
| Hawaiian / Pacific | 11 | 0.0% |
| Hispanic or Latino | 1,366 | 3.6% |
| Native / Alaskan | 72 | 0.2% |
| White / Caucasian | 29,805 | 78.2% |
| Two or more Races | 2,393 | 6.3% |
| Some other Race | 510 | 1.3% |
| Total | 38,106 | 100.0% |
Ancestry in Louisa County
The most populous ancestries reported in Louisa County are English (6,586 | 17.3%), German (5,152 | 13.5%), Irish (4,597 | 12.1%), American (3,264 | 8.6%), and Italian (1,321 | 3.5%), together accounting for 54.9% of all Louisa County residents.
| Ancestry | # Population | % Population |
| African | 75 | 0.2% |
| Albanian | 28 | 0.1% |
| American | 3,264 | 8.6% |
| Apache | 14 | 0.0% |
| Arab | 12 | 0.0% |
| Armenian | 9 | 0.0% |
| Austrian | 147 | 0.4% |
| Belgian | 28 | 0.1% |
| Bhutanese | 98 | 0.3% |
| Bolivian | 146 | 0.4% |
| Brazilian | 276 | 0.7% |
| British | 348 | 0.9% |
| Burmese | 12 | 0.0% |
| Canadian | 15 | 0.0% |
| Celtic | 13 | 0.0% |
| Central American | 202 | 0.5% |
| Cherokee | 36 | 0.1% |
| Choctaw | 8 | 0.0% |
| Creek | 44 | 0.1% |
| Croatian | 8 | 0.0% |
| Cuban | 46 | 0.1% |
| Czech | 46 | 0.1% |
| Czechoslovakian | 12 | 0.0% |
| Danish | 33 | 0.1% |
| Dutch | 217 | 0.6% |
| Eastern European | 61 | 0.2% |
| Ecuadorian | 17 | 0.0% |
| English | 6,586 | 17.3% |
| Ethiopian | 14 | 0.0% |
| European | 1,216 | 3.2% |
| Filipino | 40 | 0.1% |
| French | 1,057 | 2.8% |
| French American Indian | 13 | 0.0% |
| French Canadian | 119 | 0.3% |
| German | 5,152 | 13.5% |
| Greek | 19 | 0.1% |
| Guamanian / Chamorro | 11 | 0.0% |
| Guatemalan | 49 | 0.1% |
| Honduran | 1 | 0.0% |
| Hungarian | 180 | 0.5% |
| Indian (Asian) | 107 | 0.3% |
| Iranian | 8 | 0.0% |
| Irish | 4,597 | 12.1% |
| Iroquois | 13 | 0.0% |
| Israeli | 11 | 0.0% |
| Italian | 1,321 | 3.5% |
| Korean | 91 | 0.2% |
| Latvian | 11 | 0.0% |
| Lebanese | 12 | 0.0% |
| Lithuanian | 225 | 0.6% |
| Mexican | 731 | 1.9% |
| Nigerian | 31 | 0.1% |
| Northern European | 88 | 0.2% |
| Norwegian | 297 | 0.8% |
| Panamanian | 18 | 0.1% |
| Pennsylvania German | 26 | 0.1% |
| Polish | 502 | 1.3% |
| Portuguese | 21 | 0.1% |
| Potawatomi | 7 | 0.0% |
| Puerto Rican | 143 | 0.4% |
| Russian | 466 | 1.2% |
| Salvadoran | 134 | 0.4% |
| Scandinavian | 30 | 0.1% |
| Scotch-Irish | 830 | 2.2% |
| Scottish | 1,087 | 2.9% |
| Slavic | 16 | 0.0% |
| South American | 163 | 0.4% |
| Spaniard | 42 | 0.1% |
| Spanish | 25 | 0.1% |
| Spanish American | 14 | 0.0% |
| Sri Lankan | 21 | 0.1% |
| Subsaharan African | 121 | 0.3% |
| Swedish | 174 | 0.5% |
| Swiss | 53 | 0.1% |
| Thai | 16 | 0.0% |
| Turkish | 2 | 0.0% |
| Ugandan | 1 | 0.0% |
| Ukrainian | 84 | 0.2% |
| Welsh | 458 | 1.2% | View All 79 Rows |
Immigrants in Louisa County
The most numerous immigrant groups reported in Louisa County came from Latin America (671 | 1.8%), Europe (430 | 1.1%), Central America (382 | 1.0%), Asia (372 | 1.0%), and South America (282 | 0.7%), together accounting for 5.6% of all Louisa County residents.
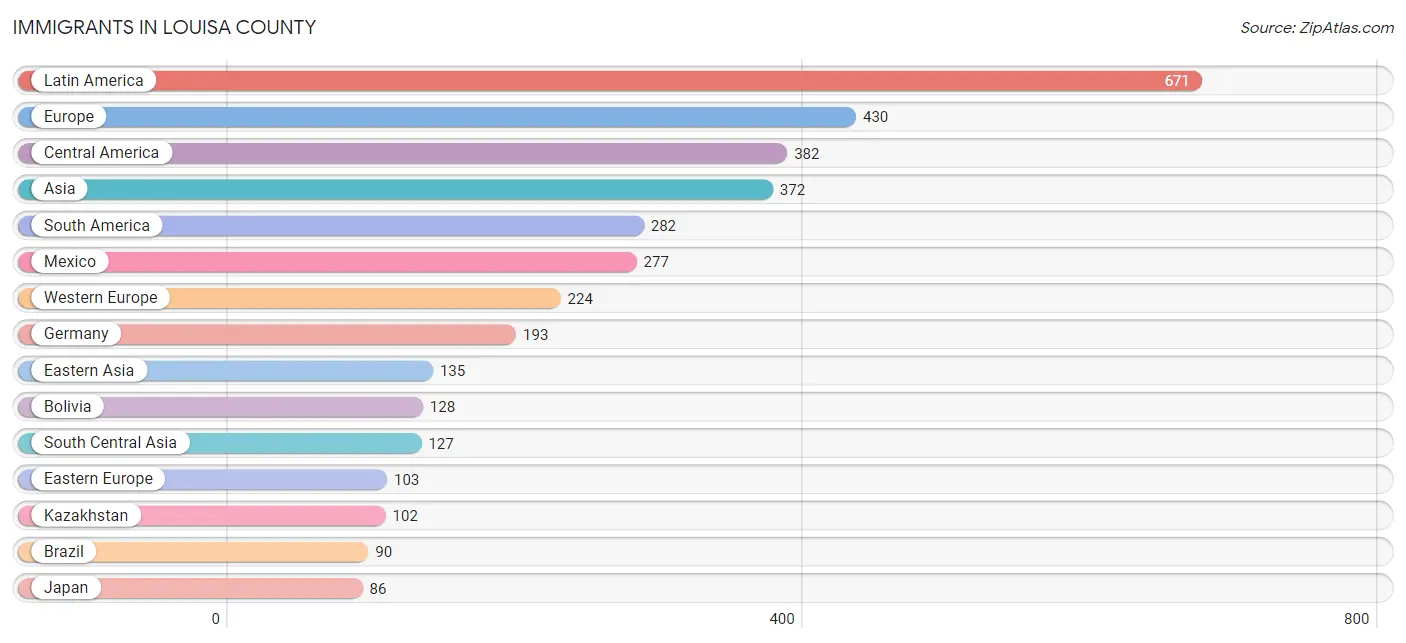
| Immigration Origin | # Population | % Population |
| Africa | 32 | 0.1% |
| Albania | 14 | 0.0% |
| Asia | 372 | 1.0% |
| Australia | 11 | 0.0% |
| Bolivia | 128 | 0.3% |
| Brazil | 90 | 0.2% |
| Canada | 39 | 0.1% |
| Caribbean | 7 | 0.0% |
| Central America | 382 | 1.0% |
| China | 45 | 0.1% |
| Colombia | 58 | 0.2% |
| Cuba | 1 | 0.0% |
| Eastern Africa | 32 | 0.1% |
| Eastern Asia | 135 | 0.4% |
| Eastern Europe | 103 | 0.3% |
| Ecuador | 6 | 0.0% |
| El Salvador | 69 | 0.2% |
| England | 8 | 0.0% |
| Europe | 430 | 1.1% |
| France | 10 | 0.0% |
| Germany | 193 | 0.5% |
| Guatemala | 17 | 0.0% |
| Honduras | 1 | 0.0% |
| Hong Kong | 3 | 0.0% |
| Hungary | 12 | 0.0% |
| India | 17 | 0.0% |
| Iran | 8 | 0.0% |
| Israel | 11 | 0.0% |
| Italy | 61 | 0.2% |
| Japan | 86 | 0.2% |
| Kazakhstan | 102 | 0.3% |
| Korea | 4 | 0.0% |
| Latin America | 671 | 1.8% |
| Mexico | 277 | 0.7% |
| Northern Europe | 42 | 0.1% |
| Oceania | 20 | 0.1% |
| Panama | 18 | 0.1% |
| Philippines | 65 | 0.2% |
| Russia | 77 | 0.2% |
| South America | 282 | 0.7% |
| South Central Asia | 127 | 0.3% |
| South Eastern Asia | 86 | 0.2% |
| Southern Europe | 61 | 0.2% |
| Switzerland | 21 | 0.1% |
| Taiwan | 40 | 0.1% |
| Trinidad and Tobago | 6 | 0.0% |
| Turkey | 2 | 0.0% |
| Vietnam | 21 | 0.1% |
| Western Asia | 24 | 0.1% |
| Western Europe | 224 | 0.6% |
| Zimbabwe | 12 | 0.0% | View All 51 Rows |
Sex and Age in Louisa County
Sex and Age in Louisa County
The most populous age groups in Louisa County are 60 to 64 Years (1,768 | 9.3%) for men and 55 to 59 Years (1,747 | 9.2%) for women.
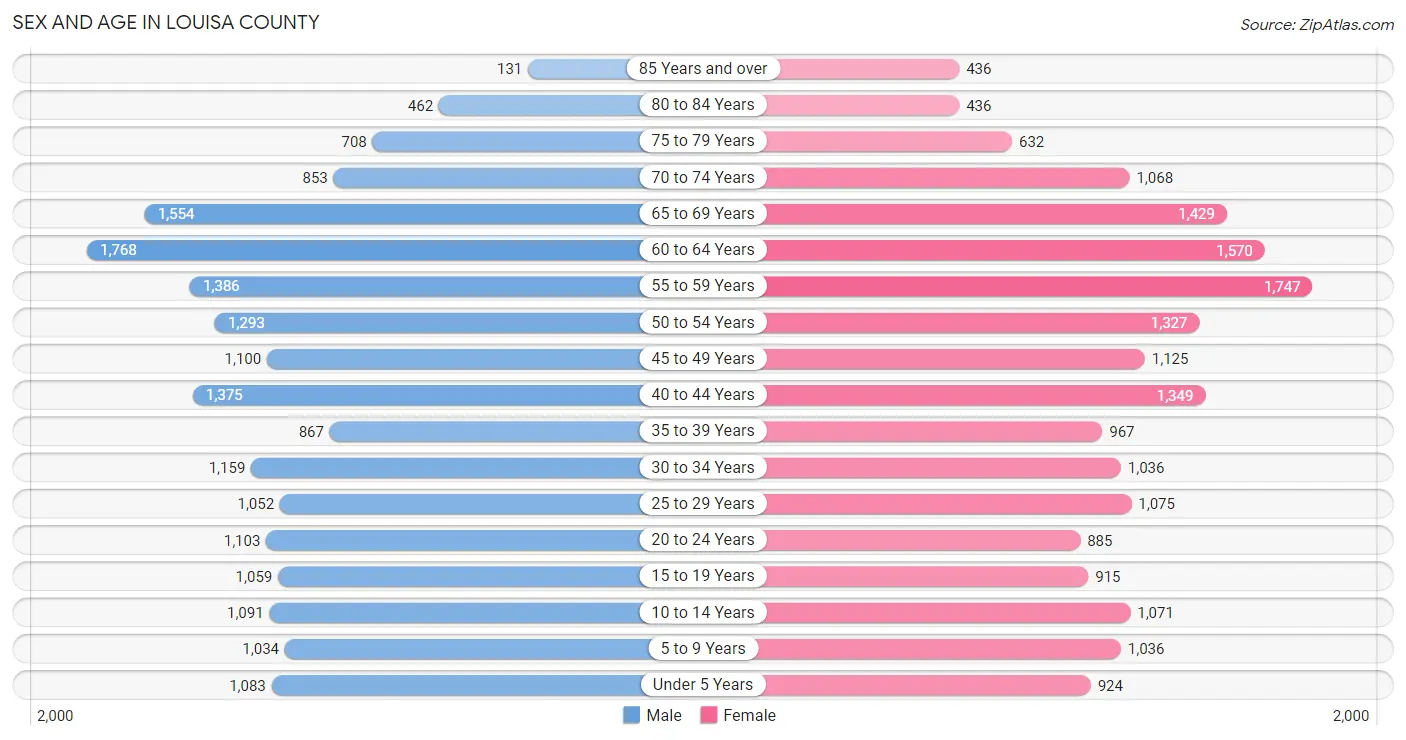
| Age Bracket | Male | Female |
| Under 5 Years | 1,083 (5.7%) | 924 (4.9%) |
| 5 to 9 Years | 1,034 (5.4%) | 1,036 (5.4%) |
| 10 to 14 Years | 1,091 (5.7%) | 1,071 (5.6%) |
| 15 to 19 Years | 1,059 (5.6%) | 915 (4.8%) |
| 20 to 24 Years | 1,103 (5.8%) | 885 (4.6%) |
| 25 to 29 Years | 1,052 (5.5%) | 1,075 (5.7%) |
| 30 to 34 Years | 1,159 (6.1%) | 1,036 (5.4%) |
| 35 to 39 Years | 867 (4.5%) | 967 (5.1%) |
| 40 to 44 Years | 1,375 (7.2%) | 1,349 (7.1%) |
| 45 to 49 Years | 1,100 (5.8%) | 1,125 (5.9%) |
| 50 to 54 Years | 1,293 (6.8%) | 1,327 (7.0%) |
| 55 to 59 Years | 1,386 (7.3%) | 1,747 (9.2%) |
| 60 to 64 Years | 1,768 (9.3%) | 1,570 (8.3%) |
| 65 to 69 Years | 1,554 (8.2%) | 1,429 (7.5%) |
| 70 to 74 Years | 853 (4.5%) | 1,068 (5.6%) |
| 75 to 79 Years | 708 (3.7%) | 632 (3.3%) |
| 80 to 84 Years | 462 (2.4%) | 436 (2.3%) |
| 85 Years and over | 131 (0.7%) | 436 (2.3%) |
| Total | 19,078 (100.0%) | 19,028 (100.0%) |
Families and Households in Louisa County
Median Family Size in Louisa County
The median family size in Louisa County is 3.03 persons per family, with single male/father families (548 | 5.2%) accounting for the largest median family size of 3.71 persons per family. On the other hand, married-couple families (8,588 | 81.4%) represent the smallest median family size with 2.99 persons per family.
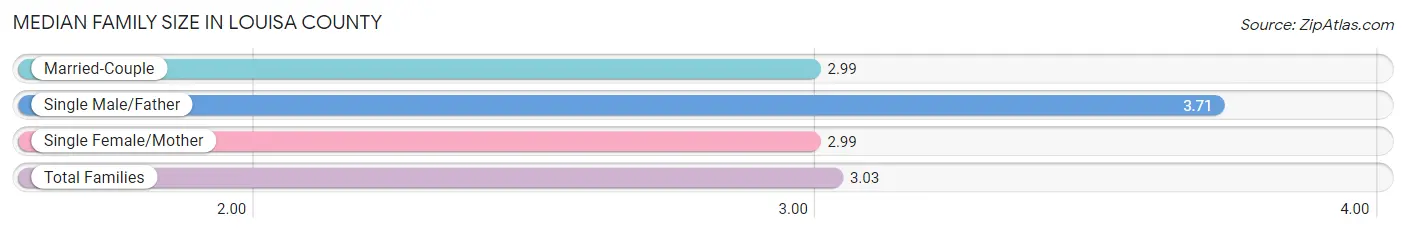
| Family Type | # Families | Family Size |
| Married-Couple | 8,588 (81.4%) | 2.99 |
| Single Male/Father | 548 (5.2%) | 3.71 |
| Single Female/Mother | 1,418 (13.4%) | 2.99 |
| Total Families | 10,554 (100.0%) | 3.03 |
Median Household Size in Louisa County
The median household size in Louisa County is 2.59 persons per household, with single male/father households (548 | 3.7%) accounting for the largest median household size of 4.19 persons per household. non-family households (4,088 | 27.9%) represent the smallest median household size with 1.25 persons per household.
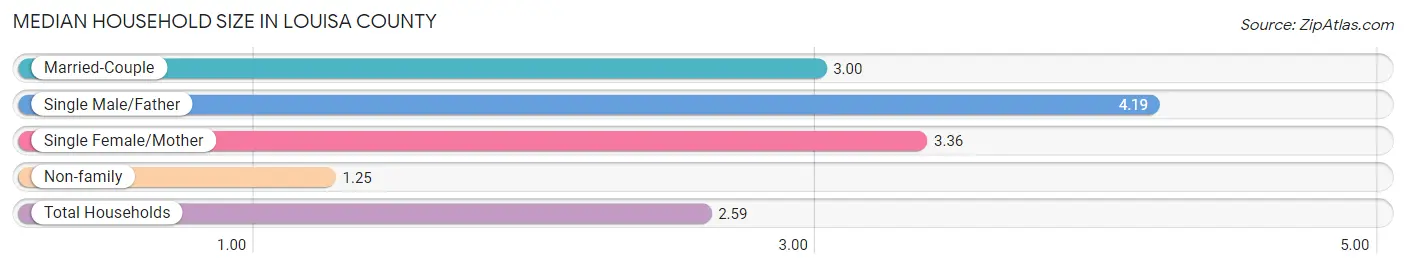
| Household Type | # Households | Household Size |
| Married-Couple | 8,588 (58.7%) | 3.00 |
| Single Male/Father | 548 (3.7%) | 4.19 |
| Single Female/Mother | 1,418 (9.7%) | 3.36 |
| Non-family | 4,088 (27.9%) | 1.25 |
| Total Households | 14,642 (100.0%) | 2.59 |
Household Size by Marriage Status in Louisa County
Out of a total of 14,642 households in Louisa County, 10,554 (72.1%) are family households, while 4,088 (27.9%) are nonfamily households. The most numerous type of family households are 2-person households, comprising 5,212, and the most common type of nonfamily households are 1-person households, comprising 3,312.
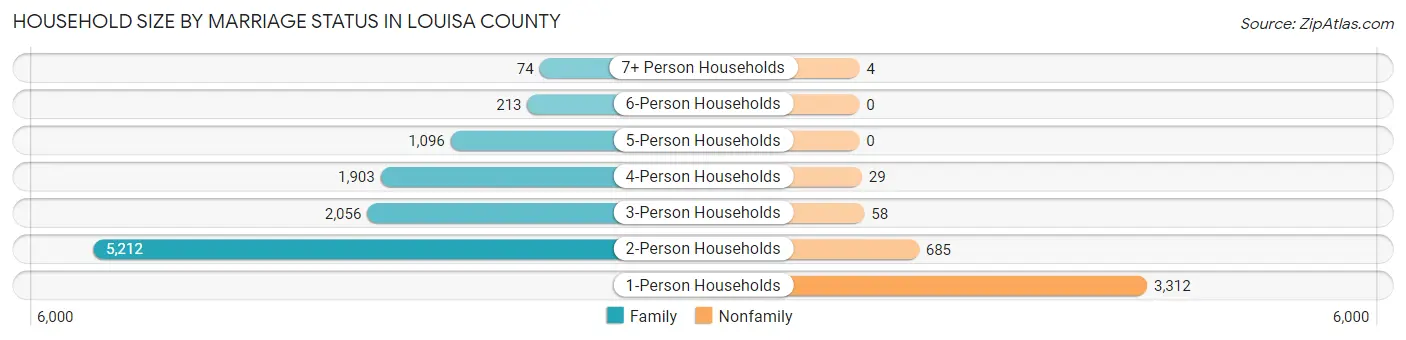
| Household Size | Family Households | Nonfamily Households |
| 1-Person Households | - | 3,312 (22.6%) |
| 2-Person Households | 5,212 (35.6%) | 685 (4.7%) |
| 3-Person Households | 2,056 (14.0%) | 58 (0.4%) |
| 4-Person Households | 1,903 (13.0%) | 29 (0.2%) |
| 5-Person Households | 1,096 (7.5%) | 0 (0.0%) |
| 6-Person Households | 213 (1.5%) | 0 (0.0%) |
| 7+ Person Households | 74 (0.5%) | 4 (0.0%) |
| Total | 10,554 (72.1%) | 4,088 (27.9%) |
Female Fertility in Louisa County
Fertility by Age in Louisa County
Average fertility rate in Louisa County is 79.0 births per 1,000 women. Women in the age bracket of 20 to 34 years have the highest fertility rate with 162.0 births per 1,000 women. Women in the age bracket of 20 to 34 years acount for 79.7% of all women with births.
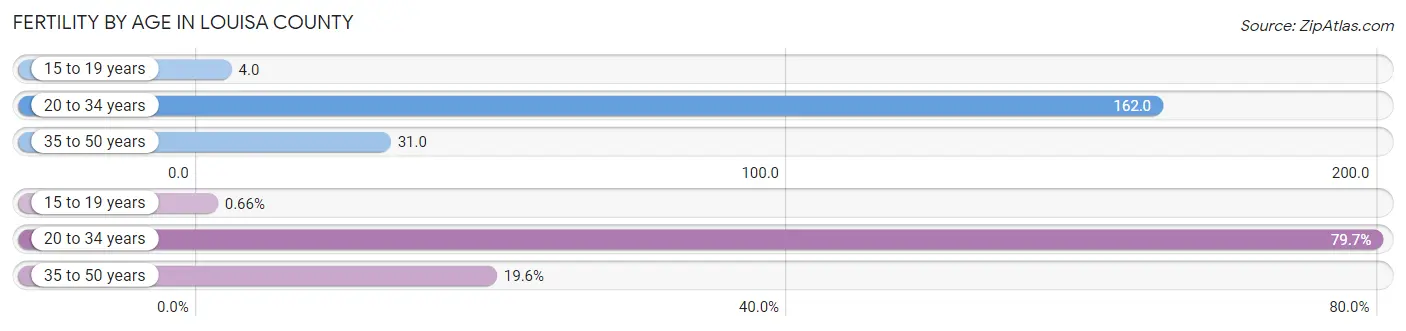
| Age Bracket | Women with Births | Births / 1,000 Women |
| 15 to 19 years | 4 (0.7%) | 4.0 |
| 20 to 34 years | 484 (79.7%) | 162.0 |
| 35 to 50 years | 119 (19.6%) | 31.0 |
| Total | 607 (100.0%) | 79.0 |
Fertility by Age by Marriage Status in Louisa County
53.7% of women with births (607) in Louisa County are married. The highest percentage of unmarried women with births falls into 15 to 19 years age bracket with 100.0% of them unmarried at the time of birth, while the lowest percentage of unmarried women with births belong to 35 to 50 years age bracket with 0.0% of them unmarried.
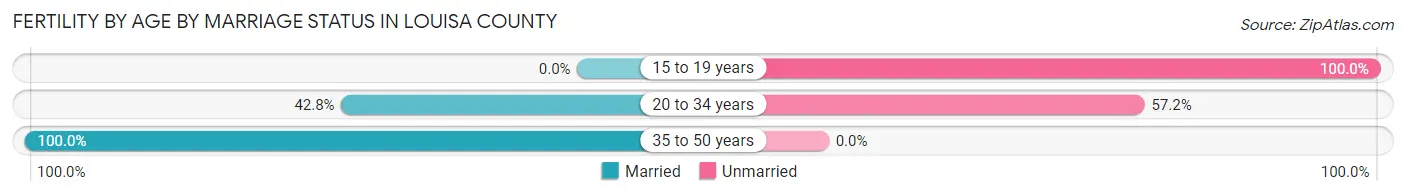
| Age Bracket | Married | Unmarried |
| 15 to 19 years | 0 (0.0%) | 4 (100.0%) |
| 20 to 34 years | 207 (42.8%) | 277 (57.2%) |
| 35 to 50 years | 119 (100.0%) | 0 (0.0%) |
| Total | 326 (53.7%) | 281 (46.3%) |
Fertility by Education in Louisa County
Average fertility rate in Louisa County is 79.0 births per 1,000 women. Women with the education attainment of bachelor's degree have the highest fertility rate of 148.0 births per 1,000 women, while women with the education attainment of high school diploma have the lowest fertility at 54.0 births per 1,000 women. Women with the education attainment of college or associate's degree represent 36.6% of all women with births.
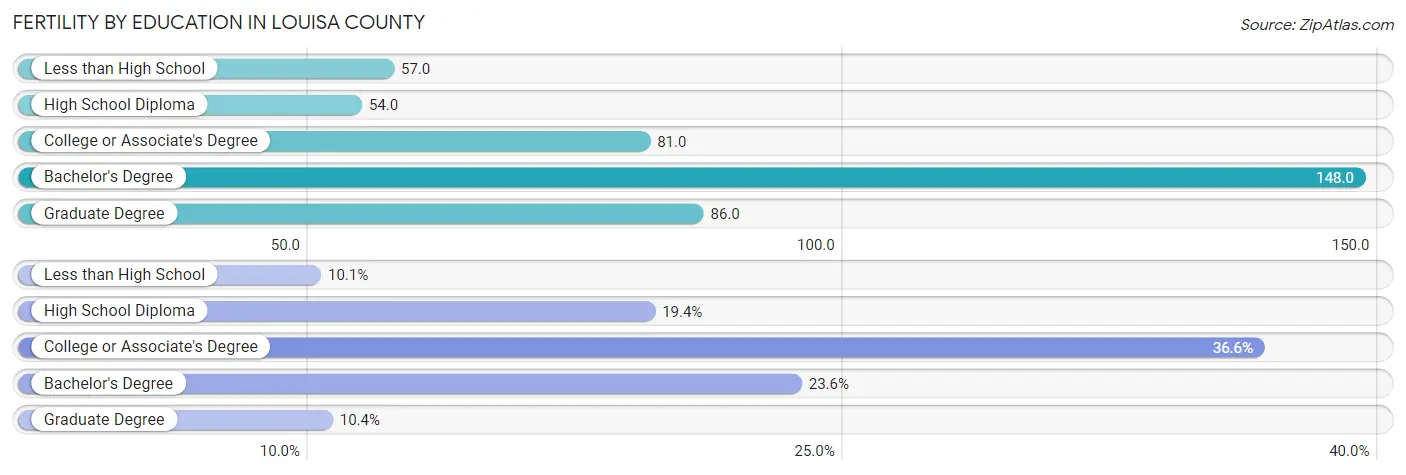
| Educational Attainment | Women with Births | Births / 1,000 Women |
| Less than High School | 61 (10.1%) | 57.0 |
| High School Diploma | 118 (19.4%) | 54.0 |
| College or Associate's Degree | 222 (36.6%) | 81.0 |
| Bachelor's Degree | 143 (23.6%) | 148.0 |
| Graduate Degree | 63 (10.4%) | 86.0 |
| Total | 607 (100.0%) | 79.0 |
Fertility by Education by Marriage Status in Louisa County
46.3% of women with births in Louisa County are unmarried. Women with the educational attainment of graduate degree are most likely to be married with 100.0% of them married at childbirth, while women with the educational attainment of less than high school are least likely to be married with 100.0% of them unmarried at childbirth.
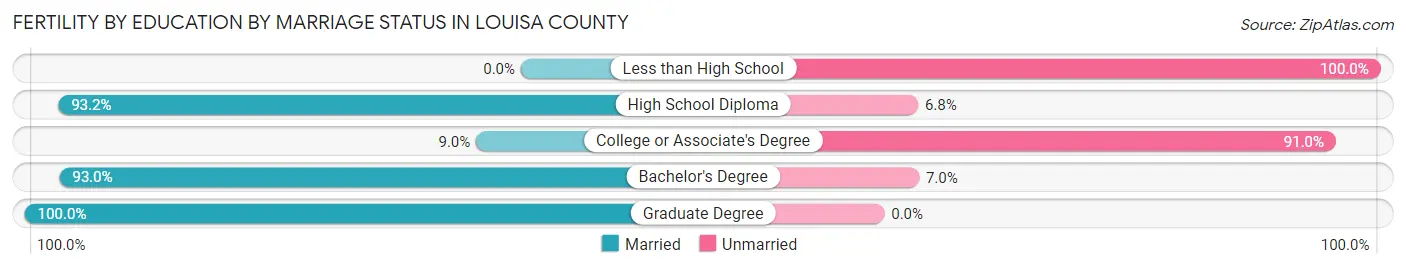
| Educational Attainment | Married | Unmarried |
| Less than High School | 0 (0.0%) | 61 (100.0%) |
| High School Diploma | 110 (93.2%) | 8 (6.8%) |
| College or Associate's Degree | 20 (9.0%) | 202 (91.0%) |
| Bachelor's Degree | 133 (93.0%) | 10 (7.0%) |
| Graduate Degree | 63 (100.0%) | 0 (0.0%) |
| Total | 326 (53.7%) | 281 (46.3%) |
Employment Characteristics in Louisa County
Employment by Class of Employer in Louisa County
Among the 17,615 employed individuals in Louisa County, private company employees (10,995 | 62.4%), local government employees (1,648 | 9.4%), and self-employed (not incorporated) (1,416 | 8.0%) make up the most common classes of employment.
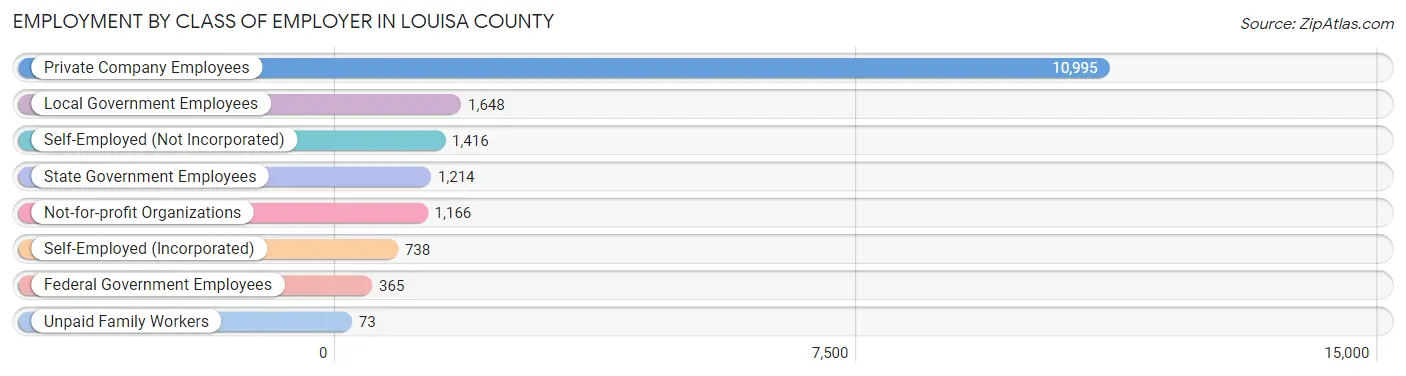
| Employer Class | # Employees | % Employees |
| Private Company Employees | 10,995 | 62.4% |
| Self-Employed (Incorporated) | 738 | 4.2% |
| Self-Employed (Not Incorporated) | 1,416 | 8.0% |
| Not-for-profit Organizations | 1,166 | 6.6% |
| Local Government Employees | 1,648 | 9.4% |
| State Government Employees | 1,214 | 6.9% |
| Federal Government Employees | 365 | 2.1% |
| Unpaid Family Workers | 73 | 0.4% |
| Total | 17,615 | 100.0% |
Employment Status by Age in Louisa County
According to the labor force statistics for Louisa County, out of the total population over 16 years of age (31,301), 61.3% or 19,188 individuals are in the labor force, with 6.4% or 1,228 of them unemployed. The age group with the highest labor force participation rate is 35 to 44 years, with 86.7% or 3,952 individuals in the labor force. Within the labor force, the 25 to 29 years age range has the highest percentage of unemployed individuals, with 21.3% or 357 of them being unemployed.
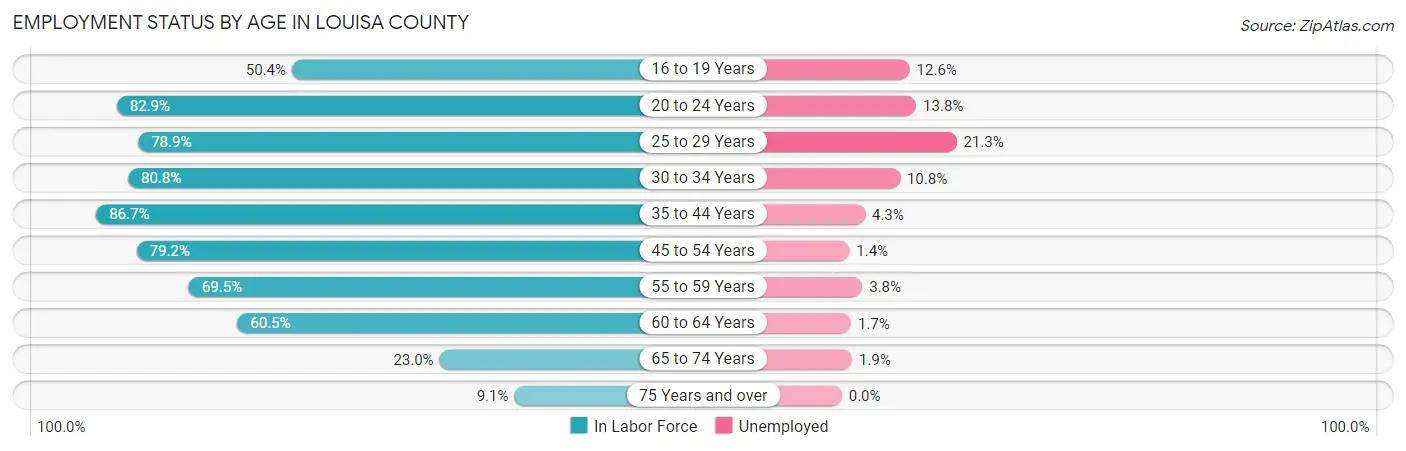
| Age Bracket | In Labor Force | Unemployed |
| 16 to 19 Years | 710 (50.4%) | 89 (12.6%) |
| 20 to 24 Years | 1,648 (82.9%) | 227 (13.8%) |
| 25 to 29 Years | 1,678 (78.9%) | 357 (21.3%) |
| 30 to 34 Years | 1,774 (80.8%) | 192 (10.8%) |
| 35 to 44 Years | 3,952 (86.7%) | 170 (4.3%) |
| 45 to 54 Years | 3,837 (79.2%) | 54 (1.4%) |
| 55 to 59 Years | 2,177 (69.5%) | 83 (3.8%) |
| 60 to 64 Years | 2,019 (60.5%) | 34 (1.7%) |
| 65 to 74 Years | 1,128 (23.0%) | 21 (1.9%) |
| 75 Years and over | 255 (9.1%) | 0 (0.0%) |
| Total | 19,188 (61.3%) | 1,228 (6.4%) |
Employment Status by Educational Attainment in Louisa County
According to labor force statistics for Louisa County, 76.4% of individuals (15,430) out of the total population between 25 and 64 years of age (20,196) are in the labor force, with 5.8% or 895 of them being unemployed. The group with the highest labor force participation rate are those with the educational attainment of college / associate degree, with 83.6% or 5,285 individuals in the labor force. Within the labor force, individuals with less than high school education have the highest percentage of unemployment, with 13.3% or 155 of them being unemployed.
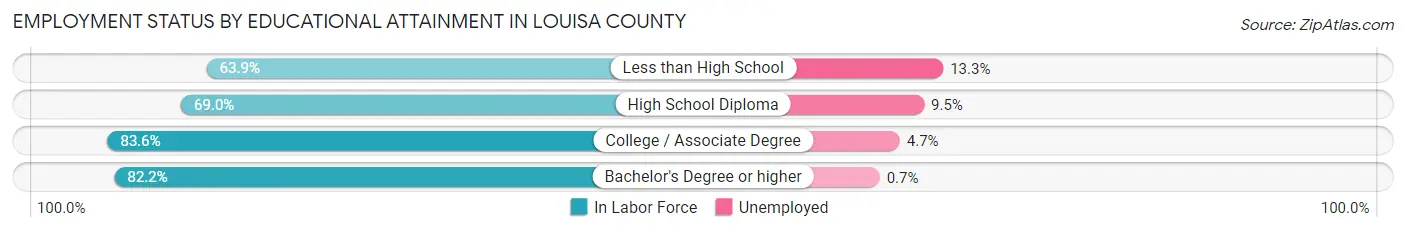
| Educational Attainment | In Labor Force | Unemployed |
| Less than High School | 1,167 (63.9%) | 243 (13.3%) |
| High School Diploma | 4,826 (69.0%) | 664 (9.5%) |
| College / Associate Degree | 5,285 (83.6%) | 297 (4.7%) |
| Bachelor's Degree or higher | 4,154 (82.2%) | 35 (0.7%) |
| Total | 15,430 (76.4%) | 1,171 (5.8%) |
Employment Occupations by Sex in Louisa County
Management, Business, Science and Arts Occupations
The most common Management, Business, Science and Arts occupations in Louisa County are Management (1,870 | 10.4%), Community & Social Service (1,519 | 8.5%), Health Diagnosing & Treating (1,313 | 7.3%), Health Technologists (997 | 5.6%), and Computers, Engineering & Science (973 | 5.4%).
Management, Business, Science and Arts Occupations by Sex
Within the Management, Business, Science and Arts occupations in Louisa County, the most male-oriented occupations are Architecture & Engineering (89.7%), Computers, Engineering & Science (72.4%), and Computers & Mathematics (65.3%), while the most female-oriented occupations are Education Instruction & Library (80.2%), Health Diagnosing & Treating (79.1%), and Health Technologists (77.9%).
| Occupation | Male | Female |
| Management | 1,128 (60.3%) | 742 (39.7%) |
| Business & Financial | 532 (56.0%) | 418 (44.0%) |
| Computers, Engineering & Science | 704 (72.4%) | 269 (27.7%) |
| Computers & Mathematics | 280 (65.3%) | 149 (34.7%) |
| Architecture & Engineering | 375 (89.7%) | 43 (10.3%) |
| Life, Physical & Social Science | 49 (38.9%) | 77 (61.1%) |
| Community & Social Service | 467 (30.7%) | 1,052 (69.3%) |
| Education, Arts & Media | 51 (25.4%) | 150 (74.6%) |
| Legal Services & Support | 84 (48.0%) | 91 (52.0%) |
| Education Instruction & Library | 175 (19.8%) | 710 (80.2%) |
| Arts, Media & Entertainment | 157 (60.9%) | 101 (39.2%) |
| Health Diagnosing & Treating | 274 (20.9%) | 1,039 (79.1%) |
| Health Technologists | 220 (22.1%) | 777 (77.9%) |
| Total (Category) | 3,105 (46.9%) | 3,520 (53.1%) |
| Total (Overall) | 9,447 (52.7%) | 8,483 (47.3%) |
Services Occupations
The most common Services occupations in Louisa County are Cleaning & Maintenance (869 | 4.9%), Food Preparation & Serving (738 | 4.1%), Personal Care & Service (494 | 2.8%), Healthcare Support (484 | 2.7%), and Security & Protection (427 | 2.4%).
Services Occupations by Sex
Within the Services occupations in Louisa County, the most male-oriented occupations are Law Enforcement (98.1%), Security & Protection (88.3%), and Firefighting & Prevention (78.8%), while the most female-oriented occupations are Healthcare Support (95.7%), Personal Care & Service (77.7%), and Food Preparation & Serving (52.6%).
| Occupation | Male | Female |
| Healthcare Support | 21 (4.3%) | 463 (95.7%) |
| Security & Protection | 377 (88.3%) | 50 (11.7%) |
| Firefighting & Prevention | 171 (78.8%) | 46 (21.2%) |
| Law Enforcement | 206 (98.1%) | 4 (1.9%) |
| Food Preparation & Serving | 350 (47.4%) | 388 (52.6%) |
| Cleaning & Maintenance | 637 (73.3%) | 232 (26.7%) |
| Personal Care & Service | 110 (22.3%) | 384 (77.7%) |
| Total (Category) | 1,495 (49.6%) | 1,517 (50.4%) |
| Total (Overall) | 9,447 (52.7%) | 8,483 (47.3%) |
Sales and Office Occupations
The most common Sales and Office occupations in Louisa County are Office & Administration (2,194 | 12.2%), and Sales & Related (1,930 | 10.8%).

Sales and Office Occupations by Sex
| Occupation | Male | Female |
| Sales & Related | 823 (42.6%) | 1,107 (57.4%) |
| Office & Administration | 450 (20.5%) | 1,744 (79.5%) |
| Total (Category) | 1,273 (30.9%) | 2,851 (69.1%) |
| Total (Overall) | 9,447 (52.7%) | 8,483 (47.3%) |
Natural Resources, Construction and Maintenance Occupations
The most common Natural Resources, Construction and Maintenance occupations in Louisa County are Construction & Extraction (967 | 5.4%), Installation, Maintenance & Repair (848 | 4.7%), and Farming, Fishing & Forestry (127 | 0.7%).
Natural Resources, Construction and Maintenance Occupations by Sex
| Occupation | Male | Female |
| Farming, Fishing & Forestry | 63 (49.6%) | 64 (50.4%) |
| Construction & Extraction | 937 (96.9%) | 30 (3.1%) |
| Installation, Maintenance & Repair | 790 (93.2%) | 58 (6.8%) |
| Total (Category) | 1,790 (92.2%) | 152 (7.8%) |
| Total (Overall) | 9,447 (52.7%) | 8,483 (47.3%) |
Production, Transportation and Moving Occupations
The most common Production, Transportation and Moving occupations in Louisa County are Production (1,066 | 5.9%), Transportation (631 | 3.5%), and Material Moving (530 | 3.0%).
Production, Transportation and Moving Occupations by Sex
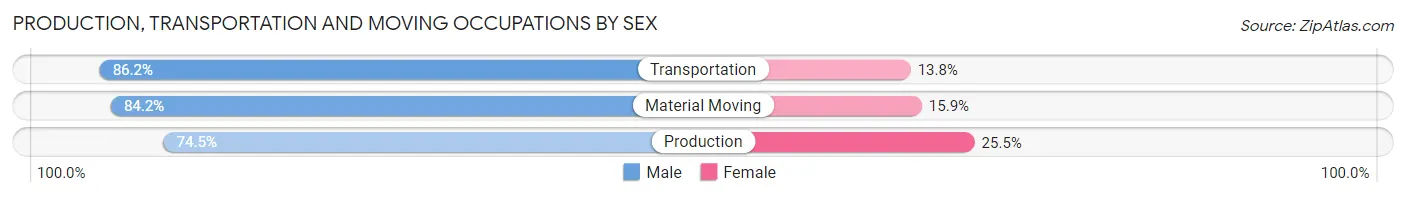
| Occupation | Male | Female |
| Production | 794 (74.5%) | 272 (25.5%) |
| Transportation | 544 (86.2%) | 87 (13.8%) |
| Material Moving | 446 (84.2%) | 84 (15.9%) |
| Total (Category) | 1,784 (80.1%) | 443 (19.9%) |
| Total (Overall) | 9,447 (52.7%) | 8,483 (47.3%) |
Employment Industries by Sex in Louisa County
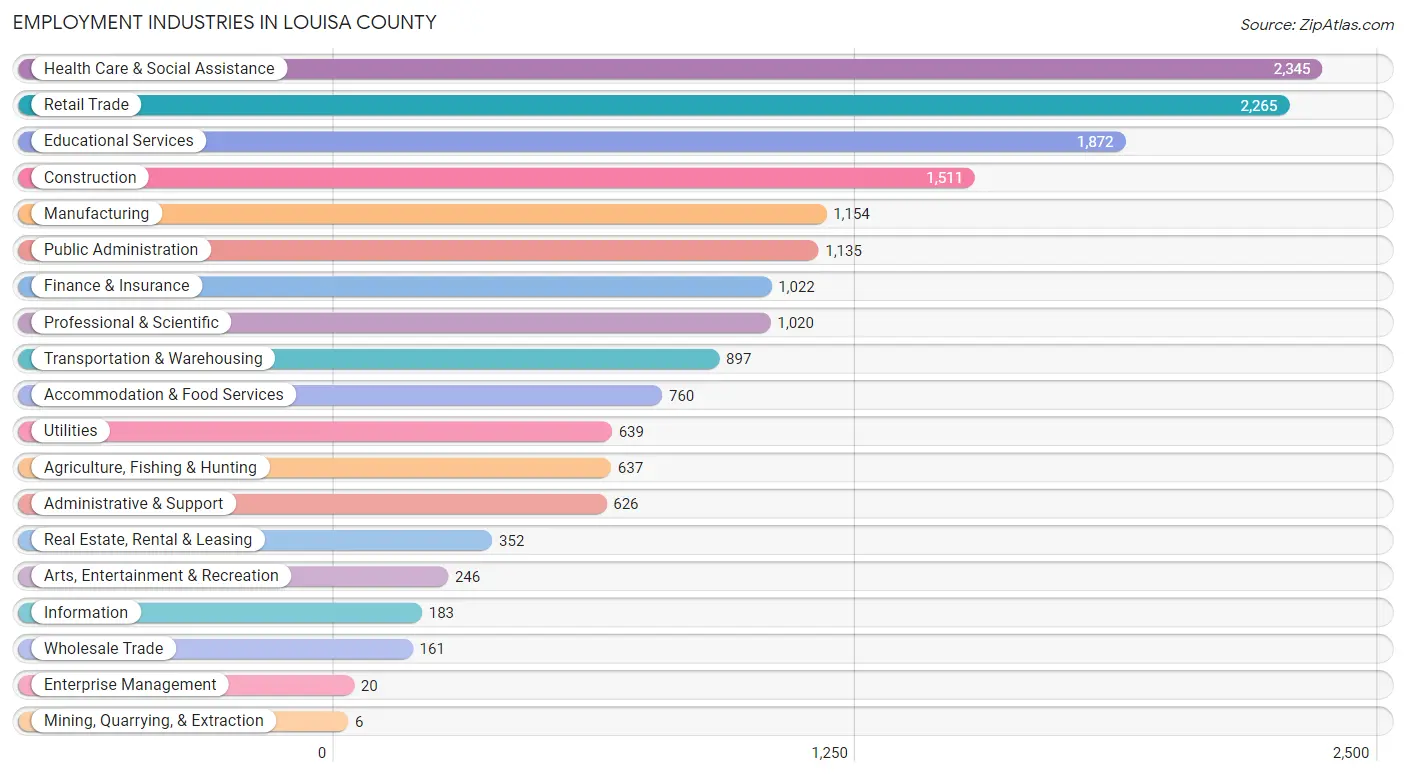
Employment Industries in Louisa County
The major employment industries in Louisa County include Health Care & Social Assistance (2,345 | 13.1%), Retail Trade (2,265 | 12.6%), Educational Services (1,872 | 10.4%), Construction (1,511 | 8.4%), and Manufacturing (1,154 | 6.4%).
Employment Industries by Sex in Louisa County
The Louisa County industries that see more men than women are Wholesale Trade (85.7%), Utilities (82.8%), and Construction (81.9%), whereas the industries that tend to have a higher number of women are Enterprise Management (100.0%), Health Care & Social Assistance (82.1%), and Finance & Insurance (67.4%).
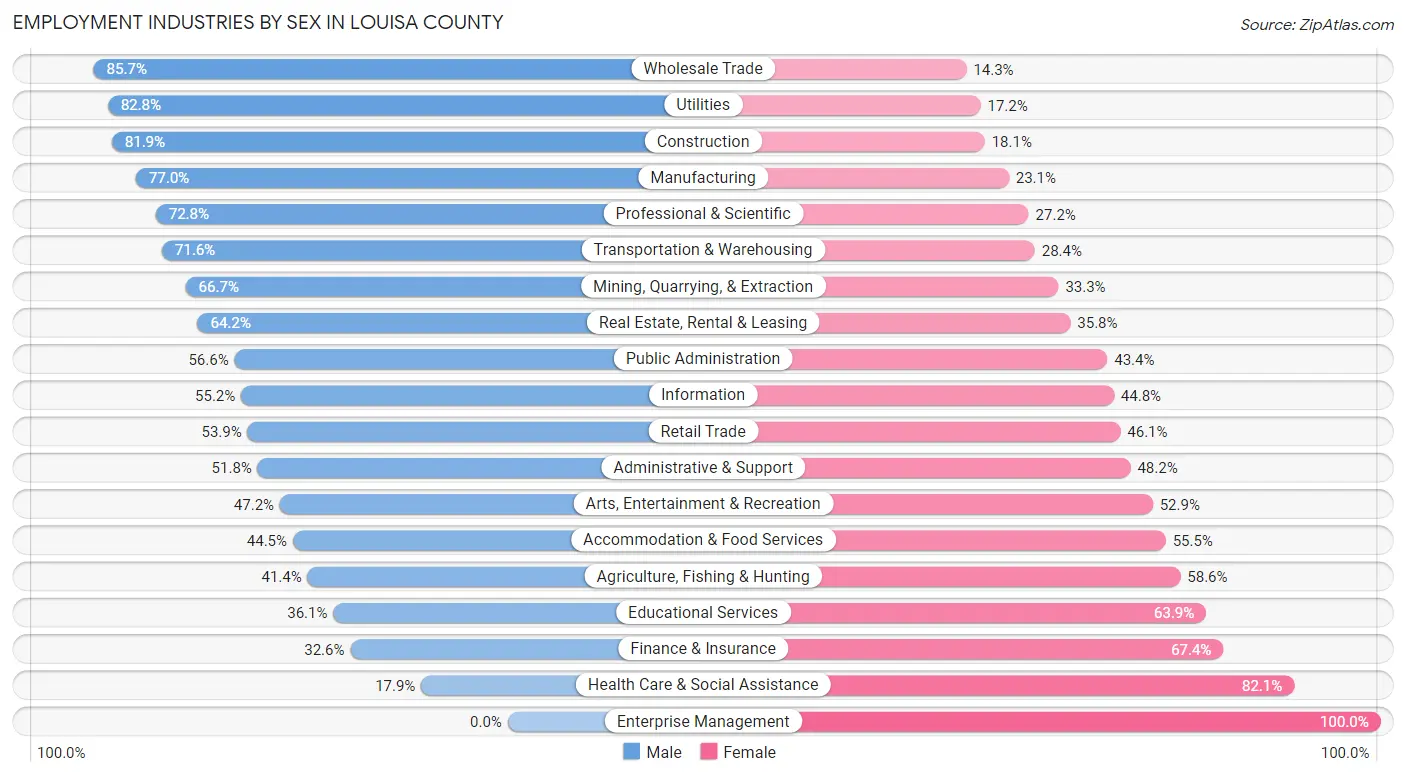
| Industry | Male | Female |
| Agriculture, Fishing & Hunting | 264 (41.4%) | 373 (58.6%) |
| Mining, Quarrying, & Extraction | 4 (66.7%) | 2 (33.3%) |
| Construction | 1,238 (81.9%) | 273 (18.1%) |
| Manufacturing | 888 (76.9%) | 266 (23.1%) |
| Wholesale Trade | 138 (85.7%) | 23 (14.3%) |
| Retail Trade | 1,220 (53.9%) | 1,045 (46.1%) |
| Transportation & Warehousing | 642 (71.6%) | 255 (28.4%) |
| Utilities | 529 (82.8%) | 110 (17.2%) |
| Information | 101 (55.2%) | 82 (44.8%) |
| Finance & Insurance | 333 (32.6%) | 689 (67.4%) |
| Real Estate, Rental & Leasing | 226 (64.2%) | 126 (35.8%) |
| Professional & Scientific | 743 (72.8%) | 277 (27.2%) |
| Enterprise Management | 0 (0.0%) | 20 (100.0%) |
| Administrative & Support | 324 (51.8%) | 302 (48.2%) |
| Educational Services | 676 (36.1%) | 1,196 (63.9%) |
| Health Care & Social Assistance | 420 (17.9%) | 1,925 (82.1%) |
| Arts, Entertainment & Recreation | 116 (47.1%) | 130 (52.8%) |
| Accommodation & Food Services | 338 (44.5%) | 422 (55.5%) |
| Public Administration | 642 (56.6%) | 493 (43.4%) |
| Total | 9,447 (52.7%) | 8,483 (47.3%) |
Education in Louisa County
School Enrollment in Louisa County
The most common levels of schooling among the 7,344 students in Louisa County are elementary school (1,802 | 24.5%), middle school (1,699 | 23.1%), and high school (1,539 | 21.0%).
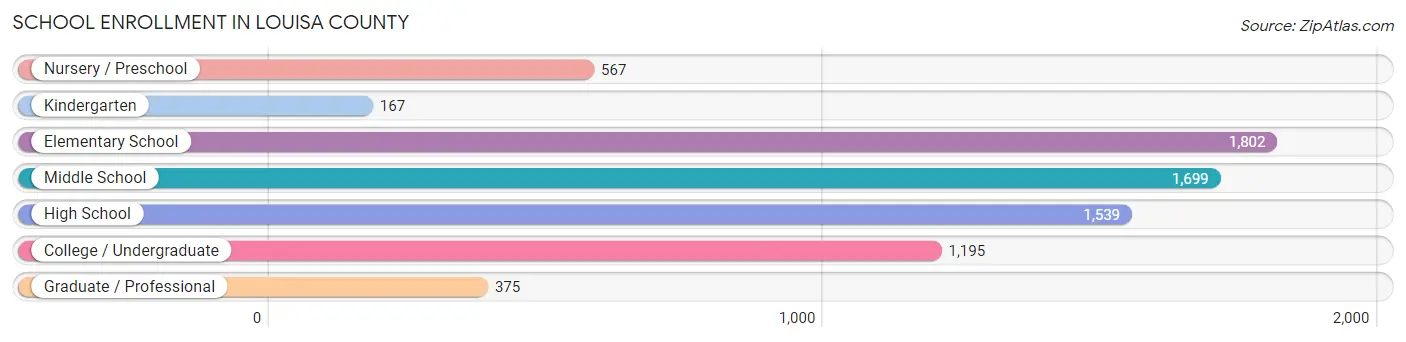
| School Level | # Students | % Students |
| Nursery / Preschool | 567 | 7.7% |
| Kindergarten | 167 | 2.3% |
| Elementary School | 1,802 | 24.5% |
| Middle School | 1,699 | 23.1% |
| High School | 1,539 | 21.0% |
| College / Undergraduate | 1,195 | 16.3% |
| Graduate / Professional | 375 | 5.1% |
| Total | 7,344 | 100.0% |
School Enrollment by Age by Funding Source in Louisa County
Out of a total of 7,344 students who are enrolled in schools in Louisa County, 1,050 (14.3%) attend a private institution, while the remaining 6,294 (85.7%) are enrolled in public schools. The age group of 3 to 4 year olds has the highest likelihood of being enrolled in private schools, with 212 (52.2% in the age bracket) enrolled. Conversely, the age group of 25 to 34 year olds has the lowest likelihood of being enrolled in a private school, with 343 (95.8% in the age bracket) attending a public institution.
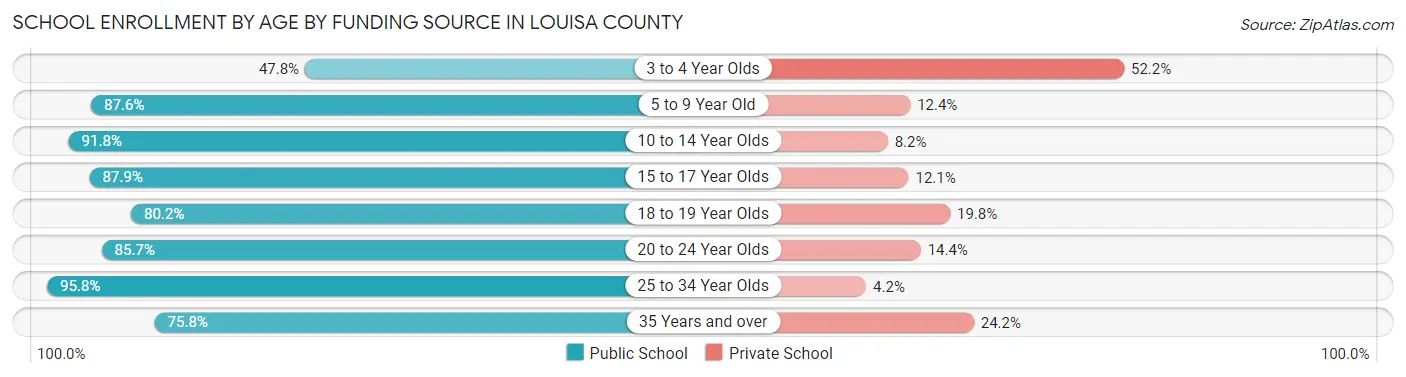
| Age Bracket | Public School | Private School |
| 3 to 4 Year Olds | 194 (47.8%) | 212 (52.2%) |
| 5 to 9 Year Old | 1,760 (87.6%) | 249 (12.4%) |
| 10 to 14 Year Olds | 1,889 (91.8%) | 169 (8.2%) |
| 15 to 17 Year Olds | 1,098 (87.9%) | 151 (12.1%) |
| 18 to 19 Year Olds | 186 (80.2%) | 46 (19.8%) |
| 20 to 24 Year Olds | 382 (85.7%) | 64 (14.3%) |
| 25 to 34 Year Olds | 343 (95.8%) | 15 (4.2%) |
| 35 Years and over | 444 (75.8%) | 142 (24.2%) |
| Total | 6,294 (85.7%) | 1,050 (14.3%) |
Educational Attainment by Field of Study in Louisa County
Business (1,274 | 16.4%), science & technology (1,079 | 13.9%), education (771 | 10.0%), bio, nature & agricultural (757 | 9.8%), and engineering (663 | 8.6%) are the most common fields of study among 7,751 individuals in Louisa County who have obtained a bachelor's degree or higher.
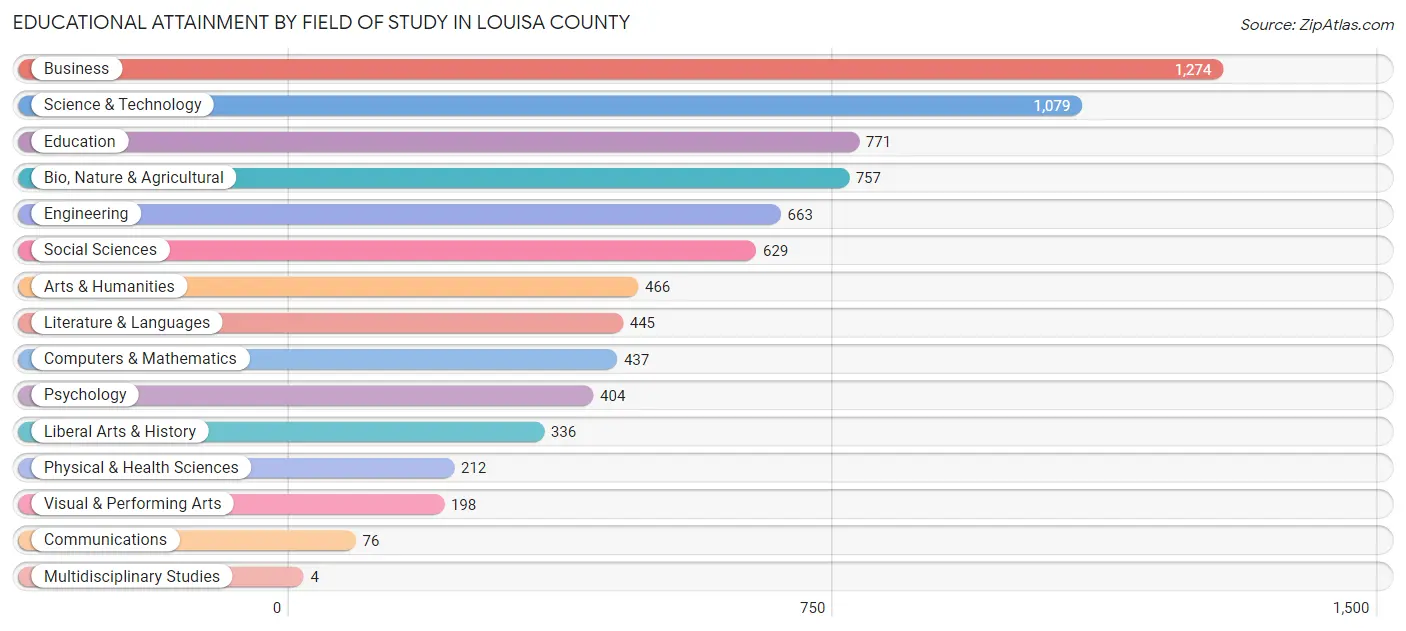
| Field of Study | # Graduates | % Graduates |
| Computers & Mathematics | 437 | 5.6% |
| Bio, Nature & Agricultural | 757 | 9.8% |
| Physical & Health Sciences | 212 | 2.7% |
| Psychology | 404 | 5.2% |
| Social Sciences | 629 | 8.1% |
| Engineering | 663 | 8.6% |
| Multidisciplinary Studies | 4 | 0.1% |
| Science & Technology | 1,079 | 13.9% |
| Business | 1,274 | 16.4% |
| Education | 771 | 10.0% |
| Literature & Languages | 445 | 5.7% |
| Liberal Arts & History | 336 | 4.3% |
| Visual & Performing Arts | 198 | 2.5% |
| Communications | 76 | 1.0% |
| Arts & Humanities | 466 | 6.0% |
| Total | 7,751 | 100.0% |
Transportation & Commute in Louisa County
Vehicle Availability by Sex in Louisa County
The most prevalent vehicle ownership categories in Louisa County are males with 2 vehicles (3,287, accounting for 35.6%) and females with 2 vehicles (2,344, making up 39.2%).
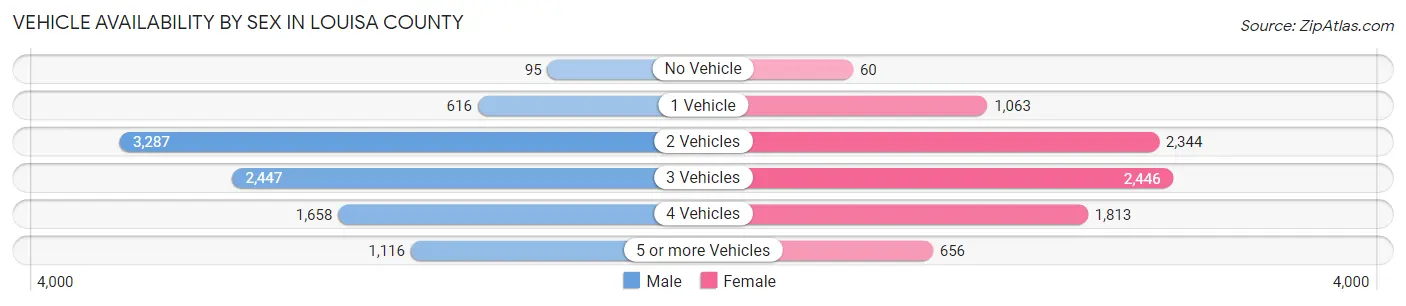
| Vehicles Available | Male | Female |
| No Vehicle | 95 (1.0%) | 60 (0.7%) |
| 1 Vehicle | 616 (6.7%) | 1,063 (12.7%) |
| 2 Vehicles | 3,287 (35.6%) | 2,344 (28.0%) |
| 3 Vehicles | 2,447 (26.5%) | 2,446 (29.2%) |
| 4 Vehicles | 1,658 (18.0%) | 1,813 (21.6%) |
| 5 or more Vehicles | 1,116 (12.1%) | 656 (7.8%) |
| Total | 9,219 (100.0%) | 8,382 (100.0%) |
Commute Time in Louisa County
The most frequently occuring commute durations in Louisa County are 45 to 59 minutes (3,128 commuters, 19.8%), 30 to 34 minutes (2,336 commuters, 14.8%), and 15 to 19 minutes (1,529 commuters, 9.7%).
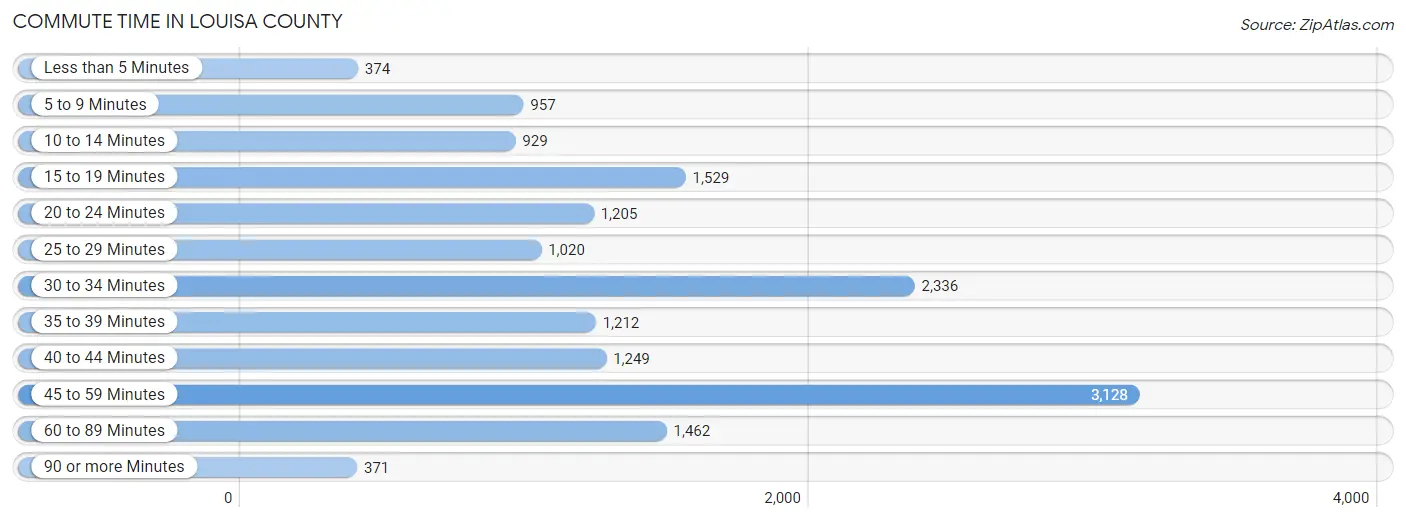
| Commute Time | # Commuters | % Commuters |
| Less than 5 Minutes | 374 | 2.4% |
| 5 to 9 Minutes | 957 | 6.1% |
| 10 to 14 Minutes | 929 | 5.9% |
| 15 to 19 Minutes | 1,529 | 9.7% |
| 20 to 24 Minutes | 1,205 | 7.6% |
| 25 to 29 Minutes | 1,020 | 6.5% |
| 30 to 34 Minutes | 2,336 | 14.8% |
| 35 to 39 Minutes | 1,212 | 7.7% |
| 40 to 44 Minutes | 1,249 | 7.9% |
| 45 to 59 Minutes | 3,128 | 19.8% |
| 60 to 89 Minutes | 1,462 | 9.3% |
| 90 or more Minutes | 371 | 2.4% |
Commute Time by Sex in Louisa County
The most common commute times in Louisa County are 45 to 59 minutes (1,686 commuters, 20.5%) for males and 45 to 59 minutes (1,442 commuters, 19.1%) for females.
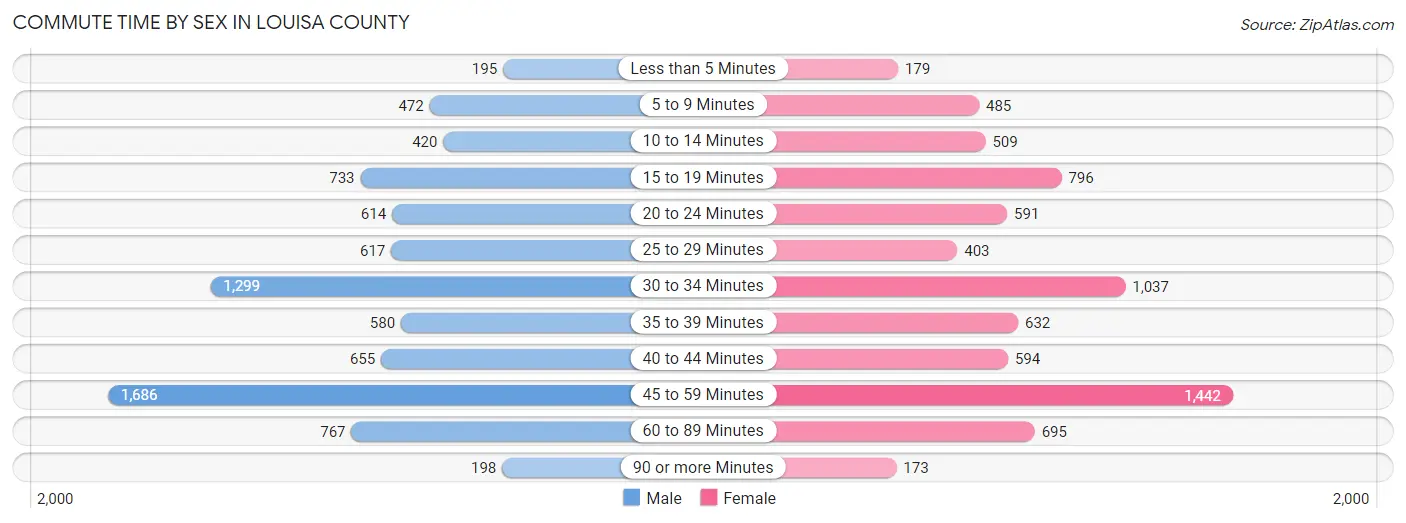
| Commute Time | Male | Female |
| Less than 5 Minutes | 195 (2.4%) | 179 (2.4%) |
| 5 to 9 Minutes | 472 (5.7%) | 485 (6.4%) |
| 10 to 14 Minutes | 420 (5.1%) | 509 (6.8%) |
| 15 to 19 Minutes | 733 (8.9%) | 796 (10.6%) |
| 20 to 24 Minutes | 614 (7.5%) | 591 (7.8%) |
| 25 to 29 Minutes | 617 (7.5%) | 403 (5.3%) |
| 30 to 34 Minutes | 1,299 (15.8%) | 1,037 (13.8%) |
| 35 to 39 Minutes | 580 (7.0%) | 632 (8.4%) |
| 40 to 44 Minutes | 655 (8.0%) | 594 (7.9%) |
| 45 to 59 Minutes | 1,686 (20.5%) | 1,442 (19.1%) |
| 60 to 89 Minutes | 767 (9.3%) | 695 (9.2%) |
| 90 or more Minutes | 198 (2.4%) | 173 (2.3%) |
Time of Departure to Work by Sex in Louisa County
The most frequent times of departure to work in Louisa County are 6:30 AM to 6:59 AM (1,322, 16.1%) for males and 7:00 AM to 7:29 AM (1,308, 17.4%) for females.
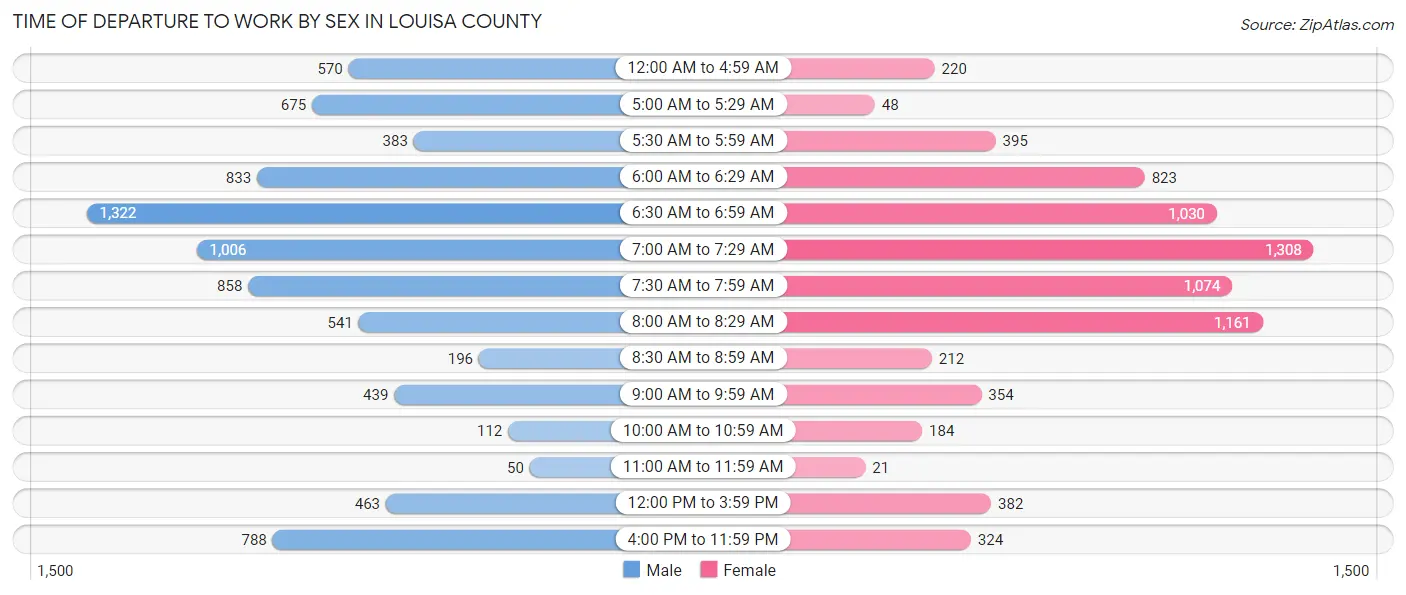
| Time of Departure | Male | Female |
| 12:00 AM to 4:59 AM | 570 (6.9%) | 220 (2.9%) |
| 5:00 AM to 5:29 AM | 675 (8.2%) | 48 (0.6%) |
| 5:30 AM to 5:59 AM | 383 (4.6%) | 395 (5.2%) |
| 6:00 AM to 6:29 AM | 833 (10.1%) | 823 (10.9%) |
| 6:30 AM to 6:59 AM | 1,322 (16.1%) | 1,030 (13.7%) |
| 7:00 AM to 7:29 AM | 1,006 (12.2%) | 1,308 (17.4%) |
| 7:30 AM to 7:59 AM | 858 (10.4%) | 1,074 (14.2%) |
| 8:00 AM to 8:29 AM | 541 (6.6%) | 1,161 (15.4%) |
| 8:30 AM to 8:59 AM | 196 (2.4%) | 212 (2.8%) |
| 9:00 AM to 9:59 AM | 439 (5.3%) | 354 (4.7%) |
| 10:00 AM to 10:59 AM | 112 (1.4%) | 184 (2.4%) |
| 11:00 AM to 11:59 AM | 50 (0.6%) | 21 (0.3%) |
| 12:00 PM to 3:59 PM | 463 (5.6%) | 382 (5.1%) |
| 4:00 PM to 11:59 PM | 788 (9.6%) | 324 (4.3%) |
| Total | 8,236 (100.0%) | 7,536 (100.0%) |
Housing Occupancy in Louisa County
Occupancy by Ownership in Louisa County
Of the total 14,642 dwellings in Louisa County, owner-occupied units account for 11,692 (79.8%), while renter-occupied units make up 2,950 (20.2%).
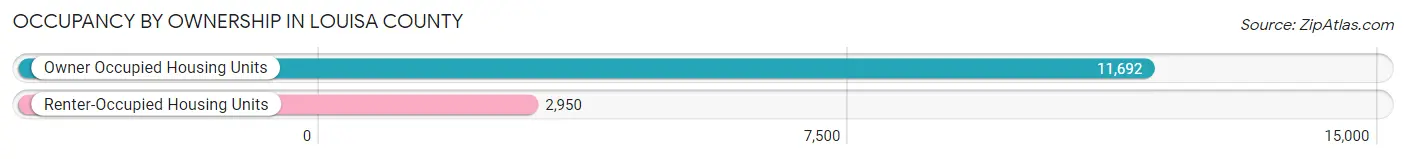
| Occupancy | # Housing Units | % Housing Units |
| Owner Occupied Housing Units | 11,692 | 79.8% |
| Renter-Occupied Housing Units | 2,950 | 20.2% |
| Total Occupied Housing Units | 14,642 | 100.0% |
Occupancy by Household Size in Louisa County
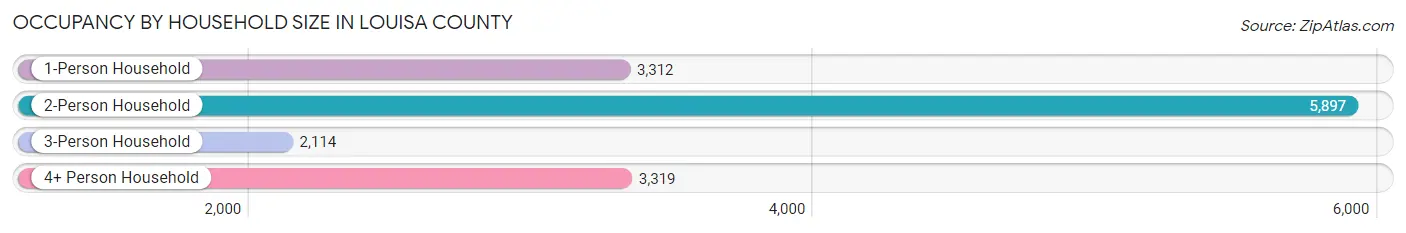
| Household Size | # Housing Units | % Housing Units |
| 1-Person Household | 3,312 | 22.6% |
| 2-Person Household | 5,897 | 40.3% |
| 3-Person Household | 2,114 | 14.4% |
| 4+ Person Household | 3,319 | 22.7% |
| Total Housing Units | 14,642 | 100.0% |
Occupancy by Ownership by Household Size in Louisa County
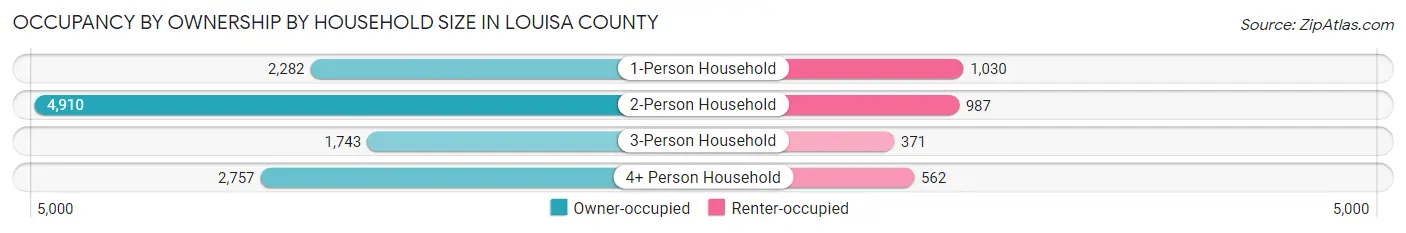
| Household Size | Owner-occupied | Renter-occupied |
| 1-Person Household | 2,282 (68.9%) | 1,030 (31.1%) |
| 2-Person Household | 4,910 (83.3%) | 987 (16.7%) |
| 3-Person Household | 1,743 (82.5%) | 371 (17.5%) |
| 4+ Person Household | 2,757 (83.1%) | 562 (16.9%) |
| Total Housing Units | 11,692 (79.8%) | 2,950 (20.2%) |
Occupancy by Educational Attainment in Louisa County
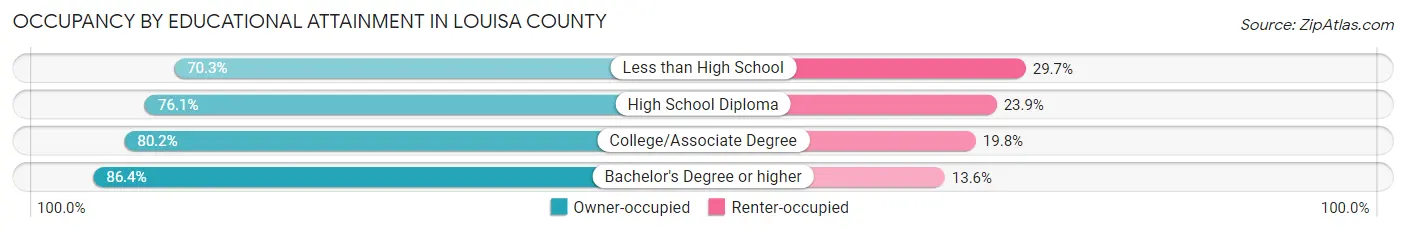
| Household Size | Owner-occupied | Renter-occupied |
| Less than High School | 1,102 (70.3%) | 465 (29.7%) |
| High School Diploma | 3,139 (76.1%) | 986 (23.9%) |
| College/Associate Degree | 3,647 (80.2%) | 899 (19.8%) |
| Bachelor's Degree or higher | 3,804 (86.4%) | 600 (13.6%) |
Occupancy by Age of Householder in Louisa County
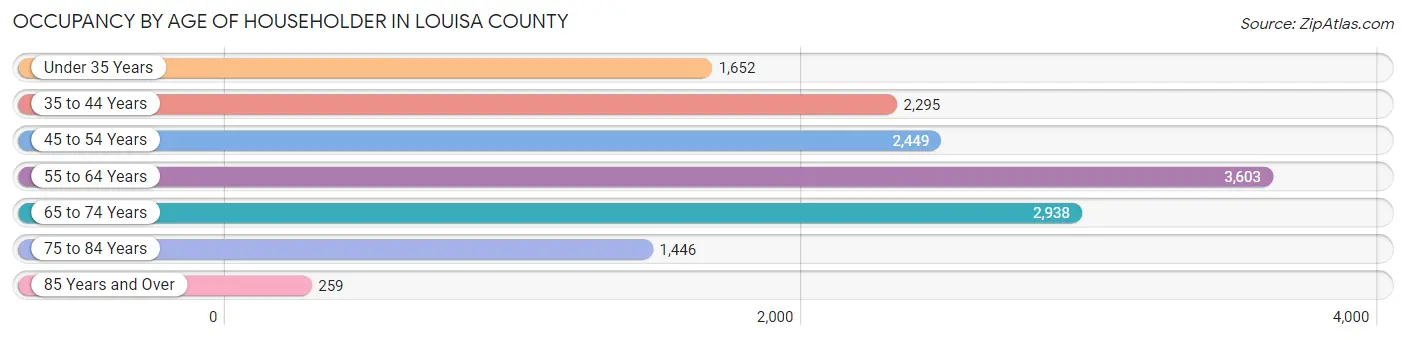
| Age Bracket | # Households | % Households |
| Under 35 Years | 1,652 | 11.3% |
| 35 to 44 Years | 2,295 | 15.7% |
| 45 to 54 Years | 2,449 | 16.7% |
| 55 to 64 Years | 3,603 | 24.6% |
| 65 to 74 Years | 2,938 | 20.1% |
| 75 to 84 Years | 1,446 | 9.9% |
| 85 Years and Over | 259 | 1.8% |
| Total | 14,642 | 100.0% |
Housing Finances in Louisa County
Median Income by Occupancy in Louisa County
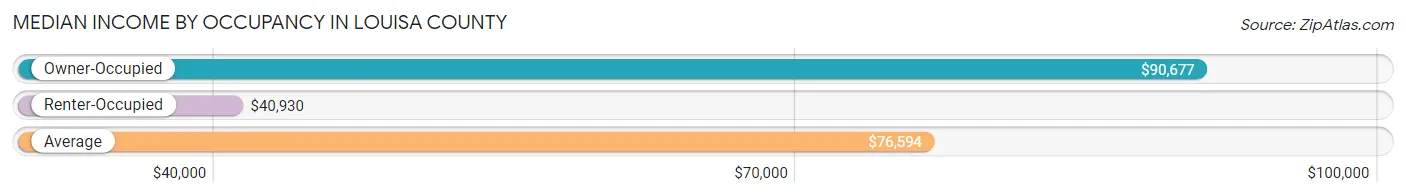
| Occupancy Type | # Households | Median Income |
| Owner-Occupied | 11,692 (79.8%) | $90,677 |
| Renter-Occupied | 2,950 (20.2%) | $40,930 |
| Average | 14,642 (100.0%) | $76,594 |
Occupancy by Householder Income Bracket in Louisa County
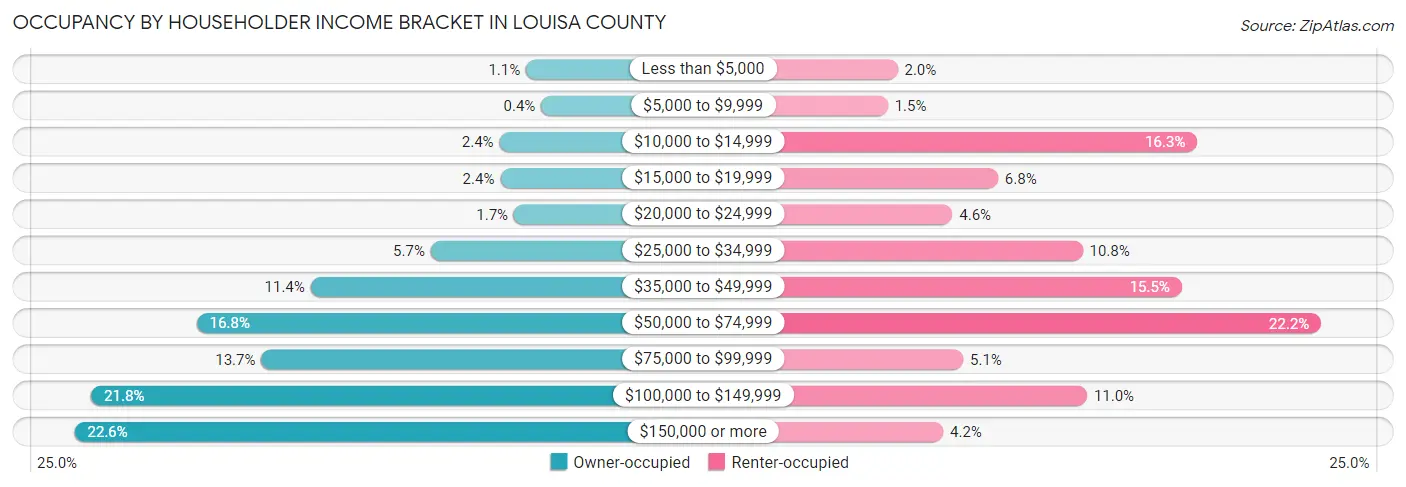
| Income Bracket | Owner-occupied | Renter-occupied |
| Less than $5,000 | 131 (1.1%) | 59 (2.0%) |
| $5,000 to $9,999 | 47 (0.4%) | 45 (1.5%) |
| $10,000 to $14,999 | 280 (2.4%) | 480 (16.3%) |
| $15,000 to $19,999 | 275 (2.4%) | 200 (6.8%) |
| $20,000 to $24,999 | 199 (1.7%) | 136 (4.6%) |
| $25,000 to $34,999 | 662 (5.7%) | 319 (10.8%) |
| $35,000 to $49,999 | 1,330 (11.4%) | 458 (15.5%) |
| $50,000 to $74,999 | 1,965 (16.8%) | 654 (22.2%) |
| $75,000 to $99,999 | 1,605 (13.7%) | 151 (5.1%) |
| $100,000 to $149,999 | 2,552 (21.8%) | 325 (11.0%) |
| $150,000 or more | 2,646 (22.6%) | 123 (4.2%) |
| Total | 11,692 (100.0%) | 2,950 (100.0%) |
Monthly Housing Cost Tiers in Louisa County
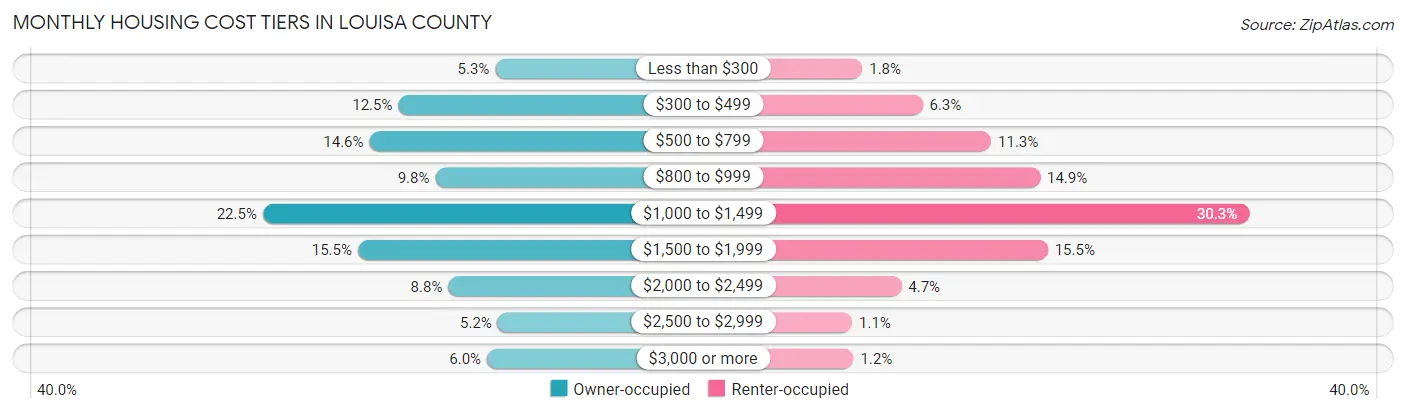
| Monthly Cost | Owner-occupied | Renter-occupied |
| Less than $300 | 624 (5.3%) | 54 (1.8%) |
| $300 to $499 | 1,459 (12.5%) | 185 (6.3%) |
| $500 to $799 | 1,708 (14.6%) | 334 (11.3%) |
| $800 to $999 | 1,140 (9.8%) | 440 (14.9%) |
| $1,000 to $1,499 | 2,626 (22.5%) | 894 (30.3%) |
| $1,500 to $1,999 | 1,807 (15.5%) | 457 (15.5%) |
| $2,000 to $2,499 | 1,029 (8.8%) | 139 (4.7%) |
| $2,500 to $2,999 | 603 (5.2%) | 32 (1.1%) |
| $3,000 or more | 696 (5.9%) | 35 (1.2%) |
| Total | 11,692 (100.0%) | 2,950 (100.0%) |
Physical Housing Characteristics in Louisa County
Housing Structures in Louisa County
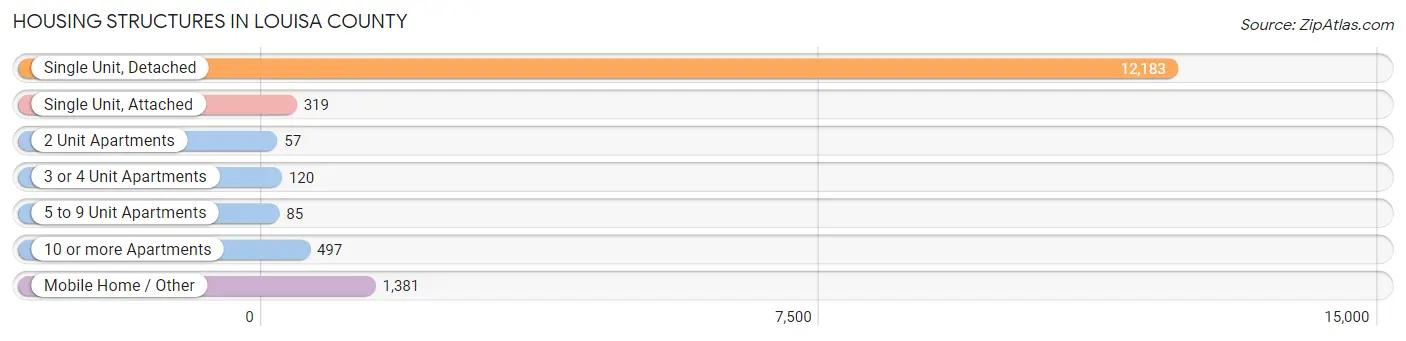
| Structure Type | # Housing Units | % Housing Units |
| Single Unit, Detached | 12,183 | 83.2% |
| Single Unit, Attached | 319 | 2.2% |
| 2 Unit Apartments | 57 | 0.4% |
| 3 or 4 Unit Apartments | 120 | 0.8% |
| 5 to 9 Unit Apartments | 85 | 0.6% |
| 10 or more Apartments | 497 | 3.4% |
| Mobile Home / Other | 1,381 | 9.4% |
| Total | 14,642 | 100.0% |
Housing Structures by Occupancy in Louisa County
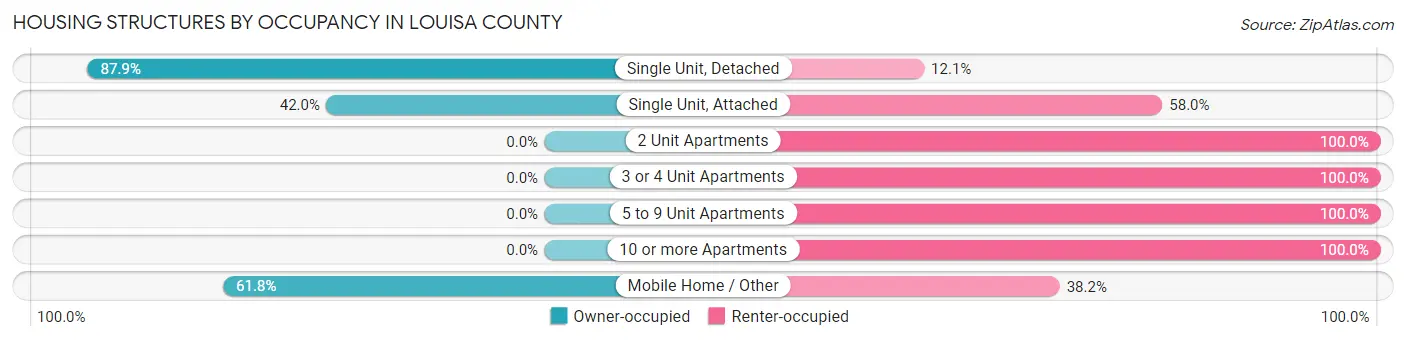
| Structure Type | Owner-occupied | Renter-occupied |
| Single Unit, Detached | 10,705 (87.9%) | 1,478 (12.1%) |
| Single Unit, Attached | 134 (42.0%) | 185 (58.0%) |
| 2 Unit Apartments | 0 (0.0%) | 57 (100.0%) |
| 3 or 4 Unit Apartments | 0 (0.0%) | 120 (100.0%) |
| 5 to 9 Unit Apartments | 0 (0.0%) | 85 (100.0%) |
| 10 or more Apartments | 0 (0.0%) | 497 (100.0%) |
| Mobile Home / Other | 853 (61.8%) | 528 (38.2%) |
| Total | 11,692 (79.8%) | 2,950 (20.2%) |
Housing Structures by Number of Rooms in Louisa County
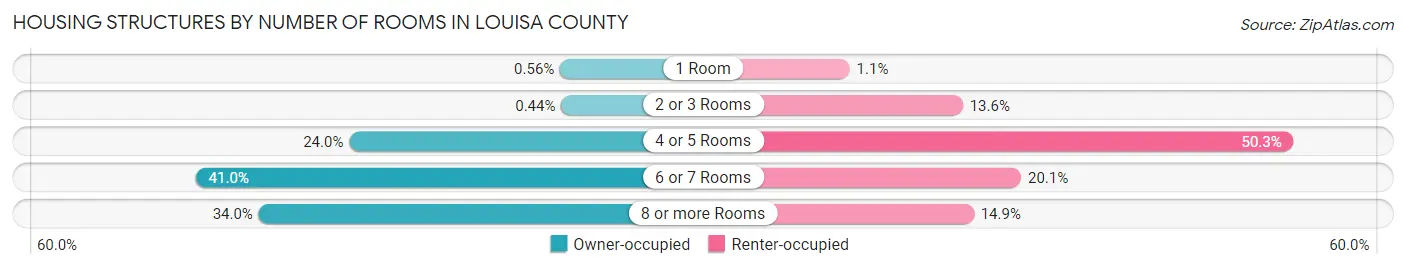
| Number of Rooms | Owner-occupied | Renter-occupied |
| 1 Room | 66 (0.6%) | 32 (1.1%) |
| 2 or 3 Rooms | 51 (0.4%) | 402 (13.6%) |
| 4 or 5 Rooms | 2,802 (24.0%) | 1,485 (50.3%) |
| 6 or 7 Rooms | 4,795 (41.0%) | 593 (20.1%) |
| 8 or more Rooms | 3,978 (34.0%) | 438 (14.8%) |
| Total | 11,692 (100.0%) | 2,950 (100.0%) |
Housing Structure by Heating Type in Louisa County
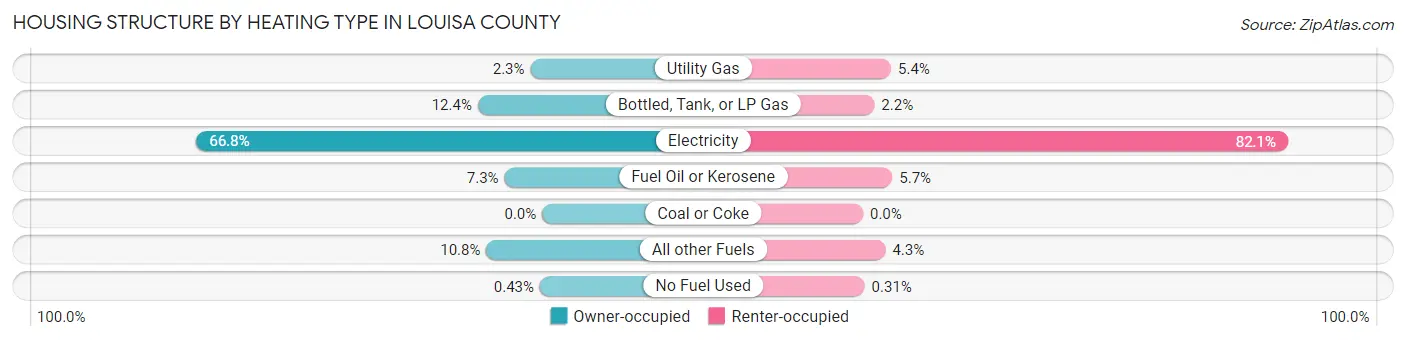
| Heating Type | Owner-occupied | Renter-occupied |
| Utility Gas | 265 (2.3%) | 160 (5.4%) |
| Bottled, Tank, or LP Gas | 1,454 (12.4%) | 65 (2.2%) |
| Electricity | 7,811 (66.8%) | 2,421 (82.1%) |
| Fuel Oil or Kerosene | 851 (7.3%) | 167 (5.7%) |
| Coal or Coke | 0 (0.0%) | 0 (0.0%) |
| All other Fuels | 1,261 (10.8%) | 128 (4.3%) |
| No Fuel Used | 50 (0.4%) | 9 (0.3%) |
| Total | 11,692 (100.0%) | 2,950 (100.0%) |
Household Vehicle Usage in Louisa County
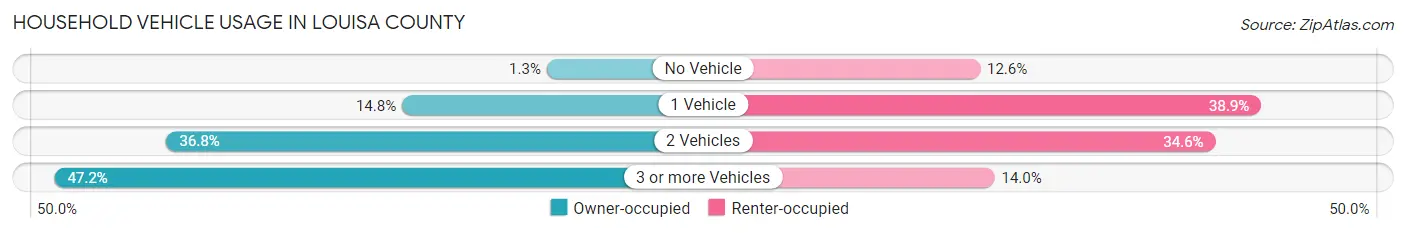
| Vehicles per Household | Owner-occupied | Renter-occupied |
| No Vehicle | 147 (1.3%) | 372 (12.6%) |
| 1 Vehicle | 1,727 (14.8%) | 1,146 (38.9%) |
| 2 Vehicles | 4,298 (36.8%) | 1,020 (34.6%) |
| 3 or more Vehicles | 5,520 (47.2%) | 412 (14.0%) |
| Total | 11,692 (100.0%) | 2,950 (100.0%) |
Real Estate & Mortgages in Louisa County
Real Estate and Mortgage Overview in Louisa County
| Characteristic | Without Mortgage | With Mortgage |
| Housing Units | 3,699 | 7,993 |
| Median Property Value | $241,500 | $275,200 |
| Median Household Income | $67,698 | $1,977 |
| Monthly Housing Costs | $488 | $688 |
| Real Estate Taxes | $1,748 | $208 |
Property Value by Mortgage Status in Louisa County
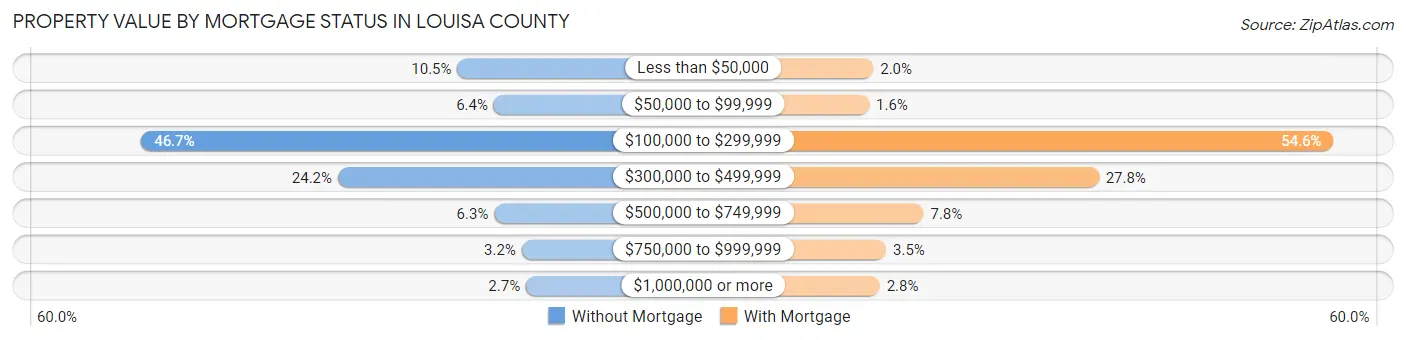
| Property Value | Without Mortgage | With Mortgage |
| Less than $50,000 | 390 (10.5%) | 162 (2.0%) |
| $50,000 to $99,999 | 236 (6.4%) | 124 (1.5%) |
| $100,000 to $299,999 | 1,726 (46.7%) | 4,365 (54.6%) |
| $300,000 to $499,999 | 895 (24.2%) | 2,221 (27.8%) |
| $500,000 to $749,999 | 234 (6.3%) | 621 (7.8%) |
| $750,000 to $999,999 | 118 (3.2%) | 279 (3.5%) |
| $1,000,000 or more | 100 (2.7%) | 221 (2.8%) |
| Total | 3,699 (100.0%) | 7,993 (100.0%) |
Household Income by Mortgage Status in Louisa County
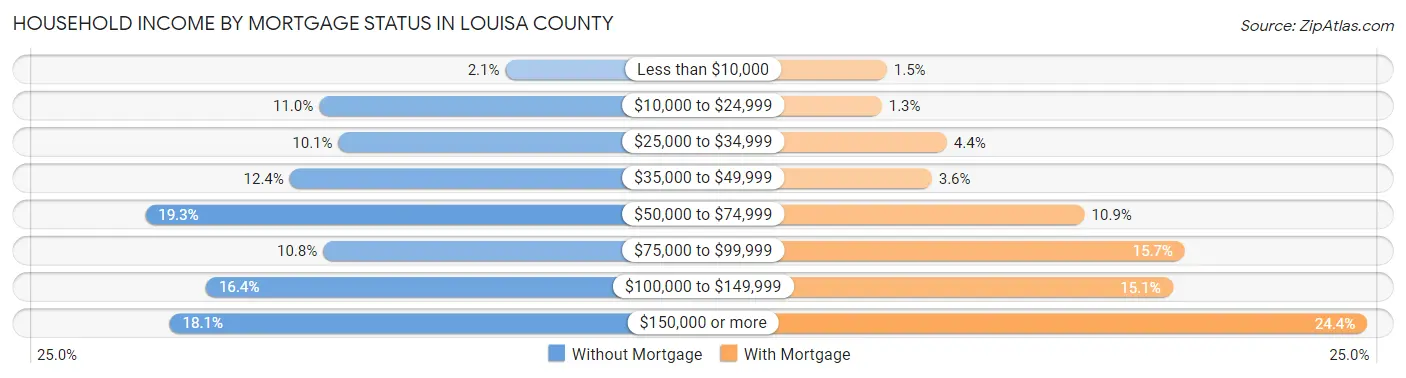
| Household Income | Without Mortgage | With Mortgage |
| Less than $10,000 | 78 (2.1%) | 119 (1.5%) |
| $10,000 to $24,999 | 406 (11.0%) | 100 (1.3%) |
| $25,000 to $34,999 | 372 (10.1%) | 348 (4.3%) |
| $35,000 to $49,999 | 458 (12.4%) | 290 (3.6%) |
| $50,000 to $74,999 | 712 (19.3%) | 872 (10.9%) |
| $75,000 to $99,999 | 399 (10.8%) | 1,253 (15.7%) |
| $100,000 to $149,999 | 605 (16.4%) | 1,206 (15.1%) |
| $150,000 or more | 669 (18.1%) | 1,947 (24.4%) |
| Total | 3,699 (100.0%) | 7,993 (100.0%) |
Property Value to Household Income Ratio in Louisa County
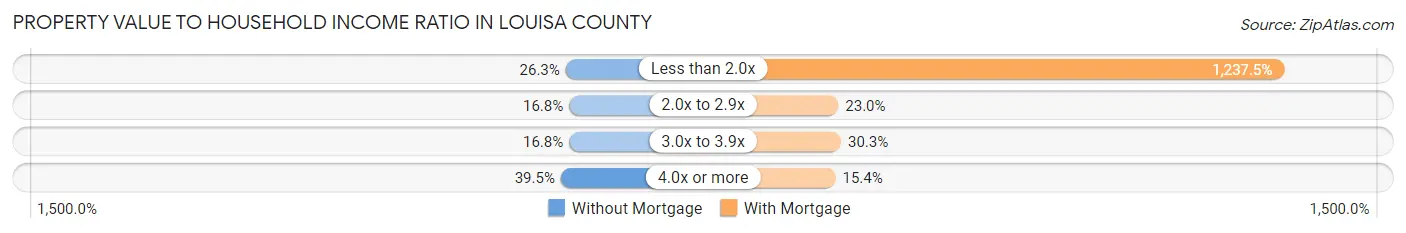
| Value-to-Income Ratio | Without Mortgage | With Mortgage |
| Less than 2.0x | 972 (26.3%) | 98,915 (1,237.5%) |
| 2.0x to 2.9x | 622 (16.8%) | 1,834 (23.0%) |
| 3.0x to 3.9x | 622 (16.8%) | 2,424 (30.3%) |
| 4.0x or more | 1,462 (39.5%) | 1,232 (15.4%) |
| Total | 3,699 (100.0%) | 7,993 (100.0%) |
Real Estate Taxes by Mortgage Status in Louisa County
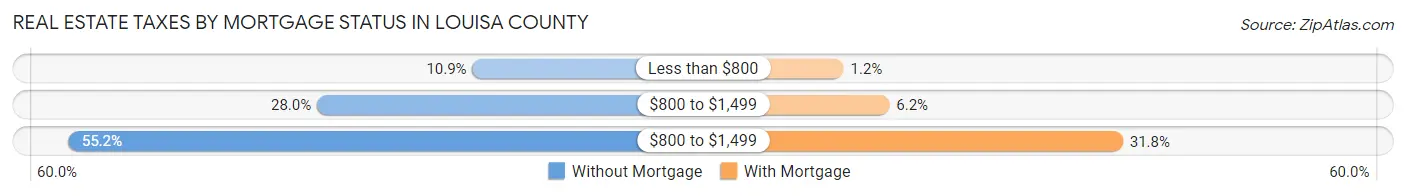
| Property Taxes | Without Mortgage | With Mortgage |
| Less than $800 | 404 (10.9%) | 93 (1.2%) |
| $800 to $1,499 | 1,034 (28.0%) | 493 (6.2%) |
| $800 to $1,499 | 2,040 (55.1%) | 2,538 (31.8%) |
| Total | 3,699 (100.0%) | 7,993 (100.0%) |
Health & Disability in Louisa County
Health Insurance Coverage by Age in Louisa County
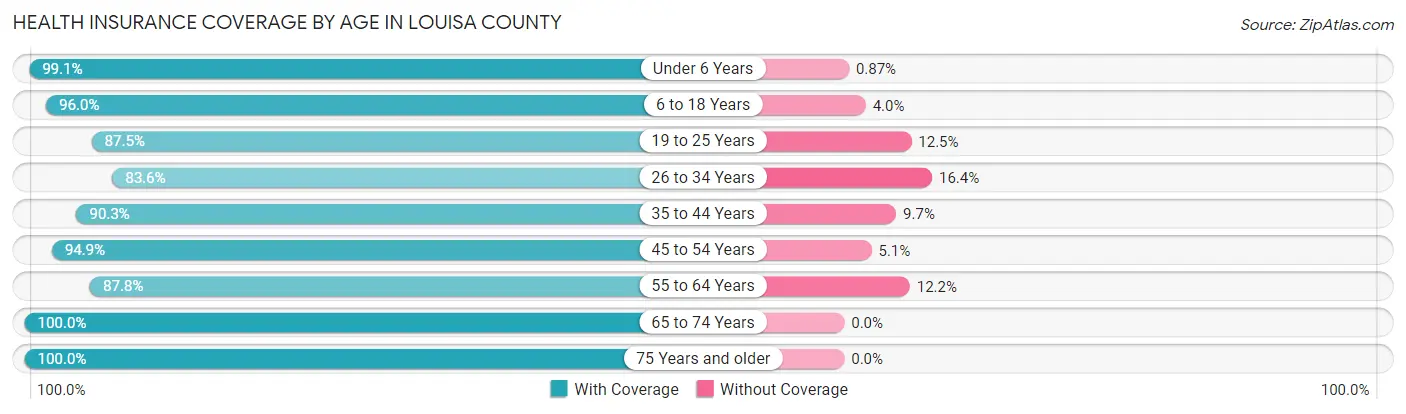
| Age Bracket | With Coverage | Without Coverage |
| Under 6 Years | 2,284 (99.1%) | 20 (0.9%) |
| 6 to 18 Years | 5,375 (96.0%) | 224 (4.0%) |
| 19 to 25 Years | 2,363 (87.5%) | 338 (12.5%) |
| 26 to 34 Years | 3,262 (83.6%) | 638 (16.4%) |
| 35 to 44 Years | 4,112 (90.3%) | 440 (9.7%) |
| 45 to 54 Years | 4,599 (94.9%) | 246 (5.1%) |
| 55 to 64 Years | 5,667 (87.8%) | 788 (12.2%) |
| 65 to 74 Years | 4,873 (100.0%) | 0 (0.0%) |
| 75 Years and older | 2,753 (100.0%) | 0 (0.0%) |
| Total | 35,288 (92.9%) | 2,694 (7.1%) |
Health Insurance Coverage by Citizenship Status in Louisa County
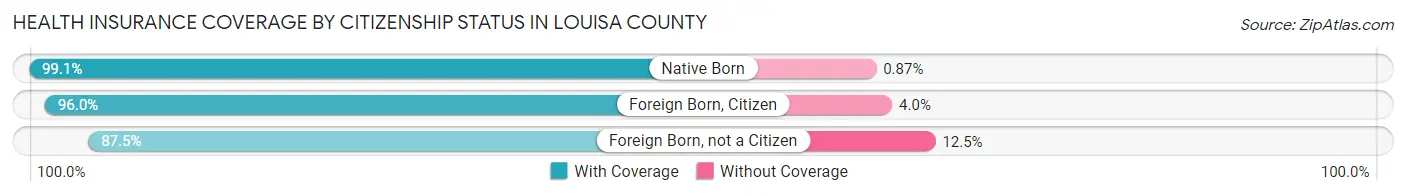
| Citizenship Status | With Coverage | Without Coverage |
| Native Born | 2,284 (99.1%) | 20 (0.9%) |
| Foreign Born, Citizen | 5,375 (96.0%) | 224 (4.0%) |
| Foreign Born, not a Citizen | 2,363 (87.5%) | 338 (12.5%) |
Health Insurance Coverage by Household Income in Louisa County
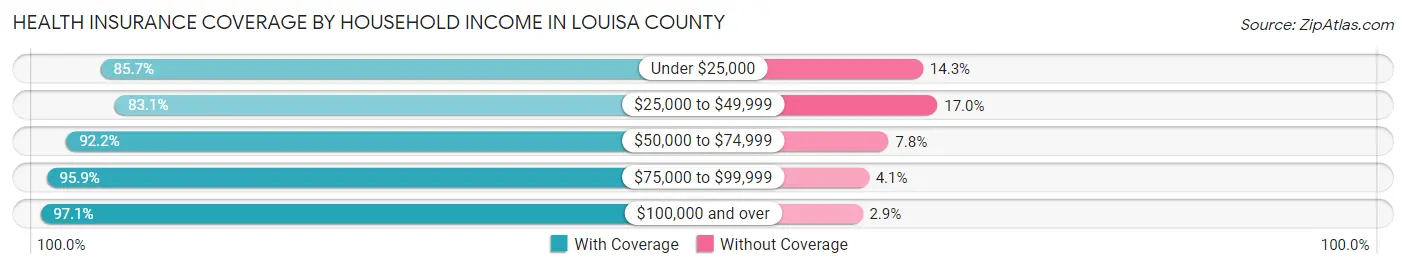
| Household Income | With Coverage | Without Coverage |
| Under $25,000 | 2,621 (85.7%) | 436 (14.3%) |
| $25,000 to $49,999 | 5,085 (83.1%) | 1,038 (17.0%) |
| $50,000 to $74,999 | 5,844 (92.2%) | 495 (7.8%) |
| $75,000 to $99,999 | 5,035 (95.9%) | 215 (4.1%) |
| $100,000 and over | 16,690 (97.1%) | 504 (2.9%) |
Public vs Private Health Insurance Coverage by Age in Louisa County
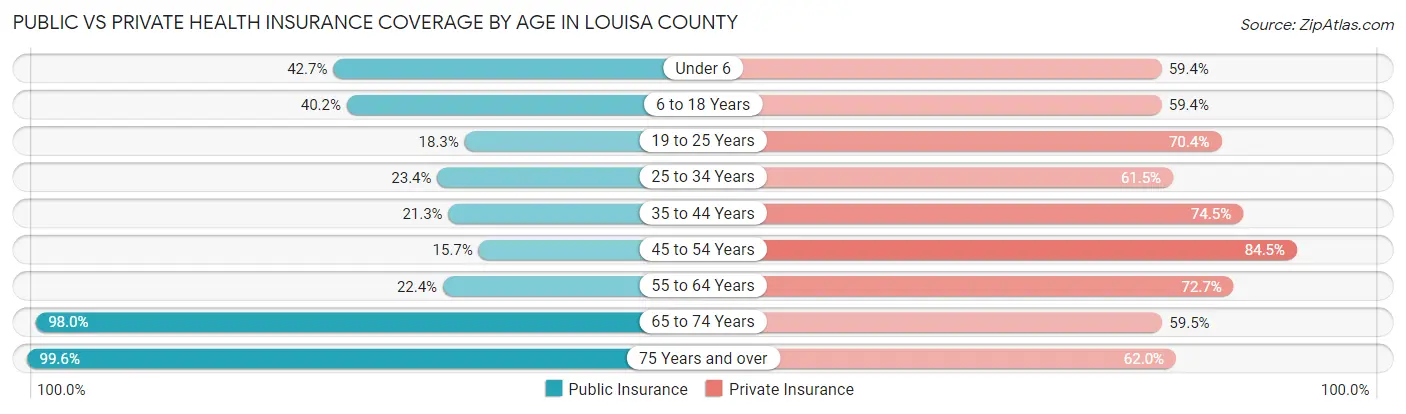
| Age Bracket | Public Insurance | Private Insurance |
| Under 6 | 984 (42.7%) | 1,368 (59.4%) |
| 6 to 18 Years | 2,251 (40.2%) | 3,325 (59.4%) |
| 19 to 25 Years | 495 (18.3%) | 1,902 (70.4%) |
| 25 to 34 Years | 912 (23.4%) | 2,397 (61.5%) |
| 35 to 44 Years | 971 (21.3%) | 3,390 (74.5%) |
| 45 to 54 Years | 762 (15.7%) | 4,092 (84.5%) |
| 55 to 64 Years | 1,443 (22.4%) | 4,695 (72.7%) |
| 65 to 74 Years | 4,777 (98.0%) | 2,900 (59.5%) |
| 75 Years and over | 2,743 (99.6%) | 1,707 (62.0%) |
| Total | 15,338 (40.4%) | 25,776 (67.9%) |
Disability Status by Sex by Age in Louisa County
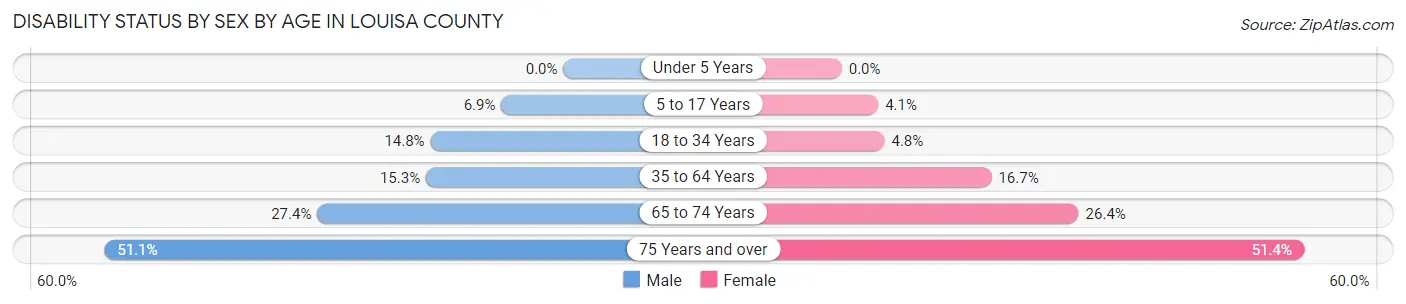
| Age Bracket | Male | Female |
| Under 5 Years | 0 (0.0%) | 0 (0.0%) |
| 5 to 17 Years | 198 (6.9%) | 111 (4.1%) |
| 18 to 34 Years | 535 (14.8%) | 156 (4.8%) |
| 35 to 64 Years | 1,190 (15.3%) | 1,346 (16.7%) |
| 65 to 74 Years | 655 (27.4%) | 655 (26.4%) |
| 75 Years and over | 661 (51.1%) | 751 (51.4%) |
Disability Class by Sex by Age in Louisa County
Disability Class: Hearing Difficulty
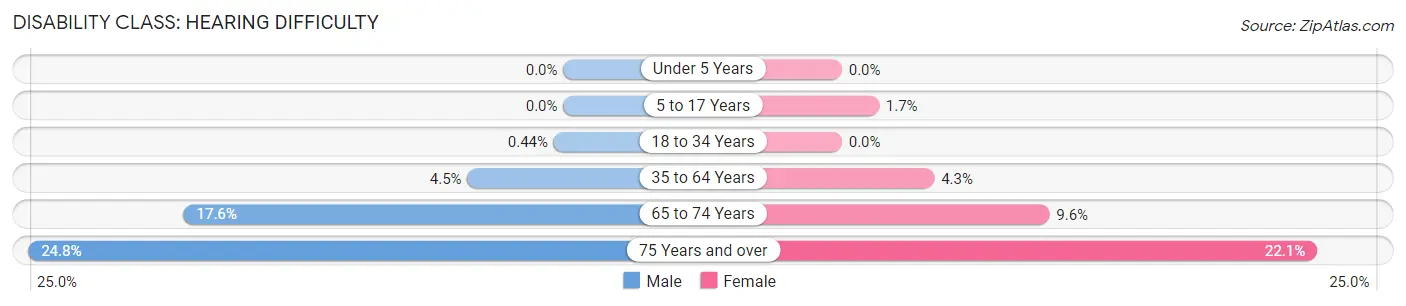
| Age Bracket | Male | Female |
| Under 5 Years | 0 (0.0%) | 0 (0.0%) |
| 5 to 17 Years | 0 (0.0%) | 47 (1.7%) |
| 18 to 34 Years | 16 (0.4%) | 0 (0.0%) |
| 35 to 64 Years | 346 (4.4%) | 346 (4.3%) |
| 65 to 74 Years | 421 (17.6%) | 239 (9.6%) |
| 75 Years and over | 321 (24.8%) | 322 (22.1%) |
Disability Class: Vision Difficulty
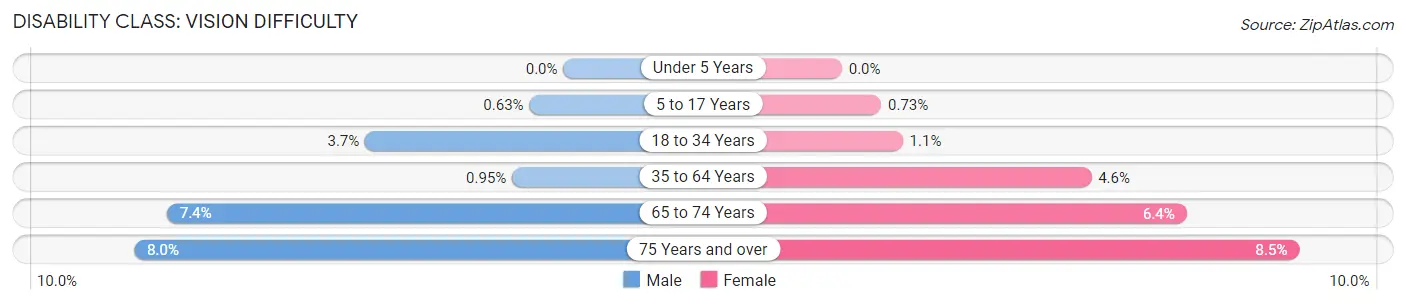
| Age Bracket | Male | Female |
| Under 5 Years | 0 (0.0%) | 0 (0.0%) |
| 5 to 17 Years | 18 (0.6%) | 20 (0.7%) |
| 18 to 34 Years | 133 (3.7%) | 37 (1.1%) |
| 35 to 64 Years | 74 (0.9%) | 374 (4.6%) |
| 65 to 74 Years | 176 (7.4%) | 159 (6.4%) |
| 75 Years and over | 103 (8.0%) | 124 (8.5%) |
Disability Class: Cognitive Difficulty
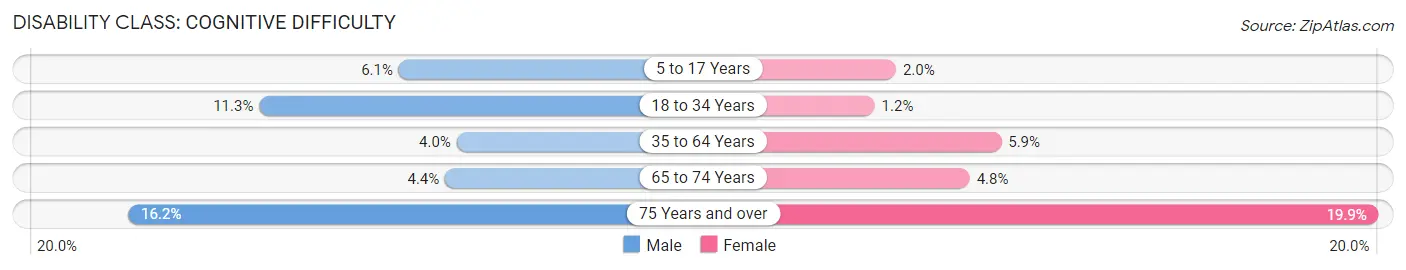
| Age Bracket | Male | Female |
| 5 to 17 Years | 175 (6.1%) | 55 (2.0%) |
| 18 to 34 Years | 408 (11.3%) | 40 (1.2%) |
| 35 to 64 Years | 308 (4.0%) | 478 (5.9%) |
| 65 to 74 Years | 105 (4.4%) | 118 (4.8%) |
| 75 Years and over | 209 (16.2%) | 291 (19.9%) |
Disability Class: Ambulatory Difficulty
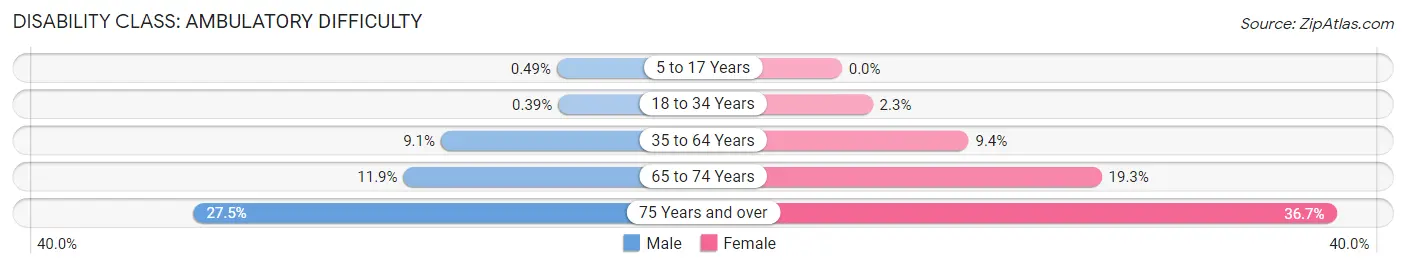
| Age Bracket | Male | Female |
| 5 to 17 Years | 14 (0.5%) | 0 (0.0%) |
| 18 to 34 Years | 14 (0.4%) | 75 (2.3%) |
| 35 to 64 Years | 708 (9.1%) | 760 (9.4%) |
| 65 to 74 Years | 284 (11.9%) | 479 (19.3%) |
| 75 Years and over | 355 (27.5%) | 536 (36.7%) |
Disability Class: Self-Care Difficulty
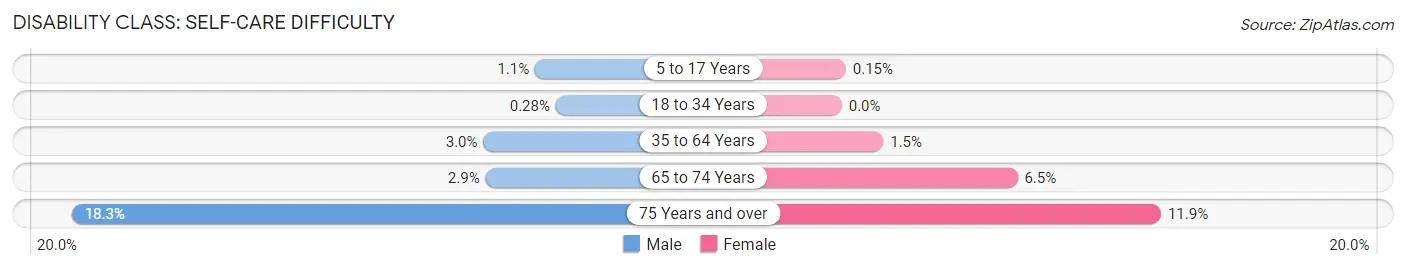
| Age Bracket | Male | Female |
| 5 to 17 Years | 30 (1.1%) | 4 (0.2%) |
| 18 to 34 Years | 10 (0.3%) | 0 (0.0%) |
| 35 to 64 Years | 231 (3.0%) | 124 (1.5%) |
| 65 to 74 Years | 69 (2.9%) | 162 (6.5%) |
| 75 Years and over | 236 (18.2%) | 173 (11.8%) |
Technology Access in Louisa County
Computing Device Access in Louisa County
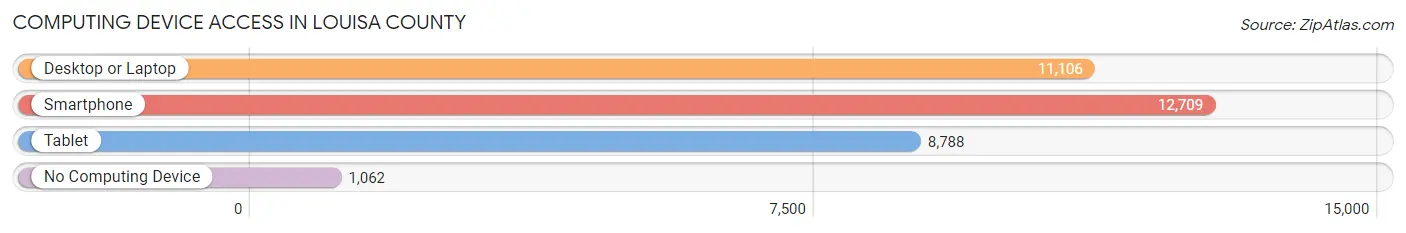
| Device Type | # Households | % Households |
| Desktop or Laptop | 11,106 | 75.8% |
| Smartphone | 12,709 | 86.8% |
| Tablet | 8,788 | 60.0% |
| No Computing Device | 1,062 | 7.2% |
| Total | 14,642 | 100.0% |
Internet Access in Louisa County
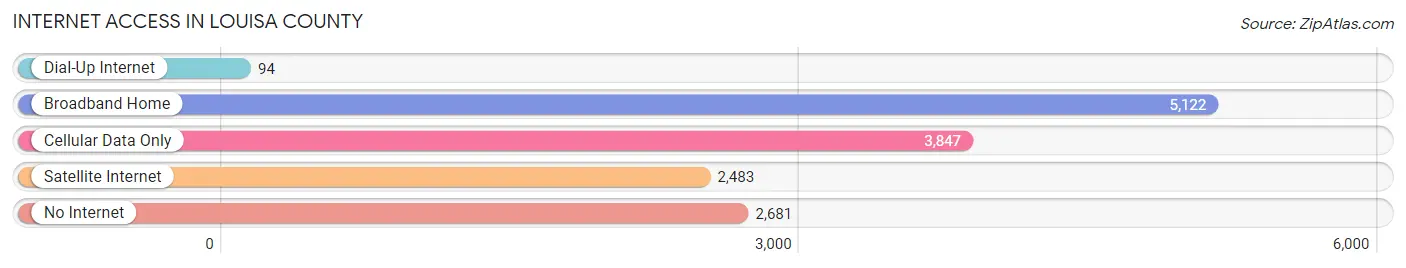
| Internet Type | # Households | % Households |
| Dial-Up Internet | 94 | 0.6% |
| Broadband Home | 5,122 | 35.0% |
| Cellular Data Only | 3,847 | 26.3% |
| Satellite Internet | 2,483 | 17.0% |
| No Internet | 2,681 | 18.3% |
| Total | 14,642 | 100.0% |
Louisa County Summary
Louisa County, Virginia is located in the central part of the state, about 40 miles northwest of Richmond. It is bordered by Orange County to the north, Fluvanna County to the east, Goochland County to the south, and Spotsylvania County to the west. The county seat is Louisa, and the county is part of the Greater Richmond Region.
History
Louisa County was formed in 1742 from Hanover County. It was named for Princess Louise of Great Britain, the daughter of King George II. The county was home to several prominent families, including the Randolphs, the Lees, and the Carters.
During the American Revolution, Louisa County was the site of several battles, including the Battle of Trevilian Station in 1864. The county was also the site of the Battle of the Wilderness in 1864, which was the first major battle of the Civil War.
Geography
Louisa County is located in the Piedmont region of Virginia. The terrain is mostly rolling hills, with some flat areas in the northern part of the county. The county is drained by the North Anna River and the South Anna River. The county is also home to several lakes, including Lake Anna, Lake Louisa, and Lake Orange.
The county has a total area of 441 square miles, of which 437 square miles is land and 4 square miles is water. The county is home to several state parks, including Lake Anna State Park, Lake Louisa State Park, and Wilderness State Park.
Economy
The economy of Louisa County is largely based on agriculture and manufacturing. The county is home to several large farms, including the Carter Family Farm, which is one of the largest farms in the state. The county is also home to several manufacturing companies, including Louisa Manufacturing, which produces furniture, and Louisa Textiles, which produces textiles.
The county is also home to several wineries, including the Carter Family Winery, which produces award-winning wines. The county is also home to several tourist attractions, including the Louisa County Historical Society Museum and the Louisa County Fairgrounds.
Demographics
As of the 2010 census, Louisa County had a population of 33,153. The racial makeup of the county was 79.2% White, 17.3% African American, 0.4% Native American, 0.7% Asian, 0.1% Pacific Islander, 1.2% from other races, and 1.1% from two or more races. Hispanic or Latino of any race were 3.2% of the population.
The median income for a household in the county was $50,945, and the median income for a family was $60,945. The per capita income for the county was $25,945. About 10.2% of families and 13.2% of the population were below the poverty line, including 17.2% of those under age 18 and 8.2% of those age 65 or over.
Louisa County is served by the Louisa County Public Schools system, which consists of seven elementary schools, two middle schools, and one high school. The county is also home to several private schools, including the Louisa Academy and the Louisa Christian School.
Common Questions
What is Per Capita Income in Louisa County?
Per Capita income in Louisa County is $40,803.
What is the Median Family Income in Louisa County?
Median Family Income in Louisa County is $93,231.
What is the Median Household income in Louisa County?
Median Household Income in Louisa County is $76,594.
What is Income or Wage Gap in Louisa County?
Income or Wage Gap in Louisa County is 23.7%.
Women in Louisa County earn 76.3 cents for every dollar earned by a man.
What is Inequality or Gini Index in Louisa County?
Inequality or Gini Index in Louisa County is 0.45.
What is the Total Population of Louisa County?
Total Population of Louisa County is 38,106.
What is the Total Male Population of Louisa County?
Total Male Population of Louisa County is 19,078.
What is the Total Female Population of Louisa County?
Total Female Population of Louisa County is 19,028.
What is the Ratio of Males per 100 Females in Louisa County?
There are 100.26 Males per 100 Females in Louisa County.
What is the Ratio of Females per 100 Males in Louisa County?
There are 99.74 Females per 100 Males in Louisa County.
What is the Median Population Age in Louisa County?
Median Population Age in Louisa County is 45.0 Years.
What is the Average Family Size in Louisa County
Average Family Size in Louisa County is 3.0 People.
What is the Average Household Size in Louisa County
Average Household Size in Louisa County is 2.6 People.
How Large is the Labor Force in Louisa County?
There are 19,188 People in the Labor Forcein in Louisa County.
What is the Percentage of People in the Labor Force in Louisa County?
61.3% of People are in the Labor Force in Louisa County.
What is the Unemployment Rate in Louisa County?
Unemployment Rate in Louisa County is 6.4%.