Lee County, VA Map & Demographics
Lee County Map
Lee County Overview
$23,257
PER CAPITA INCOME
$56,954
AVG FAMILY INCOME
$41,619
AVG HOUSEHOLD INCOME
12.4%
WAGE / INCOME GAP [ % ]
87.6¢/ $1
WAGE / INCOME GAP [ $ ]
$10,466
FAMILY INCOME DEFICIT
0.49
INEQUALITY / GINI INDEX
22,287
TOTAL POPULATION
11,812
MALE POPULATION
10,475
FEMALE POPULATION
112.76
MALES / 100 FEMALES
88.68
FEMALES / 100 MALES
45.2
MEDIAN AGE
3.1
AVG FAMILY SIZE
2.5
AVG HOUSEHOLD SIZE
7,825
LABOR FORCE [ PEOPLE ]
41.9%
PERCENT IN LABOR FORCE
8.1%
UNEMPLOYMENT RATE
Lee County Area Codes
Income in Lee County
Income Overview in Lee County
Per Capita Income in Lee County is $23,257, while median incomes of families and households are $56,954 and $41,619 respectively.
| Characteristic | Number | Measure |
| Per Capita Income | 22,287 | $23,257 |
| Median Family Income | 5,401 | $56,954 |
| Mean Family Income | 5,401 | $68,825 |
| Median Household Income | 8,324 | $41,619 |
| Mean Household Income | 8,324 | $58,254 |
| Income Deficit | 5,401 | $10,466 |
| Wage / Income Gap (%) | 22,287 | 12.36% |
| Wage / Income Gap ($) | 22,287 | 87.64¢ per $1 |
| Gini / Inequality Index | 22,287 | 0.49 |
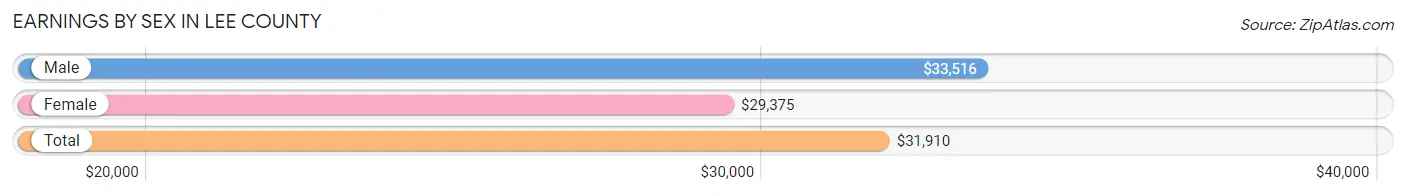
Earnings by Sex in Lee County
Average Earnings in Lee County are $31,910, $33,516 for men and $29,375 for women, a difference of 12.4%.
| Sex | Number | Average Earnings |
| Male | 4,572 (55.4%) | $33,516 |
| Female | 3,673 (44.6%) | $29,375 |
| Total | 8,245 (100.0%) | $31,910 |
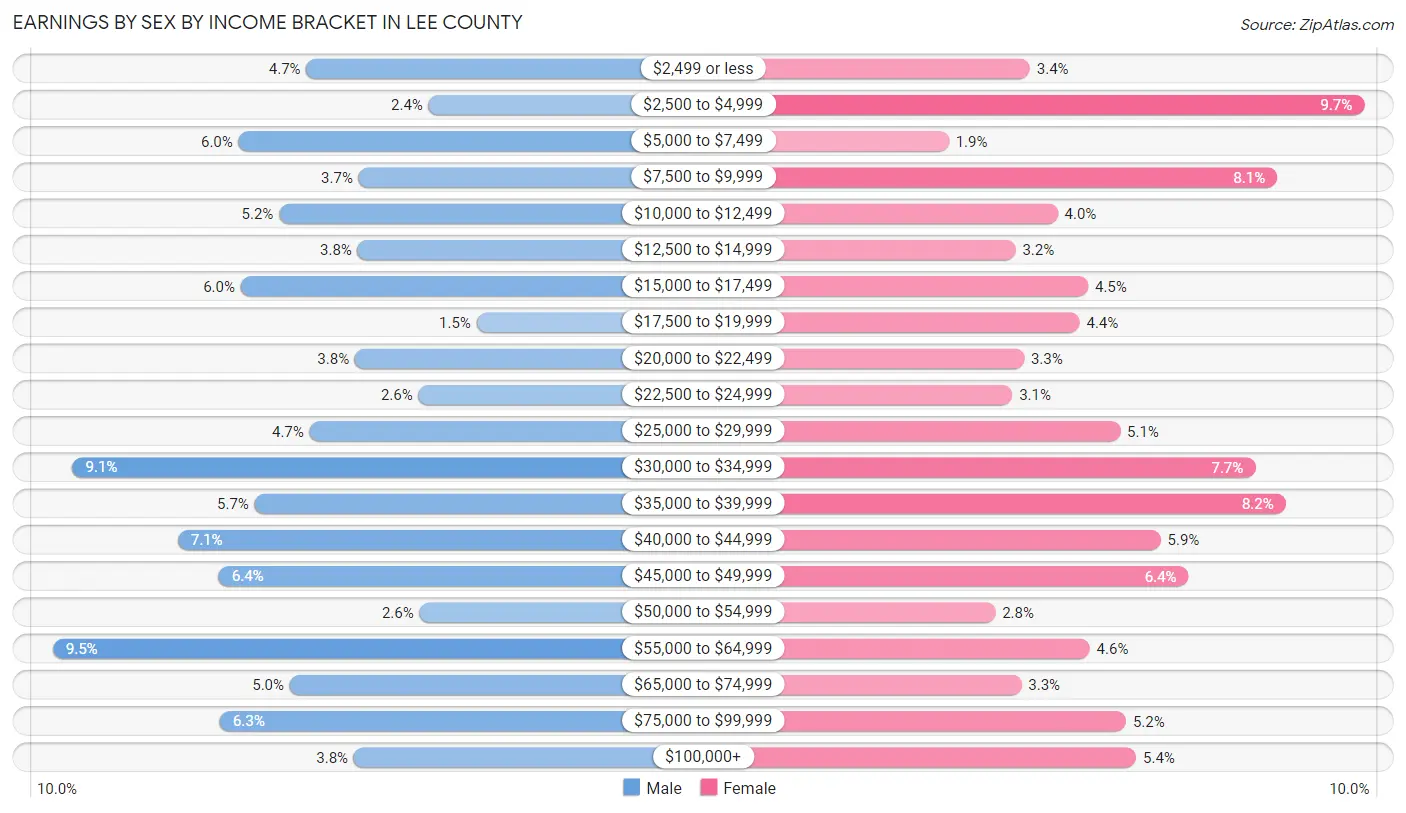
Earnings by Sex by Income Bracket in Lee County
The most common earnings brackets in Lee County are $55,000 to $64,999 for men (433 | 9.5%) and $2,500 to $4,999 for women (356 | 9.7%).
| Income | Male | Female |
| $2,499 or less | 216 (4.7%) | 126 (3.4%) |
| $2,500 to $4,999 | 111 (2.4%) | 356 (9.7%) |
| $5,000 to $7,499 | 274 (6.0%) | 70 (1.9%) |
| $7,500 to $9,999 | 171 (3.7%) | 296 (8.1%) |
| $10,000 to $12,499 | 239 (5.2%) | 145 (4.0%) |
| $12,500 to $14,999 | 172 (3.8%) | 116 (3.2%) |
| $15,000 to $17,499 | 272 (5.9%) | 166 (4.5%) |
| $17,500 to $19,999 | 70 (1.5%) | 160 (4.4%) |
| $20,000 to $22,499 | 174 (3.8%) | 122 (3.3%) |
| $22,500 to $24,999 | 120 (2.6%) | 114 (3.1%) |
| $25,000 to $29,999 | 213 (4.7%) | 188 (5.1%) |
| $30,000 to $34,999 | 416 (9.1%) | 281 (7.6%) |
| $35,000 to $39,999 | 260 (5.7%) | 302 (8.2%) |
| $40,000 to $44,999 | 326 (7.1%) | 216 (5.9%) |
| $45,000 to $49,999 | 291 (6.4%) | 235 (6.4%) |
| $50,000 to $54,999 | 119 (2.6%) | 102 (2.8%) |
| $55,000 to $64,999 | 433 (9.5%) | 167 (4.5%) |
| $65,000 to $74,999 | 230 (5.0%) | 120 (3.3%) |
| $75,000 to $99,999 | 290 (6.3%) | 192 (5.2%) |
| $100,000+ | 175 (3.8%) | 199 (5.4%) |
| Total | 4,572 (100.0%) | 3,673 (100.0%) |
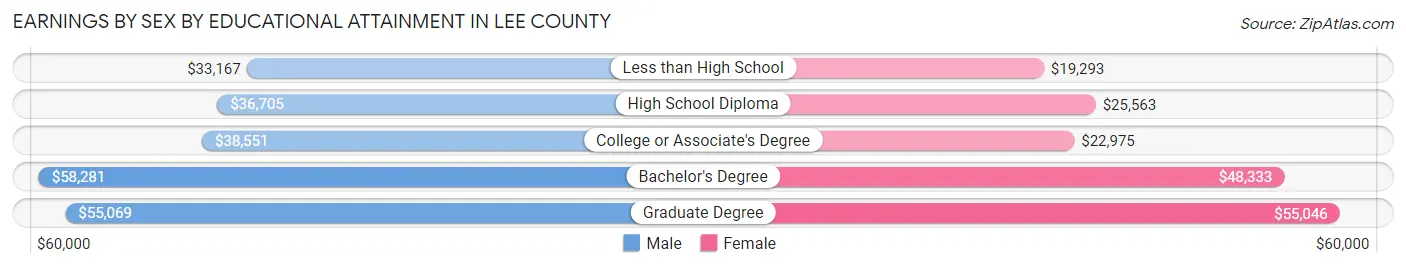
Earnings by Sex by Educational Attainment in Lee County
Average earnings in Lee County are $38,125 for men and $33,037 for women, a difference of 13.4%. Men with an educational attainment of bachelor's degree enjoy the highest average annual earnings of $58,281, while those with less than high school education earn the least with $33,167. Women with an educational attainment of graduate degree earn the most with the average annual earnings of $55,046, while those with less than high school education have the smallest earnings of $19,293.
| Educational Attainment | Male Income | Female Income |
| Less than High School | $33,167 | $19,293 |
| High School Diploma | $36,705 | $25,563 |
| College or Associate's Degree | $38,551 | $22,975 |
| Bachelor's Degree | $58,281 | $48,333 |
| Graduate Degree | $55,069 | $55,046 |
| Total | $38,125 | $33,037 |
Family Income in Lee County
Family Income Brackets in Lee County
According to the Lee County family income data, there are 1,177 families falling into the $50,000 to $74,999 income range, which is the most common income bracket and makes up 21.8% of all families. Conversely, the $200,000+ income bracket is the least frequent group with only 151 families (2.8%) belonging to this category.
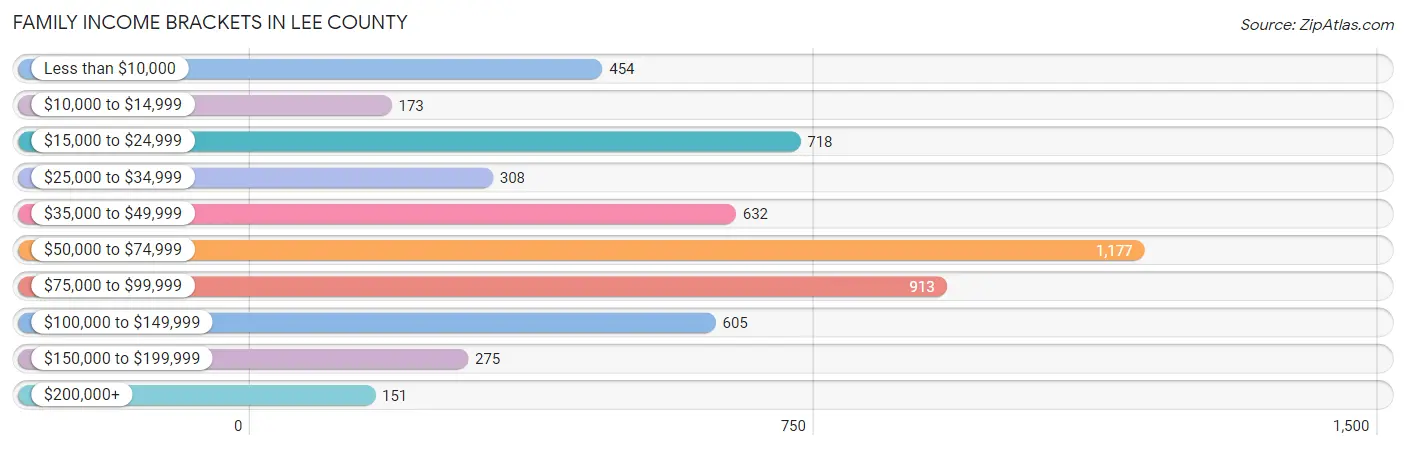
| Income Bracket | # Families | % Families |
| Less than $10,000 | 454 | 8.4% |
| $10,000 to $14,999 | 173 | 3.2% |
| $15,000 to $24,999 | 718 | 13.3% |
| $25,000 to $34,999 | 308 | 5.7% |
| $35,000 to $49,999 | 632 | 11.7% |
| $50,000 to $74,999 | 1,177 | 21.8% |
| $75,000 to $99,999 | 913 | 16.9% |
| $100,000 to $149,999 | 605 | 11.2% |
| $150,000 to $199,999 | 275 | 5.1% |
| $200,000+ | 151 | 2.8% |
Family Income by Famaliy Size in Lee County
4-person families (798 | 14.8%) account for the highest median family income in Lee County with $83,678 per family, while 2-person families (2,887 | 53.4%) have the highest median income of $25,169 per family member.
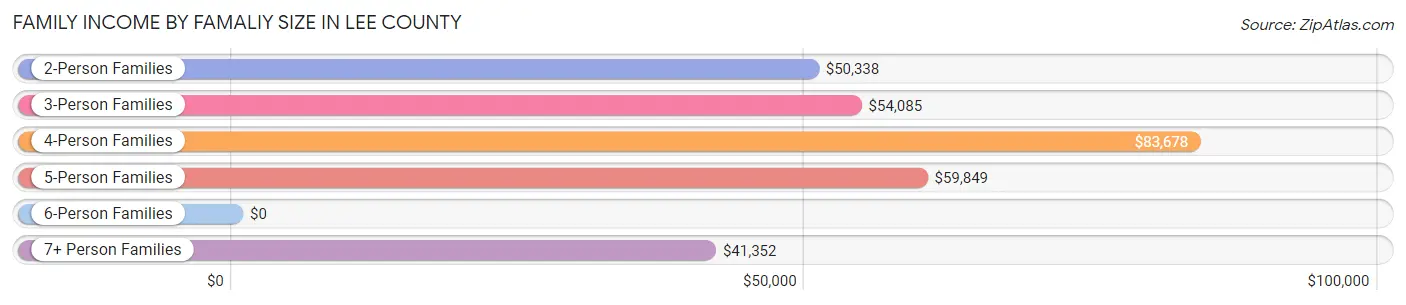
| Income Bracket | # Families | Median Income |
| 2-Person Families | 2,887 (53.4%) | $50,338 |
| 3-Person Families | 1,206 (22.3%) | $54,085 |
| 4-Person Families | 798 (14.8%) | $83,678 |
| 5-Person Families | 331 (6.1%) | $59,849 |
| 6-Person Families | 35 (0.6%) | $0 |
| 7+ Person Families | 144 (2.7%) | $41,352 |
| Total | 5,401 (100.0%) | $56,954 |
Family Income by Number of Earners in Lee County
The median family income in Lee County is $56,954, with families comprising 3+ earners (375) having the highest median family income of $118,949, while families with no earners (1,585) have the lowest median family income of $33,207, accounting for 6.9% and 29.3% of families, respectively.
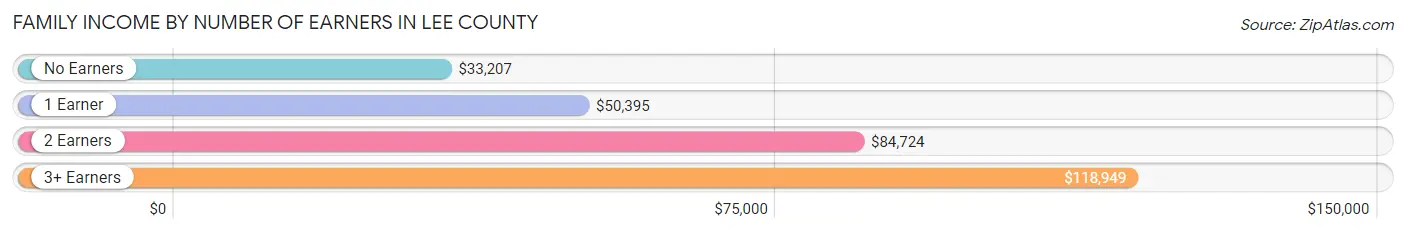
| Number of Earners | # Families | Median Income |
| No Earners | 1,585 (29.3%) | $33,207 |
| 1 Earner | 2,070 (38.3%) | $50,395 |
| 2 Earners | 1,371 (25.4%) | $84,724 |
| 3+ Earners | 375 (6.9%) | $118,949 |
| Total | 5,401 (100.0%) | $56,954 |
Household Income in Lee County
Household Income Brackets in Lee County
With 1,448 households falling in the category, the $50,000 to $74,999 income range is the most frequent in Lee County, accounting for 17.4% of all households. In contrast, only 183 households (2.2%) fall into the $200,000+ income bracket, making it the least populous group.
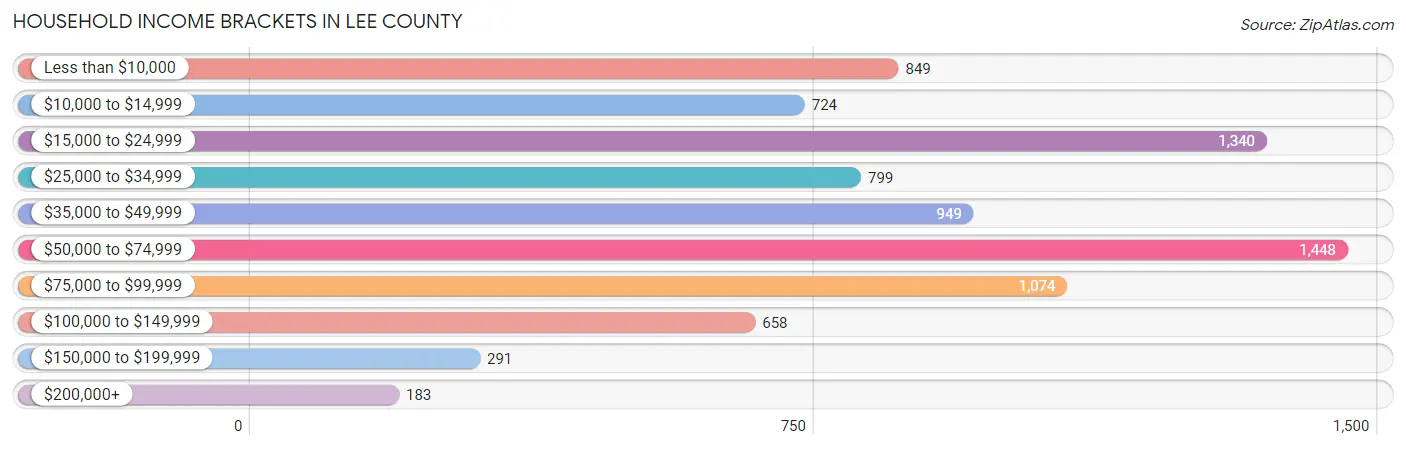
| Income Bracket | # Households | % Households |
| Less than $10,000 | 849 | 10.2% |
| $10,000 to $14,999 | 724 | 8.7% |
| $15,000 to $24,999 | 1,340 | 16.1% |
| $25,000 to $34,999 | 799 | 9.6% |
| $35,000 to $49,999 | 949 | 11.4% |
| $50,000 to $74,999 | 1,448 | 17.4% |
| $75,000 to $99,999 | 1,074 | 12.9% |
| $100,000 to $149,999 | 658 | 7.9% |
| $150,000 to $199,999 | 291 | 3.5% |
| $200,000+ | 183 | 2.2% |
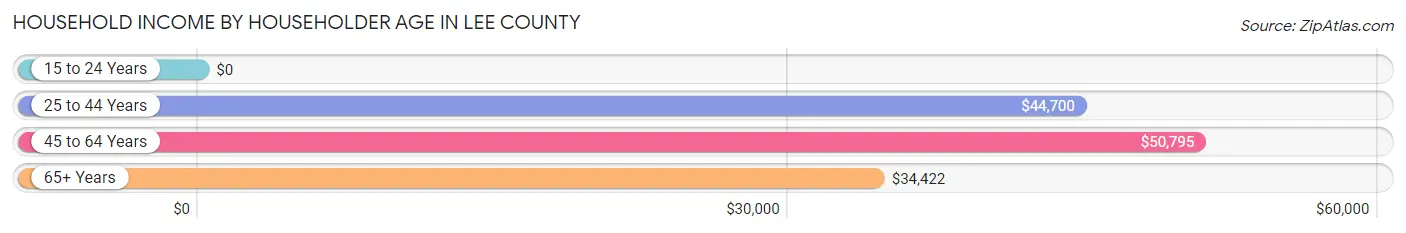
Household Income by Householder Age in Lee County
The median household income in Lee County is $41,619, with the highest median household income of $50,795 found in the 45 to 64 years age bracket for the primary householder. A total of 3,481 households (41.8%) fall into this category. Meanwhile, the 15 to 24 years age bracket for the primary householder has the lowest median household income of $0, with 114 households (1.4%) in this group.
| Income Bracket | # Households | Median Income |
| 15 to 24 Years | 114 (1.4%) | $0 |
| 25 to 44 Years | 1,812 (21.8%) | $44,700 |
| 45 to 64 Years | 3,481 (41.8%) | $50,795 |
| 65+ Years | 2,917 (35.0%) | $34,422 |
| Total | 8,324 (100.0%) | $41,619 |
Poverty in Lee County
Income Below Poverty by Sex and Age in Lee County
With 23.8% poverty level for males and 28.2% for females among the residents of Lee County, 6 to 11 year old males and 5 year old females are the most vulnerable to poverty, with 482 males (68.3%) and 54 females (77.1%) in their respective age groups living below the poverty level.
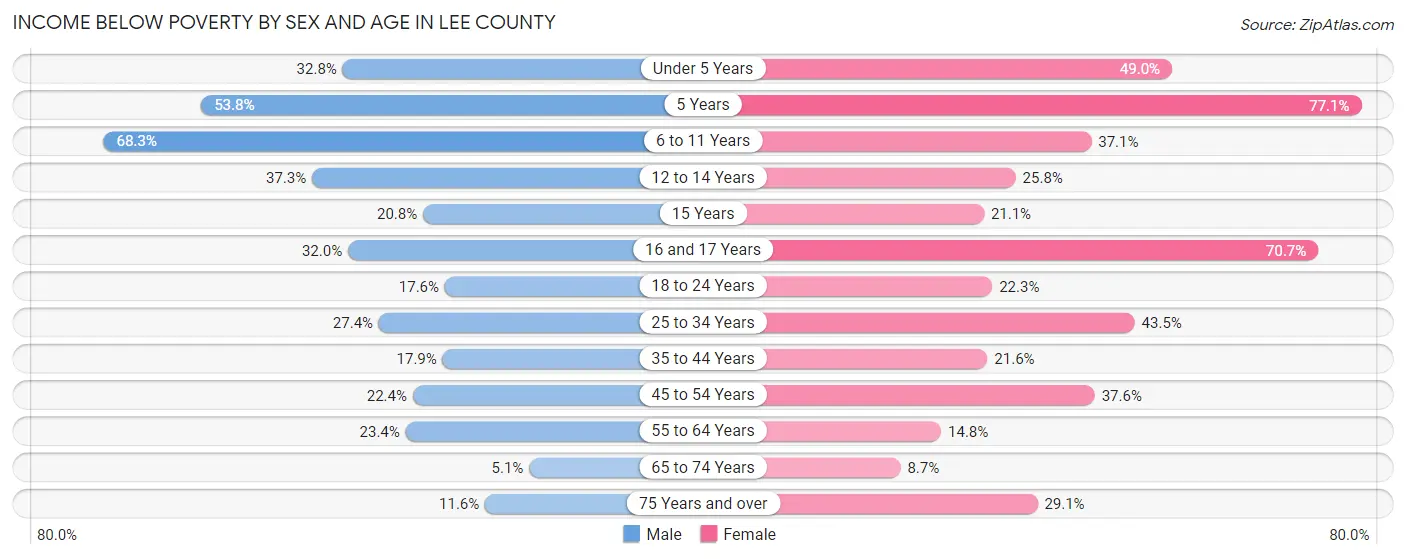
| Age Bracket | Male | Female |
| Under 5 Years | 173 (32.8%) | 225 (49.0%) |
| 5 Years | 57 (53.8%) | 54 (77.1%) |
| 6 to 11 Years | 482 (68.3%) | 249 (37.0%) |
| 12 to 14 Years | 159 (37.3%) | 71 (25.8%) |
| 15 Years | 30 (20.8%) | 19 (21.1%) |
| 16 and 17 Years | 79 (32.0%) | 215 (70.7%) |
| 18 to 24 Years | 136 (17.6%) | 153 (22.3%) |
| 25 to 34 Years | 321 (27.4%) | 458 (43.5%) |
| 35 to 44 Years | 191 (17.9%) | 240 (21.6%) |
| 45 to 54 Years | 308 (22.4%) | 536 (37.6%) |
| 55 to 64 Years | 366 (23.4%) | 238 (14.7%) |
| 65 to 74 Years | 72 (5.1%) | 126 (8.7%) |
| 75 Years and over | 101 (11.6%) | 321 (29.0%) |
| Total | 2,475 (23.8%) | 2,905 (28.2%) |
Income Above Poverty by Sex and Age in Lee County
According to the poverty statistics in Lee County, males aged 65 to 74 years and females aged 65 to 74 years are the age groups that are most secure financially, with 94.9% of males and 91.3% of females in these age groups living above the poverty line.
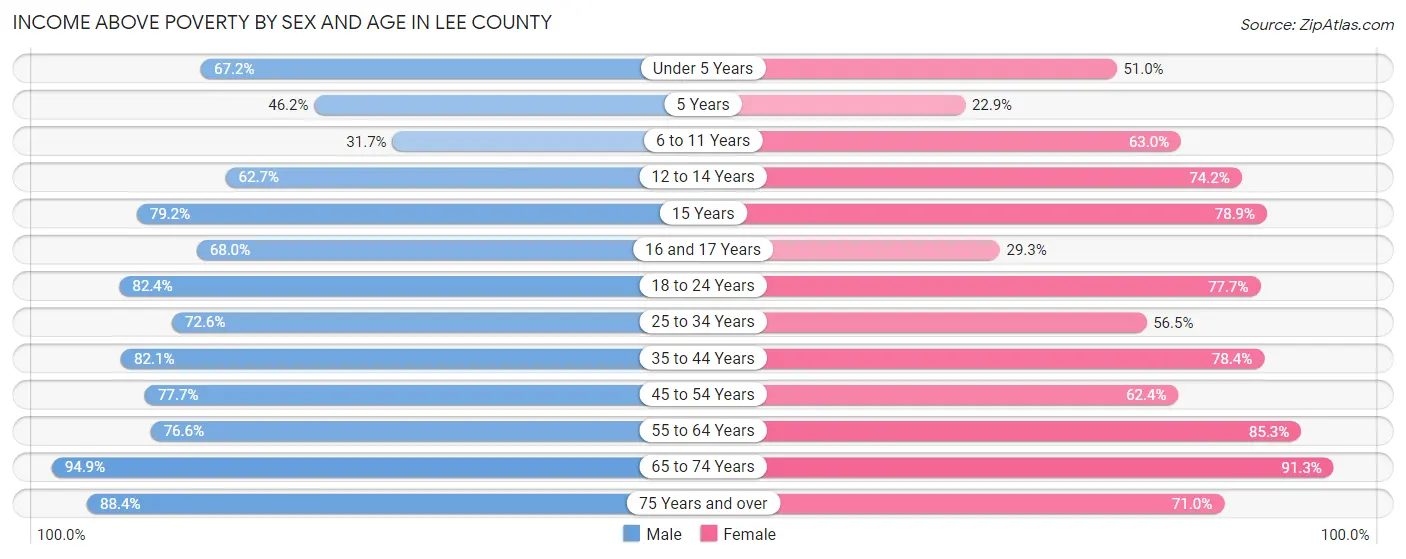
| Age Bracket | Male | Female |
| Under 5 Years | 355 (67.2%) | 234 (51.0%) |
| 5 Years | 49 (46.2%) | 16 (22.9%) |
| 6 to 11 Years | 224 (31.7%) | 423 (62.9%) |
| 12 to 14 Years | 267 (62.7%) | 204 (74.2%) |
| 15 Years | 114 (79.2%) | 71 (78.9%) |
| 16 and 17 Years | 168 (68.0%) | 89 (29.3%) |
| 18 to 24 Years | 637 (82.4%) | 532 (77.7%) |
| 25 to 34 Years | 851 (72.6%) | 595 (56.5%) |
| 35 to 44 Years | 874 (82.1%) | 870 (78.4%) |
| 45 to 54 Years | 1,070 (77.6%) | 891 (62.4%) |
| 55 to 64 Years | 1,197 (76.6%) | 1,376 (85.3%) |
| 65 to 74 Years | 1,349 (94.9%) | 1,320 (91.3%) |
| 75 Years and over | 768 (88.4%) | 784 (71.0%) |
| Total | 7,923 (76.2%) | 7,405 (71.8%) |
Income Below Poverty Among Married-Couple Families in Lee County
The poverty statistics for married-couple families in Lee County show that 11.0% or 402 of the total 3,641 families live below the poverty line. Families with 5 or more children have the highest poverty rate of 100.0%, comprising of 100 families. On the other hand, families with 1 or 2 children have the lowest poverty rate of 3.2%, which includes 21 families.
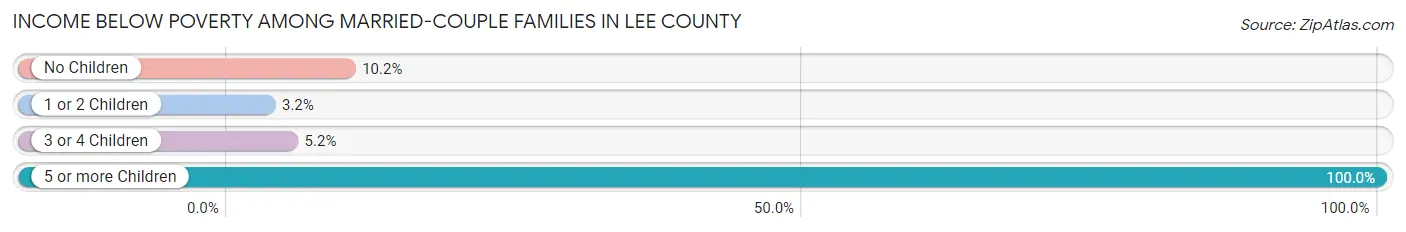
| Children | Above Poverty | Below Poverty |
| No Children | 2,351 (89.8%) | 267 (10.2%) |
| 1 or 2 Children | 632 (96.8%) | 21 (3.2%) |
| 3 or 4 Children | 256 (94.8%) | 14 (5.2%) |
| 5 or more Children | 0 (0.0%) | 100 (100.0%) |
| Total | 3,239 (89.0%) | 402 (11.0%) |
Income Below Poverty Among Single-Parent Households in Lee County
According to the poverty data in Lee County, 18.2% or 89 single-father households and 44.1% or 560 single-mother households are living below the poverty line. Among single-father households, those with 5 or more children have the highest poverty rate, with 18 households (100.0%) experiencing poverty. Likewise, among single-mother households, those with 3 or 4 children have the highest poverty rate, with 69 households (100.0%) falling below the poverty line.
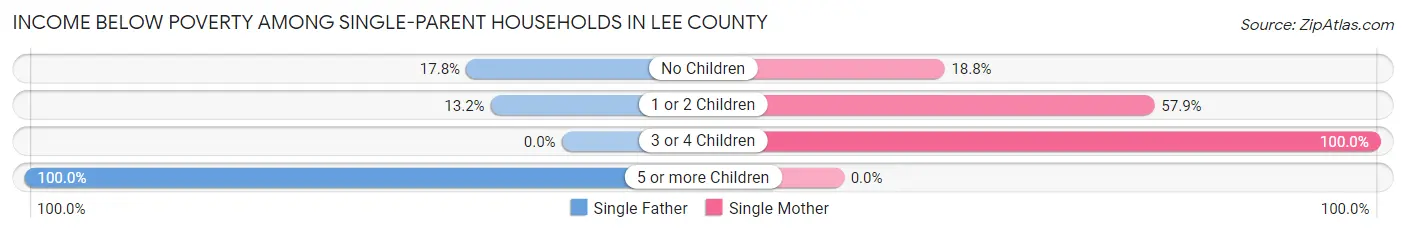
| Children | Single Father | Single Mother |
| No Children | 42 (17.8%) | 98 (18.8%) |
| 1 or 2 Children | 29 (13.2%) | 393 (57.9%) |
| 3 or 4 Children | 0 (0.0%) | 69 (100.0%) |
| 5 or more Children | 18 (100.0%) | 0 (0.0%) |
| Total | 89 (18.2%) | 560 (44.1%) |
Income Below Poverty Among Married-Couple vs Single-Parent Households in Lee County
The poverty data for Lee County shows that 402 of the married-couple family households (11.0%) and 649 of the single-parent households (36.9%) are living below the poverty level. Within the married-couple family households, those with 5 or more children have the highest poverty rate, with 100 households (100.0%) falling below the poverty line. Among the single-parent households, those with 5 or more children have the highest poverty rate, with 18 household (100.0%) living below poverty.
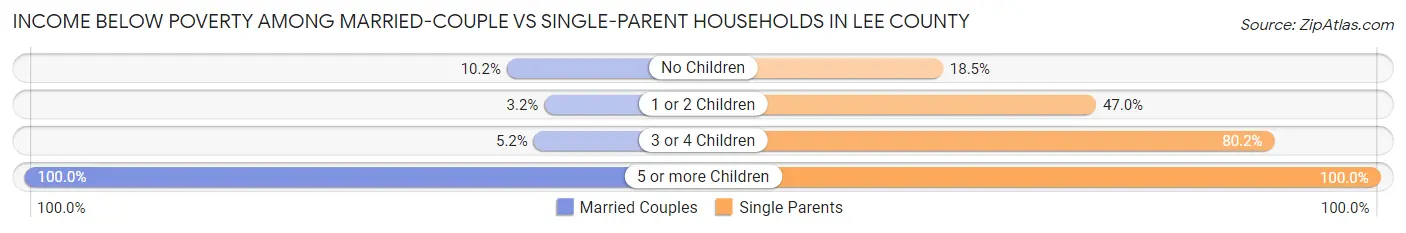
| Children | Married-Couple Families | Single-Parent Households |
| No Children | 267 (10.2%) | 140 (18.5%) |
| 1 or 2 Children | 21 (3.2%) | 422 (47.0%) |
| 3 or 4 Children | 14 (5.2%) | 69 (80.2%) |
| 5 or more Children | 100 (100.0%) | 18 (100.0%) |
| Total | 402 (11.0%) | 649 (36.9%) |
Race in Lee County
The most populous races in Lee County are White / Caucasian (20,776 | 93.2%), Black / African American (925 | 4.2%), and Two or more Races (478 | 2.1%).
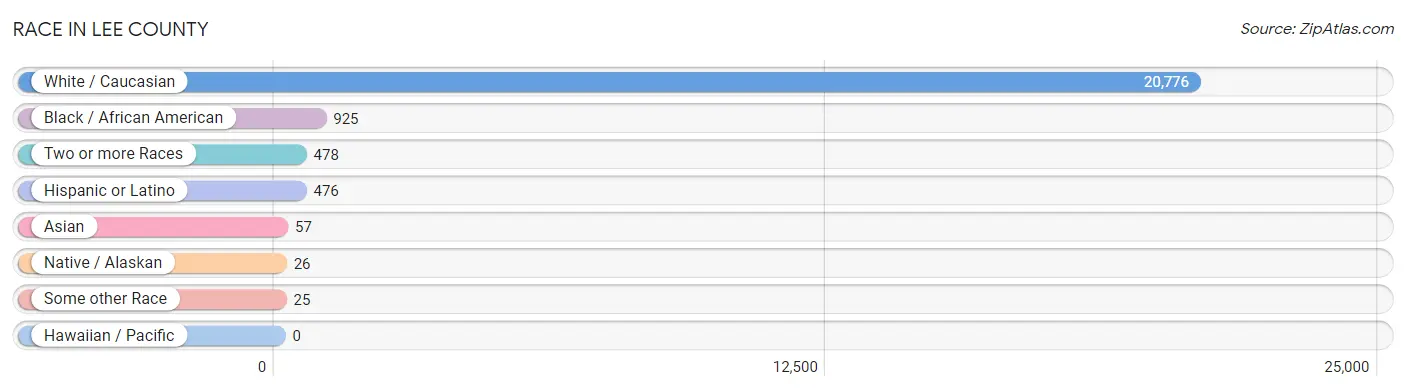
| Race | # Population | % Population |
| Asian | 57 | 0.3% |
| Black / African American | 925 | 4.2% |
| Hawaiian / Pacific | 0 | 0.0% |
| Hispanic or Latino | 476 | 2.1% |
| Native / Alaskan | 26 | 0.1% |
| White / Caucasian | 20,776 | 93.2% |
| Two or more Races | 478 | 2.1% |
| Some other Race | 25 | 0.1% |
| Total | 22,287 | 100.0% |
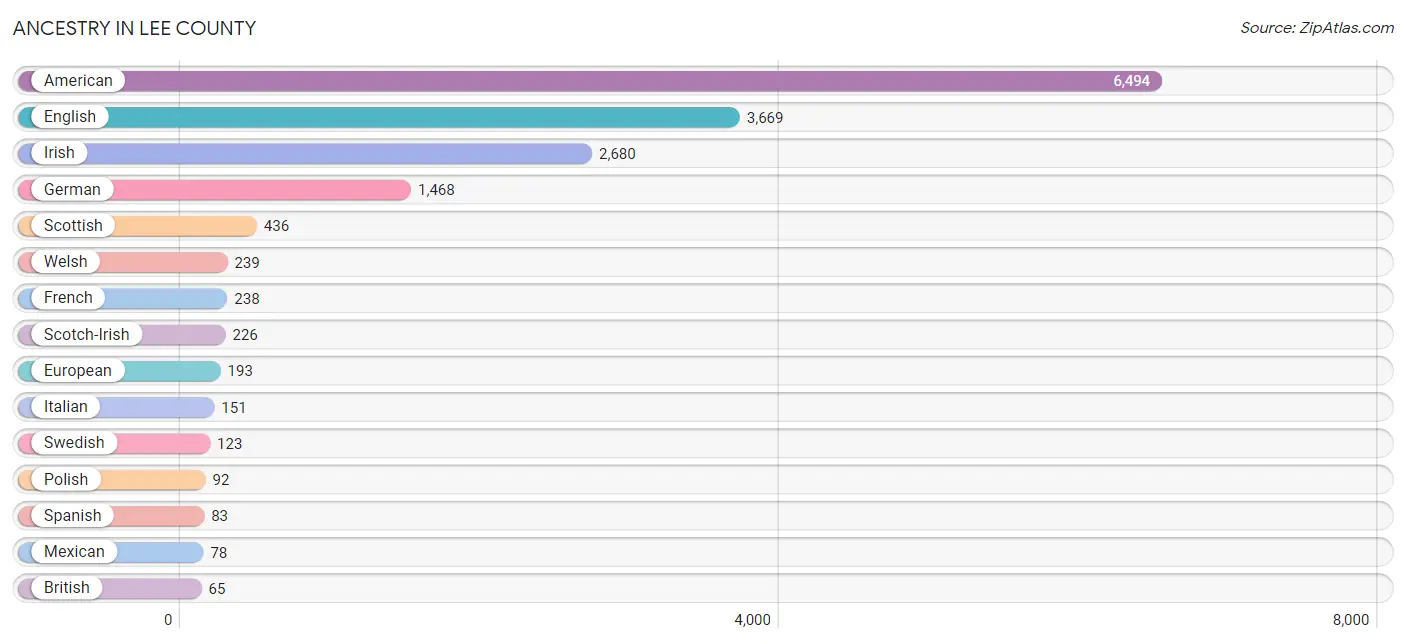
Ancestry in Lee County
The most populous ancestries reported in Lee County are American (6,494 | 29.1%), English (3,669 | 16.5%), Irish (2,680 | 12.0%), German (1,468 | 6.6%), and Scottish (436 | 2.0%), together accounting for 66.2% of all Lee County residents.
| Ancestry | # Population | % Population |
| African | 30 | 0.1% |
| Albanian | 10 | 0.0% |
| American | 6,494 | 29.1% |
| Arab | 13 | 0.1% |
| Austrian | 40 | 0.2% |
| British | 65 | 0.3% |
| Burmese | 23 | 0.1% |
| Canadian | 48 | 0.2% |
| Celtic | 10 | 0.0% |
| Central American | 15 | 0.1% |
| Cherokee | 14 | 0.1% |
| Cuban | 22 | 0.1% |
| Danish | 17 | 0.1% |
| Dominican | 10 | 0.0% |
| Dutch | 65 | 0.3% |
| Eastern European | 35 | 0.2% |
| English | 3,669 | 16.5% |
| European | 193 | 0.9% |
| Finnish | 14 | 0.1% |
| French | 238 | 1.1% |
| French Canadian | 43 | 0.2% |
| German | 1,468 | 6.6% |
| Greek | 29 | 0.1% |
| Honduran | 15 | 0.1% |
| Hungarian | 23 | 0.1% |
| Irish | 2,680 | 12.0% |
| Israeli | 25 | 0.1% |
| Italian | 151 | 0.7% |
| Korean | 13 | 0.1% |
| Lebanese | 13 | 0.1% |
| Lumbee | 8 | 0.0% |
| Mexican | 78 | 0.4% |
| Navajo | 44 | 0.2% |
| Norwegian | 12 | 0.1% |
| Polish | 92 | 0.4% |
| Puerto Rican | 48 | 0.2% |
| Romanian | 9 | 0.0% |
| Scandinavian | 8 | 0.0% |
| Scotch-Irish | 226 | 1.0% |
| Scottish | 436 | 2.0% |
| Spanish | 83 | 0.4% |
| Sri Lankan | 25 | 0.1% |
| Subsaharan African | 30 | 0.1% |
| Swedish | 123 | 0.5% |
| Swiss | 9 | 0.0% |
| Thai | 43 | 0.2% |
| Welsh | 239 | 1.1% | View All 47 Rows |
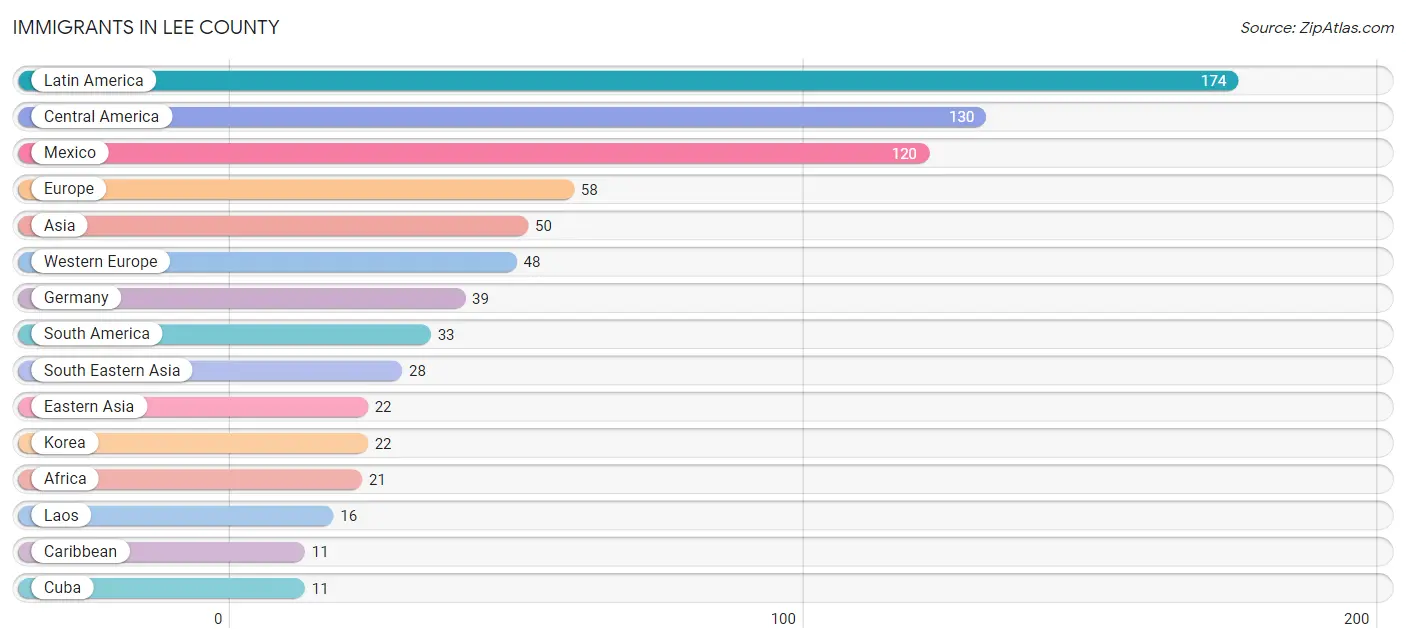
Immigrants in Lee County
The most numerous immigrant groups reported in Lee County came from Latin America (174 | 0.8%), Central America (130 | 0.6%), Mexico (120 | 0.5%), Europe (58 | 0.3%), and Asia (50 | 0.2%), together accounting for 2.4% of all Lee County residents.
| Immigration Origin | # Population | % Population |
| Africa | 21 | 0.1% |
| Asia | 50 | 0.2% |
| Caribbean | 11 | 0.1% |
| Central America | 130 | 0.6% |
| Cuba | 11 | 0.1% |
| Eastern Africa | 11 | 0.1% |
| Eastern Asia | 22 | 0.1% |
| Eastern Europe | 10 | 0.0% |
| El Salvador | 10 | 0.0% |
| Ethiopia | 11 | 0.1% |
| Europe | 58 | 0.3% |
| Germany | 39 | 0.2% |
| Korea | 22 | 0.1% |
| Laos | 16 | 0.1% |
| Latin America | 174 | 0.8% |
| Mexico | 120 | 0.5% |
| Northern Africa | 10 | 0.0% |
| Peru | 10 | 0.0% |
| Philippines | 3 | 0.0% |
| South America | 33 | 0.2% |
| South Eastern Asia | 28 | 0.1% |
| Switzerland | 9 | 0.0% |
| Venezuela | 10 | 0.0% |
| Vietnam | 9 | 0.0% |
| Western Europe | 48 | 0.2% | View All 25 Rows |
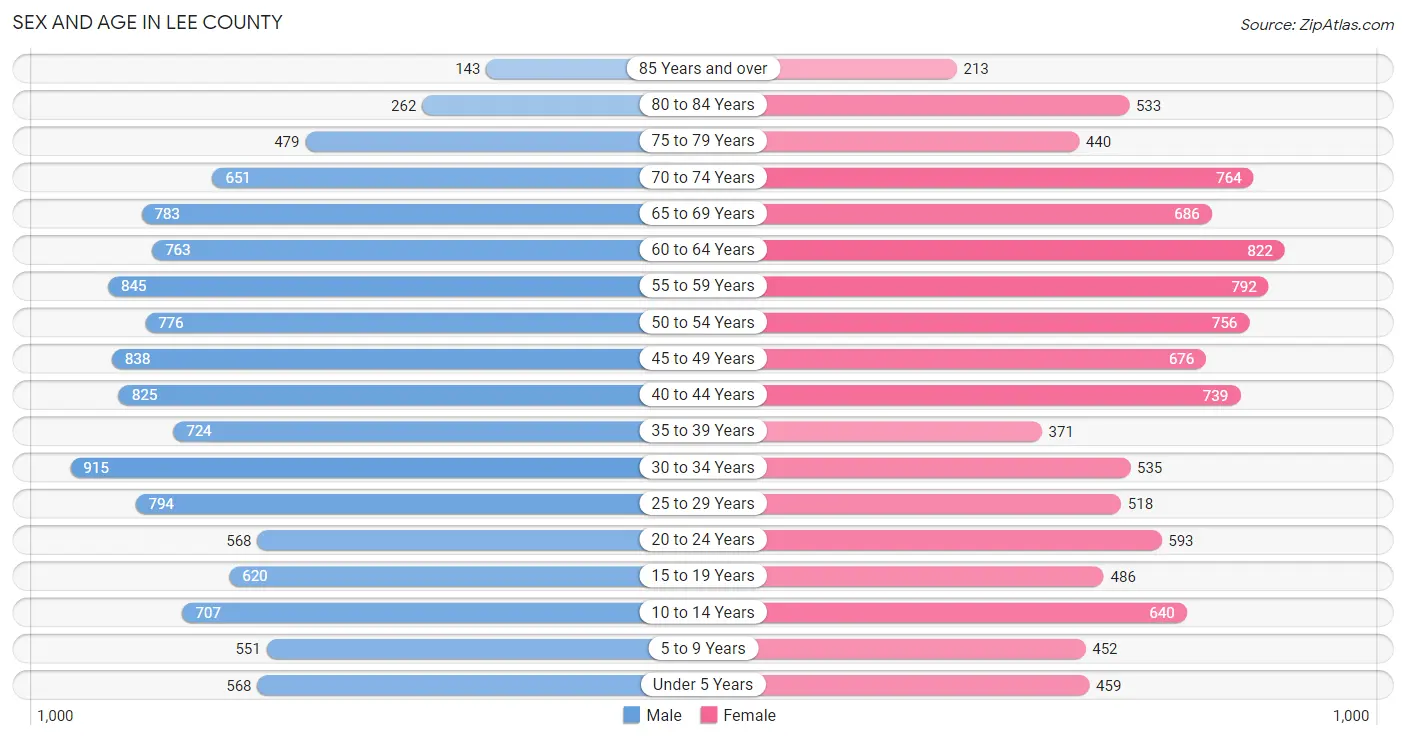
Sex and Age in Lee County
Sex and Age in Lee County
The most populous age groups in Lee County are 30 to 34 Years (915 | 7.7%) for men and 60 to 64 Years (822 | 7.9%) for women.
| Age Bracket | Male | Female |
| Under 5 Years | 568 (4.8%) | 459 (4.4%) |
| 5 to 9 Years | 551 (4.7%) | 452 (4.3%) |
| 10 to 14 Years | 707 (6.0%) | 640 (6.1%) |
| 15 to 19 Years | 620 (5.2%) | 486 (4.6%) |
| 20 to 24 Years | 568 (4.8%) | 593 (5.7%) |
| 25 to 29 Years | 794 (6.7%) | 518 (5.0%) |
| 30 to 34 Years | 915 (7.7%) | 535 (5.1%) |
| 35 to 39 Years | 724 (6.1%) | 371 (3.5%) |
| 40 to 44 Years | 825 (7.0%) | 739 (7.0%) |
| 45 to 49 Years | 838 (7.1%) | 676 (6.5%) |
| 50 to 54 Years | 776 (6.6%) | 756 (7.2%) |
| 55 to 59 Years | 845 (7.1%) | 792 (7.6%) |
| 60 to 64 Years | 763 (6.5%) | 822 (7.9%) |
| 65 to 69 Years | 783 (6.6%) | 686 (6.6%) |
| 70 to 74 Years | 651 (5.5%) | 764 (7.3%) |
| 75 to 79 Years | 479 (4.1%) | 440 (4.2%) |
| 80 to 84 Years | 262 (2.2%) | 533 (5.1%) |
| 85 Years and over | 143 (1.2%) | 213 (2.0%) |
| Total | 11,812 (100.0%) | 10,475 (100.0%) |
Families and Households in Lee County
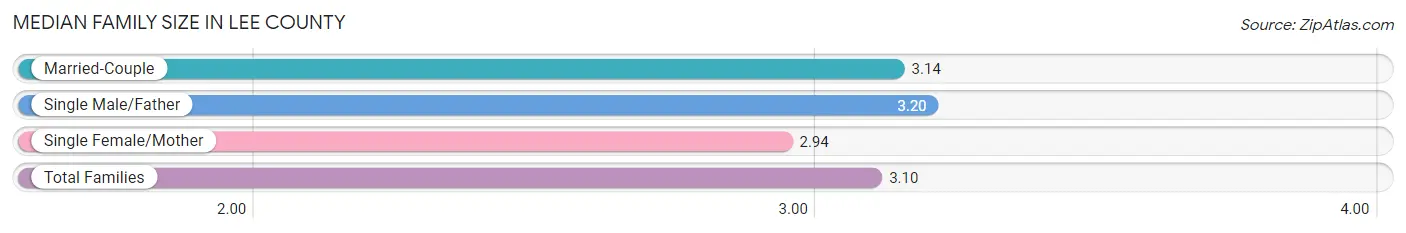
Median Family Size in Lee County
The median family size in Lee County is 3.10 persons per family, with single male/father families (490 | 9.1%) accounting for the largest median family size of 3.2 persons per family. On the other hand, single female/mother families (1,270 | 23.5%) represent the smallest median family size with 2.94 persons per family.
| Family Type | # Families | Family Size |
| Married-Couple | 3,641 (67.4%) | 3.14 |
| Single Male/Father | 490 (9.1%) | 3.20 |
| Single Female/Mother | 1,270 (23.5%) | 2.94 |
| Total Families | 5,401 (100.0%) | 3.10 |
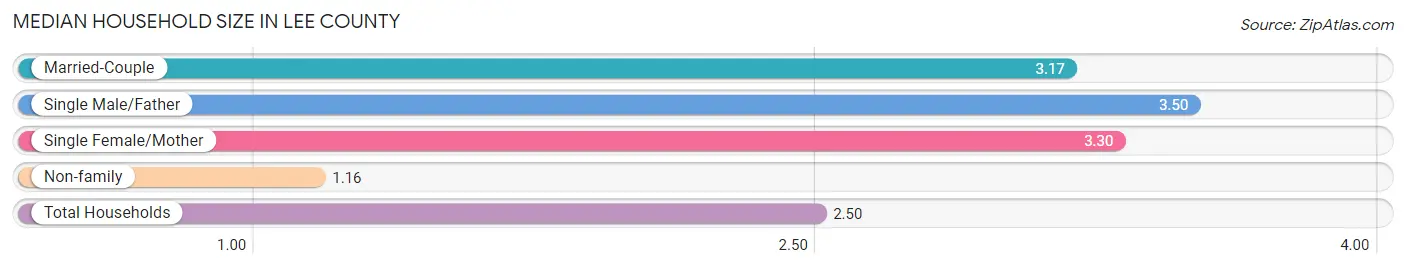
Median Household Size in Lee County
The median household size in Lee County is 2.50 persons per household, with single male/father households (490 | 5.9%) accounting for the largest median household size of 3.5 persons per household. non-family households (2,923 | 35.1%) represent the smallest median household size with 1.16 persons per household.
| Household Type | # Households | Household Size |
| Married-Couple | 3,641 (43.7%) | 3.17 |
| Single Male/Father | 490 (5.9%) | 3.50 |
| Single Female/Mother | 1,270 (15.3%) | 3.30 |
| Non-family | 2,923 (35.1%) | 1.16 |
| Total Households | 8,324 (100.0%) | 2.50 |
Household Size by Marriage Status in Lee County
Out of a total of 8,324 households in Lee County, 5,401 (64.9%) are family households, while 2,923 (35.1%) are nonfamily households. The most numerous type of family households are 2-person households, comprising 2,704, and the most common type of nonfamily households are 1-person households, comprising 2,574.
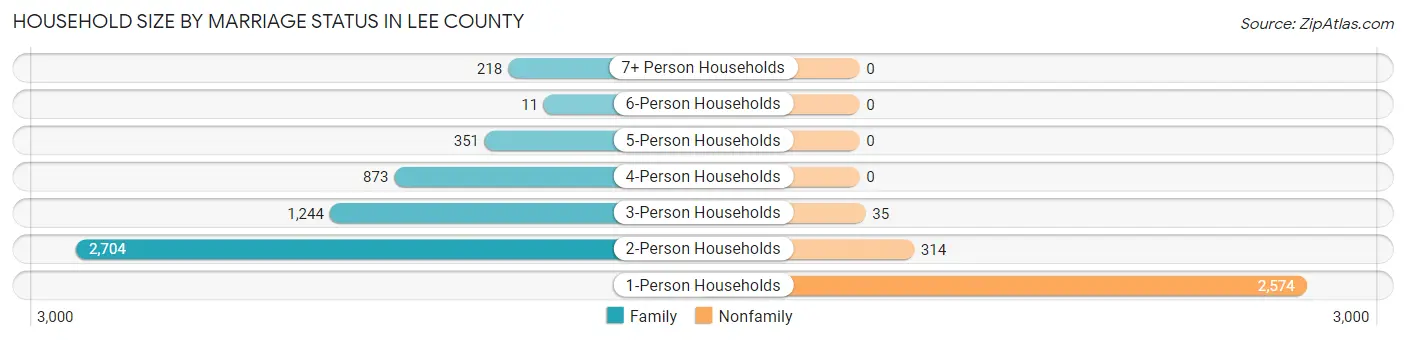
| Household Size | Family Households | Nonfamily Households |
| 1-Person Households | - | 2,574 (30.9%) |
| 2-Person Households | 2,704 (32.5%) | 314 (3.8%) |
| 3-Person Households | 1,244 (14.9%) | 35 (0.4%) |
| 4-Person Households | 873 (10.5%) | 0 (0.0%) |
| 5-Person Households | 351 (4.2%) | 0 (0.0%) |
| 6-Person Households | 11 (0.1%) | 0 (0.0%) |
| 7+ Person Households | 218 (2.6%) | 0 (0.0%) |
| Total | 5,401 (64.9%) | 2,923 (35.1%) |
Female Fertility in Lee County
Fertility by Age in Lee County
Average fertility rate in Lee County is 33.0 births per 1,000 women. Women in the age bracket of 20 to 34 years have the highest fertility rate with 67.0 births per 1,000 women. Women in the age bracket of 20 to 34 years acount for 82.8% of all women with births.
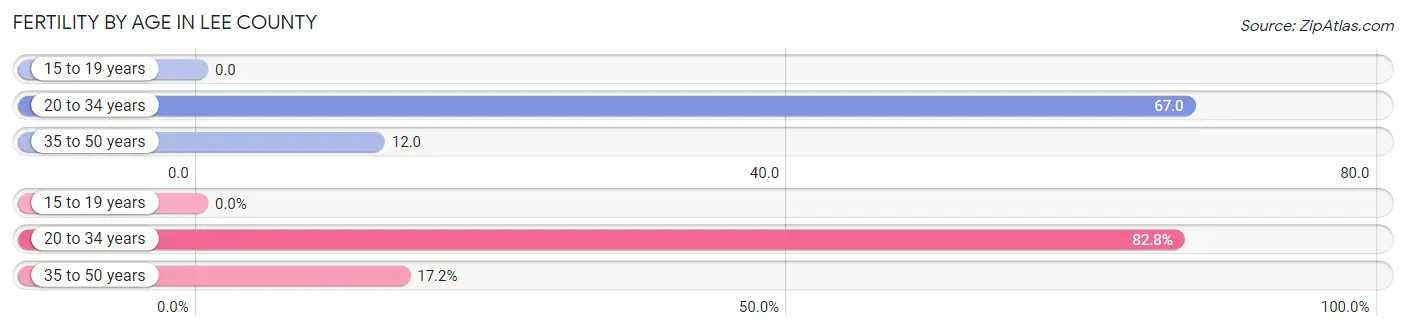
| Age Bracket | Women with Births | Births / 1,000 Women |
| 15 to 19 years | 0 (0.0%) | 0.0 |
| 20 to 34 years | 111 (82.8%) | 67.0 |
| 35 to 50 years | 23 (17.2%) | 12.0 |
| Total | 134 (100.0%) | 33.0 |
Fertility by Age by Marriage Status in Lee County
76.1% of women with births (134) in Lee County are married. The highest percentage of unmarried women with births falls into 20 to 34 years age bracket with 28.8% of them unmarried at the time of birth, while the lowest percentage of unmarried women with births belong to 35 to 50 years age bracket with 0.0% of them unmarried.
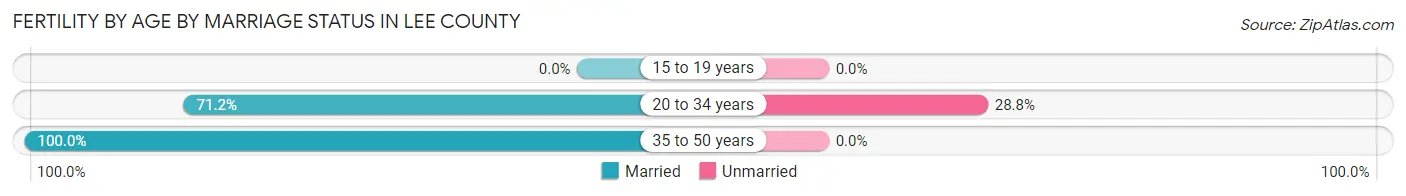
| Age Bracket | Married | Unmarried |
| 15 to 19 years | 0 (0.0%) | 0 (0.0%) |
| 20 to 34 years | 79 (71.2%) | 32 (28.8%) |
| 35 to 50 years | 23 (100.0%) | 0 (0.0%) |
| Total | 102 (76.1%) | 32 (23.9%) |
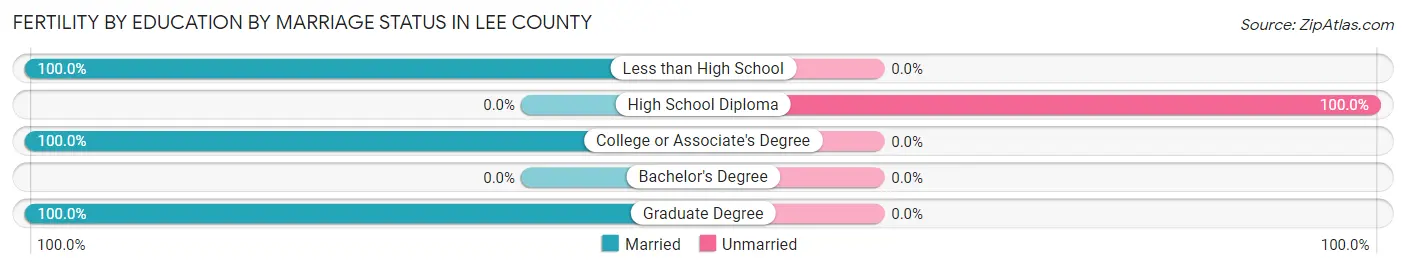
Fertility by Education in Lee County
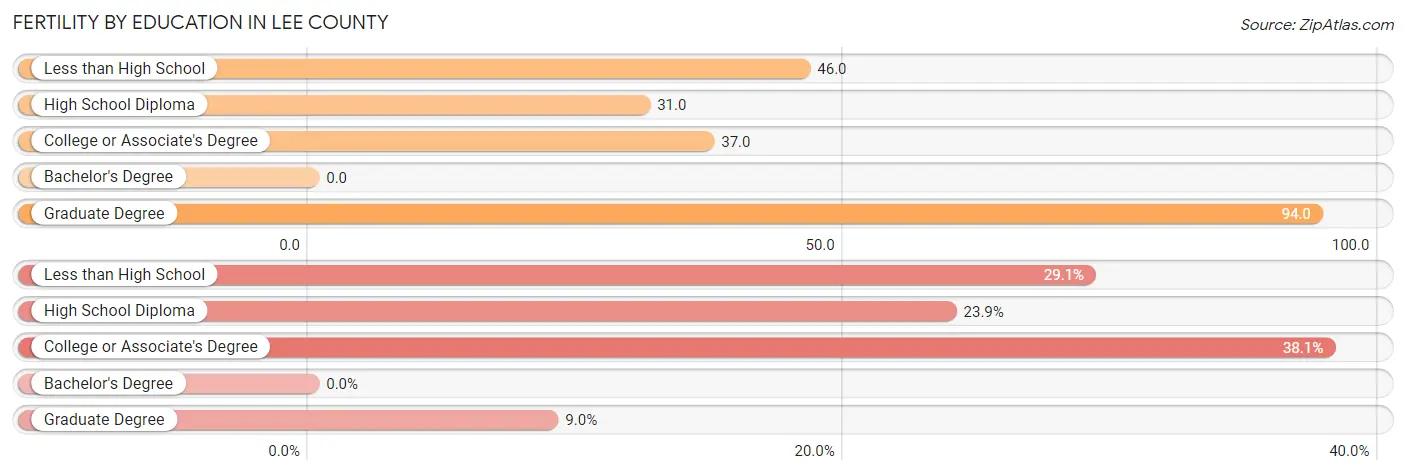
| Educational Attainment | Women with Births | Births / 1,000 Women |
| Less than High School | 39 (29.1%) | 46.0 |
| High School Diploma | 32 (23.9%) | 31.0 |
| College or Associate's Degree | 51 (38.1%) | 37.0 |
| Bachelor's Degree | 0 (0.0%) | 0.0 |
| Graduate Degree | 12 (9.0%) | 94.0 |
| Total | 134 (100.0%) | 33.0 |
Fertility by Education by Marriage Status in Lee County
23.9% of women with births in Lee County are unmarried. Women with the educational attainment of less than high school are most likely to be married with 100.0% of them married at childbirth, while women with the educational attainment of high school diploma are least likely to be married with 100.0% of them unmarried at childbirth.
| Educational Attainment | Married | Unmarried |
| Less than High School | 39 (100.0%) | 0 (0.0%) |
| High School Diploma | 0 (0.0%) | 32 (100.0%) |
| College or Associate's Degree | 51 (100.0%) | 0 (0.0%) |
| Bachelor's Degree | 0 (0.0%) | 0 (0.0%) |
| Graduate Degree | 12 (100.0%) | 0 (0.0%) |
| Total | 102 (76.1%) | 32 (23.9%) |
Employment Characteristics in Lee County
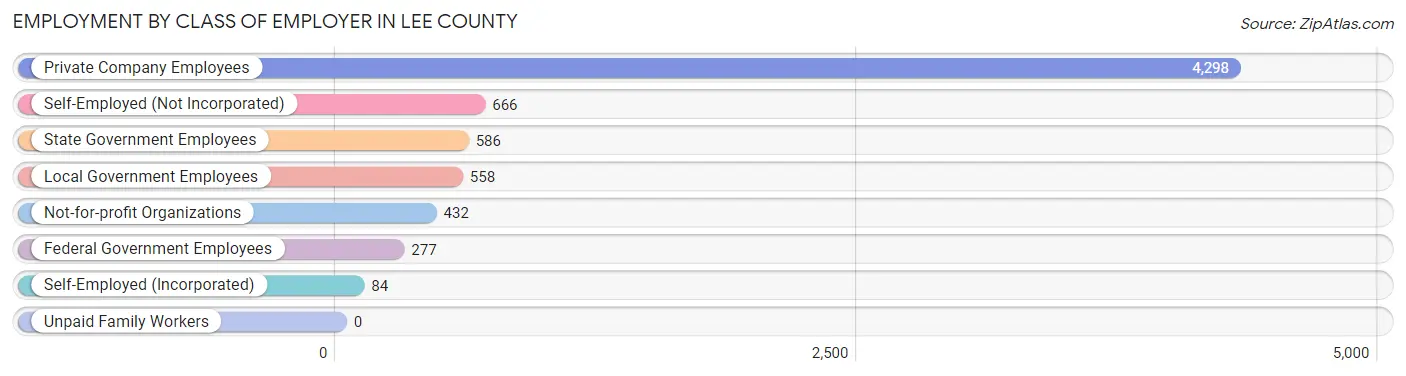
Employment by Class of Employer in Lee County
Among the 6,901 employed individuals in Lee County, private company employees (4,298 | 62.3%), self-employed (not incorporated) (666 | 9.7%), and state government employees (586 | 8.5%) make up the most common classes of employment.
| Employer Class | # Employees | % Employees |
| Private Company Employees | 4,298 | 62.3% |
| Self-Employed (Incorporated) | 84 | 1.2% |
| Self-Employed (Not Incorporated) | 666 | 9.7% |
| Not-for-profit Organizations | 432 | 6.3% |
| Local Government Employees | 558 | 8.1% |
| State Government Employees | 586 | 8.5% |
| Federal Government Employees | 277 | 4.0% |
| Unpaid Family Workers | 0 | 0.0% |
| Total | 6,901 | 100.0% |
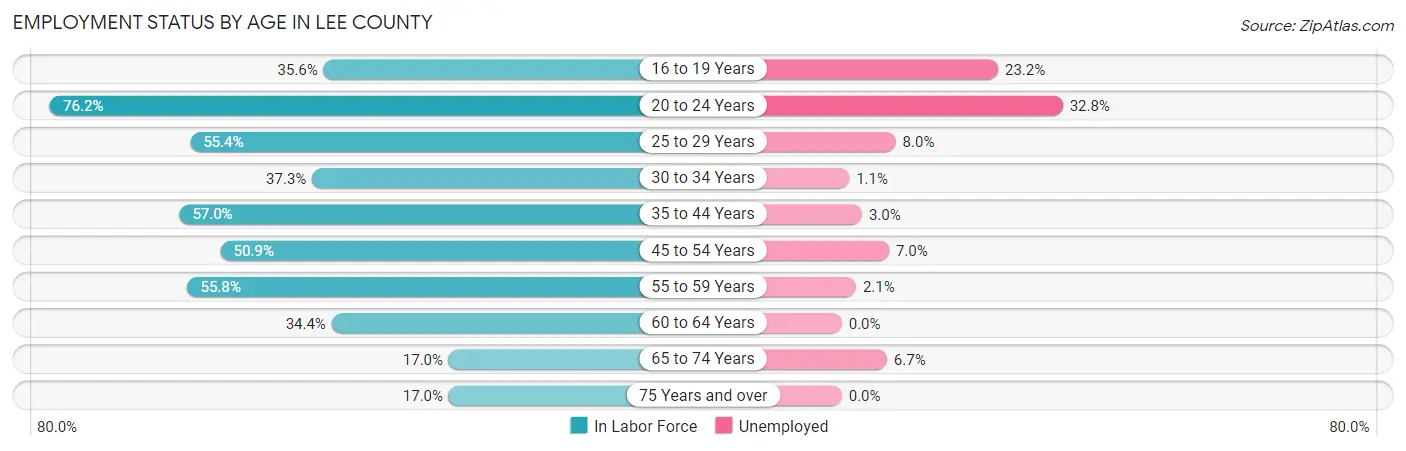
Employment Status by Age in Lee County
According to the labor force statistics for Lee County, out of the total population over 16 years of age (18,676), 41.9% or 7,825 individuals are in the labor force, with 8.1% or 634 of them unemployed. The age group with the highest labor force participation rate is 20 to 24 years, with 76.2% or 885 individuals in the labor force. Within the labor force, the 20 to 24 years age range has the highest percentage of unemployed individuals, with 32.8% or 290 of them being unemployed.
| Age Bracket | In Labor Force | Unemployed |
| 16 to 19 Years | 310 (35.6%) | 72 (23.2%) |
| 20 to 24 Years | 885 (76.2%) | 290 (32.8%) |
| 25 to 29 Years | 727 (55.4%) | 58 (8.0%) |
| 30 to 34 Years | 541 (37.3%) | 6 (1.1%) |
| 35 to 44 Years | 1,516 (57.0%) | 45 (3.0%) |
| 45 to 54 Years | 1,550 (50.9%) | 108 (7.0%) |
| 55 to 59 Years | 913 (55.8%) | 19 (2.1%) |
| 60 to 64 Years | 545 (34.4%) | 0 (0.0%) |
| 65 to 74 Years | 490 (17.0%) | 33 (6.7%) |
| 75 Years and over | 352 (17.0%) | 0 (0.0%) |
| Total | 7,825 (41.9%) | 634 (8.1%) |
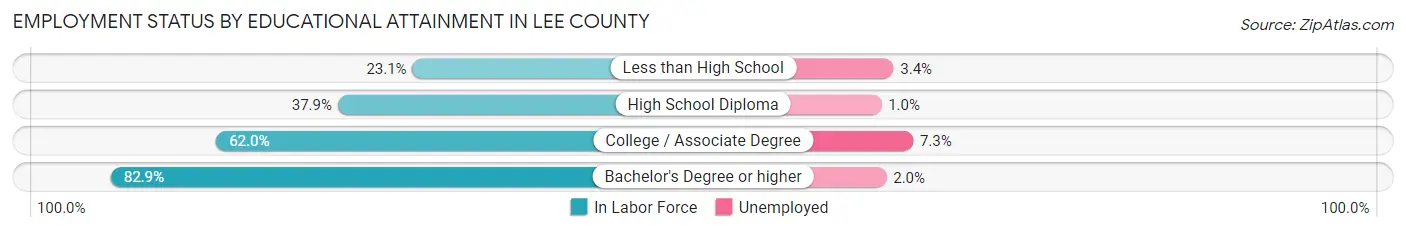
Employment Status by Educational Attainment in Lee County
According to labor force statistics for Lee County, 49.6% of individuals (5,798) out of the total population between 25 and 64 years of age (11,689) are in the labor force, with 4.1% or 238 of them being unemployed. The group with the highest labor force participation rate are those with the educational attainment of bachelor's degree or higher, with 82.9% or 1,205 individuals in the labor force. Within the labor force, individuals with college / associate degree education have the highest percentage of unemployment, with 7.3% or 183 of them being unemployed.
| Educational Attainment | In Labor Force | Unemployed |
| Less than High School | 414 (23.1%) | 61 (3.4%) |
| High School Diploma | 1,665 (37.9%) | 44 (1.0%) |
| College / Associate Degree | 2,510 (62.0%) | 296 (7.3%) |
| Bachelor's Degree or higher | 1,205 (82.9%) | 29 (2.0%) |
| Total | 5,798 (49.6%) | 479 (4.1%) |
Employment Occupations by Sex in Lee County
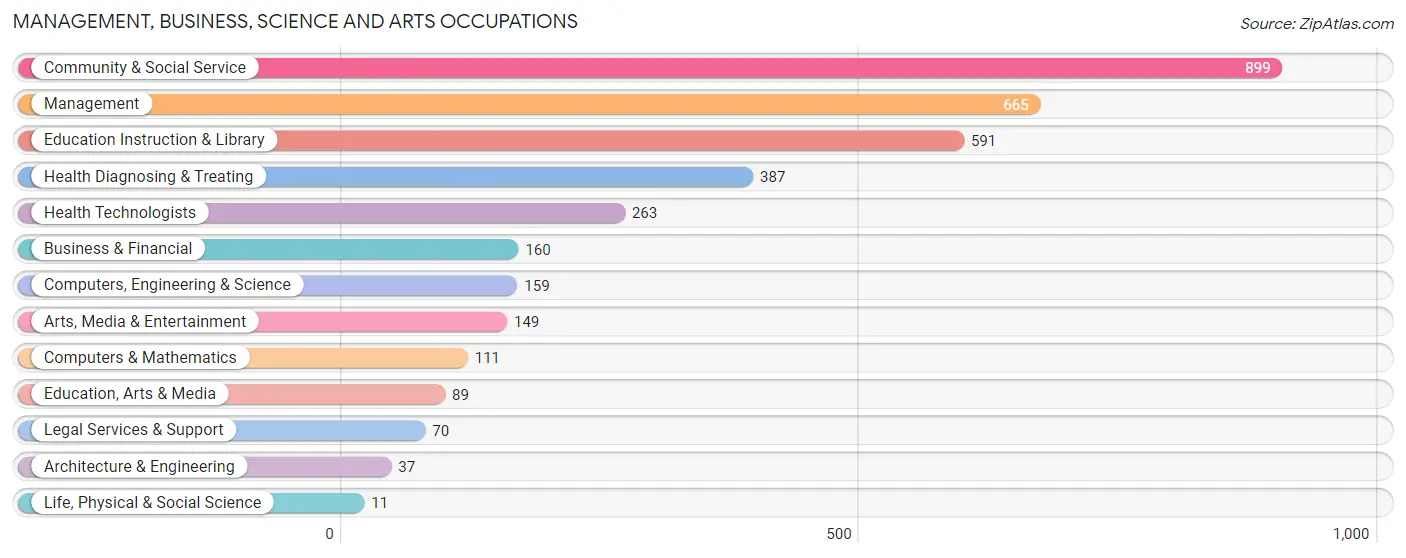
Management, Business, Science and Arts Occupations
The most common Management, Business, Science and Arts occupations in Lee County are Community & Social Service (899 | 12.5%), Management (665 | 9.2%), Education Instruction & Library (591 | 8.2%), Health Diagnosing & Treating (387 | 5.4%), and Health Technologists (263 | 3.6%).
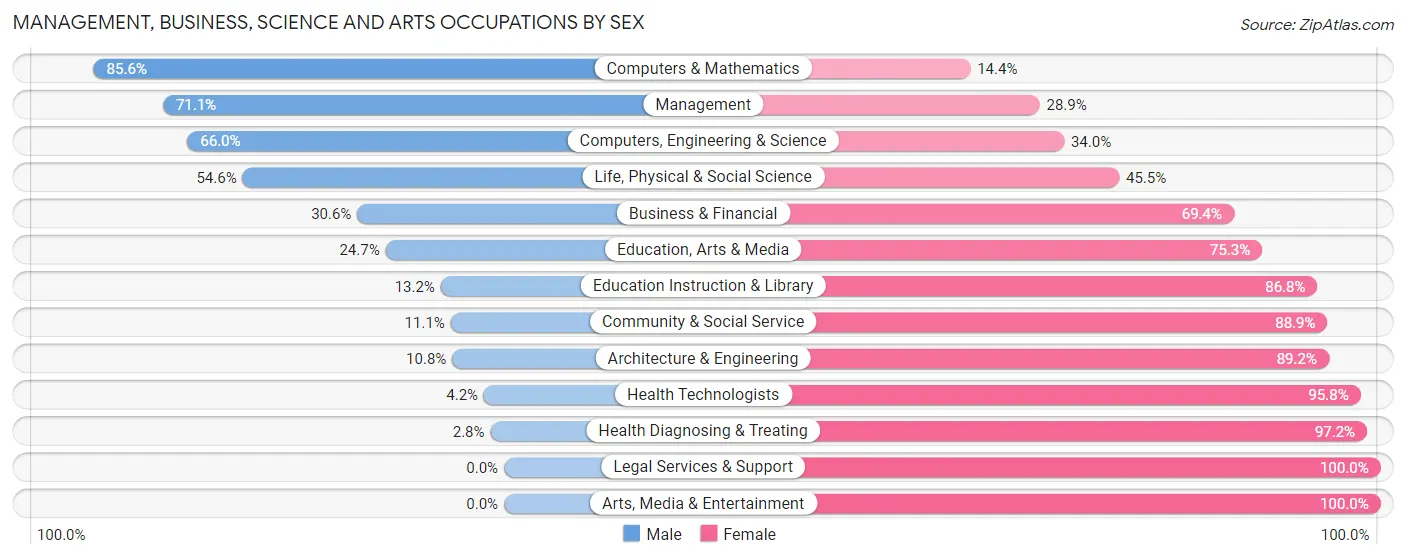
Management, Business, Science and Arts Occupations by Sex
Within the Management, Business, Science and Arts occupations in Lee County, the most male-oriented occupations are Computers & Mathematics (85.6%), Management (71.1%), and Computers, Engineering & Science (66.0%), while the most female-oriented occupations are Legal Services & Support (100.0%), Arts, Media & Entertainment (100.0%), and Health Diagnosing & Treating (97.2%).
| Occupation | Male | Female |
| Management | 473 (71.1%) | 192 (28.9%) |
| Business & Financial | 49 (30.6%) | 111 (69.4%) |
| Computers, Engineering & Science | 105 (66.0%) | 54 (34.0%) |
| Computers & Mathematics | 95 (85.6%) | 16 (14.4%) |
| Architecture & Engineering | 4 (10.8%) | 33 (89.2%) |
| Life, Physical & Social Science | 6 (54.5%) | 5 (45.5%) |
| Community & Social Service | 100 (11.1%) | 799 (88.9%) |
| Education, Arts & Media | 22 (24.7%) | 67 (75.3%) |
| Legal Services & Support | 0 (0.0%) | 70 (100.0%) |
| Education Instruction & Library | 78 (13.2%) | 513 (86.8%) |
| Arts, Media & Entertainment | 0 (0.0%) | 149 (100.0%) |
| Health Diagnosing & Treating | 11 (2.8%) | 376 (97.2%) |
| Health Technologists | 11 (4.2%) | 252 (95.8%) |
| Total (Category) | 738 (32.5%) | 1,532 (67.5%) |
| Total (Overall) | 3,862 (53.7%) | 3,334 (46.3%) |
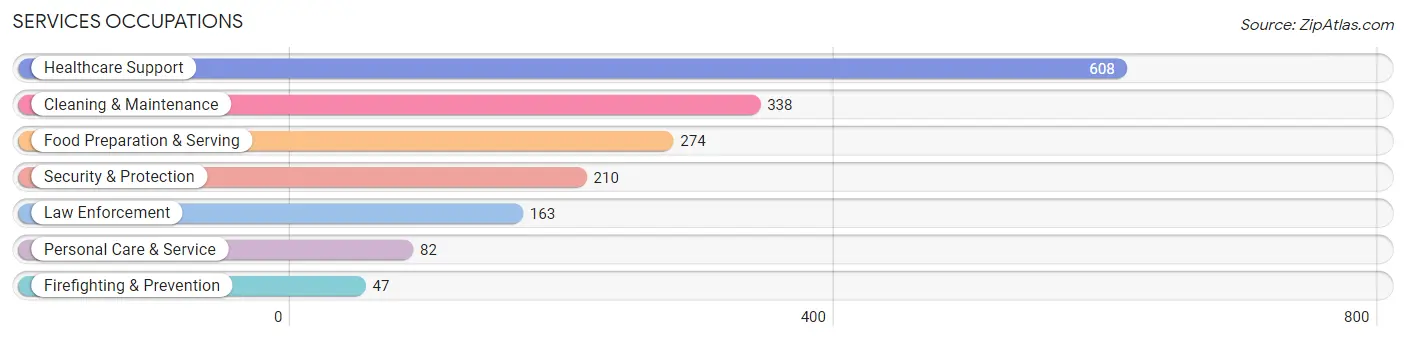
Services Occupations
The most common Services occupations in Lee County are Healthcare Support (608 | 8.5%), Cleaning & Maintenance (338 | 4.7%), Food Preparation & Serving (274 | 3.8%), Security & Protection (210 | 2.9%), and Law Enforcement (163 | 2.3%).
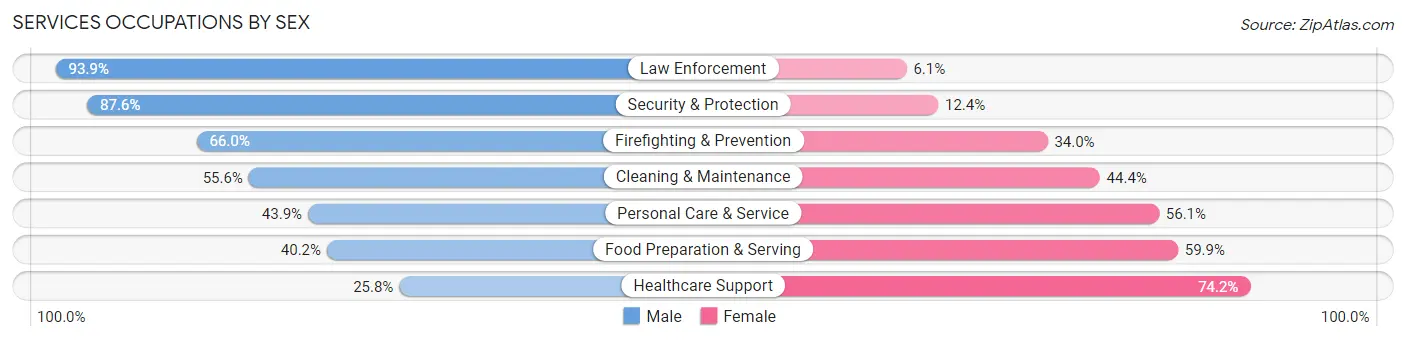
Services Occupations by Sex
Within the Services occupations in Lee County, the most male-oriented occupations are Law Enforcement (93.9%), Security & Protection (87.6%), and Firefighting & Prevention (66.0%), while the most female-oriented occupations are Healthcare Support (74.2%), Food Preparation & Serving (59.9%), and Personal Care & Service (56.1%).
| Occupation | Male | Female |
| Healthcare Support | 157 (25.8%) | 451 (74.2%) |
| Security & Protection | 184 (87.6%) | 26 (12.4%) |
| Firefighting & Prevention | 31 (66.0%) | 16 (34.0%) |
| Law Enforcement | 153 (93.9%) | 10 (6.1%) |
| Food Preparation & Serving | 110 (40.2%) | 164 (59.9%) |
| Cleaning & Maintenance | 188 (55.6%) | 150 (44.4%) |
| Personal Care & Service | 36 (43.9%) | 46 (56.1%) |
| Total (Category) | 675 (44.6%) | 837 (55.4%) |
| Total (Overall) | 3,862 (53.7%) | 3,334 (46.3%) |
Sales and Office Occupations
The most common Sales and Office occupations in Lee County are Sales & Related (652 | 9.1%), and Office & Administration (636 | 8.8%).
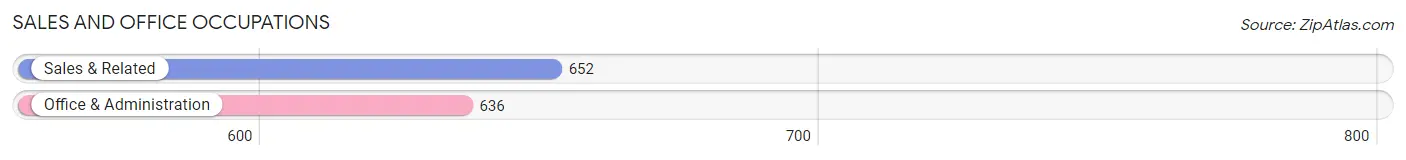
Sales and Office Occupations by Sex
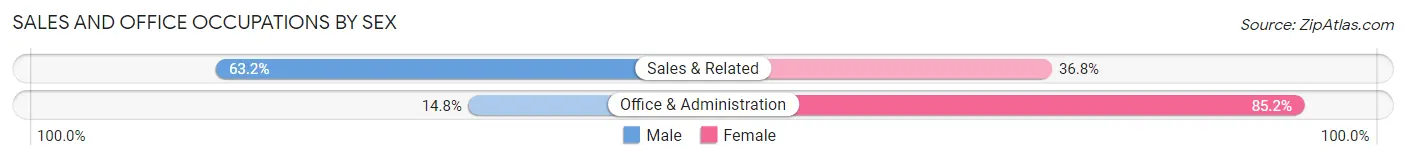
| Occupation | Male | Female |
| Sales & Related | 412 (63.2%) | 240 (36.8%) |
| Office & Administration | 94 (14.8%) | 542 (85.2%) |
| Total (Category) | 506 (39.3%) | 782 (60.7%) |
| Total (Overall) | 3,862 (53.7%) | 3,334 (46.3%) |
Natural Resources, Construction and Maintenance Occupations
The most common Natural Resources, Construction and Maintenance occupations in Lee County are Construction & Extraction (658 | 9.1%), Installation, Maintenance & Repair (272 | 3.8%), and Farming, Fishing & Forestry (29 | 0.4%).
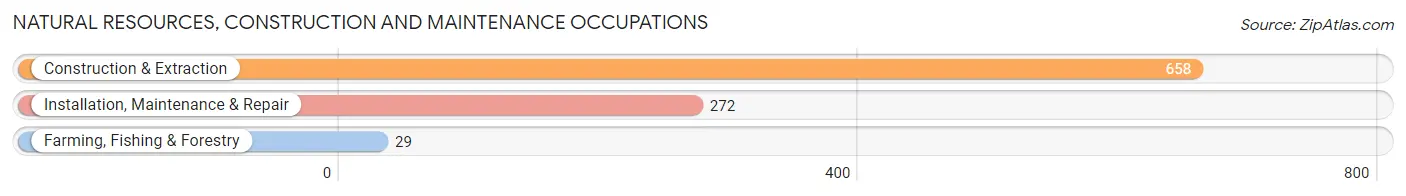
Natural Resources, Construction and Maintenance Occupations by Sex
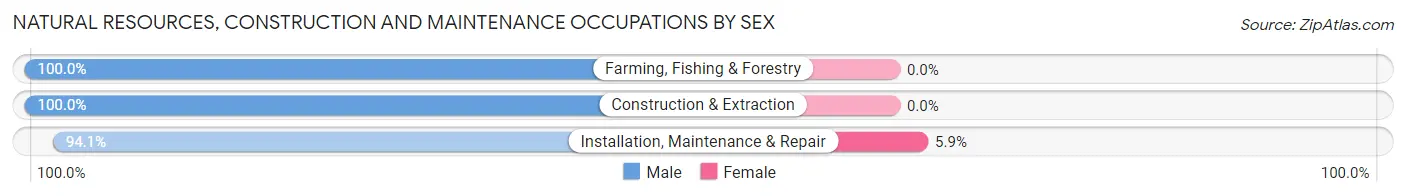
| Occupation | Male | Female |
| Farming, Fishing & Forestry | 29 (100.0%) | 0 (0.0%) |
| Construction & Extraction | 658 (100.0%) | 0 (0.0%) |
| Installation, Maintenance & Repair | 256 (94.1%) | 16 (5.9%) |
| Total (Category) | 943 (98.3%) | 16 (1.7%) |
| Total (Overall) | 3,862 (53.7%) | 3,334 (46.3%) |
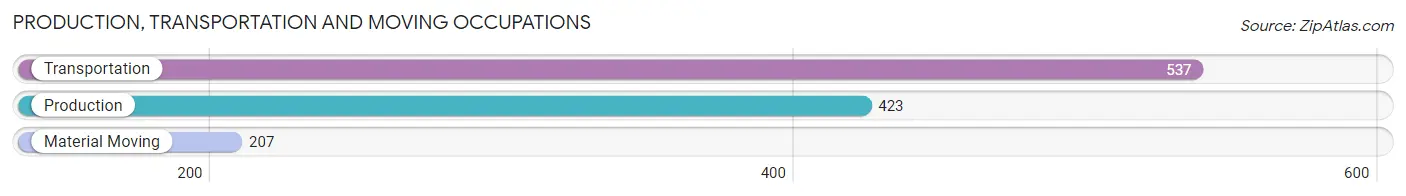
Production, Transportation and Moving Occupations
The most common Production, Transportation and Moving occupations in Lee County are Transportation (537 | 7.5%), Production (423 | 5.9%), and Material Moving (207 | 2.9%).
Production, Transportation and Moving Occupations by Sex
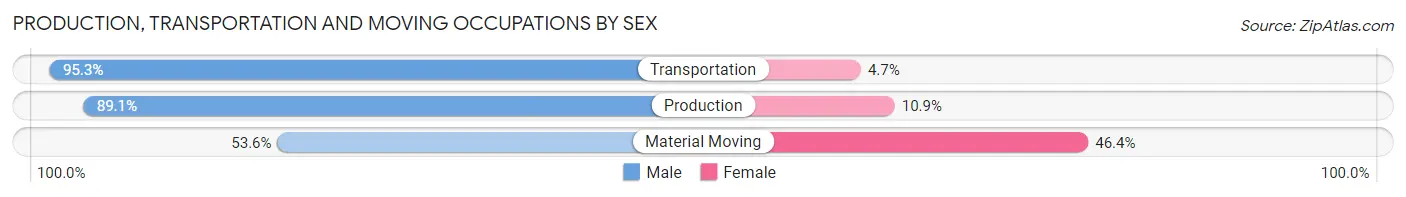
| Occupation | Male | Female |
| Production | 377 (89.1%) | 46 (10.9%) |
| Transportation | 512 (95.3%) | 25 (4.7%) |
| Material Moving | 111 (53.6%) | 96 (46.4%) |
| Total (Category) | 1,000 (85.7%) | 167 (14.3%) |
| Total (Overall) | 3,862 (53.7%) | 3,334 (46.3%) |
Employment Industries by Sex in Lee County
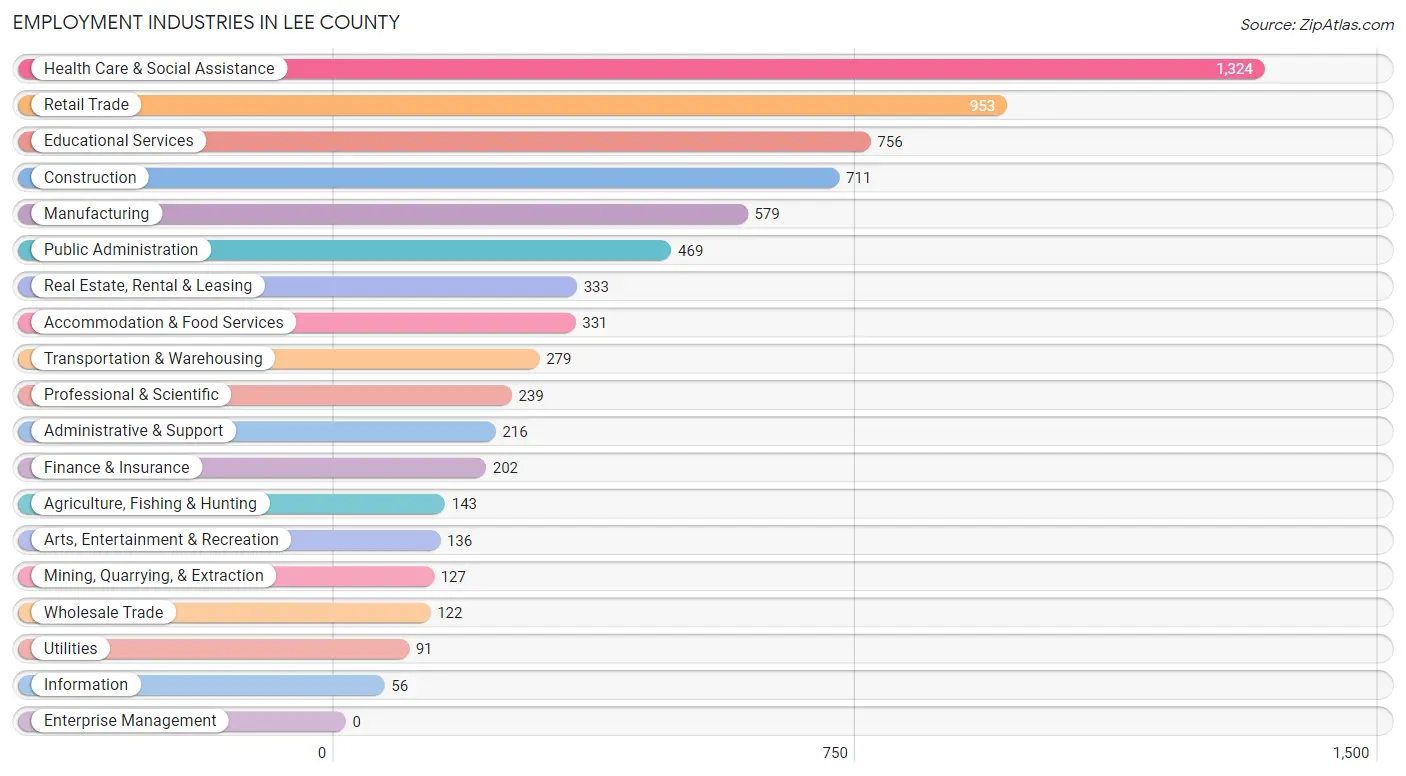
Employment Industries in Lee County
The major employment industries in Lee County include Health Care & Social Assistance (1,324 | 18.4%), Retail Trade (953 | 13.2%), Educational Services (756 | 10.5%), Construction (711 | 9.9%), and Manufacturing (579 | 8.1%).
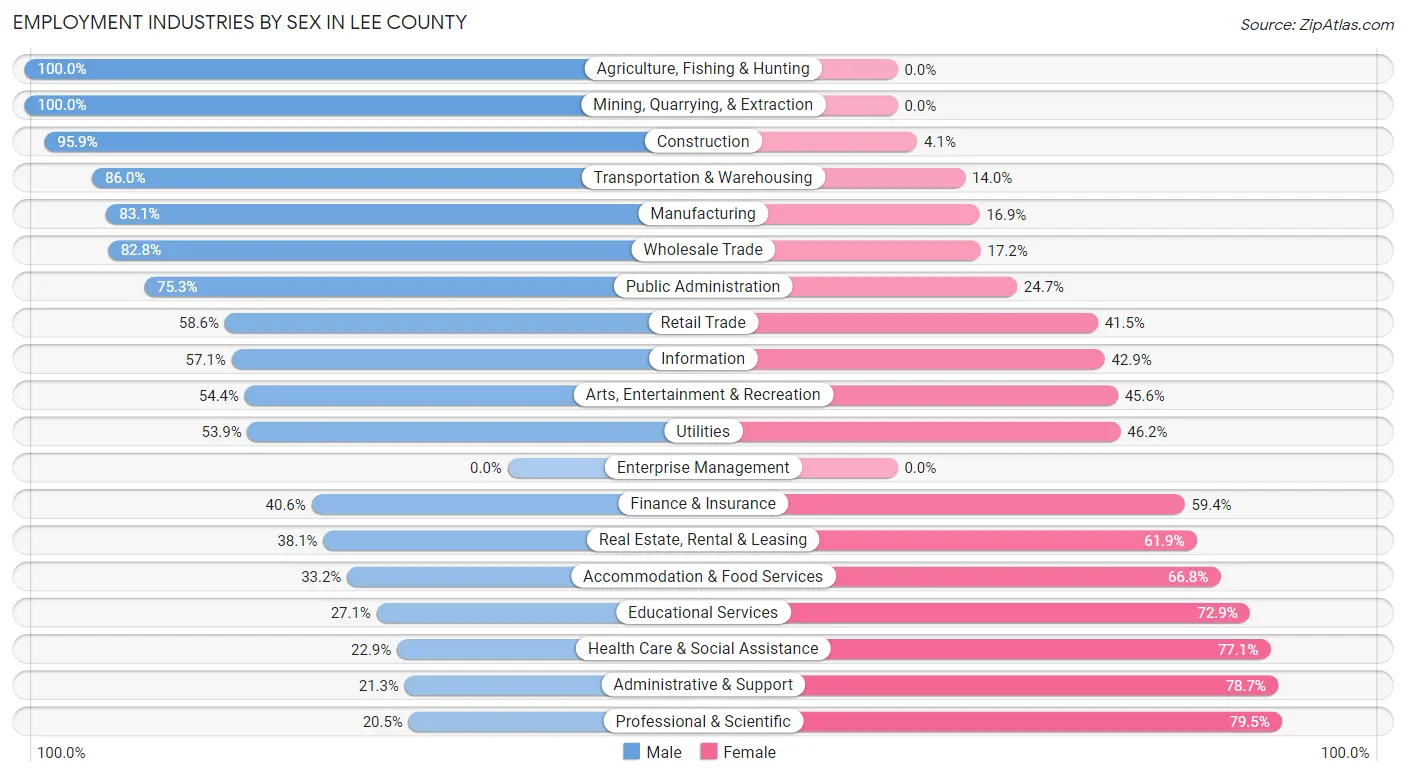
Employment Industries by Sex in Lee County
The Lee County industries that see more men than women are Agriculture, Fishing & Hunting (100.0%), Mining, Quarrying, & Extraction (100.0%), and Construction (95.9%), whereas the industries that tend to have a higher number of women are Professional & Scientific (79.5%), Administrative & Support (78.7%), and Health Care & Social Assistance (77.1%).
| Industry | Male | Female |
| Agriculture, Fishing & Hunting | 143 (100.0%) | 0 (0.0%) |
| Mining, Quarrying, & Extraction | 127 (100.0%) | 0 (0.0%) |
| Construction | 682 (95.9%) | 29 (4.1%) |
| Manufacturing | 481 (83.1%) | 98 (16.9%) |
| Wholesale Trade | 101 (82.8%) | 21 (17.2%) |
| Retail Trade | 558 (58.6%) | 395 (41.4%) |
| Transportation & Warehousing | 240 (86.0%) | 39 (14.0%) |
| Utilities | 49 (53.8%) | 42 (46.2%) |
| Information | 32 (57.1%) | 24 (42.9%) |
| Finance & Insurance | 82 (40.6%) | 120 (59.4%) |
| Real Estate, Rental & Leasing | 127 (38.1%) | 206 (61.9%) |
| Professional & Scientific | 49 (20.5%) | 190 (79.5%) |
| Enterprise Management | 0 (0.0%) | 0 (0.0%) |
| Administrative & Support | 46 (21.3%) | 170 (78.7%) |
| Educational Services | 205 (27.1%) | 551 (72.9%) |
| Health Care & Social Assistance | 303 (22.9%) | 1,021 (77.1%) |
| Arts, Entertainment & Recreation | 74 (54.4%) | 62 (45.6%) |
| Accommodation & Food Services | 110 (33.2%) | 221 (66.8%) |
| Public Administration | 353 (75.3%) | 116 (24.7%) |
| Total | 3,862 (53.7%) | 3,334 (46.3%) |
Education in Lee County
School Enrollment in Lee County
The most common levels of schooling among the 3,921 students in Lee County are high school (1,019 | 26.0%), middle school (952 | 24.3%), and elementary school (715 | 18.2%).
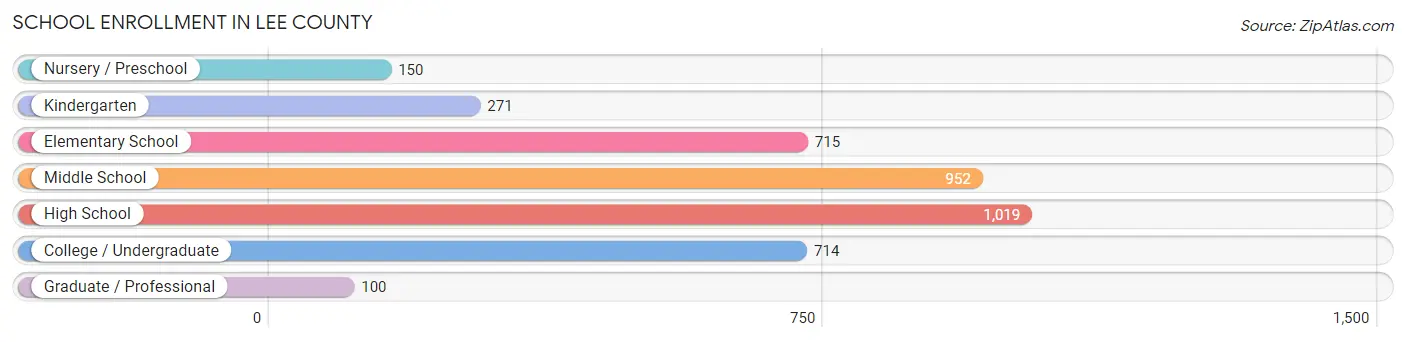
| School Level | # Students | % Students |
| Nursery / Preschool | 150 | 3.8% |
| Kindergarten | 271 | 6.9% |
| Elementary School | 715 | 18.2% |
| Middle School | 952 | 24.3% |
| High School | 1,019 | 26.0% |
| College / Undergraduate | 714 | 18.2% |
| Graduate / Professional | 100 | 2.5% |
| Total | 3,921 | 100.0% |
School Enrollment by Age by Funding Source in Lee County
Out of a total of 3,921 students who are enrolled in schools in Lee County, 459 (11.7%) attend a private institution, while the remaining 3,462 (88.3%) are enrolled in public schools. The age group of 25 to 34 year olds has the highest likelihood of being enrolled in private schools, with 210 (68.4% in the age bracket) enrolled. Conversely, the age group of 10 to 14 year olds has the lowest likelihood of being enrolled in a private school, with 1,198 (100.0% in the age bracket) attending a public institution.
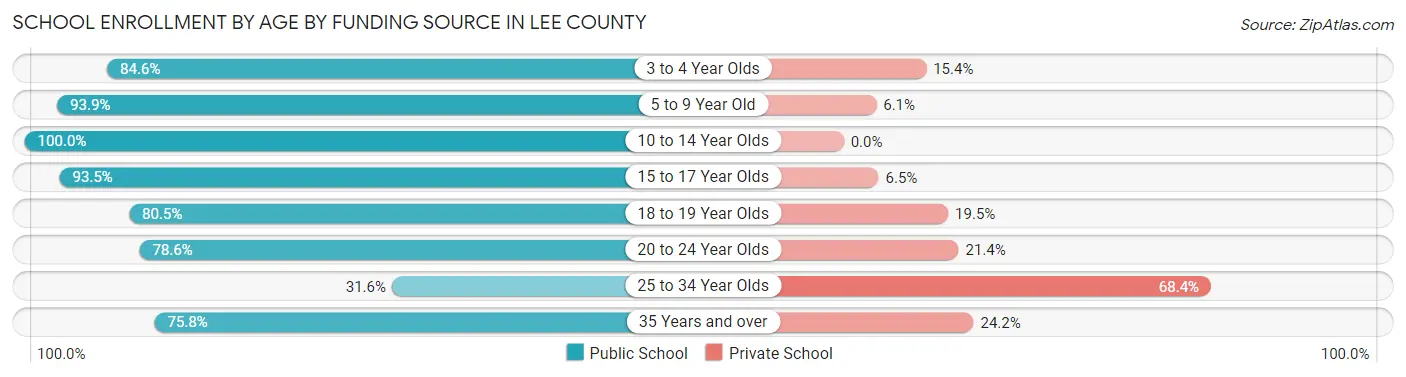
| Age Bracket | Public School | Private School |
| 3 to 4 Year Olds | 99 (84.6%) | 18 (15.4%) |
| 5 to 9 Year Old | 898 (93.9%) | 58 (6.1%) |
| 10 to 14 Year Olds | 1,198 (100.0%) | 0 (0.0%) |
| 15 to 17 Year Olds | 734 (93.5%) | 51 (6.5%) |
| 18 to 19 Year Olds | 120 (80.5%) | 29 (19.5%) |
| 20 to 24 Year Olds | 224 (78.6%) | 61 (21.4%) |
| 25 to 34 Year Olds | 97 (31.6%) | 210 (68.4%) |
| 35 Years and over | 94 (75.8%) | 30 (24.2%) |
| Total | 3,462 (88.3%) | 459 (11.7%) |
Educational Attainment by Field of Study in Lee County
Education (604 | 29.8%), business (269 | 13.3%), science & technology (265 | 13.1%), arts & humanities (146 | 7.2%), and liberal arts & history (109 | 5.4%) are the most common fields of study among 2,026 individuals in Lee County who have obtained a bachelor's degree or higher.
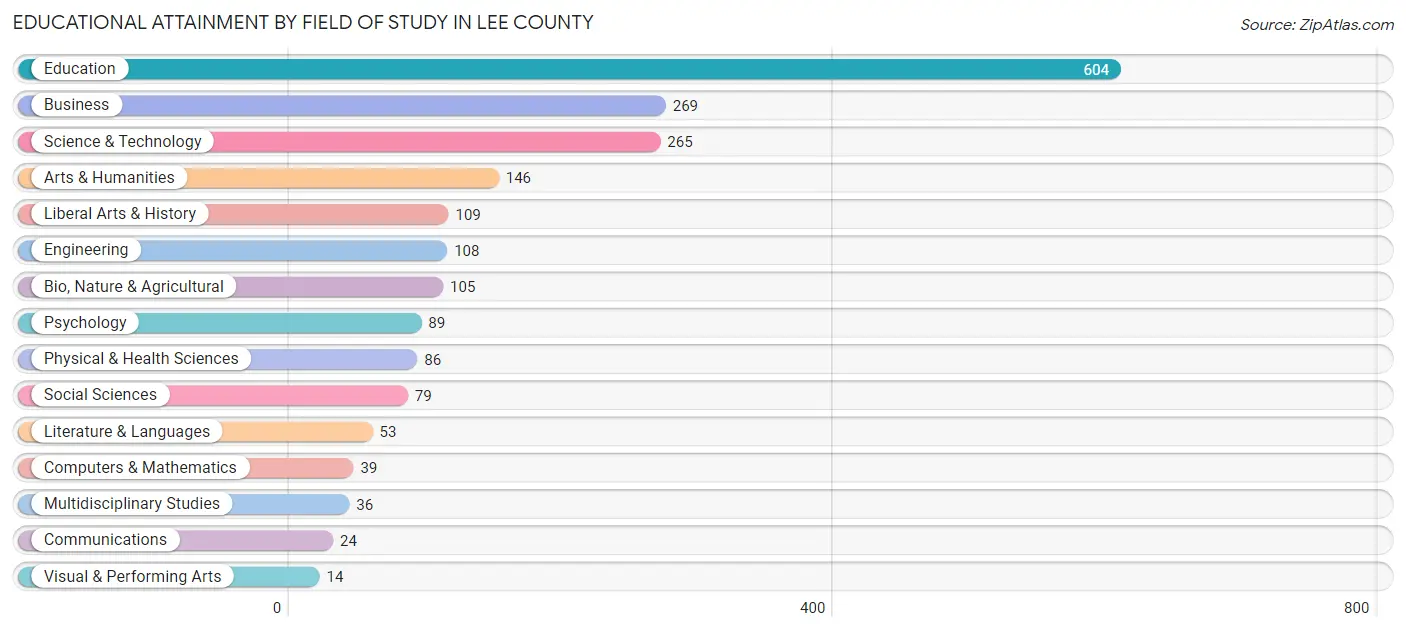
| Field of Study | # Graduates | % Graduates |
| Computers & Mathematics | 39 | 1.9% |
| Bio, Nature & Agricultural | 105 | 5.2% |
| Physical & Health Sciences | 86 | 4.2% |
| Psychology | 89 | 4.4% |
| Social Sciences | 79 | 3.9% |
| Engineering | 108 | 5.3% |
| Multidisciplinary Studies | 36 | 1.8% |
| Science & Technology | 265 | 13.1% |
| Business | 269 | 13.3% |
| Education | 604 | 29.8% |
| Literature & Languages | 53 | 2.6% |
| Liberal Arts & History | 109 | 5.4% |
| Visual & Performing Arts | 14 | 0.7% |
| Communications | 24 | 1.2% |
| Arts & Humanities | 146 | 7.2% |
| Total | 2,026 | 100.0% |
Transportation & Commute in Lee County
Vehicle Availability by Sex in Lee County
The most prevalent vehicle ownership categories in Lee County are males with 2 vehicles (1,278, accounting for 34.6%) and females with 2 vehicles (806, making up 39.8%).
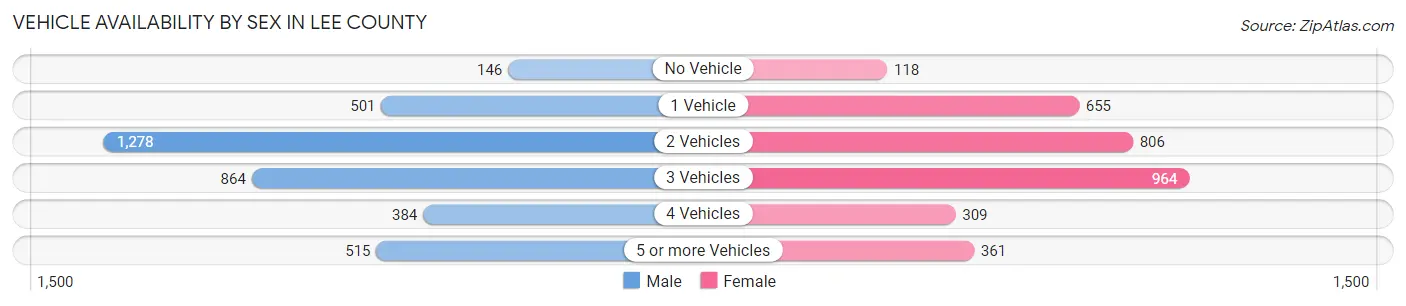
| Vehicles Available | Male | Female |
| No Vehicle | 146 (4.0%) | 118 (3.7%) |
| 1 Vehicle | 501 (13.6%) | 655 (20.4%) |
| 2 Vehicles | 1,278 (34.6%) | 806 (25.1%) |
| 3 Vehicles | 864 (23.4%) | 964 (30.0%) |
| 4 Vehicles | 384 (10.4%) | 309 (9.6%) |
| 5 or more Vehicles | 515 (14.0%) | 361 (11.2%) |
| Total | 3,688 (100.0%) | 3,213 (100.0%) |
Commute Time in Lee County
The most frequently occuring commute durations in Lee County are 15 to 19 minutes (1,522 commuters, 23.9%), 10 to 14 minutes (996 commuters, 15.6%), and 45 to 59 minutes (793 commuters, 12.4%).
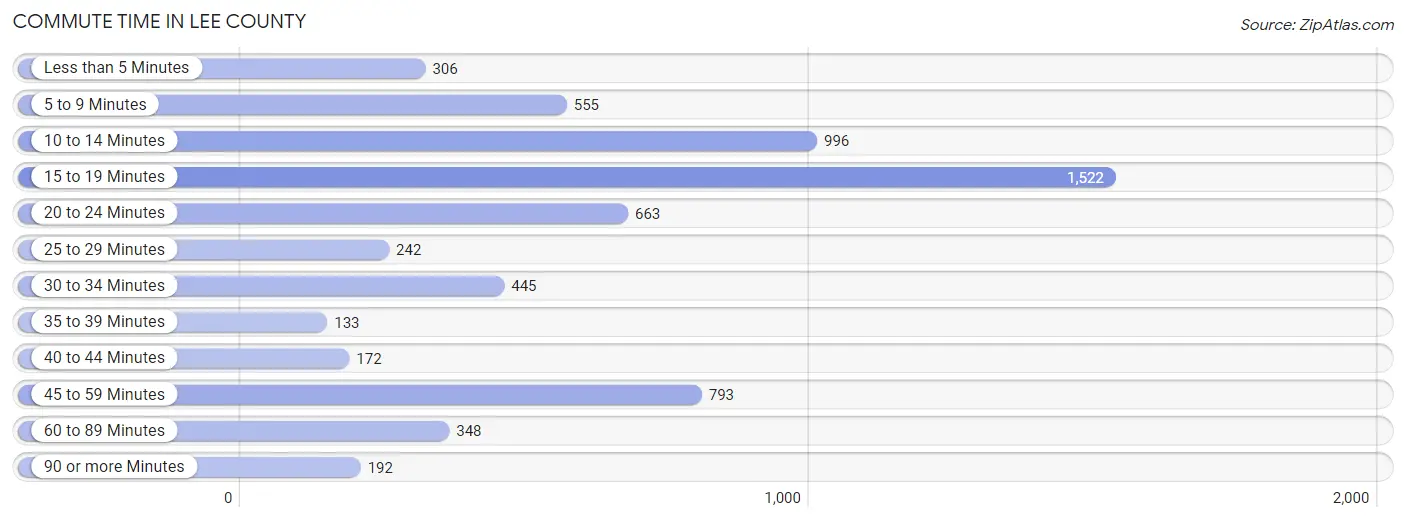
| Commute Time | # Commuters | % Commuters |
| Less than 5 Minutes | 306 | 4.8% |
| 5 to 9 Minutes | 555 | 8.7% |
| 10 to 14 Minutes | 996 | 15.6% |
| 15 to 19 Minutes | 1,522 | 23.9% |
| 20 to 24 Minutes | 663 | 10.4% |
| 25 to 29 Minutes | 242 | 3.8% |
| 30 to 34 Minutes | 445 | 7.0% |
| 35 to 39 Minutes | 133 | 2.1% |
| 40 to 44 Minutes | 172 | 2.7% |
| 45 to 59 Minutes | 793 | 12.4% |
| 60 to 89 Minutes | 348 | 5.5% |
| 90 or more Minutes | 192 | 3.0% |
Commute Time by Sex in Lee County
The most common commute times in Lee County are 15 to 19 minutes (873 commuters, 24.5%) for males and 15 to 19 minutes (649 commuters, 23.2%) for females.
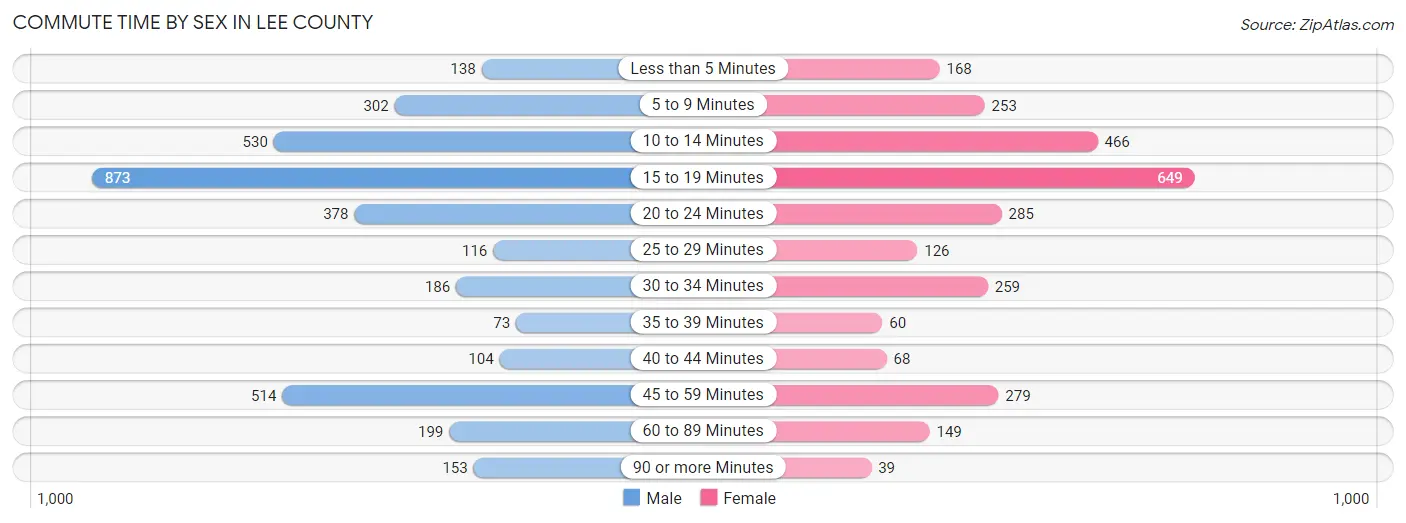
| Commute Time | Male | Female |
| Less than 5 Minutes | 138 (3.9%) | 168 (6.0%) |
| 5 to 9 Minutes | 302 (8.5%) | 253 (9.0%) |
| 10 to 14 Minutes | 530 (14.9%) | 466 (16.6%) |
| 15 to 19 Minutes | 873 (24.5%) | 649 (23.2%) |
| 20 to 24 Minutes | 378 (10.6%) | 285 (10.2%) |
| 25 to 29 Minutes | 116 (3.3%) | 126 (4.5%) |
| 30 to 34 Minutes | 186 (5.2%) | 259 (9.2%) |
| 35 to 39 Minutes | 73 (2.1%) | 60 (2.1%) |
| 40 to 44 Minutes | 104 (2.9%) | 68 (2.4%) |
| 45 to 59 Minutes | 514 (14.4%) | 279 (10.0%) |
| 60 to 89 Minutes | 199 (5.6%) | 149 (5.3%) |
| 90 or more Minutes | 153 (4.3%) | 39 (1.4%) |
Time of Departure to Work by Sex in Lee County
The most frequent times of departure to work in Lee County are 4:00 PM to 11:59 PM (439, 12.3%) for males and 7:30 AM to 7:59 AM (579, 20.7%) for females.
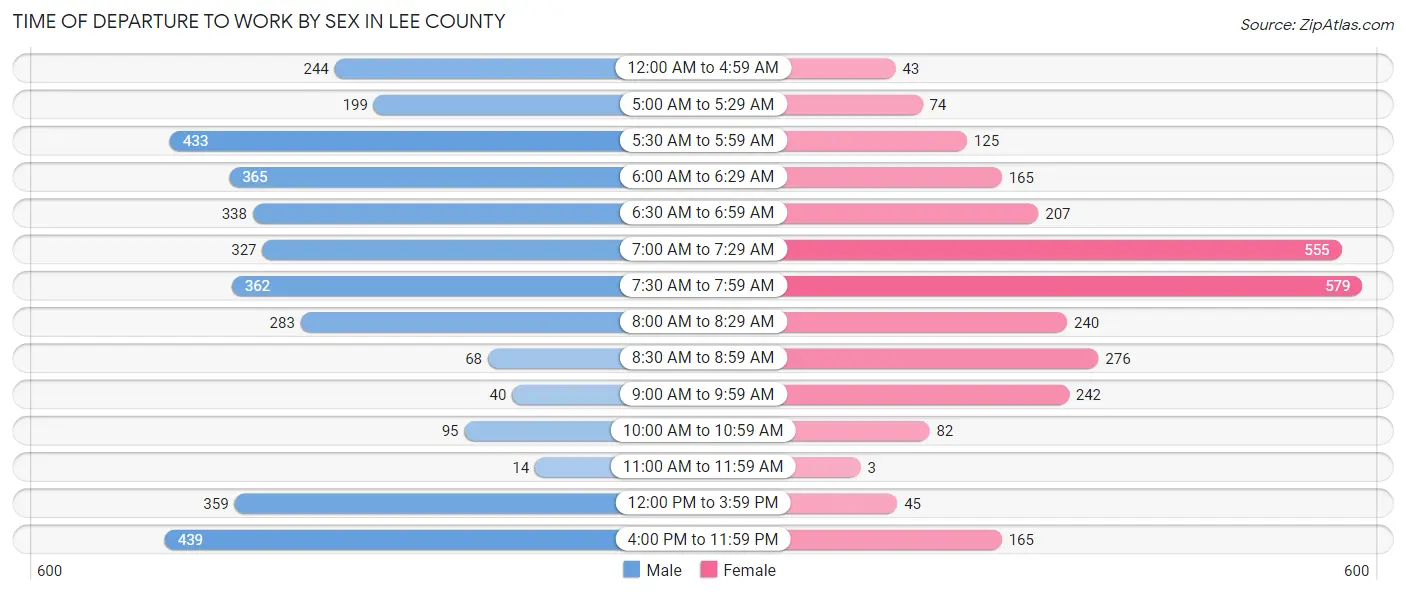
| Time of Departure | Male | Female |
| 12:00 AM to 4:59 AM | 244 (6.8%) | 43 (1.5%) |
| 5:00 AM to 5:29 AM | 199 (5.6%) | 74 (2.6%) |
| 5:30 AM to 5:59 AM | 433 (12.1%) | 125 (4.5%) |
| 6:00 AM to 6:29 AM | 365 (10.2%) | 165 (5.9%) |
| 6:30 AM to 6:59 AM | 338 (9.5%) | 207 (7.4%) |
| 7:00 AM to 7:29 AM | 327 (9.2%) | 555 (19.8%) |
| 7:30 AM to 7:59 AM | 362 (10.2%) | 579 (20.7%) |
| 8:00 AM to 8:29 AM | 283 (7.9%) | 240 (8.6%) |
| 8:30 AM to 8:59 AM | 68 (1.9%) | 276 (9.9%) |
| 9:00 AM to 9:59 AM | 40 (1.1%) | 242 (8.6%) |
| 10:00 AM to 10:59 AM | 95 (2.7%) | 82 (2.9%) |
| 11:00 AM to 11:59 AM | 14 (0.4%) | 3 (0.1%) |
| 12:00 PM to 3:59 PM | 359 (10.1%) | 45 (1.6%) |
| 4:00 PM to 11:59 PM | 439 (12.3%) | 165 (5.9%) |
| Total | 3,566 (100.0%) | 2,801 (100.0%) |
Housing Occupancy in Lee County
Occupancy by Ownership in Lee County
Of the total 8,324 dwellings in Lee County, owner-occupied units account for 6,006 (72.2%), while renter-occupied units make up 2,318 (27.9%).
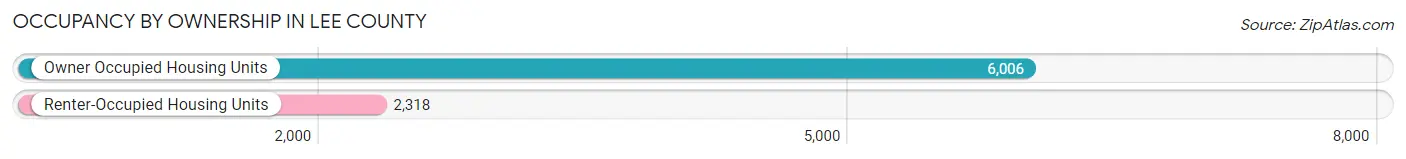
| Occupancy | # Housing Units | % Housing Units |
| Owner Occupied Housing Units | 6,006 | 72.2% |
| Renter-Occupied Housing Units | 2,318 | 27.9% |
| Total Occupied Housing Units | 8,324 | 100.0% |
Occupancy by Household Size in Lee County
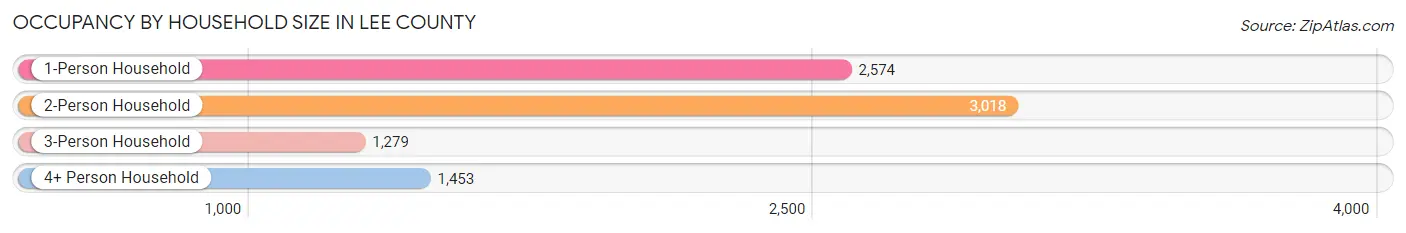
| Household Size | # Housing Units | % Housing Units |
| 1-Person Household | 2,574 | 30.9% |
| 2-Person Household | 3,018 | 36.3% |
| 3-Person Household | 1,279 | 15.4% |
| 4+ Person Household | 1,453 | 17.5% |
| Total Housing Units | 8,324 | 100.0% |
Occupancy by Ownership by Household Size in Lee County
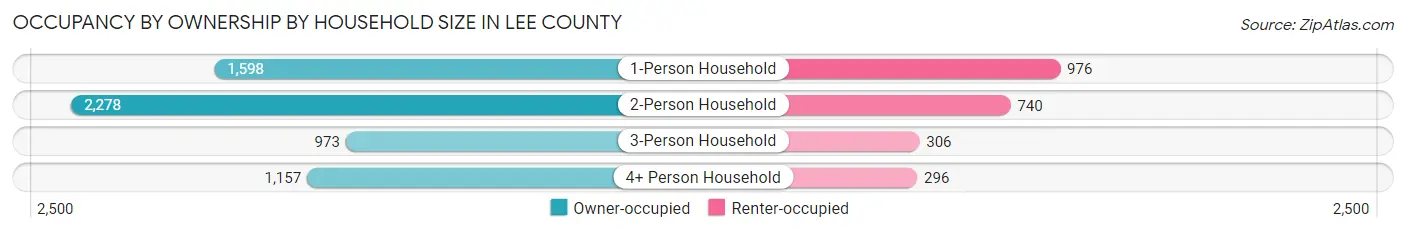
| Household Size | Owner-occupied | Renter-occupied |
| 1-Person Household | 1,598 (62.1%) | 976 (37.9%) |
| 2-Person Household | 2,278 (75.5%) | 740 (24.5%) |
| 3-Person Household | 973 (76.1%) | 306 (23.9%) |
| 4+ Person Household | 1,157 (79.6%) | 296 (20.4%) |
| Total Housing Units | 6,006 (72.2%) | 2,318 (27.9%) |
Occupancy by Educational Attainment in Lee County
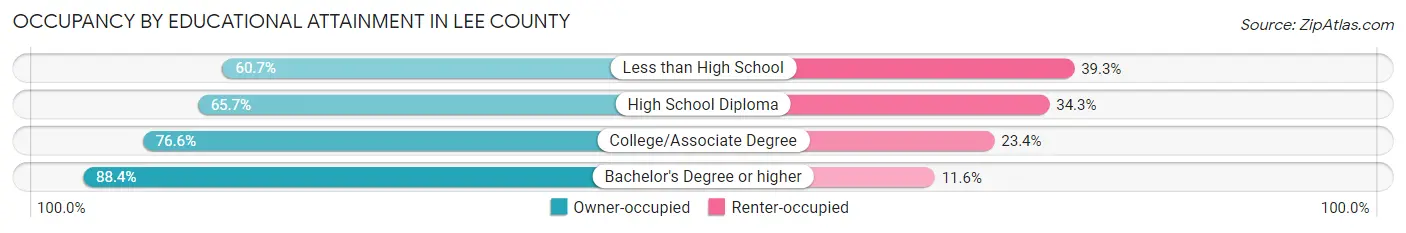
| Household Size | Owner-occupied | Renter-occupied |
| Less than High School | 899 (60.7%) | 581 (39.3%) |
| High School Diploma | 1,662 (65.7%) | 869 (34.3%) |
| College/Associate Degree | 2,379 (76.6%) | 728 (23.4%) |
| Bachelor's Degree or higher | 1,066 (88.4%) | 140 (11.6%) |
Occupancy by Age of Householder in Lee County
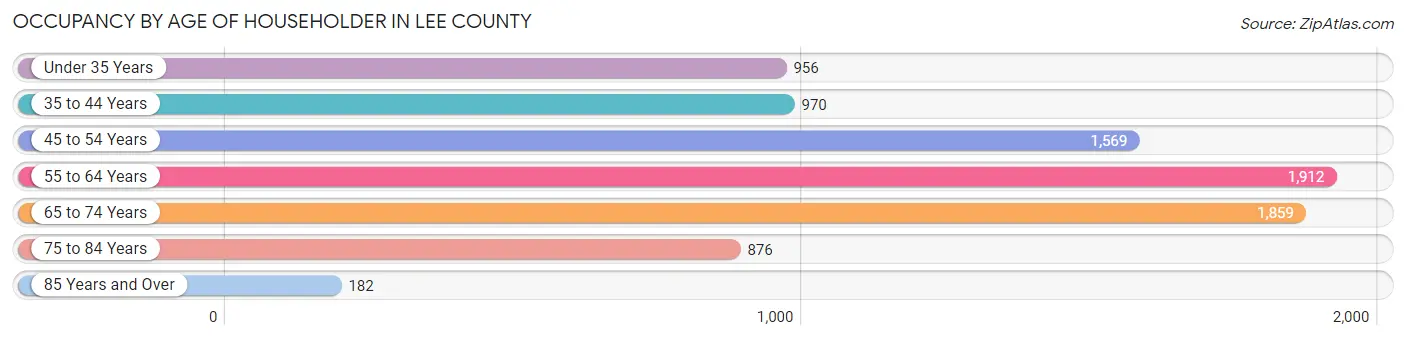
| Age Bracket | # Households | % Households |
| Under 35 Years | 956 | 11.5% |
| 35 to 44 Years | 970 | 11.7% |
| 45 to 54 Years | 1,569 | 18.9% |
| 55 to 64 Years | 1,912 | 23.0% |
| 65 to 74 Years | 1,859 | 22.3% |
| 75 to 84 Years | 876 | 10.5% |
| 85 Years and Over | 182 | 2.2% |
| Total | 8,324 | 100.0% |
Housing Finances in Lee County
Median Income by Occupancy in Lee County

| Occupancy Type | # Households | Median Income |
| Owner-Occupied | 6,006 (72.2%) | $55,194 |
| Renter-Occupied | 2,318 (27.9%) | $19,713 |
| Average | 8,324 (100.0%) | $41,619 |
Occupancy by Householder Income Bracket in Lee County
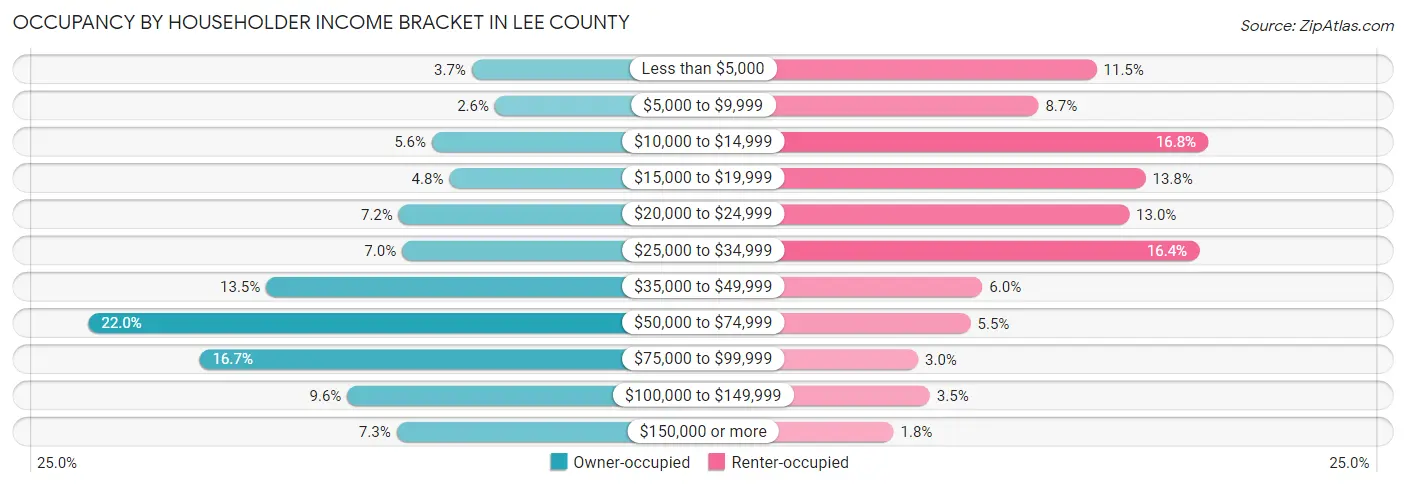
| Income Bracket | Owner-occupied | Renter-occupied |
| Less than $5,000 | 223 (3.7%) | 266 (11.5%) |
| $5,000 to $9,999 | 157 (2.6%) | 202 (8.7%) |
| $10,000 to $14,999 | 337 (5.6%) | 389 (16.8%) |
| $15,000 to $19,999 | 287 (4.8%) | 320 (13.8%) |
| $20,000 to $24,999 | 432 (7.2%) | 302 (13.0%) |
| $25,000 to $34,999 | 422 (7.0%) | 379 (16.4%) |
| $35,000 to $49,999 | 811 (13.5%) | 140 (6.0%) |
| $50,000 to $74,999 | 1,319 (22.0%) | 127 (5.5%) |
| $75,000 to $99,999 | 1,001 (16.7%) | 69 (3.0%) |
| $100,000 to $149,999 | 579 (9.6%) | 82 (3.5%) |
| $150,000 or more | 438 (7.3%) | 42 (1.8%) |
| Total | 6,006 (100.0%) | 2,318 (100.0%) |
Monthly Housing Cost Tiers in Lee County
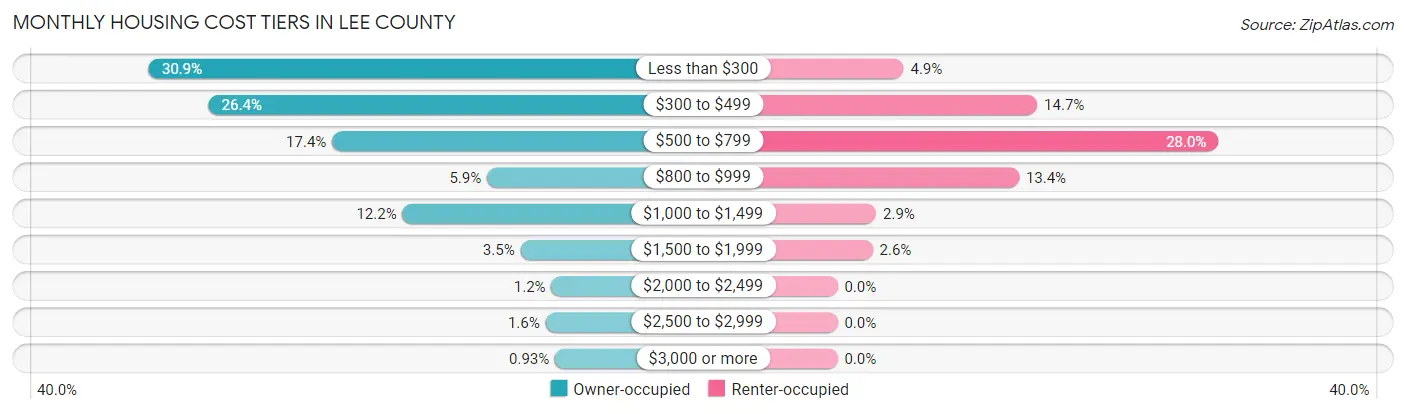
| Monthly Cost | Owner-occupied | Renter-occupied |
| Less than $300 | 1,853 (30.8%) | 113 (4.9%) |
| $300 to $499 | 1,588 (26.4%) | 341 (14.7%) |
| $500 to $799 | 1,042 (17.3%) | 650 (28.0%) |
| $800 to $999 | 357 (5.9%) | 310 (13.4%) |
| $1,000 to $1,499 | 731 (12.2%) | 66 (2.9%) |
| $1,500 to $1,999 | 209 (3.5%) | 60 (2.6%) |
| $2,000 to $2,499 | 72 (1.2%) | 0 (0.0%) |
| $2,500 to $2,999 | 98 (1.6%) | 0 (0.0%) |
| $3,000 or more | 56 (0.9%) | 0 (0.0%) |
| Total | 6,006 (100.0%) | 2,318 (100.0%) |
Physical Housing Characteristics in Lee County
Housing Structures in Lee County
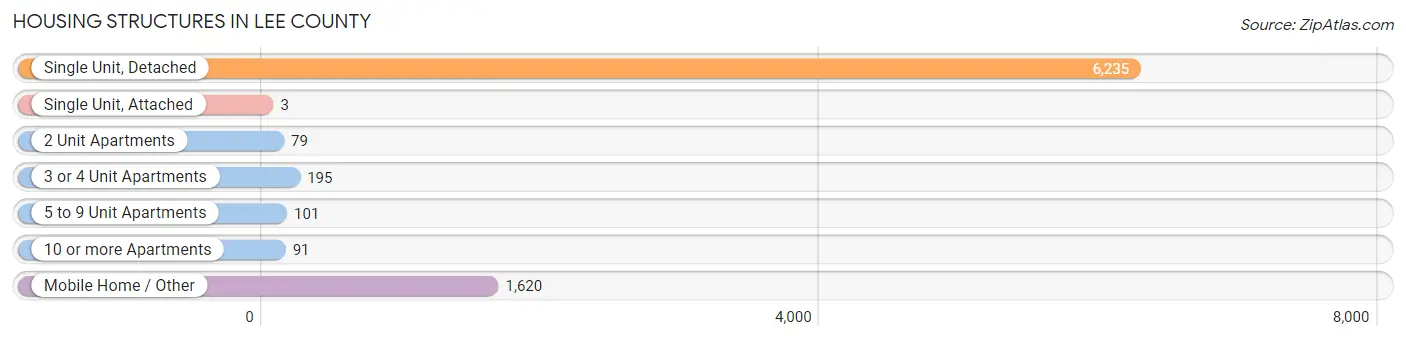
| Structure Type | # Housing Units | % Housing Units |
| Single Unit, Detached | 6,235 | 74.9% |
| Single Unit, Attached | 3 | 0.0% |
| 2 Unit Apartments | 79 | 0.9% |
| 3 or 4 Unit Apartments | 195 | 2.3% |
| 5 to 9 Unit Apartments | 101 | 1.2% |
| 10 or more Apartments | 91 | 1.1% |
| Mobile Home / Other | 1,620 | 19.5% |
| Total | 8,324 | 100.0% |
Housing Structures by Occupancy in Lee County
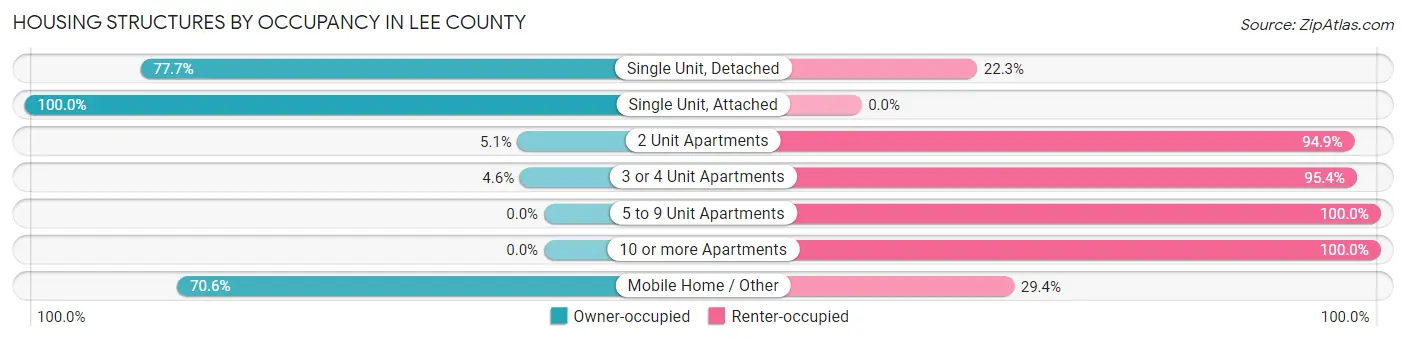
| Structure Type | Owner-occupied | Renter-occupied |
| Single Unit, Detached | 4,846 (77.7%) | 1,389 (22.3%) |
| Single Unit, Attached | 3 (100.0%) | 0 (0.0%) |
| 2 Unit Apartments | 4 (5.1%) | 75 (94.9%) |
| 3 or 4 Unit Apartments | 9 (4.6%) | 186 (95.4%) |
| 5 to 9 Unit Apartments | 0 (0.0%) | 101 (100.0%) |
| 10 or more Apartments | 0 (0.0%) | 91 (100.0%) |
| Mobile Home / Other | 1,144 (70.6%) | 476 (29.4%) |
| Total | 6,006 (72.2%) | 2,318 (27.9%) |
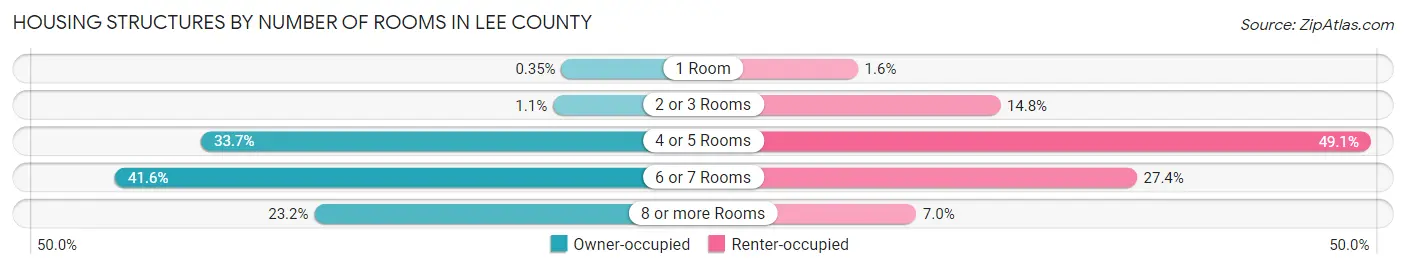
Housing Structures by Number of Rooms in Lee County
| Number of Rooms | Owner-occupied | Renter-occupied |
| 1 Room | 21 (0.4%) | 38 (1.6%) |
| 2 or 3 Rooms | 68 (1.1%) | 343 (14.8%) |
| 4 or 5 Rooms | 2,023 (33.7%) | 1,138 (49.1%) |
| 6 or 7 Rooms | 2,500 (41.6%) | 636 (27.4%) |
| 8 or more Rooms | 1,394 (23.2%) | 163 (7.0%) |
| Total | 6,006 (100.0%) | 2,318 (100.0%) |
Housing Structure by Heating Type in Lee County
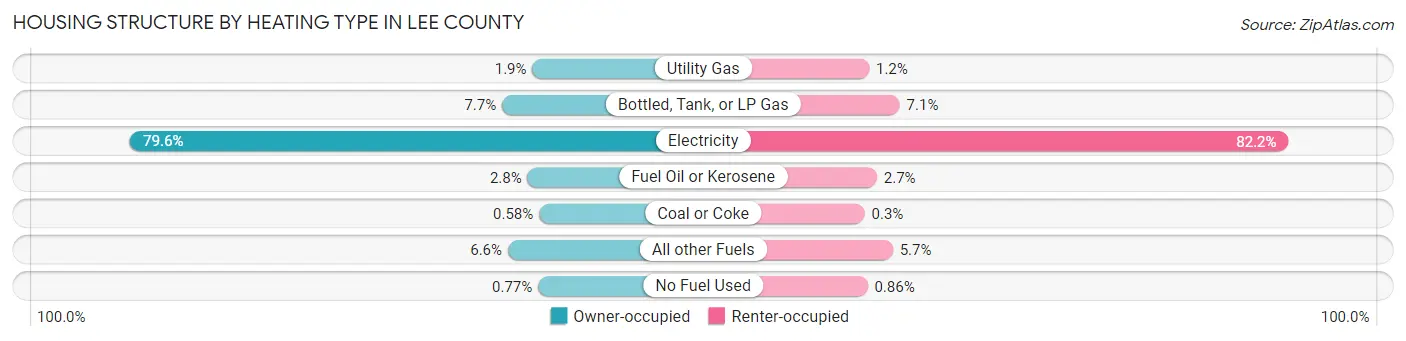
| Heating Type | Owner-occupied | Renter-occupied |
| Utility Gas | 113 (1.9%) | 27 (1.2%) |
| Bottled, Tank, or LP Gas | 465 (7.7%) | 164 (7.1%) |
| Electricity | 4,781 (79.6%) | 1,905 (82.2%) |
| Fuel Oil or Kerosene | 169 (2.8%) | 62 (2.7%) |
| Coal or Coke | 35 (0.6%) | 7 (0.3%) |
| All other Fuels | 397 (6.6%) | 133 (5.7%) |
| No Fuel Used | 46 (0.8%) | 20 (0.9%) |
| Total | 6,006 (100.0%) | 2,318 (100.0%) |
Household Vehicle Usage in Lee County
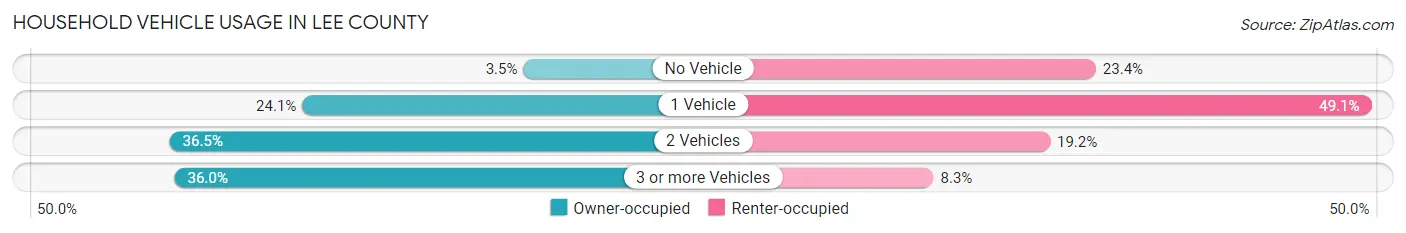
| Vehicles per Household | Owner-occupied | Renter-occupied |
| No Vehicle | 207 (3.5%) | 543 (23.4%) |
| 1 Vehicle | 1,447 (24.1%) | 1,139 (49.1%) |
| 2 Vehicles | 2,190 (36.5%) | 444 (19.2%) |
| 3 or more Vehicles | 2,162 (36.0%) | 192 (8.3%) |
| Total | 6,006 (100.0%) | 2,318 (100.0%) |
Real Estate & Mortgages in Lee County
Real Estate and Mortgage Overview in Lee County
| Characteristic | Without Mortgage | With Mortgage |
| Housing Units | 3,784 | 2,222 |
| Median Property Value | $80,900 | $121,700 |
| Median Household Income | $48,770 | $318 |
| Monthly Housing Costs | $303 | $56 |
| Real Estate Taxes | $512 | $22 |
Property Value by Mortgage Status in Lee County
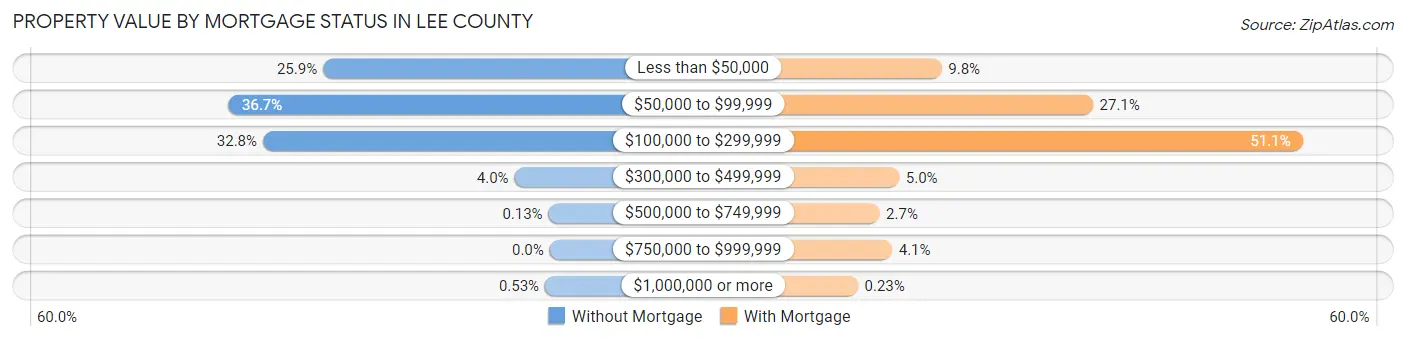
| Property Value | Without Mortgage | With Mortgage |
| Less than $50,000 | 980 (25.9%) | 218 (9.8%) |
| $50,000 to $99,999 | 1,387 (36.6%) | 602 (27.1%) |
| $100,000 to $299,999 | 1,240 (32.8%) | 1,135 (51.1%) |
| $300,000 to $499,999 | 152 (4.0%) | 110 (5.0%) |
| $500,000 to $749,999 | 5 (0.1%) | 60 (2.7%) |
| $750,000 to $999,999 | 0 (0.0%) | 92 (4.1%) |
| $1,000,000 or more | 20 (0.5%) | 5 (0.2%) |
| Total | 3,784 (100.0%) | 2,222 (100.0%) |
Household Income by Mortgage Status in Lee County
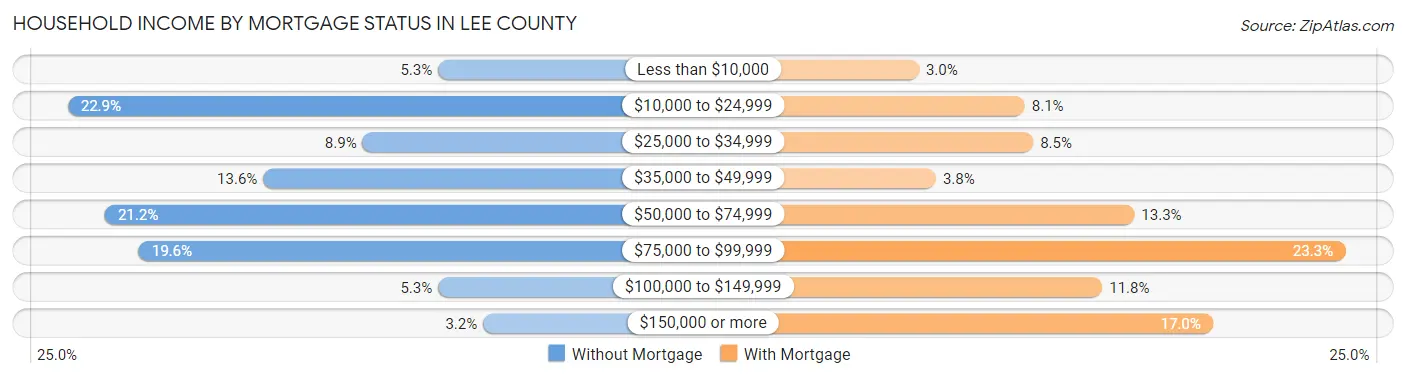
| Household Income | Without Mortgage | With Mortgage |
| Less than $10,000 | 201 (5.3%) | 67 (3.0%) |
| $10,000 to $24,999 | 868 (22.9%) | 179 (8.1%) |
| $25,000 to $34,999 | 337 (8.9%) | 188 (8.5%) |
| $35,000 to $49,999 | 516 (13.6%) | 85 (3.8%) |
| $50,000 to $74,999 | 801 (21.2%) | 295 (13.3%) |
| $75,000 to $99,999 | 740 (19.6%) | 518 (23.3%) |
| $100,000 to $149,999 | 201 (5.3%) | 261 (11.7%) |
| $150,000 or more | 120 (3.2%) | 378 (17.0%) |
| Total | 3,784 (100.0%) | 2,222 (100.0%) |
Property Value to Household Income Ratio in Lee County
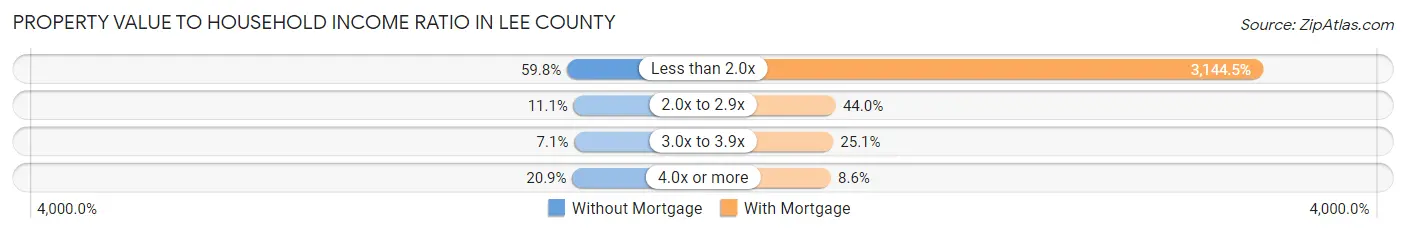
| Value-to-Income Ratio | Without Mortgage | With Mortgage |
| Less than 2.0x | 2,263 (59.8%) | 69,870 (3,144.5%) |
| 2.0x to 2.9x | 421 (11.1%) | 977 (44.0%) |
| 3.0x to 3.9x | 269 (7.1%) | 558 (25.1%) |
| 4.0x or more | 791 (20.9%) | 192 (8.6%) |
| Total | 3,784 (100.0%) | 2,222 (100.0%) |
Real Estate Taxes by Mortgage Status in Lee County
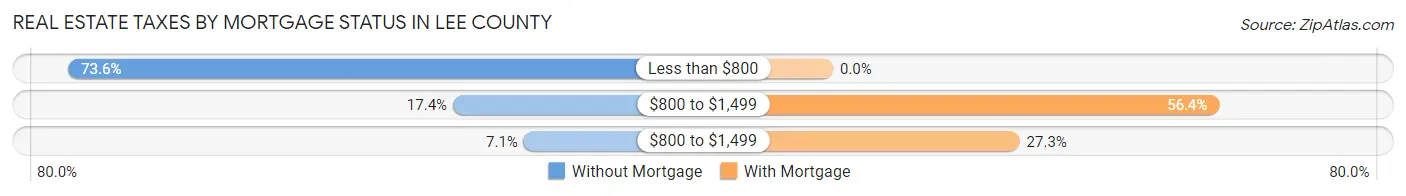
| Property Taxes | Without Mortgage | With Mortgage |
| Less than $800 | 2,786 (73.6%) | 0 (0.0%) |
| $800 to $1,499 | 659 (17.4%) | 1,254 (56.4%) |
| $800 to $1,499 | 268 (7.1%) | 606 (27.3%) |
| Total | 3,784 (100.0%) | 2,222 (100.0%) |
Health & Disability in Lee County
Health Insurance Coverage by Age in Lee County
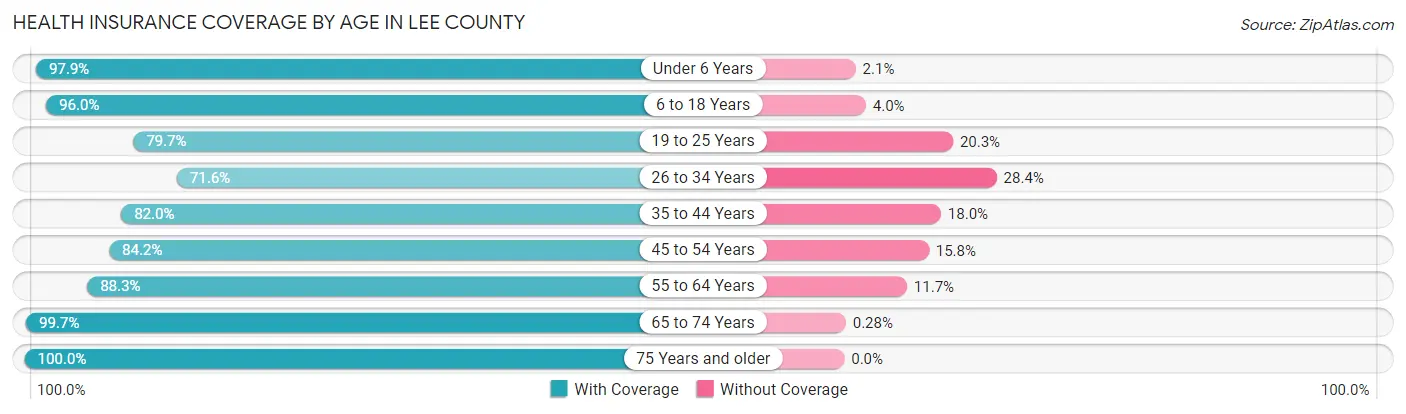
| Age Bracket | With Coverage | Without Coverage |
| Under 6 Years | 1,201 (97.9%) | 26 (2.1%) |
| 6 to 18 Years | 2,937 (96.0%) | 123 (4.0%) |
| 19 to 25 Years | 1,240 (79.7%) | 315 (20.3%) |
| 26 to 34 Years | 1,434 (71.6%) | 569 (28.4%) |
| 35 to 44 Years | 1,783 (82.0%) | 392 (18.0%) |
| 45 to 54 Years | 2,363 (84.2%) | 442 (15.8%) |
| 55 to 64 Years | 2,806 (88.3%) | 371 (11.7%) |
| 65 to 74 Years | 2,859 (99.7%) | 8 (0.3%) |
| 75 Years and older | 1,974 (100.0%) | 0 (0.0%) |
| Total | 18,597 (89.2%) | 2,246 (10.8%) |
Health Insurance Coverage by Citizenship Status in Lee County
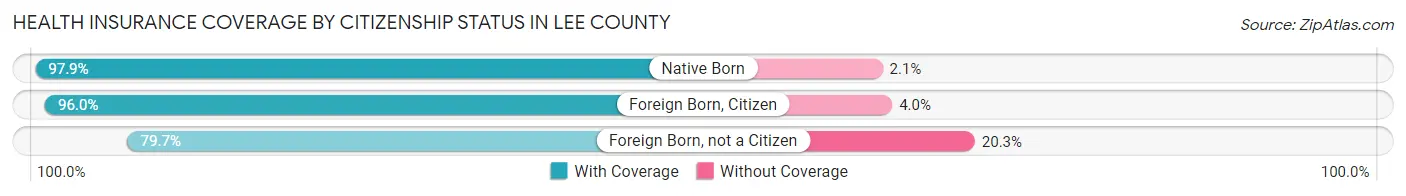
| Citizenship Status | With Coverage | Without Coverage |
| Native Born | 1,201 (97.9%) | 26 (2.1%) |
| Foreign Born, Citizen | 2,937 (96.0%) | 123 (4.0%) |
| Foreign Born, not a Citizen | 1,240 (79.7%) | 315 (20.3%) |
Health Insurance Coverage by Household Income in Lee County
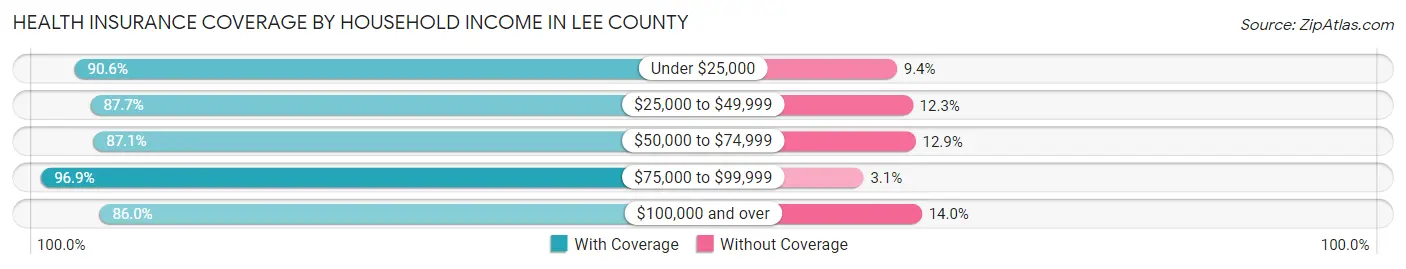
| Household Income | With Coverage | Without Coverage |
| Under $25,000 | 4,799 (90.6%) | 496 (9.4%) |
| $25,000 to $49,999 | 3,799 (87.7%) | 535 (12.3%) |
| $50,000 to $74,999 | 3,577 (87.1%) | 529 (12.9%) |
| $75,000 to $99,999 | 2,763 (96.9%) | 89 (3.1%) |
| $100,000 and over | 3,659 (86.0%) | 597 (14.0%) |
Public vs Private Health Insurance Coverage by Age in Lee County
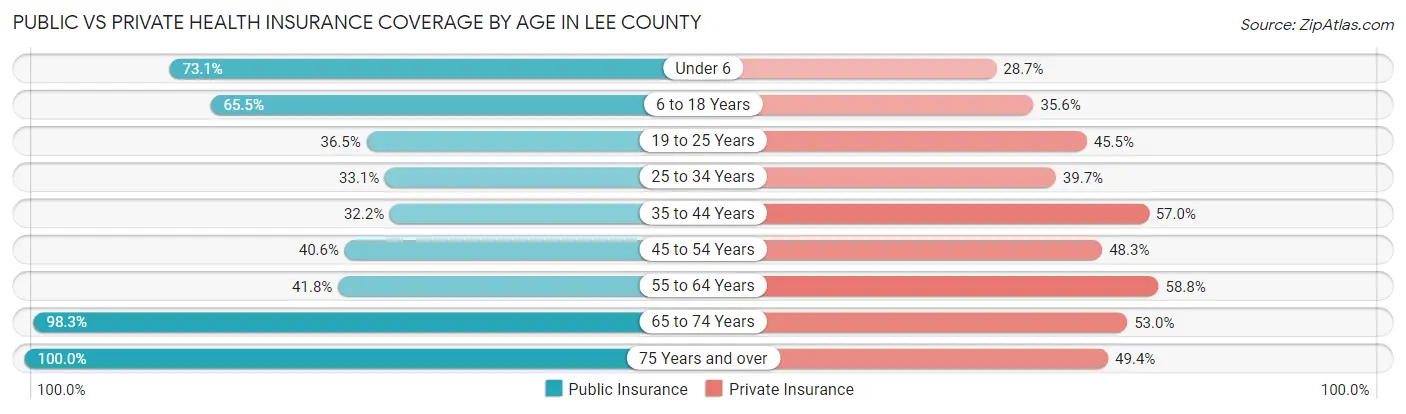
| Age Bracket | Public Insurance | Private Insurance |
| Under 6 | 897 (73.1%) | 352 (28.7%) |
| 6 to 18 Years | 2,004 (65.5%) | 1,089 (35.6%) |
| 19 to 25 Years | 568 (36.5%) | 707 (45.5%) |
| 25 to 34 Years | 663 (33.1%) | 796 (39.7%) |
| 35 to 44 Years | 700 (32.2%) | 1,239 (57.0%) |
| 45 to 54 Years | 1,138 (40.6%) | 1,356 (48.3%) |
| 55 to 64 Years | 1,328 (41.8%) | 1,868 (58.8%) |
| 65 to 74 Years | 2,819 (98.3%) | 1,519 (53.0%) |
| 75 Years and over | 1,974 (100.0%) | 976 (49.4%) |
| Total | 12,091 (58.0%) | 9,902 (47.5%) |
Disability Status by Sex by Age in Lee County
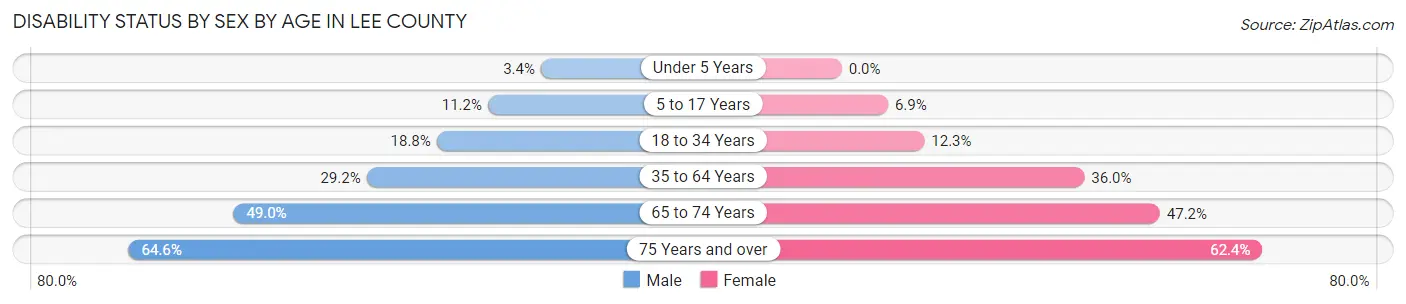
| Age Bracket | Male | Female |
| Under 5 Years | 19 (3.4%) | 0 (0.0%) |
| 5 to 17 Years | 185 (11.2%) | 102 (6.9%) |
| 18 to 34 Years | 366 (18.8%) | 213 (12.3%) |
| 35 to 64 Years | 1,171 (29.2%) | 1,495 (36.0%) |
| 65 to 74 Years | 696 (49.0%) | 683 (47.2%) |
| 75 Years and over | 561 (64.6%) | 690 (62.4%) |
Disability Class by Sex by Age in Lee County
Disability Class: Hearing Difficulty
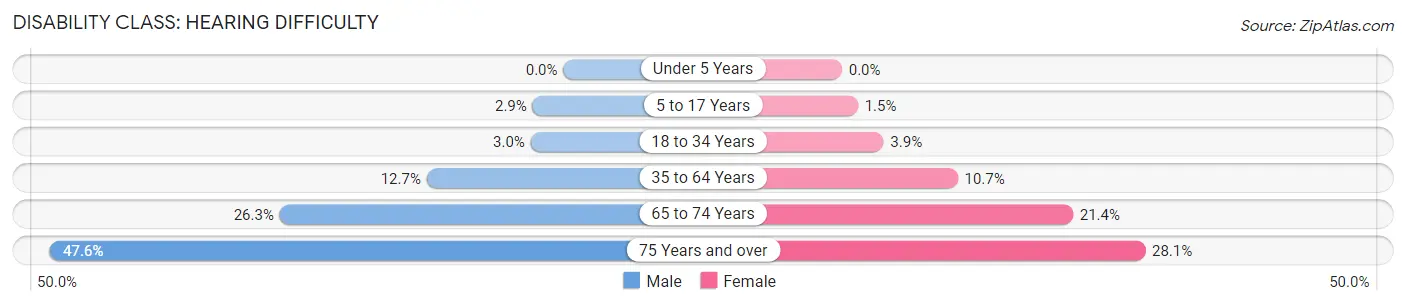
| Age Bracket | Male | Female |
| Under 5 Years | 0 (0.0%) | 0 (0.0%) |
| 5 to 17 Years | 47 (2.9%) | 22 (1.5%) |
| 18 to 34 Years | 59 (3.0%) | 67 (3.9%) |
| 35 to 64 Years | 508 (12.7%) | 446 (10.7%) |
| 65 to 74 Years | 374 (26.3%) | 310 (21.4%) |
| 75 Years and over | 414 (47.6%) | 311 (28.1%) |
Disability Class: Vision Difficulty
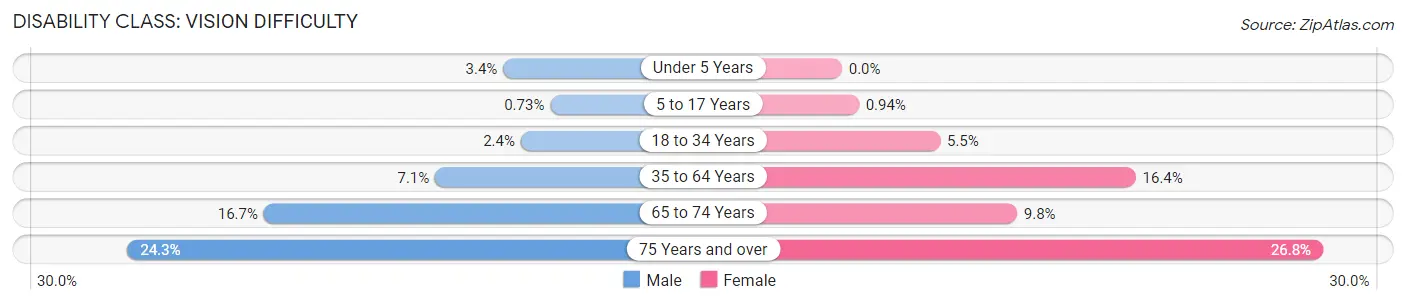
| Age Bracket | Male | Female |
| Under 5 Years | 19 (3.4%) | 0 (0.0%) |
| 5 to 17 Years | 12 (0.7%) | 14 (0.9%) |
| 18 to 34 Years | 46 (2.4%) | 95 (5.5%) |
| 35 to 64 Years | 286 (7.1%) | 679 (16.4%) |
| 65 to 74 Years | 237 (16.7%) | 141 (9.8%) |
| 75 Years and over | 211 (24.3%) | 296 (26.8%) |
Disability Class: Cognitive Difficulty
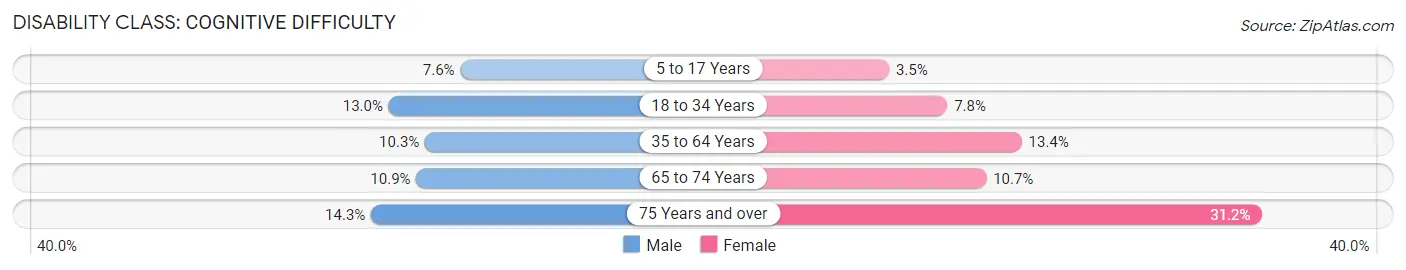
| Age Bracket | Male | Female |
| 5 to 17 Years | 126 (7.6%) | 52 (3.5%) |
| 18 to 34 Years | 252 (13.0%) | 136 (7.8%) |
| 35 to 64 Years | 411 (10.3%) | 554 (13.4%) |
| 65 to 74 Years | 155 (10.9%) | 155 (10.7%) |
| 75 Years and over | 124 (14.3%) | 345 (31.2%) |
Disability Class: Ambulatory Difficulty
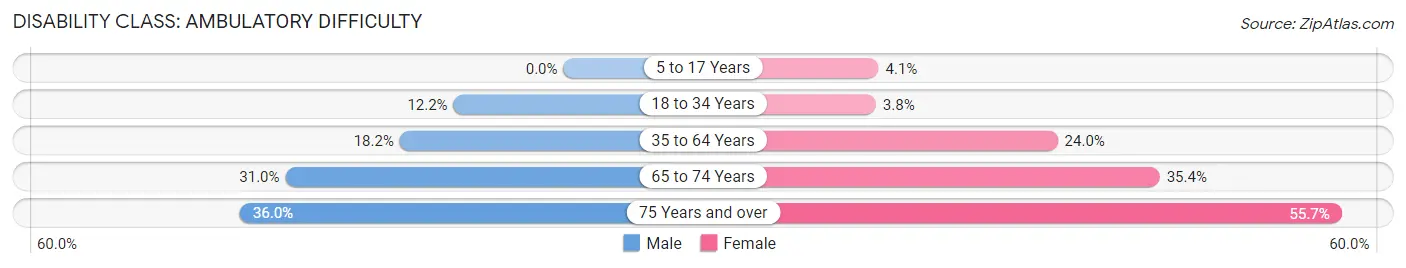
| Age Bracket | Male | Female |
| 5 to 17 Years | 0 (0.0%) | 61 (4.1%) |
| 18 to 34 Years | 238 (12.2%) | 66 (3.8%) |
| 35 to 64 Years | 730 (18.2%) | 998 (24.0%) |
| 65 to 74 Years | 440 (31.0%) | 512 (35.4%) |
| 75 Years and over | 313 (36.0%) | 615 (55.7%) |
Disability Class: Self-Care Difficulty
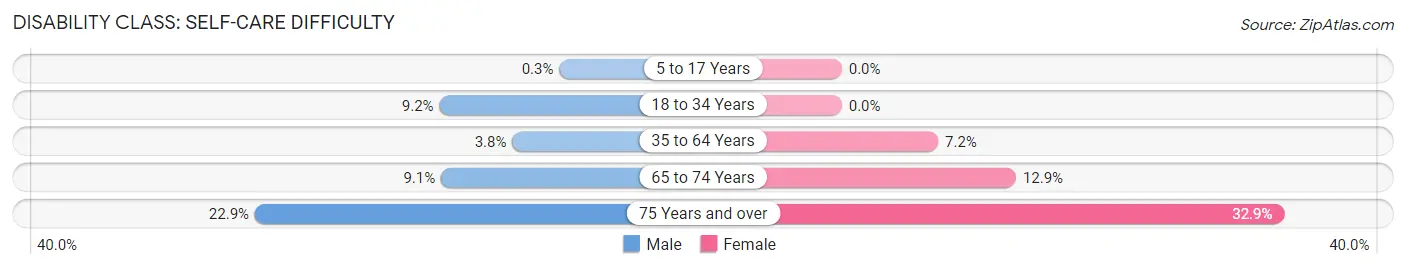
| Age Bracket | Male | Female |
| 5 to 17 Years | 5 (0.3%) | 0 (0.0%) |
| 18 to 34 Years | 179 (9.2%) | 0 (0.0%) |
| 35 to 64 Years | 152 (3.8%) | 297 (7.1%) |
| 65 to 74 Years | 129 (9.1%) | 187 (12.9%) |
| 75 Years and over | 199 (22.9%) | 363 (32.9%) |
Technology Access in Lee County
Computing Device Access in Lee County
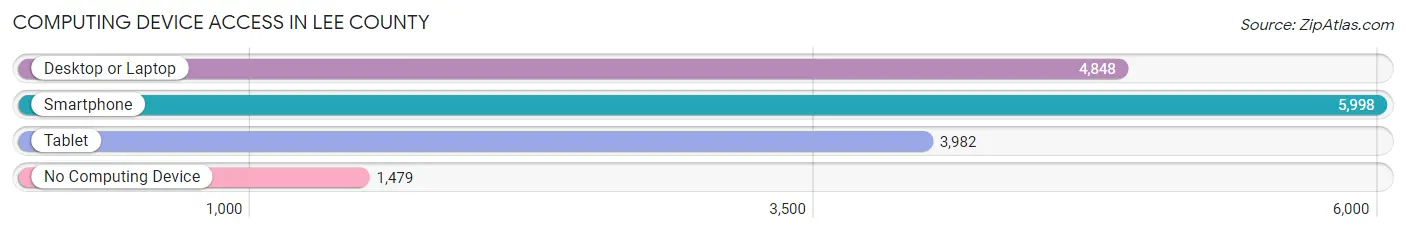
| Device Type | # Households | % Households |
| Desktop or Laptop | 4,848 | 58.2% |
| Smartphone | 5,998 | 72.1% |
| Tablet | 3,982 | 47.8% |
| No Computing Device | 1,479 | 17.8% |
| Total | 8,324 | 100.0% |
Internet Access in Lee County
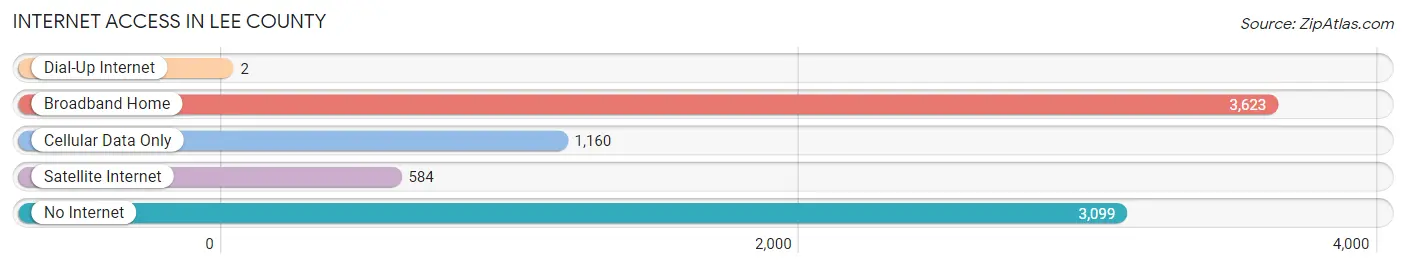
| Internet Type | # Households | % Households |
| Dial-Up Internet | 2 | 0.0% |
| Broadband Home | 3,623 | 43.5% |
| Cellular Data Only | 1,160 | 13.9% |
| Satellite Internet | 584 | 7.0% |
| No Internet | 3,099 | 37.2% |
| Total | 8,324 | 100.0% |
Lee County Summary
Lee County is located in the southwestern part of the Commonwealth of Virginia. It is bordered by Scott County to the north, Wise County to the east, and Tennessee to the south and west. The county seat is Jonesville, and the county is part of the Kingsport–Bristol–Bristol, TN–VA Metropolitan Statistical Area.
History
Lee County was formed in 1793 from parts of Russell and Scott Counties. It was named for General Charles Lee, a Revolutionary War hero. The county was originally part of the state of Franklin, which was formed in 1784 from parts of North Carolina and Virginia. The state of Franklin was dissolved in 1788, and the area became part of the state of Virginia.
The first settlers in Lee County were primarily of English and Scots-Irish descent. The county was largely agricultural, with tobacco, corn, and wheat being the main crops. The county also had a thriving timber industry, with the timber being used to build houses and barns.
Geography
Lee County is located in the Appalachian Mountains of southwestern Virginia. It is bordered by Scott County to the north, Wise County to the east, and Tennessee to the south and west. The county has a total area of 437 square miles, of which 434 square miles is land and 3 square miles is water. The county is divided into two distinct regions: the Appalachian Plateau in the east and the Cumberland Plateau in the west.
The Appalachian Plateau is characterized by rolling hills and valleys, while the Cumberland Plateau is characterized by steep ridges and narrow valleys. The highest point in the county is Big Stone Gap Mountain, which has an elevation of 3,845 feet. The county is home to several rivers, including the Clinch, Powell, and Holston Rivers.
Economy
Lee County has a diverse economy, with the largest employers being the manufacturing, retail, and healthcare industries. The county is home to several large manufacturing companies, including Eastman Chemical Company, which produces chemicals and plastics, and Alpha Natural Resources, which produces coal. The county also has a thriving retail sector, with several large shopping centers and malls.
The county is also home to several healthcare facilities, including Lee Regional Medical Center and Holston Valley Medical Center. The county is also home to several colleges and universities, including the University of Virginia's College at Wise and Mountain Empire Community College.
Demographics
As of the 2010 census, Lee County had a population of 25,587. The racial makeup of the county was 94.3% White, 2.7% Black or African American, 0.3% Native American, 0.4% Asian, 0.1% Pacific Islander, 1.2% from other races, and 1.1% from two or more races. Hispanic or Latino of any race were 2.7% of the population.
The median income for a household in the county was $35,945, and the median income for a family was $41,945. The per capita income for the county was $17,845. About 15.2% of families and 19.2% of the population were below the poverty line, including 25.2% of those under age 18 and 14.2% of those age 65 or over.
Common Questions
What is Per Capita Income in Lee County?
Per Capita income in Lee County is $23,257.
What is the Median Family Income in Lee County?
Median Family Income in Lee County is $56,954.
What is the Median Household income in Lee County?
Median Household Income in Lee County is $41,619.
What is Income or Wage Gap in Lee County?
Income or Wage Gap in Lee County is 12.4%.
Women in Lee County earn 87.6 cents for every dollar earned by a man.
What is Family Income Deficit in Lee County?
Family Income Deficit in Lee County is $10,466.
Families that are below poverty line in Lee County earn $10,466 less on average than the poverty threshold level.
What is Inequality or Gini Index in Lee County?
Inequality or Gini Index in Lee County is 0.49.
What is the Total Population of Lee County?
Total Population of Lee County is 22,287.
What is the Total Male Population of Lee County?
Total Male Population of Lee County is 11,812.
What is the Total Female Population of Lee County?
Total Female Population of Lee County is 10,475.
What is the Ratio of Males per 100 Females in Lee County?
There are 112.76 Males per 100 Females in Lee County.
What is the Ratio of Females per 100 Males in Lee County?
There are 88.68 Females per 100 Males in Lee County.
What is the Median Population Age in Lee County?
Median Population Age in Lee County is 45.2 Years.
What is the Average Family Size in Lee County
Average Family Size in Lee County is 3.1 People.
What is the Average Household Size in Lee County
Average Household Size in Lee County is 2.5 People.
How Large is the Labor Force in Lee County?
There are 7,825 People in the Labor Forcein in Lee County.
What is the Percentage of People in the Labor Force in Lee County?
41.9% of People are in the Labor Force in Lee County.
What is the Unemployment Rate in Lee County?
Unemployment Rate in Lee County is 8.1%.