Lancaster County, VA Map & Demographics
Lancaster County Overview
$46,405
PER CAPITA INCOME
$85,441
AVG FAMILY INCOME
$62,674
AVG HOUSEHOLD INCOME
22.1%
WAGE / INCOME GAP [ % ]
77.9¢/ $1
WAGE / INCOME GAP [ $ ]
$5,913
FAMILY INCOME DEFICIT
0.51
INEQUALITY / GINI INDEX
10,866
TOTAL POPULATION
5,325
MALE POPULATION
5,541
FEMALE POPULATION
96.10
MALES / 100 FEMALES
104.06
FEMALES / 100 MALES
59.2
MEDIAN AGE
2.9
AVG FAMILY SIZE
2.0
AVG HOUSEHOLD SIZE
4,432
LABOR FORCE [ PEOPLE ]
46.4%
PERCENT IN LABOR FORCE
9.3%
UNEMPLOYMENT RATE
Lancaster County Area Codes
Income in Lancaster County
Income Overview in Lancaster County
Per Capita Income in Lancaster County is $46,405, while median incomes of families and households are $85,441 and $62,674 respectively.
| Characteristic | Number | Measure |
| Per Capita Income | 10,866 | $46,405 |
| Median Family Income | 2,738 | $85,441 |
| Mean Family Income | 2,738 | $125,636 |
| Median Household Income | 5,238 | $62,674 |
| Mean Household Income | 5,238 | $93,271 |
| Income Deficit | 2,738 | $5,913 |
| Wage / Income Gap (%) | 10,866 | 22.09% |
| Wage / Income Gap ($) | 10,866 | 77.91¢ per $1 |
| Gini / Inequality Index | 10,866 | 0.51 |
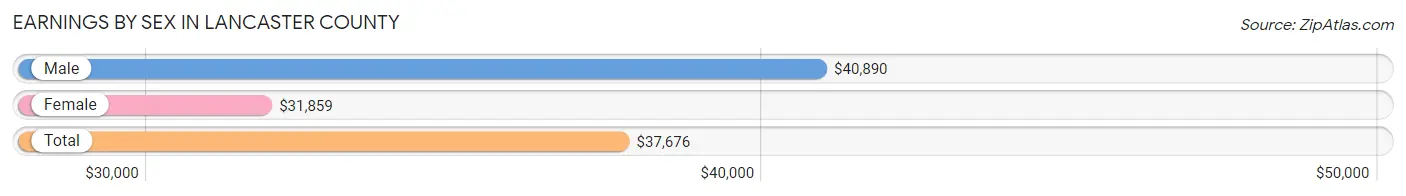
Earnings by Sex in Lancaster County
Average Earnings in Lancaster County are $37,676, $40,890 for men and $31,859 for women, a difference of 22.1%.
| Sex | Number | Average Earnings |
| Male | 2,411 (50.0%) | $40,890 |
| Female | 2,408 (50.0%) | $31,859 |
| Total | 4,819 (100.0%) | $37,676 |
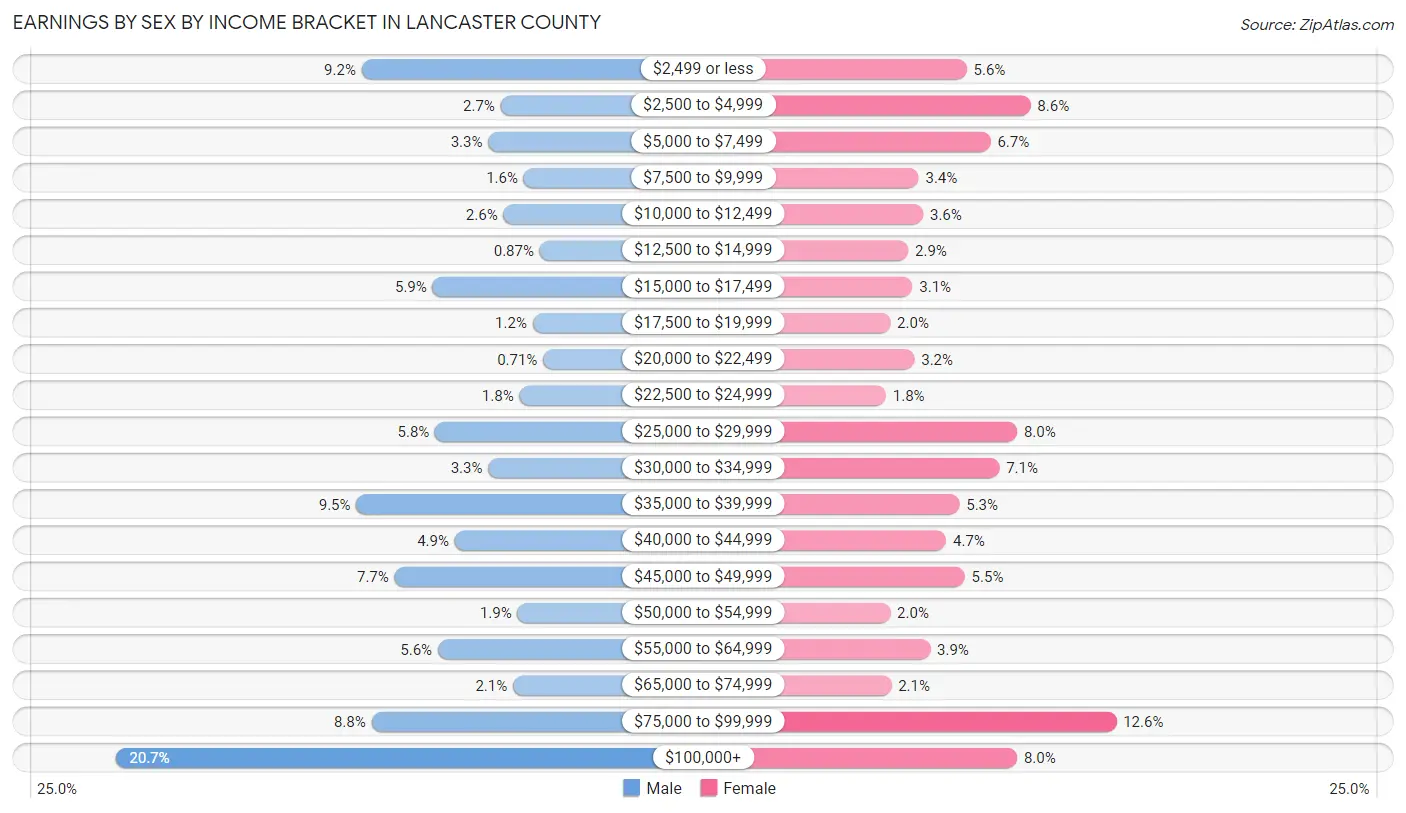
Earnings by Sex by Income Bracket in Lancaster County
The most common earnings brackets in Lancaster County are $100,000+ for men (499 | 20.7%) and $75,000 to $99,999 for women (304 | 12.6%).
| Income | Male | Female |
| $2,499 or less | 222 (9.2%) | 135 (5.6%) |
| $2,500 to $4,999 | 65 (2.7%) | 207 (8.6%) |
| $5,000 to $7,499 | 79 (3.3%) | 162 (6.7%) |
| $7,500 to $9,999 | 39 (1.6%) | 81 (3.4%) |
| $10,000 to $12,499 | 62 (2.6%) | 86 (3.6%) |
| $12,500 to $14,999 | 21 (0.9%) | 69 (2.9%) |
| $15,000 to $17,499 | 142 (5.9%) | 74 (3.1%) |
| $17,500 to $19,999 | 29 (1.2%) | 49 (2.0%) |
| $20,000 to $22,499 | 17 (0.7%) | 76 (3.2%) |
| $22,500 to $24,999 | 44 (1.8%) | 44 (1.8%) |
| $25,000 to $29,999 | 139 (5.8%) | 192 (8.0%) |
| $30,000 to $34,999 | 79 (3.3%) | 172 (7.1%) |
| $35,000 to $39,999 | 228 (9.5%) | 127 (5.3%) |
| $40,000 to $44,999 | 117 (4.9%) | 112 (4.6%) |
| $45,000 to $49,999 | 185 (7.7%) | 133 (5.5%) |
| $50,000 to $54,999 | 46 (1.9%) | 49 (2.0%) |
| $55,000 to $64,999 | 136 (5.6%) | 94 (3.9%) |
| $65,000 to $74,999 | 51 (2.1%) | 50 (2.1%) |
| $75,000 to $99,999 | 211 (8.7%) | 304 (12.6%) |
| $100,000+ | 499 (20.7%) | 192 (8.0%) |
| Total | 2,411 (100.0%) | 2,408 (100.0%) |
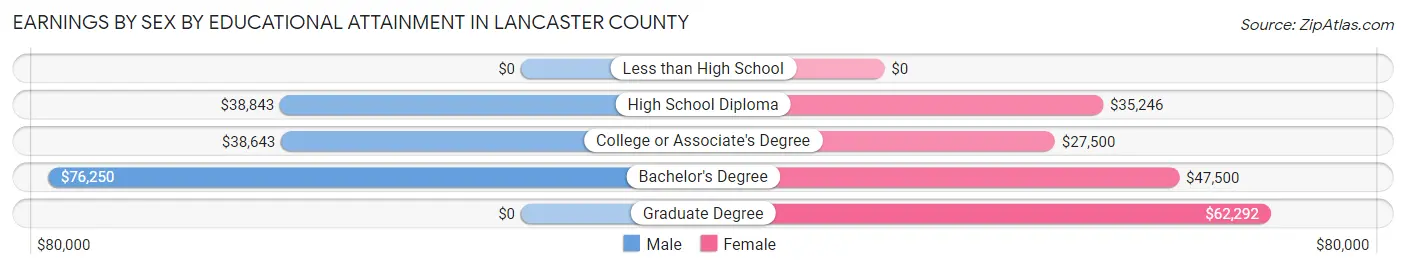
Earnings by Sex by Educational Attainment in Lancaster County
Average earnings in Lancaster County are $42,309 for men and $34,774 for women, a difference of 17.8%. Men with an educational attainment of bachelor's degree enjoy the highest average annual earnings of $76,250, while those with college or associate's degree education earn the least with $38,643. Women with an educational attainment of graduate degree earn the most with the average annual earnings of $62,292, while those with college or associate's degree education have the smallest earnings of $27,500.
| Educational Attainment | Male Income | Female Income |
| Less than High School | - | - |
| High School Diploma | $38,843 | $35,246 |
| College or Associate's Degree | $38,643 | $27,500 |
| Bachelor's Degree | $76,250 | $47,500 |
| Graduate Degree | - | - |
| Total | $42,309 | $34,774 |
Family Income in Lancaster County
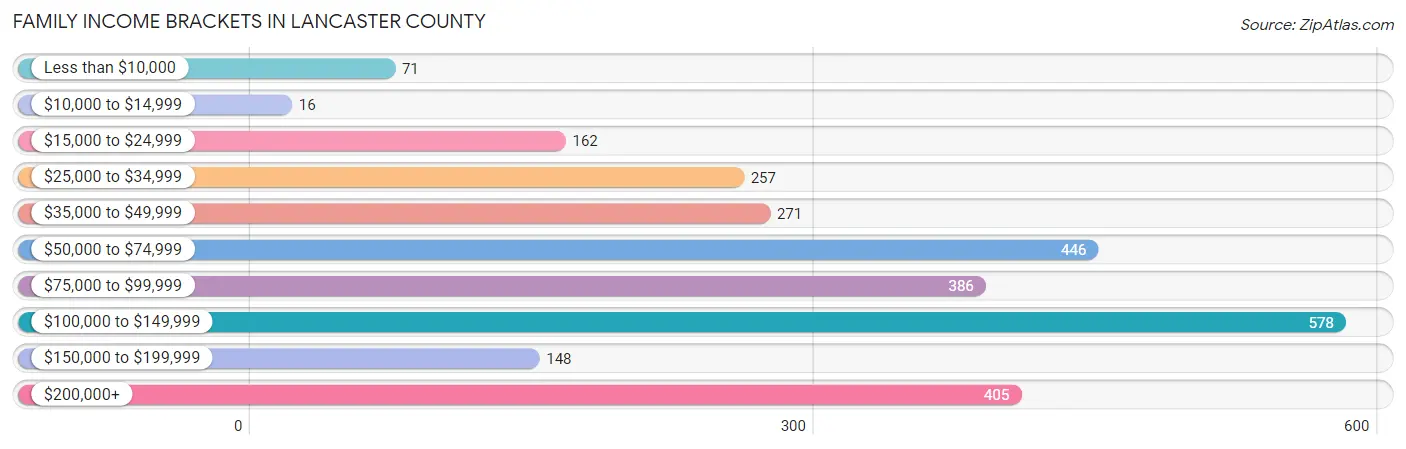
Family Income Brackets in Lancaster County
According to the Lancaster County family income data, there are 578 families falling into the $100,000 to $149,999 income range, which is the most common income bracket and makes up 21.1% of all families. Conversely, the $10,000 to $14,999 income bracket is the least frequent group with only 16 families (0.6%) belonging to this category.
| Income Bracket | # Families | % Families |
| Less than $10,000 | 71 | 2.6% |
| $10,000 to $14,999 | 16 | 0.6% |
| $15,000 to $24,999 | 162 | 5.9% |
| $25,000 to $34,999 | 257 | 9.4% |
| $35,000 to $49,999 | 271 | 9.9% |
| $50,000 to $74,999 | 446 | 16.3% |
| $75,000 to $99,999 | 386 | 14.1% |
| $100,000 to $149,999 | 578 | 21.1% |
| $150,000 to $199,999 | 148 | 5.4% |
| $200,000+ | 405 | 14.8% |
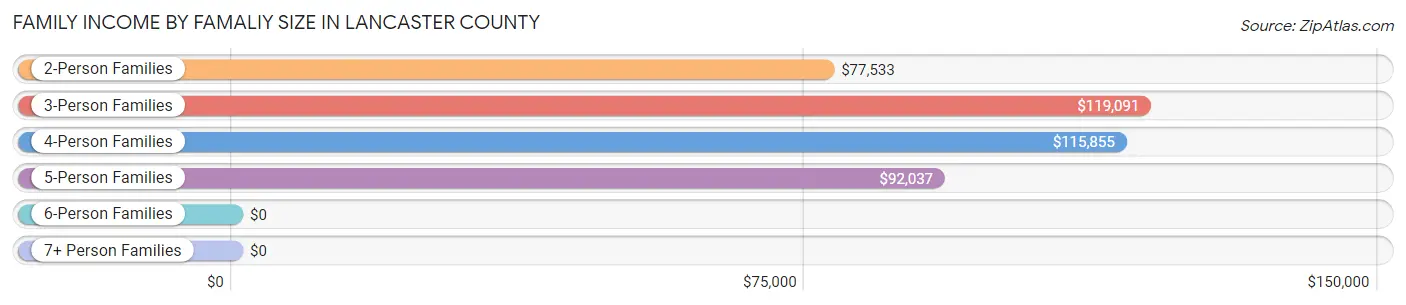
Family Income by Famaliy Size in Lancaster County
3-person families (466 | 17.0%) account for the highest median family income in Lancaster County with $119,091 per family, while 3-person families (466 | 17.0%) have the highest median income of $39,697 per family member.
| Income Bracket | # Families | Median Income |
| 2-Person Families | 1,847 (67.5%) | $77,533 |
| 3-Person Families | 466 (17.0%) | $119,091 |
| 4-Person Families | 175 (6.4%) | $115,855 |
| 5-Person Families | 214 (7.8%) | $92,037 |
| 6-Person Families | 27 (1.0%) | $0 |
| 7+ Person Families | 9 (0.3%) | $0 |
| Total | 2,738 (100.0%) | $85,441 |
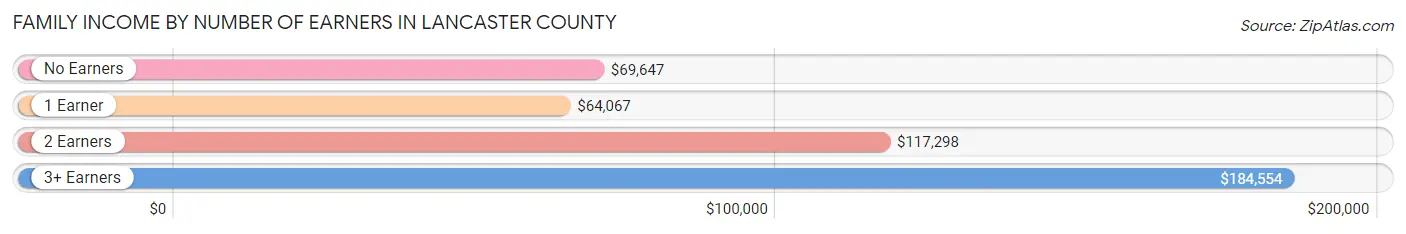
Family Income by Number of Earners in Lancaster County
The median family income in Lancaster County is $85,441, with families comprising 3+ earners (146) having the highest median family income of $184,554, while families with 1 earner (882) have the lowest median family income of $64,067, accounting for 5.3% and 32.2% of families, respectively.
| Number of Earners | # Families | Median Income |
| No Earners | 775 (28.3%) | $69,647 |
| 1 Earner | 882 (32.2%) | $64,067 |
| 2 Earners | 935 (34.2%) | $117,298 |
| 3+ Earners | 146 (5.3%) | $184,554 |
| Total | 2,738 (100.0%) | $85,441 |
Household Income in Lancaster County
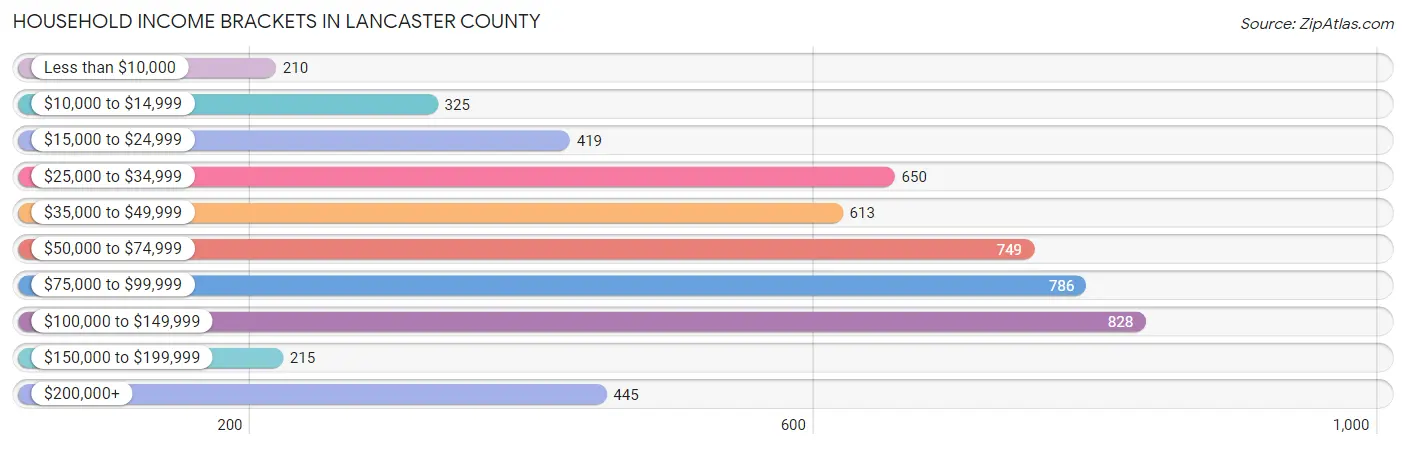
Household Income Brackets in Lancaster County
With 828 households falling in the category, the $100,000 to $149,999 income range is the most frequent in Lancaster County, accounting for 15.8% of all households. In contrast, only 210 households (4.0%) fall into the less than $10,000 income bracket, making it the least populous group.
| Income Bracket | # Households | % Households |
| Less than $10,000 | 210 | 4.0% |
| $10,000 to $14,999 | 325 | 6.2% |
| $15,000 to $24,999 | 419 | 8.0% |
| $25,000 to $34,999 | 650 | 12.4% |
| $35,000 to $49,999 | 613 | 11.7% |
| $50,000 to $74,999 | 749 | 14.3% |
| $75,000 to $99,999 | 786 | 15.0% |
| $100,000 to $149,999 | 828 | 15.8% |
| $150,000 to $199,999 | 215 | 4.1% |
| $200,000+ | 445 | 8.5% |
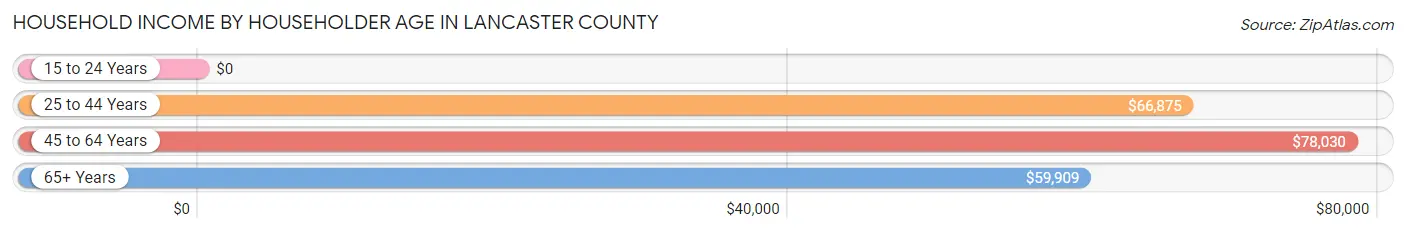
Household Income by Householder Age in Lancaster County
The median household income in Lancaster County is $62,674, with the highest median household income of $78,030 found in the 45 to 64 years age bracket for the primary householder. A total of 1,728 households (33.0%) fall into this category. Meanwhile, the 15 to 24 years age bracket for the primary householder has the lowest median household income of $0, with 8 households (0.2%) in this group.
| Income Bracket | # Households | Median Income |
| 15 to 24 Years | 8 (0.2%) | $0 |
| 25 to 44 Years | 598 (11.4%) | $66,875 |
| 45 to 64 Years | 1,728 (33.0%) | $78,030 |
| 65+ Years | 2,904 (55.4%) | $59,909 |
| Total | 5,238 (100.0%) | $62,674 |
Poverty in Lancaster County
Income Below Poverty by Sex and Age in Lancaster County
With 10.8% poverty level for males and 17.1% for females among the residents of Lancaster County, 5 year old males and 16 and 17 year old females are the most vulnerable to poverty, with 86 males (90.5%) and 86 females (54.4%) in their respective age groups living below the poverty level.
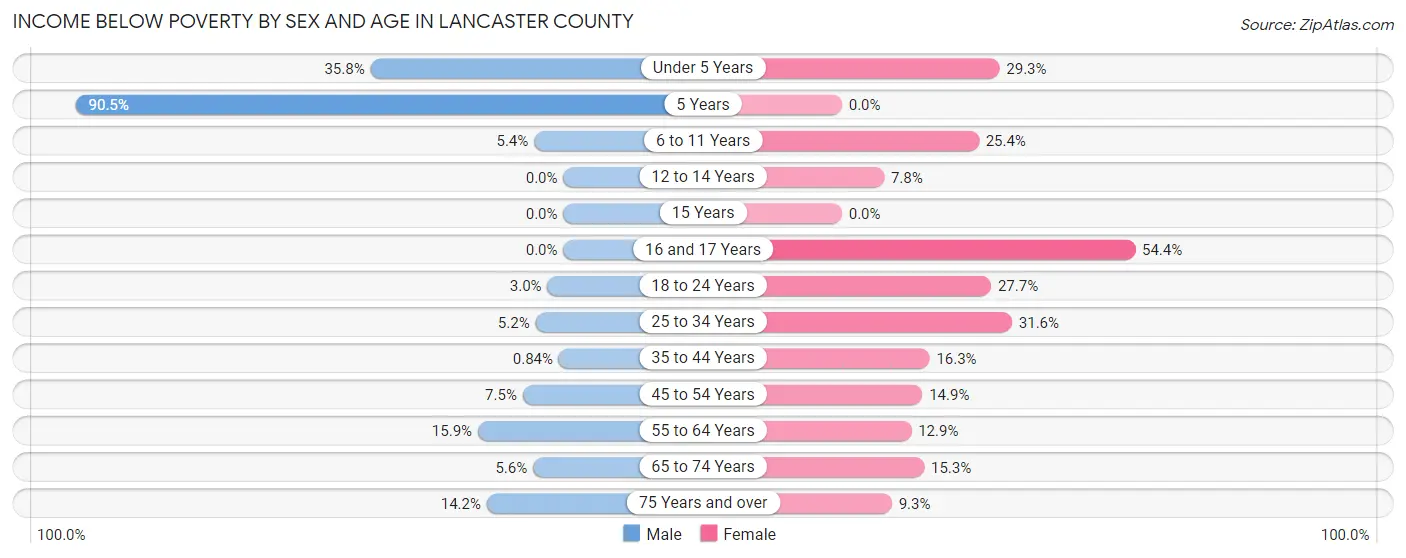
| Age Bracket | Male | Female |
| Under 5 Years | 87 (35.8%) | 31 (29.2%) |
| 5 Years | 86 (90.5%) | 0 (0.0%) |
| 6 to 11 Years | 13 (5.4%) | 62 (25.4%) |
| 12 to 14 Years | 0 (0.0%) | 9 (7.8%) |
| 15 Years | 0 (0.0%) | 0 (0.0%) |
| 16 and 17 Years | 0 (0.0%) | 86 (54.4%) |
| 18 to 24 Years | 8 (2.9%) | 72 (27.7%) |
| 25 to 34 Years | 15 (5.2%) | 125 (31.6%) |
| 35 to 44 Years | 4 (0.8%) | 48 (16.3%) |
| 45 to 54 Years | 39 (7.5%) | 100 (14.9%) |
| 55 to 64 Years | 125 (15.9%) | 125 (12.9%) |
| 65 to 74 Years | 62 (5.6%) | 173 (15.3%) |
| 75 Years and over | 129 (14.2%) | 90 (9.3%) |
| Total | 568 (10.8%) | 921 (17.1%) |
Income Above Poverty by Sex and Age in Lancaster County
According to the poverty statistics in Lancaster County, males aged 12 to 14 years and females aged 5 years are the age groups that are most secure financially, with 100.0% of males and 100.0% of females in these age groups living above the poverty line.
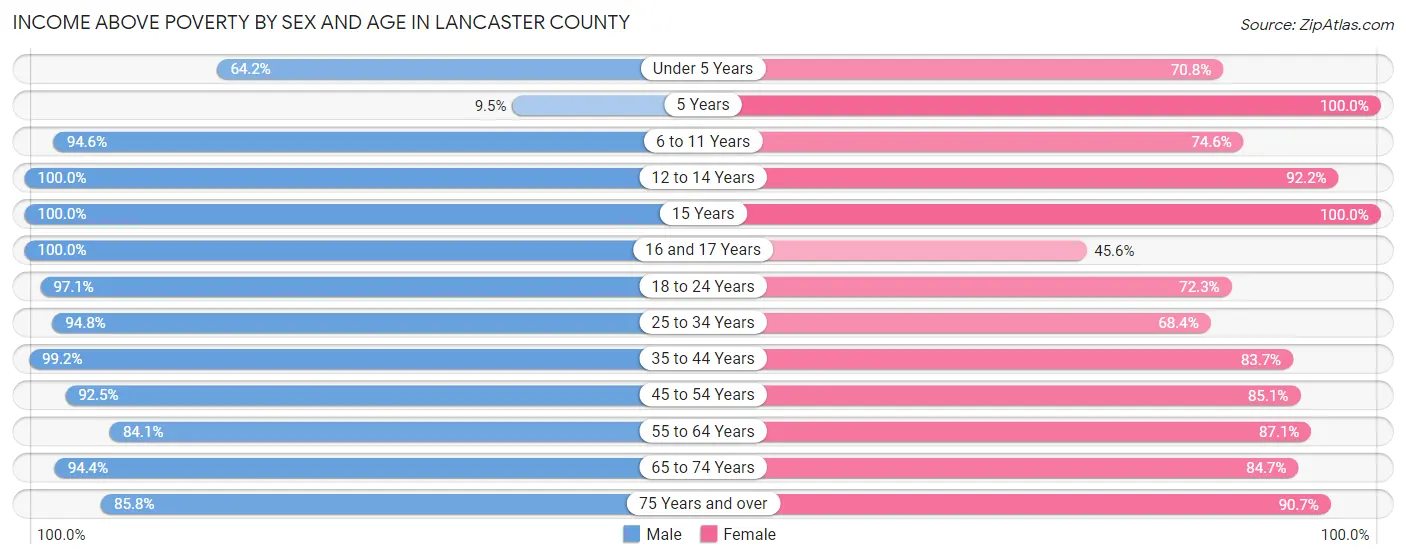
| Age Bracket | Male | Female |
| Under 5 Years | 156 (64.2%) | 75 (70.8%) |
| 5 Years | 9 (9.5%) | 22 (100.0%) |
| 6 to 11 Years | 227 (94.6%) | 182 (74.6%) |
| 12 to 14 Years | 175 (100.0%) | 106 (92.2%) |
| 15 Years | 18 (100.0%) | 46 (100.0%) |
| 16 and 17 Years | 123 (100.0%) | 72 (45.6%) |
| 18 to 24 Years | 263 (97.1%) | 188 (72.3%) |
| 25 to 34 Years | 275 (94.8%) | 271 (68.4%) |
| 35 to 44 Years | 470 (99.2%) | 247 (83.7%) |
| 45 to 54 Years | 478 (92.5%) | 570 (85.1%) |
| 55 to 64 Years | 663 (84.1%) | 845 (87.1%) |
| 65 to 74 Years | 1,041 (94.4%) | 960 (84.7%) |
| 75 Years and over | 779 (85.8%) | 882 (90.7%) |
| Total | 4,677 (89.2%) | 4,466 (82.9%) |
Income Below Poverty Among Married-Couple Families in Lancaster County
The poverty statistics for married-couple families in Lancaster County show that 6.0% or 138 of the total 2,294 families live below the poverty line. Families with 3 or 4 children have the highest poverty rate of 25.8%, comprising of 17 families. On the other hand, families with 1 or 2 children have the lowest poverty rate of 0.0%, which includes 0 families.
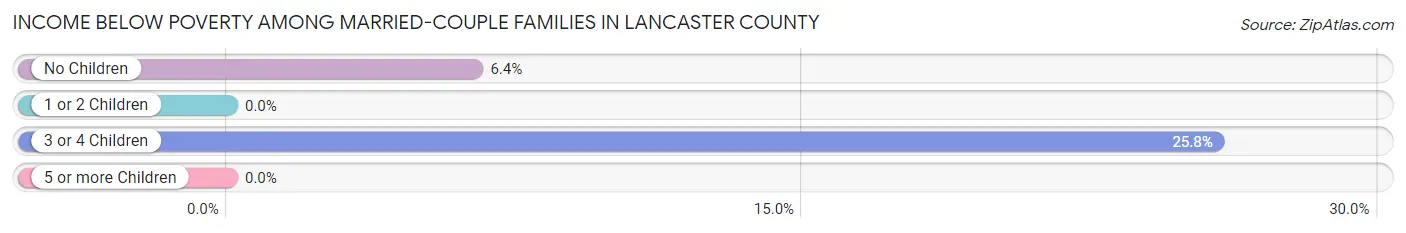
| Children | Above Poverty | Below Poverty |
| No Children | 1,768 (93.6%) | 121 (6.4%) |
| 1 or 2 Children | 339 (100.0%) | 0 (0.0%) |
| 3 or 4 Children | 49 (74.2%) | 17 (25.8%) |
| 5 or more Children | 0 (0.0%) | 0 (0.0%) |
| Total | 2,156 (94.0%) | 138 (6.0%) |
Income Below Poverty Among Single-Parent Households in Lancaster County
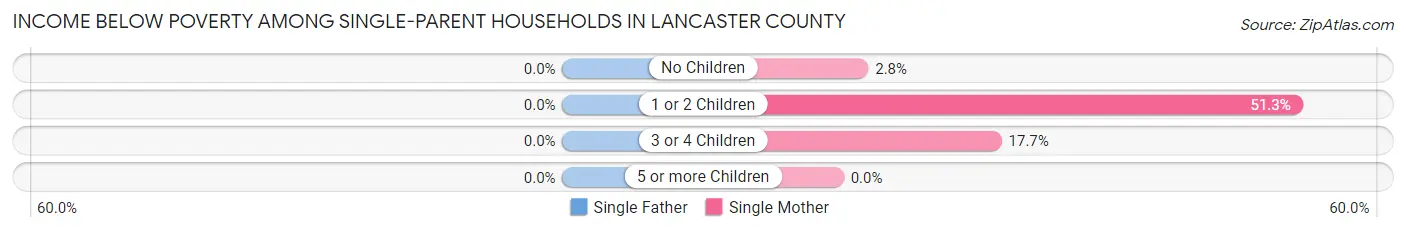
| Children | Single Father | Single Mother |
| No Children | 0 (0.0%) | 3 (2.8%) |
| 1 or 2 Children | 0 (0.0%) | 120 (51.3%) |
| 3 or 4 Children | 0 (0.0%) | 6 (17.6%) |
| 5 or more Children | 0 (0.0%) | 0 (0.0%) |
| Total | 0 (0.0%) | 129 (33.9%) |
Income Below Poverty Among Married-Couple vs Single-Parent Households in Lancaster County
The poverty data for Lancaster County shows that 138 of the married-couple family households (6.0%) and 129 of the single-parent households (29.0%) are living below the poverty level. Within the married-couple family households, those with 3 or 4 children have the highest poverty rate, with 17 households (25.8%) falling below the poverty line. Among the single-parent households, those with 1 or 2 children have the highest poverty rate, with 120 household (42.1%) living below poverty.
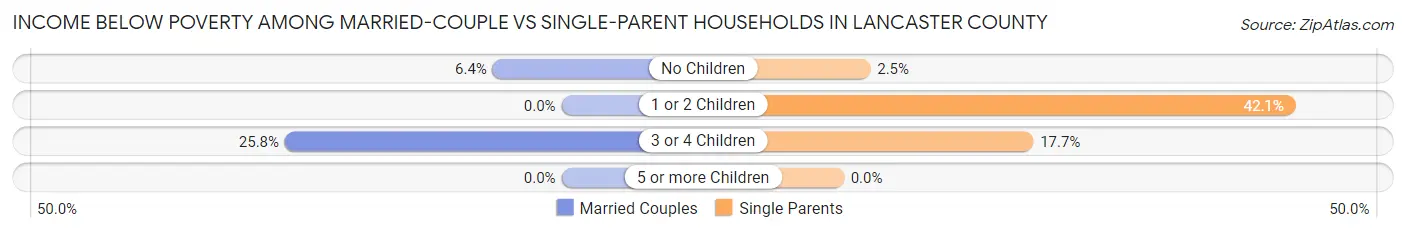
| Children | Married-Couple Families | Single-Parent Households |
| No Children | 121 (6.4%) | 3 (2.5%) |
| 1 or 2 Children | 0 (0.0%) | 120 (42.1%) |
| 3 or 4 Children | 17 (25.8%) | 6 (17.6%) |
| 5 or more Children | 0 (0.0%) | 0 (0.0%) |
| Total | 138 (6.0%) | 129 (29.0%) |
Race in Lancaster County
The most populous races in Lancaster County are White / Caucasian (7,304 | 67.2%), Black / African American (2,996 | 27.6%), and Two or more Races (320 | 2.9%).
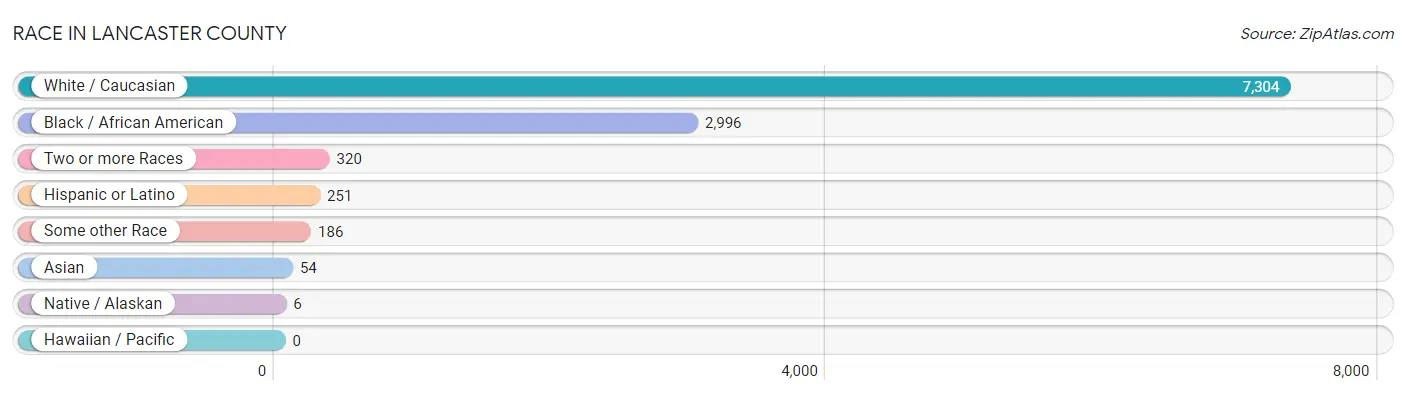
| Race | # Population | % Population |
| Asian | 54 | 0.5% |
| Black / African American | 2,996 | 27.6% |
| Hawaiian / Pacific | 0 | 0.0% |
| Hispanic or Latino | 251 | 2.3% |
| Native / Alaskan | 6 | 0.1% |
| White / Caucasian | 7,304 | 67.2% |
| Two or more Races | 320 | 2.9% |
| Some other Race | 186 | 1.7% |
| Total | 10,866 | 100.0% |
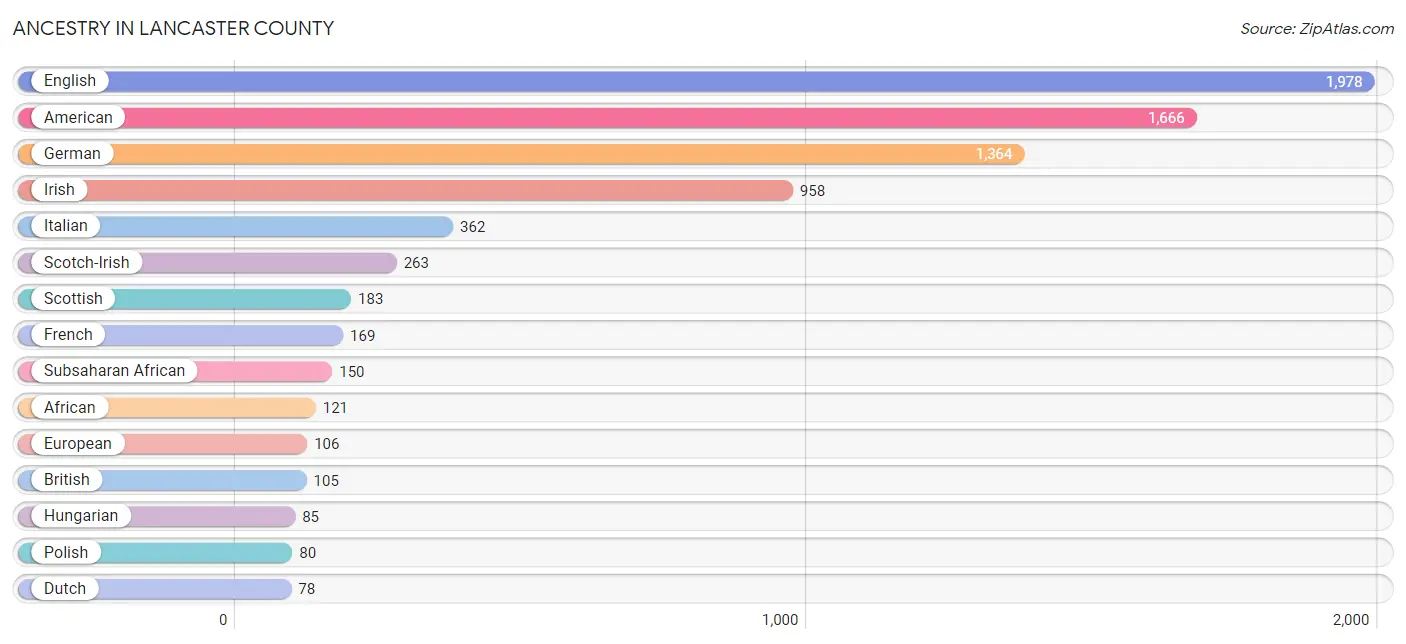
Ancestry in Lancaster County
The most populous ancestries reported in Lancaster County are English (1,978 | 18.2%), American (1,666 | 15.3%), German (1,364 | 12.6%), Irish (958 | 8.8%), and Italian (362 | 3.3%), together accounting for 58.2% of all Lancaster County residents.
| Ancestry | # Population | % Population |
| African | 121 | 1.1% |
| American | 1,666 | 15.3% |
| Arab | 16 | 0.2% |
| Armenian | 8 | 0.1% |
| Australian | 9 | 0.1% |
| Austrian | 4 | 0.0% |
| British | 105 | 1.0% |
| Burmese | 3 | 0.0% |
| Canadian | 4 | 0.0% |
| Central American | 33 | 0.3% |
| Chickasaw | 5 | 0.1% |
| Colombian | 13 | 0.1% |
| Croatian | 7 | 0.1% |
| Cuban | 1 | 0.0% |
| Czech | 18 | 0.2% |
| Czechoslovakian | 4 | 0.0% |
| Danish | 18 | 0.2% |
| Dutch | 78 | 0.7% |
| Eastern European | 10 | 0.1% |
| English | 1,978 | 18.2% |
| Estonian | 7 | 0.1% |
| European | 106 | 1.0% |
| French | 169 | 1.6% |
| French Canadian | 37 | 0.3% |
| German | 1,364 | 12.6% |
| Greek | 6 | 0.1% |
| Guatemalan | 1 | 0.0% |
| Honduran | 25 | 0.2% |
| Hungarian | 85 | 0.8% |
| Icelander | 2 | 0.0% |
| Indian (Asian) | 57 | 0.5% |
| Irish | 958 | 8.8% |
| Italian | 362 | 3.3% |
| Jamaican | 4 | 0.0% |
| Korean | 4 | 0.0% |
| Lebanese | 2 | 0.0% |
| Lithuanian | 63 | 0.6% |
| Mexican | 60 | 0.5% |
| Moroccan | 3 | 0.0% |
| Nicaraguan | 7 | 0.1% |
| Northern European | 28 | 0.3% |
| Norwegian | 10 | 0.1% |
| Pakistani | 11 | 0.1% |
| Peruvian | 5 | 0.1% |
| Polish | 80 | 0.7% |
| Puerto Rican | 14 | 0.1% |
| Russian | 34 | 0.3% |
| Scandinavian | 17 | 0.2% |
| Scotch-Irish | 263 | 2.4% |
| Scottish | 183 | 1.7% |
| Sierra Leonean | 14 | 0.1% |
| Slovak | 2 | 0.0% |
| South African | 15 | 0.1% |
| South American | 29 | 0.3% |
| Spaniard | 12 | 0.1% |
| Sri Lankan | 46 | 0.4% |
| Subsaharan African | 150 | 1.4% |
| Swedish | 51 | 0.5% |
| Swiss | 41 | 0.4% |
| Syrian | 11 | 0.1% |
| Thai | 3 | 0.0% |
| Ukrainian | 9 | 0.1% |
| Uruguayan | 11 | 0.1% |
| Welsh | 36 | 0.3% | View All 64 Rows |
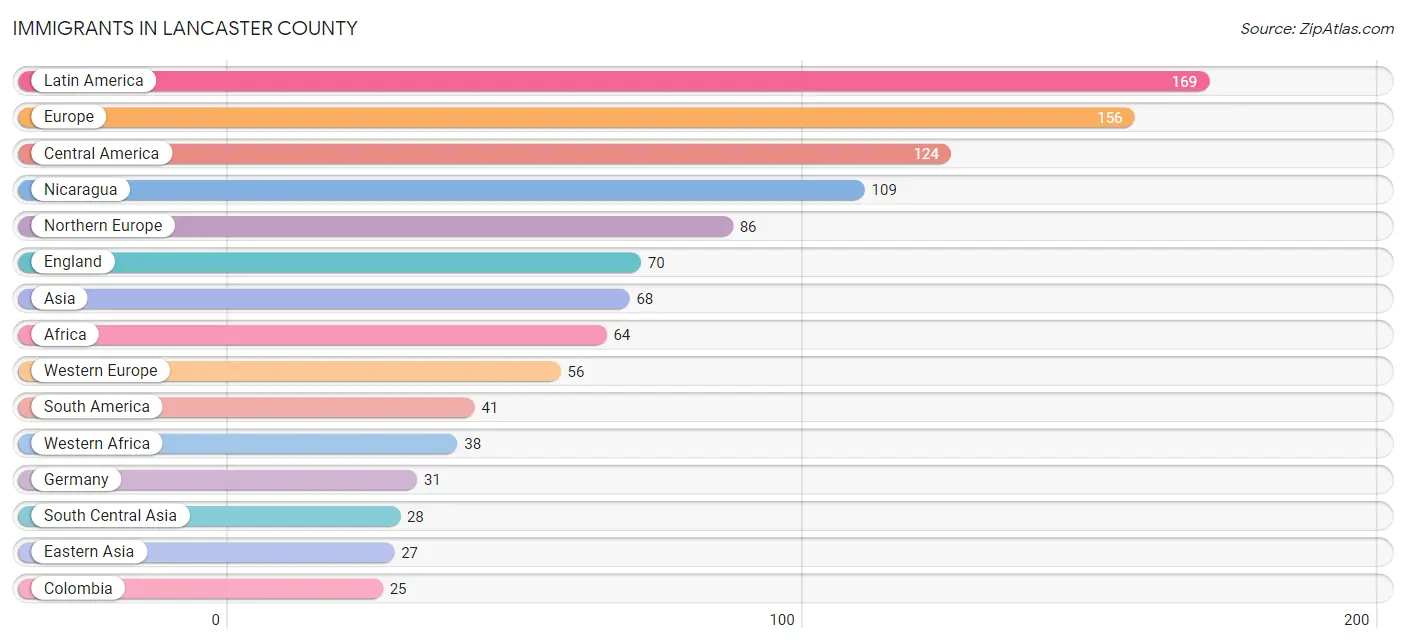
Immigrants in Lancaster County
The most numerous immigrant groups reported in Lancaster County came from Latin America (169 | 1.6%), Europe (156 | 1.4%), Central America (124 | 1.1%), Nicaragua (109 | 1.0%), and Northern Europe (86 | 0.8%), together accounting for 5.9% of all Lancaster County residents.
| Immigration Origin | # Population | % Population |
| Africa | 64 | 0.6% |
| Asia | 68 | 0.6% |
| Australia | 15 | 0.1% |
| Canada | 24 | 0.2% |
| Caribbean | 4 | 0.0% |
| Central America | 124 | 1.1% |
| China | 18 | 0.2% |
| Colombia | 25 | 0.2% |
| Eastern Asia | 27 | 0.3% |
| Eastern Europe | 14 | 0.1% |
| England | 70 | 0.6% |
| Europe | 156 | 1.4% |
| Germany | 31 | 0.3% |
| Guatemala | 2 | 0.0% |
| Honduras | 9 | 0.1% |
| India | 12 | 0.1% |
| Jamaica | 4 | 0.0% |
| Kazakhstan | 9 | 0.1% |
| Korea | 9 | 0.1% |
| Latin America | 169 | 1.6% |
| Mexico | 4 | 0.0% |
| Nicaragua | 109 | 1.0% |
| Nigeria | 24 | 0.2% |
| Northern Africa | 4 | 0.0% |
| Northern Europe | 86 | 0.8% |
| Oceania | 15 | 0.1% |
| Peru | 5 | 0.1% |
| Philippines | 2 | 0.0% |
| Serbia | 14 | 0.1% |
| Sierra Leone | 14 | 0.1% |
| South Africa | 16 | 0.2% |
| South America | 41 | 0.4% |
| South Central Asia | 28 | 0.3% |
| South Eastern Asia | 13 | 0.1% |
| Sweden | 10 | 0.1% |
| Switzerland | 25 | 0.2% |
| Thailand | 11 | 0.1% |
| Uruguay | 11 | 0.1% |
| Uzbekistan | 7 | 0.1% |
| Western Africa | 38 | 0.4% |
| Western Europe | 56 | 0.5% | View All 41 Rows |
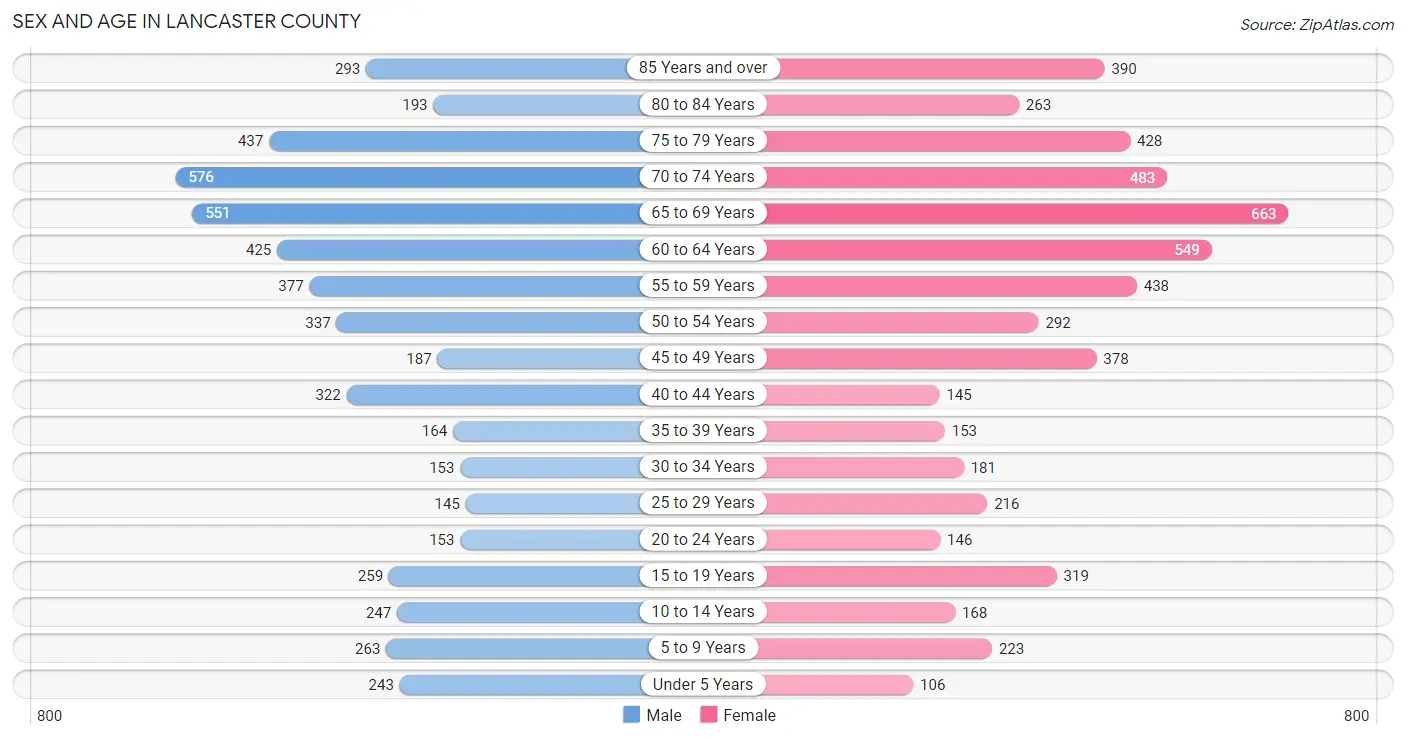
Sex and Age in Lancaster County
Sex and Age in Lancaster County
The most populous age groups in Lancaster County are 70 to 74 Years (576 | 10.8%) for men and 65 to 69 Years (663 | 12.0%) for women.
| Age Bracket | Male | Female |
| Under 5 Years | 243 (4.6%) | 106 (1.9%) |
| 5 to 9 Years | 263 (4.9%) | 223 (4.0%) |
| 10 to 14 Years | 247 (4.6%) | 168 (3.0%) |
| 15 to 19 Years | 259 (4.9%) | 319 (5.8%) |
| 20 to 24 Years | 153 (2.9%) | 146 (2.6%) |
| 25 to 29 Years | 145 (2.7%) | 216 (3.9%) |
| 30 to 34 Years | 153 (2.9%) | 181 (3.3%) |
| 35 to 39 Years | 164 (3.1%) | 153 (2.8%) |
| 40 to 44 Years | 322 (6.0%) | 145 (2.6%) |
| 45 to 49 Years | 187 (3.5%) | 378 (6.8%) |
| 50 to 54 Years | 337 (6.3%) | 292 (5.3%) |
| 55 to 59 Years | 377 (7.1%) | 438 (7.9%) |
| 60 to 64 Years | 425 (8.0%) | 549 (9.9%) |
| 65 to 69 Years | 551 (10.3%) | 663 (12.0%) |
| 70 to 74 Years | 576 (10.8%) | 483 (8.7%) |
| 75 to 79 Years | 437 (8.2%) | 428 (7.7%) |
| 80 to 84 Years | 193 (3.6%) | 263 (4.8%) |
| 85 Years and over | 293 (5.5%) | 390 (7.0%) |
| Total | 5,325 (100.0%) | 5,541 (100.0%) |
Families and Households in Lancaster County
Median Family Size in Lancaster County
The median family size in Lancaster County is 2.86 persons per family, with single female/mother families (381 | 13.9%) accounting for the largest median family size of 4.1 persons per family. On the other hand, married-couple families (2,294 | 83.8%) represent the smallest median family size with 2.63 persons per family.
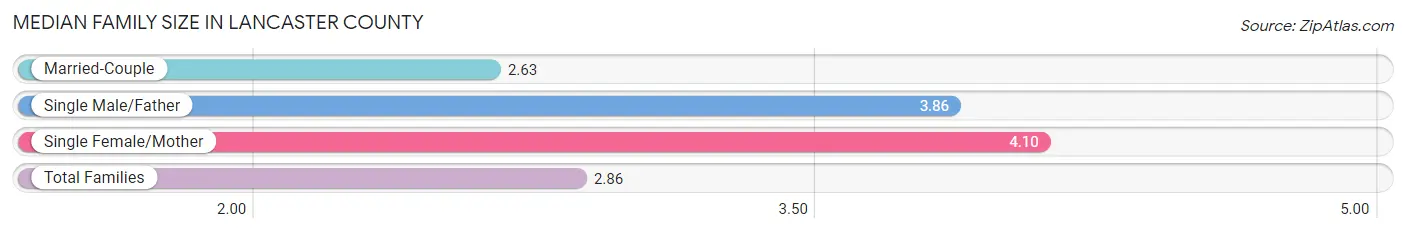
| Family Type | # Families | Family Size |
| Married-Couple | 2,294 (83.8%) | 2.63 |
| Single Male/Father | 63 (2.3%) | 3.86 |
| Single Female/Mother | 381 (13.9%) | 4.10 |
| Total Families | 2,738 (100.0%) | 2.86 |
Median Household Size in Lancaster County
The median household size in Lancaster County is 2.03 persons per household, with single female/mother households (381 | 7.3%) accounting for the largest median household size of 4.24 persons per household. non-family households (2,500 | 47.7%) represent the smallest median household size with 1.07 persons per household.
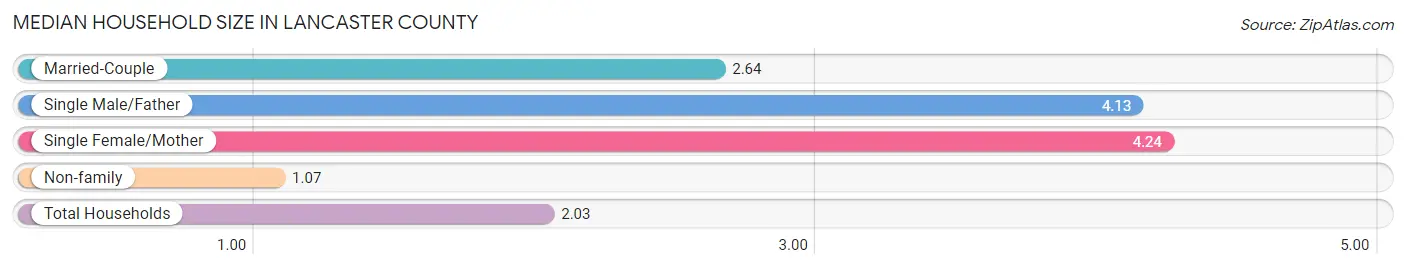
| Household Type | # Households | Household Size |
| Married-Couple | 2,294 (43.8%) | 2.64 |
| Single Male/Father | 63 (1.2%) | 4.13 |
| Single Female/Mother | 381 (7.3%) | 4.24 |
| Non-family | 2,500 (47.7%) | 1.07 |
| Total Households | 5,238 (100.0%) | 2.03 |
Household Size by Marriage Status in Lancaster County
Out of a total of 5,238 households in Lancaster County, 2,738 (52.3%) are family households, while 2,500 (47.7%) are nonfamily households. The most numerous type of family households are 2-person households, comprising 1,819, and the most common type of nonfamily households are 1-person households, comprising 2,352.
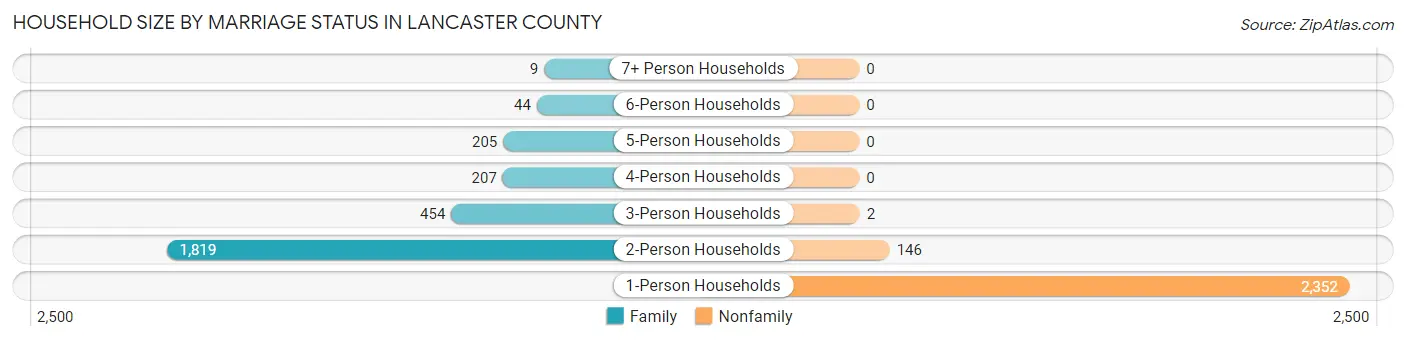
| Household Size | Family Households | Nonfamily Households |
| 1-Person Households | - | 2,352 (44.9%) |
| 2-Person Households | 1,819 (34.7%) | 146 (2.8%) |
| 3-Person Households | 454 (8.7%) | 2 (0.0%) |
| 4-Person Households | 207 (4.0%) | 0 (0.0%) |
| 5-Person Households | 205 (3.9%) | 0 (0.0%) |
| 6-Person Households | 44 (0.8%) | 0 (0.0%) |
| 7+ Person Households | 9 (0.2%) | 0 (0.0%) |
| Total | 2,738 (52.3%) | 2,500 (47.7%) |
Female Fertility in Lancaster County
Fertility by Age in Lancaster County
Average fertility rate in Lancaster County is 25.0 births per 1,000 women. Women in the age bracket of 35 to 50 years have the highest fertility rate with 49.0 births per 1,000 women. Women in the age bracket of 35 to 50 years acount for 92.5% of all women with births.
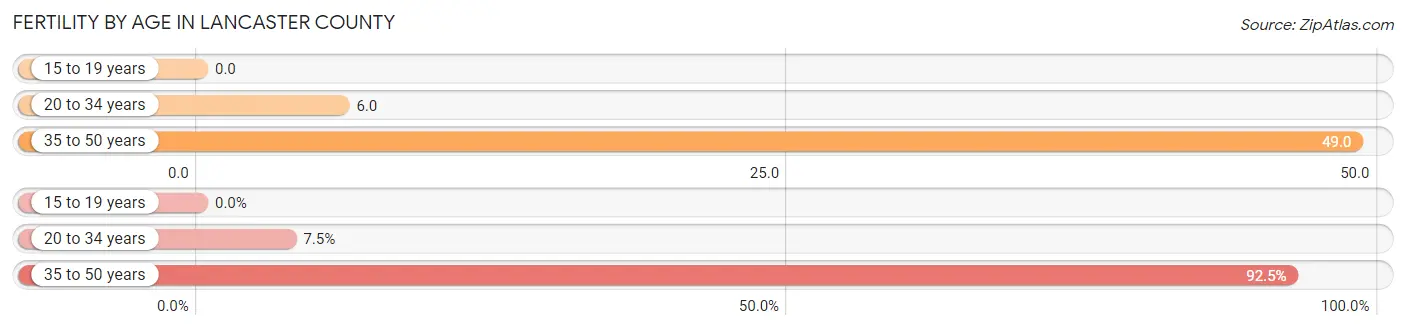
| Age Bracket | Women with Births | Births / 1,000 Women |
| 15 to 19 years | 0 (0.0%) | 0.0 |
| 20 to 34 years | 3 (7.5%) | 6.0 |
| 35 to 50 years | 37 (92.5%) | 49.0 |
| Total | 40 (100.0%) | 25.0 |
Fertility by Age by Marriage Status in Lancaster County
60.0% of women with births (40) in Lancaster County are married. The highest percentage of unmarried women with births falls into 35 to 50 years age bracket with 43.2% of them unmarried at the time of birth, while the lowest percentage of unmarried women with births belong to 20 to 34 years age bracket with 0.0% of them unmarried.
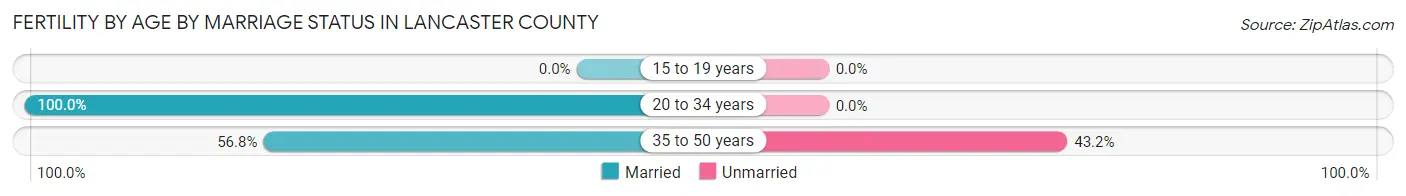
| Age Bracket | Married | Unmarried |
| 15 to 19 years | 0 (0.0%) | 0 (0.0%) |
| 20 to 34 years | 3 (100.0%) | 0 (0.0%) |
| 35 to 50 years | 21 (56.8%) | 16 (43.2%) |
| Total | 24 (60.0%) | 16 (40.0%) |
Fertility by Education in Lancaster County
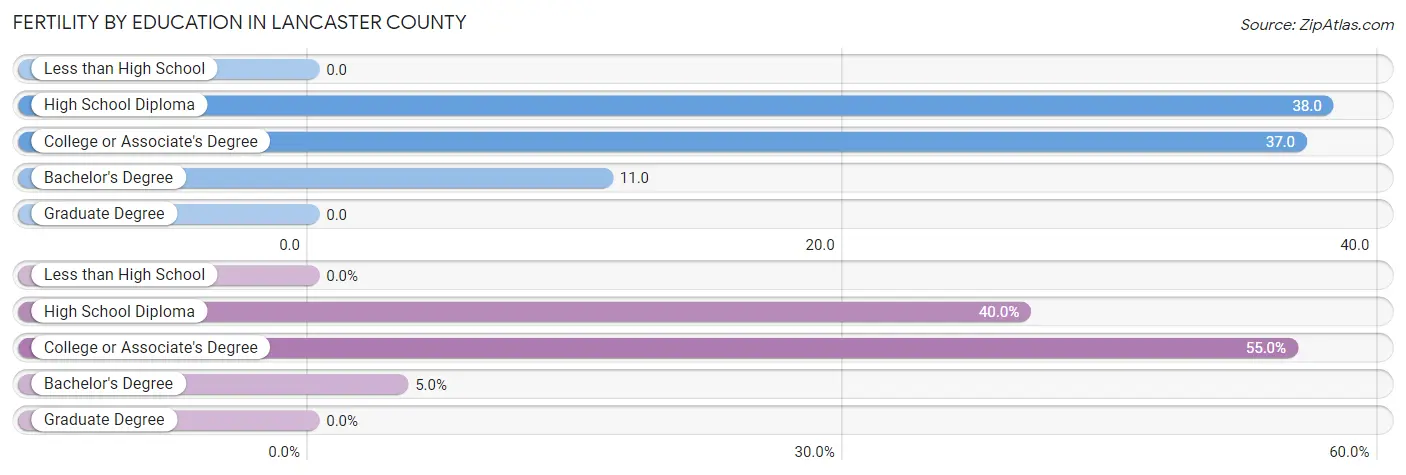
| Educational Attainment | Women with Births | Births / 1,000 Women |
| Less than High School | 0 (0.0%) | 0.0 |
| High School Diploma | 16 (40.0%) | 38.0 |
| College or Associate's Degree | 22 (55.0%) | 37.0 |
| Bachelor's Degree | 2 (5.0%) | 11.0 |
| Graduate Degree | 0 (0.0%) | 0.0 |
| Total | 40 (100.0%) | 25.0 |
Fertility by Education by Marriage Status in Lancaster County
40.0% of women with births in Lancaster County are unmarried. Women with the educational attainment of college or associate's degree are most likely to be married with 100.0% of them married at childbirth, while women with the educational attainment of high school diploma are least likely to be married with 100.0% of them unmarried at childbirth.
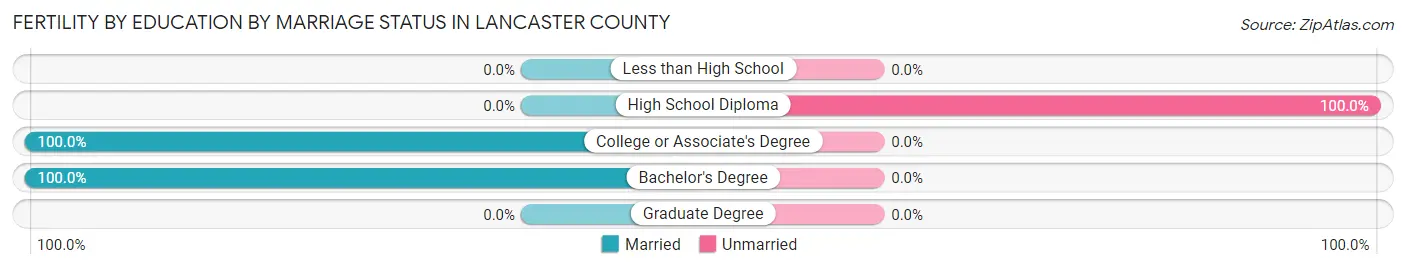
| Educational Attainment | Married | Unmarried |
| Less than High School | 0 (0.0%) | 0 (0.0%) |
| High School Diploma | 0 (0.0%) | 16 (100.0%) |
| College or Associate's Degree | 22 (100.0%) | 0 (0.0%) |
| Bachelor's Degree | 2 (100.0%) | 0 (0.0%) |
| Graduate Degree | 0 (0.0%) | 0 (0.0%) |
| Total | 24 (60.0%) | 16 (40.0%) |
Employment Characteristics in Lancaster County
Employment by Class of Employer in Lancaster County
Among the 3,953 employed individuals in Lancaster County, private company employees (2,156 | 54.5%), not-for-profit organizations (383 | 9.7%), and self-employed (not incorporated) (336 | 8.5%) make up the most common classes of employment.
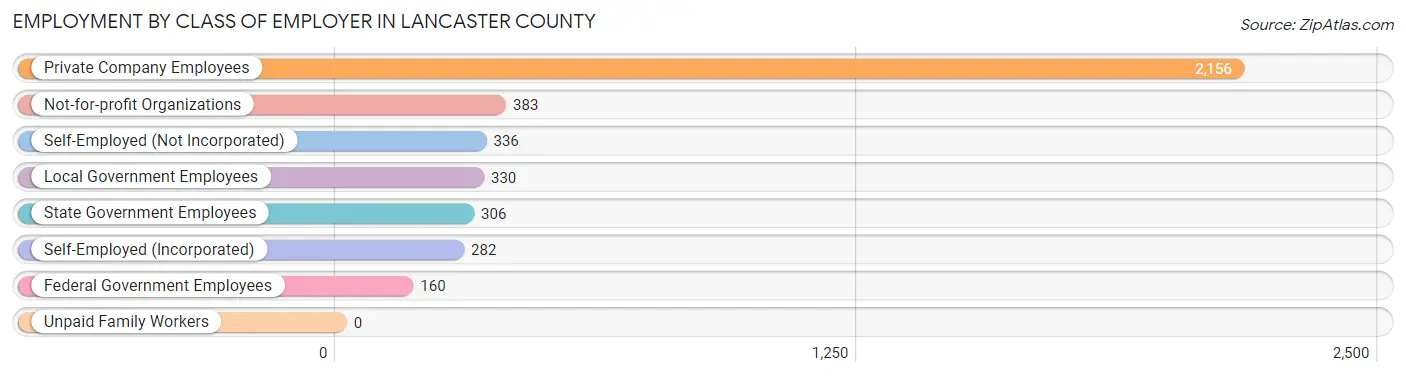
| Employer Class | # Employees | % Employees |
| Private Company Employees | 2,156 | 54.5% |
| Self-Employed (Incorporated) | 282 | 7.1% |
| Self-Employed (Not Incorporated) | 336 | 8.5% |
| Not-for-profit Organizations | 383 | 9.7% |
| Local Government Employees | 330 | 8.4% |
| State Government Employees | 306 | 7.7% |
| Federal Government Employees | 160 | 4.1% |
| Unpaid Family Workers | 0 | 0.0% |
| Total | 3,953 | 100.0% |
Employment Status by Age in Lancaster County
According to the labor force statistics for Lancaster County, out of the total population over 16 years of age (9,552), 46.4% or 4,432 individuals are in the labor force, with 9.3% or 412 of them unemployed. The age group with the highest labor force participation rate is 35 to 44 years, with 90.9% or 713 individuals in the labor force. Within the labor force, the 45 to 54 years age range has the highest percentage of unemployed individuals, with 26.0% or 242 of them being unemployed.
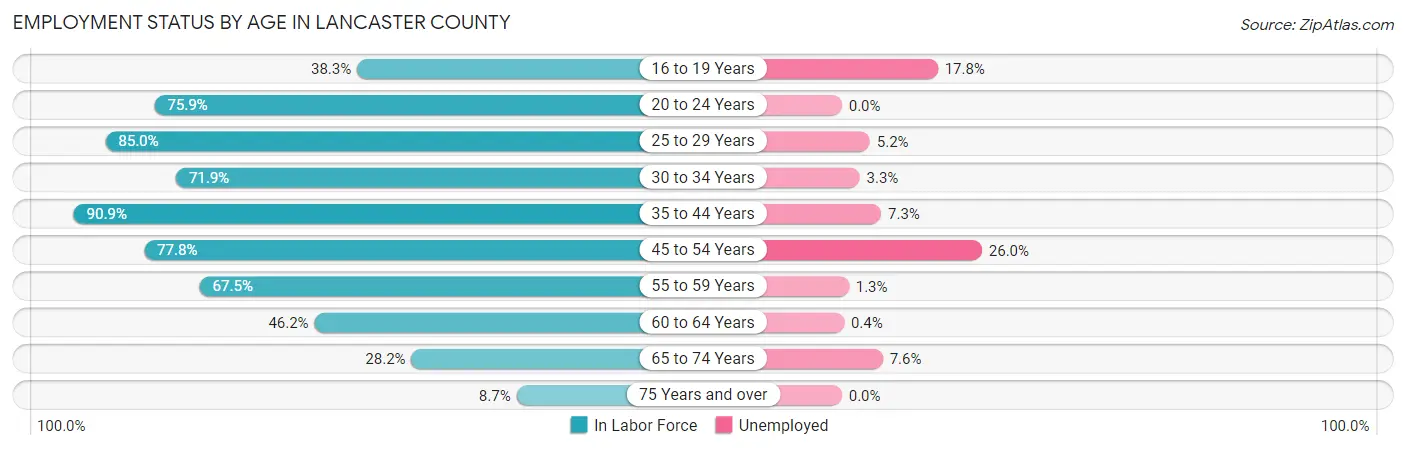
| Age Bracket | In Labor Force | Unemployed |
| 16 to 19 Years | 197 (38.3%) | 35 (17.8%) |
| 20 to 24 Years | 227 (75.9%) | 0 (0.0%) |
| 25 to 29 Years | 307 (85.0%) | 16 (5.2%) |
| 30 to 34 Years | 240 (71.9%) | 8 (3.3%) |
| 35 to 44 Years | 713 (90.9%) | 52 (7.3%) |
| 45 to 54 Years | 929 (77.8%) | 242 (26.0%) |
| 55 to 59 Years | 550 (67.5%) | 7 (1.3%) |
| 60 to 64 Years | 450 (46.2%) | 2 (0.4%) |
| 65 to 74 Years | 641 (28.2%) | 49 (7.6%) |
| 75 Years and over | 174 (8.7%) | 0 (0.0%) |
| Total | 4,432 (46.4%) | 412 (9.3%) |
Employment Status by Educational Attainment in Lancaster County
According to labor force statistics for Lancaster County, 71.5% of individuals (3,190) out of the total population between 25 and 64 years of age (4,462) are in the labor force, with 10.3% or 329 of them being unemployed. The group with the highest labor force participation rate are those with the educational attainment of bachelor's degree or higher, with 81.0% or 988 individuals in the labor force. Within the labor force, individuals with high school diploma education have the highest percentage of unemployment, with 28.9% or 266 of them being unemployed.
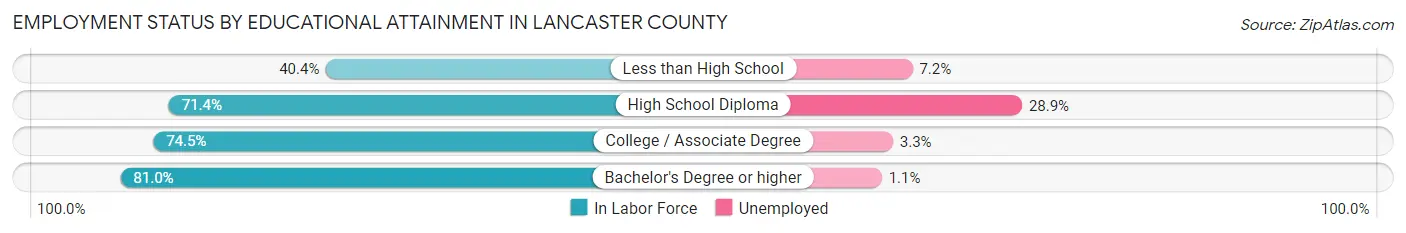
| Educational Attainment | In Labor Force | Unemployed |
| Less than High School | 207 (40.4%) | 37 (7.2%) |
| High School Diploma | 919 (71.4%) | 372 (28.9%) |
| College / Associate Degree | 1,075 (74.5%) | 48 (3.3%) |
| Bachelor's Degree or higher | 988 (81.0%) | 13 (1.1%) |
| Total | 3,190 (71.5%) | 460 (10.3%) |
Employment Occupations by Sex in Lancaster County
Management, Business, Science and Arts Occupations
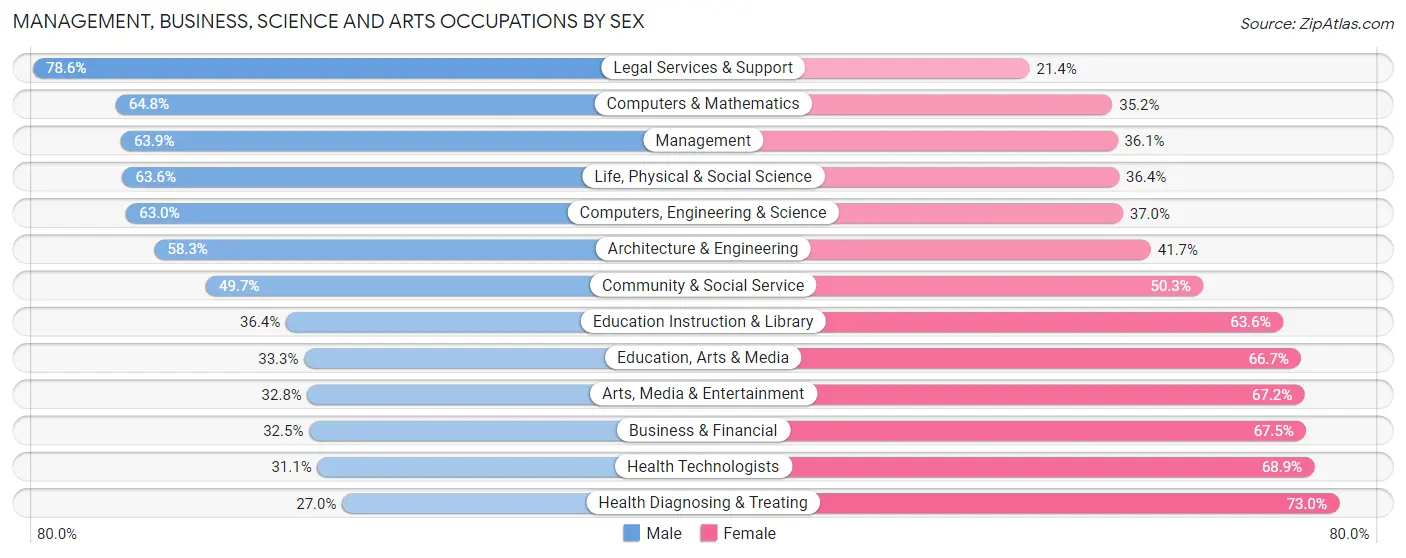
The most common Management, Business, Science and Arts occupations in Lancaster County are Community & Social Service (495 | 12.4%), Management (327 | 8.2%), Business & Financial (280 | 7.0%), Health Diagnosing & Treating (278 | 7.0%), and Health Technologists (241 | 6.0%).
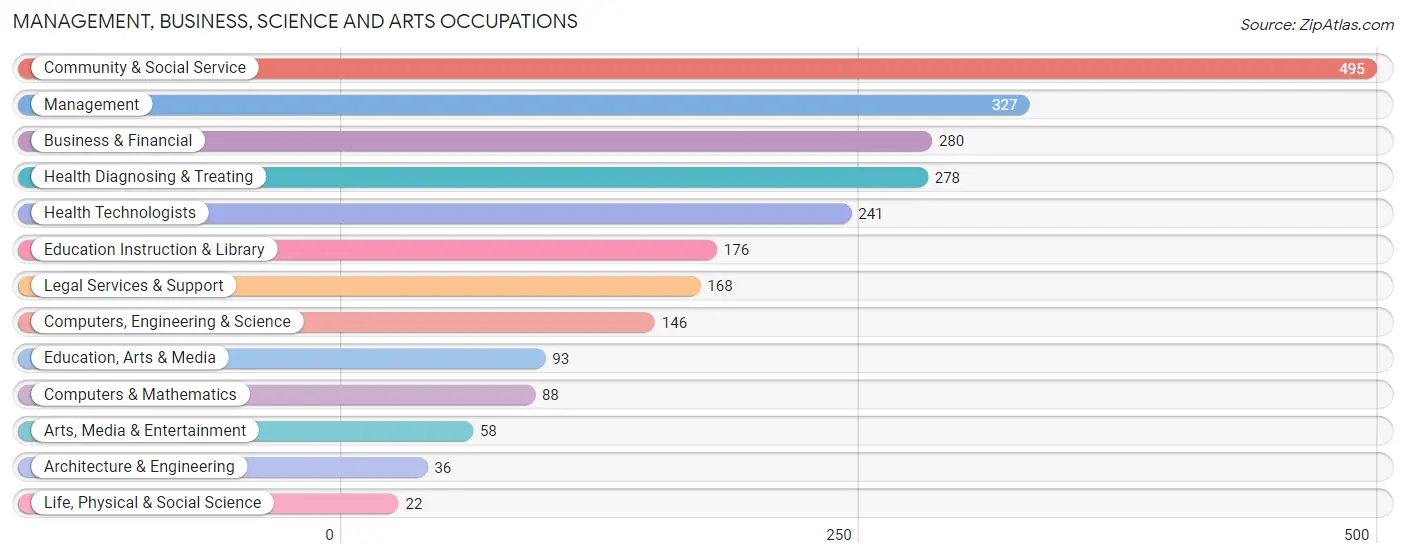
Management, Business, Science and Arts Occupations by Sex
Within the Management, Business, Science and Arts occupations in Lancaster County, the most male-oriented occupations are Legal Services & Support (78.6%), Computers & Mathematics (64.8%), and Management (63.9%), while the most female-oriented occupations are Health Diagnosing & Treating (73.0%), Health Technologists (68.9%), and Business & Financial (67.5%).
| Occupation | Male | Female |
| Management | 209 (63.9%) | 118 (36.1%) |
| Business & Financial | 91 (32.5%) | 189 (67.5%) |
| Computers, Engineering & Science | 92 (63.0%) | 54 (37.0%) |
| Computers & Mathematics | 57 (64.8%) | 31 (35.2%) |
| Architecture & Engineering | 21 (58.3%) | 15 (41.7%) |
| Life, Physical & Social Science | 14 (63.6%) | 8 (36.4%) |
| Community & Social Service | 246 (49.7%) | 249 (50.3%) |
| Education, Arts & Media | 31 (33.3%) | 62 (66.7%) |
| Legal Services & Support | 132 (78.6%) | 36 (21.4%) |
| Education Instruction & Library | 64 (36.4%) | 112 (63.6%) |
| Arts, Media & Entertainment | 19 (32.8%) | 39 (67.2%) |
| Health Diagnosing & Treating | 75 (27.0%) | 203 (73.0%) |
| Health Technologists | 75 (31.1%) | 166 (68.9%) |
| Total (Category) | 713 (46.7%) | 813 (53.3%) |
| Total (Overall) | 2,059 (51.7%) | 1,927 (48.3%) |
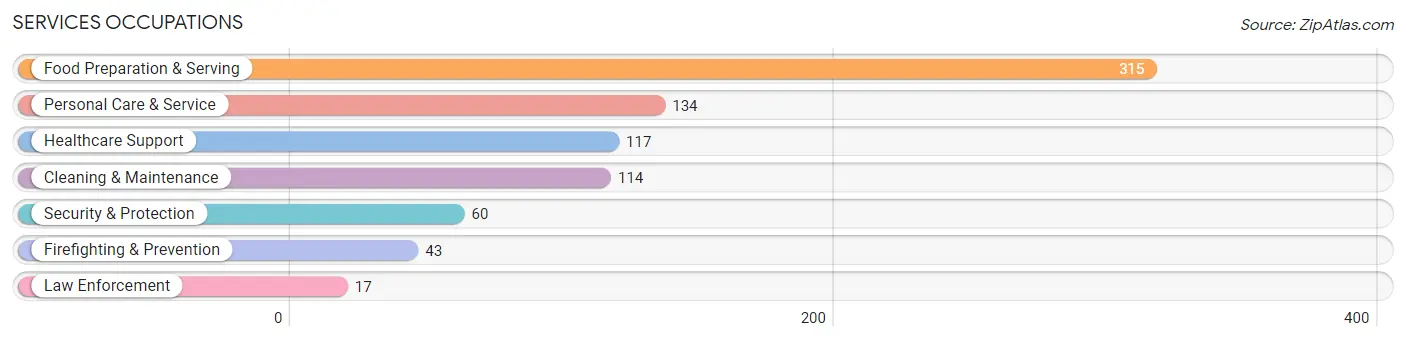
Services Occupations
The most common Services occupations in Lancaster County are Food Preparation & Serving (315 | 7.9%), Personal Care & Service (134 | 3.4%), Healthcare Support (117 | 2.9%), Cleaning & Maintenance (114 | 2.9%), and Security & Protection (60 | 1.5%).
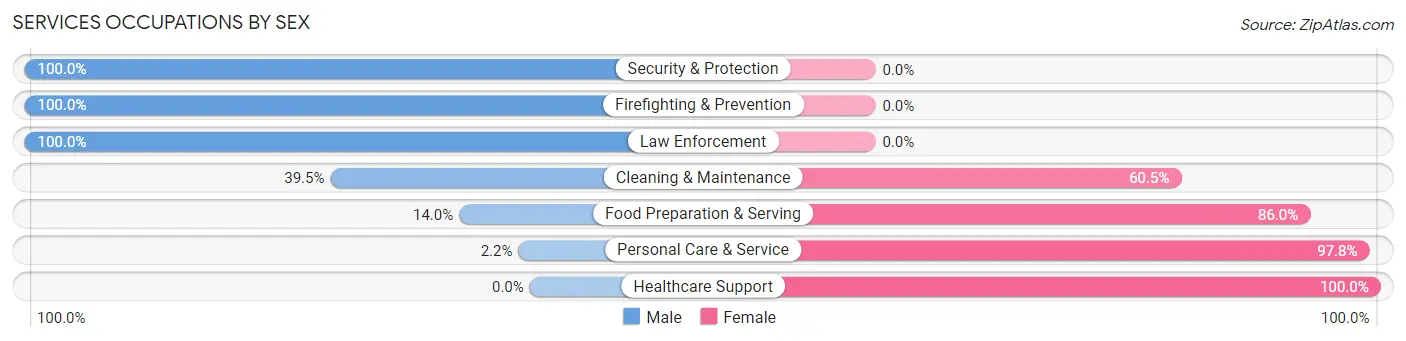
Services Occupations by Sex
Within the Services occupations in Lancaster County, the most male-oriented occupations are Security & Protection (100.0%), Firefighting & Prevention (100.0%), and Law Enforcement (100.0%), while the most female-oriented occupations are Healthcare Support (100.0%), Personal Care & Service (97.8%), and Food Preparation & Serving (86.0%).
| Occupation | Male | Female |
| Healthcare Support | 0 (0.0%) | 117 (100.0%) |
| Security & Protection | 60 (100.0%) | 0 (0.0%) |
| Firefighting & Prevention | 43 (100.0%) | 0 (0.0%) |
| Law Enforcement | 17 (100.0%) | 0 (0.0%) |
| Food Preparation & Serving | 44 (14.0%) | 271 (86.0%) |
| Cleaning & Maintenance | 45 (39.5%) | 69 (60.5%) |
| Personal Care & Service | 3 (2.2%) | 131 (97.8%) |
| Total (Category) | 152 (20.5%) | 588 (79.5%) |
| Total (Overall) | 2,059 (51.7%) | 1,927 (48.3%) |
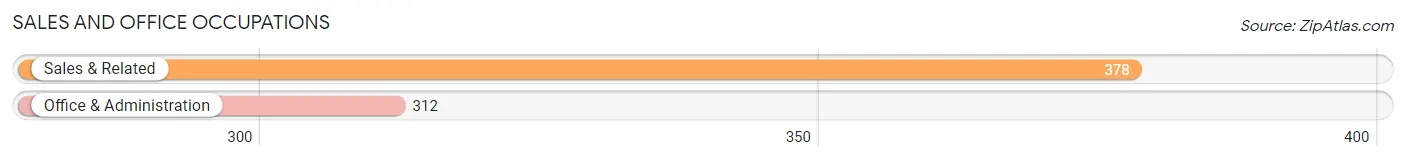
Sales and Office Occupations
The most common Sales and Office occupations in Lancaster County are Sales & Related (378 | 9.5%), and Office & Administration (312 | 7.8%).
Sales and Office Occupations by Sex

| Occupation | Male | Female |
| Sales & Related | 240 (63.5%) | 138 (36.5%) |
| Office & Administration | 58 (18.6%) | 254 (81.4%) |
| Total (Category) | 298 (43.2%) | 392 (56.8%) |
| Total (Overall) | 2,059 (51.7%) | 1,927 (48.3%) |
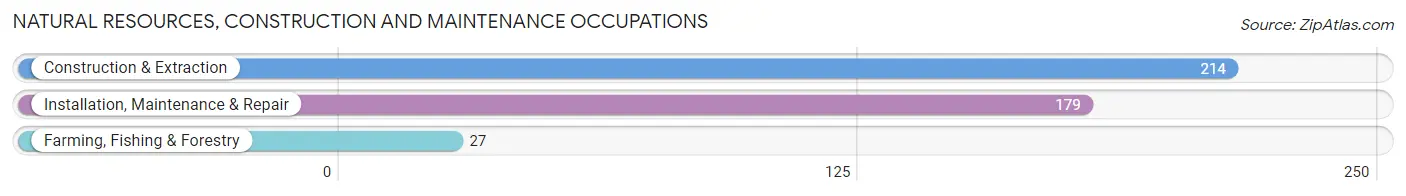
Natural Resources, Construction and Maintenance Occupations
The most common Natural Resources, Construction and Maintenance occupations in Lancaster County are Construction & Extraction (214 | 5.4%), Installation, Maintenance & Repair (179 | 4.5%), and Farming, Fishing & Forestry (27 | 0.7%).
Natural Resources, Construction and Maintenance Occupations by Sex
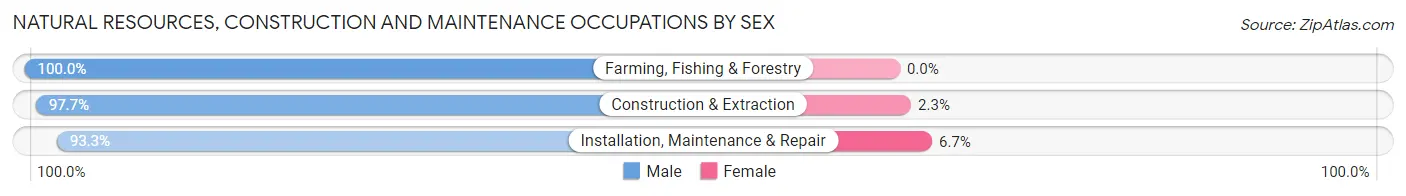
| Occupation | Male | Female |
| Farming, Fishing & Forestry | 27 (100.0%) | 0 (0.0%) |
| Construction & Extraction | 209 (97.7%) | 5 (2.3%) |
| Installation, Maintenance & Repair | 167 (93.3%) | 12 (6.7%) |
| Total (Category) | 403 (96.0%) | 17 (4.1%) |
| Total (Overall) | 2,059 (51.7%) | 1,927 (48.3%) |
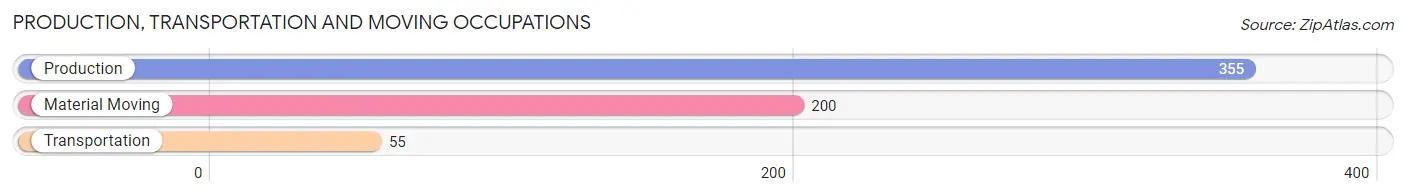
Production, Transportation and Moving Occupations
The most common Production, Transportation and Moving occupations in Lancaster County are Production (355 | 8.9%), Material Moving (200 | 5.0%), and Transportation (55 | 1.4%).
Production, Transportation and Moving Occupations by Sex
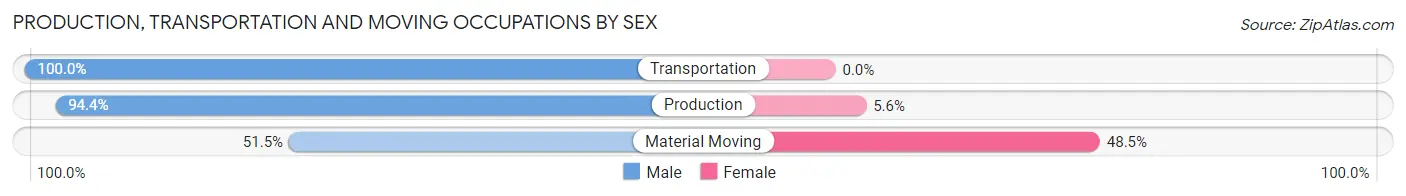
| Occupation | Male | Female |
| Production | 335 (94.4%) | 20 (5.6%) |
| Transportation | 55 (100.0%) | 0 (0.0%) |
| Material Moving | 103 (51.5%) | 97 (48.5%) |
| Total (Category) | 493 (80.8%) | 117 (19.2%) |
| Total (Overall) | 2,059 (51.7%) | 1,927 (48.3%) |
Employment Industries by Sex in Lancaster County
Employment Industries in Lancaster County
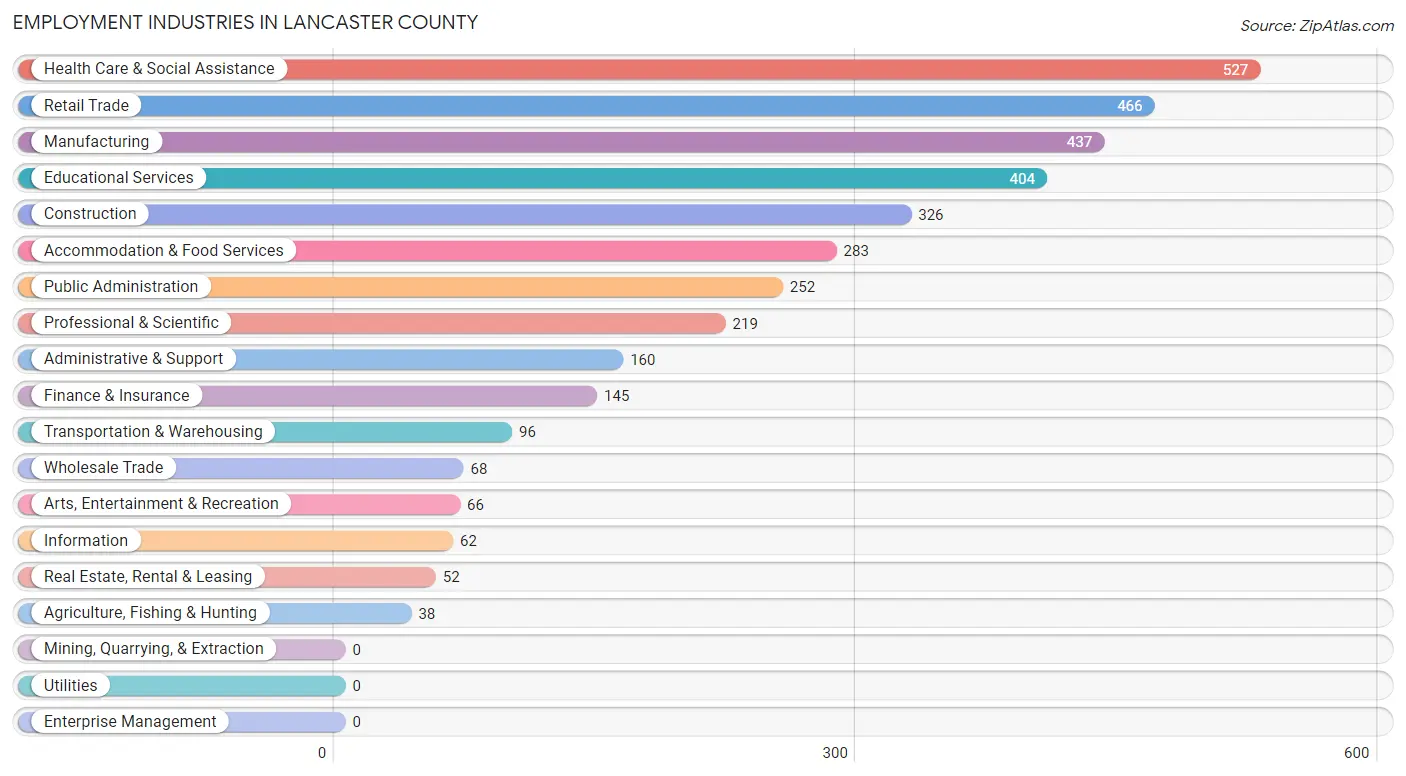
The major employment industries in Lancaster County include Health Care & Social Assistance (527 | 13.2%), Retail Trade (466 | 11.7%), Manufacturing (437 | 11.0%), Educational Services (404 | 10.1%), and Construction (326 | 8.2%).
Employment Industries by Sex in Lancaster County
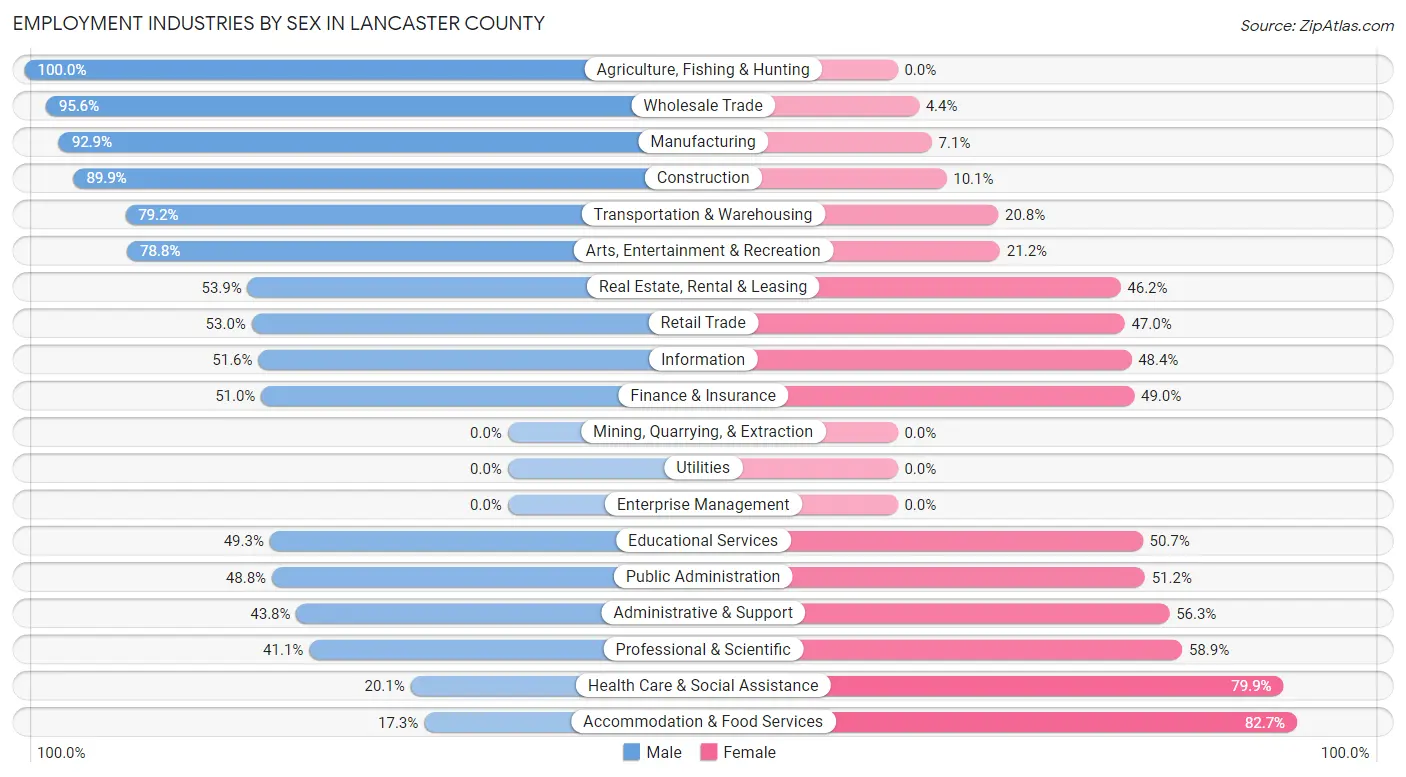
The Lancaster County industries that see more men than women are Agriculture, Fishing & Hunting (100.0%), Wholesale Trade (95.6%), and Manufacturing (92.9%), whereas the industries that tend to have a higher number of women are Accommodation & Food Services (82.7%), Health Care & Social Assistance (79.9%), and Professional & Scientific (58.9%).
| Industry | Male | Female |
| Agriculture, Fishing & Hunting | 38 (100.0%) | 0 (0.0%) |
| Mining, Quarrying, & Extraction | 0 (0.0%) | 0 (0.0%) |
| Construction | 293 (89.9%) | 33 (10.1%) |
| Manufacturing | 406 (92.9%) | 31 (7.1%) |
| Wholesale Trade | 65 (95.6%) | 3 (4.4%) |
| Retail Trade | 247 (53.0%) | 219 (47.0%) |
| Transportation & Warehousing | 76 (79.2%) | 20 (20.8%) |
| Utilities | 0 (0.0%) | 0 (0.0%) |
| Information | 32 (51.6%) | 30 (48.4%) |
| Finance & Insurance | 74 (51.0%) | 71 (49.0%) |
| Real Estate, Rental & Leasing | 28 (53.8%) | 24 (46.2%) |
| Professional & Scientific | 90 (41.1%) | 129 (58.9%) |
| Enterprise Management | 0 (0.0%) | 0 (0.0%) |
| Administrative & Support | 70 (43.8%) | 90 (56.2%) |
| Educational Services | 199 (49.3%) | 205 (50.7%) |
| Health Care & Social Assistance | 106 (20.1%) | 421 (79.9%) |
| Arts, Entertainment & Recreation | 52 (78.8%) | 14 (21.2%) |
| Accommodation & Food Services | 49 (17.3%) | 234 (82.7%) |
| Public Administration | 123 (48.8%) | 129 (51.2%) |
| Total | 2,059 (51.7%) | 1,927 (48.3%) |
Education in Lancaster County
School Enrollment in Lancaster County
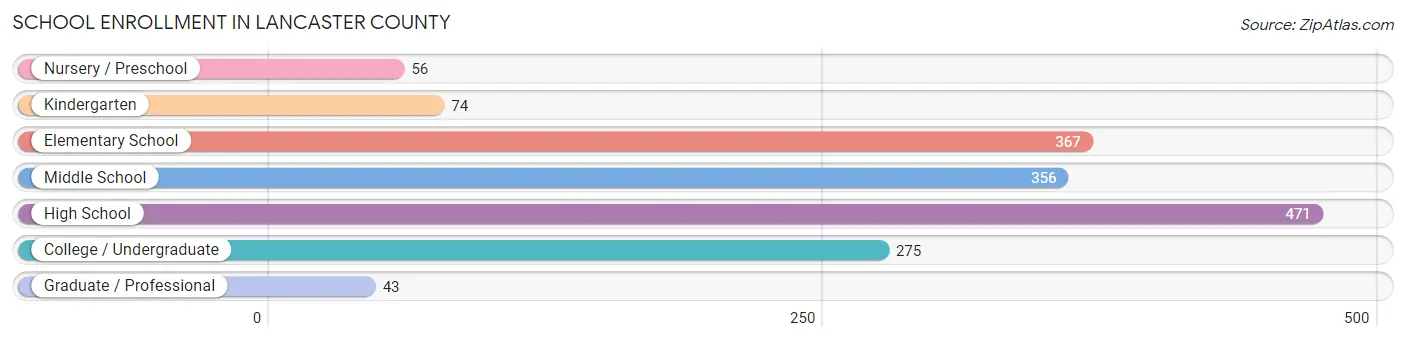
The most common levels of schooling among the 1,642 students in Lancaster County are high school (471 | 28.7%), elementary school (367 | 22.4%), and middle school (356 | 21.7%).
| School Level | # Students | % Students |
| Nursery / Preschool | 56 | 3.4% |
| Kindergarten | 74 | 4.5% |
| Elementary School | 367 | 22.4% |
| Middle School | 356 | 21.7% |
| High School | 471 | 28.7% |
| College / Undergraduate | 275 | 16.8% |
| Graduate / Professional | 43 | 2.6% |
| Total | 1,642 | 100.0% |
School Enrollment by Age by Funding Source in Lancaster County
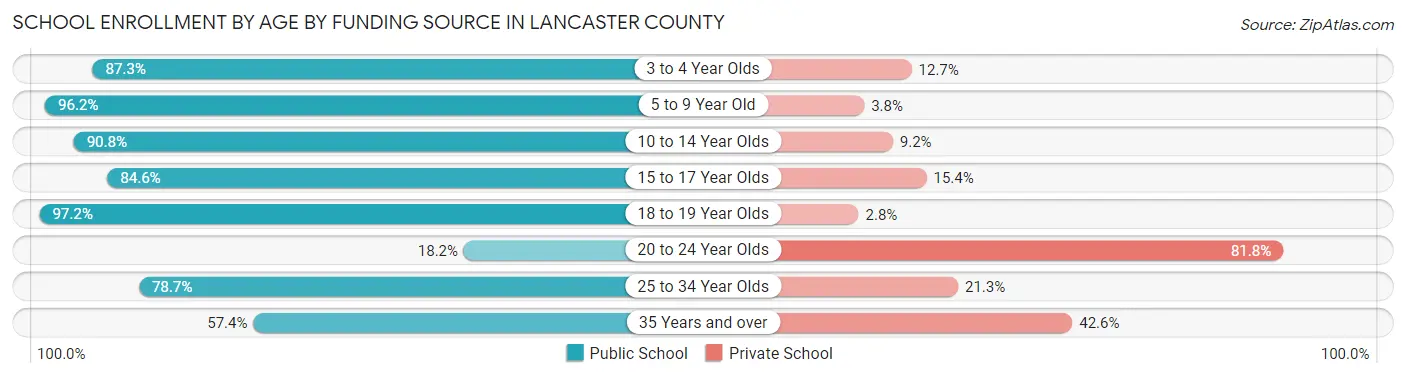
Out of a total of 1,642 students who are enrolled in schools in Lancaster County, 217 (13.2%) attend a private institution, while the remaining 1,425 (86.8%) are enrolled in public schools. The age group of 20 to 24 year olds has the highest likelihood of being enrolled in private schools, with 36 (81.8% in the age bracket) enrolled. Conversely, the age group of 18 to 19 year olds has the lowest likelihood of being enrolled in a private school, with 175 (97.2% in the age bracket) attending a public institution.
| Age Bracket | Public School | Private School |
| 3 to 4 Year Olds | 69 (87.3%) | 10 (12.7%) |
| 5 to 9 Year Old | 402 (96.2%) | 16 (3.8%) |
| 10 to 14 Year Olds | 377 (90.8%) | 38 (9.2%) |
| 15 to 17 Year Olds | 285 (84.6%) | 52 (15.4%) |
| 18 to 19 Year Olds | 175 (97.2%) | 5 (2.8%) |
| 20 to 24 Year Olds | 8 (18.2%) | 36 (81.8%) |
| 25 to 34 Year Olds | 48 (78.7%) | 13 (21.3%) |
| 35 Years and over | 62 (57.4%) | 46 (42.6%) |
| Total | 1,425 (86.8%) | 217 (13.2%) |
Educational Attainment by Field of Study in Lancaster County
Business (538 | 17.5%), education (421 | 13.7%), social sciences (385 | 12.5%), science & technology (337 | 10.9%), and liberal arts & history (220 | 7.1%) are the most common fields of study among 3,081 individuals in Lancaster County who have obtained a bachelor's degree or higher.
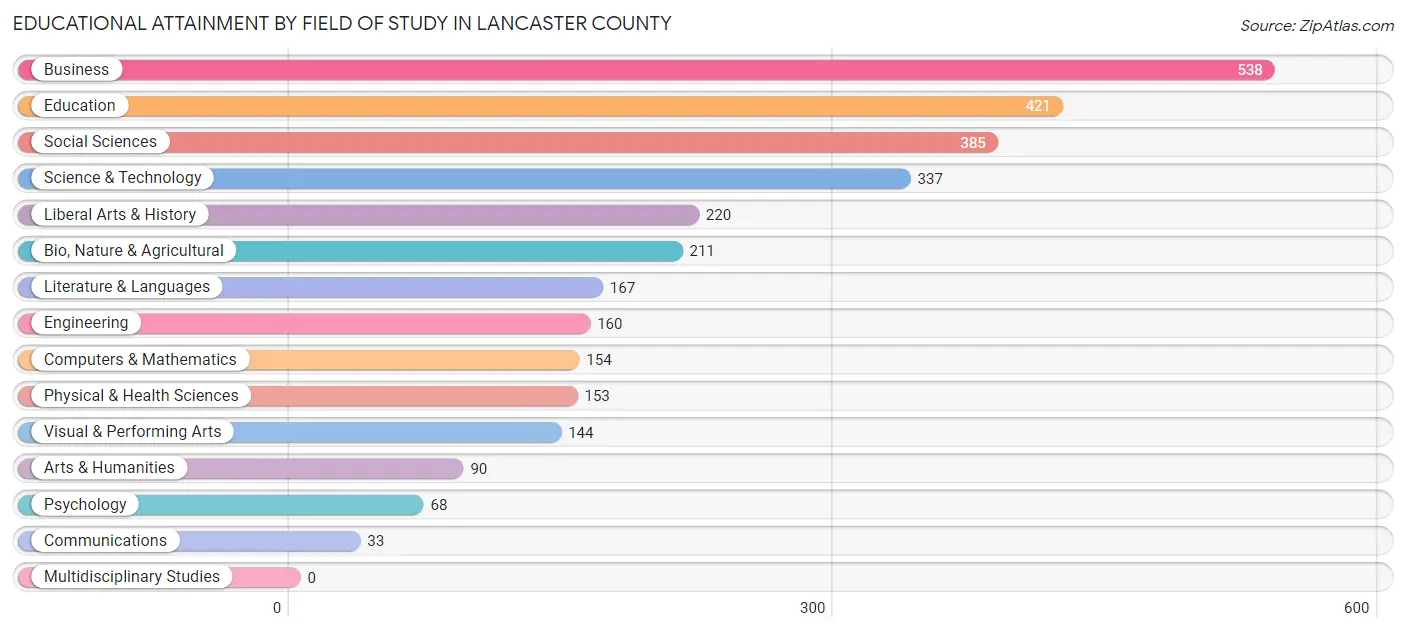
| Field of Study | # Graduates | % Graduates |
| Computers & Mathematics | 154 | 5.0% |
| Bio, Nature & Agricultural | 211 | 6.9% |
| Physical & Health Sciences | 153 | 5.0% |
| Psychology | 68 | 2.2% |
| Social Sciences | 385 | 12.5% |
| Engineering | 160 | 5.2% |
| Multidisciplinary Studies | 0 | 0.0% |
| Science & Technology | 337 | 10.9% |
| Business | 538 | 17.5% |
| Education | 421 | 13.7% |
| Literature & Languages | 167 | 5.4% |
| Liberal Arts & History | 220 | 7.1% |
| Visual & Performing Arts | 144 | 4.7% |
| Communications | 33 | 1.1% |
| Arts & Humanities | 90 | 2.9% |
| Total | 3,081 | 100.0% |
Transportation & Commute in Lancaster County
Vehicle Availability by Sex in Lancaster County
The most prevalent vehicle ownership categories in Lancaster County are males with 2 vehicles (751, accounting for 36.5%) and females with 2 vehicles (660, making up 39.8%).
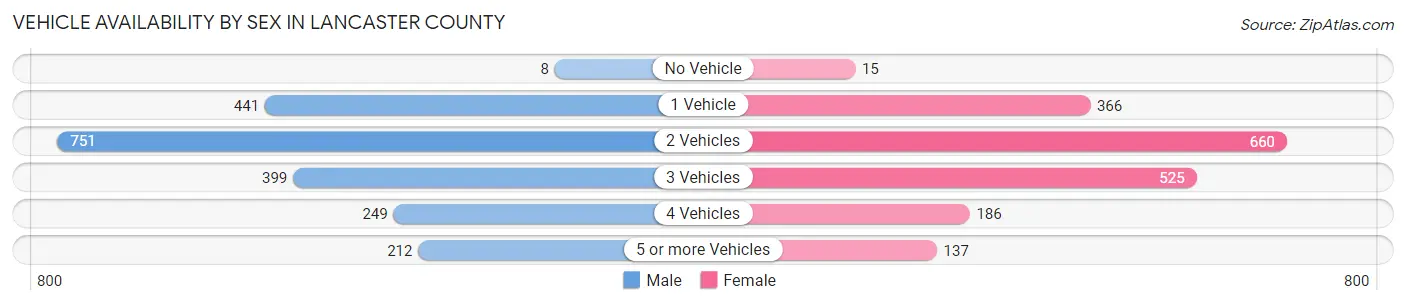
| Vehicles Available | Male | Female |
| No Vehicle | 8 (0.4%) | 15 (0.8%) |
| 1 Vehicle | 441 (21.4%) | 366 (19.4%) |
| 2 Vehicles | 751 (36.5%) | 660 (34.9%) |
| 3 Vehicles | 399 (19.4%) | 525 (27.8%) |
| 4 Vehicles | 249 (12.1%) | 186 (9.9%) |
| 5 or more Vehicles | 212 (10.3%) | 137 (7.2%) |
| Total | 2,060 (100.0%) | 1,889 (100.0%) |
Commute Time in Lancaster County
The most frequently occuring commute durations in Lancaster County are 10 to 14 minutes (604 commuters, 17.7%), 5 to 9 minutes (579 commuters, 17.0%), and 15 to 19 minutes (525 commuters, 15.4%).
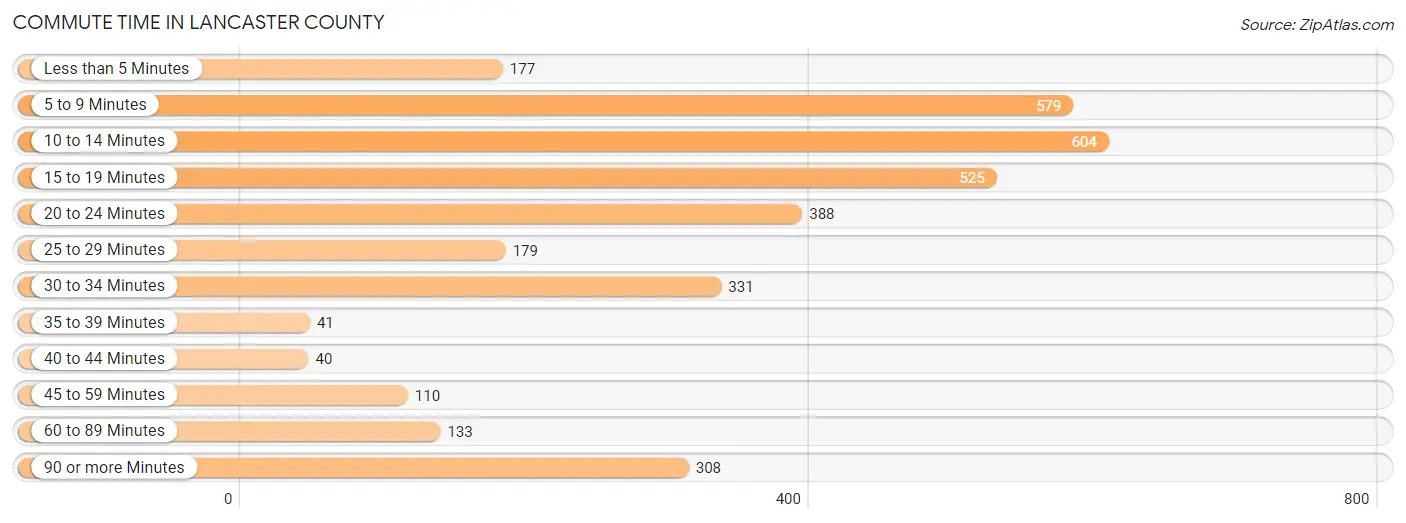
| Commute Time | # Commuters | % Commuters |
| Less than 5 Minutes | 177 | 5.2% |
| 5 to 9 Minutes | 579 | 17.0% |
| 10 to 14 Minutes | 604 | 17.7% |
| 15 to 19 Minutes | 525 | 15.4% |
| 20 to 24 Minutes | 388 | 11.4% |
| 25 to 29 Minutes | 179 | 5.2% |
| 30 to 34 Minutes | 331 | 9.7% |
| 35 to 39 Minutes | 41 | 1.2% |
| 40 to 44 Minutes | 40 | 1.2% |
| 45 to 59 Minutes | 110 | 3.2% |
| 60 to 89 Minutes | 133 | 3.9% |
| 90 or more Minutes | 308 | 9.0% |
Commute Time by Sex in Lancaster County
The most common commute times in Lancaster County are 5 to 9 minutes (327 commuters, 18.9%) for males and 10 to 14 minutes (368 commuters, 21.8%) for females.
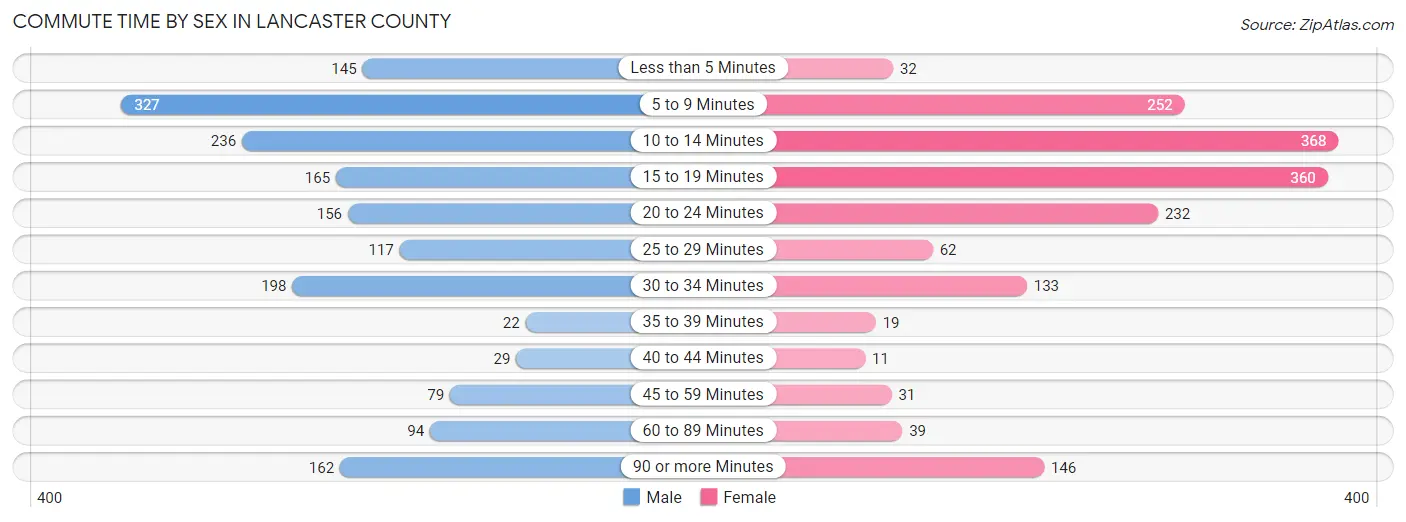
| Commute Time | Male | Female |
| Less than 5 Minutes | 145 (8.4%) | 32 (1.9%) |
| 5 to 9 Minutes | 327 (18.9%) | 252 (15.0%) |
| 10 to 14 Minutes | 236 (13.6%) | 368 (21.8%) |
| 15 to 19 Minutes | 165 (9.5%) | 360 (21.4%) |
| 20 to 24 Minutes | 156 (9.0%) | 232 (13.8%) |
| 25 to 29 Minutes | 117 (6.8%) | 62 (3.7%) |
| 30 to 34 Minutes | 198 (11.5%) | 133 (7.9%) |
| 35 to 39 Minutes | 22 (1.3%) | 19 (1.1%) |
| 40 to 44 Minutes | 29 (1.7%) | 11 (0.6%) |
| 45 to 59 Minutes | 79 (4.6%) | 31 (1.8%) |
| 60 to 89 Minutes | 94 (5.4%) | 39 (2.3%) |
| 90 or more Minutes | 162 (9.4%) | 146 (8.7%) |
Time of Departure to Work by Sex in Lancaster County
The most frequent times of departure to work in Lancaster County are 7:00 AM to 7:29 AM (406, 23.5%) for males and 8:00 AM to 8:29 AM (338, 20.1%) for females.
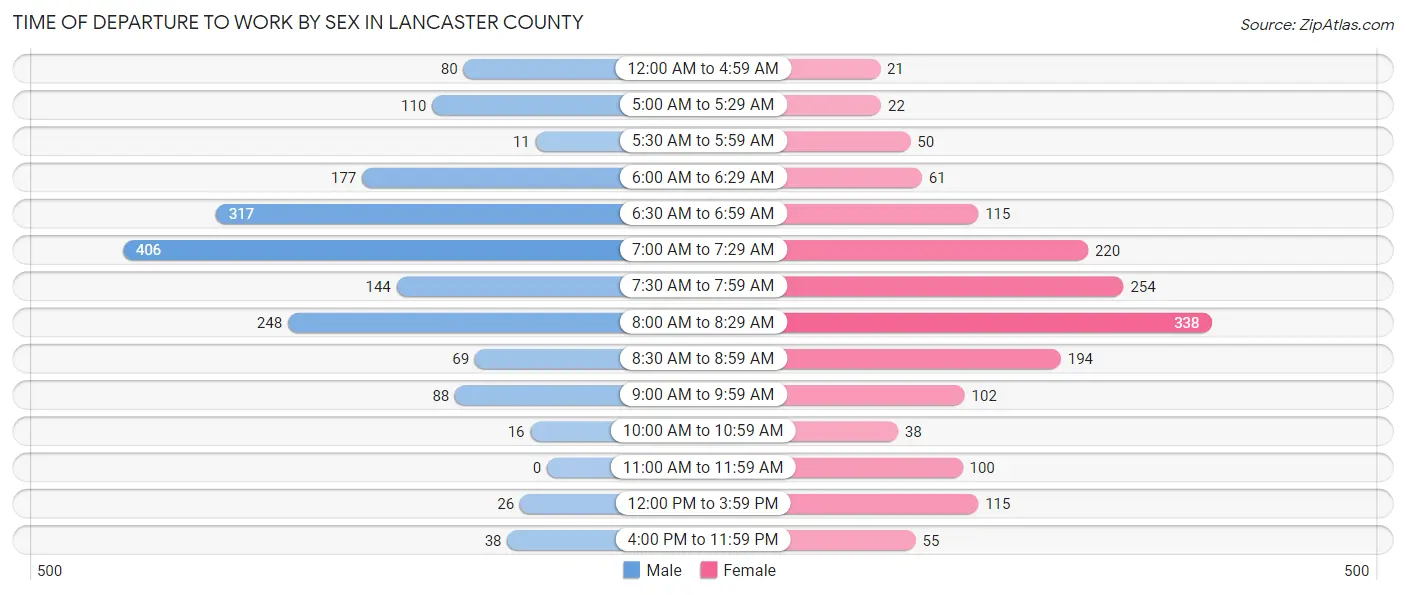
| Time of Departure | Male | Female |
| 12:00 AM to 4:59 AM | 80 (4.6%) | 21 (1.3%) |
| 5:00 AM to 5:29 AM | 110 (6.4%) | 22 (1.3%) |
| 5:30 AM to 5:59 AM | 11 (0.6%) | 50 (3.0%) |
| 6:00 AM to 6:29 AM | 177 (10.2%) | 61 (3.6%) |
| 6:30 AM to 6:59 AM | 317 (18.3%) | 115 (6.8%) |
| 7:00 AM to 7:29 AM | 406 (23.5%) | 220 (13.1%) |
| 7:30 AM to 7:59 AM | 144 (8.3%) | 254 (15.1%) |
| 8:00 AM to 8:29 AM | 248 (14.3%) | 338 (20.1%) |
| 8:30 AM to 8:59 AM | 69 (4.0%) | 194 (11.5%) |
| 9:00 AM to 9:59 AM | 88 (5.1%) | 102 (6.0%) |
| 10:00 AM to 10:59 AM | 16 (0.9%) | 38 (2.3%) |
| 11:00 AM to 11:59 AM | 0 (0.0%) | 100 (5.9%) |
| 12:00 PM to 3:59 PM | 26 (1.5%) | 115 (6.8%) |
| 4:00 PM to 11:59 PM | 38 (2.2%) | 55 (3.3%) |
| Total | 1,730 (100.0%) | 1,685 (100.0%) |
Housing Occupancy in Lancaster County
Occupancy by Ownership in Lancaster County
Of the total 5,238 dwellings in Lancaster County, owner-occupied units account for 4,305 (82.2%), while renter-occupied units make up 933 (17.8%).
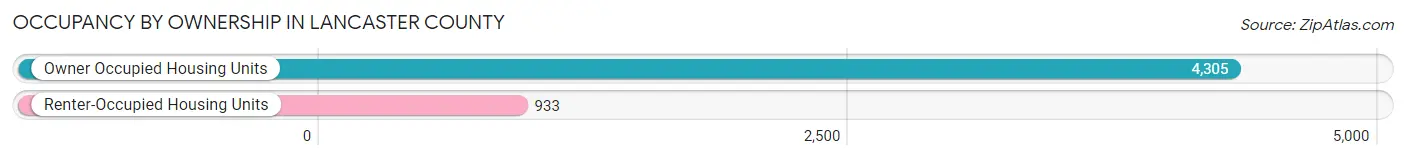
| Occupancy | # Housing Units | % Housing Units |
| Owner Occupied Housing Units | 4,305 | 82.2% |
| Renter-Occupied Housing Units | 933 | 17.8% |
| Total Occupied Housing Units | 5,238 | 100.0% |
Occupancy by Household Size in Lancaster County
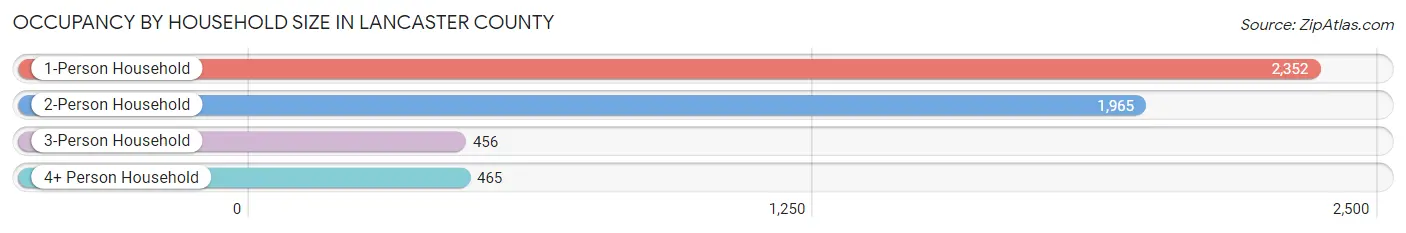
| Household Size | # Housing Units | % Housing Units |
| 1-Person Household | 2,352 | 44.9% |
| 2-Person Household | 1,965 | 37.5% |
| 3-Person Household | 456 | 8.7% |
| 4+ Person Household | 465 | 8.9% |
| Total Housing Units | 5,238 | 100.0% |
Occupancy by Ownership by Household Size in Lancaster County
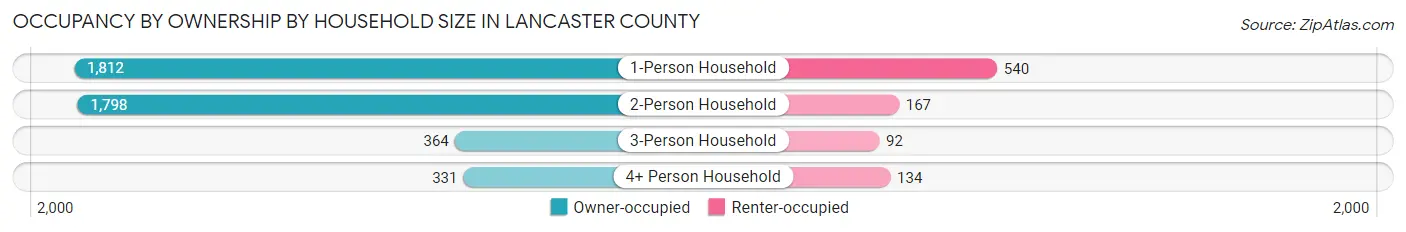
| Household Size | Owner-occupied | Renter-occupied |
| 1-Person Household | 1,812 (77.0%) | 540 (23.0%) |
| 2-Person Household | 1,798 (91.5%) | 167 (8.5%) |
| 3-Person Household | 364 (79.8%) | 92 (20.2%) |
| 4+ Person Household | 331 (71.2%) | 134 (28.8%) |
| Total Housing Units | 4,305 (82.2%) | 933 (17.8%) |
Occupancy by Educational Attainment in Lancaster County
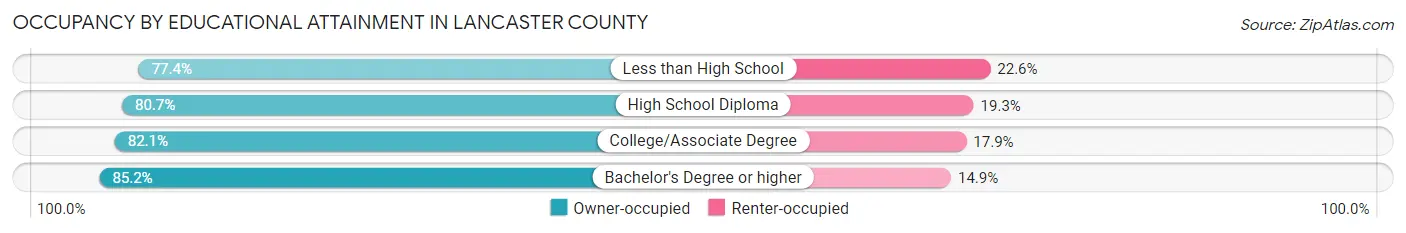
| Household Size | Owner-occupied | Renter-occupied |
| Less than High School | 591 (77.4%) | 173 (22.6%) |
| High School Diploma | 1,052 (80.7%) | 252 (19.3%) |
| College/Associate Degree | 1,005 (82.1%) | 219 (17.9%) |
| Bachelor's Degree or higher | 1,657 (85.2%) | 289 (14.8%) |
Occupancy by Age of Householder in Lancaster County
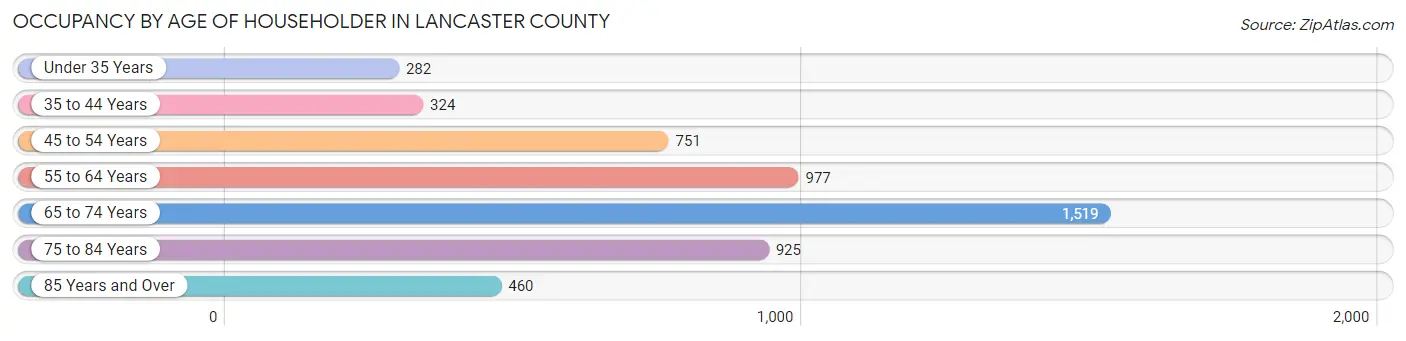
| Age Bracket | # Households | % Households |
| Under 35 Years | 282 | 5.4% |
| 35 to 44 Years | 324 | 6.2% |
| 45 to 54 Years | 751 | 14.3% |
| 55 to 64 Years | 977 | 18.6% |
| 65 to 74 Years | 1,519 | 29.0% |
| 75 to 84 Years | 925 | 17.7% |
| 85 Years and Over | 460 | 8.8% |
| Total | 5,238 | 100.0% |
Housing Finances in Lancaster County
Median Income by Occupancy in Lancaster County
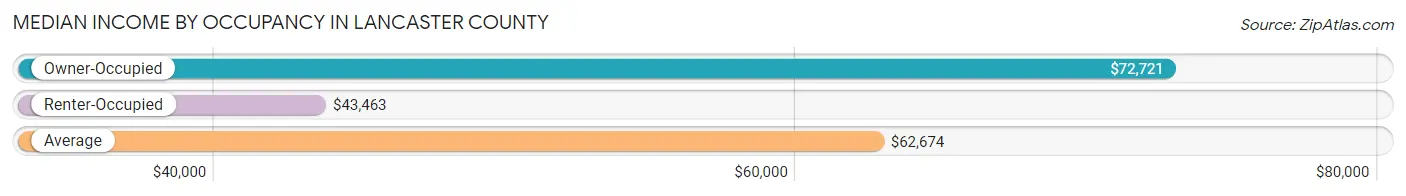
| Occupancy Type | # Households | Median Income |
| Owner-Occupied | 4,305 (82.2%) | $72,721 |
| Renter-Occupied | 933 (17.8%) | $43,463 |
| Average | 5,238 (100.0%) | $62,674 |
Occupancy by Householder Income Bracket in Lancaster County
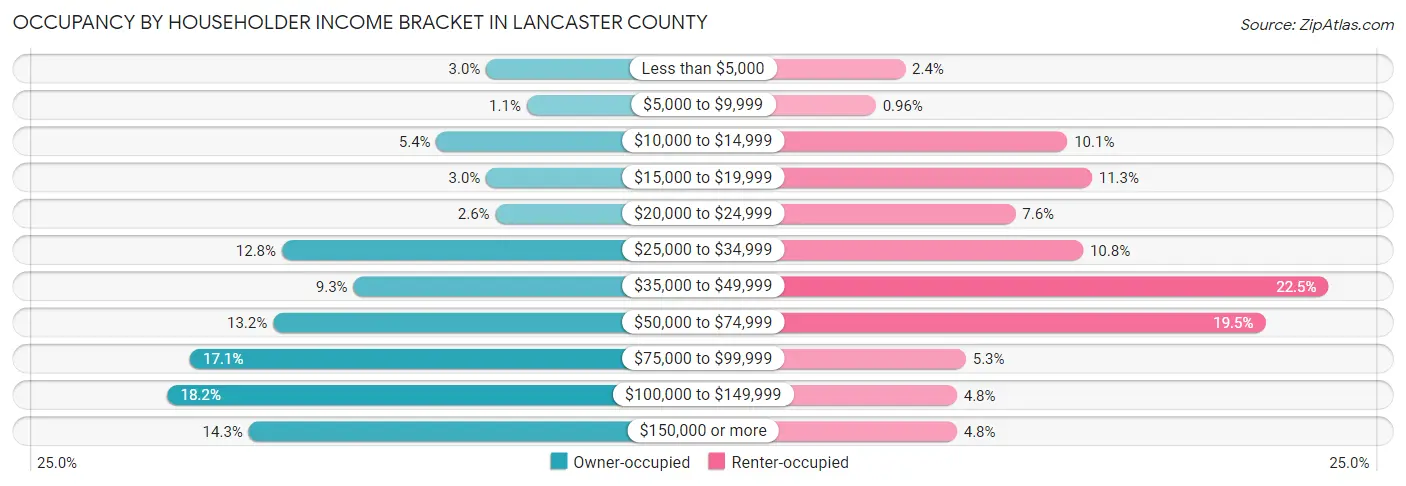
| Income Bracket | Owner-occupied | Renter-occupied |
| Less than $5,000 | 130 (3.0%) | 22 (2.4%) |
| $5,000 to $9,999 | 47 (1.1%) | 9 (1.0%) |
| $10,000 to $14,999 | 232 (5.4%) | 94 (10.1%) |
| $15,000 to $19,999 | 130 (3.0%) | 105 (11.3%) |
| $20,000 to $24,999 | 111 (2.6%) | 71 (7.6%) |
| $25,000 to $34,999 | 549 (12.8%) | 101 (10.8%) |
| $35,000 to $49,999 | 402 (9.3%) | 210 (22.5%) |
| $50,000 to $74,999 | 567 (13.2%) | 182 (19.5%) |
| $75,000 to $99,999 | 737 (17.1%) | 49 (5.2%) |
| $100,000 to $149,999 | 783 (18.2%) | 45 (4.8%) |
| $150,000 or more | 617 (14.3%) | 45 (4.8%) |
| Total | 4,305 (100.0%) | 933 (100.0%) |
Monthly Housing Cost Tiers in Lancaster County
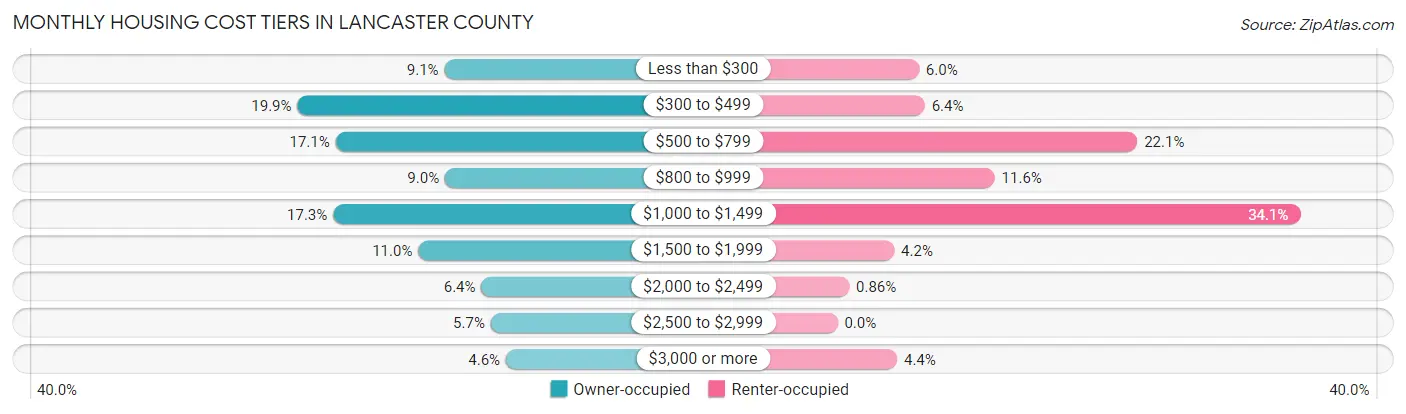
| Monthly Cost | Owner-occupied | Renter-occupied |
| Less than $300 | 391 (9.1%) | 56 (6.0%) |
| $300 to $499 | 857 (19.9%) | 60 (6.4%) |
| $500 to $799 | 736 (17.1%) | 206 (22.1%) |
| $800 to $999 | 389 (9.0%) | 108 (11.6%) |
| $1,000 to $1,499 | 744 (17.3%) | 318 (34.1%) |
| $1,500 to $1,999 | 474 (11.0%) | 39 (4.2%) |
| $2,000 to $2,499 | 274 (6.4%) | 8 (0.9%) |
| $2,500 to $2,999 | 244 (5.7%) | 0 (0.0%) |
| $3,000 or more | 196 (4.5%) | 41 (4.4%) |
| Total | 4,305 (100.0%) | 933 (100.0%) |
Physical Housing Characteristics in Lancaster County
Housing Structures in Lancaster County
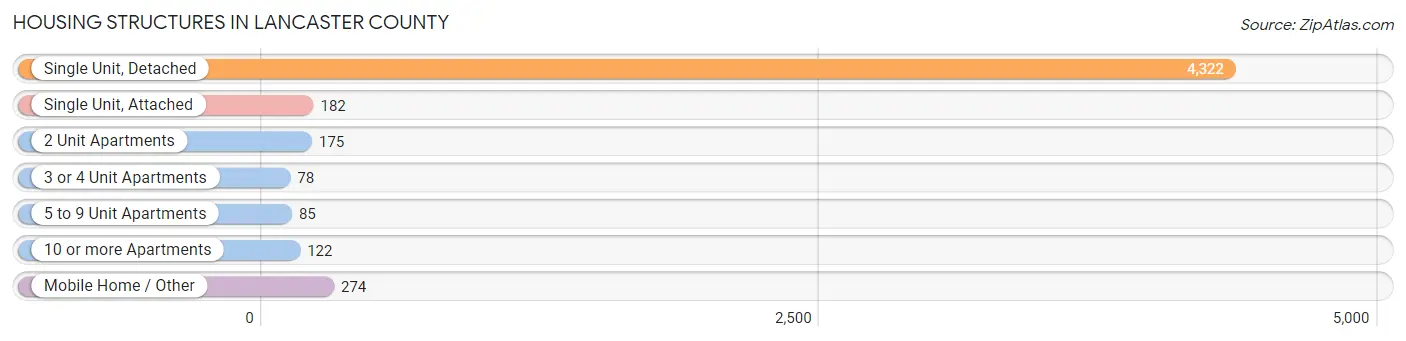
| Structure Type | # Housing Units | % Housing Units |
| Single Unit, Detached | 4,322 | 82.5% |
| Single Unit, Attached | 182 | 3.5% |
| 2 Unit Apartments | 175 | 3.3% |
| 3 or 4 Unit Apartments | 78 | 1.5% |
| 5 to 9 Unit Apartments | 85 | 1.6% |
| 10 or more Apartments | 122 | 2.3% |
| Mobile Home / Other | 274 | 5.2% |
| Total | 5,238 | 100.0% |
Housing Structures by Occupancy in Lancaster County
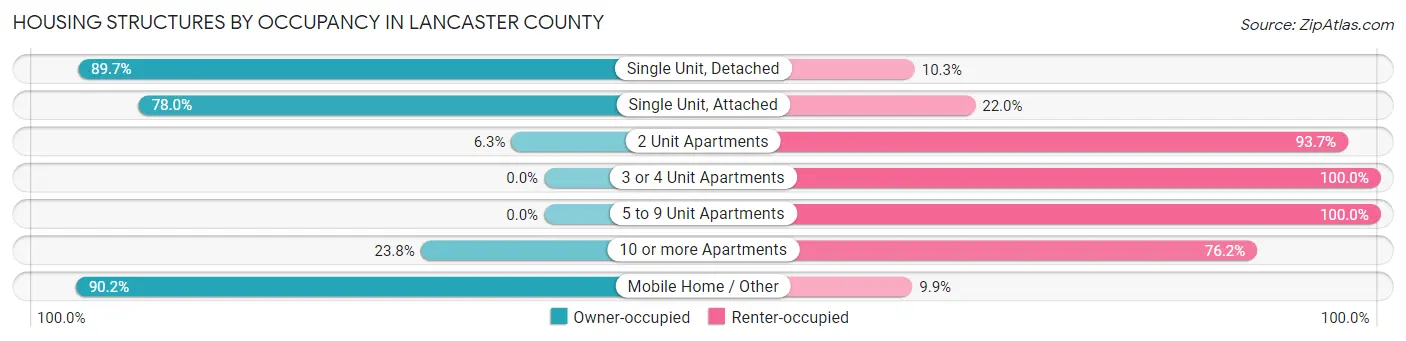
| Structure Type | Owner-occupied | Renter-occupied |
| Single Unit, Detached | 3,876 (89.7%) | 446 (10.3%) |
| Single Unit, Attached | 142 (78.0%) | 40 (22.0%) |
| 2 Unit Apartments | 11 (6.3%) | 164 (93.7%) |
| 3 or 4 Unit Apartments | 0 (0.0%) | 78 (100.0%) |
| 5 to 9 Unit Apartments | 0 (0.0%) | 85 (100.0%) |
| 10 or more Apartments | 29 (23.8%) | 93 (76.2%) |
| Mobile Home / Other | 247 (90.1%) | 27 (9.9%) |
| Total | 4,305 (82.2%) | 933 (17.8%) |
Housing Structures by Number of Rooms in Lancaster County
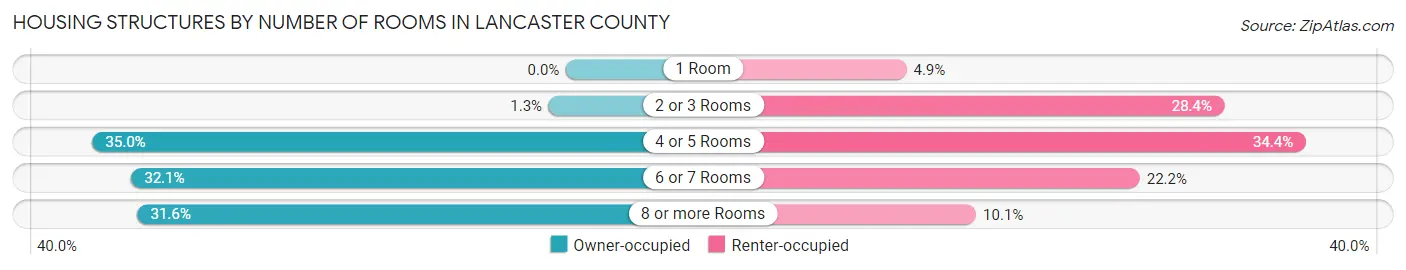
| Number of Rooms | Owner-occupied | Renter-occupied |
| 1 Room | 0 (0.0%) | 46 (4.9%) |
| 2 or 3 Rooms | 55 (1.3%) | 265 (28.4%) |
| 4 or 5 Rooms | 1,506 (35.0%) | 321 (34.4%) |
| 6 or 7 Rooms | 1,382 (32.1%) | 207 (22.2%) |
| 8 or more Rooms | 1,362 (31.6%) | 94 (10.1%) |
| Total | 4,305 (100.0%) | 933 (100.0%) |
Housing Structure by Heating Type in Lancaster County
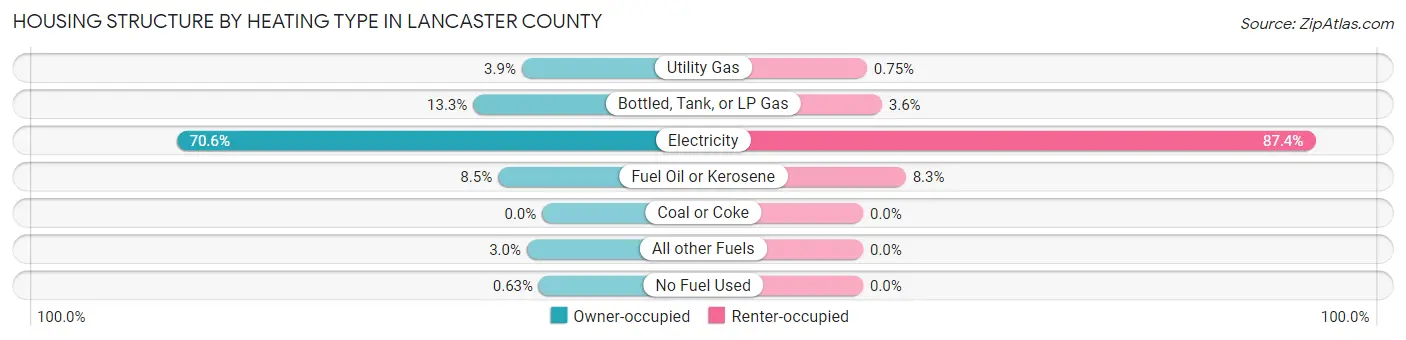
| Heating Type | Owner-occupied | Renter-occupied |
| Utility Gas | 169 (3.9%) | 7 (0.7%) |
| Bottled, Tank, or LP Gas | 574 (13.3%) | 34 (3.6%) |
| Electricity | 3,041 (70.6%) | 815 (87.4%) |
| Fuel Oil or Kerosene | 367 (8.5%) | 77 (8.3%) |
| Coal or Coke | 0 (0.0%) | 0 (0.0%) |
| All other Fuels | 127 (2.9%) | 0 (0.0%) |
| No Fuel Used | 27 (0.6%) | 0 (0.0%) |
| Total | 4,305 (100.0%) | 933 (100.0%) |
Household Vehicle Usage in Lancaster County
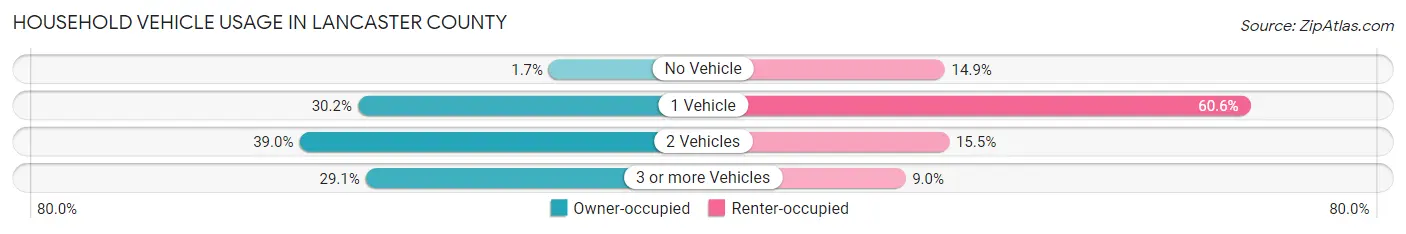
| Vehicles per Household | Owner-occupied | Renter-occupied |
| No Vehicle | 73 (1.7%) | 139 (14.9%) |
| 1 Vehicle | 1,302 (30.2%) | 565 (60.6%) |
| 2 Vehicles | 1,678 (39.0%) | 145 (15.5%) |
| 3 or more Vehicles | 1,252 (29.1%) | 84 (9.0%) |
| Total | 4,305 (100.0%) | 933 (100.0%) |
Real Estate & Mortgages in Lancaster County
Real Estate and Mortgage Overview in Lancaster County
| Characteristic | Without Mortgage | With Mortgage |
| Housing Units | 2,214 | 2,091 |
| Median Property Value | $302,300 | $288,500 |
| Median Household Income | $49,600 | $429 |
| Monthly Housing Costs | $494 | $196 |
| Real Estate Taxes | $1,505 | $23 |
Property Value by Mortgage Status in Lancaster County
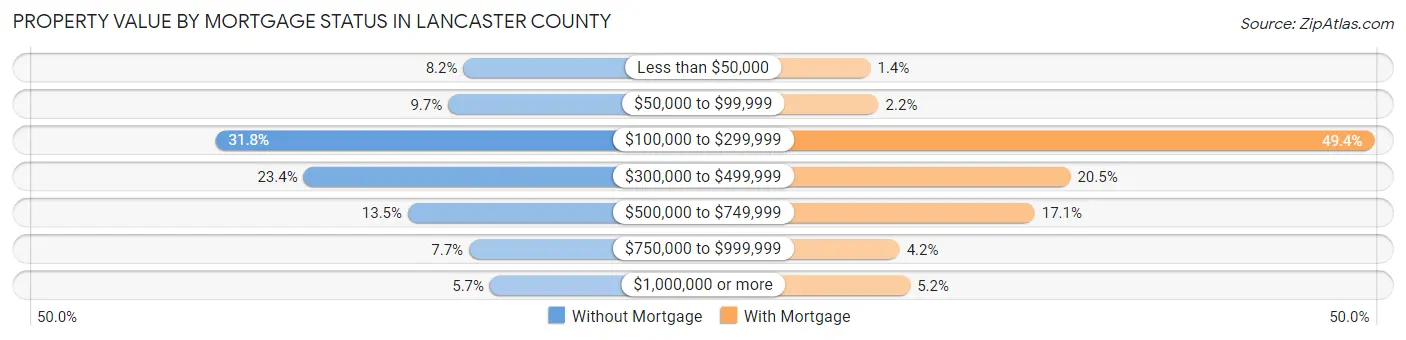
| Property Value | Without Mortgage | With Mortgage |
| Less than $50,000 | 182 (8.2%) | 30 (1.4%) |
| $50,000 to $99,999 | 214 (9.7%) | 46 (2.2%) |
| $100,000 to $299,999 | 704 (31.8%) | 1,033 (49.4%) |
| $300,000 to $499,999 | 519 (23.4%) | 428 (20.5%) |
| $500,000 to $749,999 | 299 (13.5%) | 357 (17.1%) |
| $750,000 to $999,999 | 170 (7.7%) | 88 (4.2%) |
| $1,000,000 or more | 126 (5.7%) | 109 (5.2%) |
| Total | 2,214 (100.0%) | 2,091 (100.0%) |
Household Income by Mortgage Status in Lancaster County
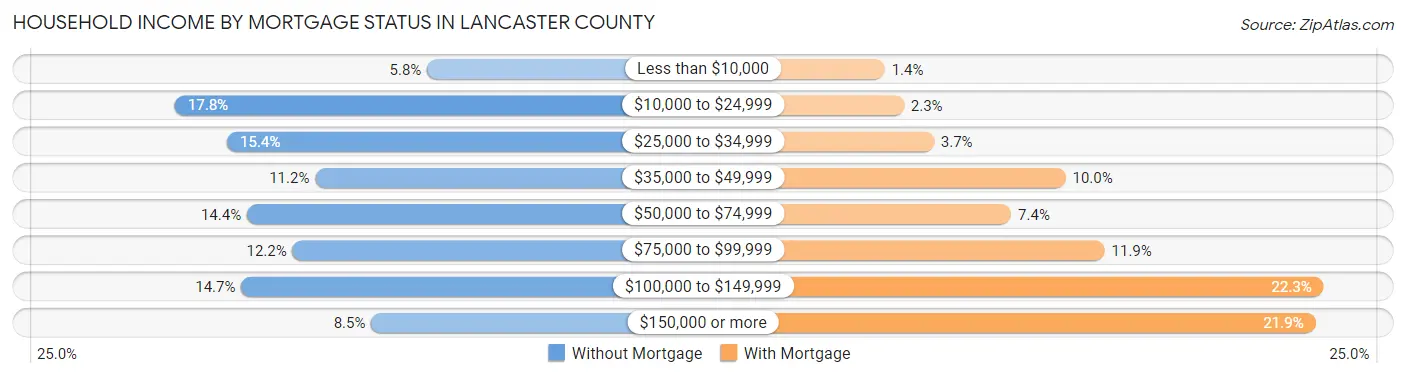
| Household Income | Without Mortgage | With Mortgage |
| Less than $10,000 | 129 (5.8%) | 29 (1.4%) |
| $10,000 to $24,999 | 395 (17.8%) | 48 (2.3%) |
| $25,000 to $34,999 | 340 (15.4%) | 78 (3.7%) |
| $35,000 to $49,999 | 247 (11.2%) | 209 (10.0%) |
| $50,000 to $74,999 | 319 (14.4%) | 155 (7.4%) |
| $75,000 to $99,999 | 271 (12.2%) | 248 (11.9%) |
| $100,000 to $149,999 | 325 (14.7%) | 466 (22.3%) |
| $150,000 or more | 188 (8.5%) | 458 (21.9%) |
| Total | 2,214 (100.0%) | 2,091 (100.0%) |
Property Value to Household Income Ratio in Lancaster County
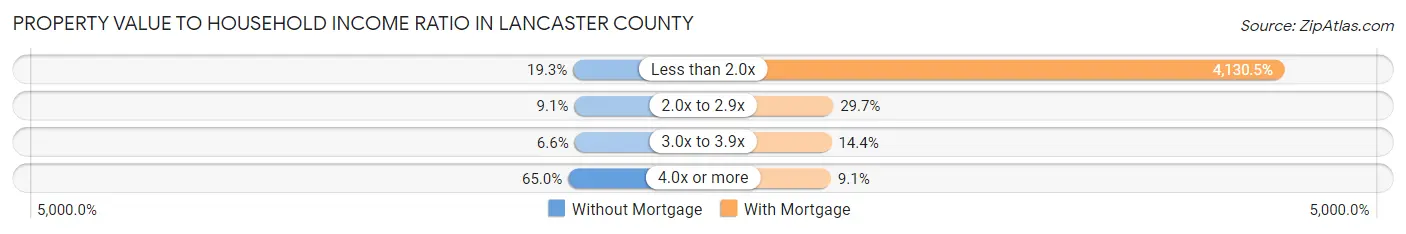
| Value-to-Income Ratio | Without Mortgage | With Mortgage |
| Less than 2.0x | 428 (19.3%) | 86,369 (4,130.5%) |
| 2.0x to 2.9x | 201 (9.1%) | 621 (29.7%) |
| 3.0x to 3.9x | 147 (6.6%) | 300 (14.3%) |
| 4.0x or more | 1,438 (64.9%) | 191 (9.1%) |
| Total | 2,214 (100.0%) | 2,091 (100.0%) |
Real Estate Taxes by Mortgage Status in Lancaster County
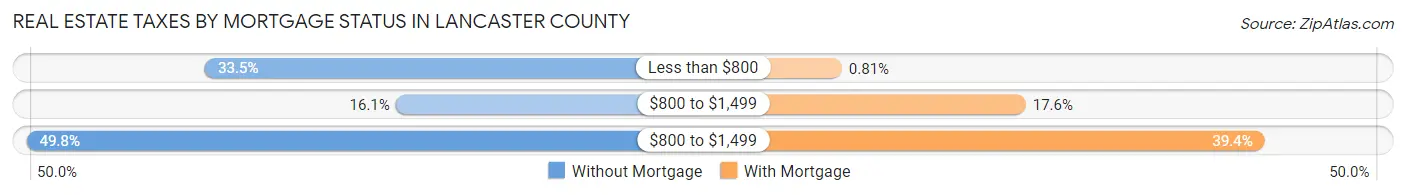
| Property Taxes | Without Mortgage | With Mortgage |
| Less than $800 | 742 (33.5%) | 17 (0.8%) |
| $800 to $1,499 | 357 (16.1%) | 368 (17.6%) |
| $800 to $1,499 | 1,103 (49.8%) | 824 (39.4%) |
| Total | 2,214 (100.0%) | 2,091 (100.0%) |
Health & Disability in Lancaster County
Health Insurance Coverage by Age in Lancaster County
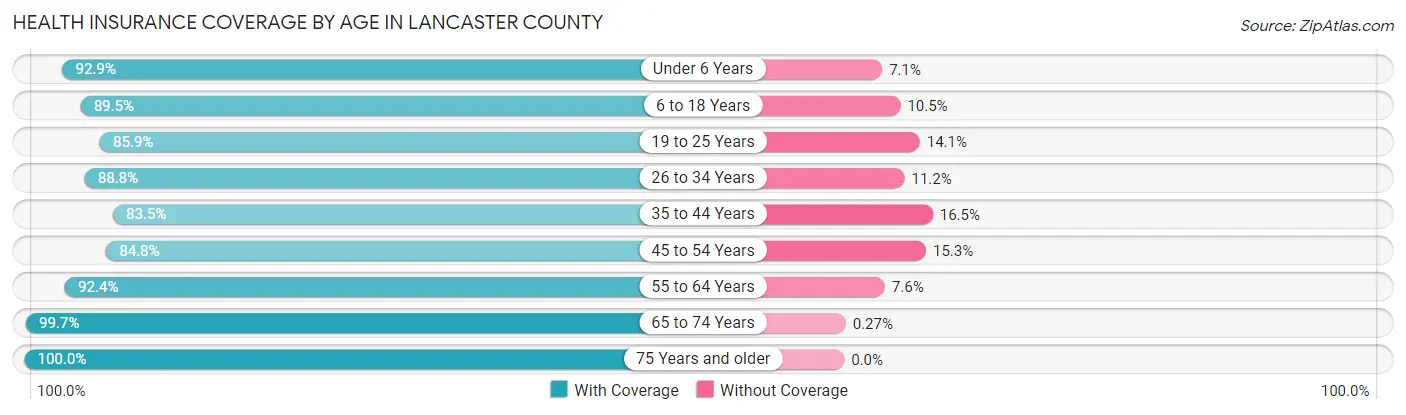
| Age Bracket | With Coverage | Without Coverage |
| Under 6 Years | 433 (92.9%) | 33 (7.1%) |
| 6 to 18 Years | 1,120 (89.5%) | 131 (10.5%) |
| 19 to 25 Years | 354 (85.9%) | 58 (14.1%) |
| 26 to 34 Years | 577 (88.8%) | 73 (11.2%) |
| 35 to 44 Years | 642 (83.5%) | 127 (16.5%) |
| 45 to 54 Years | 1,006 (84.8%) | 181 (15.2%) |
| 55 to 64 Years | 1,625 (92.4%) | 133 (7.6%) |
| 65 to 74 Years | 2,230 (99.7%) | 6 (0.3%) |
| 75 Years and older | 1,880 (100.0%) | 0 (0.0%) |
| Total | 9,867 (93.0%) | 742 (7.0%) |
Health Insurance Coverage by Citizenship Status in Lancaster County
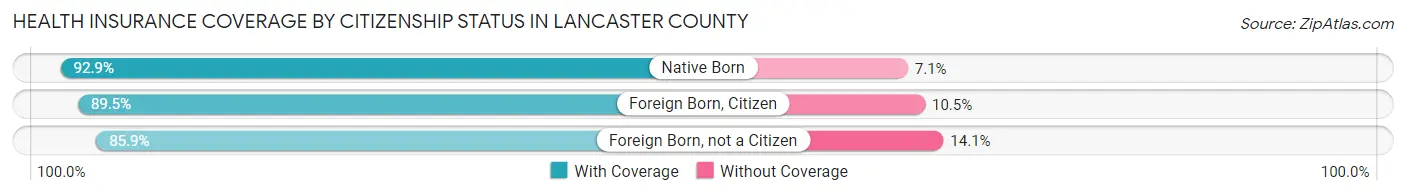
| Citizenship Status | With Coverage | Without Coverage |
| Native Born | 433 (92.9%) | 33 (7.1%) |
| Foreign Born, Citizen | 1,120 (89.5%) | 131 (10.5%) |
| Foreign Born, not a Citizen | 354 (85.9%) | 58 (14.1%) |
Health Insurance Coverage by Household Income in Lancaster County
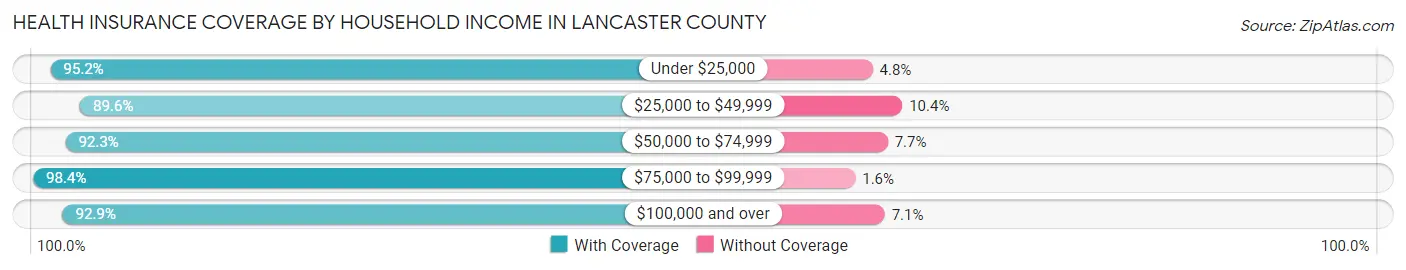
| Household Income | With Coverage | Without Coverage |
| Under $25,000 | 1,200 (95.2%) | 61 (4.8%) |
| $25,000 to $49,999 | 2,364 (89.6%) | 274 (10.4%) |
| $50,000 to $74,999 | 1,532 (92.3%) | 127 (7.7%) |
| $75,000 to $99,999 | 1,424 (98.4%) | 23 (1.6%) |
| $100,000 and over | 3,329 (92.9%) | 255 (7.1%) |
Public vs Private Health Insurance Coverage by Age in Lancaster County
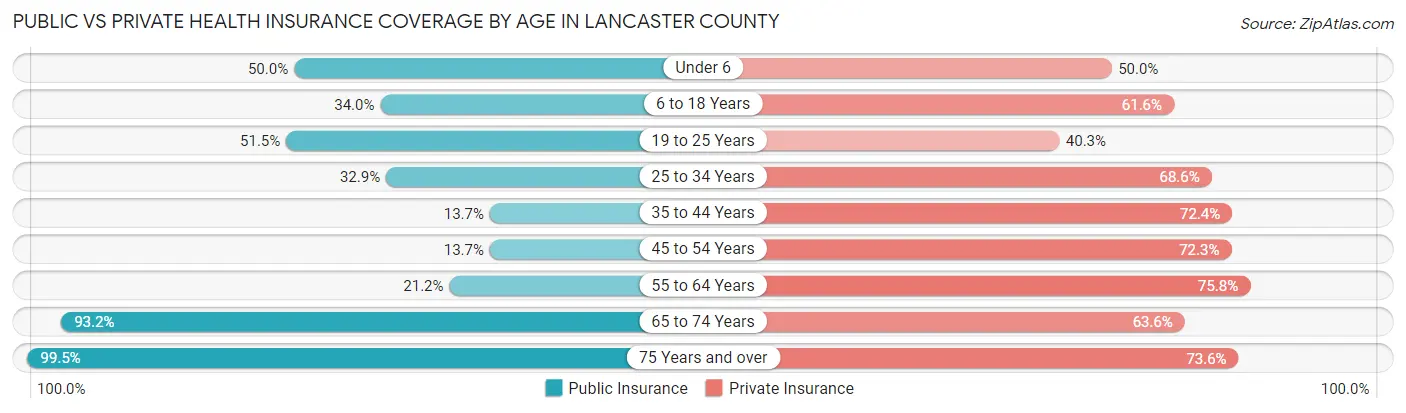
| Age Bracket | Public Insurance | Private Insurance |
| Under 6 | 233 (50.0%) | 233 (50.0%) |
| 6 to 18 Years | 425 (34.0%) | 771 (61.6%) |
| 19 to 25 Years | 212 (51.5%) | 166 (40.3%) |
| 25 to 34 Years | 214 (32.9%) | 446 (68.6%) |
| 35 to 44 Years | 105 (13.7%) | 557 (72.4%) |
| 45 to 54 Years | 162 (13.7%) | 858 (72.3%) |
| 55 to 64 Years | 372 (21.2%) | 1,332 (75.8%) |
| 65 to 74 Years | 2,084 (93.2%) | 1,423 (63.6%) |
| 75 Years and over | 1,870 (99.5%) | 1,384 (73.6%) |
| Total | 5,677 (53.5%) | 7,170 (67.6%) |
Disability Status by Sex by Age in Lancaster County
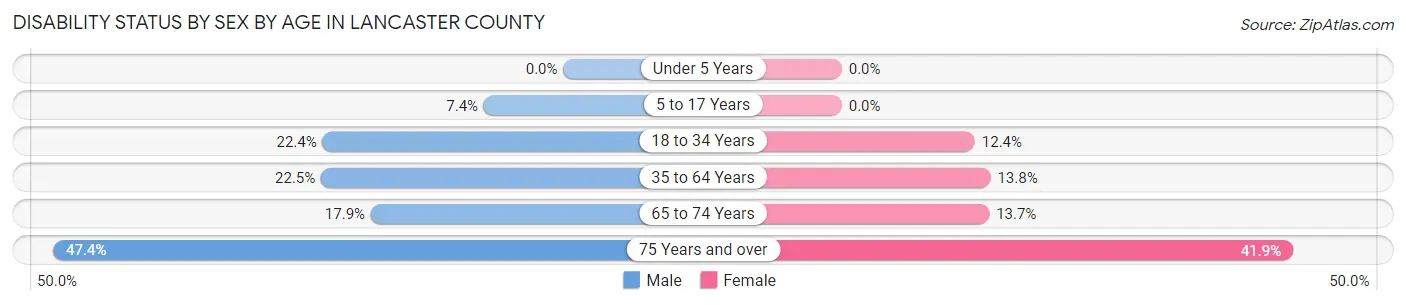
| Age Bracket | Male | Female |
| Under 5 Years | 0 (0.0%) | 0 (0.0%) |
| 5 to 17 Years | 48 (7.4%) | 0 (0.0%) |
| 18 to 34 Years | 118 (22.4%) | 81 (12.3%) |
| 35 to 64 Years | 400 (22.5%) | 267 (13.8%) |
| 65 to 74 Years | 197 (17.9%) | 155 (13.7%) |
| 75 Years and over | 430 (47.4%) | 407 (41.9%) |
Disability Class by Sex by Age in Lancaster County
Disability Class: Hearing Difficulty
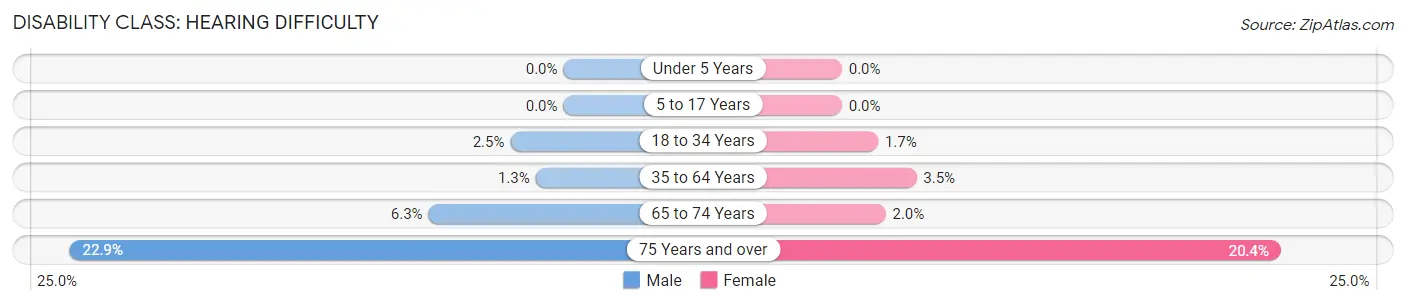
| Age Bracket | Male | Female |
| Under 5 Years | 0 (0.0%) | 0 (0.0%) |
| 5 to 17 Years | 0 (0.0%) | 0 (0.0%) |
| 18 to 34 Years | 13 (2.5%) | 11 (1.7%) |
| 35 to 64 Years | 23 (1.3%) | 67 (3.5%) |
| 65 to 74 Years | 69 (6.3%) | 23 (2.0%) |
| 75 Years and over | 208 (22.9%) | 198 (20.4%) |
Disability Class: Vision Difficulty
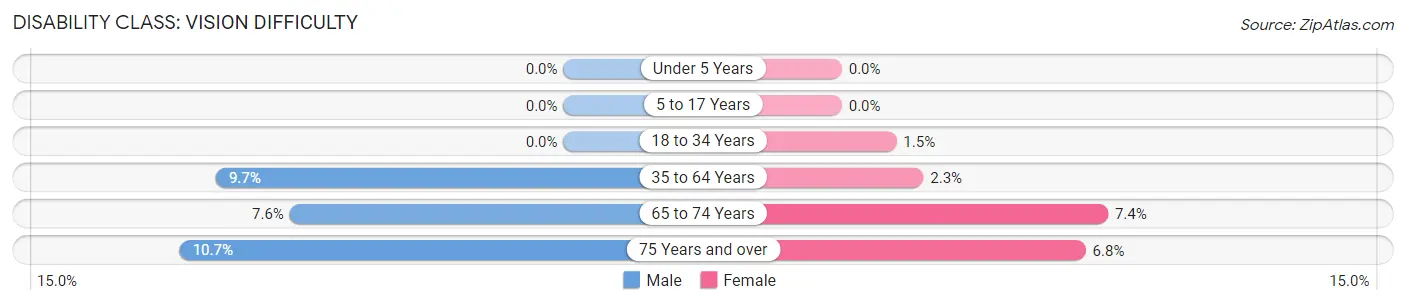
| Age Bracket | Male | Female |
| Under 5 Years | 0 (0.0%) | 0 (0.0%) |
| 5 to 17 Years | 0 (0.0%) | 0 (0.0%) |
| 18 to 34 Years | 0 (0.0%) | 10 (1.5%) |
| 35 to 64 Years | 172 (9.7%) | 44 (2.3%) |
| 65 to 74 Years | 84 (7.6%) | 84 (7.4%) |
| 75 Years and over | 97 (10.7%) | 66 (6.8%) |
Disability Class: Cognitive Difficulty
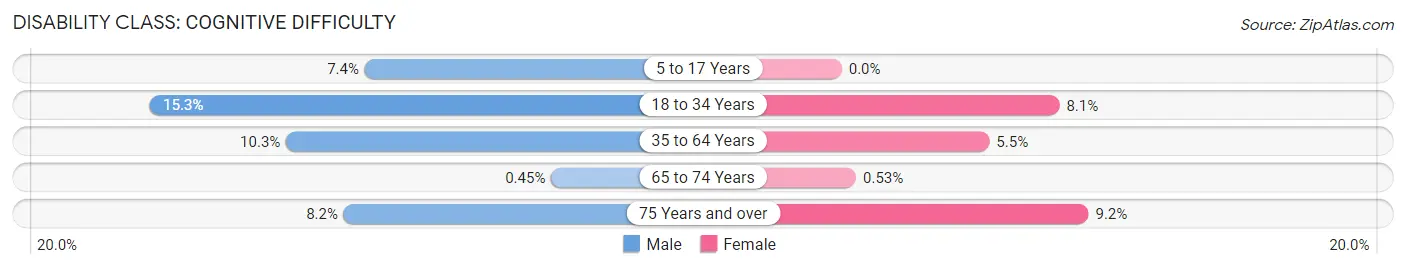
| Age Bracket | Male | Female |
| 5 to 17 Years | 48 (7.4%) | 0 (0.0%) |
| 18 to 34 Years | 81 (15.3%) | 53 (8.1%) |
| 35 to 64 Years | 183 (10.3%) | 106 (5.5%) |
| 65 to 74 Years | 5 (0.4%) | 6 (0.5%) |
| 75 Years and over | 74 (8.2%) | 89 (9.2%) |
Disability Class: Ambulatory Difficulty
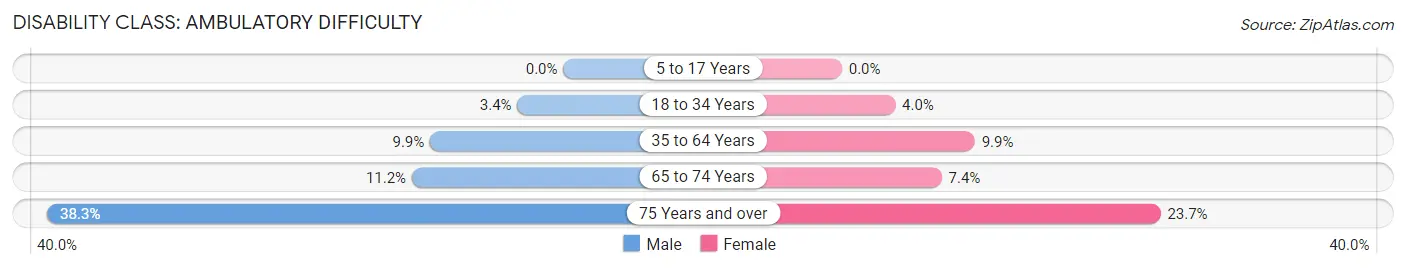
| Age Bracket | Male | Female |
| 5 to 17 Years | 0 (0.0%) | 0 (0.0%) |
| 18 to 34 Years | 18 (3.4%) | 26 (4.0%) |
| 35 to 64 Years | 176 (9.9%) | 191 (9.9%) |
| 65 to 74 Years | 124 (11.2%) | 84 (7.4%) |
| 75 Years and over | 348 (38.3%) | 230 (23.7%) |
Disability Class: Self-Care Difficulty
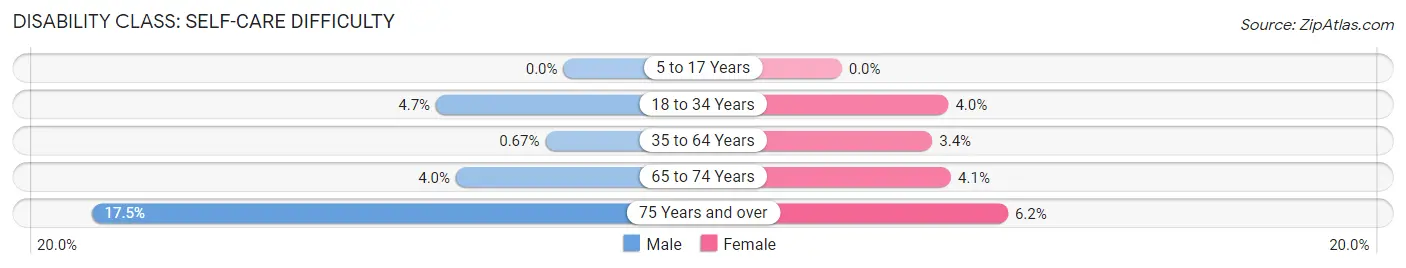
| Age Bracket | Male | Female |
| 5 to 17 Years | 0 (0.0%) | 0 (0.0%) |
| 18 to 34 Years | 25 (4.7%) | 26 (4.0%) |
| 35 to 64 Years | 12 (0.7%) | 65 (3.4%) |
| 65 to 74 Years | 44 (4.0%) | 46 (4.1%) |
| 75 Years and over | 159 (17.5%) | 60 (6.2%) |
Technology Access in Lancaster County
Computing Device Access in Lancaster County
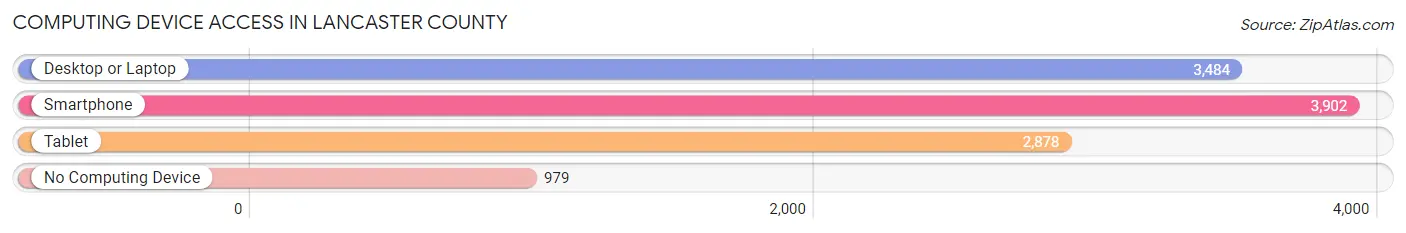
| Device Type | # Households | % Households |
| Desktop or Laptop | 3,484 | 66.5% |
| Smartphone | 3,902 | 74.5% |
| Tablet | 2,878 | 54.9% |
| No Computing Device | 979 | 18.7% |
| Total | 5,238 | 100.0% |
Internet Access in Lancaster County
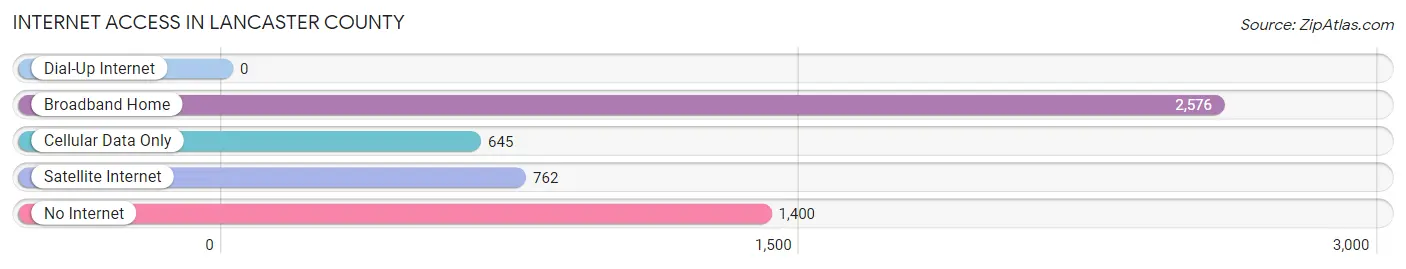
| Internet Type | # Households | % Households |
| Dial-Up Internet | 0 | 0.0% |
| Broadband Home | 2,576 | 49.2% |
| Cellular Data Only | 645 | 12.3% |
| Satellite Internet | 762 | 14.5% |
| No Internet | 1,400 | 26.7% |
| Total | 5,238 | 100.0% |
Lancaster County Summary
Lancaster County is a county located in the Commonwealth of Virginia. It is located on the Northern Neck, a peninsula between the Rappahannock and Potomac Rivers. The county seat is Lancaster Courthouse. As of the 2010 census, the population was 11,391.
History
Lancaster County was established in 1651 from Northumberland County. It was named for James Lancaster, an English explorer who explored the area in 1609. The county was originally part of the Northern Neck Proprietary, a land grant from King Charles II of England to seven of his supporters.
The county was home to several prominent families, including the Carters, Lees, and Washingtons. George Washington's mother, Mary Ball Washington, was born in the county in 1708.
Geography
Lancaster County is located in the Northern Neck of Virginia. It is bordered by Northumberland County to the north, Richmond County to the east, Westmoreland County to the south, and the Potomac River to the west. The county has a total area of 246 square miles, of which 233 square miles is land and 13 square miles is water.
The county is mostly flat, with some rolling hills in the northern and eastern parts. The terrain is mostly covered in forests, with some open fields and agricultural land. The county is home to several rivers, including the Rappahannock, Potomac, and Corrotoman.
Economy
Lancaster County's economy is largely based on agriculture and tourism. The county is home to several farms, which produce a variety of crops, including corn, soybeans, wheat, and hay. The county is also home to several wineries, which produce a variety of wines.
Tourism is also an important part of the county's economy. The county is home to several historic sites, including the Mary Ball Washington Museum and Library, the Lancaster Courthouse, and the White Stone Beach. The county is also home to several parks, including the Rappahannock River Valley National Wildlife Refuge and the George Washington Birthplace National Monument.
Demographics
As of the 2010 census, there were 11,391 people, 4,541 households, and 3,092 families living in the county. The population density was 49 people per square mile. There were 5,093 housing units at an average density of 22 per square mile. The racial makeup of the county was 73.3% White, 22.2% Black or African American, 0.3% Native American, 0.6% Asian, 0.1% Pacific Islander, 1.7% from other races, and 1.8% from two or more races.
The median income for a household in the county was $41,945, and the median income for a family was $50,945. The per capita income for the county was $20,945. About 11.3% of families and 14.2% of the population were below the poverty line, including 19.2% of those under age 18 and 11.2% of those age 65 or over.
Common Questions
What is Per Capita Income in Lancaster County?
Per Capita income in Lancaster County is $46,405.
What is the Median Family Income in Lancaster County?
Median Family Income in Lancaster County is $85,441.
What is the Median Household income in Lancaster County?
Median Household Income in Lancaster County is $62,674.
What is Income or Wage Gap in Lancaster County?
Income or Wage Gap in Lancaster County is 22.1%.
Women in Lancaster County earn 77.9 cents for every dollar earned by a man.
What is Family Income Deficit in Lancaster County?
Family Income Deficit in Lancaster County is $5,913.
Families that are below poverty line in Lancaster County earn $5,913 less on average than the poverty threshold level.
What is Inequality or Gini Index in Lancaster County?
Inequality or Gini Index in Lancaster County is 0.51.
What is the Total Population of Lancaster County?
Total Population of Lancaster County is 10,866.
What is the Total Male Population of Lancaster County?
Total Male Population of Lancaster County is 5,325.
What is the Total Female Population of Lancaster County?
Total Female Population of Lancaster County is 5,541.
What is the Ratio of Males per 100 Females in Lancaster County?
There are 96.10 Males per 100 Females in Lancaster County.
What is the Ratio of Females per 100 Males in Lancaster County?
There are 104.06 Females per 100 Males in Lancaster County.
What is the Median Population Age in Lancaster County?
Median Population Age in Lancaster County is 59.2 Years.
What is the Average Family Size in Lancaster County
Average Family Size in Lancaster County is 2.9 People.
What is the Average Household Size in Lancaster County
Average Household Size in Lancaster County is 2.0 People.
How Large is the Labor Force in Lancaster County?
There are 4,432 People in the Labor Forcein in Lancaster County.
What is the Percentage of People in the Labor Force in Lancaster County?
46.4% of People are in the Labor Force in Lancaster County.
What is the Unemployment Rate in Lancaster County?
Unemployment Rate in Lancaster County is 9.3%.