King William County, VA Map & Demographics
King William County Map
King William County Overview
$36,145
PER CAPITA INCOME
$93,490
AVG FAMILY INCOME
$79,398
AVG HOUSEHOLD INCOME
38.5%
WAGE / INCOME GAP [ % ]
61.5¢/ $1
WAGE / INCOME GAP [ $ ]
0.38
INEQUALITY / GINI INDEX
17,845
TOTAL POPULATION
8,842
MALE POPULATION
9,003
FEMALE POPULATION
98.21
MALES / 100 FEMALES
101.82
FEMALES / 100 MALES
40.8
MEDIAN AGE
3.0
AVG FAMILY SIZE
2.6
AVG HOUSEHOLD SIZE
9,640
LABOR FORCE [ PEOPLE ]
67.7%
PERCENT IN LABOR FORCE
4.0%
UNEMPLOYMENT RATE
King William County Area Codes
Income in King William County
Income Overview in King William County
Per Capita Income in King William County is $36,145, while median incomes of families and households are $93,490 and $79,398 respectively.
| Characteristic | Number | Measure |
| Per Capita Income | 17,845 | $36,145 |
| Median Family Income | 5,110 | $93,490 |
| Mean Family Income | 5,110 | $104,792 |
| Median Household Income | 6,893 | $79,398 |
| Mean Household Income | 6,893 | $91,000 |
| Income Deficit | 5,110 | $0 |
| Wage / Income Gap (%) | 17,845 | 38.55% |
| Wage / Income Gap ($) | 17,845 | 61.45¢ per $1 |
| Gini / Inequality Index | 17,845 | 0.38 |
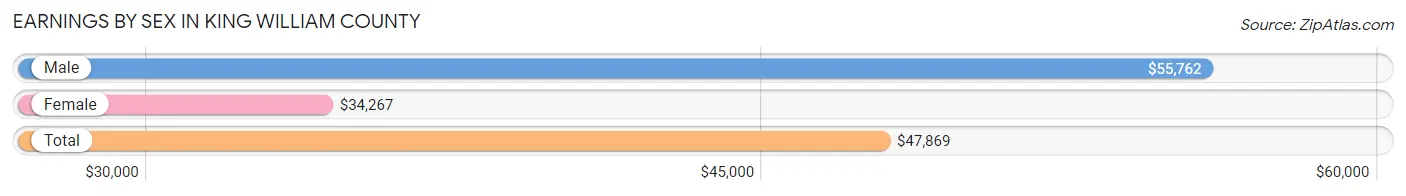
Earnings by Sex in King William County
Average Earnings in King William County are $47,869, $55,762 for men and $34,267 for women, a difference of 38.6%.
| Sex | Number | Average Earnings |
| Male | 4,934 (50.2%) | $55,762 |
| Female | 4,896 (49.8%) | $34,267 |
| Total | 9,830 (100.0%) | $47,869 |
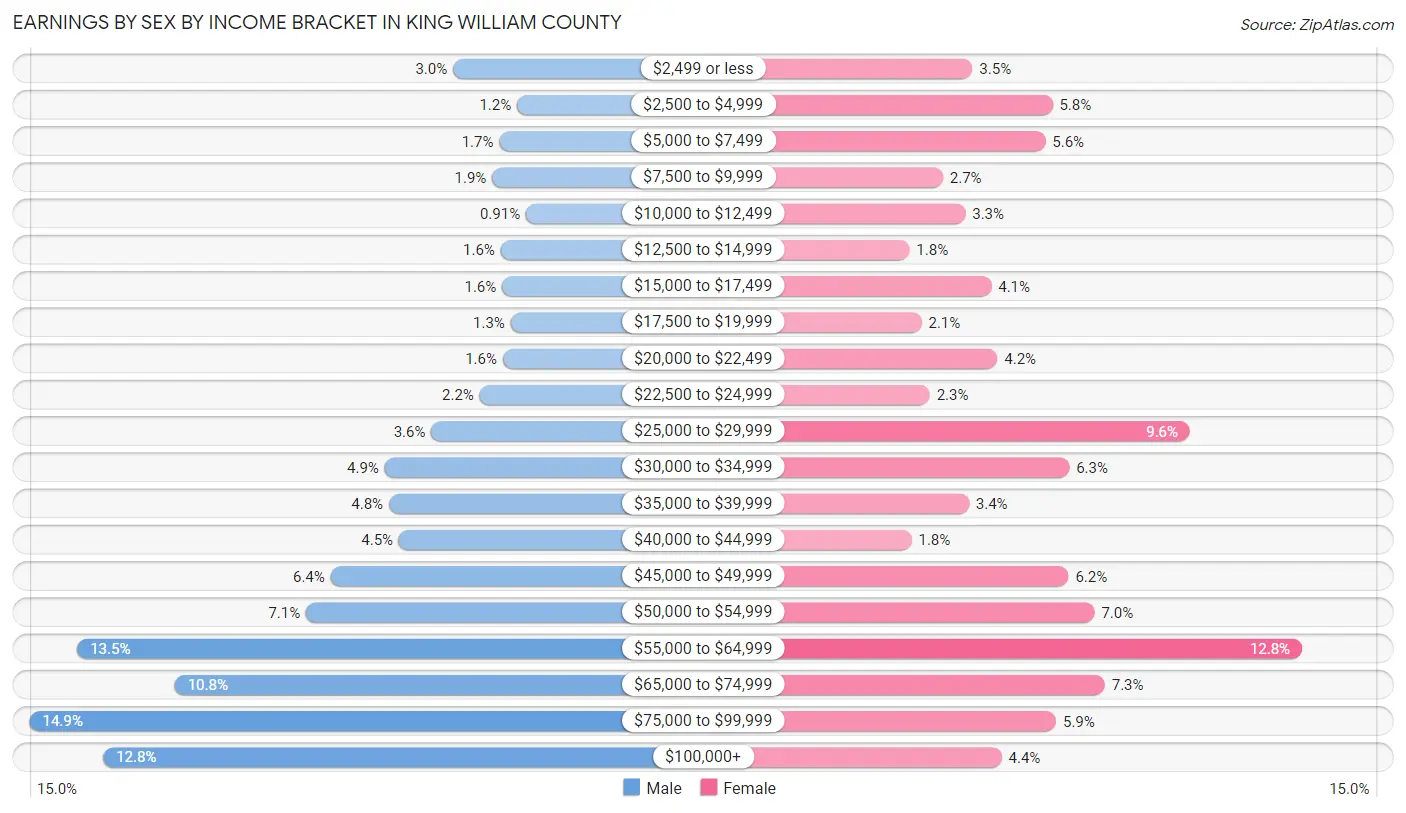
Earnings by Sex by Income Bracket in King William County
The most common earnings brackets in King William County are $75,000 to $99,999 for men (733 | 14.9%) and $55,000 to $64,999 for women (626 | 12.8%).
| Income | Male | Female |
| $2,499 or less | 146 (3.0%) | 173 (3.5%) |
| $2,500 to $4,999 | 57 (1.2%) | 283 (5.8%) |
| $5,000 to $7,499 | 82 (1.7%) | 273 (5.6%) |
| $7,500 to $9,999 | 92 (1.9%) | 132 (2.7%) |
| $10,000 to $12,499 | 45 (0.9%) | 163 (3.3%) |
| $12,500 to $14,999 | 80 (1.6%) | 86 (1.8%) |
| $15,000 to $17,499 | 78 (1.6%) | 199 (4.1%) |
| $17,500 to $19,999 | 66 (1.3%) | 103 (2.1%) |
| $20,000 to $22,499 | 77 (1.6%) | 207 (4.2%) |
| $22,500 to $24,999 | 109 (2.2%) | 114 (2.3%) |
| $25,000 to $29,999 | 176 (3.6%) | 472 (9.6%) |
| $30,000 to $34,999 | 241 (4.9%) | 306 (6.2%) |
| $35,000 to $39,999 | 235 (4.8%) | 168 (3.4%) |
| $40,000 to $44,999 | 221 (4.5%) | 89 (1.8%) |
| $45,000 to $49,999 | 316 (6.4%) | 305 (6.2%) |
| $50,000 to $54,999 | 350 (7.1%) | 341 (7.0%) |
| $55,000 to $64,999 | 667 (13.5%) | 626 (12.8%) |
| $65,000 to $74,999 | 532 (10.8%) | 355 (7.2%) |
| $75,000 to $99,999 | 733 (14.9%) | 288 (5.9%) |
| $100,000+ | 631 (12.8%) | 213 (4.3%) |
| Total | 4,934 (100.0%) | 4,896 (100.0%) |
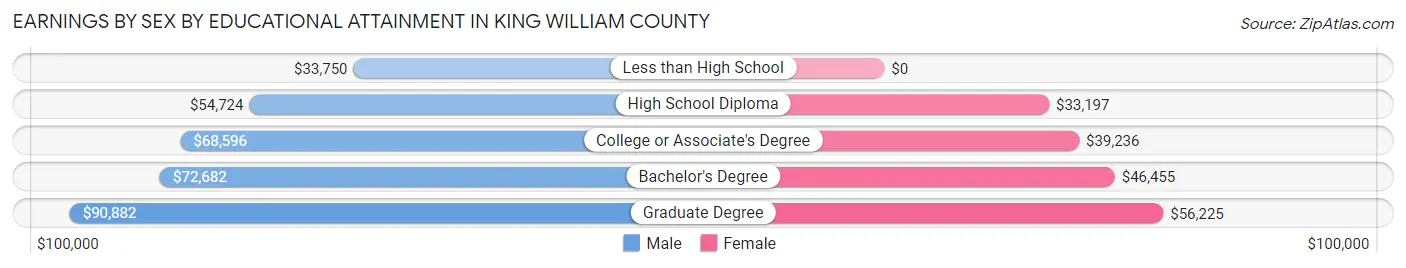
Earnings by Sex by Educational Attainment in King William County
Average earnings in King William County are $57,306 for men and $45,256 for women, a difference of 21.0%. Men with an educational attainment of graduate degree enjoy the highest average annual earnings of $90,882, while those with less than high school education earn the least with $33,750. Women with an educational attainment of graduate degree earn the most with the average annual earnings of $56,225, while those with high school diploma education have the smallest earnings of $33,197.
| Educational Attainment | Male Income | Female Income |
| Less than High School | $33,750 | $0 |
| High School Diploma | $54,724 | $33,197 |
| College or Associate's Degree | $68,596 | $39,236 |
| Bachelor's Degree | $72,682 | $46,455 |
| Graduate Degree | $90,882 | $56,225 |
| Total | $57,306 | $45,256 |
Family Income in King William County
Family Income Brackets in King William County
According to the King William County family income data, there are 1,451 families falling into the $100,000 to $149,999 income range, which is the most common income bracket and makes up 28.4% of all families. Conversely, the $10,000 to $14,999 income bracket is the least frequent group with only 36 families (0.7%) belonging to this category.
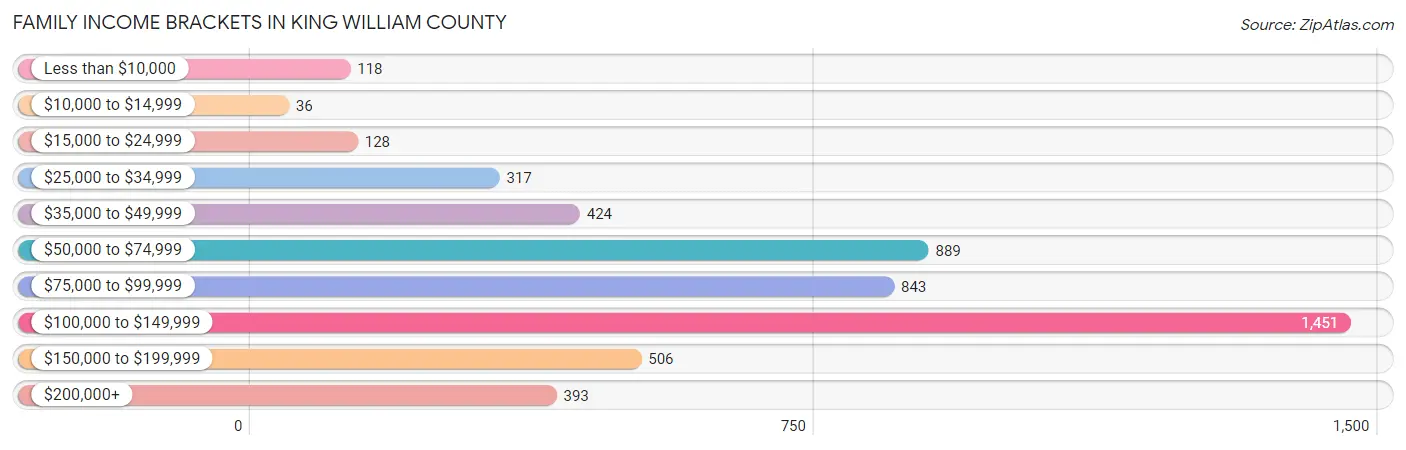
| Income Bracket | # Families | % Families |
| Less than $10,000 | 118 | 2.3% |
| $10,000 to $14,999 | 36 | 0.7% |
| $15,000 to $24,999 | 128 | 2.5% |
| $25,000 to $34,999 | 317 | 6.2% |
| $35,000 to $49,999 | 424 | 8.3% |
| $50,000 to $74,999 | 889 | 17.4% |
| $75,000 to $99,999 | 843 | 16.5% |
| $100,000 to $149,999 | 1,451 | 28.4% |
| $150,000 to $199,999 | 506 | 9.9% |
| $200,000+ | 393 | 7.7% |
Family Income by Famaliy Size in King William County
3-person families (1,139 | 22.3%) account for the highest median family income in King William County with $124,886 per family, while 2-person families (2,680 | 52.4%) have the highest median income of $42,304 per family member.
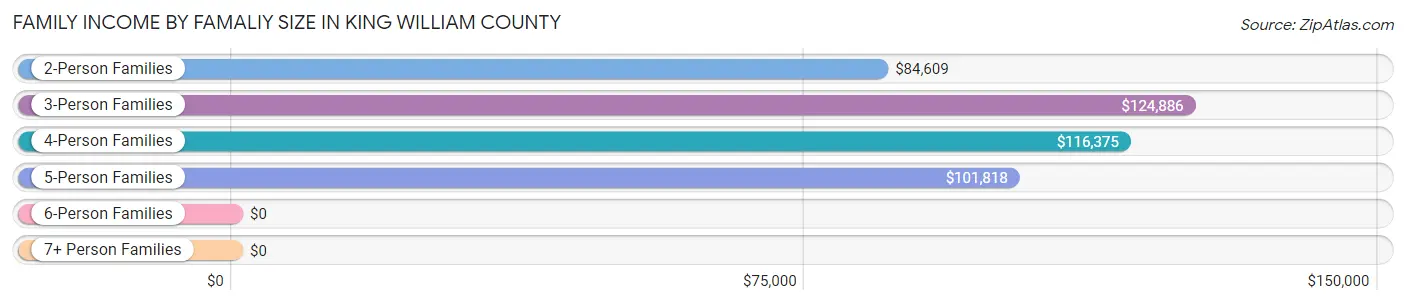
| Income Bracket | # Families | Median Income |
| 2-Person Families | 2,680 (52.4%) | $84,609 |
| 3-Person Families | 1,139 (22.3%) | $124,886 |
| 4-Person Families | 1,039 (20.3%) | $116,375 |
| 5-Person Families | 108 (2.1%) | $101,818 |
| 6-Person Families | 86 (1.7%) | $0 |
| 7+ Person Families | 58 (1.1%) | $0 |
| Total | 5,110 (100.0%) | $93,490 |
Family Income by Number of Earners in King William County
The median family income in King William County is $93,490, with families comprising 3+ earners (572) having the highest median family income of $142,004, while families with no earners (671) have the lowest median family income of $49,291, accounting for 11.2% and 13.1% of families, respectively.
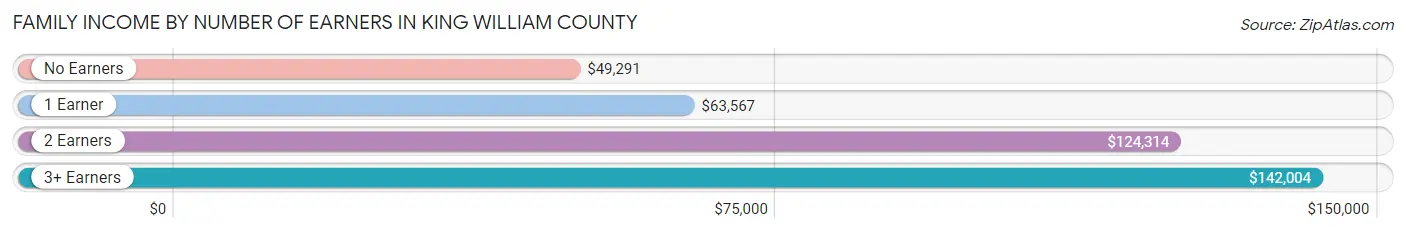
| Number of Earners | # Families | Median Income |
| No Earners | 671 (13.1%) | $49,291 |
| 1 Earner | 1,623 (31.8%) | $63,567 |
| 2 Earners | 2,244 (43.9%) | $124,314 |
| 3+ Earners | 572 (11.2%) | $142,004 |
| Total | 5,110 (100.0%) | $93,490 |
Household Income in King William County
Household Income Brackets in King William County
With 1,599 households falling in the category, the $100,000 to $149,999 income range is the most frequent in King William County, accounting for 23.2% of all households. In contrast, only 83 households (1.2%) fall into the $10,000 to $14,999 income bracket, making it the least populous group.
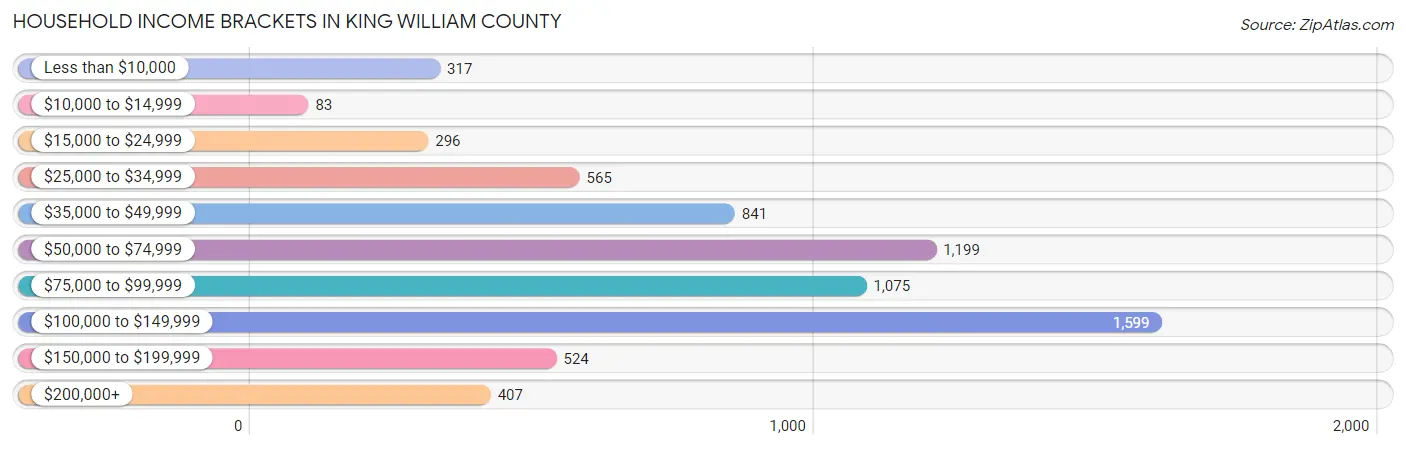
| Income Bracket | # Households | % Households |
| Less than $10,000 | 317 | 4.6% |
| $10,000 to $14,999 | 83 | 1.2% |
| $15,000 to $24,999 | 296 | 4.3% |
| $25,000 to $34,999 | 565 | 8.2% |
| $35,000 to $49,999 | 841 | 12.2% |
| $50,000 to $74,999 | 1,199 | 17.4% |
| $75,000 to $99,999 | 1,075 | 15.6% |
| $100,000 to $149,999 | 1,599 | 23.2% |
| $150,000 to $199,999 | 524 | 7.6% |
| $200,000+ | 407 | 5.9% |
Household Income by Householder Age in King William County
The median household income in King William County is $79,398, with the highest median household income of $88,917 found in the 25 to 44 years age bracket for the primary householder. A total of 2,242 households (32.5%) fall into this category. Meanwhile, the 15 to 24 years age bracket for the primary householder has the lowest median household income of $0, with 66 households (1.0%) in this group.
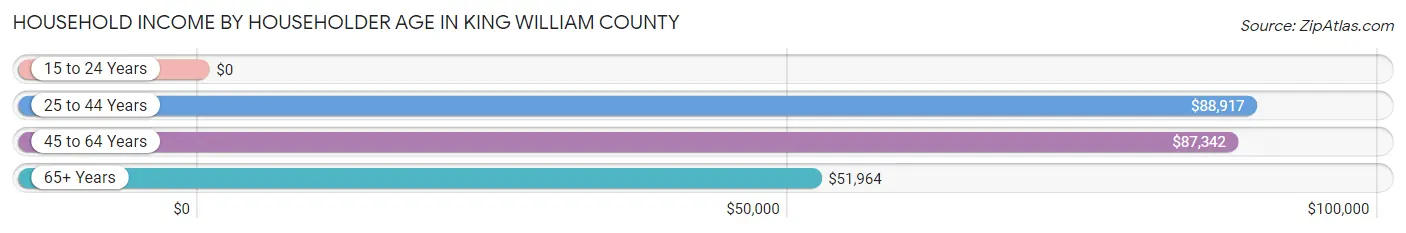
| Income Bracket | # Households | Median Income |
| 15 to 24 Years | 66 (1.0%) | $0 |
| 25 to 44 Years | 2,242 (32.5%) | $88,917 |
| 45 to 64 Years | 2,629 (38.1%) | $87,342 |
| 65+ Years | 1,956 (28.4%) | $51,964 |
| Total | 6,893 (100.0%) | $79,398 |
Poverty in King William County
Income Below Poverty by Sex and Age in King William County
With 8.3% poverty level for males and 7.7% for females among the residents of King William County, 16 and 17 year old males and 15 year old females are the most vulnerable to poverty, with 43 males (27.0%) and 16 females (44.4%) in their respective age groups living below the poverty level.
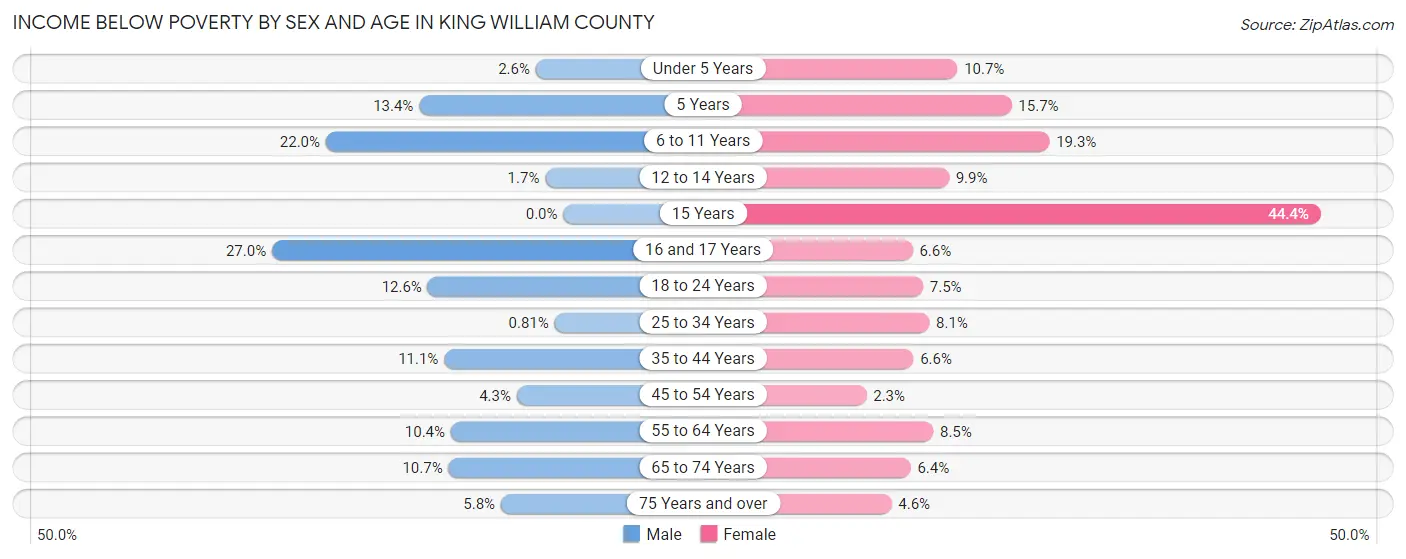
| Age Bracket | Male | Female |
| Under 5 Years | 15 (2.6%) | 51 (10.7%) |
| 5 Years | 21 (13.4%) | 17 (15.7%) |
| 6 to 11 Years | 119 (22.0%) | 87 (19.3%) |
| 12 to 14 Years | 8 (1.7%) | 49 (9.9%) |
| 15 Years | 0 (0.0%) | 16 (44.4%) |
| 16 and 17 Years | 43 (27.0%) | 20 (6.6%) |
| 18 to 24 Years | 92 (12.6%) | 51 (7.5%) |
| 25 to 34 Years | 9 (0.8%) | 98 (8.1%) |
| 35 to 44 Years | 126 (11.1%) | 77 (6.6%) |
| 45 to 54 Years | 50 (4.3%) | 26 (2.3%) |
| 55 to 64 Years | 129 (10.4%) | 109 (8.5%) |
| 65 to 74 Years | 95 (10.7%) | 61 (6.4%) |
| 75 Years and over | 23 (5.8%) | 28 (4.6%) |
| Total | 730 (8.3%) | 690 (7.7%) |
Income Above Poverty by Sex and Age in King William County
According to the poverty statistics in King William County, males aged 15 years and females aged 45 to 54 years are the age groups that are most secure financially, with 100.0% of males and 97.7% of females in these age groups living above the poverty line.
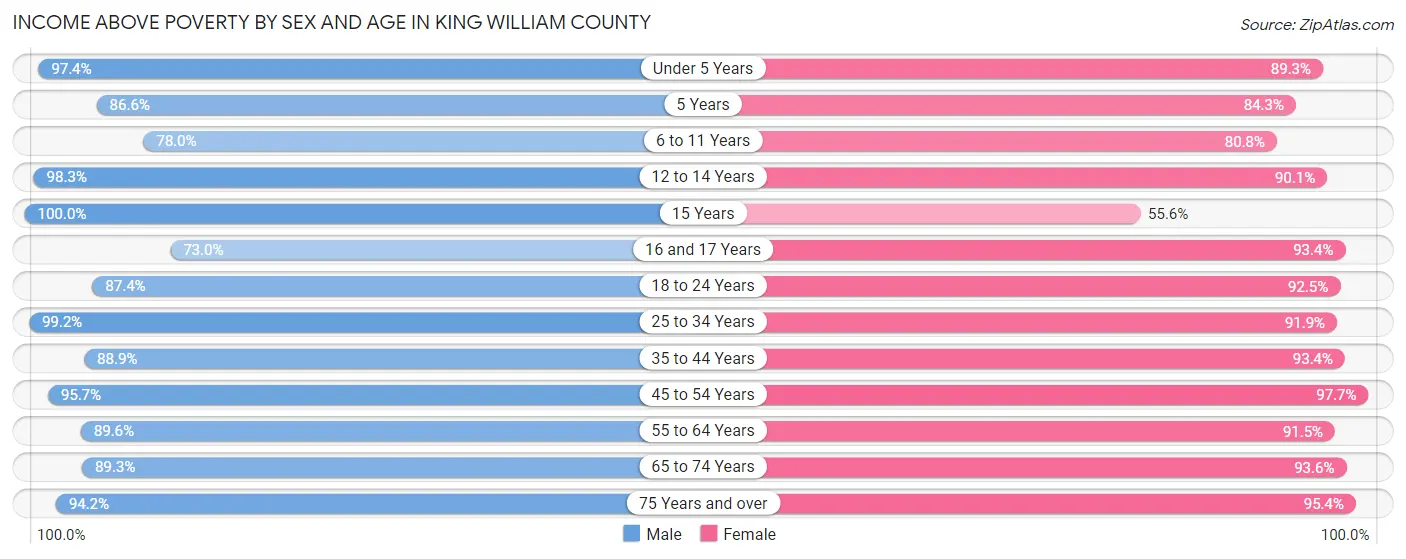
| Age Bracket | Male | Female |
| Under 5 Years | 572 (97.4%) | 425 (89.3%) |
| 5 Years | 136 (86.6%) | 91 (84.3%) |
| 6 to 11 Years | 421 (78.0%) | 365 (80.7%) |
| 12 to 14 Years | 468 (98.3%) | 445 (90.1%) |
| 15 Years | 200 (100.0%) | 20 (55.6%) |
| 16 and 17 Years | 116 (73.0%) | 285 (93.4%) |
| 18 to 24 Years | 639 (87.4%) | 627 (92.5%) |
| 25 to 34 Years | 1,099 (99.2%) | 1,112 (91.9%) |
| 35 to 44 Years | 1,013 (88.9%) | 1,085 (93.4%) |
| 45 to 54 Years | 1,108 (95.7%) | 1,118 (97.7%) |
| 55 to 64 Years | 1,107 (89.6%) | 1,178 (91.5%) |
| 65 to 74 Years | 796 (89.3%) | 896 (93.6%) |
| 75 Years and over | 374 (94.2%) | 581 (95.4%) |
| Total | 8,049 (91.7%) | 8,228 (92.3%) |
Income Below Poverty Among Married-Couple Families in King William County
The poverty statistics for married-couple families in King William County show that 5.2% or 205 of the total 3,926 families live below the poverty line. Families with 5 or more children have the highest poverty rate of 77.6%, comprising of 45 families. On the other hand, families with 1 or 2 children have the lowest poverty rate of 0.8%, which includes 12 families.
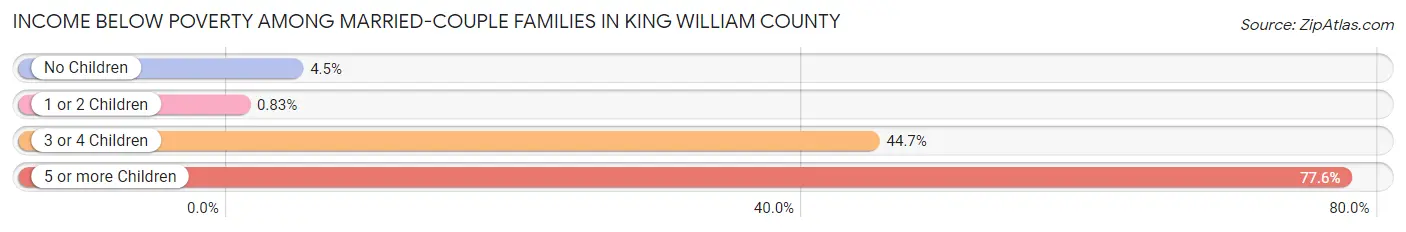
| Children | Above Poverty | Below Poverty |
| No Children | 2,229 (95.5%) | 106 (4.5%) |
| 1 or 2 Children | 1,427 (99.2%) | 12 (0.8%) |
| 3 or 4 Children | 52 (55.3%) | 42 (44.7%) |
| 5 or more Children | 13 (22.4%) | 45 (77.6%) |
| Total | 3,721 (94.8%) | 205 (5.2%) |
Income Below Poverty Among Single-Parent Households in King William County
According to the poverty data in King William County, 15.2% or 59 single-father households and 6.9% or 55 single-mother households are living below the poverty line. Among single-father households, those with 1 or 2 children have the highest poverty rate, with 59 households (27.7%) experiencing poverty. Likewise, among single-mother households, those with 3 or 4 children have the highest poverty rate, with 12 households (33.3%) falling below the poverty line.
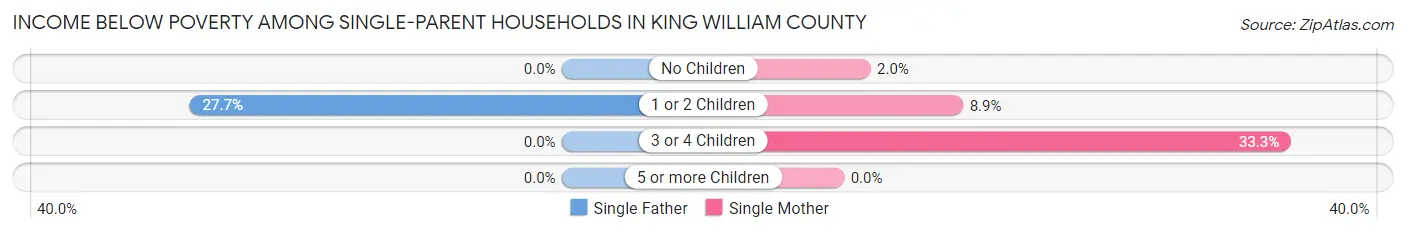
| Children | Single Father | Single Mother |
| No Children | 0 (0.0%) | 7 (2.0%) |
| 1 or 2 Children | 59 (27.7%) | 36 (8.9%) |
| 3 or 4 Children | 0 (0.0%) | 12 (33.3%) |
| 5 or more Children | 0 (0.0%) | 0 (0.0%) |
| Total | 59 (15.2%) | 55 (6.9%) |
Income Below Poverty Among Married-Couple vs Single-Parent Households in King William County
The poverty data for King William County shows that 205 of the married-couple family households (5.2%) and 114 of the single-parent households (9.6%) are living below the poverty level. Within the married-couple family households, those with 5 or more children have the highest poverty rate, with 45 households (77.6%) falling below the poverty line. Among the single-parent households, those with 1 or 2 children have the highest poverty rate, with 95 household (15.3%) living below poverty.
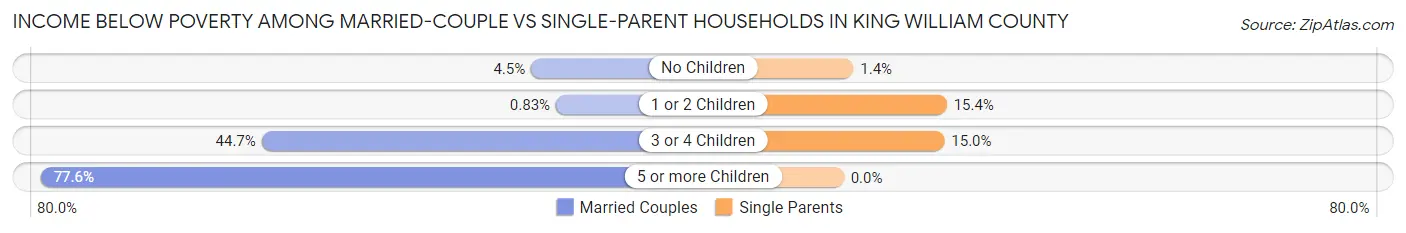
| Children | Married-Couple Families | Single-Parent Households |
| No Children | 106 (4.5%) | 7 (1.4%) |
| 1 or 2 Children | 12 (0.8%) | 95 (15.3%) |
| 3 or 4 Children | 42 (44.7%) | 12 (15.0%) |
| 5 or more Children | 45 (77.6%) | 0 (0.0%) |
| Total | 205 (5.2%) | 114 (9.6%) |
Race in King William County
The most populous races in King William County are White / Caucasian (14,080 | 78.9%), Black / African American (2,665 | 14.9%), and Two or more Races (755 | 4.2%).
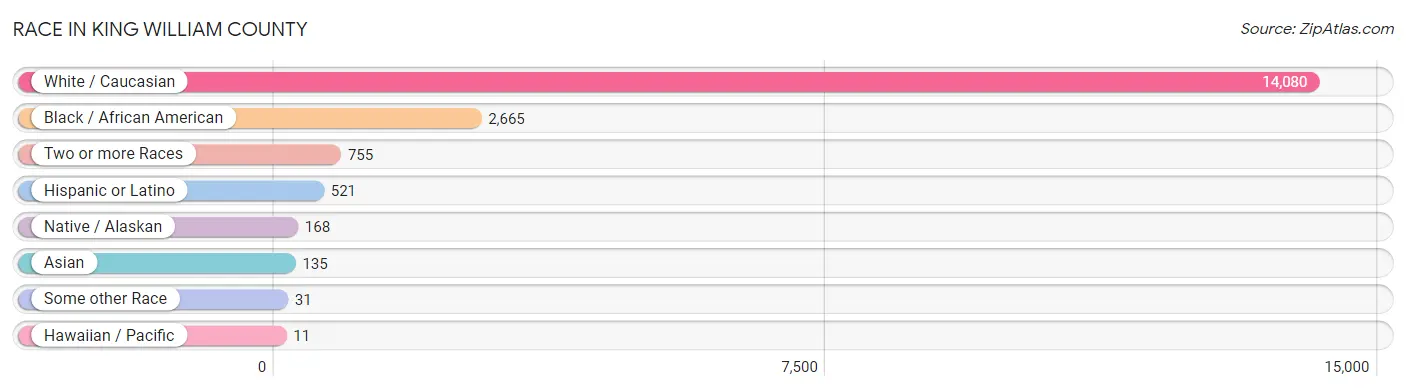
| Race | # Population | % Population |
| Asian | 135 | 0.8% |
| Black / African American | 2,665 | 14.9% |
| Hawaiian / Pacific | 11 | 0.1% |
| Hispanic or Latino | 521 | 2.9% |
| Native / Alaskan | 168 | 0.9% |
| White / Caucasian | 14,080 | 78.9% |
| Two or more Races | 755 | 4.2% |
| Some other Race | 31 | 0.2% |
| Total | 17,845 | 100.0% |
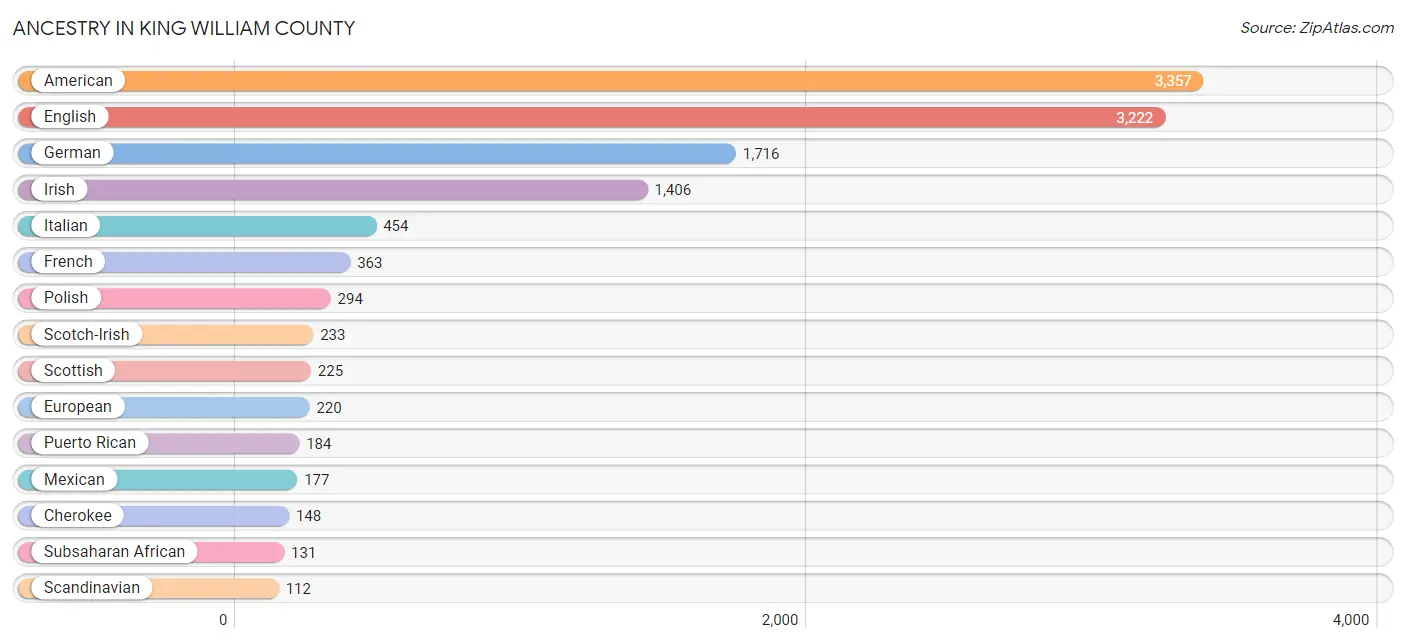
Ancestry in King William County
The most populous ancestries reported in King William County are American (3,357 | 18.8%), English (3,222 | 18.1%), German (1,716 | 9.6%), Irish (1,406 | 7.9%), and Italian (454 | 2.5%), together accounting for 56.9% of all King William County residents.
| Ancestry | # Population | % Population |
| African | 105 | 0.6% |
| American | 3,357 | 18.8% |
| Arab | 32 | 0.2% |
| Brazilian | 32 | 0.2% |
| British | 31 | 0.2% |
| Bulgarian | 1 | 0.0% |
| Canadian | 2 | 0.0% |
| Central American | 51 | 0.3% |
| Cherokee | 148 | 0.8% |
| Colombian | 22 | 0.1% |
| Cuban | 9 | 0.1% |
| Czech | 79 | 0.4% |
| Czechoslovakian | 25 | 0.1% |
| Danish | 3 | 0.0% |
| Dominican | 63 | 0.4% |
| Dutch | 41 | 0.2% |
| Eastern European | 5 | 0.0% |
| English | 3,222 | 18.1% |
| European | 220 | 1.2% |
| Finnish | 21 | 0.1% |
| French | 363 | 2.0% |
| French Canadian | 55 | 0.3% |
| German | 1,716 | 9.6% |
| Greek | 51 | 0.3% |
| Guyanese | 17 | 0.1% |
| Honduran | 36 | 0.2% |
| Hungarian | 18 | 0.1% |
| Indian (Asian) | 48 | 0.3% |
| Irish | 1,406 | 7.9% |
| Italian | 454 | 2.5% |
| Korean | 13 | 0.1% |
| Lebanese | 24 | 0.1% |
| Mexican | 177 | 1.0% |
| Native Hawaiian | 11 | 0.1% |
| Nicaraguan | 5 | 0.0% |
| Nigerian | 26 | 0.2% |
| Norwegian | 100 | 0.6% |
| Panamanian | 10 | 0.1% |
| Polish | 294 | 1.7% |
| Portuguese | 29 | 0.2% |
| Puerto Rican | 184 | 1.0% |
| Russian | 28 | 0.2% |
| Scandinavian | 112 | 0.6% |
| Scotch-Irish | 233 | 1.3% |
| Scottish | 225 | 1.3% |
| South American | 34 | 0.2% |
| Sri Lankan | 43 | 0.2% |
| Subsaharan African | 131 | 0.7% |
| Swedish | 8 | 0.0% |
| Swiss | 103 | 0.6% |
| Syrian | 8 | 0.0% |
| Thai | 56 | 0.3% |
| Turkish | 2 | 0.0% |
| Ukrainian | 101 | 0.6% |
| Venezuelan | 12 | 0.1% |
| Welsh | 110 | 0.6% |
| Yugoslavian | 16 | 0.1% | View All 57 Rows |
Immigrants in King William County
The most numerous immigrant groups reported in King William County came from Latin America (185 | 1.0%), South America (116 | 0.6%), Asia (112 | 0.6%), Europe (93 | 0.5%), and Guyana (80 | 0.4%), together accounting for 3.3% of all King William County residents.
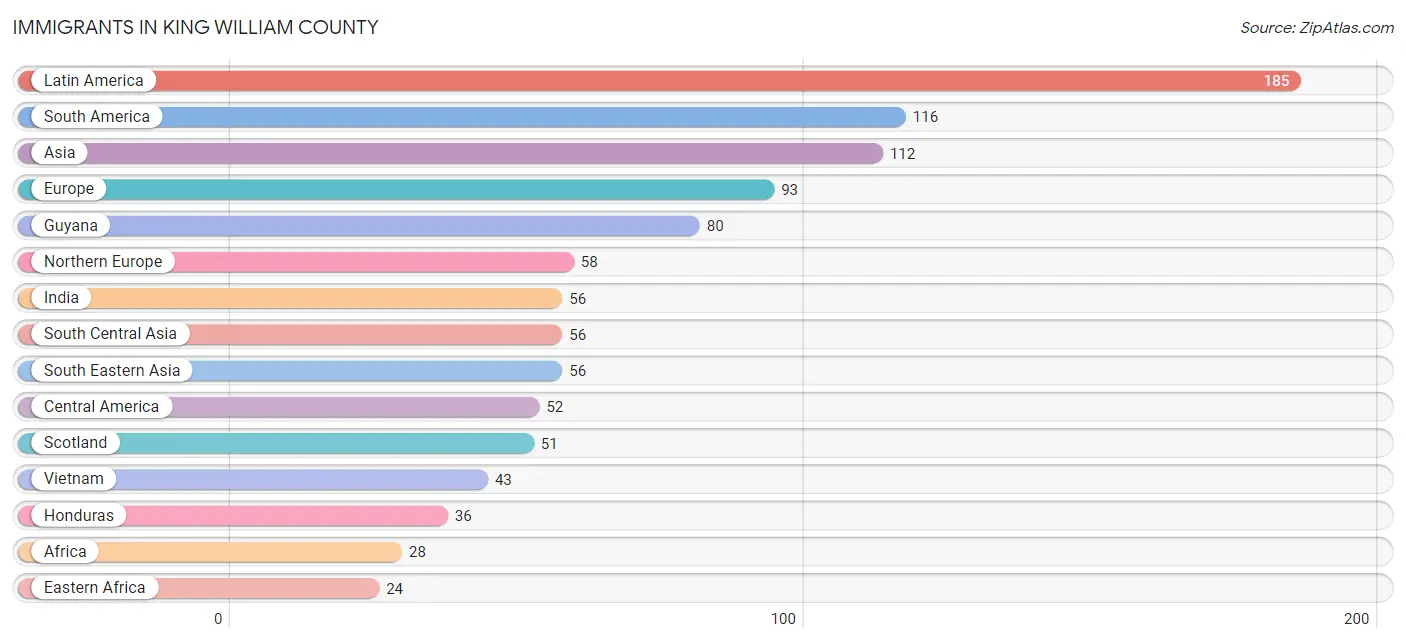
| Immigration Origin | # Population | % Population |
| Africa | 28 | 0.2% |
| Asia | 112 | 0.6% |
| Brazil | 20 | 0.1% |
| Caribbean | 17 | 0.1% |
| Central America | 52 | 0.3% |
| Colombia | 10 | 0.1% |
| Dominican Republic | 17 | 0.1% |
| Eastern Africa | 24 | 0.1% |
| Europe | 93 | 0.5% |
| Germany | 17 | 0.1% |
| Guyana | 80 | 0.4% |
| Honduras | 36 | 0.2% |
| India | 56 | 0.3% |
| Latin America | 185 | 1.0% |
| Mexico | 1 | 0.0% |
| Nicaragua | 5 | 0.0% |
| Nigeria | 4 | 0.0% |
| Northern Europe | 58 | 0.3% |
| Panama | 10 | 0.1% |
| Philippines | 13 | 0.1% |
| Portugal | 7 | 0.0% |
| Scotland | 51 | 0.3% |
| South America | 116 | 0.6% |
| South Central Asia | 56 | 0.3% |
| South Eastern Asia | 56 | 0.3% |
| Southern Europe | 18 | 0.1% |
| Spain | 11 | 0.1% |
| Venezuela | 6 | 0.0% |
| Vietnam | 43 | 0.2% |
| Western Africa | 4 | 0.0% |
| Western Europe | 17 | 0.1% |
| Zimbabwe | 24 | 0.1% | View All 32 Rows |
Sex and Age in King William County
Sex and Age in King William County
The most populous age groups in King William County are 60 to 64 Years (751 | 8.5%) for men and 40 to 44 Years (804 | 8.9%) for women.
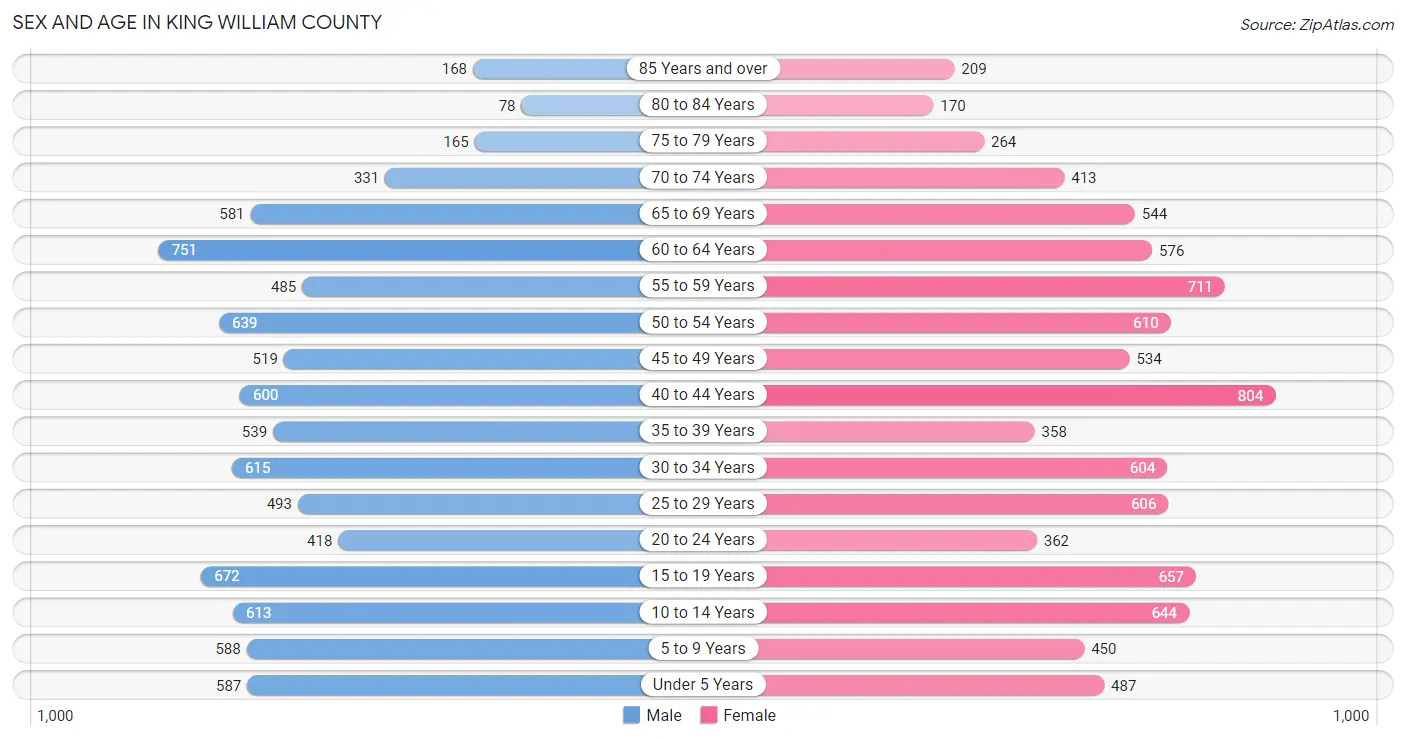
| Age Bracket | Male | Female |
| Under 5 Years | 587 (6.6%) | 487 (5.4%) |
| 5 to 9 Years | 588 (6.7%) | 450 (5.0%) |
| 10 to 14 Years | 613 (6.9%) | 644 (7.1%) |
| 15 to 19 Years | 672 (7.6%) | 657 (7.3%) |
| 20 to 24 Years | 418 (4.7%) | 362 (4.0%) |
| 25 to 29 Years | 493 (5.6%) | 606 (6.7%) |
| 30 to 34 Years | 615 (7.0%) | 604 (6.7%) |
| 35 to 39 Years | 539 (6.1%) | 358 (4.0%) |
| 40 to 44 Years | 600 (6.8%) | 804 (8.9%) |
| 45 to 49 Years | 519 (5.9%) | 534 (5.9%) |
| 50 to 54 Years | 639 (7.2%) | 610 (6.8%) |
| 55 to 59 Years | 485 (5.5%) | 711 (7.9%) |
| 60 to 64 Years | 751 (8.5%) | 576 (6.4%) |
| 65 to 69 Years | 581 (6.6%) | 544 (6.0%) |
| 70 to 74 Years | 331 (3.7%) | 413 (4.6%) |
| 75 to 79 Years | 165 (1.9%) | 264 (2.9%) |
| 80 to 84 Years | 78 (0.9%) | 170 (1.9%) |
| 85 Years and over | 168 (1.9%) | 209 (2.3%) |
| Total | 8,842 (100.0%) | 9,003 (100.0%) |
Families and Households in King William County
Median Family Size in King William County
The median family size in King William County is 3.02 persons per family, with single female/mother families (797 | 15.6%) accounting for the largest median family size of 3.05 persons per family. On the other hand, single male/father families (387 | 7.6%) represent the smallest median family size with 2.74 persons per family.
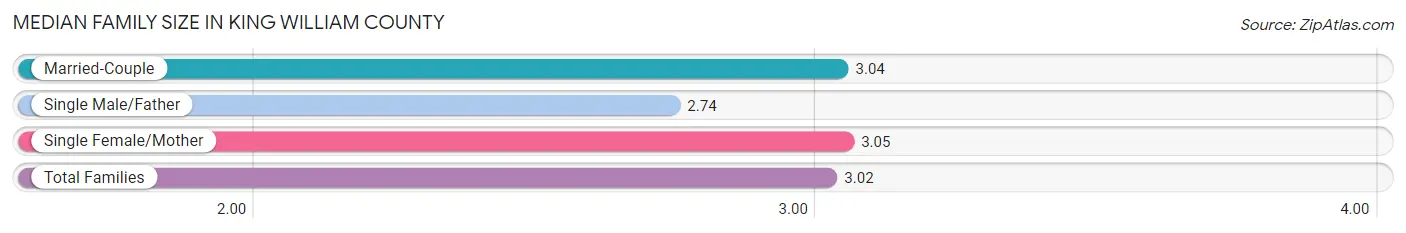
| Family Type | # Families | Family Size |
| Married-Couple | 3,926 (76.8%) | 3.04 |
| Single Male/Father | 387 (7.6%) | 2.74 |
| Single Female/Mother | 797 (15.6%) | 3.05 |
| Total Families | 5,110 (100.0%) | 3.02 |
Median Household Size in King William County
The median household size in King William County is 2.58 persons per household, with single male/father households (387 | 5.6%) accounting for the largest median household size of 3.32 persons per household. non-family households (1,783 | 25.9%) represent the smallest median household size with 1.11 persons per household.
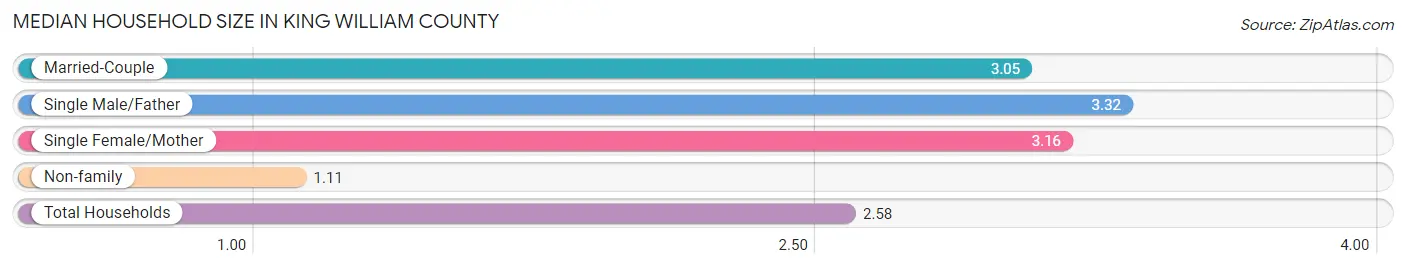
| Household Type | # Households | Household Size |
| Married-Couple | 3,926 (57.0%) | 3.05 |
| Single Male/Father | 387 (5.6%) | 3.32 |
| Single Female/Mother | 797 (11.6%) | 3.16 |
| Non-family | 1,783 (25.9%) | 1.11 |
| Total Households | 6,893 (100.0%) | 2.58 |
Household Size by Marriage Status in King William County
Out of a total of 6,893 households in King William County, 5,110 (74.1%) are family households, while 1,783 (25.9%) are nonfamily households. The most numerous type of family households are 2-person households, comprising 2,524, and the most common type of nonfamily households are 1-person households, comprising 1,655.
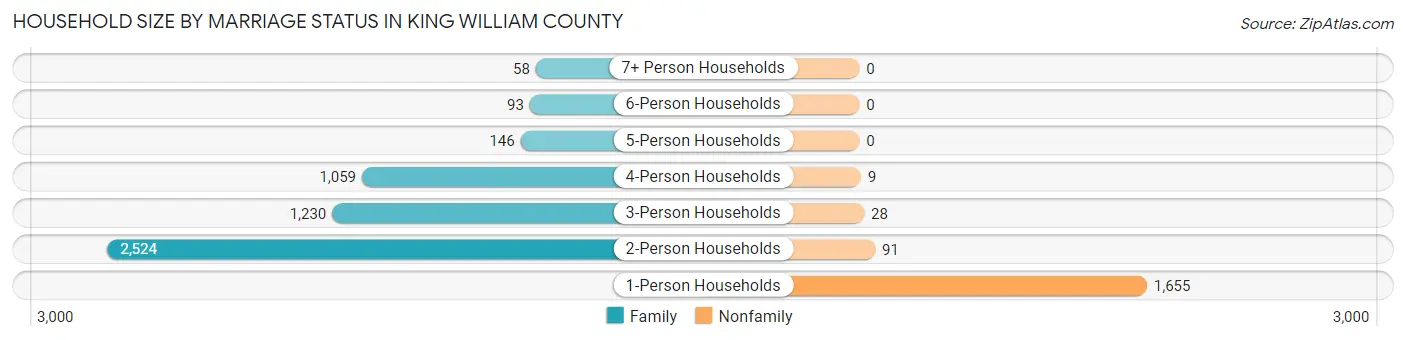
| Household Size | Family Households | Nonfamily Households |
| 1-Person Households | - | 1,655 (24.0%) |
| 2-Person Households | 2,524 (36.6%) | 91 (1.3%) |
| 3-Person Households | 1,230 (17.8%) | 28 (0.4%) |
| 4-Person Households | 1,059 (15.4%) | 9 (0.1%) |
| 5-Person Households | 146 (2.1%) | 0 (0.0%) |
| 6-Person Households | 93 (1.3%) | 0 (0.0%) |
| 7+ Person Households | 58 (0.8%) | 0 (0.0%) |
| Total | 5,110 (74.1%) | 1,783 (25.9%) |
Female Fertility in King William County
Fertility by Age in King William County
Average fertility rate in King William County is 66.0 births per 1,000 women. Women in the age bracket of 20 to 34 years have the highest fertility rate with 106.0 births per 1,000 women. Women in the age bracket of 20 to 34 years acount for 63.1% of all women with births.
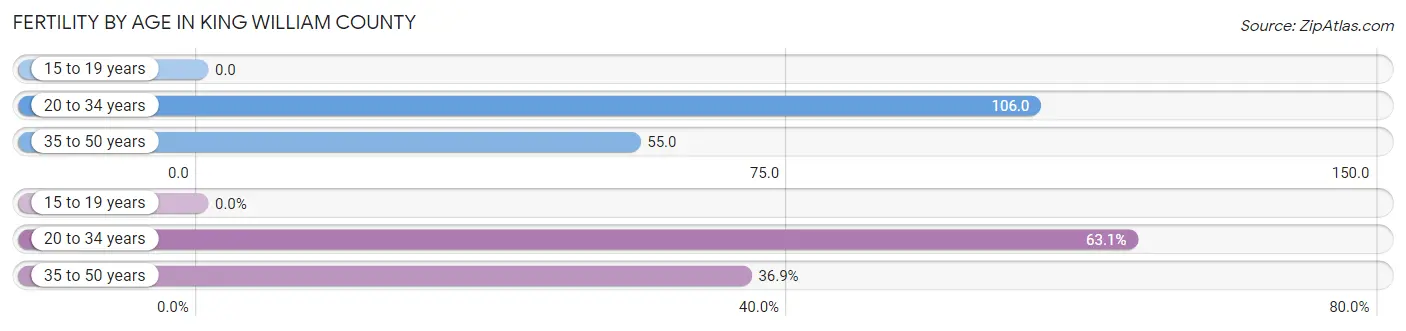
| Age Bracket | Women with Births | Births / 1,000 Women |
| 15 to 19 years | 0 (0.0%) | 0.0 |
| 20 to 34 years | 166 (63.1%) | 106.0 |
| 35 to 50 years | 97 (36.9%) | 55.0 |
| Total | 263 (100.0%) | 66.0 |
Fertility by Age by Marriage Status in King William County
49.8% of women with births (263) in King William County are married. The highest percentage of unmarried women with births falls into 35 to 50 years age bracket with 70.1% of them unmarried at the time of birth, while the lowest percentage of unmarried women with births belong to 20 to 34 years age bracket with 38.5% of them unmarried.
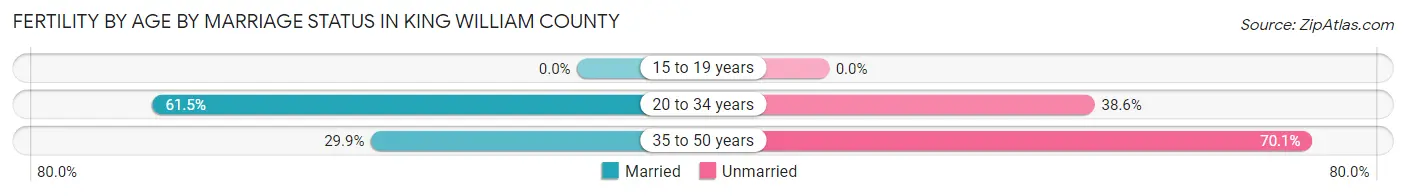
| Age Bracket | Married | Unmarried |
| 15 to 19 years | 0 (0.0%) | 0 (0.0%) |
| 20 to 34 years | 102 (61.5%) | 64 (38.6%) |
| 35 to 50 years | 29 (29.9%) | 68 (70.1%) |
| Total | 131 (49.8%) | 132 (50.2%) |
Fertility by Education in King William County
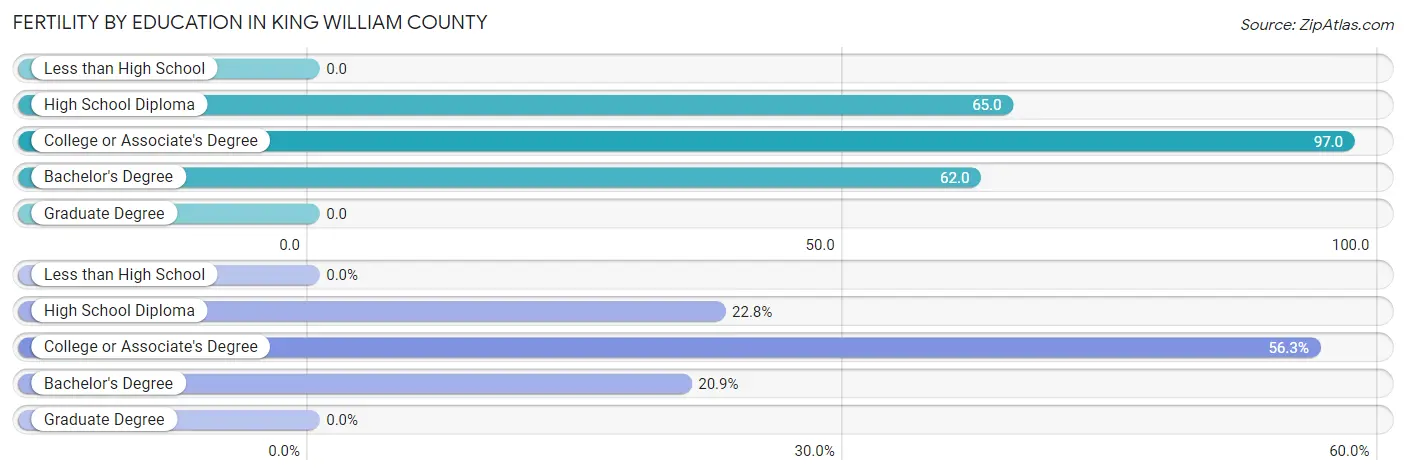
| Educational Attainment | Women with Births | Births / 1,000 Women |
| Less than High School | 0 (0.0%) | 0.0 |
| High School Diploma | 60 (22.8%) | 65.0 |
| College or Associate's Degree | 148 (56.3%) | 97.0 |
| Bachelor's Degree | 55 (20.9%) | 62.0 |
| Graduate Degree | 0 (0.0%) | 0.0 |
| Total | 263 (100.0%) | 66.0 |
Fertility by Education by Marriage Status in King William County
50.2% of women with births in King William County are unmarried. Women with the educational attainment of high school diploma are most likely to be married with 80.0% of them married at childbirth, while women with the educational attainment of college or associate's degree are least likely to be married with 60.8% of them unmarried at childbirth.
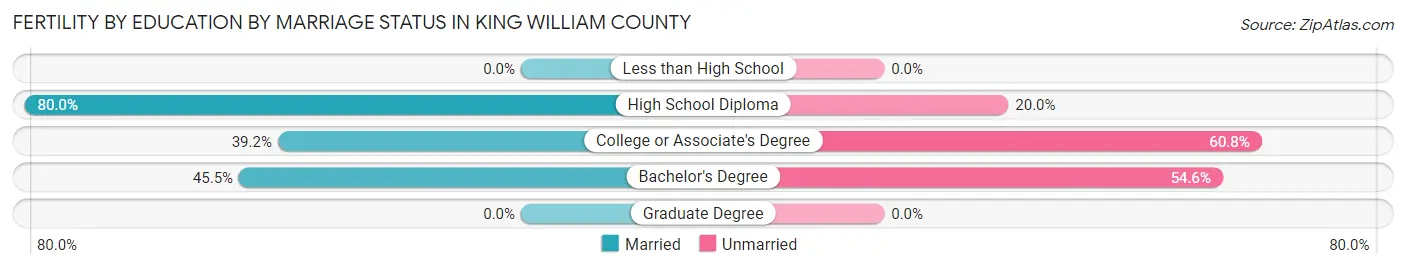
| Educational Attainment | Married | Unmarried |
| Less than High School | 0 (0.0%) | 0 (0.0%) |
| High School Diploma | 48 (80.0%) | 12 (20.0%) |
| College or Associate's Degree | 58 (39.2%) | 90 (60.8%) |
| Bachelor's Degree | 25 (45.5%) | 30 (54.5%) |
| Graduate Degree | 0 (0.0%) | 0 (0.0%) |
| Total | 131 (49.8%) | 132 (50.2%) |
Employment Characteristics in King William County
Employment by Class of Employer in King William County
Among the 9,155 employed individuals in King William County, private company employees (6,062 | 66.2%), local government employees (904 | 9.9%), and self-employed (not incorporated) (649 | 7.1%) make up the most common classes of employment.
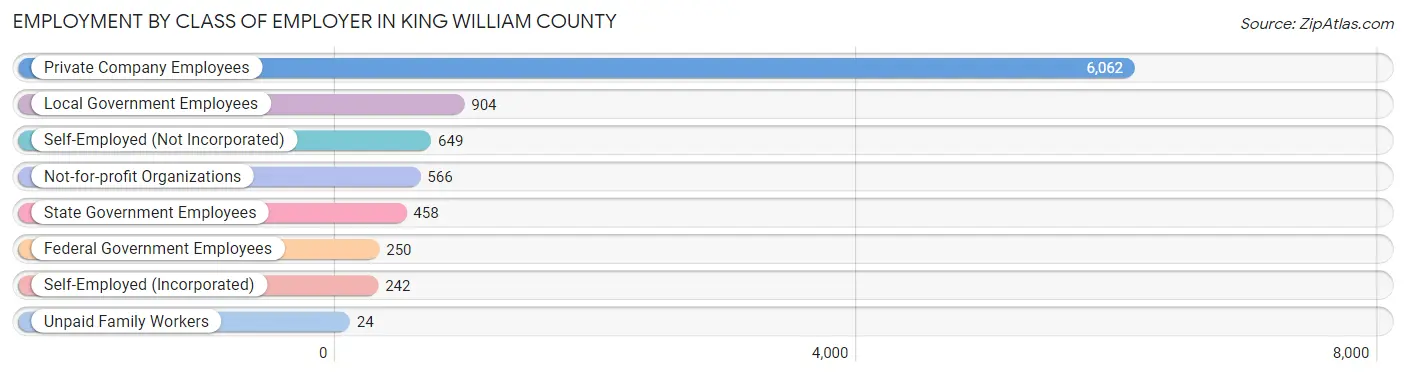
| Employer Class | # Employees | % Employees |
| Private Company Employees | 6,062 | 66.2% |
| Self-Employed (Incorporated) | 242 | 2.6% |
| Self-Employed (Not Incorporated) | 649 | 7.1% |
| Not-for-profit Organizations | 566 | 6.2% |
| Local Government Employees | 904 | 9.9% |
| State Government Employees | 458 | 5.0% |
| Federal Government Employees | 250 | 2.7% |
| Unpaid Family Workers | 24 | 0.3% |
| Total | 9,155 | 100.0% |
Employment Status by Age in King William County
According to the labor force statistics for King William County, out of the total population over 16 years of age (14,240), 67.7% or 9,640 individuals are in the labor force, with 4.0% or 386 of them unemployed. The age group with the highest labor force participation rate is 35 to 44 years, with 88.7% or 2,041 individuals in the labor force. Within the labor force, the 16 to 19 years age range has the highest percentage of unemployed individuals, with 32.4% or 220 of them being unemployed.
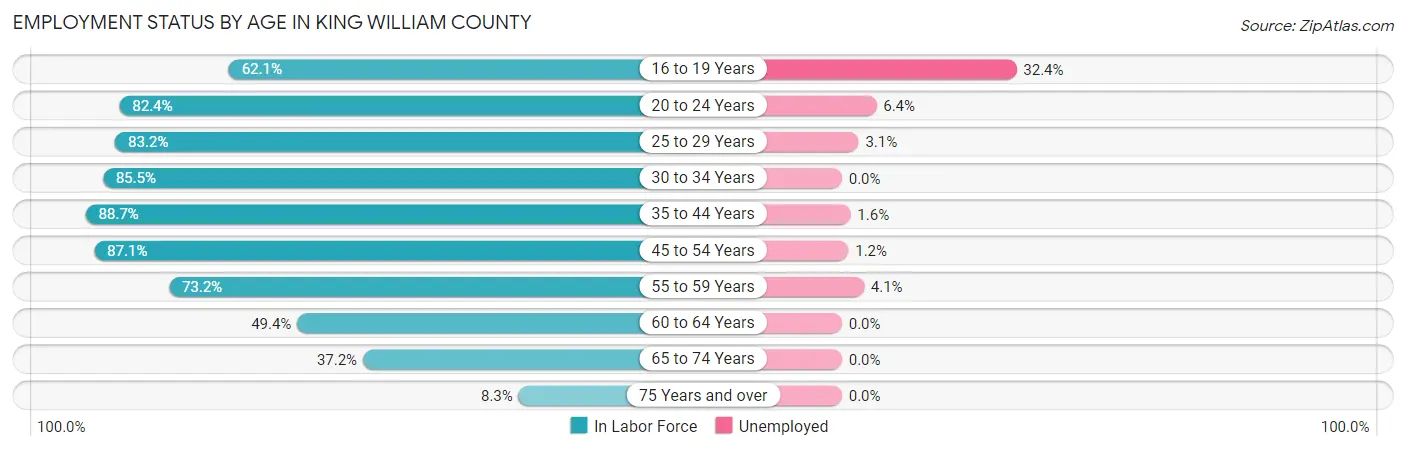
| Age Bracket | In Labor Force | Unemployed |
| 16 to 19 Years | 679 (62.1%) | 220 (32.4%) |
| 20 to 24 Years | 643 (82.4%) | 41 (6.4%) |
| 25 to 29 Years | 914 (83.2%) | 28 (3.1%) |
| 30 to 34 Years | 1,042 (85.5%) | 0 (0.0%) |
| 35 to 44 Years | 2,041 (88.7%) | 33 (1.6%) |
| 45 to 54 Years | 2,005 (87.1%) | 24 (1.2%) |
| 55 to 59 Years | 875 (73.2%) | 36 (4.1%) |
| 60 to 64 Years | 656 (49.4%) | 0 (0.0%) |
| 65 to 74 Years | 695 (37.2%) | 0 (0.0%) |
| 75 Years and over | 87 (8.3%) | 0 (0.0%) |
| Total | 9,640 (67.7%) | 386 (4.0%) |
Employment Status by Educational Attainment in King William County
According to labor force statistics for King William County, 79.8% of individuals (7,536) out of the total population between 25 and 64 years of age (9,444) are in the labor force, with 1.6% or 121 of them being unemployed. The group with the highest labor force participation rate are those with the educational attainment of bachelor's degree or higher, with 90.1% or 2,196 individuals in the labor force. Within the labor force, individuals with less than high school education have the highest percentage of unemployment, with 4.7% or 7 of them being unemployed.
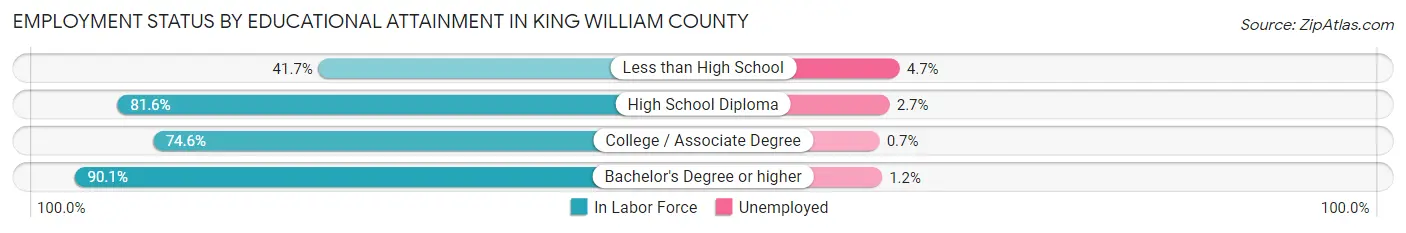
| Educational Attainment | In Labor Force | Unemployed |
| Less than High School | 149 (41.7%) | 17 (4.7%) |
| High School Diploma | 2,654 (81.6%) | 88 (2.7%) |
| College / Associate Degree | 2,534 (74.6%) | 24 (0.7%) |
| Bachelor's Degree or higher | 2,196 (90.1%) | 29 (1.2%) |
| Total | 7,536 (79.8%) | 151 (1.6%) |
Employment Occupations by Sex in King William County
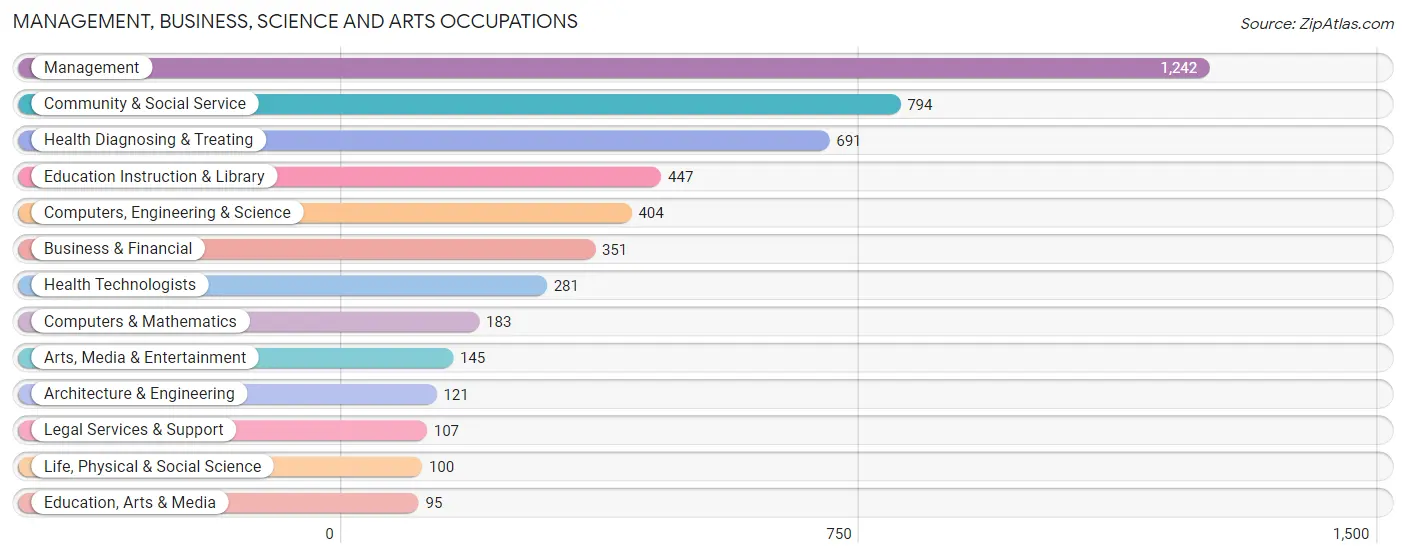
Management, Business, Science and Arts Occupations
The most common Management, Business, Science and Arts occupations in King William County are Management (1,242 | 13.4%), Community & Social Service (794 | 8.6%), Health Diagnosing & Treating (691 | 7.5%), Education Instruction & Library (447 | 4.8%), and Computers, Engineering & Science (404 | 4.4%).
Management, Business, Science and Arts Occupations by Sex
Within the Management, Business, Science and Arts occupations in King William County, the most male-oriented occupations are Architecture & Engineering (100.0%), Computers, Engineering & Science (73.0%), and Computers & Mathematics (69.4%), while the most female-oriented occupations are Legal Services & Support (89.7%), Education Instruction & Library (89.5%), and Health Diagnosing & Treating (87.5%).
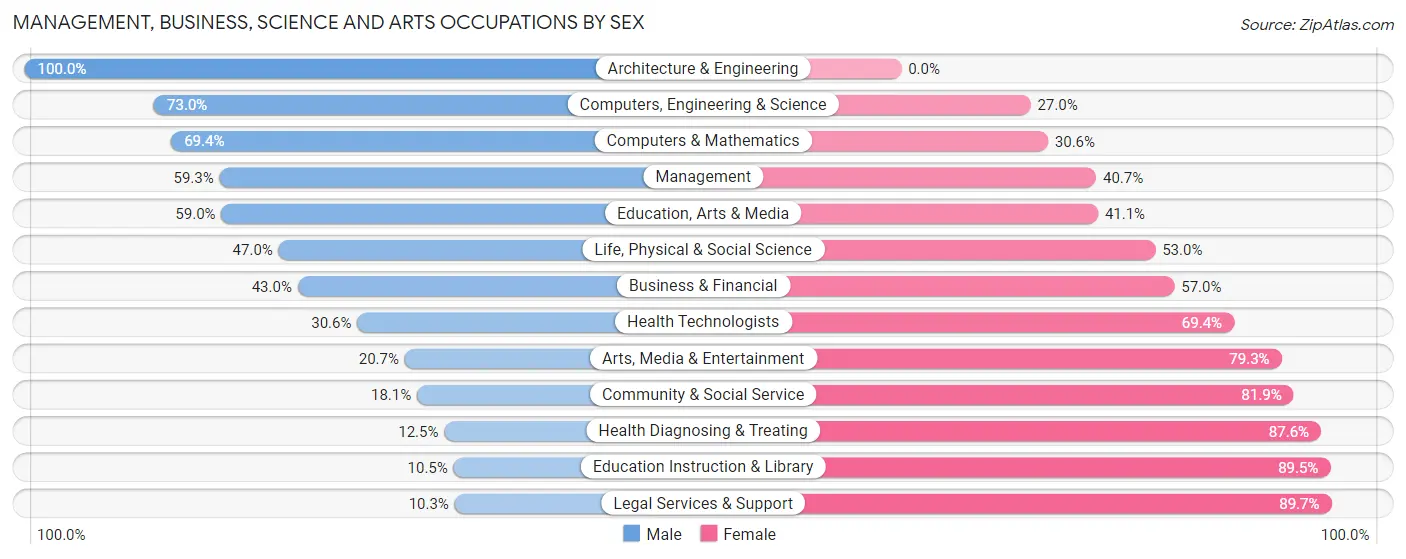
| Occupation | Male | Female |
| Management | 737 (59.3%) | 505 (40.7%) |
| Business & Financial | 151 (43.0%) | 200 (57.0%) |
| Computers, Engineering & Science | 295 (73.0%) | 109 (27.0%) |
| Computers & Mathematics | 127 (69.4%) | 56 (30.6%) |
| Architecture & Engineering | 121 (100.0%) | 0 (0.0%) |
| Life, Physical & Social Science | 47 (47.0%) | 53 (53.0%) |
| Community & Social Service | 144 (18.1%) | 650 (81.9%) |
| Education, Arts & Media | 56 (59.0%) | 39 (41.0%) |
| Legal Services & Support | 11 (10.3%) | 96 (89.7%) |
| Education Instruction & Library | 47 (10.5%) | 400 (89.5%) |
| Arts, Media & Entertainment | 30 (20.7%) | 115 (79.3%) |
| Health Diagnosing & Treating | 86 (12.4%) | 605 (87.5%) |
| Health Technologists | 86 (30.6%) | 195 (69.4%) |
| Total (Category) | 1,413 (40.6%) | 2,069 (59.4%) |
| Total (Overall) | 4,634 (50.1%) | 4,621 (49.9%) |
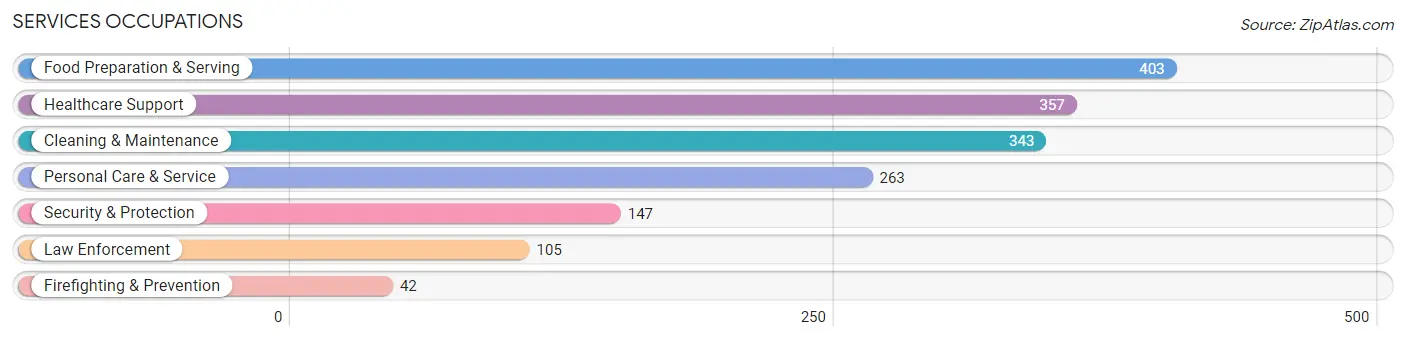
Services Occupations
The most common Services occupations in King William County are Food Preparation & Serving (403 | 4.3%), Healthcare Support (357 | 3.9%), Cleaning & Maintenance (343 | 3.7%), Personal Care & Service (263 | 2.8%), and Security & Protection (147 | 1.6%).
Services Occupations by Sex
Within the Services occupations in King William County, the most male-oriented occupations are Law Enforcement (92.4%), Security & Protection (86.4%), and Cleaning & Maintenance (86.0%), while the most female-oriented occupations are Healthcare Support (91.0%), Personal Care & Service (87.8%), and Food Preparation & Serving (82.9%).
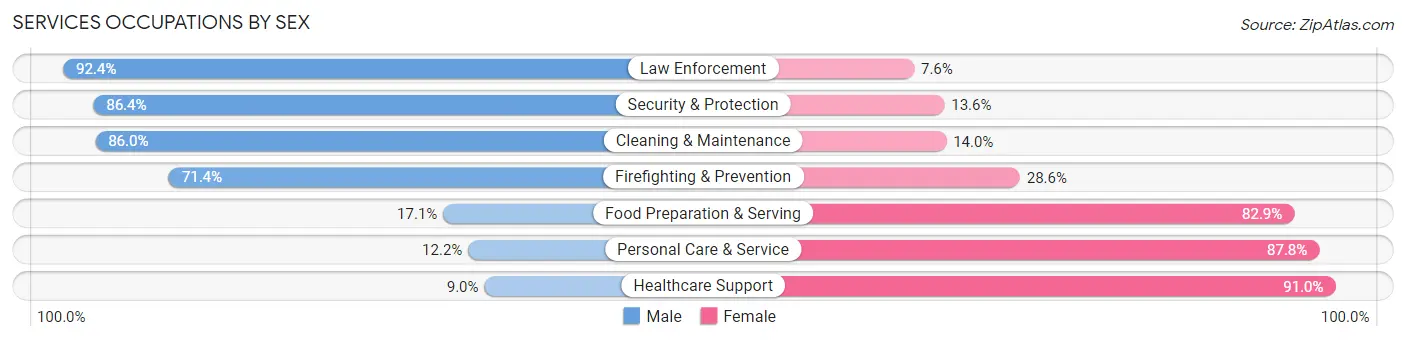
| Occupation | Male | Female |
| Healthcare Support | 32 (9.0%) | 325 (91.0%) |
| Security & Protection | 127 (86.4%) | 20 (13.6%) |
| Firefighting & Prevention | 30 (71.4%) | 12 (28.6%) |
| Law Enforcement | 97 (92.4%) | 8 (7.6%) |
| Food Preparation & Serving | 69 (17.1%) | 334 (82.9%) |
| Cleaning & Maintenance | 295 (86.0%) | 48 (14.0%) |
| Personal Care & Service | 32 (12.2%) | 231 (87.8%) |
| Total (Category) | 555 (36.7%) | 958 (63.3%) |
| Total (Overall) | 4,634 (50.1%) | 4,621 (49.9%) |
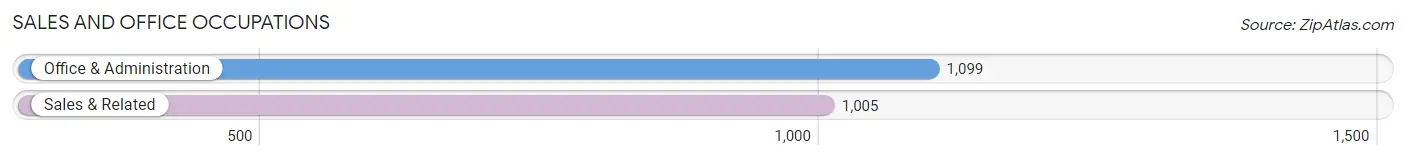
Sales and Office Occupations
The most common Sales and Office occupations in King William County are Office & Administration (1,099 | 11.9%), and Sales & Related (1,005 | 10.9%).
Sales and Office Occupations by Sex
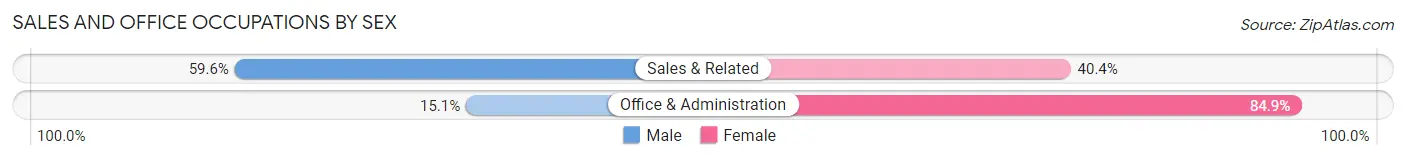
| Occupation | Male | Female |
| Sales & Related | 599 (59.6%) | 406 (40.4%) |
| Office & Administration | 166 (15.1%) | 933 (84.9%) |
| Total (Category) | 765 (36.4%) | 1,339 (63.6%) |
| Total (Overall) | 4,634 (50.1%) | 4,621 (49.9%) |
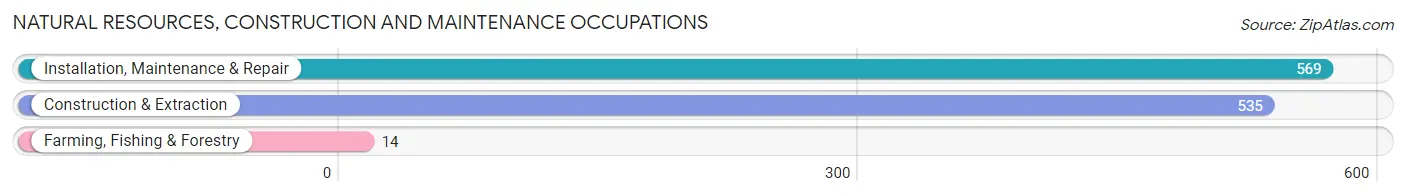
Natural Resources, Construction and Maintenance Occupations
The most common Natural Resources, Construction and Maintenance occupations in King William County are Installation, Maintenance & Repair (569 | 6.1%), Construction & Extraction (535 | 5.8%), and Farming, Fishing & Forestry (14 | 0.2%).
Natural Resources, Construction and Maintenance Occupations by Sex
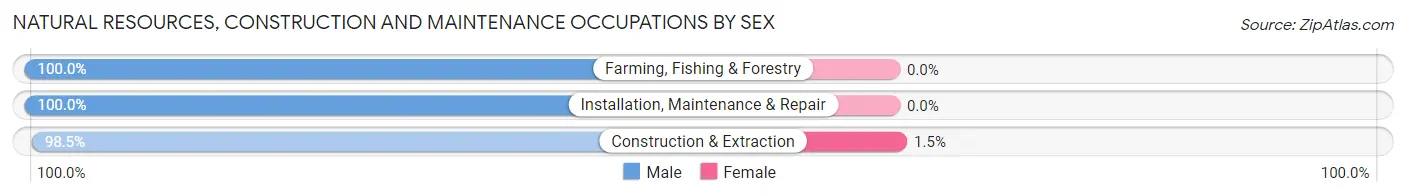
| Occupation | Male | Female |
| Farming, Fishing & Forestry | 14 (100.0%) | 0 (0.0%) |
| Construction & Extraction | 527 (98.5%) | 8 (1.5%) |
| Installation, Maintenance & Repair | 569 (100.0%) | 0 (0.0%) |
| Total (Category) | 1,110 (99.3%) | 8 (0.7%) |
| Total (Overall) | 4,634 (50.1%) | 4,621 (49.9%) |
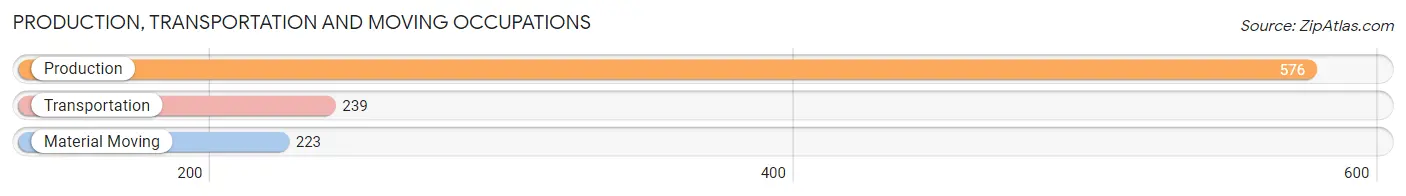
Production, Transportation and Moving Occupations
The most common Production, Transportation and Moving occupations in King William County are Production (576 | 6.2%), Transportation (239 | 2.6%), and Material Moving (223 | 2.4%).
Production, Transportation and Moving Occupations by Sex
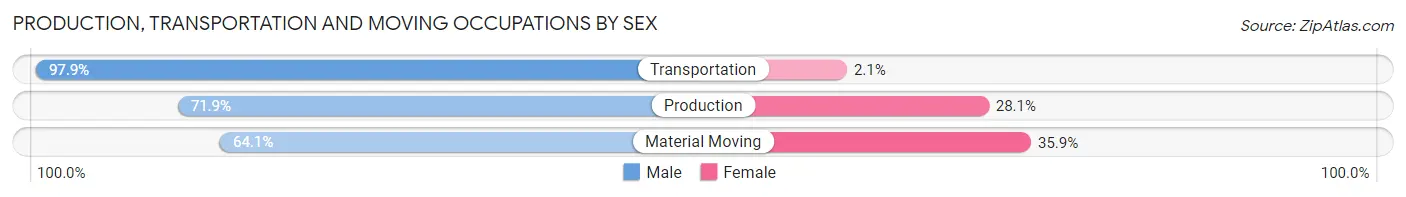
| Occupation | Male | Female |
| Production | 414 (71.9%) | 162 (28.1%) |
| Transportation | 234 (97.9%) | 5 (2.1%) |
| Material Moving | 143 (64.1%) | 80 (35.9%) |
| Total (Category) | 791 (76.2%) | 247 (23.8%) |
| Total (Overall) | 4,634 (50.1%) | 4,621 (49.9%) |
Employment Industries by Sex in King William County
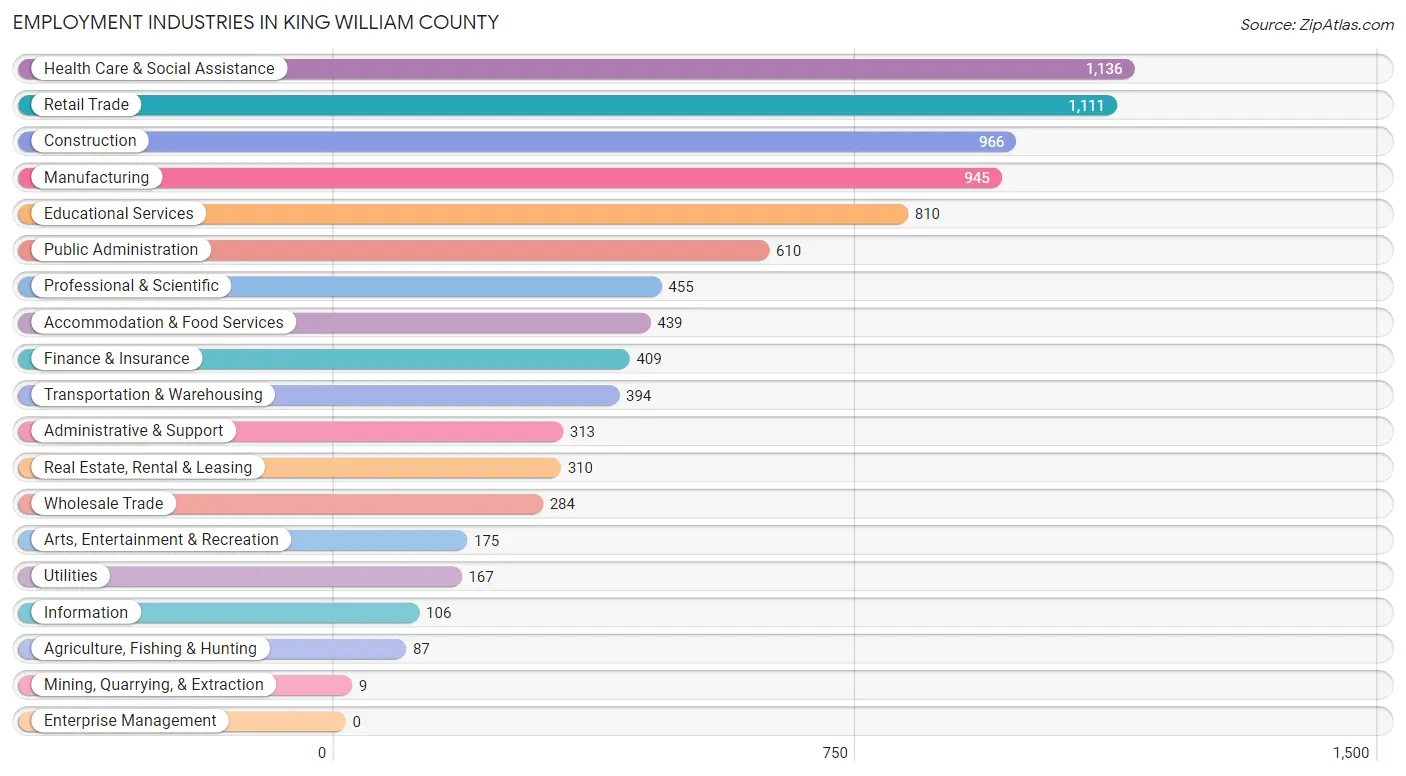
Employment Industries in King William County
The major employment industries in King William County include Health Care & Social Assistance (1,136 | 12.3%), Retail Trade (1,111 | 12.0%), Construction (966 | 10.4%), Manufacturing (945 | 10.2%), and Educational Services (810 | 8.7%).
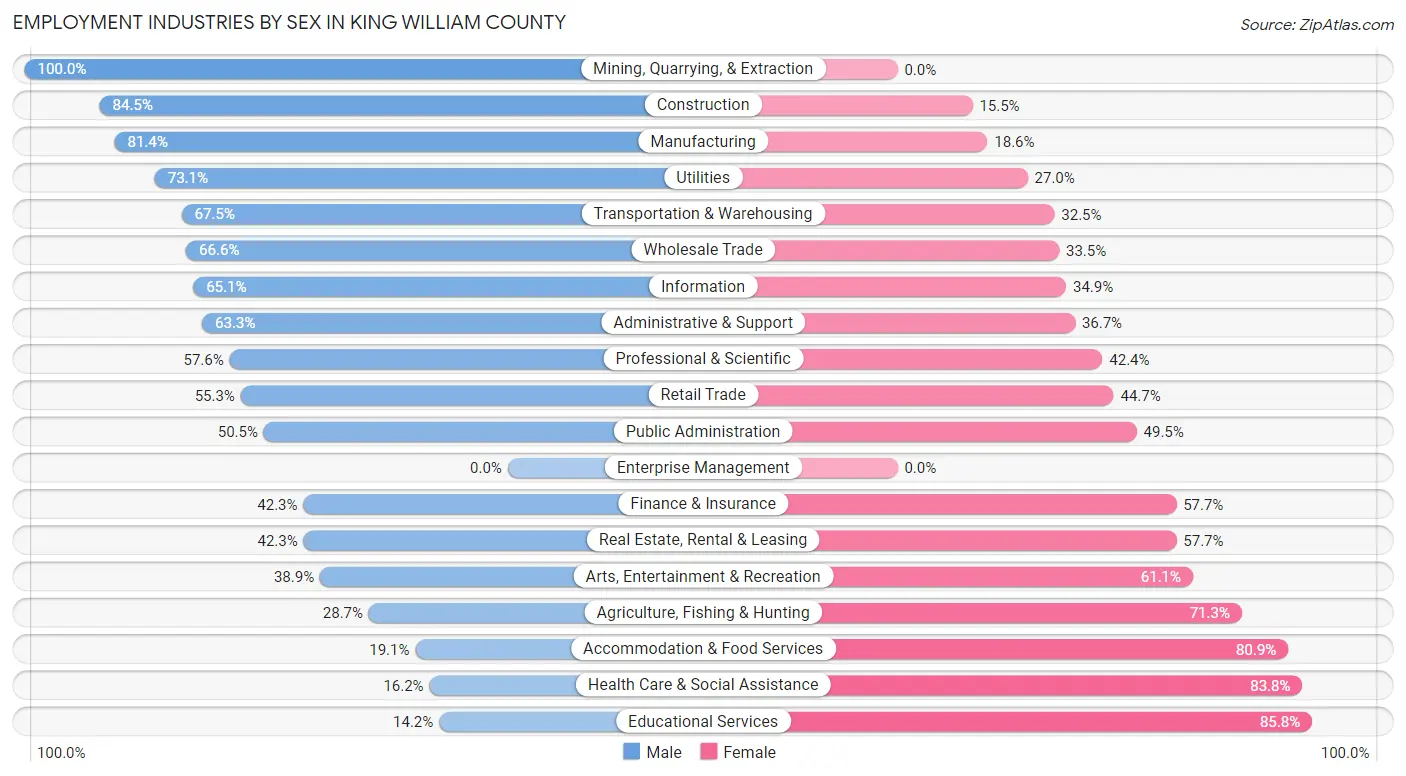
Employment Industries by Sex in King William County
The King William County industries that see more men than women are Mining, Quarrying, & Extraction (100.0%), Construction (84.5%), and Manufacturing (81.4%), whereas the industries that tend to have a higher number of women are Educational Services (85.8%), Health Care & Social Assistance (83.8%), and Accommodation & Food Services (80.9%).
| Industry | Male | Female |
| Agriculture, Fishing & Hunting | 25 (28.7%) | 62 (71.3%) |
| Mining, Quarrying, & Extraction | 9 (100.0%) | 0 (0.0%) |
| Construction | 816 (84.5%) | 150 (15.5%) |
| Manufacturing | 769 (81.4%) | 176 (18.6%) |
| Wholesale Trade | 189 (66.5%) | 95 (33.5%) |
| Retail Trade | 614 (55.3%) | 497 (44.7%) |
| Transportation & Warehousing | 266 (67.5%) | 128 (32.5%) |
| Utilities | 122 (73.1%) | 45 (27.0%) |
| Information | 69 (65.1%) | 37 (34.9%) |
| Finance & Insurance | 173 (42.3%) | 236 (57.7%) |
| Real Estate, Rental & Leasing | 131 (42.3%) | 179 (57.7%) |
| Professional & Scientific | 262 (57.6%) | 193 (42.4%) |
| Enterprise Management | 0 (0.0%) | 0 (0.0%) |
| Administrative & Support | 198 (63.3%) | 115 (36.7%) |
| Educational Services | 115 (14.2%) | 695 (85.8%) |
| Health Care & Social Assistance | 184 (16.2%) | 952 (83.8%) |
| Arts, Entertainment & Recreation | 68 (38.9%) | 107 (61.1%) |
| Accommodation & Food Services | 84 (19.1%) | 355 (80.9%) |
| Public Administration | 308 (50.5%) | 302 (49.5%) |
| Total | 4,634 (50.1%) | 4,621 (49.9%) |
Education in King William County
School Enrollment in King William County
The most common levels of schooling among the 3,980 students in King William County are high school (1,157 | 29.1%), middle school (999 | 25.1%), and elementary school (675 | 17.0%).
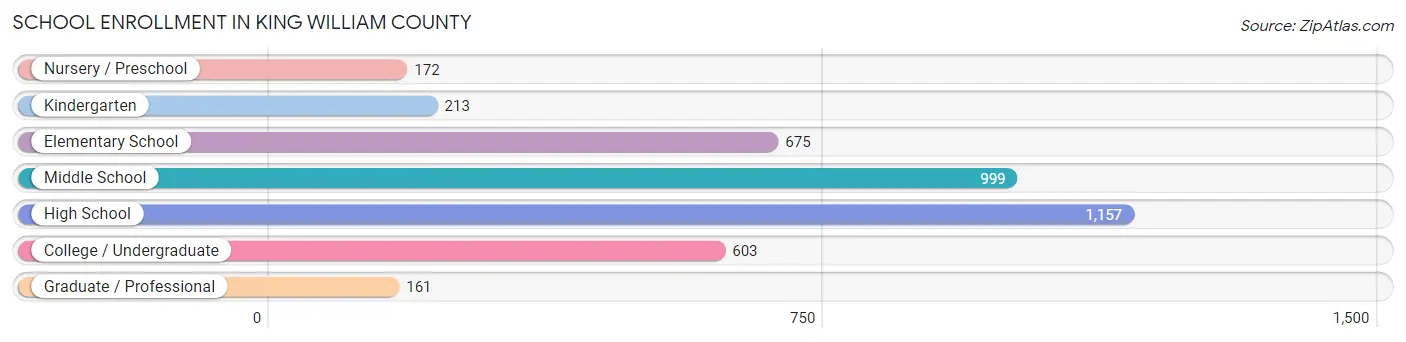
| School Level | # Students | % Students |
| Nursery / Preschool | 172 | 4.3% |
| Kindergarten | 213 | 5.3% |
| Elementary School | 675 | 17.0% |
| Middle School | 999 | 25.1% |
| High School | 1,157 | 29.1% |
| College / Undergraduate | 603 | 15.1% |
| Graduate / Professional | 161 | 4.1% |
| Total | 3,980 | 100.0% |
School Enrollment by Age by Funding Source in King William County
Out of a total of 3,980 students who are enrolled in schools in King William County, 426 (10.7%) attend a private institution, while the remaining 3,554 (89.3%) are enrolled in public schools. The age group of 3 to 4 year olds has the highest likelihood of being enrolled in private schools, with 29 (47.5% in the age bracket) enrolled. Conversely, the age group of 18 to 19 year olds has the lowest likelihood of being enrolled in a private school, with 523 (100.0% in the age bracket) attending a public institution.
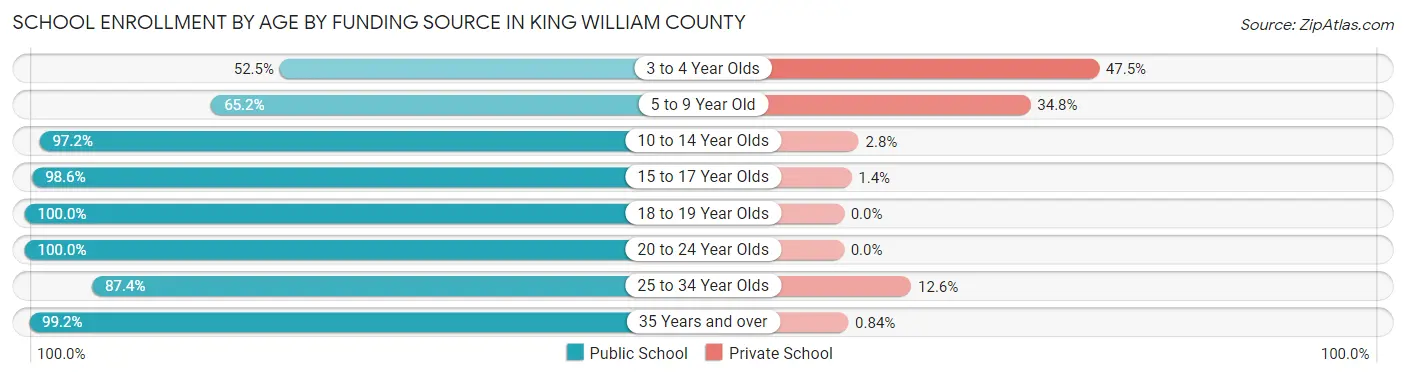
| Age Bracket | Public School | Private School |
| 3 to 4 Year Olds | 32 (52.5%) | 29 (47.5%) |
| 5 to 9 Year Old | 606 (65.2%) | 323 (34.8%) |
| 10 to 14 Year Olds | 1,222 (97.2%) | 35 (2.8%) |
| 15 to 17 Year Olds | 689 (98.6%) | 10 (1.4%) |
| 18 to 19 Year Olds | 523 (100.0%) | 0 (0.0%) |
| 20 to 24 Year Olds | 177 (100.0%) | 0 (0.0%) |
| 25 to 34 Year Olds | 188 (87.4%) | 27 (12.6%) |
| 35 Years and over | 118 (99.2%) | 1 (0.8%) |
| Total | 3,554 (89.3%) | 426 (10.7%) |
Educational Attainment by Field of Study in King William County
Business (500 | 15.4%), psychology (370 | 11.4%), bio, nature & agricultural (344 | 10.6%), education (321 | 9.9%), and social sciences (318 | 9.8%) are the most common fields of study among 3,246 individuals in King William County who have obtained a bachelor's degree or higher.
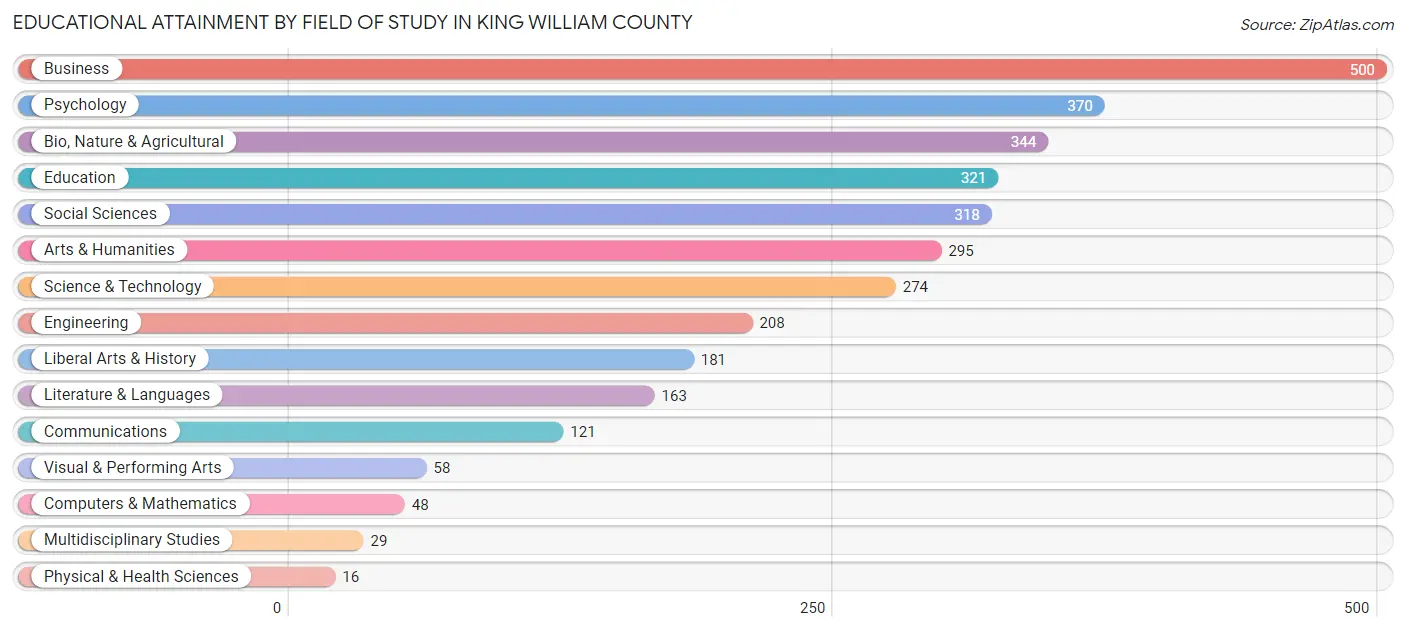
| Field of Study | # Graduates | % Graduates |
| Computers & Mathematics | 48 | 1.5% |
| Bio, Nature & Agricultural | 344 | 10.6% |
| Physical & Health Sciences | 16 | 0.5% |
| Psychology | 370 | 11.4% |
| Social Sciences | 318 | 9.8% |
| Engineering | 208 | 6.4% |
| Multidisciplinary Studies | 29 | 0.9% |
| Science & Technology | 274 | 8.4% |
| Business | 500 | 15.4% |
| Education | 321 | 9.9% |
| Literature & Languages | 163 | 5.0% |
| Liberal Arts & History | 181 | 5.6% |
| Visual & Performing Arts | 58 | 1.8% |
| Communications | 121 | 3.7% |
| Arts & Humanities | 295 | 9.1% |
| Total | 3,246 | 100.0% |
Transportation & Commute in King William County
Vehicle Availability by Sex in King William County
The most prevalent vehicle ownership categories in King William County are males with 3 vehicles (1,512, accounting for 33.1%) and females with 3 vehicles (945, making up 33.0%).
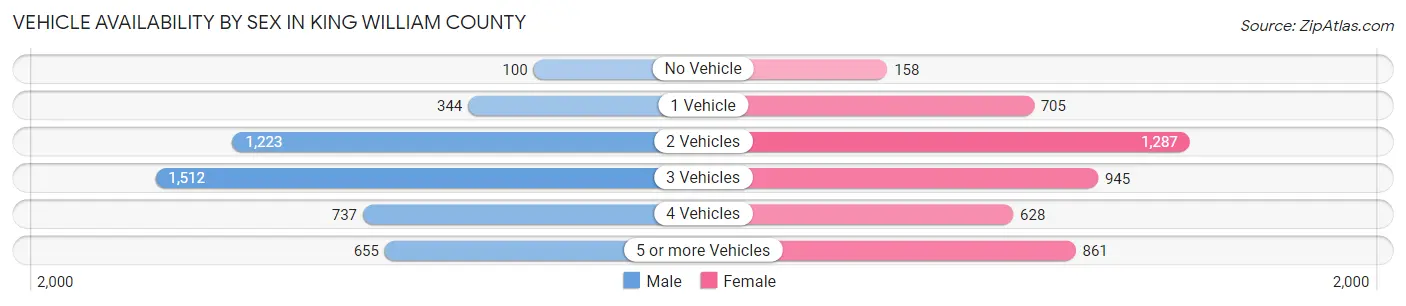
| Vehicles Available | Male | Female |
| No Vehicle | 100 (2.2%) | 158 (3.5%) |
| 1 Vehicle | 344 (7.5%) | 705 (15.4%) |
| 2 Vehicles | 1,223 (26.8%) | 1,287 (28.1%) |
| 3 Vehicles | 1,512 (33.1%) | 945 (20.6%) |
| 4 Vehicles | 737 (16.1%) | 628 (13.7%) |
| 5 or more Vehicles | 655 (14.3%) | 861 (18.8%) |
| Total | 4,571 (100.0%) | 4,584 (100.0%) |
Commute Time in King William County
The most frequently occuring commute durations in King William County are 45 to 59 minutes (1,894 commuters, 23.1%), 60 to 89 minutes (987 commuters, 12.1%), and 30 to 34 minutes (841 commuters, 10.3%).
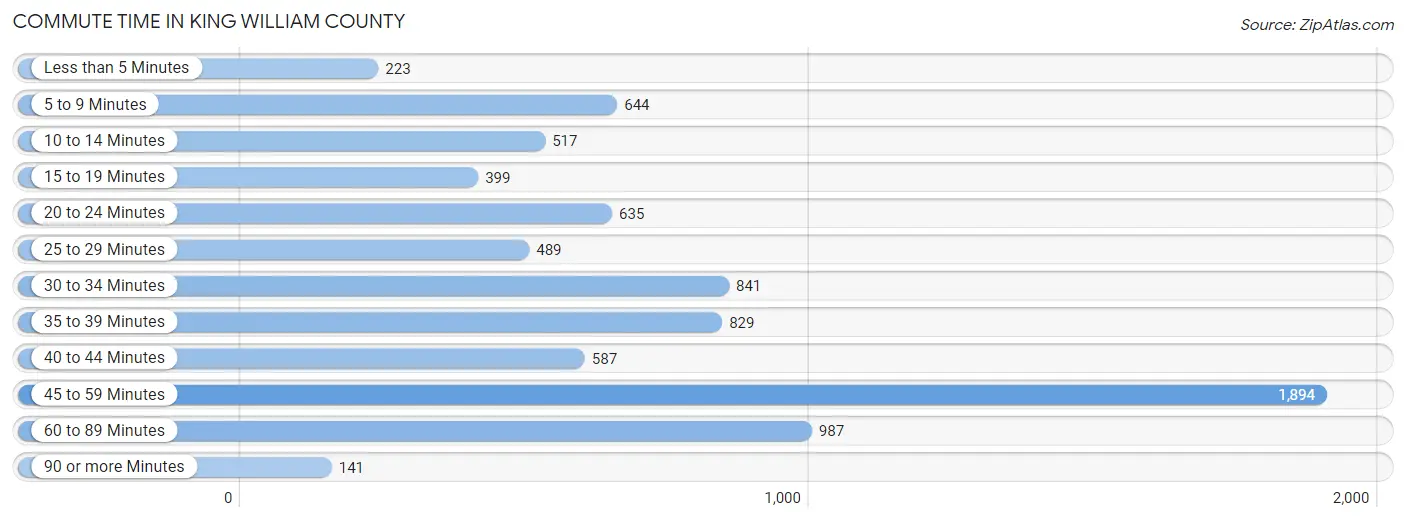
| Commute Time | # Commuters | % Commuters |
| Less than 5 Minutes | 223 | 2.7% |
| 5 to 9 Minutes | 644 | 7.9% |
| 10 to 14 Minutes | 517 | 6.3% |
| 15 to 19 Minutes | 399 | 4.9% |
| 20 to 24 Minutes | 635 | 7.8% |
| 25 to 29 Minutes | 489 | 6.0% |
| 30 to 34 Minutes | 841 | 10.3% |
| 35 to 39 Minutes | 829 | 10.1% |
| 40 to 44 Minutes | 587 | 7.2% |
| 45 to 59 Minutes | 1,894 | 23.1% |
| 60 to 89 Minutes | 987 | 12.1% |
| 90 or more Minutes | 141 | 1.7% |
Commute Time by Sex in King William County
The most common commute times in King William County are 45 to 59 minutes (1,151 commuters, 27.7%) for males and 45 to 59 minutes (743 commuters, 18.4%) for females.
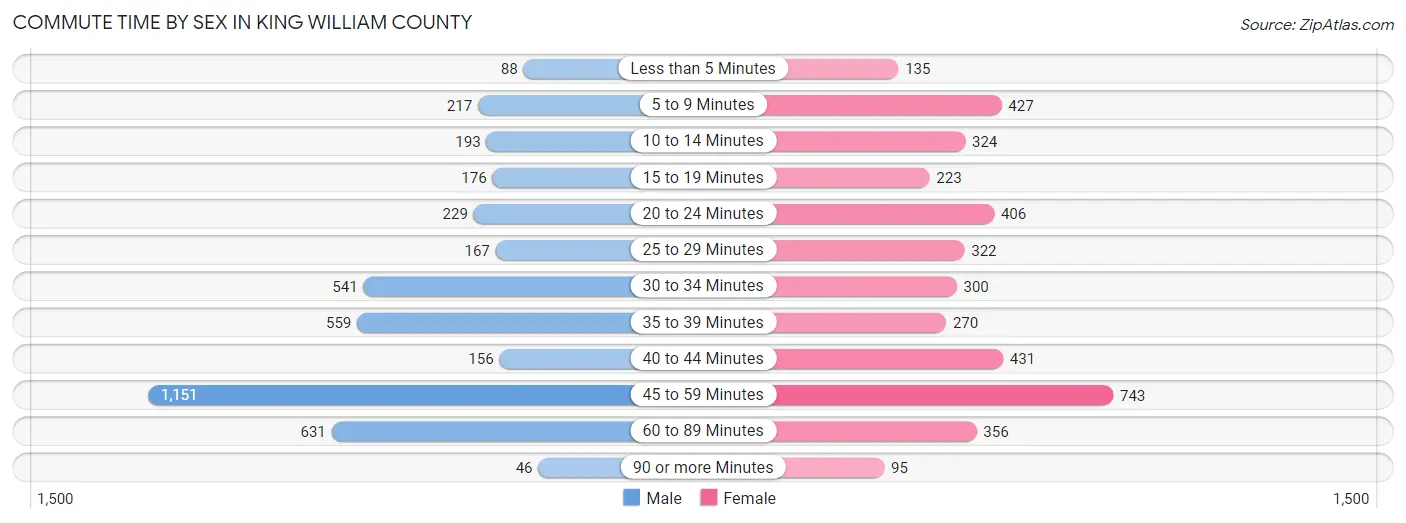
| Commute Time | Male | Female |
| Less than 5 Minutes | 88 (2.1%) | 135 (3.4%) |
| 5 to 9 Minutes | 217 (5.2%) | 427 (10.6%) |
| 10 to 14 Minutes | 193 (4.6%) | 324 (8.0%) |
| 15 to 19 Minutes | 176 (4.2%) | 223 (5.5%) |
| 20 to 24 Minutes | 229 (5.5%) | 406 (10.1%) |
| 25 to 29 Minutes | 167 (4.0%) | 322 (8.0%) |
| 30 to 34 Minutes | 541 (13.0%) | 300 (7.4%) |
| 35 to 39 Minutes | 559 (13.5%) | 270 (6.7%) |
| 40 to 44 Minutes | 156 (3.8%) | 431 (10.7%) |
| 45 to 59 Minutes | 1,151 (27.7%) | 743 (18.4%) |
| 60 to 89 Minutes | 631 (15.2%) | 356 (8.8%) |
| 90 or more Minutes | 46 (1.1%) | 95 (2.4%) |
Time of Departure to Work by Sex in King William County
The most frequent times of departure to work in King William County are 6:00 AM to 6:29 AM (883, 21.3%) for males and 7:00 AM to 7:29 AM (648, 16.1%) for females.
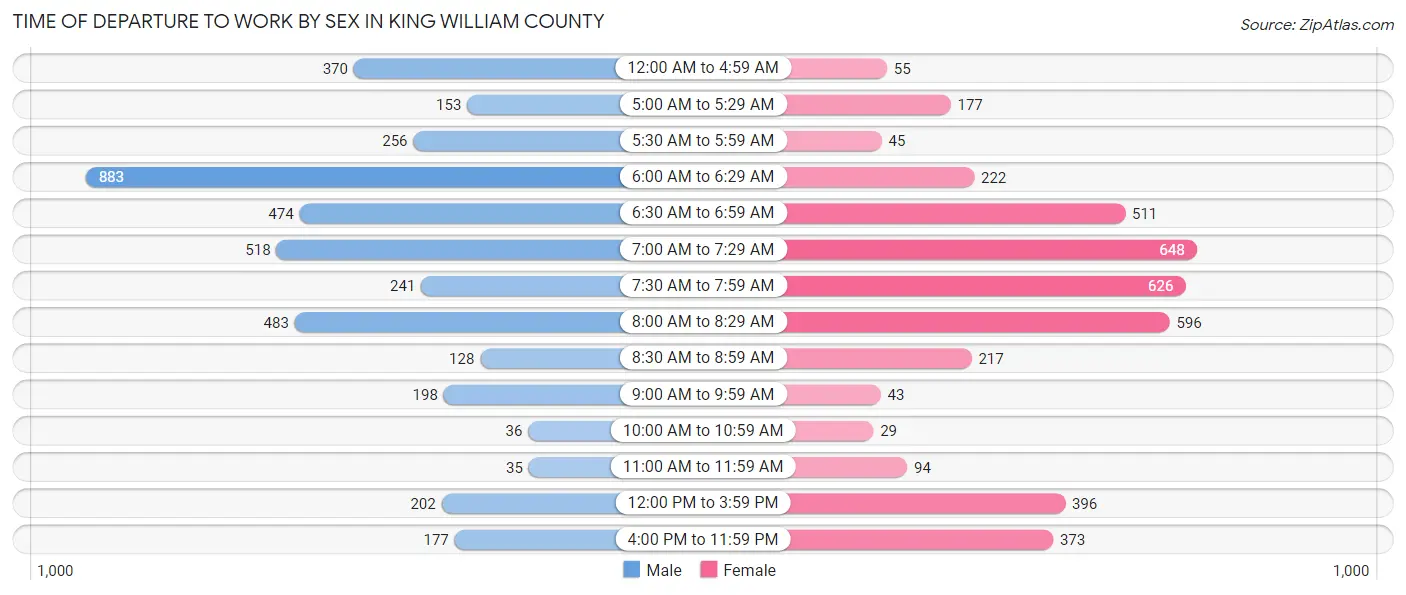
| Time of Departure | Male | Female |
| 12:00 AM to 4:59 AM | 370 (8.9%) | 55 (1.4%) |
| 5:00 AM to 5:29 AM | 153 (3.7%) | 177 (4.4%) |
| 5:30 AM to 5:59 AM | 256 (6.2%) | 45 (1.1%) |
| 6:00 AM to 6:29 AM | 883 (21.3%) | 222 (5.5%) |
| 6:30 AM to 6:59 AM | 474 (11.4%) | 511 (12.7%) |
| 7:00 AM to 7:29 AM | 518 (12.5%) | 648 (16.1%) |
| 7:30 AM to 7:59 AM | 241 (5.8%) | 626 (15.5%) |
| 8:00 AM to 8:29 AM | 483 (11.6%) | 596 (14.8%) |
| 8:30 AM to 8:59 AM | 128 (3.1%) | 217 (5.4%) |
| 9:00 AM to 9:59 AM | 198 (4.8%) | 43 (1.1%) |
| 10:00 AM to 10:59 AM | 36 (0.9%) | 29 (0.7%) |
| 11:00 AM to 11:59 AM | 35 (0.8%) | 94 (2.3%) |
| 12:00 PM to 3:59 PM | 202 (4.9%) | 396 (9.8%) |
| 4:00 PM to 11:59 PM | 177 (4.3%) | 373 (9.2%) |
| Total | 4,154 (100.0%) | 4,032 (100.0%) |
Housing Occupancy in King William County
Occupancy by Ownership in King William County
Of the total 6,893 dwellings in King William County, owner-occupied units account for 5,935 (86.1%), while renter-occupied units make up 958 (13.9%).
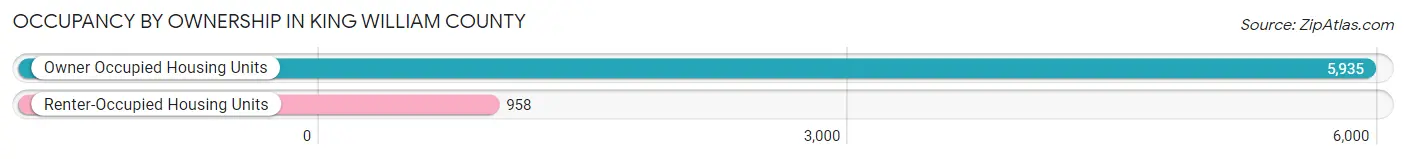
| Occupancy | # Housing Units | % Housing Units |
| Owner Occupied Housing Units | 5,935 | 86.1% |
| Renter-Occupied Housing Units | 958 | 13.9% |
| Total Occupied Housing Units | 6,893 | 100.0% |
Occupancy by Household Size in King William County
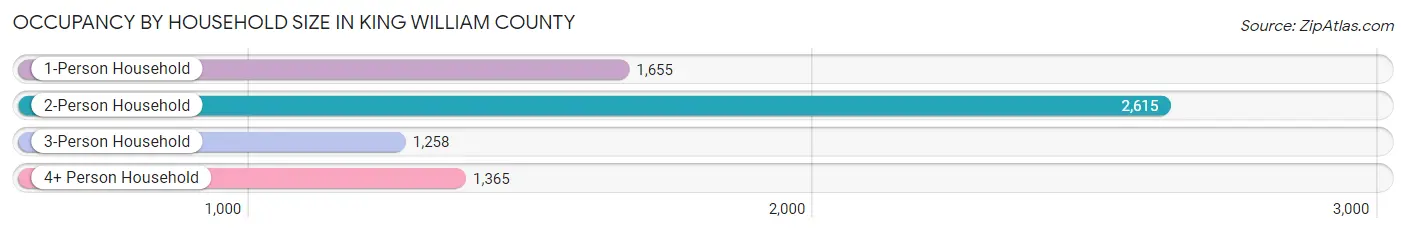
| Household Size | # Housing Units | % Housing Units |
| 1-Person Household | 1,655 | 24.0% |
| 2-Person Household | 2,615 | 37.9% |
| 3-Person Household | 1,258 | 18.2% |
| 4+ Person Household | 1,365 | 19.8% |
| Total Housing Units | 6,893 | 100.0% |
Occupancy by Ownership by Household Size in King William County
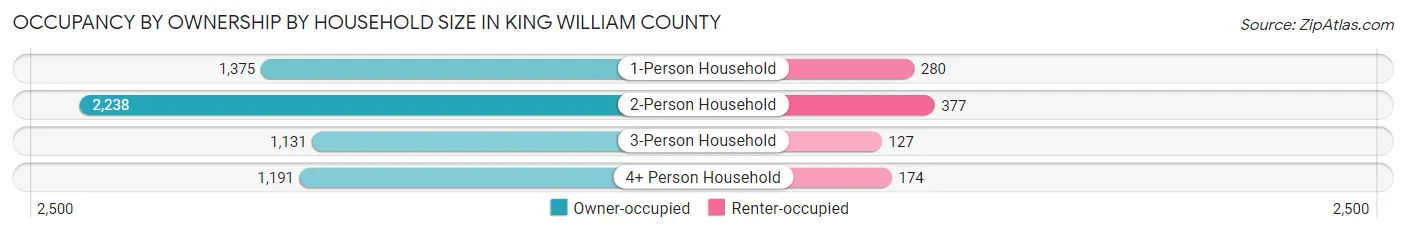
| Household Size | Owner-occupied | Renter-occupied |
| 1-Person Household | 1,375 (83.1%) | 280 (16.9%) |
| 2-Person Household | 2,238 (85.6%) | 377 (14.4%) |
| 3-Person Household | 1,131 (89.9%) | 127 (10.1%) |
| 4+ Person Household | 1,191 (87.3%) | 174 (12.8%) |
| Total Housing Units | 5,935 (86.1%) | 958 (13.9%) |
Occupancy by Educational Attainment in King William County
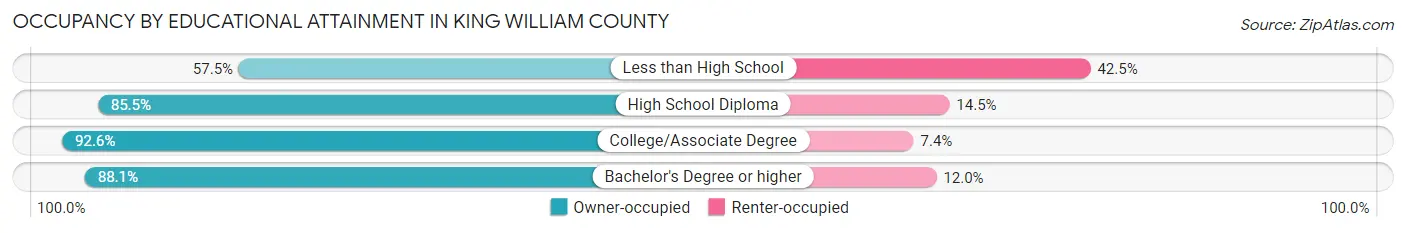
| Household Size | Owner-occupied | Renter-occupied |
| Less than High School | 310 (57.5%) | 229 (42.5%) |
| High School Diploma | 1,996 (85.5%) | 339 (14.5%) |
| College/Associate Degree | 1,846 (92.6%) | 148 (7.4%) |
| Bachelor's Degree or higher | 1,783 (88.0%) | 242 (11.9%) |
Occupancy by Age of Householder in King William County
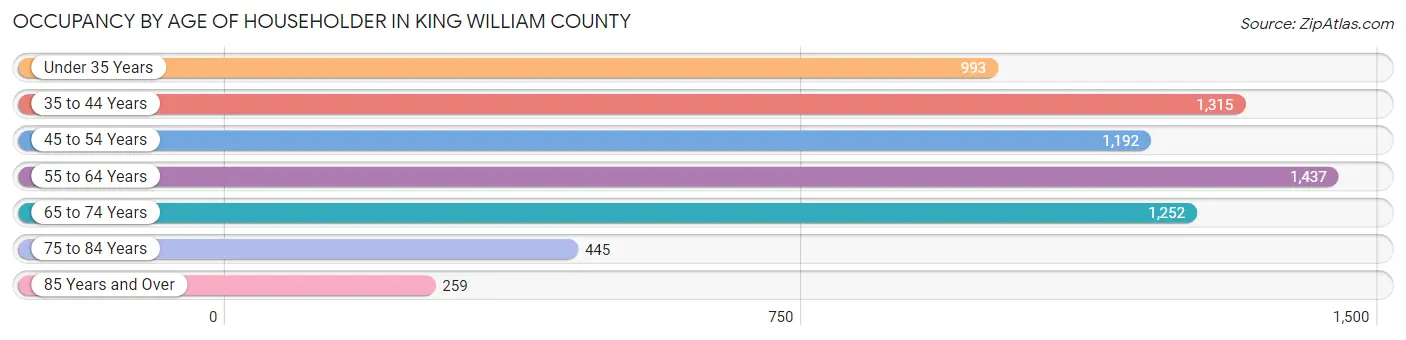
| Age Bracket | # Households | % Households |
| Under 35 Years | 993 | 14.4% |
| 35 to 44 Years | 1,315 | 19.1% |
| 45 to 54 Years | 1,192 | 17.3% |
| 55 to 64 Years | 1,437 | 20.8% |
| 65 to 74 Years | 1,252 | 18.2% |
| 75 to 84 Years | 445 | 6.5% |
| 85 Years and Over | 259 | 3.8% |
| Total | 6,893 | 100.0% |
Housing Finances in King William County
Median Income by Occupancy in King William County
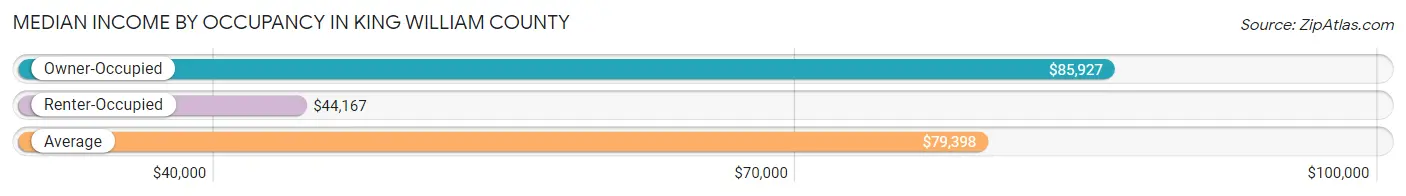
| Occupancy Type | # Households | Median Income |
| Owner-Occupied | 5,935 (86.1%) | $85,927 |
| Renter-Occupied | 958 (13.9%) | $44,167 |
| Average | 6,893 (100.0%) | $79,398 |
Occupancy by Householder Income Bracket in King William County
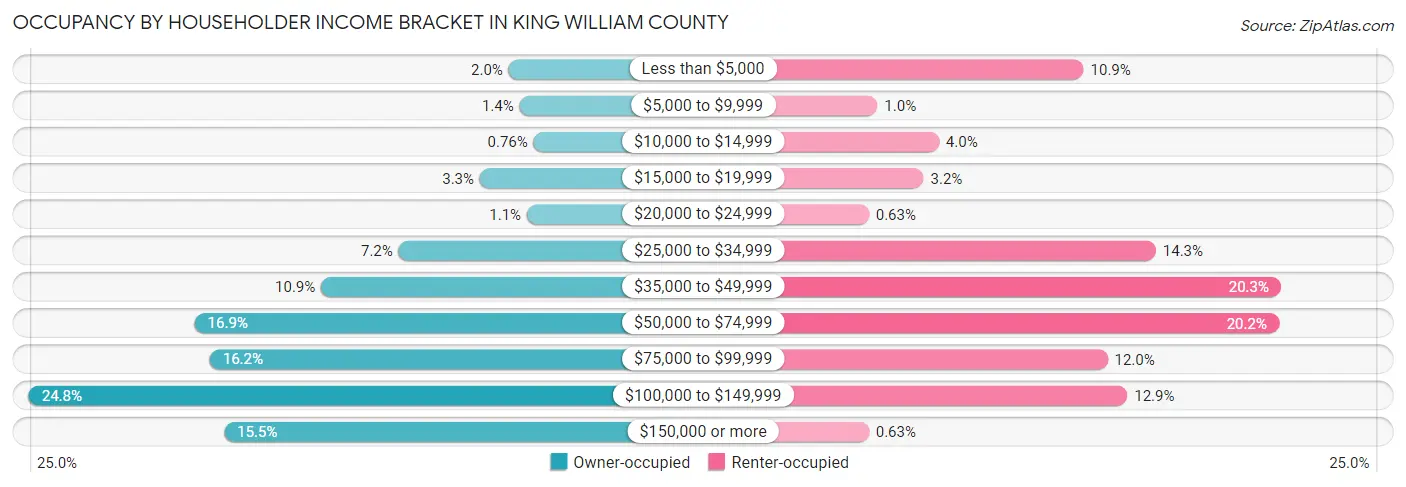
| Income Bracket | Owner-occupied | Renter-occupied |
| Less than $5,000 | 116 (1.9%) | 104 (10.9%) |
| $5,000 to $9,999 | 85 (1.4%) | 10 (1.0%) |
| $10,000 to $14,999 | 45 (0.8%) | 38 (4.0%) |
| $15,000 to $19,999 | 197 (3.3%) | 31 (3.2%) |
| $20,000 to $24,999 | 64 (1.1%) | 6 (0.6%) |
| $25,000 to $34,999 | 427 (7.2%) | 137 (14.3%) |
| $35,000 to $49,999 | 646 (10.9%) | 194 (20.3%) |
| $50,000 to $74,999 | 1,003 (16.9%) | 193 (20.2%) |
| $75,000 to $99,999 | 960 (16.2%) | 115 (12.0%) |
| $100,000 to $149,999 | 1,472 (24.8%) | 124 (12.9%) |
| $150,000 or more | 920 (15.5%) | 6 (0.6%) |
| Total | 5,935 (100.0%) | 958 (100.0%) |
Monthly Housing Cost Tiers in King William County
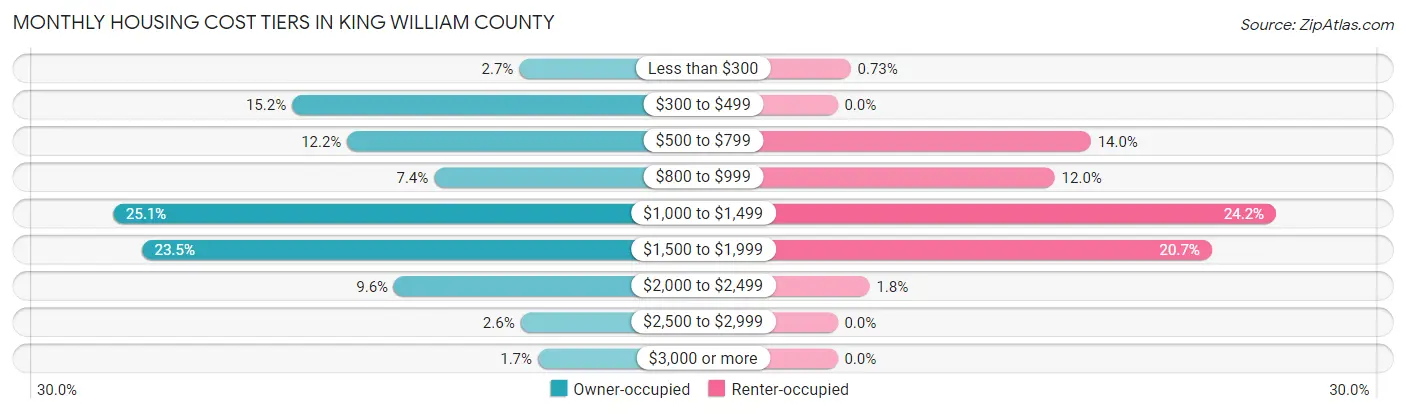
| Monthly Cost | Owner-occupied | Renter-occupied |
| Less than $300 | 159 (2.7%) | 7 (0.7%) |
| $300 to $499 | 904 (15.2%) | 0 (0.0%) |
| $500 to $799 | 723 (12.2%) | 134 (14.0%) |
| $800 to $999 | 438 (7.4%) | 115 (12.0%) |
| $1,000 to $1,499 | 1,491 (25.1%) | 232 (24.2%) |
| $1,500 to $1,999 | 1,397 (23.5%) | 198 (20.7%) |
| $2,000 to $2,499 | 570 (9.6%) | 17 (1.8%) |
| $2,500 to $2,999 | 155 (2.6%) | 0 (0.0%) |
| $3,000 or more | 98 (1.7%) | 0 (0.0%) |
| Total | 5,935 (100.0%) | 958 (100.0%) |
Physical Housing Characteristics in King William County
Housing Structures in King William County
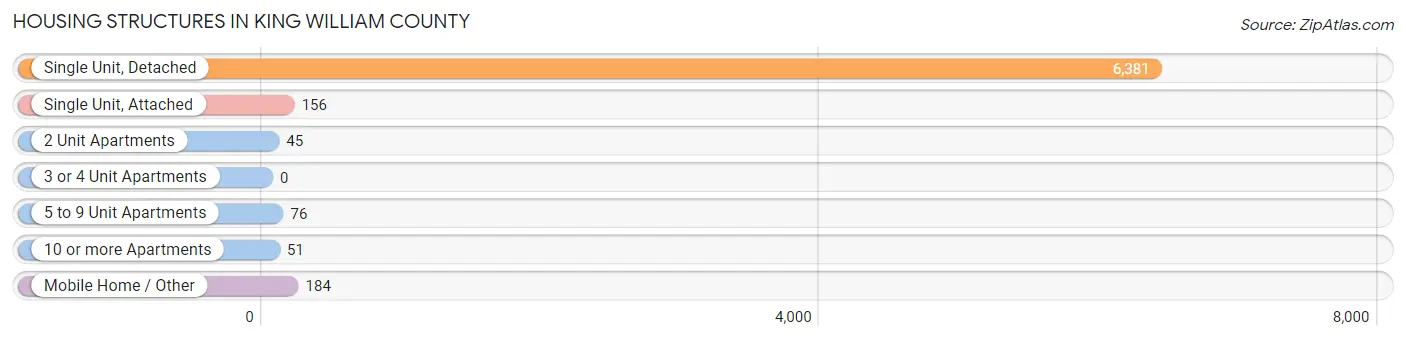
| Structure Type | # Housing Units | % Housing Units |
| Single Unit, Detached | 6,381 | 92.6% |
| Single Unit, Attached | 156 | 2.3% |
| 2 Unit Apartments | 45 | 0.6% |
| 3 or 4 Unit Apartments | 0 | 0.0% |
| 5 to 9 Unit Apartments | 76 | 1.1% |
| 10 or more Apartments | 51 | 0.7% |
| Mobile Home / Other | 184 | 2.7% |
| Total | 6,893 | 100.0% |
Housing Structures by Occupancy in King William County
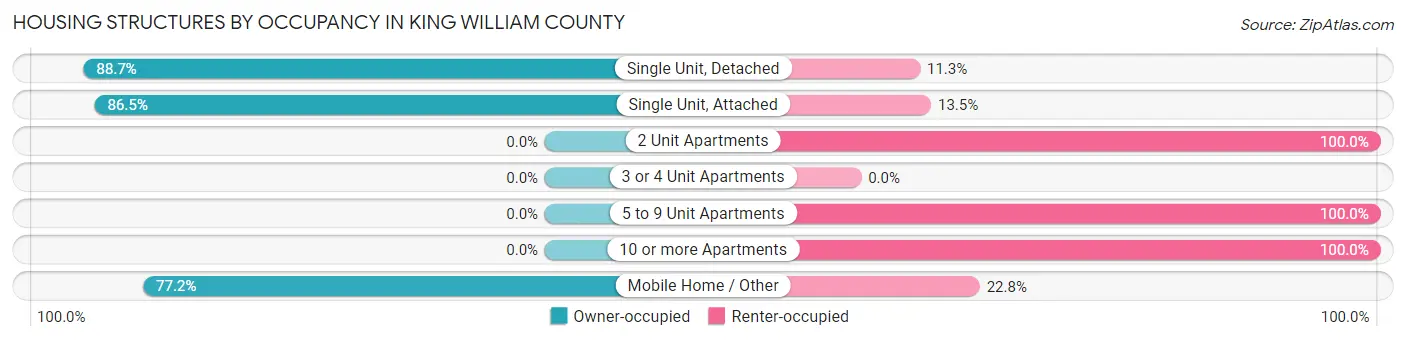
| Structure Type | Owner-occupied | Renter-occupied |
| Single Unit, Detached | 5,658 (88.7%) | 723 (11.3%) |
| Single Unit, Attached | 135 (86.5%) | 21 (13.5%) |
| 2 Unit Apartments | 0 (0.0%) | 45 (100.0%) |
| 3 or 4 Unit Apartments | 0 (0.0%) | 0 (0.0%) |
| 5 to 9 Unit Apartments | 0 (0.0%) | 76 (100.0%) |
| 10 or more Apartments | 0 (0.0%) | 51 (100.0%) |
| Mobile Home / Other | 142 (77.2%) | 42 (22.8%) |
| Total | 5,935 (86.1%) | 958 (13.9%) |
Housing Structures by Number of Rooms in King William County
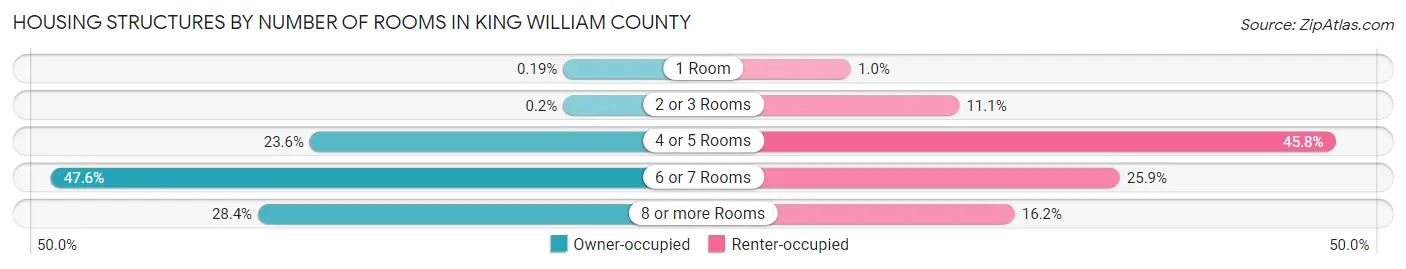
| Number of Rooms | Owner-occupied | Renter-occupied |
| 1 Room | 11 (0.2%) | 10 (1.0%) |
| 2 or 3 Rooms | 12 (0.2%) | 106 (11.1%) |
| 4 or 5 Rooms | 1,402 (23.6%) | 439 (45.8%) |
| 6 or 7 Rooms | 2,823 (47.6%) | 248 (25.9%) |
| 8 or more Rooms | 1,687 (28.4%) | 155 (16.2%) |
| Total | 5,935 (100.0%) | 958 (100.0%) |
Housing Structure by Heating Type in King William County
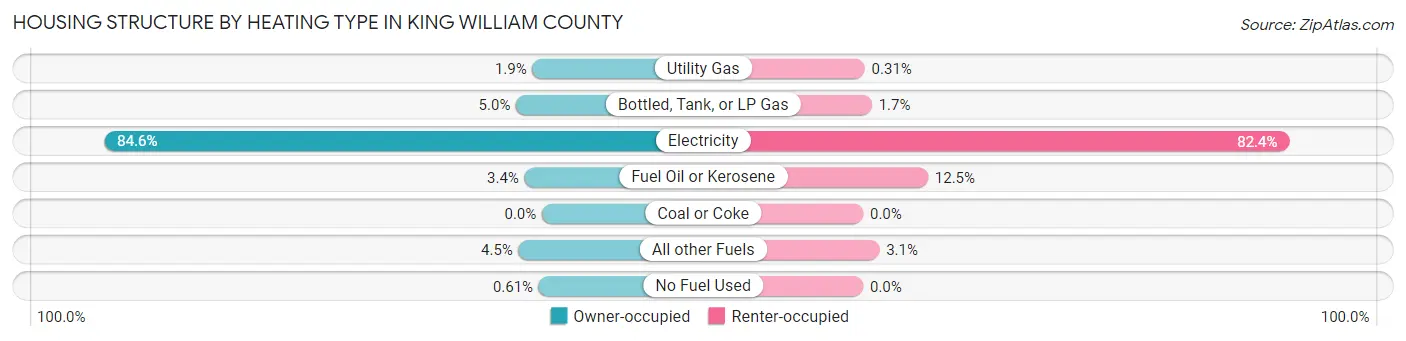
| Heating Type | Owner-occupied | Renter-occupied |
| Utility Gas | 110 (1.8%) | 3 (0.3%) |
| Bottled, Tank, or LP Gas | 297 (5.0%) | 16 (1.7%) |
| Electricity | 5,023 (84.6%) | 789 (82.4%) |
| Fuel Oil or Kerosene | 200 (3.4%) | 120 (12.5%) |
| Coal or Coke | 0 (0.0%) | 0 (0.0%) |
| All other Fuels | 269 (4.5%) | 30 (3.1%) |
| No Fuel Used | 36 (0.6%) | 0 (0.0%) |
| Total | 5,935 (100.0%) | 958 (100.0%) |
Household Vehicle Usage in King William County
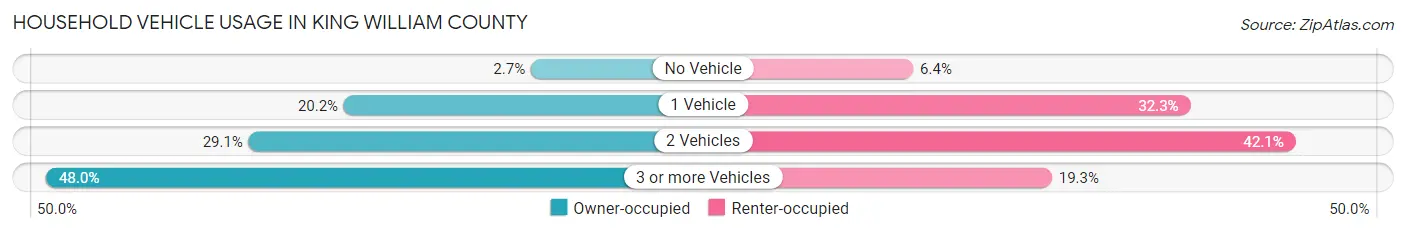
| Vehicles per Household | Owner-occupied | Renter-occupied |
| No Vehicle | 162 (2.7%) | 61 (6.4%) |
| 1 Vehicle | 1,198 (20.2%) | 309 (32.3%) |
| 2 Vehicles | 1,726 (29.1%) | 403 (42.1%) |
| 3 or more Vehicles | 2,849 (48.0%) | 185 (19.3%) |
| Total | 5,935 (100.0%) | 958 (100.0%) |
Real Estate & Mortgages in King William County
Real Estate and Mortgage Overview in King William County
| Characteristic | Without Mortgage | With Mortgage |
| Housing Units | 1,816 | 4,119 |
| Median Property Value | $245,600 | $254,700 |
| Median Household Income | $61,000 | $697 |
| Monthly Housing Costs | $475 | $98 |
| Real Estate Taxes | $1,697 | $92 |
Property Value by Mortgage Status in King William County
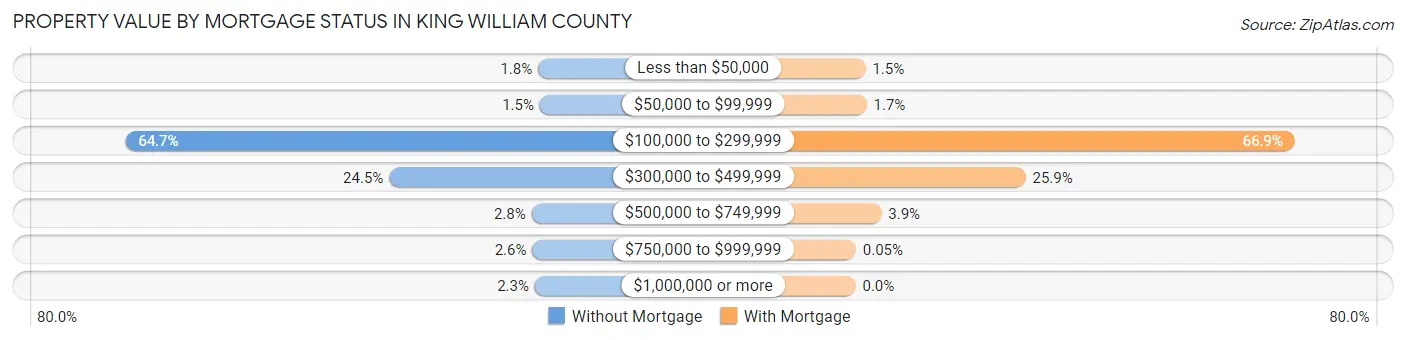
| Property Value | Without Mortgage | With Mortgage |
| Less than $50,000 | 32 (1.8%) | 62 (1.5%) |
| $50,000 to $99,999 | 27 (1.5%) | 69 (1.7%) |
| $100,000 to $299,999 | 1,174 (64.6%) | 2,757 (66.9%) |
| $300,000 to $499,999 | 444 (24.4%) | 1,067 (25.9%) |
| $500,000 to $749,999 | 50 (2.8%) | 162 (3.9%) |
| $750,000 to $999,999 | 48 (2.6%) | 2 (0.1%) |
| $1,000,000 or more | 41 (2.3%) | 0 (0.0%) |
| Total | 1,816 (100.0%) | 4,119 (100.0%) |
Household Income by Mortgage Status in King William County
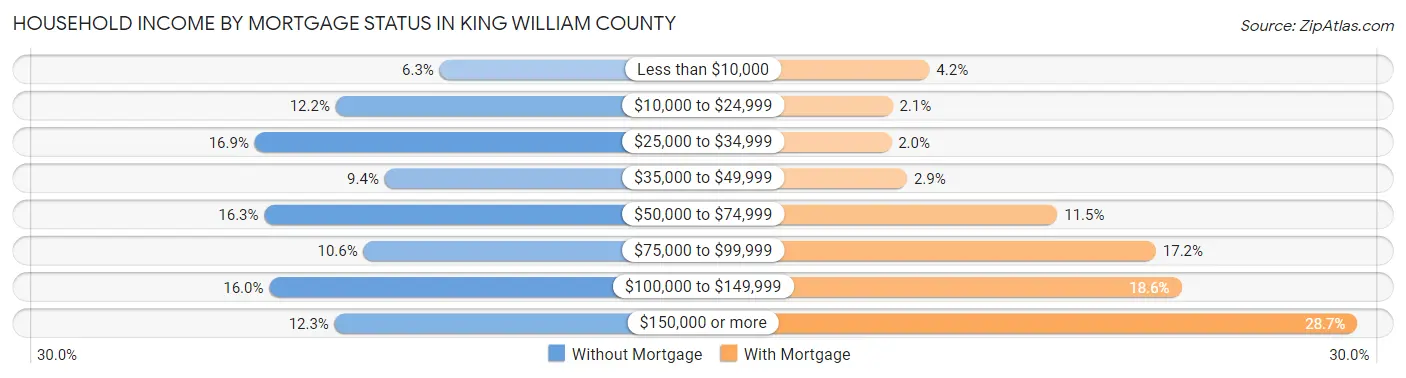
| Household Income | Without Mortgage | With Mortgage |
| Less than $10,000 | 114 (6.3%) | 174 (4.2%) |
| $10,000 to $24,999 | 222 (12.2%) | 87 (2.1%) |
| $25,000 to $34,999 | 306 (16.9%) | 84 (2.0%) |
| $35,000 to $49,999 | 171 (9.4%) | 121 (2.9%) |
| $50,000 to $74,999 | 296 (16.3%) | 475 (11.5%) |
| $75,000 to $99,999 | 193 (10.6%) | 707 (17.2%) |
| $100,000 to $149,999 | 291 (16.0%) | 767 (18.6%) |
| $150,000 or more | 223 (12.3%) | 1,181 (28.7%) |
| Total | 1,816 (100.0%) | 4,119 (100.0%) |
Property Value to Household Income Ratio in King William County
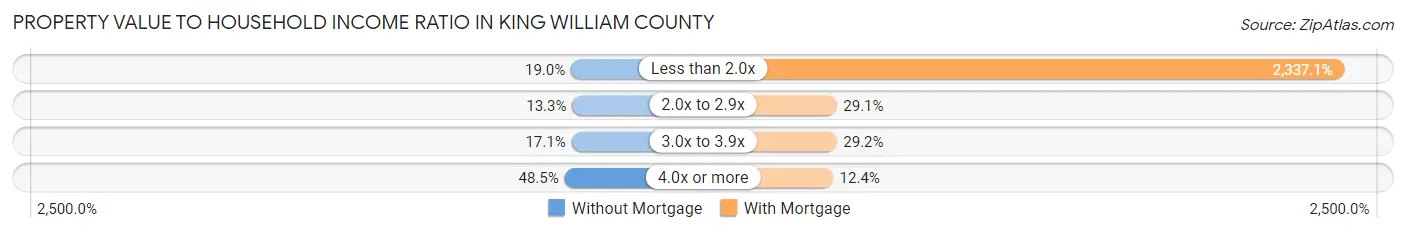
| Value-to-Income Ratio | Without Mortgage | With Mortgage |
| Less than 2.0x | 345 (19.0%) | 96,263 (2,337.0%) |
| 2.0x to 2.9x | 242 (13.3%) | 1,200 (29.1%) |
| 3.0x to 3.9x | 310 (17.1%) | 1,204 (29.2%) |
| 4.0x or more | 881 (48.5%) | 512 (12.4%) |
| Total | 1,816 (100.0%) | 4,119 (100.0%) |
Real Estate Taxes by Mortgage Status in King William County
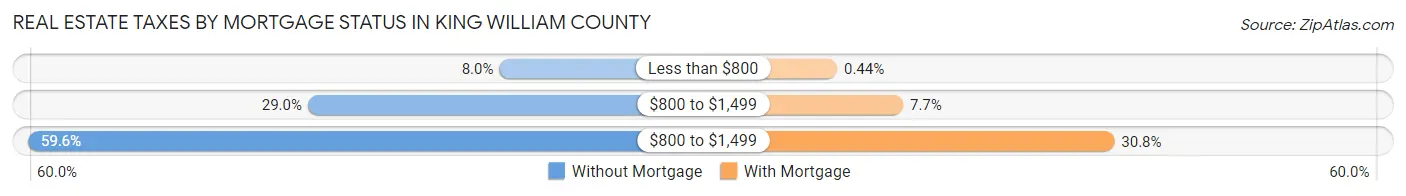
| Property Taxes | Without Mortgage | With Mortgage |
| Less than $800 | 145 (8.0%) | 18 (0.4%) |
| $800 to $1,499 | 526 (29.0%) | 316 (7.7%) |
| $800 to $1,499 | 1,083 (59.6%) | 1,270 (30.8%) |
| Total | 1,816 (100.0%) | 4,119 (100.0%) |
Health & Disability in King William County
Health Insurance Coverage by Age in King William County
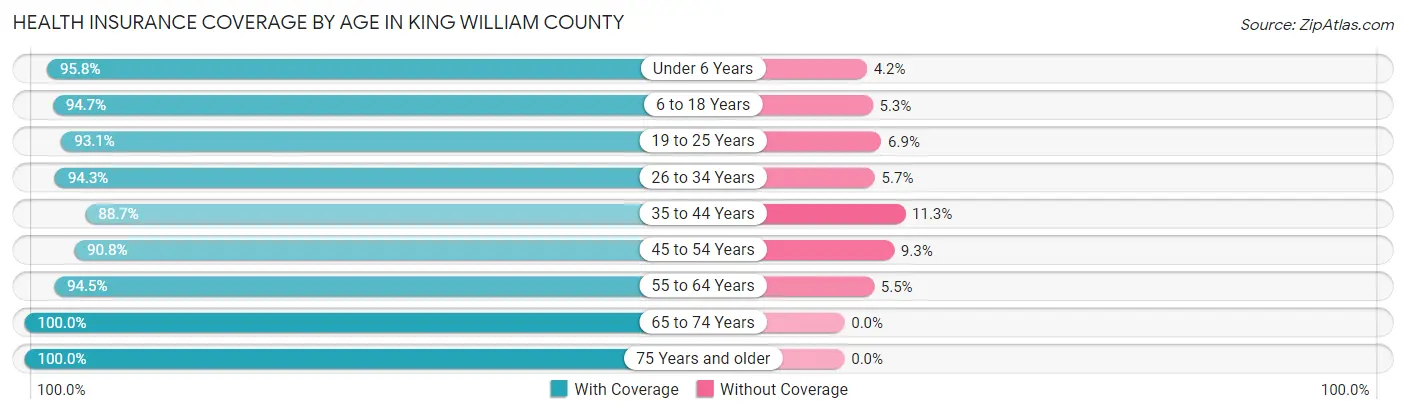
| Age Bracket | With Coverage | Without Coverage |
| Under 6 Years | 1,283 (95.8%) | 56 (4.2%) |
| 6 to 18 Years | 2,966 (94.7%) | 165 (5.3%) |
| 19 to 25 Years | 1,057 (93.1%) | 78 (6.9%) |
| 26 to 34 Years | 2,067 (94.3%) | 124 (5.7%) |
| 35 to 44 Years | 2,040 (88.7%) | 261 (11.3%) |
| 45 to 54 Years | 2,089 (90.7%) | 213 (9.2%) |
| 55 to 64 Years | 2,384 (94.5%) | 139 (5.5%) |
| 65 to 74 Years | 1,848 (100.0%) | 0 (0.0%) |
| 75 Years and older | 1,006 (100.0%) | 0 (0.0%) |
| Total | 16,740 (94.2%) | 1,036 (5.8%) |
Health Insurance Coverage by Citizenship Status in King William County
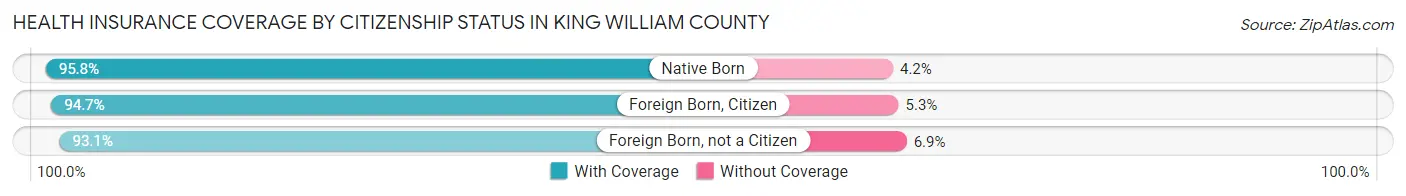
| Citizenship Status | With Coverage | Without Coverage |
| Native Born | 1,283 (95.8%) | 56 (4.2%) |
| Foreign Born, Citizen | 2,966 (94.7%) | 165 (5.3%) |
| Foreign Born, not a Citizen | 1,057 (93.1%) | 78 (6.9%) |
Health Insurance Coverage by Household Income in King William County
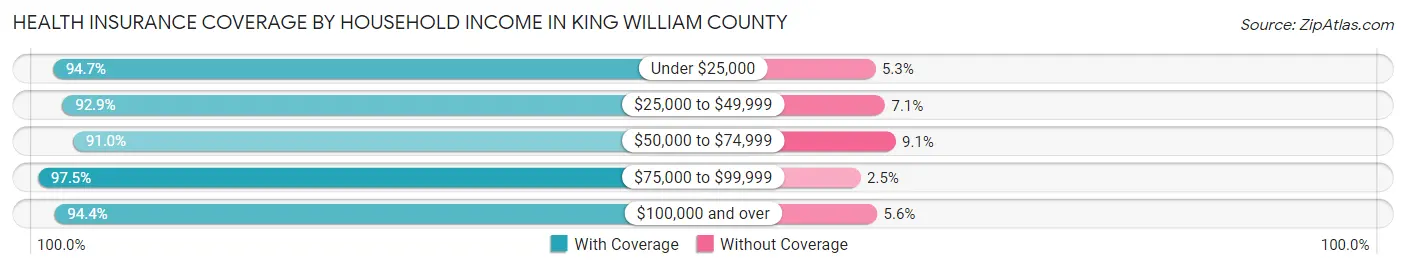
| Household Income | With Coverage | Without Coverage |
| Under $25,000 | 1,096 (94.7%) | 61 (5.3%) |
| $25,000 to $49,999 | 2,367 (92.9%) | 180 (7.1%) |
| $50,000 to $74,999 | 2,614 (90.9%) | 260 (9.0%) |
| $75,000 to $99,999 | 2,855 (97.5%) | 73 (2.5%) |
| $100,000 and over | 7,804 (94.4%) | 462 (5.6%) |
Public vs Private Health Insurance Coverage by Age in King William County
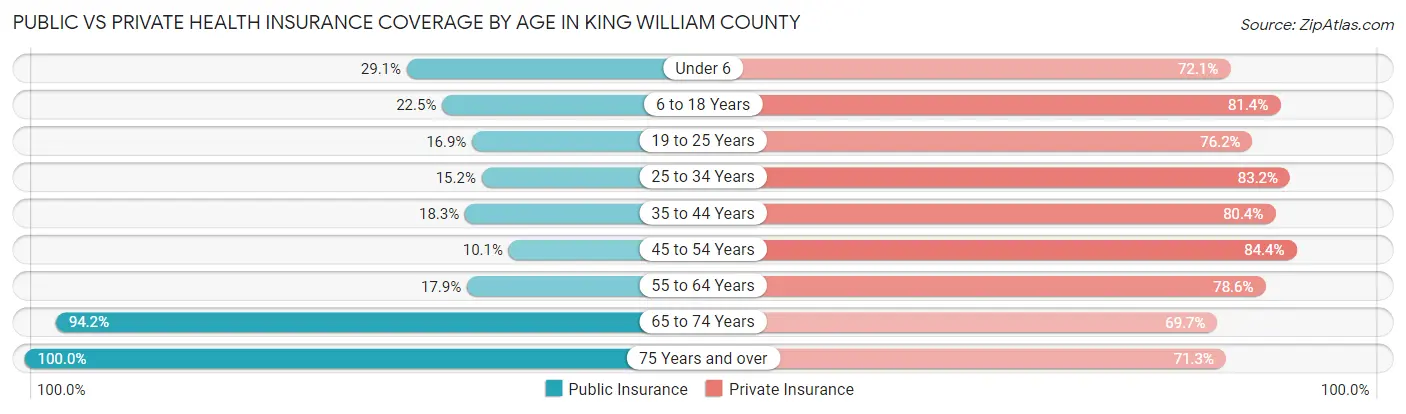
| Age Bracket | Public Insurance | Private Insurance |
| Under 6 | 389 (29.0%) | 965 (72.1%) |
| 6 to 18 Years | 704 (22.5%) | 2,547 (81.4%) |
| 19 to 25 Years | 192 (16.9%) | 865 (76.2%) |
| 25 to 34 Years | 332 (15.1%) | 1,822 (83.2%) |
| 35 to 44 Years | 420 (18.2%) | 1,851 (80.4%) |
| 45 to 54 Years | 233 (10.1%) | 1,942 (84.4%) |
| 55 to 64 Years | 451 (17.9%) | 1,983 (78.6%) |
| 65 to 74 Years | 1,741 (94.2%) | 1,288 (69.7%) |
| 75 Years and over | 1,006 (100.0%) | 717 (71.3%) |
| Total | 5,468 (30.8%) | 13,980 (78.6%) |
Disability Status by Sex by Age in King William County
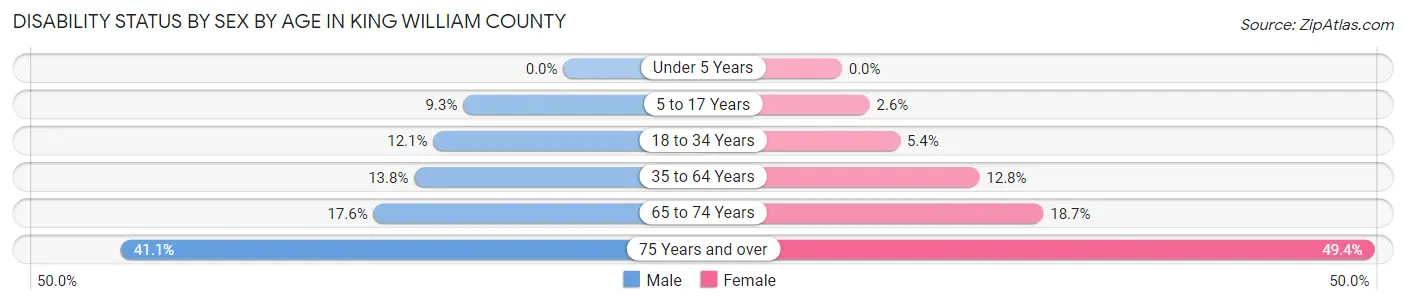
| Age Bracket | Male | Female |
| Under 5 Years | 0 (0.0%) | 0 (0.0%) |
| 5 to 17 Years | 145 (9.3%) | 37 (2.6%) |
| 18 to 34 Years | 222 (12.1%) | 102 (5.4%) |
| 35 to 64 Years | 489 (13.8%) | 459 (12.8%) |
| 65 to 74 Years | 157 (17.6%) | 179 (18.7%) |
| 75 Years and over | 163 (41.1%) | 301 (49.4%) |
Disability Class by Sex by Age in King William County
Disability Class: Hearing Difficulty
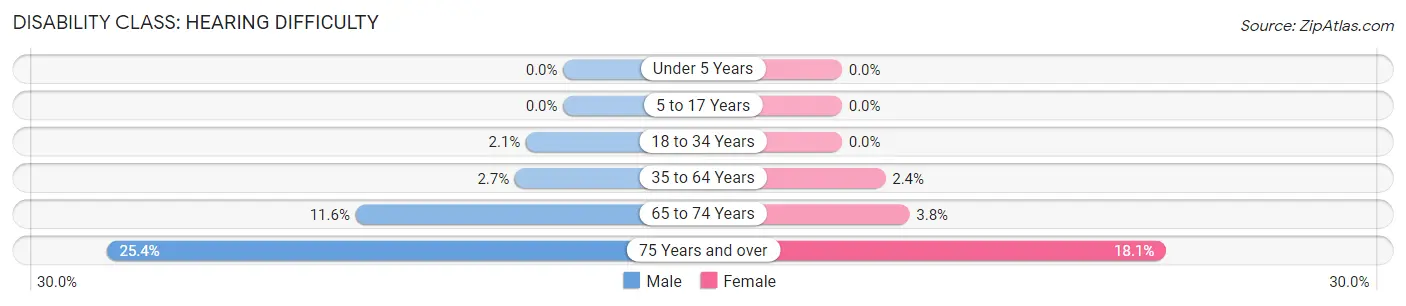
| Age Bracket | Male | Female |
| Under 5 Years | 0 (0.0%) | 0 (0.0%) |
| 5 to 17 Years | 0 (0.0%) | 0 (0.0%) |
| 18 to 34 Years | 38 (2.1%) | 0 (0.0%) |
| 35 to 64 Years | 95 (2.7%) | 87 (2.4%) |
| 65 to 74 Years | 103 (11.6%) | 36 (3.8%) |
| 75 Years and over | 101 (25.4%) | 110 (18.1%) |
Disability Class: Vision Difficulty
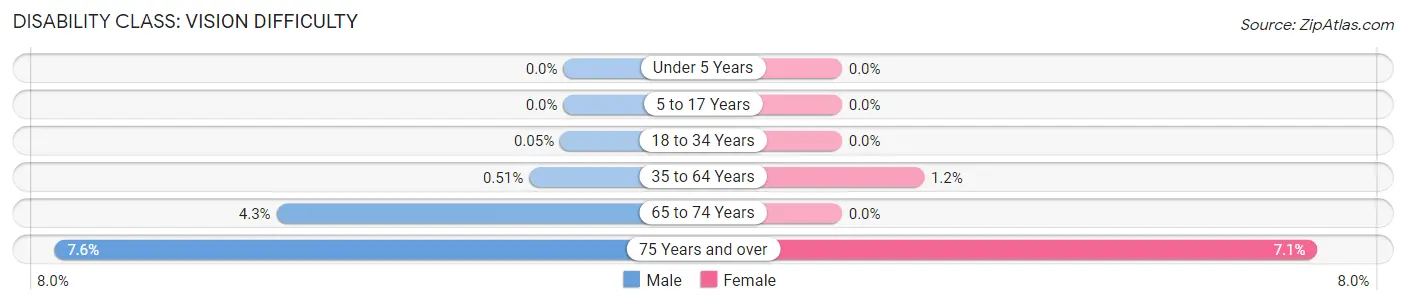
| Age Bracket | Male | Female |
| Under 5 Years | 0 (0.0%) | 0 (0.0%) |
| 5 to 17 Years | 0 (0.0%) | 0 (0.0%) |
| 18 to 34 Years | 1 (0.1%) | 0 (0.0%) |
| 35 to 64 Years | 18 (0.5%) | 44 (1.2%) |
| 65 to 74 Years | 38 (4.3%) | 0 (0.0%) |
| 75 Years and over | 30 (7.6%) | 43 (7.1%) |
Disability Class: Cognitive Difficulty
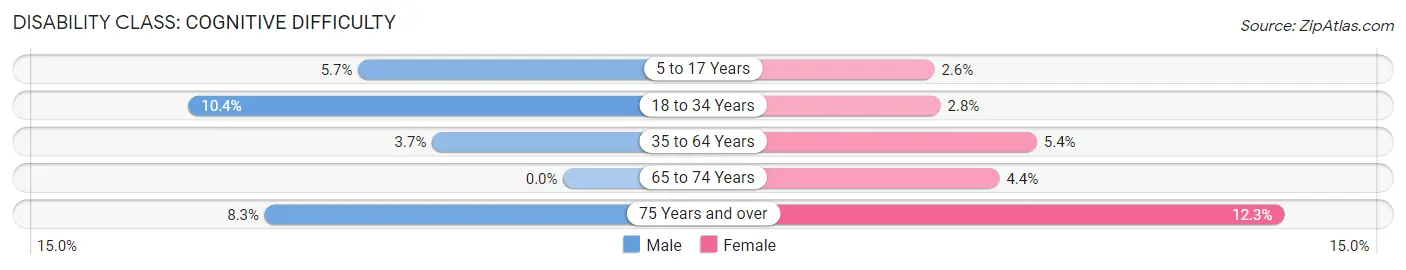
| Age Bracket | Male | Female |
| 5 to 17 Years | 89 (5.7%) | 37 (2.6%) |
| 18 to 34 Years | 192 (10.4%) | 52 (2.8%) |
| 35 to 64 Years | 129 (3.6%) | 195 (5.4%) |
| 65 to 74 Years | 0 (0.0%) | 42 (4.4%) |
| 75 Years and over | 33 (8.3%) | 75 (12.3%) |
Disability Class: Ambulatory Difficulty
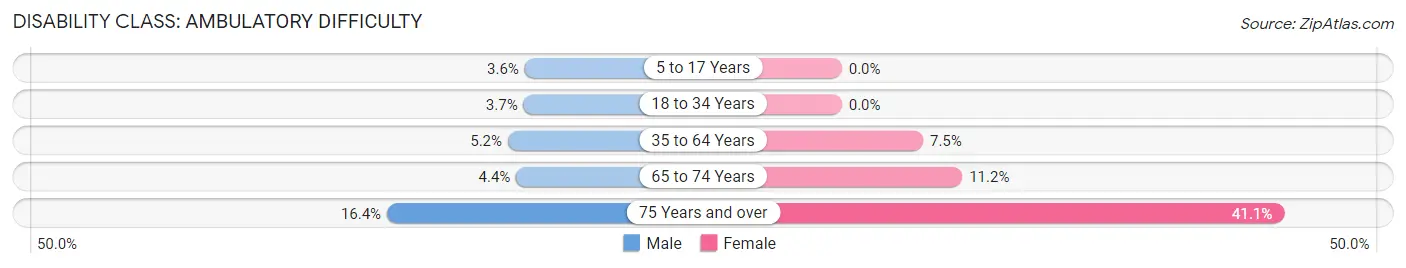
| Age Bracket | Male | Female |
| 5 to 17 Years | 56 (3.6%) | 0 (0.0%) |
| 18 to 34 Years | 68 (3.7%) | 0 (0.0%) |
| 35 to 64 Years | 182 (5.1%) | 271 (7.5%) |
| 65 to 74 Years | 39 (4.4%) | 107 (11.2%) |
| 75 Years and over | 65 (16.4%) | 250 (41.0%) |
Disability Class: Self-Care Difficulty
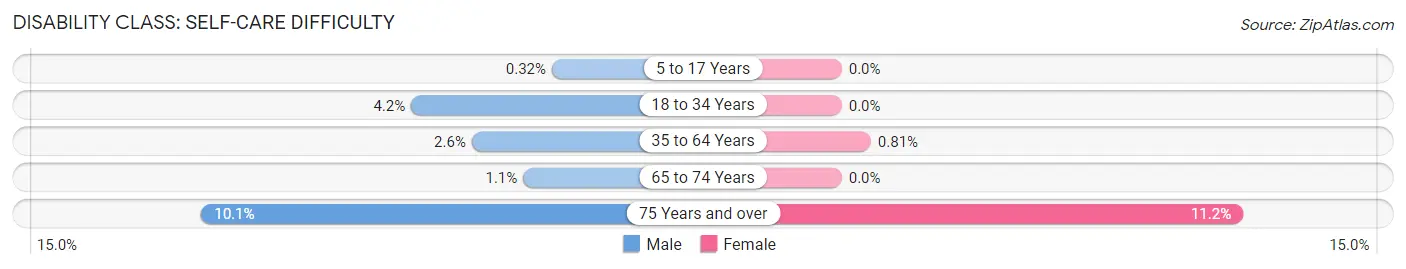
| Age Bracket | Male | Female |
| 5 to 17 Years | 5 (0.3%) | 0 (0.0%) |
| 18 to 34 Years | 78 (4.2%) | 0 (0.0%) |
| 35 to 64 Years | 90 (2.5%) | 29 (0.8%) |
| 65 to 74 Years | 10 (1.1%) | 0 (0.0%) |
| 75 Years and over | 40 (10.1%) | 68 (11.2%) |
Technology Access in King William County
Computing Device Access in King William County
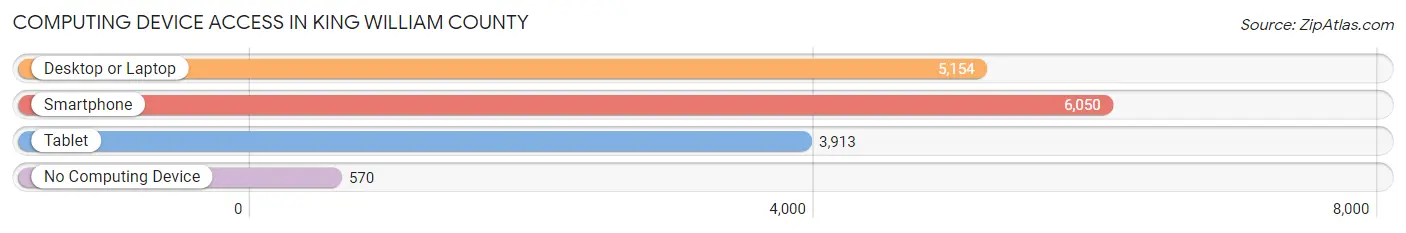
| Device Type | # Households | % Households |
| Desktop or Laptop | 5,154 | 74.8% |
| Smartphone | 6,050 | 87.8% |
| Tablet | 3,913 | 56.8% |
| No Computing Device | 570 | 8.3% |
| Total | 6,893 | 100.0% |
Internet Access in King William County
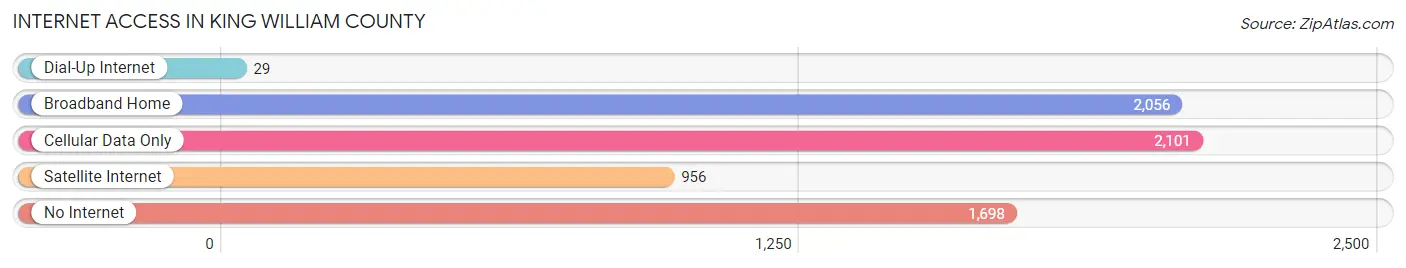
| Internet Type | # Households | % Households |
| Dial-Up Internet | 29 | 0.4% |
| Broadband Home | 2,056 | 29.8% |
| Cellular Data Only | 2,101 | 30.5% |
| Satellite Internet | 956 | 13.9% |
| No Internet | 1,698 | 24.6% |
| Total | 6,893 | 100.0% |
King William County Summary
William County, Virginia is located in the eastern part of the state, just south of the Potomac River. It is bordered by King George County to the north, Stafford County to the west, and Charles City County to the south. The county seat is the town of King William, which is located on the Mattaponi River. The county was named for King William III of England, who reigned from 1689 to 1702.
History
The area that is now King William County was first settled by Native Americans, including the Pamunkey and Mattaponi tribes. The first European settlers arrived in the area in the early 1600s. The county was officially established in 1702, and was named for King William III of England.
During the American Revolution, the county was the site of several battles, including the Battle of King's Mountain in 1781. After the war, the county experienced a period of growth and prosperity. In the early 1800s, the county was home to several large plantations, and the population grew steadily.
In the mid-1800s, the county was the site of several battles during the Civil War. After the war, the county experienced a period of economic decline, as many of the plantations were abandoned. In the late 1800s, the county began to experience a period of growth and development, as new industries and businesses were established.
Geography
King William County covers an area of approximately 437 square miles. The county is located in the eastern part of the state, just south of the Potomac River. It is bordered by King George County to the north, Stafford County to the west, and Charles City County to the south. The county is mostly rural, with the majority of the land being used for farming and forestry. The Mattaponi River runs through the county, and there are several small lakes and ponds scattered throughout the area.
Economy
The economy of King William County is largely based on agriculture and forestry. The county is home to several large farms, which produce a variety of crops, including corn, soybeans, wheat, and hay. The county is also home to several large timber companies, which harvest and process timber for use in construction and other industries.
In addition to agriculture and forestry, the county is home to several small businesses, including restaurants, retail stores, and service providers. The county is also home to several manufacturing companies, which produce a variety of products, including furniture, clothing, and electronics.
Demographics
As of the 2010 census, the population of King William County was 15,935. The population is largely white (83.3%), with African Americans making up 11.3% of the population. Other racial groups include Native Americans (1.2%), Asians (1.1%), and Hispanics (2.1%).
The median household income in the county is $60,945, and the median home value is $219,400. The unemployment rate is 4.2%, and the poverty rate is 8.3%. The county is served by several public schools, as well as several private schools.
Common Questions
What is Per Capita Income in King William County?
Per Capita income in King William County is $36,145.
What is the Median Family Income in King William County?
Median Family Income in King William County is $93,490.
What is the Median Household income in King William County?
Median Household Income in King William County is $79,398.
What is Income or Wage Gap in King William County?
Income or Wage Gap in King William County is 38.5%.
Women in King William County earn 61.5 cents for every dollar earned by a man.
What is Inequality or Gini Index in King William County?
Inequality or Gini Index in King William County is 0.38.
What is the Total Population of King William County?
Total Population of King William County is 17,845.
What is the Total Male Population of King William County?
Total Male Population of King William County is 8,842.
What is the Total Female Population of King William County?
Total Female Population of King William County is 9,003.
What is the Ratio of Males per 100 Females in King William County?
There are 98.21 Males per 100 Females in King William County.
What is the Ratio of Females per 100 Males in King William County?
There are 101.82 Females per 100 Males in King William County.
What is the Median Population Age in King William County?
Median Population Age in King William County is 40.8 Years.
What is the Average Family Size in King William County
Average Family Size in King William County is 3.0 People.
What is the Average Household Size in King William County
Average Household Size in King William County is 2.6 People.
How Large is the Labor Force in King William County?
There are 9,640 People in the Labor Forcein in King William County.
What is the Percentage of People in the Labor Force in King William County?
67.7% of People are in the Labor Force in King William County.
What is the Unemployment Rate in King William County?
Unemployment Rate in King William County is 4.0%.