King and Queen County, VA Map & Demographics
King and Queen County Map
King and Queen County Overview
$38,904
PER CAPITA INCOME
$93,558
AVG FAMILY INCOME
$70,147
AVG HOUSEHOLD INCOME
23.3%
WAGE / INCOME GAP [ % ]
76.7¢/ $1
WAGE / INCOME GAP [ $ ]
0.45
INEQUALITY / GINI INDEX
6,681
TOTAL POPULATION
3,485
MALE POPULATION
3,196
FEMALE POPULATION
109.04
MALES / 100 FEMALES
91.71
FEMALES / 100 MALES
47.4
MEDIAN AGE
2.9
AVG FAMILY SIZE
2.4
AVG HOUSEHOLD SIZE
3,502
LABOR FORCE [ PEOPLE ]
62.2%
PERCENT IN LABOR FORCE
5.7%
UNEMPLOYMENT RATE
King and Queen County Area Codes
Income in King and Queen County
Income Overview in King and Queen County
Per Capita Income in King and Queen County is $38,904, while median incomes of families and households are $93,558 and $70,147 respectively.
| Characteristic | Number | Measure |
| Per Capita Income | 6,681 | $38,904 |
| Median Family Income | 1,920 | $93,558 |
| Mean Family Income | 1,920 | $108,100 |
| Median Household Income | 2,826 | $70,147 |
| Mean Household Income | 2,826 | $89,188 |
| Income Deficit | 1,920 | $0 |
| Wage / Income Gap (%) | 6,681 | 23.28% |
| Wage / Income Gap ($) | 6,681 | 76.72¢ per $1 |
| Gini / Inequality Index | 6,681 | 0.45 |
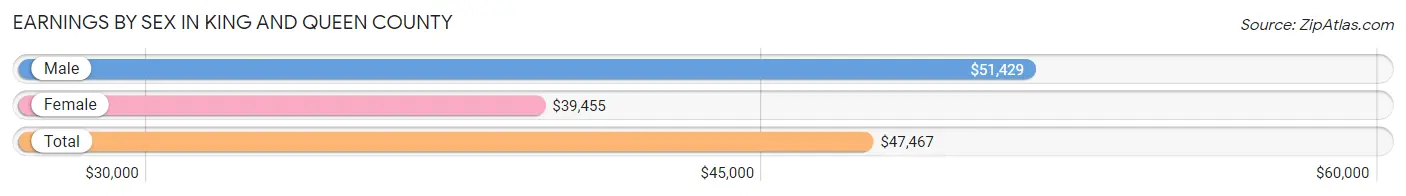
Earnings by Sex in King and Queen County
Average Earnings in King and Queen County are $47,467, $51,429 for men and $39,455 for women, a difference of 23.3%.
| Sex | Number | Average Earnings |
| Male | 2,004 (56.2%) | $51,429 |
| Female | 1,561 (43.8%) | $39,455 |
| Total | 3,565 (100.0%) | $47,467 |
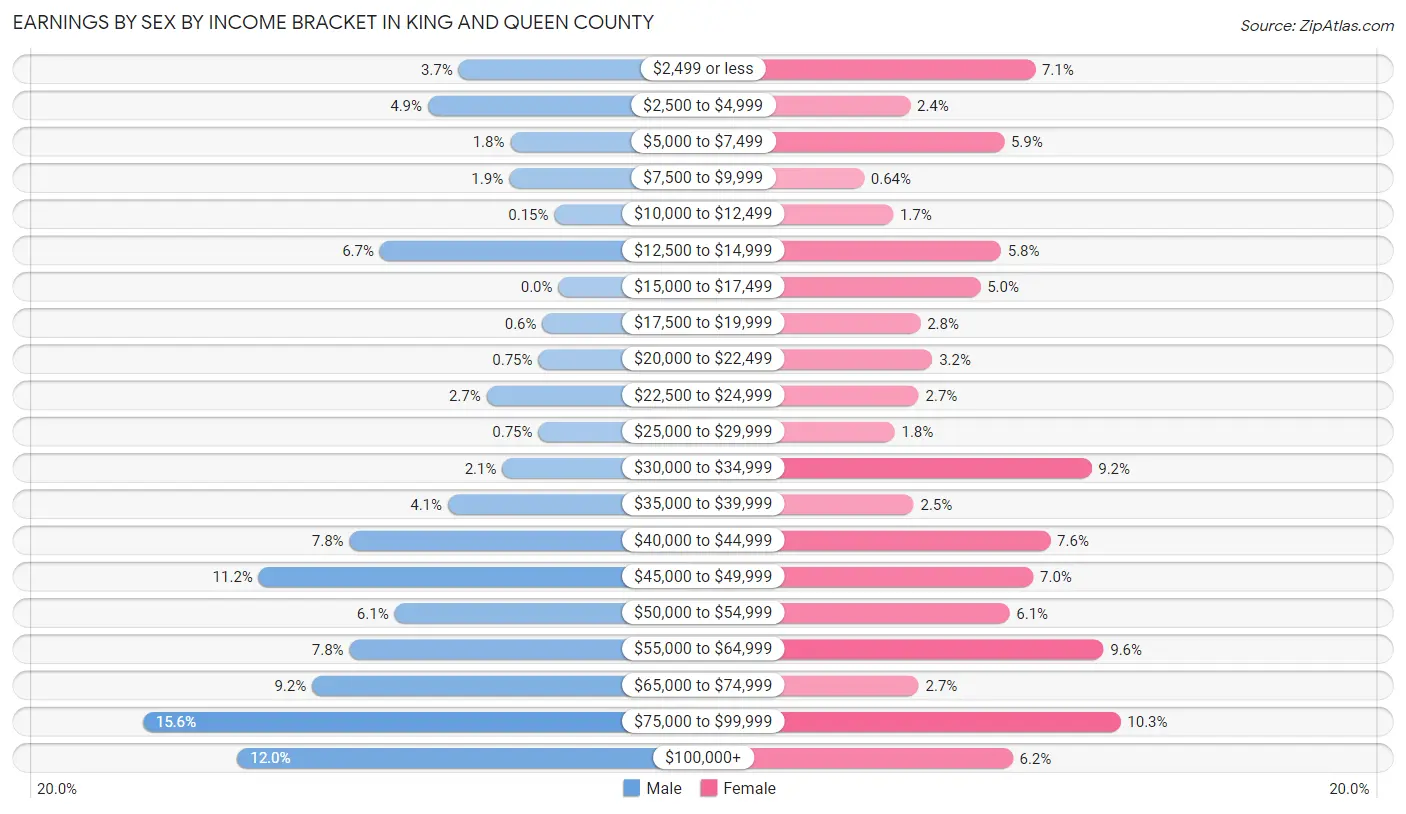
Earnings by Sex by Income Bracket in King and Queen County
The most common earnings brackets in King and Queen County are $75,000 to $99,999 for men (312 | 15.6%) and $75,000 to $99,999 for women (160 | 10.2%).
| Income | Male | Female |
| $2,499 or less | 75 (3.7%) | 110 (7.0%) |
| $2,500 to $4,999 | 98 (4.9%) | 37 (2.4%) |
| $5,000 to $7,499 | 36 (1.8%) | 92 (5.9%) |
| $7,500 to $9,999 | 37 (1.8%) | 10 (0.6%) |
| $10,000 to $12,499 | 3 (0.2%) | 27 (1.7%) |
| $12,500 to $14,999 | 134 (6.7%) | 90 (5.8%) |
| $15,000 to $17,499 | 0 (0.0%) | 78 (5.0%) |
| $17,500 to $19,999 | 12 (0.6%) | 43 (2.8%) |
| $20,000 to $22,499 | 15 (0.7%) | 50 (3.2%) |
| $22,500 to $24,999 | 54 (2.7%) | 42 (2.7%) |
| $25,000 to $29,999 | 15 (0.7%) | 28 (1.8%) |
| $30,000 to $34,999 | 42 (2.1%) | 143 (9.2%) |
| $35,000 to $39,999 | 83 (4.1%) | 39 (2.5%) |
| $40,000 to $44,999 | 157 (7.8%) | 119 (7.6%) |
| $45,000 to $49,999 | 225 (11.2%) | 109 (7.0%) |
| $50,000 to $54,999 | 123 (6.1%) | 95 (6.1%) |
| $55,000 to $64,999 | 157 (7.8%) | 150 (9.6%) |
| $65,000 to $74,999 | 185 (9.2%) | 42 (2.7%) |
| $75,000 to $99,999 | 312 (15.6%) | 160 (10.2%) |
| $100,000+ | 241 (12.0%) | 97 (6.2%) |
| Total | 2,004 (100.0%) | 1,561 (100.0%) |
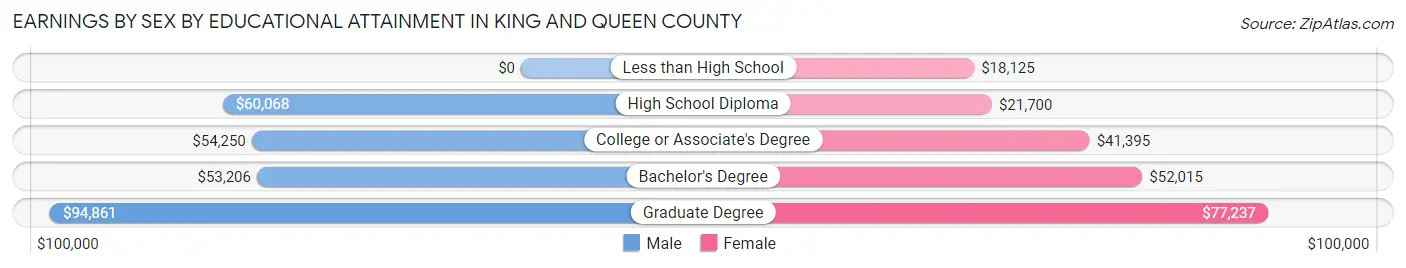
Earnings by Sex by Educational Attainment in King and Queen County
Average earnings in King and Queen County are $51,607 for men and $41,405 for women, a difference of 19.8%. Men with an educational attainment of graduate degree enjoy the highest average annual earnings of $94,861, while those with bachelor's degree education earn the least with $53,206. Women with an educational attainment of graduate degree earn the most with the average annual earnings of $77,237, while those with less than high school education have the smallest earnings of $18,125.
| Educational Attainment | Male Income | Female Income |
| Less than High School | - | - |
| High School Diploma | $60,068 | $21,700 |
| College or Associate's Degree | $54,250 | $41,395 |
| Bachelor's Degree | $53,206 | $52,015 |
| Graduate Degree | $94,861 | $77,237 |
| Total | $51,607 | $41,405 |
Family Income in King and Queen County
Family Income Brackets in King and Queen County
According to the King and Queen County family income data, there are 457 families falling into the $100,000 to $149,999 income range, which is the most common income bracket and makes up 23.8% of all families. Conversely, the $10,000 to $14,999 income bracket is the least frequent group with only 25 families (1.3%) belonging to this category.
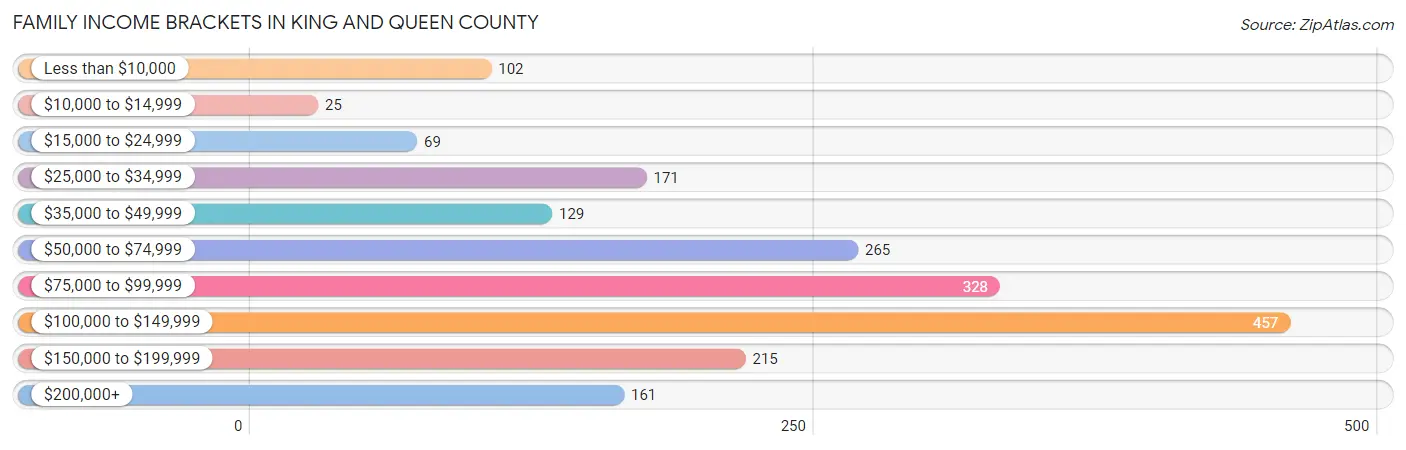
| Income Bracket | # Families | % Families |
| Less than $10,000 | 102 | 5.3% |
| $10,000 to $14,999 | 25 | 1.3% |
| $15,000 to $24,999 | 69 | 3.6% |
| $25,000 to $34,999 | 171 | 8.9% |
| $35,000 to $49,999 | 129 | 6.7% |
| $50,000 to $74,999 | 265 | 13.8% |
| $75,000 to $99,999 | 328 | 17.1% |
| $100,000 to $149,999 | 457 | 23.8% |
| $150,000 to $199,999 | 215 | 11.2% |
| $200,000+ | 161 | 8.4% |
Family Income by Famaliy Size in King and Queen County
4-person families (178 | 9.3%) account for the highest median family income in King and Queen County with $122,976 per family, while 2-person families (1,082 | 56.4%) have the highest median income of $41,030 per family member.
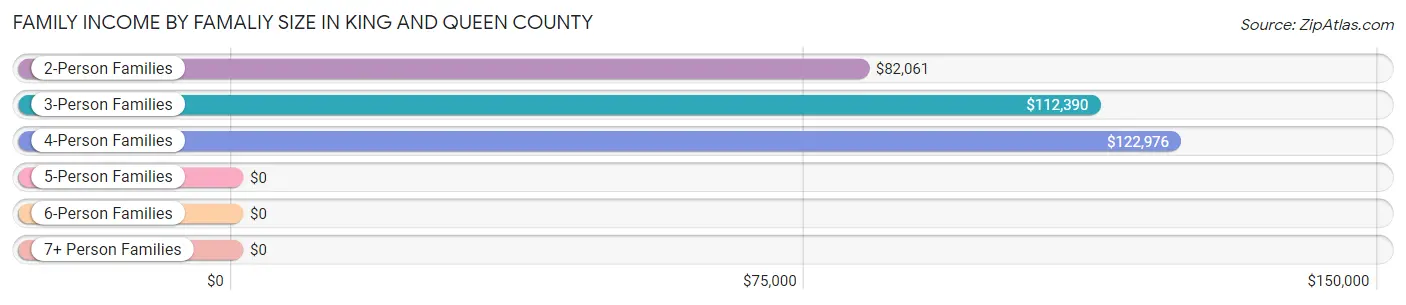
| Income Bracket | # Families | Median Income |
| 2-Person Families | 1,082 (56.4%) | $82,061 |
| 3-Person Families | 471 (24.5%) | $112,390 |
| 4-Person Families | 178 (9.3%) | $122,976 |
| 5-Person Families | 150 (7.8%) | $0 |
| 6-Person Families | 0 (0.0%) | $0 |
| 7+ Person Families | 39 (2.0%) | $0 |
| Total | 1,920 (100.0%) | $93,558 |
Family Income by Number of Earners in King and Queen County
The median family income in King and Queen County is $93,558, with families comprising 3+ earners (191) having the highest median family income of $148,641, while families with no earners (242) have the lowest median family income of $52,727, accounting for 10.0% and 12.6% of families, respectively.
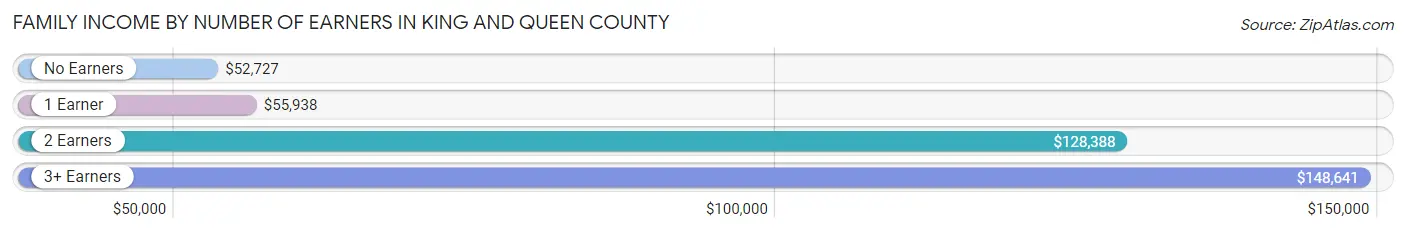
| Number of Earners | # Families | Median Income |
| No Earners | 242 (12.6%) | $52,727 |
| 1 Earner | 820 (42.7%) | $55,938 |
| 2 Earners | 667 (34.7%) | $128,388 |
| 3+ Earners | 191 (10.0%) | $148,641 |
| Total | 1,920 (100.0%) | $93,558 |
Household Income in King and Queen County
Household Income Brackets in King and Queen County
With 514 households falling in the category, the $100,000 to $149,999 income range is the most frequent in King and Queen County, accounting for 18.2% of all households. In contrast, only 133 households (4.7%) fall into the $10,000 to $14,999 income bracket, making it the least populous group.
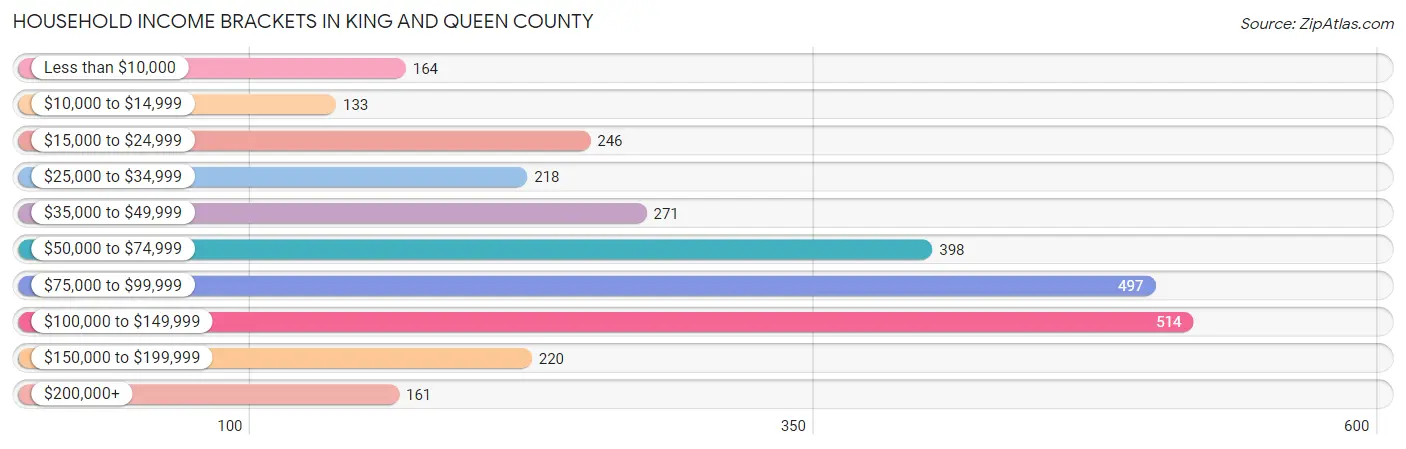
| Income Bracket | # Households | % Households |
| Less than $10,000 | 164 | 5.8% |
| $10,000 to $14,999 | 133 | 4.7% |
| $15,000 to $24,999 | 246 | 8.7% |
| $25,000 to $34,999 | 218 | 7.7% |
| $35,000 to $49,999 | 271 | 9.6% |
| $50,000 to $74,999 | 398 | 14.1% |
| $75,000 to $99,999 | 497 | 17.6% |
| $100,000 to $149,999 | 514 | 18.2% |
| $150,000 to $199,999 | 220 | 7.8% |
| $200,000+ | 161 | 5.7% |
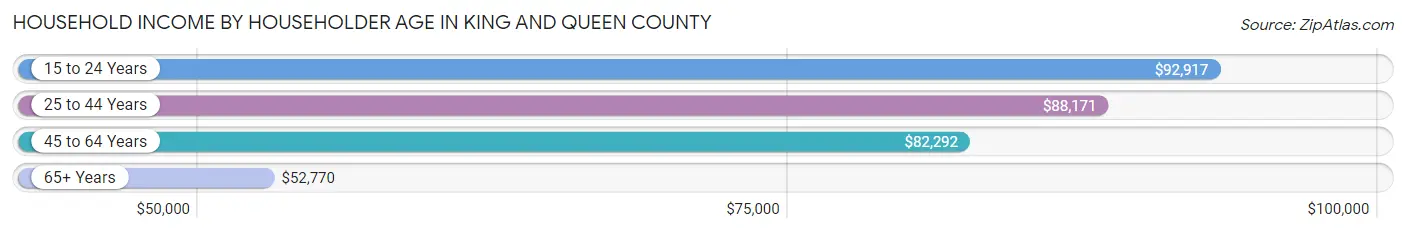
Household Income by Householder Age in King and Queen County
The median household income in King and Queen County is $70,147, with the highest median household income of $92,917 found in the 15 to 24 years age bracket for the primary householder. A total of 50 households (1.8%) fall into this category. Meanwhile, the 65+ years age bracket for the primary householder has the lowest median household income of $52,770, with 1,046 households (37.0%) in this group.
| Income Bracket | # Households | Median Income |
| 15 to 24 Years | 50 (1.8%) | $92,917 |
| 25 to 44 Years | 592 (20.9%) | $88,171 |
| 45 to 64 Years | 1,138 (40.3%) | $82,292 |
| 65+ Years | 1,046 (37.0%) | $52,770 |
| Total | 2,826 (100.0%) | $70,147 |
Poverty in King and Queen County
Income Below Poverty by Sex and Age in King and Queen County
With 17.1% poverty level for males and 23.1% for females among the residents of King and Queen County, 15 year old males and 12 to 14 year old females are the most vulnerable to poverty, with 31 males (96.9%) and 95 females (94.1%) in their respective age groups living below the poverty level.
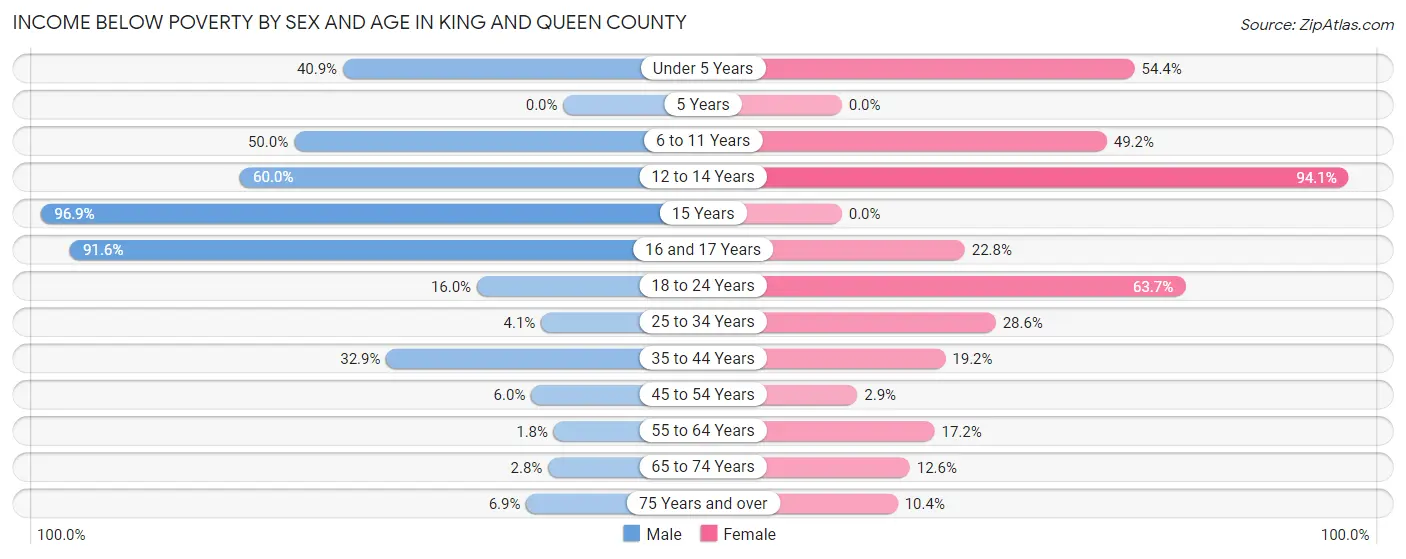
| Age Bracket | Male | Female |
| Under 5 Years | 81 (40.9%) | 50 (54.3%) |
| 5 Years | 0 (0.0%) | 0 (0.0%) |
| 6 to 11 Years | 105 (50.0%) | 91 (49.2%) |
| 12 to 14 Years | 78 (60.0%) | 95 (94.1%) |
| 15 Years | 31 (96.9%) | 0 (0.0%) |
| 16 and 17 Years | 76 (91.6%) | 21 (22.8%) |
| 18 to 24 Years | 17 (16.0%) | 93 (63.7%) |
| 25 to 34 Years | 19 (4.1%) | 100 (28.6%) |
| 35 to 44 Years | 118 (32.9%) | 74 (19.2%) |
| 45 to 54 Years | 30 (6.0%) | 12 (2.9%) |
| 55 to 64 Years | 11 (1.8%) | 105 (17.2%) |
| 65 to 74 Years | 13 (2.8%) | 64 (12.6%) |
| 75 Years and over | 16 (6.9%) | 30 (10.4%) |
| Total | 595 (17.1%) | 735 (23.1%) |
Income Above Poverty by Sex and Age in King and Queen County
According to the poverty statistics in King and Queen County, males aged 5 years and females aged 5 years are the age groups that are most secure financially, with 100.0% of males and 100.0% of females in these age groups living above the poverty line.
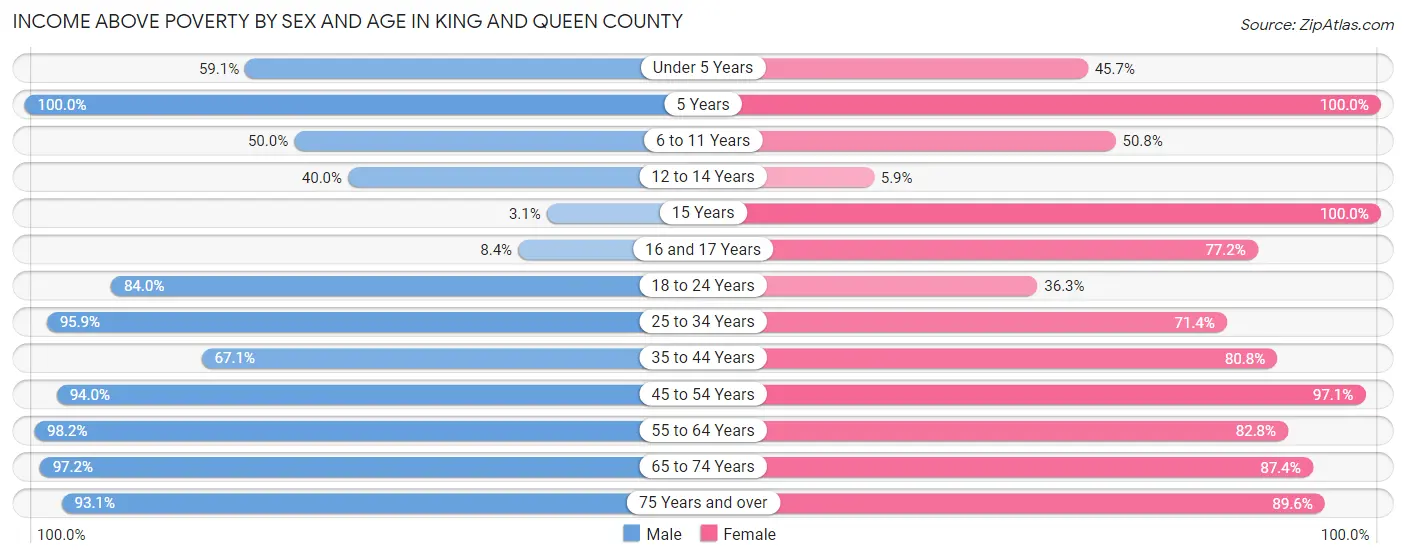
| Age Bracket | Male | Female |
| Under 5 Years | 117 (59.1%) | 42 (45.7%) |
| 5 Years | 81 (100.0%) | 2 (100.0%) |
| 6 to 11 Years | 105 (50.0%) | 94 (50.8%) |
| 12 to 14 Years | 52 (40.0%) | 6 (5.9%) |
| 15 Years | 1 (3.1%) | 10 (100.0%) |
| 16 and 17 Years | 7 (8.4%) | 71 (77.2%) |
| 18 to 24 Years | 89 (84.0%) | 53 (36.3%) |
| 25 to 34 Years | 443 (95.9%) | 250 (71.4%) |
| 35 to 44 Years | 241 (67.1%) | 311 (80.8%) |
| 45 to 54 Years | 473 (94.0%) | 405 (97.1%) |
| 55 to 64 Years | 615 (98.2%) | 505 (82.8%) |
| 65 to 74 Years | 449 (97.2%) | 443 (87.4%) |
| 75 Years and over | 217 (93.1%) | 259 (89.6%) |
| Total | 2,890 (82.9%) | 2,451 (76.9%) |
Income Below Poverty Among Married-Couple Families in King and Queen County
The poverty statistics for married-couple families in King and Queen County show that 5.9% or 88 of the total 1,491 families live below the poverty line. Families with 5 or more children have the highest poverty rate of 84.6%, comprising of 33 families. On the other hand, families with no children have the lowest poverty rate of 0.7%, which includes 7 families.
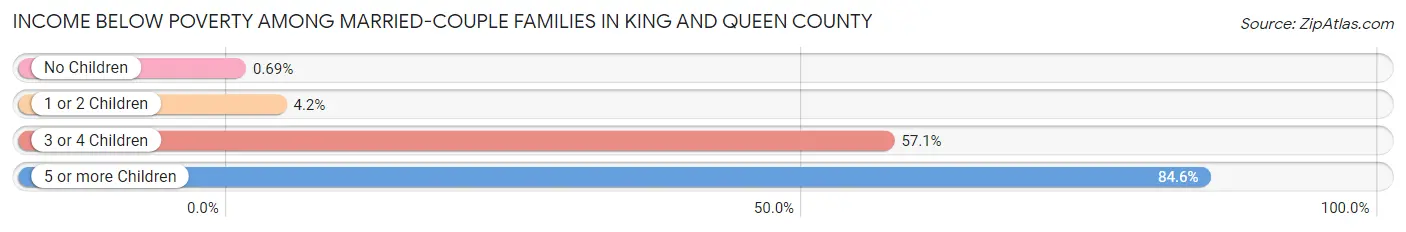
| Children | Above Poverty | Below Poverty |
| No Children | 1,010 (99.3%) | 7 (0.7%) |
| 1 or 2 Children | 363 (95.8%) | 16 (4.2%) |
| 3 or 4 Children | 24 (42.9%) | 32 (57.1%) |
| 5 or more Children | 6 (15.4%) | 33 (84.6%) |
| Total | 1,403 (94.1%) | 88 (5.9%) |
Income Below Poverty Among Single-Parent Households in King and Queen County
According to the poverty data in King and Queen County, 23.1% or 27 single-father households and 30.8% or 96 single-mother households are living below the poverty line. Among single-father households, those with 1 or 2 children have the highest poverty rate, with 27 households (56.2%) experiencing poverty. Likewise, among single-mother households, those with 3 or 4 children have the highest poverty rate, with 40 households (100.0%) falling below the poverty line.
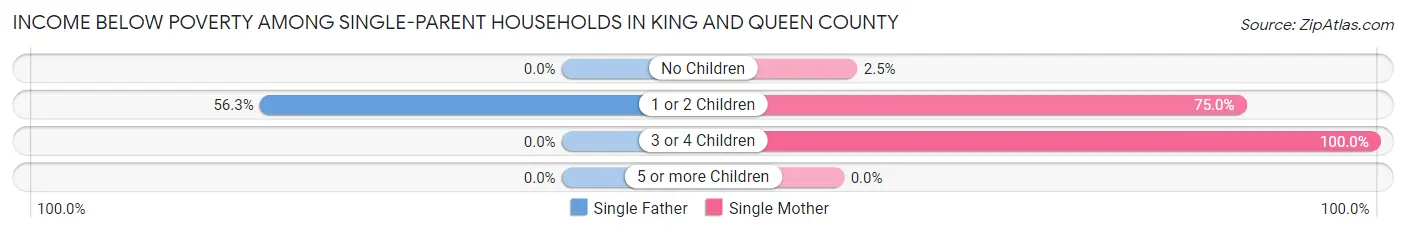
| Children | Single Father | Single Mother |
| No Children | 0 (0.0%) | 5 (2.5%) |
| 1 or 2 Children | 27 (56.2%) | 51 (75.0%) |
| 3 or 4 Children | 0 (0.0%) | 40 (100.0%) |
| 5 or more Children | 0 (0.0%) | 0 (0.0%) |
| Total | 27 (23.1%) | 96 (30.8%) |
Income Below Poverty Among Married-Couple vs Single-Parent Households in King and Queen County
The poverty data for King and Queen County shows that 88 of the married-couple family households (5.9%) and 123 of the single-parent households (28.7%) are living below the poverty level. Within the married-couple family households, those with 5 or more children have the highest poverty rate, with 33 households (84.6%) falling below the poverty line. Among the single-parent households, those with 3 or 4 children have the highest poverty rate, with 40 household (100.0%) living below poverty.
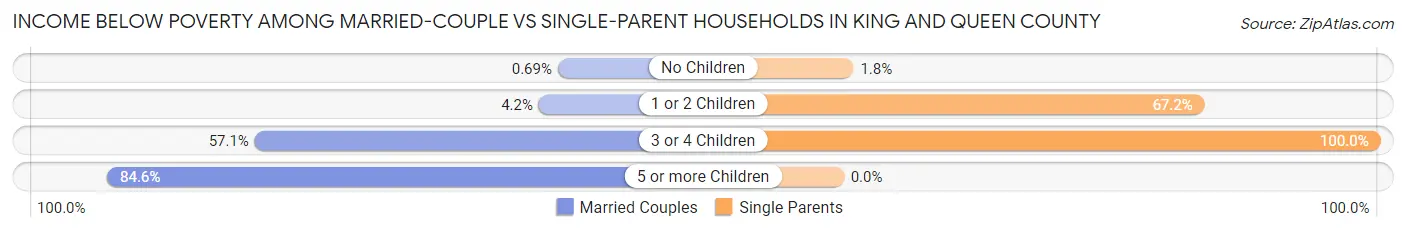
| Children | Married-Couple Families | Single-Parent Households |
| No Children | 7 (0.7%) | 5 (1.8%) |
| 1 or 2 Children | 16 (4.2%) | 78 (67.2%) |
| 3 or 4 Children | 32 (57.1%) | 40 (100.0%) |
| 5 or more Children | 33 (84.6%) | 0 (0.0%) |
| Total | 88 (5.9%) | 123 (28.7%) |
Race in King and Queen County
The most populous races in King and Queen County are White / Caucasian (4,472 | 66.9%), Black / African American (1,611 | 24.1%), and Two or more Races (364 | 5.4%).
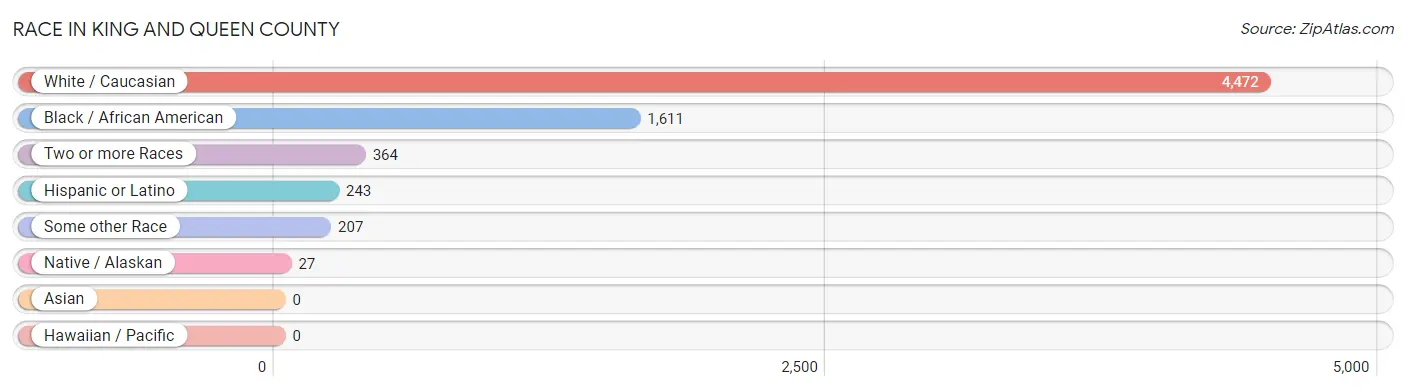
| Race | # Population | % Population |
| Asian | 0 | 0.0% |
| Black / African American | 1,611 | 24.1% |
| Hawaiian / Pacific | 0 | 0.0% |
| Hispanic or Latino | 243 | 3.6% |
| Native / Alaskan | 27 | 0.4% |
| White / Caucasian | 4,472 | 66.9% |
| Two or more Races | 364 | 5.4% |
| Some other Race | 207 | 3.1% |
| Total | 6,681 | 100.0% |
Ancestry in King and Queen County
The most populous ancestries reported in King and Queen County are American (1,113 | 16.7%), English (1,099 | 16.5%), Irish (631 | 9.4%), German (563 | 8.4%), and Italian (213 | 3.2%), together accounting for 54.2% of all King and Queen County residents.
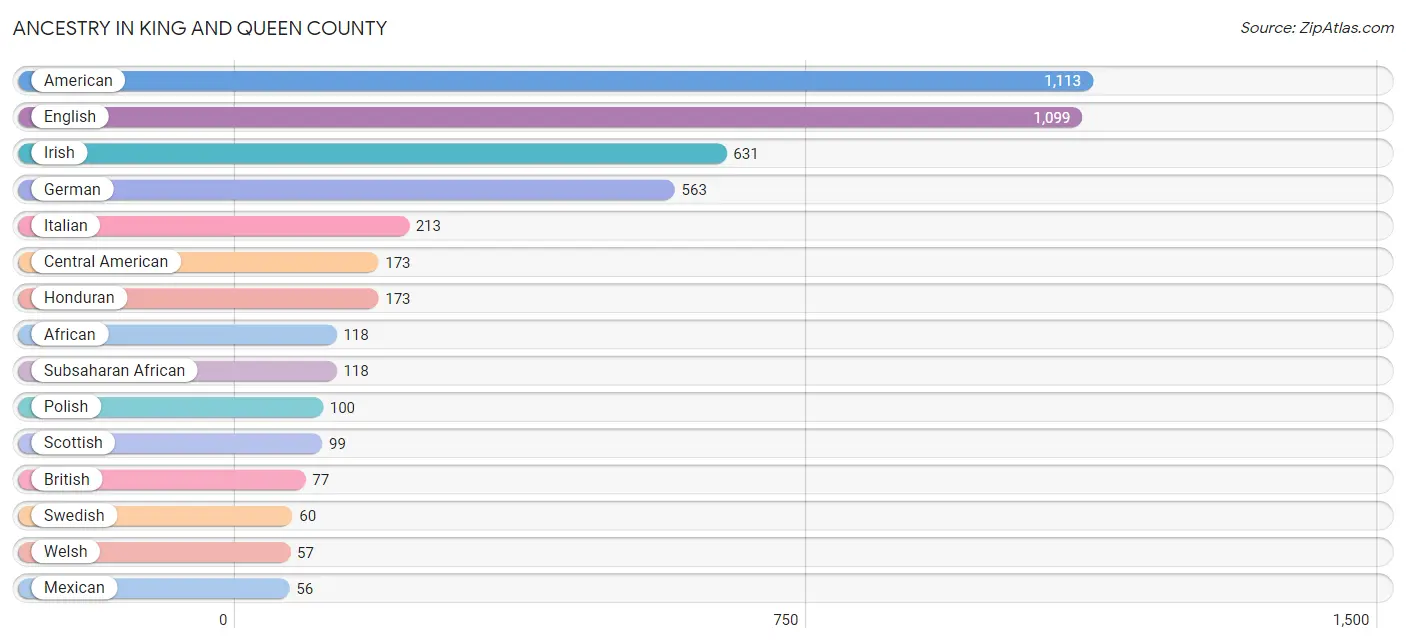
| Ancestry | # Population | % Population |
| African | 118 | 1.8% |
| American | 1,113 | 16.7% |
| Arab | 35 | 0.5% |
| British | 77 | 1.1% |
| Central American | 173 | 2.6% |
| Cherokee | 35 | 0.5% |
| Colombian | 14 | 0.2% |
| Croatian | 1 | 0.0% |
| Danish | 8 | 0.1% |
| Dutch | 29 | 0.4% |
| English | 1,099 | 16.5% |
| European | 30 | 0.4% |
| French | 12 | 0.2% |
| French Canadian | 7 | 0.1% |
| German | 563 | 8.4% |
| Greek | 18 | 0.3% |
| Honduran | 173 | 2.6% |
| Hungarian | 5 | 0.1% |
| Irish | 631 | 9.4% |
| Italian | 213 | 3.2% |
| Lebanese | 35 | 0.5% |
| Lithuanian | 7 | 0.1% |
| Maltese | 6 | 0.1% |
| Mexican | 56 | 0.8% |
| Navajo | 8 | 0.1% |
| Northern European | 8 | 0.1% |
| Norwegian | 55 | 0.8% |
| Pennsylvania German | 1 | 0.0% |
| Polish | 100 | 1.5% |
| Romanian | 11 | 0.2% |
| Russian | 16 | 0.2% |
| Scotch-Irish | 18 | 0.3% |
| Scottish | 99 | 1.5% |
| Slavic | 9 | 0.1% |
| South American | 14 | 0.2% |
| Subsaharan African | 118 | 1.8% |
| Swedish | 60 | 0.9% |
| Swiss | 8 | 0.1% |
| Welsh | 57 | 0.9% |
| Yugoslavian | 6 | 0.1% | View All 40 Rows |
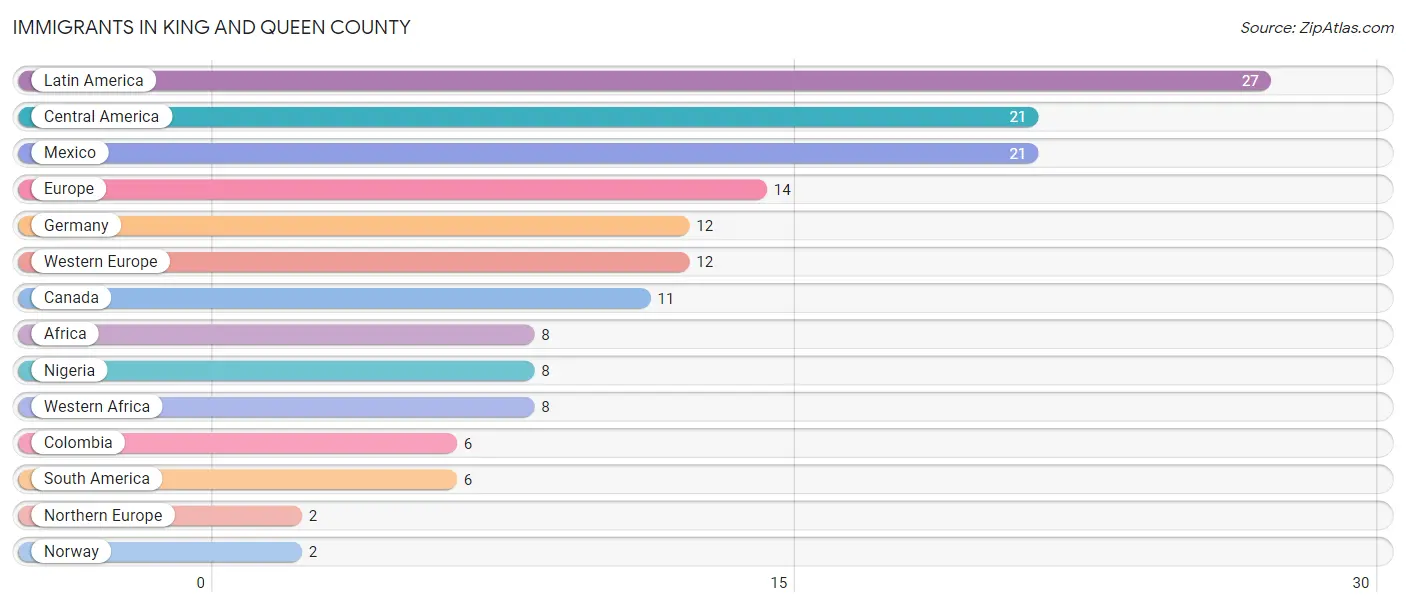
Immigrants in King and Queen County
The most numerous immigrant groups reported in King and Queen County came from Latin America (27 | 0.4%), Central America (21 | 0.3%), Mexico (21 | 0.3%), Europe (14 | 0.2%), and Germany (12 | 0.2%), together accounting for 1.4% of all King and Queen County residents.
| Immigration Origin | # Population | % Population |
| Africa | 8 | 0.1% |
| Canada | 11 | 0.2% |
| Central America | 21 | 0.3% |
| Colombia | 6 | 0.1% |
| Europe | 14 | 0.2% |
| Germany | 12 | 0.2% |
| Latin America | 27 | 0.4% |
| Mexico | 21 | 0.3% |
| Nigeria | 8 | 0.1% |
| Northern Europe | 2 | 0.0% |
| Norway | 2 | 0.0% |
| South America | 6 | 0.1% |
| Western Africa | 8 | 0.1% |
| Western Europe | 12 | 0.2% | View All 14 Rows |
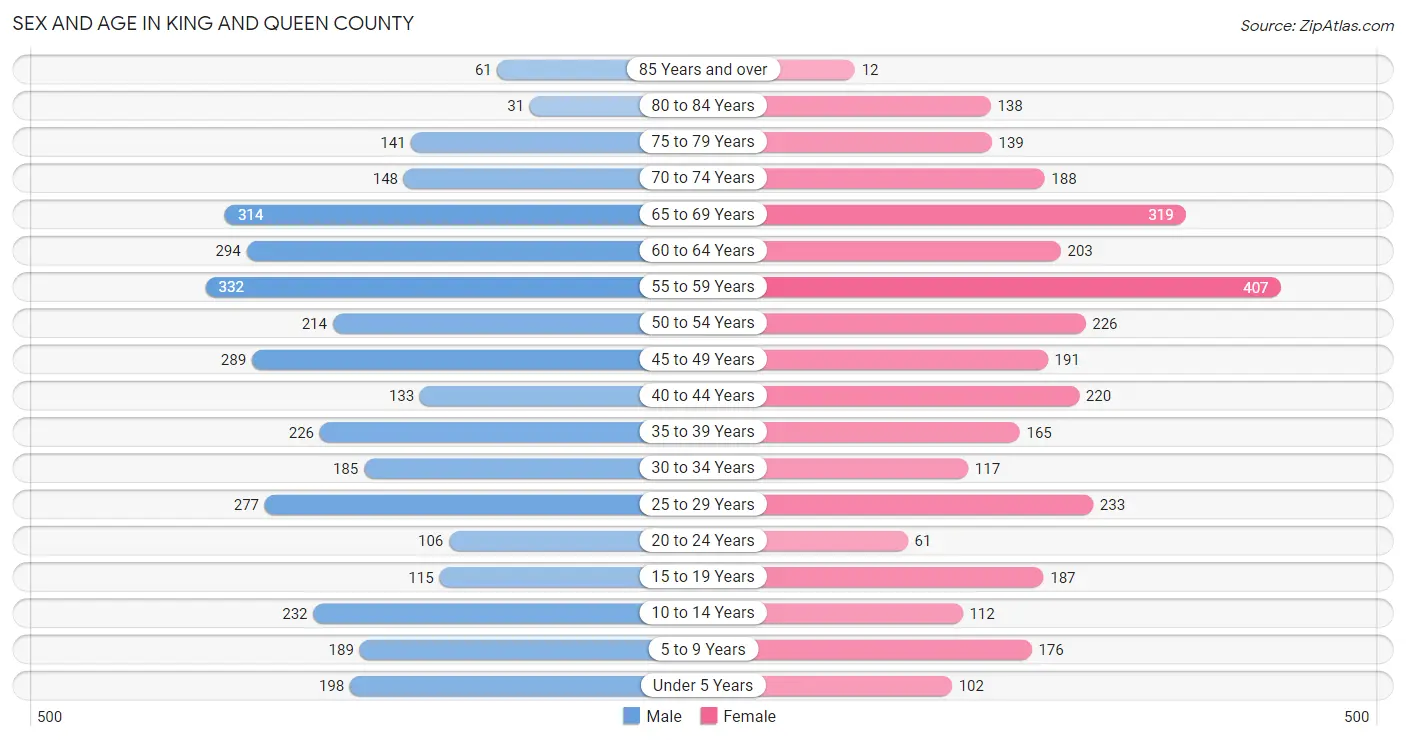
Sex and Age in King and Queen County
Sex and Age in King and Queen County
The most populous age groups in King and Queen County are 55 to 59 Years (332 | 9.5%) for men and 55 to 59 Years (407 | 12.7%) for women.
| Age Bracket | Male | Female |
| Under 5 Years | 198 (5.7%) | 102 (3.2%) |
| 5 to 9 Years | 189 (5.4%) | 176 (5.5%) |
| 10 to 14 Years | 232 (6.7%) | 112 (3.5%) |
| 15 to 19 Years | 115 (3.3%) | 187 (5.9%) |
| 20 to 24 Years | 106 (3.0%) | 61 (1.9%) |
| 25 to 29 Years | 277 (8.0%) | 233 (7.3%) |
| 30 to 34 Years | 185 (5.3%) | 117 (3.7%) |
| 35 to 39 Years | 226 (6.5%) | 165 (5.2%) |
| 40 to 44 Years | 133 (3.8%) | 220 (6.9%) |
| 45 to 49 Years | 289 (8.3%) | 191 (6.0%) |
| 50 to 54 Years | 214 (6.1%) | 226 (7.1%) |
| 55 to 59 Years | 332 (9.5%) | 407 (12.7%) |
| 60 to 64 Years | 294 (8.4%) | 203 (6.4%) |
| 65 to 69 Years | 314 (9.0%) | 319 (10.0%) |
| 70 to 74 Years | 148 (4.3%) | 188 (5.9%) |
| 75 to 79 Years | 141 (4.1%) | 139 (4.3%) |
| 80 to 84 Years | 31 (0.9%) | 138 (4.3%) |
| 85 Years and over | 61 (1.8%) | 12 (0.4%) |
| Total | 3,485 (100.0%) | 3,196 (100.0%) |
Families and Households in King and Queen County
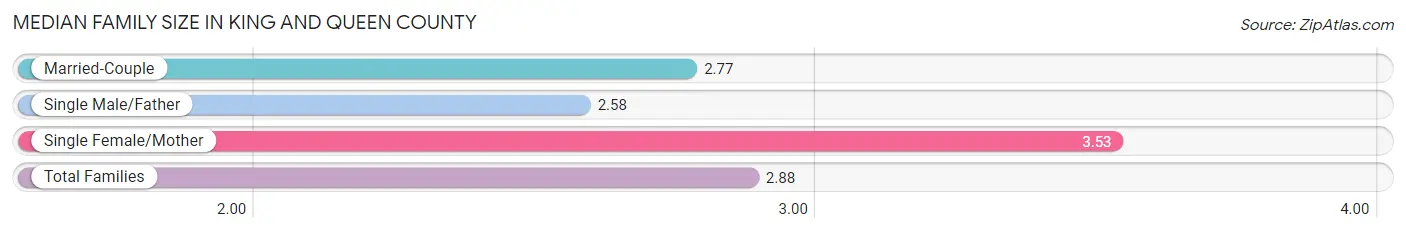
Median Family Size in King and Queen County
The median family size in King and Queen County is 2.88 persons per family, with single female/mother families (312 | 16.3%) accounting for the largest median family size of 3.53 persons per family. On the other hand, single male/father families (117 | 6.1%) represent the smallest median family size with 2.58 persons per family.
| Family Type | # Families | Family Size |
| Married-Couple | 1,491 (77.7%) | 2.77 |
| Single Male/Father | 117 (6.1%) | 2.58 |
| Single Female/Mother | 312 (16.3%) | 3.53 |
| Total Families | 1,920 (100.0%) | 2.88 |
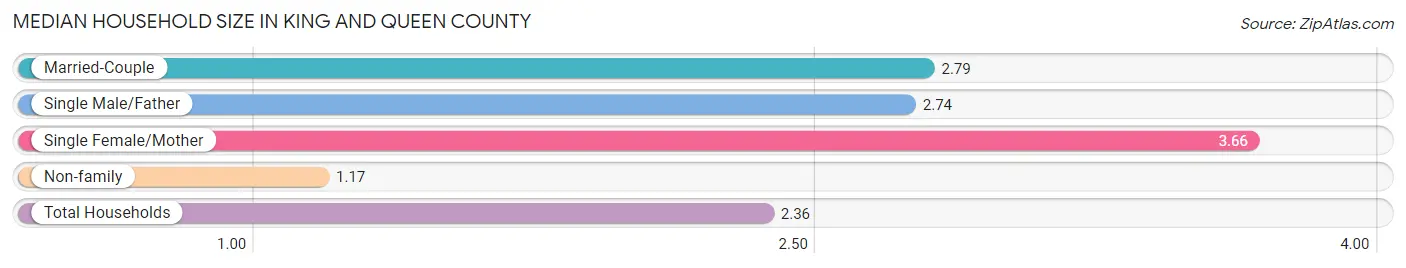
Median Household Size in King and Queen County
The median household size in King and Queen County is 2.36 persons per household, with single female/mother households (312 | 11.0%) accounting for the largest median household size of 3.66 persons per household. non-family households (906 | 32.1%) represent the smallest median household size with 1.17 persons per household.
| Household Type | # Households | Household Size |
| Married-Couple | 1,491 (52.8%) | 2.79 |
| Single Male/Father | 117 (4.1%) | 2.74 |
| Single Female/Mother | 312 (11.0%) | 3.66 |
| Non-family | 906 (32.1%) | 1.17 |
| Total Households | 2,826 (100.0%) | 2.36 |
Household Size by Marriage Status in King and Queen County
Out of a total of 2,826 households in King and Queen County, 1,920 (67.9%) are family households, while 906 (32.1%) are nonfamily households. The most numerous type of family households are 2-person households, comprising 1,053, and the most common type of nonfamily households are 1-person households, comprising 768.
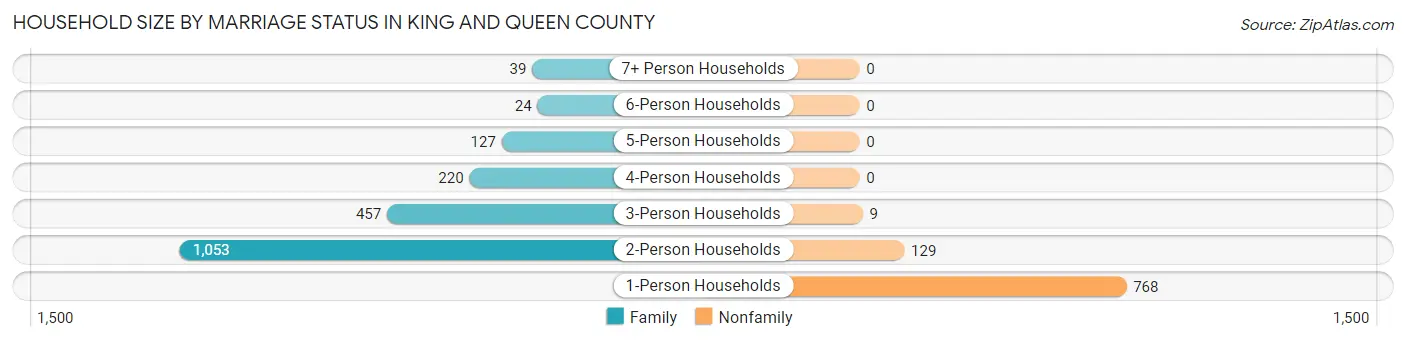
| Household Size | Family Households | Nonfamily Households |
| 1-Person Households | - | 768 (27.2%) |
| 2-Person Households | 1,053 (37.3%) | 129 (4.6%) |
| 3-Person Households | 457 (16.2%) | 9 (0.3%) |
| 4-Person Households | 220 (7.8%) | 0 (0.0%) |
| 5-Person Households | 127 (4.5%) | 0 (0.0%) |
| 6-Person Households | 24 (0.9%) | 0 (0.0%) |
| 7+ Person Households | 39 (1.4%) | 0 (0.0%) |
| Total | 1,920 (67.9%) | 906 (32.1%) |
Female Fertility in King and Queen County
Fertility by Age in King and Queen County
Average fertility rate in King and Queen County is 36.0 births per 1,000 women. Women in the age bracket of 20 to 34 years have the highest fertility rate with 71.0 births per 1,000 women. Women in the age bracket of 20 to 34 years acount for 69.1% of all women with births.
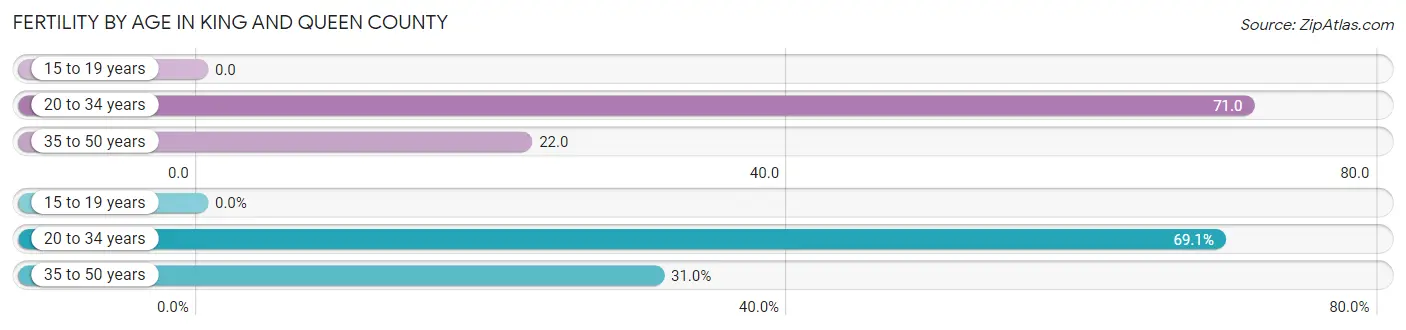
| Age Bracket | Women with Births | Births / 1,000 Women |
| 15 to 19 years | 0 (0.0%) | 0.0 |
| 20 to 34 years | 29 (69.1%) | 71.0 |
| 35 to 50 years | 13 (30.9%) | 22.0 |
| Total | 42 (100.0%) | 36.0 |
Fertility by Age by Marriage Status in King and Queen County
52.4% of women with births (42) in King and Queen County are married. The highest percentage of unmarried women with births falls into 35 to 50 years age bracket with 100.0% of them unmarried at the time of birth, while the lowest percentage of unmarried women with births belong to 20 to 34 years age bracket with 24.1% of them unmarried.
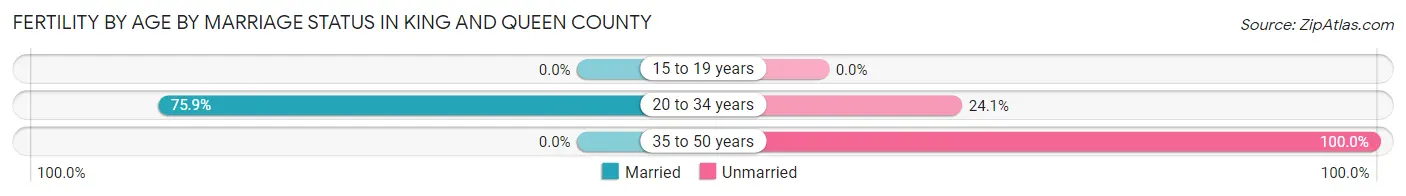
| Age Bracket | Married | Unmarried |
| 15 to 19 years | 0 (0.0%) | 0 (0.0%) |
| 20 to 34 years | 22 (75.9%) | 7 (24.1%) |
| 35 to 50 years | 0 (0.0%) | 13 (100.0%) |
| Total | 22 (52.4%) | 20 (47.6%) |
Fertility by Education in King and Queen County
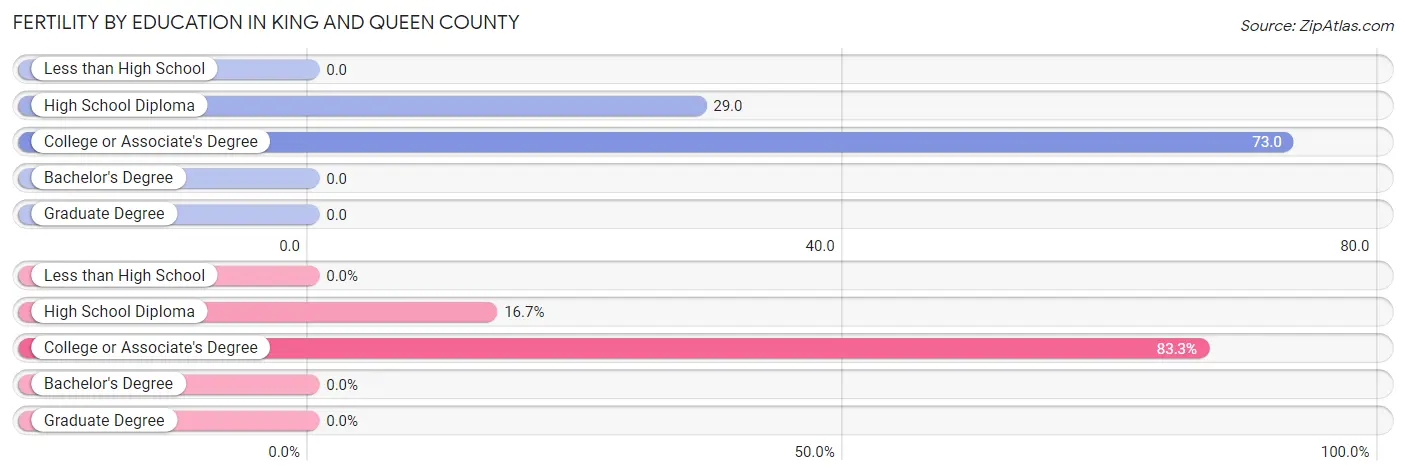
| Educational Attainment | Women with Births | Births / 1,000 Women |
| Less than High School | 0 (0.0%) | 0.0 |
| High School Diploma | 7 (16.7%) | 29.0 |
| College or Associate's Degree | 35 (83.3%) | 73.0 |
| Bachelor's Degree | 0 (0.0%) | 0.0 |
| Graduate Degree | 0 (0.0%) | 0.0 |
| Total | 42 (100.0%) | 36.0 |
Fertility by Education by Marriage Status in King and Queen County
47.6% of women with births in King and Queen County are unmarried. Women with the educational attainment of college or associate's degree are most likely to be married with 62.9% of them married at childbirth, while women with the educational attainment of high school diploma are least likely to be married with 100.0% of them unmarried at childbirth.
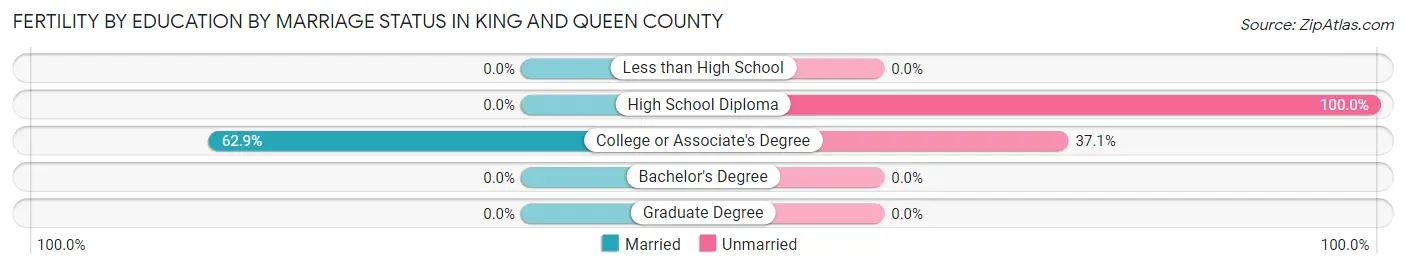
| Educational Attainment | Married | Unmarried |
| Less than High School | 0 (0.0%) | 0 (0.0%) |
| High School Diploma | 0 (0.0%) | 7 (100.0%) |
| College or Associate's Degree | 22 (62.9%) | 13 (37.1%) |
| Bachelor's Degree | 0 (0.0%) | 0 (0.0%) |
| Graduate Degree | 0 (0.0%) | 0 (0.0%) |
| Total | 22 (52.4%) | 20 (47.6%) |
Employment Characteristics in King and Queen County
Employment by Class of Employer in King and Queen County
Among the 3,248 employed individuals in King and Queen County, private company employees (1,933 | 59.5%), not-for-profit organizations (394 | 12.1%), and local government employees (333 | 10.2%) make up the most common classes of employment.
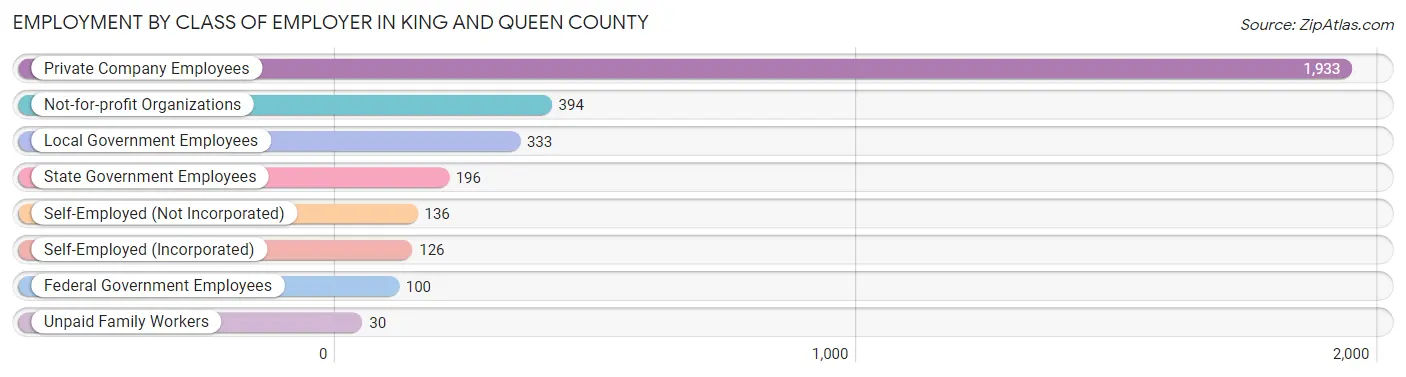
| Employer Class | # Employees | % Employees |
| Private Company Employees | 1,933 | 59.5% |
| Self-Employed (Incorporated) | 126 | 3.9% |
| Self-Employed (Not Incorporated) | 136 | 4.2% |
| Not-for-profit Organizations | 394 | 12.1% |
| Local Government Employees | 333 | 10.2% |
| State Government Employees | 196 | 6.0% |
| Federal Government Employees | 100 | 3.1% |
| Unpaid Family Workers | 30 | 0.9% |
| Total | 3,248 | 100.0% |
Employment Status by Age in King and Queen County
According to the labor force statistics for King and Queen County, out of the total population over 16 years of age (5,630), 62.2% or 3,502 individuals are in the labor force, with 5.7% or 200 of them unemployed. The age group with the highest labor force participation rate is 30 to 34 years, with 94.4% or 285 individuals in the labor force. Within the labor force, the 35 to 44 years age range has the highest percentage of unemployed individuals, with 12.1% or 77 of them being unemployed.
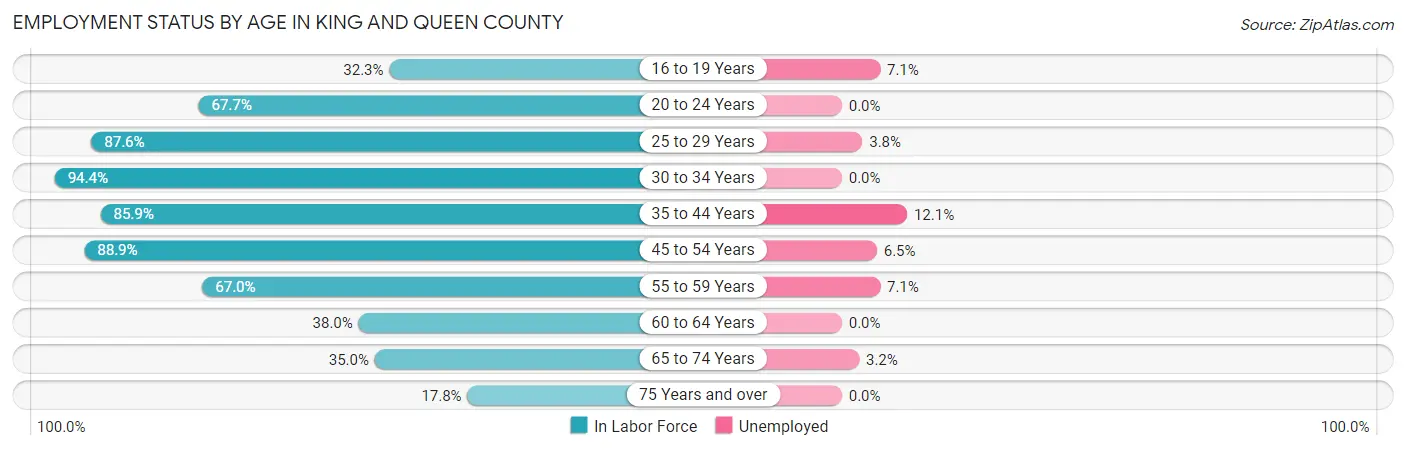
| Age Bracket | In Labor Force | Unemployed |
| 16 to 19 Years | 84 (32.3%) | 6 (7.1%) |
| 20 to 24 Years | 113 (67.7%) | 0 (0.0%) |
| 25 to 29 Years | 447 (87.6%) | 17 (3.8%) |
| 30 to 34 Years | 285 (94.4%) | 0 (0.0%) |
| 35 to 44 Years | 639 (85.9%) | 77 (12.1%) |
| 45 to 54 Years | 818 (88.9%) | 53 (6.5%) |
| 55 to 59 Years | 495 (67.0%) | 35 (7.1%) |
| 60 to 64 Years | 189 (38.0%) | 0 (0.0%) |
| 65 to 74 Years | 339 (35.0%) | 11 (3.2%) |
| 75 Years and over | 93 (17.8%) | 0 (0.0%) |
| Total | 3,502 (62.2%) | 200 (5.7%) |
Employment Status by Educational Attainment in King and Queen County
According to labor force statistics for King and Queen County, 77.4% of individuals (2,873) out of the total population between 25 and 64 years of age (3,712) are in the labor force, with 6.3% or 181 of them being unemployed. The group with the highest labor force participation rate are those with the educational attainment of bachelor's degree or higher, with 83.8% or 760 individuals in the labor force. Within the labor force, individuals with less than high school education have the highest percentage of unemployment, with 17.4% or 57 of them being unemployed.
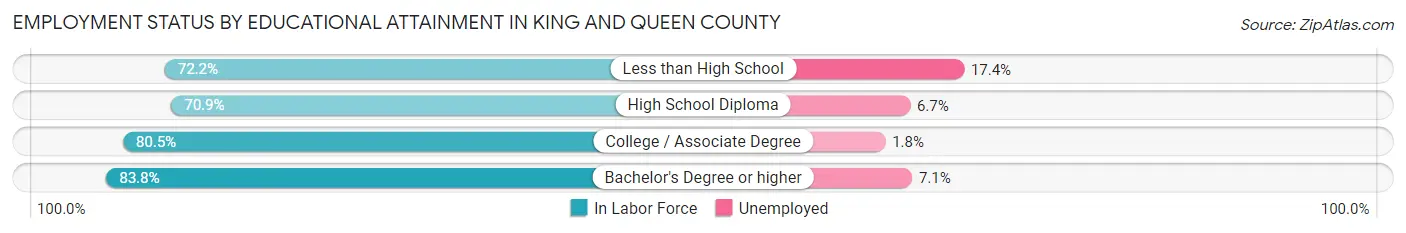
| Educational Attainment | In Labor Force | Unemployed |
| Less than High School | 328 (72.2%) | 79 (17.4%) |
| High School Diploma | 788 (70.9%) | 75 (6.7%) |
| College / Associate Degree | 997 (80.5%) | 22 (1.8%) |
| Bachelor's Degree or higher | 760 (83.8%) | 64 (7.1%) |
| Total | 2,873 (77.4%) | 234 (6.3%) |
Employment Occupations by Sex in King and Queen County
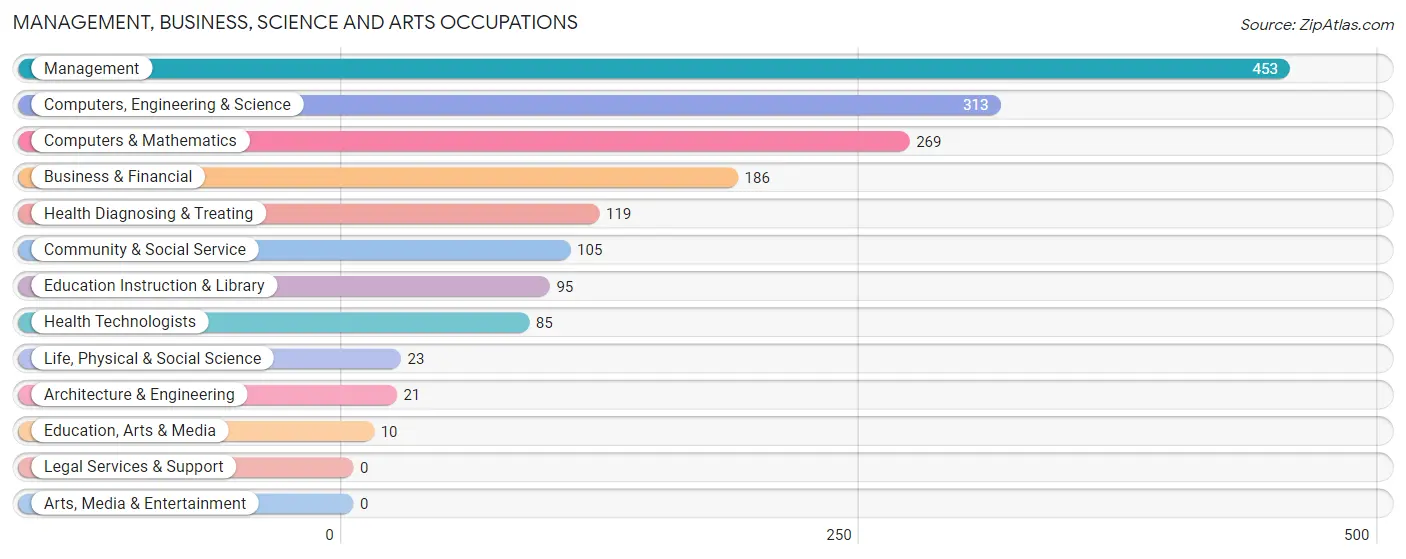
Management, Business, Science and Arts Occupations
The most common Management, Business, Science and Arts occupations in King and Queen County are Management (453 | 13.7%), Computers, Engineering & Science (313 | 9.5%), Computers & Mathematics (269 | 8.1%), Business & Financial (186 | 5.6%), and Health Diagnosing & Treating (119 | 3.6%).
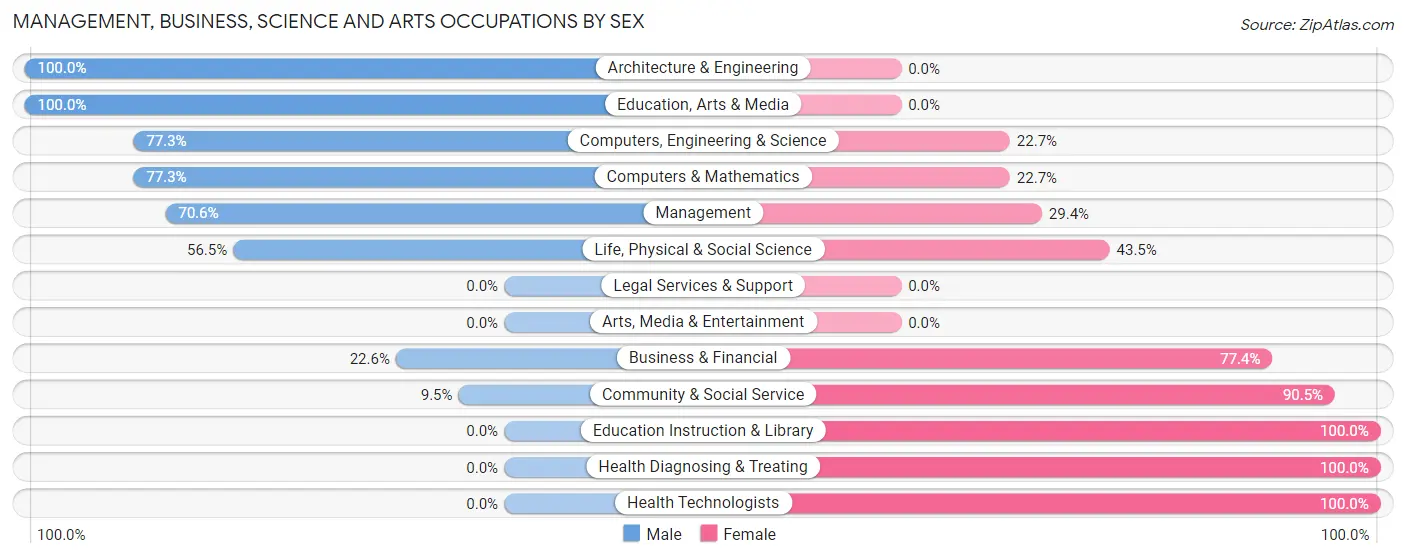
Management, Business, Science and Arts Occupations by Sex
Within the Management, Business, Science and Arts occupations in King and Queen County, the most male-oriented occupations are Architecture & Engineering (100.0%), Education, Arts & Media (100.0%), and Computers, Engineering & Science (77.3%), while the most female-oriented occupations are Education Instruction & Library (100.0%), Health Diagnosing & Treating (100.0%), and Health Technologists (100.0%).
| Occupation | Male | Female |
| Management | 320 (70.6%) | 133 (29.4%) |
| Business & Financial | 42 (22.6%) | 144 (77.4%) |
| Computers, Engineering & Science | 242 (77.3%) | 71 (22.7%) |
| Computers & Mathematics | 208 (77.3%) | 61 (22.7%) |
| Architecture & Engineering | 21 (100.0%) | 0 (0.0%) |
| Life, Physical & Social Science | 13 (56.5%) | 10 (43.5%) |
| Community & Social Service | 10 (9.5%) | 95 (90.5%) |
| Education, Arts & Media | 10 (100.0%) | 0 (0.0%) |
| Legal Services & Support | 0 (0.0%) | 0 (0.0%) |
| Education Instruction & Library | 0 (0.0%) | 95 (100.0%) |
| Arts, Media & Entertainment | 0 (0.0%) | 0 (0.0%) |
| Health Diagnosing & Treating | 0 (0.0%) | 119 (100.0%) |
| Health Technologists | 0 (0.0%) | 85 (100.0%) |
| Total (Category) | 614 (52.2%) | 562 (47.8%) |
| Total (Overall) | 1,875 (56.8%) | 1,428 (43.2%) |
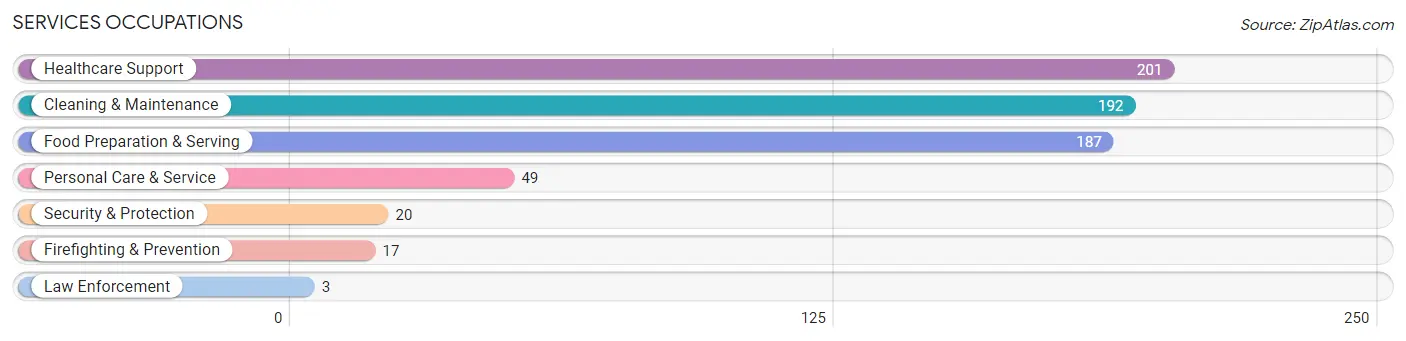
Services Occupations
The most common Services occupations in King and Queen County are Healthcare Support (201 | 6.1%), Cleaning & Maintenance (192 | 5.8%), Food Preparation & Serving (187 | 5.7%), Personal Care & Service (49 | 1.5%), and Security & Protection (20 | 0.6%).
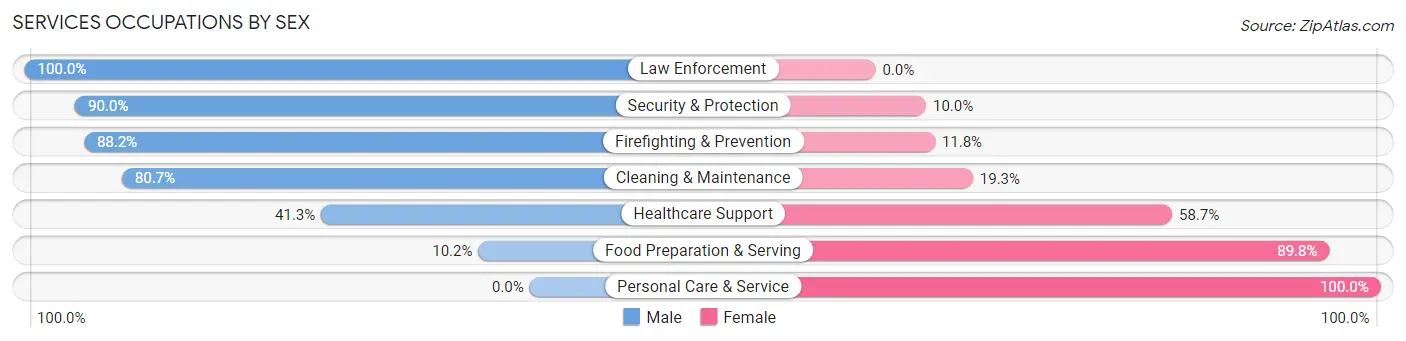
Services Occupations by Sex
Within the Services occupations in King and Queen County, the most male-oriented occupations are Law Enforcement (100.0%), Security & Protection (90.0%), and Firefighting & Prevention (88.2%), while the most female-oriented occupations are Personal Care & Service (100.0%), Food Preparation & Serving (89.8%), and Healthcare Support (58.7%).
| Occupation | Male | Female |
| Healthcare Support | 83 (41.3%) | 118 (58.7%) |
| Security & Protection | 18 (90.0%) | 2 (10.0%) |
| Firefighting & Prevention | 15 (88.2%) | 2 (11.8%) |
| Law Enforcement | 3 (100.0%) | 0 (0.0%) |
| Food Preparation & Serving | 19 (10.2%) | 168 (89.8%) |
| Cleaning & Maintenance | 155 (80.7%) | 37 (19.3%) |
| Personal Care & Service | 0 (0.0%) | 49 (100.0%) |
| Total (Category) | 275 (42.4%) | 374 (57.6%) |
| Total (Overall) | 1,875 (56.8%) | 1,428 (43.2%) |
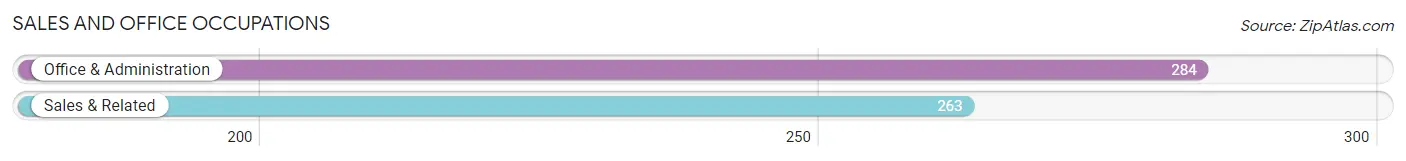
Sales and Office Occupations
The most common Sales and Office occupations in King and Queen County are Office & Administration (284 | 8.6%), and Sales & Related (263 | 8.0%).
Sales and Office Occupations by Sex
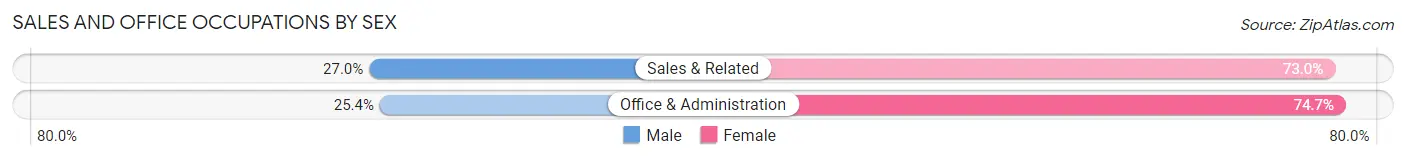
| Occupation | Male | Female |
| Sales & Related | 71 (27.0%) | 192 (73.0%) |
| Office & Administration | 72 (25.4%) | 212 (74.7%) |
| Total (Category) | 143 (26.1%) | 404 (73.9%) |
| Total (Overall) | 1,875 (56.8%) | 1,428 (43.2%) |
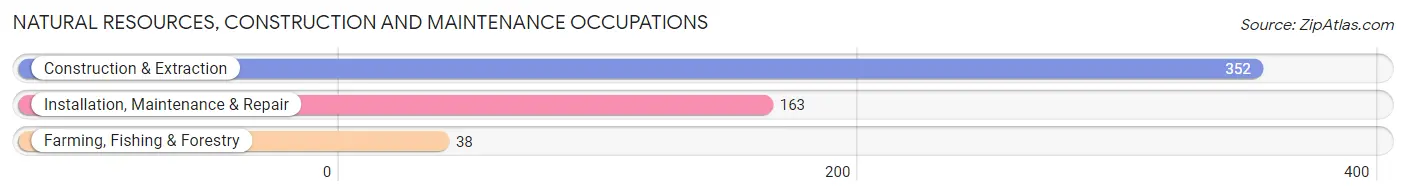
Natural Resources, Construction and Maintenance Occupations
The most common Natural Resources, Construction and Maintenance occupations in King and Queen County are Construction & Extraction (352 | 10.7%), Installation, Maintenance & Repair (163 | 4.9%), and Farming, Fishing & Forestry (38 | 1.1%).
Natural Resources, Construction and Maintenance Occupations by Sex
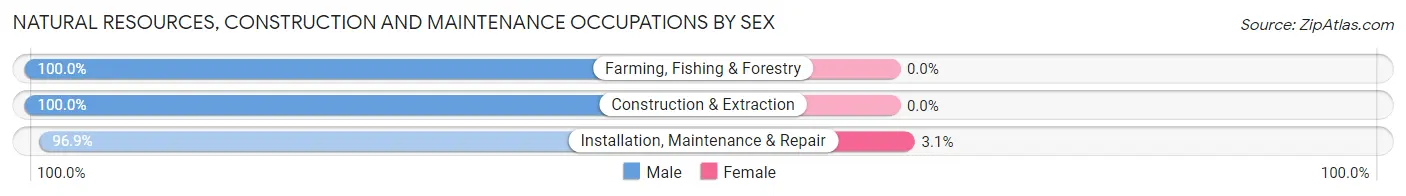
| Occupation | Male | Female |
| Farming, Fishing & Forestry | 38 (100.0%) | 0 (0.0%) |
| Construction & Extraction | 352 (100.0%) | 0 (0.0%) |
| Installation, Maintenance & Repair | 158 (96.9%) | 5 (3.1%) |
| Total (Category) | 548 (99.1%) | 5 (0.9%) |
| Total (Overall) | 1,875 (56.8%) | 1,428 (43.2%) |
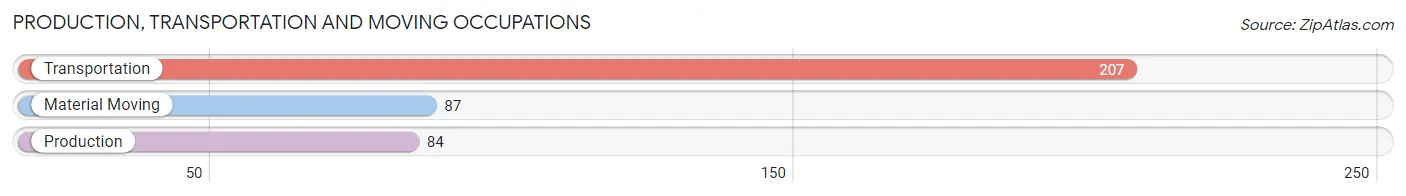
Production, Transportation and Moving Occupations
The most common Production, Transportation and Moving occupations in King and Queen County are Transportation (207 | 6.3%), Material Moving (87 | 2.6%), and Production (84 | 2.5%).
Production, Transportation and Moving Occupations by Sex
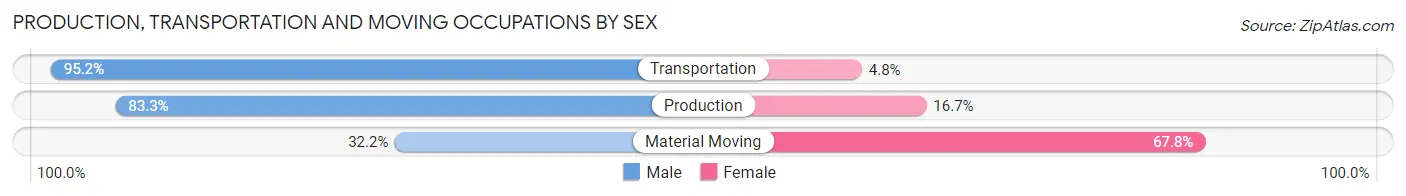
| Occupation | Male | Female |
| Production | 70 (83.3%) | 14 (16.7%) |
| Transportation | 197 (95.2%) | 10 (4.8%) |
| Material Moving | 28 (32.2%) | 59 (67.8%) |
| Total (Category) | 295 (78.0%) | 83 (22.0%) |
| Total (Overall) | 1,875 (56.8%) | 1,428 (43.2%) |
Employment Industries by Sex in King and Queen County
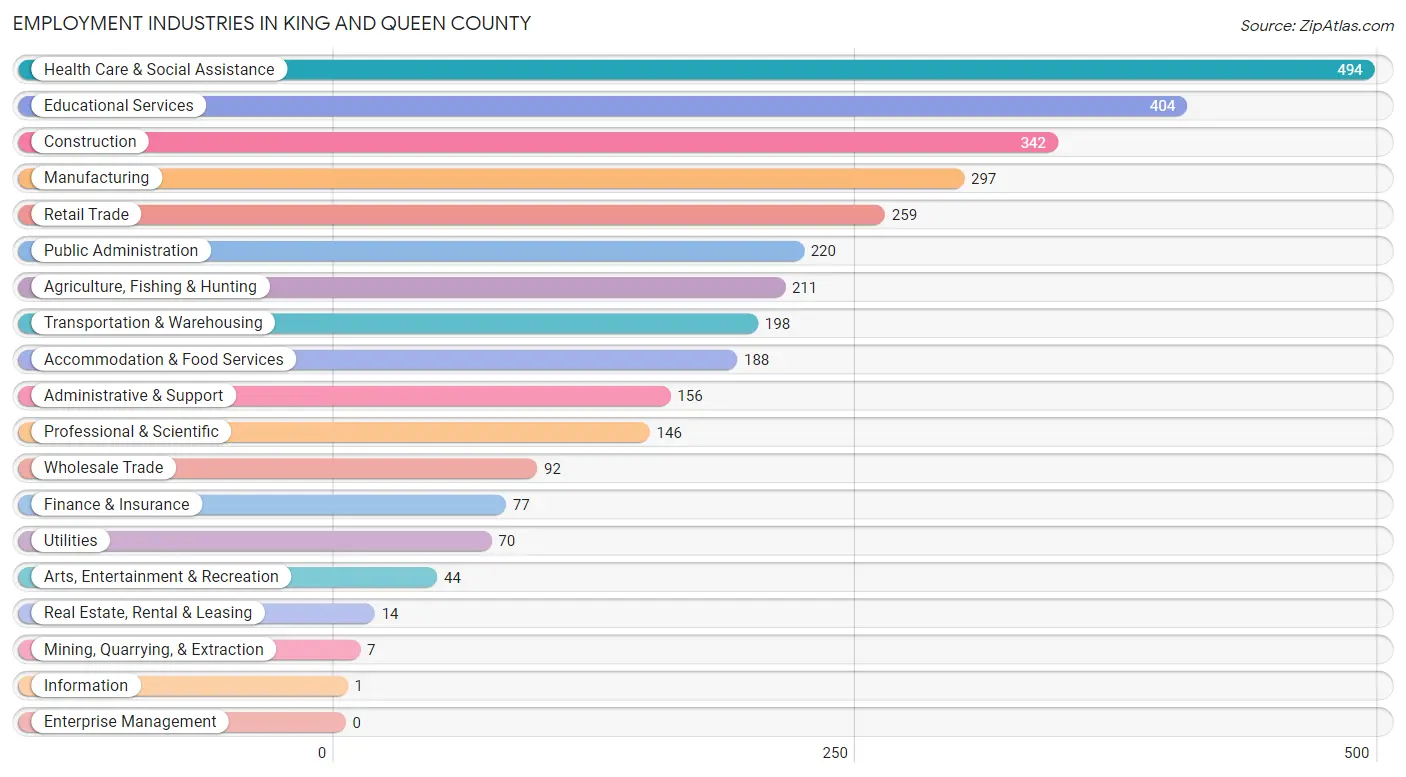
Employment Industries in King and Queen County
The major employment industries in King and Queen County include Health Care & Social Assistance (494 | 15.0%), Educational Services (404 | 12.2%), Construction (342 | 10.3%), Manufacturing (297 | 9.0%), and Retail Trade (259 | 7.8%).
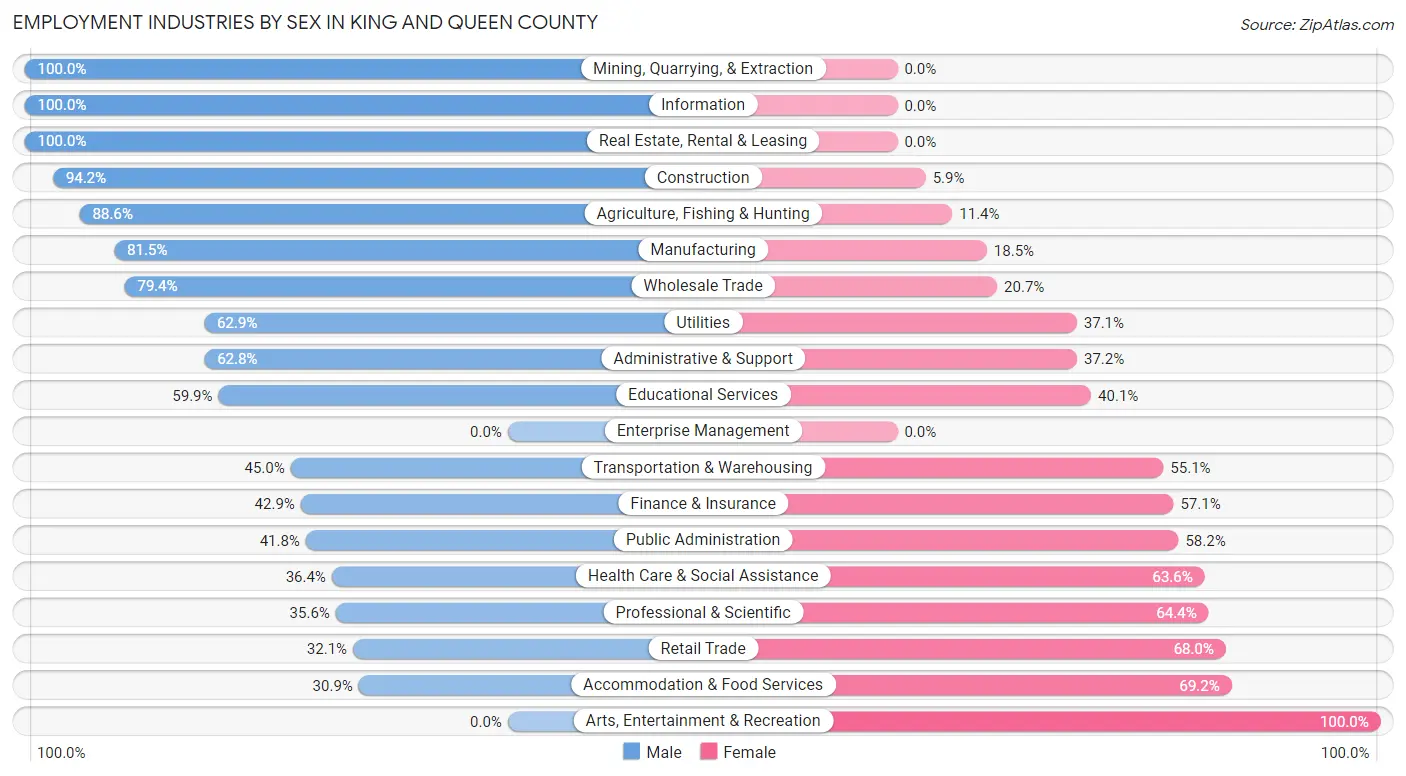
Employment Industries by Sex in King and Queen County
The King and Queen County industries that see more men than women are Mining, Quarrying, & Extraction (100.0%), Information (100.0%), and Real Estate, Rental & Leasing (100.0%), whereas the industries that tend to have a higher number of women are Arts, Entertainment & Recreation (100.0%), Accommodation & Food Services (69.2%), and Retail Trade (67.9%).
| Industry | Male | Female |
| Agriculture, Fishing & Hunting | 187 (88.6%) | 24 (11.4%) |
| Mining, Quarrying, & Extraction | 7 (100.0%) | 0 (0.0%) |
| Construction | 322 (94.2%) | 20 (5.9%) |
| Manufacturing | 242 (81.5%) | 55 (18.5%) |
| Wholesale Trade | 73 (79.3%) | 19 (20.6%) |
| Retail Trade | 83 (32.1%) | 176 (67.9%) |
| Transportation & Warehousing | 89 (45.0%) | 109 (55.0%) |
| Utilities | 44 (62.9%) | 26 (37.1%) |
| Information | 1 (100.0%) | 0 (0.0%) |
| Finance & Insurance | 33 (42.9%) | 44 (57.1%) |
| Real Estate, Rental & Leasing | 14 (100.0%) | 0 (0.0%) |
| Professional & Scientific | 52 (35.6%) | 94 (64.4%) |
| Enterprise Management | 0 (0.0%) | 0 (0.0%) |
| Administrative & Support | 98 (62.8%) | 58 (37.2%) |
| Educational Services | 242 (59.9%) | 162 (40.1%) |
| Health Care & Social Assistance | 180 (36.4%) | 314 (63.6%) |
| Arts, Entertainment & Recreation | 0 (0.0%) | 44 (100.0%) |
| Accommodation & Food Services | 58 (30.8%) | 130 (69.2%) |
| Public Administration | 92 (41.8%) | 128 (58.2%) |
| Total | 1,875 (56.8%) | 1,428 (43.2%) |
Education in King and Queen County
School Enrollment in King and Queen County
The most common levels of schooling among the 1,113 students in King and Queen County are middle school (304 | 27.3%), high school (271 | 24.3%), and elementary school (270 | 24.3%).
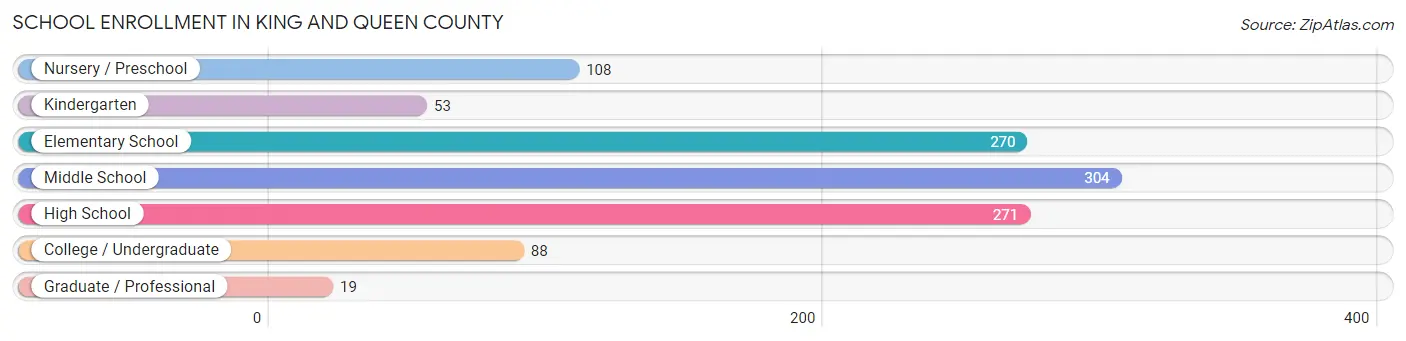
| School Level | # Students | % Students |
| Nursery / Preschool | 108 | 9.7% |
| Kindergarten | 53 | 4.8% |
| Elementary School | 270 | 24.3% |
| Middle School | 304 | 27.3% |
| High School | 271 | 24.3% |
| College / Undergraduate | 88 | 7.9% |
| Graduate / Professional | 19 | 1.7% |
| Total | 1,113 | 100.0% |
School Enrollment by Age by Funding Source in King and Queen County
Out of a total of 1,113 students who are enrolled in schools in King and Queen County, 107 (9.6%) attend a private institution, while the remaining 1,006 (90.4%) are enrolled in public schools. The age group of 3 to 4 year olds has the highest likelihood of being enrolled in private schools, with 18 (40.0% in the age bracket) enrolled. Conversely, the age group of 18 to 19 year olds has the lowest likelihood of being enrolled in a private school, with 79 (100.0% in the age bracket) attending a public institution.
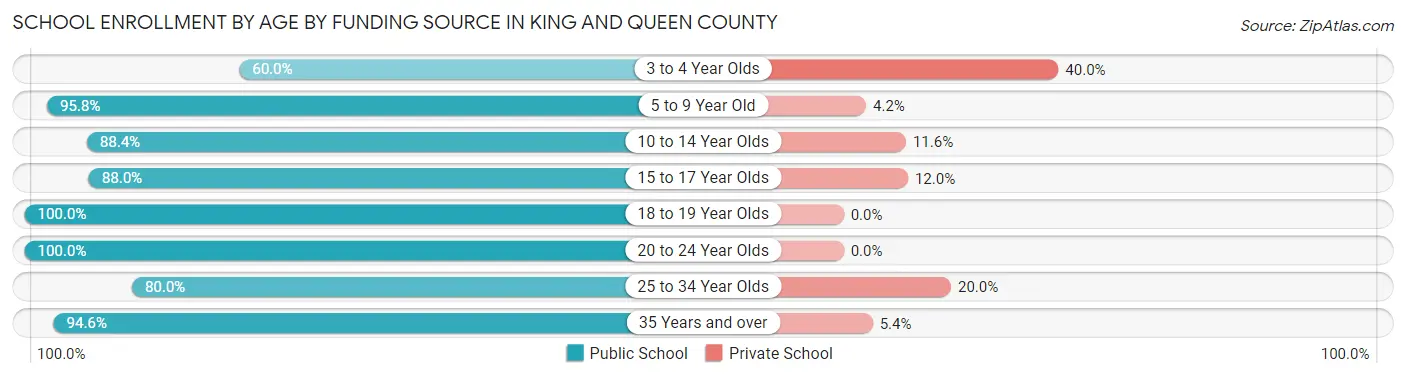
| Age Bracket | Public School | Private School |
| 3 to 4 Year Olds | 27 (60.0%) | 18 (40.0%) |
| 5 to 9 Year Old | 344 (95.8%) | 15 (4.2%) |
| 10 to 14 Year Olds | 297 (88.4%) | 39 (11.6%) |
| 15 to 17 Year Olds | 191 (88.0%) | 26 (12.0%) |
| 18 to 19 Year Olds | 79 (100.0%) | 0 (0.0%) |
| 20 to 24 Year Olds | 5 (100.0%) | 0 (0.0%) |
| 25 to 34 Year Olds | 28 (80.0%) | 7 (20.0%) |
| 35 Years and over | 35 (94.6%) | 2 (5.4%) |
| Total | 1,006 (90.4%) | 107 (9.6%) |
Educational Attainment by Field of Study in King and Queen County
Education (198 | 16.1%), science & technology (153 | 12.5%), business (150 | 12.2%), bio, nature & agricultural (136 | 11.1%), and liberal arts & history (109 | 8.9%) are the most common fields of study among 1,228 individuals in King and Queen County who have obtained a bachelor's degree or higher.
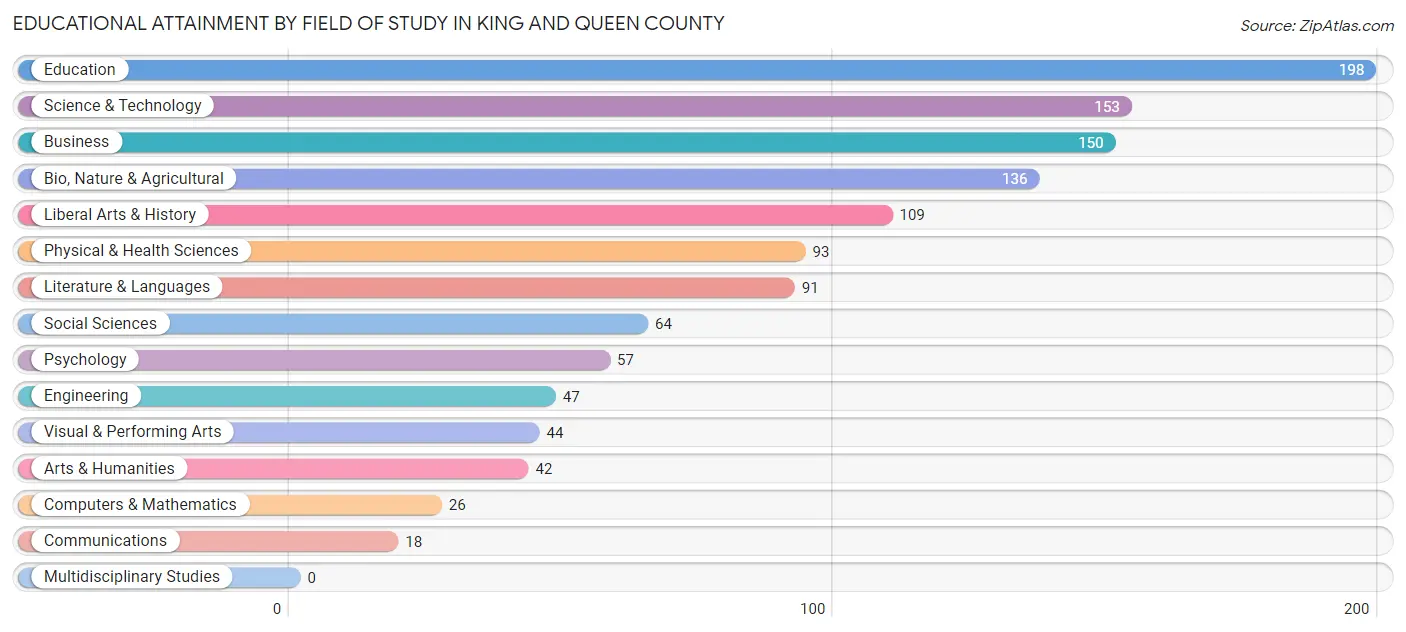
| Field of Study | # Graduates | % Graduates |
| Computers & Mathematics | 26 | 2.1% |
| Bio, Nature & Agricultural | 136 | 11.1% |
| Physical & Health Sciences | 93 | 7.6% |
| Psychology | 57 | 4.6% |
| Social Sciences | 64 | 5.2% |
| Engineering | 47 | 3.8% |
| Multidisciplinary Studies | 0 | 0.0% |
| Science & Technology | 153 | 12.5% |
| Business | 150 | 12.2% |
| Education | 198 | 16.1% |
| Literature & Languages | 91 | 7.4% |
| Liberal Arts & History | 109 | 8.9% |
| Visual & Performing Arts | 44 | 3.6% |
| Communications | 18 | 1.5% |
| Arts & Humanities | 42 | 3.4% |
| Total | 1,228 | 100.0% |
Transportation & Commute in King and Queen County
Vehicle Availability by Sex in King and Queen County
The most prevalent vehicle ownership categories in King and Queen County are males with 2 vehicles (559, accounting for 30.4%) and females with 2 vehicles (389, making up 39.7%).
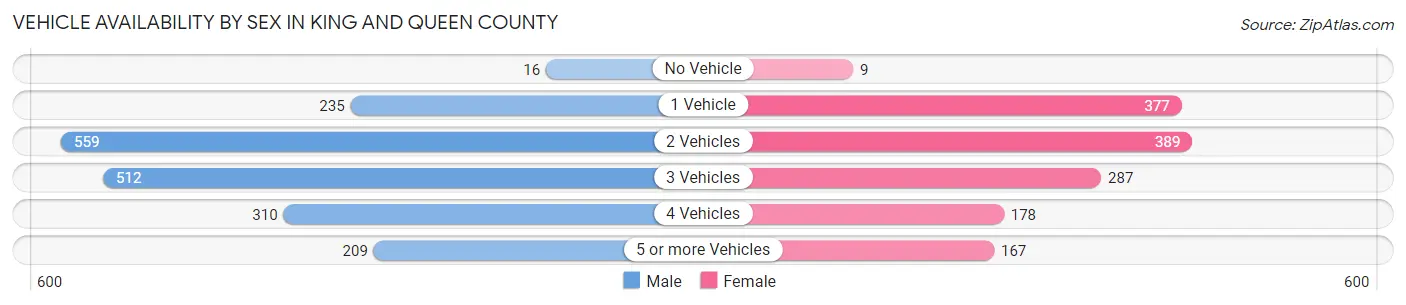
| Vehicles Available | Male | Female |
| No Vehicle | 16 (0.9%) | 9 (0.6%) |
| 1 Vehicle | 235 (12.8%) | 377 (26.8%) |
| 2 Vehicles | 559 (30.4%) | 389 (27.7%) |
| 3 Vehicles | 512 (27.8%) | 287 (20.4%) |
| 4 Vehicles | 310 (16.8%) | 178 (12.7%) |
| 5 or more Vehicles | 209 (11.4%) | 167 (11.9%) |
| Total | 1,841 (100.0%) | 1,407 (100.0%) |
Commute Time in King and Queen County
The most frequently occuring commute durations in King and Queen County are 45 to 59 minutes (507 commuters, 17.2%), 60 to 89 minutes (442 commuters, 15.0%), and 30 to 34 minutes (422 commuters, 14.3%).
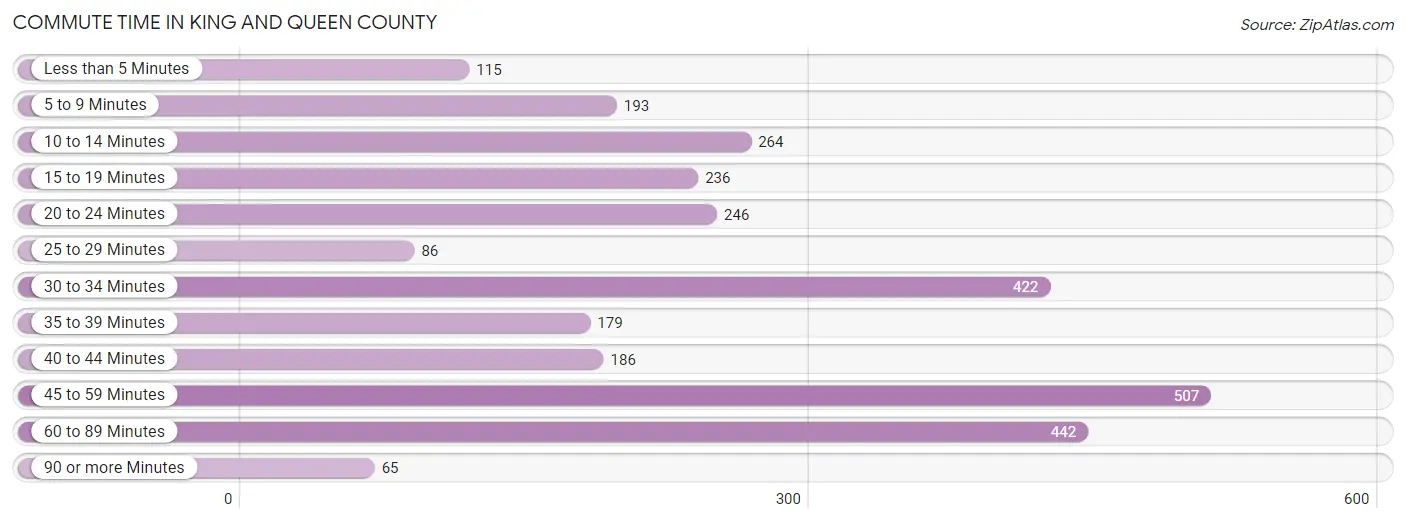
| Commute Time | # Commuters | % Commuters |
| Less than 5 Minutes | 115 | 3.9% |
| 5 to 9 Minutes | 193 | 6.6% |
| 10 to 14 Minutes | 264 | 9.0% |
| 15 to 19 Minutes | 236 | 8.0% |
| 20 to 24 Minutes | 246 | 8.4% |
| 25 to 29 Minutes | 86 | 2.9% |
| 30 to 34 Minutes | 422 | 14.3% |
| 35 to 39 Minutes | 179 | 6.1% |
| 40 to 44 Minutes | 186 | 6.3% |
| 45 to 59 Minutes | 507 | 17.2% |
| 60 to 89 Minutes | 442 | 15.0% |
| 90 or more Minutes | 65 | 2.2% |
Commute Time by Sex in King and Queen County
The most common commute times in King and Queen County are 60 to 89 minutes (276 commuters, 16.7%) for males and 45 to 59 minutes (298 commuters, 23.1%) for females.
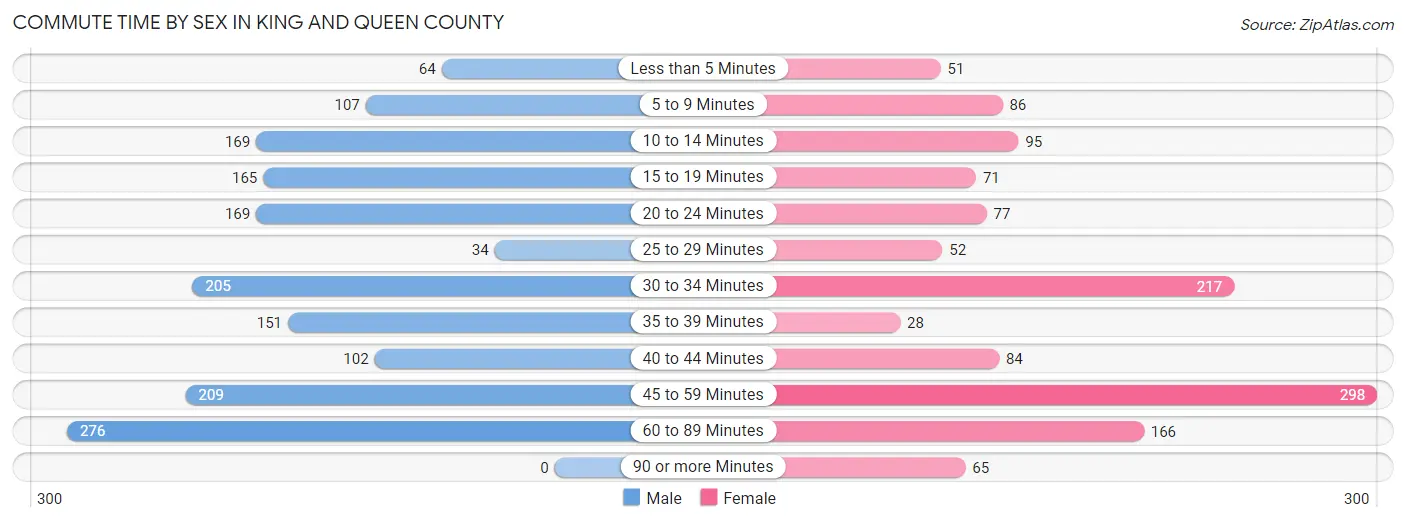
| Commute Time | Male | Female |
| Less than 5 Minutes | 64 (3.9%) | 51 (4.0%) |
| 5 to 9 Minutes | 107 (6.5%) | 86 (6.7%) |
| 10 to 14 Minutes | 169 (10.2%) | 95 (7.4%) |
| 15 to 19 Minutes | 165 (10.0%) | 71 (5.5%) |
| 20 to 24 Minutes | 169 (10.2%) | 77 (6.0%) |
| 25 to 29 Minutes | 34 (2.1%) | 52 (4.0%) |
| 30 to 34 Minutes | 205 (12.4%) | 217 (16.8%) |
| 35 to 39 Minutes | 151 (9.1%) | 28 (2.2%) |
| 40 to 44 Minutes | 102 (6.2%) | 84 (6.5%) |
| 45 to 59 Minutes | 209 (12.7%) | 298 (23.1%) |
| 60 to 89 Minutes | 276 (16.7%) | 166 (12.9%) |
| 90 or more Minutes | 0 (0.0%) | 65 (5.0%) |
Time of Departure to Work by Sex in King and Queen County
The most frequent times of departure to work in King and Queen County are 6:30 AM to 6:59 AM (279, 16.9%) for males and 7:30 AM to 7:59 AM (238, 18.4%) for females.
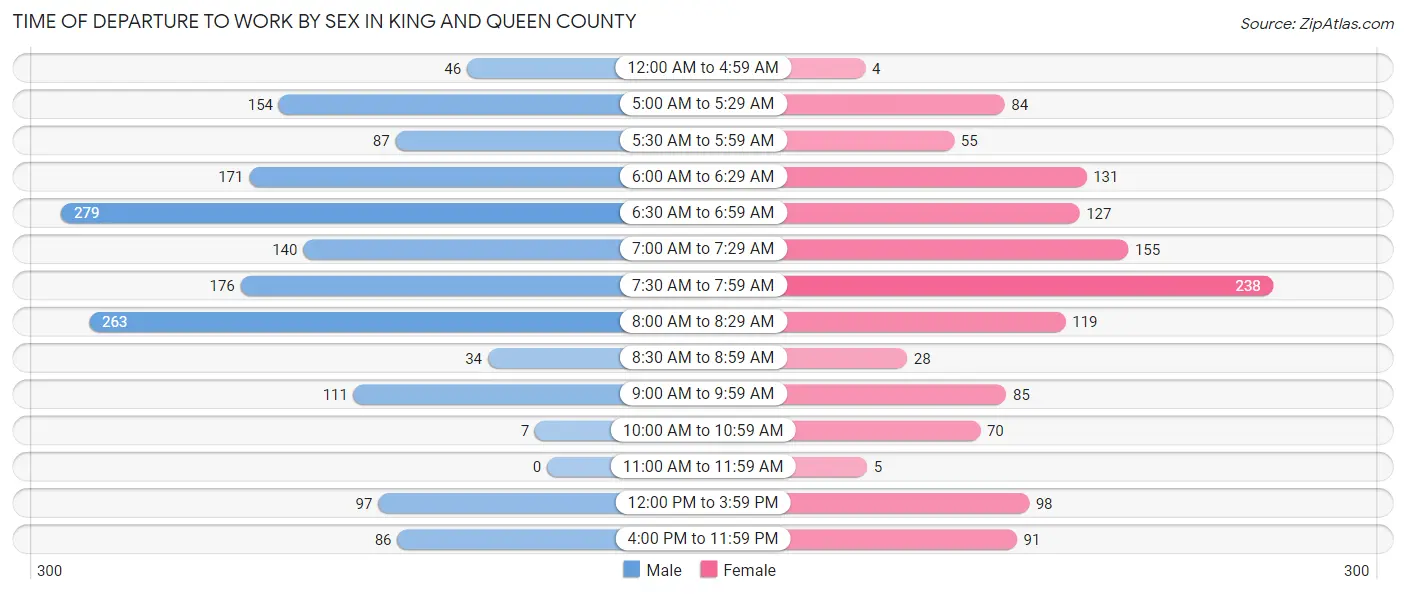
| Time of Departure | Male | Female |
| 12:00 AM to 4:59 AM | 46 (2.8%) | 4 (0.3%) |
| 5:00 AM to 5:29 AM | 154 (9.3%) | 84 (6.5%) |
| 5:30 AM to 5:59 AM | 87 (5.3%) | 55 (4.3%) |
| 6:00 AM to 6:29 AM | 171 (10.4%) | 131 (10.2%) |
| 6:30 AM to 6:59 AM | 279 (16.9%) | 127 (9.8%) |
| 7:00 AM to 7:29 AM | 140 (8.5%) | 155 (12.0%) |
| 7:30 AM to 7:59 AM | 176 (10.7%) | 238 (18.4%) |
| 8:00 AM to 8:29 AM | 263 (15.9%) | 119 (9.2%) |
| 8:30 AM to 8:59 AM | 34 (2.1%) | 28 (2.2%) |
| 9:00 AM to 9:59 AM | 111 (6.7%) | 85 (6.6%) |
| 10:00 AM to 10:59 AM | 7 (0.4%) | 70 (5.4%) |
| 11:00 AM to 11:59 AM | 0 (0.0%) | 5 (0.4%) |
| 12:00 PM to 3:59 PM | 97 (5.9%) | 98 (7.6%) |
| 4:00 PM to 11:59 PM | 86 (5.2%) | 91 (7.0%) |
| Total | 1,651 (100.0%) | 1,290 (100.0%) |
Housing Occupancy in King and Queen County
Occupancy by Ownership in King and Queen County
Of the total 2,826 dwellings in King and Queen County, owner-occupied units account for 2,195 (77.7%), while renter-occupied units make up 631 (22.3%).
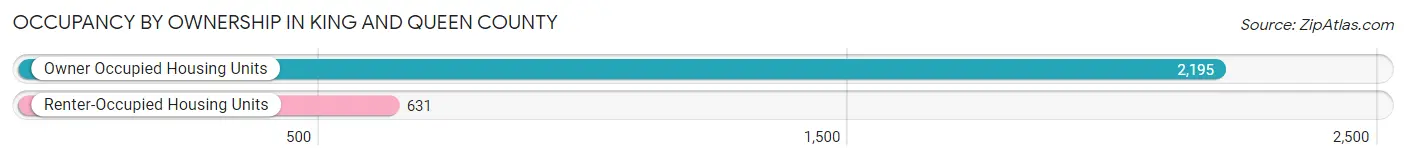
| Occupancy | # Housing Units | % Housing Units |
| Owner Occupied Housing Units | 2,195 | 77.7% |
| Renter-Occupied Housing Units | 631 | 22.3% |
| Total Occupied Housing Units | 2,826 | 100.0% |
Occupancy by Household Size in King and Queen County
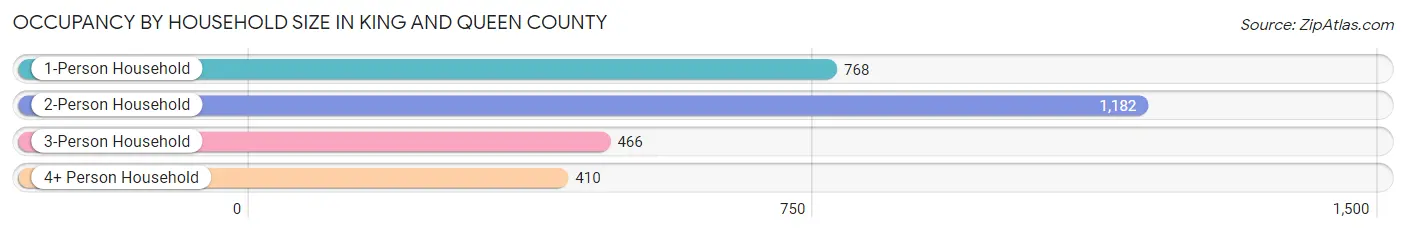
| Household Size | # Housing Units | % Housing Units |
| 1-Person Household | 768 | 27.2% |
| 2-Person Household | 1,182 | 41.8% |
| 3-Person Household | 466 | 16.5% |
| 4+ Person Household | 410 | 14.5% |
| Total Housing Units | 2,826 | 100.0% |
Occupancy by Ownership by Household Size in King and Queen County
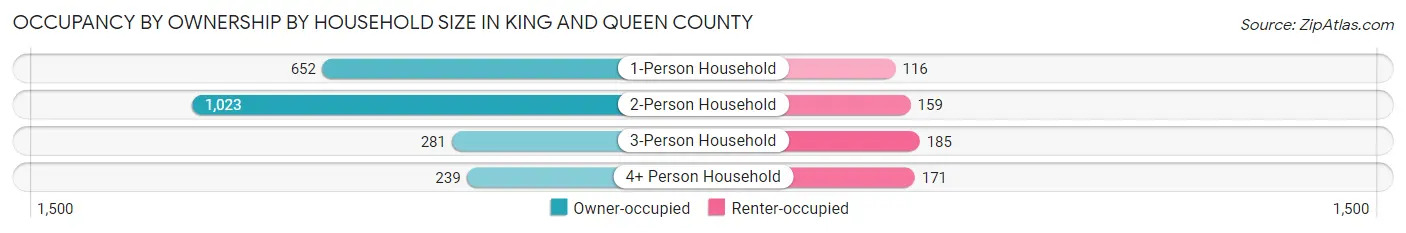
| Household Size | Owner-occupied | Renter-occupied |
| 1-Person Household | 652 (84.9%) | 116 (15.1%) |
| 2-Person Household | 1,023 (86.6%) | 159 (13.5%) |
| 3-Person Household | 281 (60.3%) | 185 (39.7%) |
| 4+ Person Household | 239 (58.3%) | 171 (41.7%) |
| Total Housing Units | 2,195 (77.7%) | 631 (22.3%) |
Occupancy by Educational Attainment in King and Queen County
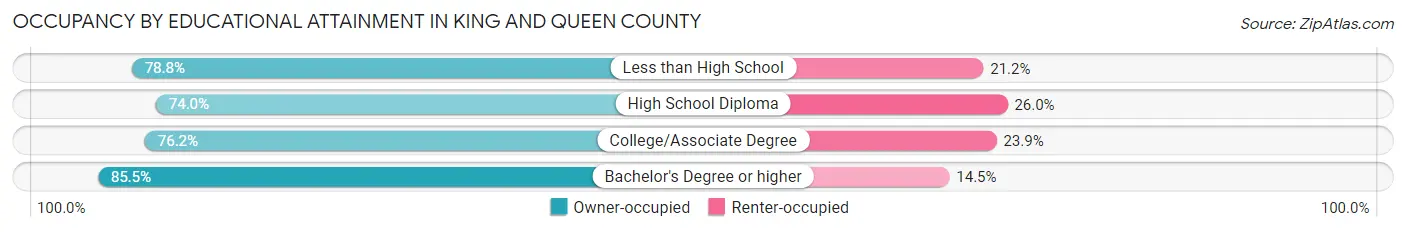
| Household Size | Owner-occupied | Renter-occupied |
| Less than High School | 293 (78.8%) | 79 (21.2%) |
| High School Diploma | 682 (74.0%) | 240 (26.0%) |
| College/Associate Degree | 731 (76.1%) | 229 (23.8%) |
| Bachelor's Degree or higher | 489 (85.5%) | 83 (14.5%) |
Occupancy by Age of Householder in King and Queen County
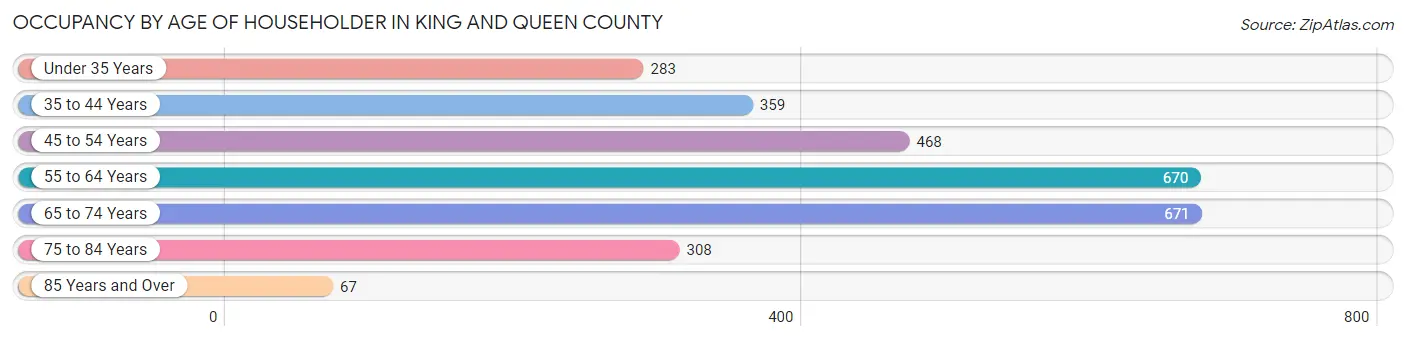
| Age Bracket | # Households | % Households |
| Under 35 Years | 283 | 10.0% |
| 35 to 44 Years | 359 | 12.7% |
| 45 to 54 Years | 468 | 16.6% |
| 55 to 64 Years | 670 | 23.7% |
| 65 to 74 Years | 671 | 23.7% |
| 75 to 84 Years | 308 | 10.9% |
| 85 Years and Over | 67 | 2.4% |
| Total | 2,826 | 100.0% |
Housing Finances in King and Queen County
Median Income by Occupancy in King and Queen County
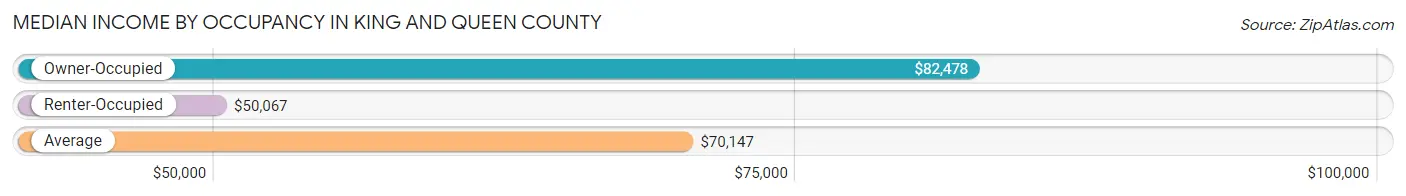
| Occupancy Type | # Households | Median Income |
| Owner-Occupied | 2,195 (77.7%) | $82,478 |
| Renter-Occupied | 631 (22.3%) | $50,067 |
| Average | 2,826 (100.0%) | $70,147 |
Occupancy by Householder Income Bracket in King and Queen County
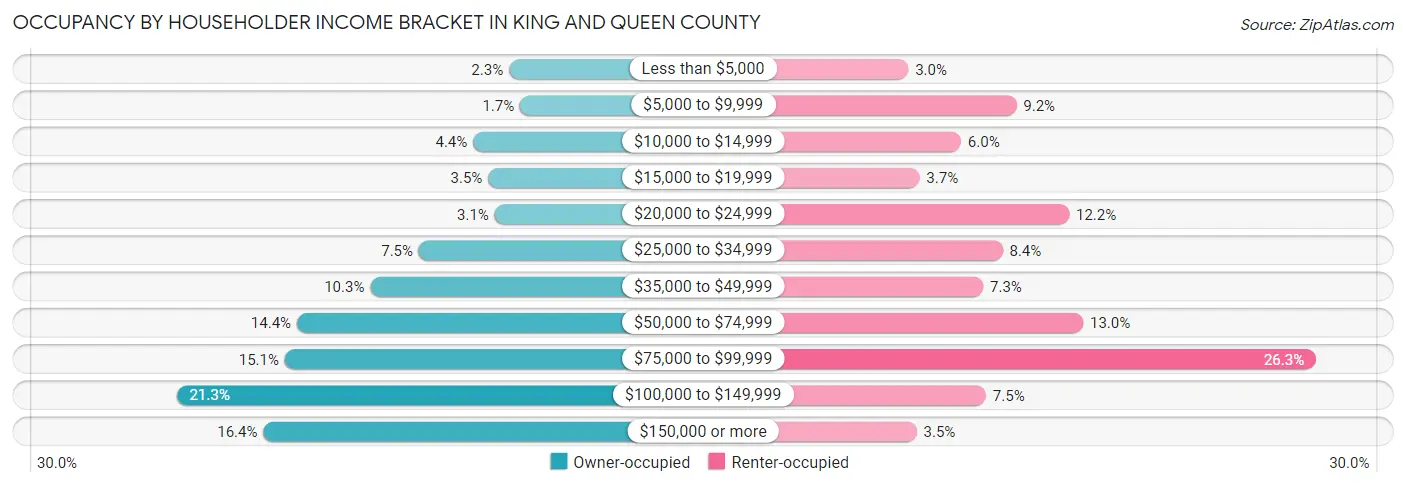
| Income Bracket | Owner-occupied | Renter-occupied |
| Less than $5,000 | 51 (2.3%) | 19 (3.0%) |
| $5,000 to $9,999 | 37 (1.7%) | 58 (9.2%) |
| $10,000 to $14,999 | 96 (4.4%) | 38 (6.0%) |
| $15,000 to $19,999 | 77 (3.5%) | 23 (3.6%) |
| $20,000 to $24,999 | 69 (3.1%) | 77 (12.2%) |
| $25,000 to $34,999 | 164 (7.5%) | 53 (8.4%) |
| $35,000 to $49,999 | 225 (10.2%) | 46 (7.3%) |
| $50,000 to $74,999 | 317 (14.4%) | 82 (13.0%) |
| $75,000 to $99,999 | 332 (15.1%) | 166 (26.3%) |
| $100,000 to $149,999 | 468 (21.3%) | 47 (7.4%) |
| $150,000 or more | 359 (16.4%) | 22 (3.5%) |
| Total | 2,195 (100.0%) | 631 (100.0%) |
Monthly Housing Cost Tiers in King and Queen County
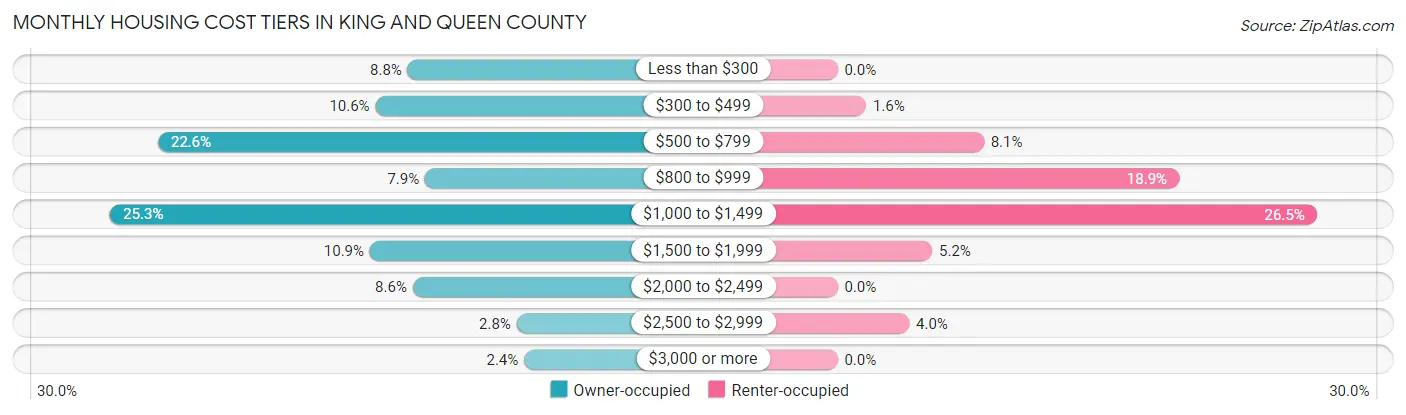
| Monthly Cost | Owner-occupied | Renter-occupied |
| Less than $300 | 194 (8.8%) | 0 (0.0%) |
| $300 to $499 | 233 (10.6%) | 10 (1.6%) |
| $500 to $799 | 497 (22.6%) | 51 (8.1%) |
| $800 to $999 | 173 (7.9%) | 119 (18.9%) |
| $1,000 to $1,499 | 555 (25.3%) | 167 (26.5%) |
| $1,500 to $1,999 | 240 (10.9%) | 33 (5.2%) |
| $2,000 to $2,499 | 188 (8.6%) | 0 (0.0%) |
| $2,500 to $2,999 | 62 (2.8%) | 25 (4.0%) |
| $3,000 or more | 53 (2.4%) | 0 (0.0%) |
| Total | 2,195 (100.0%) | 631 (100.0%) |
Physical Housing Characteristics in King and Queen County
Housing Structures in King and Queen County
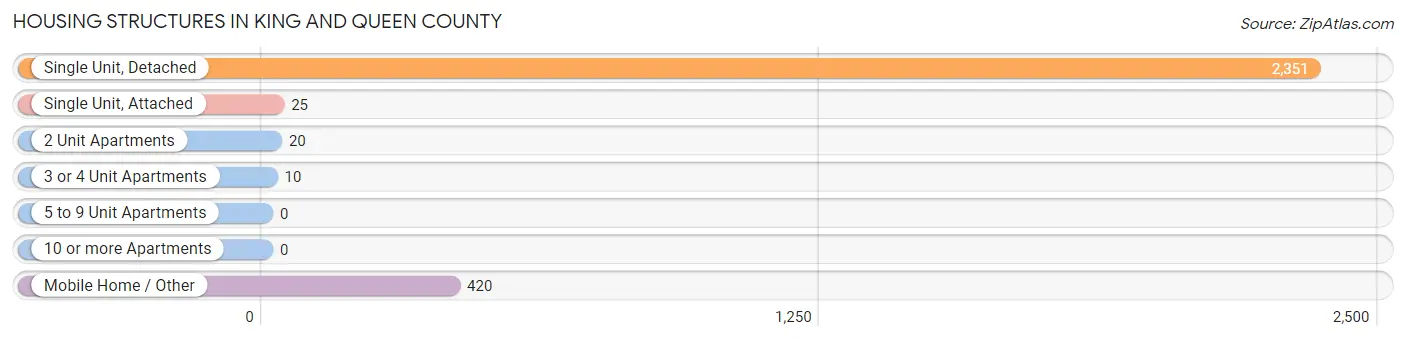
| Structure Type | # Housing Units | % Housing Units |
| Single Unit, Detached | 2,351 | 83.2% |
| Single Unit, Attached | 25 | 0.9% |
| 2 Unit Apartments | 20 | 0.7% |
| 3 or 4 Unit Apartments | 10 | 0.4% |
| 5 to 9 Unit Apartments | 0 | 0.0% |
| 10 or more Apartments | 0 | 0.0% |
| Mobile Home / Other | 420 | 14.9% |
| Total | 2,826 | 100.0% |
Housing Structures by Occupancy in King and Queen County
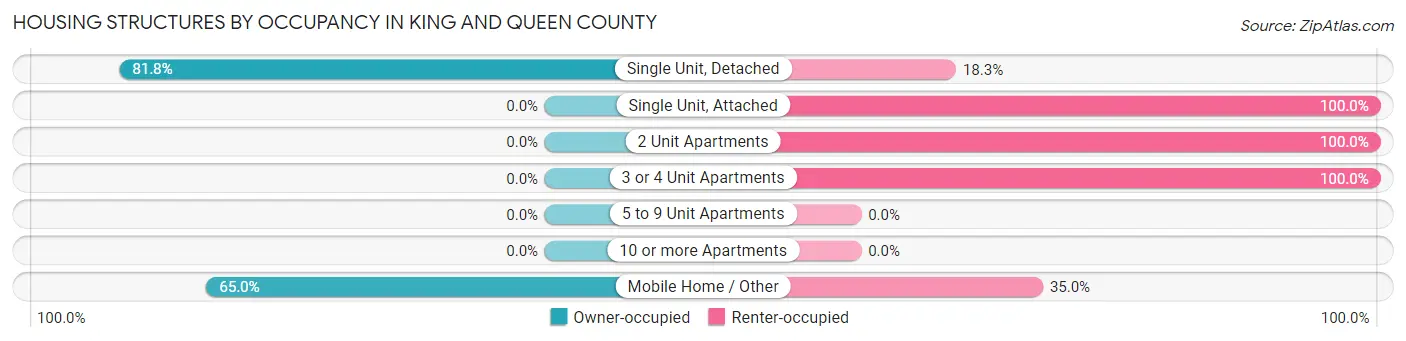
| Structure Type | Owner-occupied | Renter-occupied |
| Single Unit, Detached | 1,922 (81.8%) | 429 (18.2%) |
| Single Unit, Attached | 0 (0.0%) | 25 (100.0%) |
| 2 Unit Apartments | 0 (0.0%) | 20 (100.0%) |
| 3 or 4 Unit Apartments | 0 (0.0%) | 10 (100.0%) |
| 5 to 9 Unit Apartments | 0 (0.0%) | 0 (0.0%) |
| 10 or more Apartments | 0 (0.0%) | 0 (0.0%) |
| Mobile Home / Other | 273 (65.0%) | 147 (35.0%) |
| Total | 2,195 (77.7%) | 631 (22.3%) |
Housing Structures by Number of Rooms in King and Queen County
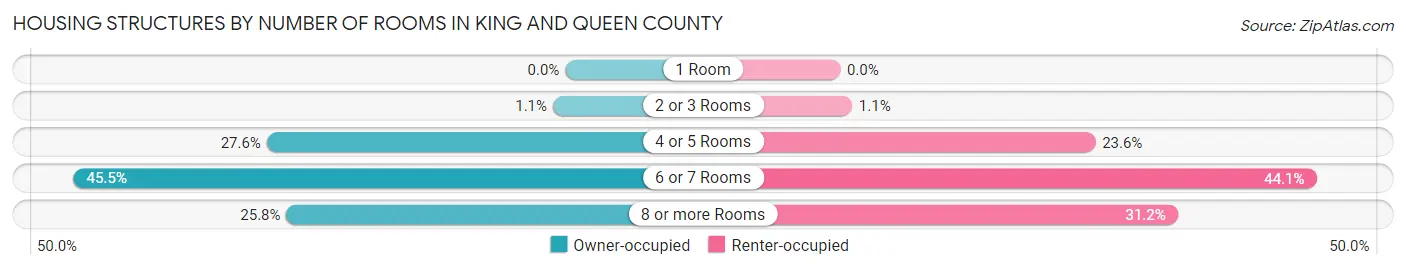
| Number of Rooms | Owner-occupied | Renter-occupied |
| 1 Room | 0 (0.0%) | 0 (0.0%) |
| 2 or 3 Rooms | 25 (1.1%) | 7 (1.1%) |
| 4 or 5 Rooms | 606 (27.6%) | 149 (23.6%) |
| 6 or 7 Rooms | 998 (45.5%) | 278 (44.1%) |
| 8 or more Rooms | 566 (25.8%) | 197 (31.2%) |
| Total | 2,195 (100.0%) | 631 (100.0%) |
Housing Structure by Heating Type in King and Queen County
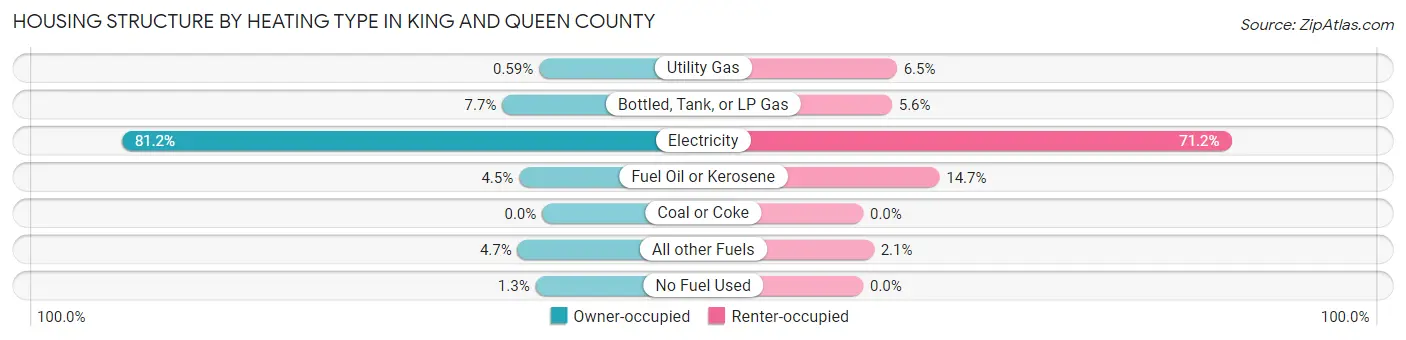
| Heating Type | Owner-occupied | Renter-occupied |
| Utility Gas | 13 (0.6%) | 41 (6.5%) |
| Bottled, Tank, or LP Gas | 169 (7.7%) | 35 (5.6%) |
| Electricity | 1,783 (81.2%) | 449 (71.2%) |
| Fuel Oil or Kerosene | 98 (4.5%) | 93 (14.7%) |
| Coal or Coke | 0 (0.0%) | 0 (0.0%) |
| All other Fuels | 104 (4.7%) | 13 (2.1%) |
| No Fuel Used | 28 (1.3%) | 0 (0.0%) |
| Total | 2,195 (100.0%) | 631 (100.0%) |
Household Vehicle Usage in King and Queen County
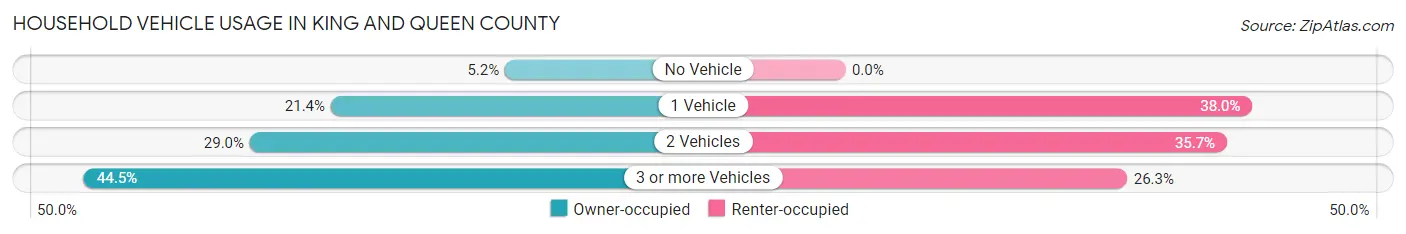
| Vehicles per Household | Owner-occupied | Renter-occupied |
| No Vehicle | 113 (5.1%) | 0 (0.0%) |
| 1 Vehicle | 470 (21.4%) | 240 (38.0%) |
| 2 Vehicles | 636 (29.0%) | 225 (35.7%) |
| 3 or more Vehicles | 976 (44.5%) | 166 (26.3%) |
| Total | 2,195 (100.0%) | 631 (100.0%) |
Real Estate & Mortgages in King and Queen County
Real Estate and Mortgage Overview in King and Queen County
| Characteristic | Without Mortgage | With Mortgage |
| Housing Units | 833 | 1,362 |
| Median Property Value | $206,300 | $215,000 |
| Median Household Income | $56,683 | $286 |
| Monthly Housing Costs | $490 | $53 |
| Real Estate Taxes | $1,060 | $23 |
Property Value by Mortgage Status in King and Queen County
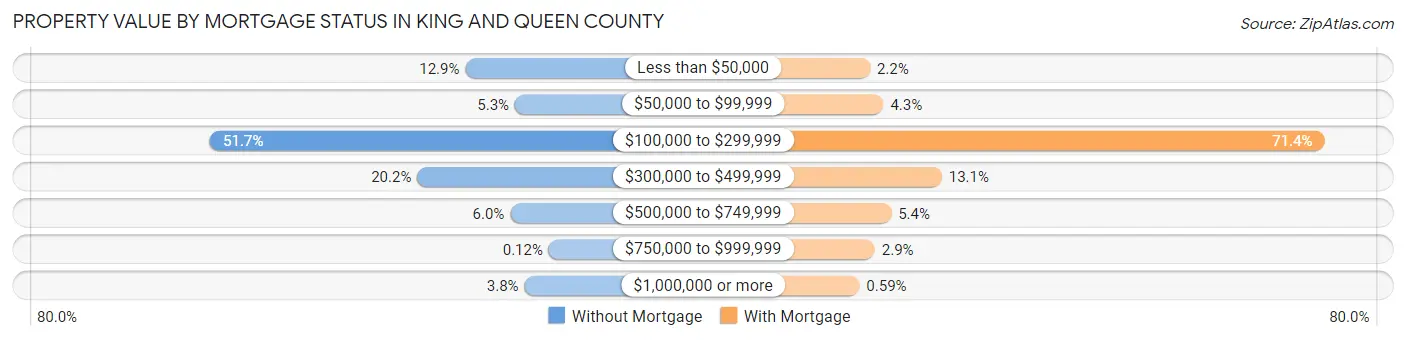
| Property Value | Without Mortgage | With Mortgage |
| Less than $50,000 | 107 (12.9%) | 30 (2.2%) |
| $50,000 to $99,999 | 44 (5.3%) | 58 (4.3%) |
| $100,000 to $299,999 | 431 (51.7%) | 973 (71.4%) |
| $300,000 to $499,999 | 168 (20.2%) | 179 (13.1%) |
| $500,000 to $749,999 | 50 (6.0%) | 74 (5.4%) |
| $750,000 to $999,999 | 1 (0.1%) | 40 (2.9%) |
| $1,000,000 or more | 32 (3.8%) | 8 (0.6%) |
| Total | 833 (100.0%) | 1,362 (100.0%) |
Household Income by Mortgage Status in King and Queen County
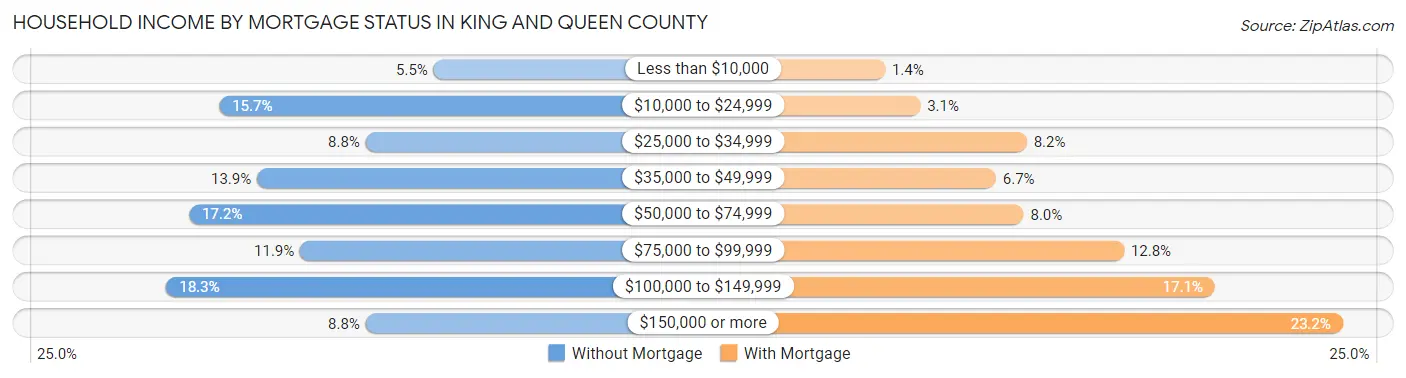
| Household Income | Without Mortgage | With Mortgage |
| Less than $10,000 | 46 (5.5%) | 19 (1.4%) |
| $10,000 to $24,999 | 131 (15.7%) | 42 (3.1%) |
| $25,000 to $34,999 | 73 (8.8%) | 111 (8.2%) |
| $35,000 to $49,999 | 116 (13.9%) | 91 (6.7%) |
| $50,000 to $74,999 | 143 (17.2%) | 109 (8.0%) |
| $75,000 to $99,999 | 99 (11.9%) | 174 (12.8%) |
| $100,000 to $149,999 | 152 (18.2%) | 233 (17.1%) |
| $150,000 or more | 73 (8.8%) | 316 (23.2%) |
| Total | 833 (100.0%) | 1,362 (100.0%) |
Property Value to Household Income Ratio in King and Queen County
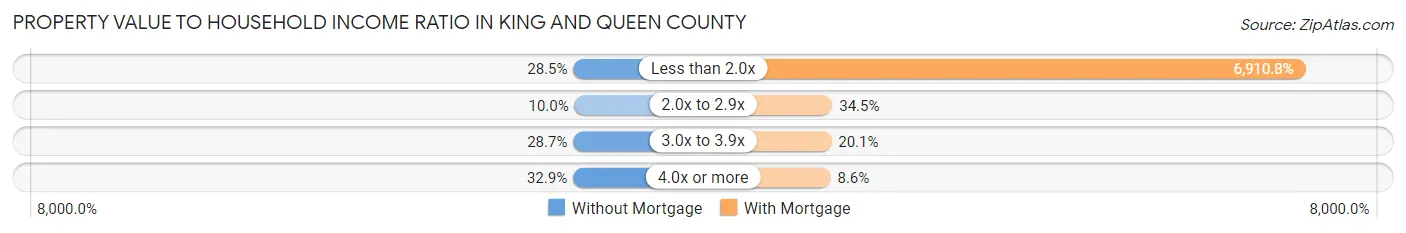
| Value-to-Income Ratio | Without Mortgage | With Mortgage |
| Less than 2.0x | 237 (28.4%) | 94,125 (6,910.8%) |
| 2.0x to 2.9x | 83 (10.0%) | 470 (34.5%) |
| 3.0x to 3.9x | 239 (28.7%) | 274 (20.1%) |
| 4.0x or more | 274 (32.9%) | 117 (8.6%) |
| Total | 833 (100.0%) | 1,362 (100.0%) |
Real Estate Taxes by Mortgage Status in King and Queen County
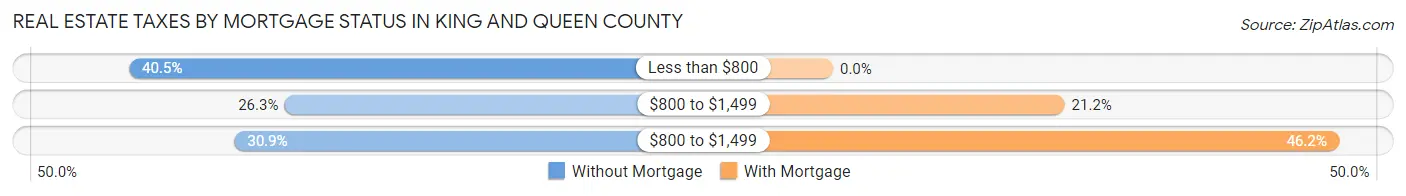
| Property Taxes | Without Mortgage | With Mortgage |
| Less than $800 | 337 (40.5%) | 0 (0.0%) |
| $800 to $1,499 | 219 (26.3%) | 288 (21.1%) |
| $800 to $1,499 | 257 (30.8%) | 629 (46.2%) |
| Total | 833 (100.0%) | 1,362 (100.0%) |
Health & Disability in King and Queen County
Health Insurance Coverage by Age in King and Queen County
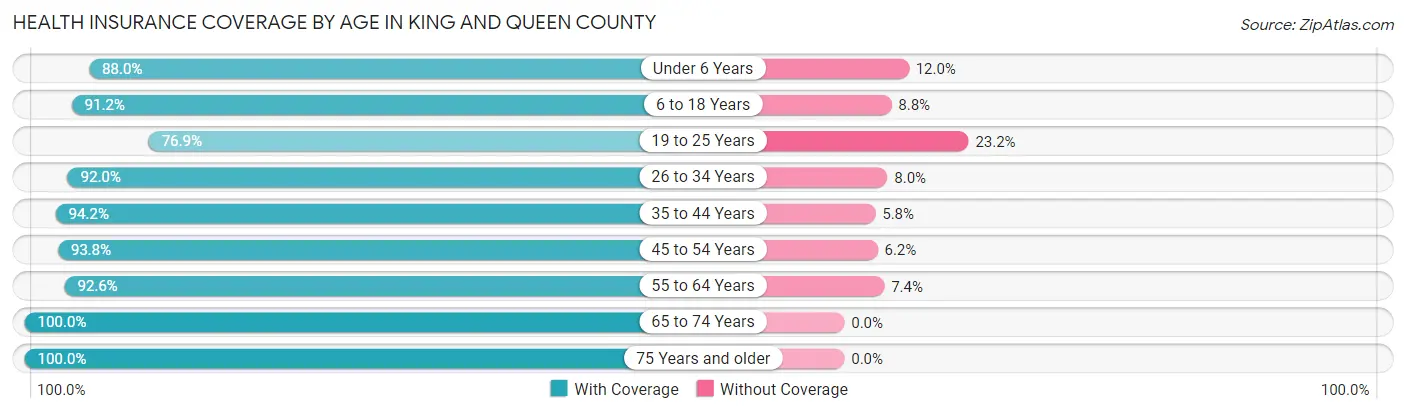
| Age Bracket | With Coverage | Without Coverage |
| Under 6 Years | 337 (88.0%) | 46 (12.0%) |
| 6 to 18 Years | 801 (91.2%) | 77 (8.8%) |
| 19 to 25 Years | 312 (76.8%) | 94 (23.2%) |
| 26 to 34 Years | 573 (92.0%) | 50 (8.0%) |
| 35 to 44 Years | 701 (94.2%) | 43 (5.8%) |
| 45 to 54 Years | 863 (93.8%) | 57 (6.2%) |
| 55 to 64 Years | 1,144 (92.6%) | 92 (7.4%) |
| 65 to 74 Years | 969 (100.0%) | 0 (0.0%) |
| 75 Years and older | 522 (100.0%) | 0 (0.0%) |
| Total | 6,222 (93.1%) | 459 (6.9%) |
Health Insurance Coverage by Citizenship Status in King and Queen County
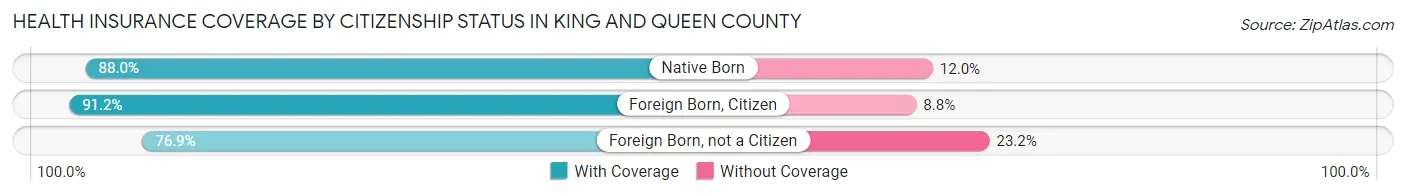
| Citizenship Status | With Coverage | Without Coverage |
| Native Born | 337 (88.0%) | 46 (12.0%) |
| Foreign Born, Citizen | 801 (91.2%) | 77 (8.8%) |
| Foreign Born, not a Citizen | 312 (76.8%) | 94 (23.2%) |
Health Insurance Coverage by Household Income in King and Queen County
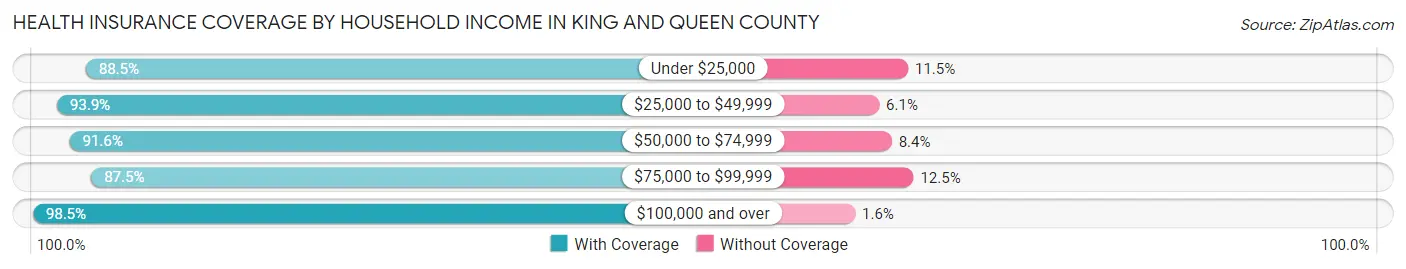
| Household Income | With Coverage | Without Coverage |
| Under $25,000 | 1,111 (88.5%) | 144 (11.5%) |
| $25,000 to $49,999 | 992 (93.9%) | 64 (6.1%) |
| $50,000 to $74,999 | 761 (91.6%) | 70 (8.4%) |
| $75,000 to $99,999 | 1,009 (87.5%) | 144 (12.5%) |
| $100,000 and over | 2,349 (98.5%) | 37 (1.5%) |
Public vs Private Health Insurance Coverage by Age in King and Queen County
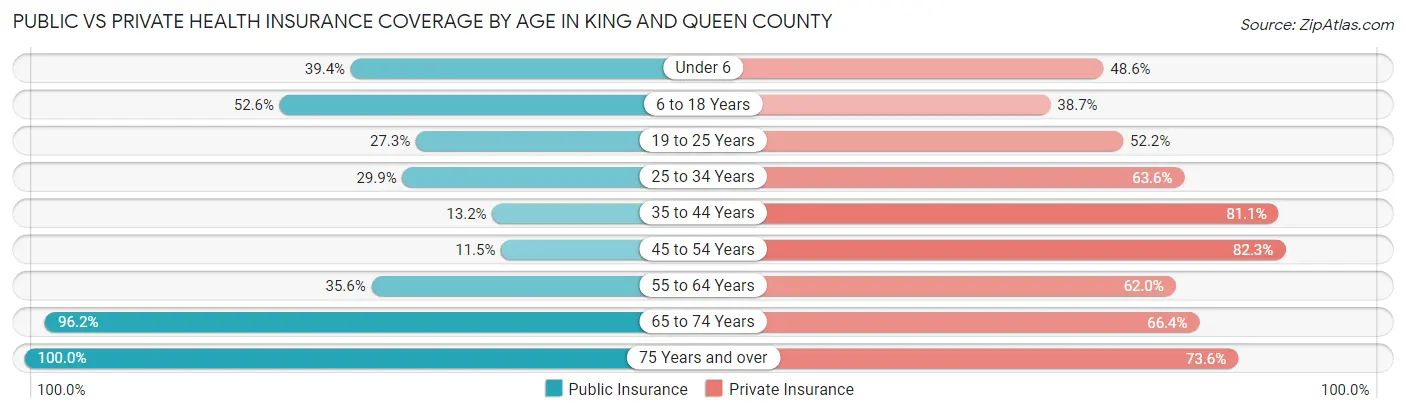
| Age Bracket | Public Insurance | Private Insurance |
| Under 6 | 151 (39.4%) | 186 (48.6%) |
| 6 to 18 Years | 462 (52.6%) | 340 (38.7%) |
| 19 to 25 Years | 111 (27.3%) | 212 (52.2%) |
| 25 to 34 Years | 186 (29.9%) | 396 (63.6%) |
| 35 to 44 Years | 98 (13.2%) | 603 (81.0%) |
| 45 to 54 Years | 106 (11.5%) | 757 (82.3%) |
| 55 to 64 Years | 440 (35.6%) | 766 (62.0%) |
| 65 to 74 Years | 932 (96.2%) | 643 (66.4%) |
| 75 Years and over | 522 (100.0%) | 384 (73.6%) |
| Total | 3,008 (45.0%) | 4,287 (64.2%) |
Disability Status by Sex by Age in King and Queen County
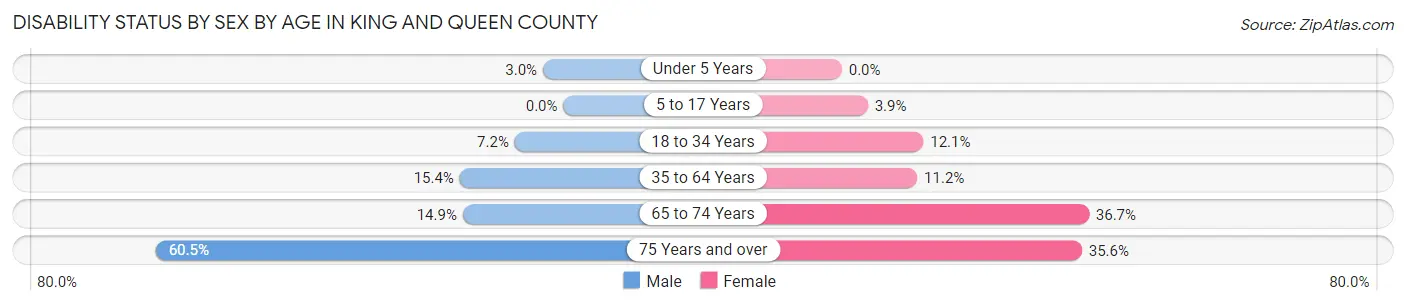
| Age Bracket | Male | Female |
| Under 5 Years | 6 (3.0%) | 0 (0.0%) |
| 5 to 17 Years | 0 (0.0%) | 15 (3.8%) |
| 18 to 34 Years | 41 (7.2%) | 60 (12.1%) |
| 35 to 64 Years | 229 (15.4%) | 158 (11.2%) |
| 65 to 74 Years | 69 (14.9%) | 186 (36.7%) |
| 75 Years and over | 141 (60.5%) | 103 (35.6%) |
Disability Class by Sex by Age in King and Queen County
Disability Class: Hearing Difficulty
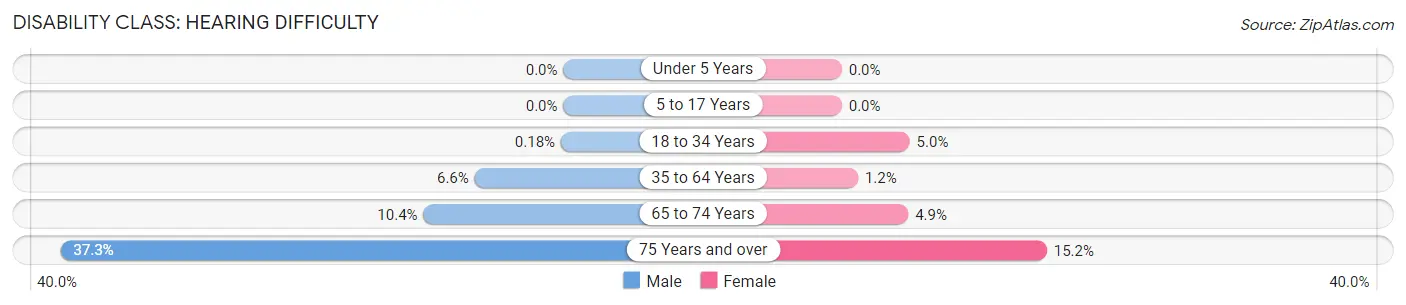
| Age Bracket | Male | Female |
| Under 5 Years | 0 (0.0%) | 0 (0.0%) |
| 5 to 17 Years | 0 (0.0%) | 0 (0.0%) |
| 18 to 34 Years | 1 (0.2%) | 25 (5.0%) |
| 35 to 64 Years | 98 (6.6%) | 17 (1.2%) |
| 65 to 74 Years | 48 (10.4%) | 25 (4.9%) |
| 75 Years and over | 87 (37.3%) | 44 (15.2%) |
Disability Class: Vision Difficulty
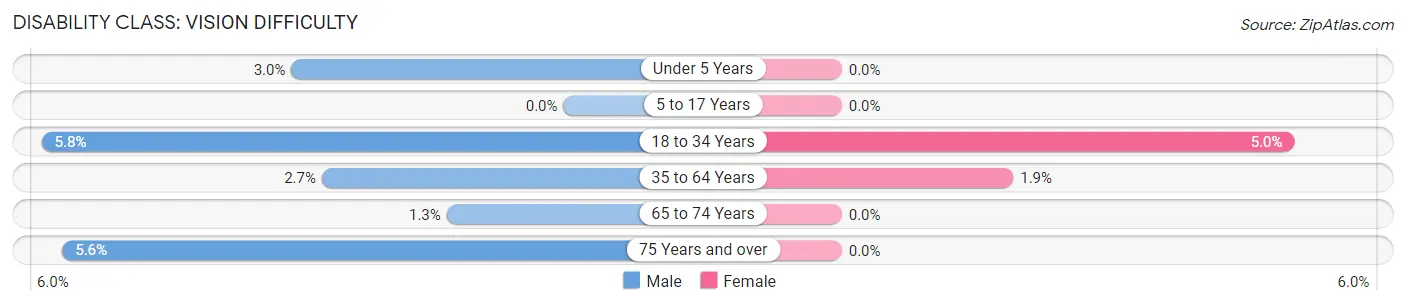
| Age Bracket | Male | Female |
| Under 5 Years | 6 (3.0%) | 0 (0.0%) |
| 5 to 17 Years | 0 (0.0%) | 0 (0.0%) |
| 18 to 34 Years | 33 (5.8%) | 25 (5.0%) |
| 35 to 64 Years | 40 (2.7%) | 27 (1.9%) |
| 65 to 74 Years | 6 (1.3%) | 0 (0.0%) |
| 75 Years and over | 13 (5.6%) | 0 (0.0%) |
Disability Class: Cognitive Difficulty
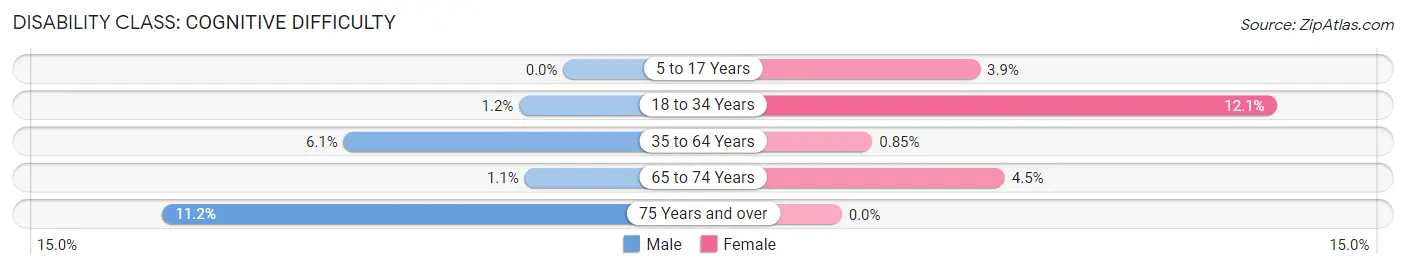
| Age Bracket | Male | Female |
| 5 to 17 Years | 0 (0.0%) | 15 (3.8%) |
| 18 to 34 Years | 7 (1.2%) | 60 (12.1%) |
| 35 to 64 Years | 91 (6.1%) | 12 (0.9%) |
| 65 to 74 Years | 5 (1.1%) | 23 (4.5%) |
| 75 Years and over | 26 (11.2%) | 0 (0.0%) |
Disability Class: Ambulatory Difficulty
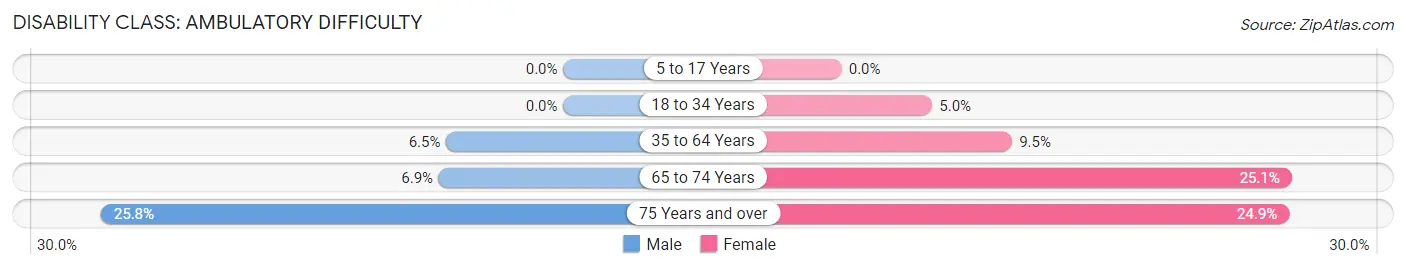
| Age Bracket | Male | Female |
| 5 to 17 Years | 0 (0.0%) | 0 (0.0%) |
| 18 to 34 Years | 0 (0.0%) | 25 (5.0%) |
| 35 to 64 Years | 97 (6.5%) | 134 (9.5%) |
| 65 to 74 Years | 32 (6.9%) | 127 (25.1%) |
| 75 Years and over | 60 (25.8%) | 72 (24.9%) |
Disability Class: Self-Care Difficulty
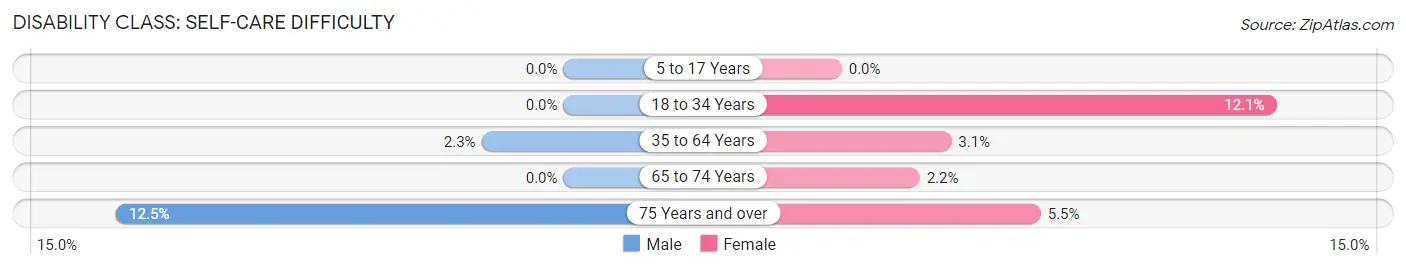
| Age Bracket | Male | Female |
| 5 to 17 Years | 0 (0.0%) | 0 (0.0%) |
| 18 to 34 Years | 0 (0.0%) | 60 (12.1%) |
| 35 to 64 Years | 34 (2.3%) | 43 (3.0%) |
| 65 to 74 Years | 0 (0.0%) | 11 (2.2%) |
| 75 Years and over | 29 (12.4%) | 16 (5.5%) |
Technology Access in King and Queen County
Computing Device Access in King and Queen County
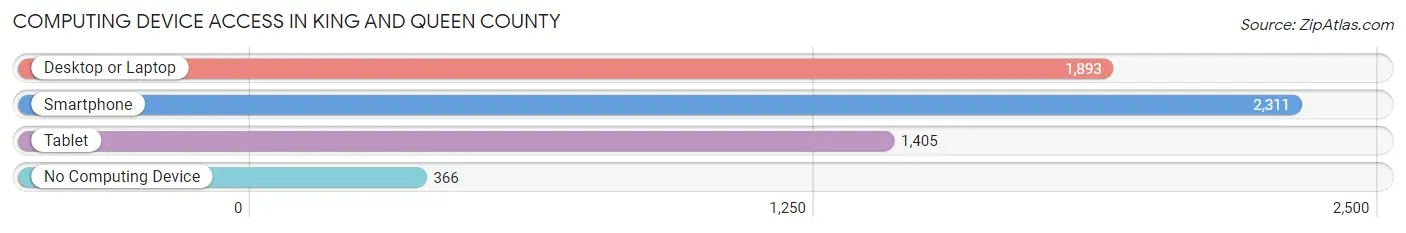
| Device Type | # Households | % Households |
| Desktop or Laptop | 1,893 | 67.0% |
| Smartphone | 2,311 | 81.8% |
| Tablet | 1,405 | 49.7% |
| No Computing Device | 366 | 13.0% |
| Total | 2,826 | 100.0% |
Internet Access in King and Queen County
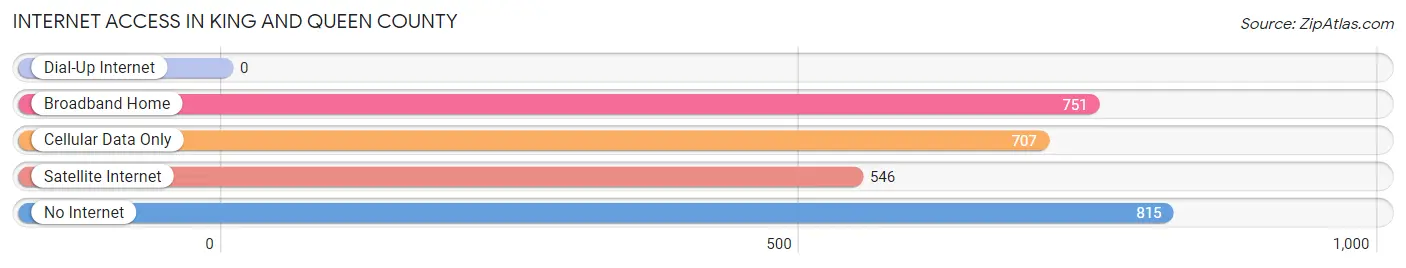
| Internet Type | # Households | % Households |
| Dial-Up Internet | 0 | 0.0% |
| Broadband Home | 751 | 26.6% |
| Cellular Data Only | 707 | 25.0% |
| Satellite Internet | 546 | 19.3% |
| No Internet | 815 | 28.8% |
| Total | 2,826 | 100.0% |
King and Queen County Summary
King and Queen County is located in the Middle Peninsula region of Virginia, and is bordered by Essex, Middlesex, and King William counties. The county seat is King and Queen Court House. The county was established in 1691 and is named for King William III and Queen Mary II of England.
Geography
King and Queen County is located in the Middle Peninsula region of Virginia, and is bordered by Essex, Middlesex, and King William counties. The county is located on the Mattaponi River, and is approximately 50 miles east of Richmond. The county has a total area of 437 square miles, of which 431 square miles is land and 6 square miles is water. The terrain is mostly flat, with some rolling hills in the northern part of the county.
Demographics
As of the 2010 census, the population of King and Queen County was 6,945. The racial makeup of the county was 68.2% White, 28.7% Black or African American, 0.3% Native American, 0.3% Asian, 0.1% Pacific Islander, 0.7% from other races, and 1.9% from two or more races. Hispanic or Latino of any race were 1.9% of the population.
The median household income in King and Queen County was $41,945 in 2019, and the median family income was $50,917. The per capita income was $20,945. About 17.2% of families and 20.7% of the population were below the poverty line, including 28.2% of those under age 18 and 16.2% of those age 65 or over.
Economy
The economy of King and Queen County is largely based on agriculture and forestry. The county is home to several large farms, as well as several small family farms. The county is also home to several timber companies, which harvest timber from the county’s forests.
The county is also home to several small businesses, including restaurants, retail stores, and service providers. The county is also home to several manufacturing companies, including a furniture manufacturer and a paper mill.
The county is served by two major highways, US Route 360 and US Route 17. The county is also served by several smaller roads, including state routes 33, 614, and 617. The county is served by the King and Queen County Airport, which is located in the town of King and Queen Court House.
Conclusion
King and Queen County is a rural county located in the Middle Peninsula region of Virginia. The county is home to several large farms, timber companies, and small businesses. The county is served by two major highways, US Route 360 and US Route 17, as well as several smaller roads. The county is also served by the King and Queen County Airport. The population of the county was 6,945 as of the 2010 census, and the median household income was $41,945 in 2019.
Common Questions
What is Per Capita Income in King and Queen County?
Per Capita income in King and Queen County is $38,904.
What is the Median Family Income in King and Queen County?
Median Family Income in King and Queen County is $93,558.
What is the Median Household income in King and Queen County?
Median Household Income in King and Queen County is $70,147.
What is Income or Wage Gap in King and Queen County?
Income or Wage Gap in King and Queen County is 23.3%.
Women in King and Queen County earn 76.7 cents for every dollar earned by a man.
What is Inequality or Gini Index in King and Queen County?
Inequality or Gini Index in King and Queen County is 0.45.
What is the Total Population of King and Queen County?
Total Population of King and Queen County is 6,681.
What is the Total Male Population of King and Queen County?
Total Male Population of King and Queen County is 3,485.
What is the Total Female Population of King and Queen County?
Total Female Population of King and Queen County is 3,196.
What is the Ratio of Males per 100 Females in King and Queen County?
There are 109.04 Males per 100 Females in King and Queen County.
What is the Ratio of Females per 100 Males in King and Queen County?
There are 91.71 Females per 100 Males in King and Queen County.
What is the Median Population Age in King and Queen County?
Median Population Age in King and Queen County is 47.4 Years.
What is the Average Family Size in King and Queen County
Average Family Size in King and Queen County is 2.9 People.
What is the Average Household Size in King and Queen County
Average Household Size in King and Queen County is 2.4 People.
How Large is the Labor Force in King and Queen County?
There are 3,502 People in the Labor Forcein in King and Queen County.
What is the Percentage of People in the Labor Force in King and Queen County?
62.2% of People are in the Labor Force in King and Queen County.
What is the Unemployment Rate in King and Queen County?
Unemployment Rate in King and Queen County is 5.7%.