James City County, VA Map & Demographics
James City County Map
James City County Overview
$50,984
PER CAPITA INCOME
$121,086
AVG FAMILY INCOME
$100,711
AVG HOUSEHOLD INCOME
29.3%
WAGE / INCOME GAP [ % ]
70.7¢/ $1
WAGE / INCOME GAP [ $ ]
$10,463
FAMILY INCOME DEFICIT
0.42
INEQUALITY / GINI INDEX
78,818
TOTAL POPULATION
38,132
MALE POPULATION
40,686
FEMALE POPULATION
93.72
MALES / 100 FEMALES
106.70
FEMALES / 100 MALES
47.1
MEDIAN AGE
3.0
AVG FAMILY SIZE
2.5
AVG HOUSEHOLD SIZE
37,219
LABOR FORCE [ PEOPLE ]
57.2%
PERCENT IN LABOR FORCE
3.7%
UNEMPLOYMENT RATE
James City County Area Codes
Income in James City County
Income Overview in James City County
Per Capita Income in James City County is $50,984, while median incomes of families and households are $121,086 and $100,711 respectively.
| Characteristic | Number | Measure |
| Per Capita Income | 78,818 | $50,984 |
| Median Family Income | 21,859 | $121,086 |
| Mean Family Income | 21,859 | $145,552 |
| Median Household Income | 30,690 | $100,711 |
| Mean Household Income | 30,690 | $124,982 |
| Income Deficit | 21,859 | $10,463 |
| Wage / Income Gap (%) | 78,818 | 29.26% |
| Wage / Income Gap ($) | 78,818 | 70.74¢ per $1 |
| Gini / Inequality Index | 78,818 | 0.42 |
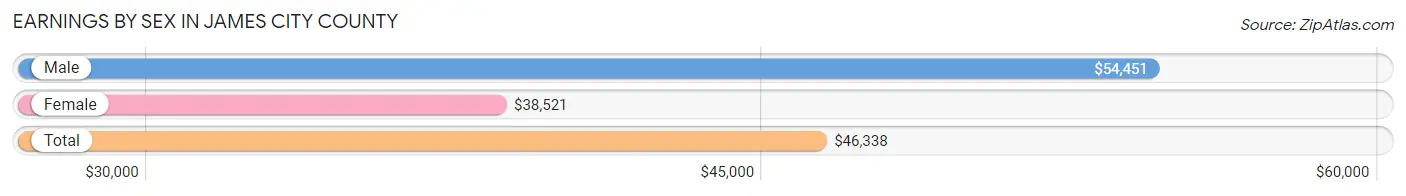
Earnings by Sex in James City County
Average Earnings in James City County are $46,338, $54,451 for men and $38,521 for women, a difference of 29.3%.
| Sex | Number | Average Earnings |
| Male | 20,916 (52.9%) | $54,451 |
| Female | 18,620 (47.1%) | $38,521 |
| Total | 39,536 (100.0%) | $46,338 |
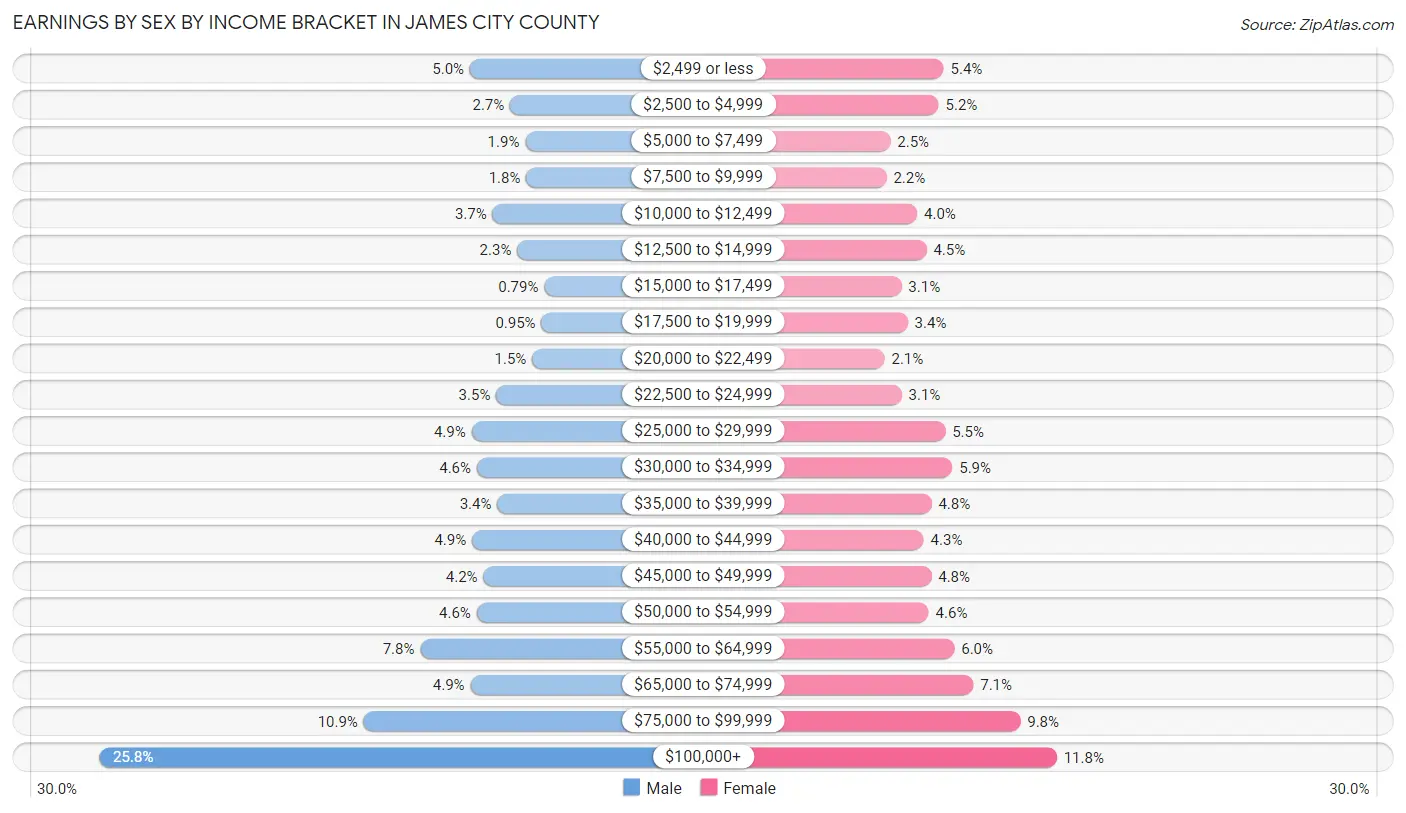
Earnings by Sex by Income Bracket in James City County
The most common earnings brackets in James City County are $100,000+ for men (5,388 | 25.8%) and $100,000+ for women (2,197 | 11.8%).
| Income | Male | Female |
| $2,499 or less | 1,040 (5.0%) | 1,013 (5.4%) |
| $2,500 to $4,999 | 566 (2.7%) | 960 (5.2%) |
| $5,000 to $7,499 | 390 (1.9%) | 456 (2.5%) |
| $7,500 to $9,999 | 377 (1.8%) | 415 (2.2%) |
| $10,000 to $12,499 | 774 (3.7%) | 736 (4.0%) |
| $12,500 to $14,999 | 484 (2.3%) | 835 (4.5%) |
| $15,000 to $17,499 | 165 (0.8%) | 572 (3.1%) |
| $17,500 to $19,999 | 199 (0.9%) | 637 (3.4%) |
| $20,000 to $22,499 | 307 (1.5%) | 395 (2.1%) |
| $22,500 to $24,999 | 731 (3.5%) | 574 (3.1%) |
| $25,000 to $29,999 | 1,020 (4.9%) | 1,029 (5.5%) |
| $30,000 to $34,999 | 957 (4.6%) | 1,105 (5.9%) |
| $35,000 to $39,999 | 717 (3.4%) | 886 (4.8%) |
| $40,000 to $44,999 | 1,015 (4.9%) | 805 (4.3%) |
| $45,000 to $49,999 | 880 (4.2%) | 885 (4.8%) |
| $50,000 to $54,999 | 961 (4.6%) | 856 (4.6%) |
| $55,000 to $64,999 | 1,624 (7.8%) | 1,125 (6.0%) |
| $65,000 to $74,999 | 1,033 (4.9%) | 1,323 (7.1%) |
| $75,000 to $99,999 | 2,288 (10.9%) | 1,816 (9.8%) |
| $100,000+ | 5,388 (25.8%) | 2,197 (11.8%) |
| Total | 20,916 (100.0%) | 18,620 (100.0%) |
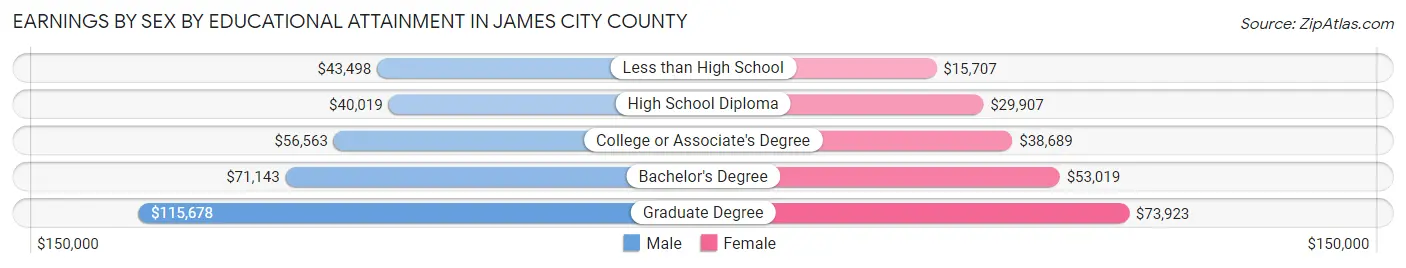
Earnings by Sex by Educational Attainment in James City County
Average earnings in James City County are $62,021 for men and $45,738 for women, a difference of 26.3%. Men with an educational attainment of graduate degree enjoy the highest average annual earnings of $115,678, while those with high school diploma education earn the least with $40,019. Women with an educational attainment of graduate degree earn the most with the average annual earnings of $73,923, while those with less than high school education have the smallest earnings of $15,707.
| Educational Attainment | Male Income | Female Income |
| Less than High School | $43,498 | $15,707 |
| High School Diploma | $40,019 | $29,907 |
| College or Associate's Degree | $56,563 | $38,689 |
| Bachelor's Degree | $71,143 | $53,019 |
| Graduate Degree | $115,678 | $73,923 |
| Total | $62,021 | $45,738 |
Family Income in James City County
Family Income Brackets in James City County
According to the James City County family income data, there are 5,202 families falling into the $100,000 to $149,999 income range, which is the most common income bracket and makes up 23.8% of all families. Conversely, the $10,000 to $14,999 income bracket is the least frequent group with only 219 families (1.0%) belonging to this category.
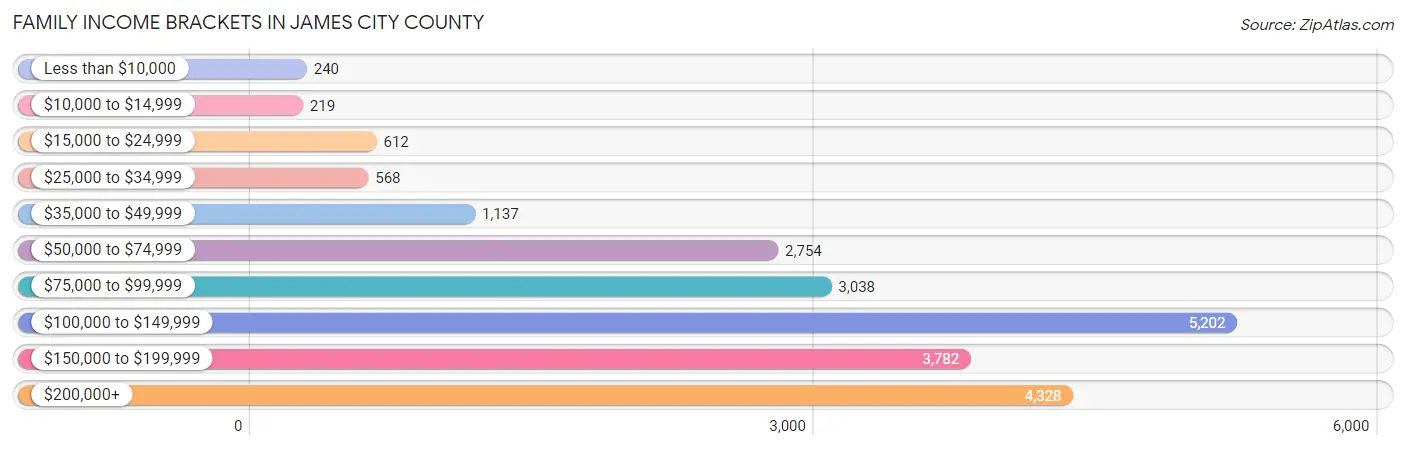
| Income Bracket | # Families | % Families |
| Less than $10,000 | 240 | 1.1% |
| $10,000 to $14,999 | 219 | 1.0% |
| $15,000 to $24,999 | 612 | 2.8% |
| $25,000 to $34,999 | 568 | 2.6% |
| $35,000 to $49,999 | 1,137 | 5.2% |
| $50,000 to $74,999 | 2,754 | 12.6% |
| $75,000 to $99,999 | 3,038 | 13.9% |
| $100,000 to $149,999 | 5,202 | 23.8% |
| $150,000 to $199,999 | 3,782 | 17.3% |
| $200,000+ | 4,328 | 19.8% |
Family Income by Famaliy Size in James City County
7+ person families (94 | 0.4%) account for the highest median family income in James City County with $150,714 per family, while 2-person families (12,447 | 56.9%) have the highest median income of $56,933 per family member.
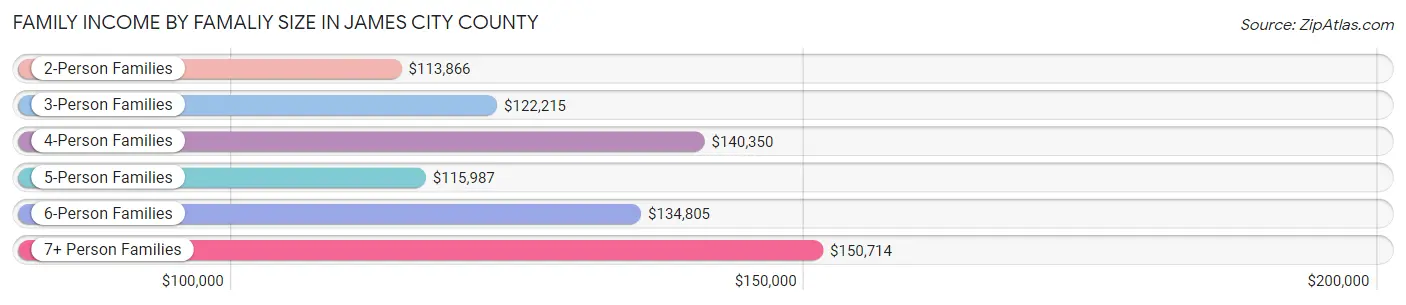
| Income Bracket | # Families | Median Income |
| 2-Person Families | 12,447 (56.9%) | $113,866 |
| 3-Person Families | 4,192 (19.2%) | $122,215 |
| 4-Person Families | 3,659 (16.7%) | $140,350 |
| 5-Person Families | 1,131 (5.2%) | $115,987 |
| 6-Person Families | 336 (1.5%) | $134,805 |
| 7+ Person Families | 94 (0.4%) | $150,714 |
| Total | 21,859 (100.0%) | $121,086 |
Family Income by Number of Earners in James City County
The median family income in James City County is $121,086, with families comprising 3+ earners (2,188) having the highest median family income of $159,630, while families with 1 earner (6,375) have the lowest median family income of $92,582, accounting for 10.0% and 29.2% of families, respectively.
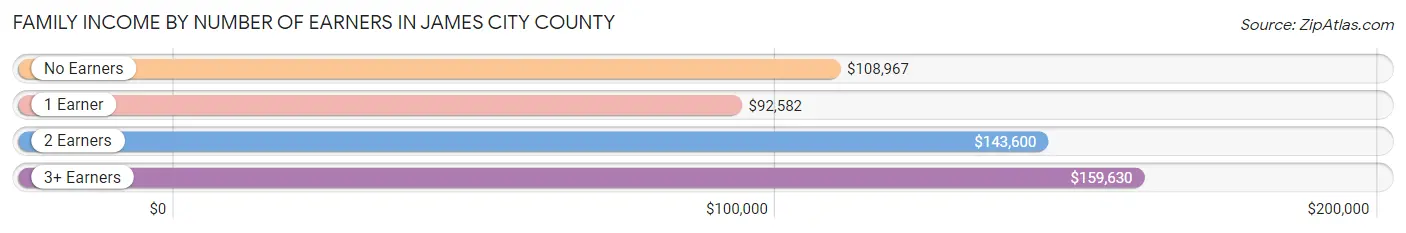
| Number of Earners | # Families | Median Income |
| No Earners | 4,977 (22.8%) | $108,967 |
| 1 Earner | 6,375 (29.2%) | $92,582 |
| 2 Earners | 8,319 (38.1%) | $143,600 |
| 3+ Earners | 2,188 (10.0%) | $159,630 |
| Total | 21,859 (100.0%) | $121,086 |
Household Income in James City County
Household Income Brackets in James City County
With 6,384 households falling in the category, the $100,000 to $149,999 income range is the most frequent in James City County, accounting for 20.8% of all households. In contrast, only 767 households (2.5%) fall into the $10,000 to $14,999 income bracket, making it the least populous group.
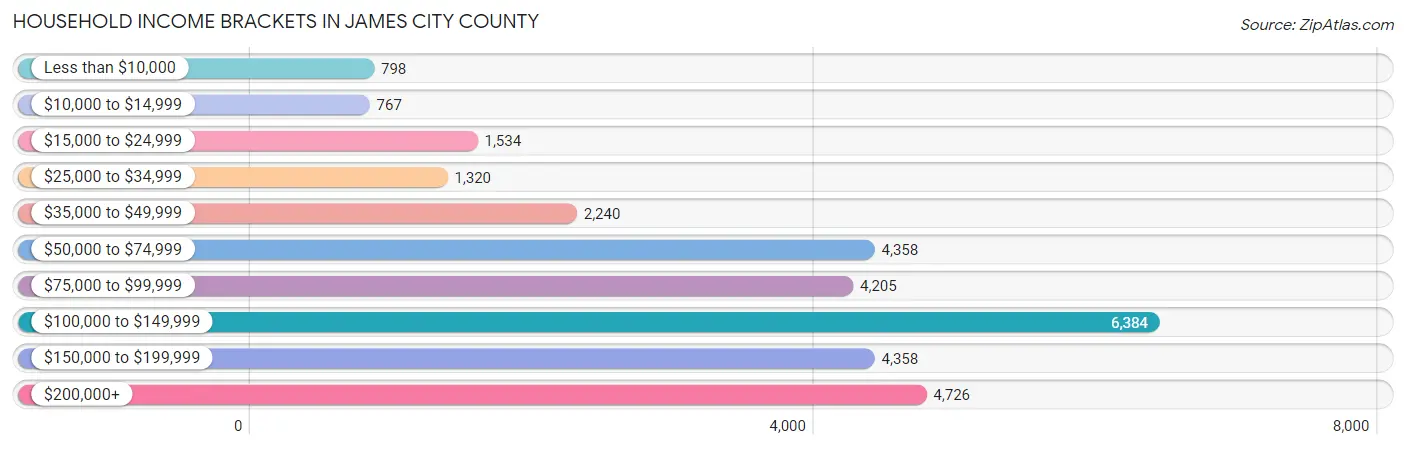
| Income Bracket | # Households | % Households |
| Less than $10,000 | 798 | 2.6% |
| $10,000 to $14,999 | 767 | 2.5% |
| $15,000 to $24,999 | 1,534 | 5.0% |
| $25,000 to $34,999 | 1,320 | 4.3% |
| $35,000 to $49,999 | 2,240 | 7.3% |
| $50,000 to $74,999 | 4,358 | 14.2% |
| $75,000 to $99,999 | 4,205 | 13.7% |
| $100,000 to $149,999 | 6,384 | 20.8% |
| $150,000 to $199,999 | 4,358 | 14.2% |
| $200,000+ | 4,726 | 15.4% |
Household Income by Householder Age in James City County
The median household income in James City County is $100,711, with the highest median household income of $128,264 found in the 45 to 64 years age bracket for the primary householder. A total of 11,273 households (36.7%) fall into this category. Meanwhile, the 15 to 24 years age bracket for the primary householder has the lowest median household income of $36,875, with 497 households (1.6%) in this group.
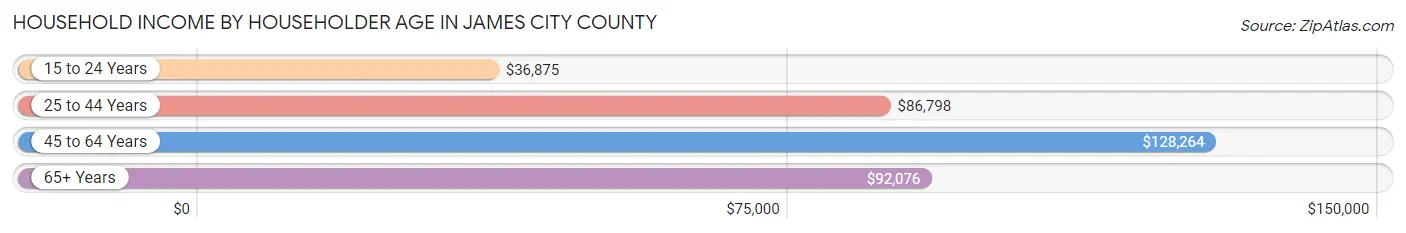
| Income Bracket | # Households | Median Income |
| 15 to 24 Years | 497 (1.6%) | $36,875 |
| 25 to 44 Years | 6,925 (22.6%) | $86,798 |
| 45 to 64 Years | 11,273 (36.7%) | $128,264 |
| 65+ Years | 11,995 (39.1%) | $92,076 |
| Total | 30,690 (100.0%) | $100,711 |
Poverty in James City County
Income Below Poverty by Sex and Age in James City County
With 6.7% poverty level for males and 7.8% for females among the residents of James City County, 5 year old males and 5 year old females are the most vulnerable to poverty, with 73 males (16.1%) and 62 females (22.6%) in their respective age groups living below the poverty level.
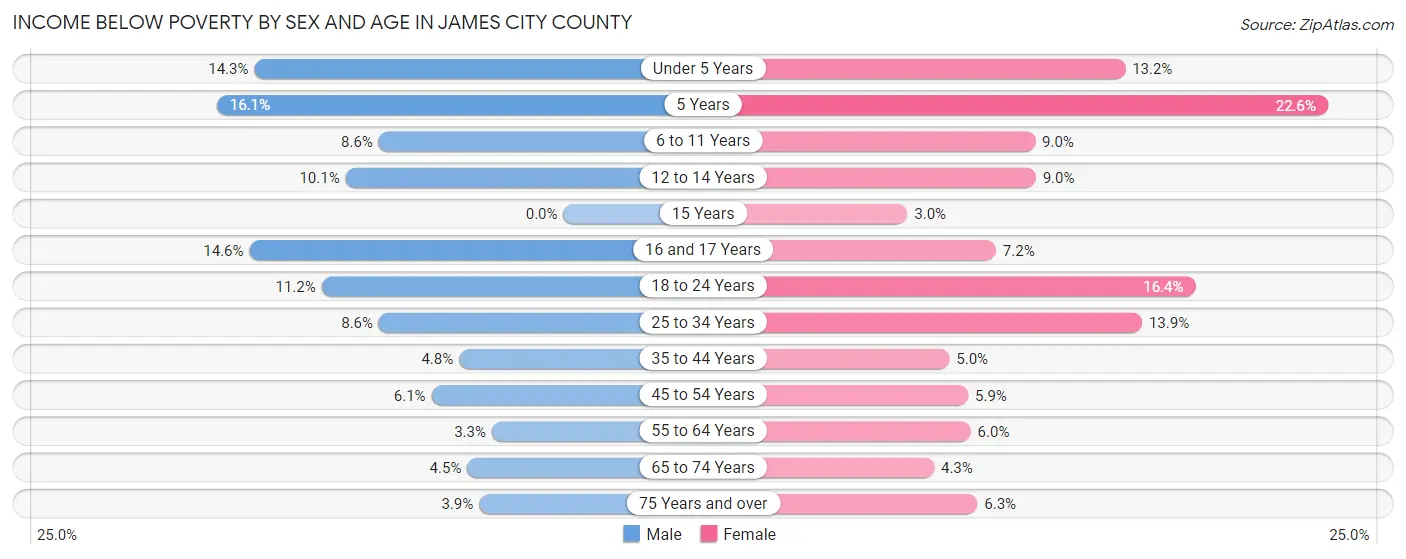
| Age Bracket | Male | Female |
| Under 5 Years | 284 (14.3%) | 245 (13.2%) |
| 5 Years | 73 (16.1%) | 62 (22.6%) |
| 6 to 11 Years | 194 (8.6%) | 238 (9.0%) |
| 12 to 14 Years | 174 (10.1%) | 120 (9.0%) |
| 15 Years | 0 (0.0%) | 17 (3.0%) |
| 16 and 17 Years | 123 (14.6%) | 61 (7.1%) |
| 18 to 24 Years | 323 (11.2%) | 476 (16.4%) |
| 25 to 34 Years | 316 (8.6%) | 482 (13.9%) |
| 35 to 44 Years | 204 (4.8%) | 228 (5.0%) |
| 45 to 54 Years | 287 (6.1%) | 283 (5.9%) |
| 55 to 64 Years | 171 (3.3%) | 351 (6.0%) |
| 65 to 74 Years | 230 (4.5%) | 267 (4.3%) |
| 75 Years and over | 153 (3.9%) | 313 (6.3%) |
| Total | 2,532 (6.7%) | 3,143 (7.8%) |
Income Above Poverty by Sex and Age in James City County
According to the poverty statistics in James City County, males aged 15 years and females aged 15 years are the age groups that are most secure financially, with 100.0% of males and 97.0% of females in these age groups living above the poverty line.
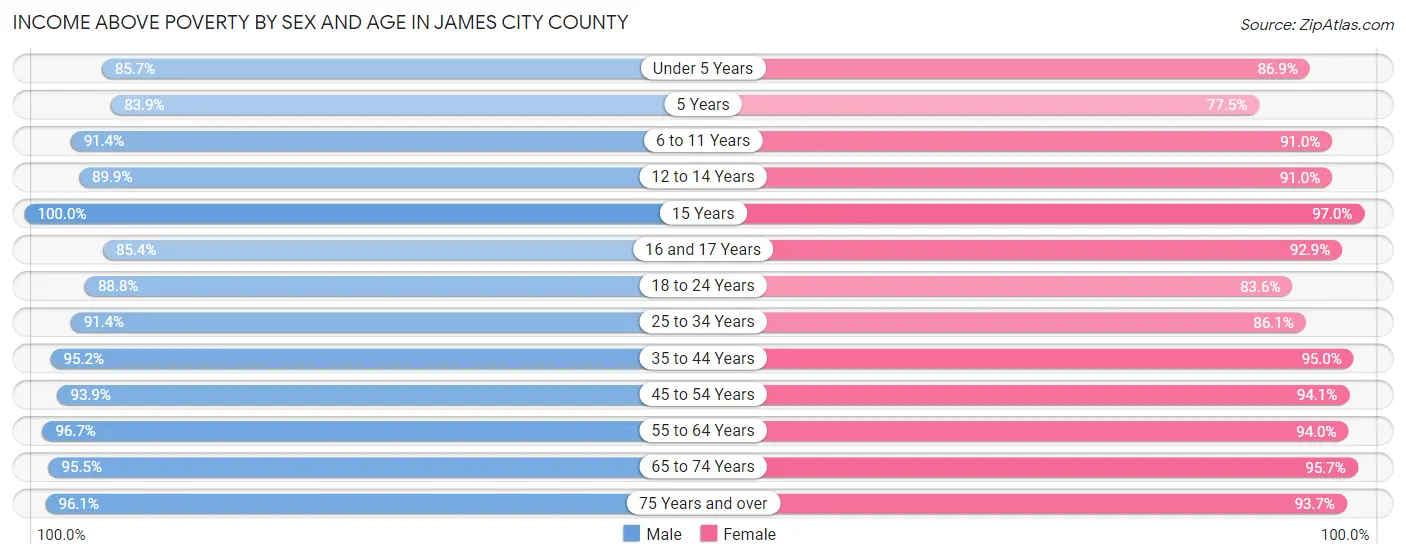
| Age Bracket | Male | Female |
| Under 5 Years | 1,697 (85.7%) | 1,618 (86.9%) |
| 5 Years | 381 (83.9%) | 213 (77.4%) |
| 6 to 11 Years | 2,069 (91.4%) | 2,414 (91.0%) |
| 12 to 14 Years | 1,547 (89.9%) | 1,213 (91.0%) |
| 15 Years | 618 (100.0%) | 542 (97.0%) |
| 16 and 17 Years | 721 (85.4%) | 792 (92.8%) |
| 18 to 24 Years | 2,555 (88.8%) | 2,426 (83.6%) |
| 25 to 34 Years | 3,377 (91.4%) | 2,978 (86.1%) |
| 35 to 44 Years | 4,010 (95.2%) | 4,340 (95.0%) |
| 45 to 54 Years | 4,401 (93.9%) | 4,549 (94.1%) |
| 55 to 64 Years | 4,974 (96.7%) | 5,519 (94.0%) |
| 65 to 74 Years | 4,924 (95.5%) | 5,973 (95.7%) |
| 75 Years and over | 3,765 (96.1%) | 4,661 (93.7%) |
| Total | 35,039 (93.3%) | 37,238 (92.2%) |
Income Below Poverty Among Married-Couple Families in James City County
The poverty statistics for married-couple families in James City County show that 2.0% or 355 of the total 17,789 families live below the poverty line. Families with 3 or 4 children have the highest poverty rate of 12.9%, comprising of 96 families. On the other hand, families with 5 or more children have the lowest poverty rate of 0.0%, which includes 0 families.
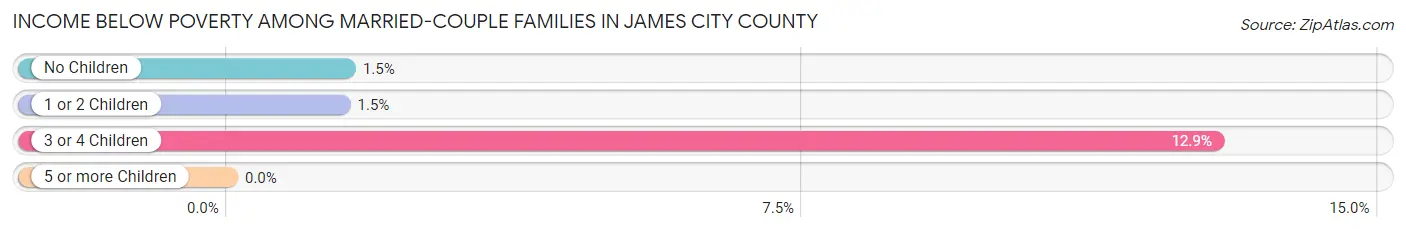
| Children | Above Poverty | Below Poverty |
| No Children | 11,856 (98.5%) | 186 (1.5%) |
| 1 or 2 Children | 4,901 (98.5%) | 73 (1.5%) |
| 3 or 4 Children | 650 (87.1%) | 96 (12.9%) |
| 5 or more Children | 27 (100.0%) | 0 (0.0%) |
| Total | 17,434 (98.0%) | 355 (2.0%) |
Income Below Poverty Among Single-Parent Households in James City County
According to the poverty data in James City County, 6.4% or 57 single-father households and 12.9% or 408 single-mother households are living below the poverty line. Among single-father households, those with no children have the highest poverty rate, with 28 households (8.9%) experiencing poverty. Likewise, among single-mother households, those with 3 or 4 children have the highest poverty rate, with 94 households (34.4%) falling below the poverty line.
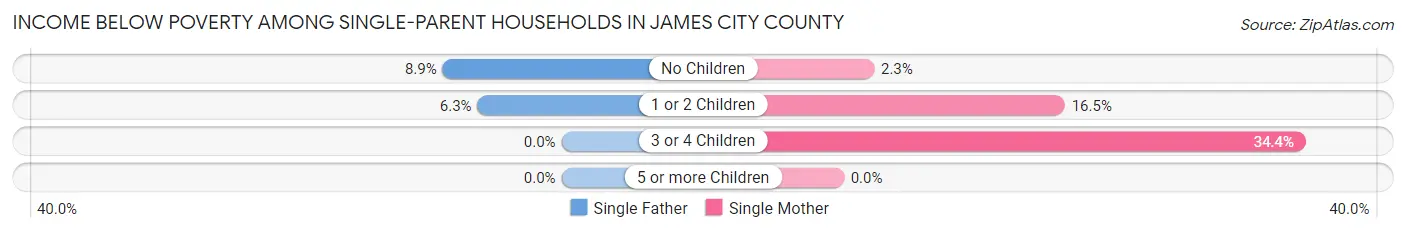
| Children | Single Father | Single Mother |
| No Children | 28 (8.9%) | 26 (2.3%) |
| 1 or 2 Children | 29 (6.3%) | 288 (16.5%) |
| 3 or 4 Children | 0 (0.0%) | 94 (34.4%) |
| 5 or more Children | 0 (0.0%) | 0 (0.0%) |
| Total | 57 (6.4%) | 408 (12.9%) |
Income Below Poverty Among Married-Couple vs Single-Parent Households in James City County
The poverty data for James City County shows that 355 of the married-couple family households (2.0%) and 465 of the single-parent households (11.4%) are living below the poverty level. Within the married-couple family households, those with 3 or 4 children have the highest poverty rate, with 96 households (12.9%) falling below the poverty line. Among the single-parent households, those with 3 or 4 children have the highest poverty rate, with 94 household (25.8%) living below poverty.
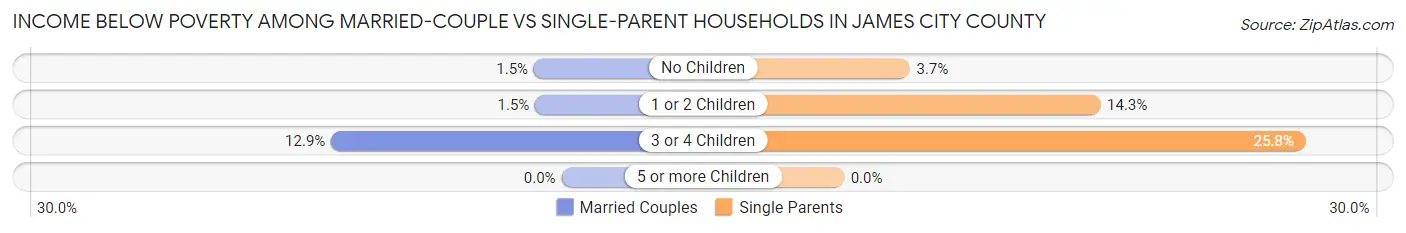
| Children | Married-Couple Families | Single-Parent Households |
| No Children | 186 (1.5%) | 54 (3.7%) |
| 1 or 2 Children | 73 (1.5%) | 317 (14.3%) |
| 3 or 4 Children | 96 (12.9%) | 94 (25.8%) |
| 5 or more Children | 0 (0.0%) | 0 (0.0%) |
| Total | 355 (2.0%) | 465 (11.4%) |
Race in James City County
The most populous races in James City County are White / Caucasian (59,872 | 76.0%), Black / African American (9,956 | 12.6%), and Two or more Races (5,552 | 7.0%).
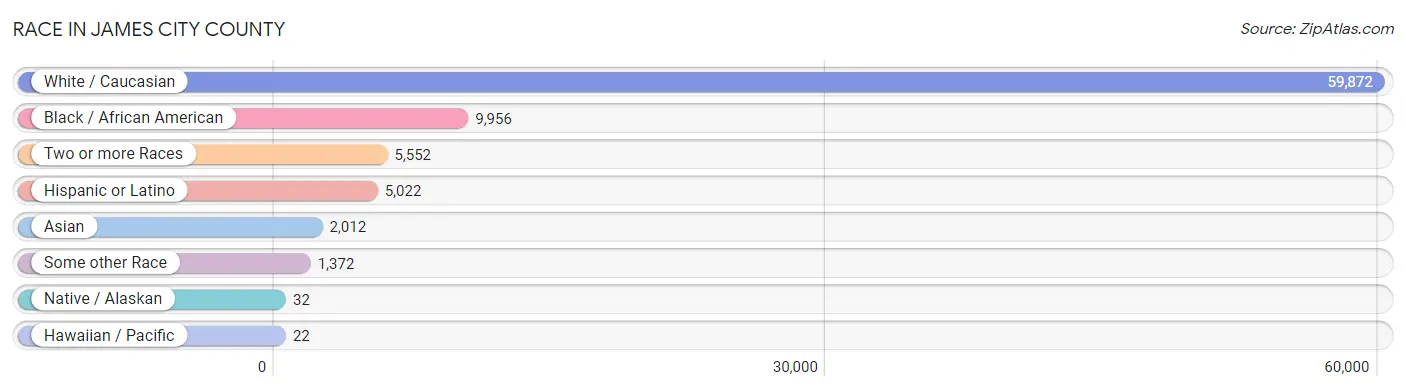
| Race | # Population | % Population |
| Asian | 2,012 | 2.5% |
| Black / African American | 9,956 | 12.6% |
| Hawaiian / Pacific | 22 | 0.0% |
| Hispanic or Latino | 5,022 | 6.4% |
| Native / Alaskan | 32 | 0.0% |
| White / Caucasian | 59,872 | 76.0% |
| Two or more Races | 5,552 | 7.0% |
| Some other Race | 1,372 | 1.7% |
| Total | 78,818 | 100.0% |
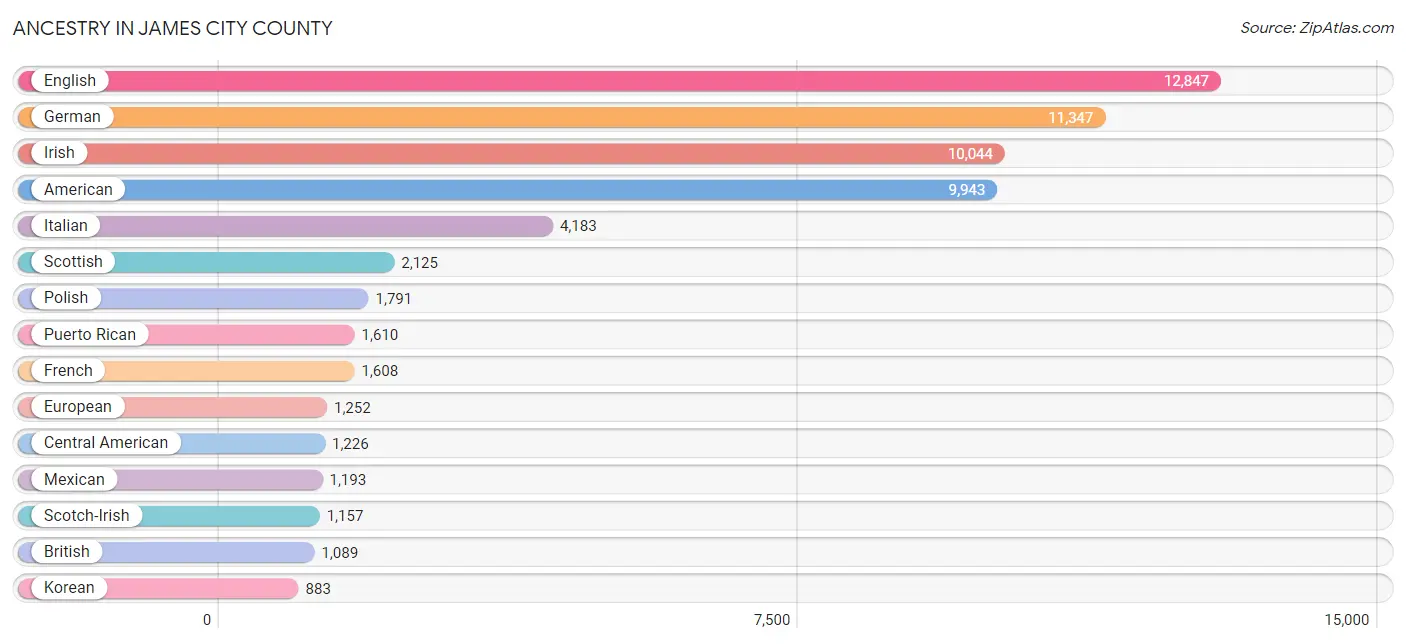
Ancestry in James City County
The most populous ancestries reported in James City County are English (12,847 | 16.3%), German (11,347 | 14.4%), Irish (10,044 | 12.7%), American (9,943 | 12.6%), and Italian (4,183 | 5.3%), together accounting for 61.4% of all James City County residents.
| Ancestry | # Population | % Population |
| Afghan | 40 | 0.1% |
| African | 366 | 0.5% |
| Alsatian | 14 | 0.0% |
| American | 9,943 | 12.6% |
| Arab | 286 | 0.4% |
| Argentinean | 91 | 0.1% |
| Armenian | 68 | 0.1% |
| Australian | 56 | 0.1% |
| Austrian | 252 | 0.3% |
| Basque | 16 | 0.0% |
| Belgian | 18 | 0.0% |
| Bermudan | 46 | 0.1% |
| Bhutanese | 290 | 0.4% |
| Blackfeet | 34 | 0.0% |
| British | 1,089 | 1.4% |
| Bulgarian | 23 | 0.0% |
| Burmese | 422 | 0.5% |
| Cajun | 31 | 0.0% |
| Canadian | 68 | 0.1% |
| Central American | 1,226 | 1.6% |
| Central American Indian | 4 | 0.0% |
| Cherokee | 76 | 0.1% |
| Colombian | 257 | 0.3% |
| Croatian | 54 | 0.1% |
| Cuban | 118 | 0.2% |
| Czech | 253 | 0.3% |
| Czechoslovakian | 51 | 0.1% |
| Danish | 399 | 0.5% |
| Dominican | 63 | 0.1% |
| Dutch | 474 | 0.6% |
| Eastern European | 448 | 0.6% |
| Egyptian | 73 | 0.1% |
| English | 12,847 | 16.3% |
| Ethiopian | 26 | 0.0% |
| European | 1,252 | 1.6% |
| Finnish | 49 | 0.1% |
| French | 1,608 | 2.0% |
| French Canadian | 509 | 0.6% |
| German | 11,347 | 14.4% |
| Greek | 290 | 0.4% |
| Guamanian / Chamorro | 77 | 0.1% |
| Guatemalan | 272 | 0.4% |
| Guyanese | 42 | 0.1% |
| Haitian | 7 | 0.0% |
| Honduran | 109 | 0.1% |
| Hungarian | 301 | 0.4% |
| Icelander | 30 | 0.0% |
| Indian (Asian) | 795 | 1.0% |
| Irish | 10,044 | 12.7% |
| Israeli | 13 | 0.0% |
| Italian | 4,183 | 5.3% |
| Jamaican | 346 | 0.4% |
| Japanese | 124 | 0.2% |
| Korean | 883 | 1.1% |
| Latvian | 54 | 0.1% |
| Lebanese | 55 | 0.1% |
| Lithuanian | 127 | 0.2% |
| Macedonian | 20 | 0.0% |
| Mexican | 1,193 | 1.5% |
| Mexican American Indian | 20 | 0.0% |
| Moroccan | 30 | 0.0% |
| Native Hawaiian | 140 | 0.2% |
| Nicaraguan | 146 | 0.2% |
| Nigerian | 55 | 0.1% |
| Northern European | 283 | 0.4% |
| Norwegian | 591 | 0.7% |
| Pakistani | 36 | 0.1% |
| Palestinian | 13 | 0.0% |
| Panamanian | 61 | 0.1% |
| Pennsylvania German | 12 | 0.0% |
| Peruvian | 36 | 0.1% |
| Polish | 1,791 | 2.3% |
| Portuguese | 247 | 0.3% |
| Potawatomi | 203 | 0.3% |
| Pueblo | 14 | 0.0% |
| Puerto Rican | 1,610 | 2.0% |
| Romanian | 74 | 0.1% |
| Russian | 785 | 1.0% |
| Salvadoran | 638 | 0.8% |
| Scandinavian | 253 | 0.3% |
| Scotch-Irish | 1,157 | 1.5% |
| Scottish | 2,125 | 2.7% |
| Serbian | 62 | 0.1% |
| Slavic | 42 | 0.1% |
| Slovak | 273 | 0.4% |
| Slovene | 34 | 0.0% |
| South African | 7 | 0.0% |
| South American | 515 | 0.6% |
| Spaniard | 126 | 0.2% |
| Spanish | 87 | 0.1% |
| Sri Lankan | 180 | 0.2% |
| Subsaharan African | 454 | 0.6% |
| Swedish | 738 | 0.9% |
| Swiss | 108 | 0.1% |
| Syrian | 42 | 0.1% |
| Thai | 182 | 0.2% |
| Turkish | 140 | 0.2% |
| Ukrainian | 306 | 0.4% |
| Ute | 34 | 0.0% |
| Venezuelan | 131 | 0.2% |
| Vietnamese | 15 | 0.0% |
| Welsh | 865 | 1.1% | View All 102 Rows |
Immigrants in James City County
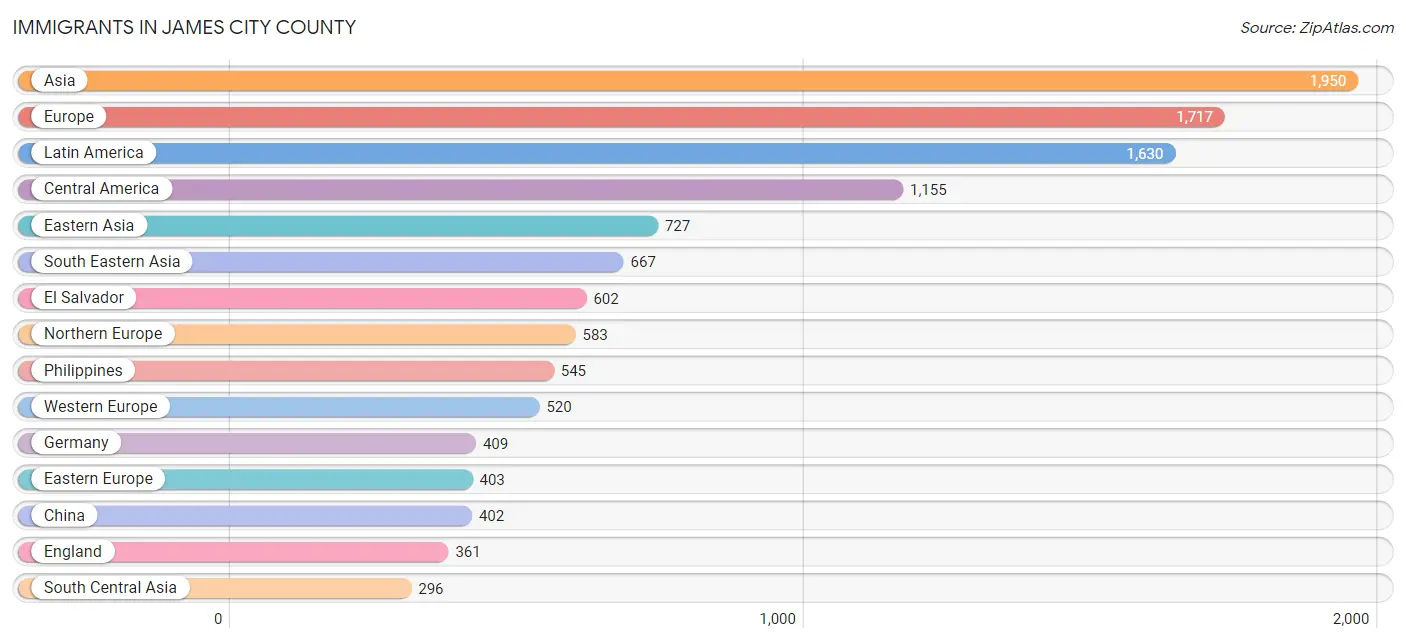
The most numerous immigrant groups reported in James City County came from Asia (1,950 | 2.5%), Europe (1,717 | 2.2%), Latin America (1,630 | 2.1%), Central America (1,155 | 1.5%), and Eastern Asia (727 | 0.9%), together accounting for 9.1% of all James City County residents.
| Immigration Origin | # Population | % Population |
| Afghanistan | 26 | 0.0% |
| Africa | 76 | 0.1% |
| Argentina | 36 | 0.1% |
| Asia | 1,950 | 2.5% |
| Australia | 32 | 0.0% |
| Austria | 14 | 0.0% |
| Bangladesh | 15 | 0.0% |
| Canada | 128 | 0.2% |
| Caribbean | 212 | 0.3% |
| Central America | 1,155 | 1.5% |
| China | 402 | 0.5% |
| Colombia | 28 | 0.0% |
| Czechoslovakia | 47 | 0.1% |
| Eastern Africa | 32 | 0.0% |
| Eastern Asia | 727 | 0.9% |
| Eastern Europe | 403 | 0.5% |
| El Salvador | 602 | 0.8% |
| England | 361 | 0.5% |
| Ethiopia | 32 | 0.0% |
| Europe | 1,717 | 2.2% |
| France | 44 | 0.1% |
| Germany | 409 | 0.5% |
| Greece | 87 | 0.1% |
| Guatemala | 126 | 0.2% |
| Guyana | 42 | 0.1% |
| Haiti | 7 | 0.0% |
| Honduras | 67 | 0.1% |
| Hungary | 8 | 0.0% |
| India | 110 | 0.1% |
| Iraq | 30 | 0.0% |
| Ireland | 21 | 0.0% |
| Italy | 50 | 0.1% |
| Jamaica | 196 | 0.3% |
| Japan | 161 | 0.2% |
| Kazakhstan | 106 | 0.1% |
| Korea | 164 | 0.2% |
| Kuwait | 17 | 0.0% |
| Latin America | 1,630 | 2.1% |
| Malaysia | 7 | 0.0% |
| Mexico | 262 | 0.3% |
| Morocco | 22 | 0.0% |
| Nepal | 21 | 0.0% |
| Nicaragua | 59 | 0.1% |
| Northern Africa | 22 | 0.0% |
| Northern Europe | 583 | 0.7% |
| Oceania | 32 | 0.0% |
| Pakistan | 3 | 0.0% |
| Panama | 39 | 0.1% |
| Peru | 7 | 0.0% |
| Philippines | 545 | 0.7% |
| Poland | 63 | 0.1% |
| Portugal | 59 | 0.1% |
| Romania | 68 | 0.1% |
| Russia | 158 | 0.2% |
| Saudi Arabia | 51 | 0.1% |
| Scotland | 60 | 0.1% |
| Senegal | 22 | 0.0% |
| Serbia | 9 | 0.0% |
| South America | 263 | 0.3% |
| South Central Asia | 296 | 0.4% |
| South Eastern Asia | 667 | 0.9% |
| Southern Europe | 204 | 0.3% |
| Spain | 8 | 0.0% |
| Sri Lanka | 8 | 0.0% |
| Sweden | 4 | 0.0% |
| Switzerland | 53 | 0.1% |
| Syria | 29 | 0.0% |
| Thailand | 13 | 0.0% |
| Turkey | 133 | 0.2% |
| Ukraine | 37 | 0.1% |
| Uzbekistan | 7 | 0.0% |
| Venezuela | 150 | 0.2% |
| Vietnam | 102 | 0.1% |
| Western Africa | 22 | 0.0% |
| Western Asia | 260 | 0.3% |
| Western Europe | 520 | 0.7% | View All 76 Rows |
Sex and Age in James City County
Sex and Age in James City County
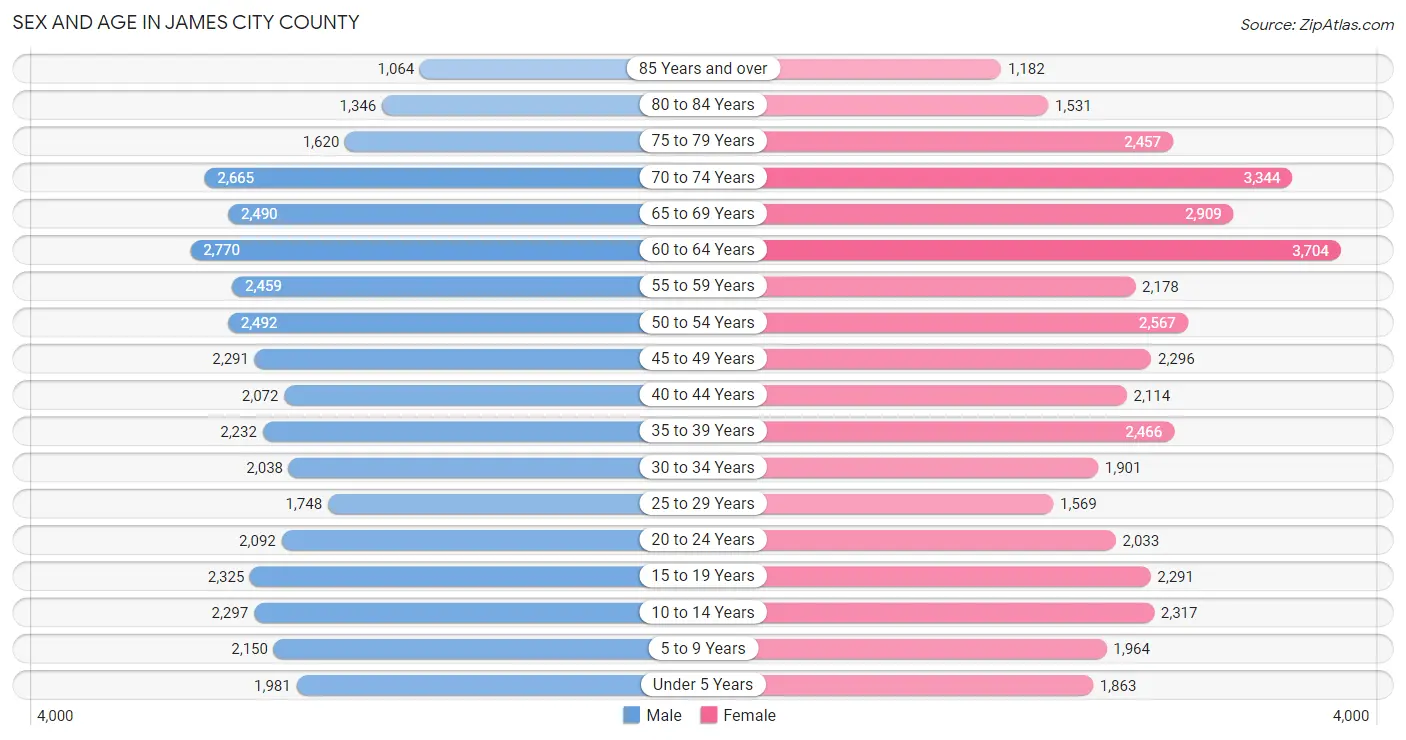
The most populous age groups in James City County are 60 to 64 Years (2,770 | 7.3%) for men and 60 to 64 Years (3,704 | 9.1%) for women.
| Age Bracket | Male | Female |
| Under 5 Years | 1,981 (5.2%) | 1,863 (4.6%) |
| 5 to 9 Years | 2,150 (5.6%) | 1,964 (4.8%) |
| 10 to 14 Years | 2,297 (6.0%) | 2,317 (5.7%) |
| 15 to 19 Years | 2,325 (6.1%) | 2,291 (5.6%) |
| 20 to 24 Years | 2,092 (5.5%) | 2,033 (5.0%) |
| 25 to 29 Years | 1,748 (4.6%) | 1,569 (3.9%) |
| 30 to 34 Years | 2,038 (5.3%) | 1,901 (4.7%) |
| 35 to 39 Years | 2,232 (5.9%) | 2,466 (6.1%) |
| 40 to 44 Years | 2,072 (5.4%) | 2,114 (5.2%) |
| 45 to 49 Years | 2,291 (6.0%) | 2,296 (5.6%) |
| 50 to 54 Years | 2,492 (6.5%) | 2,567 (6.3%) |
| 55 to 59 Years | 2,459 (6.5%) | 2,178 (5.3%) |
| 60 to 64 Years | 2,770 (7.3%) | 3,704 (9.1%) |
| 65 to 69 Years | 2,490 (6.5%) | 2,909 (7.1%) |
| 70 to 74 Years | 2,665 (7.0%) | 3,344 (8.2%) |
| 75 to 79 Years | 1,620 (4.3%) | 2,457 (6.0%) |
| 80 to 84 Years | 1,346 (3.5%) | 1,531 (3.8%) |
| 85 Years and over | 1,064 (2.8%) | 1,182 (2.9%) |
| Total | 38,132 (100.0%) | 40,686 (100.0%) |
Families and Households in James City County
Median Family Size in James City County
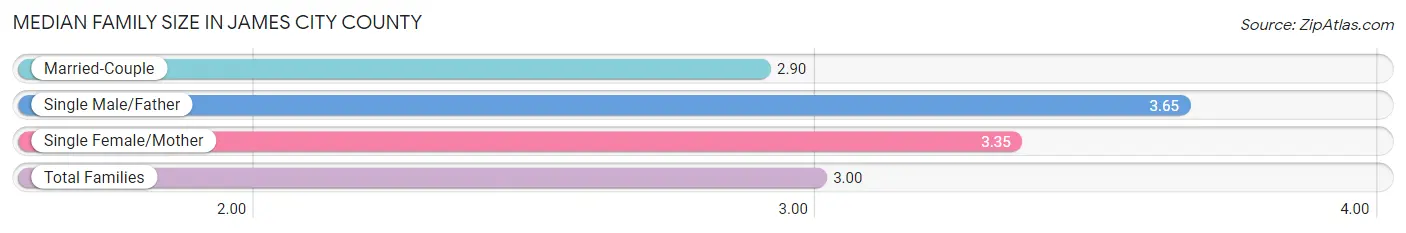
The median family size in James City County is 3.00 persons per family, with single male/father families (898 | 4.1%) accounting for the largest median family size of 3.65 persons per family. On the other hand, married-couple families (17,789 | 81.4%) represent the smallest median family size with 2.90 persons per family.
| Family Type | # Families | Family Size |
| Married-Couple | 17,789 (81.4%) | 2.90 |
| Single Male/Father | 898 (4.1%) | 3.65 |
| Single Female/Mother | 3,172 (14.5%) | 3.35 |
| Total Families | 21,859 (100.0%) | 3.00 |
Median Household Size in James City County
The median household size in James City County is 2.53 persons per household, with single male/father households (898 | 2.9%) accounting for the largest median household size of 4.08 persons per household. non-family households (8,831 | 28.8%) represent the smallest median household size with 1.20 persons per household.

| Household Type | # Households | Household Size |
| Married-Couple | 17,789 (58.0%) | 2.91 |
| Single Male/Father | 898 (2.9%) | 4.08 |
| Single Female/Mother | 3,172 (10.3%) | 3.68 |
| Non-family | 8,831 (28.8%) | 1.20 |
| Total Households | 30,690 (100.0%) | 2.53 |
Household Size by Marriage Status in James City County
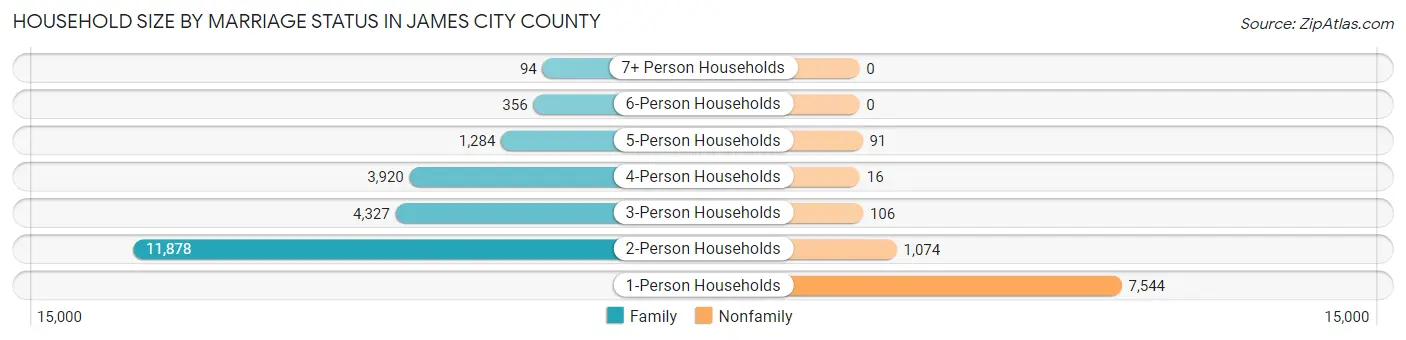
Out of a total of 30,690 households in James City County, 21,859 (71.2%) are family households, while 8,831 (28.8%) are nonfamily households. The most numerous type of family households are 2-person households, comprising 11,878, and the most common type of nonfamily households are 1-person households, comprising 7,544.
| Household Size | Family Households | Nonfamily Households |
| 1-Person Households | - | 7,544 (24.6%) |
| 2-Person Households | 11,878 (38.7%) | 1,074 (3.5%) |
| 3-Person Households | 4,327 (14.1%) | 106 (0.4%) |
| 4-Person Households | 3,920 (12.8%) | 16 (0.1%) |
| 5-Person Households | 1,284 (4.2%) | 91 (0.3%) |
| 6-Person Households | 356 (1.2%) | 0 (0.0%) |
| 7+ Person Households | 94 (0.3%) | 0 (0.0%) |
| Total | 21,859 (71.2%) | 8,831 (28.8%) |
Female Fertility in James City County
Fertility by Age in James City County
Average fertility rate in James City County is 46.0 births per 1,000 women. Women in the age bracket of 20 to 34 years have the highest fertility rate with 84.0 births per 1,000 women. Women in the age bracket of 20 to 34 years acount for 66.8% of all women with births.
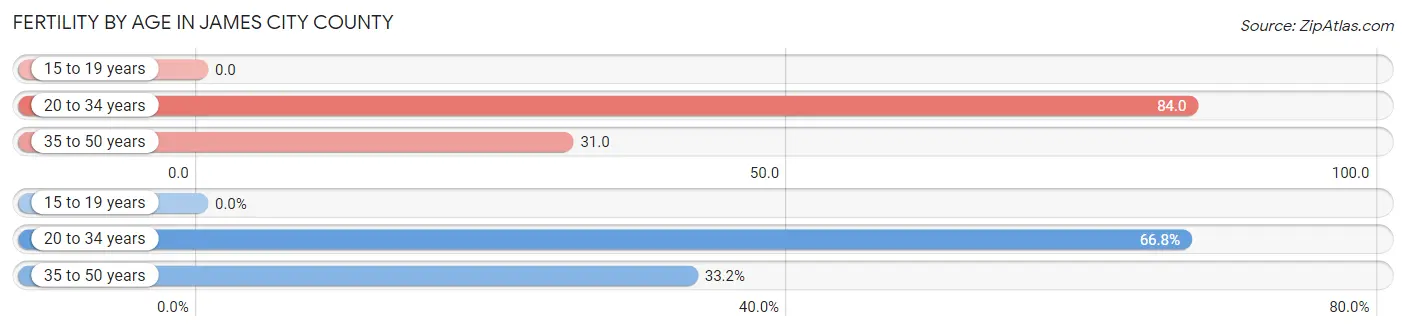
| Age Bracket | Women with Births | Births / 1,000 Women |
| 15 to 19 years | 0 (0.0%) | 0.0 |
| 20 to 34 years | 462 (66.8%) | 84.0 |
| 35 to 50 years | 230 (33.2%) | 31.0 |
| Total | 692 (100.0%) | 46.0 |
Fertility by Age by Marriage Status in James City County
62.9% of women with births (692) in James City County are married. The highest percentage of unmarried women with births falls into 35 to 50 years age bracket with 47.8% of them unmarried at the time of birth, while the lowest percentage of unmarried women with births belong to 20 to 34 years age bracket with 31.8% of them unmarried.
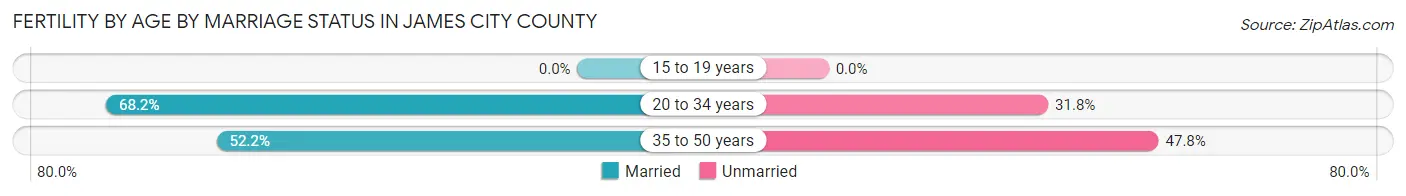
| Age Bracket | Married | Unmarried |
| 15 to 19 years | 0 (0.0%) | 0 (0.0%) |
| 20 to 34 years | 315 (68.2%) | 147 (31.8%) |
| 35 to 50 years | 120 (52.2%) | 110 (47.8%) |
| Total | 435 (62.9%) | 257 (37.1%) |
Fertility by Education in James City County
Average fertility rate in James City County is 46.0 births per 1,000 women. Women with the education attainment of bachelor's degree have the highest fertility rate of 65.0 births per 1,000 women, while women with the education attainment of less than high school have the lowest fertility at 26.0 births per 1,000 women. Women with the education attainment of bachelor's degree represent 28.6% of all women with births.
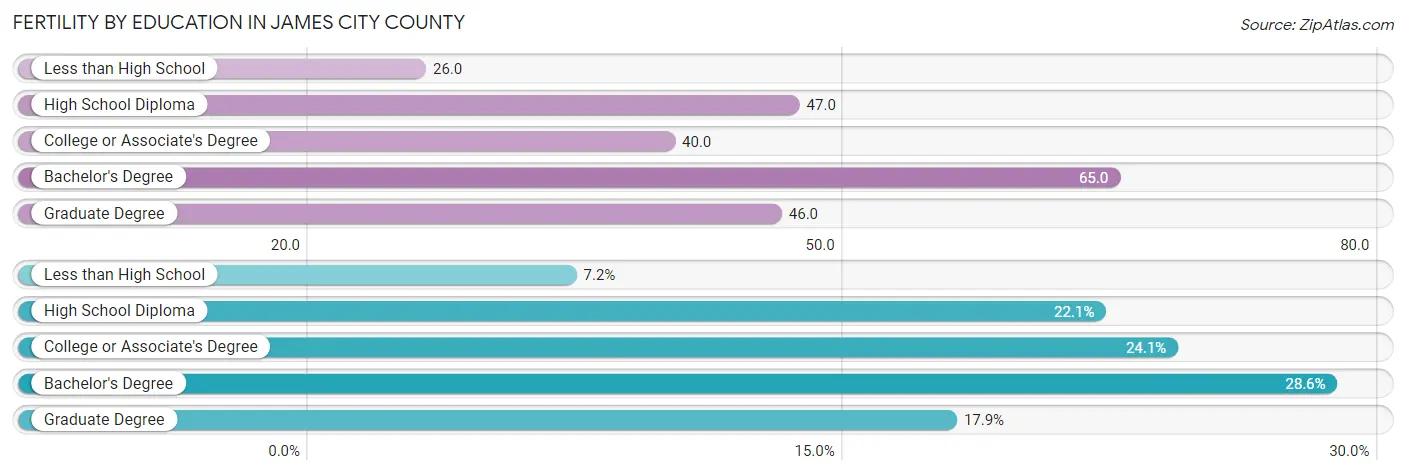
| Educational Attainment | Women with Births | Births / 1,000 Women |
| Less than High School | 50 (7.2%) | 26.0 |
| High School Diploma | 153 (22.1%) | 47.0 |
| College or Associate's Degree | 167 (24.1%) | 40.0 |
| Bachelor's Degree | 198 (28.6%) | 65.0 |
| Graduate Degree | 124 (17.9%) | 46.0 |
| Total | 692 (100.0%) | 46.0 |
Fertility by Education by Marriage Status in James City County
37.1% of women with births in James City County are unmarried. Women with the educational attainment of graduate degree are most likely to be married with 100.0% of them married at childbirth, while women with the educational attainment of high school diploma are least likely to be married with 52.3% of them unmarried at childbirth.
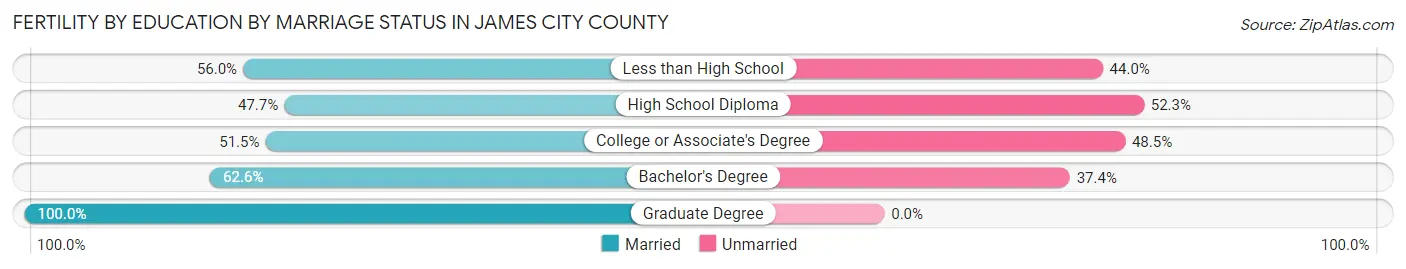
| Educational Attainment | Married | Unmarried |
| Less than High School | 28 (56.0%) | 22 (44.0%) |
| High School Diploma | 73 (47.7%) | 80 (52.3%) |
| College or Associate's Degree | 86 (51.5%) | 81 (48.5%) |
| Bachelor's Degree | 124 (62.6%) | 74 (37.4%) |
| Graduate Degree | 124 (100.0%) | 0 (0.0%) |
| Total | 435 (62.9%) | 257 (37.1%) |
Employment Characteristics in James City County
Employment by Class of Employer in James City County
Among the 35,330 employed individuals in James City County, private company employees (20,125 | 57.0%), federal government employees (3,415 | 9.7%), and local government employees (3,190 | 9.0%) make up the most common classes of employment.
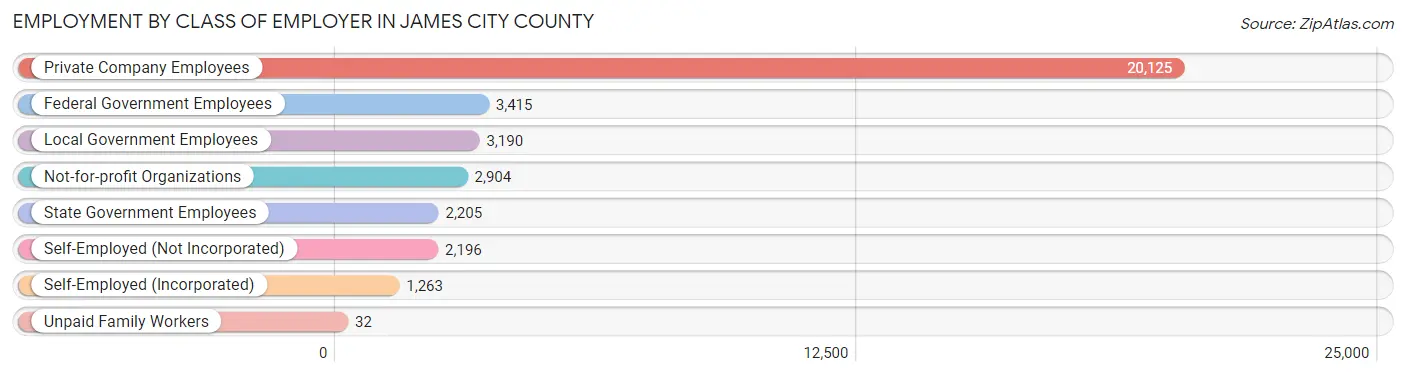
| Employer Class | # Employees | % Employees |
| Private Company Employees | 20,125 | 57.0% |
| Self-Employed (Incorporated) | 1,263 | 3.6% |
| Self-Employed (Not Incorporated) | 2,196 | 6.2% |
| Not-for-profit Organizations | 2,904 | 8.2% |
| Local Government Employees | 3,190 | 9.0% |
| State Government Employees | 2,205 | 6.2% |
| Federal Government Employees | 3,415 | 9.7% |
| Unpaid Family Workers | 32 | 0.1% |
| Total | 35,330 | 100.0% |
Employment Status by Age in James City County
According to the labor force statistics for James City County, out of the total population over 16 years of age (65,069), 57.2% or 37,219 individuals are in the labor force, with 3.7% or 1,377 of them unemployed. The age group with the highest labor force participation rate is 35 to 44 years, with 86.1% or 7,649 individuals in the labor force. Within the labor force, the 65 to 74 years age range has the highest percentage of unemployed individuals, with 8.3% or 204 of them being unemployed.
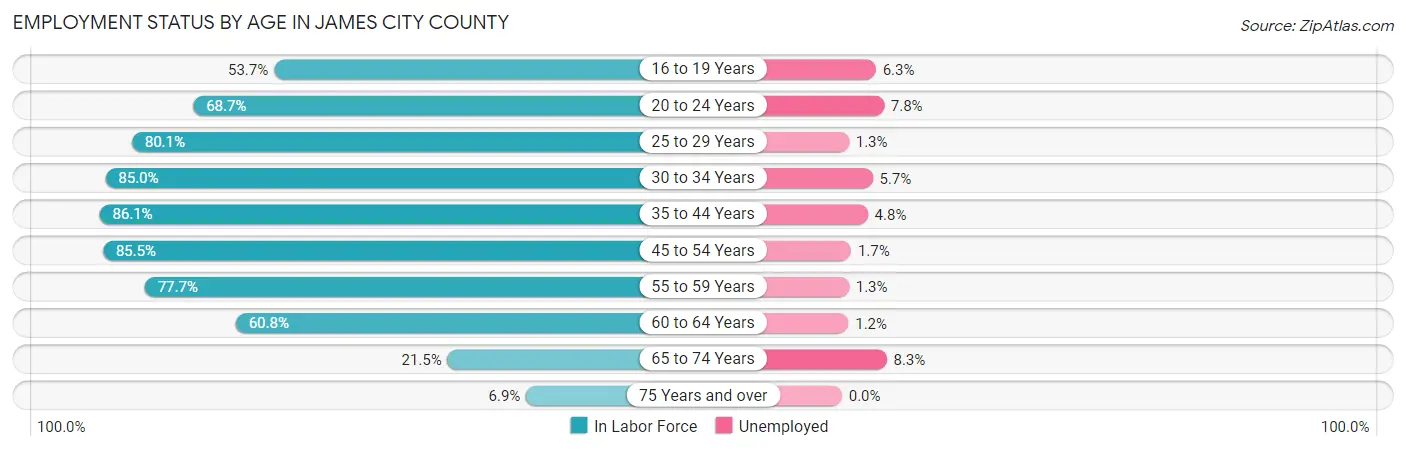
| Age Bracket | In Labor Force | Unemployed |
| 16 to 19 Years | 1,847 (53.7%) | 116 (6.3%) |
| 20 to 24 Years | 2,834 (68.7%) | 221 (7.8%) |
| 25 to 29 Years | 2,657 (80.1%) | 35 (1.3%) |
| 30 to 34 Years | 3,348 (85.0%) | 191 (5.7%) |
| 35 to 44 Years | 7,649 (86.1%) | 367 (4.8%) |
| 45 to 54 Years | 8,247 (85.5%) | 140 (1.7%) |
| 55 to 59 Years | 3,603 (77.7%) | 47 (1.3%) |
| 60 to 64 Years | 3,936 (60.8%) | 47 (1.2%) |
| 65 to 74 Years | 2,453 (21.5%) | 204 (8.3%) |
| 75 Years and over | 635 (6.9%) | 0 (0.0%) |
| Total | 37,219 (57.2%) | 1,377 (3.7%) |
Employment Status by Educational Attainment in James City County
According to labor force statistics for James City County, 79.8% of individuals (29,444) out of the total population between 25 and 64 years of age (36,897) are in the labor force, with 2.8% or 824 of them being unemployed. The group with the highest labor force participation rate are those with the educational attainment of bachelor's degree or higher, with 84.5% or 14,823 individuals in the labor force. Within the labor force, individuals with college / associate degree education have the highest percentage of unemployment, with 4.0% or 324 of them being unemployed.
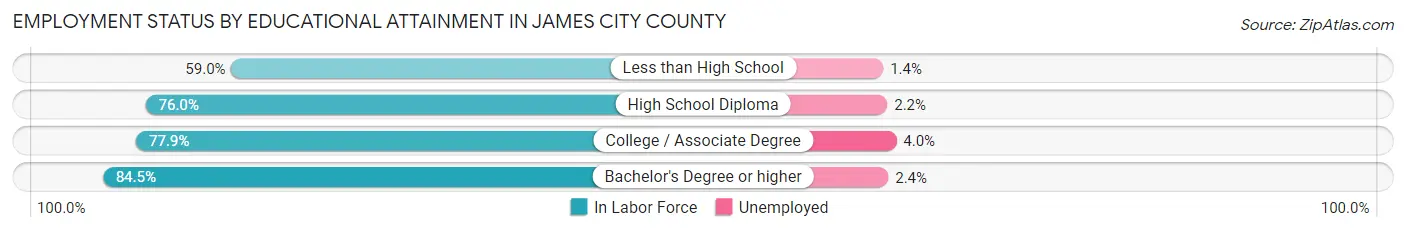
| Educational Attainment | In Labor Force | Unemployed |
| Less than High School | 1,001 (59.0%) | 24 (1.4%) |
| High School Diploma | 5,524 (76.0%) | 160 (2.2%) |
| College / Associate Degree | 8,094 (77.9%) | 416 (4.0%) |
| Bachelor's Degree or higher | 14,823 (84.5%) | 421 (2.4%) |
| Total | 29,444 (79.8%) | 1,033 (2.8%) |
Employment Occupations by Sex in James City County
Management, Business, Science and Arts Occupations
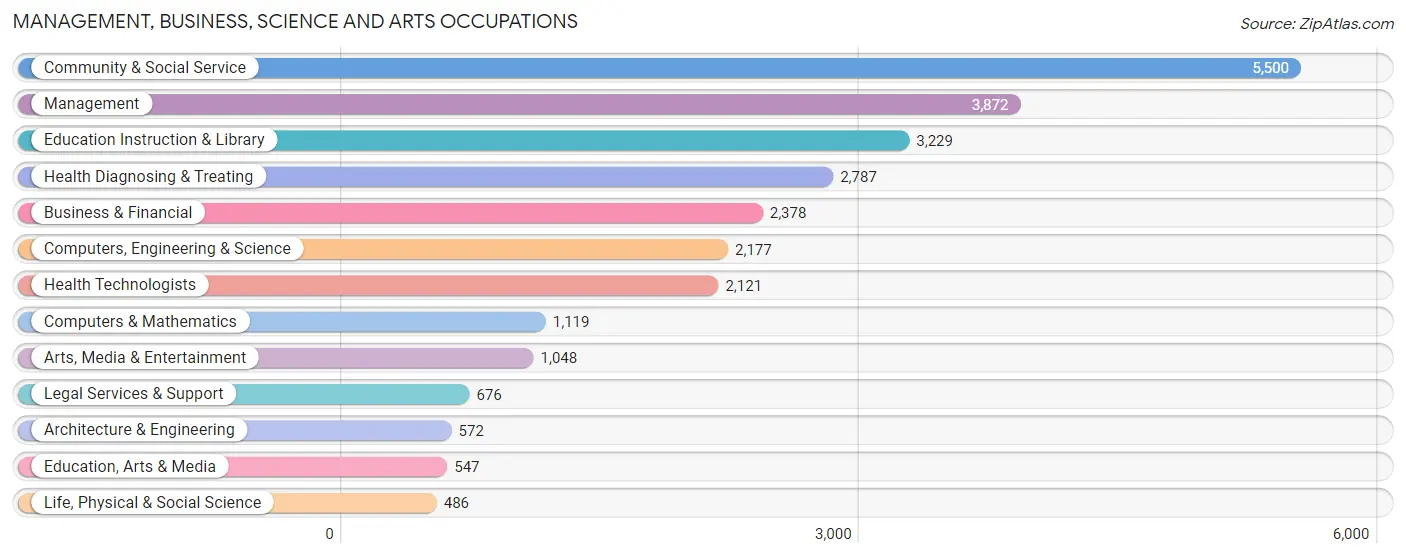
The most common Management, Business, Science and Arts occupations in James City County are Community & Social Service (5,500 | 15.8%), Management (3,872 | 11.1%), Education Instruction & Library (3,229 | 9.3%), Health Diagnosing & Treating (2,787 | 8.0%), and Business & Financial (2,378 | 6.8%).
Management, Business, Science and Arts Occupations by Sex
Within the Management, Business, Science and Arts occupations in James City County, the most male-oriented occupations are Architecture & Engineering (93.4%), Computers, Engineering & Science (74.1%), and Management (68.9%), while the most female-oriented occupations are Health Diagnosing & Treating (76.3%), Health Technologists (71.4%), and Education Instruction & Library (67.5%).
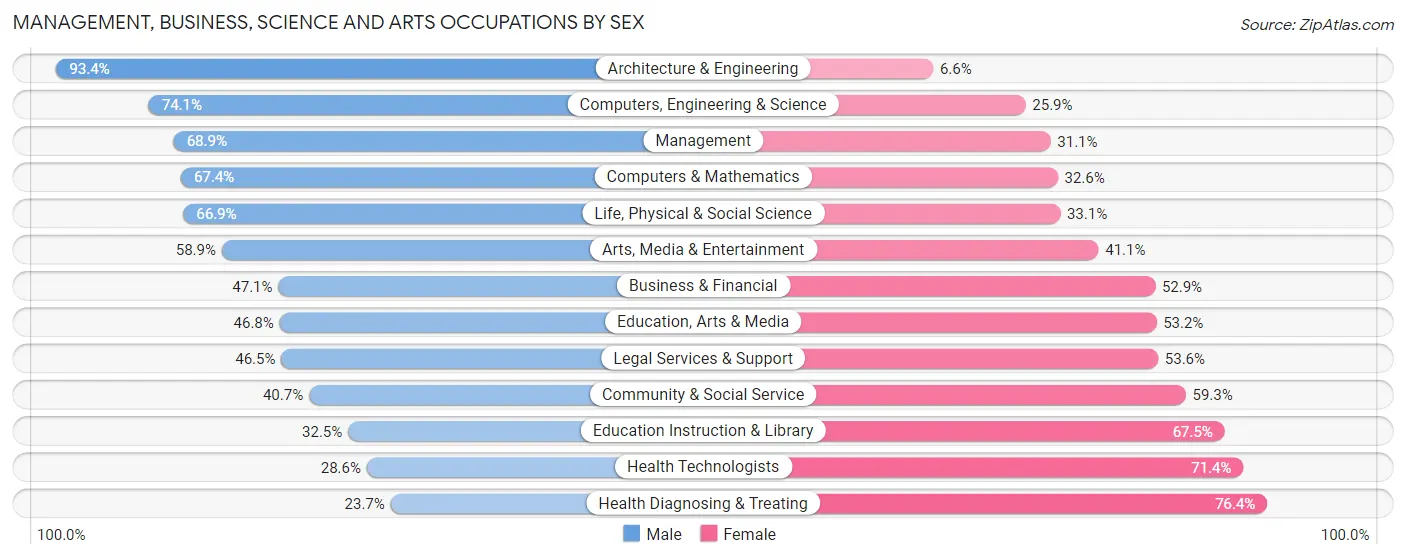
| Occupation | Male | Female |
| Management | 2,667 (68.9%) | 1,205 (31.1%) |
| Business & Financial | 1,119 (47.1%) | 1,259 (52.9%) |
| Computers, Engineering & Science | 1,613 (74.1%) | 564 (25.9%) |
| Computers & Mathematics | 754 (67.4%) | 365 (32.6%) |
| Architecture & Engineering | 534 (93.4%) | 38 (6.6%) |
| Life, Physical & Social Science | 325 (66.9%) | 161 (33.1%) |
| Community & Social Service | 2,237 (40.7%) | 3,263 (59.3%) |
| Education, Arts & Media | 256 (46.8%) | 291 (53.2%) |
| Legal Services & Support | 314 (46.5%) | 362 (53.5%) |
| Education Instruction & Library | 1,050 (32.5%) | 2,179 (67.5%) |
| Arts, Media & Entertainment | 617 (58.9%) | 431 (41.1%) |
| Health Diagnosing & Treating | 659 (23.6%) | 2,128 (76.3%) |
| Health Technologists | 607 (28.6%) | 1,514 (71.4%) |
| Total (Category) | 8,295 (49.6%) | 8,419 (50.4%) |
| Total (Overall) | 18,016 (51.8%) | 16,744 (48.2%) |
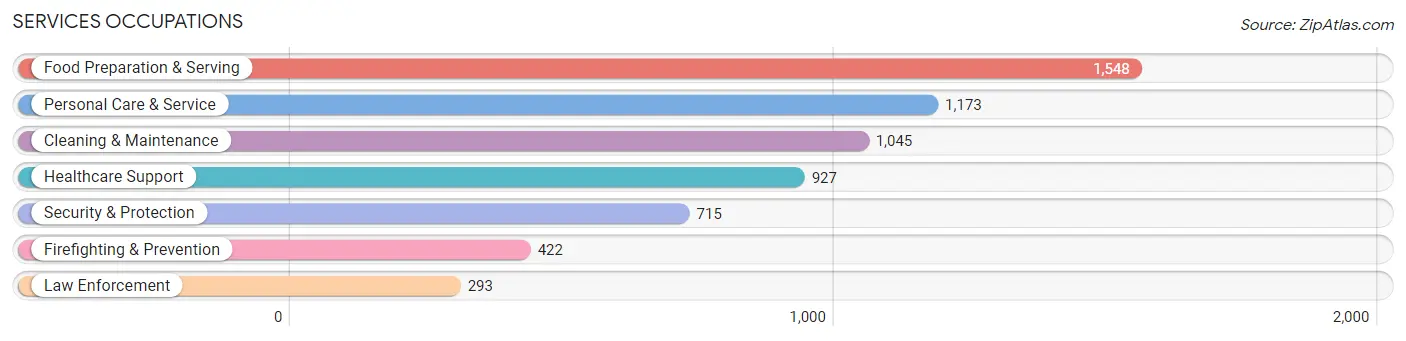
Services Occupations
The most common Services occupations in James City County are Food Preparation & Serving (1,548 | 4.4%), Personal Care & Service (1,173 | 3.4%), Cleaning & Maintenance (1,045 | 3.0%), Healthcare Support (927 | 2.7%), and Security & Protection (715 | 2.1%).
Services Occupations by Sex
Within the Services occupations in James City County, the most male-oriented occupations are Law Enforcement (100.0%), Security & Protection (75.7%), and Cleaning & Maintenance (59.1%), while the most female-oriented occupations are Healthcare Support (87.6%), Personal Care & Service (67.1%), and Food Preparation & Serving (56.0%).
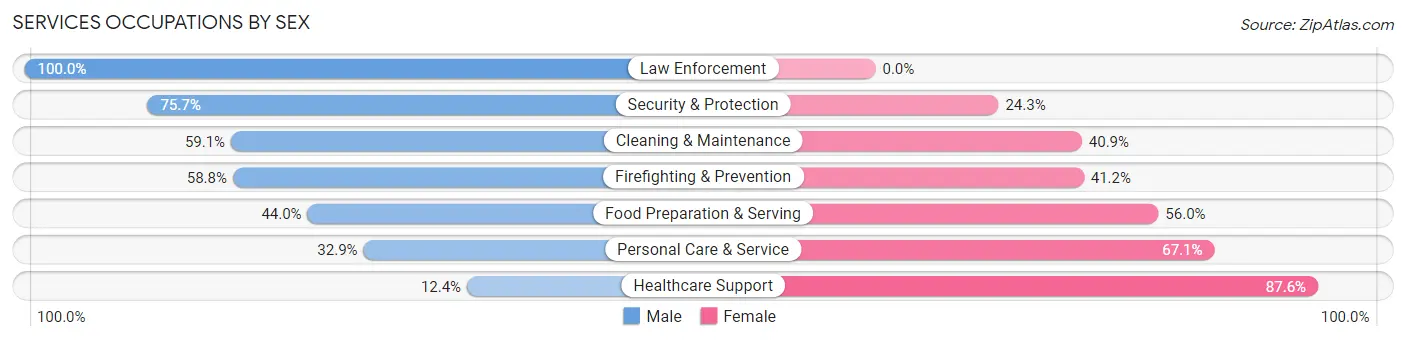
| Occupation | Male | Female |
| Healthcare Support | 115 (12.4%) | 812 (87.6%) |
| Security & Protection | 541 (75.7%) | 174 (24.3%) |
| Firefighting & Prevention | 248 (58.8%) | 174 (41.2%) |
| Law Enforcement | 293 (100.0%) | 0 (0.0%) |
| Food Preparation & Serving | 681 (44.0%) | 867 (56.0%) |
| Cleaning & Maintenance | 618 (59.1%) | 427 (40.9%) |
| Personal Care & Service | 386 (32.9%) | 787 (67.1%) |
| Total (Category) | 2,341 (43.3%) | 3,067 (56.7%) |
| Total (Overall) | 18,016 (51.8%) | 16,744 (48.2%) |
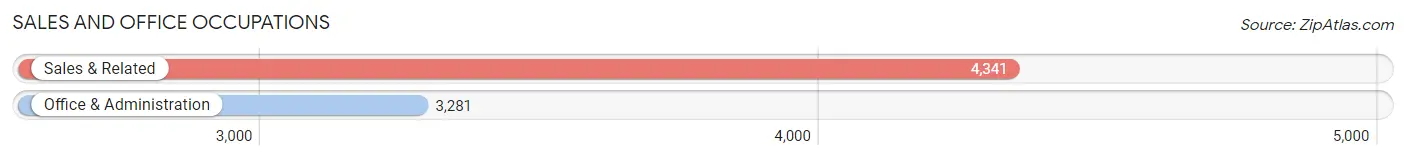
Sales and Office Occupations
The most common Sales and Office occupations in James City County are Sales & Related (4,341 | 12.5%), and Office & Administration (3,281 | 9.4%).
Sales and Office Occupations by Sex
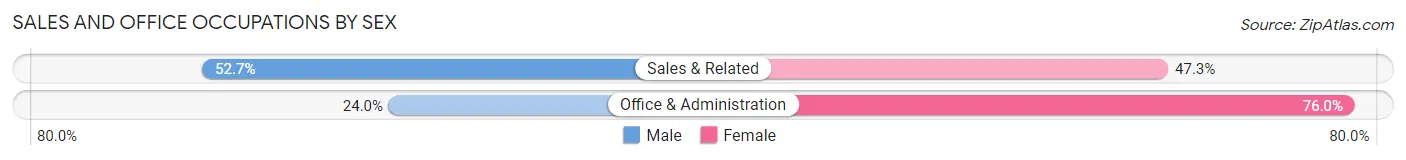
| Occupation | Male | Female |
| Sales & Related | 2,287 (52.7%) | 2,054 (47.3%) |
| Office & Administration | 786 (24.0%) | 2,495 (76.0%) |
| Total (Category) | 3,073 (40.3%) | 4,549 (59.7%) |
| Total (Overall) | 18,016 (51.8%) | 16,744 (48.2%) |
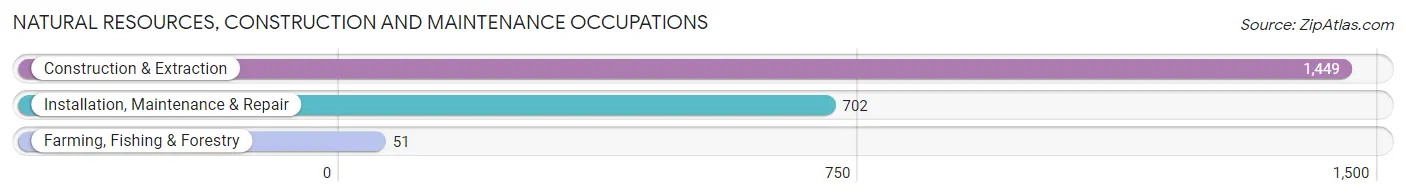
Natural Resources, Construction and Maintenance Occupations
The most common Natural Resources, Construction and Maintenance occupations in James City County are Construction & Extraction (1,449 | 4.2%), Installation, Maintenance & Repair (702 | 2.0%), and Farming, Fishing & Forestry (51 | 0.2%).
Natural Resources, Construction and Maintenance Occupations by Sex
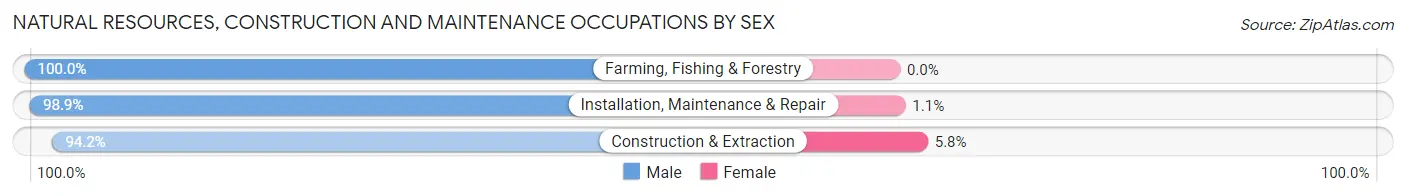
| Occupation | Male | Female |
| Farming, Fishing & Forestry | 51 (100.0%) | 0 (0.0%) |
| Construction & Extraction | 1,365 (94.2%) | 84 (5.8%) |
| Installation, Maintenance & Repair | 694 (98.9%) | 8 (1.1%) |
| Total (Category) | 2,110 (95.8%) | 92 (4.2%) |
| Total (Overall) | 18,016 (51.8%) | 16,744 (48.2%) |
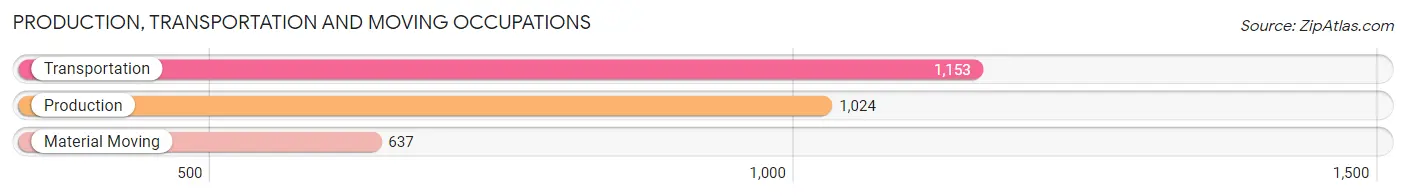
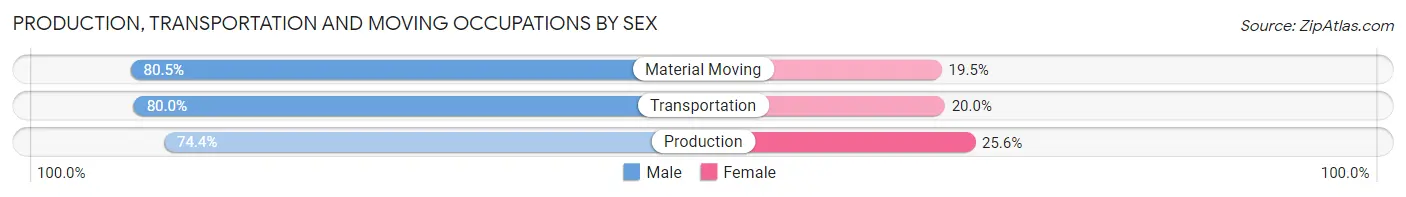
Production, Transportation and Moving Occupations
The most common Production, Transportation and Moving occupations in James City County are Transportation (1,153 | 3.3%), Production (1,024 | 2.9%), and Material Moving (637 | 1.8%).
Production, Transportation and Moving Occupations by Sex
| Occupation | Male | Female |
| Production | 762 (74.4%) | 262 (25.6%) |
| Transportation | 922 (80.0%) | 231 (20.0%) |
| Material Moving | 513 (80.5%) | 124 (19.5%) |
| Total (Category) | 2,197 (78.1%) | 617 (21.9%) |
| Total (Overall) | 18,016 (51.8%) | 16,744 (48.2%) |
Employment Industries by Sex in James City County
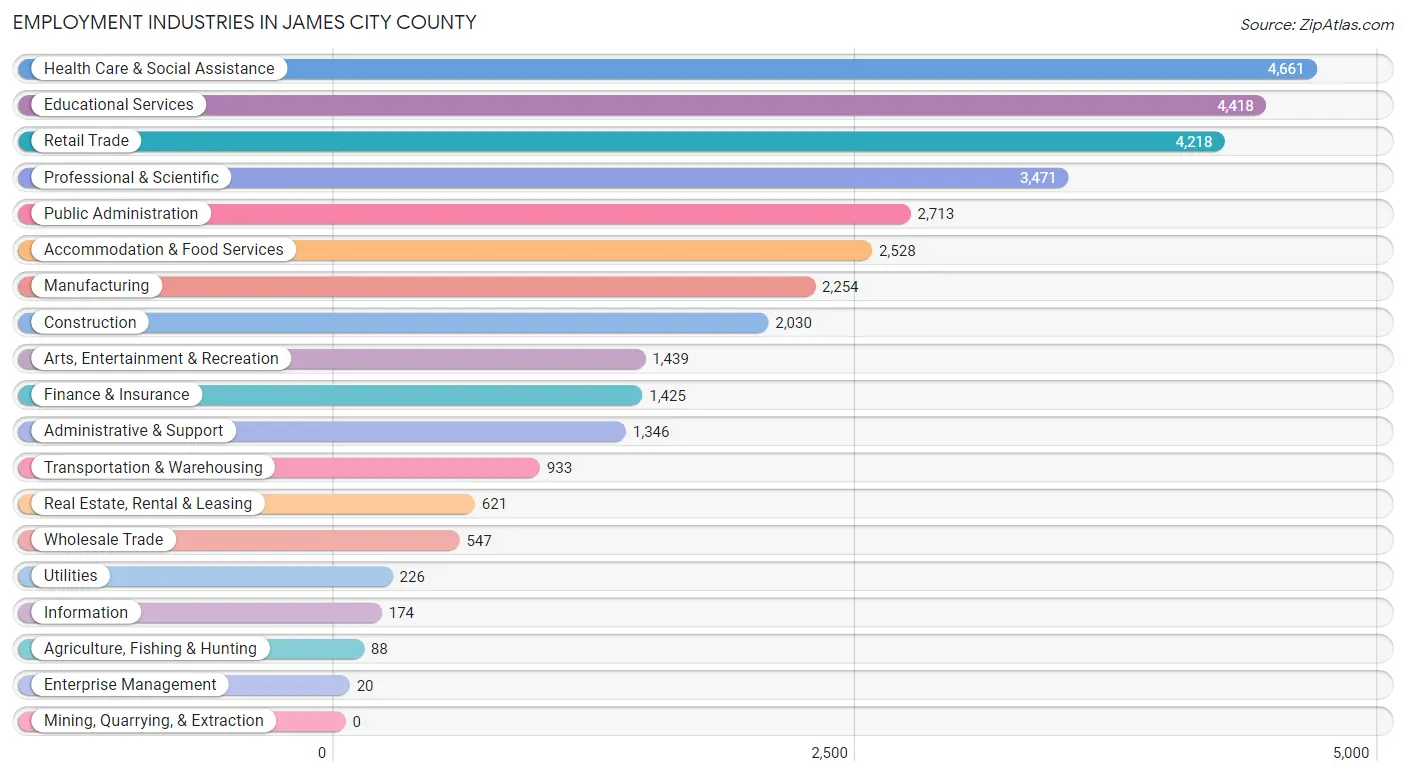
Employment Industries in James City County
The major employment industries in James City County include Health Care & Social Assistance (4,661 | 13.4%), Educational Services (4,418 | 12.7%), Retail Trade (4,218 | 12.1%), Professional & Scientific (3,471 | 10.0%), and Public Administration (2,713 | 7.8%).
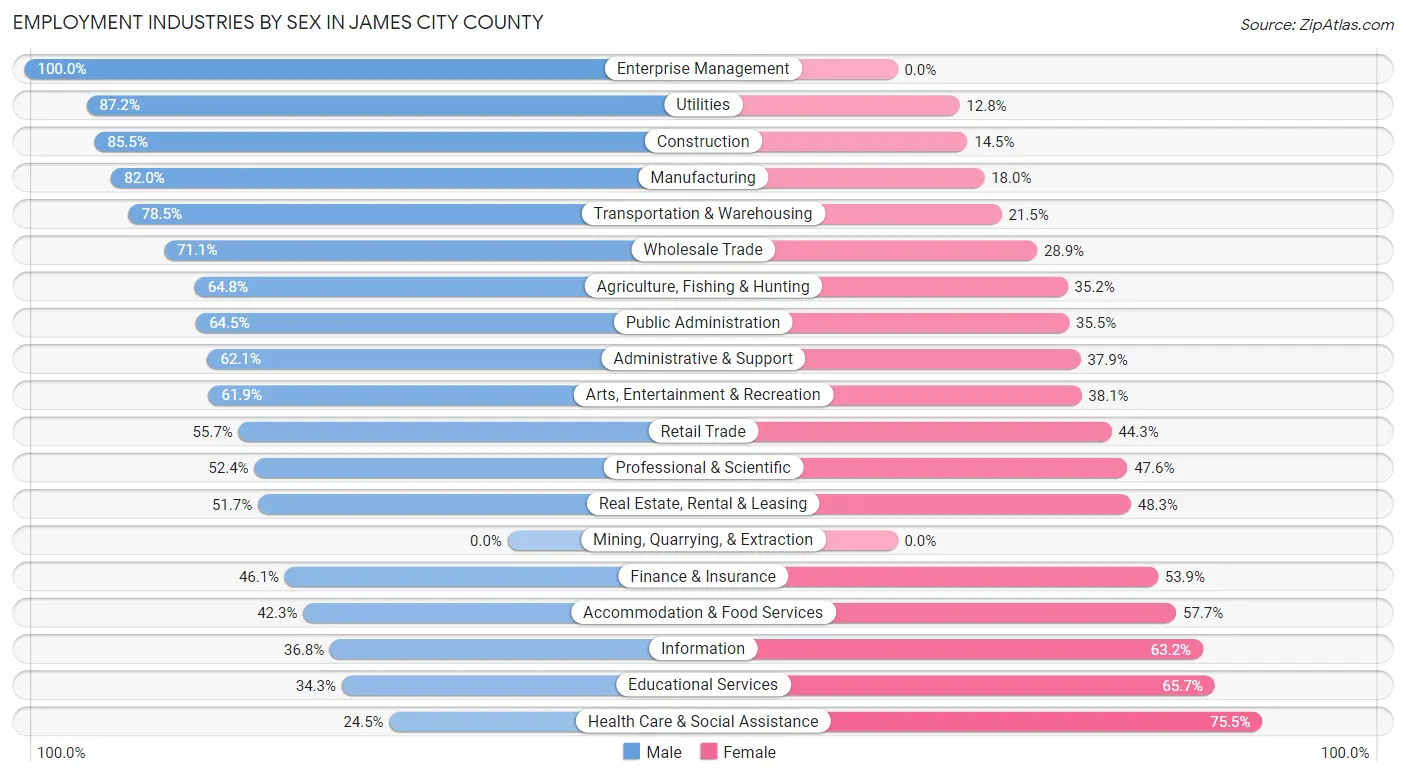
Employment Industries by Sex in James City County
The James City County industries that see more men than women are Enterprise Management (100.0%), Utilities (87.2%), and Construction (85.5%), whereas the industries that tend to have a higher number of women are Health Care & Social Assistance (75.5%), Educational Services (65.7%), and Information (63.2%).
| Industry | Male | Female |
| Agriculture, Fishing & Hunting | 57 (64.8%) | 31 (35.2%) |
| Mining, Quarrying, & Extraction | 0 (0.0%) | 0 (0.0%) |
| Construction | 1,736 (85.5%) | 294 (14.5%) |
| Manufacturing | 1,849 (82.0%) | 405 (18.0%) |
| Wholesale Trade | 389 (71.1%) | 158 (28.9%) |
| Retail Trade | 2,349 (55.7%) | 1,869 (44.3%) |
| Transportation & Warehousing | 732 (78.5%) | 201 (21.5%) |
| Utilities | 197 (87.2%) | 29 (12.8%) |
| Information | 64 (36.8%) | 110 (63.2%) |
| Finance & Insurance | 657 (46.1%) | 768 (53.9%) |
| Real Estate, Rental & Leasing | 321 (51.7%) | 300 (48.3%) |
| Professional & Scientific | 1,820 (52.4%) | 1,651 (47.6%) |
| Enterprise Management | 20 (100.0%) | 0 (0.0%) |
| Administrative & Support | 836 (62.1%) | 510 (37.9%) |
| Educational Services | 1,517 (34.3%) | 2,901 (65.7%) |
| Health Care & Social Assistance | 1,141 (24.5%) | 3,520 (75.5%) |
| Arts, Entertainment & Recreation | 891 (61.9%) | 548 (38.1%) |
| Accommodation & Food Services | 1,070 (42.3%) | 1,458 (57.7%) |
| Public Administration | 1,749 (64.5%) | 964 (35.5%) |
| Total | 18,016 (51.8%) | 16,744 (48.2%) |
Education in James City County
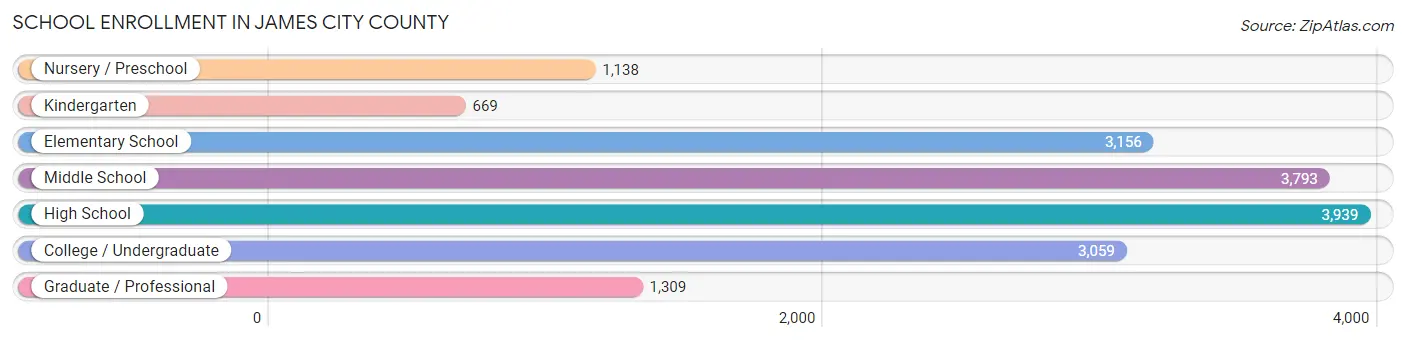
School Enrollment in James City County
The most common levels of schooling among the 17,063 students in James City County are high school (3,939 | 23.1%), middle school (3,793 | 22.2%), and elementary school (3,156 | 18.5%).
| School Level | # Students | % Students |
| Nursery / Preschool | 1,138 | 6.7% |
| Kindergarten | 669 | 3.9% |
| Elementary School | 3,156 | 18.5% |
| Middle School | 3,793 | 22.2% |
| High School | 3,939 | 23.1% |
| College / Undergraduate | 3,059 | 17.9% |
| Graduate / Professional | 1,309 | 7.7% |
| Total | 17,063 | 100.0% |
School Enrollment by Age by Funding Source in James City County
Out of a total of 17,063 students who are enrolled in schools in James City County, 3,020 (17.7%) attend a private institution, while the remaining 14,043 (82.3%) are enrolled in public schools. The age group of 3 to 4 year olds has the highest likelihood of being enrolled in private schools, with 415 (46.2% in the age bracket) enrolled. Conversely, the age group of 20 to 24 year olds has the lowest likelihood of being enrolled in a private school, with 1,626 (91.8% in the age bracket) attending a public institution.
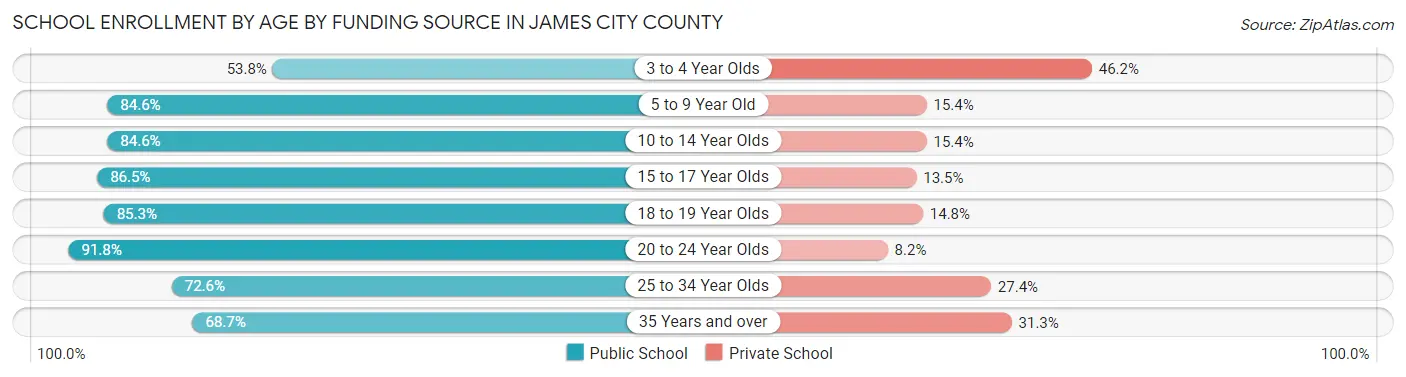
| Age Bracket | Public School | Private School |
| 3 to 4 Year Olds | 483 (53.8%) | 415 (46.2%) |
| 5 to 9 Year Old | 3,244 (84.6%) | 592 (15.4%) |
| 10 to 14 Year Olds | 3,815 (84.6%) | 696 (15.4%) |
| 15 to 17 Year Olds | 2,326 (86.5%) | 364 (13.5%) |
| 18 to 19 Year Olds | 1,092 (85.3%) | 189 (14.7%) |
| 20 to 24 Year Olds | 1,626 (91.8%) | 145 (8.2%) |
| 25 to 34 Year Olds | 646 (72.6%) | 244 (27.4%) |
| 35 Years and over | 815 (68.7%) | 371 (31.3%) |
| Total | 14,043 (82.3%) | 3,020 (17.7%) |
Educational Attainment by Field of Study in James City County
Business (5,494 | 17.8%), social sciences (3,230 | 10.5%), education (3,096 | 10.1%), liberal arts & history (2,465 | 8.0%), and science & technology (2,441 | 7.9%) are the most common fields of study among 30,792 individuals in James City County who have obtained a bachelor's degree or higher.
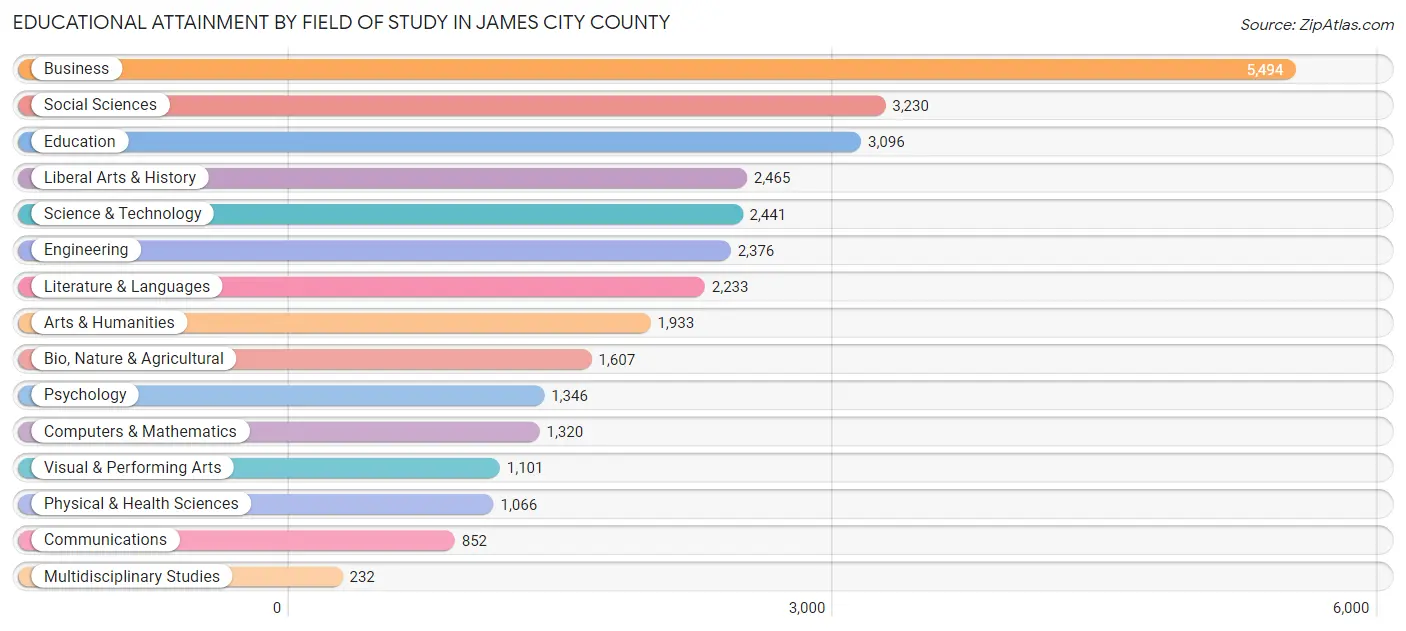
| Field of Study | # Graduates | % Graduates |
| Computers & Mathematics | 1,320 | 4.3% |
| Bio, Nature & Agricultural | 1,607 | 5.2% |
| Physical & Health Sciences | 1,066 | 3.5% |
| Psychology | 1,346 | 4.4% |
| Social Sciences | 3,230 | 10.5% |
| Engineering | 2,376 | 7.7% |
| Multidisciplinary Studies | 232 | 0.7% |
| Science & Technology | 2,441 | 7.9% |
| Business | 5,494 | 17.8% |
| Education | 3,096 | 10.1% |
| Literature & Languages | 2,233 | 7.2% |
| Liberal Arts & History | 2,465 | 8.0% |
| Visual & Performing Arts | 1,101 | 3.6% |
| Communications | 852 | 2.8% |
| Arts & Humanities | 1,933 | 6.3% |
| Total | 30,792 | 100.0% |
Transportation & Commute in James City County
Vehicle Availability by Sex in James City County
The most prevalent vehicle ownership categories in James City County are males with 2 vehicles (8,096, accounting for 43.2%) and females with 2 vehicles (6,671, making up 48.8%).
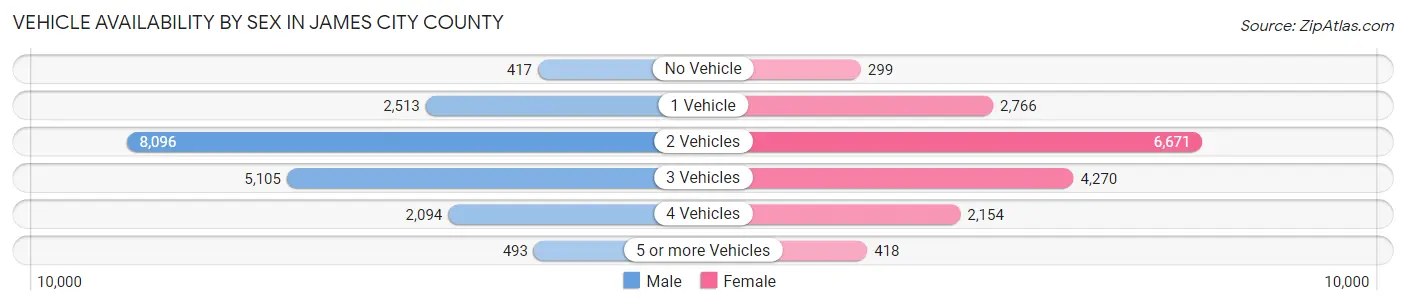
| Vehicles Available | Male | Female |
| No Vehicle | 417 (2.2%) | 299 (1.8%) |
| 1 Vehicle | 2,513 (13.4%) | 2,766 (16.7%) |
| 2 Vehicles | 8,096 (43.2%) | 6,671 (40.2%) |
| 3 Vehicles | 5,105 (27.3%) | 4,270 (25.8%) |
| 4 Vehicles | 2,094 (11.2%) | 2,154 (13.0%) |
| 5 or more Vehicles | 493 (2.6%) | 418 (2.5%) |
| Total | 18,718 (100.0%) | 16,578 (100.0%) |
Commute Time in James City County
The most frequently occuring commute durations in James City County are 15 to 19 minutes (5,816 commuters, 19.2%), 10 to 14 minutes (4,913 commuters, 16.2%), and 20 to 24 minutes (4,251 commuters, 14.0%).
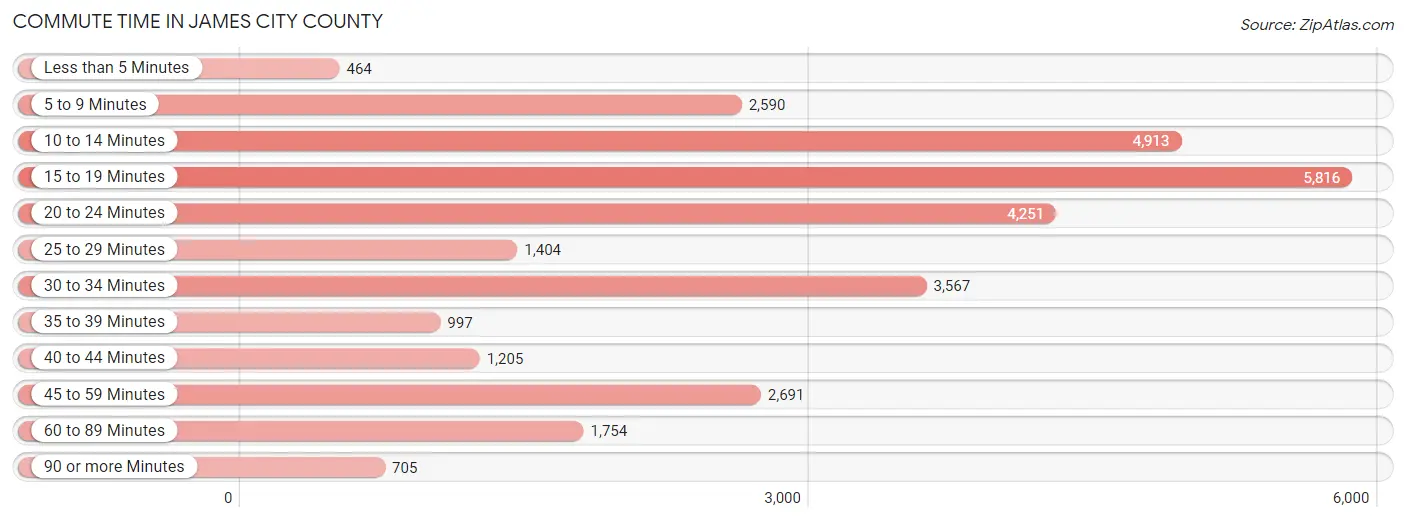
| Commute Time | # Commuters | % Commuters |
| Less than 5 Minutes | 464 | 1.5% |
| 5 to 9 Minutes | 2,590 | 8.5% |
| 10 to 14 Minutes | 4,913 | 16.2% |
| 15 to 19 Minutes | 5,816 | 19.2% |
| 20 to 24 Minutes | 4,251 | 14.0% |
| 25 to 29 Minutes | 1,404 | 4.6% |
| 30 to 34 Minutes | 3,567 | 11.7% |
| 35 to 39 Minutes | 997 | 3.3% |
| 40 to 44 Minutes | 1,205 | 4.0% |
| 45 to 59 Minutes | 2,691 | 8.9% |
| 60 to 89 Minutes | 1,754 | 5.8% |
| 90 or more Minutes | 705 | 2.3% |
Commute Time by Sex in James City County
The most common commute times in James City County are 15 to 19 minutes (2,762 commuters, 16.9%) for males and 15 to 19 minutes (3,054 commuters, 21.7%) for females.
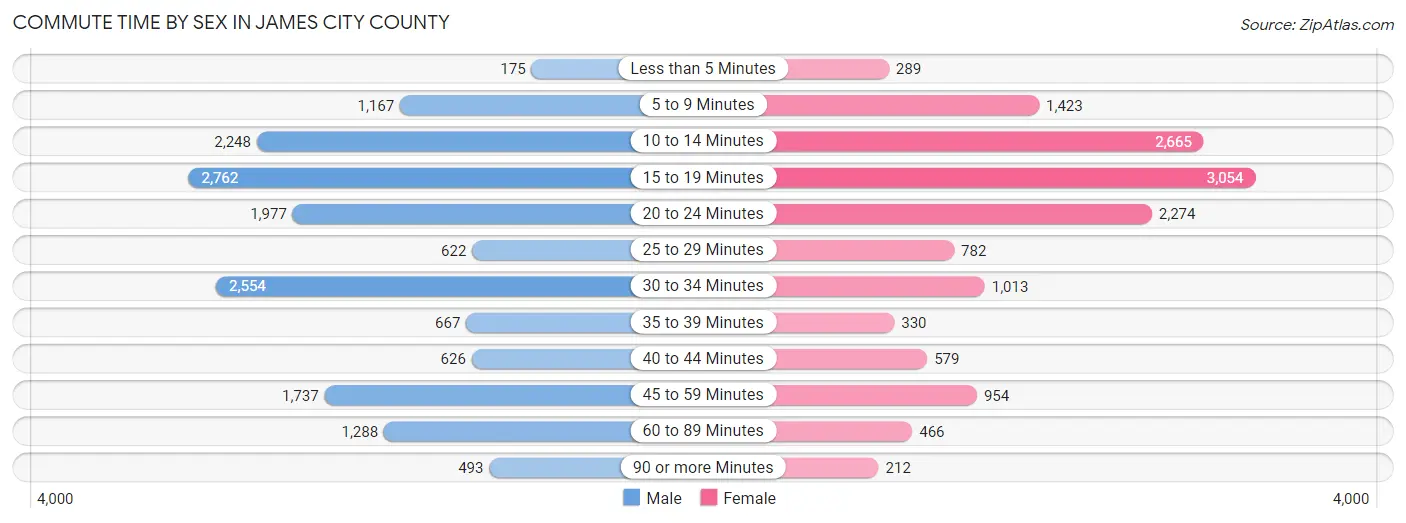
| Commute Time | Male | Female |
| Less than 5 Minutes | 175 (1.1%) | 289 (2.1%) |
| 5 to 9 Minutes | 1,167 (7.1%) | 1,423 (10.1%) |
| 10 to 14 Minutes | 2,248 (13.8%) | 2,665 (19.0%) |
| 15 to 19 Minutes | 2,762 (16.9%) | 3,054 (21.7%) |
| 20 to 24 Minutes | 1,977 (12.1%) | 2,274 (16.2%) |
| 25 to 29 Minutes | 622 (3.8%) | 782 (5.6%) |
| 30 to 34 Minutes | 2,554 (15.7%) | 1,013 (7.2%) |
| 35 to 39 Minutes | 667 (4.1%) | 330 (2.4%) |
| 40 to 44 Minutes | 626 (3.8%) | 579 (4.1%) |
| 45 to 59 Minutes | 1,737 (10.6%) | 954 (6.8%) |
| 60 to 89 Minutes | 1,288 (7.9%) | 466 (3.3%) |
| 90 or more Minutes | 493 (3.0%) | 212 (1.5%) |
Time of Departure to Work by Sex in James City County
The most frequent times of departure to work in James City County are 7:00 AM to 7:29 AM (2,708, 16.6%) for males and 8:00 AM to 8:29 AM (2,378, 16.9%) for females.
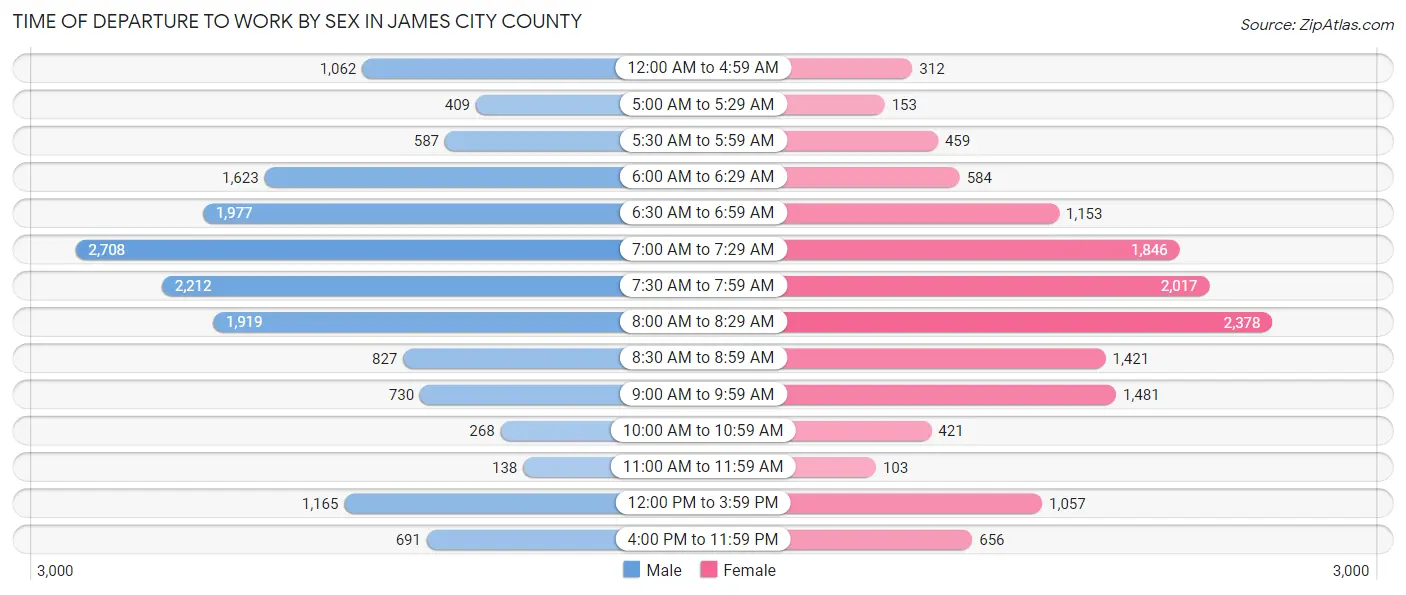
| Time of Departure | Male | Female |
| 12:00 AM to 4:59 AM | 1,062 (6.5%) | 312 (2.2%) |
| 5:00 AM to 5:29 AM | 409 (2.5%) | 153 (1.1%) |
| 5:30 AM to 5:59 AM | 587 (3.6%) | 459 (3.3%) |
| 6:00 AM to 6:29 AM | 1,623 (10.0%) | 584 (4.2%) |
| 6:30 AM to 6:59 AM | 1,977 (12.1%) | 1,153 (8.2%) |
| 7:00 AM to 7:29 AM | 2,708 (16.6%) | 1,846 (13.2%) |
| 7:30 AM to 7:59 AM | 2,212 (13.6%) | 2,017 (14.4%) |
| 8:00 AM to 8:29 AM | 1,919 (11.8%) | 2,378 (16.9%) |
| 8:30 AM to 8:59 AM | 827 (5.1%) | 1,421 (10.1%) |
| 9:00 AM to 9:59 AM | 730 (4.5%) | 1,481 (10.5%) |
| 10:00 AM to 10:59 AM | 268 (1.6%) | 421 (3.0%) |
| 11:00 AM to 11:59 AM | 138 (0.9%) | 103 (0.7%) |
| 12:00 PM to 3:59 PM | 1,165 (7.1%) | 1,057 (7.5%) |
| 4:00 PM to 11:59 PM | 691 (4.2%) | 656 (4.7%) |
| Total | 16,316 (100.0%) | 14,041 (100.0%) |
Housing Occupancy in James City County
Occupancy by Ownership in James City County
Of the total 30,690 dwellings in James City County, owner-occupied units account for 23,820 (77.6%), while renter-occupied units make up 6,870 (22.4%).
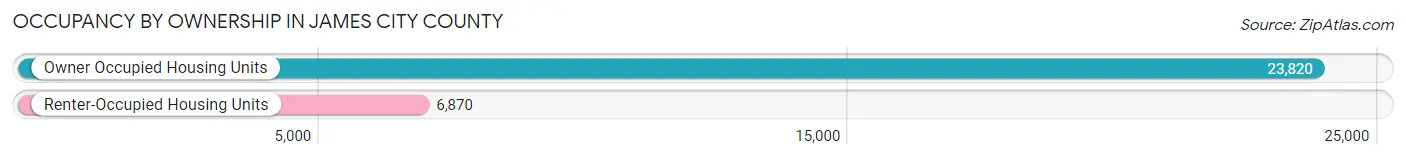
| Occupancy | # Housing Units | % Housing Units |
| Owner Occupied Housing Units | 23,820 | 77.6% |
| Renter-Occupied Housing Units | 6,870 | 22.4% |
| Total Occupied Housing Units | 30,690 | 100.0% |
Occupancy by Household Size in James City County
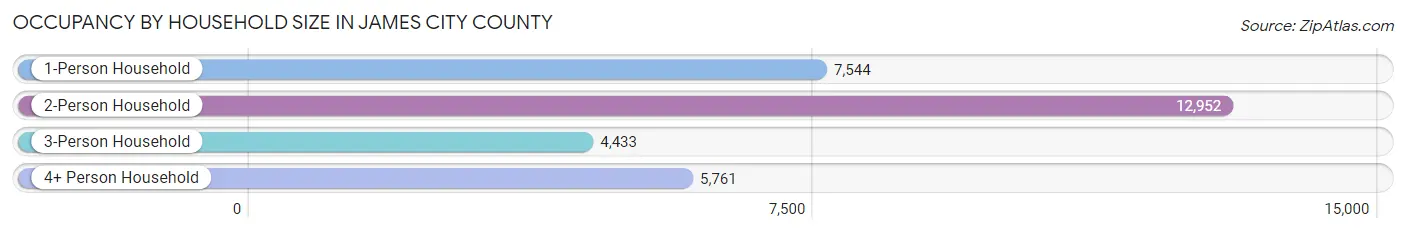
| Household Size | # Housing Units | % Housing Units |
| 1-Person Household | 7,544 | 24.6% |
| 2-Person Household | 12,952 | 42.2% |
| 3-Person Household | 4,433 | 14.4% |
| 4+ Person Household | 5,761 | 18.8% |
| Total Housing Units | 30,690 | 100.0% |
Occupancy by Ownership by Household Size in James City County
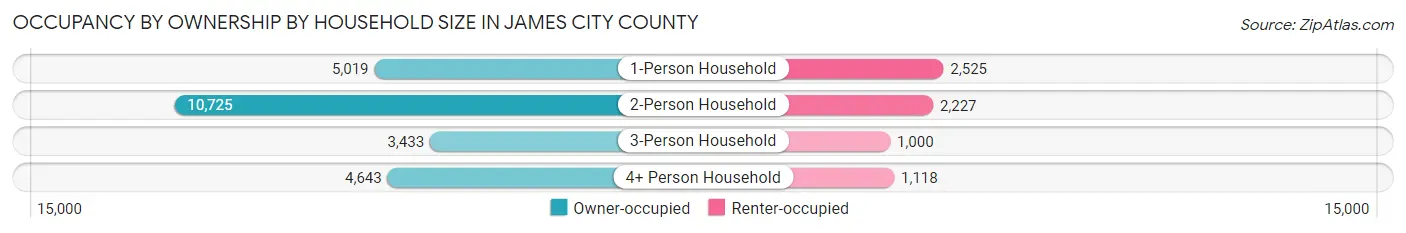
| Household Size | Owner-occupied | Renter-occupied |
| 1-Person Household | 5,019 (66.5%) | 2,525 (33.5%) |
| 2-Person Household | 10,725 (82.8%) | 2,227 (17.2%) |
| 3-Person Household | 3,433 (77.4%) | 1,000 (22.6%) |
| 4+ Person Household | 4,643 (80.6%) | 1,118 (19.4%) |
| Total Housing Units | 23,820 (77.6%) | 6,870 (22.4%) |
Occupancy by Educational Attainment in James City County
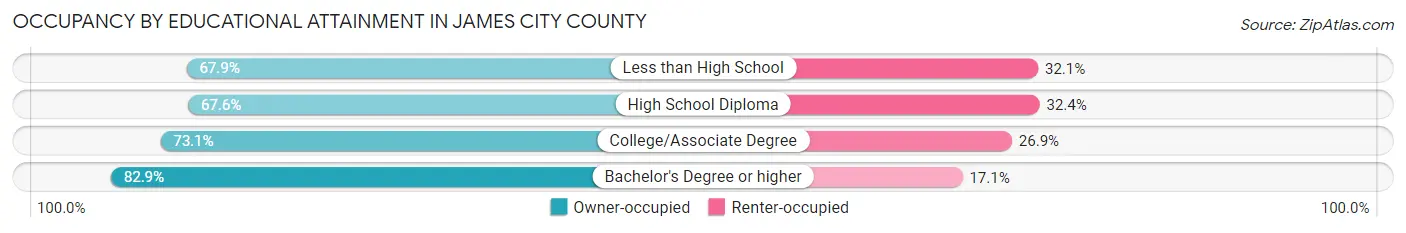
| Household Size | Owner-occupied | Renter-occupied |
| Less than High School | 713 (67.9%) | 337 (32.1%) |
| High School Diploma | 3,086 (67.6%) | 1,479 (32.4%) |
| College/Associate Degree | 5,690 (73.1%) | 2,095 (26.9%) |
| Bachelor's Degree or higher | 14,331 (82.9%) | 2,959 (17.1%) |
Occupancy by Age of Householder in James City County
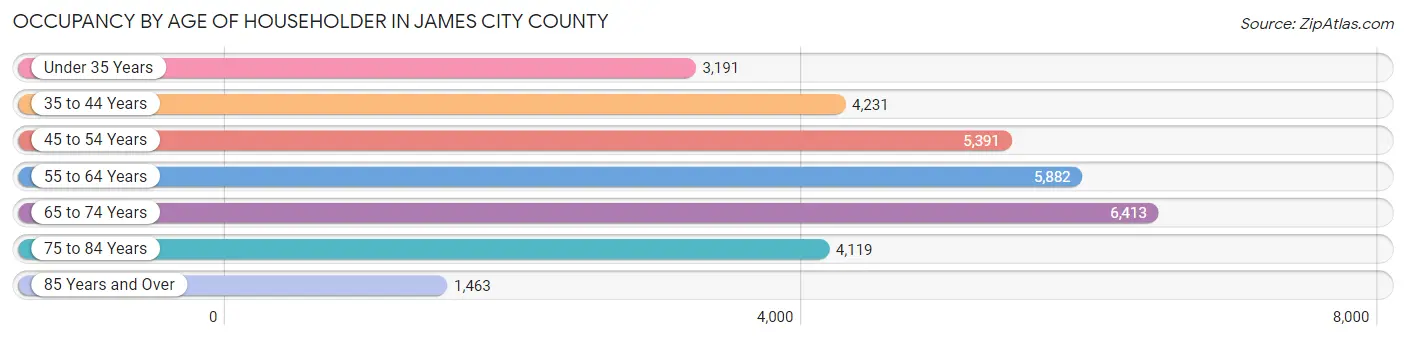
| Age Bracket | # Households | % Households |
| Under 35 Years | 3,191 | 10.4% |
| 35 to 44 Years | 4,231 | 13.8% |
| 45 to 54 Years | 5,391 | 17.6% |
| 55 to 64 Years | 5,882 | 19.2% |
| 65 to 74 Years | 6,413 | 20.9% |
| 75 to 84 Years | 4,119 | 13.4% |
| 85 Years and Over | 1,463 | 4.8% |
| Total | 30,690 | 100.0% |
Housing Finances in James City County
Median Income by Occupancy in James City County
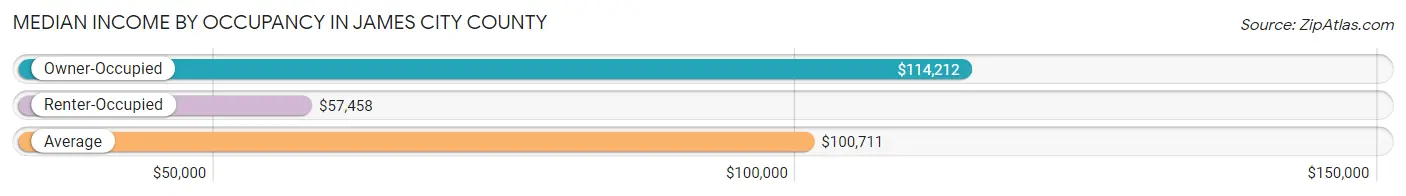
| Occupancy Type | # Households | Median Income |
| Owner-Occupied | 23,820 (77.6%) | $114,212 |
| Renter-Occupied | 6,870 (22.4%) | $57,458 |
| Average | 30,690 (100.0%) | $100,711 |
Occupancy by Householder Income Bracket in James City County
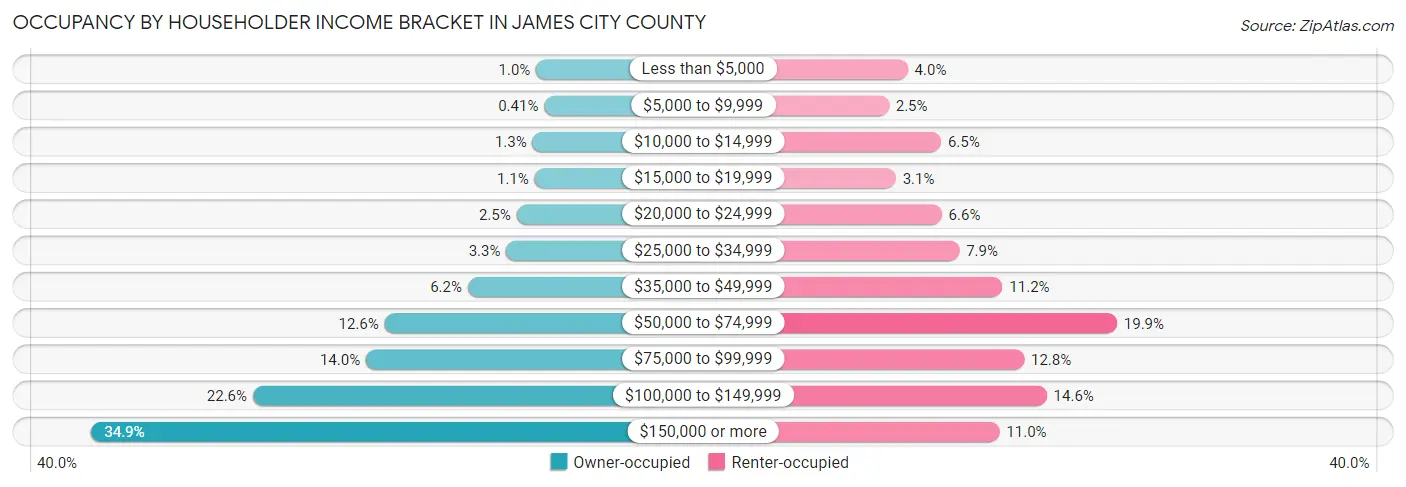
| Income Bracket | Owner-occupied | Renter-occupied |
| Less than $5,000 | 243 (1.0%) | 273 (4.0%) |
| $5,000 to $9,999 | 98 (0.4%) | 174 (2.5%) |
| $10,000 to $14,999 | 310 (1.3%) | 447 (6.5%) |
| $15,000 to $19,999 | 271 (1.1%) | 210 (3.1%) |
| $20,000 to $24,999 | 601 (2.5%) | 451 (6.6%) |
| $25,000 to $34,999 | 785 (3.3%) | 543 (7.9%) |
| $35,000 to $49,999 | 1,484 (6.2%) | 769 (11.2%) |
| $50,000 to $74,999 | 2,995 (12.6%) | 1,368 (19.9%) |
| $75,000 to $99,999 | 3,332 (14.0%) | 882 (12.8%) |
| $100,000 to $149,999 | 5,386 (22.6%) | 1,000 (14.6%) |
| $150,000 or more | 8,315 (34.9%) | 753 (11.0%) |
| Total | 23,820 (100.0%) | 6,870 (100.0%) |
Monthly Housing Cost Tiers in James City County
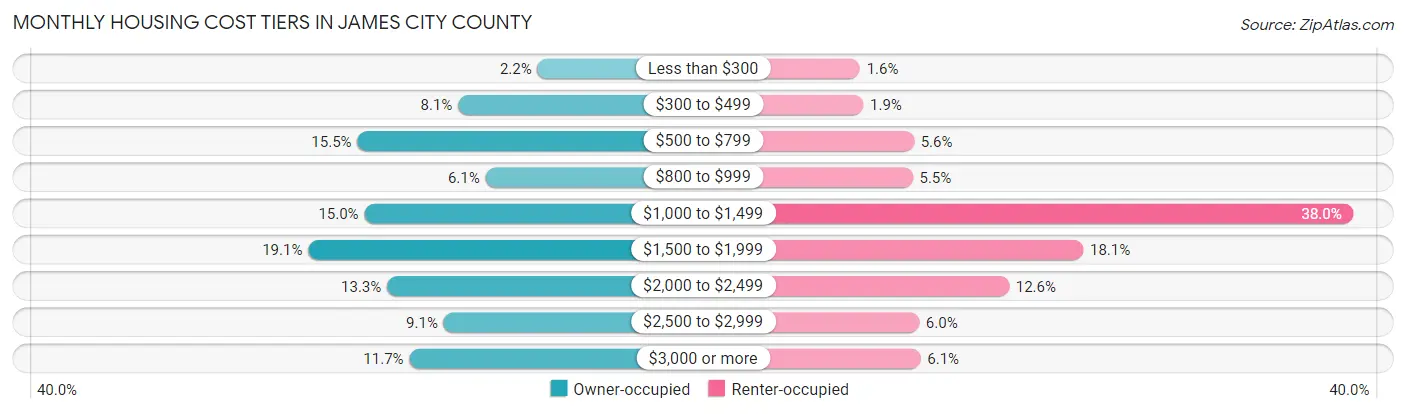
| Monthly Cost | Owner-occupied | Renter-occupied |
| Less than $300 | 528 (2.2%) | 113 (1.6%) |
| $300 to $499 | 1,922 (8.1%) | 130 (1.9%) |
| $500 to $799 | 3,689 (15.5%) | 386 (5.6%) |
| $800 to $999 | 1,441 (6.0%) | 380 (5.5%) |
| $1,000 to $1,499 | 3,566 (15.0%) | 2,611 (38.0%) |
| $1,500 to $1,999 | 4,553 (19.1%) | 1,243 (18.1%) |
| $2,000 to $2,499 | 3,169 (13.3%) | 867 (12.6%) |
| $2,500 to $2,999 | 2,174 (9.1%) | 412 (6.0%) |
| $3,000 or more | 2,778 (11.7%) | 420 (6.1%) |
| Total | 23,820 (100.0%) | 6,870 (100.0%) |
Physical Housing Characteristics in James City County
Housing Structures in James City County
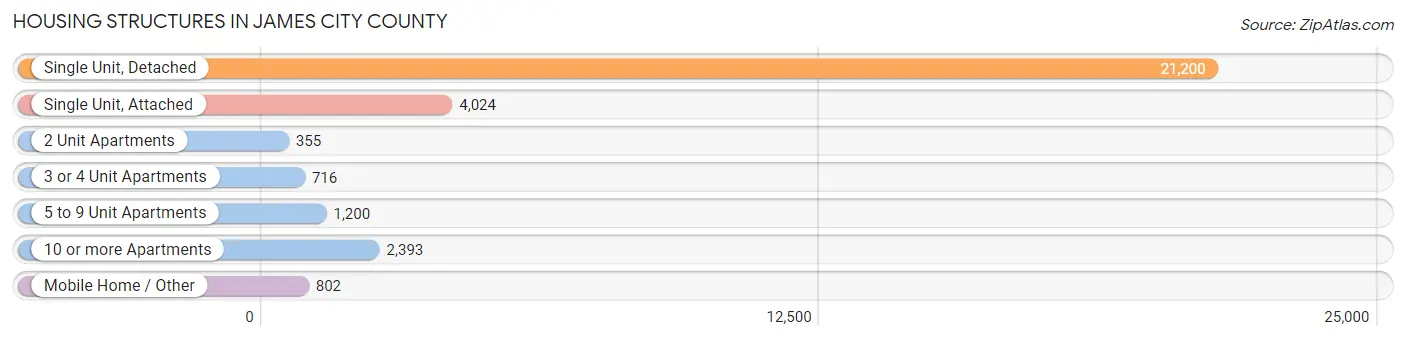
| Structure Type | # Housing Units | % Housing Units |
| Single Unit, Detached | 21,200 | 69.1% |
| Single Unit, Attached | 4,024 | 13.1% |
| 2 Unit Apartments | 355 | 1.2% |
| 3 or 4 Unit Apartments | 716 | 2.3% |
| 5 to 9 Unit Apartments | 1,200 | 3.9% |
| 10 or more Apartments | 2,393 | 7.8% |
| Mobile Home / Other | 802 | 2.6% |
| Total | 30,690 | 100.0% |
Housing Structures by Occupancy in James City County
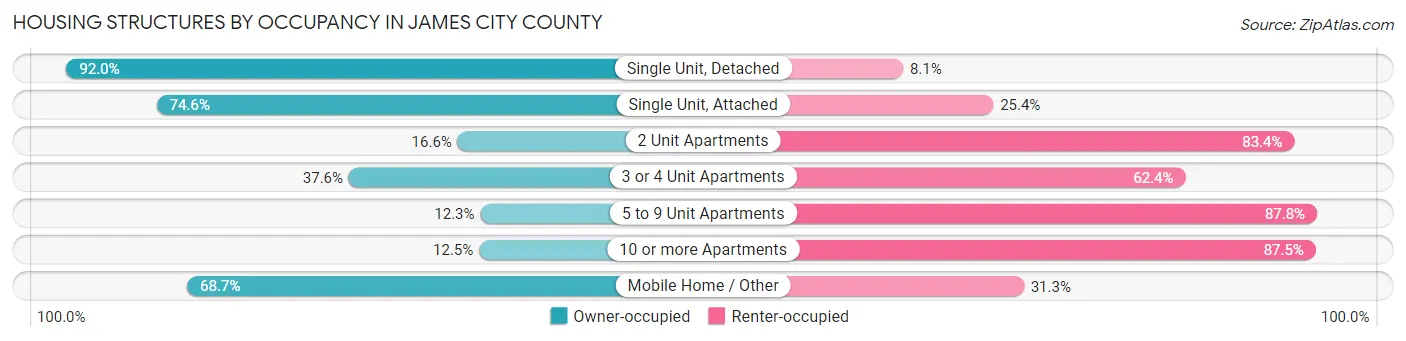
| Structure Type | Owner-occupied | Renter-occupied |
| Single Unit, Detached | 19,494 (91.9%) | 1,706 (8.1%) |
| Single Unit, Attached | 3,001 (74.6%) | 1,023 (25.4%) |
| 2 Unit Apartments | 59 (16.6%) | 296 (83.4%) |
| 3 or 4 Unit Apartments | 269 (37.6%) | 447 (62.4%) |
| 5 to 9 Unit Apartments | 147 (12.2%) | 1,053 (87.7%) |
| 10 or more Apartments | 299 (12.5%) | 2,094 (87.5%) |
| Mobile Home / Other | 551 (68.7%) | 251 (31.3%) |
| Total | 23,820 (77.6%) | 6,870 (22.4%) |
Housing Structures by Number of Rooms in James City County
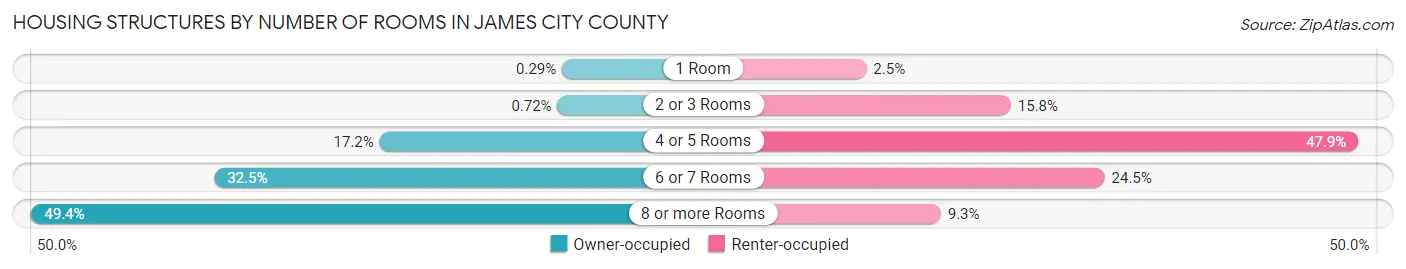
| Number of Rooms | Owner-occupied | Renter-occupied |
| 1 Room | 68 (0.3%) | 168 (2.5%) |
| 2 or 3 Rooms | 172 (0.7%) | 1,086 (15.8%) |
| 4 or 5 Rooms | 4,090 (17.2%) | 3,293 (47.9%) |
| 6 or 7 Rooms | 7,731 (32.5%) | 1,682 (24.5%) |
| 8 or more Rooms | 11,759 (49.4%) | 641 (9.3%) |
| Total | 23,820 (100.0%) | 6,870 (100.0%) |
Housing Structure by Heating Type in James City County
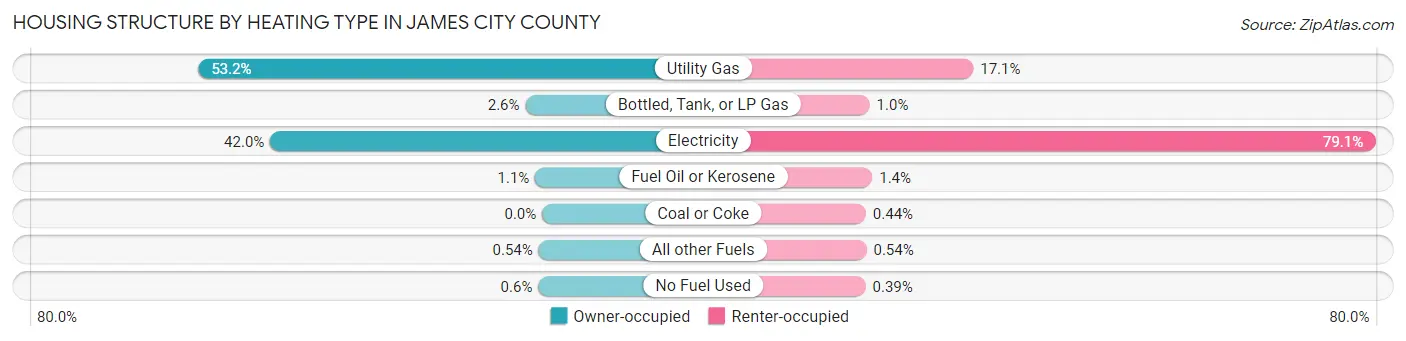
| Heating Type | Owner-occupied | Renter-occupied |
| Utility Gas | 12,662 (53.2%) | 1,171 (17.1%) |
| Bottled, Tank, or LP Gas | 617 (2.6%) | 70 (1.0%) |
| Electricity | 10,014 (42.0%) | 5,437 (79.1%) |
| Fuel Oil or Kerosene | 255 (1.1%) | 98 (1.4%) |
| Coal or Coke | 0 (0.0%) | 30 (0.4%) |
| All other Fuels | 129 (0.5%) | 37 (0.5%) |
| No Fuel Used | 143 (0.6%) | 27 (0.4%) |
| Total | 23,820 (100.0%) | 6,870 (100.0%) |
Household Vehicle Usage in James City County
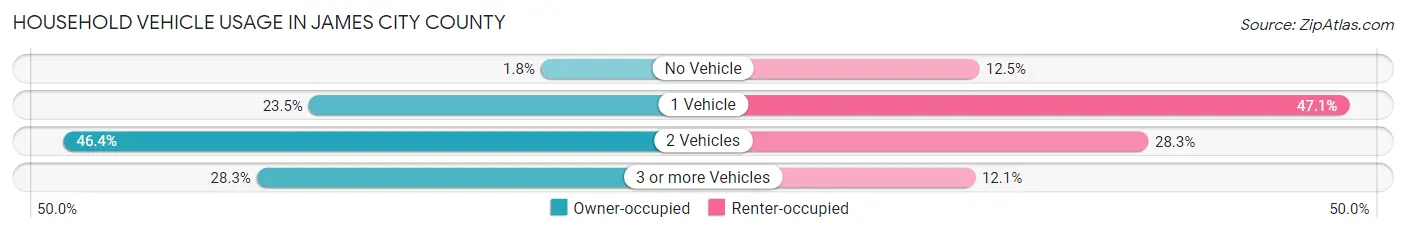
| Vehicles per Household | Owner-occupied | Renter-occupied |
| No Vehicle | 434 (1.8%) | 859 (12.5%) |
| 1 Vehicle | 5,594 (23.5%) | 3,233 (47.1%) |
| 2 Vehicles | 11,042 (46.4%) | 1,944 (28.3%) |
| 3 or more Vehicles | 6,750 (28.3%) | 834 (12.1%) |
| Total | 23,820 (100.0%) | 6,870 (100.0%) |
Real Estate & Mortgages in James City County
Real Estate and Mortgage Overview in James City County
| Characteristic | Without Mortgage | With Mortgage |
| Housing Units | 7,918 | 15,902 |
| Median Property Value | $404,900 | $393,500 |
| Median Household Income | $96,210 | $5,950 |
| Monthly Housing Costs | $619 | $2,778 |
| Real Estate Taxes | $2,818 | $322 |
Property Value by Mortgage Status in James City County
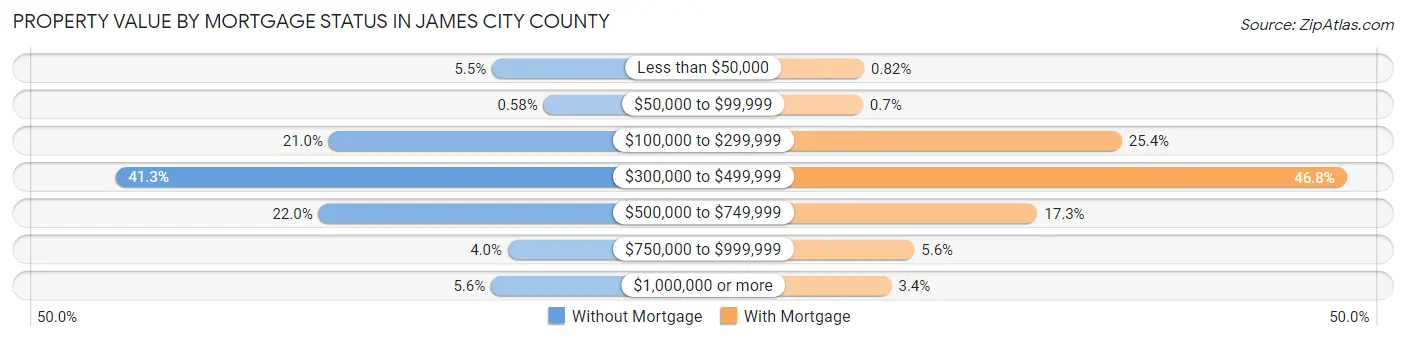
| Property Value | Without Mortgage | With Mortgage |
| Less than $50,000 | 434 (5.5%) | 130 (0.8%) |
| $50,000 to $99,999 | 46 (0.6%) | 111 (0.7%) |
| $100,000 to $299,999 | 1,665 (21.0%) | 4,034 (25.4%) |
| $300,000 to $499,999 | 3,273 (41.3%) | 7,436 (46.8%) |
| $500,000 to $749,999 | 1,743 (22.0%) | 2,754 (17.3%) |
| $750,000 to $999,999 | 315 (4.0%) | 891 (5.6%) |
| $1,000,000 or more | 442 (5.6%) | 546 (3.4%) |
| Total | 7,918 (100.0%) | 15,902 (100.0%) |
Household Income by Mortgage Status in James City County
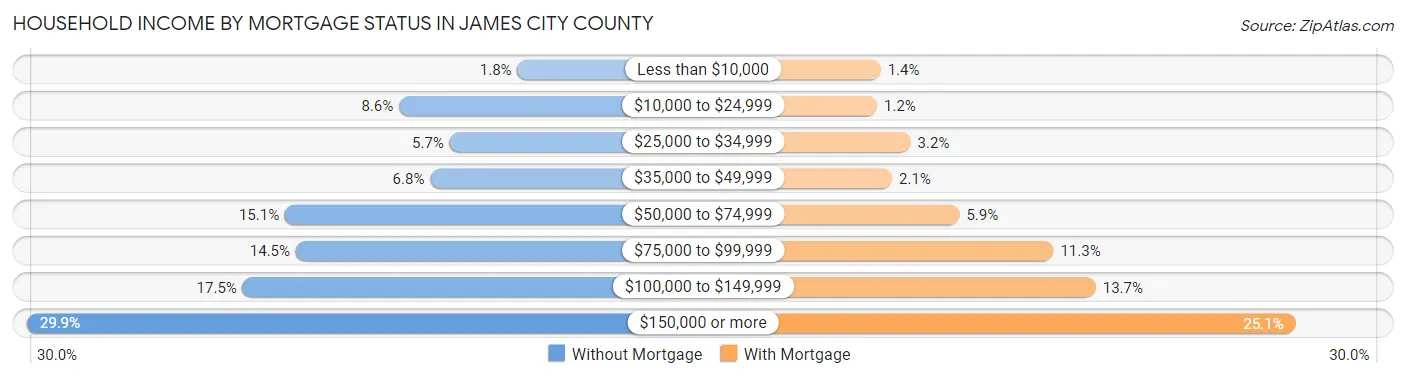
| Household Income | Without Mortgage | With Mortgage |
| Less than $10,000 | 146 (1.8%) | 229 (1.4%) |
| $10,000 to $24,999 | 681 (8.6%) | 195 (1.2%) |
| $25,000 to $34,999 | 452 (5.7%) | 501 (3.2%) |
| $35,000 to $49,999 | 540 (6.8%) | 333 (2.1%) |
| $50,000 to $74,999 | 1,197 (15.1%) | 944 (5.9%) |
| $75,000 to $99,999 | 1,148 (14.5%) | 1,798 (11.3%) |
| $100,000 to $149,999 | 1,389 (17.5%) | 2,184 (13.7%) |
| $150,000 or more | 2,365 (29.9%) | 3,997 (25.1%) |
| Total | 7,918 (100.0%) | 15,902 (100.0%) |
Property Value to Household Income Ratio in James City County
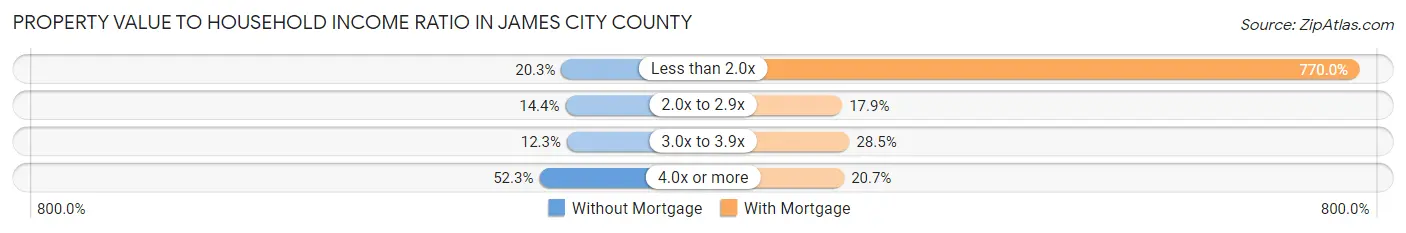
| Value-to-Income Ratio | Without Mortgage | With Mortgage |
| Less than 2.0x | 1,606 (20.3%) | 122,449 (770.0%) |
| 2.0x to 2.9x | 1,141 (14.4%) | 2,844 (17.9%) |
| 3.0x to 3.9x | 971 (12.3%) | 4,526 (28.5%) |
| 4.0x or more | 4,143 (52.3%) | 3,295 (20.7%) |
| Total | 7,918 (100.0%) | 15,902 (100.0%) |
Real Estate Taxes by Mortgage Status in James City County
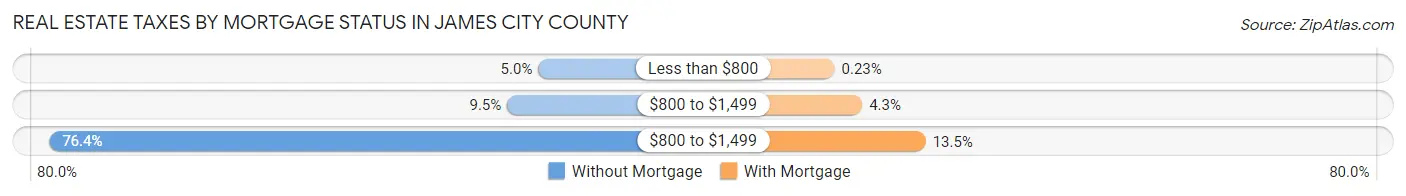
| Property Taxes | Without Mortgage | With Mortgage |
| Less than $800 | 392 (5.0%) | 37 (0.2%) |
| $800 to $1,499 | 752 (9.5%) | 678 (4.3%) |
| $800 to $1,499 | 6,049 (76.4%) | 2,153 (13.5%) |
| Total | 7,918 (100.0%) | 15,902 (100.0%) |
Health & Disability in James City County
Health Insurance Coverage by Age in James City County
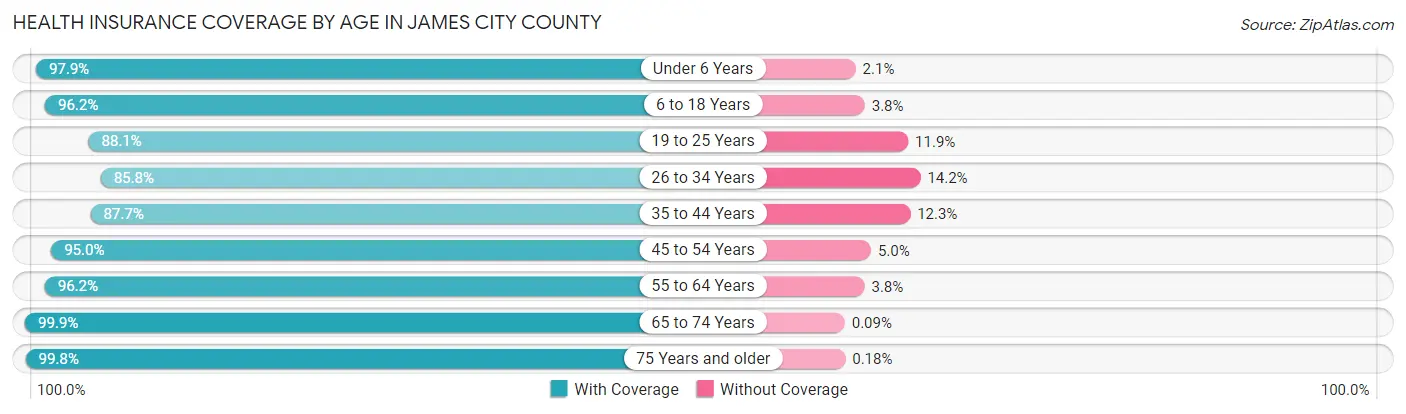
| Age Bracket | With Coverage | Without Coverage |
| Under 6 Years | 4,482 (97.9%) | 97 (2.1%) |
| 6 to 18 Years | 11,400 (96.2%) | 453 (3.8%) |
| 19 to 25 Years | 4,823 (88.1%) | 652 (11.9%) |
| 26 to 34 Years | 5,232 (85.8%) | 866 (14.2%) |
| 35 to 44 Years | 7,279 (87.7%) | 1,020 (12.3%) |
| 45 to 54 Years | 8,800 (95.0%) | 460 (5.0%) |
| 55 to 64 Years | 10,587 (96.2%) | 416 (3.8%) |
| 65 to 74 Years | 11,384 (99.9%) | 10 (0.1%) |
| 75 Years and older | 8,876 (99.8%) | 16 (0.2%) |
| Total | 72,863 (94.8%) | 3,990 (5.2%) |
Health Insurance Coverage by Citizenship Status in James City County
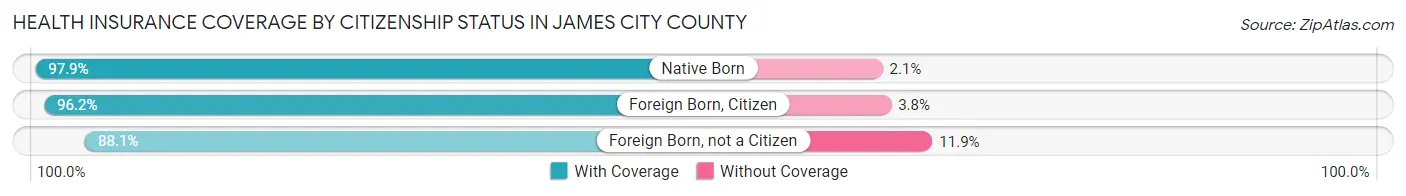
| Citizenship Status | With Coverage | Without Coverage |
| Native Born | 4,482 (97.9%) | 97 (2.1%) |
| Foreign Born, Citizen | 11,400 (96.2%) | 453 (3.8%) |
| Foreign Born, not a Citizen | 4,823 (88.1%) | 652 (11.9%) |
Health Insurance Coverage by Household Income in James City County
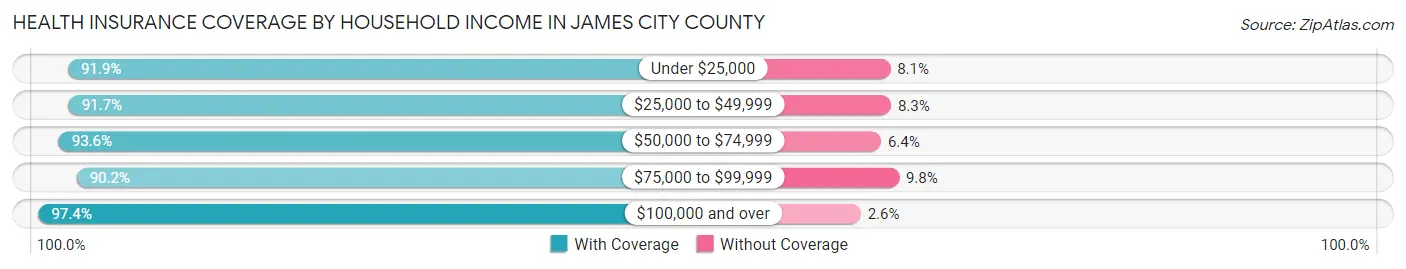
| Household Income | With Coverage | Without Coverage |
| Under $25,000 | 4,739 (91.9%) | 420 (8.1%) |
| $25,000 to $49,999 | 6,317 (91.7%) | 570 (8.3%) |
| $50,000 to $74,999 | 9,454 (93.6%) | 647 (6.4%) |
| $75,000 to $99,999 | 9,784 (90.2%) | 1,059 (9.8%) |
| $100,000 and over | 42,400 (97.4%) | 1,138 (2.6%) |
Public vs Private Health Insurance Coverage by Age in James City County
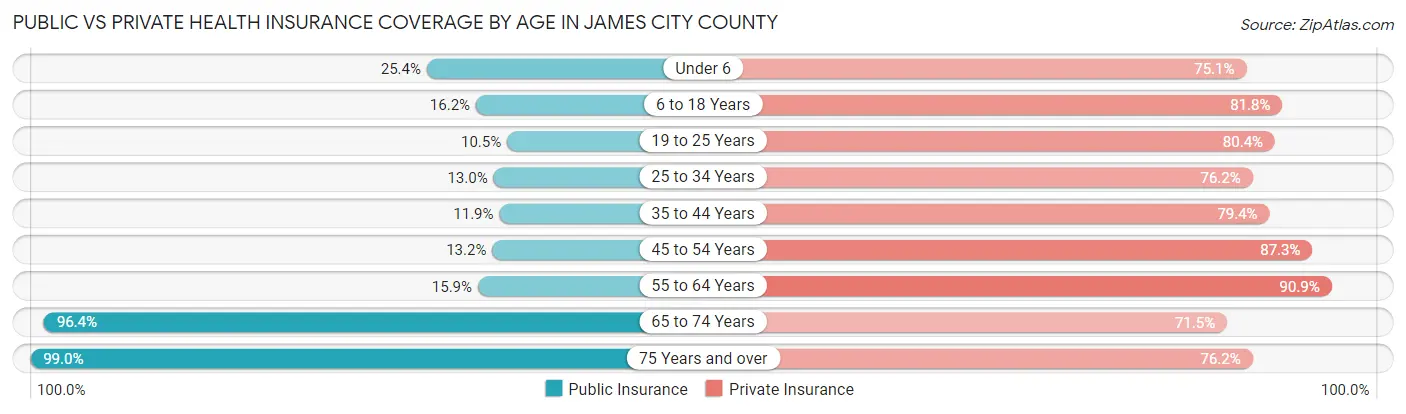
| Age Bracket | Public Insurance | Private Insurance |
| Under 6 | 1,161 (25.4%) | 3,438 (75.1%) |
| 6 to 18 Years | 1,924 (16.2%) | 9,691 (81.8%) |
| 19 to 25 Years | 572 (10.4%) | 4,401 (80.4%) |
| 25 to 34 Years | 791 (13.0%) | 4,649 (76.2%) |
| 35 to 44 Years | 986 (11.9%) | 6,587 (79.4%) |
| 45 to 54 Years | 1,222 (13.2%) | 8,086 (87.3%) |
| 55 to 64 Years | 1,746 (15.9%) | 10,003 (90.9%) |
| 65 to 74 Years | 10,987 (96.4%) | 8,146 (71.5%) |
| 75 Years and over | 8,799 (99.0%) | 6,778 (76.2%) |
| Total | 28,188 (36.7%) | 61,779 (80.4%) |
Disability Status by Sex by Age in James City County
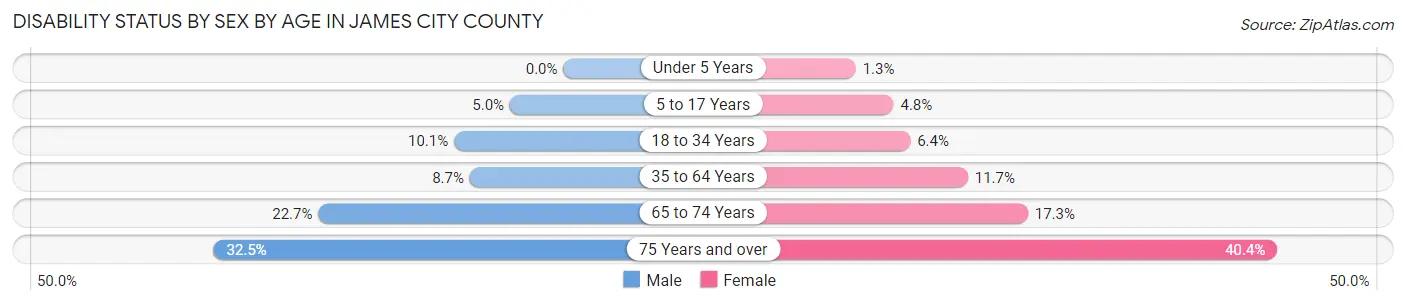
| Age Bracket | Male | Female |
| Under 5 Years | 0 (0.0%) | 24 (1.3%) |
| 5 to 17 Years | 293 (5.0%) | 273 (4.8%) |
| 18 to 34 Years | 634 (10.1%) | 401 (6.4%) |
| 35 to 64 Years | 1,166 (8.7%) | 1,769 (11.7%) |
| 65 to 74 Years | 1,172 (22.7%) | 1,077 (17.3%) |
| 75 Years and over | 1,272 (32.5%) | 2,010 (40.4%) |
Disability Class by Sex by Age in James City County
Disability Class: Hearing Difficulty
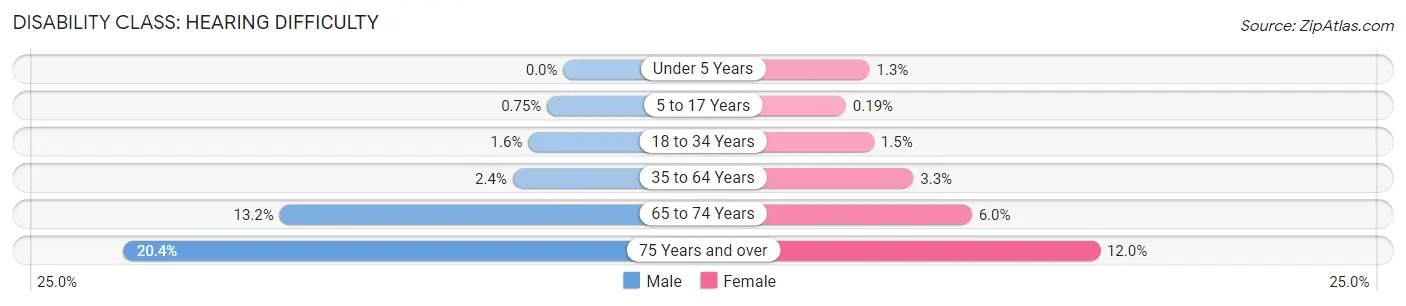
| Age Bracket | Male | Female |
| Under 5 Years | 0 (0.0%) | 24 (1.3%) |
| 5 to 17 Years | 44 (0.7%) | 11 (0.2%) |
| 18 to 34 Years | 102 (1.6%) | 94 (1.5%) |
| 35 to 64 Years | 315 (2.4%) | 502 (3.3%) |
| 65 to 74 Years | 679 (13.2%) | 376 (6.0%) |
| 75 Years and over | 799 (20.4%) | 596 (12.0%) |
Disability Class: Vision Difficulty
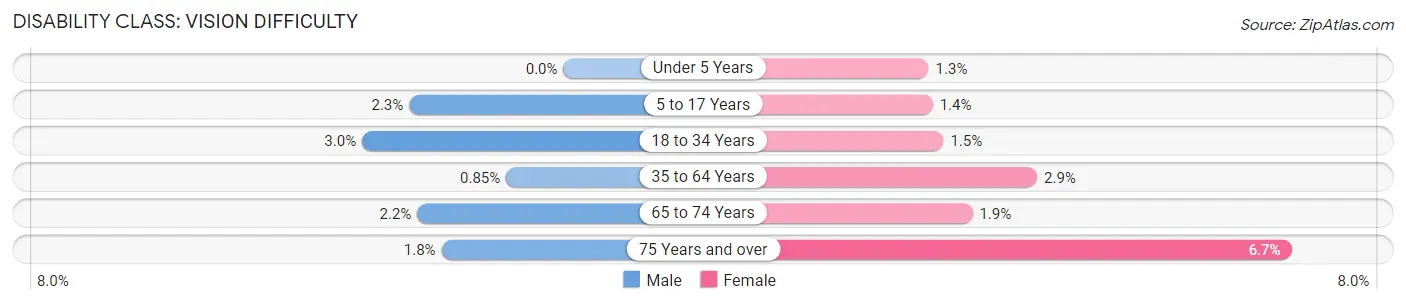
| Age Bracket | Male | Female |
| Under 5 Years | 0 (0.0%) | 24 (1.3%) |
| 5 to 17 Years | 135 (2.3%) | 77 (1.3%) |
| 18 to 34 Years | 187 (3.0%) | 95 (1.5%) |
| 35 to 64 Years | 114 (0.9%) | 439 (2.9%) |
| 65 to 74 Years | 112 (2.2%) | 121 (1.9%) |
| 75 Years and over | 71 (1.8%) | 333 (6.7%) |
Disability Class: Cognitive Difficulty
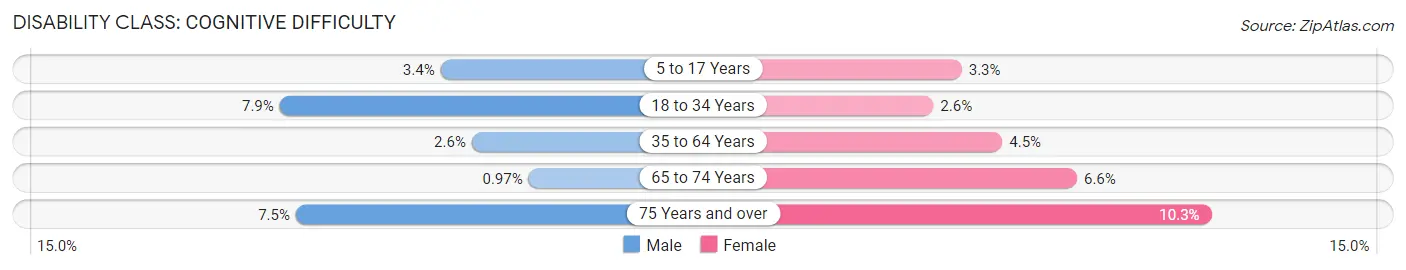
| Age Bracket | Male | Female |
| 5 to 17 Years | 202 (3.4%) | 190 (3.3%) |
| 18 to 34 Years | 494 (7.9%) | 161 (2.5%) |
| 35 to 64 Years | 343 (2.5%) | 676 (4.5%) |
| 65 to 74 Years | 50 (1.0%) | 409 (6.6%) |
| 75 Years and over | 292 (7.4%) | 512 (10.3%) |
Disability Class: Ambulatory Difficulty
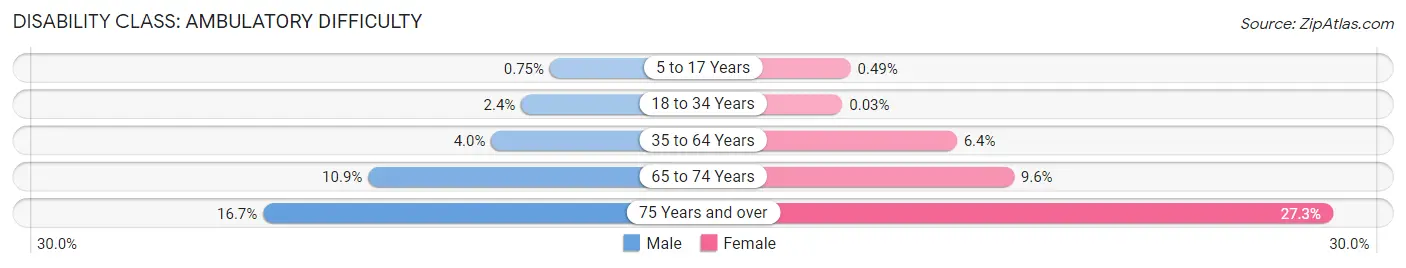
| Age Bracket | Male | Female |
| 5 to 17 Years | 44 (0.7%) | 28 (0.5%) |
| 18 to 34 Years | 147 (2.4%) | 2 (0.0%) |
| 35 to 64 Years | 538 (4.0%) | 969 (6.4%) |
| 65 to 74 Years | 560 (10.9%) | 598 (9.6%) |
| 75 Years and over | 655 (16.7%) | 1,360 (27.3%) |
Disability Class: Self-Care Difficulty
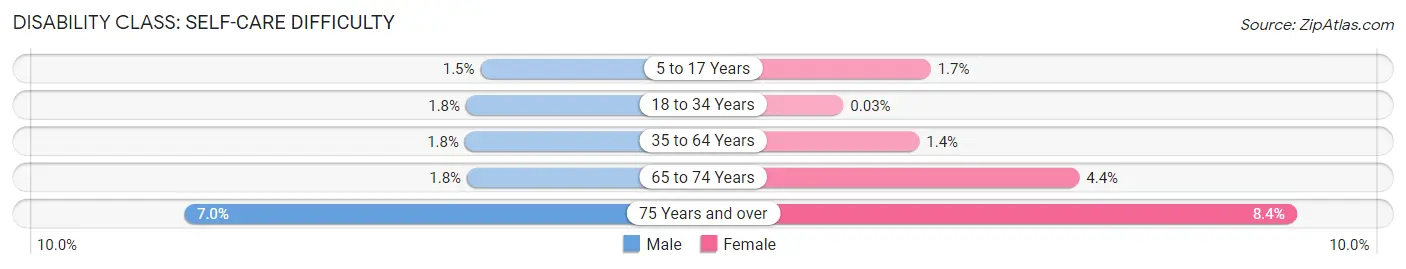
| Age Bracket | Male | Female |
| 5 to 17 Years | 91 (1.5%) | 94 (1.7%) |
| 18 to 34 Years | 113 (1.8%) | 2 (0.0%) |
| 35 to 64 Years | 246 (1.8%) | 218 (1.4%) |
| 65 to 74 Years | 92 (1.8%) | 275 (4.4%) |
| 75 Years and over | 276 (7.0%) | 420 (8.4%) |
Technology Access in James City County
Computing Device Access in James City County
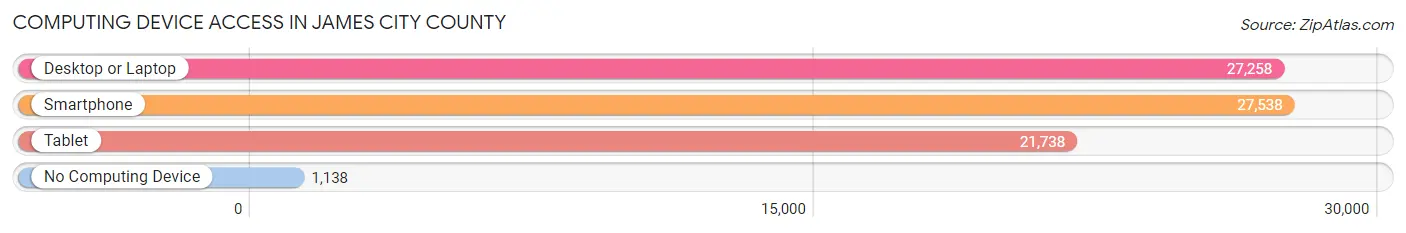
| Device Type | # Households | % Households |
| Desktop or Laptop | 27,258 | 88.8% |
| Smartphone | 27,538 | 89.7% |
| Tablet | 21,738 | 70.8% |
| No Computing Device | 1,138 | 3.7% |
| Total | 30,690 | 100.0% |
Internet Access in James City County
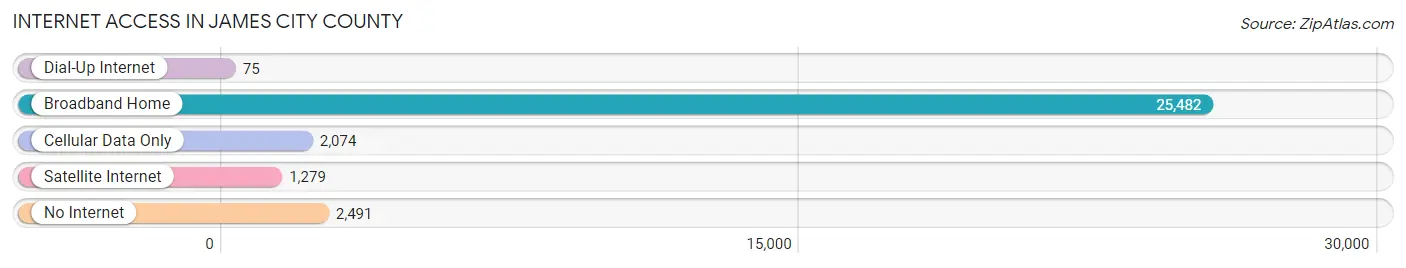
| Internet Type | # Households | % Households |
| Dial-Up Internet | 75 | 0.2% |
| Broadband Home | 25,482 | 83.0% |
| Cellular Data Only | 2,074 | 6.8% |
| Satellite Internet | 1,279 | 4.2% |
| No Internet | 2,491 | 8.1% |
| Total | 30,690 | 100.0% |
James City County Summary
James City County is a county located in the Commonwealth of Virginia. It is located on the Virginia Peninsula, between the James and York Rivers. The county seat is Williamsburg, and the county is part of the Greater Hampton Roads area. As of the 2010 census, the population was 67,009.
History
James City County was established in 1634 as one of the eight original shires of Virginia. It was named for James I of England, who had granted the Virginia Company of London a charter to settle the area. The county was originally part of the Virginia Colony, and was one of the earliest areas of English settlement in the New World.
The county was home to many of the earliest English settlements in the New World, including Jamestown, the first permanent English settlement in the Americas. The county was also home to the first representative assembly in the New World, the House of Burgesses, which met in Jamestown in 1619.
The county was also home to the first college in the New World, the College of William & Mary, which was founded in 1693. The college is still in operation today, and is the second-oldest college in the United States.
Geography
James City County is located on the Virginia Peninsula, between the James and York Rivers. The county is bordered by York County to the north, New Kent County to the east, Charles City County to the south, and the City of Williamsburg to the west.
The county is mostly flat, with some rolling hills in the northern and eastern parts of the county. The highest point in the county is located in the northern part of the county, at an elevation of approximately 200 feet.
The county is home to several state parks, including Chippokes Plantation State Park, York River State Park, and Jamestown Island State Park.
Economy
James City County has a diverse economy, with a mix of manufacturing, retail, and service industries. The county is home to several large employers, including Busch Gardens Williamsburg, Anheuser-Busch, and the Colonial Williamsburg Foundation.
The county is also home to several military installations, including Naval Weapons Station Yorktown, Camp Peary, and Fort Eustis. These installations provide a significant number of jobs to the county.
The county is also home to several tourist attractions, including Busch Gardens Williamsburg, Colonial Williamsburg, and Jamestown Settlement. These attractions bring in millions of visitors each year, and provide a significant boost to the local economy.
Demographics
As of the 2010 census, the population of James City County was 67,009. The population is predominantly white (83.3%), with African Americans making up 11.2% of the population, and Hispanics making up 4.2%.
The median household income in the county is $68,845, and the median family income is $77,845. The per capita income in the county is $35,845.
The county is home to several colleges and universities, including the College of William & Mary, Thomas Nelson Community College, and the University of Mary Washington. These institutions provide a significant number of jobs to the county.
Conclusion
James City County is a county located in the Commonwealth of Virginia. It is located on the Virginia Peninsula, between the James and York Rivers. The county has a long and rich history, and is home to many of the earliest English settlements in the New World. The county has a diverse economy, with a mix of manufacturing, retail, and service industries. The population of the county is predominantly white, with African Americans and Hispanics making up a significant portion of the population. The county is home to several colleges and universities, which provide a significant number of jobs to the county.
Common Questions
What is Per Capita Income in James City County?
Per Capita income in James City County is $50,984.
What is the Median Family Income in James City County?
Median Family Income in James City County is $121,086.
What is the Median Household income in James City County?
Median Household Income in James City County is $100,711.
What is Income or Wage Gap in James City County?
Income or Wage Gap in James City County is 29.3%.
Women in James City County earn 70.7 cents for every dollar earned by a man.
What is Family Income Deficit in James City County?
Family Income Deficit in James City County is $10,463.
Families that are below poverty line in James City County earn $10,463 less on average than the poverty threshold level.
What is Inequality or Gini Index in James City County?
Inequality or Gini Index in James City County is 0.42.
What is the Total Population of James City County?
Total Population of James City County is 78,818.
What is the Total Male Population of James City County?
Total Male Population of James City County is 38,132.
What is the Total Female Population of James City County?
Total Female Population of James City County is 40,686.
What is the Ratio of Males per 100 Females in James City County?
There are 93.72 Males per 100 Females in James City County.
What is the Ratio of Females per 100 Males in James City County?
There are 106.70 Females per 100 Males in James City County.
What is the Median Population Age in James City County?
Median Population Age in James City County is 47.1 Years.
What is the Average Family Size in James City County
Average Family Size in James City County is 3.0 People.
What is the Average Household Size in James City County
Average Household Size in James City County is 2.5 People.
How Large is the Labor Force in James City County?
There are 37,219 People in the Labor Forcein in James City County.
What is the Percentage of People in the Labor Force in James City County?
57.2% of People are in the Labor Force in James City County.
What is the Unemployment Rate in James City County?
Unemployment Rate in James City County is 3.7%.