Isle of Wight County, VA Map & Demographics
Isle of Wight County Map
Isle of Wight County Overview
$45,230
PER CAPITA INCOME
$111,147
AVG FAMILY INCOME
$91,680
AVG HOUSEHOLD INCOME
38.7%
WAGE / INCOME GAP [ % ]
61.3¢/ $1
WAGE / INCOME GAP [ $ ]
$9,091
FAMILY INCOME DEFICIT
0.44
INEQUALITY / GINI INDEX
38,898
TOTAL POPULATION
19,422
MALE POPULATION
19,476
FEMALE POPULATION
99.72
MALES / 100 FEMALES
100.28
FEMALES / 100 MALES
44.2
MEDIAN AGE
3.0
AVG FAMILY SIZE
2.5
AVG HOUSEHOLD SIZE
20,194
LABOR FORCE [ PEOPLE ]
63.7%
PERCENT IN LABOR FORCE
5.5%
UNEMPLOYMENT RATE
Isle of Wight County Area Codes
Income in Isle of Wight County
Income Overview in Isle of Wight County
Per Capita Income in Isle of Wight County is $45,230, while median incomes of families and households are $111,147 and $91,680 respectively.
| Characteristic | Number | Measure |
| Per Capita Income | 38,898 | $45,230 |
| Median Family Income | 10,846 | $111,147 |
| Mean Family Income | 10,846 | $132,370 |
| Median Household Income | 15,196 | $91,680 |
| Mean Household Income | 15,196 | $112,926 |
| Income Deficit | 10,846 | $9,091 |
| Wage / Income Gap (%) | 38,898 | 38.73% |
| Wage / Income Gap ($) | 38,898 | 61.27¢ per $1 |
| Gini / Inequality Index | 38,898 | 0.44 |
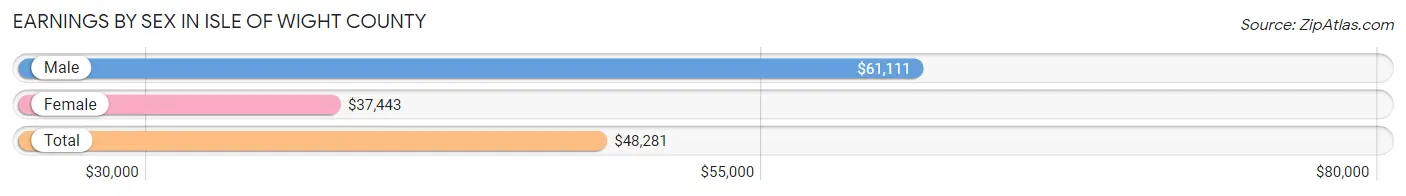
Earnings by Sex in Isle of Wight County
Average Earnings in Isle of Wight County are $48,281, $61,111 for men and $37,443 for women, a difference of 38.7%.
| Sex | Number | Average Earnings |
| Male | 11,136 (53.3%) | $61,111 |
| Female | 9,748 (46.7%) | $37,443 |
| Total | 20,884 (100.0%) | $48,281 |
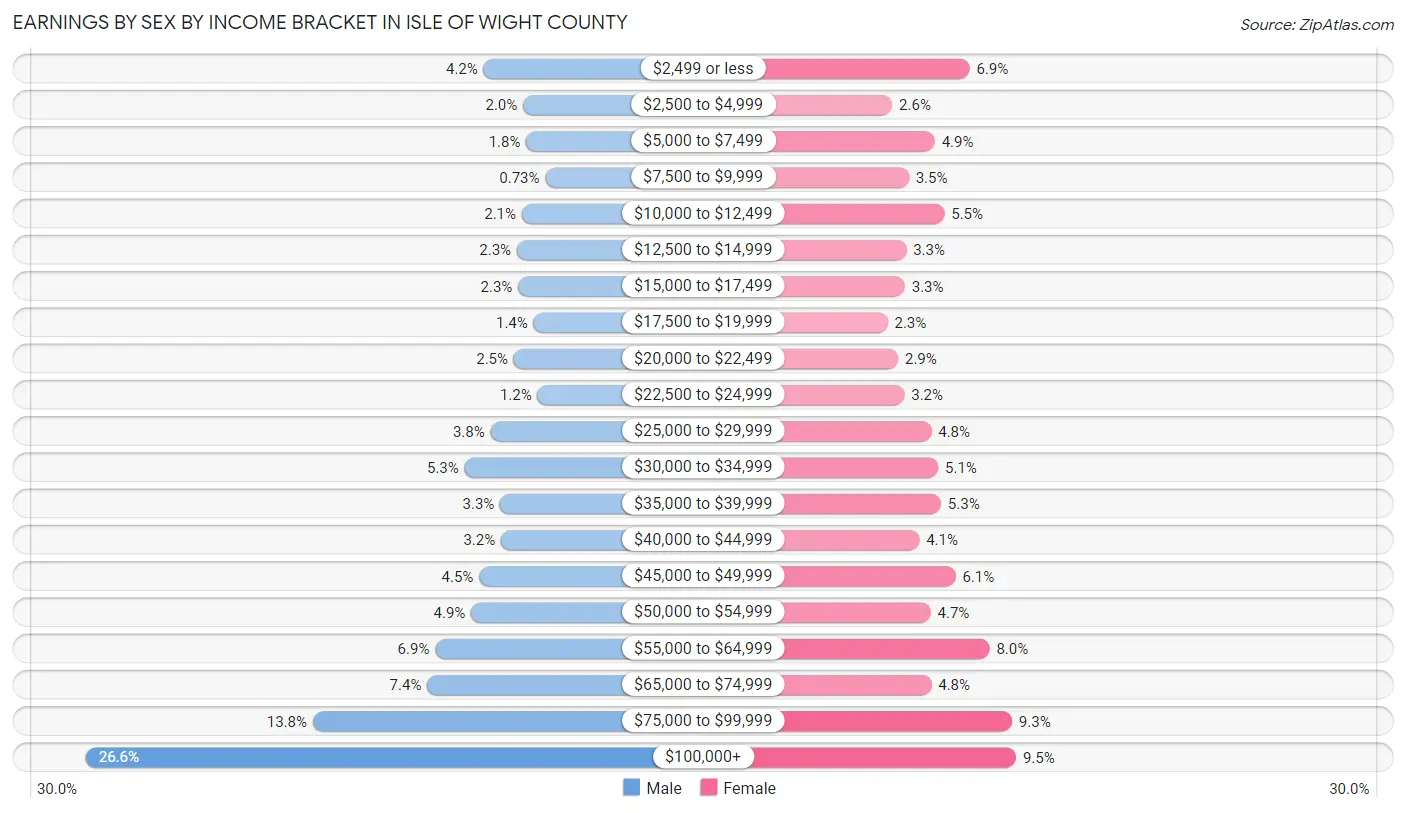
Earnings by Sex by Income Bracket in Isle of Wight County
The most common earnings brackets in Isle of Wight County are $100,000+ for men (2,958 | 26.6%) and $100,000+ for women (927 | 9.5%).
| Income | Male | Female |
| $2,499 or less | 468 (4.2%) | 673 (6.9%) |
| $2,500 to $4,999 | 221 (2.0%) | 249 (2.5%) |
| $5,000 to $7,499 | 201 (1.8%) | 482 (4.9%) |
| $7,500 to $9,999 | 81 (0.7%) | 339 (3.5%) |
| $10,000 to $12,499 | 228 (2.1%) | 534 (5.5%) |
| $12,500 to $14,999 | 260 (2.3%) | 326 (3.3%) |
| $15,000 to $17,499 | 252 (2.3%) | 318 (3.3%) |
| $17,500 to $19,999 | 155 (1.4%) | 223 (2.3%) |
| $20,000 to $22,499 | 278 (2.5%) | 281 (2.9%) |
| $22,500 to $24,999 | 130 (1.2%) | 315 (3.2%) |
| $25,000 to $29,999 | 424 (3.8%) | 463 (4.8%) |
| $30,000 to $34,999 | 587 (5.3%) | 500 (5.1%) |
| $35,000 to $39,999 | 364 (3.3%) | 516 (5.3%) |
| $40,000 to $44,999 | 359 (3.2%) | 397 (4.1%) |
| $45,000 to $49,999 | 495 (4.4%) | 596 (6.1%) |
| $50,000 to $54,999 | 546 (4.9%) | 459 (4.7%) |
| $55,000 to $64,999 | 771 (6.9%) | 782 (8.0%) |
| $65,000 to $74,999 | 821 (7.4%) | 463 (4.8%) |
| $75,000 to $99,999 | 1,537 (13.8%) | 905 (9.3%) |
| $100,000+ | 2,958 (26.6%) | 927 (9.5%) |
| Total | 11,136 (100.0%) | 9,748 (100.0%) |
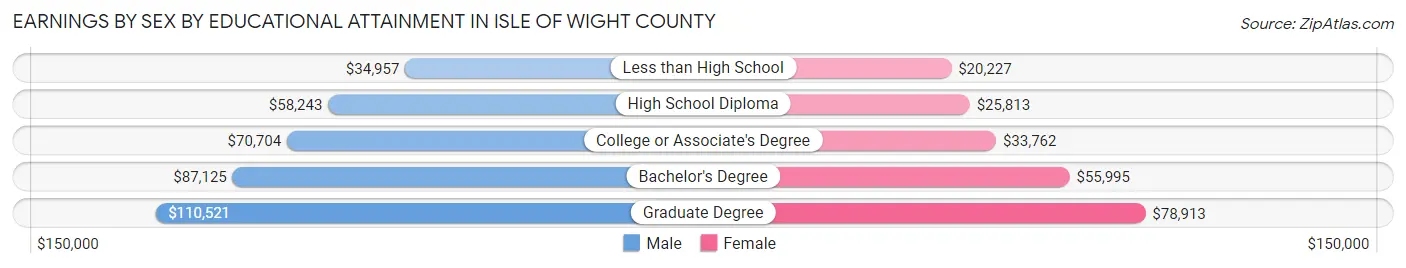
Earnings by Sex by Educational Attainment in Isle of Wight County
Average earnings in Isle of Wight County are $69,829 for men and $42,196 for women, a difference of 39.6%. Men with an educational attainment of graduate degree enjoy the highest average annual earnings of $110,521, while those with less than high school education earn the least with $34,957. Women with an educational attainment of graduate degree earn the most with the average annual earnings of $78,913, while those with less than high school education have the smallest earnings of $20,227.
| Educational Attainment | Male Income | Female Income |
| Less than High School | $34,957 | $20,227 |
| High School Diploma | $58,243 | $25,813 |
| College or Associate's Degree | $70,704 | $33,762 |
| Bachelor's Degree | $87,125 | $55,995 |
| Graduate Degree | $110,521 | $78,913 |
| Total | $69,829 | $42,196 |
Family Income in Isle of Wight County
Family Income Brackets in Isle of Wight County
According to the Isle of Wight County family income data, there are 2,484 families falling into the $100,000 to $149,999 income range, which is the most common income bracket and makes up 22.9% of all families. Conversely, the $10,000 to $14,999 income bracket is the least frequent group with only 65 families (0.6%) belonging to this category.
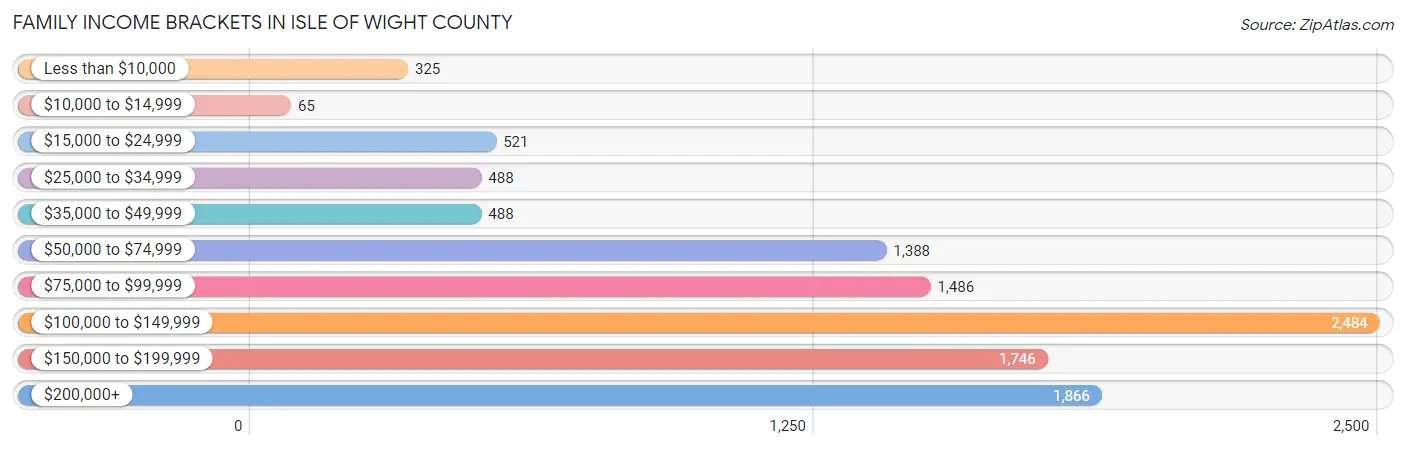
| Income Bracket | # Families | % Families |
| Less than $10,000 | 325 | 3.0% |
| $10,000 to $14,999 | 65 | 0.6% |
| $15,000 to $24,999 | 521 | 4.8% |
| $25,000 to $34,999 | 488 | 4.5% |
| $35,000 to $49,999 | 488 | 4.5% |
| $50,000 to $74,999 | 1,388 | 12.8% |
| $75,000 to $99,999 | 1,486 | 13.7% |
| $100,000 to $149,999 | 2,484 | 22.9% |
| $150,000 to $199,999 | 1,746 | 16.1% |
| $200,000+ | 1,866 | 17.2% |
Family Income by Famaliy Size in Isle of Wight County
4-person families (1,943 | 17.9%) account for the highest median family income in Isle of Wight County with $135,163 per family, while 2-person families (5,288 | 48.8%) have the highest median income of $46,560 per family member.
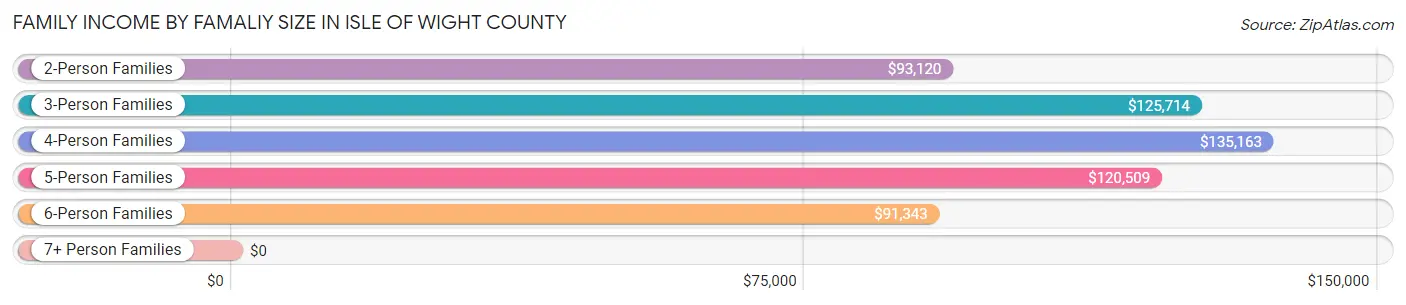
| Income Bracket | # Families | Median Income |
| 2-Person Families | 5,288 (48.8%) | $93,120 |
| 3-Person Families | 2,560 (23.6%) | $125,714 |
| 4-Person Families | 1,943 (17.9%) | $135,163 |
| 5-Person Families | 753 (6.9%) | $120,509 |
| 6-Person Families | 283 (2.6%) | $91,343 |
| 7+ Person Families | 19 (0.2%) | $0 |
| Total | 10,846 (100.0%) | $111,147 |
Family Income by Number of Earners in Isle of Wight County
The median family income in Isle of Wight County is $111,147, with families comprising 3+ earners (1,191) having the highest median family income of $155,875, while families with no earners (1,618) have the lowest median family income of $63,902, accounting for 11.0% and 14.9% of families, respectively.
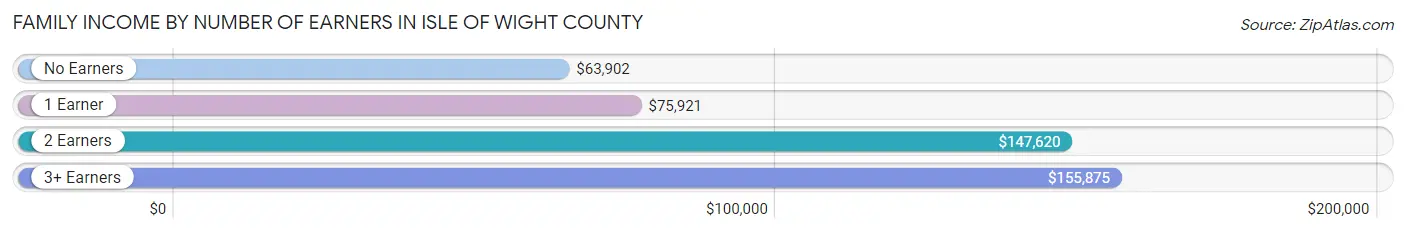
| Number of Earners | # Families | Median Income |
| No Earners | 1,618 (14.9%) | $63,902 |
| 1 Earner | 3,238 (29.8%) | $75,921 |
| 2 Earners | 4,799 (44.3%) | $147,620 |
| 3+ Earners | 1,191 (11.0%) | $155,875 |
| Total | 10,846 (100.0%) | $111,147 |
Household Income in Isle of Wight County
Household Income Brackets in Isle of Wight County
With 3,161 households falling in the category, the $100,000 to $149,999 income range is the most frequent in Isle of Wight County, accounting for 20.8% of all households. In contrast, only 410 households (2.7%) fall into the $10,000 to $14,999 income bracket, making it the least populous group.
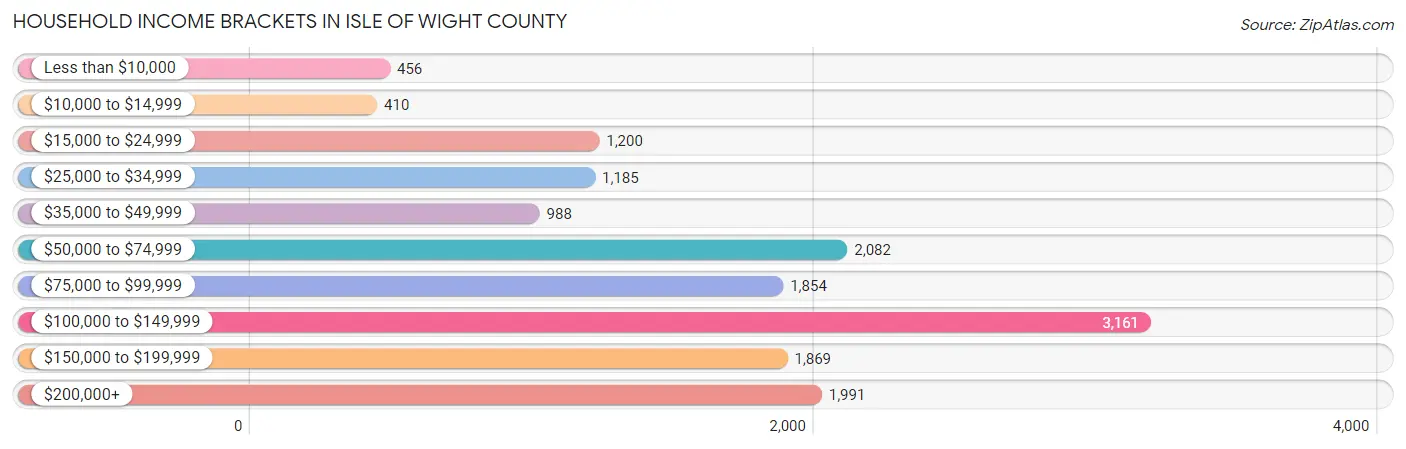
| Income Bracket | # Households | % Households |
| Less than $10,000 | 456 | 3.0% |
| $10,000 to $14,999 | 410 | 2.7% |
| $15,000 to $24,999 | 1,200 | 7.9% |
| $25,000 to $34,999 | 1,185 | 7.8% |
| $35,000 to $49,999 | 988 | 6.5% |
| $50,000 to $74,999 | 2,082 | 13.7% |
| $75,000 to $99,999 | 1,854 | 12.2% |
| $100,000 to $149,999 | 3,161 | 20.8% |
| $150,000 to $199,999 | 1,869 | 12.3% |
| $200,000+ | 1,991 | 13.1% |
Household Income by Householder Age in Isle of Wight County
The median household income in Isle of Wight County is $91,680, with the highest median household income of $109,592 found in the 25 to 44 years age bracket for the primary householder. A total of 4,175 households (27.5%) fall into this category. Meanwhile, the 65+ years age bracket for the primary householder has the lowest median household income of $60,199, with 4,591 households (30.2%) in this group.
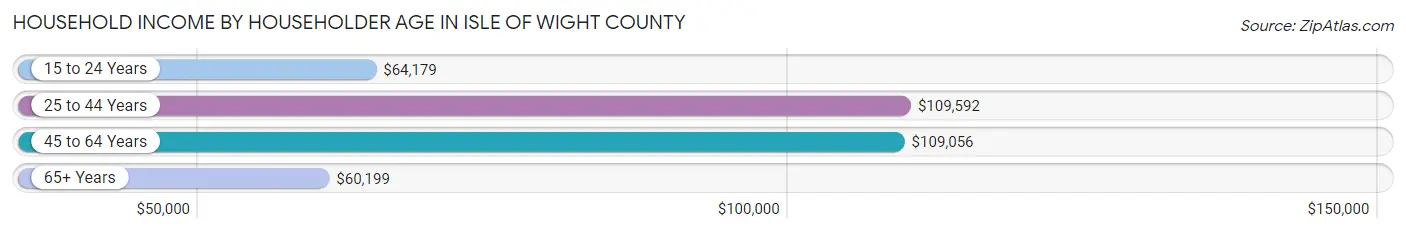
| Income Bracket | # Households | Median Income |
| 15 to 24 Years | 261 (1.7%) | $64,179 |
| 25 to 44 Years | 4,175 (27.5%) | $109,592 |
| 45 to 64 Years | 6,169 (40.6%) | $109,056 |
| 65+ Years | 4,591 (30.2%) | $60,199 |
| Total | 15,196 (100.0%) | $91,680 |
Poverty in Isle of Wight County
Income Below Poverty by Sex and Age in Isle of Wight County
With 7.1% poverty level for males and 12.4% for females among the residents of Isle of Wight County, 15 year old males and 5 year old females are the most vulnerable to poverty, with 84 males (27.4%) and 86 females (38.6%) in their respective age groups living below the poverty level.
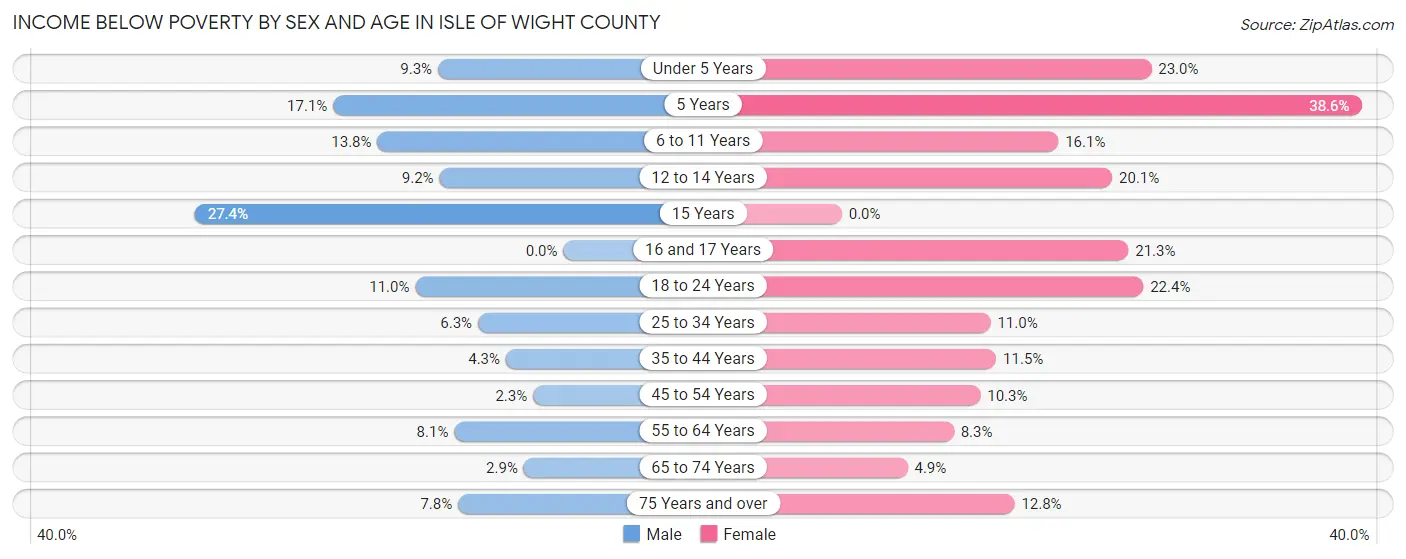
| Age Bracket | Male | Female |
| Under 5 Years | 95 (9.3%) | 205 (23.0%) |
| 5 Years | 34 (17.1%) | 86 (38.6%) |
| 6 to 11 Years | 215 (13.8%) | 189 (16.1%) |
| 12 to 14 Years | 64 (9.2%) | 165 (20.1%) |
| 15 Years | 84 (27.4%) | 0 (0.0%) |
| 16 and 17 Years | 0 (0.0%) | 114 (21.3%) |
| 18 to 24 Years | 161 (11.0%) | 301 (22.4%) |
| 25 to 34 Years | 130 (6.3%) | 231 (11.0%) |
| 35 to 44 Years | 104 (4.3%) | 271 (11.5%) |
| 45 to 54 Years | 56 (2.2%) | 261 (10.3%) |
| 55 to 64 Years | 266 (8.1%) | 259 (8.3%) |
| 65 to 74 Years | 62 (2.9%) | 114 (4.9%) |
| 75 Years and over | 98 (7.8%) | 206 (12.8%) |
| Total | 1,369 (7.1%) | 2,402 (12.4%) |
Income Above Poverty by Sex and Age in Isle of Wight County
According to the poverty statistics in Isle of Wight County, males aged 16 and 17 years and females aged 15 years are the age groups that are most secure financially, with 100.0% of males and 100.0% of females in these age groups living above the poverty line.
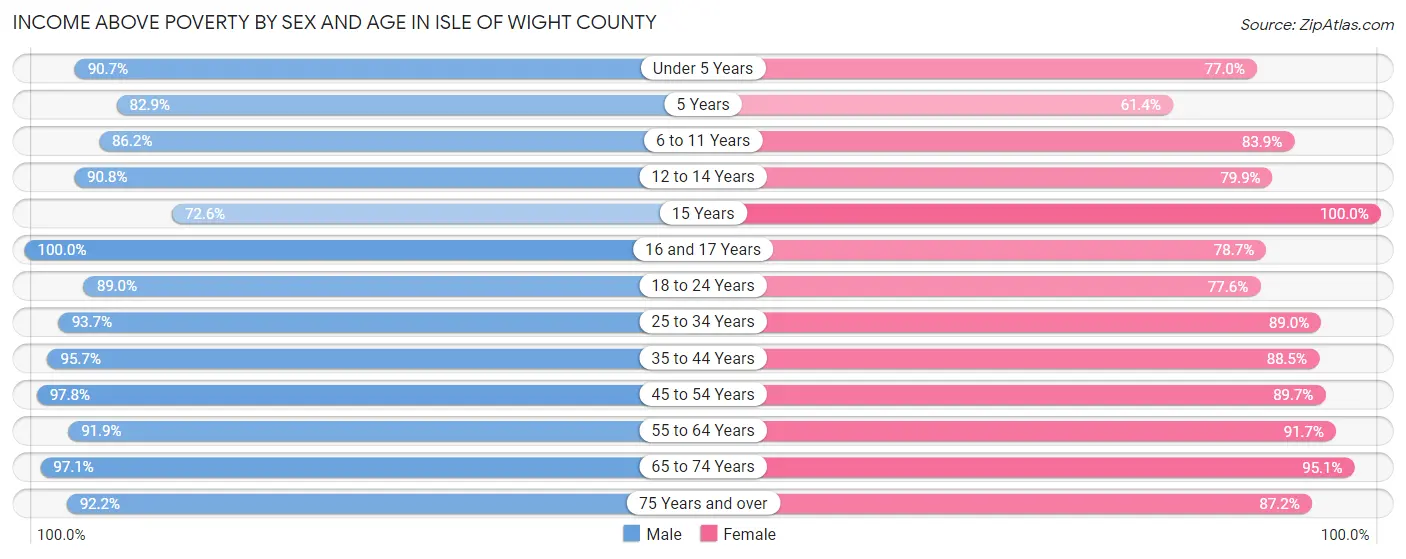
| Age Bracket | Male | Female |
| Under 5 Years | 925 (90.7%) | 687 (77.0%) |
| 5 Years | 165 (82.9%) | 137 (61.4%) |
| 6 to 11 Years | 1,342 (86.2%) | 987 (83.9%) |
| 12 to 14 Years | 632 (90.8%) | 657 (79.9%) |
| 15 Years | 223 (72.6%) | 247 (100.0%) |
| 16 and 17 Years | 466 (100.0%) | 422 (78.7%) |
| 18 to 24 Years | 1,304 (89.0%) | 1,044 (77.6%) |
| 25 to 34 Years | 1,921 (93.7%) | 1,862 (89.0%) |
| 35 to 44 Years | 2,329 (95.7%) | 2,093 (88.5%) |
| 45 to 54 Years | 2,436 (97.8%) | 2,278 (89.7%) |
| 55 to 64 Years | 3,019 (91.9%) | 2,858 (91.7%) |
| 65 to 74 Years | 2,044 (97.1%) | 2,223 (95.1%) |
| 75 Years and over | 1,155 (92.2%) | 1,401 (87.2%) |
| Total | 17,961 (92.9%) | 16,896 (87.5%) |
Income Below Poverty Among Married-Couple Families in Isle of Wight County
The poverty statistics for married-couple families in Isle of Wight County show that 4.2% or 371 of the total 8,750 families live below the poverty line. Families with 3 or 4 children have the highest poverty rate of 10.9%, comprising of 65 families. On the other hand, families with 1 or 2 children have the lowest poverty rate of 1.4%, which includes 38 families.
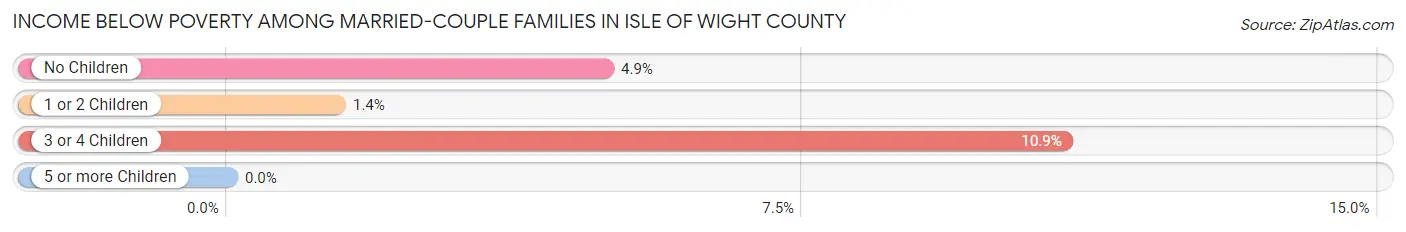
| Children | Above Poverty | Below Poverty |
| No Children | 5,194 (95.1%) | 268 (4.9%) |
| 1 or 2 Children | 2,654 (98.6%) | 38 (1.4%) |
| 3 or 4 Children | 531 (89.1%) | 65 (10.9%) |
| 5 or more Children | 0 (0.0%) | 0 (0.0%) |
| Total | 8,379 (95.8%) | 371 (4.2%) |
Income Below Poverty Among Single-Parent Households in Isle of Wight County
According to the poverty data in Isle of Wight County, 7.6% or 39 single-father households and 28.0% or 444 single-mother households are living below the poverty line. Among single-father households, those with 1 or 2 children have the highest poverty rate, with 39 households (19.4%) experiencing poverty. Likewise, among single-mother households, those with 5 or more children have the highest poverty rate, with 4 households (100.0%) falling below the poverty line.
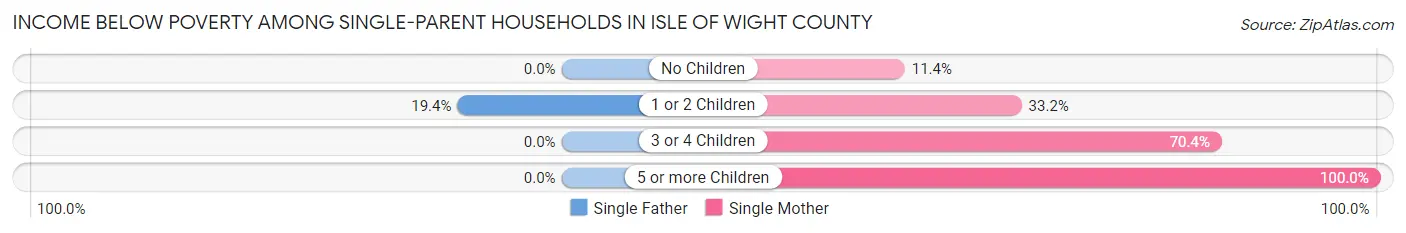
| Children | Single Father | Single Mother |
| No Children | 0 (0.0%) | 77 (11.4%) |
| 1 or 2 Children | 39 (19.4%) | 244 (33.2%) |
| 3 or 4 Children | 0 (0.0%) | 119 (70.4%) |
| 5 or more Children | 0 (0.0%) | 4 (100.0%) |
| Total | 39 (7.6%) | 444 (28.0%) |
Income Below Poverty Among Married-Couple vs Single-Parent Households in Isle of Wight County
The poverty data for Isle of Wight County shows that 371 of the married-couple family households (4.2%) and 483 of the single-parent households (23.0%) are living below the poverty level. Within the married-couple family households, those with 3 or 4 children have the highest poverty rate, with 65 households (10.9%) falling below the poverty line. Among the single-parent households, those with 3 or 4 children have the highest poverty rate, with 119 household (70.4%) living below poverty.
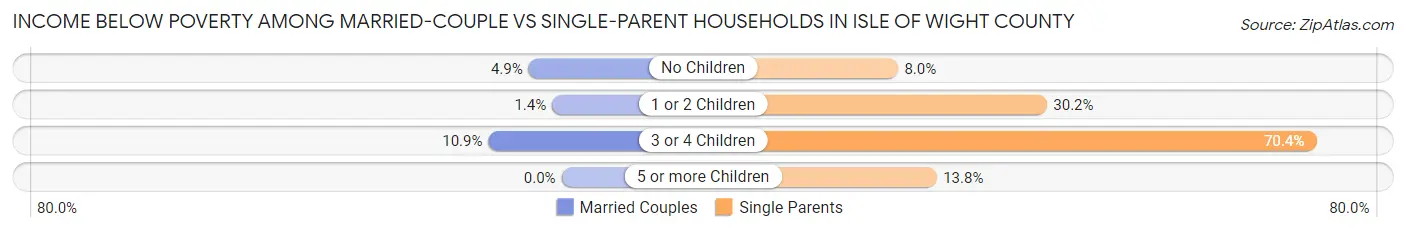
| Children | Married-Couple Families | Single-Parent Households |
| No Children | 268 (4.9%) | 77 (8.0%) |
| 1 or 2 Children | 38 (1.4%) | 283 (30.2%) |
| 3 or 4 Children | 65 (10.9%) | 119 (70.4%) |
| 5 or more Children | 0 (0.0%) | 4 (13.8%) |
| Total | 371 (4.2%) | 483 (23.0%) |
Race in Isle of Wight County
The most populous races in Isle of Wight County are White / Caucasian (27,388 | 70.4%), Black / African American (8,595 | 22.1%), and Two or more Races (1,802 | 4.6%).
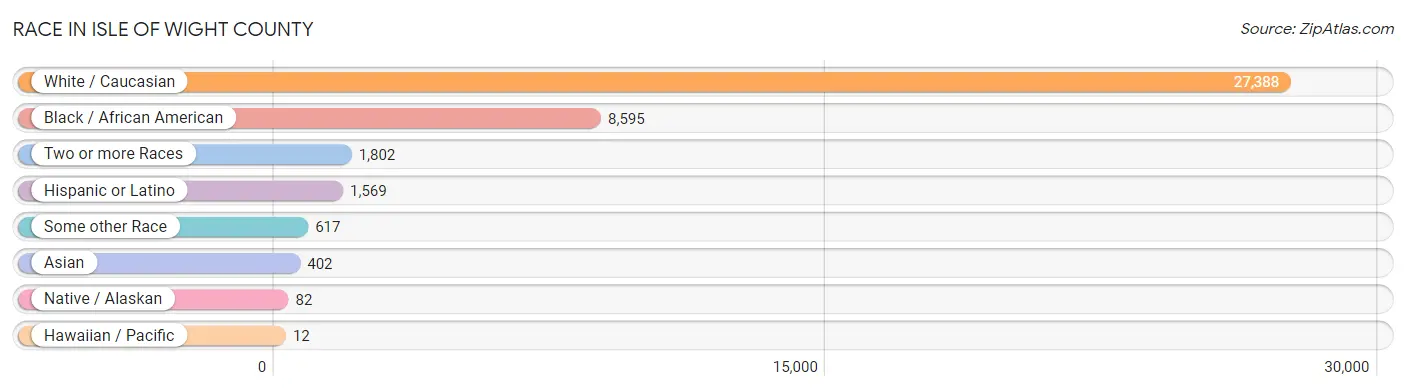
| Race | # Population | % Population |
| Asian | 402 | 1.0% |
| Black / African American | 8,595 | 22.1% |
| Hawaiian / Pacific | 12 | 0.0% |
| Hispanic or Latino | 1,569 | 4.0% |
| Native / Alaskan | 82 | 0.2% |
| White / Caucasian | 27,388 | 70.4% |
| Two or more Races | 1,802 | 4.6% |
| Some other Race | 617 | 1.6% |
| Total | 38,898 | 100.0% |
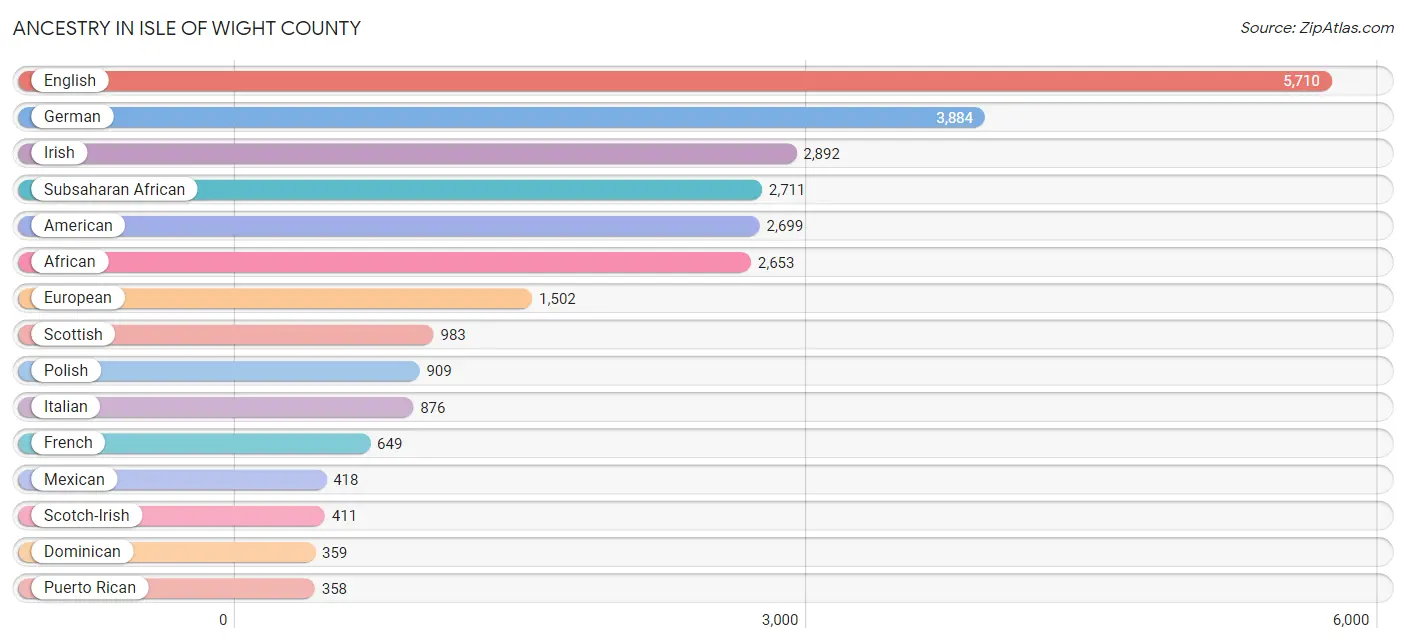
Ancestry in Isle of Wight County
The most populous ancestries reported in Isle of Wight County are English (5,710 | 14.7%), German (3,884 | 10.0%), Irish (2,892 | 7.4%), Subsaharan African (2,711 | 7.0%), and American (2,699 | 6.9%), together accounting for 46.0% of all Isle of Wight County residents.
| Ancestry | # Population | % Population |
| African | 2,653 | 6.8% |
| American | 2,699 | 6.9% |
| Apache | 59 | 0.2% |
| Arab | 16 | 0.0% |
| Austrian | 36 | 0.1% |
| Belgian | 13 | 0.0% |
| Bhutanese | 71 | 0.2% |
| Blackfeet | 50 | 0.1% |
| Bolivian | 39 | 0.1% |
| British | 239 | 0.6% |
| Burmese | 231 | 0.6% |
| Cape Verdean | 7 | 0.0% |
| Celtic | 8 | 0.0% |
| Central American | 63 | 0.2% |
| Cherokee | 284 | 0.7% |
| Chippewa | 15 | 0.0% |
| Colombian | 12 | 0.0% |
| Croatian | 16 | 0.0% |
| Crow | 2 | 0.0% |
| Cuban | 143 | 0.4% |
| Cypriot | 8 | 0.0% |
| Czech | 154 | 0.4% |
| Czechoslovakian | 9 | 0.0% |
| Danish | 76 | 0.2% |
| Dominican | 359 | 0.9% |
| Dutch | 264 | 0.7% |
| Eastern European | 93 | 0.2% |
| Ecuadorian | 12 | 0.0% |
| English | 5,710 | 14.7% |
| European | 1,502 | 3.9% |
| Finnish | 105 | 0.3% |
| French | 649 | 1.7% |
| French American Indian | 4 | 0.0% |
| French Canadian | 151 | 0.4% |
| German | 3,884 | 10.0% |
| Greek | 146 | 0.4% |
| Guatemalan | 62 | 0.2% |
| Honduran | 1 | 0.0% |
| Hungarian | 88 | 0.2% |
| Indian (Asian) | 11 | 0.0% |
| Irish | 2,892 | 7.4% |
| Iroquois | 21 | 0.1% |
| Italian | 876 | 2.2% |
| Jamaican | 135 | 0.4% |
| Korean | 303 | 0.8% |
| Lebanese | 16 | 0.0% |
| Lithuanian | 37 | 0.1% |
| Malaysian | 39 | 0.1% |
| Mexican | 418 | 1.1% |
| Native Hawaiian | 87 | 0.2% |
| Northern European | 45 | 0.1% |
| Norwegian | 185 | 0.5% |
| Pennsylvania German | 6 | 0.0% |
| Peruvian | 45 | 0.1% |
| Polish | 909 | 2.3% |
| Portuguese | 48 | 0.1% |
| Puerto Rican | 358 | 0.9% |
| Romanian | 15 | 0.0% |
| Russian | 231 | 0.6% |
| Scandinavian | 239 | 0.6% |
| Scotch-Irish | 411 | 1.1% |
| Scottish | 983 | 2.5% |
| Slavic | 7 | 0.0% |
| Slovak | 7 | 0.0% |
| South African | 28 | 0.1% |
| South American | 158 | 0.4% |
| Spaniard | 56 | 0.1% |
| Sri Lankan | 115 | 0.3% |
| Subsaharan African | 2,711 | 7.0% |
| Swedish | 195 | 0.5% |
| Swiss | 28 | 0.1% |
| Ukrainian | 21 | 0.1% |
| Venezuelan | 50 | 0.1% |
| Welsh | 285 | 0.7% |
| West Indian | 2 | 0.0% | View All 75 Rows |
Immigrants in Isle of Wight County
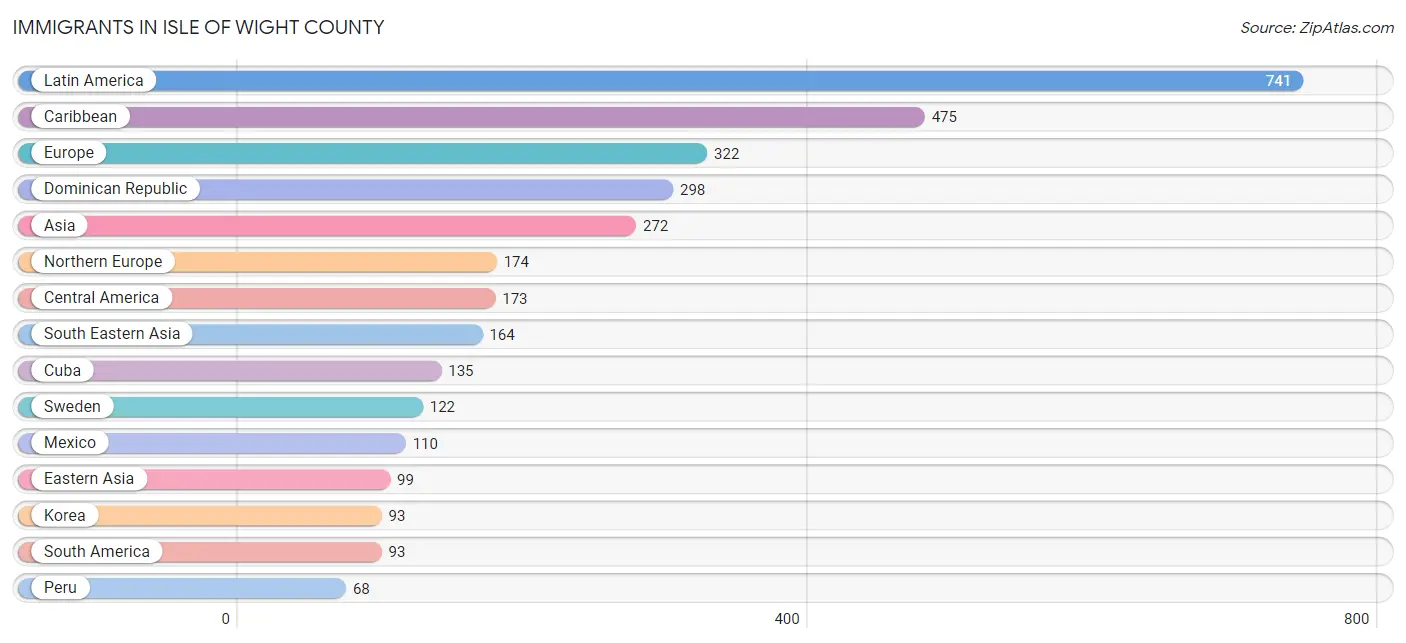
The most numerous immigrant groups reported in Isle of Wight County came from Latin America (741 | 1.9%), Caribbean (475 | 1.2%), Europe (322 | 0.8%), Dominican Republic (298 | 0.8%), and Asia (272 | 0.7%), together accounting for 5.4% of all Isle of Wight County residents.
| Immigration Origin | # Population | % Population |
| Africa | 27 | 0.1% |
| Asia | 272 | 0.7% |
| Azores | 14 | 0.0% |
| Bolivia | 13 | 0.0% |
| Cambodia | 65 | 0.2% |
| Canada | 25 | 0.1% |
| Caribbean | 475 | 1.2% |
| Central America | 173 | 0.4% |
| China | 6 | 0.0% |
| Colombia | 12 | 0.0% |
| Congo | 8 | 0.0% |
| Cuba | 135 | 0.4% |
| Czechoslovakia | 10 | 0.0% |
| Dominican Republic | 298 | 0.8% |
| Eastern Africa | 9 | 0.0% |
| Eastern Asia | 99 | 0.3% |
| Eastern Europe | 58 | 0.2% |
| England | 39 | 0.1% |
| Europe | 322 | 0.8% |
| Germany | 24 | 0.1% |
| Guatemala | 62 | 0.2% |
| Honduras | 1 | 0.0% |
| Jamaica | 42 | 0.1% |
| Korea | 93 | 0.2% |
| Laos | 11 | 0.0% |
| Latin America | 741 | 1.9% |
| Mexico | 110 | 0.3% |
| Middle Africa | 8 | 0.0% |
| Netherlands | 18 | 0.1% |
| Northern Europe | 174 | 0.4% |
| Peru | 68 | 0.2% |
| Philippines | 60 | 0.2% |
| Portugal | 14 | 0.0% |
| Russia | 48 | 0.1% |
| South America | 93 | 0.2% |
| South Central Asia | 9 | 0.0% |
| South Eastern Asia | 164 | 0.4% |
| Southern Europe | 14 | 0.0% |
| Sweden | 122 | 0.3% |
| Switzerland | 14 | 0.0% |
| Vietnam | 28 | 0.1% |
| Western Africa | 10 | 0.0% |
| Western Europe | 56 | 0.1% | View All 43 Rows |
Sex and Age in Isle of Wight County
Sex and Age in Isle of Wight County
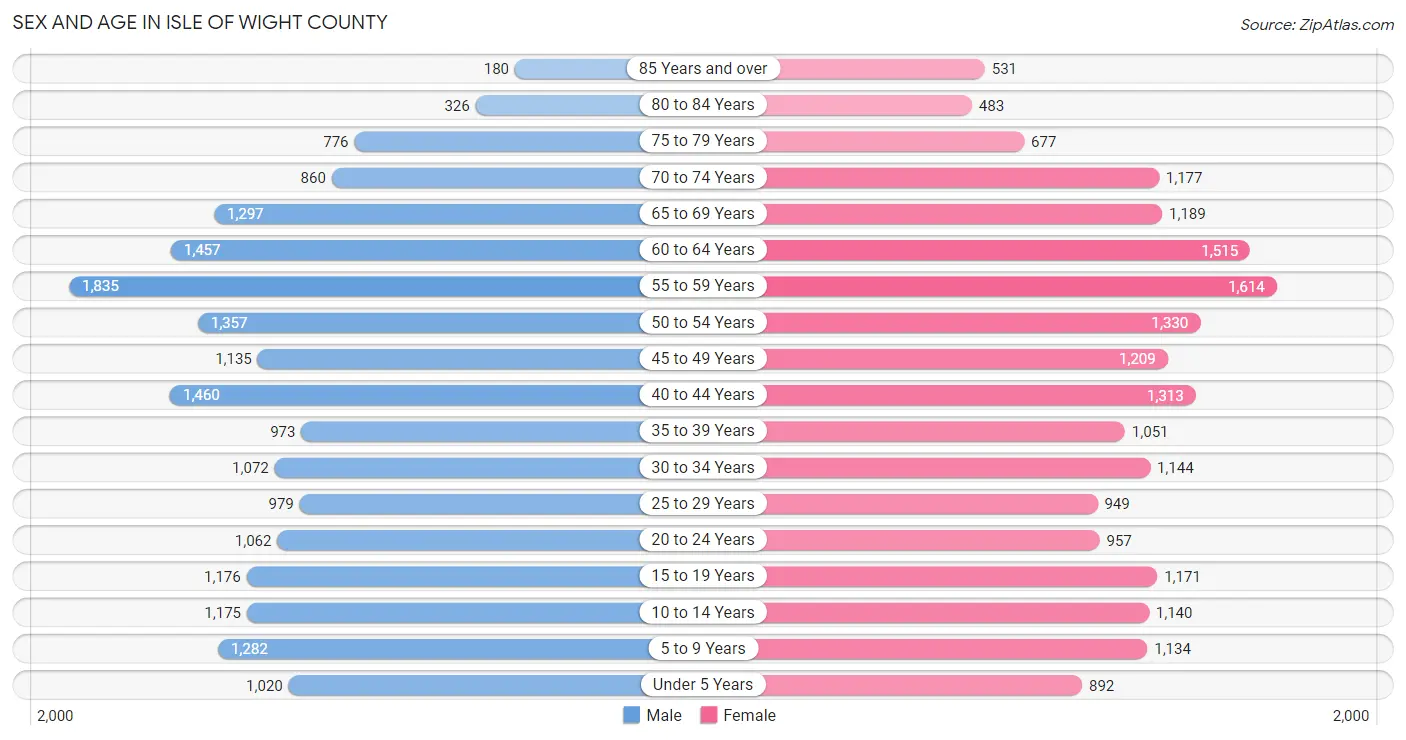
The most populous age groups in Isle of Wight County are 55 to 59 Years (1,835 | 9.5%) for men and 55 to 59 Years (1,614 | 8.3%) for women.
| Age Bracket | Male | Female |
| Under 5 Years | 1,020 (5.2%) | 892 (4.6%) |
| 5 to 9 Years | 1,282 (6.6%) | 1,134 (5.8%) |
| 10 to 14 Years | 1,175 (6.0%) | 1,140 (5.9%) |
| 15 to 19 Years | 1,176 (6.0%) | 1,171 (6.0%) |
| 20 to 24 Years | 1,062 (5.5%) | 957 (4.9%) |
| 25 to 29 Years | 979 (5.0%) | 949 (4.9%) |
| 30 to 34 Years | 1,072 (5.5%) | 1,144 (5.9%) |
| 35 to 39 Years | 973 (5.0%) | 1,051 (5.4%) |
| 40 to 44 Years | 1,460 (7.5%) | 1,313 (6.7%) |
| 45 to 49 Years | 1,135 (5.8%) | 1,209 (6.2%) |
| 50 to 54 Years | 1,357 (7.0%) | 1,330 (6.8%) |
| 55 to 59 Years | 1,835 (9.5%) | 1,614 (8.3%) |
| 60 to 64 Years | 1,457 (7.5%) | 1,515 (7.8%) |
| 65 to 69 Years | 1,297 (6.7%) | 1,189 (6.1%) |
| 70 to 74 Years | 860 (4.4%) | 1,177 (6.0%) |
| 75 to 79 Years | 776 (4.0%) | 677 (3.5%) |
| 80 to 84 Years | 326 (1.7%) | 483 (2.5%) |
| 85 Years and over | 180 (0.9%) | 531 (2.7%) |
| Total | 19,422 (100.0%) | 19,476 (100.0%) |
Families and Households in Isle of Wight County
Median Family Size in Isle of Wight County
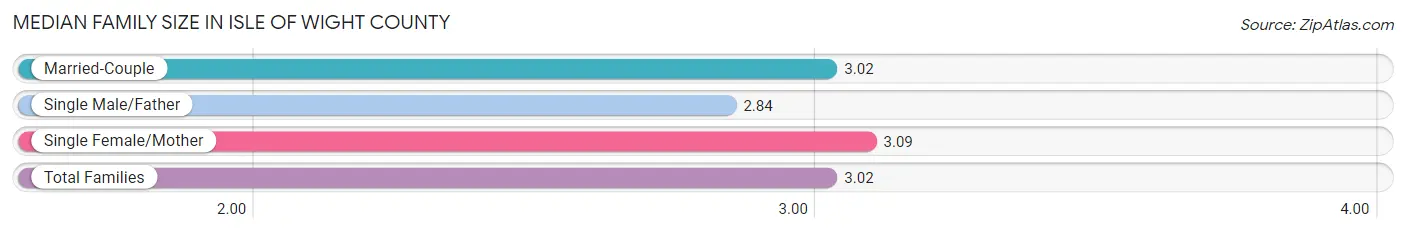
The median family size in Isle of Wight County is 3.02 persons per family, with single female/mother families (1,585 | 14.6%) accounting for the largest median family size of 3.09 persons per family. On the other hand, single male/father families (511 | 4.7%) represent the smallest median family size with 2.84 persons per family.
| Family Type | # Families | Family Size |
| Married-Couple | 8,750 (80.7%) | 3.02 |
| Single Male/Father | 511 (4.7%) | 2.84 |
| Single Female/Mother | 1,585 (14.6%) | 3.09 |
| Total Families | 10,846 (100.0%) | 3.02 |
Median Household Size in Isle of Wight County
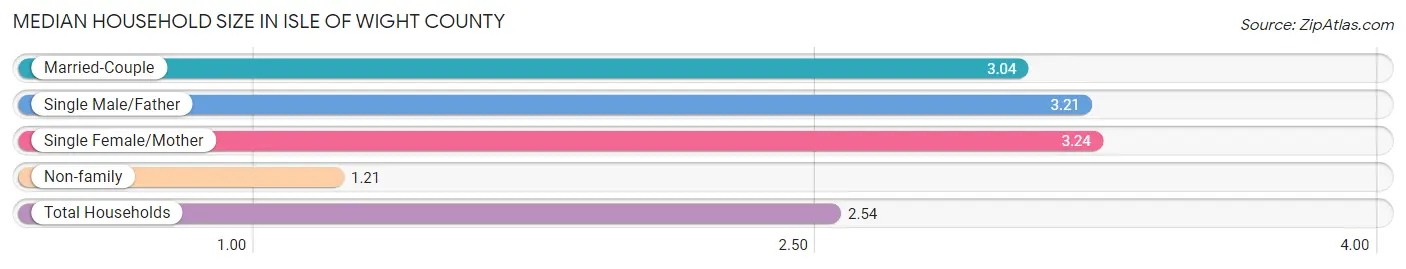
The median household size in Isle of Wight County is 2.54 persons per household, with single female/mother households (1,585 | 10.4%) accounting for the largest median household size of 3.24 persons per household. non-family households (4,350 | 28.6%) represent the smallest median household size with 1.21 persons per household.
| Household Type | # Households | Household Size |
| Married-Couple | 8,750 (57.6%) | 3.04 |
| Single Male/Father | 511 (3.4%) | 3.21 |
| Single Female/Mother | 1,585 (10.4%) | 3.24 |
| Non-family | 4,350 (28.6%) | 1.21 |
| Total Households | 15,196 (100.0%) | 2.54 |
Household Size by Marriage Status in Isle of Wight County
Out of a total of 15,196 households in Isle of Wight County, 10,846 (71.4%) are family households, while 4,350 (28.6%) are nonfamily households. The most numerous type of family households are 2-person households, comprising 5,098, and the most common type of nonfamily households are 1-person households, comprising 3,589.
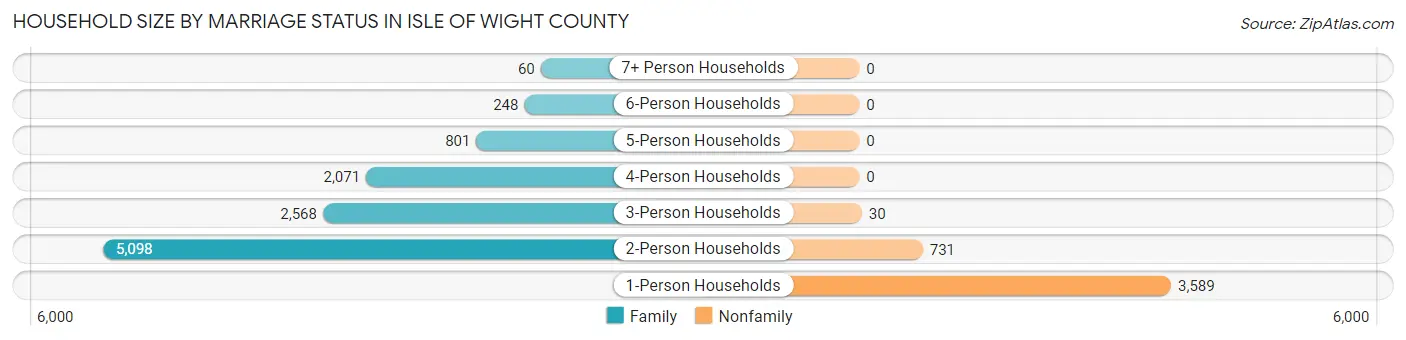
| Household Size | Family Households | Nonfamily Households |
| 1-Person Households | - | 3,589 (23.6%) |
| 2-Person Households | 5,098 (33.6%) | 731 (4.8%) |
| 3-Person Households | 2,568 (16.9%) | 30 (0.2%) |
| 4-Person Households | 2,071 (13.6%) | 0 (0.0%) |
| 5-Person Households | 801 (5.3%) | 0 (0.0%) |
| 6-Person Households | 248 (1.6%) | 0 (0.0%) |
| 7+ Person Households | 60 (0.4%) | 0 (0.0%) |
| Total | 10,846 (71.4%) | 4,350 (28.6%) |
Female Fertility in Isle of Wight County
Fertility by Age in Isle of Wight County
Average fertility rate in Isle of Wight County is 39.0 births per 1,000 women. Women in the age bracket of 20 to 34 years have the highest fertility rate with 83.0 births per 1,000 women. Women in the age bracket of 20 to 34 years acount for 79.2% of all women with births.
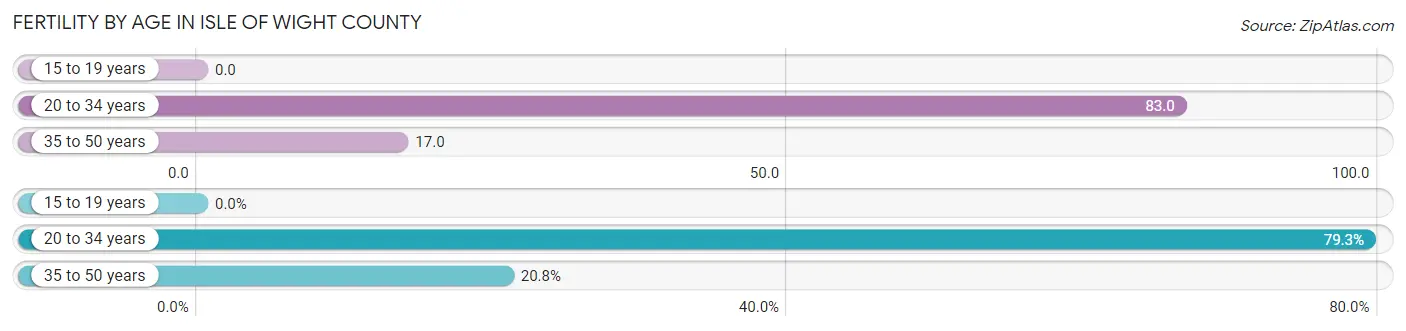
| Age Bracket | Women with Births | Births / 1,000 Women |
| 15 to 19 years | 0 (0.0%) | 0.0 |
| 20 to 34 years | 252 (79.2%) | 83.0 |
| 35 to 50 years | 66 (20.7%) | 17.0 |
| Total | 318 (100.0%) | 39.0 |
Fertility by Age by Marriage Status in Isle of Wight County
84.6% of women with births (318) in Isle of Wight County are married. The highest percentage of unmarried women with births falls into 20 to 34 years age bracket with 17.1% of them unmarried at the time of birth, while the lowest percentage of unmarried women with births belong to 35 to 50 years age bracket with 9.1% of them unmarried.
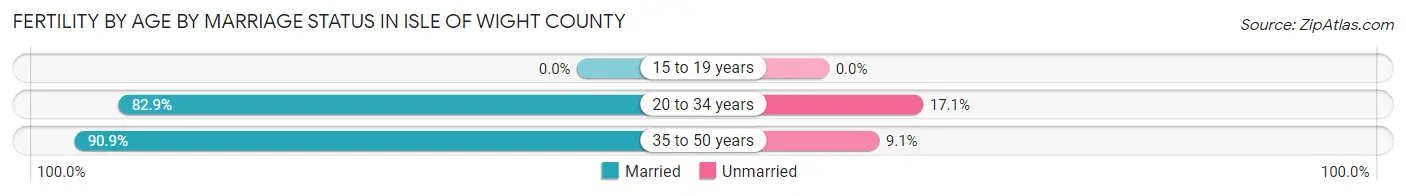
| Age Bracket | Married | Unmarried |
| 15 to 19 years | 0 (0.0%) | 0 (0.0%) |
| 20 to 34 years | 209 (82.9%) | 43 (17.1%) |
| 35 to 50 years | 60 (90.9%) | 6 (9.1%) |
| Total | 269 (84.6%) | 49 (15.4%) |
Fertility by Education in Isle of Wight County
Average fertility rate in Isle of Wight County is 39.0 births per 1,000 women. Women with the education attainment of high school diploma have the highest fertility rate of 64.0 births per 1,000 women, while women with the education attainment of less than high school have the lowest fertility at 13.0 births per 1,000 women. Women with the education attainment of high school diploma represent 30.8% of all women with births.
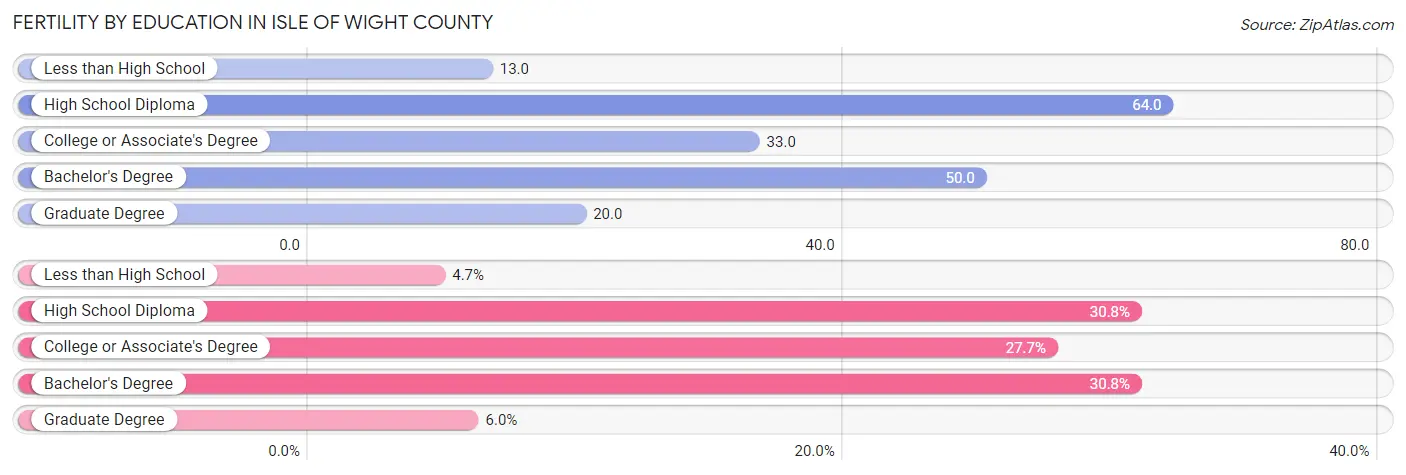
| Educational Attainment | Women with Births | Births / 1,000 Women |
| Less than High School | 15 (4.7%) | 13.0 |
| High School Diploma | 98 (30.8%) | 64.0 |
| College or Associate's Degree | 88 (27.7%) | 33.0 |
| Bachelor's Degree | 98 (30.8%) | 50.0 |
| Graduate Degree | 19 (6.0%) | 20.0 |
| Total | 318 (100.0%) | 39.0 |
Fertility by Education by Marriage Status in Isle of Wight County
15.4% of women with births in Isle of Wight County are unmarried. Women with the educational attainment of less than high school are most likely to be married with 100.0% of them married at childbirth, while women with the educational attainment of high school diploma are least likely to be married with 35.7% of them unmarried at childbirth.
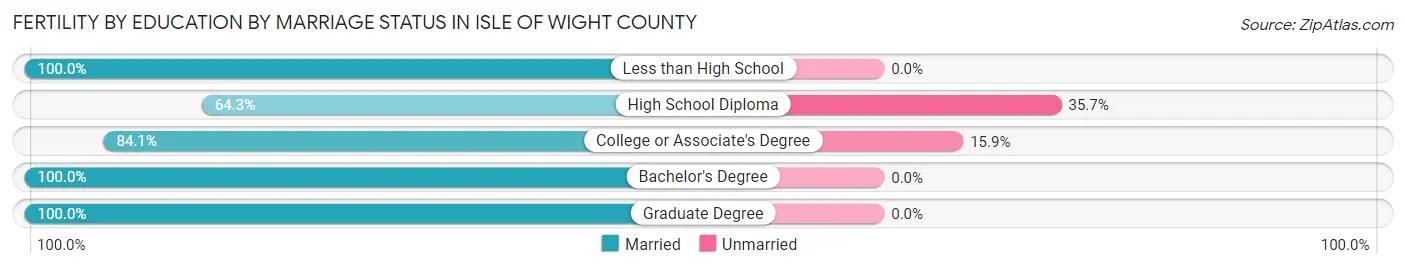
| Educational Attainment | Married | Unmarried |
| Less than High School | 15 (100.0%) | 0 (0.0%) |
| High School Diploma | 63 (64.3%) | 35 (35.7%) |
| College or Associate's Degree | 74 (84.1%) | 14 (15.9%) |
| Bachelor's Degree | 98 (100.0%) | 0 (0.0%) |
| Graduate Degree | 19 (100.0%) | 0 (0.0%) |
| Total | 269 (84.6%) | 49 (15.4%) |
Employment Characteristics in Isle of Wight County
Employment by Class of Employer in Isle of Wight County
Among the 18,470 employed individuals in Isle of Wight County, private company employees (11,455 | 62.0%), federal government employees (1,678 | 9.1%), and local government employees (1,581 | 8.6%) make up the most common classes of employment.
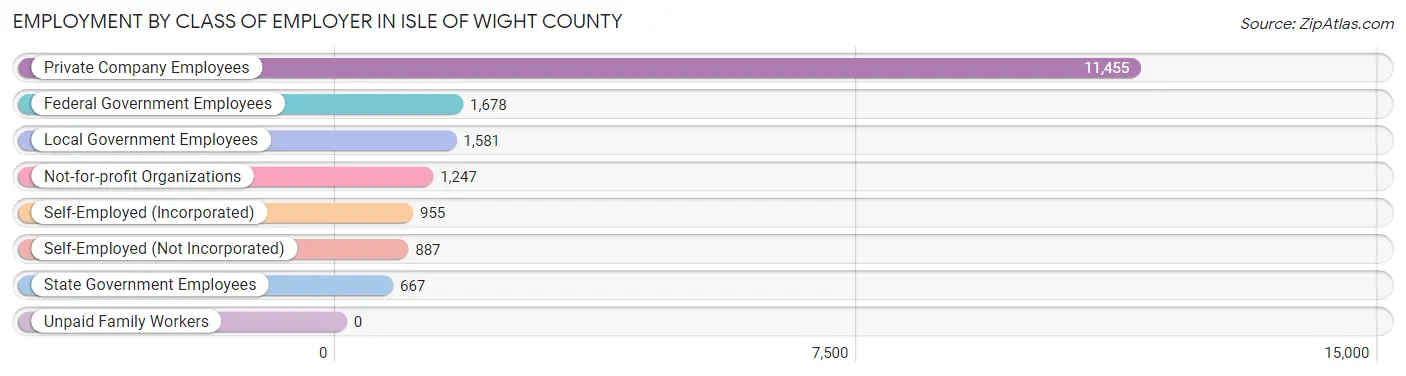
| Employer Class | # Employees | % Employees |
| Private Company Employees | 11,455 | 62.0% |
| Self-Employed (Incorporated) | 955 | 5.2% |
| Self-Employed (Not Incorporated) | 887 | 4.8% |
| Not-for-profit Organizations | 1,247 | 6.8% |
| Local Government Employees | 1,581 | 8.6% |
| State Government Employees | 667 | 3.6% |
| Federal Government Employees | 1,678 | 9.1% |
| Unpaid Family Workers | 0 | 0.0% |
| Total | 18,470 | 100.0% |
Employment Status by Age in Isle of Wight County
According to the labor force statistics for Isle of Wight County, out of the total population over 16 years of age (31,701), 63.7% or 20,194 individuals are in the labor force, with 5.5% or 1,111 of them unemployed. The age group with the highest labor force participation rate is 30 to 34 years, with 90.3% or 2,001 individuals in the labor force. Within the labor force, the 16 to 19 years age range has the highest percentage of unemployed individuals, with 24.1% or 201 of them being unemployed.
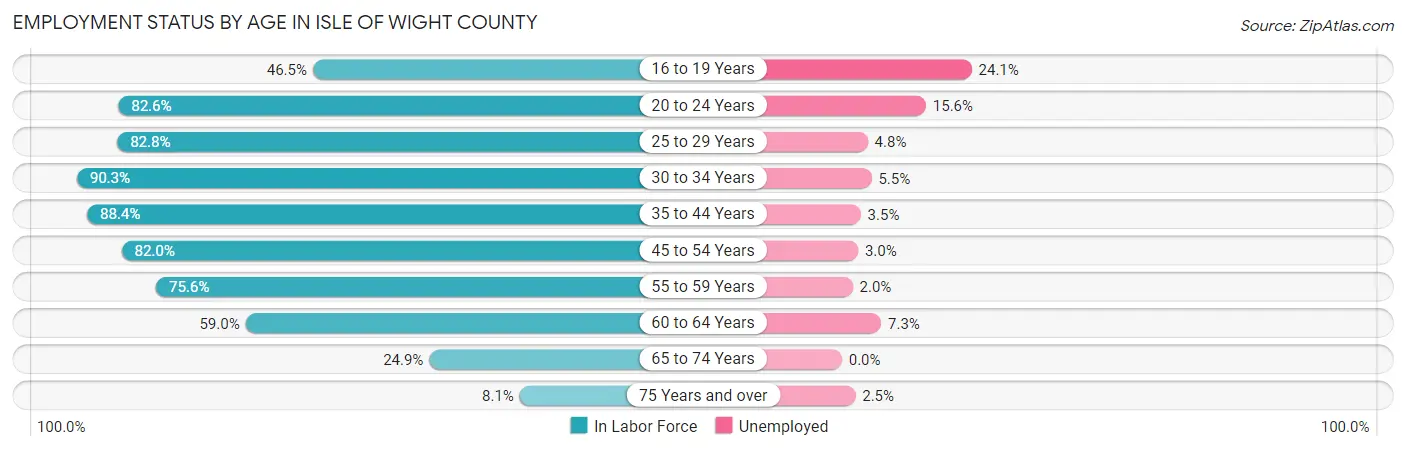
| Age Bracket | In Labor Force | Unemployed |
| 16 to 19 Years | 834 (46.5%) | 201 (24.1%) |
| 20 to 24 Years | 1,668 (82.6%) | 260 (15.6%) |
| 25 to 29 Years | 1,596 (82.8%) | 77 (4.8%) |
| 30 to 34 Years | 2,001 (90.3%) | 110 (5.5%) |
| 35 to 44 Years | 4,241 (88.4%) | 148 (3.5%) |
| 45 to 54 Years | 4,125 (82.0%) | 124 (3.0%) |
| 55 to 59 Years | 2,607 (75.6%) | 52 (2.0%) |
| 60 to 64 Years | 1,753 (59.0%) | 128 (7.3%) |
| 65 to 74 Years | 1,126 (24.9%) | 0 (0.0%) |
| 75 Years and over | 241 (8.1%) | 6 (2.5%) |
| Total | 20,194 (63.7%) | 1,111 (5.5%) |
Employment Status by Educational Attainment in Isle of Wight County
According to labor force statistics for Isle of Wight County, 80.0% of individuals (16,314) out of the total population between 25 and 64 years of age (20,393) are in the labor force, with 3.9% or 636 of them being unemployed. The group with the highest labor force participation rate are those with the educational attainment of bachelor's degree or higher, with 86.0% or 5,574 individuals in the labor force. Within the labor force, individuals with less than high school education have the highest percentage of unemployment, with 15.2% or 118 of them being unemployed.
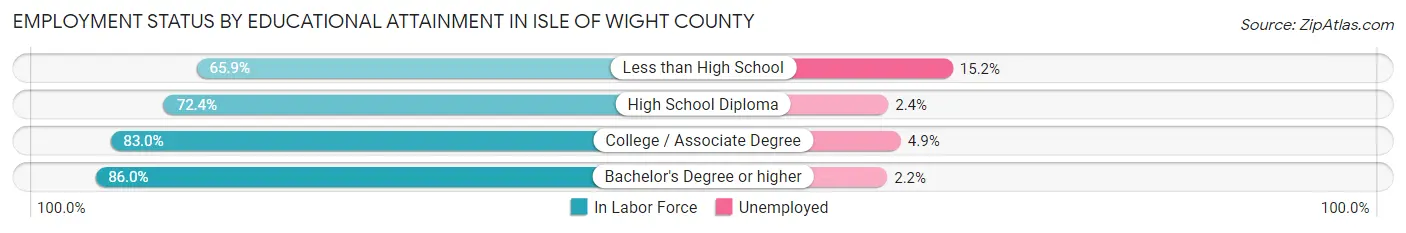
| Educational Attainment | In Labor Force | Unemployed |
| Less than High School | 774 (65.9%) | 178 (15.2%) |
| High School Diploma | 4,102 (72.4%) | 136 (2.4%) |
| College / Associate Degree | 5,870 (83.0%) | 347 (4.9%) |
| Bachelor's Degree or higher | 5,574 (86.0%) | 143 (2.2%) |
| Total | 16,314 (80.0%) | 795 (3.9%) |
Employment Occupations by Sex in Isle of Wight County
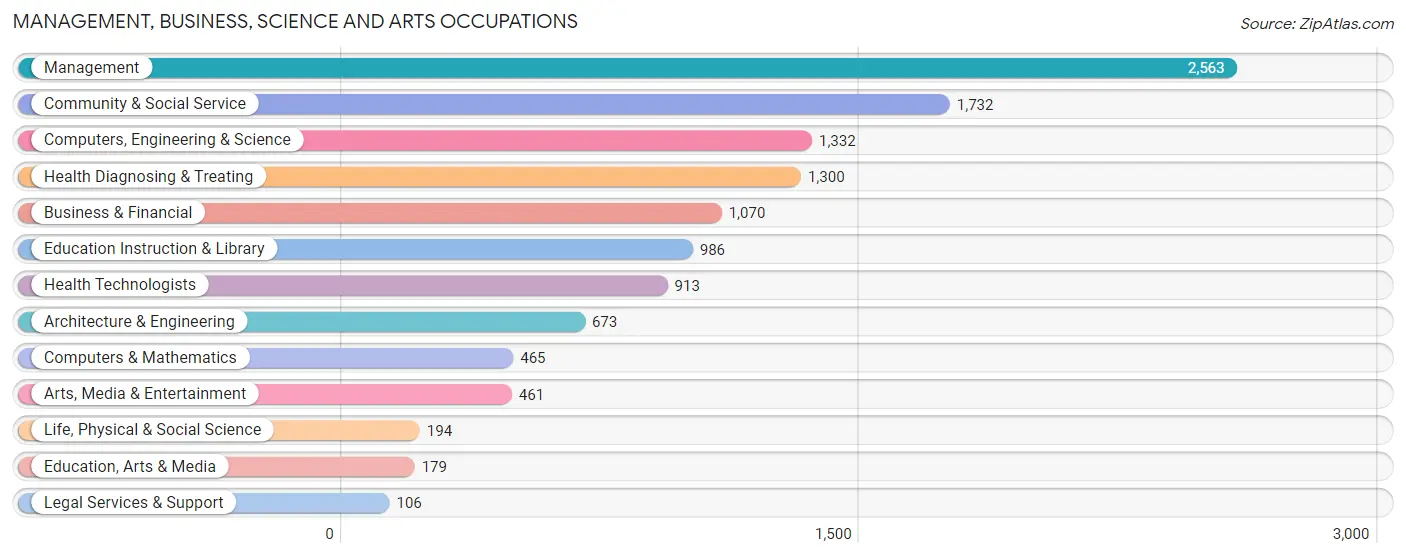
Management, Business, Science and Arts Occupations
The most common Management, Business, Science and Arts occupations in Isle of Wight County are Management (2,563 | 13.8%), Community & Social Service (1,732 | 9.3%), Computers, Engineering & Science (1,332 | 7.1%), Health Diagnosing & Treating (1,300 | 7.0%), and Business & Financial (1,070 | 5.8%).
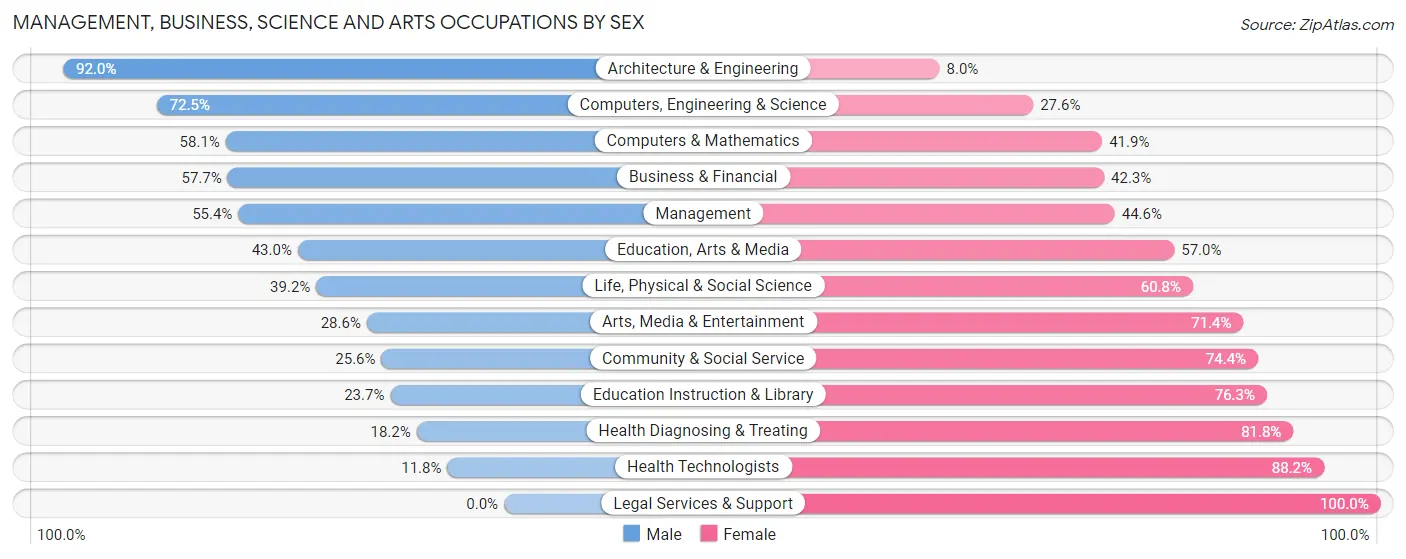
Management, Business, Science and Arts Occupations by Sex
Within the Management, Business, Science and Arts occupations in Isle of Wight County, the most male-oriented occupations are Architecture & Engineering (92.0%), Computers, Engineering & Science (72.5%), and Computers & Mathematics (58.1%), while the most female-oriented occupations are Legal Services & Support (100.0%), Health Technologists (88.2%), and Health Diagnosing & Treating (81.8%).
| Occupation | Male | Female |
| Management | 1,421 (55.4%) | 1,142 (44.6%) |
| Business & Financial | 617 (57.7%) | 453 (42.3%) |
| Computers, Engineering & Science | 965 (72.5%) | 367 (27.6%) |
| Computers & Mathematics | 270 (58.1%) | 195 (41.9%) |
| Architecture & Engineering | 619 (92.0%) | 54 (8.0%) |
| Life, Physical & Social Science | 76 (39.2%) | 118 (60.8%) |
| Community & Social Service | 443 (25.6%) | 1,289 (74.4%) |
| Education, Arts & Media | 77 (43.0%) | 102 (57.0%) |
| Legal Services & Support | 0 (0.0%) | 106 (100.0%) |
| Education Instruction & Library | 234 (23.7%) | 752 (76.3%) |
| Arts, Media & Entertainment | 132 (28.6%) | 329 (71.4%) |
| Health Diagnosing & Treating | 237 (18.2%) | 1,063 (81.8%) |
| Health Technologists | 108 (11.8%) | 805 (88.2%) |
| Total (Category) | 3,683 (46.1%) | 4,314 (53.9%) |
| Total (Overall) | 9,653 (51.8%) | 8,967 (48.2%) |
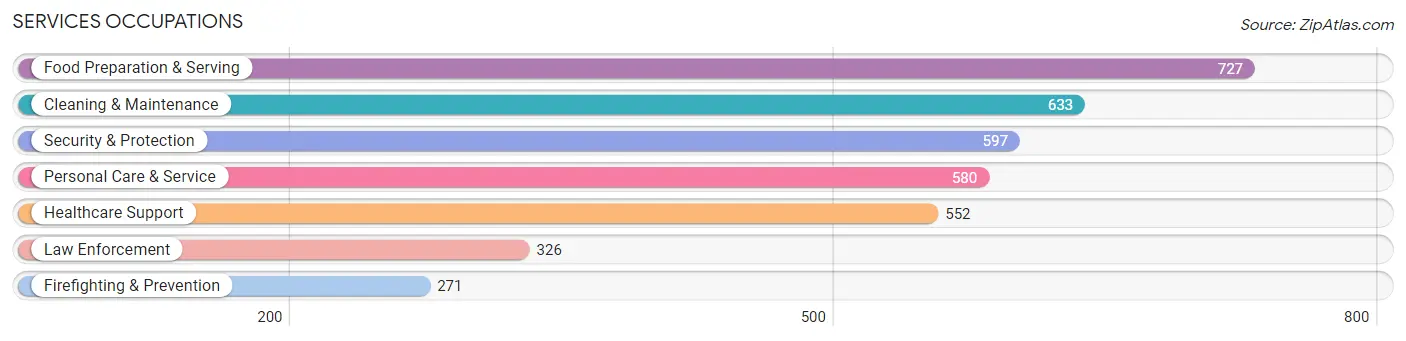
Services Occupations
The most common Services occupations in Isle of Wight County are Food Preparation & Serving (727 | 3.9%), Cleaning & Maintenance (633 | 3.4%), Security & Protection (597 | 3.2%), Personal Care & Service (580 | 3.1%), and Healthcare Support (552 | 3.0%).
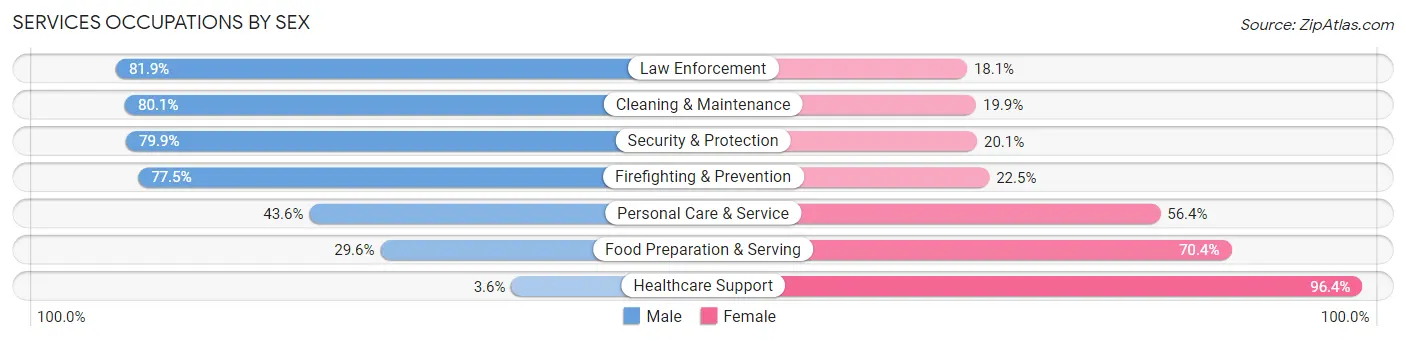
Services Occupations by Sex
Within the Services occupations in Isle of Wight County, the most male-oriented occupations are Law Enforcement (81.9%), Cleaning & Maintenance (80.1%), and Security & Protection (79.9%), while the most female-oriented occupations are Healthcare Support (96.4%), Food Preparation & Serving (70.4%), and Personal Care & Service (56.4%).
| Occupation | Male | Female |
| Healthcare Support | 20 (3.6%) | 532 (96.4%) |
| Security & Protection | 477 (79.9%) | 120 (20.1%) |
| Firefighting & Prevention | 210 (77.5%) | 61 (22.5%) |
| Law Enforcement | 267 (81.9%) | 59 (18.1%) |
| Food Preparation & Serving | 215 (29.6%) | 512 (70.4%) |
| Cleaning & Maintenance | 507 (80.1%) | 126 (19.9%) |
| Personal Care & Service | 253 (43.6%) | 327 (56.4%) |
| Total (Category) | 1,472 (47.6%) | 1,617 (52.3%) |
| Total (Overall) | 9,653 (51.8%) | 8,967 (48.2%) |
Sales and Office Occupations
The most common Sales and Office occupations in Isle of Wight County are Office & Administration (1,970 | 10.6%), and Sales & Related (1,201 | 6.5%).
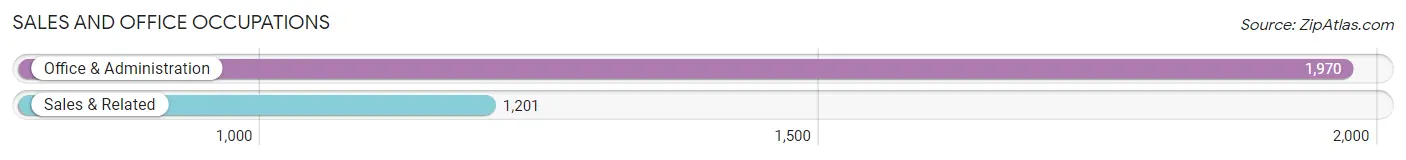
Sales and Office Occupations by Sex

| Occupation | Male | Female |
| Sales & Related | 517 (43.0%) | 684 (57.0%) |
| Office & Administration | 359 (18.2%) | 1,611 (81.8%) |
| Total (Category) | 876 (27.6%) | 2,295 (72.4%) |
| Total (Overall) | 9,653 (51.8%) | 8,967 (48.2%) |
Natural Resources, Construction and Maintenance Occupations
The most common Natural Resources, Construction and Maintenance occupations in Isle of Wight County are Construction & Extraction (943 | 5.1%), Installation, Maintenance & Repair (802 | 4.3%), and Farming, Fishing & Forestry (52 | 0.3%).
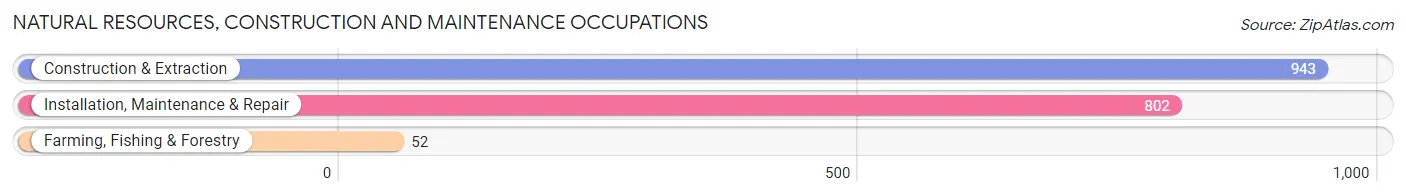
Natural Resources, Construction and Maintenance Occupations by Sex
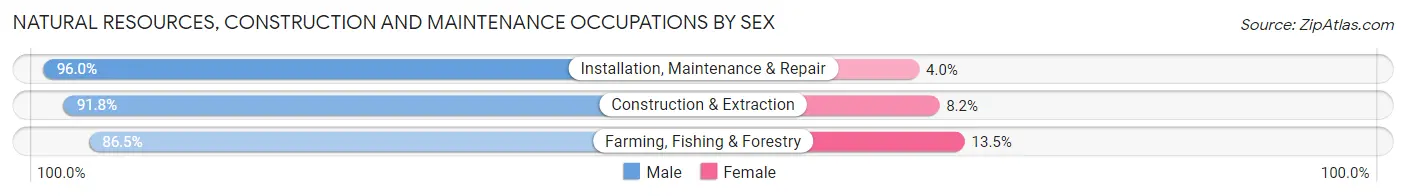
| Occupation | Male | Female |
| Farming, Fishing & Forestry | 45 (86.5%) | 7 (13.5%) |
| Construction & Extraction | 866 (91.8%) | 77 (8.2%) |
| Installation, Maintenance & Repair | 770 (96.0%) | 32 (4.0%) |
| Total (Category) | 1,681 (93.5%) | 116 (6.5%) |
| Total (Overall) | 9,653 (51.8%) | 8,967 (48.2%) |
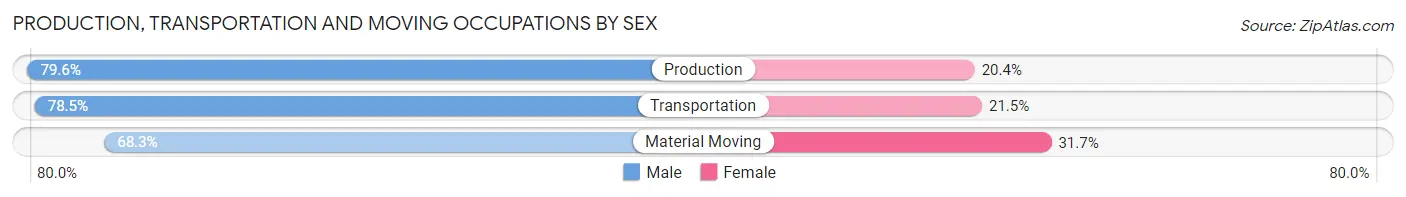
Production, Transportation and Moving Occupations
The most common Production, Transportation and Moving occupations in Isle of Wight County are Production (1,155 | 6.2%), Material Moving (839 | 4.5%), and Transportation (572 | 3.1%).
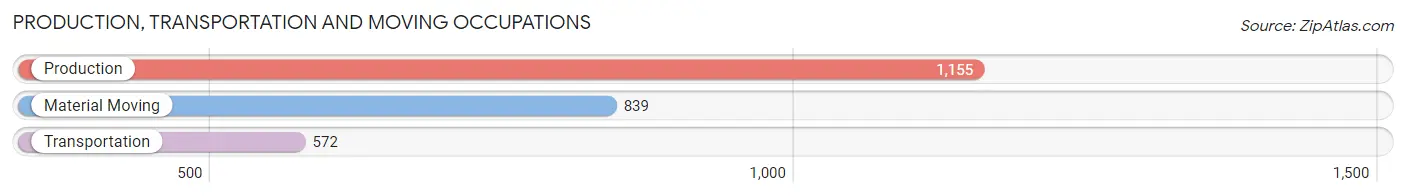
Production, Transportation and Moving Occupations by Sex
| Occupation | Male | Female |
| Production | 919 (79.6%) | 236 (20.4%) |
| Transportation | 449 (78.5%) | 123 (21.5%) |
| Material Moving | 573 (68.3%) | 266 (31.7%) |
| Total (Category) | 1,941 (75.6%) | 625 (24.4%) |
| Total (Overall) | 9,653 (51.8%) | 8,967 (48.2%) |
Employment Industries by Sex in Isle of Wight County
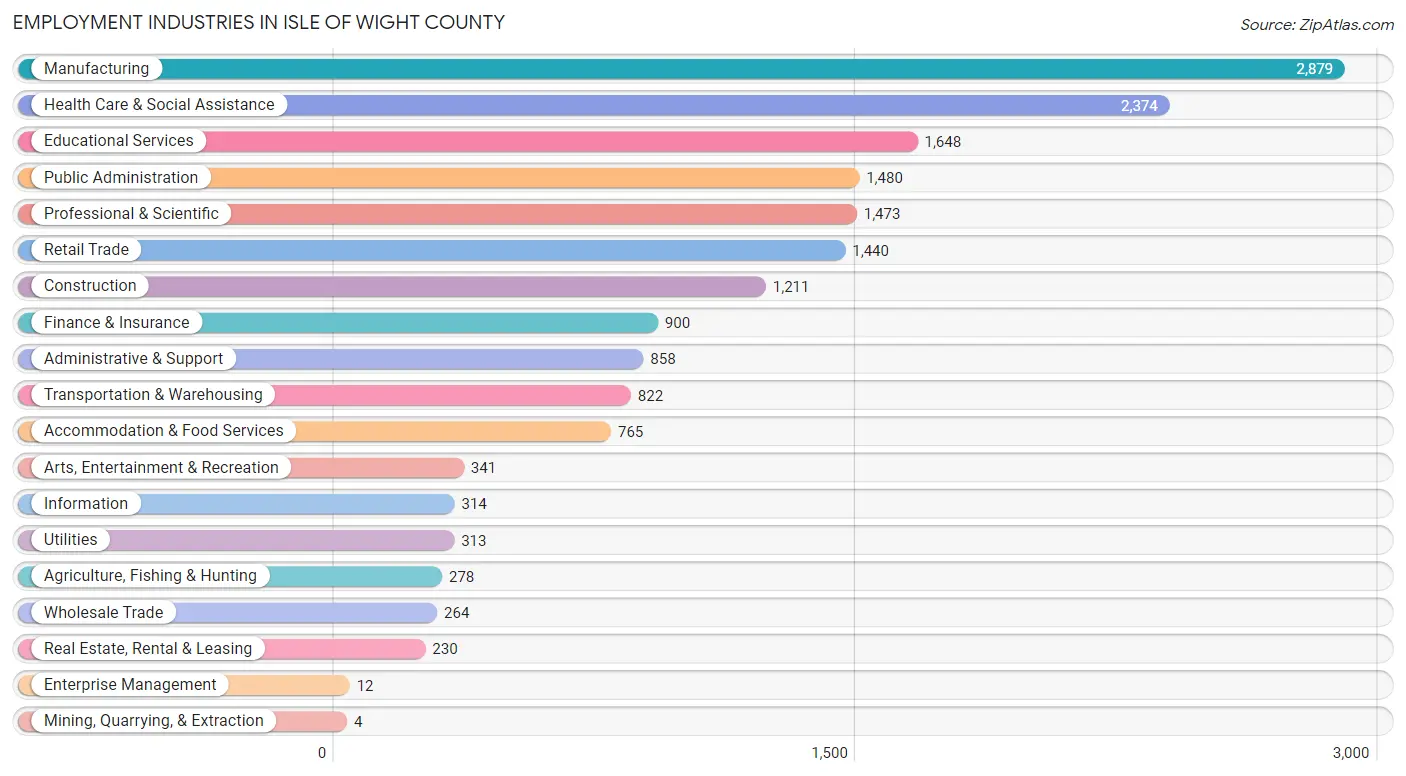
Employment Industries in Isle of Wight County
The major employment industries in Isle of Wight County include Manufacturing (2,879 | 15.5%), Health Care & Social Assistance (2,374 | 12.8%), Educational Services (1,648 | 8.8%), Public Administration (1,480 | 8.0%), and Professional & Scientific (1,473 | 7.9%).
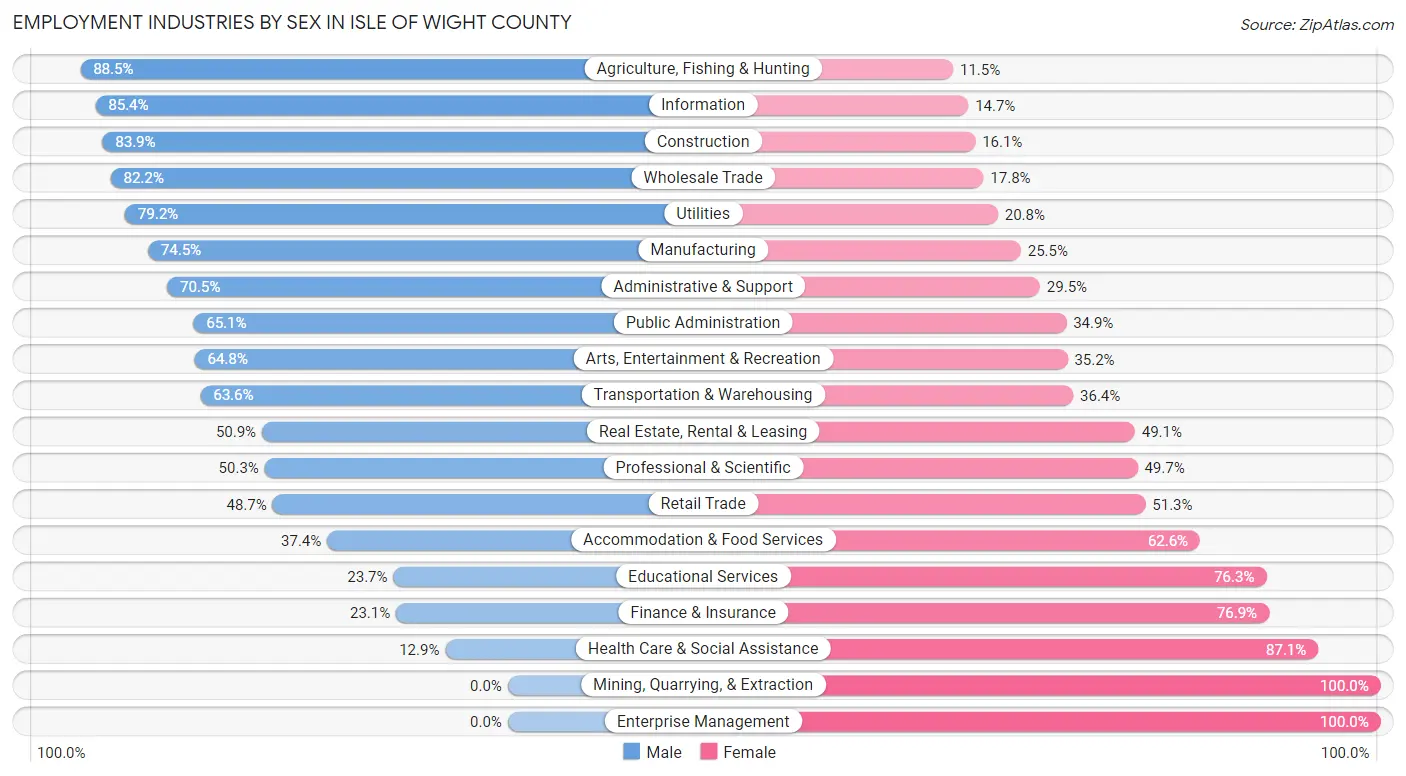
Employment Industries by Sex in Isle of Wight County
The Isle of Wight County industries that see more men than women are Agriculture, Fishing & Hunting (88.5%), Information (85.4%), and Construction (83.9%), whereas the industries that tend to have a higher number of women are Mining, Quarrying, & Extraction (100.0%), Enterprise Management (100.0%), and Health Care & Social Assistance (87.1%).
| Industry | Male | Female |
| Agriculture, Fishing & Hunting | 246 (88.5%) | 32 (11.5%) |
| Mining, Quarrying, & Extraction | 0 (0.0%) | 4 (100.0%) |
| Construction | 1,016 (83.9%) | 195 (16.1%) |
| Manufacturing | 2,144 (74.5%) | 735 (25.5%) |
| Wholesale Trade | 217 (82.2%) | 47 (17.8%) |
| Retail Trade | 701 (48.7%) | 739 (51.3%) |
| Transportation & Warehousing | 523 (63.6%) | 299 (36.4%) |
| Utilities | 248 (79.2%) | 65 (20.8%) |
| Information | 268 (85.4%) | 46 (14.6%) |
| Finance & Insurance | 208 (23.1%) | 692 (76.9%) |
| Real Estate, Rental & Leasing | 117 (50.9%) | 113 (49.1%) |
| Professional & Scientific | 741 (50.3%) | 732 (49.7%) |
| Enterprise Management | 0 (0.0%) | 12 (100.0%) |
| Administrative & Support | 605 (70.5%) | 253 (29.5%) |
| Educational Services | 390 (23.7%) | 1,258 (76.3%) |
| Health Care & Social Assistance | 307 (12.9%) | 2,067 (87.1%) |
| Arts, Entertainment & Recreation | 221 (64.8%) | 120 (35.2%) |
| Accommodation & Food Services | 286 (37.4%) | 479 (62.6%) |
| Public Administration | 963 (65.1%) | 517 (34.9%) |
| Total | 9,653 (51.8%) | 8,967 (48.2%) |
Education in Isle of Wight County
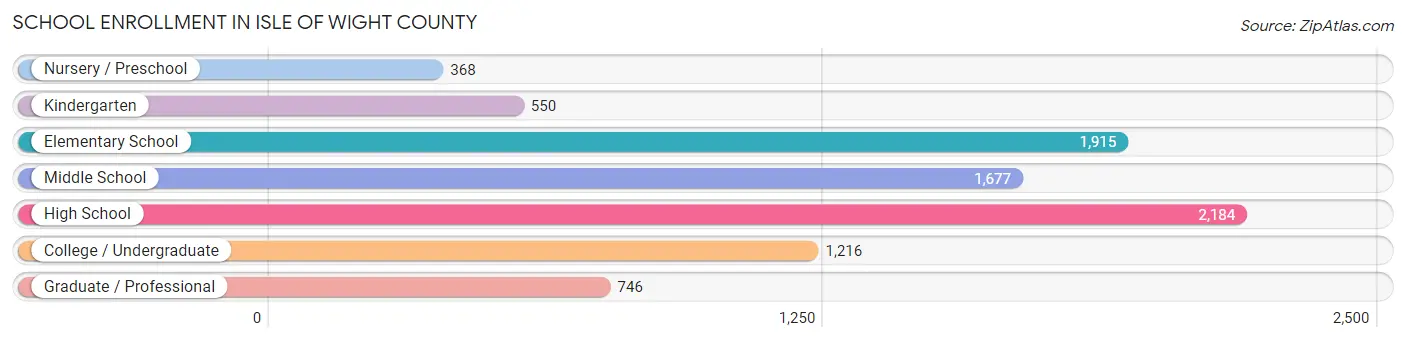
School Enrollment in Isle of Wight County
The most common levels of schooling among the 8,656 students in Isle of Wight County are high school (2,184 | 25.2%), elementary school (1,915 | 22.1%), and middle school (1,677 | 19.4%).
| School Level | # Students | % Students |
| Nursery / Preschool | 368 | 4.3% |
| Kindergarten | 550 | 6.4% |
| Elementary School | 1,915 | 22.1% |
| Middle School | 1,677 | 19.4% |
| High School | 2,184 | 25.2% |
| College / Undergraduate | 1,216 | 14.1% |
| Graduate / Professional | 746 | 8.6% |
| Total | 8,656 | 100.0% |
School Enrollment by Age by Funding Source in Isle of Wight County
Out of a total of 8,656 students who are enrolled in schools in Isle of Wight County, 2,147 (24.8%) attend a private institution, while the remaining 6,509 (75.2%) are enrolled in public schools. The age group of 3 to 4 year olds has the highest likelihood of being enrolled in private schools, with 271 (81.4% in the age bracket) enrolled. Conversely, the age group of 15 to 17 year olds has the lowest likelihood of being enrolled in a private school, with 1,259 (86.1% in the age bracket) attending a public institution.
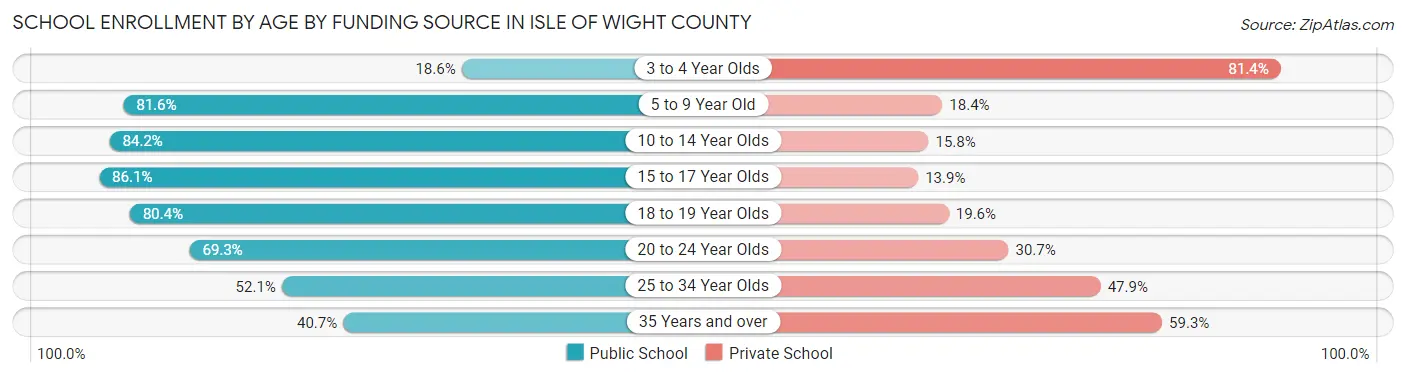
| Age Bracket | Public School | Private School |
| 3 to 4 Year Olds | 62 (18.6%) | 271 (81.4%) |
| 5 to 9 Year Old | 1,864 (81.6%) | 420 (18.4%) |
| 10 to 14 Year Olds | 1,922 (84.2%) | 361 (15.8%) |
| 15 to 17 Year Olds | 1,259 (86.1%) | 203 (13.9%) |
| 18 to 19 Year Olds | 472 (80.4%) | 115 (19.6%) |
| 20 to 24 Year Olds | 431 (69.3%) | 191 (30.7%) |
| 25 to 34 Year Olds | 258 (52.1%) | 237 (47.9%) |
| 35 Years and over | 240 (40.7%) | 350 (59.3%) |
| Total | 6,509 (75.2%) | 2,147 (24.8%) |
Educational Attainment by Field of Study in Isle of Wight County
Business (1,705 | 19.3%), education (1,189 | 13.5%), science & technology (1,105 | 12.5%), bio, nature & agricultural (753 | 8.5%), and social sciences (610 | 6.9%) are the most common fields of study among 8,837 individuals in Isle of Wight County who have obtained a bachelor's degree or higher.
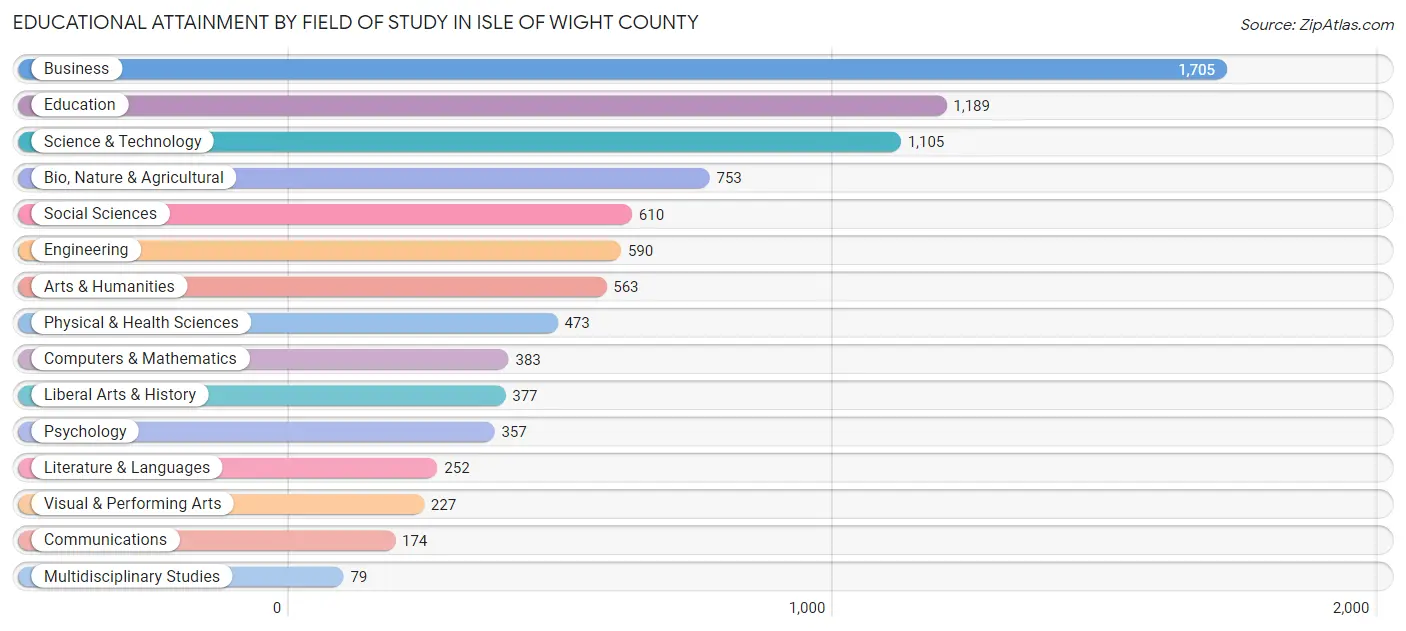
| Field of Study | # Graduates | % Graduates |
| Computers & Mathematics | 383 | 4.3% |
| Bio, Nature & Agricultural | 753 | 8.5% |
| Physical & Health Sciences | 473 | 5.3% |
| Psychology | 357 | 4.0% |
| Social Sciences | 610 | 6.9% |
| Engineering | 590 | 6.7% |
| Multidisciplinary Studies | 79 | 0.9% |
| Science & Technology | 1,105 | 12.5% |
| Business | 1,705 | 19.3% |
| Education | 1,189 | 13.5% |
| Literature & Languages | 252 | 2.9% |
| Liberal Arts & History | 377 | 4.3% |
| Visual & Performing Arts | 227 | 2.6% |
| Communications | 174 | 2.0% |
| Arts & Humanities | 563 | 6.4% |
| Total | 8,837 | 100.0% |
Transportation & Commute in Isle of Wight County
Vehicle Availability by Sex in Isle of Wight County
The most prevalent vehicle ownership categories in Isle of Wight County are males with 2 vehicles (3,557, accounting for 36.4%) and females with 2 vehicles (3,321, making up 40.9%).
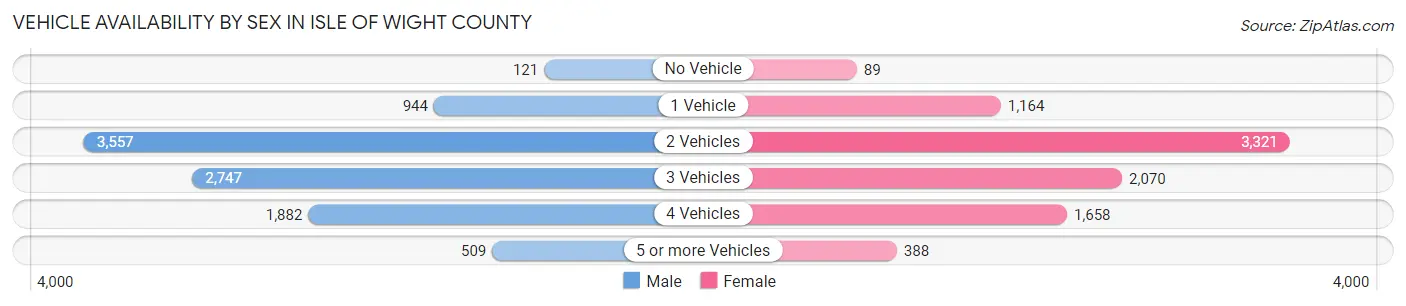
| Vehicles Available | Male | Female |
| No Vehicle | 121 (1.2%) | 89 (1.0%) |
| 1 Vehicle | 944 (9.7%) | 1,164 (13.4%) |
| 2 Vehicles | 3,557 (36.4%) | 3,321 (38.2%) |
| 3 Vehicles | 2,747 (28.1%) | 2,070 (23.8%) |
| 4 Vehicles | 1,882 (19.3%) | 1,658 (19.1%) |
| 5 or more Vehicles | 509 (5.2%) | 388 (4.5%) |
| Total | 9,760 (100.0%) | 8,690 (100.0%) |
Commute Time in Isle of Wight County
The most frequently occuring commute durations in Isle of Wight County are 30 to 34 minutes (2,482 commuters, 14.8%), 45 to 59 minutes (2,293 commuters, 13.7%), and 15 to 19 minutes (2,205 commuters, 13.1%).
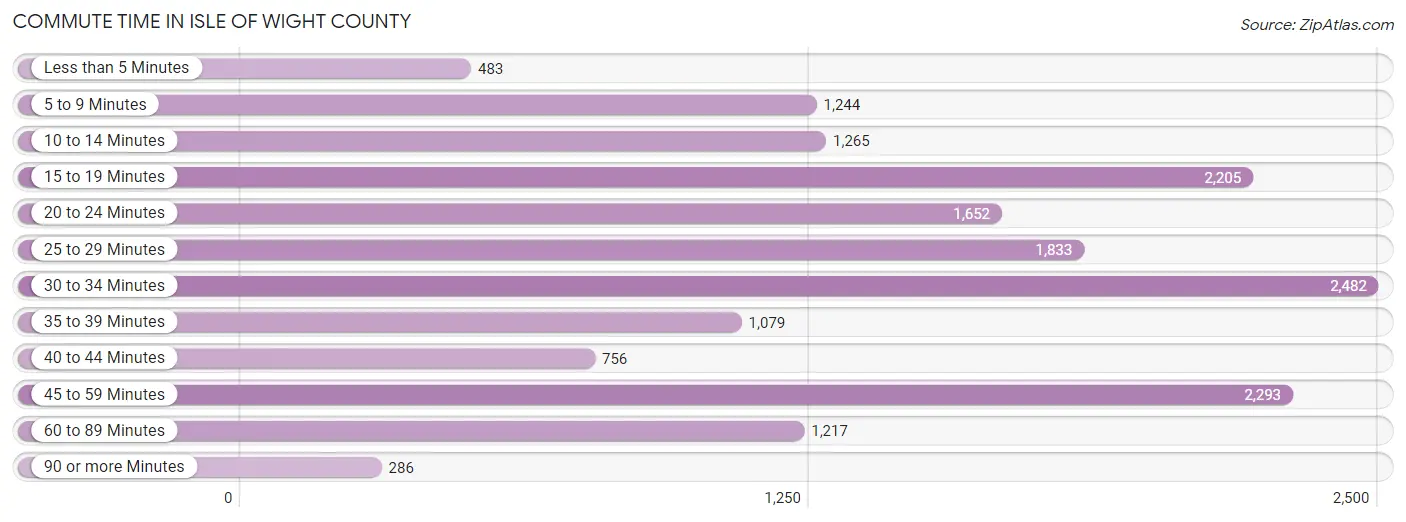
| Commute Time | # Commuters | % Commuters |
| Less than 5 Minutes | 483 | 2.9% |
| 5 to 9 Minutes | 1,244 | 7.4% |
| 10 to 14 Minutes | 1,265 | 7.5% |
| 15 to 19 Minutes | 2,205 | 13.1% |
| 20 to 24 Minutes | 1,652 | 9.8% |
| 25 to 29 Minutes | 1,833 | 10.9% |
| 30 to 34 Minutes | 2,482 | 14.8% |
| 35 to 39 Minutes | 1,079 | 6.4% |
| 40 to 44 Minutes | 756 | 4.5% |
| 45 to 59 Minutes | 2,293 | 13.7% |
| 60 to 89 Minutes | 1,217 | 7.2% |
| 90 or more Minutes | 286 | 1.7% |
Commute Time by Sex in Isle of Wight County
The most common commute times in Isle of Wight County are 45 to 59 minutes (1,435 commuters, 15.9%) for males and 30 to 34 minutes (1,052 commuters, 13.5%) for females.
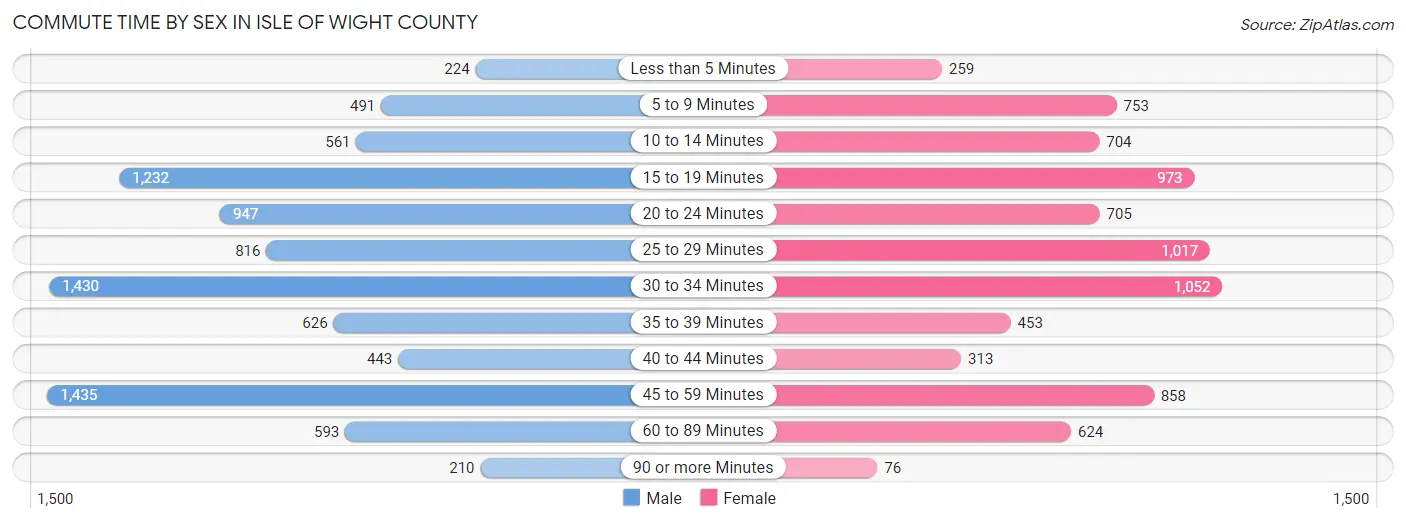
| Commute Time | Male | Female |
| Less than 5 Minutes | 224 (2.5%) | 259 (3.3%) |
| 5 to 9 Minutes | 491 (5.4%) | 753 (9.7%) |
| 10 to 14 Minutes | 561 (6.2%) | 704 (9.0%) |
| 15 to 19 Minutes | 1,232 (13.7%) | 973 (12.5%) |
| 20 to 24 Minutes | 947 (10.5%) | 705 (9.0%) |
| 25 to 29 Minutes | 816 (9.1%) | 1,017 (13.1%) |
| 30 to 34 Minutes | 1,430 (15.9%) | 1,052 (13.5%) |
| 35 to 39 Minutes | 626 (7.0%) | 453 (5.8%) |
| 40 to 44 Minutes | 443 (4.9%) | 313 (4.0%) |
| 45 to 59 Minutes | 1,435 (15.9%) | 858 (11.0%) |
| 60 to 89 Minutes | 593 (6.6%) | 624 (8.0%) |
| 90 or more Minutes | 210 (2.3%) | 76 (1.0%) |
Time of Departure to Work by Sex in Isle of Wight County
The most frequent times of departure to work in Isle of Wight County are 6:00 AM to 6:29 AM (1,193, 13.2%) for males and 6:30 AM to 6:59 AM (1,196, 15.4%) for females.
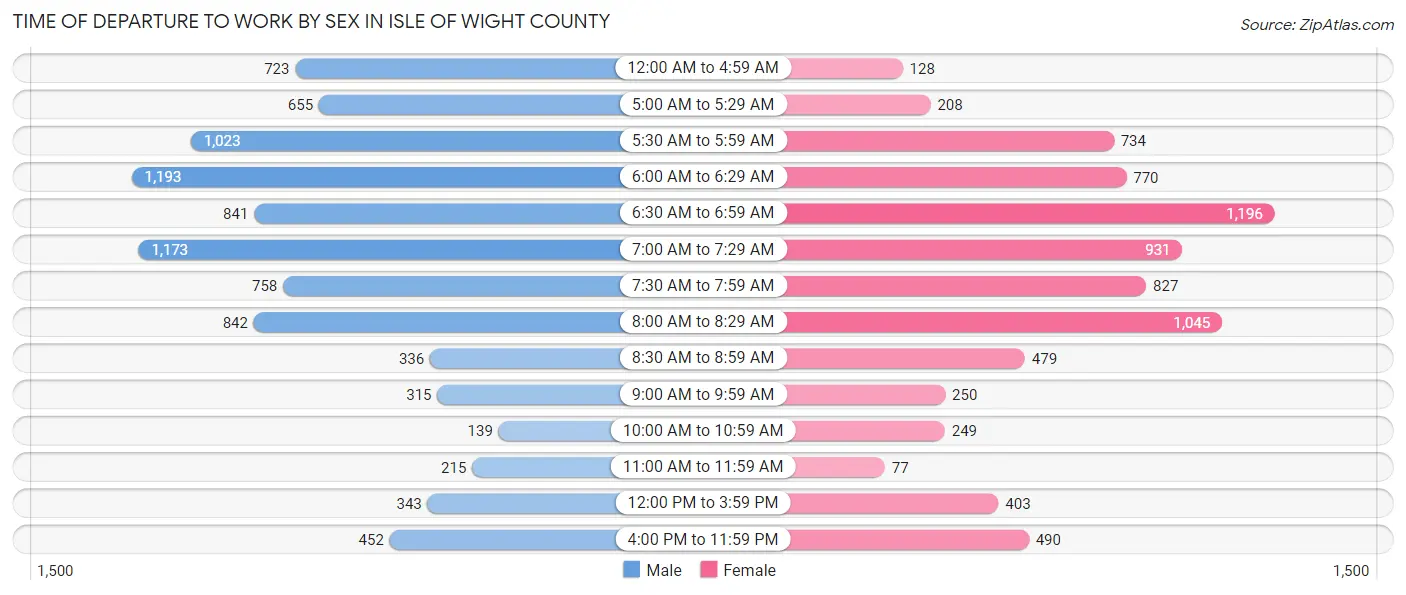
| Time of Departure | Male | Female |
| 12:00 AM to 4:59 AM | 723 (8.0%) | 128 (1.6%) |
| 5:00 AM to 5:29 AM | 655 (7.3%) | 208 (2.7%) |
| 5:30 AM to 5:59 AM | 1,023 (11.4%) | 734 (9.4%) |
| 6:00 AM to 6:29 AM | 1,193 (13.2%) | 770 (9.9%) |
| 6:30 AM to 6:59 AM | 841 (9.3%) | 1,196 (15.4%) |
| 7:00 AM to 7:29 AM | 1,173 (13.0%) | 931 (12.0%) |
| 7:30 AM to 7:59 AM | 758 (8.4%) | 827 (10.6%) |
| 8:00 AM to 8:29 AM | 842 (9.3%) | 1,045 (13.4%) |
| 8:30 AM to 8:59 AM | 336 (3.7%) | 479 (6.1%) |
| 9:00 AM to 9:59 AM | 315 (3.5%) | 250 (3.2%) |
| 10:00 AM to 10:59 AM | 139 (1.5%) | 249 (3.2%) |
| 11:00 AM to 11:59 AM | 215 (2.4%) | 77 (1.0%) |
| 12:00 PM to 3:59 PM | 343 (3.8%) | 403 (5.2%) |
| 4:00 PM to 11:59 PM | 452 (5.0%) | 490 (6.3%) |
| Total | 9,008 (100.0%) | 7,787 (100.0%) |
Housing Occupancy in Isle of Wight County
Occupancy by Ownership in Isle of Wight County
Of the total 15,196 dwellings in Isle of Wight County, owner-occupied units account for 11,901 (78.3%), while renter-occupied units make up 3,295 (21.7%).
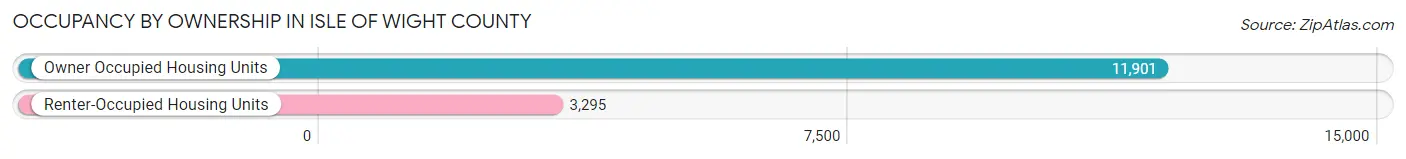
| Occupancy | # Housing Units | % Housing Units |
| Owner Occupied Housing Units | 11,901 | 78.3% |
| Renter-Occupied Housing Units | 3,295 | 21.7% |
| Total Occupied Housing Units | 15,196 | 100.0% |
Occupancy by Household Size in Isle of Wight County
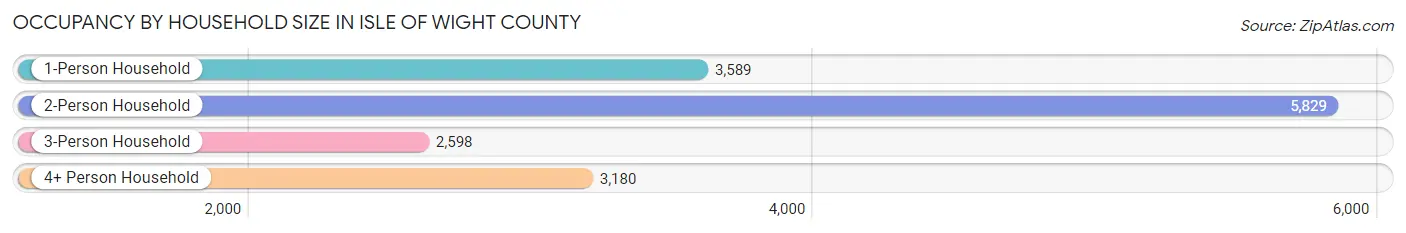
| Household Size | # Housing Units | % Housing Units |
| 1-Person Household | 3,589 | 23.6% |
| 2-Person Household | 5,829 | 38.4% |
| 3-Person Household | 2,598 | 17.1% |
| 4+ Person Household | 3,180 | 20.9% |
| Total Housing Units | 15,196 | 100.0% |
Occupancy by Ownership by Household Size in Isle of Wight County
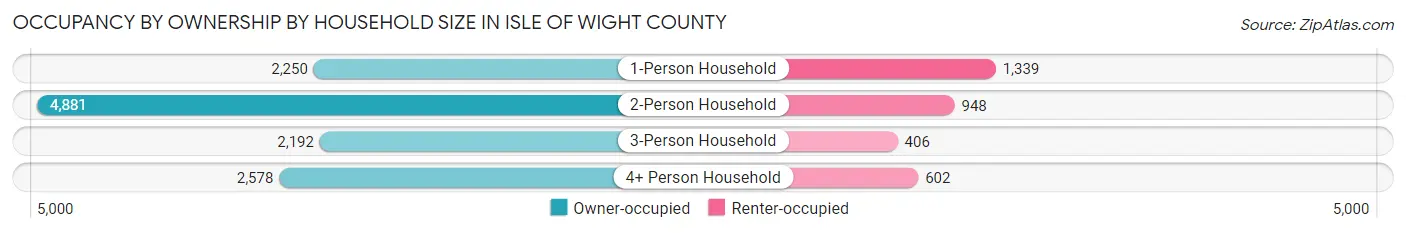
| Household Size | Owner-occupied | Renter-occupied |
| 1-Person Household | 2,250 (62.7%) | 1,339 (37.3%) |
| 2-Person Household | 4,881 (83.7%) | 948 (16.3%) |
| 3-Person Household | 2,192 (84.4%) | 406 (15.6%) |
| 4+ Person Household | 2,578 (81.1%) | 602 (18.9%) |
| Total Housing Units | 11,901 (78.3%) | 3,295 (21.7%) |
Occupancy by Educational Attainment in Isle of Wight County
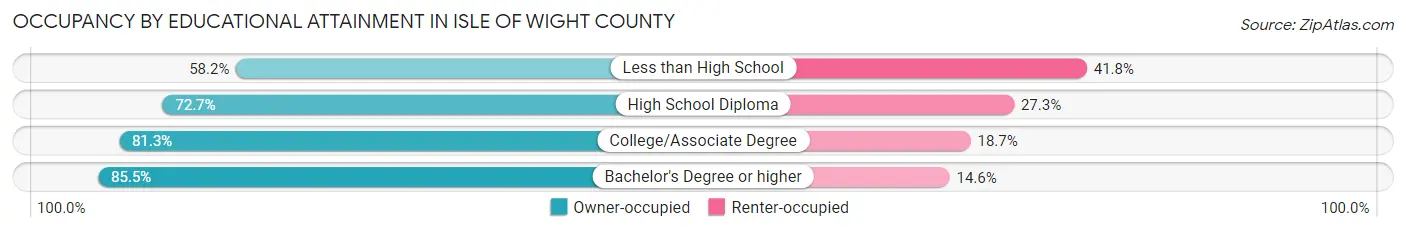
| Household Size | Owner-occupied | Renter-occupied |
| Less than High School | 710 (58.2%) | 509 (41.8%) |
| High School Diploma | 3,014 (72.7%) | 1,133 (27.3%) |
| College/Associate Degree | 4,354 (81.3%) | 1,002 (18.7%) |
| Bachelor's Degree or higher | 3,823 (85.5%) | 651 (14.5%) |
Occupancy by Age of Householder in Isle of Wight County
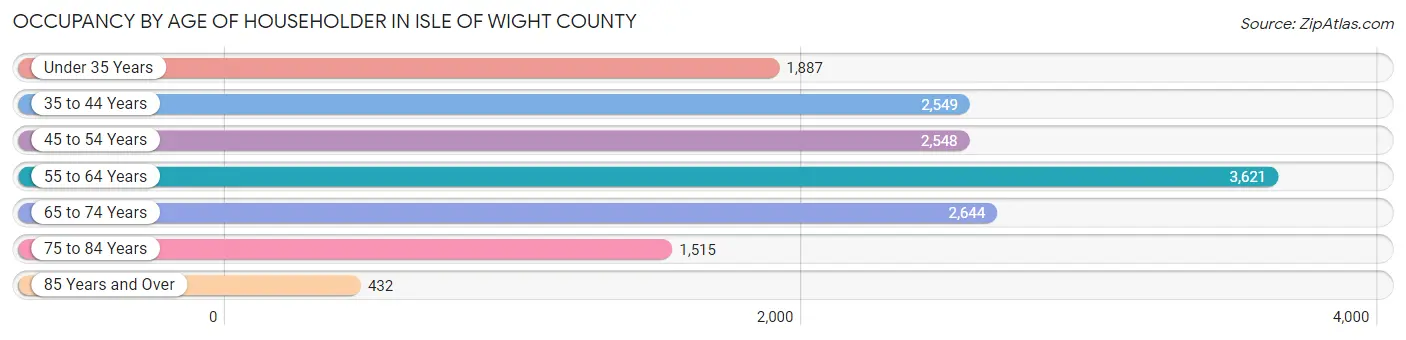
| Age Bracket | # Households | % Households |
| Under 35 Years | 1,887 | 12.4% |
| 35 to 44 Years | 2,549 | 16.8% |
| 45 to 54 Years | 2,548 | 16.8% |
| 55 to 64 Years | 3,621 | 23.8% |
| 65 to 74 Years | 2,644 | 17.4% |
| 75 to 84 Years | 1,515 | 10.0% |
| 85 Years and Over | 432 | 2.8% |
| Total | 15,196 | 100.0% |
Housing Finances in Isle of Wight County
Median Income by Occupancy in Isle of Wight County
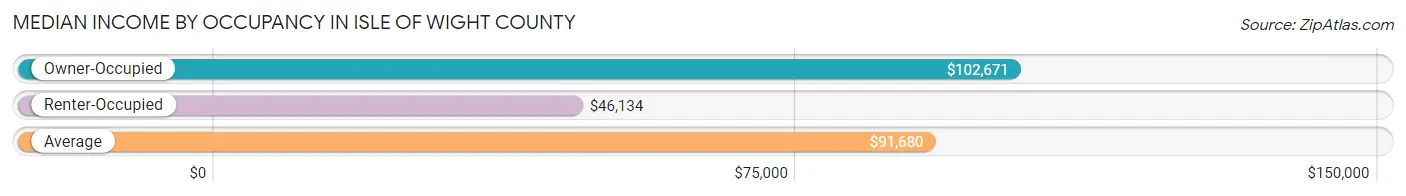
| Occupancy Type | # Households | Median Income |
| Owner-Occupied | 11,901 (78.3%) | $102,671 |
| Renter-Occupied | 3,295 (21.7%) | $46,134 |
| Average | 15,196 (100.0%) | $91,680 |
Occupancy by Householder Income Bracket in Isle of Wight County
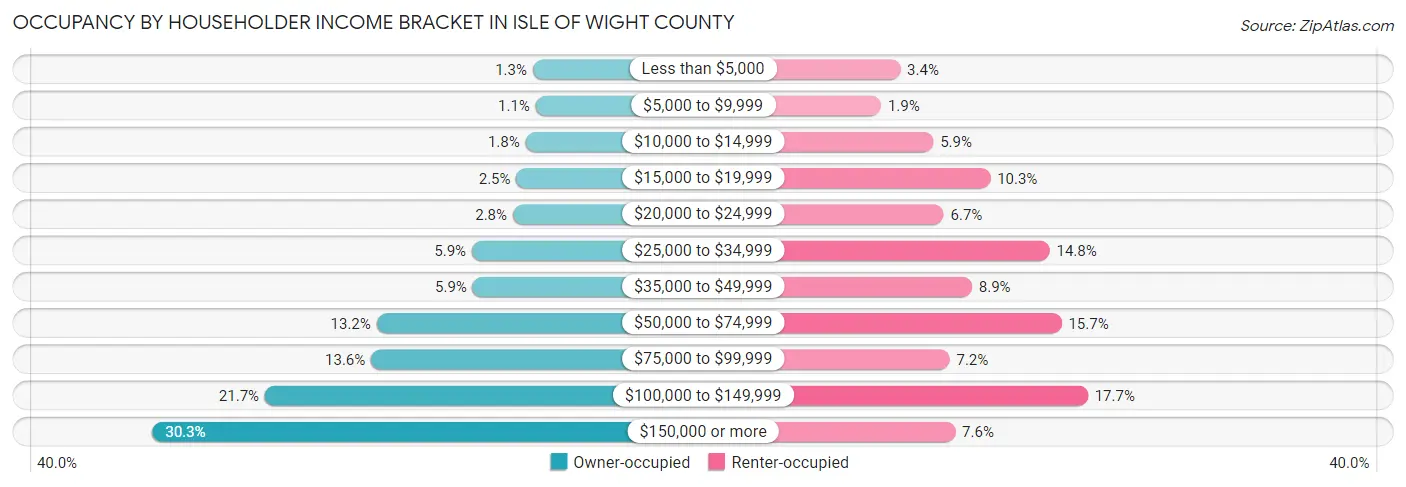
| Income Bracket | Owner-occupied | Renter-occupied |
| Less than $5,000 | 152 (1.3%) | 112 (3.4%) |
| $5,000 to $9,999 | 126 (1.1%) | 64 (1.9%) |
| $10,000 to $14,999 | 218 (1.8%) | 195 (5.9%) |
| $15,000 to $19,999 | 301 (2.5%) | 338 (10.3%) |
| $20,000 to $24,999 | 333 (2.8%) | 221 (6.7%) |
| $25,000 to $34,999 | 704 (5.9%) | 487 (14.8%) |
| $35,000 to $49,999 | 697 (5.9%) | 292 (8.9%) |
| $50,000 to $74,999 | 1,568 (13.2%) | 517 (15.7%) |
| $75,000 to $99,999 | 1,618 (13.6%) | 236 (7.2%) |
| $100,000 to $149,999 | 2,581 (21.7%) | 583 (17.7%) |
| $150,000 or more | 3,603 (30.3%) | 250 (7.6%) |
| Total | 11,901 (100.0%) | 3,295 (100.0%) |
Monthly Housing Cost Tiers in Isle of Wight County
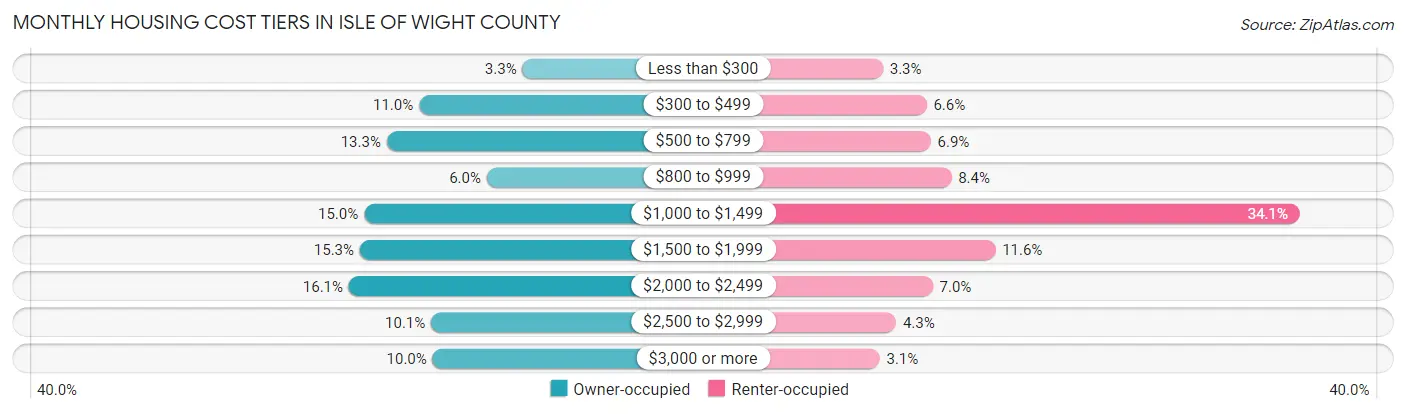
| Monthly Cost | Owner-occupied | Renter-occupied |
| Less than $300 | 396 (3.3%) | 110 (3.3%) |
| $300 to $499 | 1,303 (11.0%) | 216 (6.6%) |
| $500 to $799 | 1,586 (13.3%) | 226 (6.9%) |
| $800 to $999 | 709 (6.0%) | 276 (8.4%) |
| $1,000 to $1,499 | 1,785 (15.0%) | 1,122 (34.1%) |
| $1,500 to $1,999 | 1,822 (15.3%) | 383 (11.6%) |
| $2,000 to $2,499 | 1,919 (16.1%) | 231 (7.0%) |
| $2,500 to $2,999 | 1,197 (10.1%) | 142 (4.3%) |
| $3,000 or more | 1,184 (10.0%) | 102 (3.1%) |
| Total | 11,901 (100.0%) | 3,295 (100.0%) |
Physical Housing Characteristics in Isle of Wight County
Housing Structures in Isle of Wight County
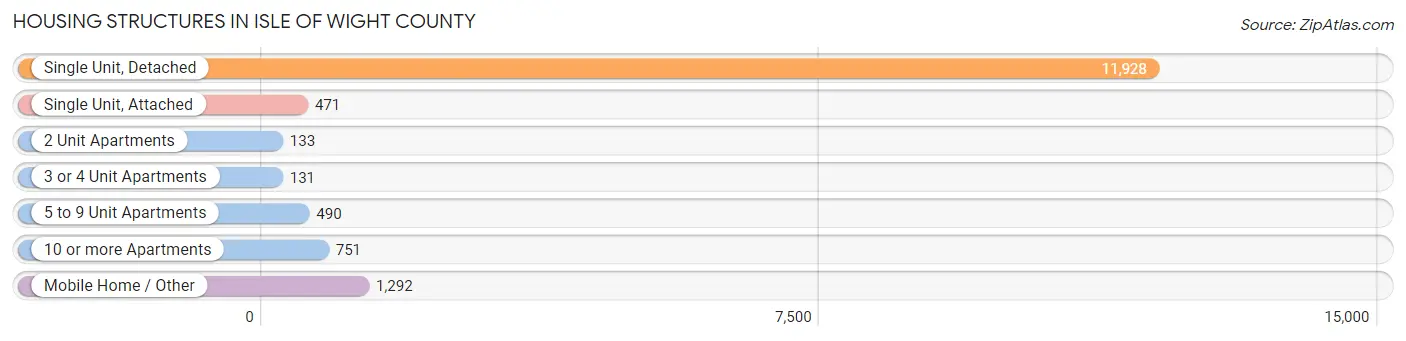
| Structure Type | # Housing Units | % Housing Units |
| Single Unit, Detached | 11,928 | 78.5% |
| Single Unit, Attached | 471 | 3.1% |
| 2 Unit Apartments | 133 | 0.9% |
| 3 or 4 Unit Apartments | 131 | 0.9% |
| 5 to 9 Unit Apartments | 490 | 3.2% |
| 10 or more Apartments | 751 | 4.9% |
| Mobile Home / Other | 1,292 | 8.5% |
| Total | 15,196 | 100.0% |
Housing Structures by Occupancy in Isle of Wight County
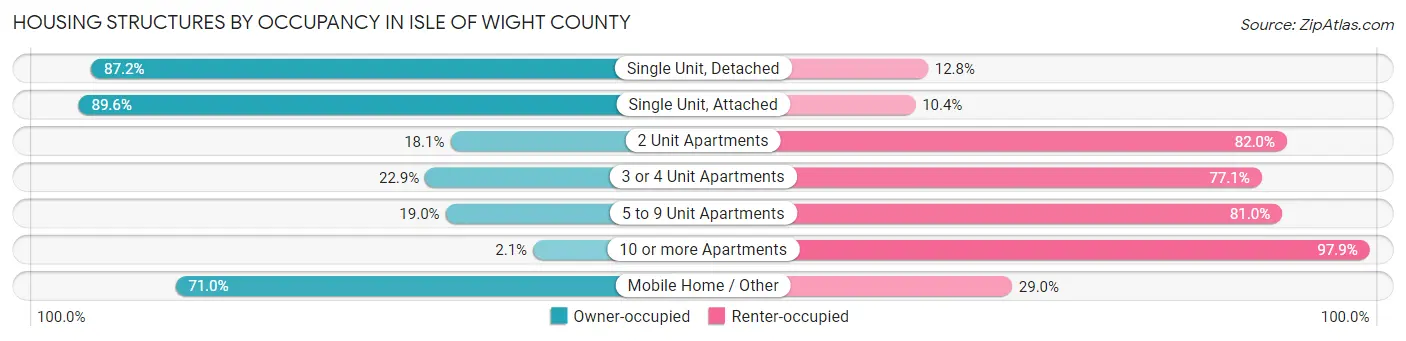
| Structure Type | Owner-occupied | Renter-occupied |
| Single Unit, Detached | 10,399 (87.2%) | 1,529 (12.8%) |
| Single Unit, Attached | 422 (89.6%) | 49 (10.4%) |
| 2 Unit Apartments | 24 (18.0%) | 109 (82.0%) |
| 3 or 4 Unit Apartments | 30 (22.9%) | 101 (77.1%) |
| 5 to 9 Unit Apartments | 93 (19.0%) | 397 (81.0%) |
| 10 or more Apartments | 16 (2.1%) | 735 (97.9%) |
| Mobile Home / Other | 917 (71.0%) | 375 (29.0%) |
| Total | 11,901 (78.3%) | 3,295 (21.7%) |
Housing Structures by Number of Rooms in Isle of Wight County
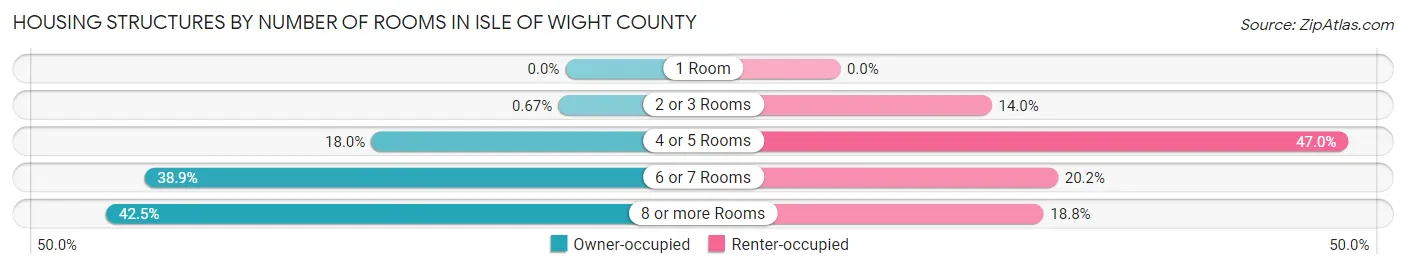
| Number of Rooms | Owner-occupied | Renter-occupied |
| 1 Room | 0 (0.0%) | 0 (0.0%) |
| 2 or 3 Rooms | 80 (0.7%) | 462 (14.0%) |
| 4 or 5 Rooms | 2,136 (17.9%) | 1,549 (47.0%) |
| 6 or 7 Rooms | 4,632 (38.9%) | 664 (20.2%) |
| 8 or more Rooms | 5,053 (42.5%) | 620 (18.8%) |
| Total | 11,901 (100.0%) | 3,295 (100.0%) |
Housing Structure by Heating Type in Isle of Wight County
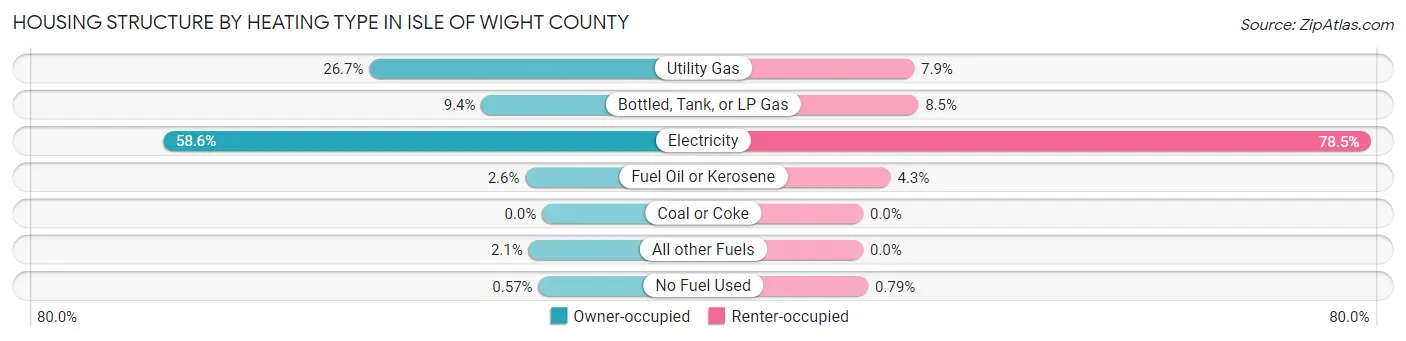
| Heating Type | Owner-occupied | Renter-occupied |
| Utility Gas | 3,180 (26.7%) | 260 (7.9%) |
| Bottled, Tank, or LP Gas | 1,118 (9.4%) | 281 (8.5%) |
| Electricity | 6,976 (58.6%) | 2,588 (78.5%) |
| Fuel Oil or Kerosene | 310 (2.6%) | 140 (4.3%) |
| Coal or Coke | 0 (0.0%) | 0 (0.0%) |
| All other Fuels | 249 (2.1%) | 0 (0.0%) |
| No Fuel Used | 68 (0.6%) | 26 (0.8%) |
| Total | 11,901 (100.0%) | 3,295 (100.0%) |
Household Vehicle Usage in Isle of Wight County
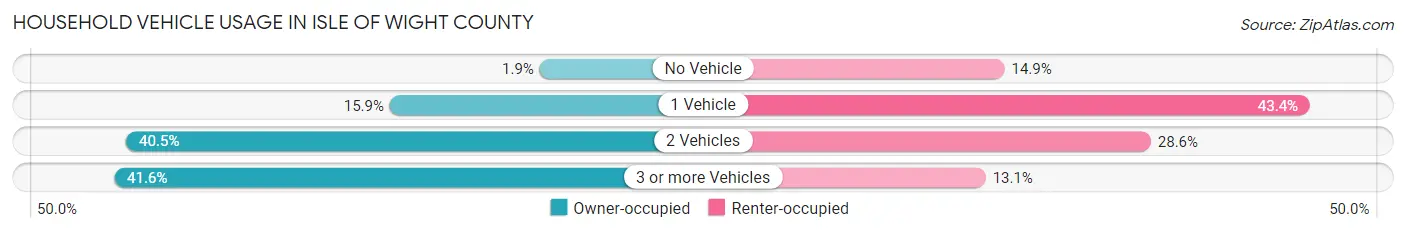
| Vehicles per Household | Owner-occupied | Renter-occupied |
| No Vehicle | 229 (1.9%) | 491 (14.9%) |
| 1 Vehicle | 1,893 (15.9%) | 1,430 (43.4%) |
| 2 Vehicles | 4,824 (40.5%) | 941 (28.6%) |
| 3 or more Vehicles | 4,955 (41.6%) | 433 (13.1%) |
| Total | 11,901 (100.0%) | 3,295 (100.0%) |
Real Estate & Mortgages in Isle of Wight County
Real Estate and Mortgage Overview in Isle of Wight County
| Characteristic | Without Mortgage | With Mortgage |
| Housing Units | 3,949 | 7,952 |
| Median Property Value | $263,700 | $351,700 |
| Median Household Income | $61,621 | $3,130 |
| Monthly Housing Costs | $571 | $1,173 |
| Real Estate Taxes | $2,133 | $134 |
Property Value by Mortgage Status in Isle of Wight County
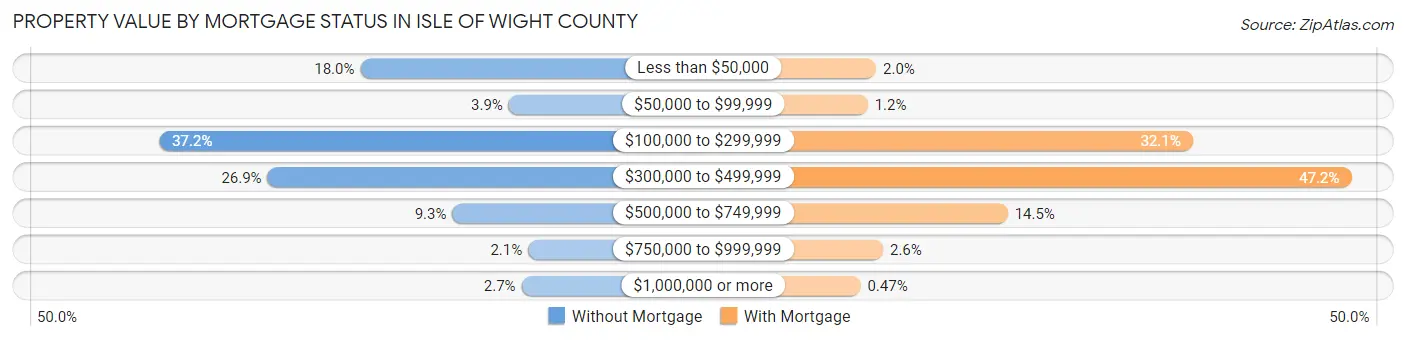
| Property Value | Without Mortgage | With Mortgage |
| Less than $50,000 | 712 (18.0%) | 156 (2.0%) |
| $50,000 to $99,999 | 154 (3.9%) | 92 (1.2%) |
| $100,000 to $299,999 | 1,469 (37.2%) | 2,553 (32.1%) |
| $300,000 to $499,999 | 1,061 (26.9%) | 3,754 (47.2%) |
| $500,000 to $749,999 | 366 (9.3%) | 1,152 (14.5%) |
| $750,000 to $999,999 | 81 (2.1%) | 208 (2.6%) |
| $1,000,000 or more | 106 (2.7%) | 37 (0.5%) |
| Total | 3,949 (100.0%) | 7,952 (100.0%) |
Household Income by Mortgage Status in Isle of Wight County
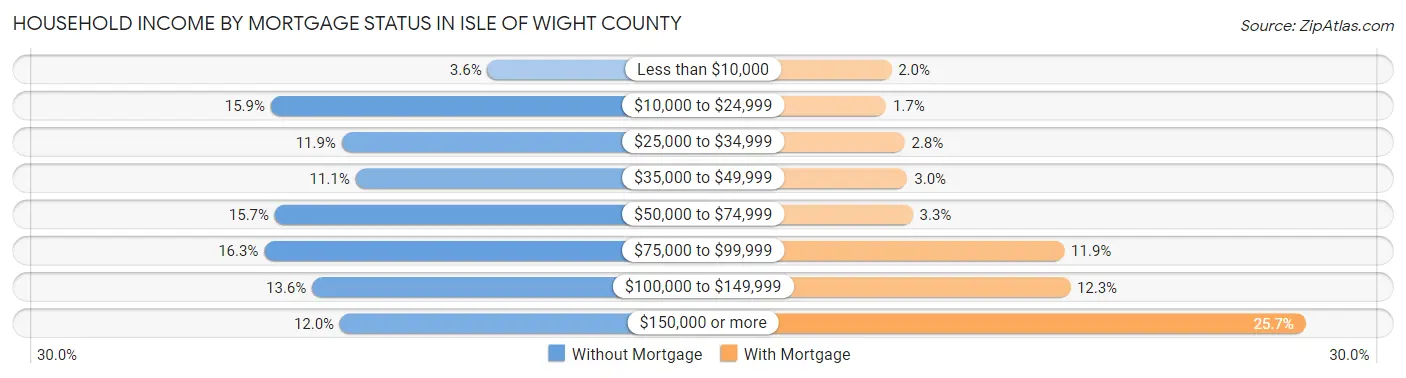
| Household Income | Without Mortgage | With Mortgage |
| Less than $10,000 | 140 (3.5%) | 162 (2.0%) |
| $10,000 to $24,999 | 629 (15.9%) | 138 (1.7%) |
| $25,000 to $34,999 | 469 (11.9%) | 223 (2.8%) |
| $35,000 to $49,999 | 438 (11.1%) | 235 (3.0%) |
| $50,000 to $74,999 | 620 (15.7%) | 259 (3.3%) |
| $75,000 to $99,999 | 644 (16.3%) | 948 (11.9%) |
| $100,000 to $149,999 | 536 (13.6%) | 974 (12.2%) |
| $150,000 or more | 473 (12.0%) | 2,045 (25.7%) |
| Total | 3,949 (100.0%) | 7,952 (100.0%) |
Property Value to Household Income Ratio in Isle of Wight County
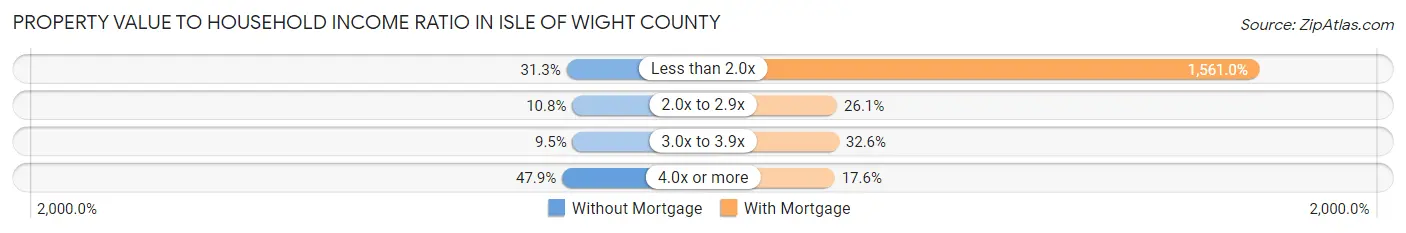
| Value-to-Income Ratio | Without Mortgage | With Mortgage |
| Less than 2.0x | 1,235 (31.3%) | 124,129 (1,561.0%) |
| 2.0x to 2.9x | 426 (10.8%) | 2,075 (26.1%) |
| 3.0x to 3.9x | 373 (9.5%) | 2,588 (32.6%) |
| 4.0x or more | 1,890 (47.9%) | 1,399 (17.6%) |
| Total | 3,949 (100.0%) | 7,952 (100.0%) |
Real Estate Taxes by Mortgage Status in Isle of Wight County
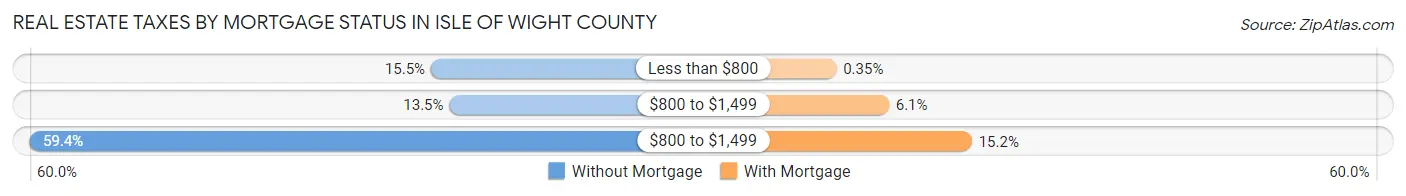
| Property Taxes | Without Mortgage | With Mortgage |
| Less than $800 | 611 (15.5%) | 28 (0.4%) |
| $800 to $1,499 | 531 (13.5%) | 486 (6.1%) |
| $800 to $1,499 | 2,346 (59.4%) | 1,209 (15.2%) |
| Total | 3,949 (100.0%) | 7,952 (100.0%) |
Health & Disability in Isle of Wight County
Health Insurance Coverage by Age in Isle of Wight County
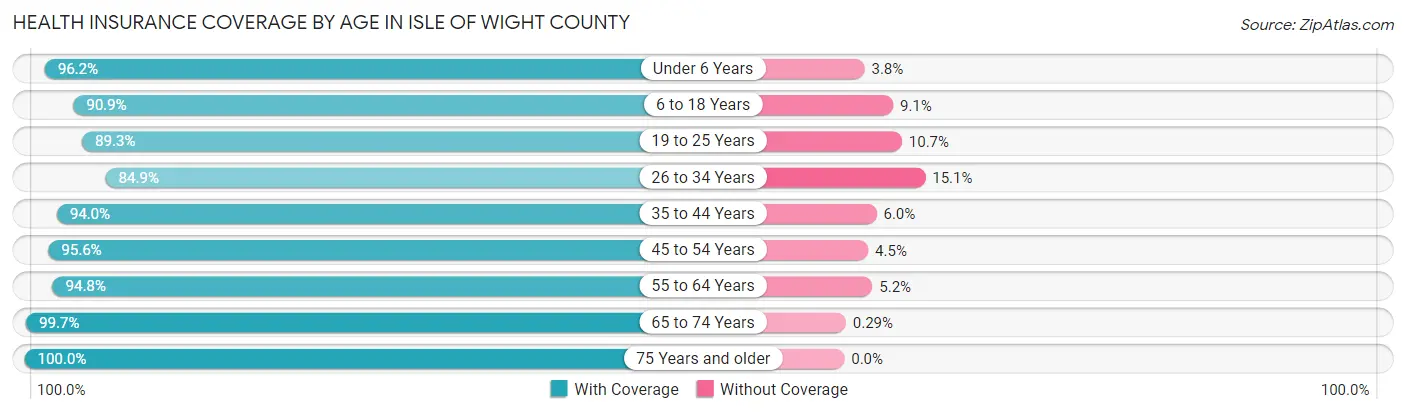
| Age Bracket | With Coverage | Without Coverage |
| Under 6 Years | 2,246 (96.2%) | 88 (3.8%) |
| 6 to 18 Years | 5,779 (90.9%) | 578 (9.1%) |
| 19 to 25 Years | 2,239 (89.3%) | 269 (10.7%) |
| 26 to 34 Years | 3,126 (84.9%) | 556 (15.1%) |
| 35 to 44 Years | 4,360 (94.0%) | 279 (6.0%) |
| 45 to 54 Years | 4,747 (95.6%) | 221 (4.4%) |
| 55 to 64 Years | 6,067 (94.8%) | 335 (5.2%) |
| 65 to 74 Years | 4,430 (99.7%) | 13 (0.3%) |
| 75 Years and older | 2,860 (100.0%) | 0 (0.0%) |
| Total | 35,854 (93.9%) | 2,339 (6.1%) |
Health Insurance Coverage by Citizenship Status in Isle of Wight County
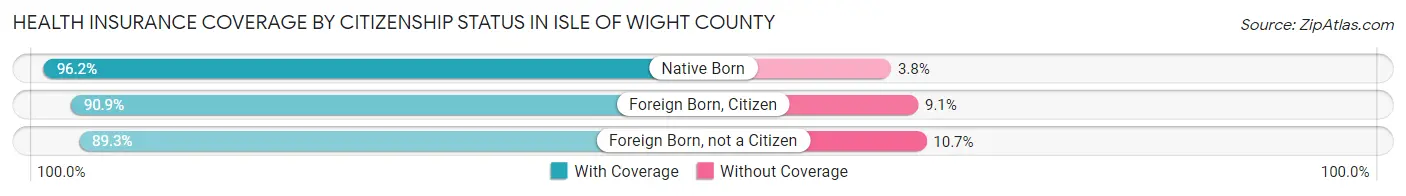
| Citizenship Status | With Coverage | Without Coverage |
| Native Born | 2,246 (96.2%) | 88 (3.8%) |
| Foreign Born, Citizen | 5,779 (90.9%) | 578 (9.1%) |
| Foreign Born, not a Citizen | 2,239 (89.3%) | 269 (10.7%) |
Health Insurance Coverage by Household Income in Isle of Wight County
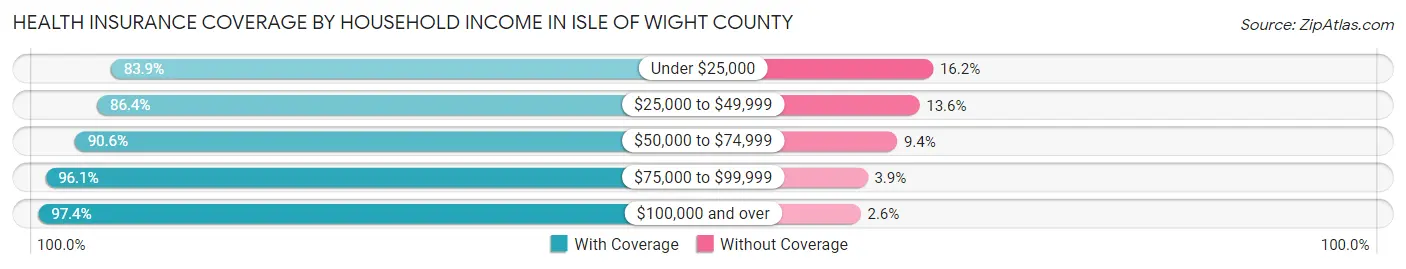
| Household Income | With Coverage | Without Coverage |
| Under $25,000 | 2,976 (83.9%) | 573 (16.2%) |
| $25,000 to $49,999 | 3,659 (86.4%) | 575 (13.6%) |
| $50,000 to $74,999 | 4,393 (90.6%) | 456 (9.4%) |
| $75,000 to $99,999 | 4,427 (96.1%) | 178 (3.9%) |
| $100,000 and over | 20,370 (97.4%) | 538 (2.6%) |
Public vs Private Health Insurance Coverage by Age in Isle of Wight County
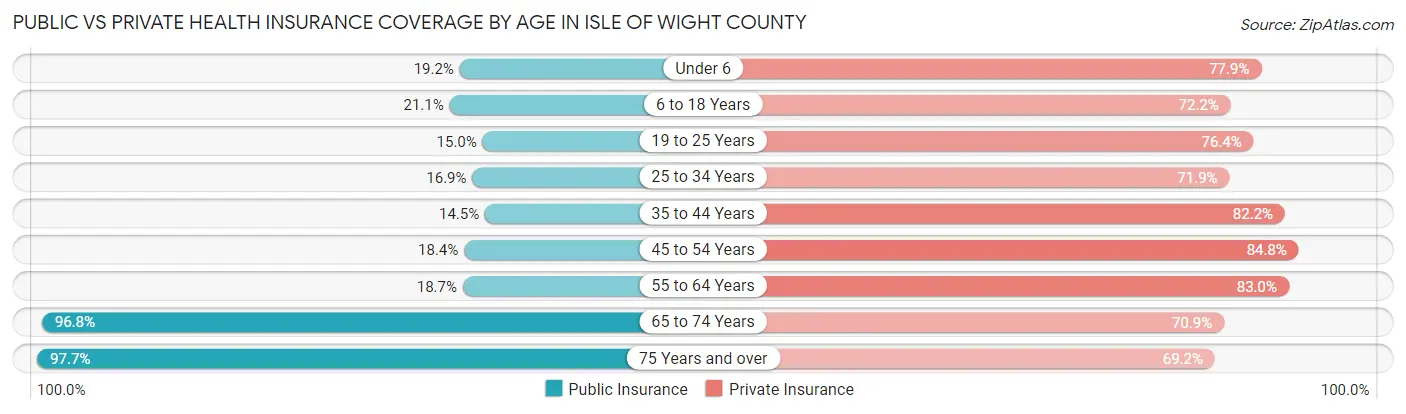
| Age Bracket | Public Insurance | Private Insurance |
| Under 6 | 449 (19.2%) | 1,817 (77.8%) |
| 6 to 18 Years | 1,343 (21.1%) | 4,588 (72.2%) |
| 19 to 25 Years | 376 (15.0%) | 1,917 (76.4%) |
| 25 to 34 Years | 622 (16.9%) | 2,649 (71.9%) |
| 35 to 44 Years | 674 (14.5%) | 3,815 (82.2%) |
| 45 to 54 Years | 915 (18.4%) | 4,213 (84.8%) |
| 55 to 64 Years | 1,195 (18.7%) | 5,312 (83.0%) |
| 65 to 74 Years | 4,301 (96.8%) | 3,152 (70.9%) |
| 75 Years and over | 2,793 (97.7%) | 1,980 (69.2%) |
| Total | 12,668 (33.2%) | 29,443 (77.1%) |
Disability Status by Sex by Age in Isle of Wight County
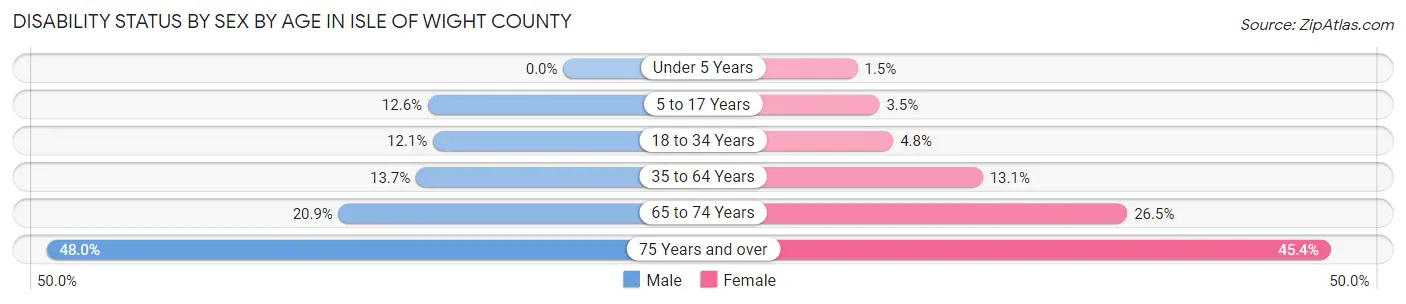
| Age Bracket | Male | Female |
| Under 5 Years | 0 (0.0%) | 13 (1.5%) |
| 5 to 17 Years | 406 (12.6%) | 107 (3.5%) |
| 18 to 34 Years | 405 (12.1%) | 159 (4.8%) |
| 35 to 64 Years | 1,096 (13.7%) | 1,045 (13.1%) |
| 65 to 74 Years | 439 (20.8%) | 619 (26.5%) |
| 75 Years and over | 601 (48.0%) | 729 (45.4%) |
Disability Class by Sex by Age in Isle of Wight County
Disability Class: Hearing Difficulty
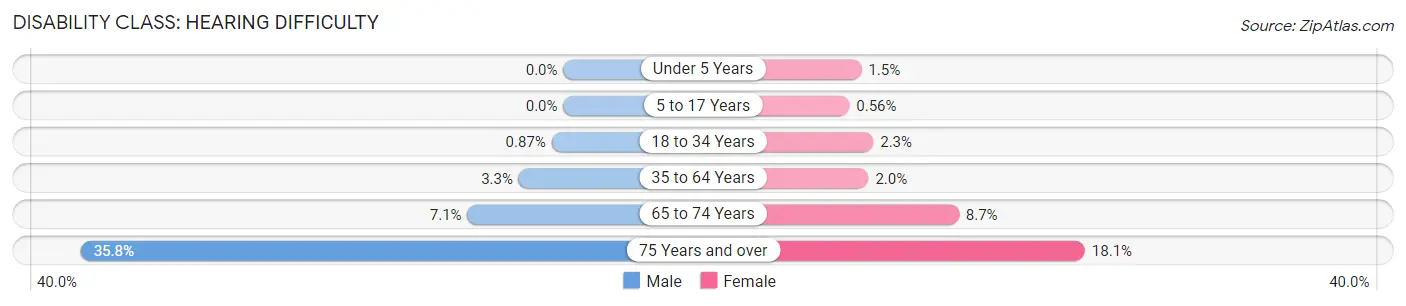
| Age Bracket | Male | Female |
| Under 5 Years | 0 (0.0%) | 13 (1.5%) |
| 5 to 17 Years | 0 (0.0%) | 17 (0.6%) |
| 18 to 34 Years | 29 (0.9%) | 78 (2.3%) |
| 35 to 64 Years | 265 (3.3%) | 158 (2.0%) |
| 65 to 74 Years | 150 (7.1%) | 203 (8.7%) |
| 75 Years and over | 449 (35.8%) | 290 (18.0%) |
Disability Class: Vision Difficulty
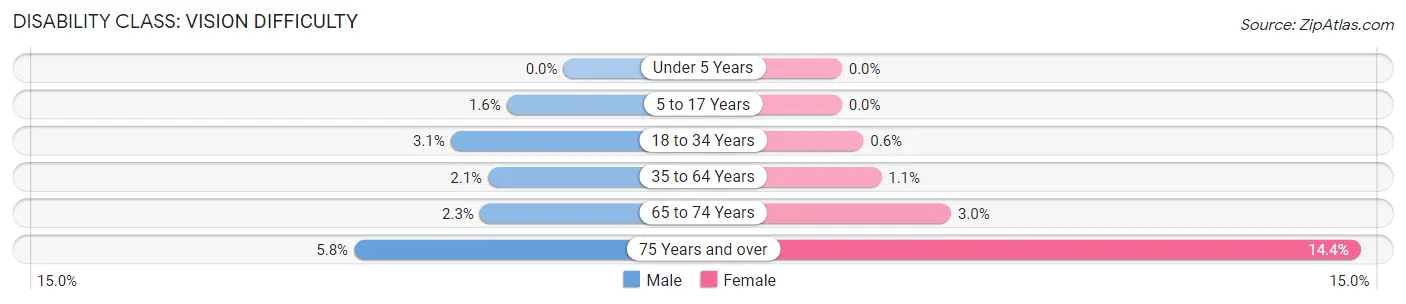
| Age Bracket | Male | Female |
| Under 5 Years | 0 (0.0%) | 0 (0.0%) |
| 5 to 17 Years | 51 (1.6%) | 0 (0.0%) |
| 18 to 34 Years | 105 (3.1%) | 20 (0.6%) |
| 35 to 64 Years | 168 (2.1%) | 88 (1.1%) |
| 65 to 74 Years | 49 (2.3%) | 71 (3.0%) |
| 75 Years and over | 73 (5.8%) | 232 (14.4%) |
Disability Class: Cognitive Difficulty
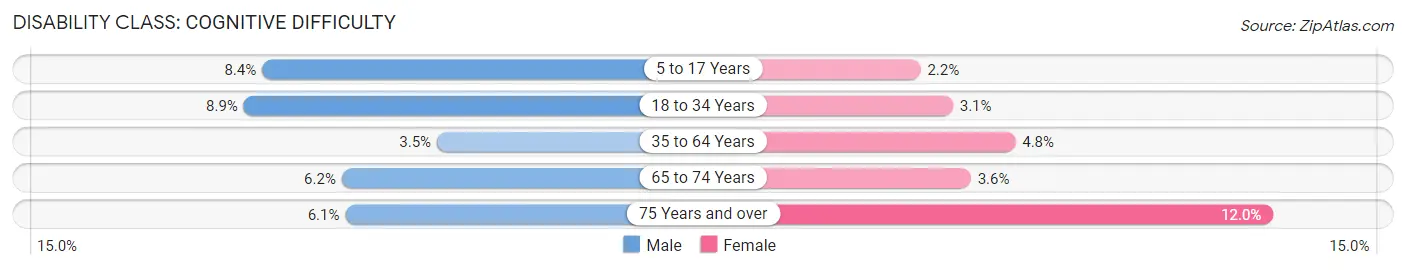
| Age Bracket | Male | Female |
| 5 to 17 Years | 271 (8.4%) | 67 (2.2%) |
| 18 to 34 Years | 298 (8.9%) | 103 (3.1%) |
| 35 to 64 Years | 282 (3.5%) | 386 (4.8%) |
| 65 to 74 Years | 130 (6.2%) | 84 (3.6%) |
| 75 Years and over | 76 (6.1%) | 193 (12.0%) |
Disability Class: Ambulatory Difficulty
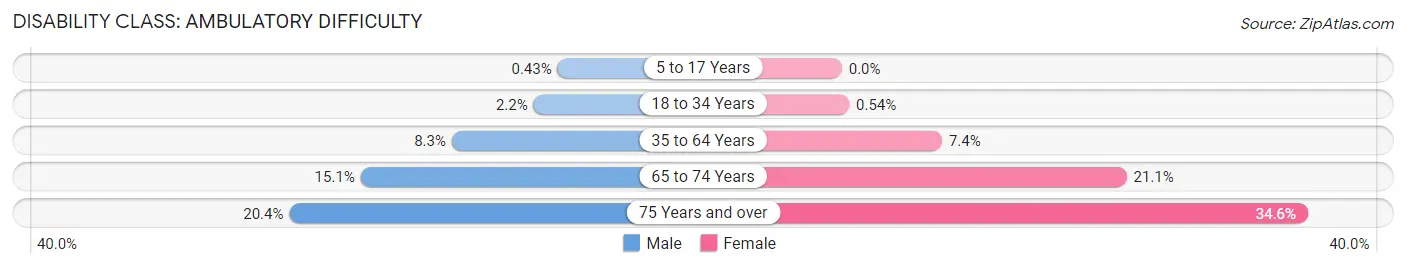
| Age Bracket | Male | Female |
| 5 to 17 Years | 14 (0.4%) | 0 (0.0%) |
| 18 to 34 Years | 74 (2.2%) | 18 (0.5%) |
| 35 to 64 Years | 664 (8.3%) | 595 (7.4%) |
| 65 to 74 Years | 317 (15.0%) | 494 (21.1%) |
| 75 Years and over | 255 (20.3%) | 556 (34.6%) |
Disability Class: Self-Care Difficulty
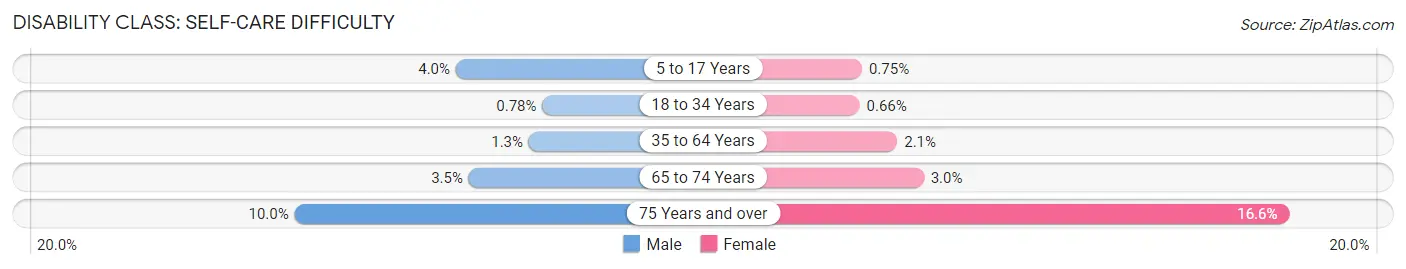
| Age Bracket | Male | Female |
| 5 to 17 Years | 129 (4.0%) | 23 (0.7%) |
| 18 to 34 Years | 26 (0.8%) | 22 (0.7%) |
| 35 to 64 Years | 103 (1.3%) | 165 (2.1%) |
| 65 to 74 Years | 74 (3.5%) | 71 (3.0%) |
| 75 Years and over | 125 (10.0%) | 267 (16.6%) |
Technology Access in Isle of Wight County
Computing Device Access in Isle of Wight County
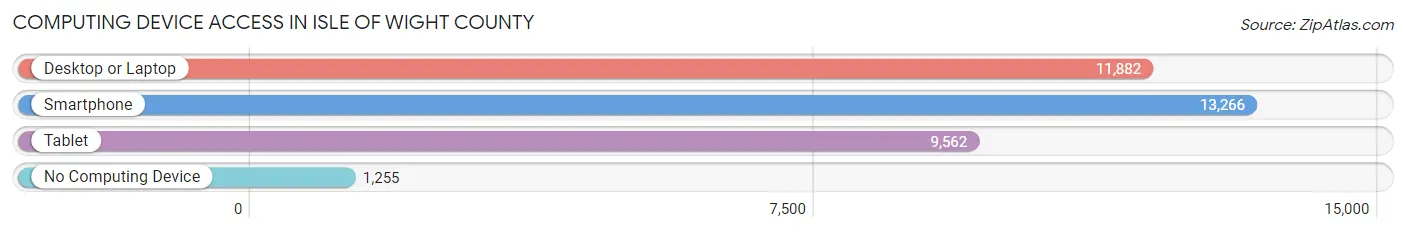
| Device Type | # Households | % Households |
| Desktop or Laptop | 11,882 | 78.2% |
| Smartphone | 13,266 | 87.3% |
| Tablet | 9,562 | 62.9% |
| No Computing Device | 1,255 | 8.3% |
| Total | 15,196 | 100.0% |
Internet Access in Isle of Wight County
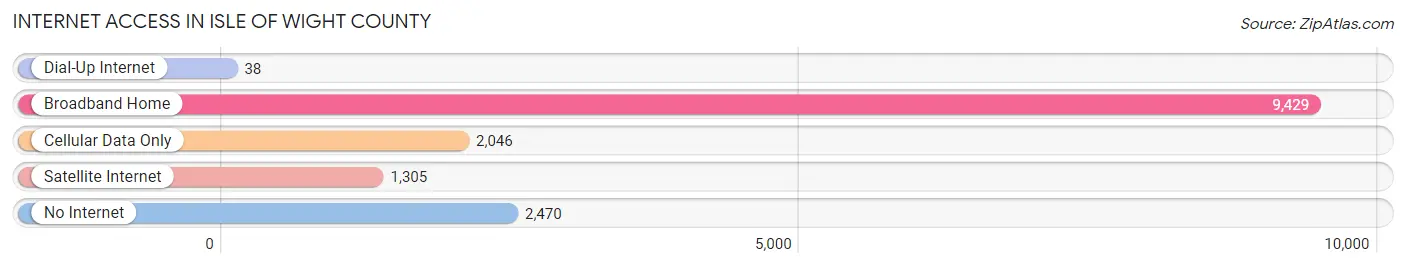
| Internet Type | # Households | % Households |
| Dial-Up Internet | 38 | 0.3% |
| Broadband Home | 9,429 | 62.1% |
| Cellular Data Only | 2,046 | 13.5% |
| Satellite Internet | 1,305 | 8.6% |
| No Internet | 2,470 | 16.3% |
| Total | 15,196 | 100.0% |
Isle of Wight County Summary
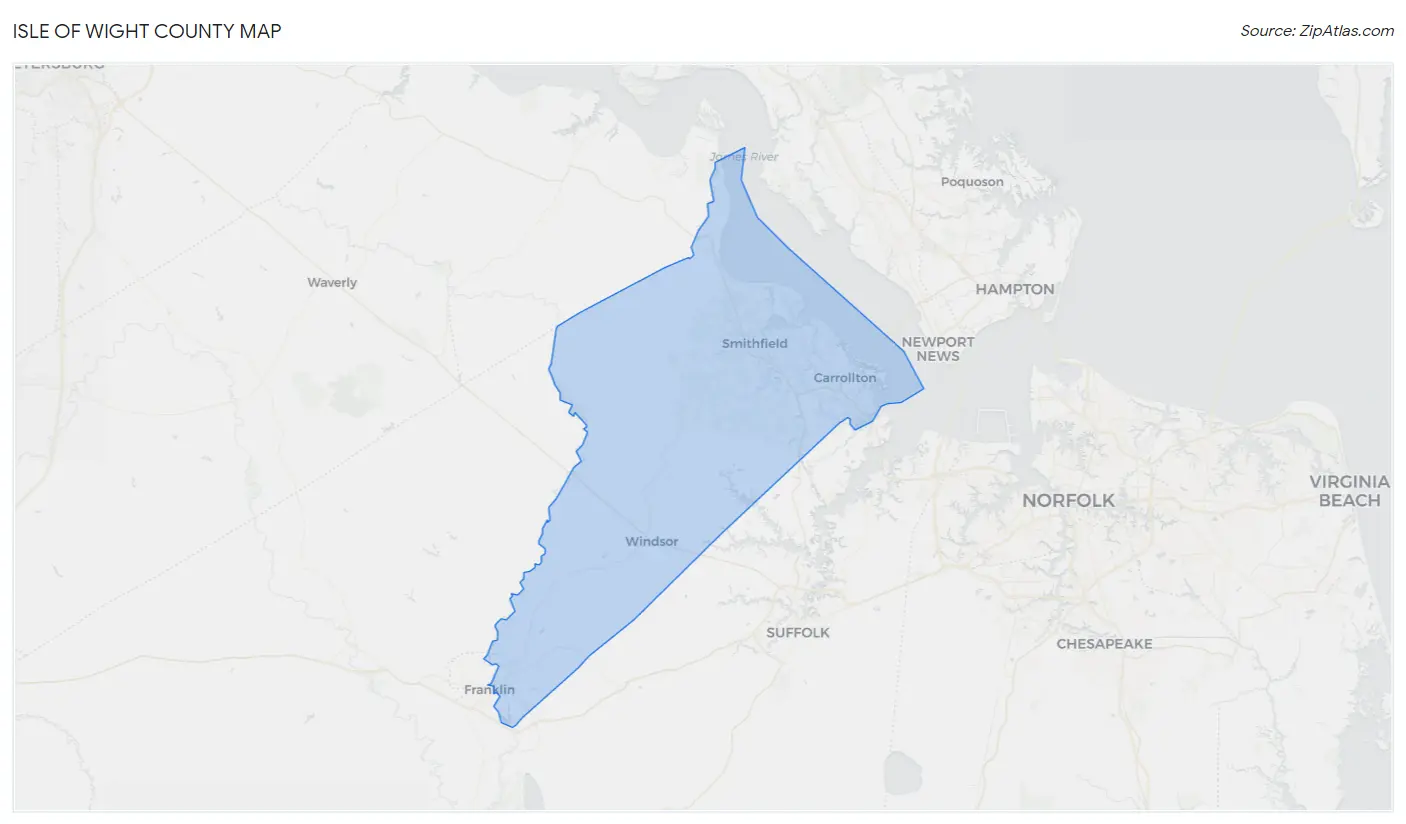
Isle of Wight County is a county located in the Commonwealth of Virginia. It is located on the south side of the James River and is part of the Hampton Roads metropolitan area. The county seat is Isle of Wight. The county was named after the Isle of Wight in England.
Geography
Isle of Wight County is located in the southeastern corner of Virginia, bordered by the James River to the north, the Nansemond River to the east, and the Blackwater River to the south. The county is approximately 545 square miles in size and is divided into seven townships: Smithfield, Rushmere, Carrsville, Windsor, Newport, Isle of Wight, and Hardy. The county is mostly rural, with the majority of the population living in the towns of Smithfield and Windsor.
The county is home to several state parks, including Chippokes Plantation State Park, False Cape State Park, and the Isle of Wight State Park. The county is also home to the historic St. Luke’s Church, which is the oldest church in the United States.
History
The area that is now Isle of Wight County was first settled by Europeans in 1608, when Captain John Smith and his crew explored the area. The county was officially established in 1634, when it was carved out of Warrosquyoake County. The county was named after the Isle of Wight in England, which was the birthplace of many of the early settlers.
The county was an important agricultural center during the colonial period, and it was home to many prominent families, including the Carrs, the Smiths, and the Windsors. The county was also home to several important Revolutionary War battles, including the Battle of Great Bridge and the Battle of Smithfield.
In the 19th century, the county became an important center for the production of tobacco, and it was home to several large tobacco plantations. The county was also home to several important Civil War battles, including the Battle of Smithfield and the Battle of Carrsville.
Economy
The economy of Isle of Wight County is largely based on agriculture and tourism. The county is home to several large farms, which produce a variety of crops, including corn, soybeans, wheat, and tobacco. The county is also home to several wineries, which produce a variety of wines.
The county is also home to several tourist attractions, including the Isle of Wight State Park, Chippokes Plantation State Park, and the historic St. Luke’s Church. The county is also home to several museums, including the Isle of Wight County Museum and the Smithfield Station Museum.
Demographics
As of the 2010 census, the population of Isle of Wight County was 35,270. The population is largely white (87.3%), with African Americans making up 8.2% of the population. The median household income is $60,945, and the median age is 43.
Conclusion
Isle of Wight County is a rural county located in the southeastern corner of Virginia. The county is home to several state parks, historic sites, and museums, and it is an important agricultural center. The county is also home to several tourist attractions, and it has a largely white population with a median household income of $60,945.
Common Questions
What is Per Capita Income in Isle of Wight County?
Per Capita income in Isle of Wight County is $45,230.
What is the Median Family Income in Isle of Wight County?
Median Family Income in Isle of Wight County is $111,147.
What is the Median Household income in Isle of Wight County?
Median Household Income in Isle of Wight County is $91,680.
What is Income or Wage Gap in Isle of Wight County?
Income or Wage Gap in Isle of Wight County is 38.7%.
Women in Isle of Wight County earn 61.3 cents for every dollar earned by a man.
What is Family Income Deficit in Isle of Wight County?
Family Income Deficit in Isle of Wight County is $9,091.
Families that are below poverty line in Isle of Wight County earn $9,091 less on average than the poverty threshold level.
What is Inequality or Gini Index in Isle of Wight County?
Inequality or Gini Index in Isle of Wight County is 0.44.
What is the Total Population of Isle of Wight County?
Total Population of Isle of Wight County is 38,898.
What is the Total Male Population of Isle of Wight County?
Total Male Population of Isle of Wight County is 19,422.
What is the Total Female Population of Isle of Wight County?
Total Female Population of Isle of Wight County is 19,476.
What is the Ratio of Males per 100 Females in Isle of Wight County?
There are 99.72 Males per 100 Females in Isle of Wight County.
What is the Ratio of Females per 100 Males in Isle of Wight County?
There are 100.28 Females per 100 Males in Isle of Wight County.
What is the Median Population Age in Isle of Wight County?
Median Population Age in Isle of Wight County is 44.2 Years.
What is the Average Family Size in Isle of Wight County
Average Family Size in Isle of Wight County is 3.0 People.
What is the Average Household Size in Isle of Wight County
Average Household Size in Isle of Wight County is 2.5 People.
How Large is the Labor Force in Isle of Wight County?
There are 20,194 People in the Labor Forcein in Isle of Wight County.
What is the Percentage of People in the Labor Force in Isle of Wight County?
63.7% of People are in the Labor Force in Isle of Wight County.
What is the Unemployment Rate in Isle of Wight County?
Unemployment Rate in Isle of Wight County is 5.5%.