Hopewell city, VA Map & Demographics
Hopewell city Map
Hopewell city Overview
$25,664
PER CAPITA INCOME
$58,850
AVG FAMILY INCOME
$50,661
AVG HOUSEHOLD INCOME
14.9%
WAGE / INCOME GAP [ % ]
85.1¢/ $1
WAGE / INCOME GAP [ $ ]
$10,942
FAMILY INCOME DEFICIT
0.44
INEQUALITY / GINI INDEX
23,046
TOTAL POPULATION
10,827
MALE POPULATION
12,219
FEMALE POPULATION
88.61
MALES / 100 FEMALES
112.86
FEMALES / 100 MALES
35.7
MEDIAN AGE
3.0
AVG FAMILY SIZE
2.4
AVG HOUSEHOLD SIZE
10,655
LABOR FORCE [ PEOPLE ]
60.2%
PERCENT IN LABOR FORCE
8.8%
UNEMPLOYMENT RATE
Hopewell city Area Codes
Income in Hopewell city
Income Overview in Hopewell city
Per Capita Income in Hopewell city is $25,664, while median incomes of families and households are $58,850 and $50,661 respectively.
| Characteristic | Number | Measure |
| Per Capita Income | 23,046 | $25,664 |
| Median Family Income | 5,946 | $58,850 |
| Mean Family Income | 5,946 | $71,729 |
| Median Household Income | 9,348 | $50,661 |
| Mean Household Income | 9,348 | $63,460 |
| Income Deficit | 5,946 | $10,942 |
| Wage / Income Gap (%) | 23,046 | 14.93% |
| Wage / Income Gap ($) | 23,046 | 85.07¢ per $1 |
| Gini / Inequality Index | 23,046 | 0.44 |
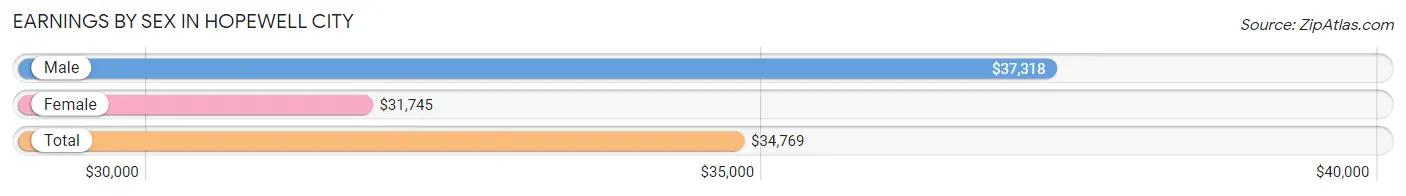
Earnings by Sex in Hopewell city
Average Earnings in Hopewell city are $34,769, $37,318 for men and $31,745 for women, a difference of 14.9%.
| Sex | Number | Average Earnings |
| Male | 5,516 (48.9%) | $37,318 |
| Female | 5,757 (51.1%) | $31,745 |
| Total | 11,273 (100.0%) | $34,769 |
Earnings by Sex by Income Bracket in Hopewell city
The most common earnings brackets in Hopewell city are $15,000 to $17,499 for men (521 | 9.5%) and $40,000 to $44,999 for women (659 | 11.5%).
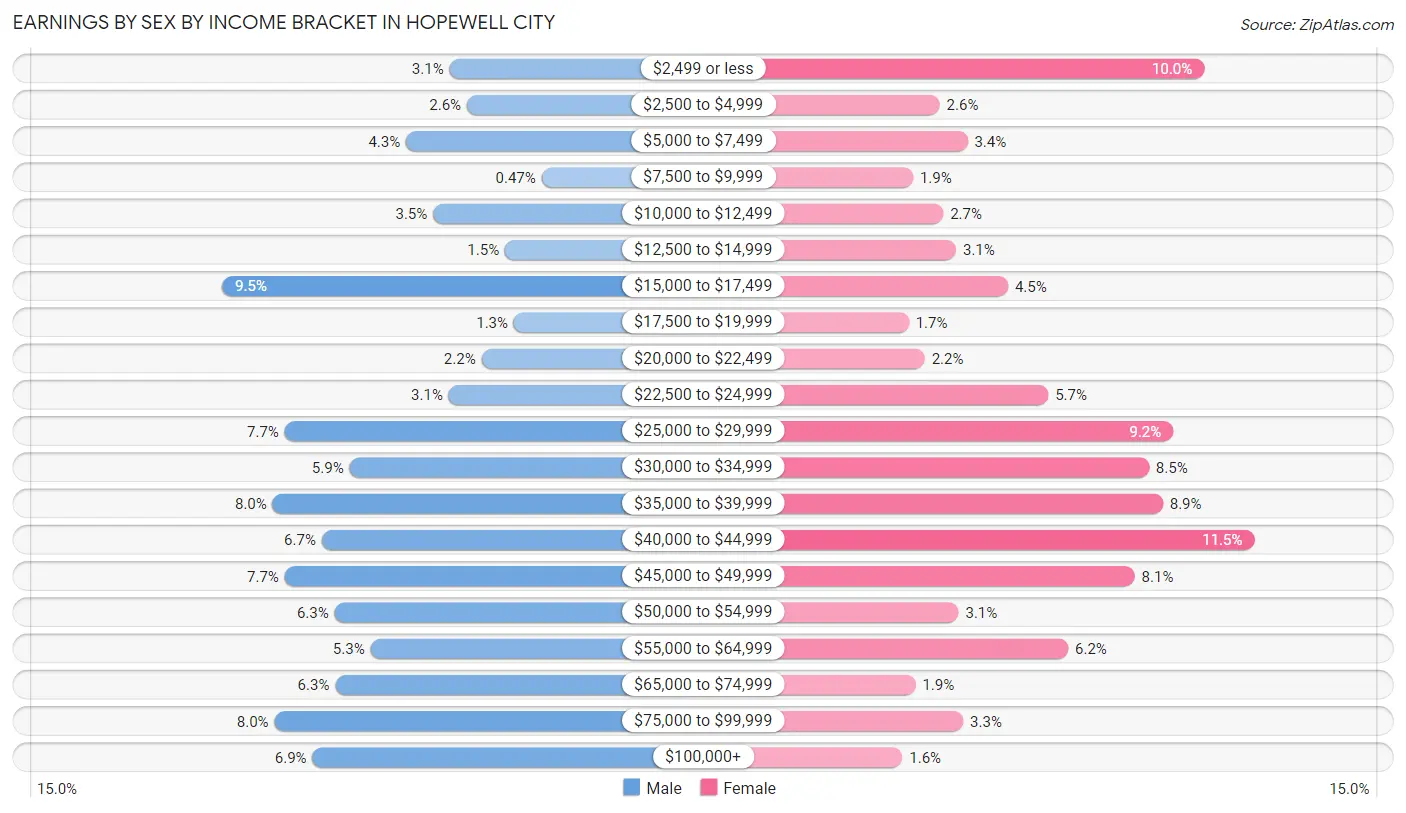
| Income | Male | Female |
| $2,499 or less | 169 (3.1%) | 578 (10.0%) |
| $2,500 to $4,999 | 142 (2.6%) | 150 (2.6%) |
| $5,000 to $7,499 | 236 (4.3%) | 195 (3.4%) |
| $7,500 to $9,999 | 26 (0.5%) | 107 (1.9%) |
| $10,000 to $12,499 | 194 (3.5%) | 156 (2.7%) |
| $12,500 to $14,999 | 83 (1.5%) | 177 (3.1%) |
| $15,000 to $17,499 | 521 (9.5%) | 261 (4.5%) |
| $17,500 to $19,999 | 69 (1.3%) | 100 (1.7%) |
| $20,000 to $22,499 | 119 (2.2%) | 126 (2.2%) |
| $22,500 to $24,999 | 170 (3.1%) | 326 (5.7%) |
| $25,000 to $29,999 | 424 (7.7%) | 528 (9.2%) |
| $30,000 to $34,999 | 324 (5.9%) | 489 (8.5%) |
| $35,000 to $39,999 | 443 (8.0%) | 511 (8.9%) |
| $40,000 to $44,999 | 367 (6.7%) | 659 (11.5%) |
| $45,000 to $49,999 | 424 (7.7%) | 466 (8.1%) |
| $50,000 to $54,999 | 347 (6.3%) | 181 (3.1%) |
| $55,000 to $64,999 | 291 (5.3%) | 358 (6.2%) |
| $65,000 to $74,999 | 346 (6.3%) | 111 (1.9%) |
| $75,000 to $99,999 | 440 (8.0%) | 188 (3.3%) |
| $100,000+ | 381 (6.9%) | 90 (1.6%) |
| Total | 5,516 (100.0%) | 5,757 (100.0%) |
Earnings by Sex by Educational Attainment in Hopewell city
Average earnings in Hopewell city are $41,028 for men and $35,406 for women, a difference of 13.7%. Men with an educational attainment of bachelor's degree enjoy the highest average annual earnings of $54,055, while those with less than high school education earn the least with $16,164. Women with an educational attainment of graduate degree earn the most with the average annual earnings of $52,230, while those with less than high school education have the smallest earnings of $23,250.
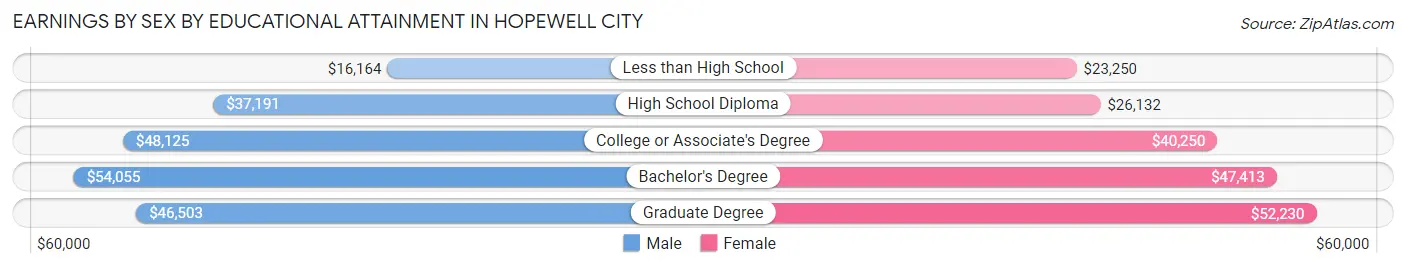
| Educational Attainment | Male Income | Female Income |
| Less than High School | $16,164 | $23,250 |
| High School Diploma | $37,191 | $26,132 |
| College or Associate's Degree | $48,125 | $40,250 |
| Bachelor's Degree | $54,055 | $47,413 |
| Graduate Degree | $46,503 | $52,230 |
| Total | $41,028 | $35,406 |
Family Income in Hopewell city
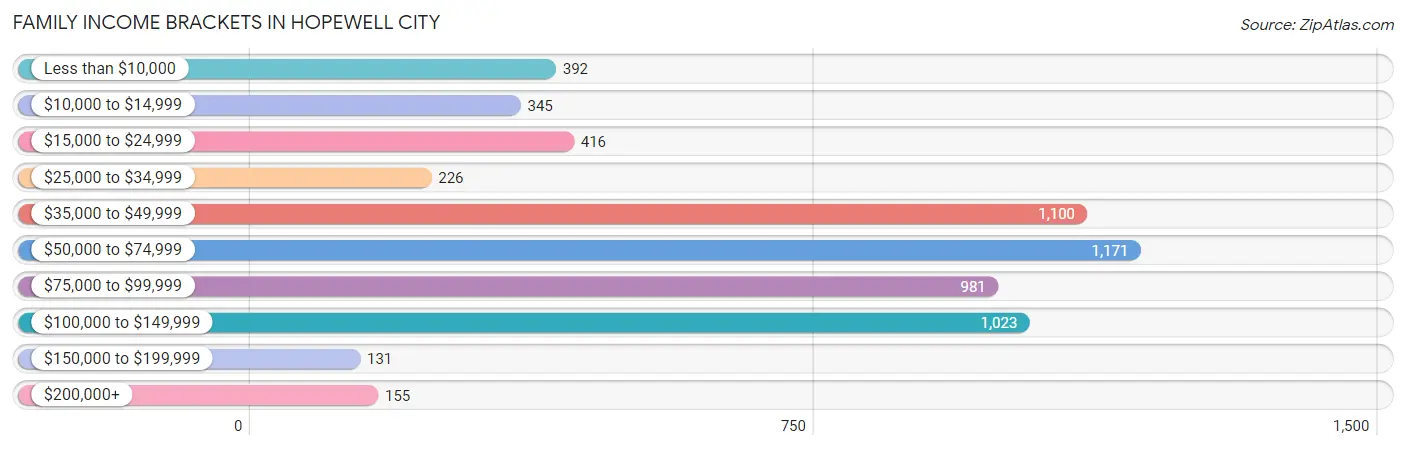
Family Income Brackets in Hopewell city
According to the Hopewell city family income data, there are 1,171 families falling into the $50,000 to $74,999 income range, which is the most common income bracket and makes up 19.7% of all families. Conversely, the $150,000 to $199,999 income bracket is the least frequent group with only 131 families (2.2%) belonging to this category.
| Income Bracket | # Families | % Families |
| Less than $10,000 | 392 | 6.6% |
| $10,000 to $14,999 | 345 | 5.8% |
| $15,000 to $24,999 | 416 | 7.0% |
| $25,000 to $34,999 | 226 | 3.8% |
| $35,000 to $49,999 | 1,100 | 18.5% |
| $50,000 to $74,999 | 1,171 | 19.7% |
| $75,000 to $99,999 | 981 | 16.5% |
| $100,000 to $149,999 | 1,023 | 17.2% |
| $150,000 to $199,999 | 131 | 2.2% |
| $200,000+ | 155 | 2.6% |
Family Income by Famaliy Size in Hopewell city
4-person families (900 | 15.1%) account for the highest median family income in Hopewell city with $87,819 per family, while 2-person families (2,587 | 43.5%) have the highest median income of $31,016 per family member.
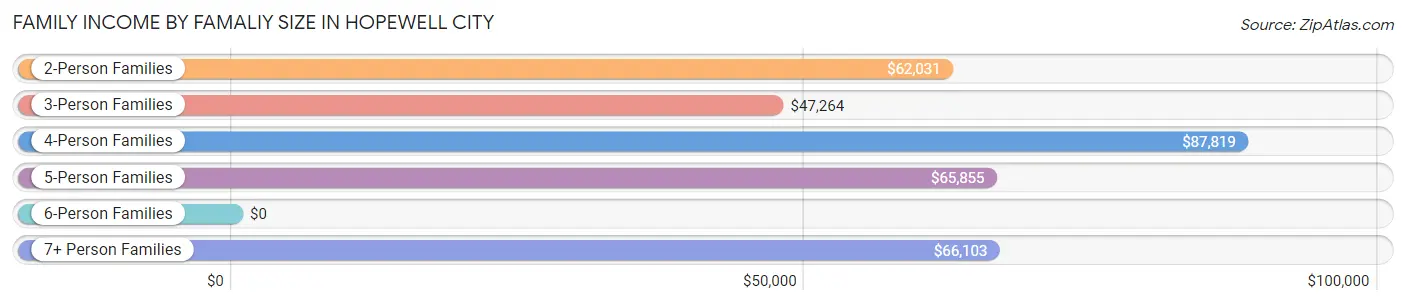
| Income Bracket | # Families | Median Income |
| 2-Person Families | 2,587 (43.5%) | $62,031 |
| 3-Person Families | 1,492 (25.1%) | $47,264 |
| 4-Person Families | 900 (15.1%) | $87,819 |
| 5-Person Families | 538 (9.0%) | $65,855 |
| 6-Person Families | 305 (5.1%) | $0 |
| 7+ Person Families | 124 (2.1%) | $66,103 |
| Total | 5,946 (100.0%) | $58,850 |
Family Income by Number of Earners in Hopewell city
The median family income in Hopewell city is $58,850, with families comprising 3+ earners (605) having the highest median family income of $99,419, while families with no earners (837) have the lowest median family income of $22,092, accounting for 10.2% and 14.1% of families, respectively.
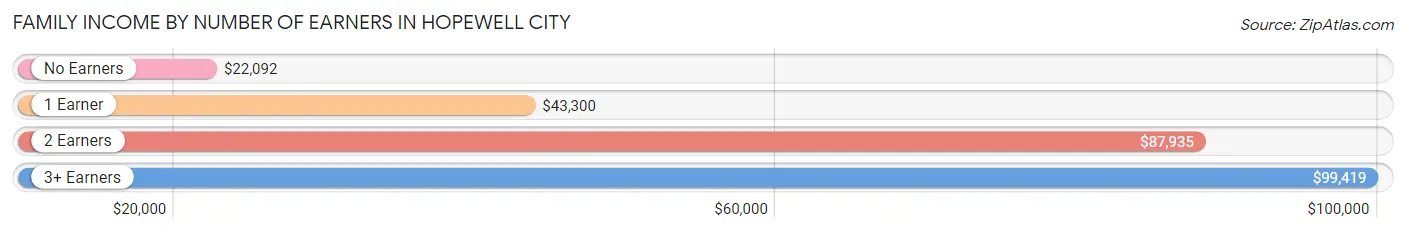
| Number of Earners | # Families | Median Income |
| No Earners | 837 (14.1%) | $22,092 |
| 1 Earner | 2,126 (35.8%) | $43,300 |
| 2 Earners | 2,378 (40.0%) | $87,935 |
| 3+ Earners | 605 (10.2%) | $99,419 |
| Total | 5,946 (100.0%) | $58,850 |
Household Income in Hopewell city
Household Income Brackets in Hopewell city
With 1,814 households falling in the category, the $50,000 to $74,999 income range is the most frequent in Hopewell city, accounting for 19.4% of all households. In contrast, only 206 households (2.2%) fall into the $200,000+ income bracket, making it the least populous group.
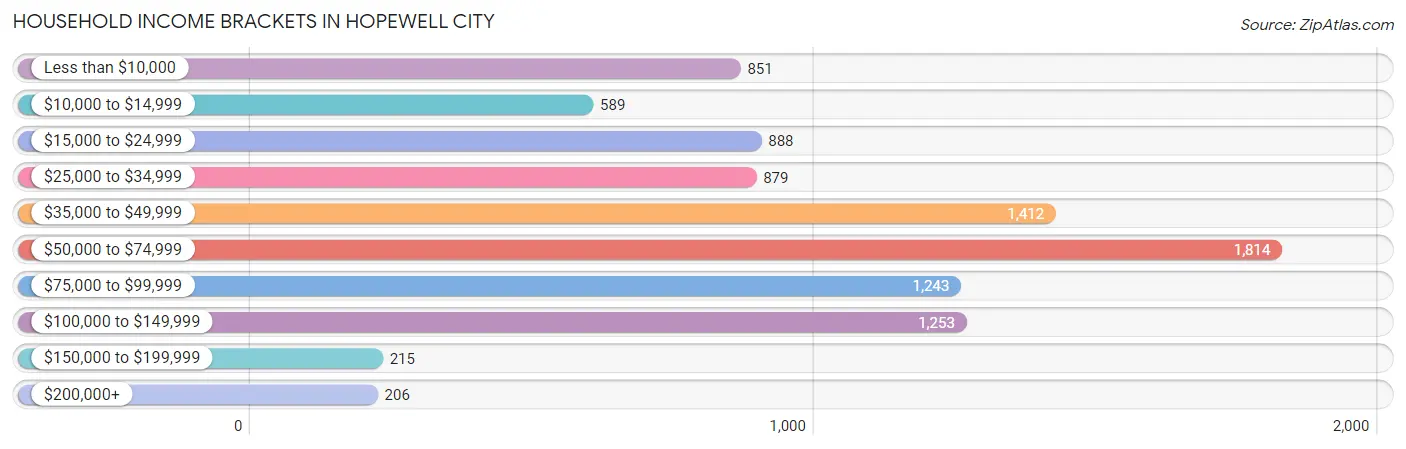
| Income Bracket | # Households | % Households |
| Less than $10,000 | 851 | 9.1% |
| $10,000 to $14,999 | 589 | 6.3% |
| $15,000 to $24,999 | 888 | 9.5% |
| $25,000 to $34,999 | 879 | 9.4% |
| $35,000 to $49,999 | 1,412 | 15.1% |
| $50,000 to $74,999 | 1,814 | 19.4% |
| $75,000 to $99,999 | 1,243 | 13.3% |
| $100,000 to $149,999 | 1,253 | 13.4% |
| $150,000 to $199,999 | 215 | 2.3% |
| $200,000+ | 206 | 2.2% |
Household Income by Householder Age in Hopewell city
The median household income in Hopewell city is $50,661, with the highest median household income of $59,417 found in the 45 to 64 years age bracket for the primary householder. A total of 3,387 households (36.2%) fall into this category. Meanwhile, the 65+ years age bracket for the primary householder has the lowest median household income of $35,162, with 2,349 households (25.1%) in this group.
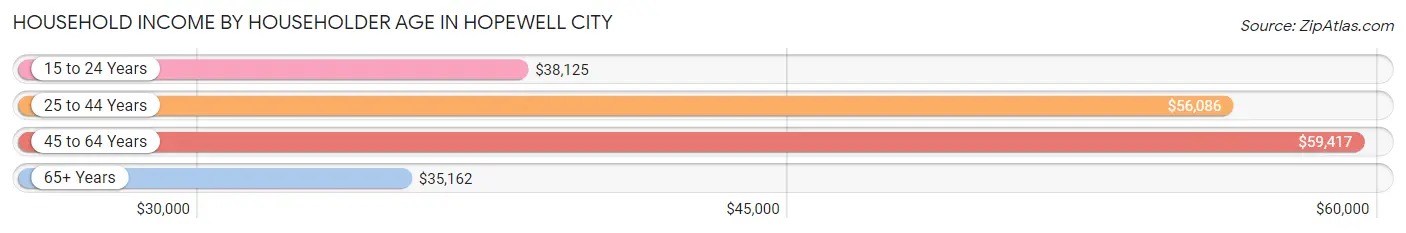
| Income Bracket | # Households | Median Income |
| 15 to 24 Years | 587 (6.3%) | $38,125 |
| 25 to 44 Years | 3,025 (32.4%) | $56,086 |
| 45 to 64 Years | 3,387 (36.2%) | $59,417 |
| 65+ Years | 2,349 (25.1%) | $35,162 |
| Total | 9,348 (100.0%) | $50,661 |
Poverty in Hopewell city
Income Below Poverty by Sex and Age in Hopewell city
With 20.3% poverty level for males and 22.3% for females among the residents of Hopewell city, 16 and 17 year old males and 12 to 14 year old females are the most vulnerable to poverty, with 245 males (62.0%) and 176 females (60.3%) in their respective age groups living below the poverty level.
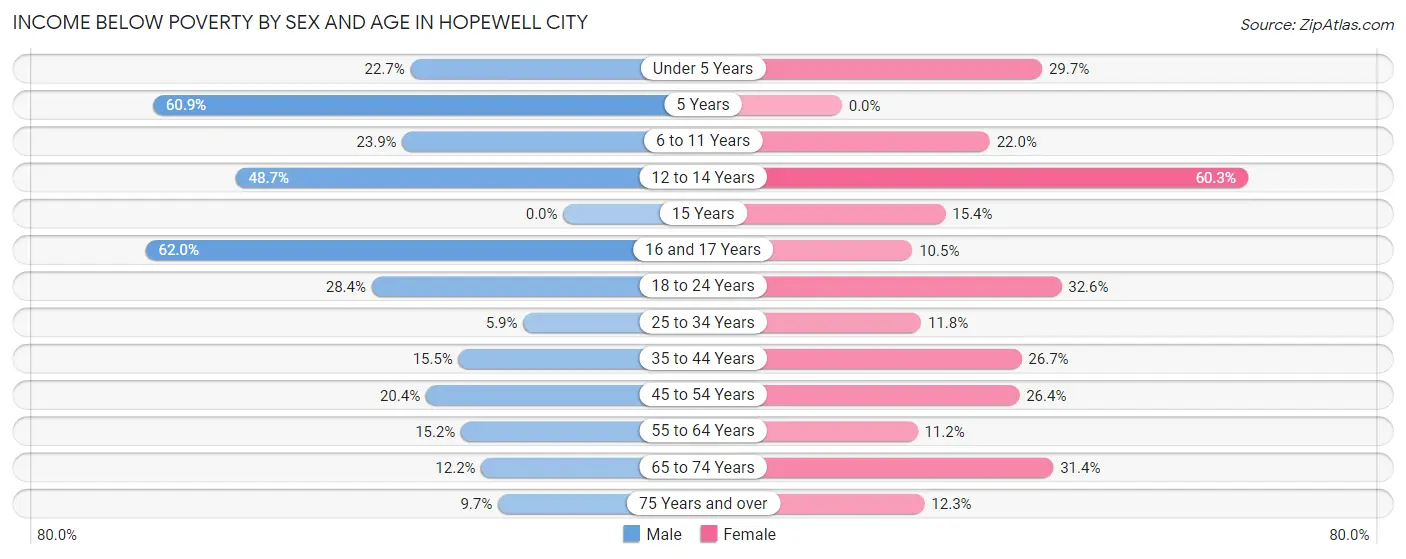
| Age Bracket | Male | Female |
| Under 5 Years | 204 (22.7%) | 223 (29.7%) |
| 5 Years | 39 (60.9%) | 0 (0.0%) |
| 6 to 11 Years | 345 (23.9%) | 248 (22.0%) |
| 12 to 14 Years | 163 (48.7%) | 176 (60.3%) |
| 15 Years | 0 (0.0%) | 48 (15.4%) |
| 16 and 17 Years | 245 (62.0%) | 16 (10.5%) |
| 18 to 24 Years | 329 (28.4%) | 322 (32.6%) |
| 25 to 34 Years | 88 (5.9%) | 206 (11.8%) |
| 35 to 44 Years | 191 (15.5%) | 387 (26.7%) |
| 45 to 54 Years | 234 (20.4%) | 438 (26.4%) |
| 55 to 64 Years | 194 (15.2%) | 178 (11.2%) |
| 65 to 74 Years | 97 (12.2%) | 351 (31.4%) |
| 75 Years and over | 47 (9.7%) | 98 (12.3%) |
| Total | 2,176 (20.3%) | 2,691 (22.3%) |
Income Above Poverty by Sex and Age in Hopewell city
According to the poverty statistics in Hopewell city, males aged 15 years and females aged 5 years are the age groups that are most secure financially, with 100.0% of males and 100.0% of females in these age groups living above the poverty line.
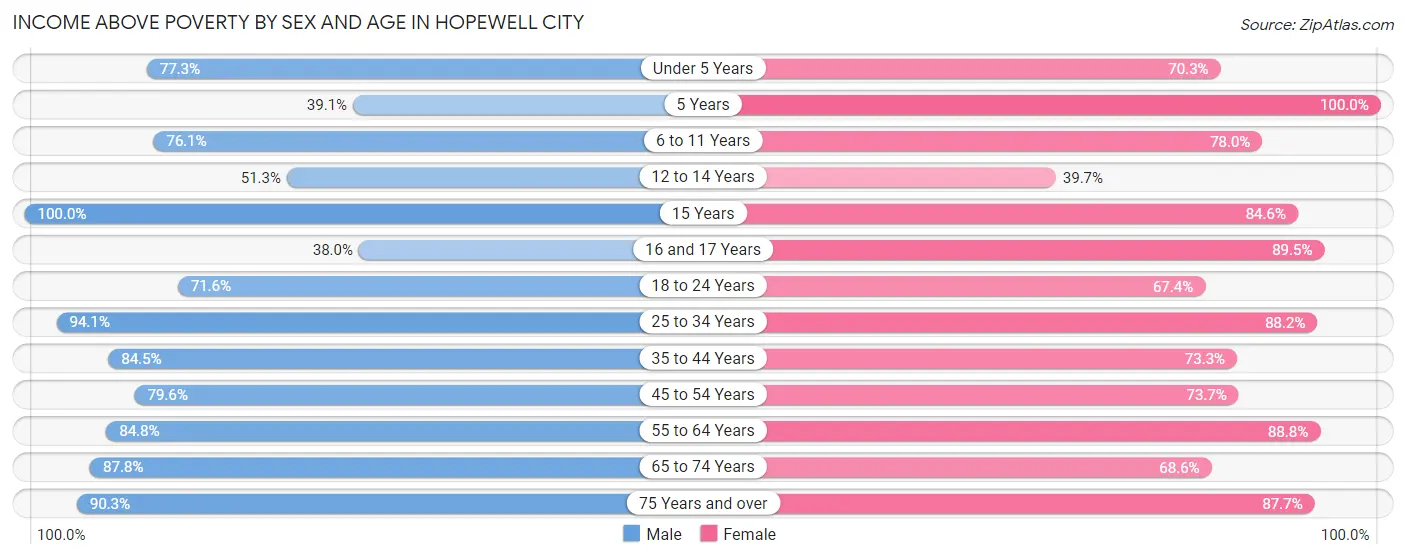
| Age Bracket | Male | Female |
| Under 5 Years | 695 (77.3%) | 527 (70.3%) |
| 5 Years | 25 (39.1%) | 105 (100.0%) |
| 6 to 11 Years | 1,099 (76.1%) | 881 (78.0%) |
| 12 to 14 Years | 172 (51.3%) | 116 (39.7%) |
| 15 Years | 17 (100.0%) | 264 (84.6%) |
| 16 and 17 Years | 150 (38.0%) | 137 (89.5%) |
| 18 to 24 Years | 828 (71.6%) | 666 (67.4%) |
| 25 to 34 Years | 1,394 (94.1%) | 1,545 (88.2%) |
| 35 to 44 Years | 1,038 (84.5%) | 1,064 (73.3%) |
| 45 to 54 Years | 913 (79.6%) | 1,224 (73.7%) |
| 55 to 64 Years | 1,085 (84.8%) | 1,406 (88.8%) |
| 65 to 74 Years | 700 (87.8%) | 767 (68.6%) |
| 75 Years and over | 438 (90.3%) | 701 (87.7%) |
| Total | 8,554 (79.7%) | 9,403 (77.7%) |
Income Below Poverty Among Married-Couple Families in Hopewell city
The poverty statistics for married-couple families in Hopewell city show that 8.7% or 275 of the total 3,174 families live below the poverty line. Families with 5 or more children have the highest poverty rate of 100.0%, comprising of 18 families. On the other hand, families with 3 or 4 children have the lowest poverty rate of 2.4%, which includes 10 families.
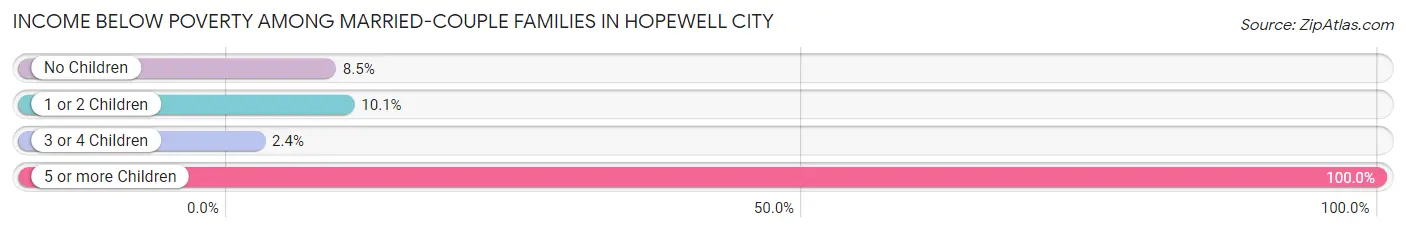
| Children | Above Poverty | Below Poverty |
| No Children | 1,696 (91.5%) | 158 (8.5%) |
| 1 or 2 Children | 790 (89.9%) | 89 (10.1%) |
| 3 or 4 Children | 413 (97.6%) | 10 (2.4%) |
| 5 or more Children | 0 (0.0%) | 18 (100.0%) |
| Total | 2,899 (91.3%) | 275 (8.7%) |
Income Below Poverty Among Single-Parent Households in Hopewell city
According to the poverty data in Hopewell city, 27.9% or 122 single-father households and 30.5% or 711 single-mother households are living below the poverty line. Among single-father households, those with 1 or 2 children have the highest poverty rate, with 103 households (32.9%) experiencing poverty. Likewise, among single-mother households, those with 5 or more children have the highest poverty rate, with 37 households (100.0%) falling below the poverty line.
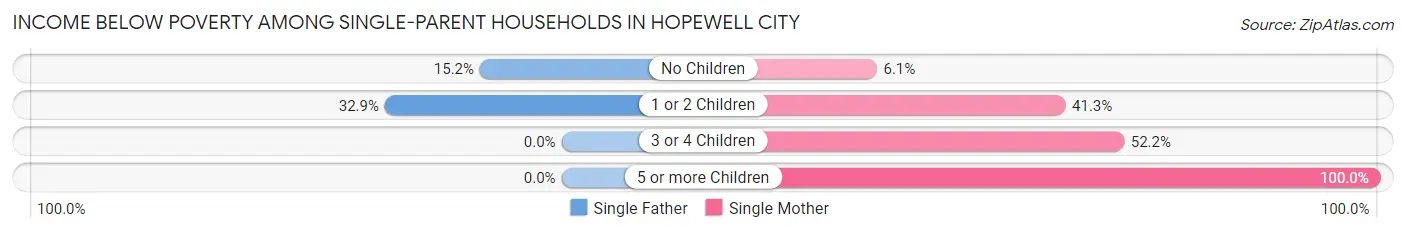
| Children | Single Father | Single Mother |
| No Children | 19 (15.2%) | 52 (6.1%) |
| 1 or 2 Children | 103 (32.9%) | 502 (41.2%) |
| 3 or 4 Children | 0 (0.0%) | 120 (52.2%) |
| 5 or more Children | 0 (0.0%) | 37 (100.0%) |
| Total | 122 (27.9%) | 711 (30.5%) |
Income Below Poverty Among Married-Couple vs Single-Parent Households in Hopewell city
The poverty data for Hopewell city shows that 275 of the married-couple family households (8.7%) and 833 of the single-parent households (30.0%) are living below the poverty level. Within the married-couple family households, those with 5 or more children have the highest poverty rate, with 18 households (100.0%) falling below the poverty line. Among the single-parent households, those with 5 or more children have the highest poverty rate, with 37 household (100.0%) living below poverty.
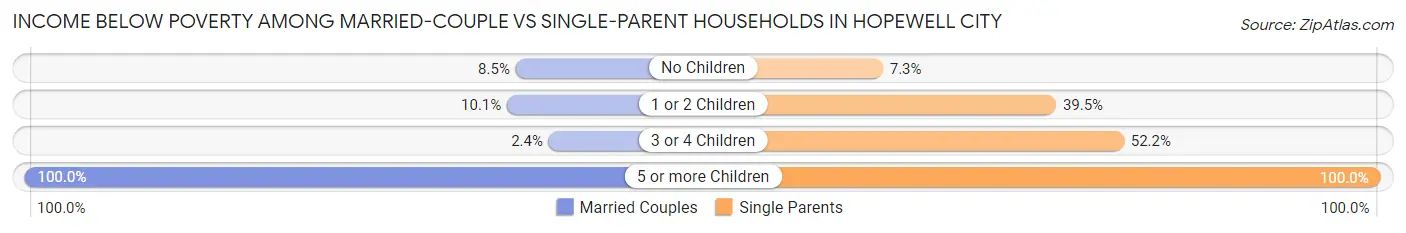
| Children | Married-Couple Families | Single-Parent Households |
| No Children | 158 (8.5%) | 71 (7.3%) |
| 1 or 2 Children | 89 (10.1%) | 605 (39.5%) |
| 3 or 4 Children | 10 (2.4%) | 120 (52.2%) |
| 5 or more Children | 18 (100.0%) | 37 (100.0%) |
| Total | 275 (8.7%) | 833 (30.0%) |
Race in Hopewell city
The most populous races in Hopewell city are White / Caucasian (10,612 | 46.1%), Black / African American (9,978 | 43.3%), and Hispanic or Latino (2,043 | 8.9%).
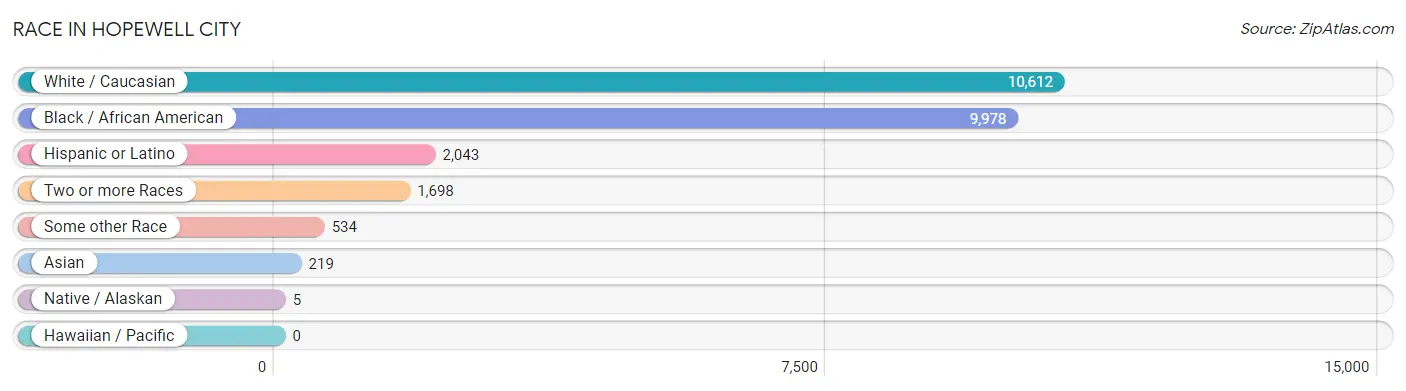
| Race | # Population | % Population |
| Asian | 219 | 0.9% |
| Black / African American | 9,978 | 43.3% |
| Hawaiian / Pacific | 0 | 0.0% |
| Hispanic or Latino | 2,043 | 8.9% |
| Native / Alaskan | 5 | 0.0% |
| White / Caucasian | 10,612 | 46.1% |
| Two or more Races | 1,698 | 7.4% |
| Some other Race | 534 | 2.3% |
| Total | 23,046 | 100.0% |
Ancestry in Hopewell city
The most populous ancestries reported in Hopewell city are English (2,036 | 8.8%), American (1,445 | 6.3%), German (1,116 | 4.8%), Mexican (813 | 3.5%), and Irish (708 | 3.1%), together accounting for 26.5% of all Hopewell city residents.
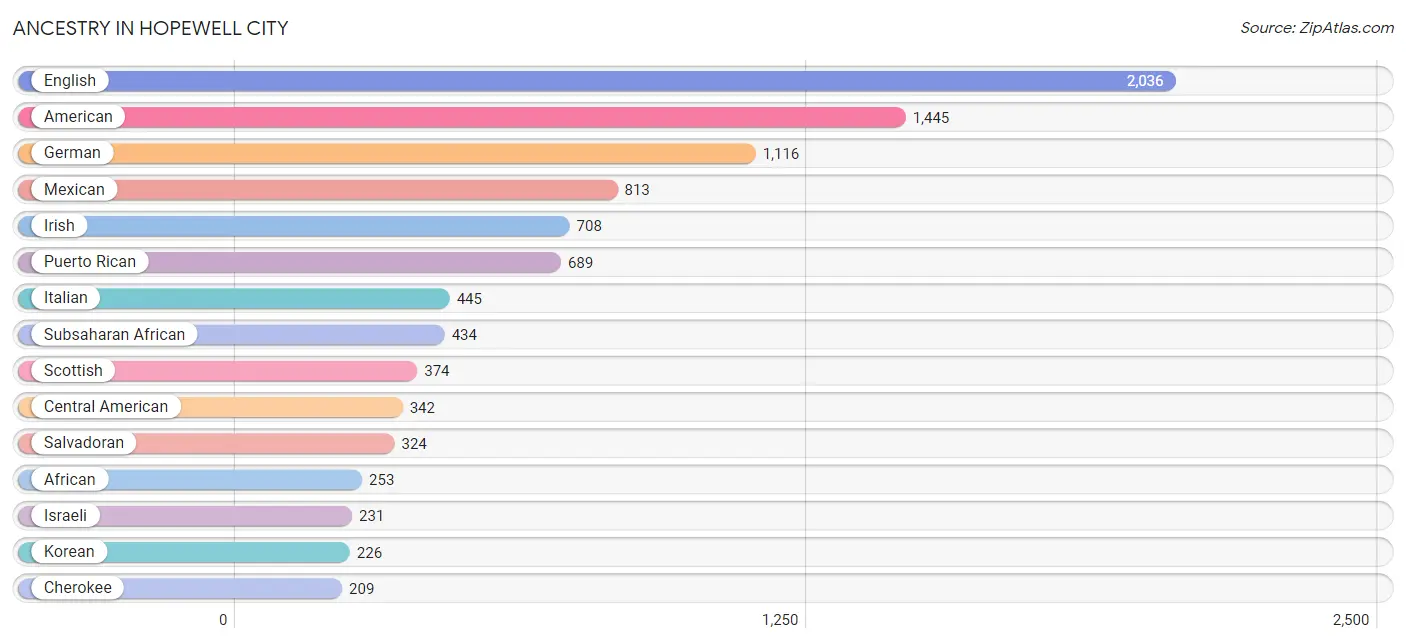
| Ancestry | # Population | % Population |
| African | 253 | 1.1% |
| Aleut | 2 | 0.0% |
| American | 1,445 | 6.3% |
| Arab | 143 | 0.6% |
| Austrian | 22 | 0.1% |
| Bahamian | 31 | 0.1% |
| Barbadian | 41 | 0.2% |
| Bhutanese | 67 | 0.3% |
| British | 58 | 0.3% |
| Burmese | 2 | 0.0% |
| Canadian | 17 | 0.1% |
| Central American | 342 | 1.5% |
| Central American Indian | 25 | 0.1% |
| Cherokee | 209 | 0.9% |
| Costa Rican | 16 | 0.1% |
| Croatian | 14 | 0.1% |
| Cuban | 146 | 0.6% |
| Czech | 16 | 0.1% |
| Danish | 7 | 0.0% |
| Dominican | 25 | 0.1% |
| Dutch | 91 | 0.4% |
| Eastern European | 21 | 0.1% |
| Ecuadorian | 5 | 0.0% |
| Egyptian | 8 | 0.0% |
| English | 2,036 | 8.8% |
| European | 106 | 0.5% |
| Finnish | 11 | 0.1% |
| French | 95 | 0.4% |
| French Canadian | 24 | 0.1% |
| German | 1,116 | 4.8% |
| Greek | 40 | 0.2% |
| Honduran | 1 | 0.0% |
| Hungarian | 36 | 0.2% |
| Iranian | 24 | 0.1% |
| Irish | 708 | 3.1% |
| Israeli | 231 | 1.0% |
| Italian | 445 | 1.9% |
| Jamaican | 48 | 0.2% |
| Korean | 226 | 1.0% |
| Lithuanian | 14 | 0.1% |
| Mexican | 813 | 3.5% |
| Moroccan | 135 | 0.6% |
| Nigerian | 30 | 0.1% |
| Norwegian | 20 | 0.1% |
| Pakistani | 12 | 0.1% |
| Panamanian | 1 | 0.0% |
| Polish | 76 | 0.3% |
| Puerto Rican | 689 | 3.0% |
| Salvadoran | 324 | 1.4% |
| Scandinavian | 57 | 0.3% |
| Scotch-Irish | 168 | 0.7% |
| Scottish | 374 | 1.6% |
| Sierra Leonean | 89 | 0.4% |
| Slovak | 106 | 0.5% |
| South American | 5 | 0.0% |
| Sri Lankan | 26 | 0.1% |
| Subsaharan African | 434 | 1.9% |
| Swedish | 34 | 0.2% |
| Swiss | 5 | 0.0% |
| Thai | 48 | 0.2% |
| Trinidadian and Tobagonian | 48 | 0.2% |
| U.S. Virgin Islander | 9 | 0.0% |
| Welsh | 112 | 0.5% |
| West Indian | 9 | 0.0% |
| Yugoslavian | 25 | 0.1% | View All 65 Rows |
Immigrants in Hopewell city
The most numerous immigrant groups reported in Hopewell city came from Latin America (254 | 1.1%), Europe (248 | 1.1%), Asia (182 | 0.8%), Central America (170 | 0.7%), and Mexico (160 | 0.7%), together accounting for 4.4% of all Hopewell city residents.
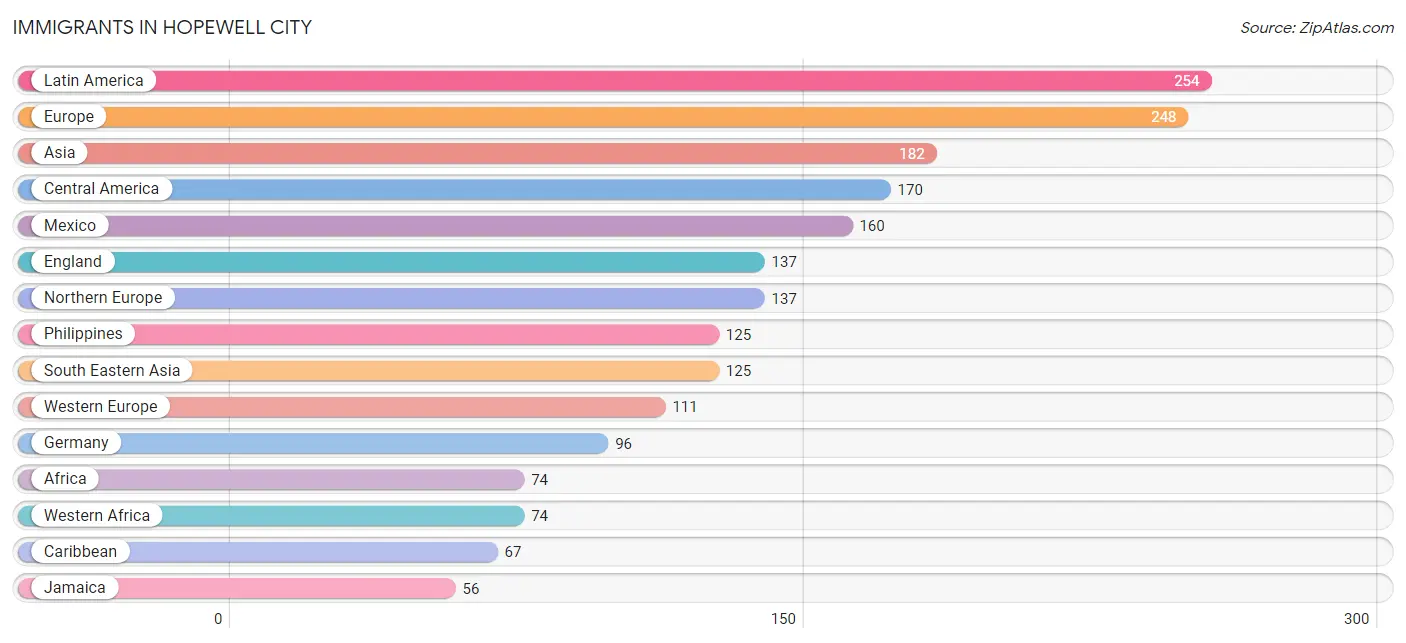
| Immigration Origin | # Population | % Population |
| Africa | 74 | 0.3% |
| Asia | 182 | 0.8% |
| Brazil | 12 | 0.1% |
| Caribbean | 67 | 0.3% |
| Central America | 170 | 0.7% |
| Dominica | 11 | 0.1% |
| Eastern Asia | 27 | 0.1% |
| Ecuador | 5 | 0.0% |
| England | 137 | 0.6% |
| Europe | 248 | 1.1% |
| France | 15 | 0.1% |
| Germany | 96 | 0.4% |
| Honduras | 1 | 0.0% |
| Iran | 24 | 0.1% |
| Jamaica | 56 | 0.2% |
| Japan | 25 | 0.1% |
| Korea | 2 | 0.0% |
| Latin America | 254 | 1.1% |
| Mexico | 160 | 0.7% |
| Nigeria | 11 | 0.1% |
| Northern Europe | 137 | 0.6% |
| Oceania | 9 | 0.0% |
| Panama | 9 | 0.0% |
| Philippines | 125 | 0.5% |
| Sierra Leone | 55 | 0.2% |
| South America | 17 | 0.1% |
| South Central Asia | 24 | 0.1% |
| South Eastern Asia | 125 | 0.5% |
| Western Africa | 74 | 0.3% |
| Western Asia | 6 | 0.0% |
| Western Europe | 111 | 0.5% | View All 31 Rows |
Sex and Age in Hopewell city
Sex and Age in Hopewell city
The most populous age groups in Hopewell city are 5 to 9 Years (1,085 | 10.0%) for men and 25 to 29 Years (962 | 7.9%) for women.
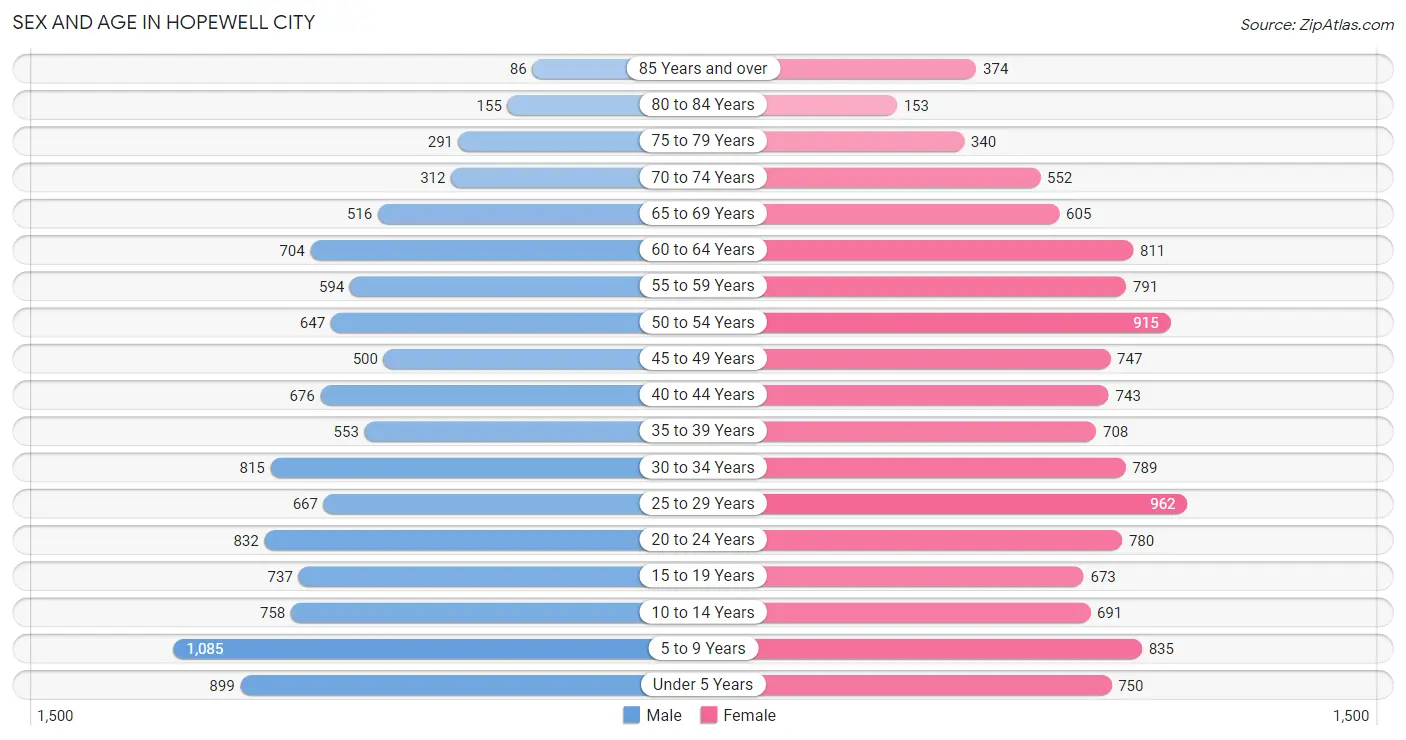
| Age Bracket | Male | Female |
| Under 5 Years | 899 (8.3%) | 750 (6.1%) |
| 5 to 9 Years | 1,085 (10.0%) | 835 (6.8%) |
| 10 to 14 Years | 758 (7.0%) | 691 (5.7%) |
| 15 to 19 Years | 737 (6.8%) | 673 (5.5%) |
| 20 to 24 Years | 832 (7.7%) | 780 (6.4%) |
| 25 to 29 Years | 667 (6.2%) | 962 (7.9%) |
| 30 to 34 Years | 815 (7.5%) | 789 (6.5%) |
| 35 to 39 Years | 553 (5.1%) | 708 (5.8%) |
| 40 to 44 Years | 676 (6.2%) | 743 (6.1%) |
| 45 to 49 Years | 500 (4.6%) | 747 (6.1%) |
| 50 to 54 Years | 647 (6.0%) | 915 (7.5%) |
| 55 to 59 Years | 594 (5.5%) | 791 (6.5%) |
| 60 to 64 Years | 704 (6.5%) | 811 (6.6%) |
| 65 to 69 Years | 516 (4.8%) | 605 (5.0%) |
| 70 to 74 Years | 312 (2.9%) | 552 (4.5%) |
| 75 to 79 Years | 291 (2.7%) | 340 (2.8%) |
| 80 to 84 Years | 155 (1.4%) | 153 (1.3%) |
| 85 Years and over | 86 (0.8%) | 374 (3.1%) |
| Total | 10,827 (100.0%) | 12,219 (100.0%) |
Families and Households in Hopewell city
Median Family Size in Hopewell city
The median family size in Hopewell city is 3.04 persons per family, with married-couple families (3,174 | 53.4%) accounting for the largest median family size of 3.25 persons per family. On the other hand, single male/father families (438 | 7.4%) represent the smallest median family size with 2.67 persons per family.
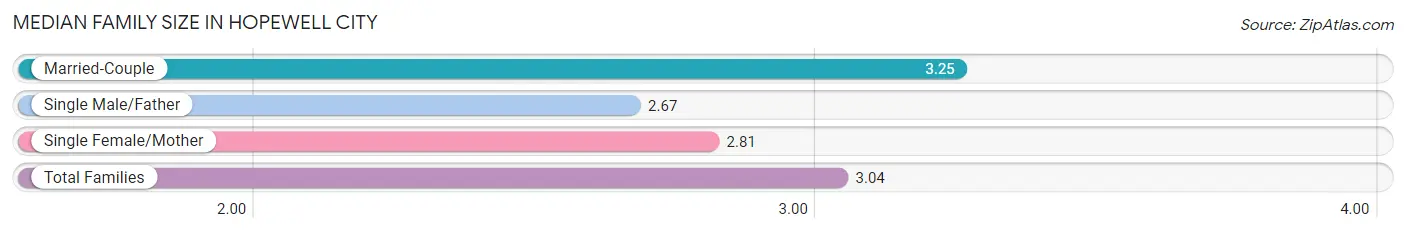
| Family Type | # Families | Family Size |
| Married-Couple | 3,174 (53.4%) | 3.25 |
| Single Male/Father | 438 (7.4%) | 2.67 |
| Single Female/Mother | 2,334 (39.3%) | 2.81 |
| Total Families | 5,946 (100.0%) | 3.04 |
Median Household Size in Hopewell city
The median household size in Hopewell city is 2.44 persons per household, with married-couple households (3,174 | 34.0%) accounting for the largest median household size of 3.28 persons per household. non-family households (3,402 | 36.4%) represent the smallest median household size with 1.16 persons per household.
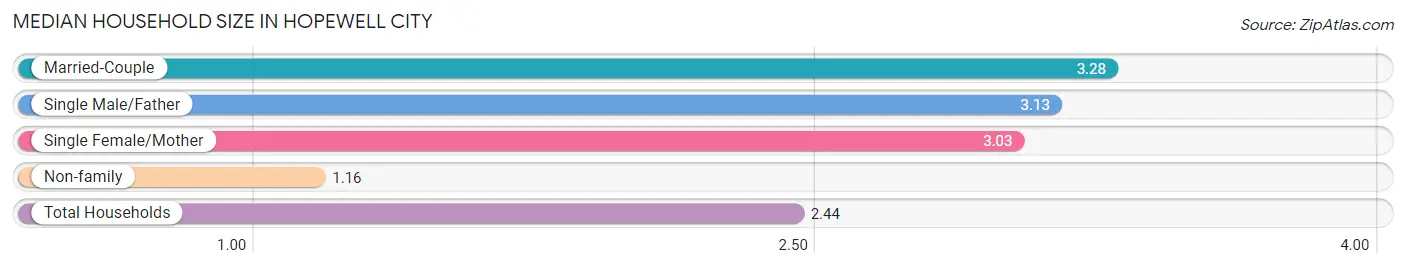
| Household Type | # Households | Household Size |
| Married-Couple | 3,174 (34.0%) | 3.28 |
| Single Male/Father | 438 (4.7%) | 3.13 |
| Single Female/Mother | 2,334 (25.0%) | 3.03 |
| Non-family | 3,402 (36.4%) | 1.16 |
| Total Households | 9,348 (100.0%) | 2.44 |
Household Size by Marriage Status in Hopewell city
Out of a total of 9,348 households in Hopewell city, 5,946 (63.6%) are family households, while 3,402 (36.4%) are nonfamily households. The most numerous type of family households are 2-person households, comprising 2,218, and the most common type of nonfamily households are 1-person households, comprising 2,855.
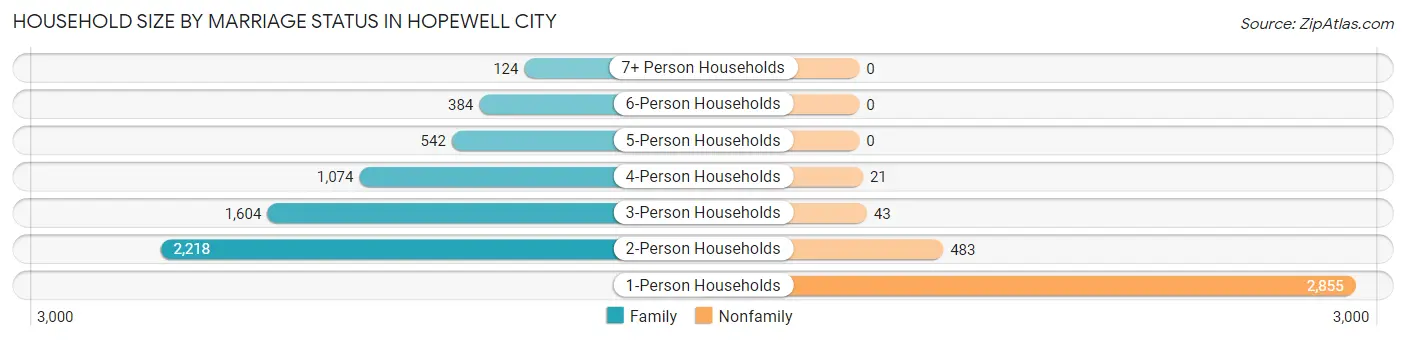
| Household Size | Family Households | Nonfamily Households |
| 1-Person Households | - | 2,855 (30.5%) |
| 2-Person Households | 2,218 (23.7%) | 483 (5.2%) |
| 3-Person Households | 1,604 (17.2%) | 43 (0.5%) |
| 4-Person Households | 1,074 (11.5%) | 21 (0.2%) |
| 5-Person Households | 542 (5.8%) | 0 (0.0%) |
| 6-Person Households | 384 (4.1%) | 0 (0.0%) |
| 7+ Person Households | 124 (1.3%) | 0 (0.0%) |
| Total | 5,946 (63.6%) | 3,402 (36.4%) |
Female Fertility in Hopewell city
Fertility by Age in Hopewell city
Average fertility rate in Hopewell city is 59.0 births per 1,000 women. Women in the age bracket of 20 to 34 years have the highest fertility rate with 96.0 births per 1,000 women. Women in the age bracket of 20 to 34 years acount for 73.1% of all women with births.
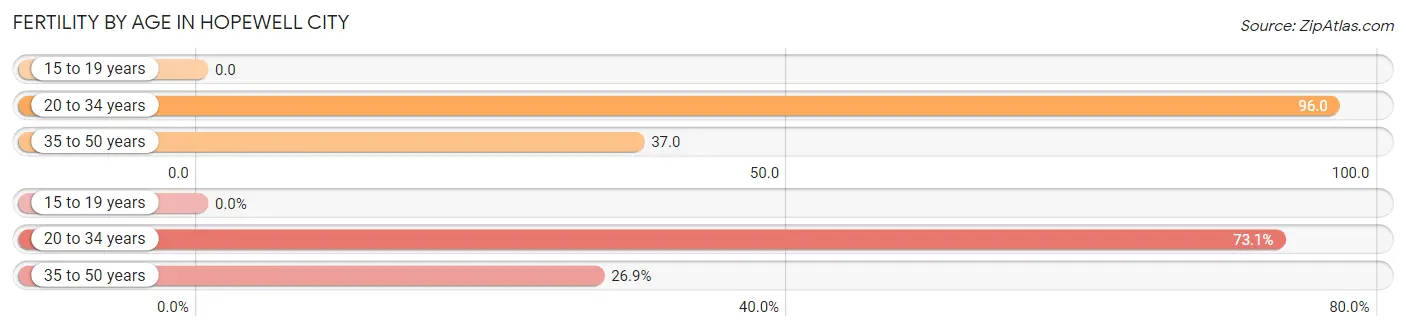
| Age Bracket | Women with Births | Births / 1,000 Women |
| 15 to 19 years | 0 (0.0%) | 0.0 |
| 20 to 34 years | 242 (73.1%) | 96.0 |
| 35 to 50 years | 89 (26.9%) | 37.0 |
| Total | 331 (100.0%) | 59.0 |
Fertility by Age by Marriage Status in Hopewell city
27.5% of women with births (331) in Hopewell city are married. The highest percentage of unmarried women with births falls into 20 to 34 years age bracket with 78.9% of them unmarried at the time of birth, while the lowest percentage of unmarried women with births belong to 35 to 50 years age bracket with 55.1% of them unmarried.
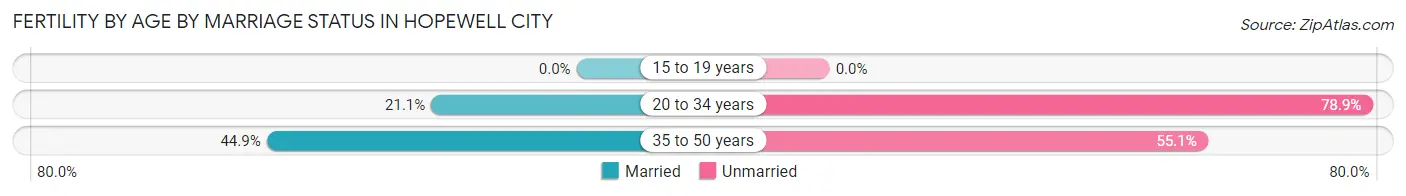
| Age Bracket | Married | Unmarried |
| 15 to 19 years | 0 (0.0%) | 0 (0.0%) |
| 20 to 34 years | 51 (21.1%) | 191 (78.9%) |
| 35 to 50 years | 40 (44.9%) | 49 (55.1%) |
| Total | 91 (27.5%) | 240 (72.5%) |
Fertility by Education in Hopewell city
| Educational Attainment | Women with Births | Births / 1,000 Women |
| Less than High School | 50 (15.1%) | 56.0 |
| High School Diploma | 89 (26.9%) | 42.0 |
| College or Associate's Degree | 152 (45.9%) | 75.0 |
| Bachelor's Degree | 40 (12.1%) | 100.0 |
| Graduate Degree | 0 (0.0%) | 0.0 |
| Total | 331 (100.0%) | 59.0 |
Fertility by Education by Marriage Status in Hopewell city
72.5% of women with births in Hopewell city are unmarried. Women with the educational attainment of bachelor's degree are most likely to be married with 100.0% of them married at childbirth, while women with the educational attainment of less than high school are least likely to be married with 100.0% of them unmarried at childbirth.
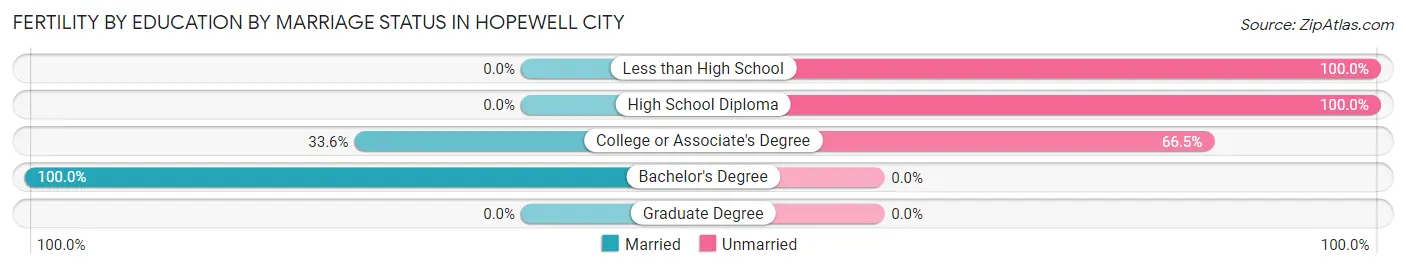
| Educational Attainment | Married | Unmarried |
| Less than High School | 0 (0.0%) | 50 (100.0%) |
| High School Diploma | 0 (0.0%) | 89 (100.0%) |
| College or Associate's Degree | 51 (33.6%) | 101 (66.4%) |
| Bachelor's Degree | 40 (100.0%) | 0 (0.0%) |
| Graduate Degree | 0 (0.0%) | 0 (0.0%) |
| Total | 91 (27.5%) | 240 (72.5%) |
Employment Characteristics in Hopewell city
Employment by Class of Employer in Hopewell city
Among the 9,431 employed individuals in Hopewell city, private company employees (6,801 | 72.1%), federal government employees (698 | 7.4%), and local government employees (662 | 7.0%) make up the most common classes of employment.
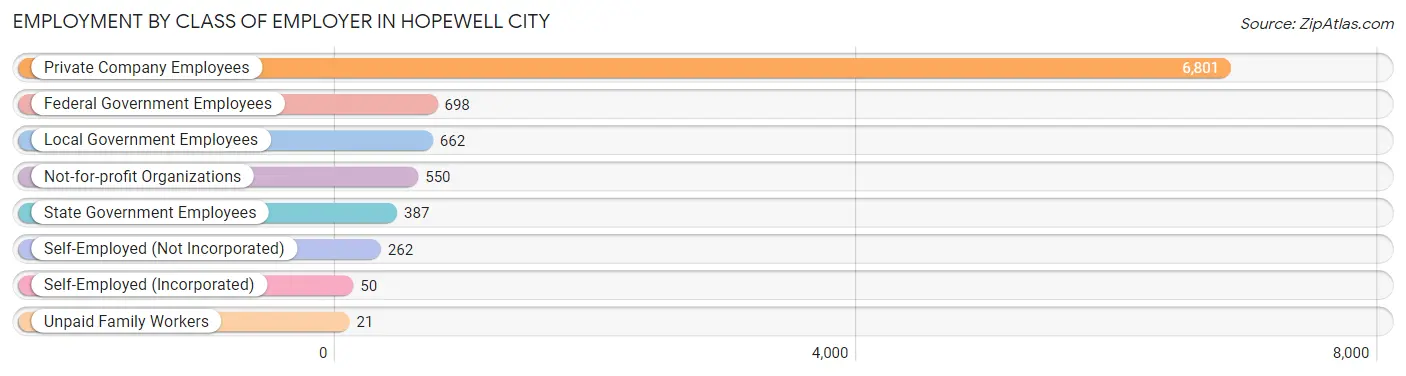
| Employer Class | # Employees | % Employees |
| Private Company Employees | 6,801 | 72.1% |
| Self-Employed (Incorporated) | 50 | 0.5% |
| Self-Employed (Not Incorporated) | 262 | 2.8% |
| Not-for-profit Organizations | 550 | 5.8% |
| Local Government Employees | 662 | 7.0% |
| State Government Employees | 387 | 4.1% |
| Federal Government Employees | 698 | 7.4% |
| Unpaid Family Workers | 21 | 0.2% |
| Total | 9,431 | 100.0% |
Employment Status by Age in Hopewell city
According to the labor force statistics for Hopewell city, out of the total population over 16 years of age (17,699), 60.2% or 10,655 individuals are in the labor force, with 8.8% or 938 of them unemployed. The age group with the highest labor force participation rate is 20 to 24 years, with 81.3% or 1,311 individuals in the labor force. Within the labor force, the 16 to 19 years age range has the highest percentage of unemployed individuals, with 27.7% or 87 of them being unemployed.
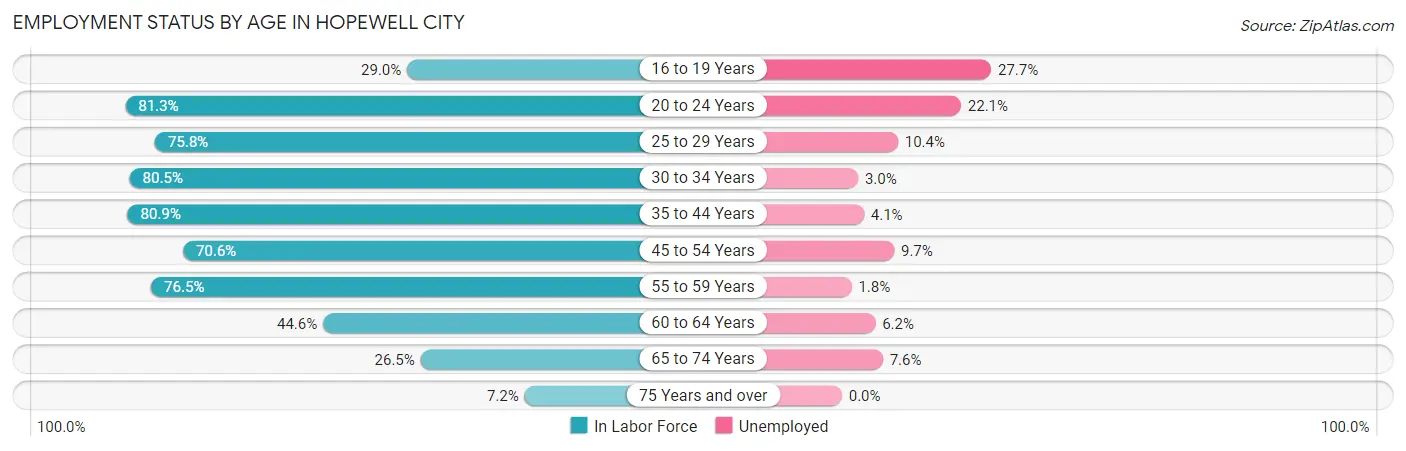
| Age Bracket | In Labor Force | Unemployed |
| 16 to 19 Years | 313 (29.0%) | 87 (27.7%) |
| 20 to 24 Years | 1,311 (81.3%) | 290 (22.1%) |
| 25 to 29 Years | 1,235 (75.8%) | 128 (10.4%) |
| 30 to 34 Years | 1,291 (80.5%) | 39 (3.0%) |
| 35 to 44 Years | 2,168 (80.9%) | 89 (4.1%) |
| 45 to 54 Years | 1,983 (70.6%) | 192 (9.7%) |
| 55 to 59 Years | 1,060 (76.5%) | 19 (1.8%) |
| 60 to 64 Years | 676 (44.6%) | 42 (6.2%) |
| 65 to 74 Years | 526 (26.5%) | 40 (7.6%) |
| 75 Years and over | 101 (7.2%) | 0 (0.0%) |
| Total | 10,655 (60.2%) | 938 (8.8%) |
Employment Status by Educational Attainment in Hopewell city
According to labor force statistics for Hopewell city, 72.4% of individuals (8,414) out of the total population between 25 and 64 years of age (11,622) are in the labor force, with 6.1% or 513 of them being unemployed. The group with the highest labor force participation rate are those with the educational attainment of college / associate degree, with 79.6% or 3,491 individuals in the labor force. Within the labor force, individuals with high school diploma education have the highest percentage of unemployment, with 9.6% or 304 of them being unemployed.
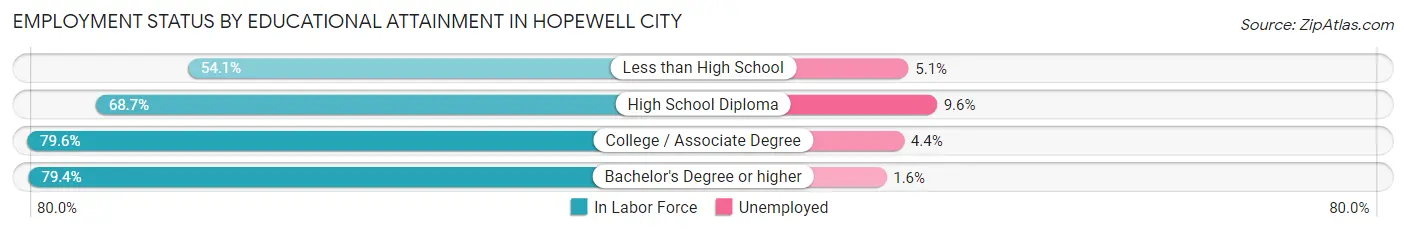
| Educational Attainment | In Labor Force | Unemployed |
| Less than High School | 707 (54.1%) | 67 (5.1%) |
| High School Diploma | 3,166 (68.7%) | 442 (9.6%) |
| College / Associate Degree | 3,491 (79.6%) | 193 (4.4%) |
| Bachelor's Degree or higher | 1,048 (79.4%) | 21 (1.6%) |
| Total | 8,414 (72.4%) | 709 (6.1%) |
Employment Occupations by Sex in Hopewell city
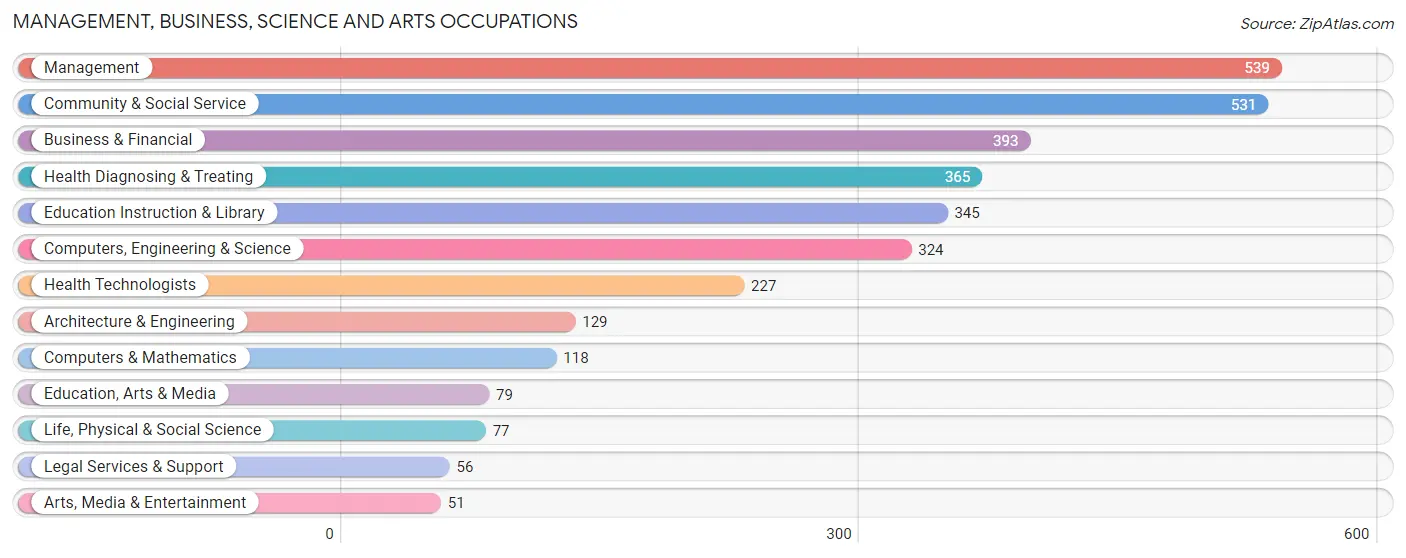
Management, Business, Science and Arts Occupations
The most common Management, Business, Science and Arts occupations in Hopewell city are Management (539 | 5.6%), Community & Social Service (531 | 5.6%), Business & Financial (393 | 4.1%), Health Diagnosing & Treating (365 | 3.8%), and Education Instruction & Library (345 | 3.6%).
Management, Business, Science and Arts Occupations by Sex
Within the Management, Business, Science and Arts occupations in Hopewell city, the most male-oriented occupations are Arts, Media & Entertainment (100.0%), Architecture & Engineering (89.1%), and Computers, Engineering & Science (64.2%), while the most female-oriented occupations are Health Technologists (91.6%), Health Diagnosing & Treating (85.2%), and Legal Services & Support (66.1%).
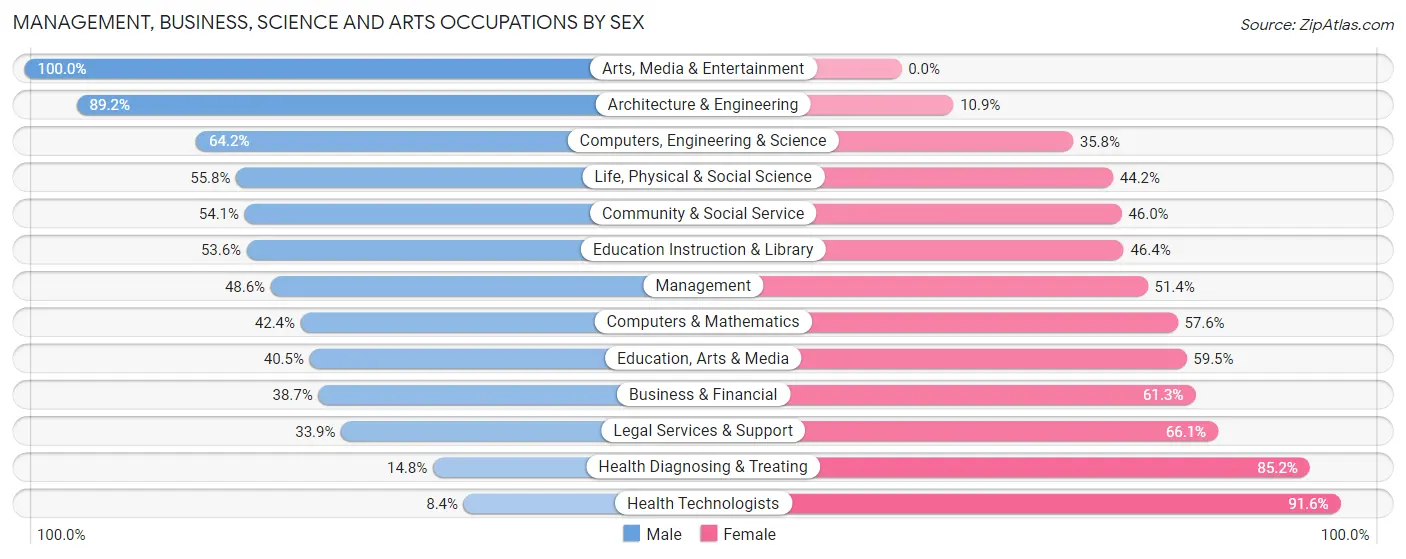
| Occupation | Male | Female |
| Management | 262 (48.6%) | 277 (51.4%) |
| Business & Financial | 152 (38.7%) | 241 (61.3%) |
| Computers, Engineering & Science | 208 (64.2%) | 116 (35.8%) |
| Computers & Mathematics | 50 (42.4%) | 68 (57.6%) |
| Architecture & Engineering | 115 (89.1%) | 14 (10.8%) |
| Life, Physical & Social Science | 43 (55.8%) | 34 (44.2%) |
| Community & Social Service | 287 (54.0%) | 244 (46.0%) |
| Education, Arts & Media | 32 (40.5%) | 47 (59.5%) |
| Legal Services & Support | 19 (33.9%) | 37 (66.1%) |
| Education Instruction & Library | 185 (53.6%) | 160 (46.4%) |
| Arts, Media & Entertainment | 51 (100.0%) | 0 (0.0%) |
| Health Diagnosing & Treating | 54 (14.8%) | 311 (85.2%) |
| Health Technologists | 19 (8.4%) | 208 (91.6%) |
| Total (Category) | 963 (44.8%) | 1,189 (55.2%) |
| Total (Overall) | 4,761 (49.8%) | 4,807 (50.2%) |
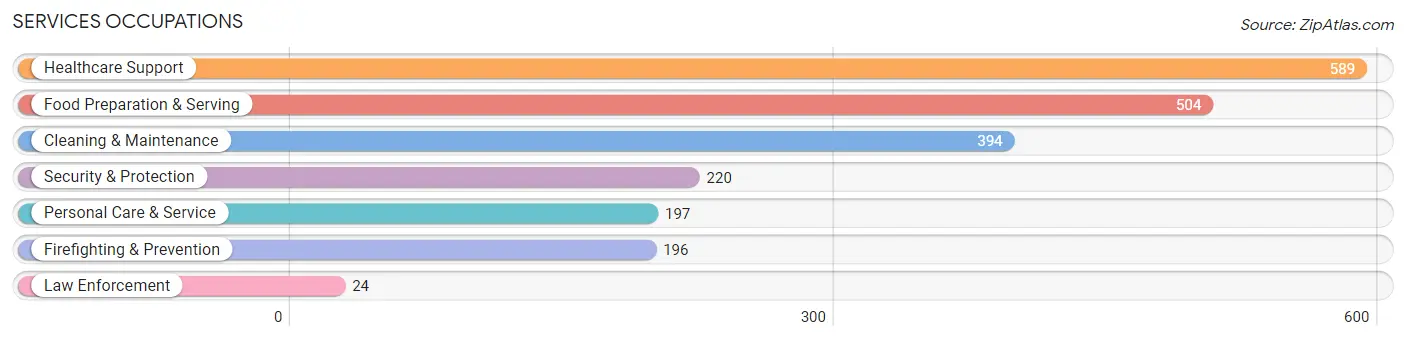
Services Occupations
The most common Services occupations in Hopewell city are Healthcare Support (589 | 6.2%), Food Preparation & Serving (504 | 5.3%), Cleaning & Maintenance (394 | 4.1%), Security & Protection (220 | 2.3%), and Personal Care & Service (197 | 2.1%).
Services Occupations by Sex
Within the Services occupations in Hopewell city, the most male-oriented occupations are Law Enforcement (100.0%), Cleaning & Maintenance (85.8%), and Security & Protection (58.6%), while the most female-oriented occupations are Healthcare Support (95.8%), Personal Care & Service (76.1%), and Food Preparation & Serving (53.6%).
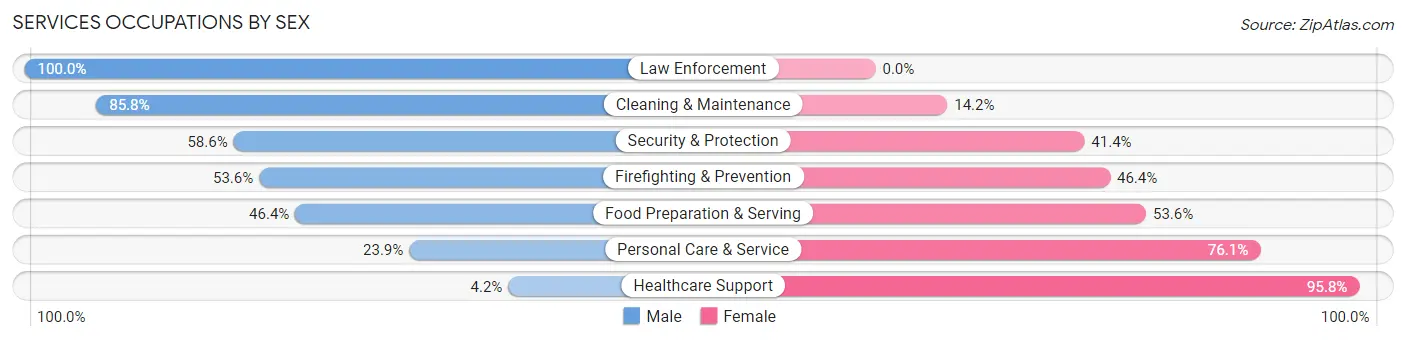
| Occupation | Male | Female |
| Healthcare Support | 25 (4.2%) | 564 (95.8%) |
| Security & Protection | 129 (58.6%) | 91 (41.4%) |
| Firefighting & Prevention | 105 (53.6%) | 91 (46.4%) |
| Law Enforcement | 24 (100.0%) | 0 (0.0%) |
| Food Preparation & Serving | 234 (46.4%) | 270 (53.6%) |
| Cleaning & Maintenance | 338 (85.8%) | 56 (14.2%) |
| Personal Care & Service | 47 (23.9%) | 150 (76.1%) |
| Total (Category) | 773 (40.6%) | 1,131 (59.4%) |
| Total (Overall) | 4,761 (49.8%) | 4,807 (50.2%) |
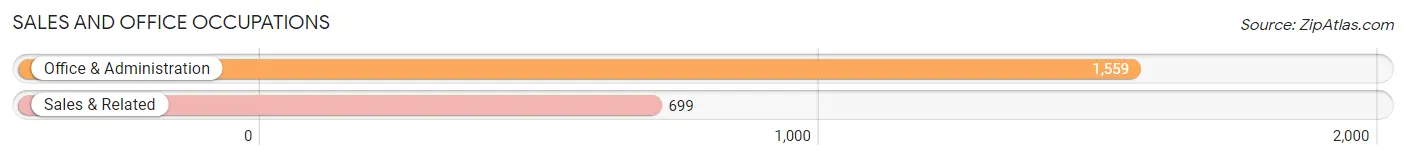
Sales and Office Occupations
The most common Sales and Office occupations in Hopewell city are Office & Administration (1,559 | 16.3%), and Sales & Related (699 | 7.3%).
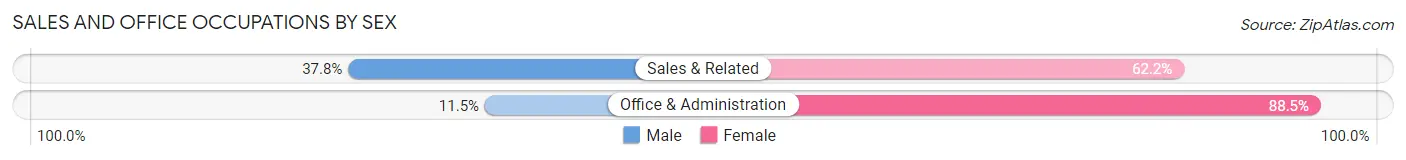
Sales and Office Occupations by Sex
| Occupation | Male | Female |
| Sales & Related | 264 (37.8%) | 435 (62.2%) |
| Office & Administration | 179 (11.5%) | 1,380 (88.5%) |
| Total (Category) | 443 (19.6%) | 1,815 (80.4%) |
| Total (Overall) | 4,761 (49.8%) | 4,807 (50.2%) |
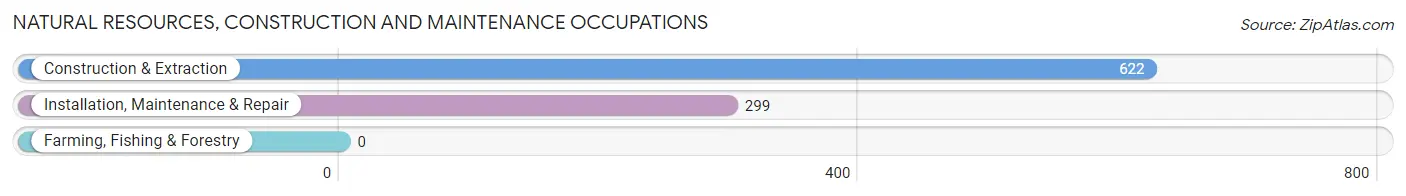
Natural Resources, Construction and Maintenance Occupations
The most common Natural Resources, Construction and Maintenance occupations in Hopewell city are Construction & Extraction (622 | 6.5%), and Installation, Maintenance & Repair (299 | 3.1%).
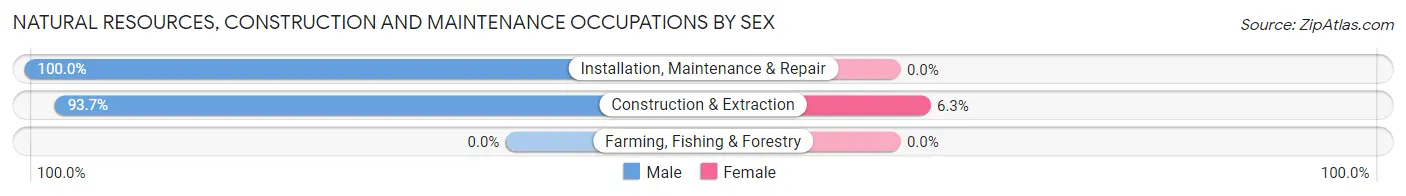
Natural Resources, Construction and Maintenance Occupations by Sex
| Occupation | Male | Female |
| Farming, Fishing & Forestry | 0 (0.0%) | 0 (0.0%) |
| Construction & Extraction | 583 (93.7%) | 39 (6.3%) |
| Installation, Maintenance & Repair | 299 (100.0%) | 0 (0.0%) |
| Total (Category) | 882 (95.8%) | 39 (4.2%) |
| Total (Overall) | 4,761 (49.8%) | 4,807 (50.2%) |
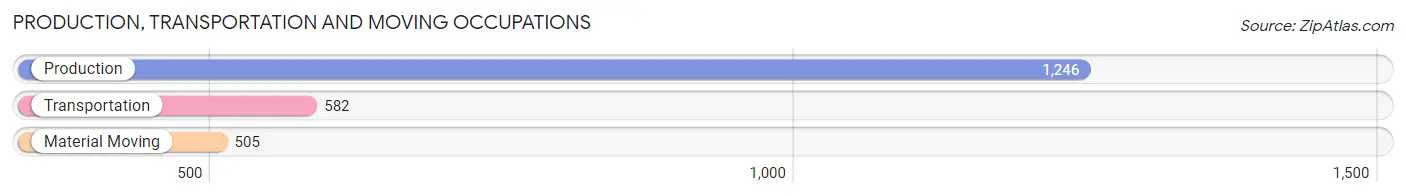
Production, Transportation and Moving Occupations
The most common Production, Transportation and Moving occupations in Hopewell city are Production (1,246 | 13.0%), Transportation (582 | 6.1%), and Material Moving (505 | 5.3%).
Production, Transportation and Moving Occupations by Sex
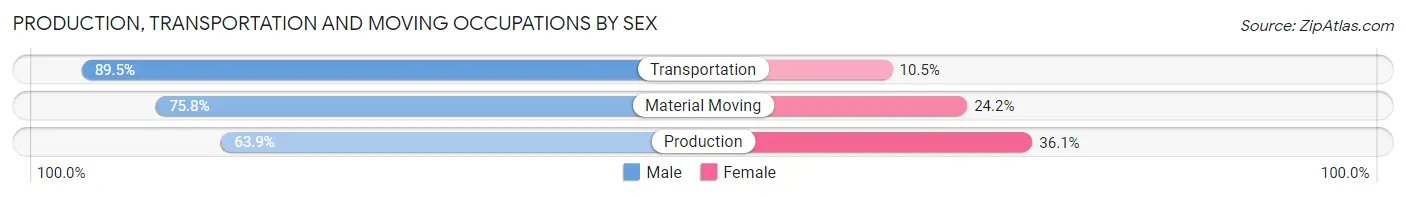
| Occupation | Male | Female |
| Production | 796 (63.9%) | 450 (36.1%) |
| Transportation | 521 (89.5%) | 61 (10.5%) |
| Material Moving | 383 (75.8%) | 122 (24.2%) |
| Total (Category) | 1,700 (72.9%) | 633 (27.1%) |
| Total (Overall) | 4,761 (49.8%) | 4,807 (50.2%) |
Employment Industries by Sex in Hopewell city
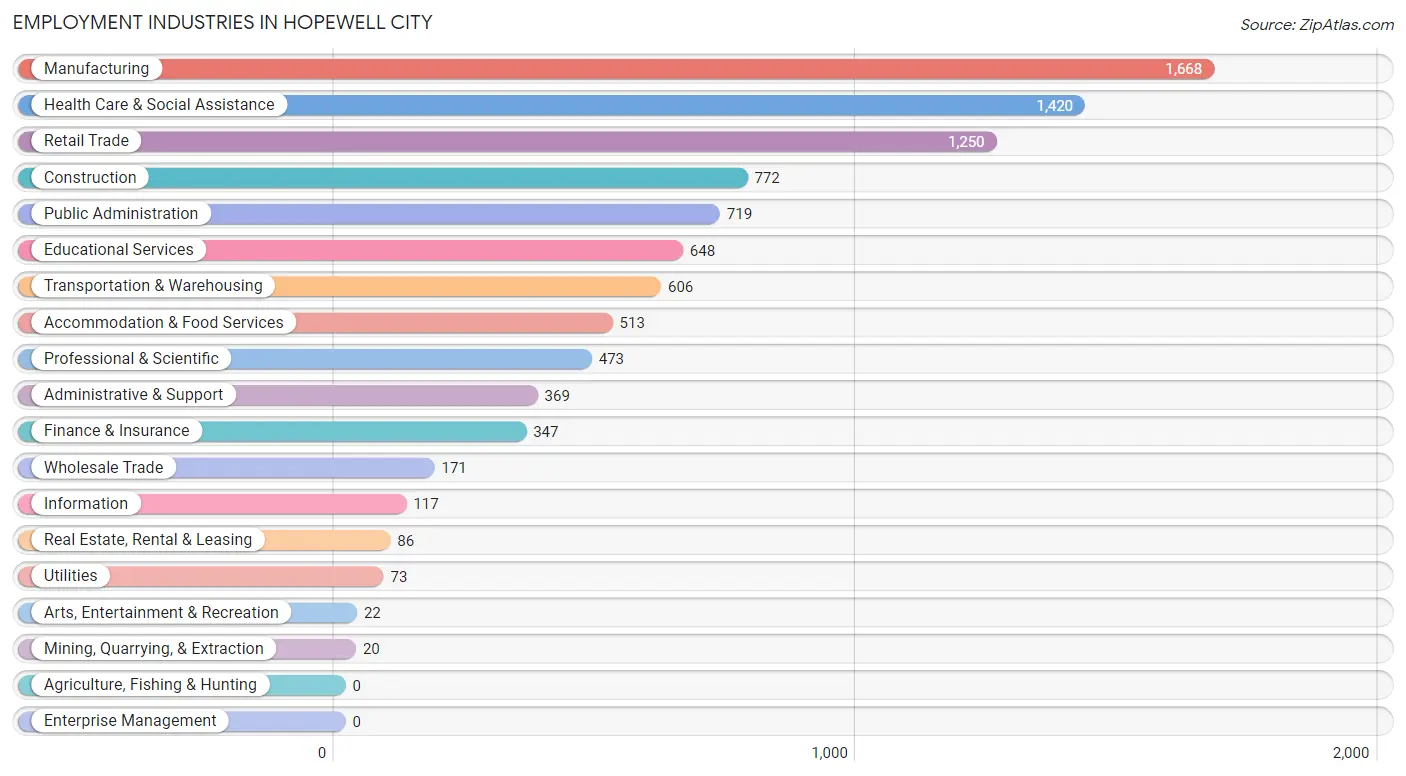
Employment Industries in Hopewell city
The major employment industries in Hopewell city include Manufacturing (1,668 | 17.4%), Health Care & Social Assistance (1,420 | 14.8%), Retail Trade (1,250 | 13.1%), Construction (772 | 8.1%), and Public Administration (719 | 7.5%).
Employment Industries by Sex in Hopewell city
The Hopewell city industries that see more men than women are Mining, Quarrying, & Extraction (100.0%), Utilities (91.8%), and Construction (90.3%), whereas the industries that tend to have a higher number of women are Real Estate, Rental & Leasing (94.2%), Health Care & Social Assistance (93.5%), and Finance & Insurance (85.3%).
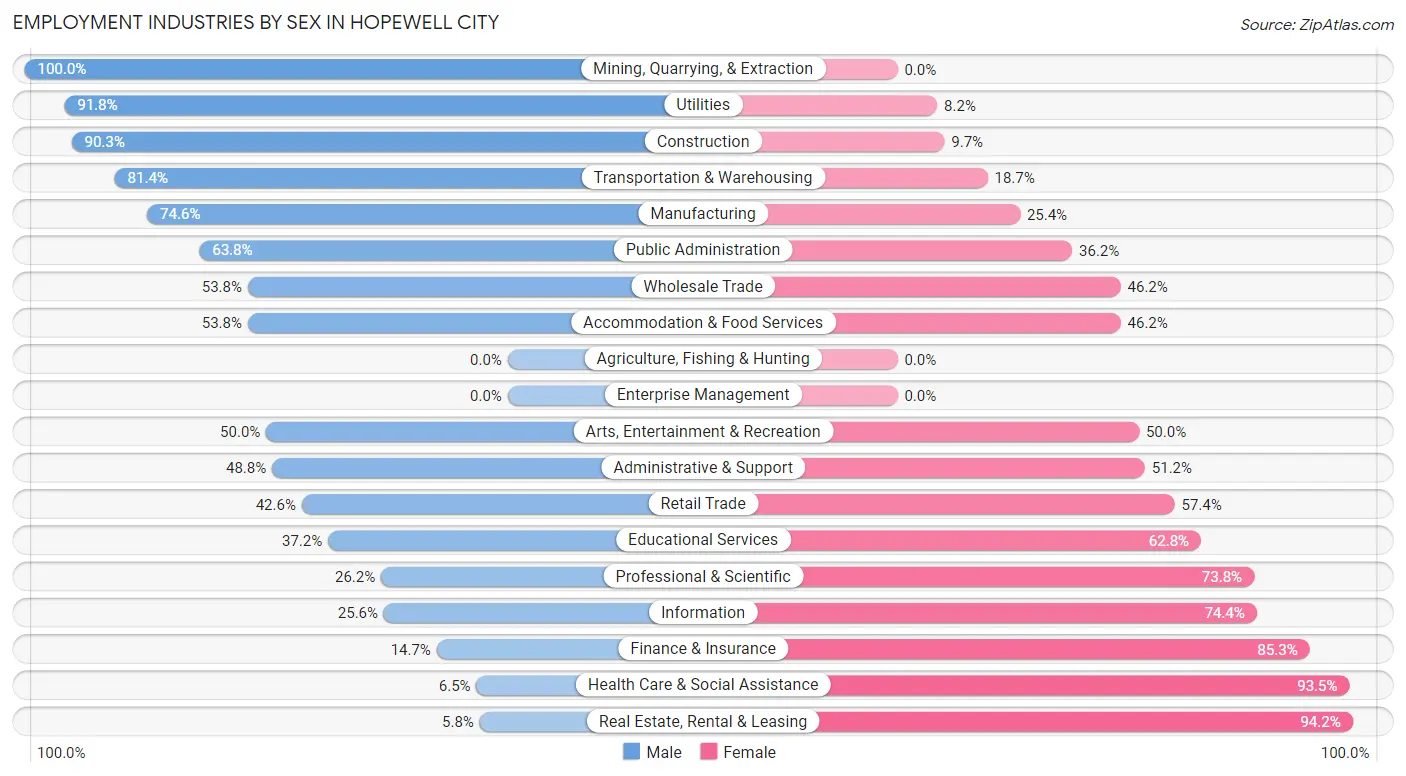
| Industry | Male | Female |
| Agriculture, Fishing & Hunting | 0 (0.0%) | 0 (0.0%) |
| Mining, Quarrying, & Extraction | 20 (100.0%) | 0 (0.0%) |
| Construction | 697 (90.3%) | 75 (9.7%) |
| Manufacturing | 1,245 (74.6%) | 423 (25.4%) |
| Wholesale Trade | 92 (53.8%) | 79 (46.2%) |
| Retail Trade | 533 (42.6%) | 717 (57.4%) |
| Transportation & Warehousing | 493 (81.4%) | 113 (18.6%) |
| Utilities | 67 (91.8%) | 6 (8.2%) |
| Information | 30 (25.6%) | 87 (74.4%) |
| Finance & Insurance | 51 (14.7%) | 296 (85.3%) |
| Real Estate, Rental & Leasing | 5 (5.8%) | 81 (94.2%) |
| Professional & Scientific | 124 (26.2%) | 349 (73.8%) |
| Enterprise Management | 0 (0.0%) | 0 (0.0%) |
| Administrative & Support | 180 (48.8%) | 189 (51.2%) |
| Educational Services | 241 (37.2%) | 407 (62.8%) |
| Health Care & Social Assistance | 92 (6.5%) | 1,328 (93.5%) |
| Arts, Entertainment & Recreation | 11 (50.0%) | 11 (50.0%) |
| Accommodation & Food Services | 276 (53.8%) | 237 (46.2%) |
| Public Administration | 459 (63.8%) | 260 (36.2%) |
| Total | 4,761 (49.8%) | 4,807 (50.2%) |
Education in Hopewell city
School Enrollment in Hopewell city
The most common levels of schooling among the 5,822 students in Hopewell city are elementary school (1,846 | 31.7%), high school (1,252 | 21.5%), and middle school (1,181 | 20.3%).
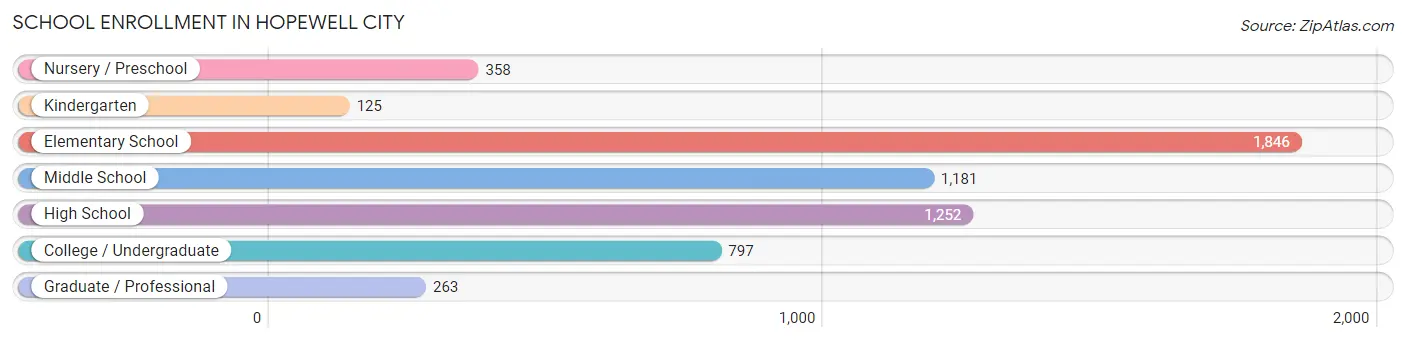
| School Level | # Students | % Students |
| Nursery / Preschool | 358 | 6.1% |
| Kindergarten | 125 | 2.1% |
| Elementary School | 1,846 | 31.7% |
| Middle School | 1,181 | 20.3% |
| High School | 1,252 | 21.5% |
| College / Undergraduate | 797 | 13.7% |
| Graduate / Professional | 263 | 4.5% |
| Total | 5,822 | 100.0% |
School Enrollment by Age by Funding Source in Hopewell city
Out of a total of 5,822 students who are enrolled in schools in Hopewell city, 512 (8.8%) attend a private institution, while the remaining 5,310 (91.2%) are enrolled in public schools. The age group of 20 to 24 year olds has the highest likelihood of being enrolled in private schools, with 184 (47.1% in the age bracket) enrolled. Conversely, the age group of 18 to 19 year olds has the lowest likelihood of being enrolled in a private school, with 287 (100.0% in the age bracket) attending a public institution.
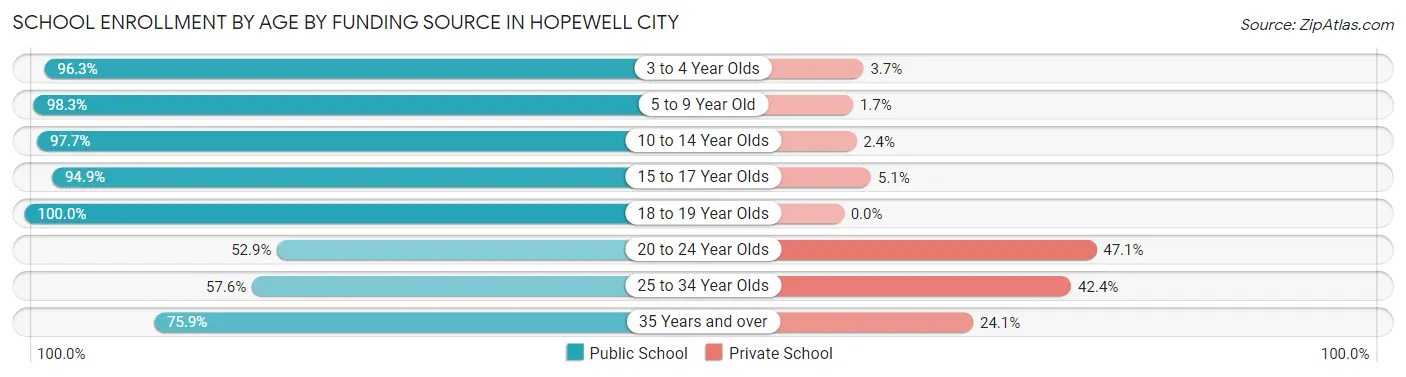
| Age Bracket | Public School | Private School |
| 3 to 4 Year Olds | 287 (96.3%) | 11 (3.7%) |
| 5 to 9 Year Old | 1,822 (98.3%) | 32 (1.7%) |
| 10 to 14 Year Olds | 1,415 (97.7%) | 34 (2.4%) |
| 15 to 17 Year Olds | 819 (94.9%) | 44 (5.1%) |
| 18 to 19 Year Olds | 287 (100.0%) | 0 (0.0%) |
| 20 to 24 Year Olds | 207 (52.9%) | 184 (47.1%) |
| 25 to 34 Year Olds | 136 (57.6%) | 100 (42.4%) |
| 35 Years and over | 337 (75.9%) | 107 (24.1%) |
| Total | 5,310 (91.2%) | 512 (8.8%) |
Educational Attainment by Field of Study in Hopewell city
Business (449 | 23.1%), arts & humanities (243 | 12.5%), liberal arts & history (205 | 10.5%), social sciences (203 | 10.4%), and education (151 | 7.8%) are the most common fields of study among 1,945 individuals in Hopewell city who have obtained a bachelor's degree or higher.
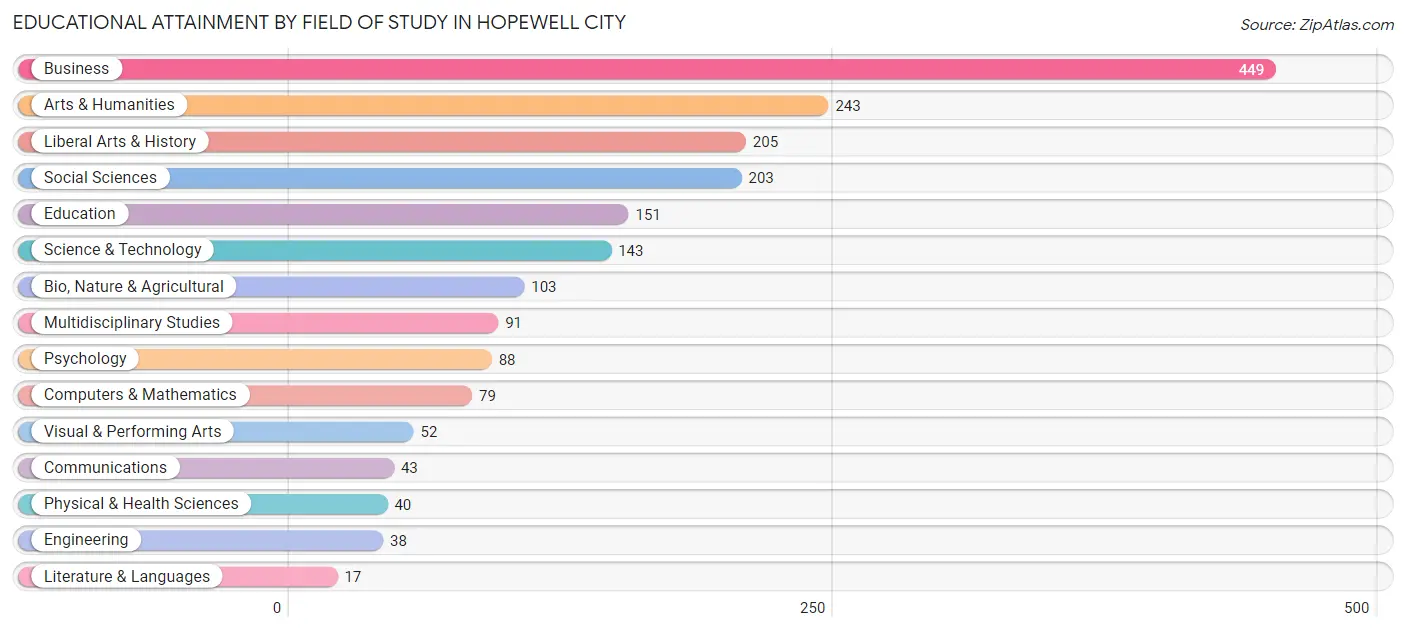
| Field of Study | # Graduates | % Graduates |
| Computers & Mathematics | 79 | 4.1% |
| Bio, Nature & Agricultural | 103 | 5.3% |
| Physical & Health Sciences | 40 | 2.1% |
| Psychology | 88 | 4.5% |
| Social Sciences | 203 | 10.4% |
| Engineering | 38 | 1.9% |
| Multidisciplinary Studies | 91 | 4.7% |
| Science & Technology | 143 | 7.3% |
| Business | 449 | 23.1% |
| Education | 151 | 7.8% |
| Literature & Languages | 17 | 0.9% |
| Liberal Arts & History | 205 | 10.5% |
| Visual & Performing Arts | 52 | 2.7% |
| Communications | 43 | 2.2% |
| Arts & Humanities | 243 | 12.5% |
| Total | 1,945 | 100.0% |
Transportation & Commute in Hopewell city
Vehicle Availability by Sex in Hopewell city
The most prevalent vehicle ownership categories in Hopewell city are males with 3 vehicles (1,768, accounting for 36.2%) and females with 3 vehicles (1,336, making up 38.9%).
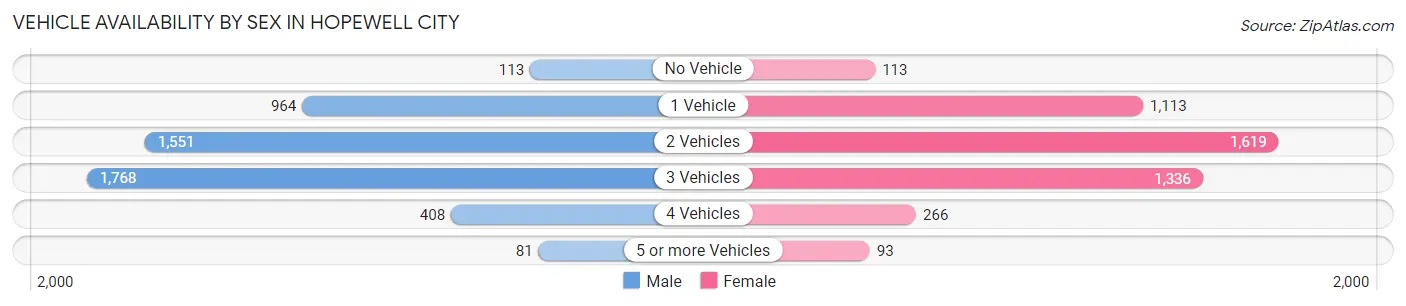
| Vehicles Available | Male | Female |
| No Vehicle | 113 (2.3%) | 113 (2.5%) |
| 1 Vehicle | 964 (19.7%) | 1,113 (24.5%) |
| 2 Vehicles | 1,551 (31.8%) | 1,619 (35.7%) |
| 3 Vehicles | 1,768 (36.2%) | 1,336 (29.4%) |
| 4 Vehicles | 408 (8.4%) | 266 (5.9%) |
| 5 or more Vehicles | 81 (1.7%) | 93 (2.1%) |
| Total | 4,885 (100.0%) | 4,540 (100.0%) |
Commute Time in Hopewell city
The most frequently occuring commute durations in Hopewell city are 10 to 14 minutes (1,439 commuters, 16.3%), 30 to 34 minutes (1,270 commuters, 14.4%), and 20 to 24 minutes (1,227 commuters, 13.9%).
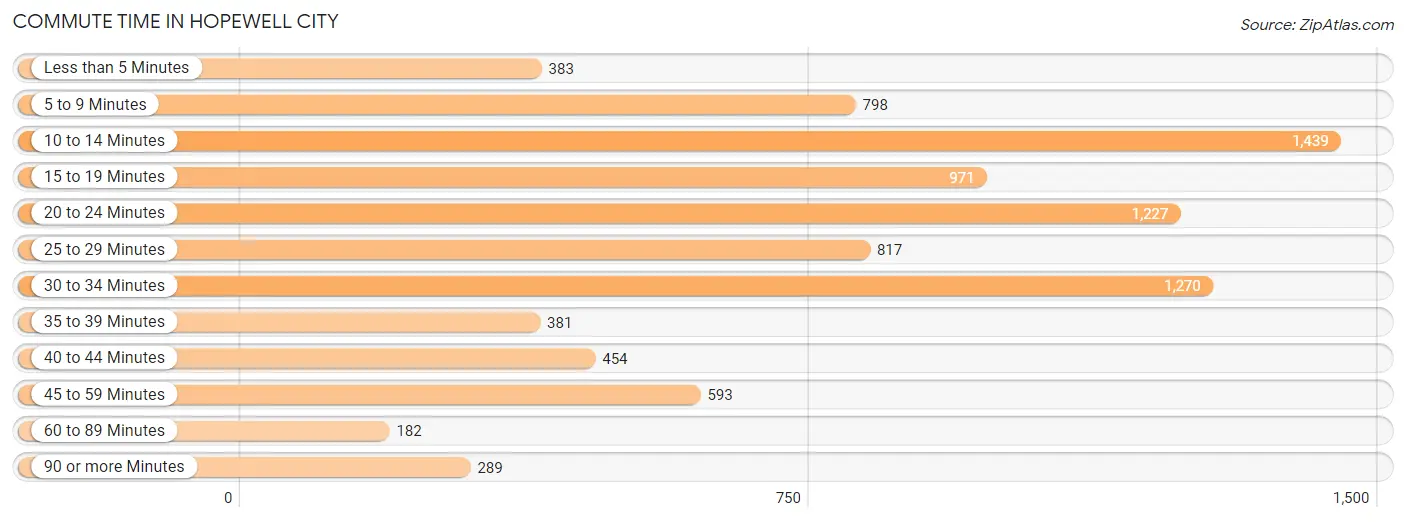
| Commute Time | # Commuters | % Commuters |
| Less than 5 Minutes | 383 | 4.3% |
| 5 to 9 Minutes | 798 | 9.1% |
| 10 to 14 Minutes | 1,439 | 16.3% |
| 15 to 19 Minutes | 971 | 11.0% |
| 20 to 24 Minutes | 1,227 | 13.9% |
| 25 to 29 Minutes | 817 | 9.3% |
| 30 to 34 Minutes | 1,270 | 14.4% |
| 35 to 39 Minutes | 381 | 4.3% |
| 40 to 44 Minutes | 454 | 5.2% |
| 45 to 59 Minutes | 593 | 6.7% |
| 60 to 89 Minutes | 182 | 2.1% |
| 90 or more Minutes | 289 | 3.3% |
Commute Time by Sex in Hopewell city
The most common commute times in Hopewell city are 30 to 34 minutes (919 commuters, 19.4%) for males and 10 to 14 minutes (669 commuters, 16.5%) for females.
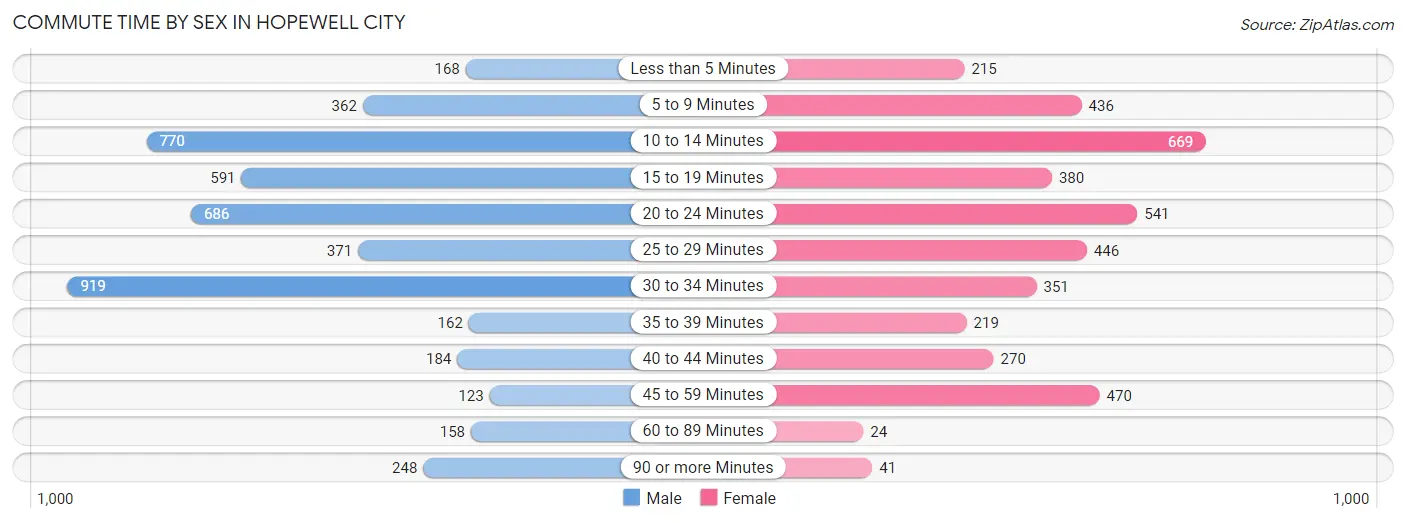
| Commute Time | Male | Female |
| Less than 5 Minutes | 168 (3.5%) | 215 (5.3%) |
| 5 to 9 Minutes | 362 (7.6%) | 436 (10.7%) |
| 10 to 14 Minutes | 770 (16.2%) | 669 (16.5%) |
| 15 to 19 Minutes | 591 (12.5%) | 380 (9.3%) |
| 20 to 24 Minutes | 686 (14.5%) | 541 (13.3%) |
| 25 to 29 Minutes | 371 (7.8%) | 446 (11.0%) |
| 30 to 34 Minutes | 919 (19.4%) | 351 (8.6%) |
| 35 to 39 Minutes | 162 (3.4%) | 219 (5.4%) |
| 40 to 44 Minutes | 184 (3.9%) | 270 (6.7%) |
| 45 to 59 Minutes | 123 (2.6%) | 470 (11.6%) |
| 60 to 89 Minutes | 158 (3.3%) | 24 (0.6%) |
| 90 or more Minutes | 248 (5.2%) | 41 (1.0%) |
Time of Departure to Work by Sex in Hopewell city
The most frequent times of departure to work in Hopewell city are 4:00 PM to 11:59 PM (683, 14.4%) for males and 6:30 AM to 6:59 AM (609, 15.0%) for females.
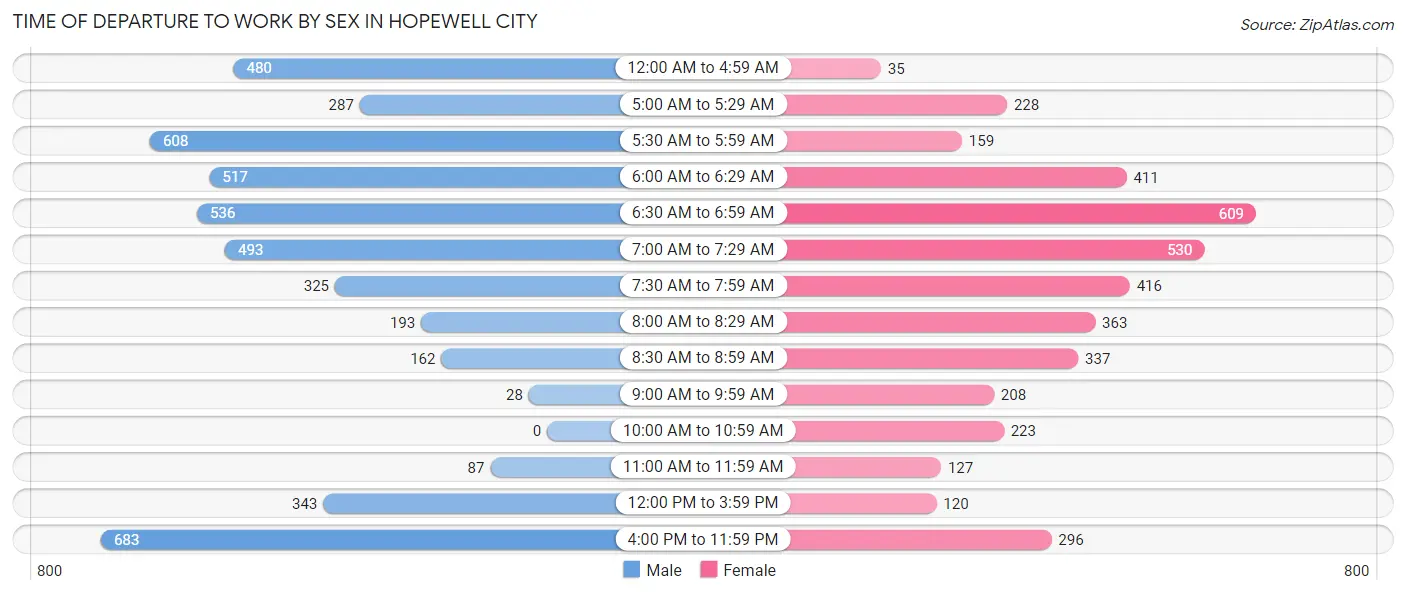
| Time of Departure | Male | Female |
| 12:00 AM to 4:59 AM | 480 (10.1%) | 35 (0.9%) |
| 5:00 AM to 5:29 AM | 287 (6.0%) | 228 (5.6%) |
| 5:30 AM to 5:59 AM | 608 (12.8%) | 159 (3.9%) |
| 6:00 AM to 6:29 AM | 517 (10.9%) | 411 (10.1%) |
| 6:30 AM to 6:59 AM | 536 (11.3%) | 609 (15.0%) |
| 7:00 AM to 7:29 AM | 493 (10.4%) | 530 (13.1%) |
| 7:30 AM to 7:59 AM | 325 (6.9%) | 416 (10.2%) |
| 8:00 AM to 8:29 AM | 193 (4.1%) | 363 (8.9%) |
| 8:30 AM to 8:59 AM | 162 (3.4%) | 337 (8.3%) |
| 9:00 AM to 9:59 AM | 28 (0.6%) | 208 (5.1%) |
| 10:00 AM to 10:59 AM | 0 (0.0%) | 223 (5.5%) |
| 11:00 AM to 11:59 AM | 87 (1.8%) | 127 (3.1%) |
| 12:00 PM to 3:59 PM | 343 (7.2%) | 120 (2.9%) |
| 4:00 PM to 11:59 PM | 683 (14.4%) | 296 (7.3%) |
| Total | 4,742 (100.0%) | 4,062 (100.0%) |
Housing Occupancy in Hopewell city
Occupancy by Ownership in Hopewell city
Of the total 9,348 dwellings in Hopewell city, owner-occupied units account for 5,007 (53.6%), while renter-occupied units make up 4,341 (46.4%).
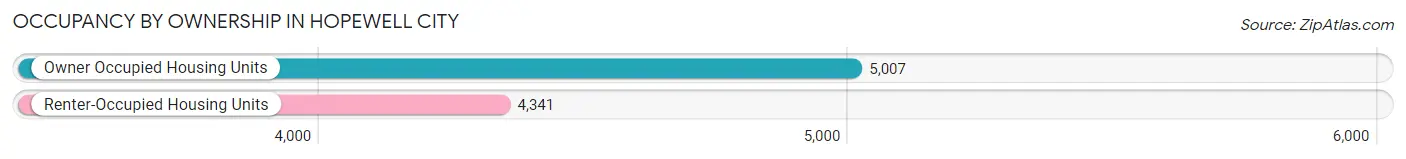
| Occupancy | # Housing Units | % Housing Units |
| Owner Occupied Housing Units | 5,007 | 53.6% |
| Renter-Occupied Housing Units | 4,341 | 46.4% |
| Total Occupied Housing Units | 9,348 | 100.0% |
Occupancy by Household Size in Hopewell city
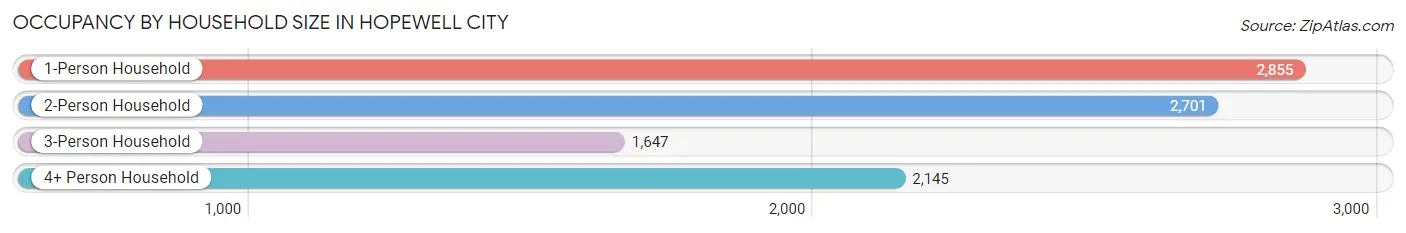
| Household Size | # Housing Units | % Housing Units |
| 1-Person Household | 2,855 | 30.5% |
| 2-Person Household | 2,701 | 28.9% |
| 3-Person Household | 1,647 | 17.6% |
| 4+ Person Household | 2,145 | 23.0% |
| Total Housing Units | 9,348 | 100.0% |
Occupancy by Ownership by Household Size in Hopewell city
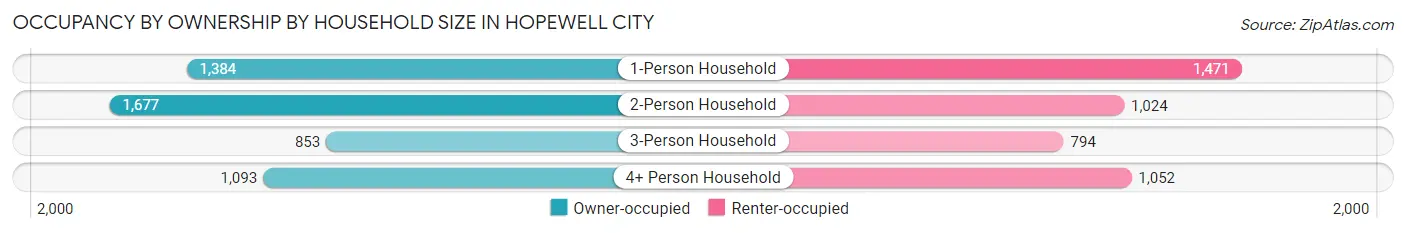
| Household Size | Owner-occupied | Renter-occupied |
| 1-Person Household | 1,384 (48.5%) | 1,471 (51.5%) |
| 2-Person Household | 1,677 (62.1%) | 1,024 (37.9%) |
| 3-Person Household | 853 (51.8%) | 794 (48.2%) |
| 4+ Person Household | 1,093 (51.0%) | 1,052 (49.0%) |
| Total Housing Units | 5,007 (53.6%) | 4,341 (46.4%) |
Occupancy by Educational Attainment in Hopewell city
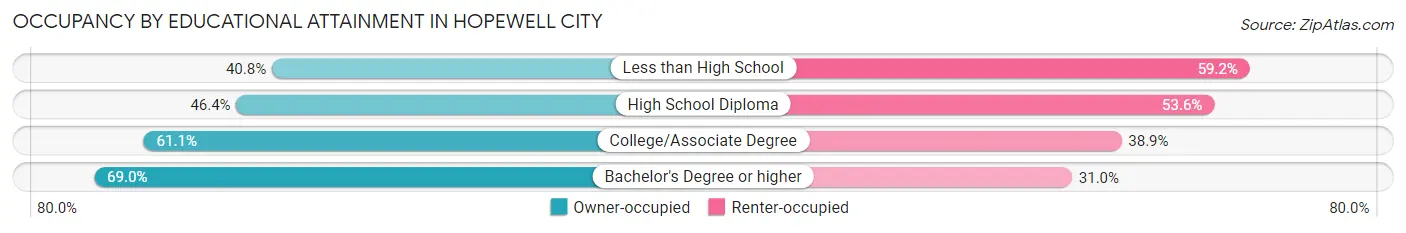
| Household Size | Owner-occupied | Renter-occupied |
| Less than High School | 450 (40.8%) | 654 (59.2%) |
| High School Diploma | 1,790 (46.4%) | 2,068 (53.6%) |
| College/Associate Degree | 2,005 (61.1%) | 1,276 (38.9%) |
| Bachelor's Degree or higher | 762 (69.0%) | 343 (31.0%) |
Occupancy by Age of Householder in Hopewell city
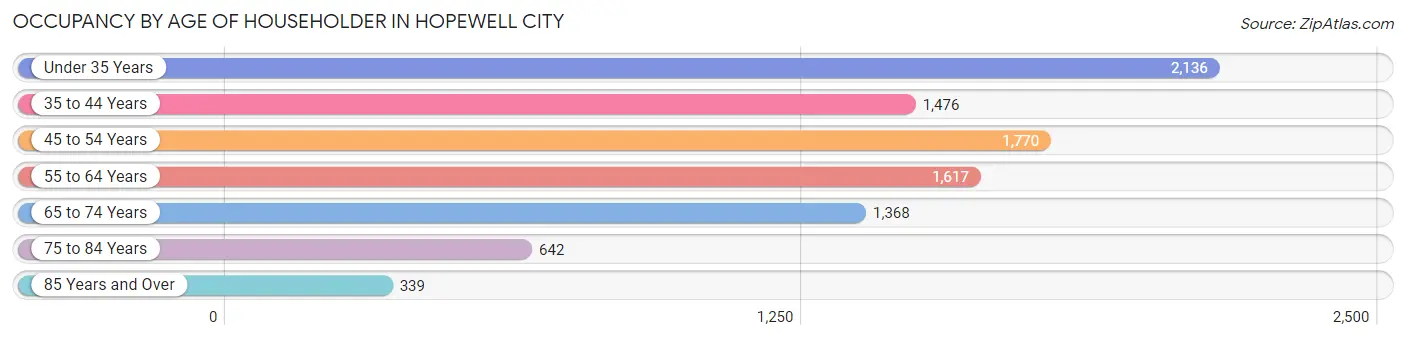
| Age Bracket | # Households | % Households |
| Under 35 Years | 2,136 | 22.9% |
| 35 to 44 Years | 1,476 | 15.8% |
| 45 to 54 Years | 1,770 | 18.9% |
| 55 to 64 Years | 1,617 | 17.3% |
| 65 to 74 Years | 1,368 | 14.6% |
| 75 to 84 Years | 642 | 6.9% |
| 85 Years and Over | 339 | 3.6% |
| Total | 9,348 | 100.0% |
Housing Finances in Hopewell city
Median Income by Occupancy in Hopewell city
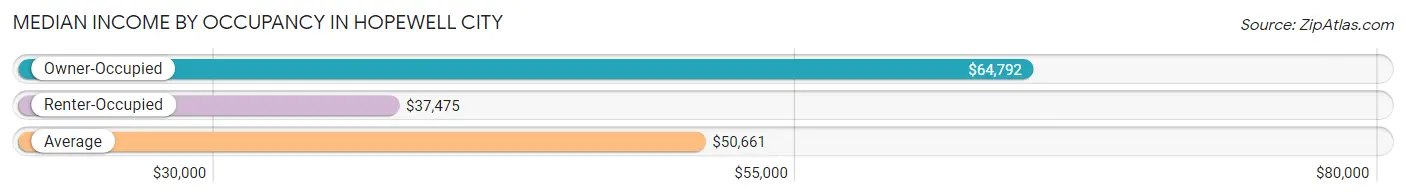
| Occupancy Type | # Households | Median Income |
| Owner-Occupied | 5,007 (53.6%) | $64,792 |
| Renter-Occupied | 4,341 (46.4%) | $37,475 |
| Average | 9,348 (100.0%) | $50,661 |
Occupancy by Householder Income Bracket in Hopewell city
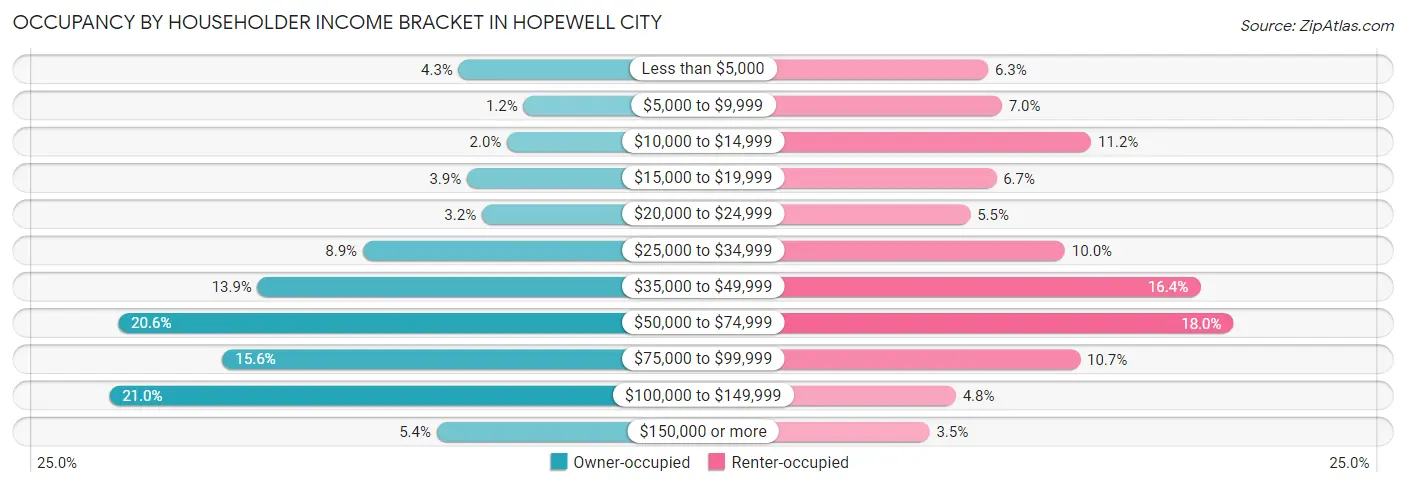
| Income Bracket | Owner-occupied | Renter-occupied |
| Less than $5,000 | 217 (4.3%) | 274 (6.3%) |
| $5,000 to $9,999 | 62 (1.2%) | 302 (7.0%) |
| $10,000 to $14,999 | 101 (2.0%) | 487 (11.2%) |
| $15,000 to $19,999 | 197 (3.9%) | 291 (6.7%) |
| $20,000 to $24,999 | 161 (3.2%) | 237 (5.5%) |
| $25,000 to $34,999 | 445 (8.9%) | 433 (10.0%) |
| $35,000 to $49,999 | 696 (13.9%) | 712 (16.4%) |
| $50,000 to $74,999 | 1,029 (20.5%) | 781 (18.0%) |
| $75,000 to $99,999 | 780 (15.6%) | 464 (10.7%) |
| $100,000 to $149,999 | 1,050 (21.0%) | 207 (4.8%) |
| $150,000 or more | 269 (5.4%) | 153 (3.5%) |
| Total | 5,007 (100.0%) | 4,341 (100.0%) |
Monthly Housing Cost Tiers in Hopewell city
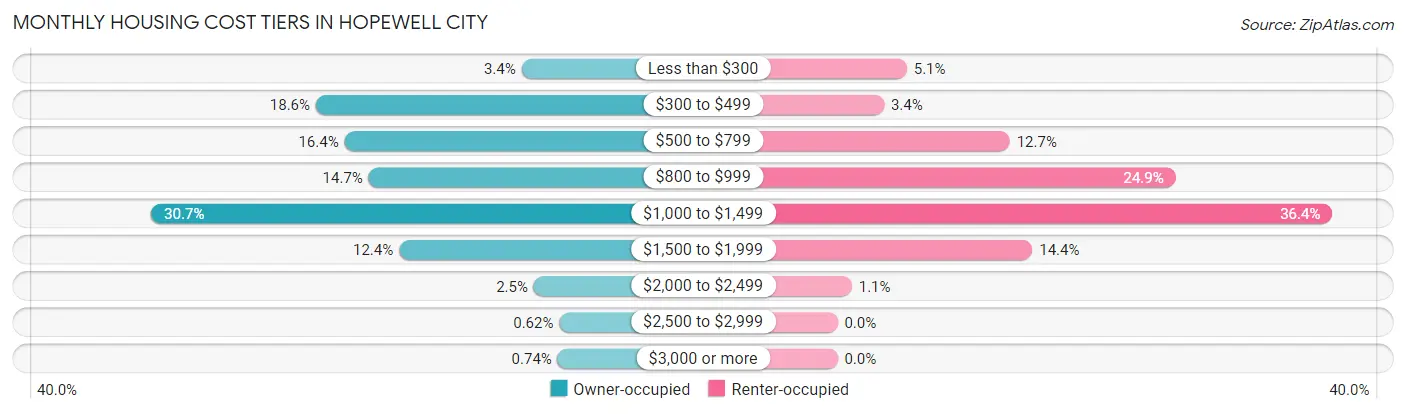
| Monthly Cost | Owner-occupied | Renter-occupied |
| Less than $300 | 170 (3.4%) | 222 (5.1%) |
| $300 to $499 | 929 (18.5%) | 149 (3.4%) |
| $500 to $799 | 823 (16.4%) | 551 (12.7%) |
| $800 to $999 | 734 (14.7%) | 1,081 (24.9%) |
| $1,000 to $1,499 | 1,536 (30.7%) | 1,582 (36.4%) |
| $1,500 to $1,999 | 622 (12.4%) | 623 (14.3%) |
| $2,000 to $2,499 | 125 (2.5%) | 46 (1.1%) |
| $2,500 to $2,999 | 31 (0.6%) | 0 (0.0%) |
| $3,000 or more | 37 (0.7%) | 0 (0.0%) |
| Total | 5,007 (100.0%) | 4,341 (100.0%) |
Physical Housing Characteristics in Hopewell city
Housing Structures in Hopewell city
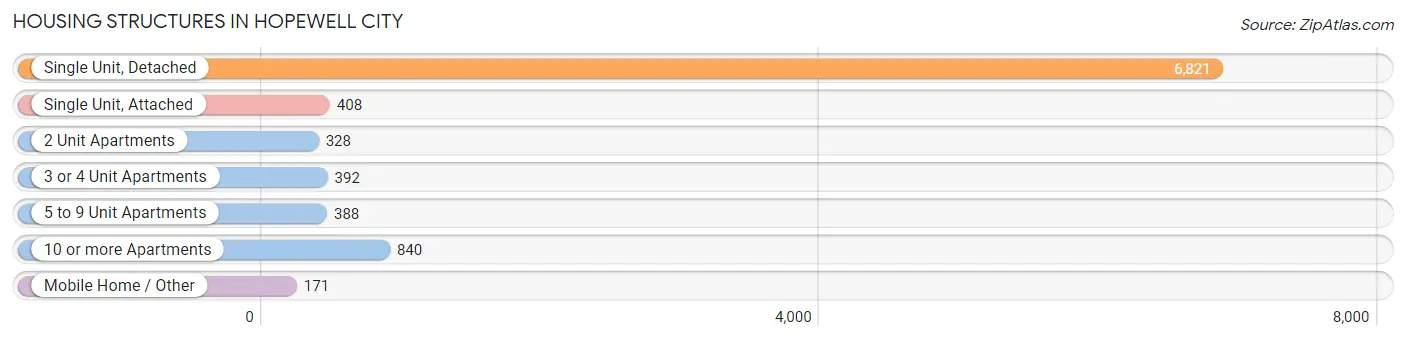
| Structure Type | # Housing Units | % Housing Units |
| Single Unit, Detached | 6,821 | 73.0% |
| Single Unit, Attached | 408 | 4.4% |
| 2 Unit Apartments | 328 | 3.5% |
| 3 or 4 Unit Apartments | 392 | 4.2% |
| 5 to 9 Unit Apartments | 388 | 4.2% |
| 10 or more Apartments | 840 | 9.0% |
| Mobile Home / Other | 171 | 1.8% |
| Total | 9,348 | 100.0% |
Housing Structures by Occupancy in Hopewell city
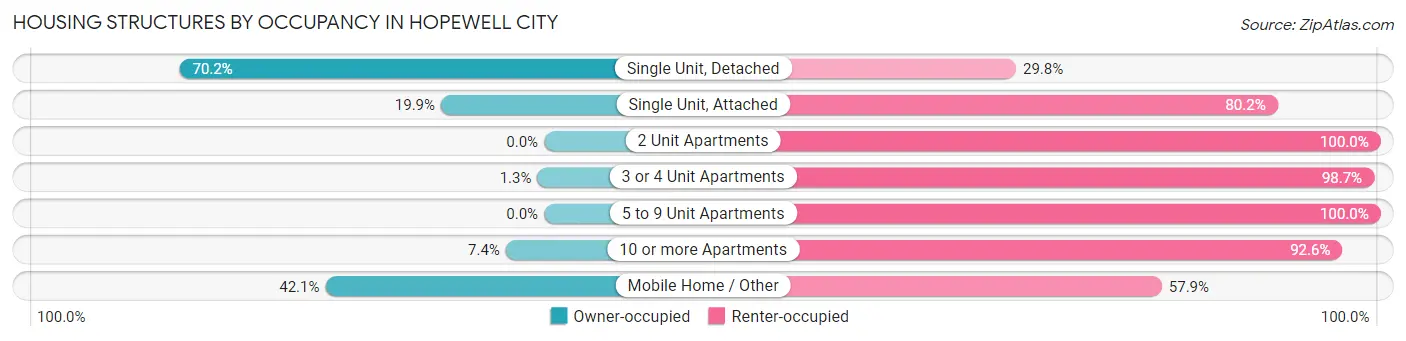
| Structure Type | Owner-occupied | Renter-occupied |
| Single Unit, Detached | 4,787 (70.2%) | 2,034 (29.8%) |
| Single Unit, Attached | 81 (19.9%) | 327 (80.1%) |
| 2 Unit Apartments | 0 (0.0%) | 328 (100.0%) |
| 3 or 4 Unit Apartments | 5 (1.3%) | 387 (98.7%) |
| 5 to 9 Unit Apartments | 0 (0.0%) | 388 (100.0%) |
| 10 or more Apartments | 62 (7.4%) | 778 (92.6%) |
| Mobile Home / Other | 72 (42.1%) | 99 (57.9%) |
| Total | 5,007 (53.6%) | 4,341 (46.4%) |
Housing Structures by Number of Rooms in Hopewell city
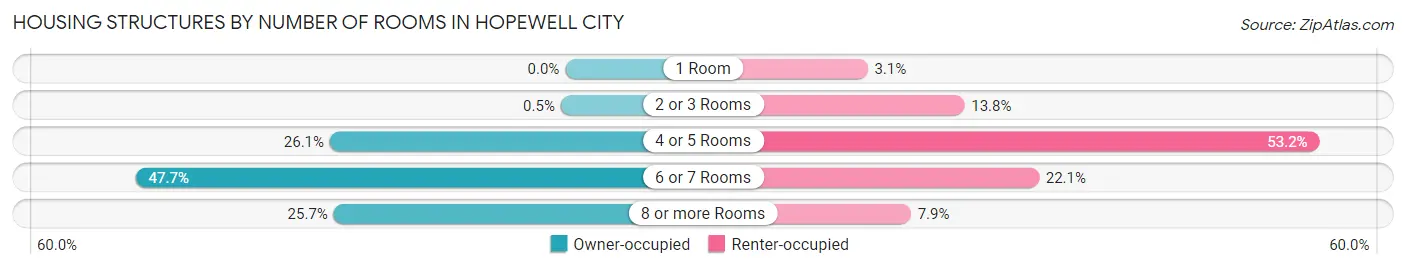
| Number of Rooms | Owner-occupied | Renter-occupied |
| 1 Room | 0 (0.0%) | 133 (3.1%) |
| 2 or 3 Rooms | 25 (0.5%) | 599 (13.8%) |
| 4 or 5 Rooms | 1,308 (26.1%) | 2,310 (53.2%) |
| 6 or 7 Rooms | 2,387 (47.7%) | 958 (22.1%) |
| 8 or more Rooms | 1,287 (25.7%) | 341 (7.9%) |
| Total | 5,007 (100.0%) | 4,341 (100.0%) |
Housing Structure by Heating Type in Hopewell city
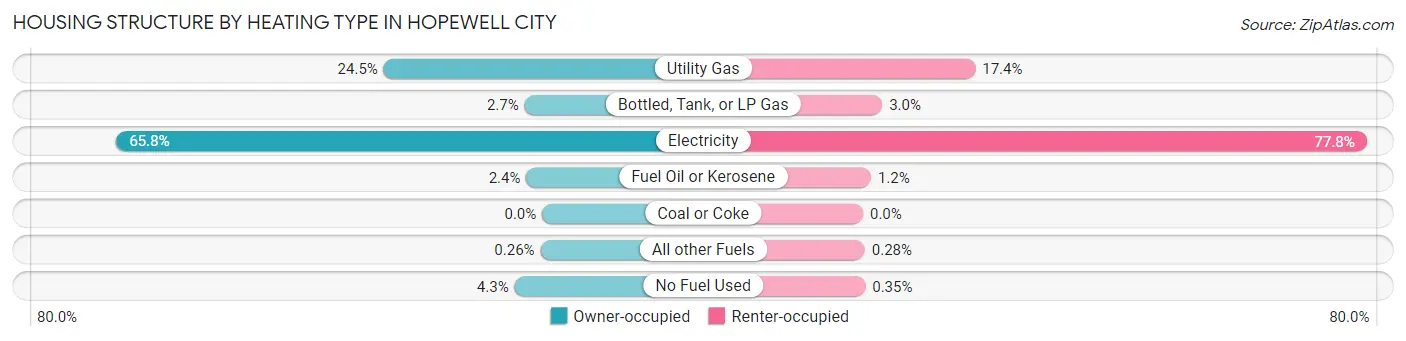
| Heating Type | Owner-occupied | Renter-occupied |
| Utility Gas | 1,226 (24.5%) | 753 (17.3%) |
| Bottled, Tank, or LP Gas | 136 (2.7%) | 129 (3.0%) |
| Electricity | 3,296 (65.8%) | 3,379 (77.8%) |
| Fuel Oil or Kerosene | 122 (2.4%) | 53 (1.2%) |
| Coal or Coke | 0 (0.0%) | 0 (0.0%) |
| All other Fuels | 13 (0.3%) | 12 (0.3%) |
| No Fuel Used | 214 (4.3%) | 15 (0.4%) |
| Total | 5,007 (100.0%) | 4,341 (100.0%) |
Household Vehicle Usage in Hopewell city
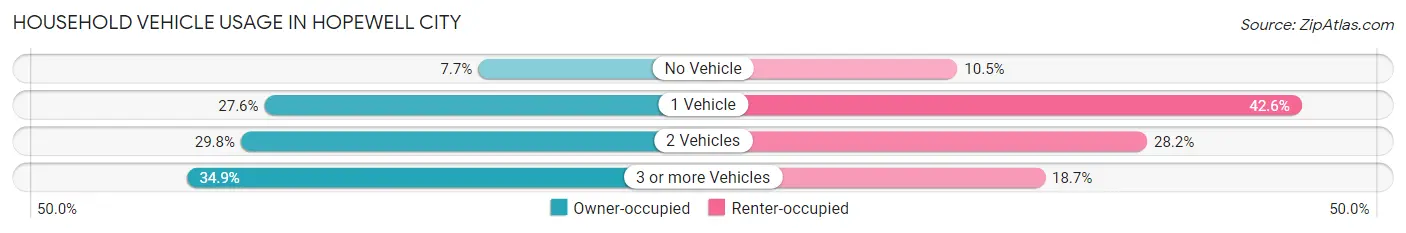
| Vehicles per Household | Owner-occupied | Renter-occupied |
| No Vehicle | 384 (7.7%) | 456 (10.5%) |
| 1 Vehicle | 1,383 (27.6%) | 1,850 (42.6%) |
| 2 Vehicles | 1,493 (29.8%) | 1,224 (28.2%) |
| 3 or more Vehicles | 1,747 (34.9%) | 811 (18.7%) |
| Total | 5,007 (100.0%) | 4,341 (100.0%) |
Real Estate & Mortgages in Hopewell city
Real Estate and Mortgage Overview in Hopewell city
| Characteristic | Without Mortgage | With Mortgage |
| Housing Units | 1,502 | 3,505 |
| Median Property Value | $132,100 | $159,300 |
| Median Household Income | $45,889 | $202 |
| Monthly Housing Costs | $435 | $37 |
| Real Estate Taxes | $1,498 | $275 |
Property Value by Mortgage Status in Hopewell city
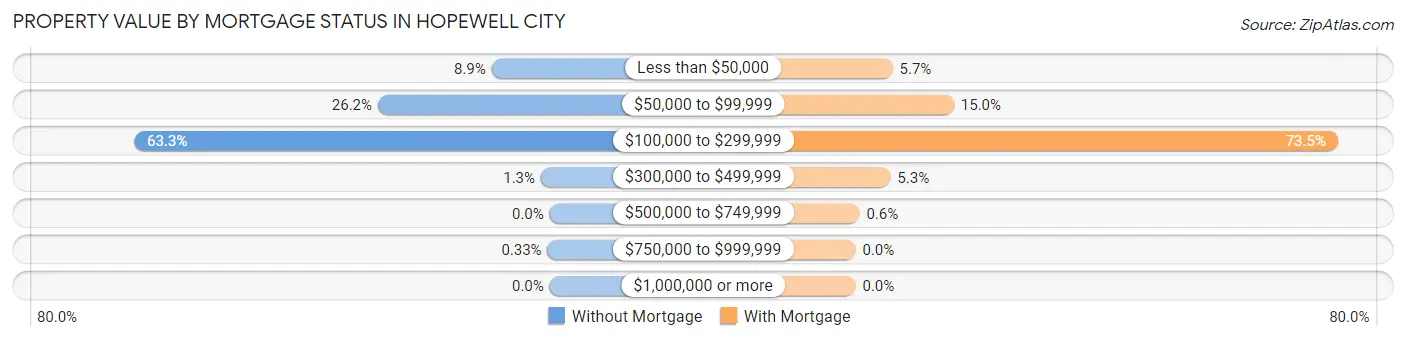
| Property Value | Without Mortgage | With Mortgage |
| Less than $50,000 | 133 (8.8%) | 198 (5.7%) |
| $50,000 to $99,999 | 393 (26.2%) | 525 (15.0%) |
| $100,000 to $299,999 | 951 (63.3%) | 2,575 (73.5%) |
| $300,000 to $499,999 | 20 (1.3%) | 186 (5.3%) |
| $500,000 to $749,999 | 0 (0.0%) | 21 (0.6%) |
| $750,000 to $999,999 | 5 (0.3%) | 0 (0.0%) |
| $1,000,000 or more | 0 (0.0%) | 0 (0.0%) |
| Total | 1,502 (100.0%) | 3,505 (100.0%) |
Household Income by Mortgage Status in Hopewell city
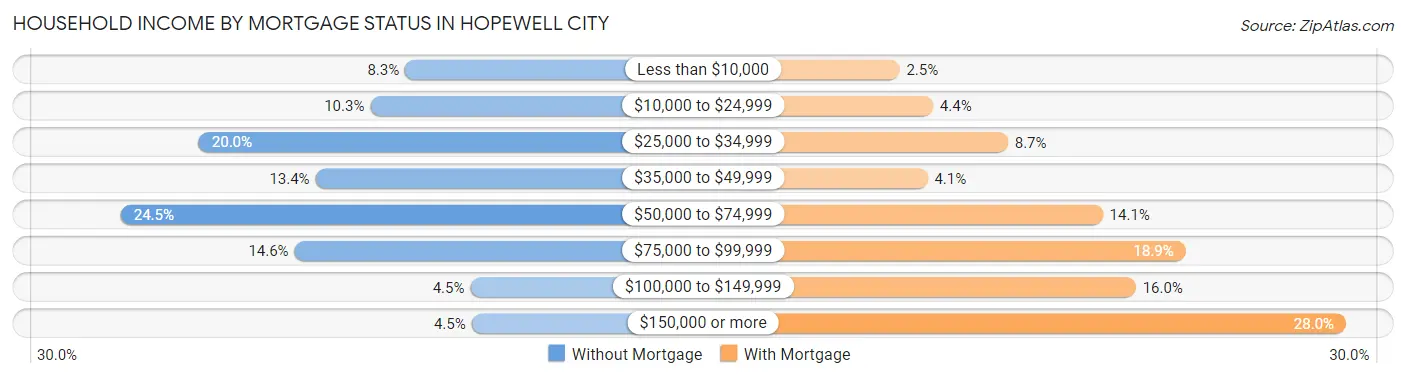
| Household Income | Without Mortgage | With Mortgage |
| Less than $10,000 | 124 (8.3%) | 88 (2.5%) |
| $10,000 to $24,999 | 154 (10.2%) | 155 (4.4%) |
| $25,000 to $34,999 | 301 (20.0%) | 305 (8.7%) |
| $35,000 to $49,999 | 201 (13.4%) | 144 (4.1%) |
| $50,000 to $74,999 | 368 (24.5%) | 495 (14.1%) |
| $75,000 to $99,999 | 219 (14.6%) | 661 (18.9%) |
| $100,000 to $149,999 | 68 (4.5%) | 561 (16.0%) |
| $150,000 or more | 67 (4.5%) | 982 (28.0%) |
| Total | 1,502 (100.0%) | 3,505 (100.0%) |
Property Value to Household Income Ratio in Hopewell city
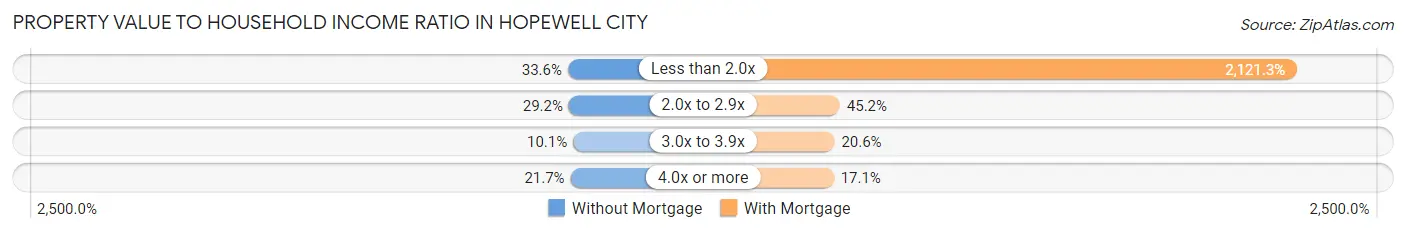
| Value-to-Income Ratio | Without Mortgage | With Mortgage |
| Less than 2.0x | 505 (33.6%) | 74,353 (2,121.3%) |
| 2.0x to 2.9x | 439 (29.2%) | 1,583 (45.2%) |
| 3.0x to 3.9x | 151 (10.1%) | 721 (20.6%) |
| 4.0x or more | 326 (21.7%) | 599 (17.1%) |
| Total | 1,502 (100.0%) | 3,505 (100.0%) |
Real Estate Taxes by Mortgage Status in Hopewell city
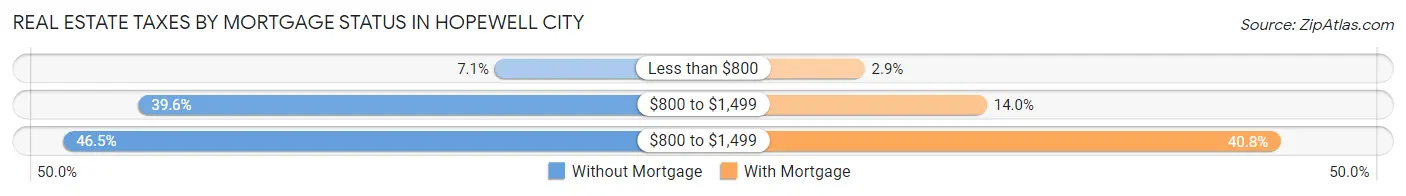
| Property Taxes | Without Mortgage | With Mortgage |
| Less than $800 | 106 (7.1%) | 101 (2.9%) |
| $800 to $1,499 | 595 (39.6%) | 492 (14.0%) |
| $800 to $1,499 | 698 (46.5%) | 1,431 (40.8%) |
| Total | 1,502 (100.0%) | 3,505 (100.0%) |
Health & Disability in Hopewell city
Health Insurance Coverage by Age in Hopewell city
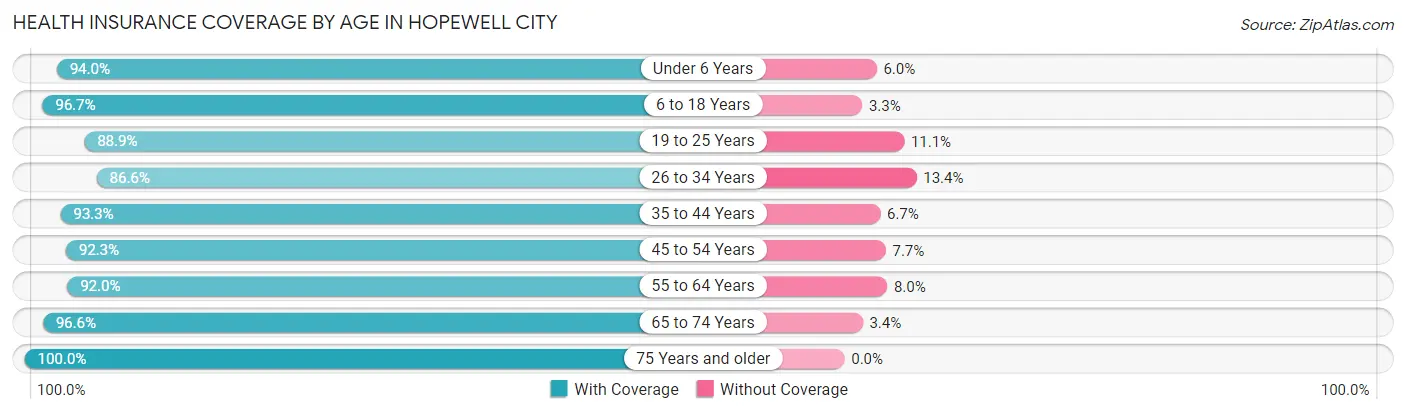
| Age Bracket | With Coverage | Without Coverage |
| Under 6 Years | 1,709 (94.0%) | 109 (6.0%) |
| 6 to 18 Years | 4,185 (96.7%) | 143 (3.3%) |
| 19 to 25 Years | 1,847 (88.9%) | 231 (11.1%) |
| 26 to 34 Years | 2,637 (86.6%) | 409 (13.4%) |
| 35 to 44 Years | 2,340 (93.3%) | 167 (6.7%) |
| 45 to 54 Years | 2,593 (92.3%) | 216 (7.7%) |
| 55 to 64 Years | 2,635 (92.0%) | 228 (8.0%) |
| 65 to 74 Years | 1,850 (96.6%) | 65 (3.4%) |
| 75 Years and older | 1,284 (100.0%) | 0 (0.0%) |
| Total | 21,080 (93.1%) | 1,568 (6.9%) |
Health Insurance Coverage by Citizenship Status in Hopewell city
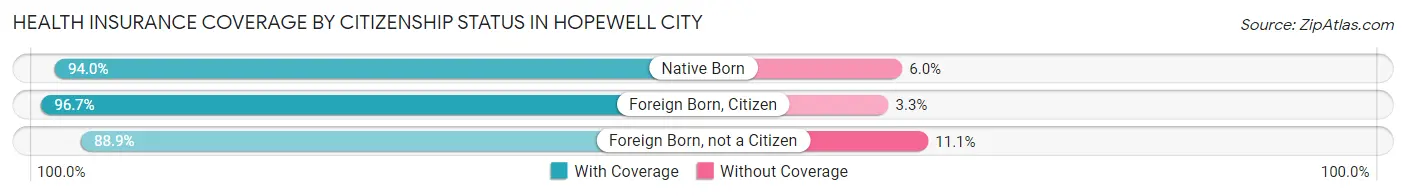
| Citizenship Status | With Coverage | Without Coverage |
| Native Born | 1,709 (94.0%) | 109 (6.0%) |
| Foreign Born, Citizen | 4,185 (96.7%) | 143 (3.3%) |
| Foreign Born, not a Citizen | 1,847 (88.9%) | 231 (11.1%) |
Health Insurance Coverage by Household Income in Hopewell city
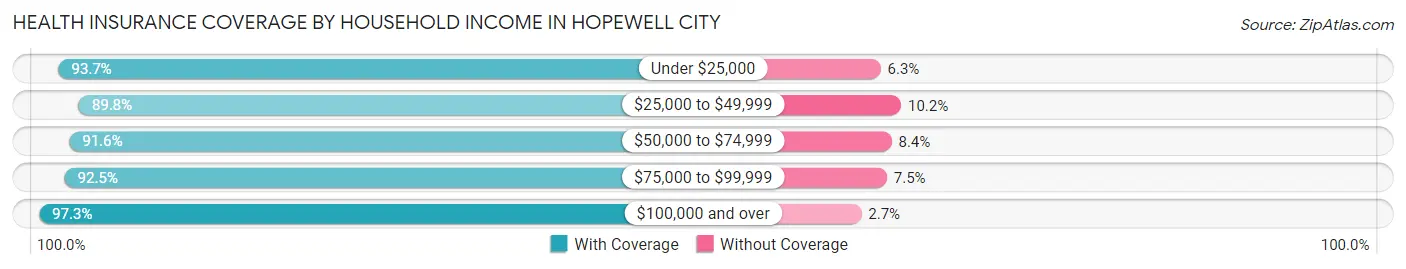
| Household Income | With Coverage | Without Coverage |
| Under $25,000 | 4,252 (93.7%) | 288 (6.3%) |
| $25,000 to $49,999 | 4,374 (89.8%) | 495 (10.2%) |
| $50,000 to $74,999 | 4,516 (91.6%) | 413 (8.4%) |
| $75,000 to $99,999 | 2,776 (92.5%) | 225 (7.5%) |
| $100,000 and over | 5,155 (97.3%) | 144 (2.7%) |
Public vs Private Health Insurance Coverage by Age in Hopewell city
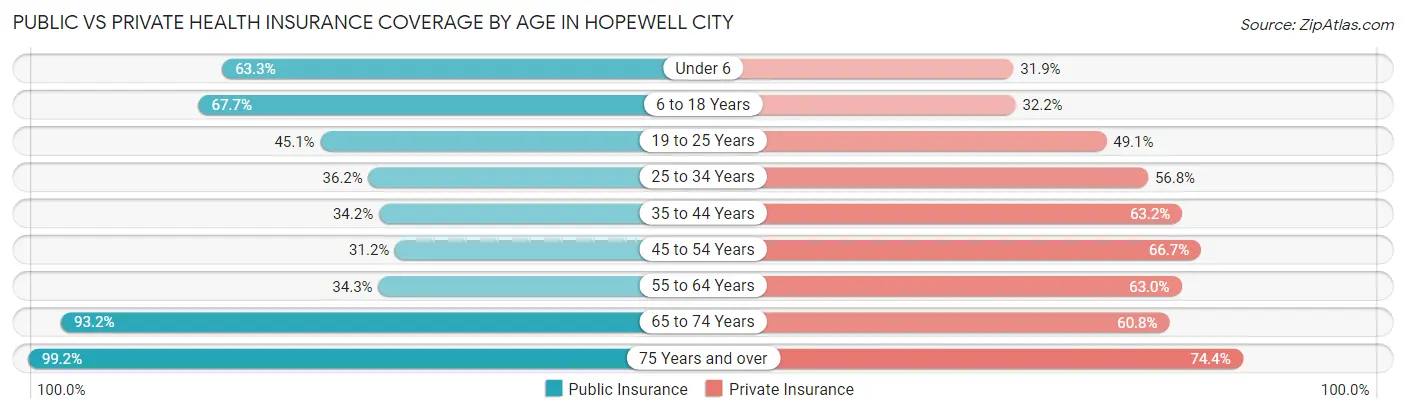
| Age Bracket | Public Insurance | Private Insurance |
| Under 6 | 1,151 (63.3%) | 579 (31.9%) |
| 6 to 18 Years | 2,930 (67.7%) | 1,395 (32.2%) |
| 19 to 25 Years | 937 (45.1%) | 1,020 (49.1%) |
| 25 to 34 Years | 1,101 (36.1%) | 1,731 (56.8%) |
| 35 to 44 Years | 858 (34.2%) | 1,584 (63.2%) |
| 45 to 54 Years | 877 (31.2%) | 1,873 (66.7%) |
| 55 to 64 Years | 983 (34.3%) | 1,804 (63.0%) |
| 65 to 74 Years | 1,785 (93.2%) | 1,164 (60.8%) |
| 75 Years and over | 1,274 (99.2%) | 955 (74.4%) |
| Total | 11,896 (52.5%) | 12,105 (53.4%) |
Disability Status by Sex by Age in Hopewell city
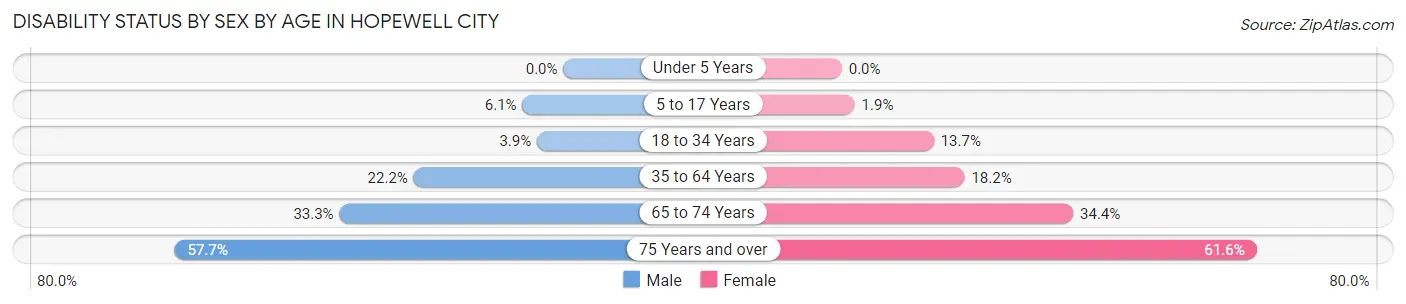
| Age Bracket | Male | Female |
| Under 5 Years | 0 (0.0%) | 0 (0.0%) |
| 5 to 17 Years | 137 (6.1%) | 38 (1.9%) |
| 18 to 34 Years | 103 (3.9%) | 374 (13.7%) |
| 35 to 64 Years | 774 (22.2%) | 856 (18.2%) |
| 65 to 74 Years | 265 (33.3%) | 384 (34.4%) |
| 75 Years and over | 280 (57.7%) | 492 (61.6%) |
Disability Class by Sex by Age in Hopewell city
Disability Class: Hearing Difficulty
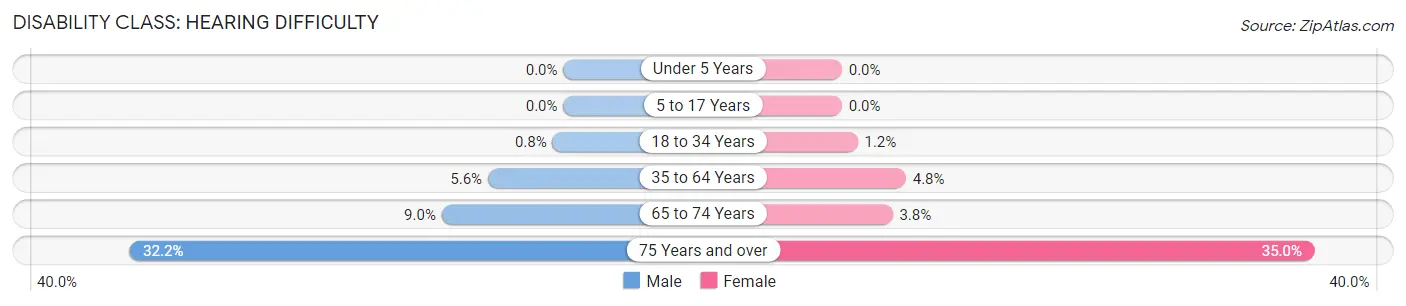
| Age Bracket | Male | Female |
| Under 5 Years | 0 (0.0%) | 0 (0.0%) |
| 5 to 17 Years | 0 (0.0%) | 0 (0.0%) |
| 18 to 34 Years | 21 (0.8%) | 32 (1.2%) |
| 35 to 64 Years | 195 (5.6%) | 223 (4.8%) |
| 65 to 74 Years | 72 (9.0%) | 42 (3.8%) |
| 75 Years and over | 156 (32.2%) | 280 (35.0%) |
Disability Class: Vision Difficulty
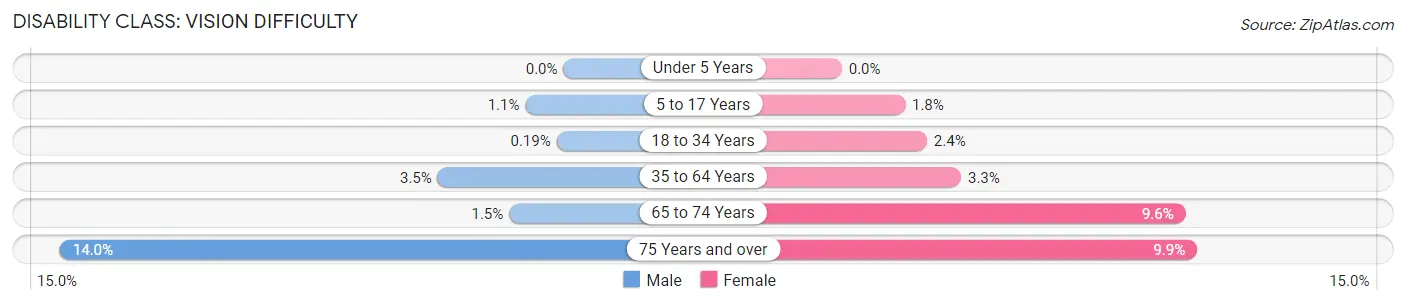
| Age Bracket | Male | Female |
| Under 5 Years | 0 (0.0%) | 0 (0.0%) |
| 5 to 17 Years | 24 (1.1%) | 35 (1.8%) |
| 18 to 34 Years | 5 (0.2%) | 65 (2.4%) |
| 35 to 64 Years | 122 (3.5%) | 156 (3.3%) |
| 65 to 74 Years | 12 (1.5%) | 107 (9.6%) |
| 75 Years and over | 68 (14.0%) | 79 (9.9%) |
Disability Class: Cognitive Difficulty
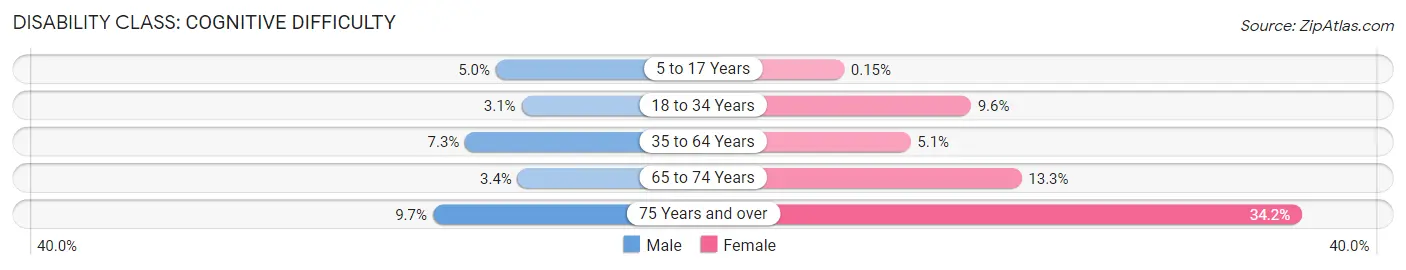
| Age Bracket | Male | Female |
| 5 to 17 Years | 113 (5.0%) | 3 (0.2%) |
| 18 to 34 Years | 82 (3.1%) | 262 (9.6%) |
| 35 to 64 Years | 254 (7.3%) | 239 (5.1%) |
| 65 to 74 Years | 27 (3.4%) | 149 (13.3%) |
| 75 Years and over | 47 (9.7%) | 273 (34.2%) |
Disability Class: Ambulatory Difficulty
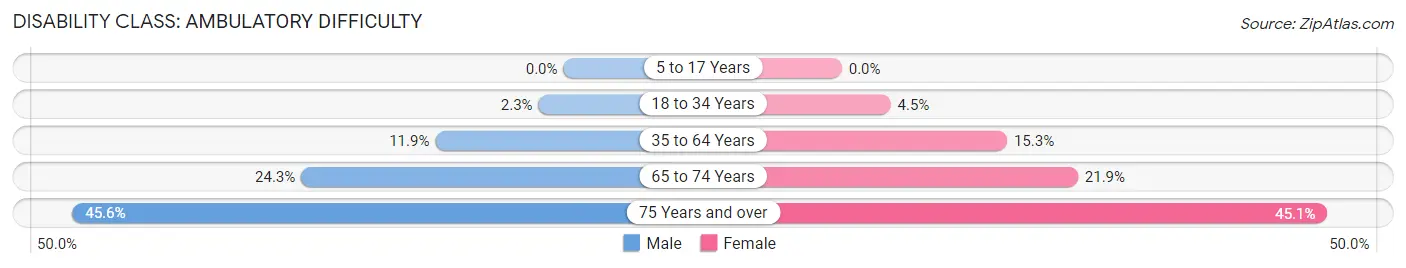
| Age Bracket | Male | Female |
| 5 to 17 Years | 0 (0.0%) | 0 (0.0%) |
| 18 to 34 Years | 61 (2.3%) | 124 (4.5%) |
| 35 to 64 Years | 414 (11.9%) | 720 (15.3%) |
| 65 to 74 Years | 194 (24.3%) | 245 (21.9%) |
| 75 Years and over | 221 (45.6%) | 360 (45.1%) |
Disability Class: Self-Care Difficulty
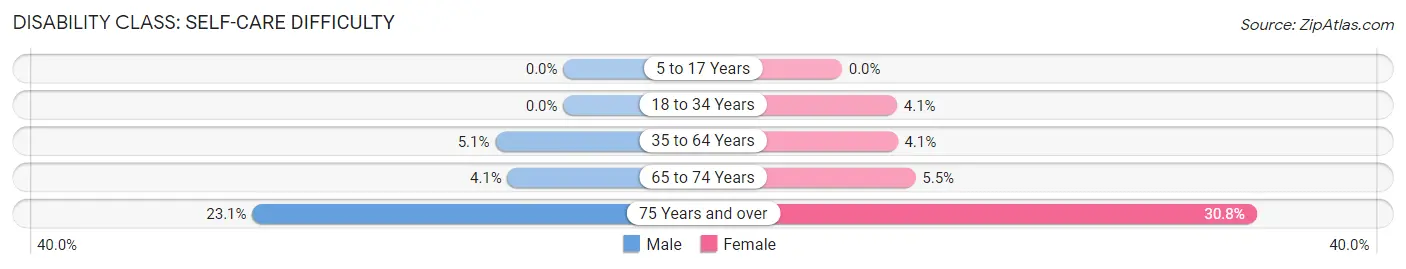
| Age Bracket | Male | Female |
| 5 to 17 Years | 0 (0.0%) | 0 (0.0%) |
| 18 to 34 Years | 0 (0.0%) | 112 (4.1%) |
| 35 to 64 Years | 176 (5.1%) | 194 (4.1%) |
| 65 to 74 Years | 33 (4.1%) | 61 (5.5%) |
| 75 Years and over | 112 (23.1%) | 246 (30.8%) |
Technology Access in Hopewell city
Computing Device Access in Hopewell city
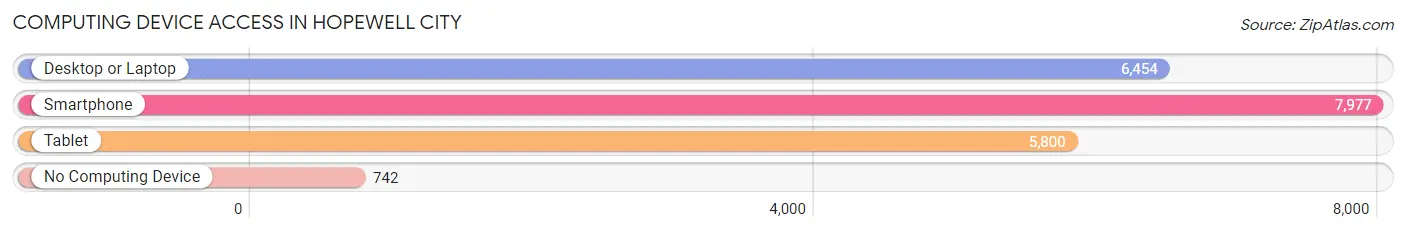
| Device Type | # Households | % Households |
| Desktop or Laptop | 6,454 | 69.0% |
| Smartphone | 7,977 | 85.3% |
| Tablet | 5,800 | 62.1% |
| No Computing Device | 742 | 7.9% |
| Total | 9,348 | 100.0% |
Internet Access in Hopewell city
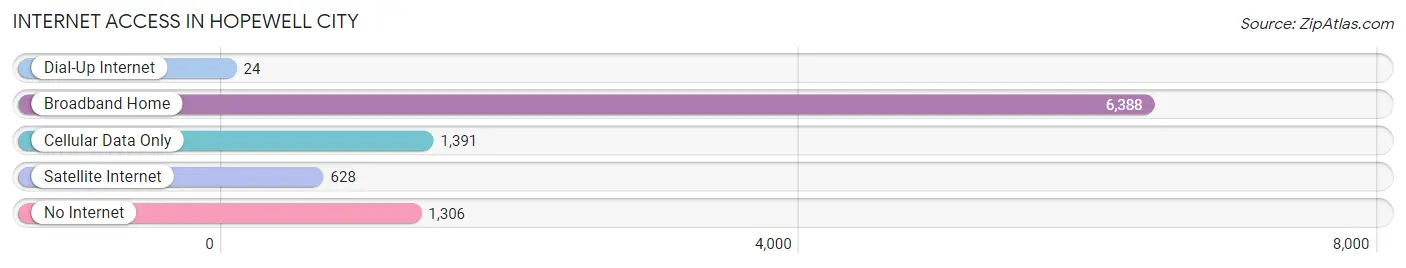
| Internet Type | # Households | % Households |
| Dial-Up Internet | 24 | 0.3% |
| Broadband Home | 6,388 | 68.3% |
| Cellular Data Only | 1,391 | 14.9% |
| Satellite Internet | 628 | 6.7% |
| No Internet | 1,306 | 14.0% |
| Total | 9,348 | 100.0% |
Hopewell city Summary
HopeWell City, VA is a small city located in the southeastern part of the state of Virginia. It is situated in the Hampton Roads metropolitan area, which is home to a population of over 1.7 million people. The city is located on the banks of the James River and is bordered by the cities of Hampton, Newport News, and Suffolk. HopeWell City is a part of the Hampton Roads region, which is known for its rich history, diverse culture, and vibrant economy.
History
HopeWell City was founded in 1610 by English settlers. The city was originally known as “HopeWell” and was named after the nearby James River. The city was initially a small trading post and was used as a port for ships traveling up and down the James River. In the late 1700s, the city began to grow and develop as a major port for the export of tobacco, cotton, and other goods.
In the early 1800s, HopeWell City became a major center for the slave trade. The city was home to a large number of slave traders and was a major hub for the transportation of slaves from the south to the north. During the Civil War, the city was occupied by Union forces and was the site of several battles. After the war, the city experienced a period of economic growth and development.
Geography
HopeWell City is located in the southeastern part of the state of Virginia. The city is situated on the banks of the James River and is bordered by the cities of Hampton, Newport News, and Suffolk. The city is located in the Hampton Roads metropolitan area, which is home to a population of over 1.7 million people. The city is located in a humid subtropical climate zone and experiences hot, humid summers and mild winters.
Economy
HopeWell City’s economy is largely based on the service industry. The city is home to a number of large corporations, including the Newport News Shipbuilding and Drydock Company, which is the largest employer in the city. The city is also home to a number of smaller businesses, including restaurants, retail stores, and other service-based businesses. The city is also home to a number of government agencies, including the Naval Station Norfolk and the Hampton Roads Naval Base.
Demographics
As of the 2010 census, HopeWell City had a population of 22,959. The city has a diverse population, with a majority of the population being African American (51.3%), followed by White (37.2%), Hispanic (7.2%), and Asian (3.3%). The median household income in the city is $45,845, and the median age is 37. The city has a high rate of poverty, with 24.3% of the population living below the poverty line.
Conclusion
HopeWell City, VA is a small city located in the southeastern part of the state of Virginia. The city has a rich history, diverse culture, and vibrant economy. The city is home to a number of large corporations and government agencies, and is a major center for the service industry. The city has a diverse population, with a majority of the population being African American. The city has a high rate of poverty, with 24.3% of the population living below the poverty line.
Common Questions
What is Per Capita Income in Hopewell city?
Per Capita income in Hopewell city is $25,664.
What is the Median Family Income in Hopewell city?
Median Family Income in Hopewell city is $58,850.
What is the Median Household income in Hopewell city?
Median Household Income in Hopewell city is $50,661.
What is Income or Wage Gap in Hopewell city?
Income or Wage Gap in Hopewell city is 14.9%.
Women in Hopewell city earn 85.1 cents for every dollar earned by a man.
What is Family Income Deficit in Hopewell city?
Family Income Deficit in Hopewell city is $10,942.
Families that are below poverty line in Hopewell city earn $10,942 less on average than the poverty threshold level.
What is Inequality or Gini Index in Hopewell city?
Inequality or Gini Index in Hopewell city is 0.44.
What is the Total Population of Hopewell city?
Total Population of Hopewell city is 23,046.
What is the Total Male Population of Hopewell city?
Total Male Population of Hopewell city is 10,827.
What is the Total Female Population of Hopewell city?
Total Female Population of Hopewell city is 12,219.
What is the Ratio of Males per 100 Females in Hopewell city?
There are 88.61 Males per 100 Females in Hopewell city.
What is the Ratio of Females per 100 Males in Hopewell city?
There are 112.86 Females per 100 Males in Hopewell city.
What is the Median Population Age in Hopewell city?
Median Population Age in Hopewell city is 35.7 Years.
What is the Average Family Size in Hopewell city
Average Family Size in Hopewell city is 3.0 People.
What is the Average Household Size in Hopewell city
Average Household Size in Hopewell city is 2.4 People.
How Large is the Labor Force in Hopewell city?
There are 10,655 People in the Labor Forcein in Hopewell city.
What is the Percentage of People in the Labor Force in Hopewell city?
60.2% of People are in the Labor Force in Hopewell city.
What is the Unemployment Rate in Hopewell city?
Unemployment Rate in Hopewell city is 8.8%.