Highland County, VA Map & Demographics
Highland County Overview
$32,704
PER CAPITA INCOME
$67,931
AVG FAMILY INCOME
$57,070
AVG HOUSEHOLD INCOME
18.2%
WAGE / INCOME GAP [ % ]
81.8¢/ $1
WAGE / INCOME GAP [ $ ]
$5,248
FAMILY INCOME DEFICIT
0.38
INEQUALITY / GINI INDEX
2,247
TOTAL POPULATION
1,034
MALE POPULATION
1,213
FEMALE POPULATION
85.24
MALES / 100 FEMALES
117.31
FEMALES / 100 MALES
58.0
MEDIAN AGE
2.5
AVG FAMILY SIZE
2.2
AVG HOUSEHOLD SIZE
948
LABOR FORCE [ PEOPLE ]
47.8%
PERCENT IN LABOR FORCE
14.7%
UNEMPLOYMENT RATE
Highland County Area Codes
Income in Highland County
Income Overview in Highland County
Per Capita Income in Highland County is $32,704, while median incomes of families and households are $67,931 and $57,070 respectively.
| Characteristic | Number | Measure |
| Per Capita Income | 2,247 | $32,704 |
| Median Family Income | 682 | $67,931 |
| Mean Family Income | 682 | $84,925 |
| Median Household Income | 1,014 | $57,070 |
| Mean Household Income | 1,014 | $71,672 |
| Income Deficit | 682 | $5,248 |
| Wage / Income Gap (%) | 2,247 | 18.20% |
| Wage / Income Gap ($) | 2,247 | 81.80¢ per $1 |
| Gini / Inequality Index | 2,247 | 0.38 |
Earnings by Sex in Highland County
Average Earnings in Highland County are $31,905, $27,176 for men and $33,224 for women, a difference of 18.2%.
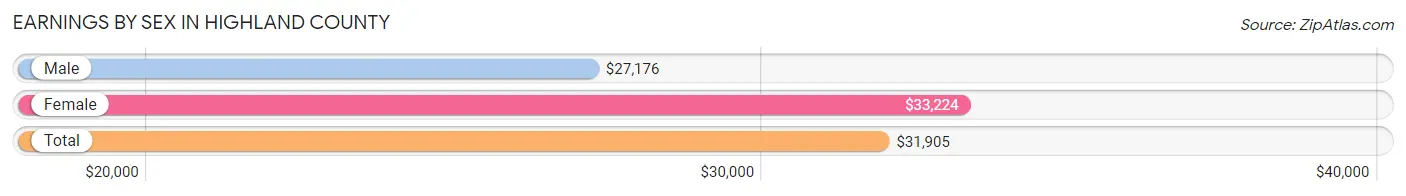
| Sex | Number | Average Earnings |
| Male | 491 (49.0%) | $27,176 |
| Female | 511 (51.0%) | $33,224 |
| Total | 1,002 (100.0%) | $31,905 |
Earnings by Sex by Income Bracket in Highland County
The most common earnings brackets in Highland County are $2,499 or less for men (73 | 14.9%) and $25,000 to $29,999 for women (97 | 19.0%).
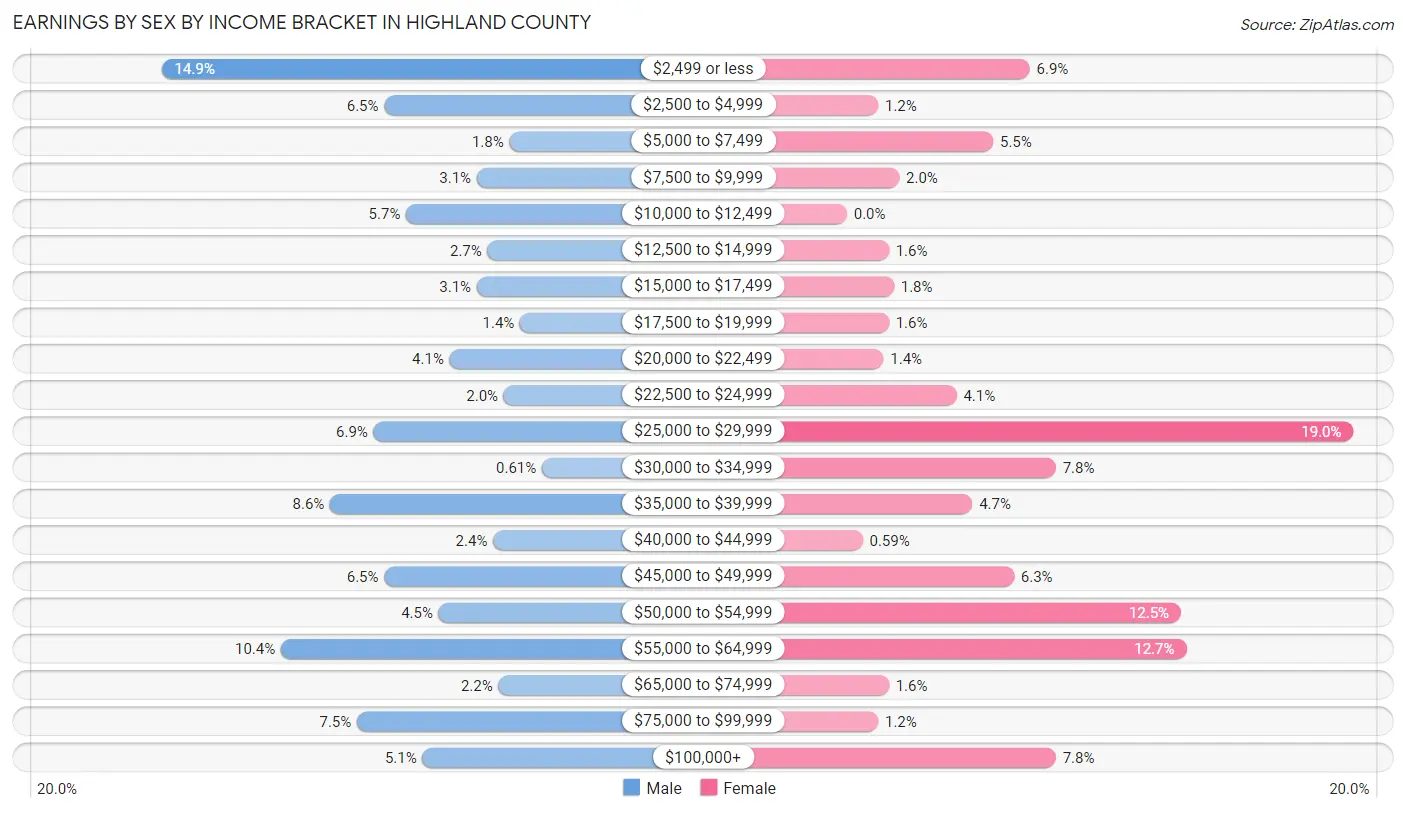
| Income | Male | Female |
| $2,499 or less | 73 (14.9%) | 35 (6.9%) |
| $2,500 to $4,999 | 32 (6.5%) | 6 (1.2%) |
| $5,000 to $7,499 | 9 (1.8%) | 28 (5.5%) |
| $7,500 to $9,999 | 15 (3.0%) | 10 (2.0%) |
| $10,000 to $12,499 | 28 (5.7%) | 0 (0.0%) |
| $12,500 to $14,999 | 13 (2.6%) | 8 (1.6%) |
| $15,000 to $17,499 | 15 (3.0%) | 9 (1.8%) |
| $17,500 to $19,999 | 7 (1.4%) | 8 (1.6%) |
| $20,000 to $22,499 | 20 (4.1%) | 7 (1.4%) |
| $22,500 to $24,999 | 10 (2.0%) | 21 (4.1%) |
| $25,000 to $29,999 | 34 (6.9%) | 97 (19.0%) |
| $30,000 to $34,999 | 3 (0.6%) | 40 (7.8%) |
| $35,000 to $39,999 | 42 (8.6%) | 24 (4.7%) |
| $40,000 to $44,999 | 12 (2.4%) | 3 (0.6%) |
| $45,000 to $49,999 | 32 (6.5%) | 32 (6.3%) |
| $50,000 to $54,999 | 22 (4.5%) | 64 (12.5%) |
| $55,000 to $64,999 | 51 (10.4%) | 65 (12.7%) |
| $65,000 to $74,999 | 11 (2.2%) | 8 (1.6%) |
| $75,000 to $99,999 | 37 (7.5%) | 6 (1.2%) |
| $100,000+ | 25 (5.1%) | 40 (7.8%) |
| Total | 491 (100.0%) | 511 (100.0%) |
Earnings by Sex by Educational Attainment in Highland County
Average earnings in Highland County are $38,194 for men and $29,932 for women, a difference of 21.6%. Men with an educational attainment of graduate degree enjoy the highest average annual earnings of $110,357, while those with bachelor's degree education earn the least with $24,750. Women with an educational attainment of less than high school earn the most with the average annual earnings of $31,154, while those with high school diploma education have the smallest earnings of $29,152.
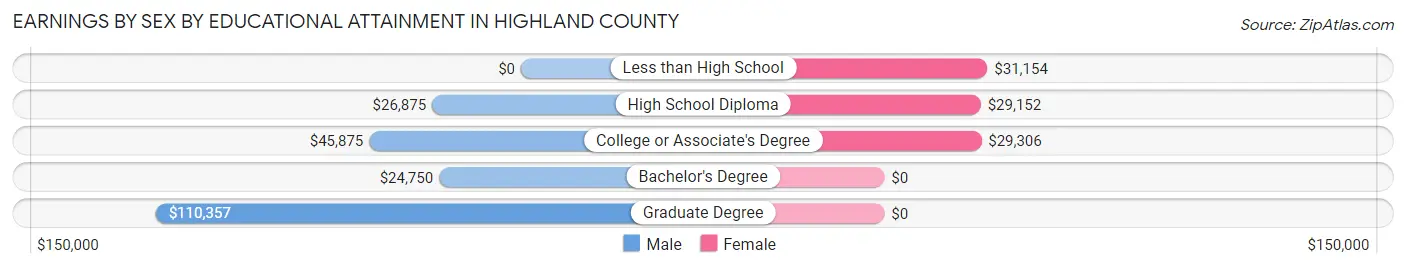
| Educational Attainment | Male Income | Female Income |
| Less than High School | - | - |
| High School Diploma | $26,875 | $29,152 |
| College or Associate's Degree | $45,875 | $29,306 |
| Bachelor's Degree | $24,750 | $0 |
| Graduate Degree | $110,357 | $0 |
| Total | $38,194 | $29,932 |
Family Income in Highland County
Family Income Brackets in Highland County
According to the Highland County family income data, there are 212 families falling into the $50,000 to $74,999 income range, which is the most common income bracket and makes up 31.1% of all families.
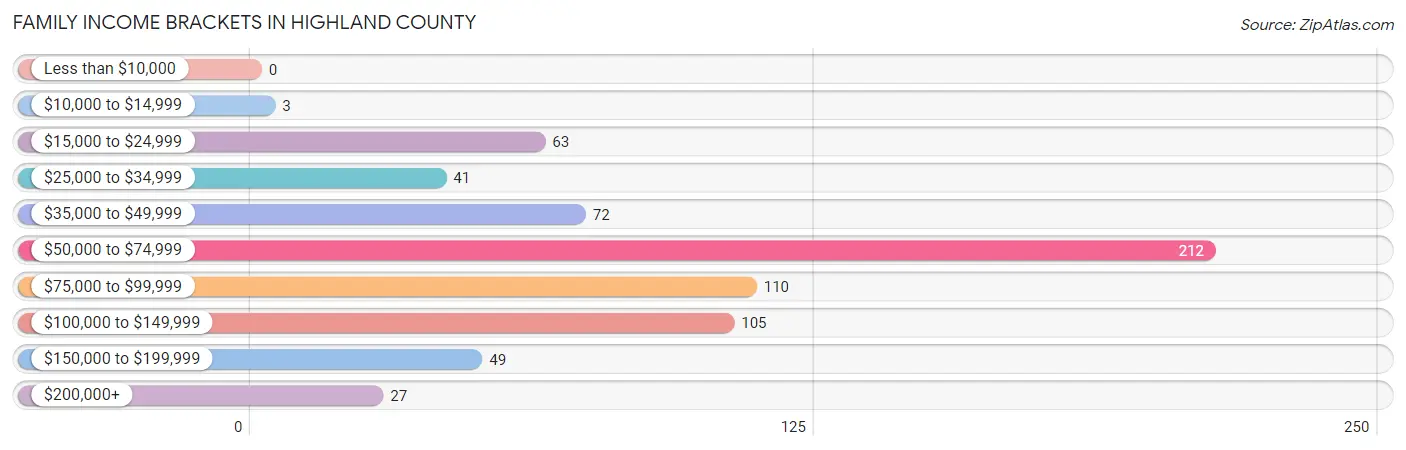
| Income Bracket | # Families | % Families |
| Less than $10,000 | 0 | 0.0% |
| $10,000 to $14,999 | 3 | 0.4% |
| $15,000 to $24,999 | 63 | 9.2% |
| $25,000 to $34,999 | 41 | 6.0% |
| $35,000 to $49,999 | 72 | 10.6% |
| $50,000 to $74,999 | 212 | 31.1% |
| $75,000 to $99,999 | 110 | 16.1% |
| $100,000 to $149,999 | 105 | 15.4% |
| $150,000 to $199,999 | 49 | 7.2% |
| $200,000+ | 27 | 4.0% |
Family Income by Famaliy Size in Highland County
2-person families (481 | 70.5%) account for the highest median family income in Highland County with $68,450 per family, while 2-person families (481 | 70.5%) have the highest median income of $34,225 per family member.
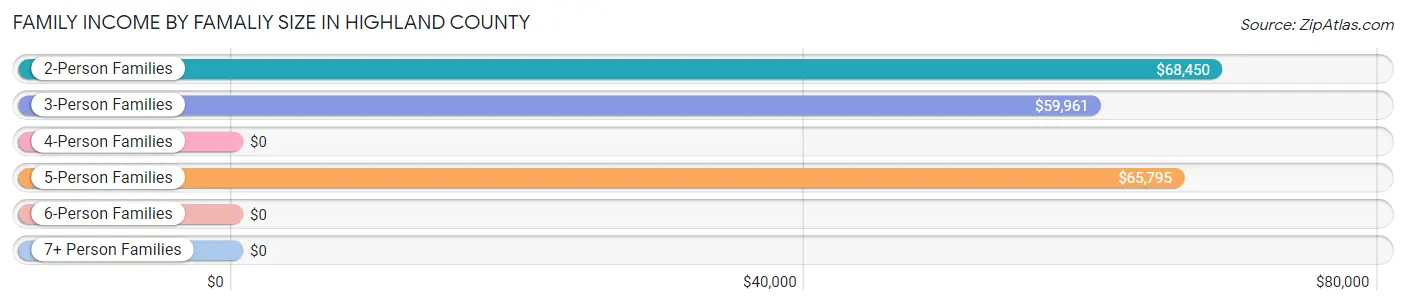
| Income Bracket | # Families | Median Income |
| 2-Person Families | 481 (70.5%) | $68,450 |
| 3-Person Families | 103 (15.1%) | $59,961 |
| 4-Person Families | 69 (10.1%) | $0 |
| 5-Person Families | 29 (4.3%) | $65,795 |
| 6-Person Families | 0 (0.0%) | $0 |
| 7+ Person Families | 0 (0.0%) | $0 |
| Total | 682 (100.0%) | $67,931 |
Family Income by Number of Earners in Highland County
The median family income in Highland County is $67,931, with families comprising 3+ earners (14) having the highest median family income of $116,786, while families with no earners (214) have the lowest median family income of $57,000, accounting for 2.1% and 31.4% of families, respectively.
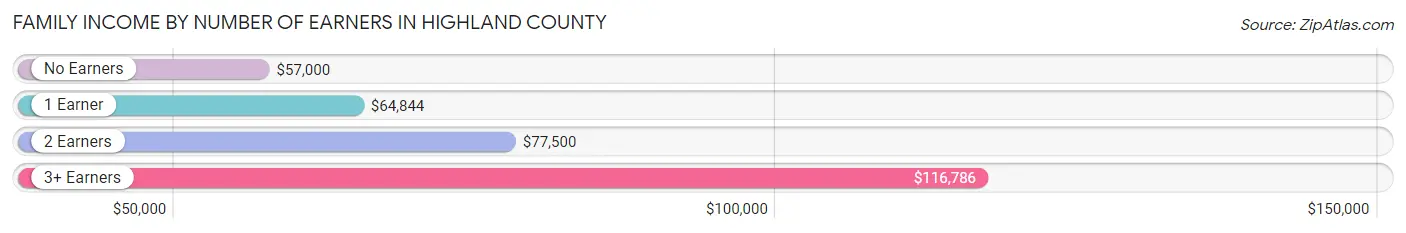
| Number of Earners | # Families | Median Income |
| No Earners | 214 (31.4%) | $57,000 |
| 1 Earner | 188 (27.6%) | $64,844 |
| 2 Earners | 266 (39.0%) | $77,500 |
| 3+ Earners | 14 (2.1%) | $116,786 |
| Total | 682 (100.0%) | $67,931 |
Household Income in Highland County
Household Income Brackets in Highland County
With 258 households falling in the category, the $50,000 to $74,999 income range is the most frequent in Highland County, accounting for 25.4% of all households. In contrast, only 16 households (1.6%) fall into the less than $10,000 income bracket, making it the least populous group.
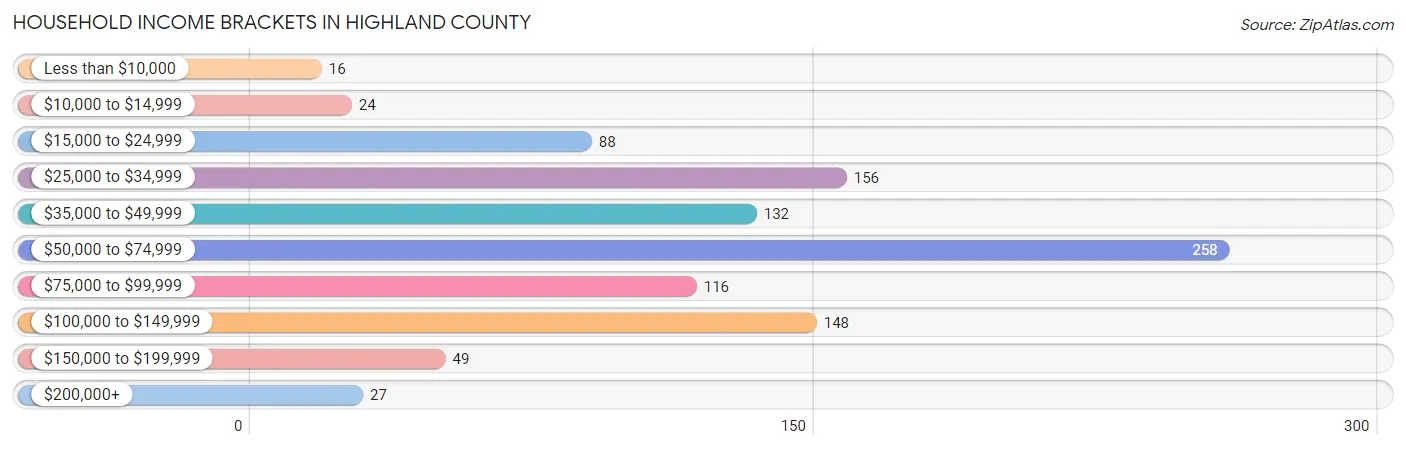
| Income Bracket | # Households | % Households |
| Less than $10,000 | 16 | 1.6% |
| $10,000 to $14,999 | 24 | 2.4% |
| $15,000 to $24,999 | 88 | 8.7% |
| $25,000 to $34,999 | 156 | 15.4% |
| $35,000 to $49,999 | 132 | 13.0% |
| $50,000 to $74,999 | 258 | 25.4% |
| $75,000 to $99,999 | 116 | 11.4% |
| $100,000 to $149,999 | 148 | 14.6% |
| $150,000 to $199,999 | 49 | 4.8% |
| $200,000+ | 27 | 2.7% |
Household Income by Householder Age in Highland County
The median household income in Highland County is $57,070, with the highest median household income of $68,984 found in the 45 to 64 years age bracket for the primary householder. A total of 383 households (37.8%) fall into this category. Meanwhile, the 15 to 24 years age bracket for the primary householder has the lowest median household income of $0, with 6 households (0.6%) in this group.

| Income Bracket | # Households | Median Income |
| 15 to 24 Years | 6 (0.6%) | $0 |
| 25 to 44 Years | 144 (14.2%) | $62,500 |
| 45 to 64 Years | 383 (37.8%) | $68,984 |
| 65+ Years | 481 (47.4%) | $55,215 |
| Total | 1,014 (100.0%) | $57,070 |
Poverty in Highland County
Income Below Poverty by Sex and Age in Highland County
With 14.2% poverty level for males and 6.9% for females among the residents of Highland County, 18 to 24 year old males and under 5 year old females are the most vulnerable to poverty, with 50 males (72.5%) and 12 females (42.9%) in their respective age groups living below the poverty level.
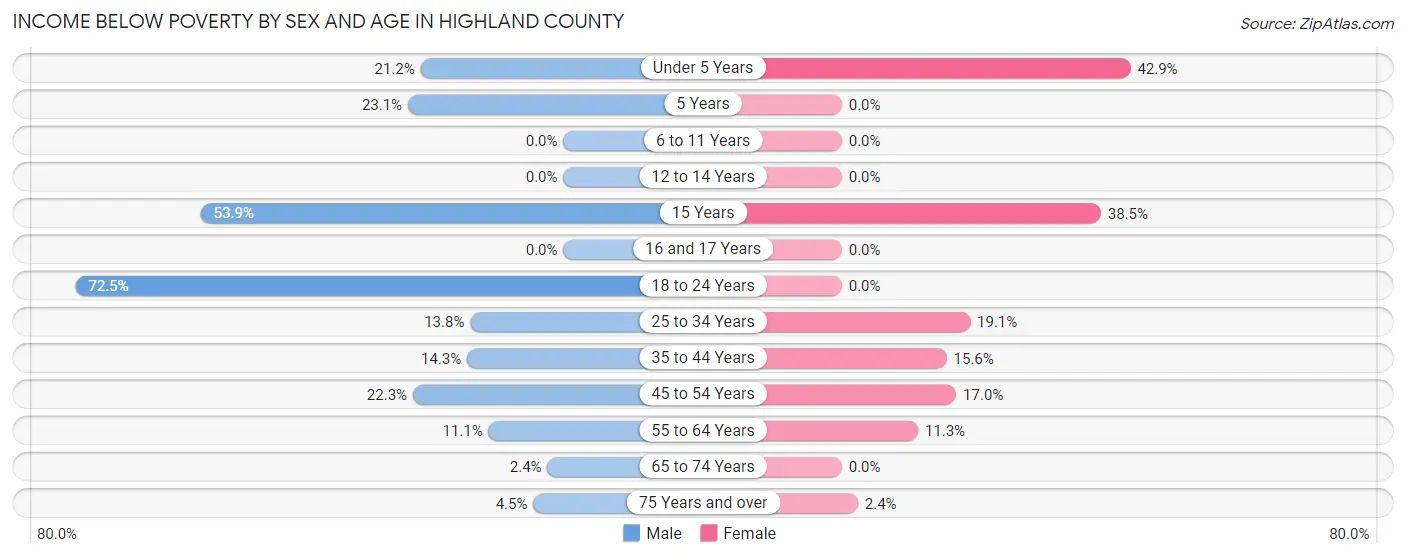
| Age Bracket | Male | Female |
| Under 5 Years | 7 (21.2%) | 12 (42.9%) |
| 5 Years | 3 (23.1%) | 0 (0.0%) |
| 6 to 11 Years | 0 (0.0%) | 0 (0.0%) |
| 12 to 14 Years | 0 (0.0%) | 0 (0.0%) |
| 15 Years | 7 (53.8%) | 5 (38.5%) |
| 16 and 17 Years | 0 (0.0%) | 0 (0.0%) |
| 18 to 24 Years | 50 (72.5%) | 0 (0.0%) |
| 25 to 34 Years | 13 (13.8%) | 12 (19.1%) |
| 35 to 44 Years | 12 (14.3%) | 7 (15.6%) |
| 45 to 54 Years | 21 (22.3%) | 18 (17.0%) |
| 55 to 64 Years | 20 (11.1%) | 25 (11.3%) |
| 65 to 74 Years | 6 (2.4%) | 0 (0.0%) |
| 75 Years and over | 7 (4.5%) | 5 (2.4%) |
| Total | 146 (14.2%) | 84 (6.9%) |
Income Above Poverty by Sex and Age in Highland County
According to the poverty statistics in Highland County, males aged 6 to 11 years and females aged 5 years are the age groups that are most secure financially, with 100.0% of males and 100.0% of females in these age groups living above the poverty line.
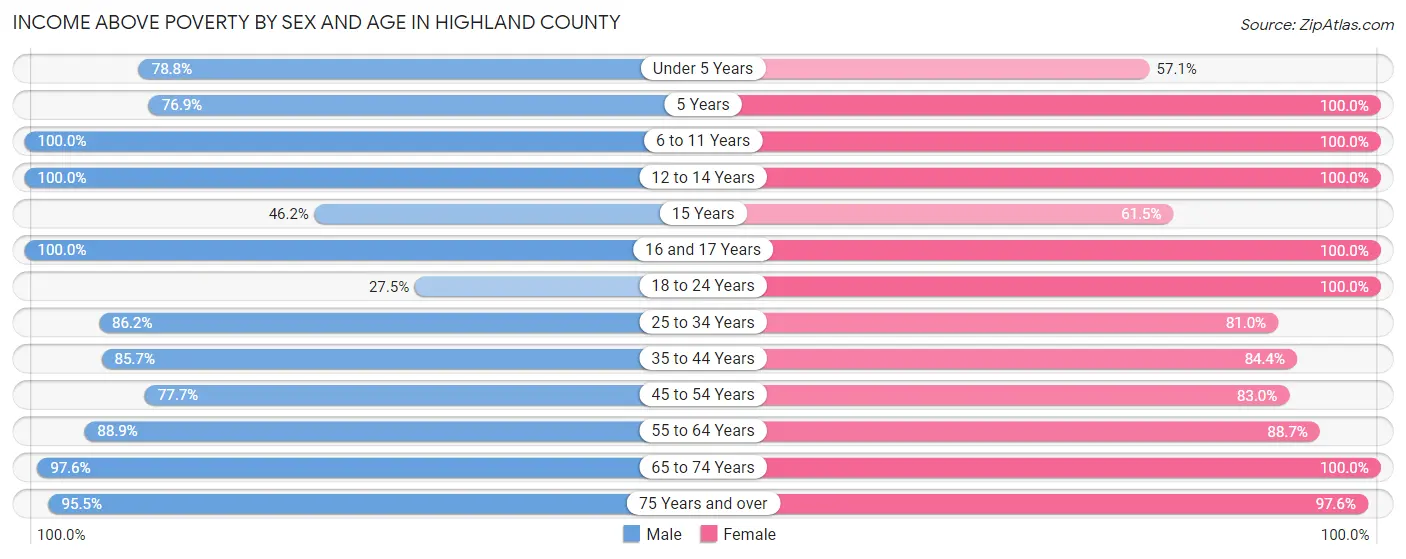
| Age Bracket | Male | Female |
| Under 5 Years | 26 (78.8%) | 16 (57.1%) |
| 5 Years | 10 (76.9%) | 17 (100.0%) |
| 6 to 11 Years | 28 (100.0%) | 79 (100.0%) |
| 12 to 14 Years | 6 (100.0%) | 30 (100.0%) |
| 15 Years | 6 (46.2%) | 8 (61.5%) |
| 16 and 17 Years | 5 (100.0%) | 19 (100.0%) |
| 18 to 24 Years | 19 (27.5%) | 174 (100.0%) |
| 25 to 34 Years | 81 (86.2%) | 51 (80.9%) |
| 35 to 44 Years | 72 (85.7%) | 38 (84.4%) |
| 45 to 54 Years | 73 (77.7%) | 88 (83.0%) |
| 55 to 64 Years | 160 (88.9%) | 196 (88.7%) |
| 65 to 74 Years | 248 (97.6%) | 208 (100.0%) |
| 75 Years and over | 150 (95.5%) | 205 (97.6%) |
| Total | 884 (85.8%) | 1,129 (93.1%) |
Income Below Poverty Among Married-Couple Families in Highland County
The poverty statistics for married-couple families in Highland County show that 4.2% or 25 of the total 591 families live below the poverty line. Families with 3 or 4 children have the highest poverty rate of 18.2%, comprising of 4 families. On the other hand, families with no children have the lowest poverty rate of 2.8%, which includes 13 families.
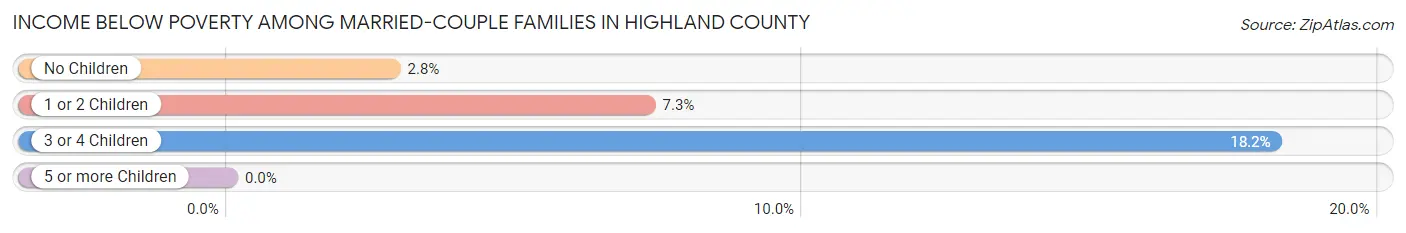
| Children | Above Poverty | Below Poverty |
| No Children | 446 (97.2%) | 13 (2.8%) |
| 1 or 2 Children | 102 (92.7%) | 8 (7.3%) |
| 3 or 4 Children | 18 (81.8%) | 4 (18.2%) |
| 5 or more Children | 0 (0.0%) | 0 (0.0%) |
| Total | 566 (95.8%) | 25 (4.2%) |
Income Below Poverty Among Single-Parent Households in Highland County
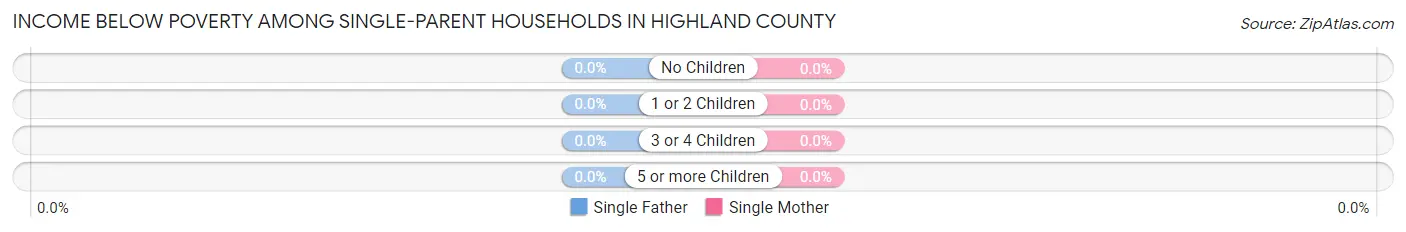
| Children | Single Father | Single Mother |
| No Children | 0 (0.0%) | 0 (0.0%) |
| 1 or 2 Children | 0 (0.0%) | 0 (0.0%) |
| 3 or 4 Children | 0 (0.0%) | 0 (0.0%) |
| 5 or more Children | 0 (0.0%) | 0 (0.0%) |
| Total | 0 (0.0%) | 0 (0.0%) |
Income Below Poverty Among Married-Couple vs Single-Parent Households in Highland County
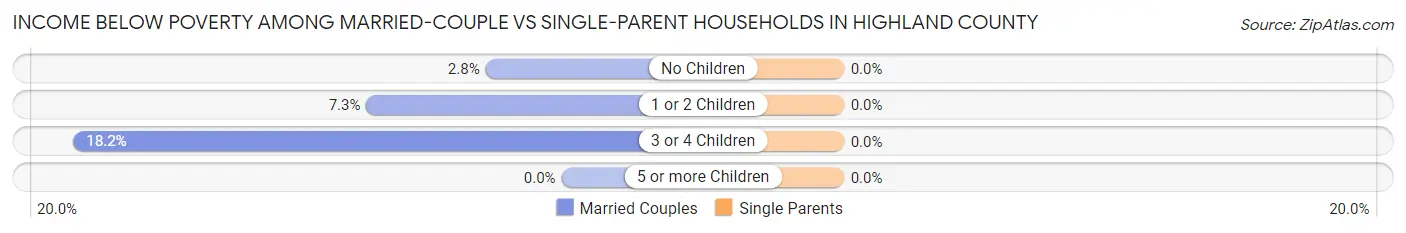
| Children | Married-Couple Families | Single-Parent Households |
| No Children | 13 (2.8%) | 0 (0.0%) |
| 1 or 2 Children | 8 (7.3%) | 0 (0.0%) |
| 3 or 4 Children | 4 (18.2%) | 0 (0.0%) |
| 5 or more Children | 0 (0.0%) | 0 (0.0%) |
| Total | 25 (4.2%) | 0 (0.0%) |
Race in Highland County
The most populous races in Highland County are White / Caucasian (2,120 | 94.4%), Asian (69 | 3.1%), and Two or more Races (58 | 2.6%).
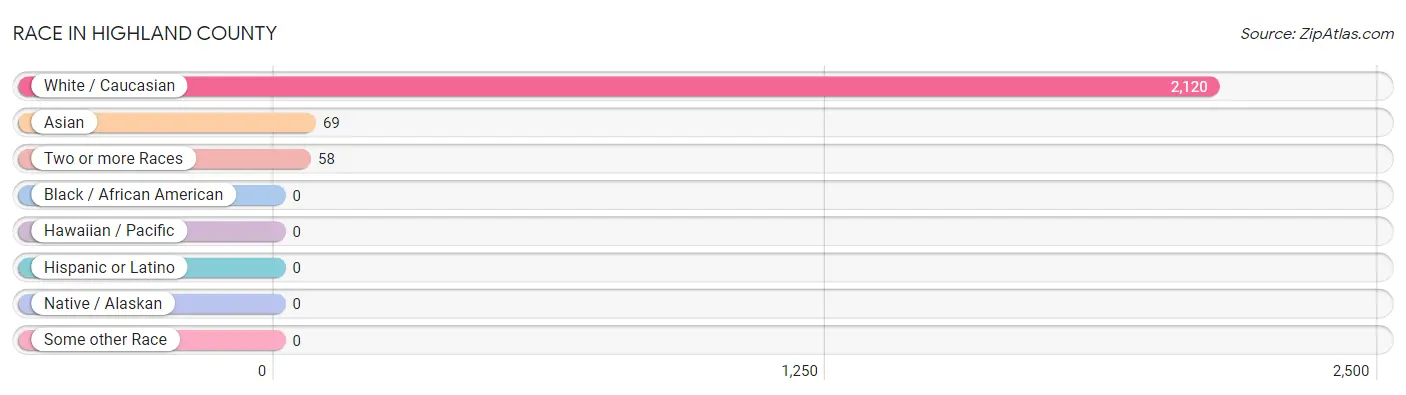
| Race | # Population | % Population |
| Asian | 69 | 3.1% |
| Black / African American | 0 | 0.0% |
| Hawaiian / Pacific | 0 | 0.0% |
| Hispanic or Latino | 0 | 0.0% |
| Native / Alaskan | 0 | 0.0% |
| White / Caucasian | 2,120 | 94.4% |
| Two or more Races | 58 | 2.6% |
| Some other Race | 0 | 0.0% |
| Total | 2,247 | 100.0% |
Ancestry in Highland County
The most populous ancestries reported in Highland County are English (502 | 22.3%), German (494 | 22.0%), Irish (230 | 10.2%), American (216 | 9.6%), and Korean (63 | 2.8%), together accounting for 67.0% of all Highland County residents.
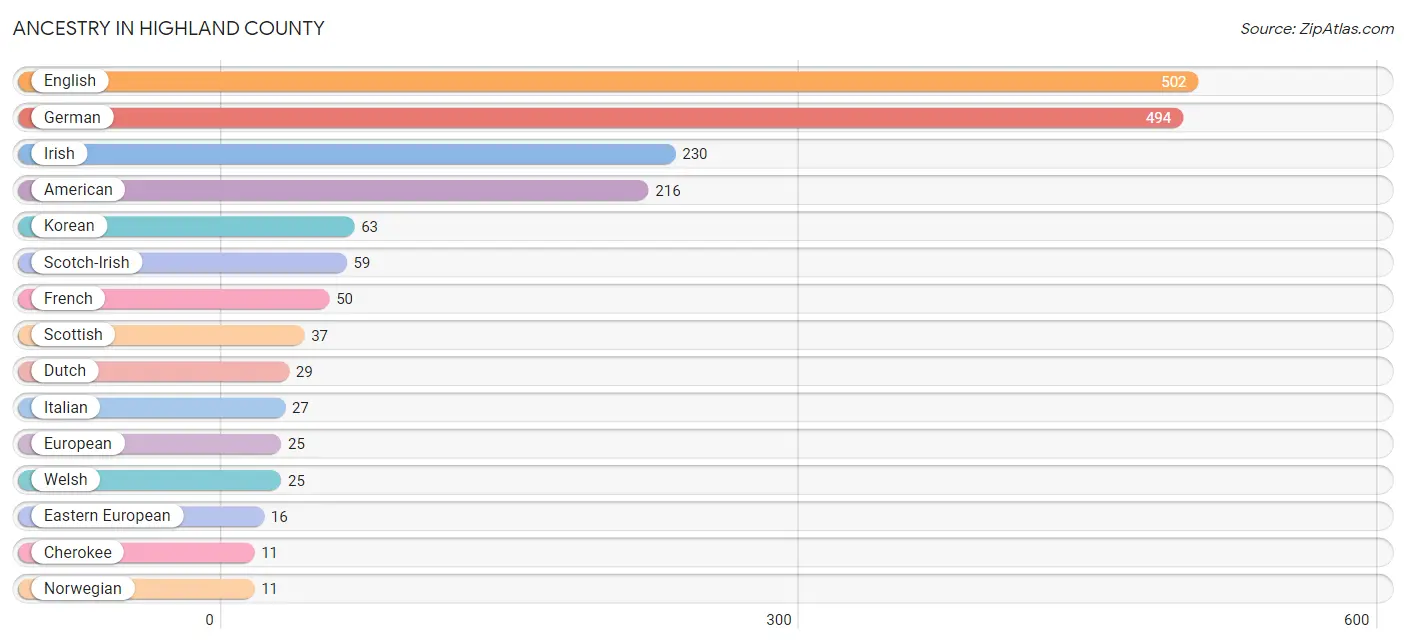
| Ancestry | # Population | % Population |
| American | 216 | 9.6% |
| British | 8 | 0.4% |
| Burmese | 6 | 0.3% |
| Cherokee | 11 | 0.5% |
| Chickasaw | 2 | 0.1% |
| Czech | 8 | 0.4% |
| Czechoslovakian | 7 | 0.3% |
| Dutch | 29 | 1.3% |
| Eastern European | 16 | 0.7% |
| English | 502 | 22.3% |
| European | 25 | 1.1% |
| French | 50 | 2.2% |
| German | 494 | 22.0% |
| Irish | 230 | 10.2% |
| Italian | 27 | 1.2% |
| Korean | 63 | 2.8% |
| Northern European | 10 | 0.4% |
| Norwegian | 11 | 0.5% |
| Polish | 9 | 0.4% |
| Russian | 5 | 0.2% |
| Scandinavian | 9 | 0.4% |
| Scotch-Irish | 59 | 2.6% |
| Scottish | 37 | 1.7% |
| Slovak | 10 | 0.4% |
| Swedish | 2 | 0.1% |
| Swiss | 2 | 0.1% |
| Welsh | 25 | 1.1% | View All 27 Rows |
Immigrants in Highland County
The most numerous immigrant groups reported in Highland County came from Asia (14 | 0.6%), Philippines (13 | 0.6%), South Eastern Asia (13 | 0.6%), Europe (12 | 0.5%), and England (7 | 0.3%), together accounting for 2.6% of all Highland County residents.
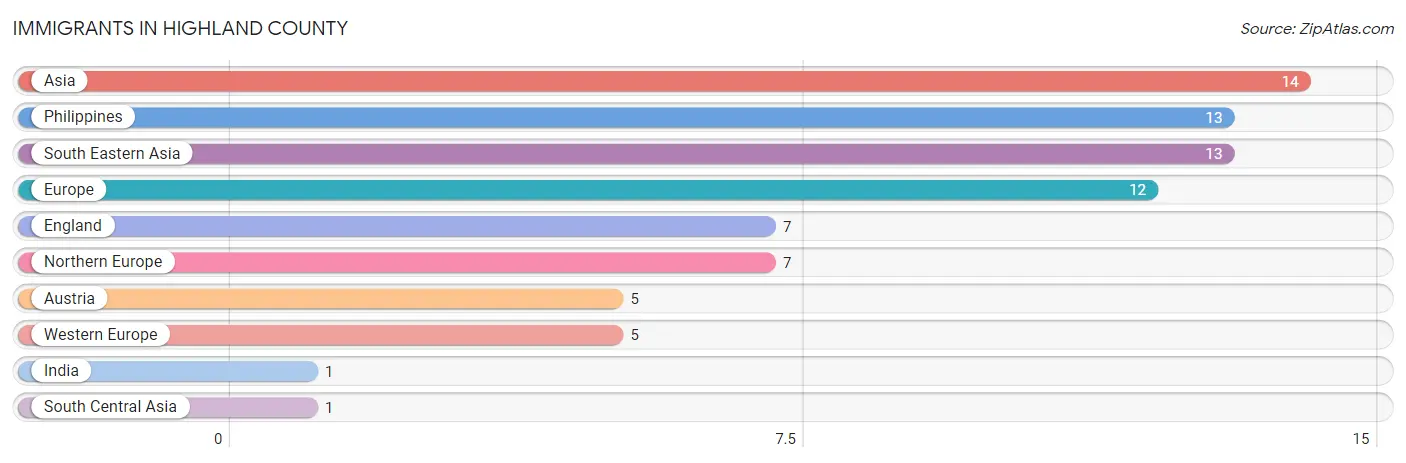
| Immigration Origin | # Population | % Population |
| Asia | 14 | 0.6% |
| Austria | 5 | 0.2% |
| England | 7 | 0.3% |
| Europe | 12 | 0.5% |
| India | 1 | 0.0% |
| Northern Europe | 7 | 0.3% |
| Philippines | 13 | 0.6% |
| South Central Asia | 1 | 0.0% |
| South Eastern Asia | 13 | 0.6% |
| Western Europe | 5 | 0.2% | View All 10 Rows |
Sex and Age in Highland County
Sex and Age in Highland County
The most populous age groups in Highland County are 65 to 69 Years (153 | 14.8%) for men and 20 to 24 Years (172 | 14.2%) for women.
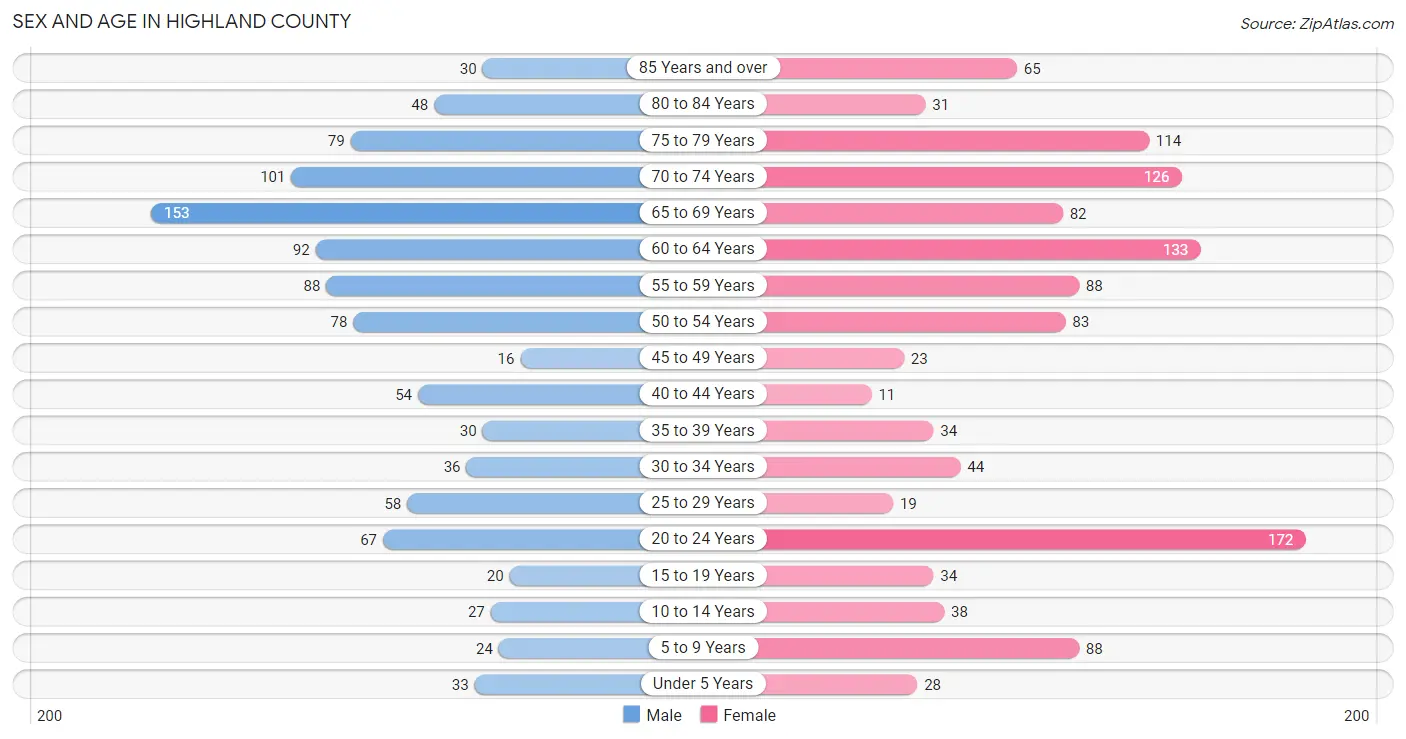
| Age Bracket | Male | Female |
| Under 5 Years | 33 (3.2%) | 28 (2.3%) |
| 5 to 9 Years | 24 (2.3%) | 88 (7.2%) |
| 10 to 14 Years | 27 (2.6%) | 38 (3.1%) |
| 15 to 19 Years | 20 (1.9%) | 34 (2.8%) |
| 20 to 24 Years | 67 (6.5%) | 172 (14.2%) |
| 25 to 29 Years | 58 (5.6%) | 19 (1.6%) |
| 30 to 34 Years | 36 (3.5%) | 44 (3.6%) |
| 35 to 39 Years | 30 (2.9%) | 34 (2.8%) |
| 40 to 44 Years | 54 (5.2%) | 11 (0.9%) |
| 45 to 49 Years | 16 (1.5%) | 23 (1.9%) |
| 50 to 54 Years | 78 (7.5%) | 83 (6.8%) |
| 55 to 59 Years | 88 (8.5%) | 88 (7.2%) |
| 60 to 64 Years | 92 (8.9%) | 133 (11.0%) |
| 65 to 69 Years | 153 (14.8%) | 82 (6.8%) |
| 70 to 74 Years | 101 (9.8%) | 126 (10.4%) |
| 75 to 79 Years | 79 (7.6%) | 114 (9.4%) |
| 80 to 84 Years | 48 (4.6%) | 31 (2.6%) |
| 85 Years and over | 30 (2.9%) | 65 (5.4%) |
| Total | 1,034 (100.0%) | 1,213 (100.0%) |
Families and Households in Highland County
Median Family Size in Highland County
The median family size in Highland County is 2.49 persons per family, with single female/mother families (79 | 11.6%) accounting for the largest median family size of 2.65 persons per family. On the other hand, single male/father families (12 | 1.8%) represent the smallest median family size with 2.33 persons per family.
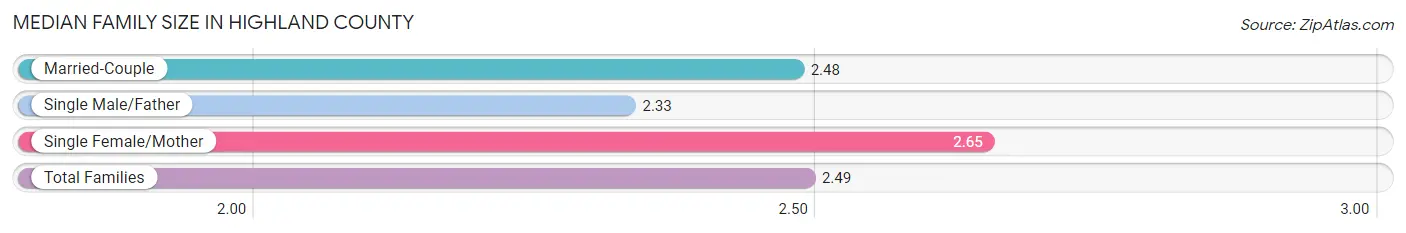
| Family Type | # Families | Family Size |
| Married-Couple | 591 (86.7%) | 2.48 |
| Single Male/Father | 12 (1.8%) | 2.33 |
| Single Female/Mother | 79 (11.6%) | 2.65 |
| Total Families | 682 (100.0%) | 2.49 |
Median Household Size in Highland County
The median household size in Highland County is 2.22 persons per household, with single female/mother households (79 | 7.8%) accounting for the largest median household size of 4.13 persons per household. non-family households (332 | 32.7%) represent the smallest median household size with 1.24 persons per household.
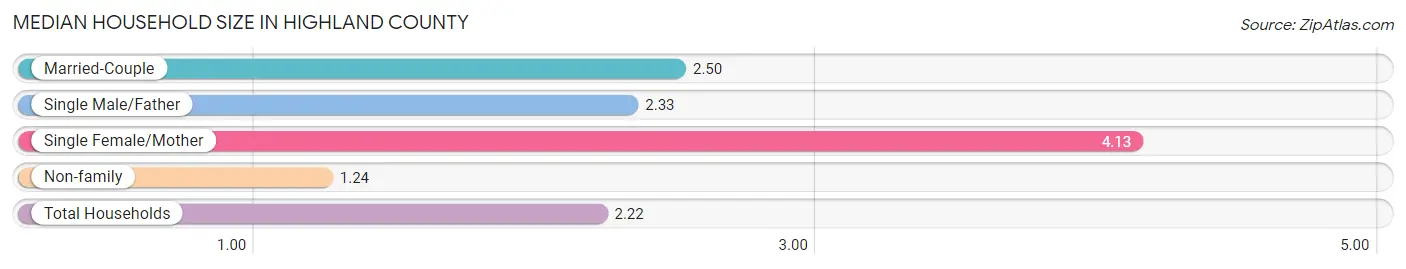
| Household Type | # Households | Household Size |
| Married-Couple | 591 (58.3%) | 2.50 |
| Single Male/Father | 12 (1.2%) | 2.33 |
| Single Female/Mother | 79 (7.8%) | 4.13 |
| Non-family | 332 (32.7%) | 1.24 |
| Total Households | 1,014 (100.0%) | 2.22 |
Household Size by Marriage Status in Highland County
Out of a total of 1,014 households in Highland County, 682 (67.3%) are family households, while 332 (32.7%) are nonfamily households. The most numerous type of family households are 2-person households, comprising 465, and the most common type of nonfamily households are 1-person households, comprising 285.
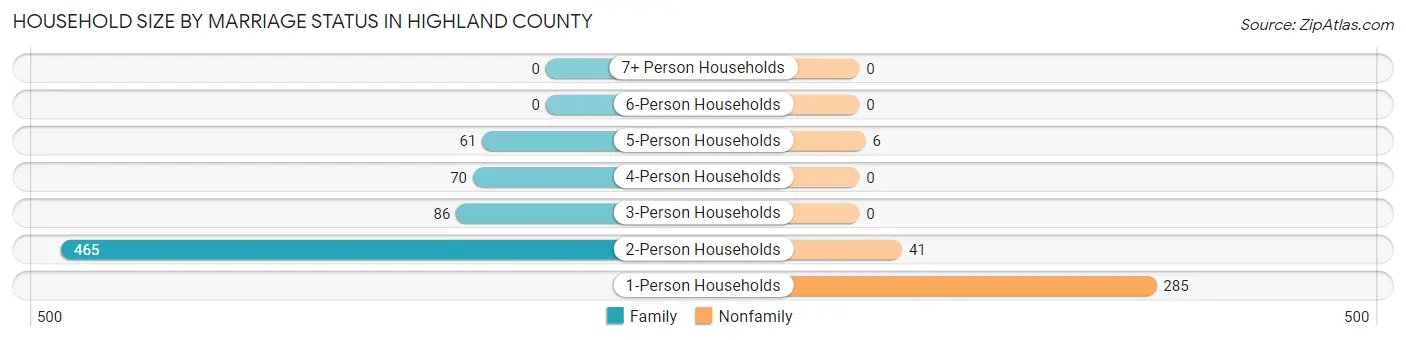
| Household Size | Family Households | Nonfamily Households |
| 1-Person Households | - | 285 (28.1%) |
| 2-Person Households | 465 (45.9%) | 41 (4.0%) |
| 3-Person Households | 86 (8.5%) | 0 (0.0%) |
| 4-Person Households | 70 (6.9%) | 0 (0.0%) |
| 5-Person Households | 61 (6.0%) | 6 (0.6%) |
| 6-Person Households | 0 (0.0%) | 0 (0.0%) |
| 7+ Person Households | 0 (0.0%) | 0 (0.0%) |
| Total | 682 (67.3%) | 332 (32.7%) |
Female Fertility in Highland County
Fertility by Age in Highland County
Average fertility rate in Highland County is 191.0 births per 1,000 women. Women in the age bracket of 20 to 34 years have the highest fertility rate with 306.0 births per 1,000 women. Women in the age bracket of 20 to 34 years acount for 100.0% of all women with births.
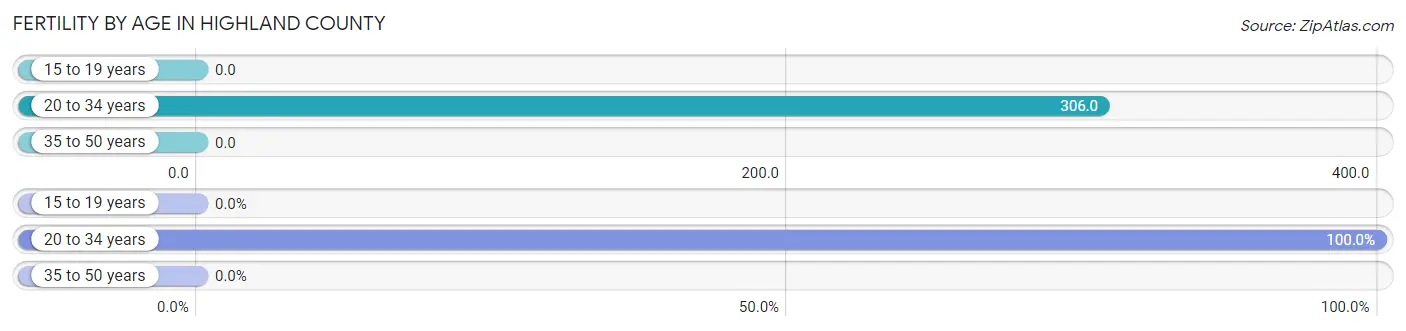
| Age Bracket | Women with Births | Births / 1,000 Women |
| 15 to 19 years | 0 (0.0%) | 0.0 |
| 20 to 34 years | 72 (100.0%) | 306.0 |
| 35 to 50 years | 0 (0.0%) | 0.0 |
| Total | 72 (100.0%) | 191.0 |
Fertility by Age by Marriage Status in Highland County
13.9% of women with births (72) in Highland County are married. The highest percentage of unmarried women with births falls into 20 to 34 years age bracket with 86.1% of them unmarried at the time of birth, while the lowest percentage of unmarried women with births belong to 20 to 34 years age bracket with 86.1% of them unmarried.
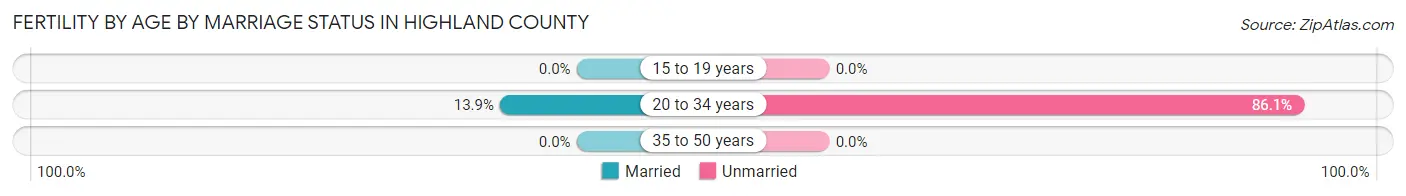
| Age Bracket | Married | Unmarried |
| 15 to 19 years | 0 (0.0%) | 0 (0.0%) |
| 20 to 34 years | 10 (13.9%) | 62 (86.1%) |
| 35 to 50 years | 0 (0.0%) | 0 (0.0%) |
| Total | 10 (13.9%) | 62 (86.1%) |
Fertility by Education in Highland County
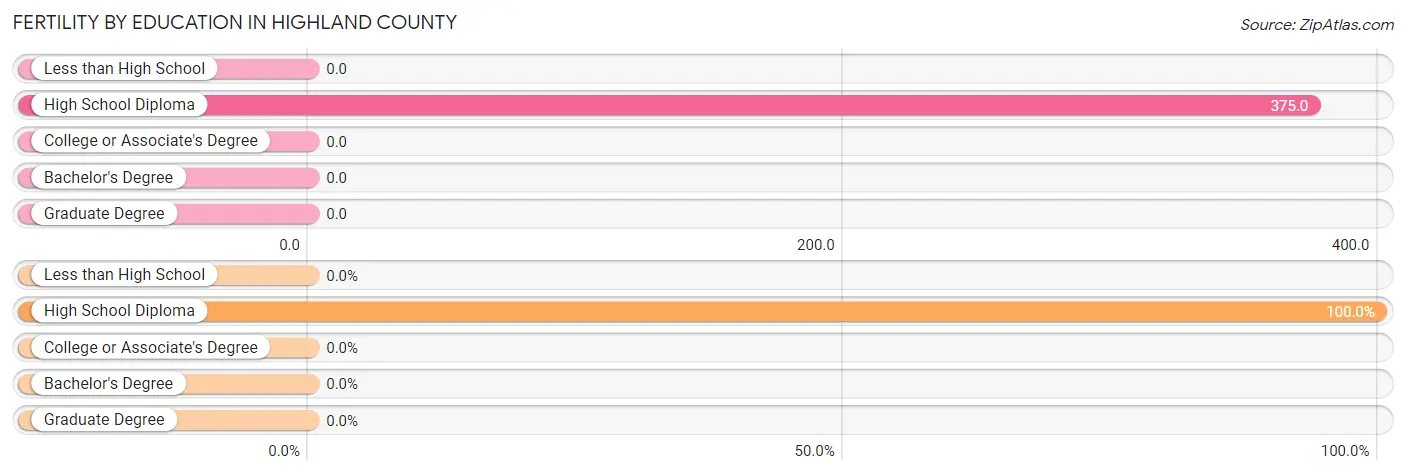
| Educational Attainment | Women with Births | Births / 1,000 Women |
| Less than High School | 0 (0.0%) | 0.0 |
| High School Diploma | 72 (100.0%) | 375.0 |
| College or Associate's Degree | 0 (0.0%) | 0.0 |
| Bachelor's Degree | 0 (0.0%) | 0.0 |
| Graduate Degree | 0 (0.0%) | 0.0 |
| Total | 72 (100.0%) | 191.0 |
Fertility by Education by Marriage Status in Highland County
86.1% of women with births in Highland County are unmarried. Women with the educational attainment of high school diploma are most likely to be married with 13.9% of them married at childbirth, while women with the educational attainment of high school diploma are least likely to be married with 86.1% of them unmarried at childbirth.
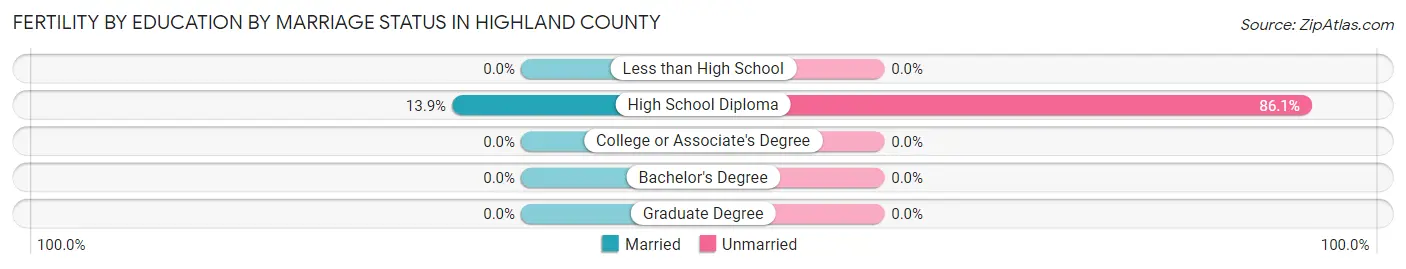
| Educational Attainment | Married | Unmarried |
| Less than High School | 0 (0.0%) | 0 (0.0%) |
| High School Diploma | 10 (13.9%) | 62 (86.1%) |
| College or Associate's Degree | 0 (0.0%) | 0 (0.0%) |
| Bachelor's Degree | 0 (0.0%) | 0 (0.0%) |
| Graduate Degree | 0 (0.0%) | 0 (0.0%) |
| Total | 10 (13.9%) | 62 (86.1%) |
Employment Characteristics in Highland County
Employment by Class of Employer in Highland County
Among the 805 employed individuals in Highland County, private company employees (330 | 41.0%), state government employees (136 | 16.9%), and self-employed (not incorporated) (116 | 14.4%) make up the most common classes of employment.
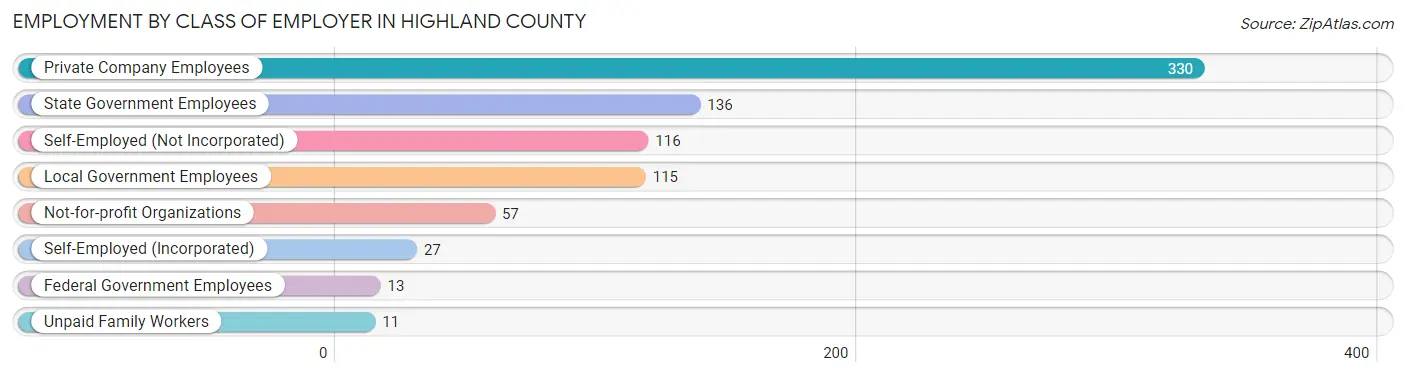
| Employer Class | # Employees | % Employees |
| Private Company Employees | 330 | 41.0% |
| Self-Employed (Incorporated) | 27 | 3.4% |
| Self-Employed (Not Incorporated) | 116 | 14.4% |
| Not-for-profit Organizations | 57 | 7.1% |
| Local Government Employees | 115 | 14.3% |
| State Government Employees | 136 | 16.9% |
| Federal Government Employees | 13 | 1.6% |
| Unpaid Family Workers | 11 | 1.4% |
| Total | 805 | 100.0% |
Employment Status by Age in Highland County
According to the labor force statistics for Highland County, out of the total population over 16 years of age (1,983), 47.8% or 948 individuals are in the labor force, with 14.7% or 139 of them unemployed. The age group with the highest labor force participation rate is 45 to 54 years, with 92.5% or 185 individuals in the labor force. Within the labor force, the 20 to 24 years age range has the highest percentage of unemployed individuals, with 64.0% or 112 of them being unemployed.
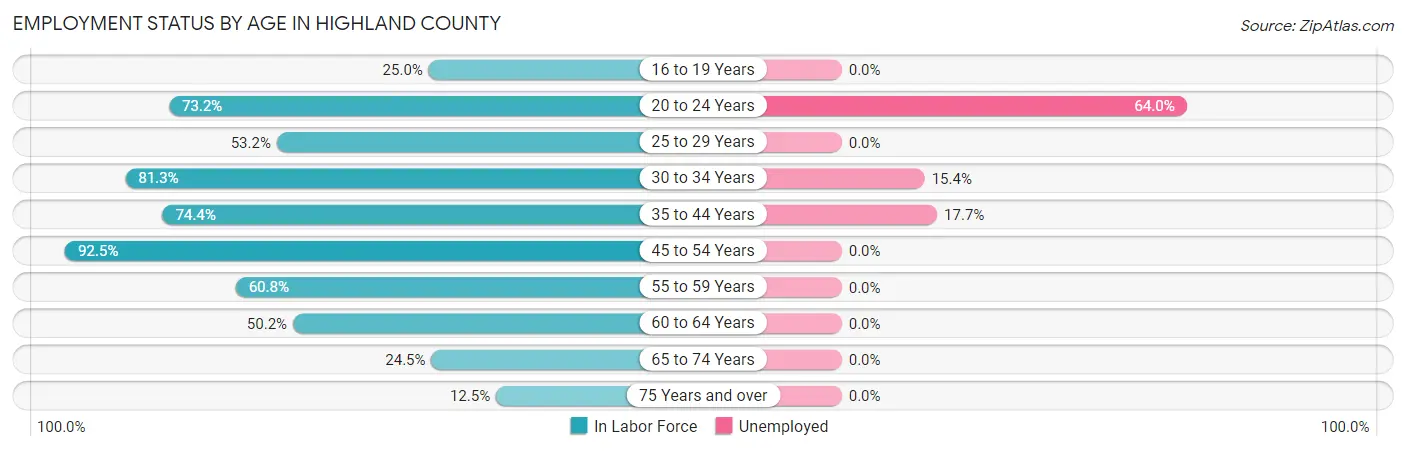
| Age Bracket | In Labor Force | Unemployed |
| 16 to 19 Years | 7 (25.0%) | 0 (0.0%) |
| 20 to 24 Years | 175 (73.2%) | 112 (64.0%) |
| 25 to 29 Years | 41 (53.2%) | 0 (0.0%) |
| 30 to 34 Years | 65 (81.3%) | 10 (15.4%) |
| 35 to 44 Years | 96 (74.4%) | 17 (17.7%) |
| 45 to 54 Years | 185 (92.5%) | 0 (0.0%) |
| 55 to 59 Years | 107 (60.8%) | 0 (0.0%) |
| 60 to 64 Years | 113 (50.2%) | 0 (0.0%) |
| 65 to 74 Years | 113 (24.5%) | 0 (0.0%) |
| 75 Years and over | 46 (12.5%) | 0 (0.0%) |
| Total | 948 (47.8%) | 139 (14.7%) |
Employment Status by Educational Attainment in Highland County
According to labor force statistics for Highland County, 68.4% of individuals (607) out of the total population between 25 and 64 years of age (887) are in the labor force, with 4.4% or 27 of them being unemployed. The group with the highest labor force participation rate are those with the educational attainment of college / associate degree, with 88.9% or 185 individuals in the labor force. Within the labor force, individuals with high school diploma education have the highest percentage of unemployment, with 10.7% or 27 of them being unemployed.
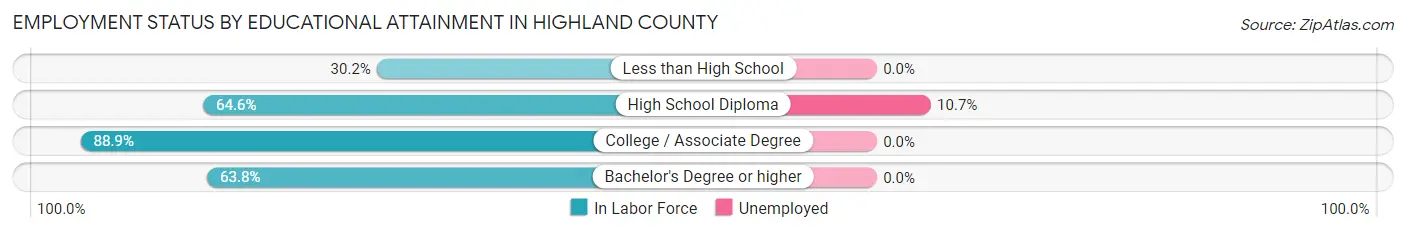
| Educational Attainment | In Labor Force | Unemployed |
| Less than High School | 13 (30.2%) | 0 (0.0%) |
| High School Diploma | 252 (64.6%) | 42 (10.7%) |
| College / Associate Degree | 185 (88.9%) | 0 (0.0%) |
| Bachelor's Degree or higher | 157 (63.8%) | 0 (0.0%) |
| Total | 607 (68.4%) | 39 (4.4%) |
Employment Occupations by Sex in Highland County
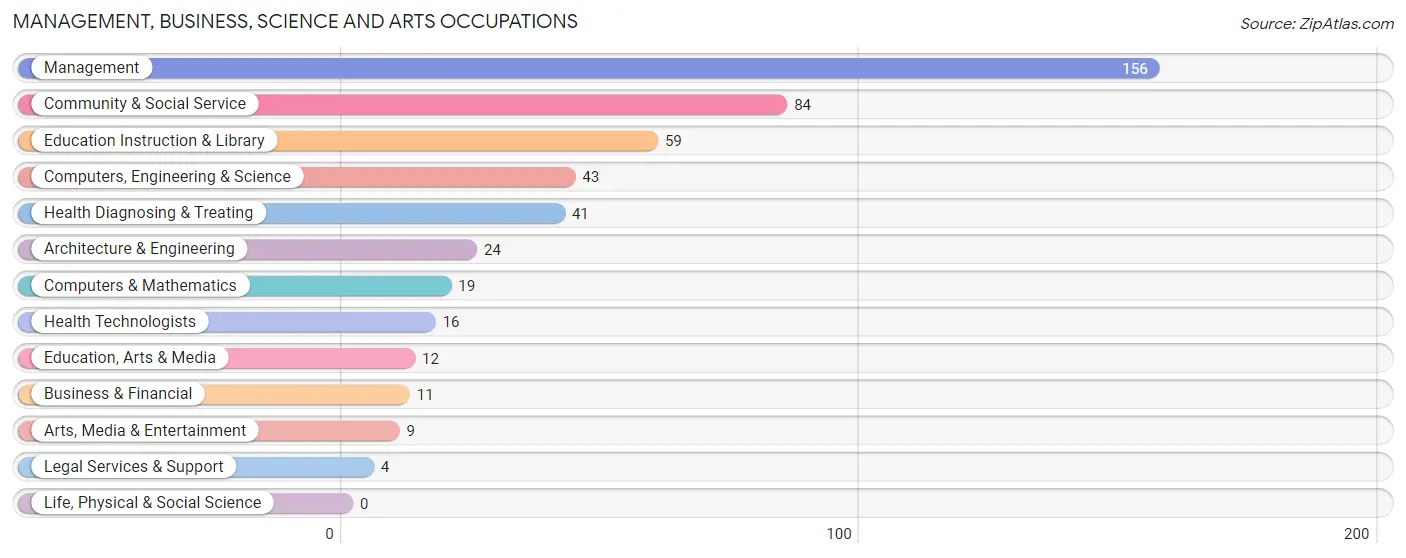
Management, Business, Science and Arts Occupations
The most common Management, Business, Science and Arts occupations in Highland County are Management (156 | 19.3%), Community & Social Service (84 | 10.4%), Education Instruction & Library (59 | 7.3%), Computers, Engineering & Science (43 | 5.3%), and Health Diagnosing & Treating (41 | 5.1%).
Management, Business, Science and Arts Occupations by Sex
Within the Management, Business, Science and Arts occupations in Highland County, the most male-oriented occupations are Architecture & Engineering (100.0%), Legal Services & Support (100.0%), and Arts, Media & Entertainment (100.0%), while the most female-oriented occupations are Computers & Mathematics (100.0%), Health Diagnosing & Treating (87.8%), and Education Instruction & Library (86.4%).
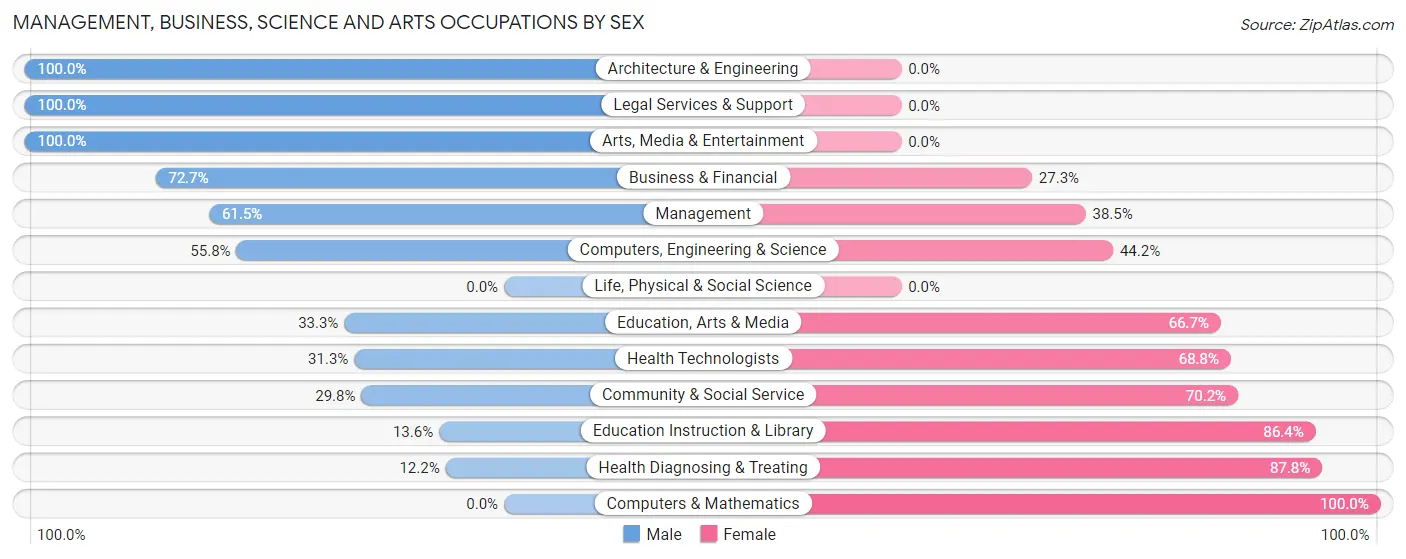
| Occupation | Male | Female |
| Management | 96 (61.5%) | 60 (38.5%) |
| Business & Financial | 8 (72.7%) | 3 (27.3%) |
| Computers, Engineering & Science | 24 (55.8%) | 19 (44.2%) |
| Computers & Mathematics | 0 (0.0%) | 19 (100.0%) |
| Architecture & Engineering | 24 (100.0%) | 0 (0.0%) |
| Life, Physical & Social Science | 0 (0.0%) | 0 (0.0%) |
| Community & Social Service | 25 (29.8%) | 59 (70.2%) |
| Education, Arts & Media | 4 (33.3%) | 8 (66.7%) |
| Legal Services & Support | 4 (100.0%) | 0 (0.0%) |
| Education Instruction & Library | 8 (13.6%) | 51 (86.4%) |
| Arts, Media & Entertainment | 9 (100.0%) | 0 (0.0%) |
| Health Diagnosing & Treating | 5 (12.2%) | 36 (87.8%) |
| Health Technologists | 5 (31.2%) | 11 (68.8%) |
| Total (Category) | 158 (47.2%) | 177 (52.8%) |
| Total (Overall) | 388 (48.0%) | 421 (52.0%) |
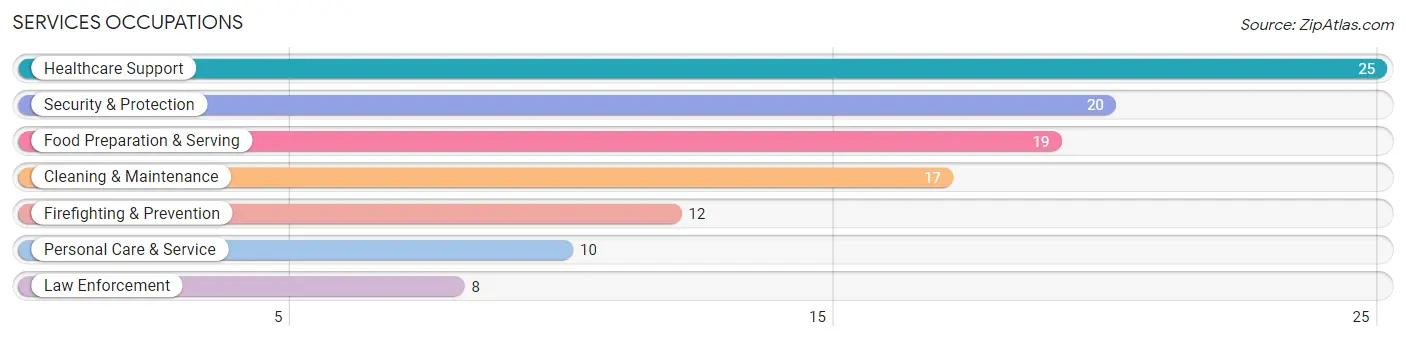
Services Occupations
The most common Services occupations in Highland County are Healthcare Support (25 | 3.1%), Security & Protection (20 | 2.5%), Food Preparation & Serving (19 | 2.4%), Cleaning & Maintenance (17 | 2.1%), and Firefighting & Prevention (12 | 1.5%).
Services Occupations by Sex
Within the Services occupations in Highland County, the most male-oriented occupations are Law Enforcement (100.0%), Cleaning & Maintenance (88.2%), and Security & Protection (70.0%), while the most female-oriented occupations are Healthcare Support (100.0%), Personal Care & Service (100.0%), and Food Preparation & Serving (57.9%).
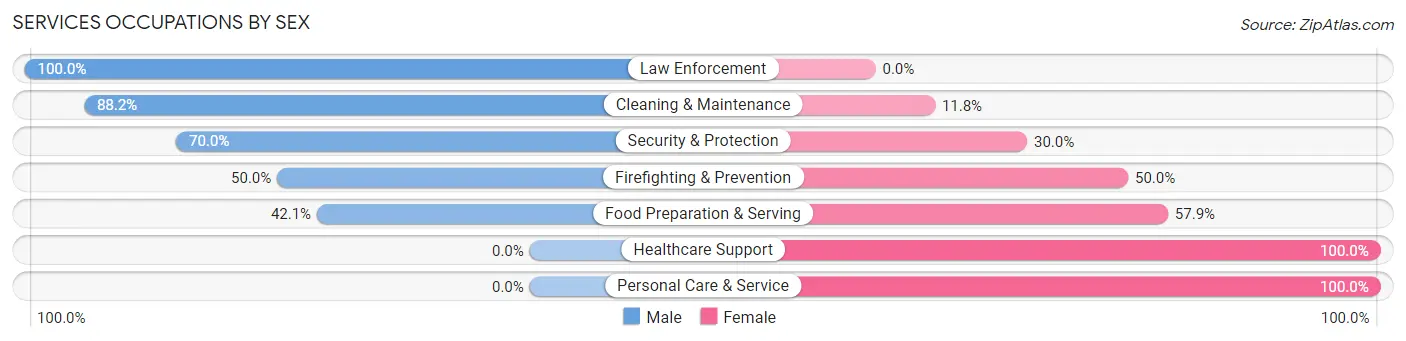
| Occupation | Male | Female |
| Healthcare Support | 0 (0.0%) | 25 (100.0%) |
| Security & Protection | 14 (70.0%) | 6 (30.0%) |
| Firefighting & Prevention | 6 (50.0%) | 6 (50.0%) |
| Law Enforcement | 8 (100.0%) | 0 (0.0%) |
| Food Preparation & Serving | 8 (42.1%) | 11 (57.9%) |
| Cleaning & Maintenance | 15 (88.2%) | 2 (11.8%) |
| Personal Care & Service | 0 (0.0%) | 10 (100.0%) |
| Total (Category) | 37 (40.7%) | 54 (59.3%) |
| Total (Overall) | 388 (48.0%) | 421 (52.0%) |
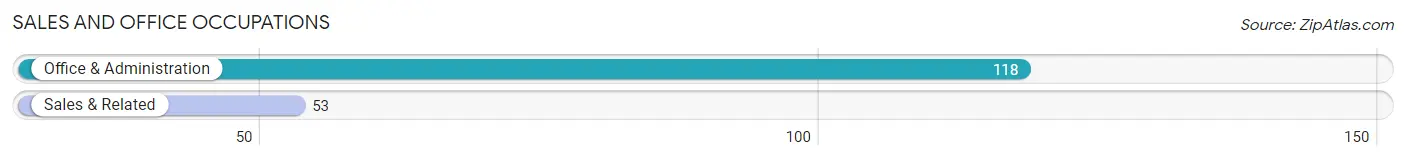
Sales and Office Occupations
The most common Sales and Office occupations in Highland County are Office & Administration (118 | 14.6%), and Sales & Related (53 | 6.6%).
Sales and Office Occupations by Sex
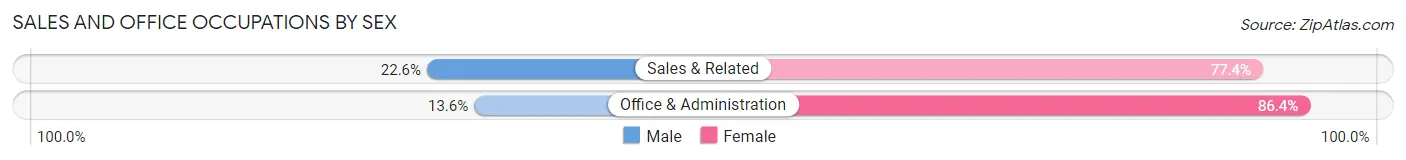
| Occupation | Male | Female |
| Sales & Related | 12 (22.6%) | 41 (77.4%) |
| Office & Administration | 16 (13.6%) | 102 (86.4%) |
| Total (Category) | 28 (16.4%) | 143 (83.6%) |
| Total (Overall) | 388 (48.0%) | 421 (52.0%) |
Natural Resources, Construction and Maintenance Occupations
The most common Natural Resources, Construction and Maintenance occupations in Highland County are Construction & Extraction (72 | 8.9%), Installation, Maintenance & Repair (36 | 4.4%), and Farming, Fishing & Forestry (33 | 4.1%).
Natural Resources, Construction and Maintenance Occupations by Sex
| Occupation | Male | Female |
| Farming, Fishing & Forestry | 14 (42.4%) | 19 (57.6%) |
| Construction & Extraction | 57 (79.2%) | 15 (20.8%) |
| Installation, Maintenance & Repair | 36 (100.0%) | 0 (0.0%) |
| Total (Category) | 107 (75.9%) | 34 (24.1%) |
| Total (Overall) | 388 (48.0%) | 421 (52.0%) |
Production, Transportation and Moving Occupations
The most common Production, Transportation and Moving occupations in Highland County are Production (33 | 4.1%), Transportation (30 | 3.7%), and Material Moving (8 | 1.0%).
Production, Transportation and Moving Occupations by Sex
| Occupation | Male | Female |
| Production | 33 (100.0%) | 0 (0.0%) |
| Transportation | 17 (56.7%) | 13 (43.3%) |
| Material Moving | 8 (100.0%) | 0 (0.0%) |
| Total (Category) | 58 (81.7%) | 13 (18.3%) |
| Total (Overall) | 388 (48.0%) | 421 (52.0%) |
Employment Industries by Sex in Highland County
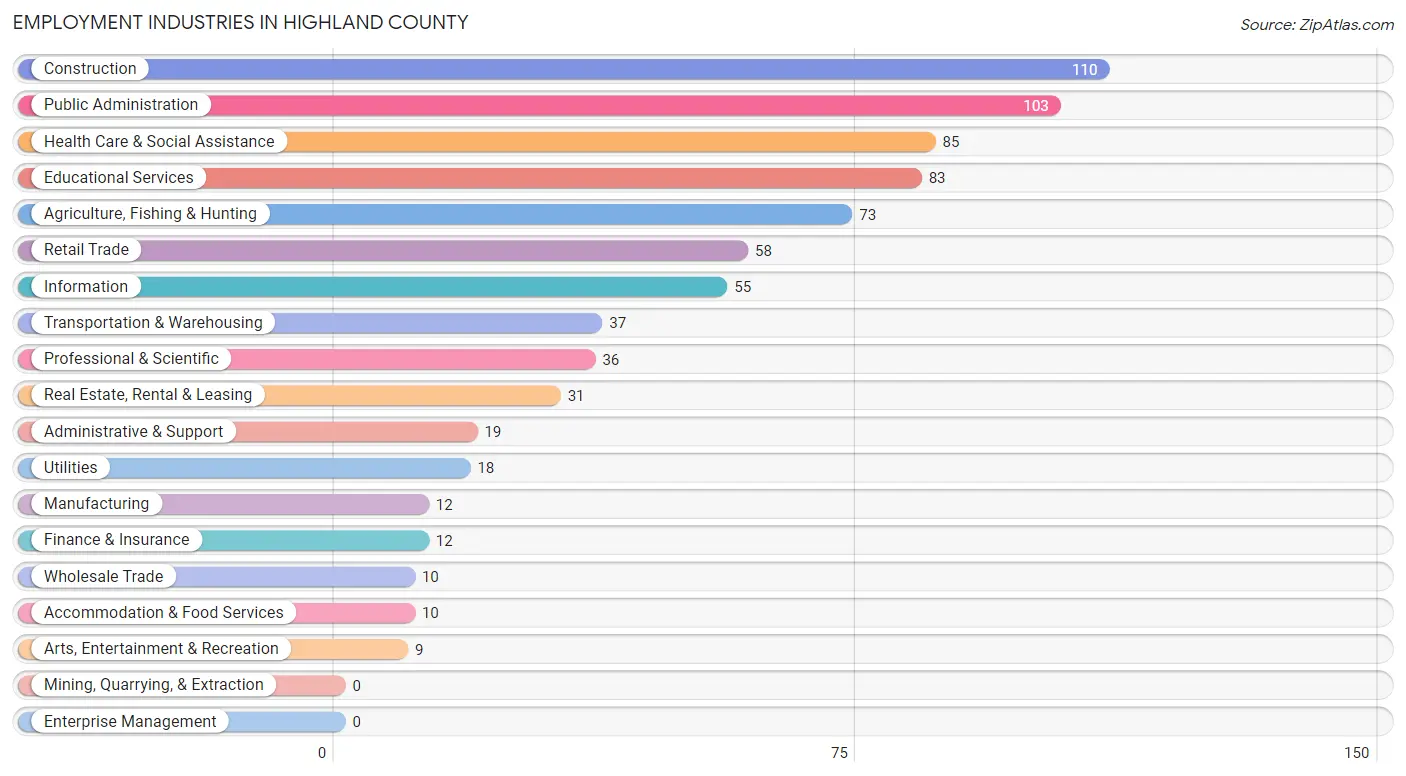
Employment Industries in Highland County
The major employment industries in Highland County include Construction (110 | 13.6%), Public Administration (103 | 12.7%), Health Care & Social Assistance (85 | 10.5%), Educational Services (83 | 10.3%), and Agriculture, Fishing & Hunting (73 | 9.0%).
Employment Industries by Sex in Highland County
The Highland County industries that see more men than women are Manufacturing (100.0%), Wholesale Trade (100.0%), and Administrative & Support (100.0%), whereas the industries that tend to have a higher number of women are Finance & Insurance (100.0%), Arts, Entertainment & Recreation (100.0%), and Health Care & Social Assistance (87.1%).
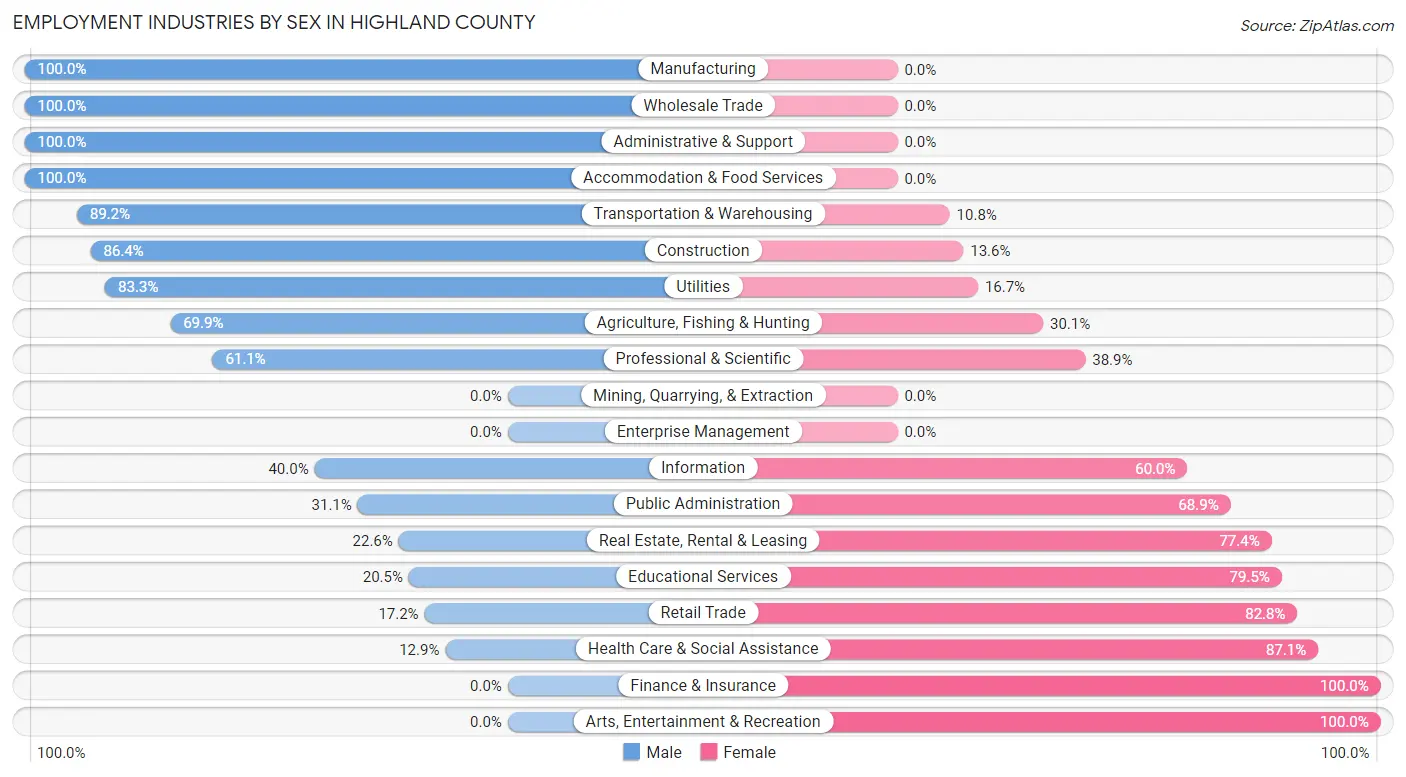
| Industry | Male | Female |
| Agriculture, Fishing & Hunting | 51 (69.9%) | 22 (30.1%) |
| Mining, Quarrying, & Extraction | 0 (0.0%) | 0 (0.0%) |
| Construction | 95 (86.4%) | 15 (13.6%) |
| Manufacturing | 12 (100.0%) | 0 (0.0%) |
| Wholesale Trade | 10 (100.0%) | 0 (0.0%) |
| Retail Trade | 10 (17.2%) | 48 (82.8%) |
| Transportation & Warehousing | 33 (89.2%) | 4 (10.8%) |
| Utilities | 15 (83.3%) | 3 (16.7%) |
| Information | 22 (40.0%) | 33 (60.0%) |
| Finance & Insurance | 0 (0.0%) | 12 (100.0%) |
| Real Estate, Rental & Leasing | 7 (22.6%) | 24 (77.4%) |
| Professional & Scientific | 22 (61.1%) | 14 (38.9%) |
| Enterprise Management | 0 (0.0%) | 0 (0.0%) |
| Administrative & Support | 19 (100.0%) | 0 (0.0%) |
| Educational Services | 17 (20.5%) | 66 (79.5%) |
| Health Care & Social Assistance | 11 (12.9%) | 74 (87.1%) |
| Arts, Entertainment & Recreation | 0 (0.0%) | 9 (100.0%) |
| Accommodation & Food Services | 10 (100.0%) | 0 (0.0%) |
| Public Administration | 32 (31.1%) | 71 (68.9%) |
| Total | 388 (48.0%) | 421 (52.0%) |
Education in Highland County
School Enrollment in Highland County
The most common levels of schooling among the 279 students in Highland County are elementary school (86 | 30.8%), middle school (59 | 21.1%), and high school (45 | 16.1%).
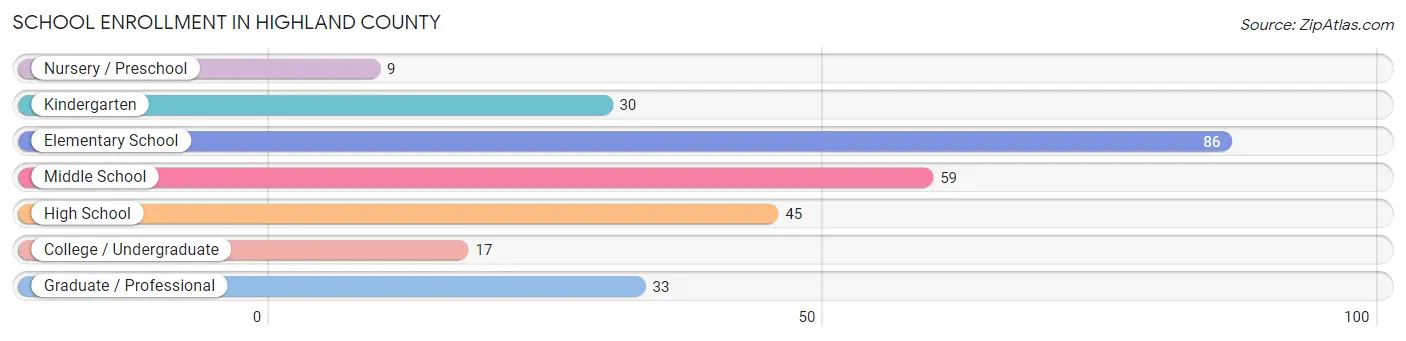
| School Level | # Students | % Students |
| Nursery / Preschool | 9 | 3.2% |
| Kindergarten | 30 | 10.7% |
| Elementary School | 86 | 30.8% |
| Middle School | 59 | 21.1% |
| High School | 45 | 16.1% |
| College / Undergraduate | 17 | 6.1% |
| Graduate / Professional | 33 | 11.8% |
| Total | 279 | 100.0% |
School Enrollment by Age by Funding Source in Highland County
Out of a total of 279 students who are enrolled in schools in Highland County, 48 (17.2%) attend a private institution, while the remaining 231 (82.8%) are enrolled in public schools. The age group of 18 to 19 year olds has the highest likelihood of being enrolled in private schools, with 2 (50.0% in the age bracket) enrolled. Conversely, the age group of 3 to 4 year olds has the lowest likelihood of being enrolled in a private school, with 5 (100.0% in the age bracket) attending a public institution.
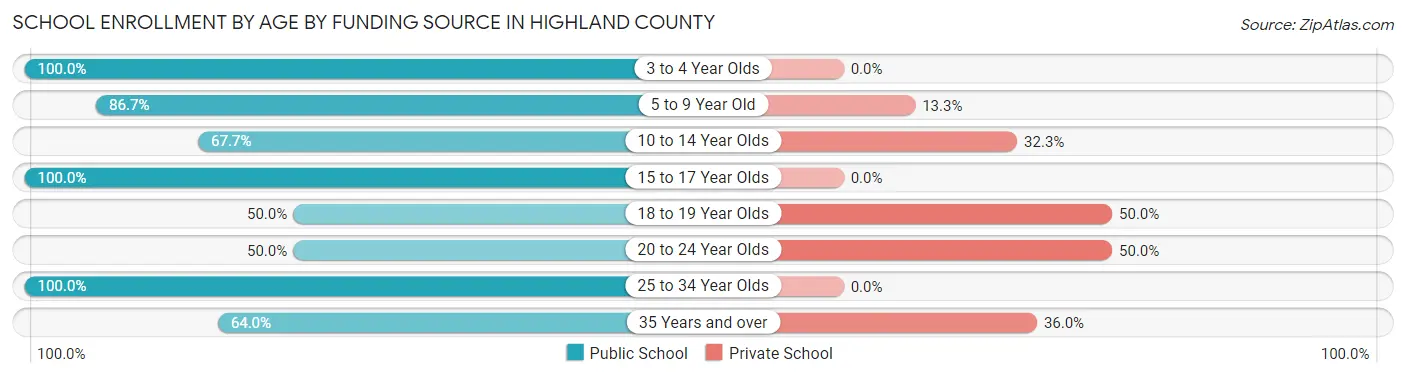
| Age Bracket | Public School | Private School |
| 3 to 4 Year Olds | 5 (100.0%) | 0 (0.0%) |
| 5 to 9 Year Old | 91 (86.7%) | 14 (13.3%) |
| 10 to 14 Year Olds | 44 (67.7%) | 21 (32.3%) |
| 15 to 17 Year Olds | 50 (100.0%) | 0 (0.0%) |
| 18 to 19 Year Olds | 2 (50.0%) | 2 (50.0%) |
| 20 to 24 Year Olds | 2 (50.0%) | 2 (50.0%) |
| 25 to 34 Year Olds | 21 (100.0%) | 0 (0.0%) |
| 35 Years and over | 16 (64.0%) | 9 (36.0%) |
| Total | 231 (82.8%) | 48 (17.2%) |
Educational Attainment by Field of Study in Highland County
Education (130 | 22.3%), social sciences (90 | 15.5%), bio, nature & agricultural (53 | 9.1%), liberal arts & history (49 | 8.4%), and arts & humanities (48 | 8.3%) are the most common fields of study among 582 individuals in Highland County who have obtained a bachelor's degree or higher.
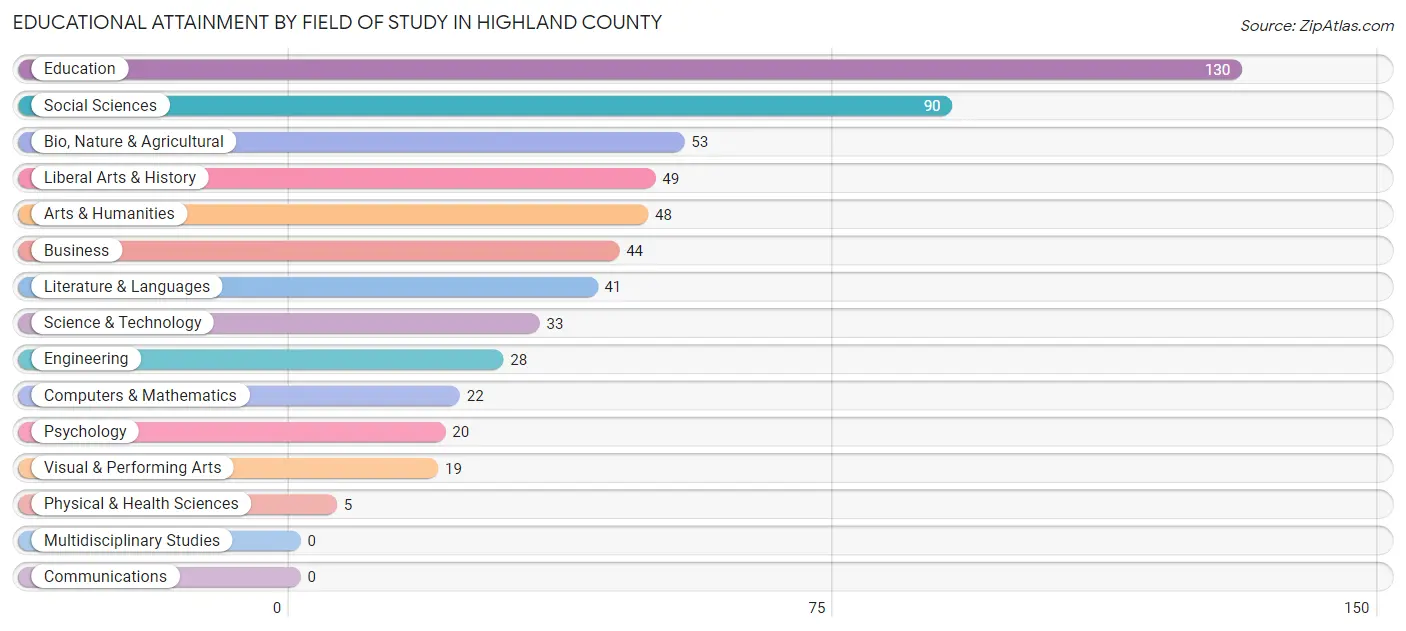
| Field of Study | # Graduates | % Graduates |
| Computers & Mathematics | 22 | 3.8% |
| Bio, Nature & Agricultural | 53 | 9.1% |
| Physical & Health Sciences | 5 | 0.9% |
| Psychology | 20 | 3.4% |
| Social Sciences | 90 | 15.5% |
| Engineering | 28 | 4.8% |
| Multidisciplinary Studies | 0 | 0.0% |
| Science & Technology | 33 | 5.7% |
| Business | 44 | 7.6% |
| Education | 130 | 22.3% |
| Literature & Languages | 41 | 7.0% |
| Liberal Arts & History | 49 | 8.4% |
| Visual & Performing Arts | 19 | 3.3% |
| Communications | 0 | 0.0% |
| Arts & Humanities | 48 | 8.3% |
| Total | 582 | 100.0% |
Transportation & Commute in Highland County
Vehicle Availability by Sex in Highland County
The most prevalent vehicle ownership categories in Highland County are males with 2 vehicles (139, accounting for 36.2%) and females with 2 vehicles (162, making up 33.0%).
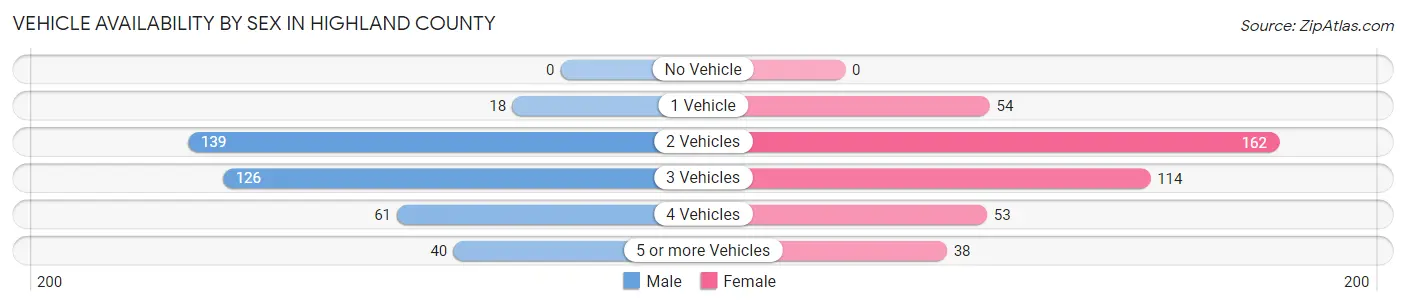
| Vehicles Available | Male | Female |
| No Vehicle | 0 (0.0%) | 0 (0.0%) |
| 1 Vehicle | 18 (4.7%) | 54 (12.8%) |
| 2 Vehicles | 139 (36.2%) | 162 (38.5%) |
| 3 Vehicles | 126 (32.8%) | 114 (27.1%) |
| 4 Vehicles | 61 (15.9%) | 53 (12.6%) |
| 5 or more Vehicles | 40 (10.4%) | 38 (9.0%) |
| Total | 384 (100.0%) | 421 (100.0%) |
Commute Time in Highland County
The most frequently occuring commute durations in Highland County are 5 to 9 minutes (125 commuters, 18.3%), 15 to 19 minutes (109 commuters, 16.0%), and 20 to 24 minutes (80 commuters, 11.7%).
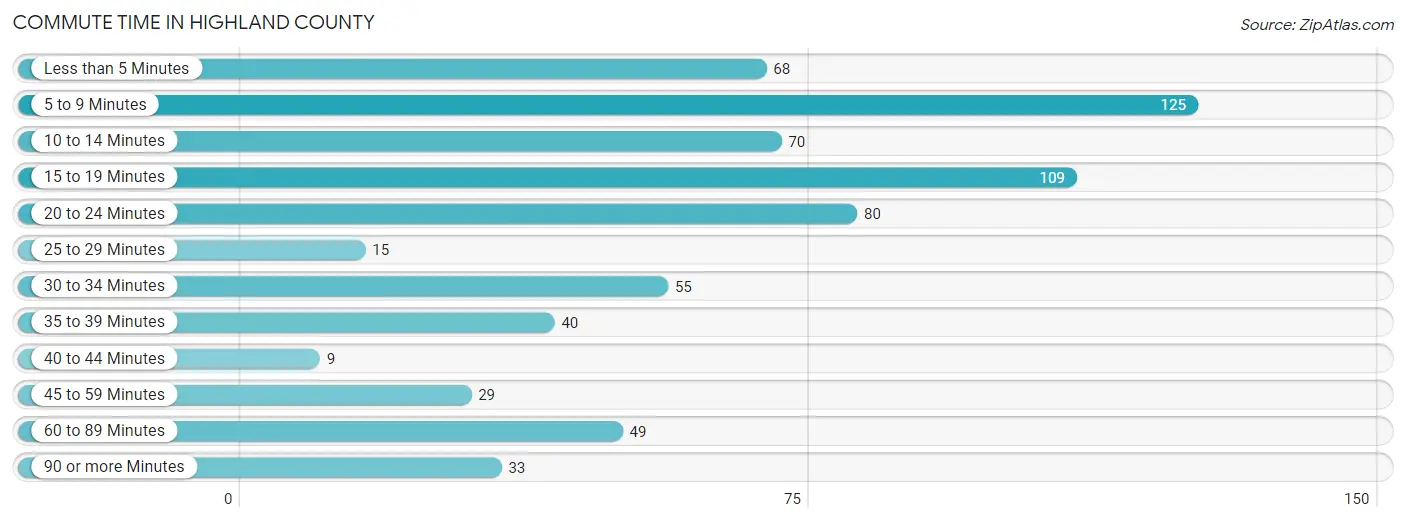
| Commute Time | # Commuters | % Commuters |
| Less than 5 Minutes | 68 | 10.0% |
| 5 to 9 Minutes | 125 | 18.3% |
| 10 to 14 Minutes | 70 | 10.3% |
| 15 to 19 Minutes | 109 | 16.0% |
| 20 to 24 Minutes | 80 | 11.7% |
| 25 to 29 Minutes | 15 | 2.2% |
| 30 to 34 Minutes | 55 | 8.1% |
| 35 to 39 Minutes | 40 | 5.9% |
| 40 to 44 Minutes | 9 | 1.3% |
| 45 to 59 Minutes | 29 | 4.3% |
| 60 to 89 Minutes | 49 | 7.2% |
| 90 or more Minutes | 33 | 4.8% |
Commute Time by Sex in Highland County
The most common commute times in Highland County are 20 to 24 minutes (56 commuters, 16.4%) for males and 5 to 9 minutes (76 commuters, 22.3%) for females.
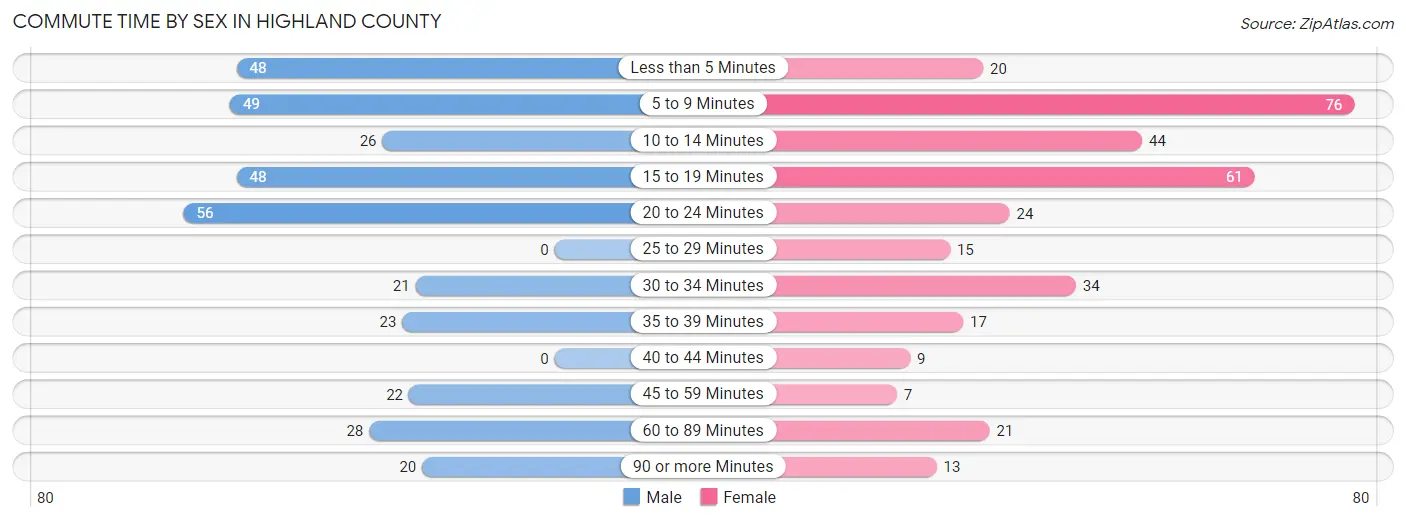
| Commute Time | Male | Female |
| Less than 5 Minutes | 48 (14.1%) | 20 (5.9%) |
| 5 to 9 Minutes | 49 (14.4%) | 76 (22.3%) |
| 10 to 14 Minutes | 26 (7.6%) | 44 (12.9%) |
| 15 to 19 Minutes | 48 (14.1%) | 61 (17.9%) |
| 20 to 24 Minutes | 56 (16.4%) | 24 (7.0%) |
| 25 to 29 Minutes | 0 (0.0%) | 15 (4.4%) |
| 30 to 34 Minutes | 21 (6.2%) | 34 (10.0%) |
| 35 to 39 Minutes | 23 (6.7%) | 17 (5.0%) |
| 40 to 44 Minutes | 0 (0.0%) | 9 (2.6%) |
| 45 to 59 Minutes | 22 (6.5%) | 7 (2.1%) |
| 60 to 89 Minutes | 28 (8.2%) | 21 (6.2%) |
| 90 or more Minutes | 20 (5.9%) | 13 (3.8%) |
Time of Departure to Work by Sex in Highland County
The most frequent times of departure to work in Highland County are 7:00 AM to 7:29 AM (61, 17.9%) for males and 7:00 AM to 7:29 AM (109, 32.0%) for females.
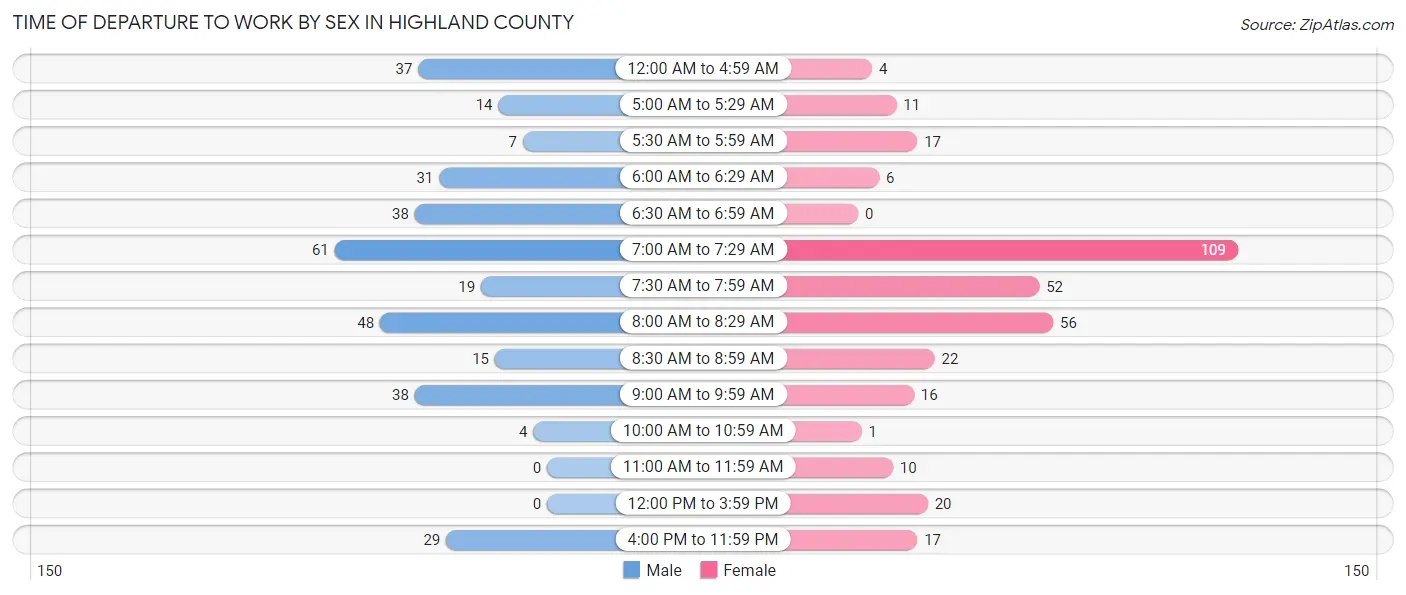
| Time of Departure | Male | Female |
| 12:00 AM to 4:59 AM | 37 (10.8%) | 4 (1.2%) |
| 5:00 AM to 5:29 AM | 14 (4.1%) | 11 (3.2%) |
| 5:30 AM to 5:59 AM | 7 (2.1%) | 17 (5.0%) |
| 6:00 AM to 6:29 AM | 31 (9.1%) | 6 (1.8%) |
| 6:30 AM to 6:59 AM | 38 (11.1%) | 0 (0.0%) |
| 7:00 AM to 7:29 AM | 61 (17.9%) | 109 (32.0%) |
| 7:30 AM to 7:59 AM | 19 (5.6%) | 52 (15.2%) |
| 8:00 AM to 8:29 AM | 48 (14.1%) | 56 (16.4%) |
| 8:30 AM to 8:59 AM | 15 (4.4%) | 22 (6.5%) |
| 9:00 AM to 9:59 AM | 38 (11.1%) | 16 (4.7%) |
| 10:00 AM to 10:59 AM | 4 (1.2%) | 1 (0.3%) |
| 11:00 AM to 11:59 AM | 0 (0.0%) | 10 (2.9%) |
| 12:00 PM to 3:59 PM | 0 (0.0%) | 20 (5.9%) |
| 4:00 PM to 11:59 PM | 29 (8.5%) | 17 (5.0%) |
| Total | 341 (100.0%) | 341 (100.0%) |
Housing Occupancy in Highland County
Occupancy by Ownership in Highland County
Of the total 1,014 dwellings in Highland County, owner-occupied units account for 876 (86.4%), while renter-occupied units make up 138 (13.6%).
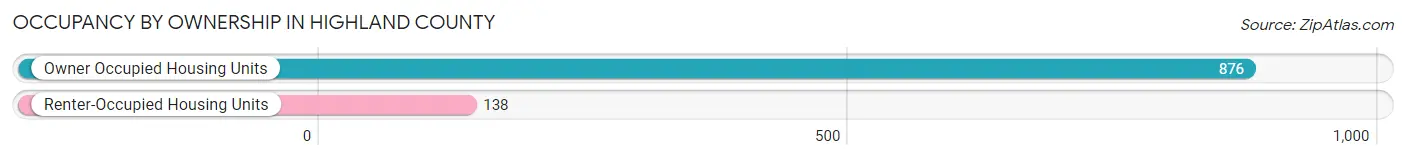
| Occupancy | # Housing Units | % Housing Units |
| Owner Occupied Housing Units | 876 | 86.4% |
| Renter-Occupied Housing Units | 138 | 13.6% |
| Total Occupied Housing Units | 1,014 | 100.0% |
Occupancy by Household Size in Highland County
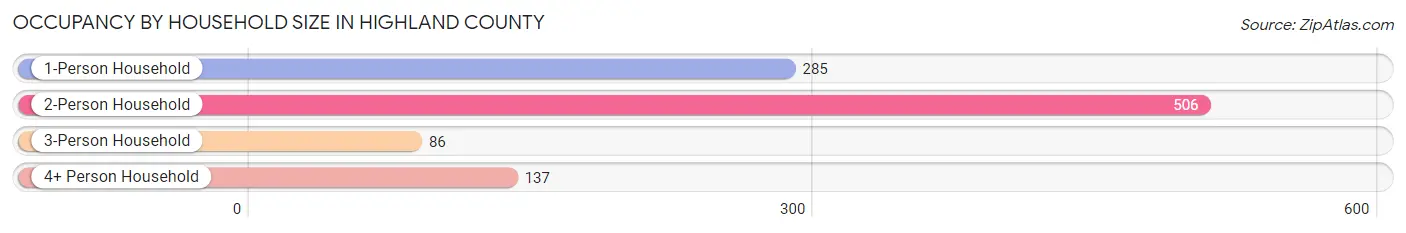
| Household Size | # Housing Units | % Housing Units |
| 1-Person Household | 285 | 28.1% |
| 2-Person Household | 506 | 49.9% |
| 3-Person Household | 86 | 8.5% |
| 4+ Person Household | 137 | 13.5% |
| Total Housing Units | 1,014 | 100.0% |
Occupancy by Ownership by Household Size in Highland County
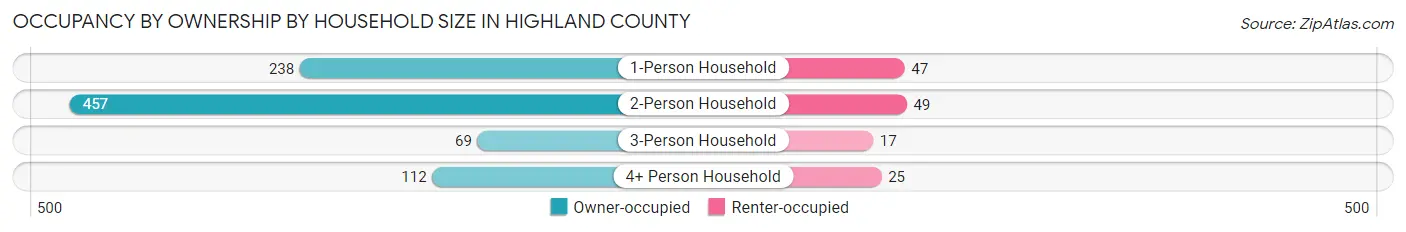
| Household Size | Owner-occupied | Renter-occupied |
| 1-Person Household | 238 (83.5%) | 47 (16.5%) |
| 2-Person Household | 457 (90.3%) | 49 (9.7%) |
| 3-Person Household | 69 (80.2%) | 17 (19.8%) |
| 4+ Person Household | 112 (81.8%) | 25 (18.2%) |
| Total Housing Units | 876 (86.4%) | 138 (13.6%) |
Occupancy by Educational Attainment in Highland County

| Household Size | Owner-occupied | Renter-occupied |
| Less than High School | 77 (89.5%) | 9 (10.5%) |
| High School Diploma | 258 (84.0%) | 49 (16.0%) |
| College/Associate Degree | 195 (85.9%) | 32 (14.1%) |
| Bachelor's Degree or higher | 346 (87.8%) | 48 (12.2%) |
Occupancy by Age of Householder in Highland County
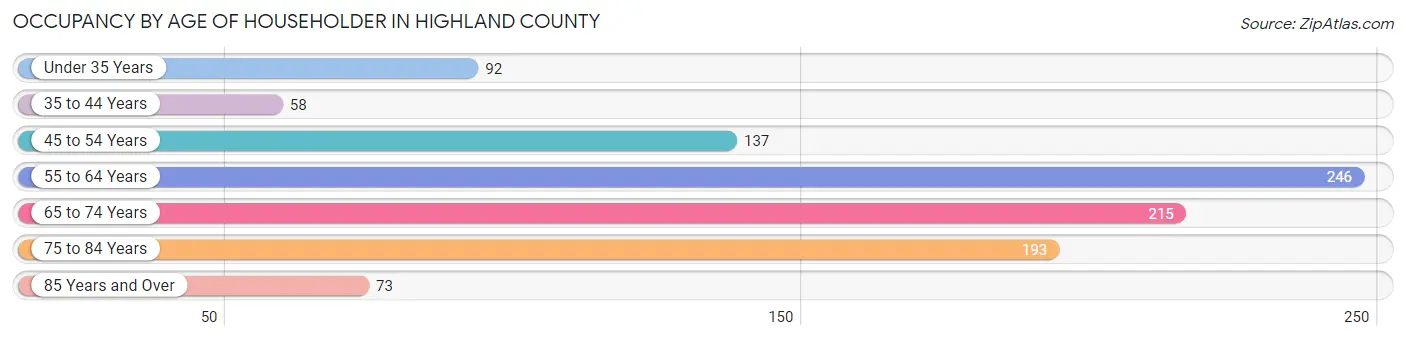
| Age Bracket | # Households | % Households |
| Under 35 Years | 92 | 9.1% |
| 35 to 44 Years | 58 | 5.7% |
| 45 to 54 Years | 137 | 13.5% |
| 55 to 64 Years | 246 | 24.3% |
| 65 to 74 Years | 215 | 21.2% |
| 75 to 84 Years | 193 | 19.0% |
| 85 Years and Over | 73 | 7.2% |
| Total | 1,014 | 100.0% |
Housing Finances in Highland County
Median Income by Occupancy in Highland County
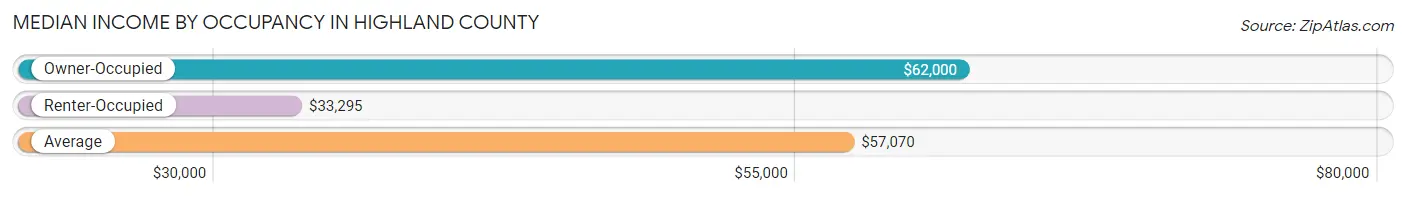
| Occupancy Type | # Households | Median Income |
| Owner-Occupied | 876 (86.4%) | $62,000 |
| Renter-Occupied | 138 (13.6%) | $33,295 |
| Average | 1,014 (100.0%) | $57,070 |
Occupancy by Householder Income Bracket in Highland County
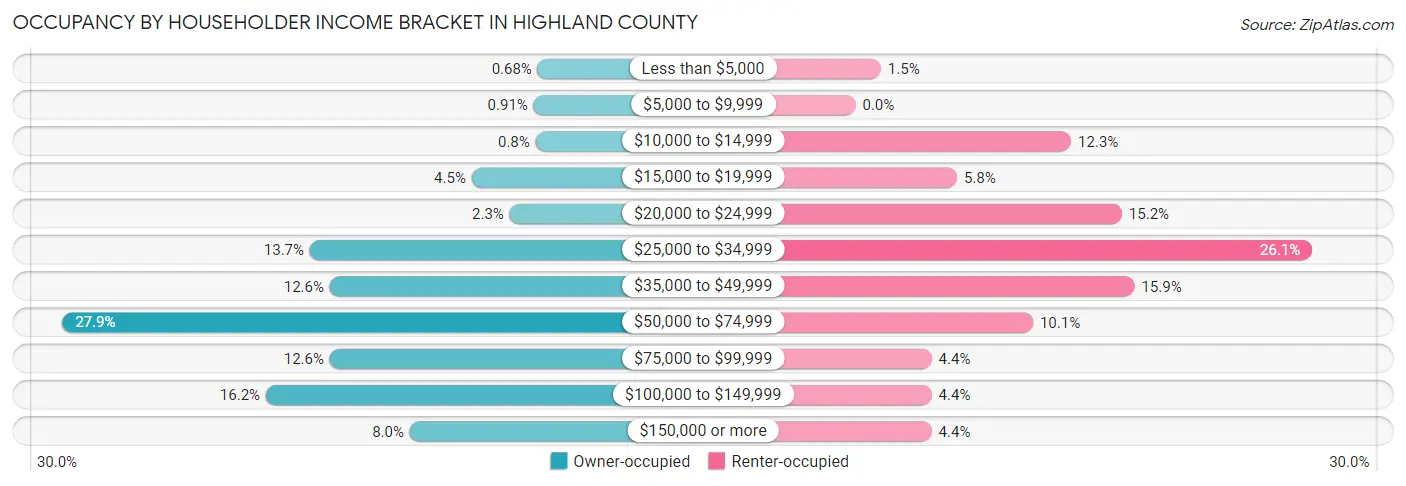
| Income Bracket | Owner-occupied | Renter-occupied |
| Less than $5,000 | 6 (0.7%) | 2 (1.5%) |
| $5,000 to $9,999 | 8 (0.9%) | 0 (0.0%) |
| $10,000 to $14,999 | 7 (0.8%) | 17 (12.3%) |
| $15,000 to $19,999 | 39 (4.4%) | 8 (5.8%) |
| $20,000 to $24,999 | 20 (2.3%) | 21 (15.2%) |
| $25,000 to $34,999 | 120 (13.7%) | 36 (26.1%) |
| $35,000 to $49,999 | 110 (12.6%) | 22 (15.9%) |
| $50,000 to $74,999 | 244 (27.9%) | 14 (10.1%) |
| $75,000 to $99,999 | 110 (12.6%) | 6 (4.3%) |
| $100,000 to $149,999 | 142 (16.2%) | 6 (4.3%) |
| $150,000 or more | 70 (8.0%) | 6 (4.3%) |
| Total | 876 (100.0%) | 138 (100.0%) |
Monthly Housing Cost Tiers in Highland County

| Monthly Cost | Owner-occupied | Renter-occupied |
| Less than $300 | 174 (19.9%) | 0 (0.0%) |
| $300 to $499 | 273 (31.2%) | 0 (0.0%) |
| $500 to $799 | 119 (13.6%) | 34 (24.6%) |
| $800 to $999 | 50 (5.7%) | 13 (9.4%) |
| $1,000 to $1,499 | 165 (18.8%) | 18 (13.0%) |
| $1,500 to $1,999 | 63 (7.2%) | 3 (2.2%) |
| $2,000 to $2,499 | 23 (2.6%) | 0 (0.0%) |
| $2,500 to $2,999 | 8 (0.9%) | 0 (0.0%) |
| $3,000 or more | 1 (0.1%) | 0 (0.0%) |
| Total | 876 (100.0%) | 138 (100.0%) |
Physical Housing Characteristics in Highland County
Housing Structures in Highland County
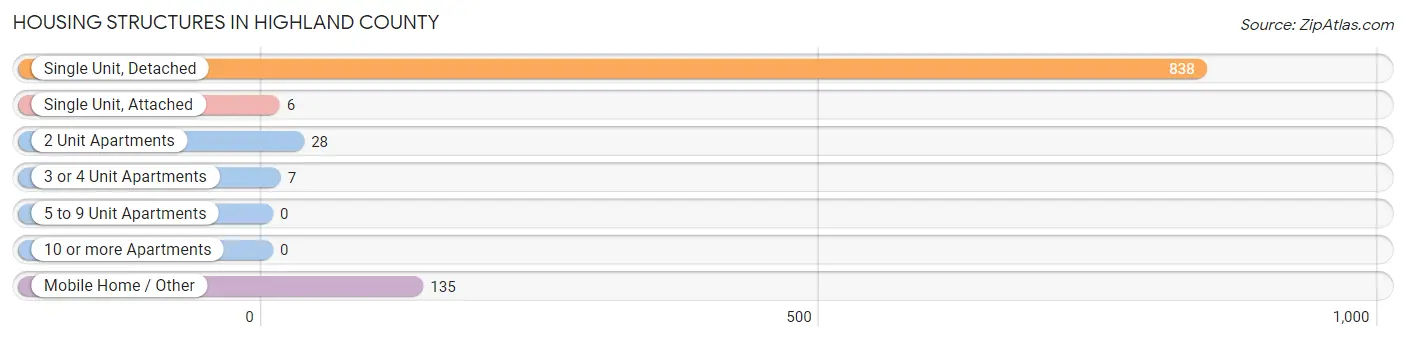
| Structure Type | # Housing Units | % Housing Units |
| Single Unit, Detached | 838 | 82.6% |
| Single Unit, Attached | 6 | 0.6% |
| 2 Unit Apartments | 28 | 2.8% |
| 3 or 4 Unit Apartments | 7 | 0.7% |
| 5 to 9 Unit Apartments | 0 | 0.0% |
| 10 or more Apartments | 0 | 0.0% |
| Mobile Home / Other | 135 | 13.3% |
| Total | 1,014 | 100.0% |
Housing Structures by Occupancy in Highland County
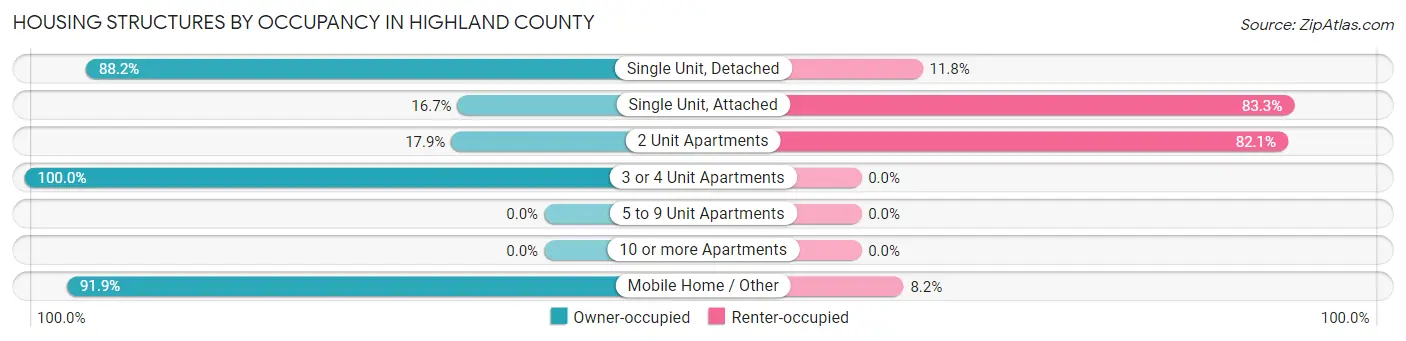
| Structure Type | Owner-occupied | Renter-occupied |
| Single Unit, Detached | 739 (88.2%) | 99 (11.8%) |
| Single Unit, Attached | 1 (16.7%) | 5 (83.3%) |
| 2 Unit Apartments | 5 (17.9%) | 23 (82.1%) |
| 3 or 4 Unit Apartments | 7 (100.0%) | 0 (0.0%) |
| 5 to 9 Unit Apartments | 0 (0.0%) | 0 (0.0%) |
| 10 or more Apartments | 0 (0.0%) | 0 (0.0%) |
| Mobile Home / Other | 124 (91.8%) | 11 (8.2%) |
| Total | 876 (86.4%) | 138 (13.6%) |
Housing Structures by Number of Rooms in Highland County
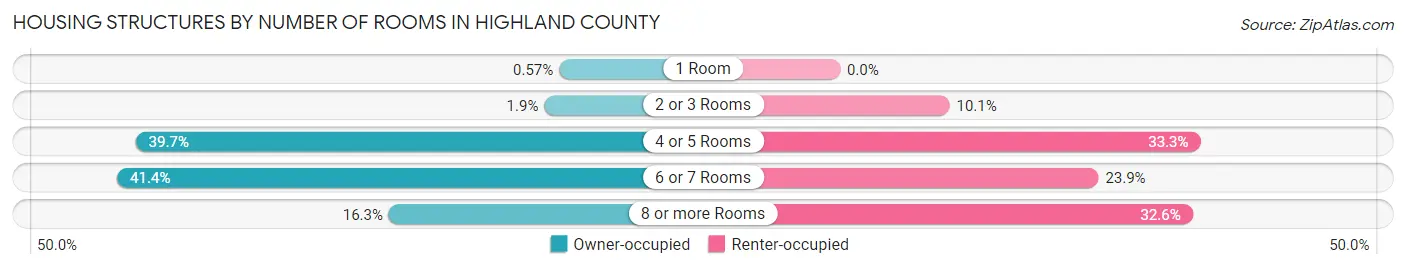
| Number of Rooms | Owner-occupied | Renter-occupied |
| 1 Room | 5 (0.6%) | 0 (0.0%) |
| 2 or 3 Rooms | 17 (1.9%) | 14 (10.1%) |
| 4 or 5 Rooms | 348 (39.7%) | 46 (33.3%) |
| 6 or 7 Rooms | 363 (41.4%) | 33 (23.9%) |
| 8 or more Rooms | 143 (16.3%) | 45 (32.6%) |
| Total | 876 (100.0%) | 138 (100.0%) |
Housing Structure by Heating Type in Highland County
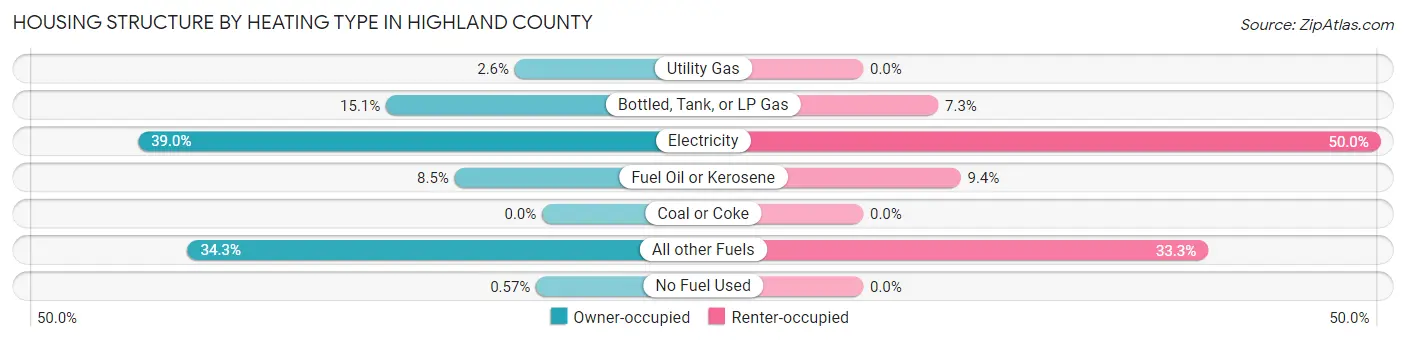
| Heating Type | Owner-occupied | Renter-occupied |
| Utility Gas | 23 (2.6%) | 0 (0.0%) |
| Bottled, Tank, or LP Gas | 132 (15.1%) | 10 (7.2%) |
| Electricity | 342 (39.0%) | 69 (50.0%) |
| Fuel Oil or Kerosene | 74 (8.5%) | 13 (9.4%) |
| Coal or Coke | 0 (0.0%) | 0 (0.0%) |
| All other Fuels | 300 (34.3%) | 46 (33.3%) |
| No Fuel Used | 5 (0.6%) | 0 (0.0%) |
| Total | 876 (100.0%) | 138 (100.0%) |
Household Vehicle Usage in Highland County
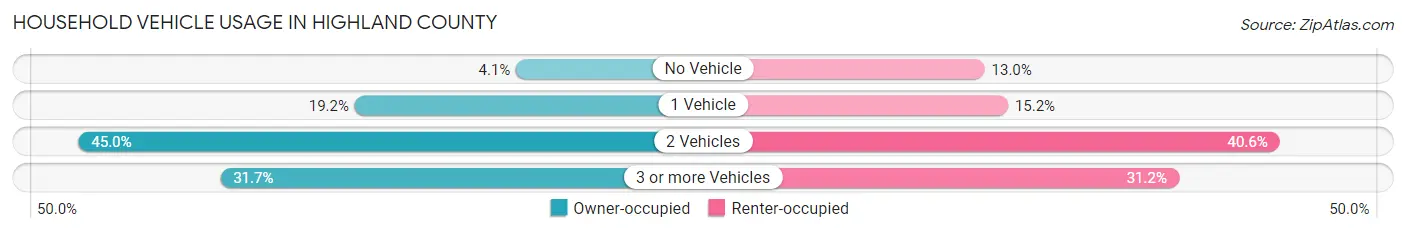
| Vehicles per Household | Owner-occupied | Renter-occupied |
| No Vehicle | 36 (4.1%) | 18 (13.0%) |
| 1 Vehicle | 168 (19.2%) | 21 (15.2%) |
| 2 Vehicles | 394 (45.0%) | 56 (40.6%) |
| 3 or more Vehicles | 278 (31.7%) | 43 (31.2%) |
| Total | 876 (100.0%) | 138 (100.0%) |
Real Estate & Mortgages in Highland County
Real Estate and Mortgage Overview in Highland County
| Characteristic | Without Mortgage | With Mortgage |
| Housing Units | 595 | 281 |
| Median Property Value | $197,600 | $156,700 |
| Median Household Income | $54,479 | $43 |
| Monthly Housing Costs | $380 | $1 |
| Real Estate Taxes | $1,148 | $0 |
Property Value by Mortgage Status in Highland County
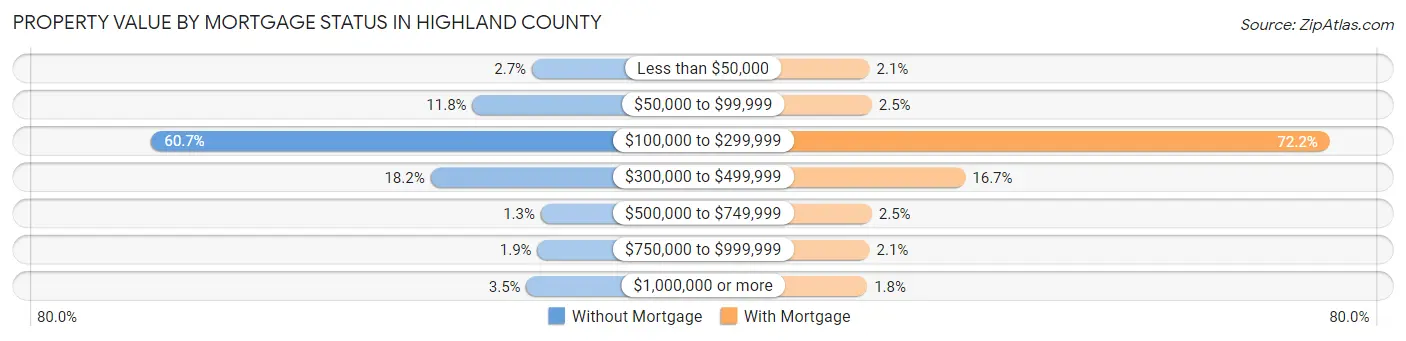
| Property Value | Without Mortgage | With Mortgage |
| Less than $50,000 | 16 (2.7%) | 6 (2.1%) |
| $50,000 to $99,999 | 70 (11.8%) | 7 (2.5%) |
| $100,000 to $299,999 | 361 (60.7%) | 203 (72.2%) |
| $300,000 to $499,999 | 108 (18.1%) | 47 (16.7%) |
| $500,000 to $749,999 | 8 (1.3%) | 7 (2.5%) |
| $750,000 to $999,999 | 11 (1.8%) | 6 (2.1%) |
| $1,000,000 or more | 21 (3.5%) | 5 (1.8%) |
| Total | 595 (100.0%) | 281 (100.0%) |
Household Income by Mortgage Status in Highland County
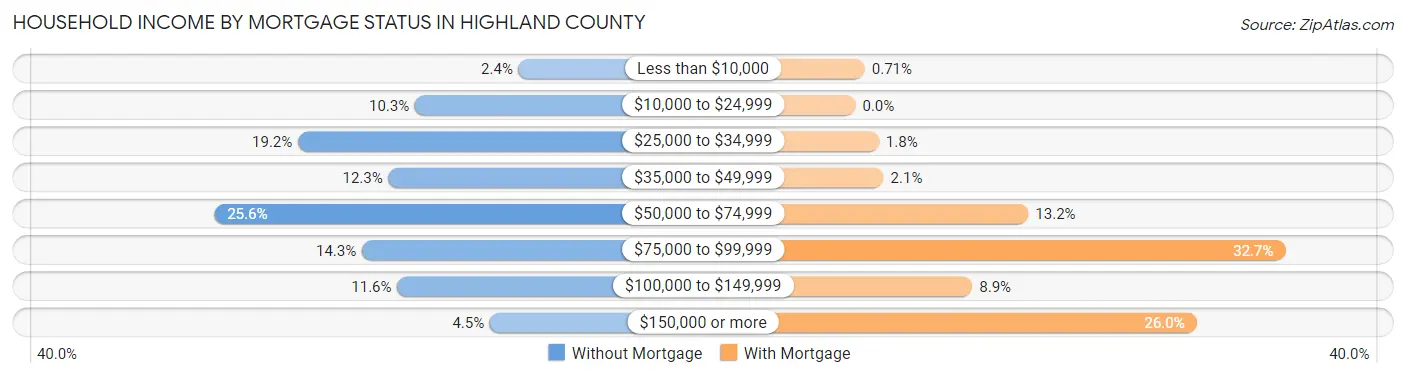
| Household Income | Without Mortgage | With Mortgage |
| Less than $10,000 | 14 (2.4%) | 2 (0.7%) |
| $10,000 to $24,999 | 61 (10.2%) | 0 (0.0%) |
| $25,000 to $34,999 | 114 (19.2%) | 5 (1.8%) |
| $35,000 to $49,999 | 73 (12.3%) | 6 (2.1%) |
| $50,000 to $74,999 | 152 (25.6%) | 37 (13.2%) |
| $75,000 to $99,999 | 85 (14.3%) | 92 (32.7%) |
| $100,000 to $149,999 | 69 (11.6%) | 25 (8.9%) |
| $150,000 or more | 27 (4.5%) | 73 (26.0%) |
| Total | 595 (100.0%) | 281 (100.0%) |
Property Value to Household Income Ratio in Highland County
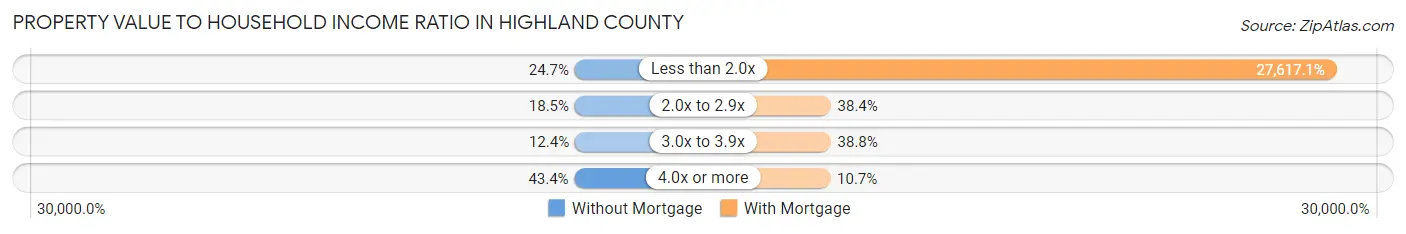
| Value-to-Income Ratio | Without Mortgage | With Mortgage |
| Less than 2.0x | 147 (24.7%) | 77,604 (27,617.1%) |
| 2.0x to 2.9x | 110 (18.5%) | 108 (38.4%) |
| 3.0x to 3.9x | 74 (12.4%) | 109 (38.8%) |
| 4.0x or more | 258 (43.4%) | 30 (10.7%) |
| Total | 595 (100.0%) | 281 (100.0%) |
Real Estate Taxes by Mortgage Status in Highland County
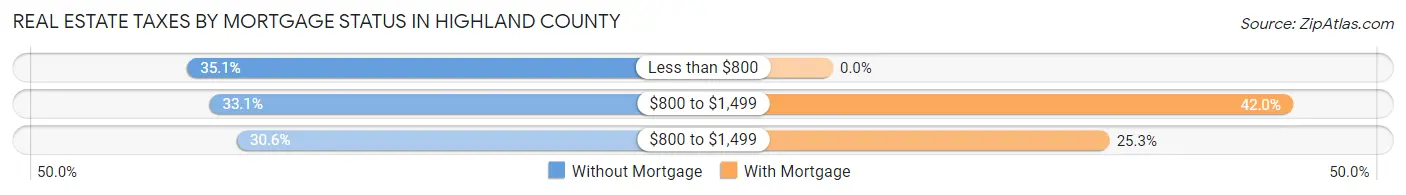
| Property Taxes | Without Mortgage | With Mortgage |
| Less than $800 | 209 (35.1%) | 0 (0.0%) |
| $800 to $1,499 | 197 (33.1%) | 118 (42.0%) |
| $800 to $1,499 | 182 (30.6%) | 71 (25.3%) |
| Total | 595 (100.0%) | 281 (100.0%) |
Health & Disability in Highland County
Health Insurance Coverage by Age in Highland County
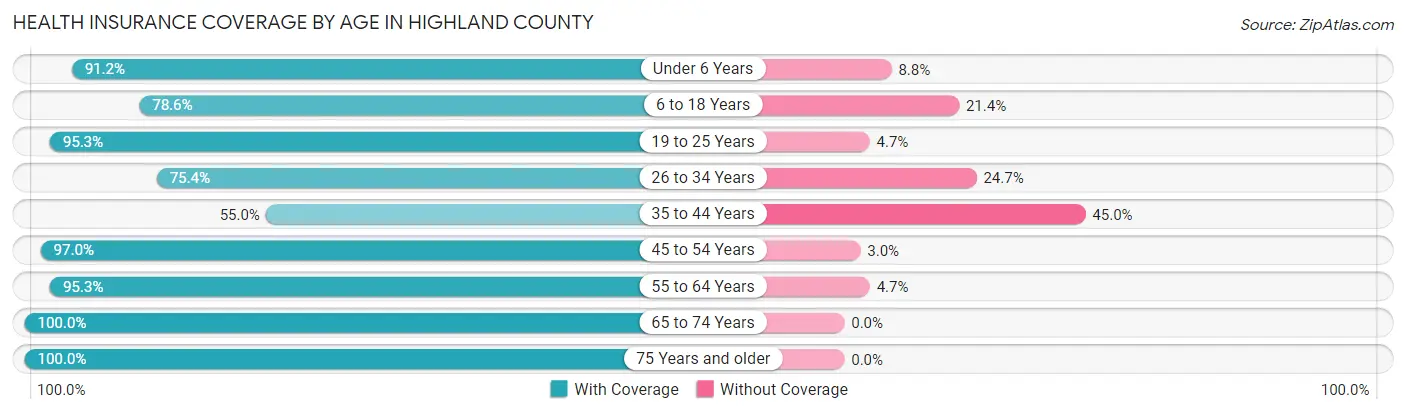
| Age Bracket | With Coverage | Without Coverage |
| Under 6 Years | 83 (91.2%) | 8 (8.8%) |
| 6 to 18 Years | 158 (78.6%) | 43 (21.4%) |
| 19 to 25 Years | 242 (95.3%) | 12 (4.7%) |
| 26 to 34 Years | 107 (75.3%) | 35 (24.6%) |
| 35 to 44 Years | 71 (55.0%) | 58 (45.0%) |
| 45 to 54 Years | 194 (97.0%) | 6 (3.0%) |
| 55 to 64 Years | 382 (95.3%) | 19 (4.7%) |
| 65 to 74 Years | 462 (100.0%) | 0 (0.0%) |
| 75 Years and older | 367 (100.0%) | 0 (0.0%) |
| Total | 2,066 (91.9%) | 181 (8.1%) |
Health Insurance Coverage by Citizenship Status in Highland County
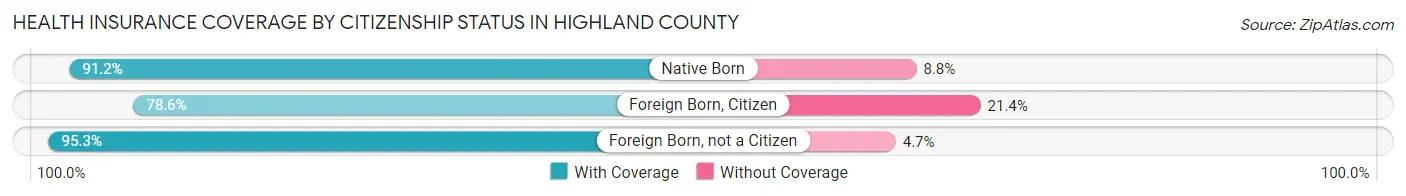
| Citizenship Status | With Coverage | Without Coverage |
| Native Born | 83 (91.2%) | 8 (8.8%) |
| Foreign Born, Citizen | 158 (78.6%) | 43 (21.4%) |
| Foreign Born, not a Citizen | 242 (95.3%) | 12 (4.7%) |
Health Insurance Coverage by Household Income in Highland County
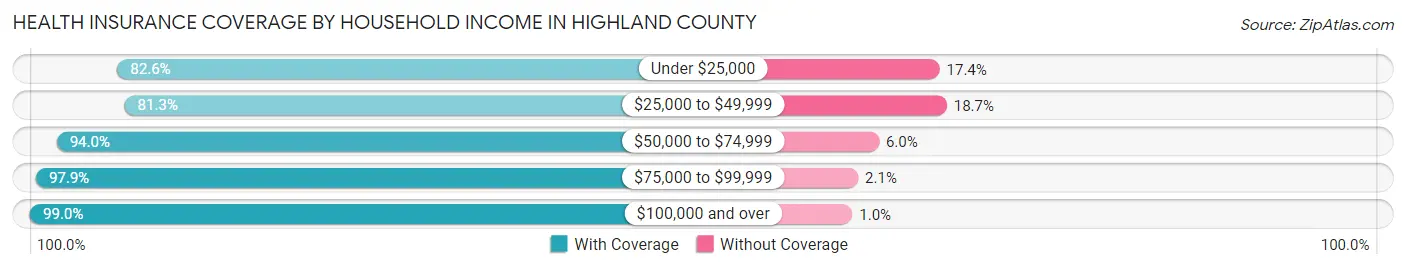
| Household Income | With Coverage | Without Coverage |
| Under $25,000 | 190 (82.6%) | 40 (17.4%) |
| $25,000 to $49,999 | 421 (81.3%) | 97 (18.7%) |
| $50,000 to $74,999 | 468 (94.0%) | 30 (6.0%) |
| $75,000 to $99,999 | 321 (97.9%) | 7 (2.1%) |
| $100,000 and over | 666 (99.0%) | 7 (1.0%) |
Public vs Private Health Insurance Coverage by Age in Highland County
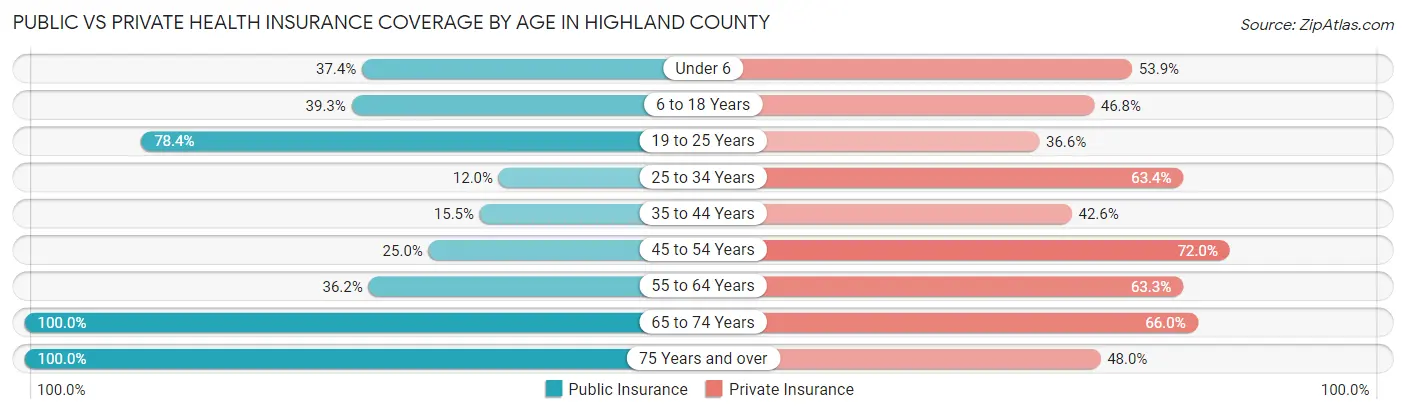
| Age Bracket | Public Insurance | Private Insurance |
| Under 6 | 34 (37.4%) | 49 (53.8%) |
| 6 to 18 Years | 79 (39.3%) | 94 (46.8%) |
| 19 to 25 Years | 199 (78.3%) | 93 (36.6%) |
| 25 to 34 Years | 17 (12.0%) | 90 (63.4%) |
| 35 to 44 Years | 20 (15.5%) | 55 (42.6%) |
| 45 to 54 Years | 50 (25.0%) | 144 (72.0%) |
| 55 to 64 Years | 145 (36.2%) | 254 (63.3%) |
| 65 to 74 Years | 462 (100.0%) | 305 (66.0%) |
| 75 Years and over | 367 (100.0%) | 176 (48.0%) |
| Total | 1,373 (61.1%) | 1,260 (56.1%) |
Disability Status by Sex by Age in Highland County
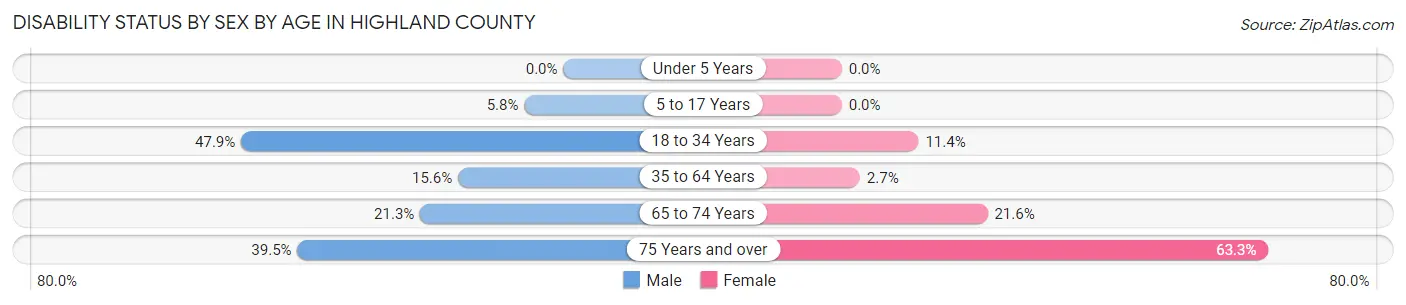
| Age Bracket | Male | Female |
| Under 5 Years | 0 (0.0%) | 0 (0.0%) |
| 5 to 17 Years | 4 (5.8%) | 0 (0.0%) |
| 18 to 34 Years | 78 (47.8%) | 27 (11.4%) |
| 35 to 64 Years | 56 (15.6%) | 10 (2.7%) |
| 65 to 74 Years | 54 (21.3%) | 45 (21.6%) |
| 75 Years and over | 62 (39.5%) | 133 (63.3%) |
Disability Class by Sex by Age in Highland County
Disability Class: Hearing Difficulty
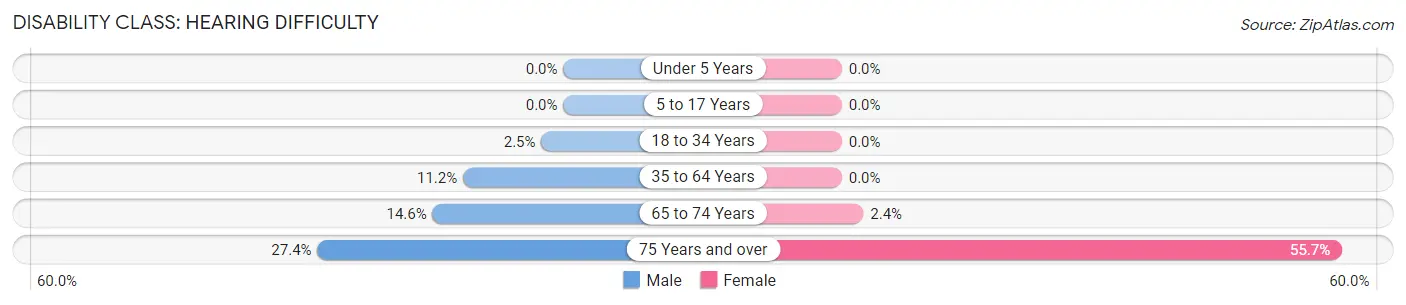
| Age Bracket | Male | Female |
| Under 5 Years | 0 (0.0%) | 0 (0.0%) |
| 5 to 17 Years | 0 (0.0%) | 0 (0.0%) |
| 18 to 34 Years | 4 (2.5%) | 0 (0.0%) |
| 35 to 64 Years | 40 (11.2%) | 0 (0.0%) |
| 65 to 74 Years | 37 (14.6%) | 5 (2.4%) |
| 75 Years and over | 43 (27.4%) | 117 (55.7%) |
Disability Class: Vision Difficulty
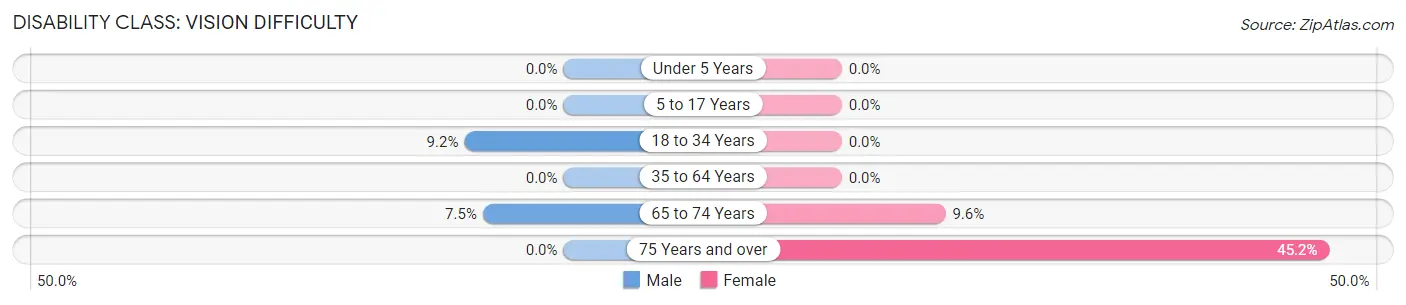
| Age Bracket | Male | Female |
| Under 5 Years | 0 (0.0%) | 0 (0.0%) |
| 5 to 17 Years | 0 (0.0%) | 0 (0.0%) |
| 18 to 34 Years | 15 (9.2%) | 0 (0.0%) |
| 35 to 64 Years | 0 (0.0%) | 0 (0.0%) |
| 65 to 74 Years | 19 (7.5%) | 20 (9.6%) |
| 75 Years and over | 0 (0.0%) | 95 (45.2%) |
Disability Class: Cognitive Difficulty
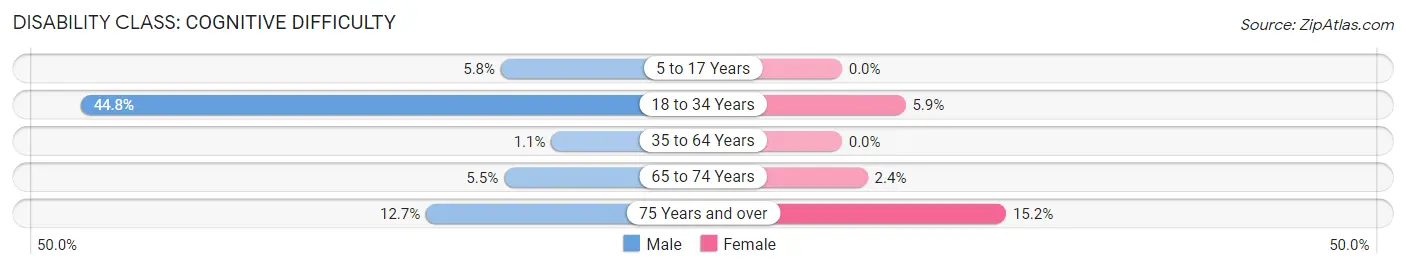
| Age Bracket | Male | Female |
| 5 to 17 Years | 4 (5.8%) | 0 (0.0%) |
| 18 to 34 Years | 73 (44.8%) | 14 (5.9%) |
| 35 to 64 Years | 4 (1.1%) | 0 (0.0%) |
| 65 to 74 Years | 14 (5.5%) | 5 (2.4%) |
| 75 Years and over | 20 (12.7%) | 32 (15.2%) |
Disability Class: Ambulatory Difficulty
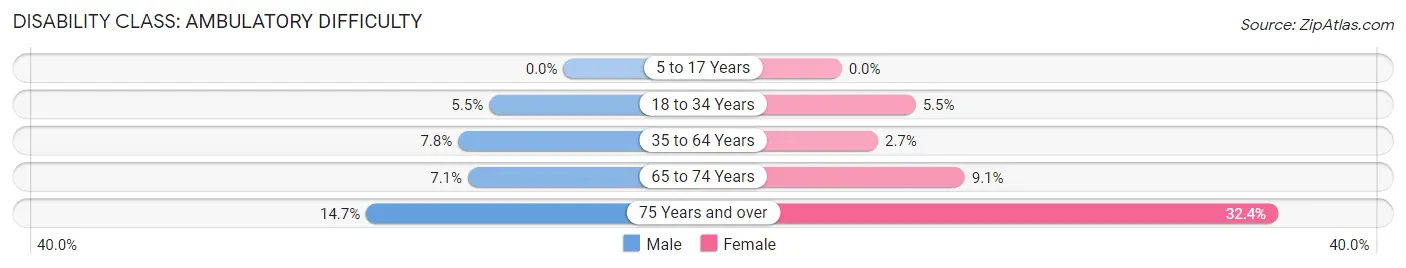
| Age Bracket | Male | Female |
| 5 to 17 Years | 0 (0.0%) | 0 (0.0%) |
| 18 to 34 Years | 9 (5.5%) | 13 (5.5%) |
| 35 to 64 Years | 28 (7.8%) | 10 (2.7%) |
| 65 to 74 Years | 18 (7.1%) | 19 (9.1%) |
| 75 Years and over | 23 (14.6%) | 68 (32.4%) |
Disability Class: Self-Care Difficulty
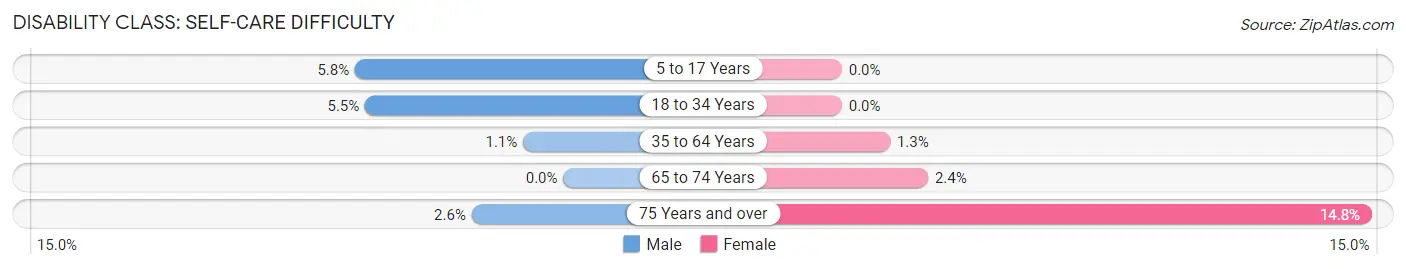
| Age Bracket | Male | Female |
| 5 to 17 Years | 4 (5.8%) | 0 (0.0%) |
| 18 to 34 Years | 9 (5.5%) | 0 (0.0%) |
| 35 to 64 Years | 4 (1.1%) | 5 (1.3%) |
| 65 to 74 Years | 0 (0.0%) | 5 (2.4%) |
| 75 Years and over | 4 (2.5%) | 31 (14.8%) |
Technology Access in Highland County
Computing Device Access in Highland County
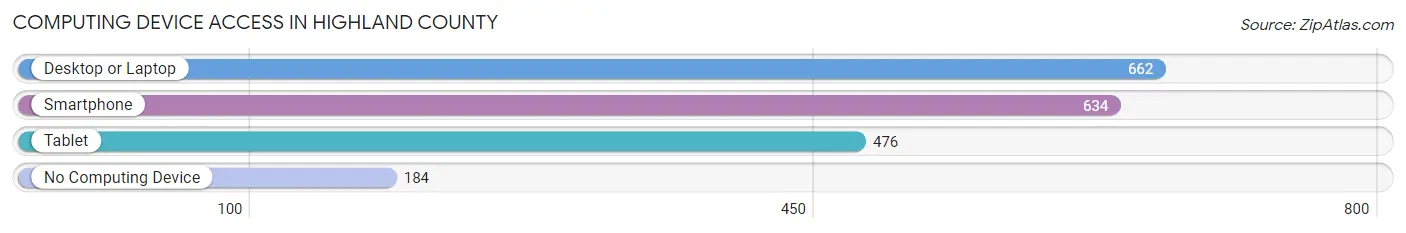
| Device Type | # Households | % Households |
| Desktop or Laptop | 662 | 65.3% |
| Smartphone | 634 | 62.5% |
| Tablet | 476 | 46.9% |
| No Computing Device | 184 | 18.1% |
| Total | 1,014 | 100.0% |
Internet Access in Highland County
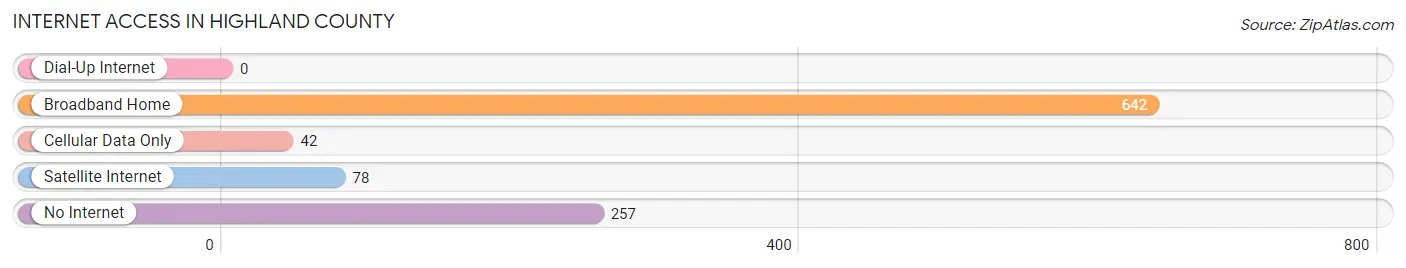
| Internet Type | # Households | % Households |
| Dial-Up Internet | 0 | 0.0% |
| Broadband Home | 642 | 63.3% |
| Cellular Data Only | 42 | 4.1% |
| Satellite Internet | 78 | 7.7% |
| No Internet | 257 | 25.4% |
| Total | 1,014 | 100.0% |
Highland County Summary
Highland County, Virginia is a rural county located in the western part of the state. It is bordered by West Virginia to the west, Bath County to the east, and Rockingham County to the south. The county seat is Monterey, and the county is part of the Staunton-Waynesboro Metropolitan Statistical Area. Highland County is known for its rural beauty and is home to the George Washington National Forest, the Appalachian Trail, and the Shenandoah River.
Geography
Highland County is located in the Allegheny Mountains of western Virginia. It is the second-smallest county in the state, with an area of only 176 square miles. The county is divided into two distinct regions: the Allegheny Plateau in the west and the Shenandoah Valley in the east. The Allegheny Plateau is characterized by steep, rugged terrain, while the Shenandoah Valley is more rolling and gentle. The highest point in the county is Reddish Knob, which has an elevation of 4,397 feet.
The county is drained by the North Fork of the Shenandoah River, which flows through the county from west to east. The river is a popular destination for fishing, canoeing, and kayaking. Other major waterways in the county include the South Fork of the Shenandoah River, the Cowpasture River, and the Jackson River.
Economy
Highland County has a largely agricultural economy. The county is home to several large farms, which produce a variety of crops, including corn, wheat, hay, and soybeans. Livestock production is also important to the local economy, with beef cattle, dairy cows, and sheep being raised in the county.
The county is also home to several small businesses, including restaurants, retail stores, and service providers. Tourism is also an important part of the local economy, with visitors coming to the county to enjoy its rural beauty and outdoor recreation opportunities.
Demographics
As of the 2010 census, Highland County had a population of 2,321. The population is predominantly white (96.2%), with small percentages of African Americans (1.7%), Native Americans (0.3%), and Asians (0.2%). The median household income in the county is $37,917, and the median age is 44.7 years.
Highland County is home to a large Amish community, which makes up about 5% of the population. The Amish are known for their traditional lifestyle and their commitment to hard work and self-sufficiency.
Conclusion
Highland County, Virginia is a rural county located in the western part of the state. It is known for its rural beauty and outdoor recreation opportunities, and is home to a large Amish community. The county has a largely agricultural economy, with farms producing a variety of crops and livestock. The population is predominantly white, with a median household income of $37,917 and a median age of 44.7 years.
Common Questions
What is Per Capita Income in Highland County?
Per Capita income in Highland County is $32,704.
What is the Median Family Income in Highland County?
Median Family Income in Highland County is $67,931.
What is the Median Household income in Highland County?
Median Household Income in Highland County is $57,070.
What is Income or Wage Gap in Highland County?
Income or Wage Gap in Highland County is 18.2%.
Women in Highland County earn 81.8 cents for every dollar earned by a man.
What is Family Income Deficit in Highland County?
Family Income Deficit in Highland County is $5,248.
Families that are below poverty line in Highland County earn $5,248 less on average than the poverty threshold level.
What is Inequality or Gini Index in Highland County?
Inequality or Gini Index in Highland County is 0.38.
What is the Total Population of Highland County?
Total Population of Highland County is 2,247.
What is the Total Male Population of Highland County?
Total Male Population of Highland County is 1,034.
What is the Total Female Population of Highland County?
Total Female Population of Highland County is 1,213.
What is the Ratio of Males per 100 Females in Highland County?
There are 85.24 Males per 100 Females in Highland County.
What is the Ratio of Females per 100 Males in Highland County?
There are 117.31 Females per 100 Males in Highland County.
What is the Median Population Age in Highland County?
Median Population Age in Highland County is 58.0 Years.
What is the Average Family Size in Highland County
Average Family Size in Highland County is 2.5 People.
What is the Average Household Size in Highland County
Average Household Size in Highland County is 2.2 People.
How Large is the Labor Force in Highland County?
There are 948 People in the Labor Forcein in Highland County.
What is the Percentage of People in the Labor Force in Highland County?
47.8% of People are in the Labor Force in Highland County.
What is the Unemployment Rate in Highland County?
Unemployment Rate in Highland County is 14.7%.