Henry County, VA Map & Demographics
Henry County Map
Henry County Overview
$26,097
PER CAPITA INCOME
$60,737
AVG FAMILY INCOME
$43,694
AVG HOUSEHOLD INCOME
23.9%
WAGE / INCOME GAP [ % ]
76.1¢/ $1
WAGE / INCOME GAP [ $ ]
$9,301
FAMILY INCOME DEFICIT
0.44
INEQUALITY / GINI INDEX
50,760
TOTAL POPULATION
24,420
MALE POPULATION
26,340
FEMALE POPULATION
92.71
MALES / 100 FEMALES
107.86
FEMALES / 100 MALES
48.3
MEDIAN AGE
3.3
AVG FAMILY SIZE
2.5
AVG HOUSEHOLD SIZE
21,426
LABOR FORCE [ PEOPLE ]
51.1%
PERCENT IN LABOR FORCE
5.2%
UNEMPLOYMENT RATE
Henry County Area Codes
Income in Henry County
Income Overview in Henry County
Per Capita Income in Henry County is $26,097, while median incomes of families and households are $60,737 and $43,694 respectively.
| Characteristic | Number | Measure |
| Per Capita Income | 50,760 | $26,097 |
| Median Family Income | 11,720 | $60,737 |
| Mean Family Income | 11,720 | $72,593 |
| Median Household Income | 20,411 | $43,694 |
| Mean Household Income | 20,411 | $58,729 |
| Income Deficit | 11,720 | $9,301 |
| Wage / Income Gap (%) | 50,760 | 23.94% |
| Wage / Income Gap ($) | 50,760 | 76.06¢ per $1 |
| Gini / Inequality Index | 50,760 | 0.44 |
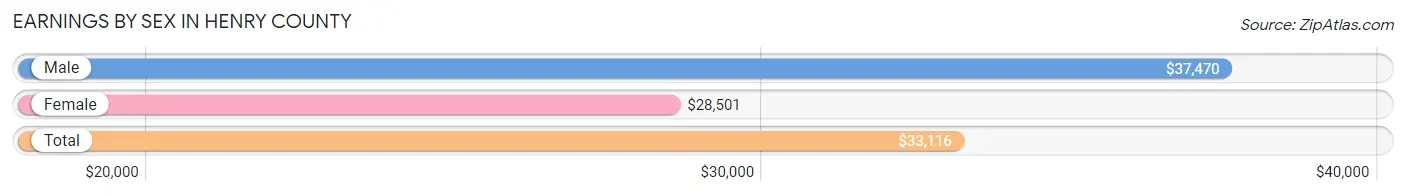
Earnings by Sex in Henry County
Average Earnings in Henry County are $33,116, $37,470 for men and $28,501 for women, a difference of 23.9%.
| Sex | Number | Average Earnings |
| Male | 11,003 (49.9%) | $37,470 |
| Female | 11,062 (50.1%) | $28,501 |
| Total | 22,065 (100.0%) | $33,116 |
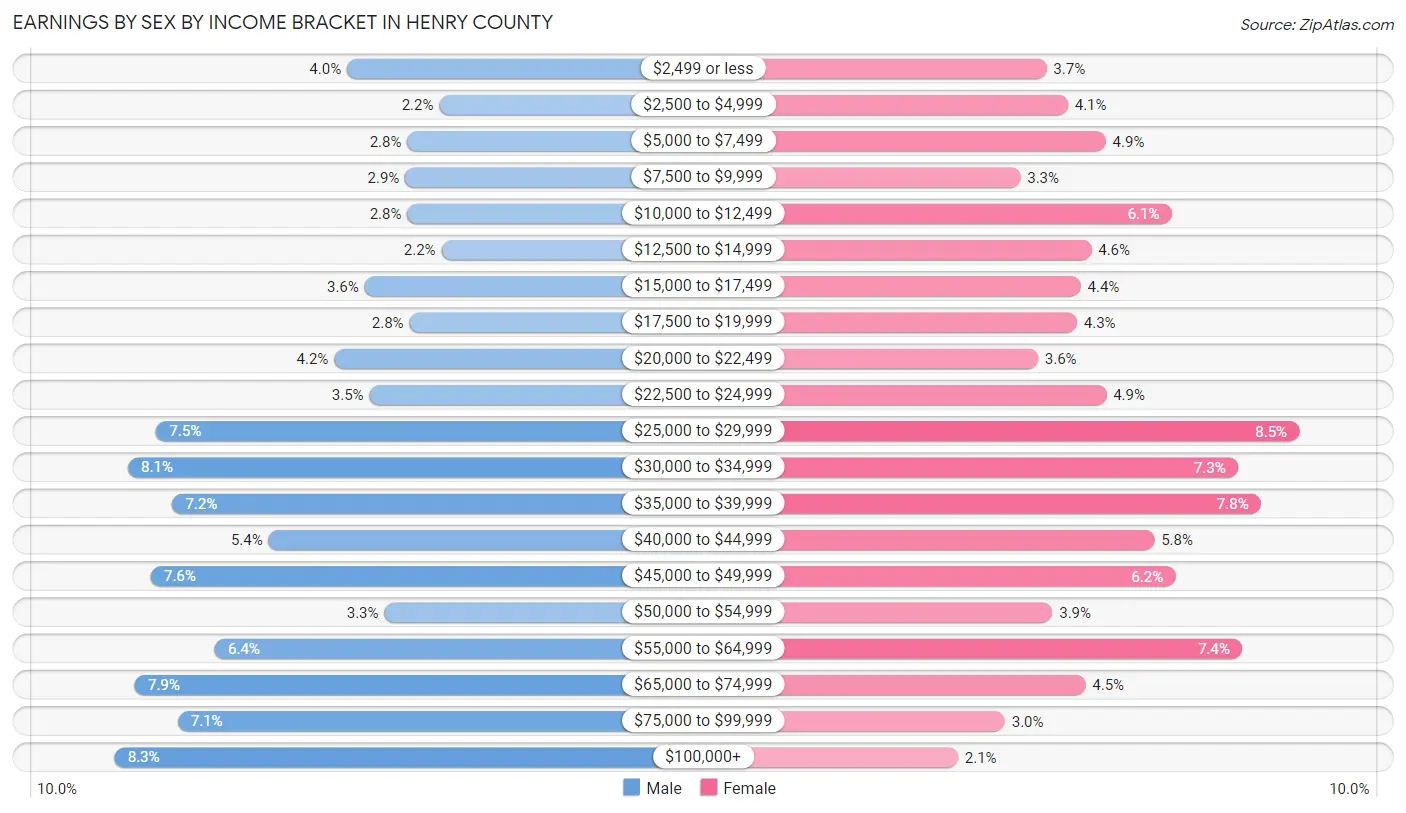
Earnings by Sex by Income Bracket in Henry County
The most common earnings brackets in Henry County are $100,000+ for men (914 | 8.3%) and $25,000 to $29,999 for women (937 | 8.5%).
| Income | Male | Female |
| $2,499 or less | 436 (4.0%) | 414 (3.7%) |
| $2,500 to $4,999 | 245 (2.2%) | 458 (4.1%) |
| $5,000 to $7,499 | 311 (2.8%) | 537 (4.9%) |
| $7,500 to $9,999 | 316 (2.9%) | 360 (3.3%) |
| $10,000 to $12,499 | 311 (2.8%) | 673 (6.1%) |
| $12,500 to $14,999 | 241 (2.2%) | 507 (4.6%) |
| $15,000 to $17,499 | 399 (3.6%) | 484 (4.4%) |
| $17,500 to $19,999 | 307 (2.8%) | 477 (4.3%) |
| $20,000 to $22,499 | 462 (4.2%) | 396 (3.6%) |
| $22,500 to $24,999 | 390 (3.5%) | 538 (4.9%) |
| $25,000 to $29,999 | 829 (7.5%) | 937 (8.5%) |
| $30,000 to $34,999 | 887 (8.1%) | 810 (7.3%) |
| $35,000 to $39,999 | 795 (7.2%) | 857 (7.7%) |
| $40,000 to $44,999 | 597 (5.4%) | 637 (5.8%) |
| $45,000 to $49,999 | 839 (7.6%) | 680 (6.1%) |
| $50,000 to $54,999 | 359 (3.3%) | 426 (3.8%) |
| $55,000 to $64,999 | 707 (6.4%) | 819 (7.4%) |
| $65,000 to $74,999 | 873 (7.9%) | 495 (4.5%) |
| $75,000 to $99,999 | 785 (7.1%) | 327 (3.0%) |
| $100,000+ | 914 (8.3%) | 230 (2.1%) |
| Total | 11,003 (100.0%) | 11,062 (100.0%) |
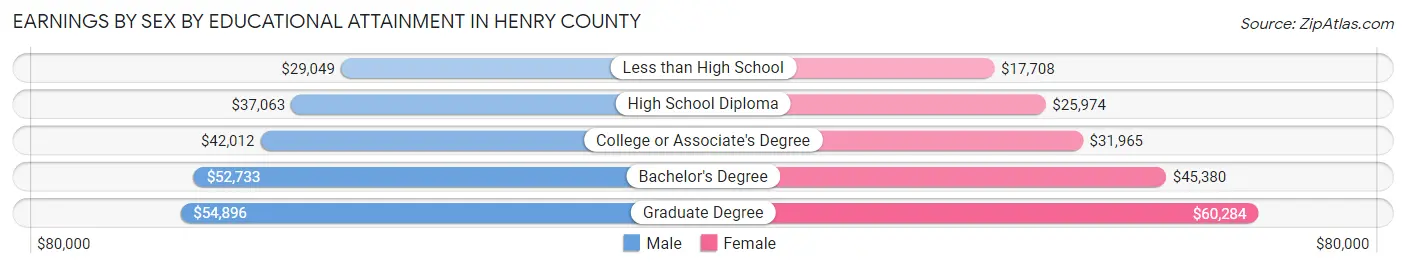
Earnings by Sex by Educational Attainment in Henry County
Average earnings in Henry County are $41,036 for men and $31,764 for women, a difference of 22.6%. Men with an educational attainment of graduate degree enjoy the highest average annual earnings of $54,896, while those with less than high school education earn the least with $29,049. Women with an educational attainment of graduate degree earn the most with the average annual earnings of $60,284, while those with less than high school education have the smallest earnings of $17,708.
| Educational Attainment | Male Income | Female Income |
| Less than High School | $29,049 | $17,708 |
| High School Diploma | $37,063 | $25,974 |
| College or Associate's Degree | $42,012 | $31,965 |
| Bachelor's Degree | $52,733 | $45,380 |
| Graduate Degree | $54,896 | $60,284 |
| Total | $41,036 | $31,764 |
Family Income in Henry County
Family Income Brackets in Henry County
According to the Henry County family income data, there are 2,637 families falling into the $50,000 to $74,999 income range, which is the most common income bracket and makes up 22.5% of all families. Conversely, the $200,000+ income bracket is the least frequent group with only 246 families (2.1%) belonging to this category.
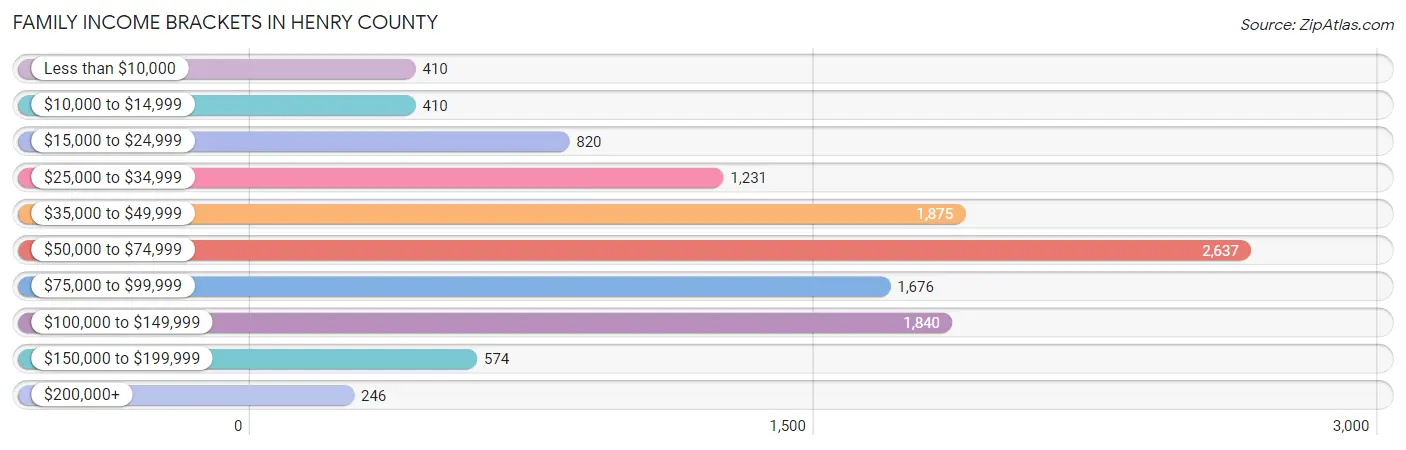
| Income Bracket | # Families | % Families |
| Less than $10,000 | 410 | 3.5% |
| $10,000 to $14,999 | 410 | 3.5% |
| $15,000 to $24,999 | 820 | 7.0% |
| $25,000 to $34,999 | 1,231 | 10.5% |
| $35,000 to $49,999 | 1,875 | 16.0% |
| $50,000 to $74,999 | 2,637 | 22.5% |
| $75,000 to $99,999 | 1,676 | 14.3% |
| $100,000 to $149,999 | 1,840 | 15.7% |
| $150,000 to $199,999 | 574 | 4.9% |
| $200,000+ | 246 | 2.1% |
Family Income by Famaliy Size in Henry County
7+ person families (80 | 0.7%) account for the highest median family income in Henry County with $82,424 per family, while 2-person families (6,694 | 57.1%) have the highest median income of $27,053 per family member.
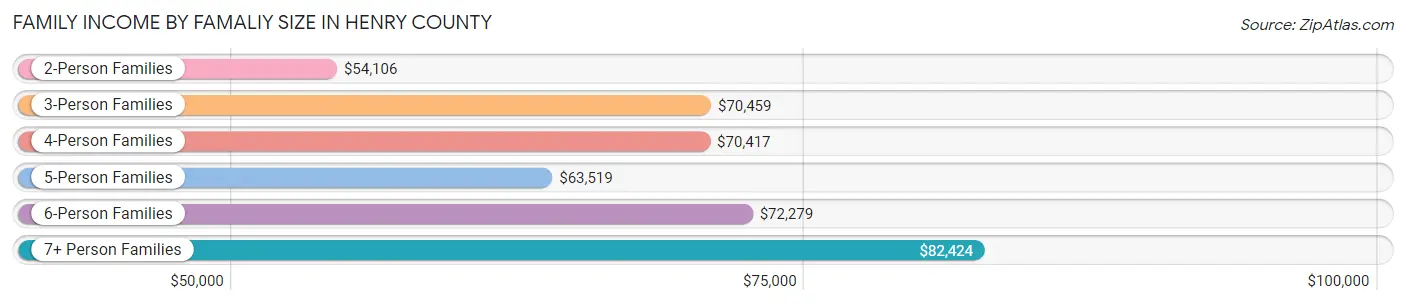
| Income Bracket | # Families | Median Income |
| 2-Person Families | 6,694 (57.1%) | $54,106 |
| 3-Person Families | 2,913 (24.8%) | $70,459 |
| 4-Person Families | 1,211 (10.3%) | $70,417 |
| 5-Person Families | 400 (3.4%) | $63,519 |
| 6-Person Families | 422 (3.6%) | $72,279 |
| 7+ Person Families | 80 (0.7%) | $82,424 |
| Total | 11,720 (100.0%) | $60,737 |
Family Income by Number of Earners in Henry County
The median family income in Henry County is $60,737, with families comprising 3+ earners (712) having the highest median family income of $106,129, while families with no earners (3,144) have the lowest median family income of $35,533, accounting for 6.1% and 26.8% of families, respectively.
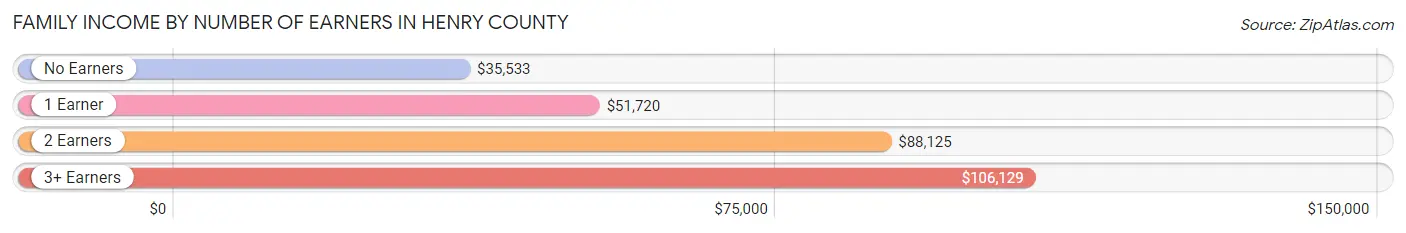
| Number of Earners | # Families | Median Income |
| No Earners | 3,144 (26.8%) | $35,533 |
| 1 Earner | 3,589 (30.6%) | $51,720 |
| 2 Earners | 4,275 (36.5%) | $88,125 |
| 3+ Earners | 712 (6.1%) | $106,129 |
| Total | 11,720 (100.0%) | $60,737 |
Household Income in Henry County
Household Income Brackets in Henry County
With 3,694 households falling in the category, the $50,000 to $74,999 income range is the most frequent in Henry County, accounting for 18.1% of all households. In contrast, only 306 households (1.5%) fall into the $200,000+ income bracket, making it the least populous group.
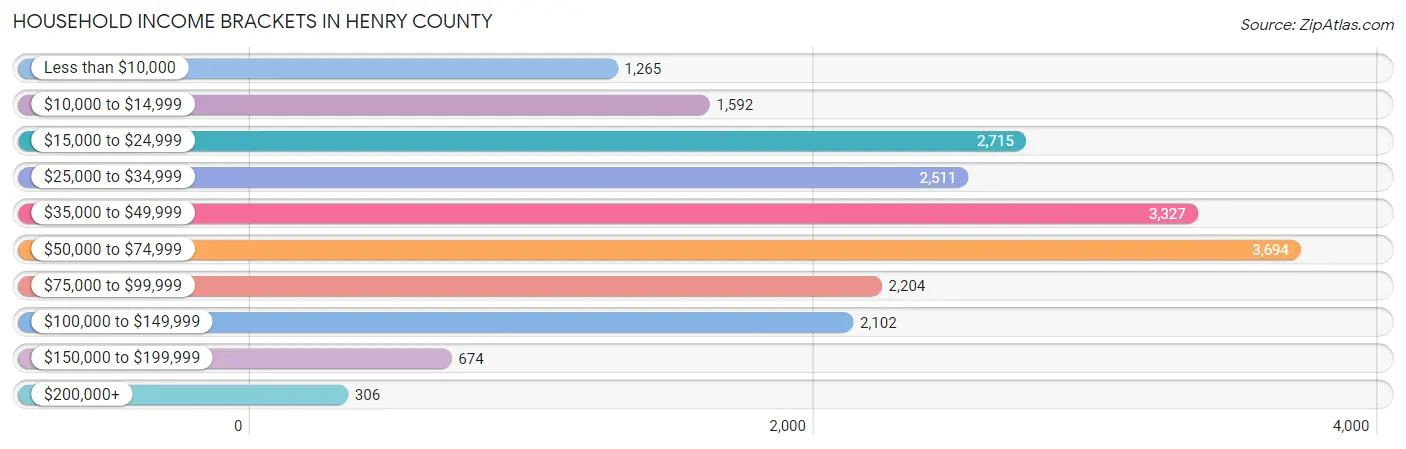
| Income Bracket | # Households | % Households |
| Less than $10,000 | 1,265 | 6.2% |
| $10,000 to $14,999 | 1,592 | 7.8% |
| $15,000 to $24,999 | 2,715 | 13.3% |
| $25,000 to $34,999 | 2,511 | 12.3% |
| $35,000 to $49,999 | 3,327 | 16.3% |
| $50,000 to $74,999 | 3,694 | 18.1% |
| $75,000 to $99,999 | 2,204 | 10.8% |
| $100,000 to $149,999 | 2,102 | 10.3% |
| $150,000 to $199,999 | 674 | 3.3% |
| $200,000+ | 306 | 1.5% |
Household Income by Householder Age in Henry County
The median household income in Henry County is $43,694, with the highest median household income of $55,955 found in the 45 to 64 years age bracket for the primary householder. A total of 7,704 households (37.7%) fall into this category. Meanwhile, the 65+ years age bracket for the primary householder has the lowest median household income of $34,952, with 7,823 households (38.3%) in this group.
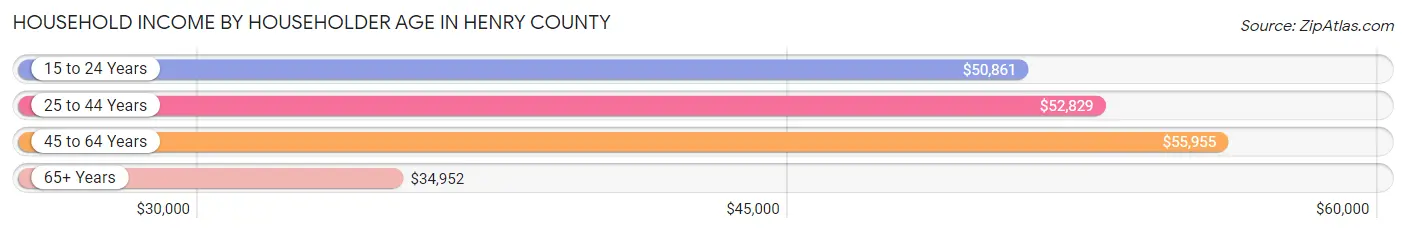
| Income Bracket | # Households | Median Income |
| 15 to 24 Years | 421 (2.1%) | $50,861 |
| 25 to 44 Years | 4,463 (21.9%) | $52,829 |
| 45 to 64 Years | 7,704 (37.7%) | $55,955 |
| 65+ Years | 7,823 (38.3%) | $34,952 |
| Total | 20,411 (100.0%) | $43,694 |
Poverty in Henry County
Income Below Poverty by Sex and Age in Henry County
With 14.0% poverty level for males and 18.1% for females among the residents of Henry County, under 5 year old males and 5 year old females are the most vulnerable to poverty, with 329 males (31.7%) and 137 females (45.8%) in their respective age groups living below the poverty level.
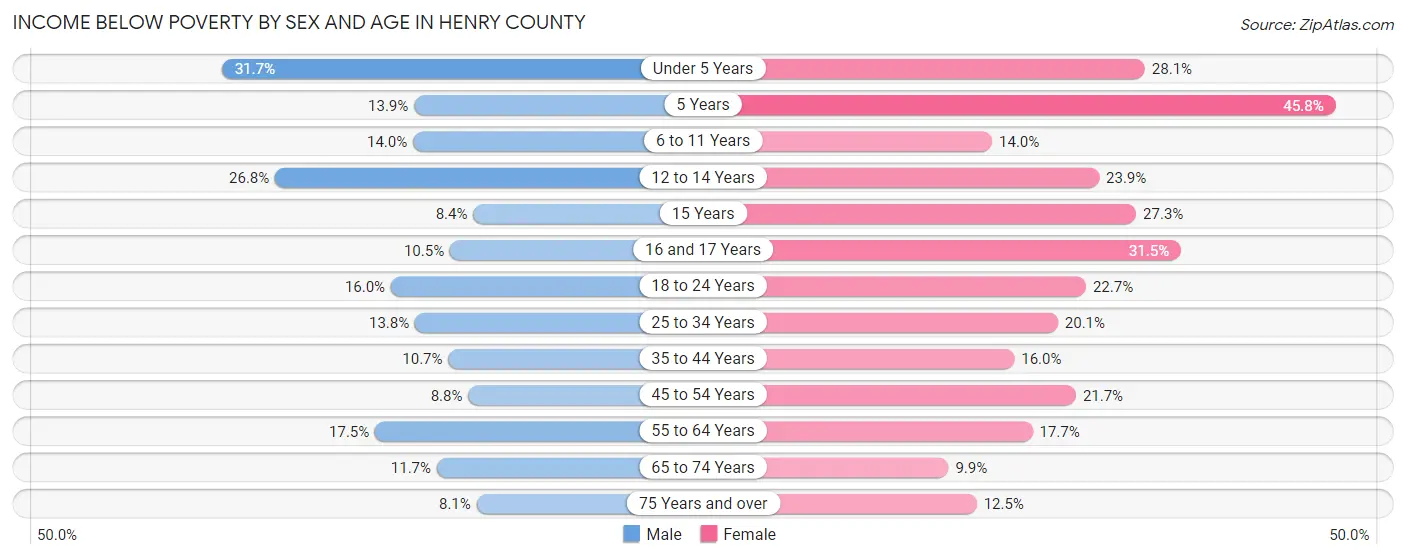
| Age Bracket | Male | Female |
| Under 5 Years | 329 (31.7%) | 310 (28.1%) |
| 5 Years | 18 (13.9%) | 137 (45.8%) |
| 6 to 11 Years | 221 (14.0%) | 218 (14.0%) |
| 12 to 14 Years | 302 (26.8%) | 207 (23.9%) |
| 15 Years | 26 (8.4%) | 156 (27.3%) |
| 16 and 17 Years | 61 (10.5%) | 130 (31.5%) |
| 18 to 24 Years | 282 (16.0%) | 400 (22.7%) |
| 25 to 34 Years | 333 (13.8%) | 510 (20.1%) |
| 35 to 44 Years | 273 (10.7%) | 423 (16.0%) |
| 45 to 54 Years | 281 (8.8%) | 744 (21.7%) |
| 55 to 64 Years | 673 (17.5%) | 709 (17.7%) |
| 65 to 74 Years | 357 (11.7%) | 346 (9.9%) |
| 75 Years and over | 187 (8.1%) | 402 (12.5%) |
| Total | 3,343 (14.0%) | 4,692 (18.1%) |
Income Above Poverty by Sex and Age in Henry County
According to the poverty statistics in Henry County, males aged 75 years and over and females aged 65 to 74 years are the age groups that are most secure financially, with 91.9% of males and 90.1% of females in these age groups living above the poverty line.
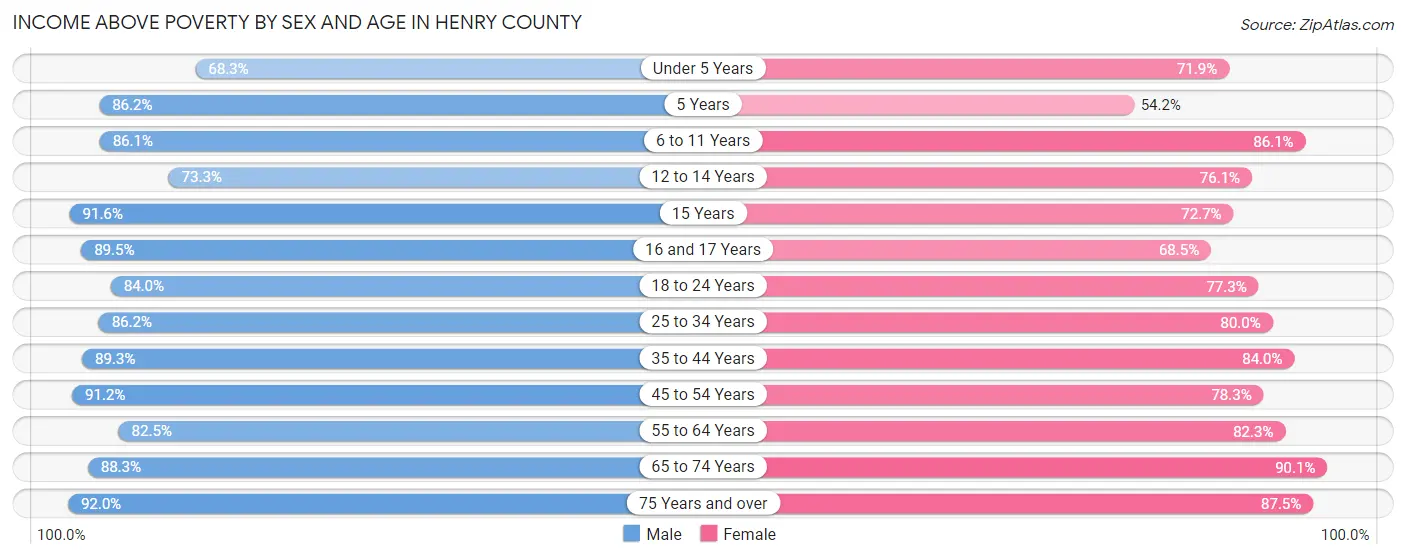
| Age Bracket | Male | Female |
| Under 5 Years | 709 (68.3%) | 792 (71.9%) |
| 5 Years | 112 (86.2%) | 162 (54.2%) |
| 6 to 11 Years | 1,363 (86.1%) | 1,345 (86.1%) |
| 12 to 14 Years | 827 (73.3%) | 660 (76.1%) |
| 15 Years | 285 (91.6%) | 415 (72.7%) |
| 16 and 17 Years | 519 (89.5%) | 283 (68.5%) |
| 18 to 24 Years | 1,480 (84.0%) | 1,365 (77.3%) |
| 25 to 34 Years | 2,087 (86.2%) | 2,034 (79.9%) |
| 35 to 44 Years | 2,286 (89.3%) | 2,219 (84.0%) |
| 45 to 54 Years | 2,906 (91.2%) | 2,680 (78.3%) |
| 55 to 64 Years | 3,179 (82.5%) | 3,296 (82.3%) |
| 65 to 74 Years | 2,684 (88.3%) | 3,148 (90.1%) |
| 75 Years and over | 2,135 (91.9%) | 2,810 (87.5%) |
| Total | 20,572 (86.0%) | 21,209 (81.9%) |
Income Below Poverty Among Married-Couple Families in Henry County
The poverty statistics for married-couple families in Henry County show that 6.2% or 532 of the total 8,514 families live below the poverty line. Families with 3 or 4 children have the highest poverty rate of 17.9%, comprising of 84 families. On the other hand, families with 5 or more children have the lowest poverty rate of 0.0%, which includes 0 families.
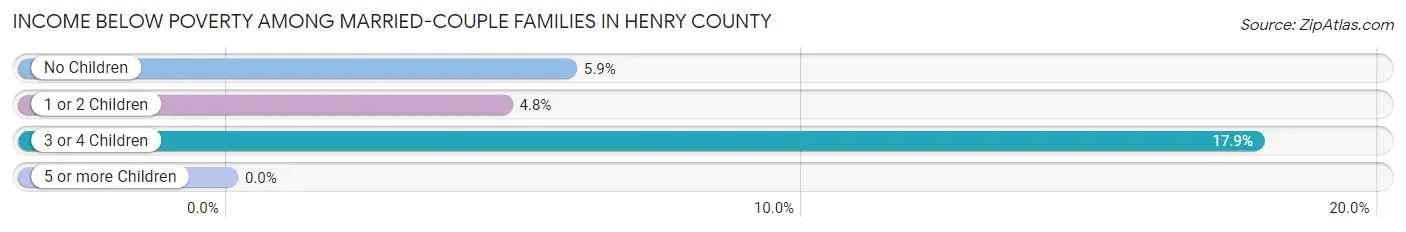
| Children | Above Poverty | Below Poverty |
| No Children | 5,490 (94.1%) | 344 (5.9%) |
| 1 or 2 Children | 2,073 (95.2%) | 104 (4.8%) |
| 3 or 4 Children | 386 (82.1%) | 84 (17.9%) |
| 5 or more Children | 33 (100.0%) | 0 (0.0%) |
| Total | 7,982 (93.8%) | 532 (6.2%) |
Income Below Poverty Among Single-Parent Households in Henry County
According to the poverty data in Henry County, 15.7% or 171 single-father households and 31.7% or 672 single-mother households are living below the poverty line. Among single-father households, those with 3 or 4 children have the highest poverty rate, with 56 households (56.6%) experiencing poverty. Likewise, among single-mother households, those with 3 or 4 children have the highest poverty rate, with 74 households (89.2%) falling below the poverty line.
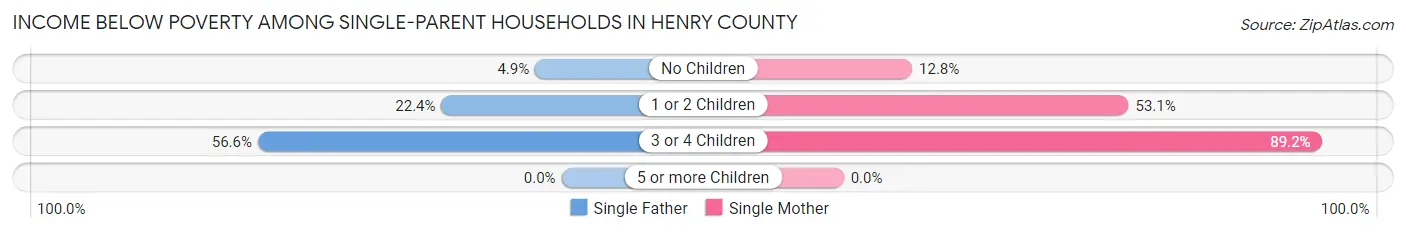
| Children | Single Father | Single Mother |
| No Children | 30 (4.9%) | 147 (12.8%) |
| 1 or 2 Children | 85 (22.4%) | 451 (53.1%) |
| 3 or 4 Children | 56 (56.6%) | 74 (89.2%) |
| 5 or more Children | 0 (0.0%) | 0 (0.0%) |
| Total | 171 (15.7%) | 672 (31.7%) |
Income Below Poverty Among Married-Couple vs Single-Parent Households in Henry County
The poverty data for Henry County shows that 532 of the married-couple family households (6.2%) and 843 of the single-parent households (26.3%) are living below the poverty level. Within the married-couple family households, those with 3 or 4 children have the highest poverty rate, with 84 households (17.9%) falling below the poverty line. Among the single-parent households, those with 3 or 4 children have the highest poverty rate, with 130 household (71.4%) living below poverty.
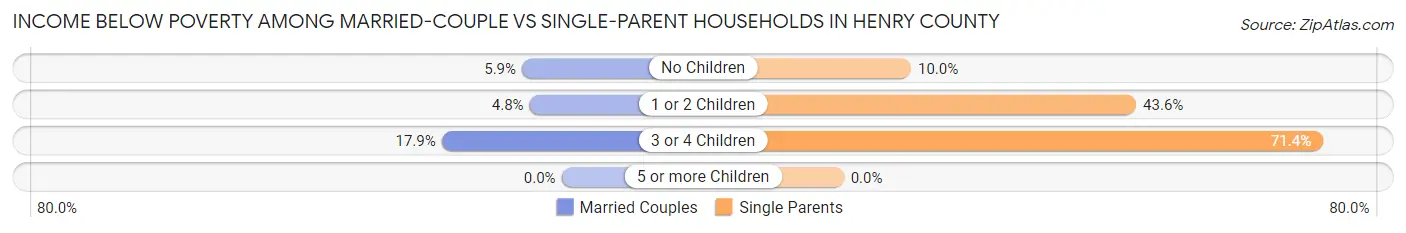
| Children | Married-Couple Families | Single-Parent Households |
| No Children | 344 (5.9%) | 177 (10.0%) |
| 1 or 2 Children | 104 (4.8%) | 536 (43.6%) |
| 3 or 4 Children | 84 (17.9%) | 130 (71.4%) |
| 5 or more Children | 0 (0.0%) | 0 (0.0%) |
| Total | 532 (6.2%) | 843 (26.3%) |
Race in Henry County
The most populous races in Henry County are White / Caucasian (35,943 | 70.8%), Black / African American (11,636 | 22.9%), and Hispanic or Latino (3,070 | 6.0%).
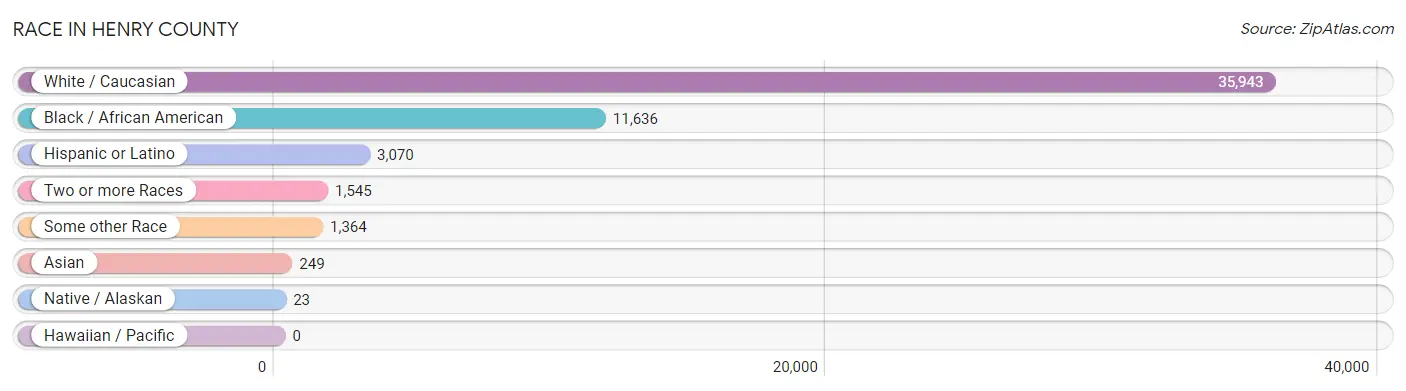
| Race | # Population | % Population |
| Asian | 249 | 0.5% |
| Black / African American | 11,636 | 22.9% |
| Hawaiian / Pacific | 0 | 0.0% |
| Hispanic or Latino | 3,070 | 6.0% |
| Native / Alaskan | 23 | 0.1% |
| White / Caucasian | 35,943 | 70.8% |
| Two or more Races | 1,545 | 3.0% |
| Some other Race | 1,364 | 2.7% |
| Total | 50,760 | 100.0% |
Ancestry in Henry County
The most populous ancestries reported in Henry County are American (12,279 | 24.2%), English (4,543 | 8.9%), Irish (3,056 | 6.0%), German (2,497 | 4.9%), and Mexican (1,870 | 3.7%), together accounting for 47.8% of all Henry County residents.
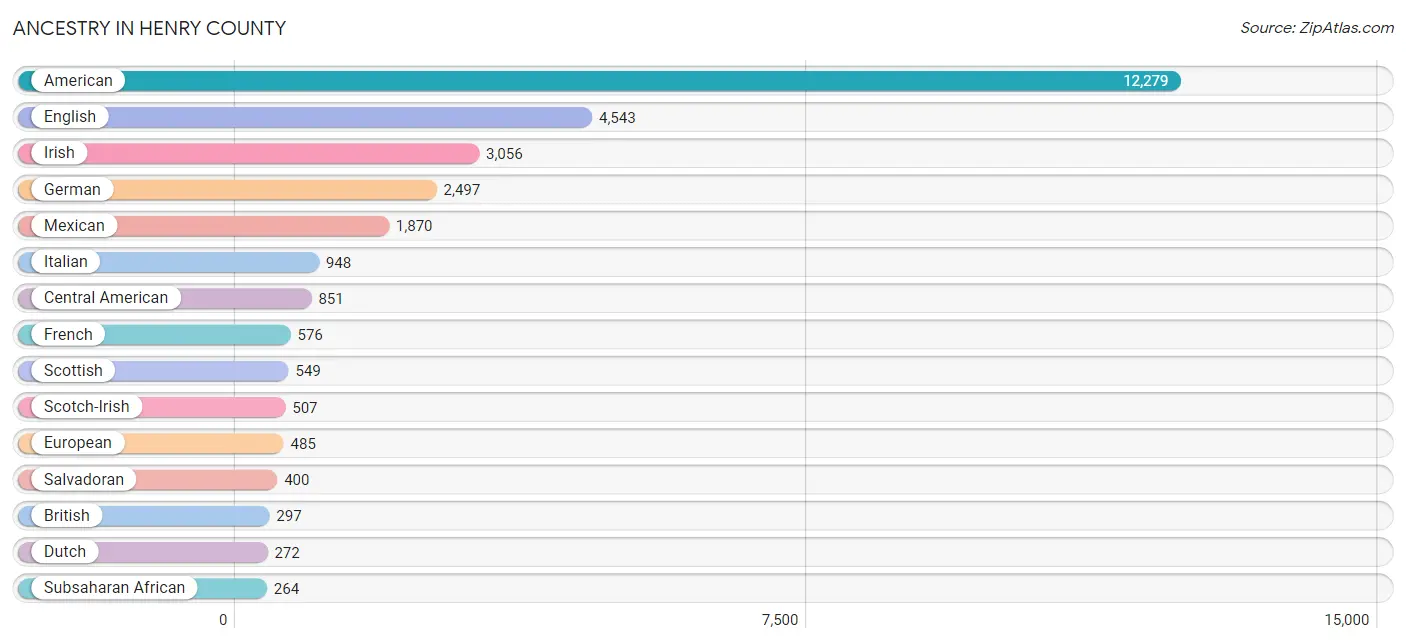
| Ancestry | # Population | % Population |
| African | 134 | 0.3% |
| American | 12,279 | 24.2% |
| Arab | 99 | 0.2% |
| Barbadian | 5 | 0.0% |
| Belgian | 15 | 0.0% |
| Bhutanese | 43 | 0.1% |
| Blackfeet | 4 | 0.0% |
| British | 297 | 0.6% |
| Burmese | 90 | 0.2% |
| Cajun | 15 | 0.0% |
| Cambodian | 10 | 0.0% |
| Central American | 851 | 1.7% |
| Cherokee | 175 | 0.3% |
| Croatian | 2 | 0.0% |
| Cuban | 22 | 0.0% |
| Czechoslovakian | 16 | 0.0% |
| Danish | 32 | 0.1% |
| Dominican | 24 | 0.1% |
| Dutch | 272 | 0.5% |
| Eastern European | 8 | 0.0% |
| Egyptian | 87 | 0.2% |
| English | 4,543 | 8.9% |
| European | 485 | 1.0% |
| French | 576 | 1.1% |
| French Canadian | 9 | 0.0% |
| German | 2,497 | 4.9% |
| Greek | 10 | 0.0% |
| Guatemalan | 177 | 0.4% |
| Honduran | 263 | 0.5% |
| Hungarian | 9 | 0.0% |
| Indian (Asian) | 36 | 0.1% |
| Irish | 3,056 | 6.0% |
| Iroquois | 4 | 0.0% |
| Italian | 948 | 1.9% |
| Korean | 4 | 0.0% |
| Mexican | 1,870 | 3.7% |
| Norwegian | 47 | 0.1% |
| Palestinian | 9 | 0.0% |
| Panamanian | 11 | 0.0% |
| Polish | 229 | 0.4% |
| Portuguese | 41 | 0.1% |
| Puerto Rican | 205 | 0.4% |
| Romanian | 9 | 0.0% |
| Russian | 96 | 0.2% |
| Salvadoran | 400 | 0.8% |
| Scandinavian | 17 | 0.0% |
| Scotch-Irish | 507 | 1.0% |
| Scottish | 549 | 1.1% |
| South African | 90 | 0.2% |
| Spaniard | 7 | 0.0% |
| Spanish | 5 | 0.0% |
| Sri Lankan | 88 | 0.2% |
| Subsaharan African | 264 | 0.5% |
| Swedish | 7 | 0.0% |
| Swiss | 69 | 0.1% |
| Thai | 129 | 0.3% |
| Ukrainian | 27 | 0.1% |
| Welsh | 149 | 0.3% | View All 58 Rows |
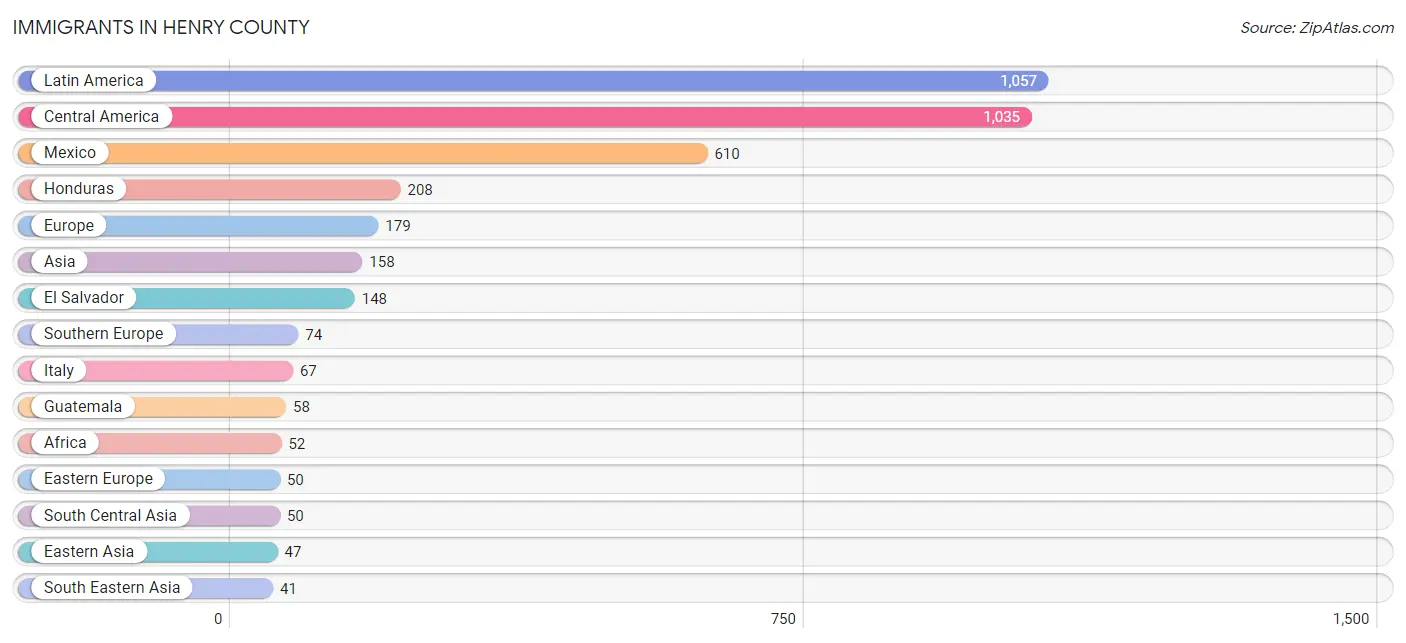
Immigrants in Henry County
The most numerous immigrant groups reported in Henry County came from Latin America (1,057 | 2.1%), Central America (1,035 | 2.0%), Mexico (610 | 1.2%), Honduras (208 | 0.4%), and Europe (179 | 0.4%), together accounting for 6.1% of all Henry County residents.
| Immigration Origin | # Population | % Population |
| Africa | 52 | 0.1% |
| Asia | 158 | 0.3% |
| Bahamas | 17 | 0.0% |
| Brazil | 5 | 0.0% |
| Caribbean | 17 | 0.0% |
| Central America | 1,035 | 2.0% |
| Eastern Asia | 47 | 0.1% |
| Eastern Europe | 50 | 0.1% |
| Egypt | 27 | 0.1% |
| El Salvador | 148 | 0.3% |
| Europe | 179 | 0.4% |
| Germany | 30 | 0.1% |
| Ghana | 25 | 0.1% |
| Guatemala | 58 | 0.1% |
| Honduras | 208 | 0.4% |
| India | 40 | 0.1% |
| Italy | 67 | 0.1% |
| Japan | 19 | 0.0% |
| Jordan | 9 | 0.0% |
| Kazakhstan | 10 | 0.0% |
| Korea | 28 | 0.1% |
| Latin America | 1,057 | 2.1% |
| Mexico | 610 | 1.2% |
| Netherlands | 8 | 0.0% |
| Northern Africa | 27 | 0.1% |
| Northern Europe | 17 | 0.0% |
| Panama | 11 | 0.0% |
| Philippines | 4 | 0.0% |
| Poland | 12 | 0.0% |
| Russia | 38 | 0.1% |
| South America | 5 | 0.0% |
| South Central Asia | 50 | 0.1% |
| South Eastern Asia | 41 | 0.1% |
| Southern Europe | 74 | 0.2% |
| Spain | 7 | 0.0% |
| Vietnam | 37 | 0.1% |
| Western Africa | 25 | 0.1% |
| Western Asia | 20 | 0.0% |
| Western Europe | 38 | 0.1% |
| Yemen | 11 | 0.0% | View All 40 Rows |
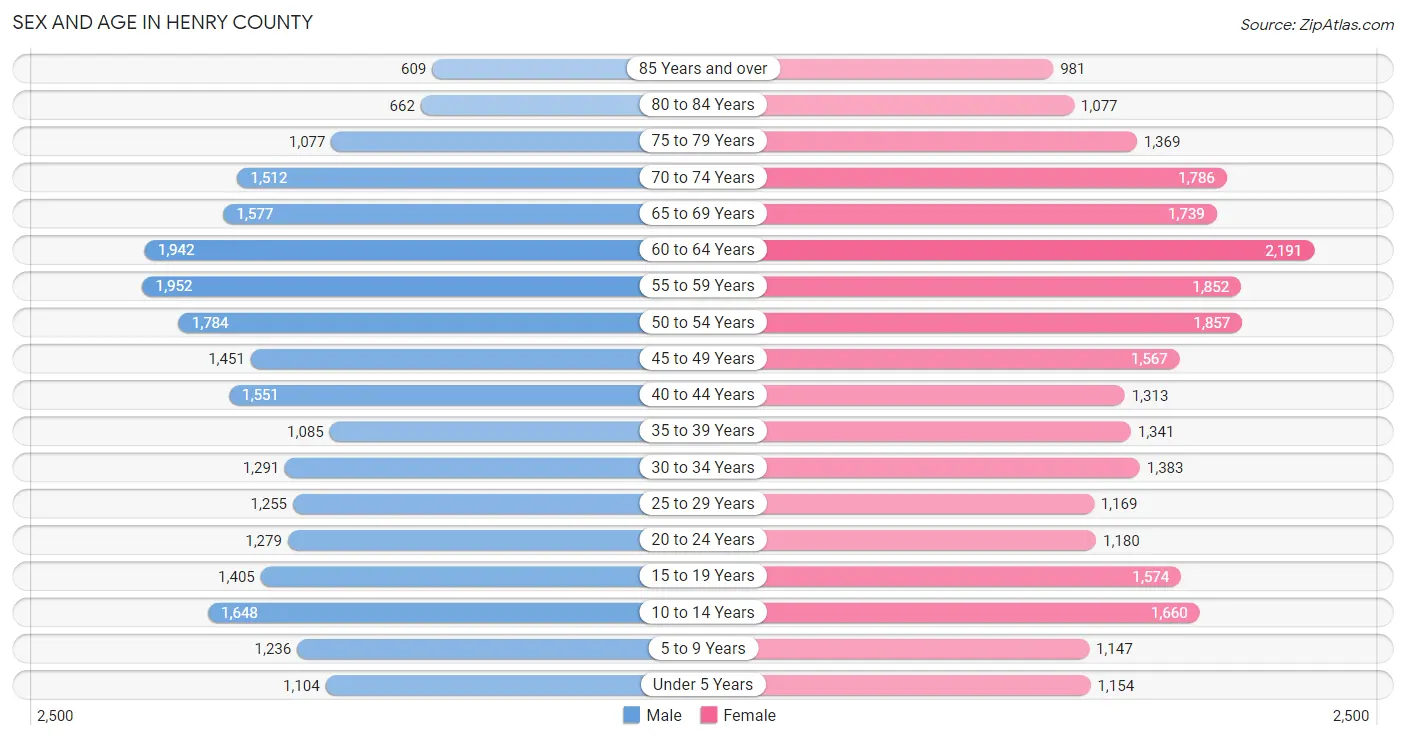
Sex and Age in Henry County
Sex and Age in Henry County
The most populous age groups in Henry County are 55 to 59 Years (1,952 | 8.0%) for men and 60 to 64 Years (2,191 | 8.3%) for women.
| Age Bracket | Male | Female |
| Under 5 Years | 1,104 (4.5%) | 1,154 (4.4%) |
| 5 to 9 Years | 1,236 (5.1%) | 1,147 (4.3%) |
| 10 to 14 Years | 1,648 (6.8%) | 1,660 (6.3%) |
| 15 to 19 Years | 1,405 (5.8%) | 1,574 (6.0%) |
| 20 to 24 Years | 1,279 (5.2%) | 1,180 (4.5%) |
| 25 to 29 Years | 1,255 (5.1%) | 1,169 (4.4%) |
| 30 to 34 Years | 1,291 (5.3%) | 1,383 (5.2%) |
| 35 to 39 Years | 1,085 (4.4%) | 1,341 (5.1%) |
| 40 to 44 Years | 1,551 (6.4%) | 1,313 (5.0%) |
| 45 to 49 Years | 1,451 (5.9%) | 1,567 (5.9%) |
| 50 to 54 Years | 1,784 (7.3%) | 1,857 (7.0%) |
| 55 to 59 Years | 1,952 (8.0%) | 1,852 (7.0%) |
| 60 to 64 Years | 1,942 (8.0%) | 2,191 (8.3%) |
| 65 to 69 Years | 1,577 (6.5%) | 1,739 (6.6%) |
| 70 to 74 Years | 1,512 (6.2%) | 1,786 (6.8%) |
| 75 to 79 Years | 1,077 (4.4%) | 1,369 (5.2%) |
| 80 to 84 Years | 662 (2.7%) | 1,077 (4.1%) |
| 85 Years and over | 609 (2.5%) | 981 (3.7%) |
| Total | 24,420 (100.0%) | 26,340 (100.0%) |
Families and Households in Henry County
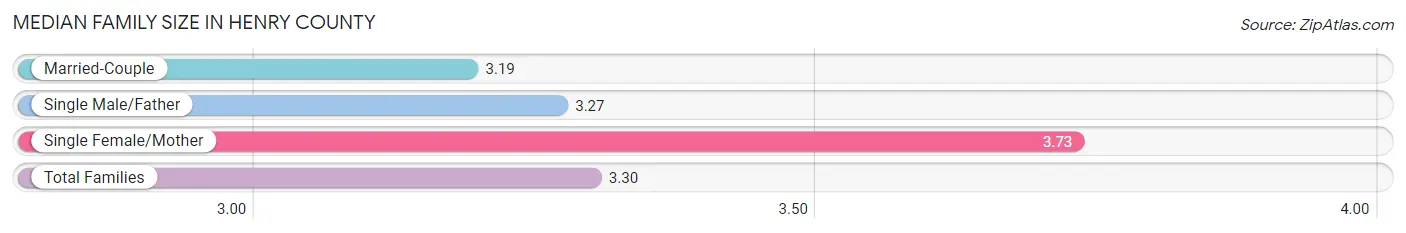
Median Family Size in Henry County
The median family size in Henry County is 3.30 persons per family, with single female/mother families (2,117 | 18.1%) accounting for the largest median family size of 3.73 persons per family. On the other hand, married-couple families (8,514 | 72.7%) represent the smallest median family size with 3.19 persons per family.
| Family Type | # Families | Family Size |
| Married-Couple | 8,514 (72.7%) | 3.19 |
| Single Male/Father | 1,089 (9.3%) | 3.27 |
| Single Female/Mother | 2,117 (18.1%) | 3.73 |
| Total Families | 11,720 (100.0%) | 3.30 |
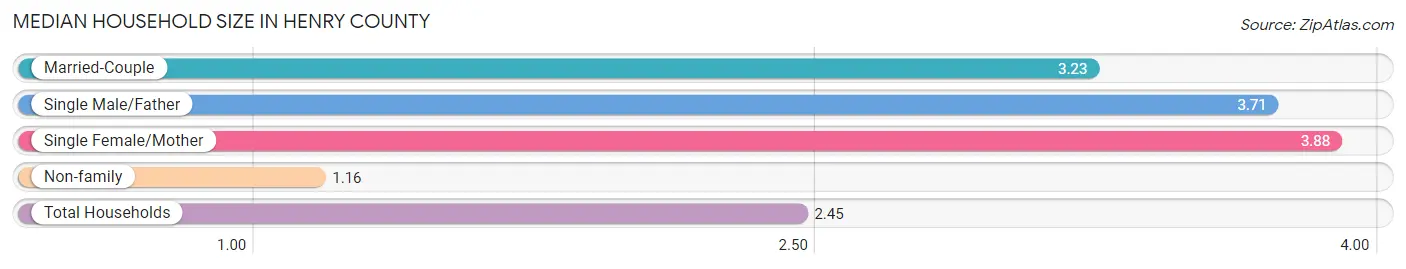
Median Household Size in Henry County
The median household size in Henry County is 2.45 persons per household, with single female/mother households (2,117 | 10.4%) accounting for the largest median household size of 3.88 persons per household. non-family households (8,691 | 42.6%) represent the smallest median household size with 1.16 persons per household.
| Household Type | # Households | Household Size |
| Married-Couple | 8,514 (41.7%) | 3.23 |
| Single Male/Father | 1,089 (5.3%) | 3.71 |
| Single Female/Mother | 2,117 (10.4%) | 3.88 |
| Non-family | 8,691 (42.6%) | 1.16 |
| Total Households | 20,411 (100.0%) | 2.45 |
Household Size by Marriage Status in Henry County
Out of a total of 20,411 households in Henry County, 11,720 (57.4%) are family households, while 8,691 (42.6%) are nonfamily households. The most numerous type of family households are 2-person households, comprising 6,412, and the most common type of nonfamily households are 1-person households, comprising 7,654.
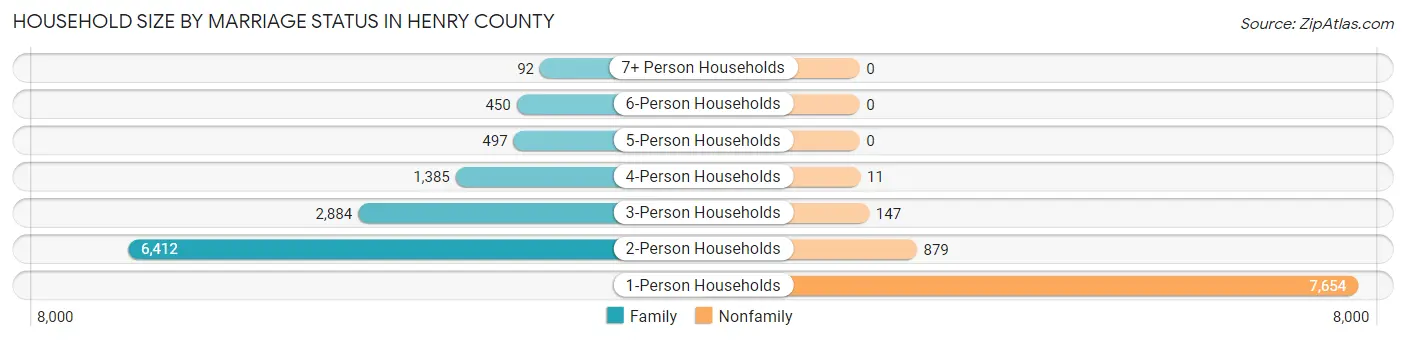
| Household Size | Family Households | Nonfamily Households |
| 1-Person Households | - | 7,654 (37.5%) |
| 2-Person Households | 6,412 (31.4%) | 879 (4.3%) |
| 3-Person Households | 2,884 (14.1%) | 147 (0.7%) |
| 4-Person Households | 1,385 (6.8%) | 11 (0.1%) |
| 5-Person Households | 497 (2.4%) | 0 (0.0%) |
| 6-Person Households | 450 (2.2%) | 0 (0.0%) |
| 7+ Person Households | 92 (0.4%) | 0 (0.0%) |
| Total | 11,720 (57.4%) | 8,691 (42.6%) |
Female Fertility in Henry County
Fertility by Age in Henry County
Average fertility rate in Henry County is 45.0 births per 1,000 women. Women in the age bracket of 20 to 34 years have the highest fertility rate with 87.0 births per 1,000 women. Women in the age bracket of 20 to 34 years acount for 73.6% of all women with births.
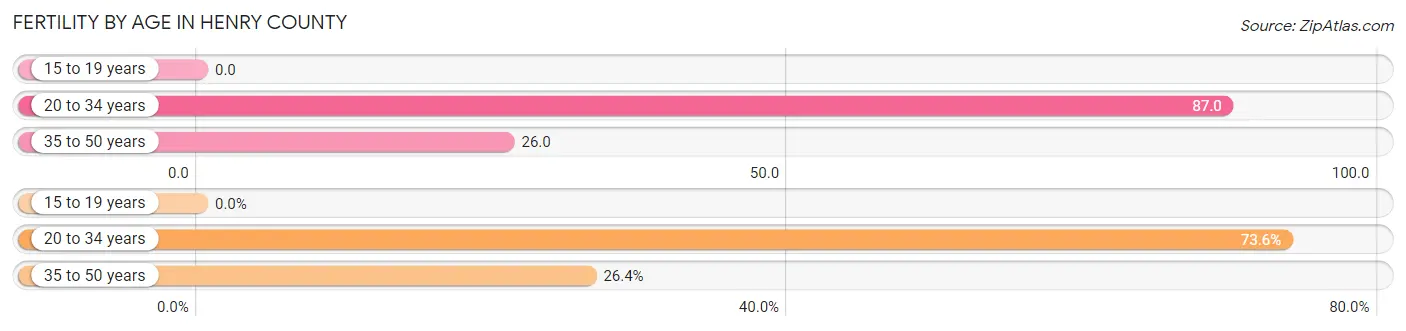
| Age Bracket | Women with Births | Births / 1,000 Women |
| 15 to 19 years | 0 (0.0%) | 0.0 |
| 20 to 34 years | 324 (73.6%) | 87.0 |
| 35 to 50 years | 116 (26.4%) | 26.0 |
| Total | 440 (100.0%) | 45.0 |
Fertility by Age by Marriage Status in Henry County
42.5% of women with births (440) in Henry County are married. The highest percentage of unmarried women with births falls into 35 to 50 years age bracket with 87.1% of them unmarried at the time of birth, while the lowest percentage of unmarried women with births belong to 20 to 34 years age bracket with 46.9% of them unmarried.
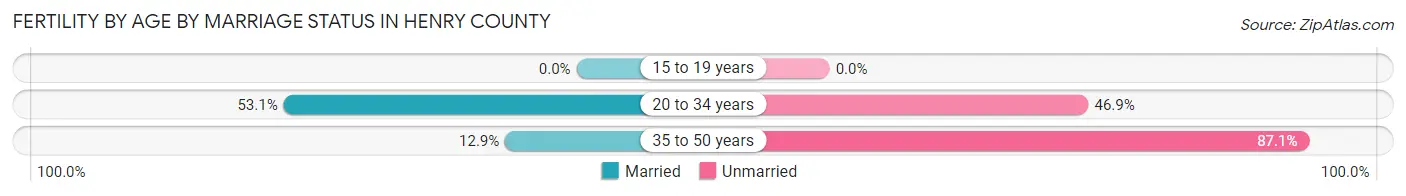
| Age Bracket | Married | Unmarried |
| 15 to 19 years | 0 (0.0%) | 0 (0.0%) |
| 20 to 34 years | 172 (53.1%) | 152 (46.9%) |
| 35 to 50 years | 15 (12.9%) | 101 (87.1%) |
| Total | 187 (42.5%) | 253 (57.5%) |
Fertility by Education in Henry County
Average fertility rate in Henry County is 45.0 births per 1,000 women. Women with the education attainment of high school diploma have the highest fertility rate of 71.0 births per 1,000 women, while women with the education attainment of bachelor's degree have the lowest fertility at 3.0 births per 1,000 women. Women with the education attainment of college or associate's degree represent 48.2% of all women with births.
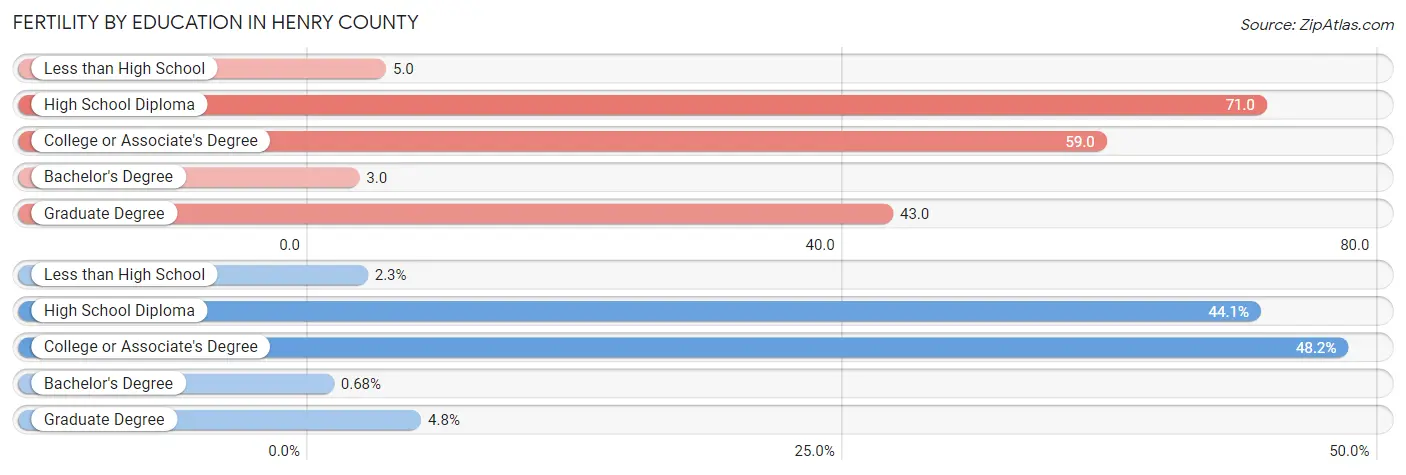
| Educational Attainment | Women with Births | Births / 1,000 Women |
| Less than High School | 10 (2.3%) | 5.0 |
| High School Diploma | 194 (44.1%) | 71.0 |
| College or Associate's Degree | 212 (48.2%) | 59.0 |
| Bachelor's Degree | 3 (0.7%) | 3.0 |
| Graduate Degree | 21 (4.8%) | 43.0 |
| Total | 440 (100.0%) | 45.0 |
Fertility by Education by Marriage Status in Henry County
57.5% of women with births in Henry County are unmarried. Women with the educational attainment of less than high school are most likely to be married with 100.0% of them married at childbirth, while women with the educational attainment of graduate degree are least likely to be married with 100.0% of them unmarried at childbirth.
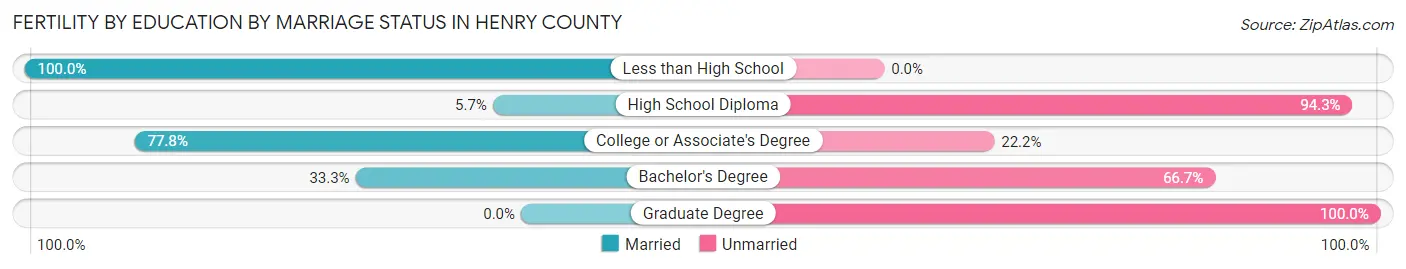
| Educational Attainment | Married | Unmarried |
| Less than High School | 10 (100.0%) | 0 (0.0%) |
| High School Diploma | 11 (5.7%) | 183 (94.3%) |
| College or Associate's Degree | 165 (77.8%) | 47 (22.2%) |
| Bachelor's Degree | 1 (33.3%) | 2 (66.7%) |
| Graduate Degree | 0 (0.0%) | 21 (100.0%) |
| Total | 187 (42.5%) | 253 (57.5%) |
Employment Characteristics in Henry County
Employment by Class of Employer in Henry County
Among the 19,464 employed individuals in Henry County, private company employees (13,793 | 70.9%), local government employees (1,882 | 9.7%), and not-for-profit organizations (1,234 | 6.3%) make up the most common classes of employment.
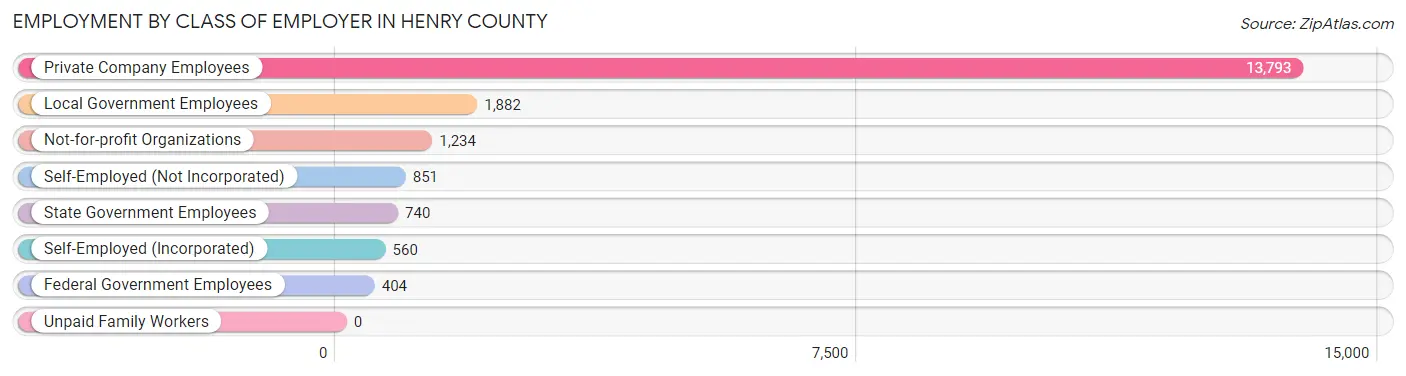
| Employer Class | # Employees | % Employees |
| Private Company Employees | 13,793 | 70.9% |
| Self-Employed (Incorporated) | 560 | 2.9% |
| Self-Employed (Not Incorporated) | 851 | 4.4% |
| Not-for-profit Organizations | 1,234 | 6.3% |
| Local Government Employees | 1,882 | 9.7% |
| State Government Employees | 740 | 3.8% |
| Federal Government Employees | 404 | 2.1% |
| Unpaid Family Workers | 0 | 0.0% |
| Total | 19,464 | 100.0% |
Employment Status by Age in Henry County
According to the labor force statistics for Henry County, out of the total population over 16 years of age (41,929), 51.1% or 21,426 individuals are in the labor force, with 5.2% or 1,114 of them unemployed. The age group with the highest labor force participation rate is 35 to 44 years, with 81.0% or 4,285 individuals in the labor force. Within the labor force, the 20 to 24 years age range has the highest percentage of unemployed individuals, with 9.0% or 169 of them being unemployed.
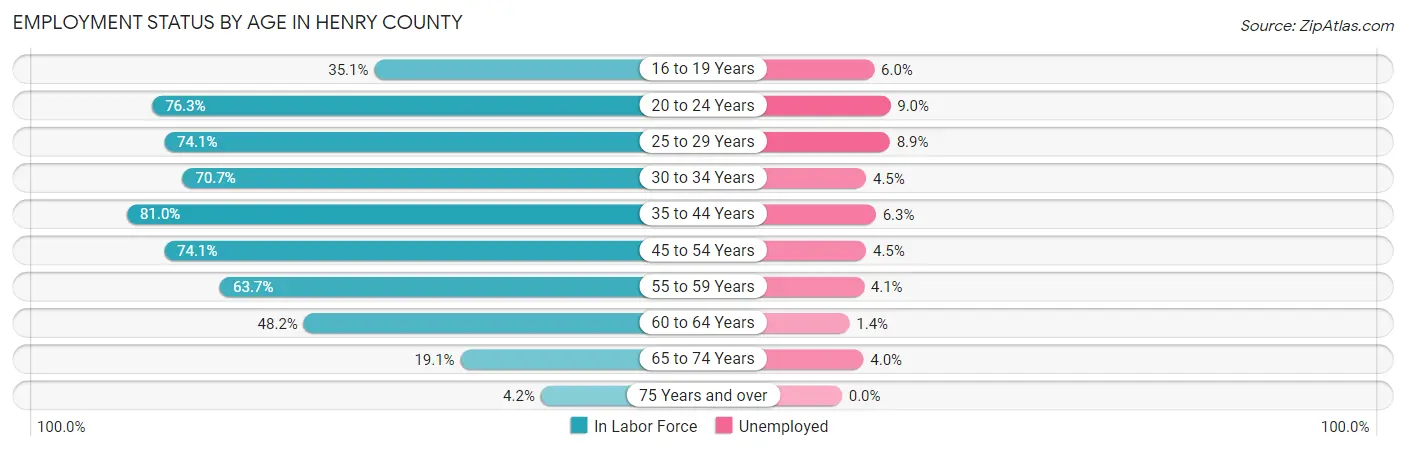
| Age Bracket | In Labor Force | Unemployed |
| 16 to 19 Years | 736 (35.1%) | 44 (6.0%) |
| 20 to 24 Years | 1,876 (76.3%) | 169 (9.0%) |
| 25 to 29 Years | 1,796 (74.1%) | 160 (8.9%) |
| 30 to 34 Years | 1,891 (70.7%) | 85 (4.5%) |
| 35 to 44 Years | 4,285 (81.0%) | 270 (6.3%) |
| 45 to 54 Years | 4,934 (74.1%) | 222 (4.5%) |
| 55 to 59 Years | 2,423 (63.7%) | 99 (4.1%) |
| 60 to 64 Years | 1,992 (48.2%) | 28 (1.4%) |
| 65 to 74 Years | 1,263 (19.1%) | 51 (4.0%) |
| 75 Years and over | 243 (4.2%) | 0 (0.0%) |
| Total | 21,426 (51.1%) | 1,114 (5.2%) |
Employment Status by Educational Attainment in Henry County
According to labor force statistics for Henry County, 69.3% of individuals (17,314) out of the total population between 25 and 64 years of age (24,984) are in the labor force, with 5.0% or 866 of them being unemployed. The group with the highest labor force participation rate are those with the educational attainment of bachelor's degree or higher, with 86.2% or 3,420 individuals in the labor force. Within the labor force, individuals with less than high school education have the highest percentage of unemployment, with 9.2% or 137 of them being unemployed.
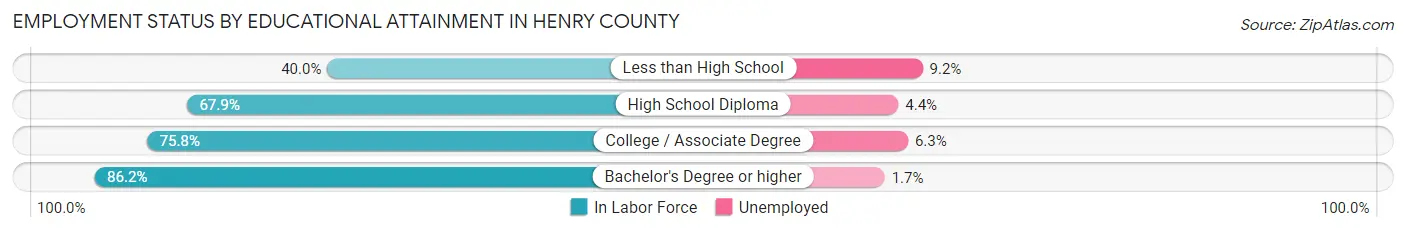
| Educational Attainment | In Labor Force | Unemployed |
| Less than High School | 1,485 (40.0%) | 342 (9.2%) |
| High School Diploma | 6,038 (67.9%) | 391 (4.4%) |
| College / Associate Degree | 6,376 (75.8%) | 530 (6.3%) |
| Bachelor's Degree or higher | 3,420 (86.2%) | 67 (1.7%) |
| Total | 17,314 (69.3%) | 1,249 (5.0%) |
Employment Occupations by Sex in Henry County
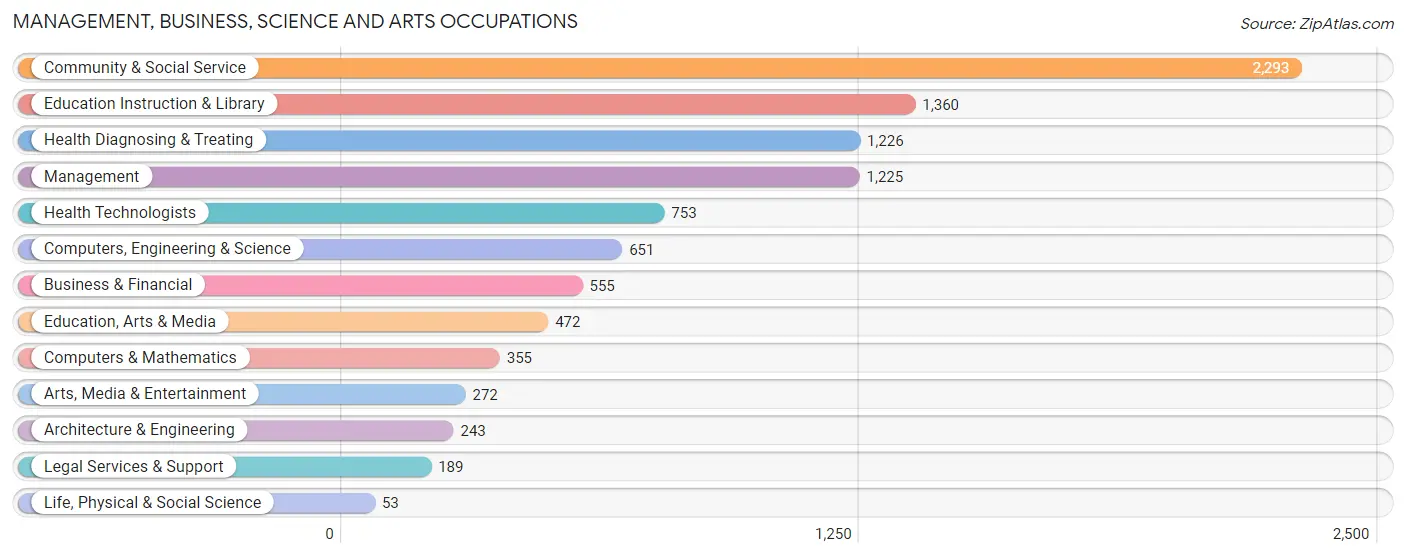
Management, Business, Science and Arts Occupations
The most common Management, Business, Science and Arts occupations in Henry County are Community & Social Service (2,293 | 11.4%), Education Instruction & Library (1,360 | 6.7%), Health Diagnosing & Treating (1,226 | 6.1%), Management (1,225 | 6.1%), and Health Technologists (753 | 3.7%).
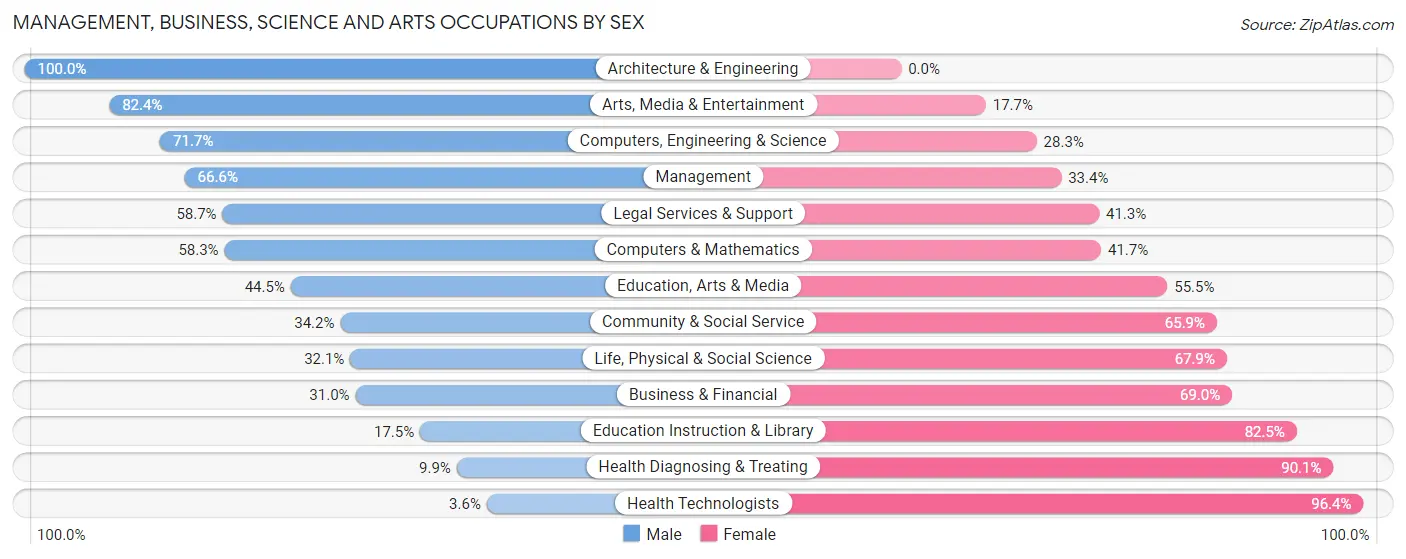
Management, Business, Science and Arts Occupations by Sex
Within the Management, Business, Science and Arts occupations in Henry County, the most male-oriented occupations are Architecture & Engineering (100.0%), Arts, Media & Entertainment (82.4%), and Computers, Engineering & Science (71.7%), while the most female-oriented occupations are Health Technologists (96.4%), Health Diagnosing & Treating (90.1%), and Education Instruction & Library (82.5%).
| Occupation | Male | Female |
| Management | 816 (66.6%) | 409 (33.4%) |
| Business & Financial | 172 (31.0%) | 383 (69.0%) |
| Computers, Engineering & Science | 467 (71.7%) | 184 (28.3%) |
| Computers & Mathematics | 207 (58.3%) | 148 (41.7%) |
| Architecture & Engineering | 243 (100.0%) | 0 (0.0%) |
| Life, Physical & Social Science | 17 (32.1%) | 36 (67.9%) |
| Community & Social Service | 783 (34.2%) | 1,510 (65.8%) |
| Education, Arts & Media | 210 (44.5%) | 262 (55.5%) |
| Legal Services & Support | 111 (58.7%) | 78 (41.3%) |
| Education Instruction & Library | 238 (17.5%) | 1,122 (82.5%) |
| Arts, Media & Entertainment | 224 (82.4%) | 48 (17.6%) |
| Health Diagnosing & Treating | 121 (9.9%) | 1,105 (90.1%) |
| Health Technologists | 27 (3.6%) | 726 (96.4%) |
| Total (Category) | 2,359 (39.7%) | 3,591 (60.4%) |
| Total (Overall) | 10,070 (49.9%) | 10,118 (50.1%) |
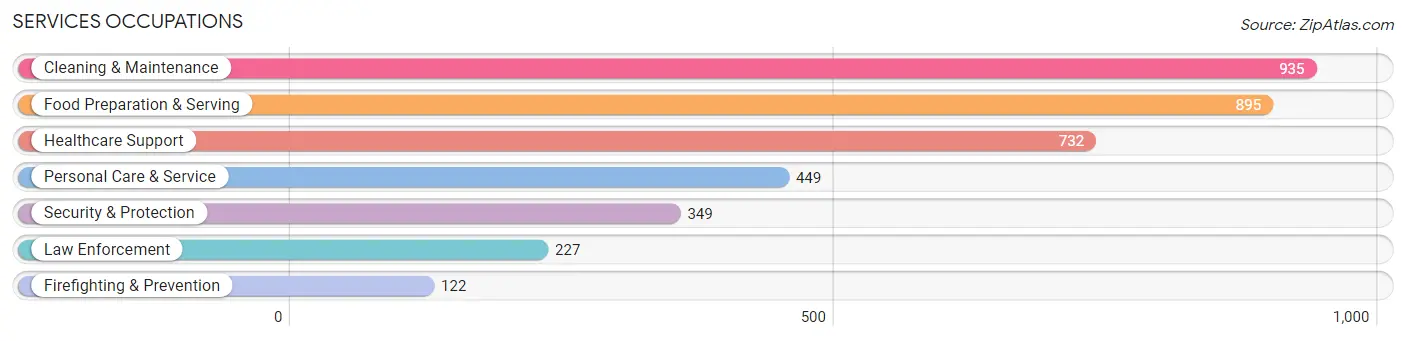
Services Occupations
The most common Services occupations in Henry County are Cleaning & Maintenance (935 | 4.6%), Food Preparation & Serving (895 | 4.4%), Healthcare Support (732 | 3.6%), Personal Care & Service (449 | 2.2%), and Security & Protection (349 | 1.7%).
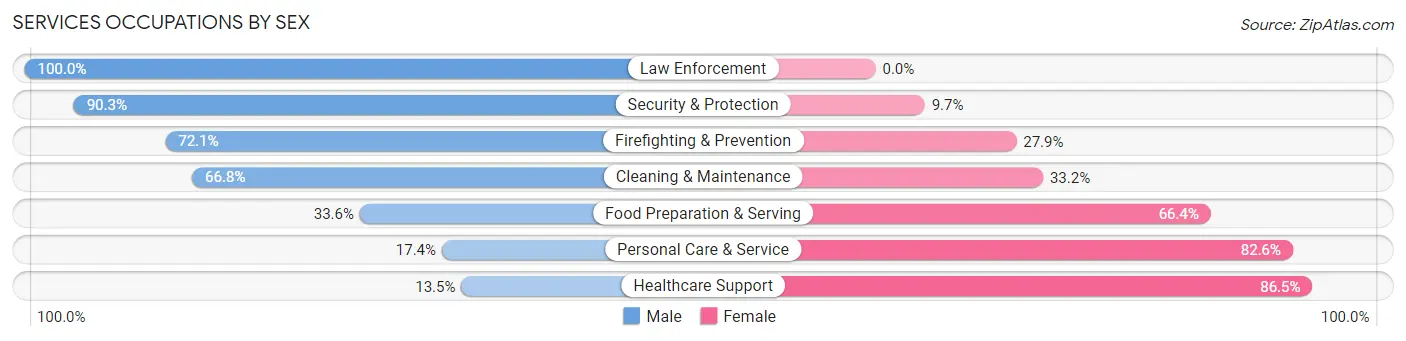
Services Occupations by Sex
Within the Services occupations in Henry County, the most male-oriented occupations are Law Enforcement (100.0%), Security & Protection (90.3%), and Firefighting & Prevention (72.1%), while the most female-oriented occupations are Healthcare Support (86.5%), Personal Care & Service (82.6%), and Food Preparation & Serving (66.4%).
| Occupation | Male | Female |
| Healthcare Support | 99 (13.5%) | 633 (86.5%) |
| Security & Protection | 315 (90.3%) | 34 (9.7%) |
| Firefighting & Prevention | 88 (72.1%) | 34 (27.9%) |
| Law Enforcement | 227 (100.0%) | 0 (0.0%) |
| Food Preparation & Serving | 301 (33.6%) | 594 (66.4%) |
| Cleaning & Maintenance | 625 (66.8%) | 310 (33.2%) |
| Personal Care & Service | 78 (17.4%) | 371 (82.6%) |
| Total (Category) | 1,418 (42.2%) | 1,942 (57.8%) |
| Total (Overall) | 10,070 (49.9%) | 10,118 (50.1%) |
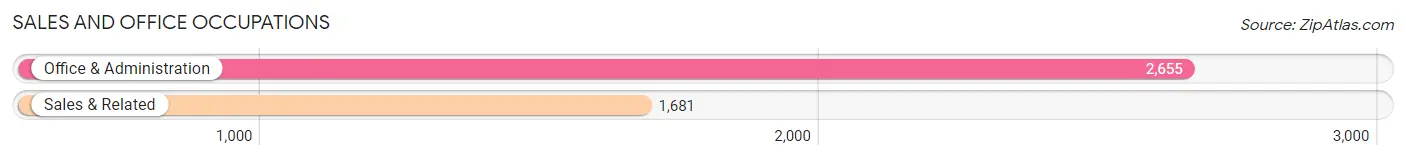
Sales and Office Occupations
The most common Sales and Office occupations in Henry County are Office & Administration (2,655 | 13.2%), and Sales & Related (1,681 | 8.3%).
Sales and Office Occupations by Sex
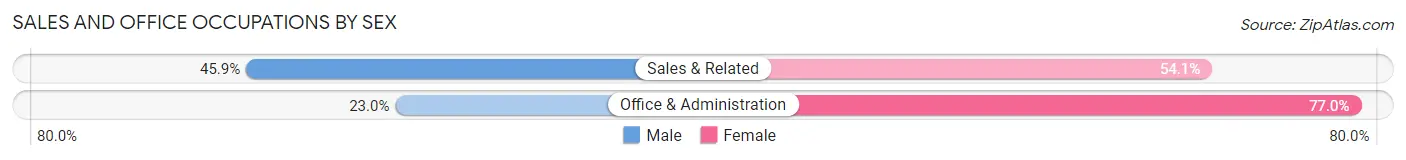
| Occupation | Male | Female |
| Sales & Related | 772 (45.9%) | 909 (54.1%) |
| Office & Administration | 610 (23.0%) | 2,045 (77.0%) |
| Total (Category) | 1,382 (31.9%) | 2,954 (68.1%) |
| Total (Overall) | 10,070 (49.9%) | 10,118 (50.1%) |
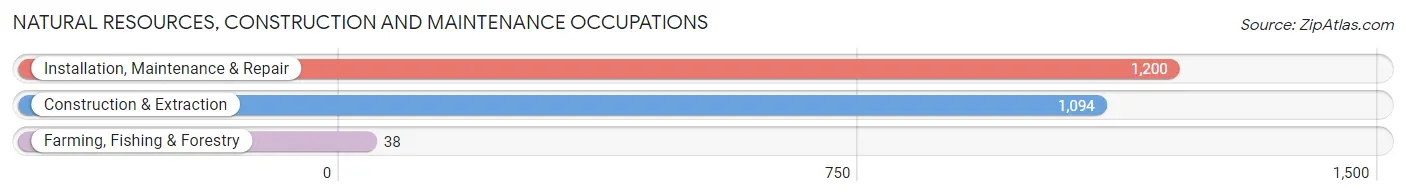
Natural Resources, Construction and Maintenance Occupations
The most common Natural Resources, Construction and Maintenance occupations in Henry County are Installation, Maintenance & Repair (1,200 | 5.9%), Construction & Extraction (1,094 | 5.4%), and Farming, Fishing & Forestry (38 | 0.2%).
Natural Resources, Construction and Maintenance Occupations by Sex
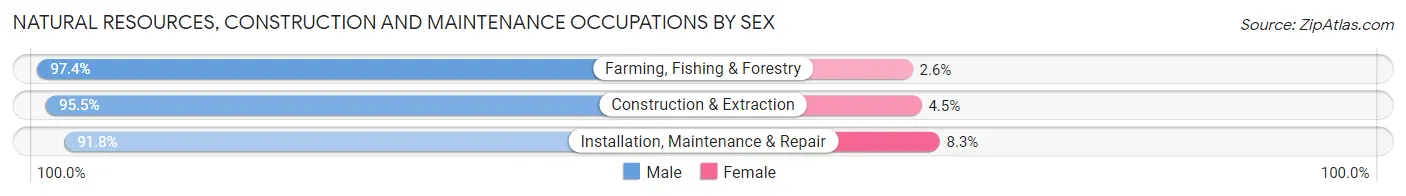
| Occupation | Male | Female |
| Farming, Fishing & Forestry | 37 (97.4%) | 1 (2.6%) |
| Construction & Extraction | 1,045 (95.5%) | 49 (4.5%) |
| Installation, Maintenance & Repair | 1,101 (91.7%) | 99 (8.3%) |
| Total (Category) | 2,183 (93.6%) | 149 (6.4%) |
| Total (Overall) | 10,070 (49.9%) | 10,118 (50.1%) |
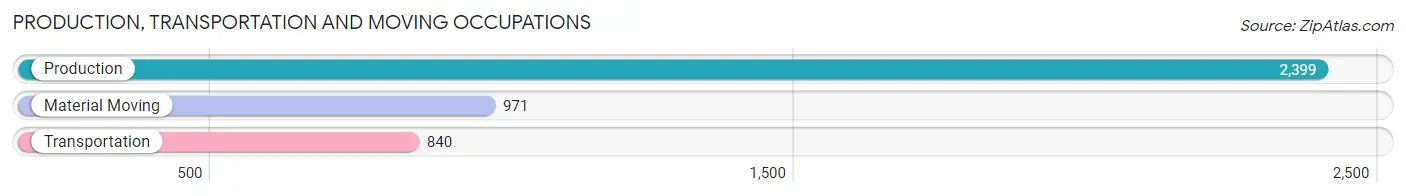
Production, Transportation and Moving Occupations
The most common Production, Transportation and Moving occupations in Henry County are Production (2,399 | 11.9%), Material Moving (971 | 4.8%), and Transportation (840 | 4.2%).
Production, Transportation and Moving Occupations by Sex
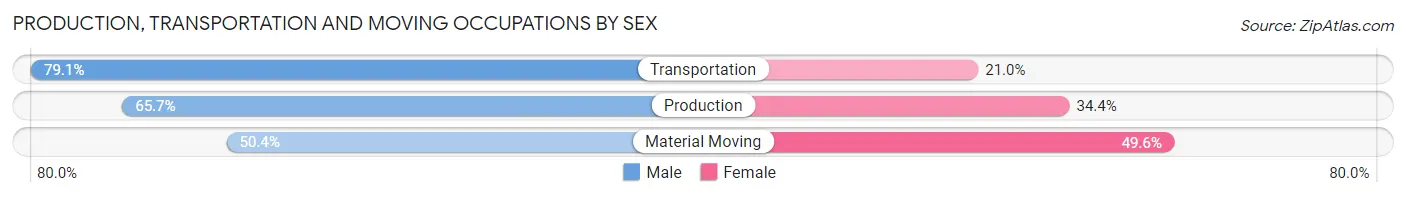
| Occupation | Male | Female |
| Production | 1,575 (65.6%) | 824 (34.4%) |
| Transportation | 664 (79.0%) | 176 (20.9%) |
| Material Moving | 489 (50.4%) | 482 (49.6%) |
| Total (Category) | 2,728 (64.8%) | 1,482 (35.2%) |
| Total (Overall) | 10,070 (49.9%) | 10,118 (50.1%) |
Employment Industries by Sex in Henry County
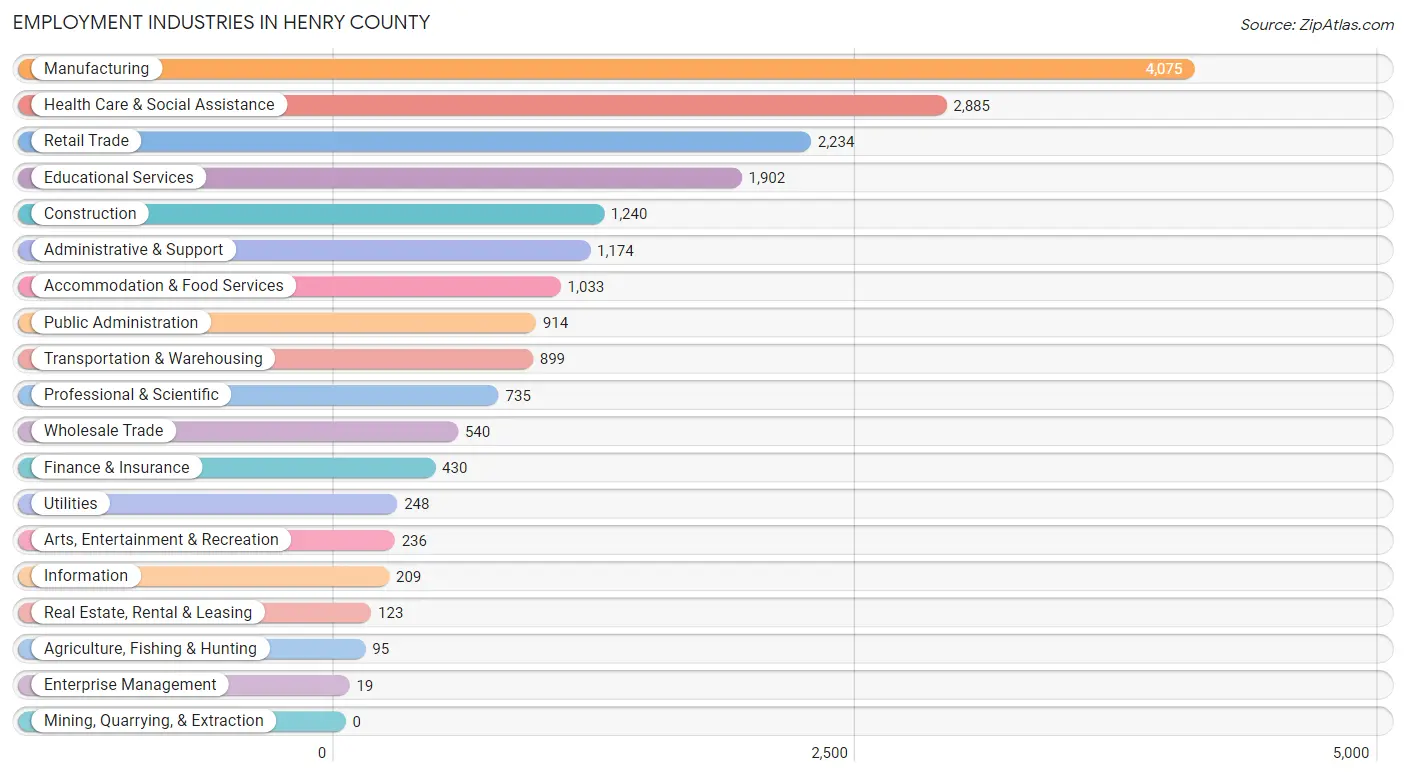
Employment Industries in Henry County
The major employment industries in Henry County include Manufacturing (4,075 | 20.2%), Health Care & Social Assistance (2,885 | 14.3%), Retail Trade (2,234 | 11.1%), Educational Services (1,902 | 9.4%), and Construction (1,240 | 6.1%).
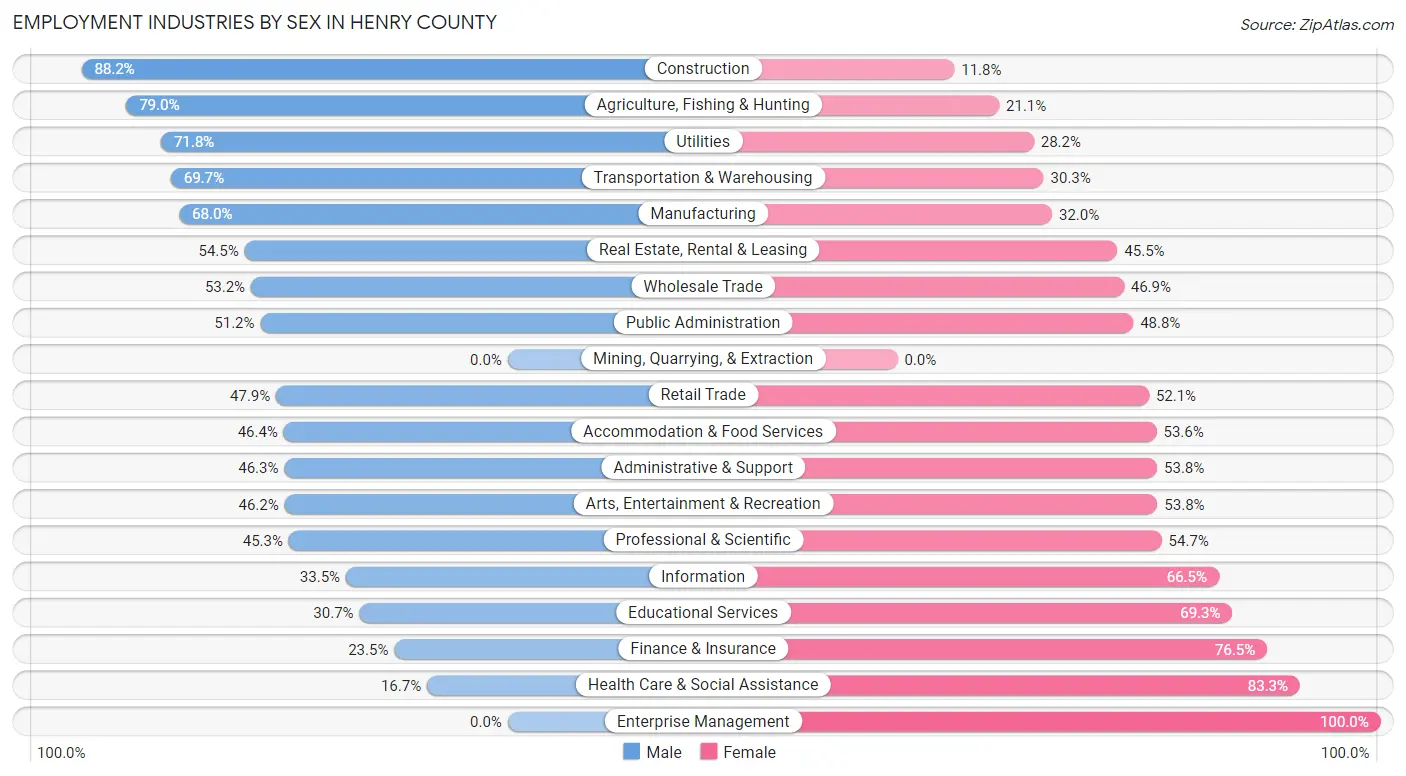
Employment Industries by Sex in Henry County
The Henry County industries that see more men than women are Construction (88.2%), Agriculture, Fishing & Hunting (78.9%), and Utilities (71.8%), whereas the industries that tend to have a higher number of women are Enterprise Management (100.0%), Health Care & Social Assistance (83.3%), and Finance & Insurance (76.5%).
| Industry | Male | Female |
| Agriculture, Fishing & Hunting | 75 (78.9%) | 20 (21.0%) |
| Mining, Quarrying, & Extraction | 0 (0.0%) | 0 (0.0%) |
| Construction | 1,094 (88.2%) | 146 (11.8%) |
| Manufacturing | 2,771 (68.0%) | 1,304 (32.0%) |
| Wholesale Trade | 287 (53.1%) | 253 (46.9%) |
| Retail Trade | 1,071 (47.9%) | 1,163 (52.1%) |
| Transportation & Warehousing | 627 (69.7%) | 272 (30.3%) |
| Utilities | 178 (71.8%) | 70 (28.2%) |
| Information | 70 (33.5%) | 139 (66.5%) |
| Finance & Insurance | 101 (23.5%) | 329 (76.5%) |
| Real Estate, Rental & Leasing | 67 (54.5%) | 56 (45.5%) |
| Professional & Scientific | 333 (45.3%) | 402 (54.7%) |
| Enterprise Management | 0 (0.0%) | 19 (100.0%) |
| Administrative & Support | 543 (46.3%) | 631 (53.7%) |
| Educational Services | 584 (30.7%) | 1,318 (69.3%) |
| Health Care & Social Assistance | 482 (16.7%) | 2,403 (83.3%) |
| Arts, Entertainment & Recreation | 109 (46.2%) | 127 (53.8%) |
| Accommodation & Food Services | 479 (46.4%) | 554 (53.6%) |
| Public Administration | 468 (51.2%) | 446 (48.8%) |
| Total | 10,070 (49.9%) | 10,118 (50.1%) |
Education in Henry County
School Enrollment in Henry County
The most common levels of schooling among the 10,052 students in Henry County are high school (2,736 | 27.2%), middle school (2,507 | 24.9%), and elementary school (1,867 | 18.6%).
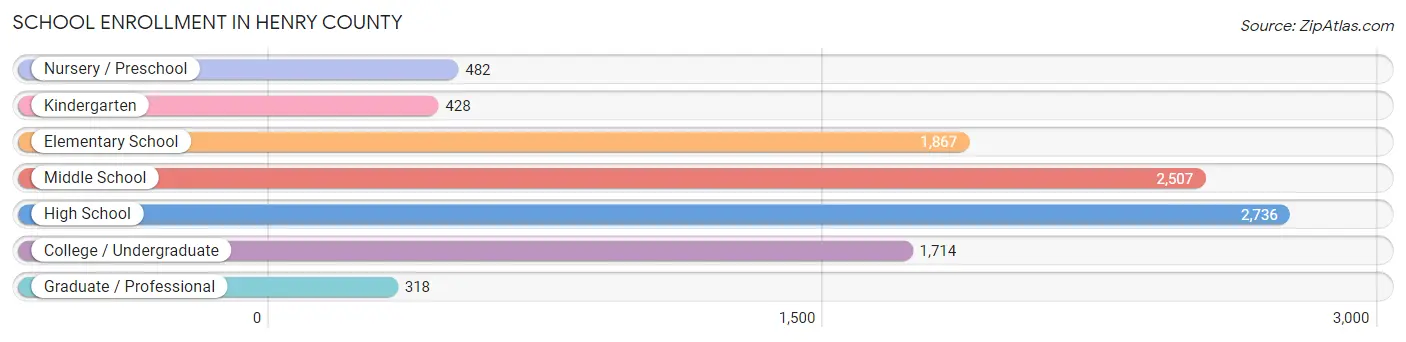
| School Level | # Students | % Students |
| Nursery / Preschool | 482 | 4.8% |
| Kindergarten | 428 | 4.3% |
| Elementary School | 1,867 | 18.6% |
| Middle School | 2,507 | 24.9% |
| High School | 2,736 | 27.2% |
| College / Undergraduate | 1,714 | 17.1% |
| Graduate / Professional | 318 | 3.2% |
| Total | 10,052 | 100.0% |
School Enrollment by Age by Funding Source in Henry County
Out of a total of 10,052 students who are enrolled in schools in Henry County, 1,518 (15.1%) attend a private institution, while the remaining 8,534 (84.9%) are enrolled in public schools. The age group of 25 to 34 year olds has the highest likelihood of being enrolled in private schools, with 244 (44.5% in the age bracket) enrolled. Conversely, the age group of 5 to 9 year old has the lowest likelihood of being enrolled in a private school, with 2,018 (91.7% in the age bracket) attending a public institution.
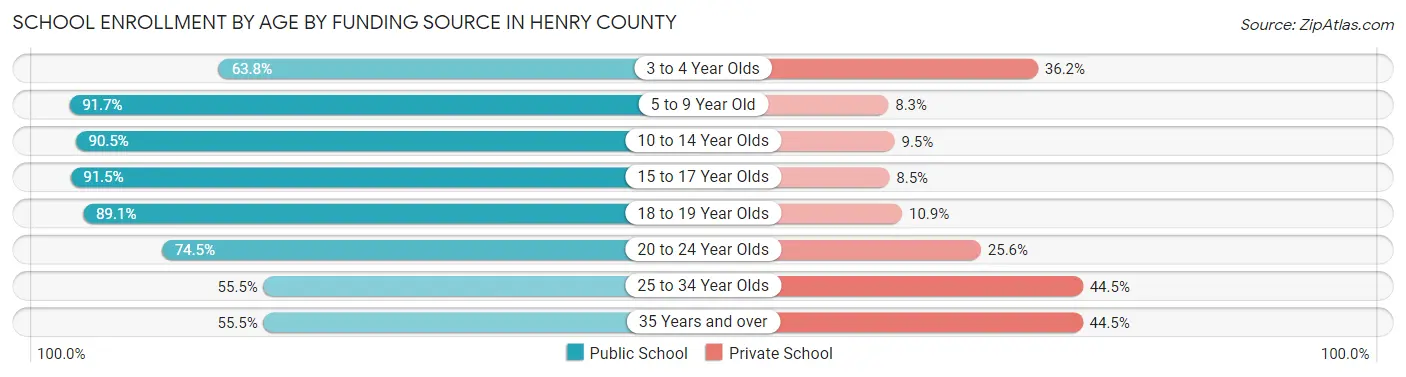
| Age Bracket | Public School | Private School |
| 3 to 4 Year Olds | 263 (63.8%) | 149 (36.2%) |
| 5 to 9 Year Old | 2,018 (91.7%) | 183 (8.3%) |
| 10 to 14 Year Olds | 2,845 (90.5%) | 298 (9.5%) |
| 15 to 17 Year Olds | 1,688 (91.5%) | 157 (8.5%) |
| 18 to 19 Year Olds | 713 (89.1%) | 87 (10.9%) |
| 20 to 24 Year Olds | 341 (74.5%) | 117 (25.6%) |
| 25 to 34 Year Olds | 304 (55.5%) | 244 (44.5%) |
| 35 Years and over | 358 (55.5%) | 287 (44.5%) |
| Total | 8,534 (84.9%) | 1,518 (15.1%) |
Educational Attainment by Field of Study in Henry County
Education (1,339 | 23.5%), business (1,144 | 20.1%), science & technology (703 | 12.3%), arts & humanities (582 | 10.2%), and liberal arts & history (423 | 7.4%) are the most common fields of study among 5,691 individuals in Henry County who have obtained a bachelor's degree or higher.
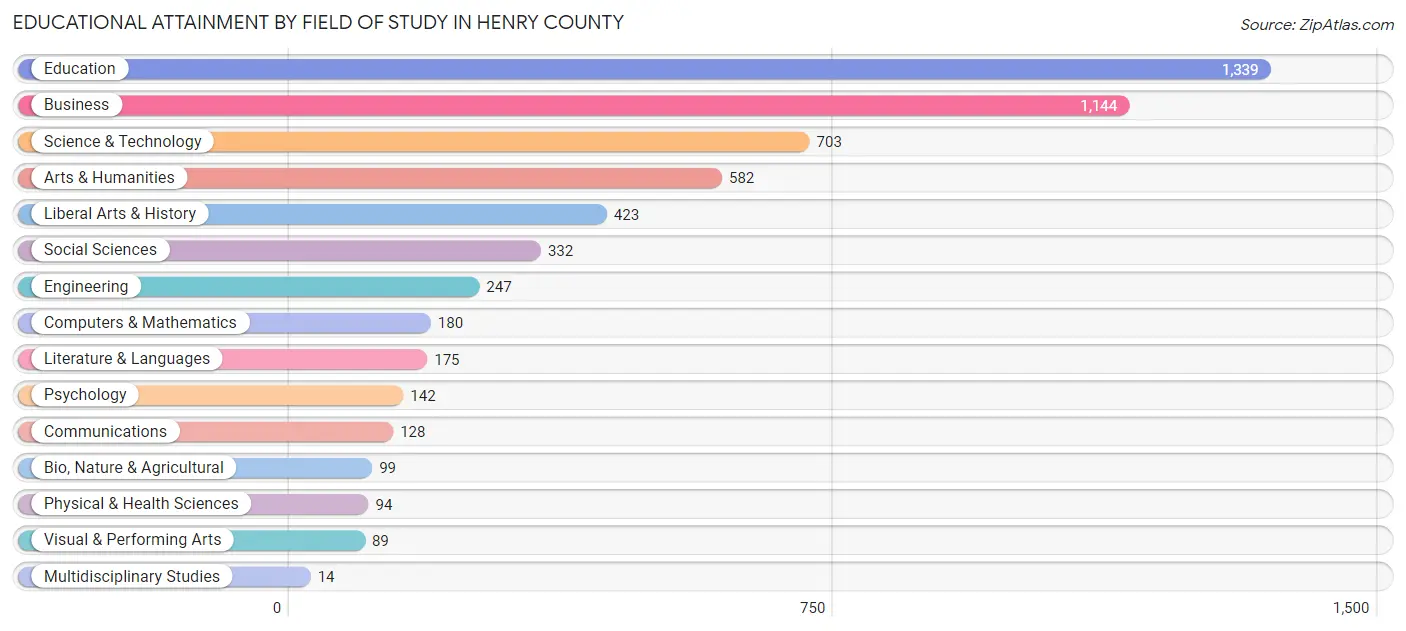
| Field of Study | # Graduates | % Graduates |
| Computers & Mathematics | 180 | 3.2% |
| Bio, Nature & Agricultural | 99 | 1.7% |
| Physical & Health Sciences | 94 | 1.7% |
| Psychology | 142 | 2.5% |
| Social Sciences | 332 | 5.8% |
| Engineering | 247 | 4.3% |
| Multidisciplinary Studies | 14 | 0.3% |
| Science & Technology | 703 | 12.3% |
| Business | 1,144 | 20.1% |
| Education | 1,339 | 23.5% |
| Literature & Languages | 175 | 3.1% |
| Liberal Arts & History | 423 | 7.4% |
| Visual & Performing Arts | 89 | 1.6% |
| Communications | 128 | 2.2% |
| Arts & Humanities | 582 | 10.2% |
| Total | 5,691 | 100.0% |
Transportation & Commute in Henry County
Vehicle Availability by Sex in Henry County
The most prevalent vehicle ownership categories in Henry County are males with 2 vehicles (3,039, accounting for 32.3%) and females with 2 vehicles (3,303, making up 30.3%).
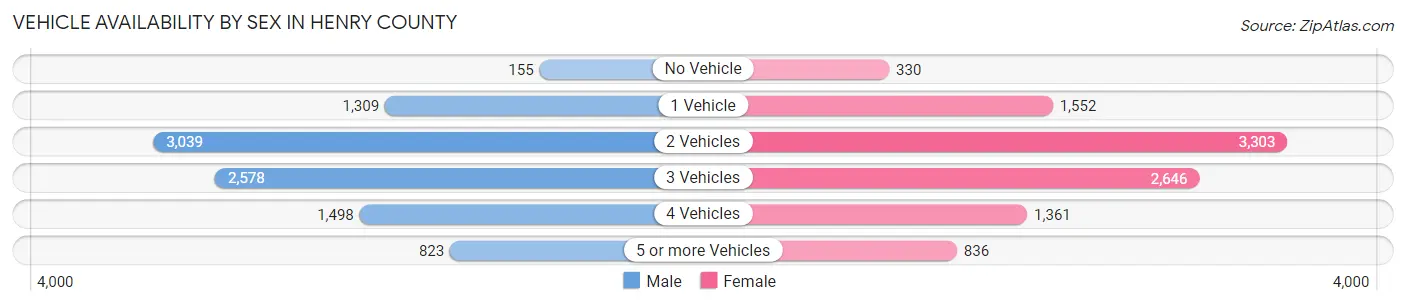
| Vehicles Available | Male | Female |
| No Vehicle | 155 (1.7%) | 330 (3.3%) |
| 1 Vehicle | 1,309 (13.9%) | 1,552 (15.5%) |
| 2 Vehicles | 3,039 (32.3%) | 3,303 (32.9%) |
| 3 Vehicles | 2,578 (27.4%) | 2,646 (26.4%) |
| 4 Vehicles | 1,498 (15.9%) | 1,361 (13.6%) |
| 5 or more Vehicles | 823 (8.7%) | 836 (8.3%) |
| Total | 9,402 (100.0%) | 10,028 (100.0%) |
Commute Time in Henry County
The most frequently occuring commute durations in Henry County are 20 to 24 minutes (4,016 commuters, 21.9%), 15 to 19 minutes (3,472 commuters, 18.9%), and 10 to 14 minutes (2,350 commuters, 12.8%).
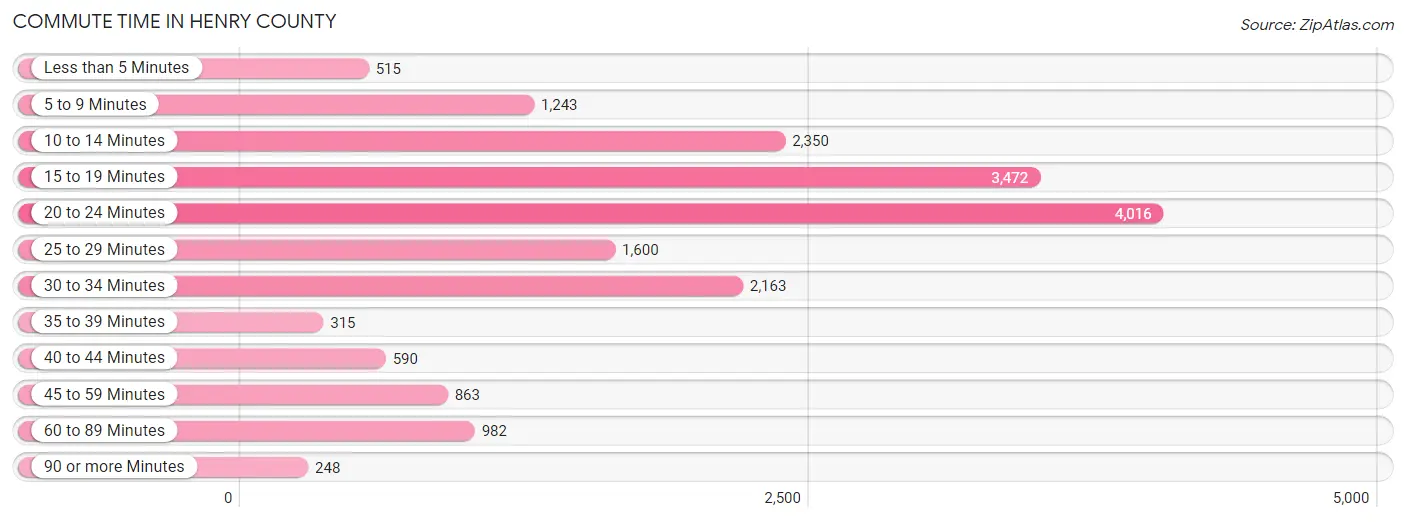
| Commute Time | # Commuters | % Commuters |
| Less than 5 Minutes | 515 | 2.8% |
| 5 to 9 Minutes | 1,243 | 6.8% |
| 10 to 14 Minutes | 2,350 | 12.8% |
| 15 to 19 Minutes | 3,472 | 18.9% |
| 20 to 24 Minutes | 4,016 | 21.9% |
| 25 to 29 Minutes | 1,600 | 8.7% |
| 30 to 34 Minutes | 2,163 | 11.8% |
| 35 to 39 Minutes | 315 | 1.7% |
| 40 to 44 Minutes | 590 | 3.2% |
| 45 to 59 Minutes | 863 | 4.7% |
| 60 to 89 Minutes | 982 | 5.3% |
| 90 or more Minutes | 248 | 1.3% |
Commute Time by Sex in Henry County
The most common commute times in Henry County are 20 to 24 minutes (2,066 commuters, 22.7%) for males and 20 to 24 minutes (1,950 commuters, 21.0%) for females.
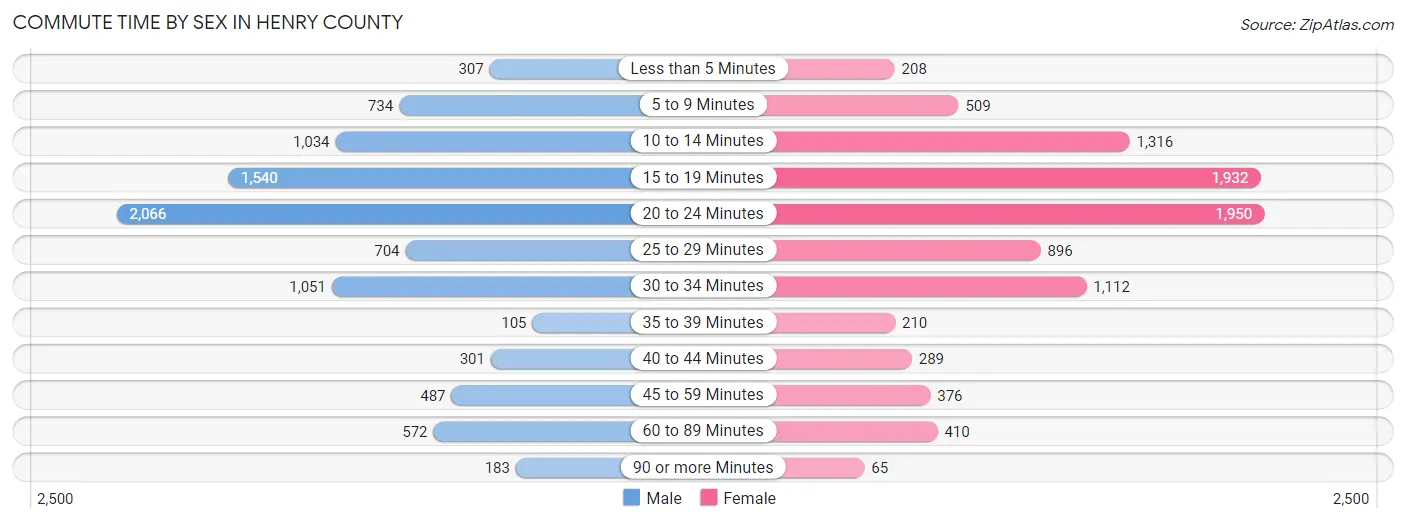
| Commute Time | Male | Female |
| Less than 5 Minutes | 307 (3.4%) | 208 (2.2%) |
| 5 to 9 Minutes | 734 (8.1%) | 509 (5.5%) |
| 10 to 14 Minutes | 1,034 (11.4%) | 1,316 (14.2%) |
| 15 to 19 Minutes | 1,540 (17.0%) | 1,932 (20.8%) |
| 20 to 24 Minutes | 2,066 (22.7%) | 1,950 (21.0%) |
| 25 to 29 Minutes | 704 (7.7%) | 896 (9.7%) |
| 30 to 34 Minutes | 1,051 (11.6%) | 1,112 (12.0%) |
| 35 to 39 Minutes | 105 (1.2%) | 210 (2.3%) |
| 40 to 44 Minutes | 301 (3.3%) | 289 (3.1%) |
| 45 to 59 Minutes | 487 (5.4%) | 376 (4.1%) |
| 60 to 89 Minutes | 572 (6.3%) | 410 (4.4%) |
| 90 or more Minutes | 183 (2.0%) | 65 (0.7%) |
Time of Departure to Work by Sex in Henry County
The most frequent times of departure to work in Henry County are 6:30 AM to 6:59 AM (1,305, 14.4%) for males and 7:30 AM to 7:59 AM (1,605, 17.3%) for females.
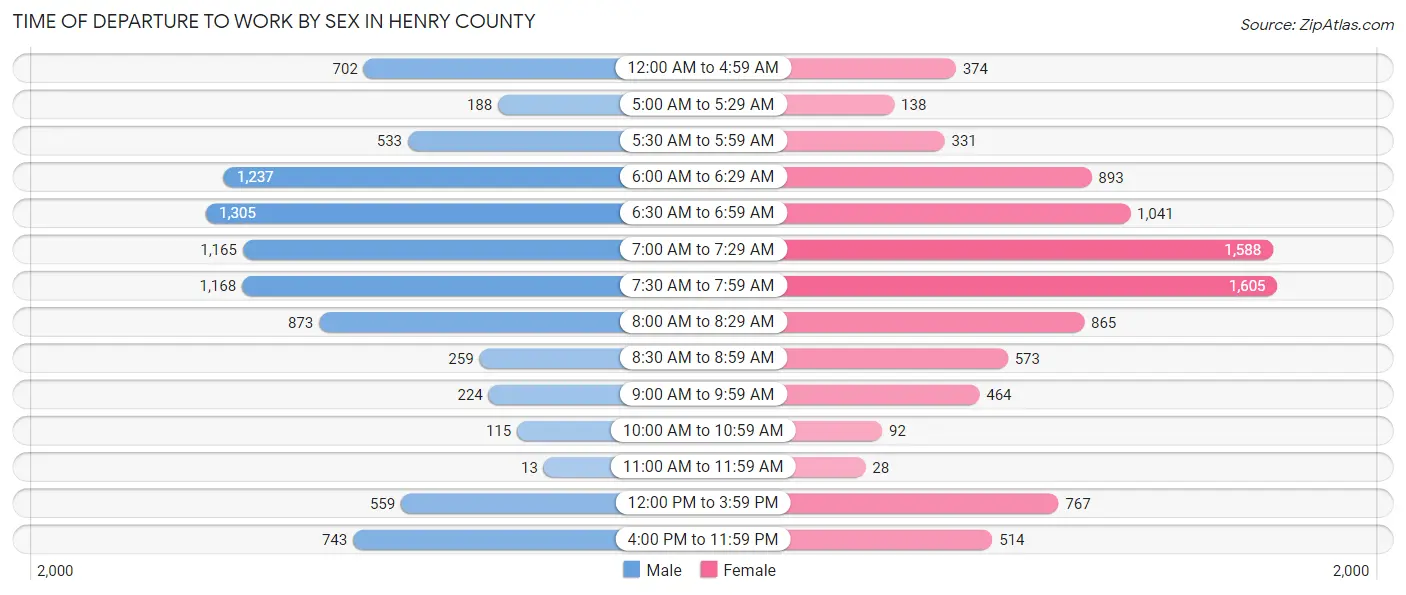
| Time of Departure | Male | Female |
| 12:00 AM to 4:59 AM | 702 (7.7%) | 374 (4.0%) |
| 5:00 AM to 5:29 AM | 188 (2.1%) | 138 (1.5%) |
| 5:30 AM to 5:59 AM | 533 (5.9%) | 331 (3.6%) |
| 6:00 AM to 6:29 AM | 1,237 (13.6%) | 893 (9.6%) |
| 6:30 AM to 6:59 AM | 1,305 (14.4%) | 1,041 (11.2%) |
| 7:00 AM to 7:29 AM | 1,165 (12.8%) | 1,588 (17.1%) |
| 7:30 AM to 7:59 AM | 1,168 (12.9%) | 1,605 (17.3%) |
| 8:00 AM to 8:29 AM | 873 (9.6%) | 865 (9.3%) |
| 8:30 AM to 8:59 AM | 259 (2.9%) | 573 (6.2%) |
| 9:00 AM to 9:59 AM | 224 (2.5%) | 464 (5.0%) |
| 10:00 AM to 10:59 AM | 115 (1.3%) | 92 (1.0%) |
| 11:00 AM to 11:59 AM | 13 (0.1%) | 28 (0.3%) |
| 12:00 PM to 3:59 PM | 559 (6.1%) | 767 (8.3%) |
| 4:00 PM to 11:59 PM | 743 (8.2%) | 514 (5.5%) |
| Total | 9,084 (100.0%) | 9,273 (100.0%) |
Housing Occupancy in Henry County
Occupancy by Ownership in Henry County
Of the total 20,411 dwellings in Henry County, owner-occupied units account for 14,941 (73.2%), while renter-occupied units make up 5,470 (26.8%).
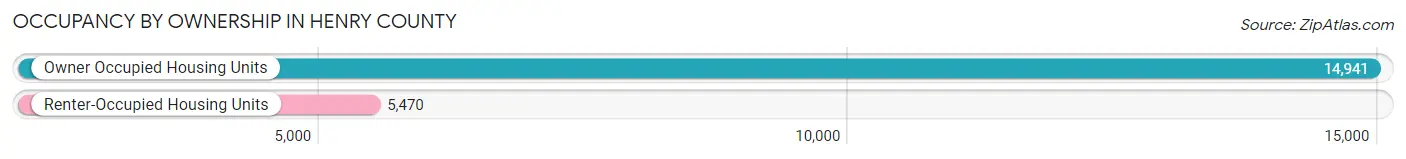
| Occupancy | # Housing Units | % Housing Units |
| Owner Occupied Housing Units | 14,941 | 73.2% |
| Renter-Occupied Housing Units | 5,470 | 26.8% |
| Total Occupied Housing Units | 20,411 | 100.0% |
Occupancy by Household Size in Henry County
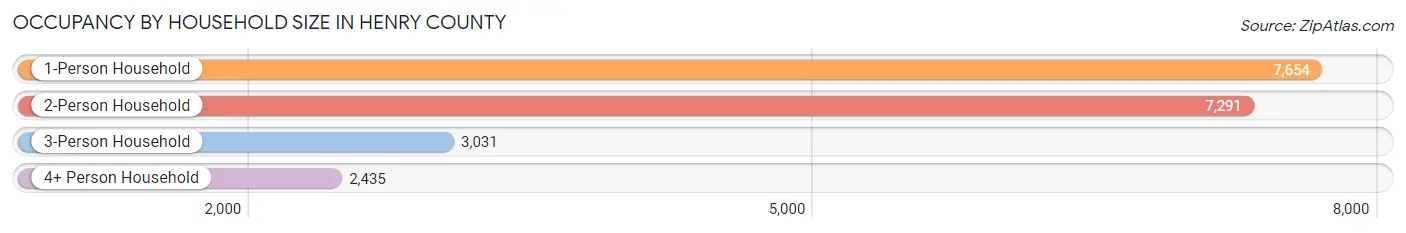
| Household Size | # Housing Units | % Housing Units |
| 1-Person Household | 7,654 | 37.5% |
| 2-Person Household | 7,291 | 35.7% |
| 3-Person Household | 3,031 | 14.8% |
| 4+ Person Household | 2,435 | 11.9% |
| Total Housing Units | 20,411 | 100.0% |
Occupancy by Ownership by Household Size in Henry County
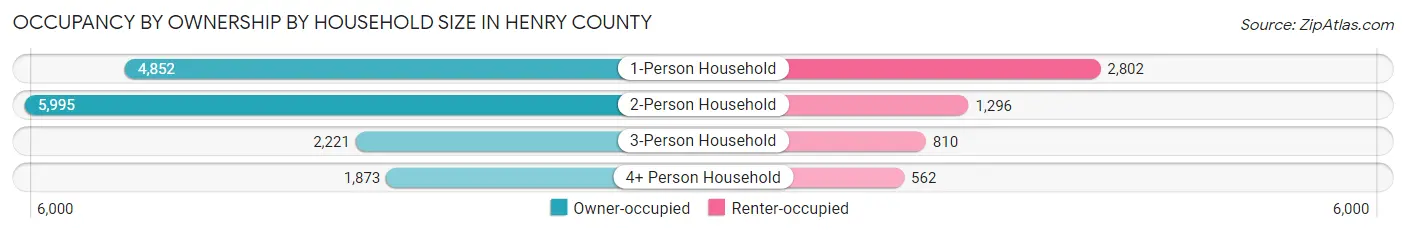
| Household Size | Owner-occupied | Renter-occupied |
| 1-Person Household | 4,852 (63.4%) | 2,802 (36.6%) |
| 2-Person Household | 5,995 (82.2%) | 1,296 (17.8%) |
| 3-Person Household | 2,221 (73.3%) | 810 (26.7%) |
| 4+ Person Household | 1,873 (76.9%) | 562 (23.1%) |
| Total Housing Units | 14,941 (73.2%) | 5,470 (26.8%) |
Occupancy by Educational Attainment in Henry County
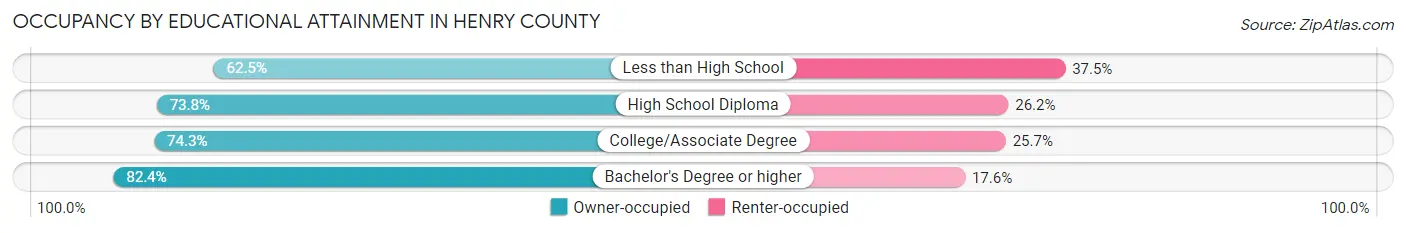
| Household Size | Owner-occupied | Renter-occupied |
| Less than High School | 2,487 (62.5%) | 1,491 (37.5%) |
| High School Diploma | 4,758 (73.8%) | 1,689 (26.2%) |
| College/Associate Degree | 4,885 (74.3%) | 1,689 (25.7%) |
| Bachelor's Degree or higher | 2,811 (82.4%) | 601 (17.6%) |
Occupancy by Age of Householder in Henry County
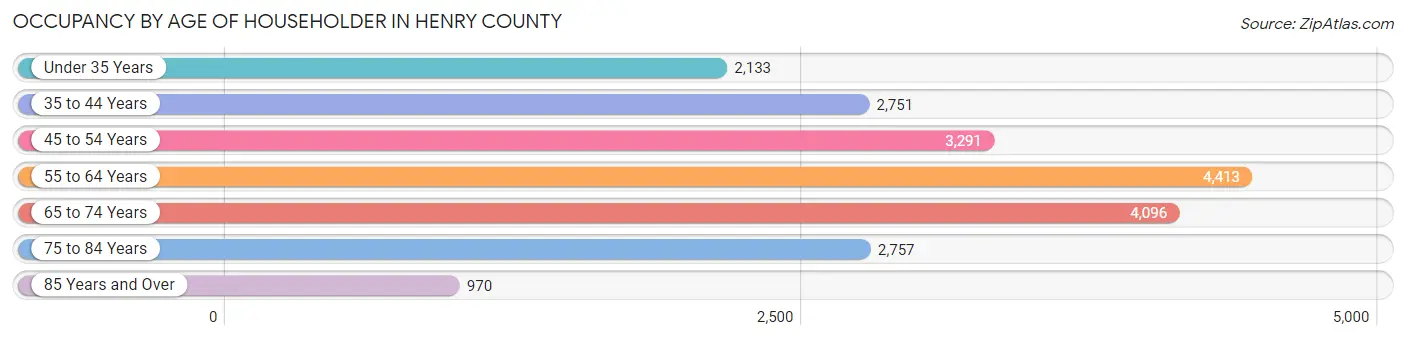
| Age Bracket | # Households | % Households |
| Under 35 Years | 2,133 | 10.4% |
| 35 to 44 Years | 2,751 | 13.5% |
| 45 to 54 Years | 3,291 | 16.1% |
| 55 to 64 Years | 4,413 | 21.6% |
| 65 to 74 Years | 4,096 | 20.1% |
| 75 to 84 Years | 2,757 | 13.5% |
| 85 Years and Over | 970 | 4.8% |
| Total | 20,411 | 100.0% |
Housing Finances in Henry County
Median Income by Occupancy in Henry County
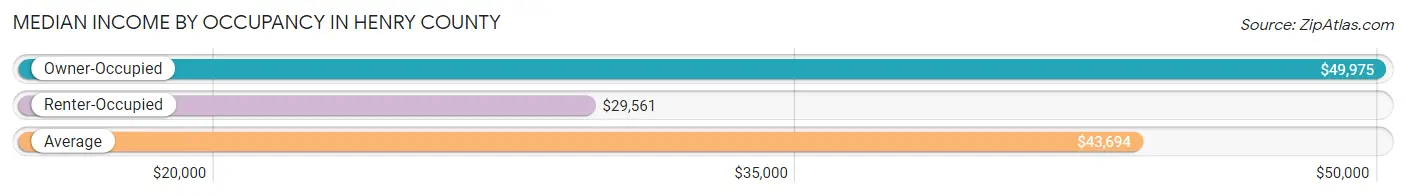
| Occupancy Type | # Households | Median Income |
| Owner-Occupied | 14,941 (73.2%) | $49,975 |
| Renter-Occupied | 5,470 (26.8%) | $29,561 |
| Average | 20,411 (100.0%) | $43,694 |
Occupancy by Householder Income Bracket in Henry County
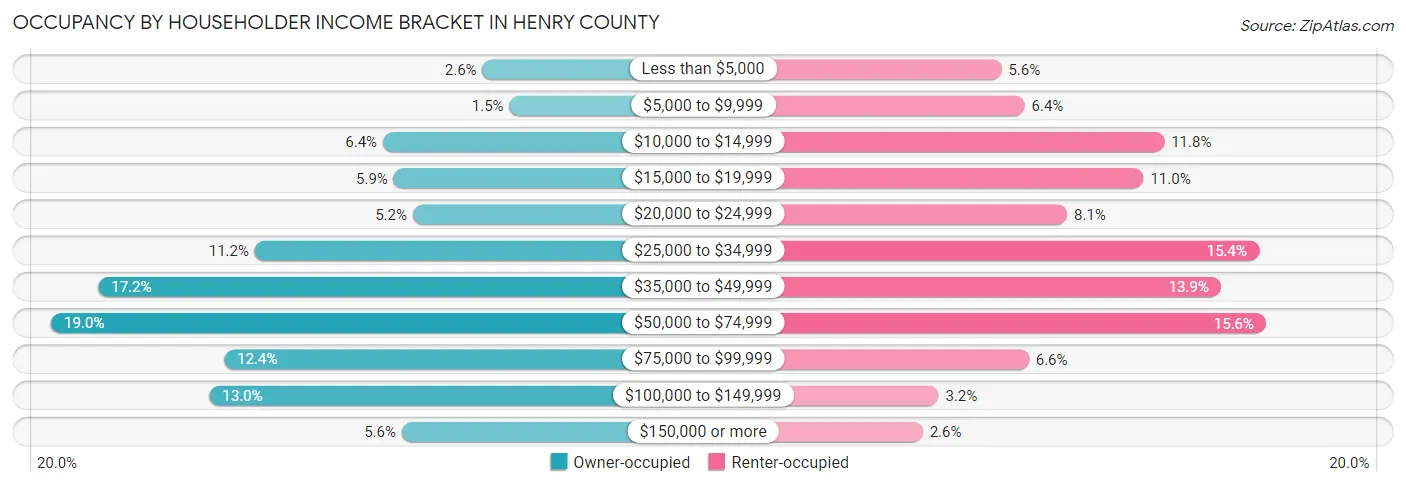
| Income Bracket | Owner-occupied | Renter-occupied |
| Less than $5,000 | 383 (2.6%) | 304 (5.6%) |
| $5,000 to $9,999 | 229 (1.5%) | 352 (6.4%) |
| $10,000 to $14,999 | 949 (6.4%) | 643 (11.8%) |
| $15,000 to $19,999 | 888 (5.9%) | 600 (11.0%) |
| $20,000 to $24,999 | 778 (5.2%) | 441 (8.1%) |
| $25,000 to $34,999 | 1,678 (11.2%) | 840 (15.4%) |
| $35,000 to $49,999 | 2,569 (17.2%) | 761 (13.9%) |
| $50,000 to $74,999 | 2,837 (19.0%) | 855 (15.6%) |
| $75,000 to $99,999 | 1,853 (12.4%) | 361 (6.6%) |
| $100,000 to $149,999 | 1,936 (13.0%) | 173 (3.2%) |
| $150,000 or more | 841 (5.6%) | 140 (2.6%) |
| Total | 14,941 (100.0%) | 5,470 (100.0%) |
Monthly Housing Cost Tiers in Henry County
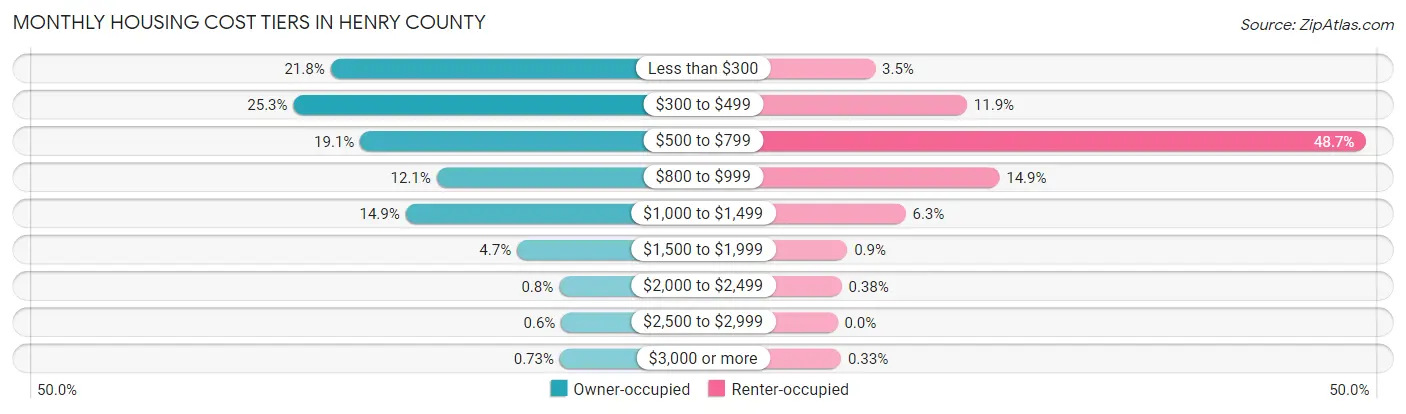
| Monthly Cost | Owner-occupied | Renter-occupied |
| Less than $300 | 3,263 (21.8%) | 190 (3.5%) |
| $300 to $499 | 3,774 (25.3%) | 652 (11.9%) |
| $500 to $799 | 2,855 (19.1%) | 2,662 (48.7%) |
| $800 to $999 | 1,803 (12.1%) | 815 (14.9%) |
| $1,000 to $1,499 | 2,230 (14.9%) | 343 (6.3%) |
| $1,500 to $1,999 | 697 (4.7%) | 49 (0.9%) |
| $2,000 to $2,499 | 120 (0.8%) | 21 (0.4%) |
| $2,500 to $2,999 | 90 (0.6%) | 0 (0.0%) |
| $3,000 or more | 109 (0.7%) | 18 (0.3%) |
| Total | 14,941 (100.0%) | 5,470 (100.0%) |
Physical Housing Characteristics in Henry County
Housing Structures in Henry County
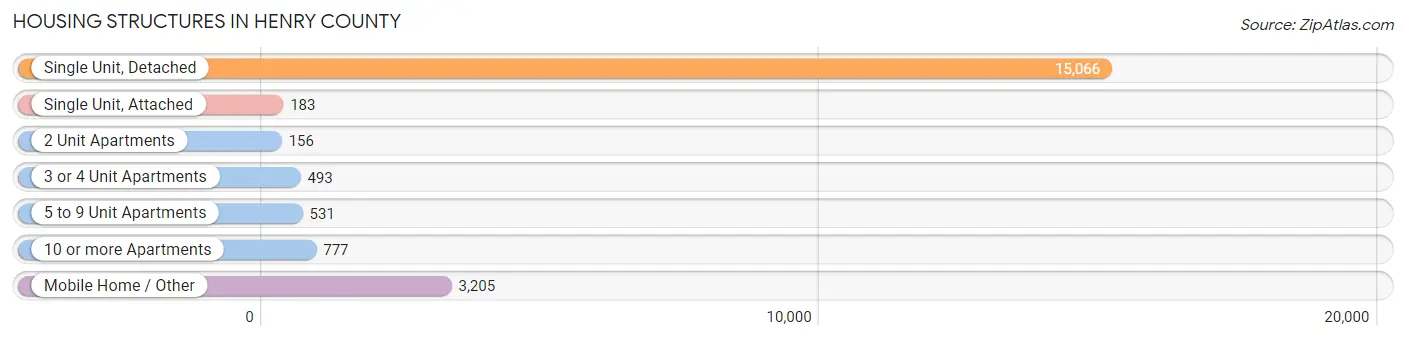
| Structure Type | # Housing Units | % Housing Units |
| Single Unit, Detached | 15,066 | 73.8% |
| Single Unit, Attached | 183 | 0.9% |
| 2 Unit Apartments | 156 | 0.8% |
| 3 or 4 Unit Apartments | 493 | 2.4% |
| 5 to 9 Unit Apartments | 531 | 2.6% |
| 10 or more Apartments | 777 | 3.8% |
| Mobile Home / Other | 3,205 | 15.7% |
| Total | 20,411 | 100.0% |
Housing Structures by Occupancy in Henry County
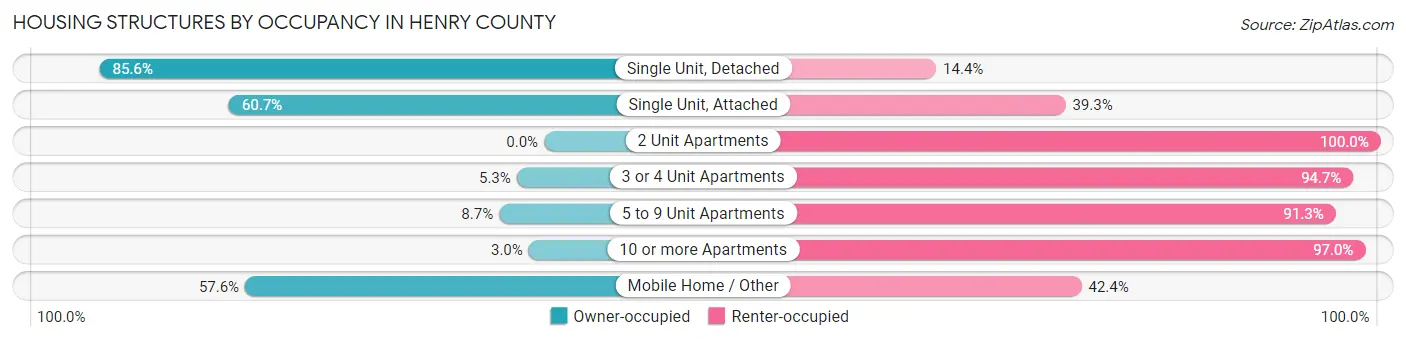
| Structure Type | Owner-occupied | Renter-occupied |
| Single Unit, Detached | 12,890 (85.6%) | 2,176 (14.4%) |
| Single Unit, Attached | 111 (60.7%) | 72 (39.3%) |
| 2 Unit Apartments | 0 (0.0%) | 156 (100.0%) |
| 3 or 4 Unit Apartments | 26 (5.3%) | 467 (94.7%) |
| 5 to 9 Unit Apartments | 46 (8.7%) | 485 (91.3%) |
| 10 or more Apartments | 23 (3.0%) | 754 (97.0%) |
| Mobile Home / Other | 1,845 (57.6%) | 1,360 (42.4%) |
| Total | 14,941 (73.2%) | 5,470 (26.8%) |
Housing Structures by Number of Rooms in Henry County
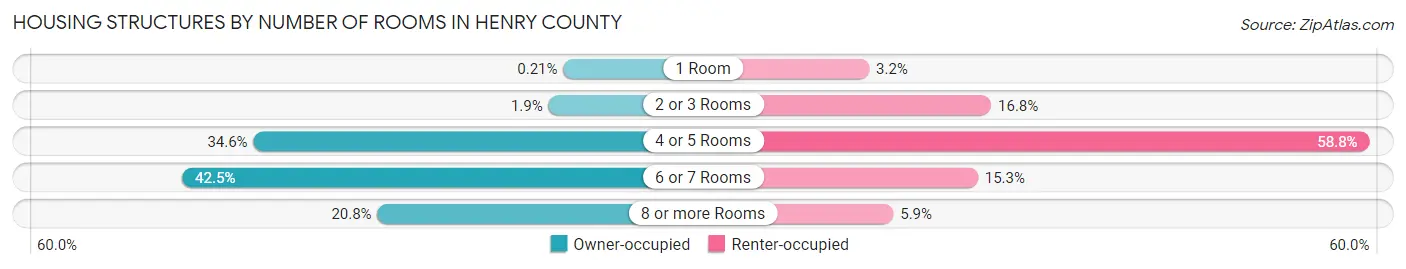
| Number of Rooms | Owner-occupied | Renter-occupied |
| 1 Room | 31 (0.2%) | 177 (3.2%) |
| 2 or 3 Rooms | 276 (1.8%) | 918 (16.8%) |
| 4 or 5 Rooms | 5,169 (34.6%) | 3,214 (58.8%) |
| 6 or 7 Rooms | 6,352 (42.5%) | 837 (15.3%) |
| 8 or more Rooms | 3,113 (20.8%) | 324 (5.9%) |
| Total | 14,941 (100.0%) | 5,470 (100.0%) |
Housing Structure by Heating Type in Henry County
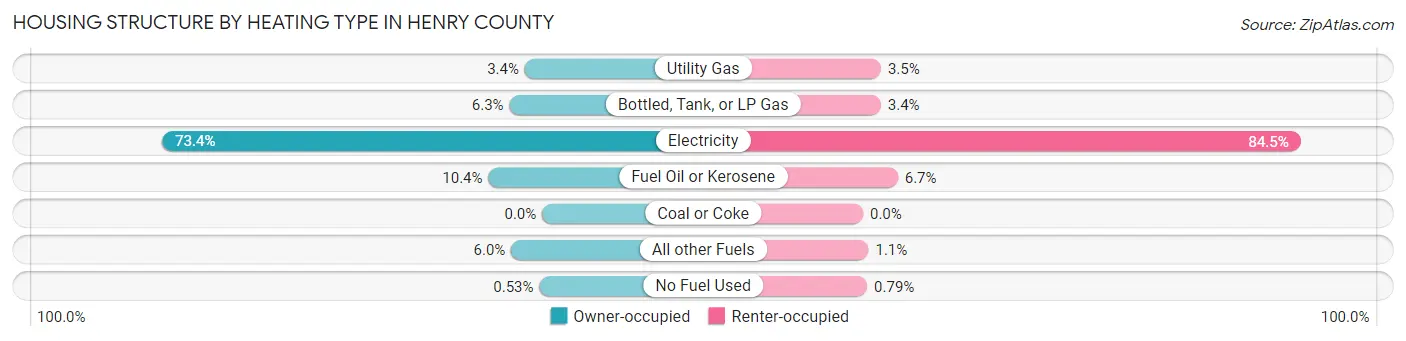
| Heating Type | Owner-occupied | Renter-occupied |
| Utility Gas | 500 (3.4%) | 190 (3.5%) |
| Bottled, Tank, or LP Gas | 944 (6.3%) | 188 (3.4%) |
| Electricity | 10,973 (73.4%) | 4,624 (84.5%) |
| Fuel Oil or Kerosene | 1,553 (10.4%) | 367 (6.7%) |
| Coal or Coke | 0 (0.0%) | 0 (0.0%) |
| All other Fuels | 892 (6.0%) | 58 (1.1%) |
| No Fuel Used | 79 (0.5%) | 43 (0.8%) |
| Total | 14,941 (100.0%) | 5,470 (100.0%) |
Household Vehicle Usage in Henry County
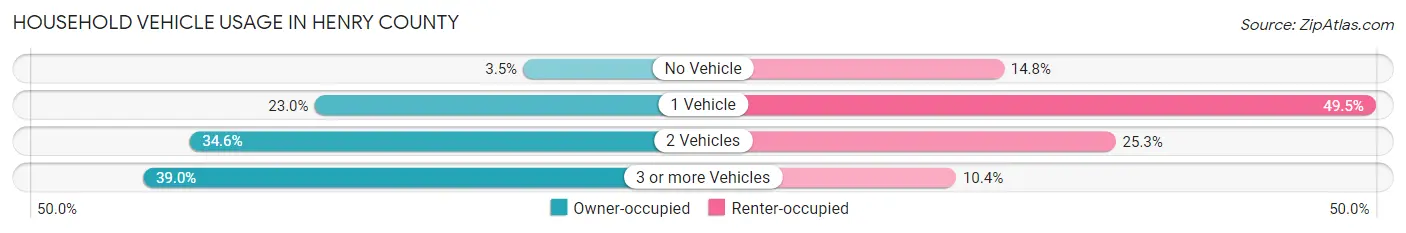
| Vehicles per Household | Owner-occupied | Renter-occupied |
| No Vehicle | 520 (3.5%) | 811 (14.8%) |
| 1 Vehicle | 3,429 (23.0%) | 2,710 (49.5%) |
| 2 Vehicles | 5,172 (34.6%) | 1,382 (25.3%) |
| 3 or more Vehicles | 5,820 (39.0%) | 567 (10.4%) |
| Total | 14,941 (100.0%) | 5,470 (100.0%) |
Real Estate & Mortgages in Henry County
Real Estate and Mortgage Overview in Henry County
| Characteristic | Without Mortgage | With Mortgage |
| Housing Units | 8,354 | 6,587 |
| Median Property Value | $100,500 | $125,900 |
| Median Household Income | $38,838 | $421 |
| Monthly Housing Costs | $336 | $109 |
| Real Estate Taxes | $548 | $241 |
Property Value by Mortgage Status in Henry County
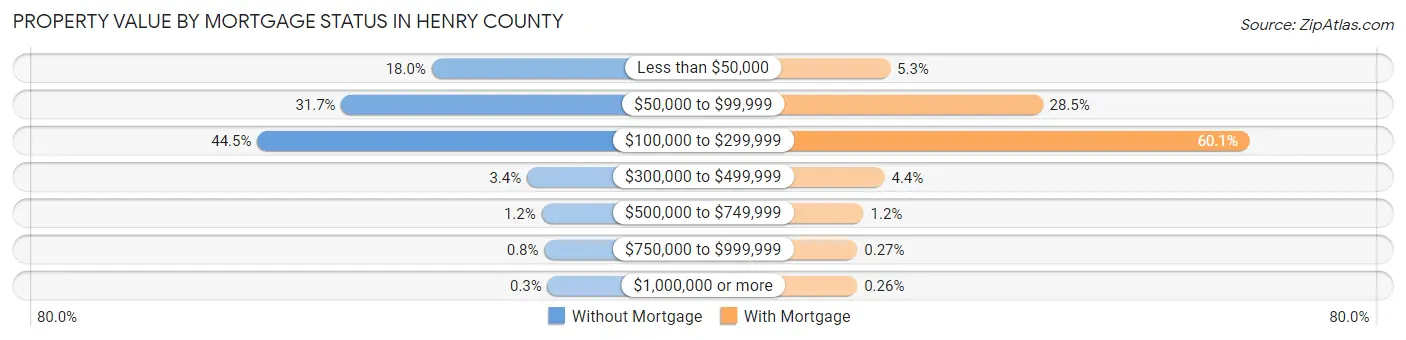
| Property Value | Without Mortgage | With Mortgage |
| Less than $50,000 | 1,501 (18.0%) | 347 (5.3%) |
| $50,000 to $99,999 | 2,650 (31.7%) | 1,877 (28.5%) |
| $100,000 to $299,999 | 3,721 (44.5%) | 3,956 (60.1%) |
| $300,000 to $499,999 | 287 (3.4%) | 291 (4.4%) |
| $500,000 to $749,999 | 103 (1.2%) | 81 (1.2%) |
| $750,000 to $999,999 | 67 (0.8%) | 18 (0.3%) |
| $1,000,000 or more | 25 (0.3%) | 17 (0.3%) |
| Total | 8,354 (100.0%) | 6,587 (100.0%) |
Household Income by Mortgage Status in Henry County
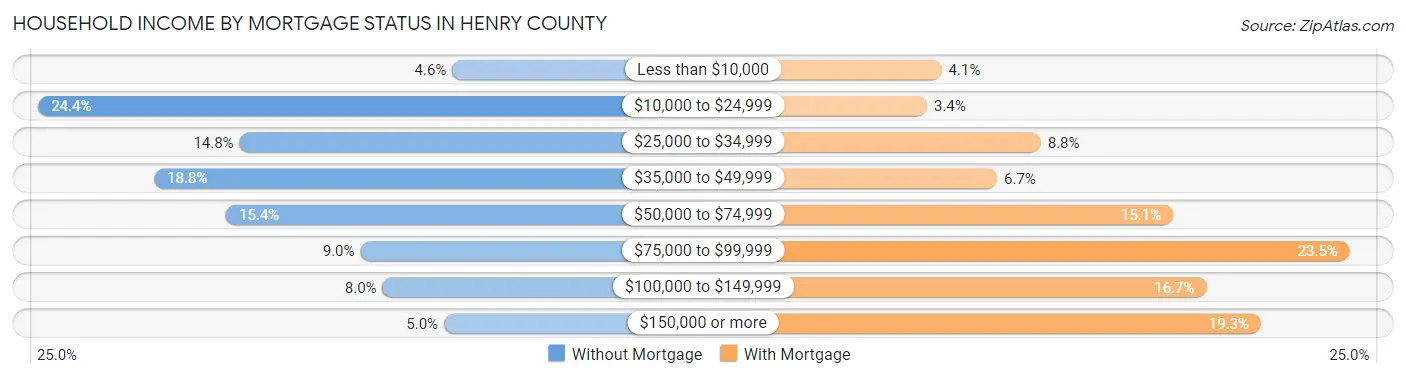
| Household Income | Without Mortgage | With Mortgage |
| Less than $10,000 | 388 (4.6%) | 270 (4.1%) |
| $10,000 to $24,999 | 2,034 (24.3%) | 224 (3.4%) |
| $25,000 to $34,999 | 1,234 (14.8%) | 581 (8.8%) |
| $35,000 to $49,999 | 1,573 (18.8%) | 444 (6.7%) |
| $50,000 to $74,999 | 1,287 (15.4%) | 996 (15.1%) |
| $75,000 to $99,999 | 753 (9.0%) | 1,550 (23.5%) |
| $100,000 to $149,999 | 665 (8.0%) | 1,100 (16.7%) |
| $150,000 or more | 420 (5.0%) | 1,271 (19.3%) |
| Total | 8,354 (100.0%) | 6,587 (100.0%) |
Property Value to Household Income Ratio in Henry County
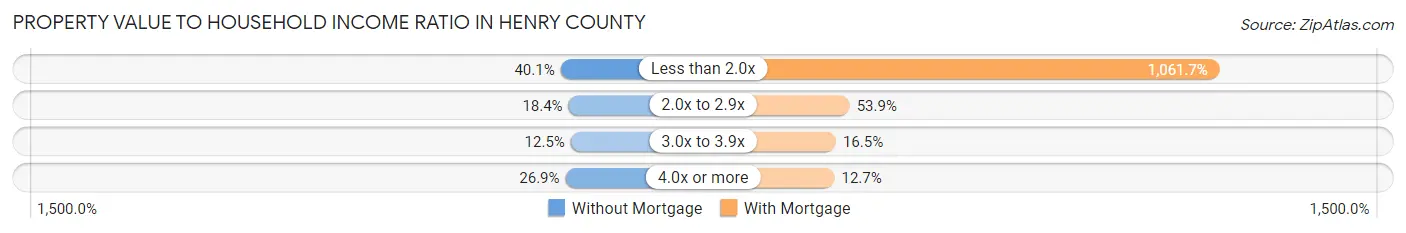
| Value-to-Income Ratio | Without Mortgage | With Mortgage |
| Less than 2.0x | 3,353 (40.1%) | 69,934 (1,061.7%) |
| 2.0x to 2.9x | 1,539 (18.4%) | 3,551 (53.9%) |
| 3.0x to 3.9x | 1,040 (12.4%) | 1,084 (16.5%) |
| 4.0x or more | 2,248 (26.9%) | 833 (12.7%) |
| Total | 8,354 (100.0%) | 6,587 (100.0%) |
Real Estate Taxes by Mortgage Status in Henry County
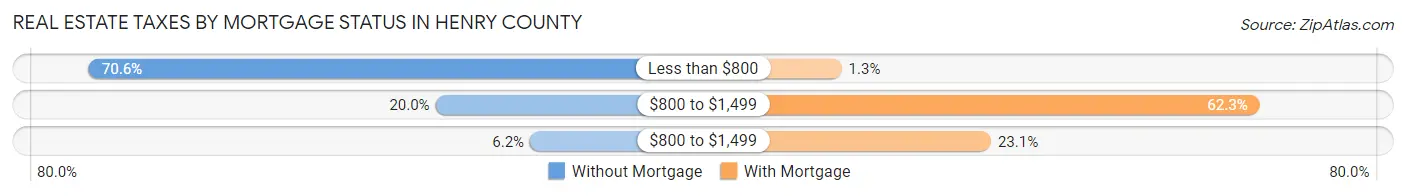
| Property Taxes | Without Mortgage | With Mortgage |
| Less than $800 | 5,898 (70.6%) | 83 (1.3%) |
| $800 to $1,499 | 1,668 (20.0%) | 4,106 (62.3%) |
| $800 to $1,499 | 515 (6.2%) | 1,520 (23.1%) |
| Total | 8,354 (100.0%) | 6,587 (100.0%) |
Health & Disability in Henry County
Health Insurance Coverage by Age in Henry County
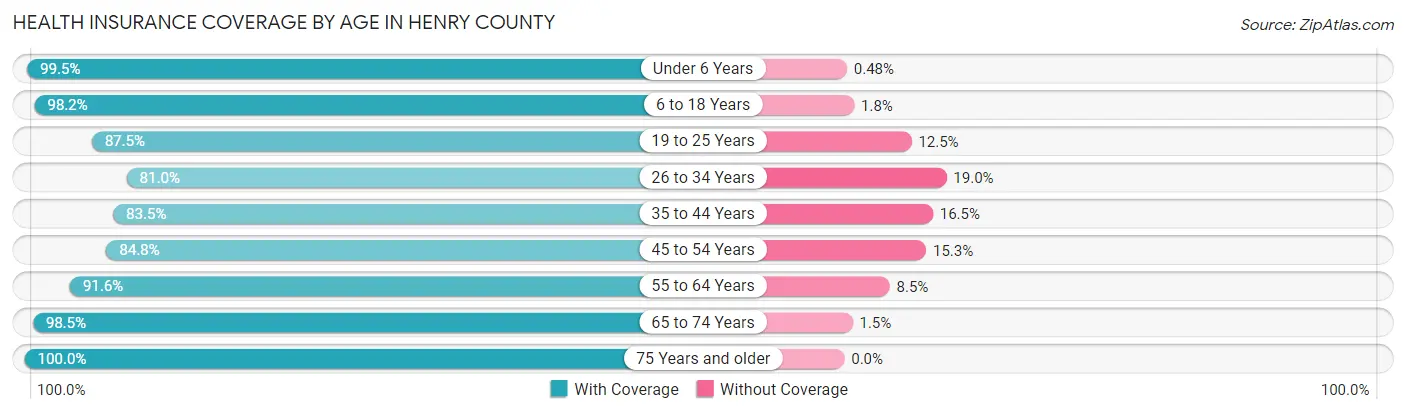
| Age Bracket | With Coverage | Without Coverage |
| Under 6 Years | 2,674 (99.5%) | 13 (0.5%) |
| 6 to 18 Years | 7,728 (98.2%) | 144 (1.8%) |
| 19 to 25 Years | 2,633 (87.5%) | 377 (12.5%) |
| 26 to 34 Years | 3,734 (81.0%) | 878 (19.0%) |
| 35 to 44 Years | 4,343 (83.5%) | 858 (16.5%) |
| 45 to 54 Years | 5,603 (84.8%) | 1,008 (15.2%) |
| 55 to 64 Years | 7,193 (91.5%) | 664 (8.5%) |
| 65 to 74 Years | 6,435 (98.5%) | 100 (1.5%) |
| 75 Years and older | 5,534 (100.0%) | 0 (0.0%) |
| Total | 45,877 (91.9%) | 4,042 (8.1%) |
Health Insurance Coverage by Citizenship Status in Henry County
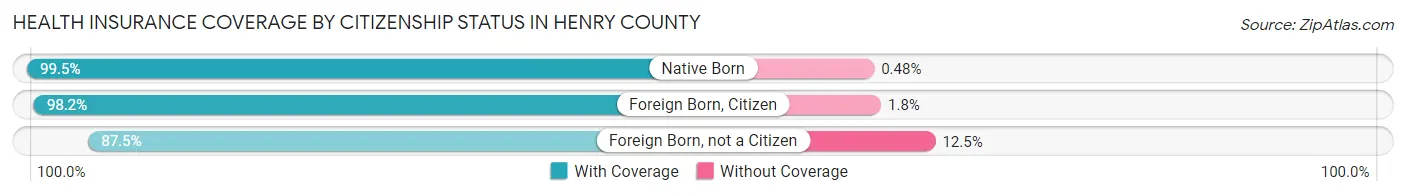
| Citizenship Status | With Coverage | Without Coverage |
| Native Born | 2,674 (99.5%) | 13 (0.5%) |
| Foreign Born, Citizen | 7,728 (98.2%) | 144 (1.8%) |
| Foreign Born, not a Citizen | 2,633 (87.5%) | 377 (12.5%) |
Health Insurance Coverage by Household Income in Henry County
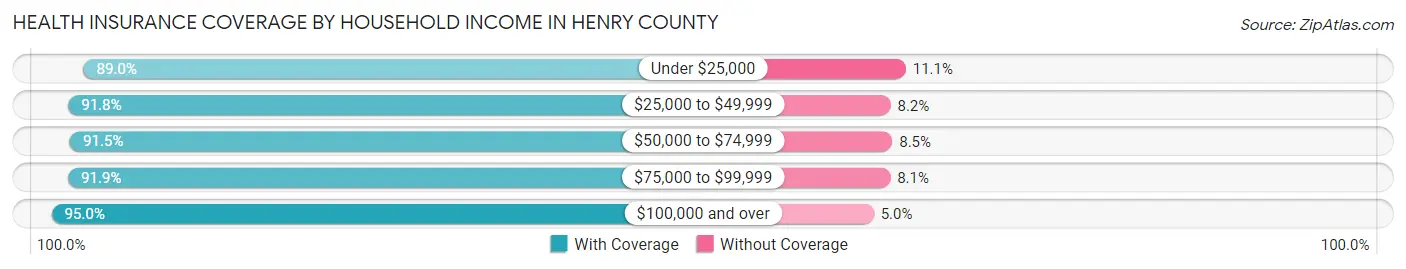
| Household Income | With Coverage | Without Coverage |
| Under $25,000 | 7,891 (88.9%) | 980 (11.1%) |
| $25,000 to $49,999 | 12,223 (91.8%) | 1,090 (8.2%) |
| $50,000 to $74,999 | 9,504 (91.5%) | 885 (8.5%) |
| $75,000 to $99,999 | 6,204 (91.9%) | 550 (8.1%) |
| $100,000 and over | 9,924 (95.0%) | 527 (5.0%) |
Public vs Private Health Insurance Coverage by Age in Henry County
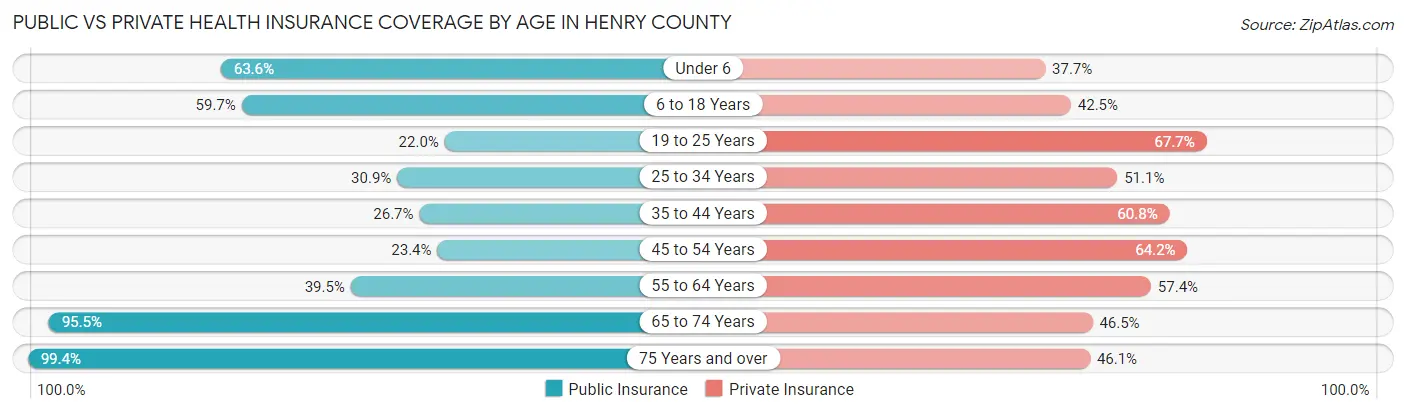
| Age Bracket | Public Insurance | Private Insurance |
| Under 6 | 1,708 (63.6%) | 1,014 (37.7%) |
| 6 to 18 Years | 4,701 (59.7%) | 3,347 (42.5%) |
| 19 to 25 Years | 663 (22.0%) | 2,038 (67.7%) |
| 25 to 34 Years | 1,423 (30.8%) | 2,358 (51.1%) |
| 35 to 44 Years | 1,390 (26.7%) | 3,163 (60.8%) |
| 45 to 54 Years | 1,546 (23.4%) | 4,241 (64.1%) |
| 55 to 64 Years | 3,101 (39.5%) | 4,508 (57.4%) |
| 65 to 74 Years | 6,242 (95.5%) | 3,040 (46.5%) |
| 75 Years and over | 5,502 (99.4%) | 2,549 (46.1%) |
| Total | 26,276 (52.6%) | 26,258 (52.6%) |
Disability Status by Sex by Age in Henry County
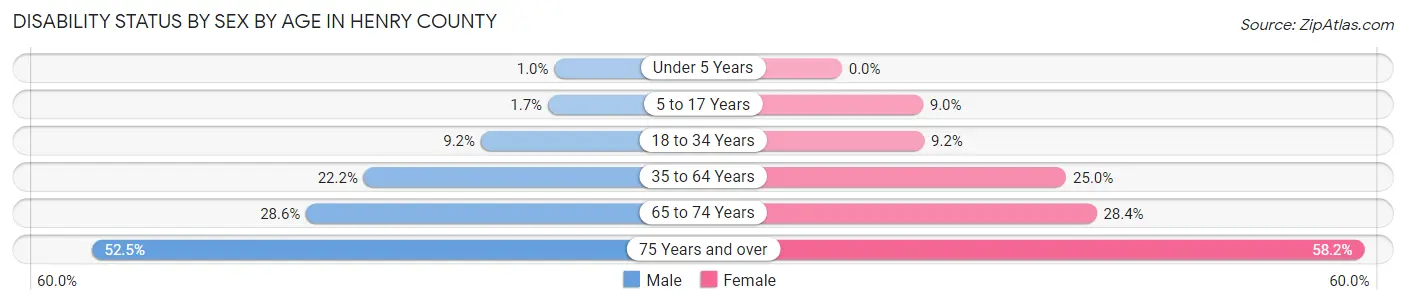
| Age Bracket | Male | Female |
| Under 5 Years | 11 (1.0%) | 0 (0.0%) |
| 5 to 17 Years | 65 (1.7%) | 342 (9.0%) |
| 18 to 34 Years | 376 (9.2%) | 391 (9.2%) |
| 35 to 64 Years | 2,134 (22.2%) | 2,516 (25.0%) |
| 65 to 74 Years | 871 (28.6%) | 991 (28.4%) |
| 75 Years and over | 1,220 (52.5%) | 1,869 (58.2%) |
Disability Class by Sex by Age in Henry County
Disability Class: Hearing Difficulty
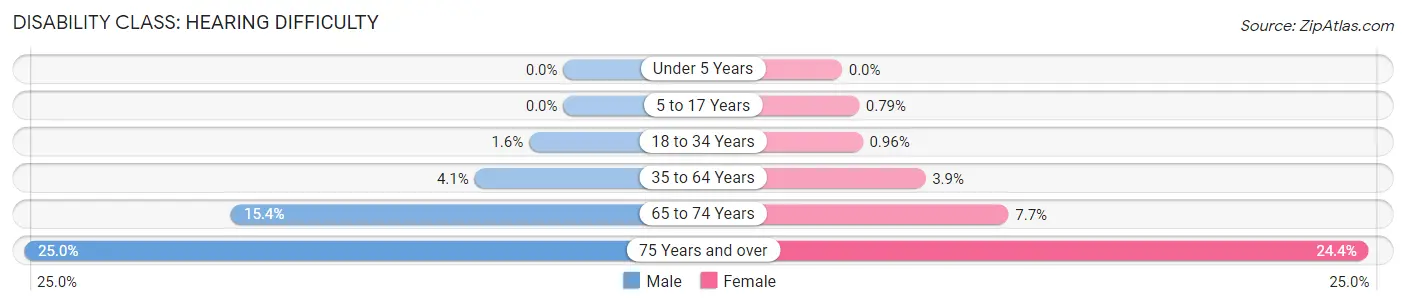
| Age Bracket | Male | Female |
| Under 5 Years | 0 (0.0%) | 0 (0.0%) |
| 5 to 17 Years | 0 (0.0%) | 30 (0.8%) |
| 18 to 34 Years | 65 (1.6%) | 41 (1.0%) |
| 35 to 64 Years | 395 (4.1%) | 390 (3.9%) |
| 65 to 74 Years | 469 (15.4%) | 270 (7.7%) |
| 75 Years and over | 580 (25.0%) | 785 (24.4%) |
Disability Class: Vision Difficulty
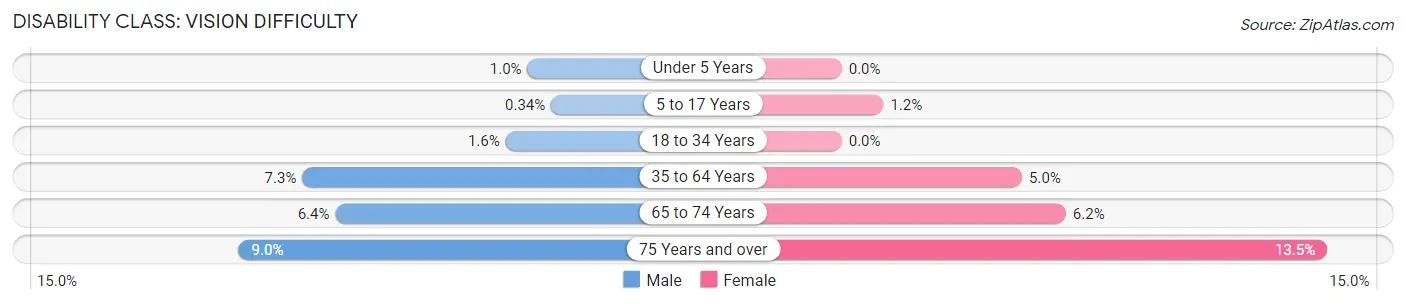
| Age Bracket | Male | Female |
| Under 5 Years | 11 (1.0%) | 0 (0.0%) |
| 5 to 17 Years | 13 (0.3%) | 44 (1.2%) |
| 18 to 34 Years | 66 (1.6%) | 0 (0.0%) |
| 35 to 64 Years | 698 (7.3%) | 506 (5.0%) |
| 65 to 74 Years | 193 (6.4%) | 218 (6.2%) |
| 75 Years and over | 210 (9.0%) | 434 (13.5%) |
Disability Class: Cognitive Difficulty
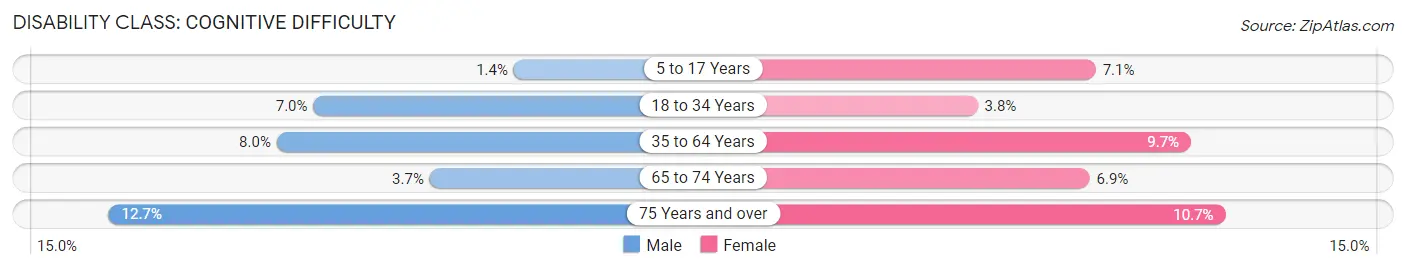
| Age Bracket | Male | Female |
| 5 to 17 Years | 52 (1.4%) | 268 (7.1%) |
| 18 to 34 Years | 285 (7.0%) | 161 (3.8%) |
| 35 to 64 Years | 766 (8.0%) | 979 (9.7%) |
| 65 to 74 Years | 113 (3.7%) | 241 (6.9%) |
| 75 Years and over | 294 (12.7%) | 343 (10.7%) |
Disability Class: Ambulatory Difficulty
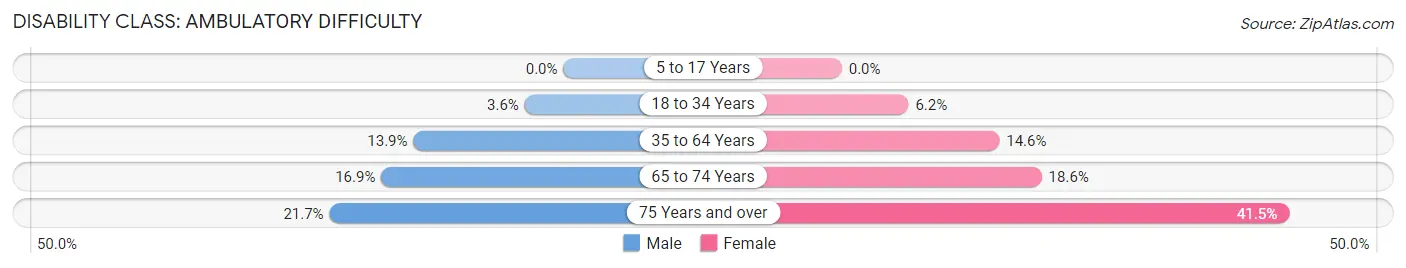
| Age Bracket | Male | Female |
| 5 to 17 Years | 0 (0.0%) | 0 (0.0%) |
| 18 to 34 Years | 147 (3.6%) | 264 (6.2%) |
| 35 to 64 Years | 1,336 (13.9%) | 1,472 (14.6%) |
| 65 to 74 Years | 514 (16.9%) | 648 (18.5%) |
| 75 Years and over | 504 (21.7%) | 1,333 (41.5%) |
Disability Class: Self-Care Difficulty
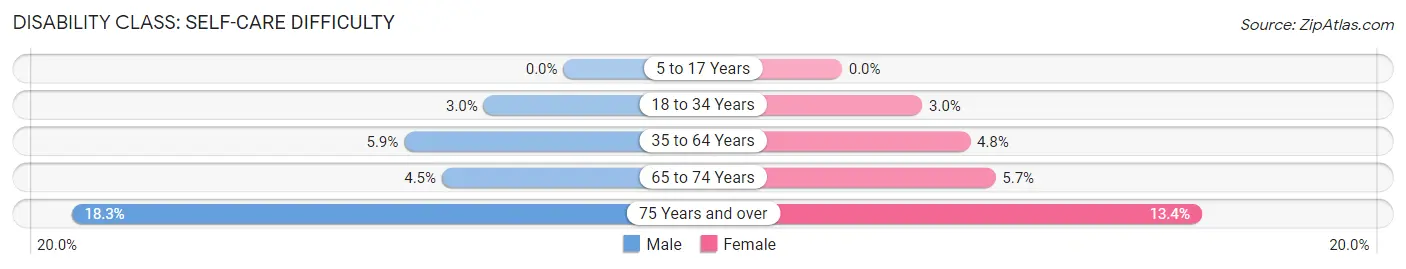
| Age Bracket | Male | Female |
| 5 to 17 Years | 0 (0.0%) | 0 (0.0%) |
| 18 to 34 Years | 121 (3.0%) | 127 (3.0%) |
| 35 to 64 Years | 567 (5.9%) | 479 (4.8%) |
| 65 to 74 Years | 137 (4.5%) | 199 (5.7%) |
| 75 Years and over | 424 (18.3%) | 429 (13.4%) |
Technology Access in Henry County
Computing Device Access in Henry County
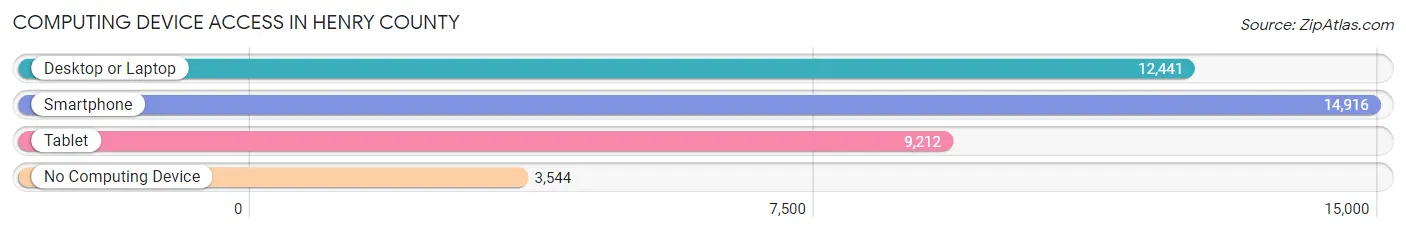
| Device Type | # Households | % Households |
| Desktop or Laptop | 12,441 | 61.0% |
| Smartphone | 14,916 | 73.1% |
| Tablet | 9,212 | 45.1% |
| No Computing Device | 3,544 | 17.4% |
| Total | 20,411 | 100.0% |
Internet Access in Henry County
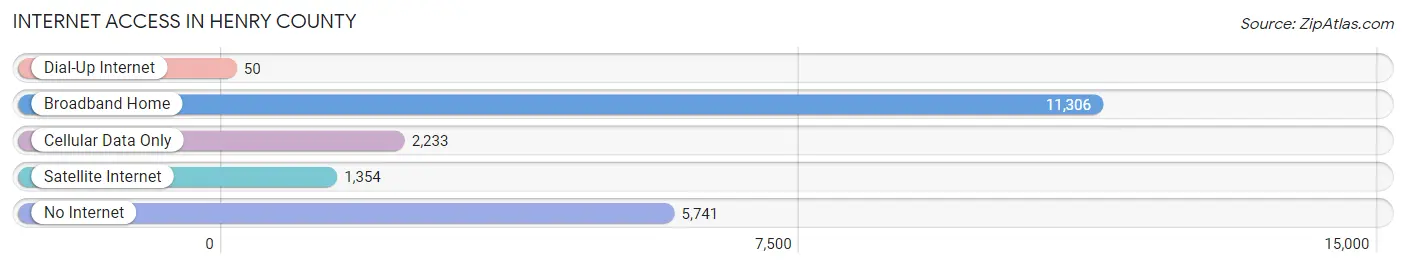
| Internet Type | # Households | % Households |
| Dial-Up Internet | 50 | 0.2% |
| Broadband Home | 11,306 | 55.4% |
| Cellular Data Only | 2,233 | 10.9% |
| Satellite Internet | 1,354 | 6.6% |
| No Internet | 5,741 | 28.1% |
| Total | 20,411 | 100.0% |
Henry County Summary
Henry County, Virginia is located in the south-central part of the state, and is part of the Piedmont region. It is bordered by Patrick County to the north, Franklin County to the east, Pittsylvania County to the south, and Martinsville to the west. The county seat is the town of Martinsville, which is also the largest city in the county. The county was established in 1777 and named for Patrick Henry, the famous Revolutionary War patriot and Virginia statesman.
Geography
Henry County covers an area of 437 square miles, of which 434 square miles is land and 3 square miles is water. The terrain is mostly rolling hills, with the highest point being the summit of Big Mountain at 1,845 feet. The county is drained by the Smith River, which flows through the county from north to south. Other major waterways include the Dan River, the Mayo River, and the Roanoke River.
The county is home to several state parks, including Fairy Stone State Park, Philpott Lake, and Smith Mountain Lake. Fairy Stone State Park is located in the northern part of the county and is known for its unique rock formations. Philpott Lake is located in the southern part of the county and is a popular destination for fishing, boating, and camping. Smith Mountain Lake is located in the western part of the county and is a popular destination for swimming, boating, and fishing.
Economy
Henry County has a diverse economy, with the largest industries being manufacturing, healthcare, and retail. The county is home to several major employers, including Bassett Furniture, Stanley Furniture, and Carilion Clinic. Bassett Furniture is the largest employer in the county, with over 1,000 employees. Stanley Furniture is the second largest employer, with over 500 employees. Carilion Clinic is the third largest employer, with over 400 employees.
The county also has a thriving agricultural sector, with the main crops being corn, soybeans, wheat, and hay. Livestock production is also important, with the main animals being cattle, hogs, and poultry.
Demographics
As of the 2010 census, Henry County had a population of 54,151. The population was spread out, with 24.3% under the age of 18, 8.2% from 18 to 24, 28.2% from 25 to 44, 24.7% from 45 to 64, and 14.6% who were 65 years of age or older. The median age was 37.4 years.
The racial makeup of the county was 84.2% White, 11.7% African American, 0.3% Native American, 0.7% Asian, 0.1% Pacific Islander, 1.7% from other races, and 1.2% from two or more races. Hispanic or Latino of any race were 3.3% of the population.
The median income for a household in the county was $41,945, and the median income for a family was $50,945. The per capita income for the county was $21,845. About 11.2% of families and 14.3% of the population were below the poverty line, including 19.2% of those under age 18 and 11.2% of those age 65 or over.
Conclusion
Henry County, Virginia is a diverse and vibrant county located in the south-central part of the state. It is home to several major employers, including Bassett Furniture, Stanley Furniture, and Carilion Clinic. The county also has a thriving agricultural sector, with the main crops being corn, soybeans, wheat, and hay. The population of the county is 54,151, with the median age being 37.4 years. The median income for a household in the county is $41,945, and the median income for a family is $50,945. Henry County is a great place to live, work, and play.
Common Questions
What is Per Capita Income in Henry County?
Per Capita income in Henry County is $26,097.
What is the Median Family Income in Henry County?
Median Family Income in Henry County is $60,737.
What is the Median Household income in Henry County?
Median Household Income in Henry County is $43,694.
What is Income or Wage Gap in Henry County?
Income or Wage Gap in Henry County is 23.9%.
Women in Henry County earn 76.1 cents for every dollar earned by a man.
What is Family Income Deficit in Henry County?
Family Income Deficit in Henry County is $9,301.
Families that are below poverty line in Henry County earn $9,301 less on average than the poverty threshold level.
What is Inequality or Gini Index in Henry County?
Inequality or Gini Index in Henry County is 0.44.
What is the Total Population of Henry County?
Total Population of Henry County is 50,760.
What is the Total Male Population of Henry County?
Total Male Population of Henry County is 24,420.
What is the Total Female Population of Henry County?
Total Female Population of Henry County is 26,340.
What is the Ratio of Males per 100 Females in Henry County?
There are 92.71 Males per 100 Females in Henry County.
What is the Ratio of Females per 100 Males in Henry County?
There are 107.86 Females per 100 Males in Henry County.
What is the Median Population Age in Henry County?
Median Population Age in Henry County is 48.3 Years.
What is the Average Family Size in Henry County
Average Family Size in Henry County is 3.3 People.
What is the Average Household Size in Henry County
Average Household Size in Henry County is 2.5 People.
How Large is the Labor Force in Henry County?
There are 21,426 People in the Labor Forcein in Henry County.
What is the Percentage of People in the Labor Force in Henry County?
51.1% of People are in the Labor Force in Henry County.
What is the Unemployment Rate in Henry County?
Unemployment Rate in Henry County is 5.2%.