Grayson County, VA Map & Demographics
Grayson County Map
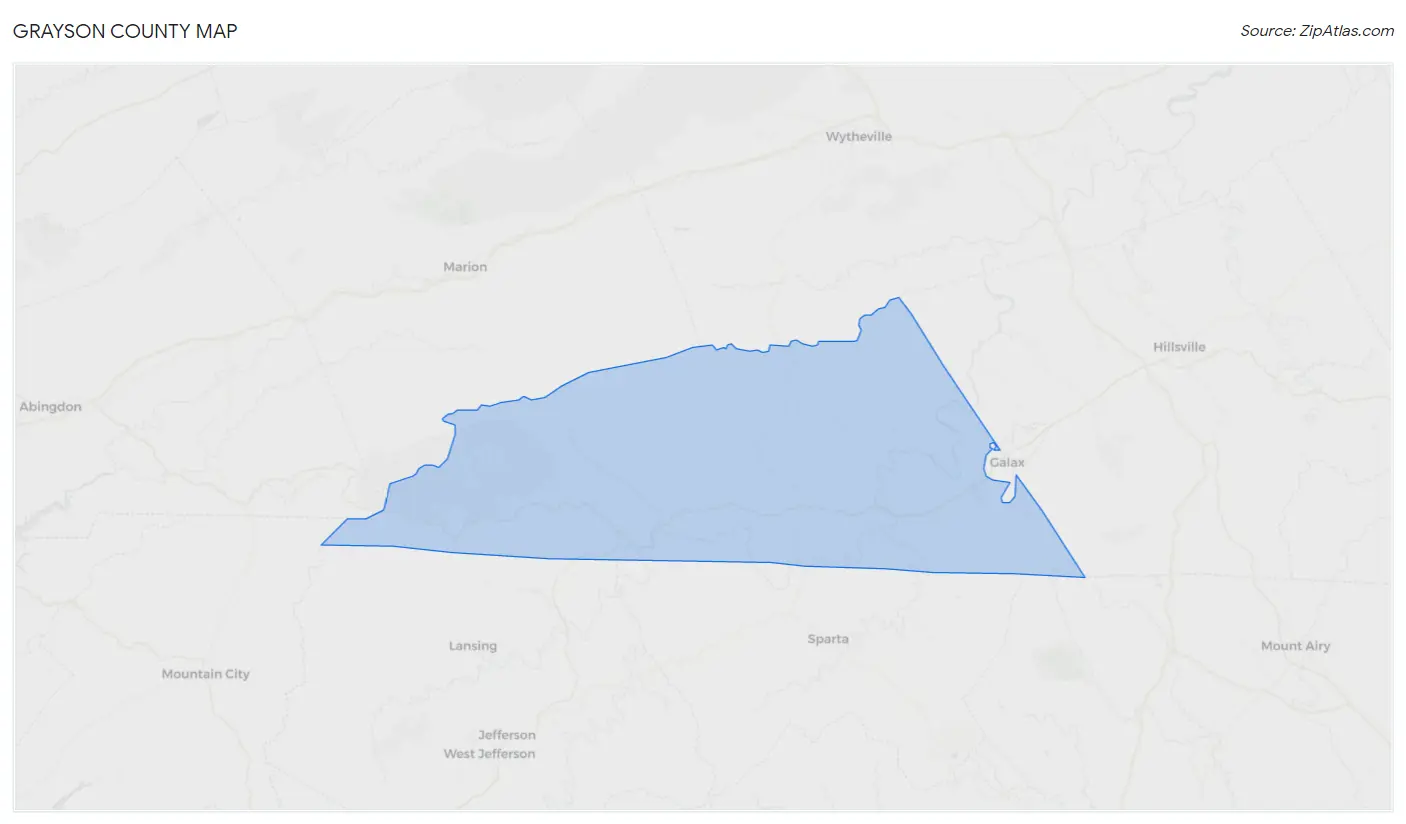
Grayson County Overview
$26,270
PER CAPITA INCOME
$58,588
AVG FAMILY INCOME
$43,348
AVG HOUSEHOLD INCOME
10.7%
WAGE / INCOME GAP [ % ]
89.3¢/ $1
WAGE / INCOME GAP [ $ ]
$9,549
FAMILY INCOME DEFICIT
0.47
INEQUALITY / GINI INDEX
15,356
TOTAL POPULATION
8,064
MALE POPULATION
7,292
FEMALE POPULATION
110.59
MALES / 100 FEMALES
90.43
FEMALES / 100 MALES
49.0
MEDIAN AGE
2.8
AVG FAMILY SIZE
2.3
AVG HOUSEHOLD SIZE
6,232
LABOR FORCE [ PEOPLE ]
47.9%
PERCENT IN LABOR FORCE
4.3%
UNEMPLOYMENT RATE
Grayson County Area Codes
Income in Grayson County
Income Overview in Grayson County
Per Capita Income in Grayson County is $26,270, while median incomes of families and households are $58,588 and $43,348 respectively.
| Characteristic | Number | Measure |
| Per Capita Income | 15,356 | $26,270 |
| Median Family Income | 4,176 | $58,588 |
| Mean Family Income | 4,176 | $69,951 |
| Median Household Income | 6,148 | $43,348 |
| Mean Household Income | 6,148 | $62,651 |
| Income Deficit | 4,176 | $9,549 |
| Wage / Income Gap (%) | 15,356 | 10.66% |
| Wage / Income Gap ($) | 15,356 | 89.34¢ per $1 |
| Gini / Inequality Index | 15,356 | 0.47 |
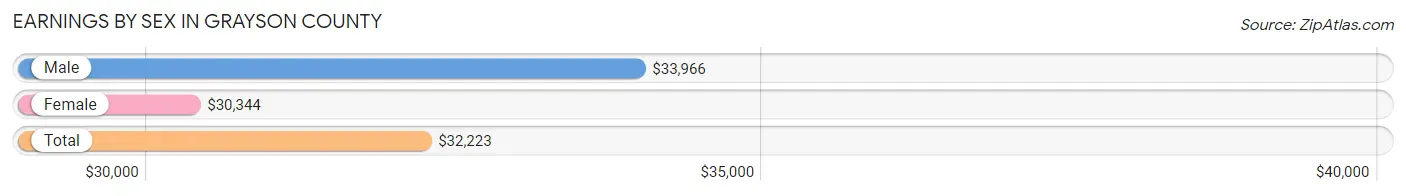
Earnings by Sex in Grayson County
Average Earnings in Grayson County are $32,223, $33,966 for men and $30,344 for women, a difference of 10.7%.
| Sex | Number | Average Earnings |
| Male | 3,646 (54.6%) | $33,966 |
| Female | 3,026 (45.4%) | $30,344 |
| Total | 6,672 (100.0%) | $32,223 |
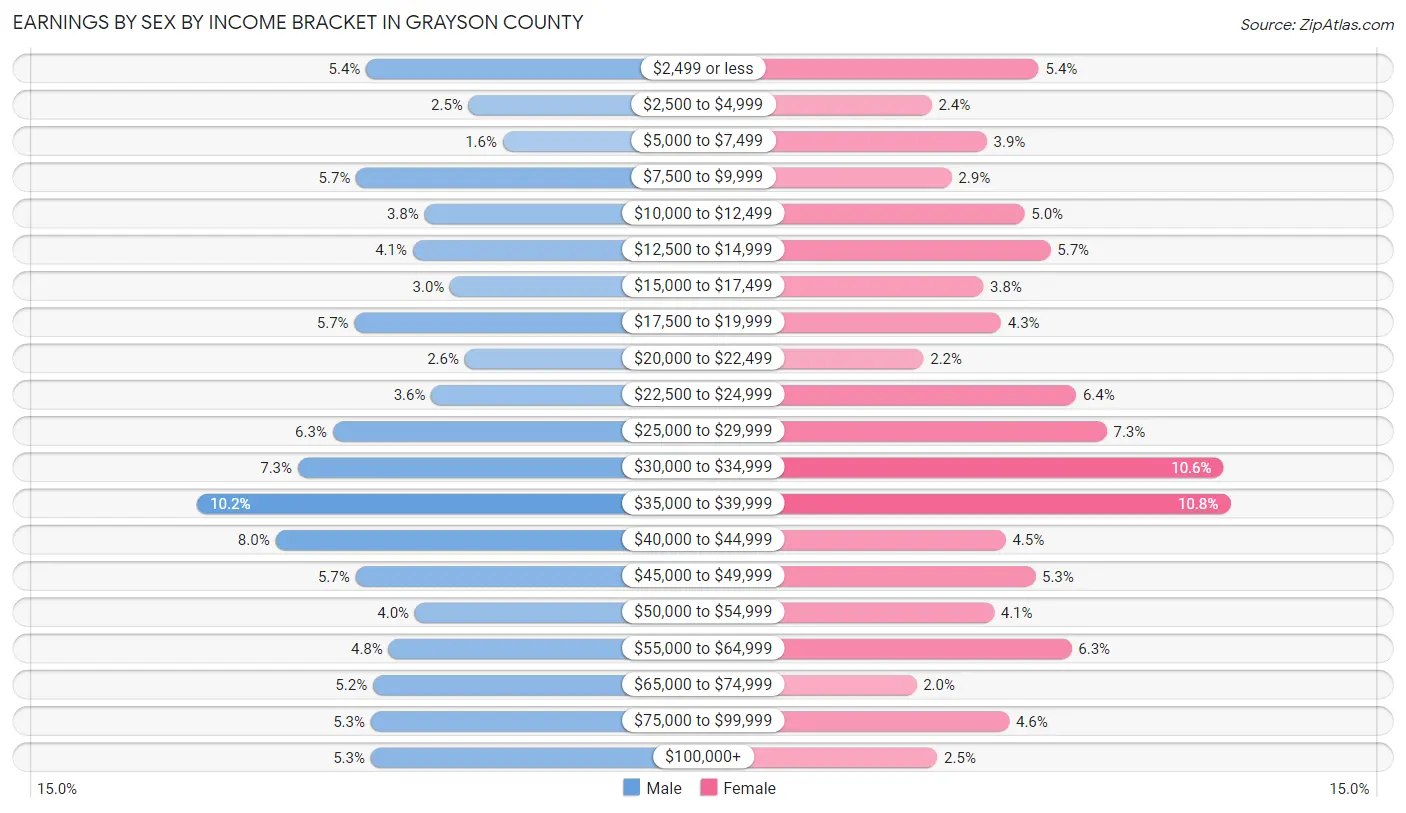
Earnings by Sex by Income Bracket in Grayson County
The most common earnings brackets in Grayson County are $35,000 to $39,999 for men (370 | 10.2%) and $35,000 to $39,999 for women (326 | 10.8%).
| Income | Male | Female |
| $2,499 or less | 197 (5.4%) | 163 (5.4%) |
| $2,500 to $4,999 | 92 (2.5%) | 72 (2.4%) |
| $5,000 to $7,499 | 57 (1.6%) | 119 (3.9%) |
| $7,500 to $9,999 | 207 (5.7%) | 89 (2.9%) |
| $10,000 to $12,499 | 137 (3.8%) | 151 (5.0%) |
| $12,500 to $14,999 | 149 (4.1%) | 173 (5.7%) |
| $15,000 to $17,499 | 111 (3.0%) | 116 (3.8%) |
| $17,500 to $19,999 | 209 (5.7%) | 131 (4.3%) |
| $20,000 to $22,499 | 96 (2.6%) | 65 (2.1%) |
| $22,500 to $24,999 | 130 (3.6%) | 195 (6.4%) |
| $25,000 to $29,999 | 231 (6.3%) | 221 (7.3%) |
| $30,000 to $34,999 | 267 (7.3%) | 320 (10.6%) |
| $35,000 to $39,999 | 370 (10.2%) | 326 (10.8%) |
| $40,000 to $44,999 | 290 (8.0%) | 135 (4.5%) |
| $45,000 to $49,999 | 208 (5.7%) | 160 (5.3%) |
| $50,000 to $54,999 | 147 (4.0%) | 125 (4.1%) |
| $55,000 to $64,999 | 174 (4.8%) | 191 (6.3%) |
| $65,000 to $74,999 | 190 (5.2%) | 59 (1.9%) |
| $75,000 to $99,999 | 192 (5.3%) | 138 (4.6%) |
| $100,000+ | 192 (5.3%) | 77 (2.5%) |
| Total | 3,646 (100.0%) | 3,026 (100.0%) |
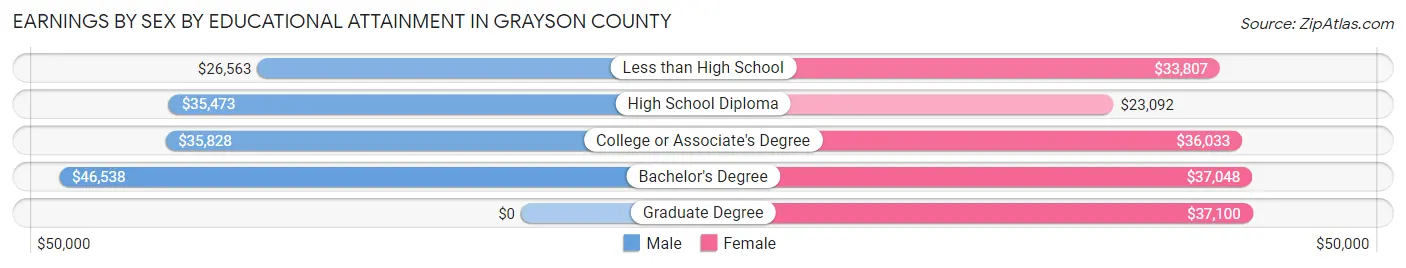
Earnings by Sex by Educational Attainment in Grayson County
Average earnings in Grayson County are $35,715 for men and $32,598 for women, a difference of 8.7%. Men with an educational attainment of bachelor's degree enjoy the highest average annual earnings of $46,538, while those with less than high school education earn the least with $26,563. Women with an educational attainment of graduate degree earn the most with the average annual earnings of $37,100, while those with high school diploma education have the smallest earnings of $23,092.
| Educational Attainment | Male Income | Female Income |
| Less than High School | $26,563 | $33,807 |
| High School Diploma | $35,473 | $23,092 |
| College or Associate's Degree | $35,828 | $36,033 |
| Bachelor's Degree | $46,538 | $37,048 |
| Graduate Degree | - | - |
| Total | $35,715 | $32,598 |
Family Income in Grayson County
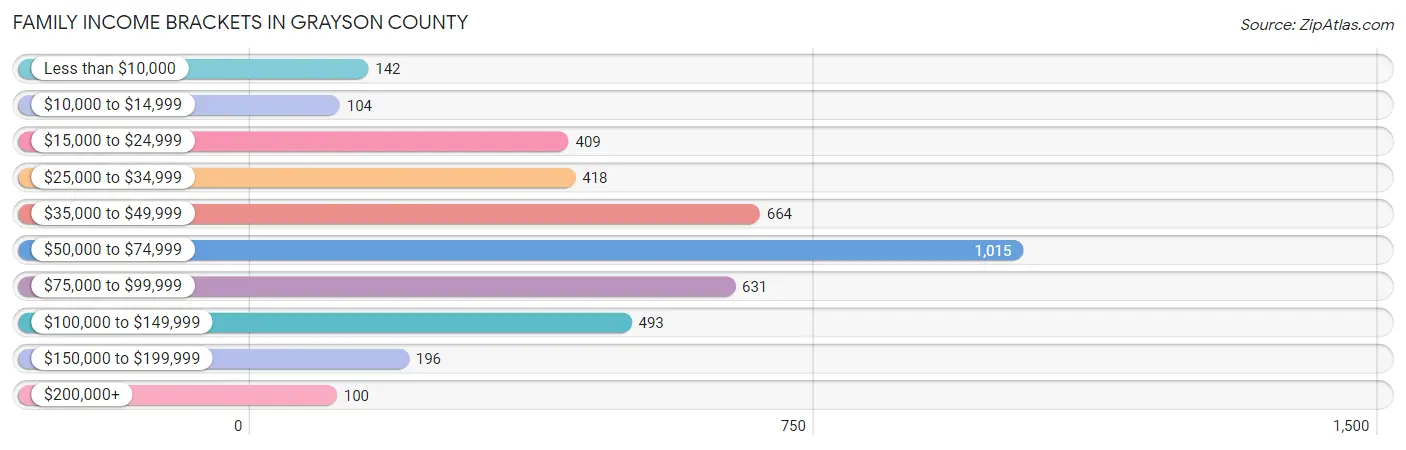
Family Income Brackets in Grayson County
According to the Grayson County family income data, there are 1,015 families falling into the $50,000 to $74,999 income range, which is the most common income bracket and makes up 24.3% of all families. Conversely, the $200,000+ income bracket is the least frequent group with only 100 families (2.4%) belonging to this category.
| Income Bracket | # Families | % Families |
| Less than $10,000 | 142 | 3.4% |
| $10,000 to $14,999 | 104 | 2.5% |
| $15,000 to $24,999 | 409 | 9.8% |
| $25,000 to $34,999 | 418 | 10.0% |
| $35,000 to $49,999 | 664 | 15.9% |
| $50,000 to $74,999 | 1,015 | 24.3% |
| $75,000 to $99,999 | 631 | 15.1% |
| $100,000 to $149,999 | 493 | 11.8% |
| $150,000 to $199,999 | 196 | 4.7% |
| $200,000+ | 100 | 2.4% |
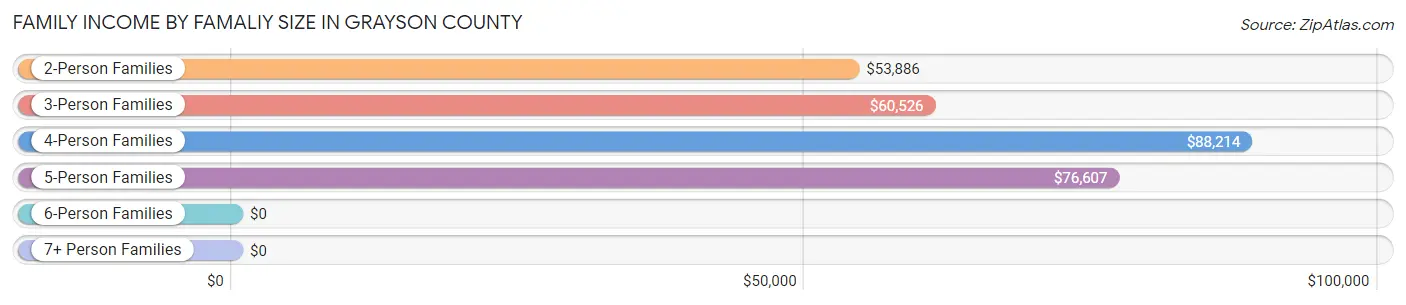
Family Income by Famaliy Size in Grayson County
4-person families (494 | 11.8%) account for the highest median family income in Grayson County with $88,214 per family, while 2-person families (2,529 | 60.6%) have the highest median income of $26,943 per family member.
| Income Bracket | # Families | Median Income |
| 2-Person Families | 2,529 (60.6%) | $53,886 |
| 3-Person Families | 840 (20.1%) | $60,526 |
| 4-Person Families | 494 (11.8%) | $88,214 |
| 5-Person Families | 192 (4.6%) | $76,607 |
| 6-Person Families | 81 (1.9%) | $0 |
| 7+ Person Families | 40 (1.0%) | $0 |
| Total | 4,176 (100.0%) | $58,588 |
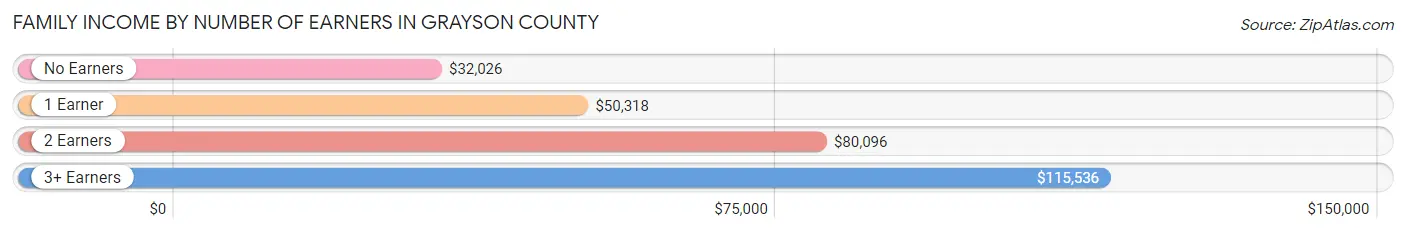
Family Income by Number of Earners in Grayson County
The median family income in Grayson County is $58,588, with families comprising 3+ earners (295) having the highest median family income of $115,536, while families with no earners (1,071) have the lowest median family income of $32,026, accounting for 7.1% and 25.7% of families, respectively.
| Number of Earners | # Families | Median Income |
| No Earners | 1,071 (25.7%) | $32,026 |
| 1 Earner | 1,214 (29.1%) | $50,318 |
| 2 Earners | 1,596 (38.2%) | $80,096 |
| 3+ Earners | 295 (7.1%) | $115,536 |
| Total | 4,176 (100.0%) | $58,588 |
Household Income in Grayson County
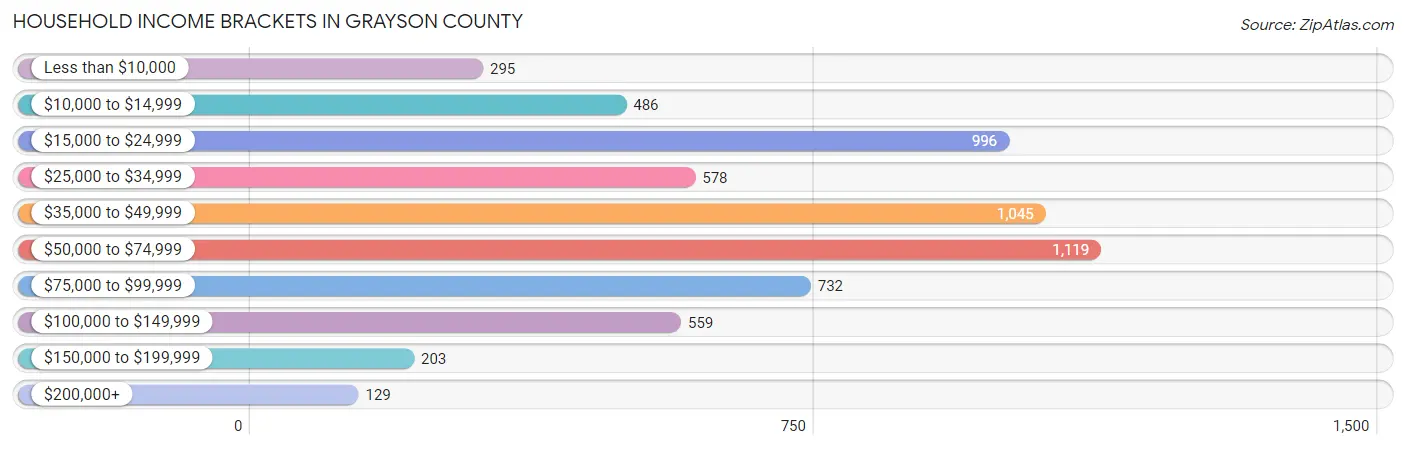
Household Income Brackets in Grayson County
With 1,119 households falling in the category, the $50,000 to $74,999 income range is the most frequent in Grayson County, accounting for 18.2% of all households. In contrast, only 129 households (2.1%) fall into the $200,000+ income bracket, making it the least populous group.
| Income Bracket | # Households | % Households |
| Less than $10,000 | 295 | 4.8% |
| $10,000 to $14,999 | 486 | 7.9% |
| $15,000 to $24,999 | 996 | 16.2% |
| $25,000 to $34,999 | 578 | 9.4% |
| $35,000 to $49,999 | 1,045 | 17.0% |
| $50,000 to $74,999 | 1,119 | 18.2% |
| $75,000 to $99,999 | 732 | 11.9% |
| $100,000 to $149,999 | 559 | 9.1% |
| $150,000 to $199,999 | 203 | 3.3% |
| $200,000+ | 129 | 2.1% |
Household Income by Householder Age in Grayson County
The median household income in Grayson County is $43,348, with the highest median household income of $62,558 found in the 45 to 64 years age bracket for the primary householder. A total of 2,293 households (37.3%) fall into this category. Meanwhile, the 15 to 24 years age bracket for the primary householder has the lowest median household income of $29,479, with 162 households (2.6%) in this group.
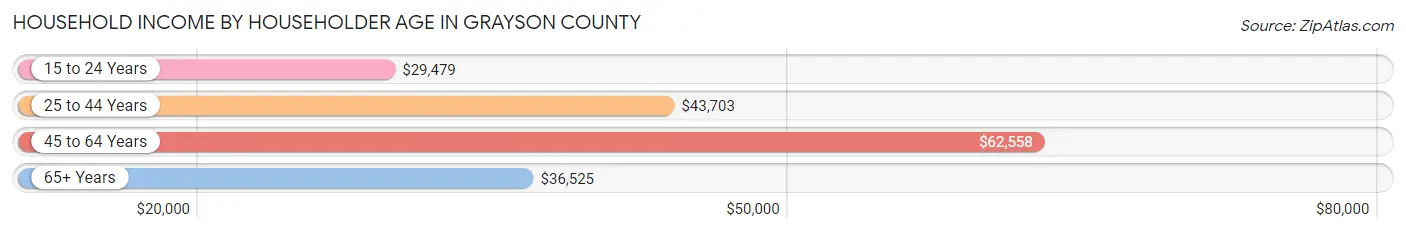
| Income Bracket | # Households | Median Income |
| 15 to 24 Years | 162 (2.6%) | $29,479 |
| 25 to 44 Years | 1,263 (20.5%) | $43,703 |
| 45 to 64 Years | 2,293 (37.3%) | $62,558 |
| 65+ Years | 2,430 (39.5%) | $36,525 |
| Total | 6,148 (100.0%) | $43,348 |
Poverty in Grayson County
Income Below Poverty by Sex and Age in Grayson County
With 16.3% poverty level for males and 21.1% for females among the residents of Grayson County, 12 to 14 year old males and 12 to 14 year old females are the most vulnerable to poverty, with 67 males (38.1%) and 86 females (40.8%) in their respective age groups living below the poverty level.
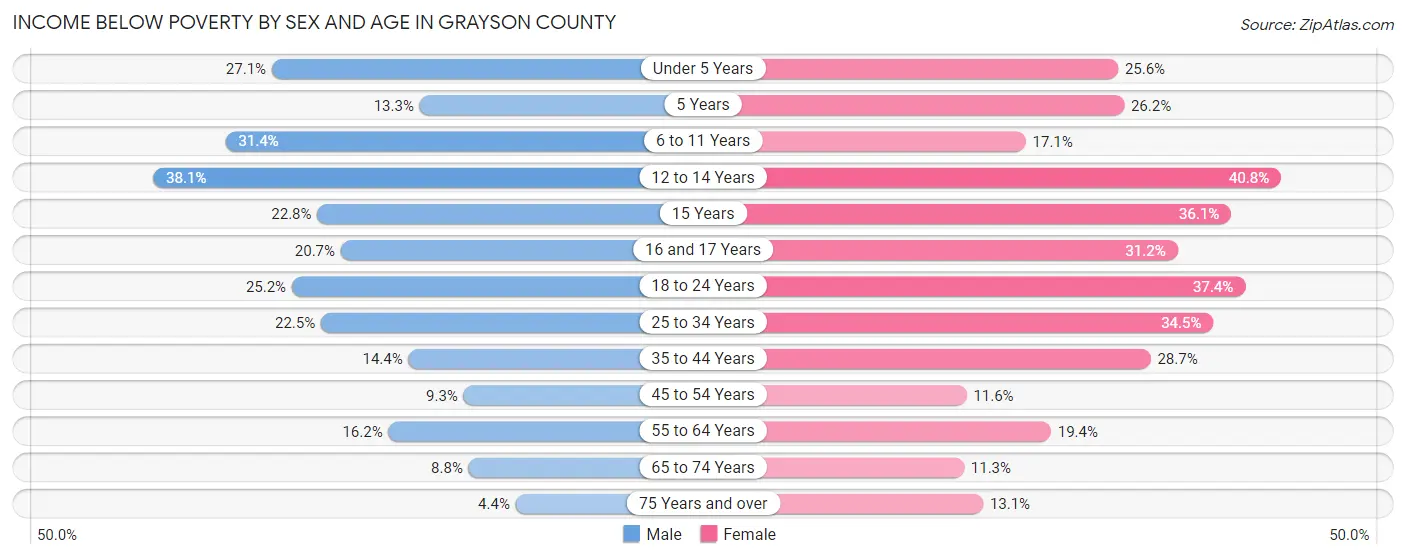
| Age Bracket | Male | Female |
| Under 5 Years | 79 (27.1%) | 71 (25.6%) |
| 5 Years | 16 (13.3%) | 22 (26.2%) |
| 6 to 11 Years | 143 (31.4%) | 73 (17.1%) |
| 12 to 14 Years | 67 (38.1%) | 86 (40.8%) |
| 15 Years | 29 (22.8%) | 56 (36.1%) |
| 16 and 17 Years | 19 (20.6%) | 19 (31.1%) |
| 18 to 24 Years | 136 (25.2%) | 195 (37.4%) |
| 25 to 34 Years | 179 (22.5%) | 212 (34.5%) |
| 35 to 44 Years | 102 (14.4%) | 198 (28.6%) |
| 45 to 54 Years | 96 (9.2%) | 111 (11.6%) |
| 55 to 64 Years | 185 (16.2%) | 240 (19.4%) |
| 65 to 74 Years | 99 (8.8%) | 116 (11.3%) |
| 75 Years and over | 28 (4.4%) | 123 (13.1%) |
| Total | 1,178 (16.3%) | 1,522 (21.1%) |
Income Above Poverty by Sex and Age in Grayson County
According to the poverty statistics in Grayson County, males aged 75 years and over and females aged 65 to 74 years are the age groups that are most secure financially, with 95.6% of males and 88.7% of females in these age groups living above the poverty line.
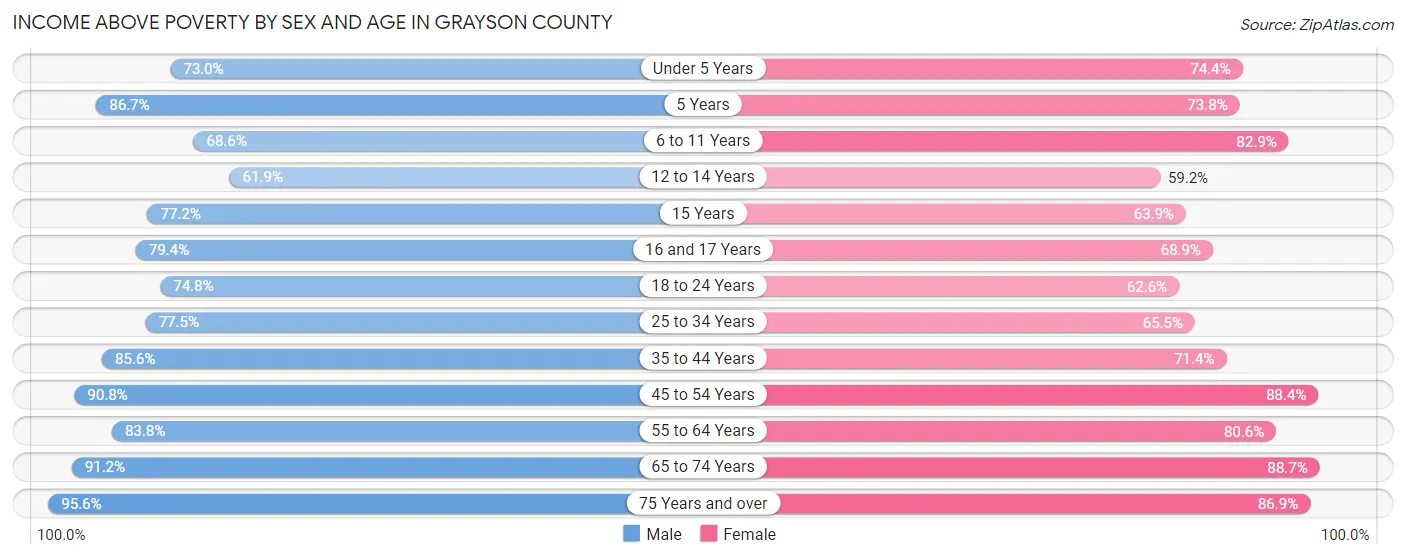
| Age Bracket | Male | Female |
| Under 5 Years | 213 (73.0%) | 206 (74.4%) |
| 5 Years | 104 (86.7%) | 62 (73.8%) |
| 6 to 11 Years | 313 (68.6%) | 355 (82.9%) |
| 12 to 14 Years | 109 (61.9%) | 125 (59.2%) |
| 15 Years | 98 (77.2%) | 99 (63.9%) |
| 16 and 17 Years | 73 (79.3%) | 42 (68.9%) |
| 18 to 24 Years | 404 (74.8%) | 326 (62.6%) |
| 25 to 34 Years | 617 (77.5%) | 403 (65.5%) |
| 35 to 44 Years | 608 (85.6%) | 493 (71.4%) |
| 45 to 54 Years | 942 (90.7%) | 848 (88.4%) |
| 55 to 64 Years | 955 (83.8%) | 997 (80.6%) |
| 65 to 74 Years | 1,029 (91.2%) | 908 (88.7%) |
| 75 Years and over | 605 (95.6%) | 816 (86.9%) |
| Total | 6,070 (83.8%) | 5,680 (78.9%) |
Income Below Poverty Among Married-Couple Families in Grayson County
The poverty statistics for married-couple families in Grayson County show that 5.6% or 180 of the total 3,211 families live below the poverty line. Families with 5 or more children have the highest poverty rate of 50.0%, comprising of 12 families. On the other hand, families with no children have the lowest poverty rate of 3.0%, which includes 67 families.
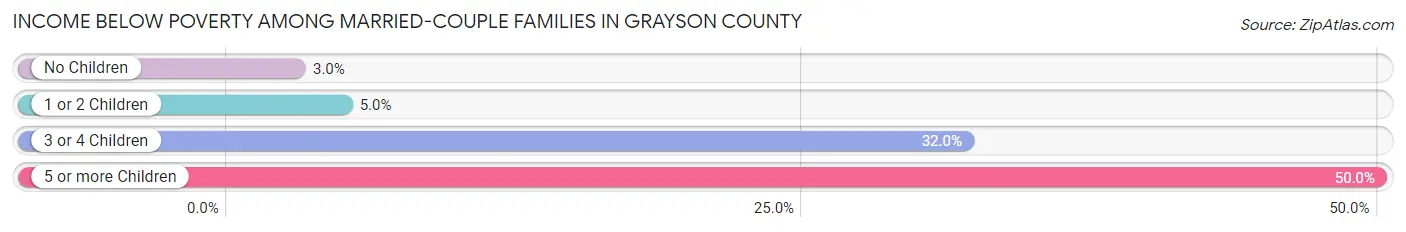
| Children | Above Poverty | Below Poverty |
| No Children | 2,196 (97.0%) | 67 (3.0%) |
| 1 or 2 Children | 685 (95.0%) | 36 (5.0%) |
| 3 or 4 Children | 138 (68.0%) | 65 (32.0%) |
| 5 or more Children | 12 (50.0%) | 12 (50.0%) |
| Total | 3,031 (94.4%) | 180 (5.6%) |
Income Below Poverty Among Single-Parent Households in Grayson County
According to the poverty data in Grayson County, 20.2% or 51 single-father households and 42.8% or 305 single-mother households are living below the poverty line. Among single-father households, those with 1 or 2 children have the highest poverty rate, with 44 households (56.4%) experiencing poverty. Likewise, among single-mother households, those with 3 or 4 children have the highest poverty rate, with 38 households (84.4%) falling below the poverty line.
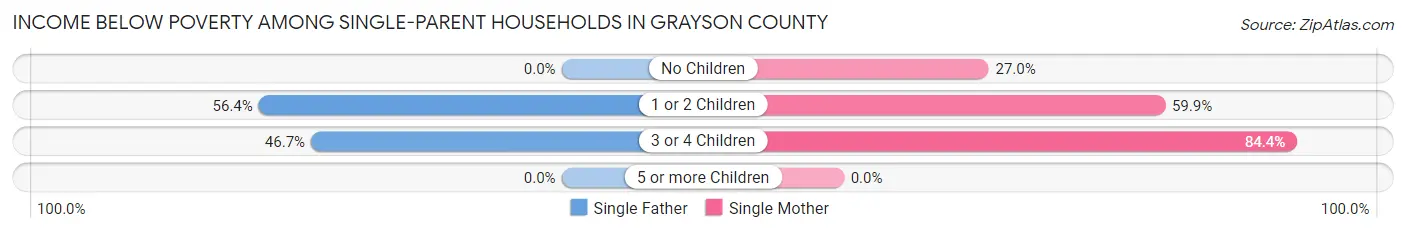
| Children | Single Father | Single Mother |
| No Children | 0 (0.0%) | 109 (27.0%) |
| 1 or 2 Children | 44 (56.4%) | 158 (59.9%) |
| 3 or 4 Children | 7 (46.7%) | 38 (84.4%) |
| 5 or more Children | 0 (0.0%) | 0 (0.0%) |
| Total | 51 (20.2%) | 305 (42.8%) |
Income Below Poverty Among Married-Couple vs Single-Parent Households in Grayson County
The poverty data for Grayson County shows that 180 of the married-couple family households (5.6%) and 356 of the single-parent households (36.9%) are living below the poverty level. Within the married-couple family households, those with 5 or more children have the highest poverty rate, with 12 households (50.0%) falling below the poverty line. Among the single-parent households, those with 3 or 4 children have the highest poverty rate, with 45 household (75.0%) living below poverty.
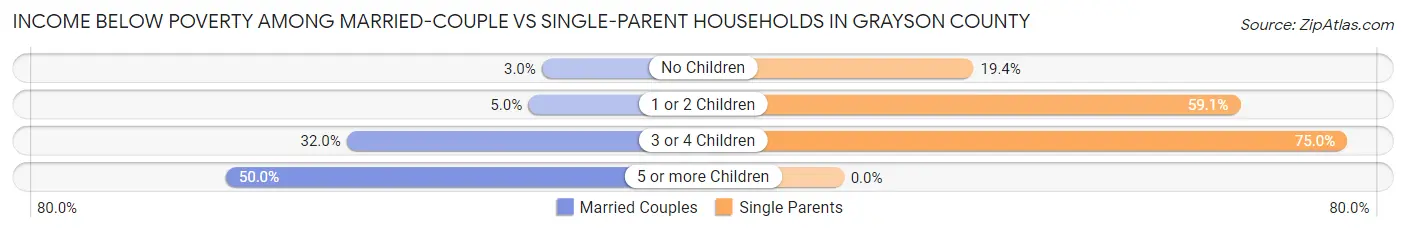
| Children | Married-Couple Families | Single-Parent Households |
| No Children | 67 (3.0%) | 109 (19.4%) |
| 1 or 2 Children | 36 (5.0%) | 202 (59.1%) |
| 3 or 4 Children | 65 (32.0%) | 45 (75.0%) |
| 5 or more Children | 12 (50.0%) | 0 (0.0%) |
| Total | 180 (5.6%) | 356 (36.9%) |
Race in Grayson County
The most populous races in Grayson County are White / Caucasian (13,848 | 90.2%), Black / African American (852 | 5.6%), and Hispanic or Latino (601 | 3.9%).
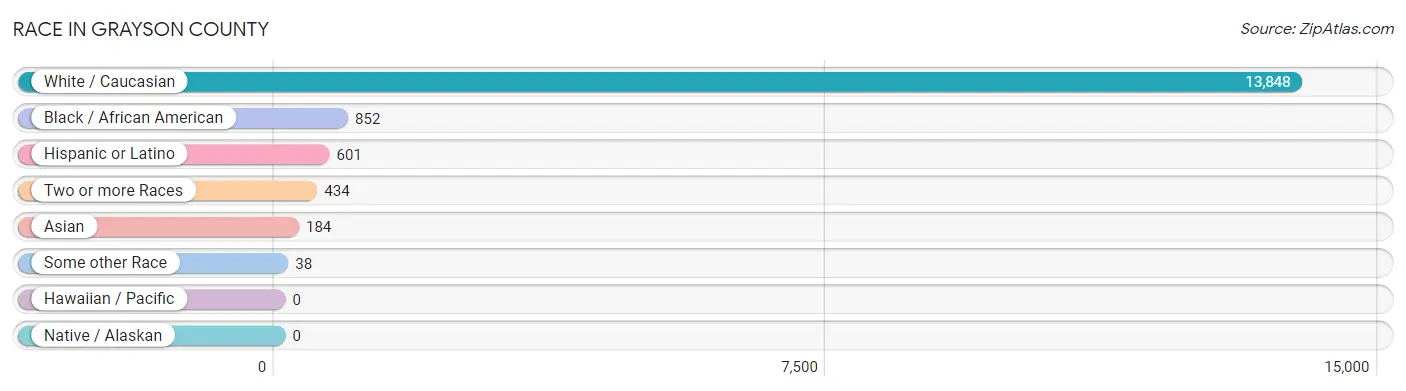
| Race | # Population | % Population |
| Asian | 184 | 1.2% |
| Black / African American | 852 | 5.6% |
| Hawaiian / Pacific | 0 | 0.0% |
| Hispanic or Latino | 601 | 3.9% |
| Native / Alaskan | 0 | 0.0% |
| White / Caucasian | 13,848 | 90.2% |
| Two or more Races | 434 | 2.8% |
| Some other Race | 38 | 0.3% |
| Total | 15,356 | 100.0% |
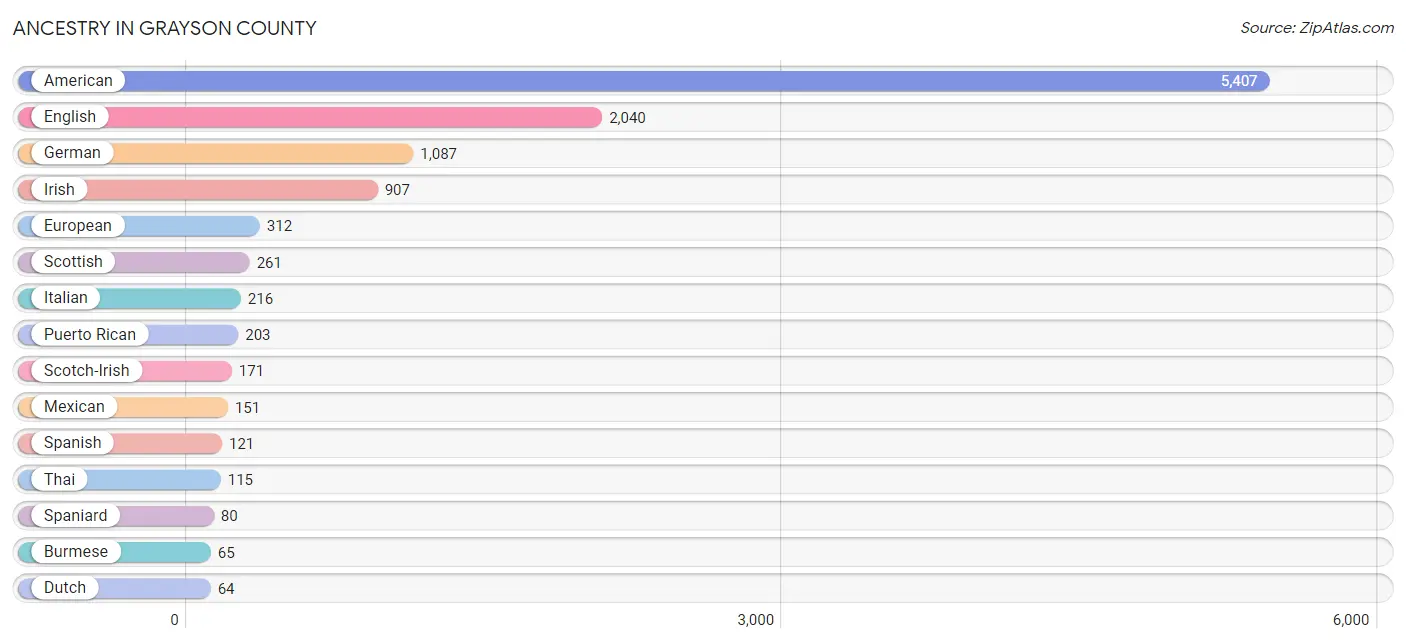
Ancestry in Grayson County
The most populous ancestries reported in Grayson County are American (5,407 | 35.2%), English (2,040 | 13.3%), German (1,087 | 7.1%), Irish (907 | 5.9%), and European (312 | 2.0%), together accounting for 63.5% of all Grayson County residents.
| Ancestry | # Population | % Population |
| African | 27 | 0.2% |
| American | 5,407 | 35.2% |
| Arab | 5 | 0.0% |
| Austrian | 43 | 0.3% |
| Belizean | 37 | 0.2% |
| Bhutanese | 21 | 0.1% |
| Bolivian | 7 | 0.1% |
| British | 38 | 0.3% |
| Burmese | 65 | 0.4% |
| Central American | 10 | 0.1% |
| Central American Indian | 49 | 0.3% |
| Cherokee | 23 | 0.2% |
| Chickasaw | 7 | 0.1% |
| Croatian | 8 | 0.1% |
| Dutch | 64 | 0.4% |
| Eastern European | 25 | 0.2% |
| English | 2,040 | 13.3% |
| European | 312 | 2.0% |
| French | 59 | 0.4% |
| German | 1,087 | 7.1% |
| Hungarian | 15 | 0.1% |
| Indian (Asian) | 1 | 0.0% |
| Irish | 907 | 5.9% |
| Italian | 216 | 1.4% |
| Jamaican | 7 | 0.1% |
| Korean | 59 | 0.4% |
| Lebanese | 5 | 0.0% |
| Lithuanian | 9 | 0.1% |
| Mexican | 151 | 1.0% |
| Northern European | 18 | 0.1% |
| Norwegian | 9 | 0.1% |
| Panamanian | 10 | 0.1% |
| Polish | 37 | 0.2% |
| Puerto Rican | 203 | 1.3% |
| Russian | 57 | 0.4% |
| Scandinavian | 53 | 0.4% |
| Scotch-Irish | 171 | 1.1% |
| Scottish | 261 | 1.7% |
| South American | 27 | 0.2% |
| Spaniard | 80 | 0.5% |
| Spanish | 121 | 0.8% |
| Subsaharan African | 27 | 0.2% |
| Swedish | 22 | 0.1% |
| Swiss | 25 | 0.2% |
| Thai | 115 | 0.7% |
| Trinidadian and Tobagonian | 5 | 0.0% |
| Uruguayan | 20 | 0.1% |
| Welsh | 46 | 0.3% |
| West Indian | 7 | 0.1% | View All 49 Rows |
Immigrants in Grayson County
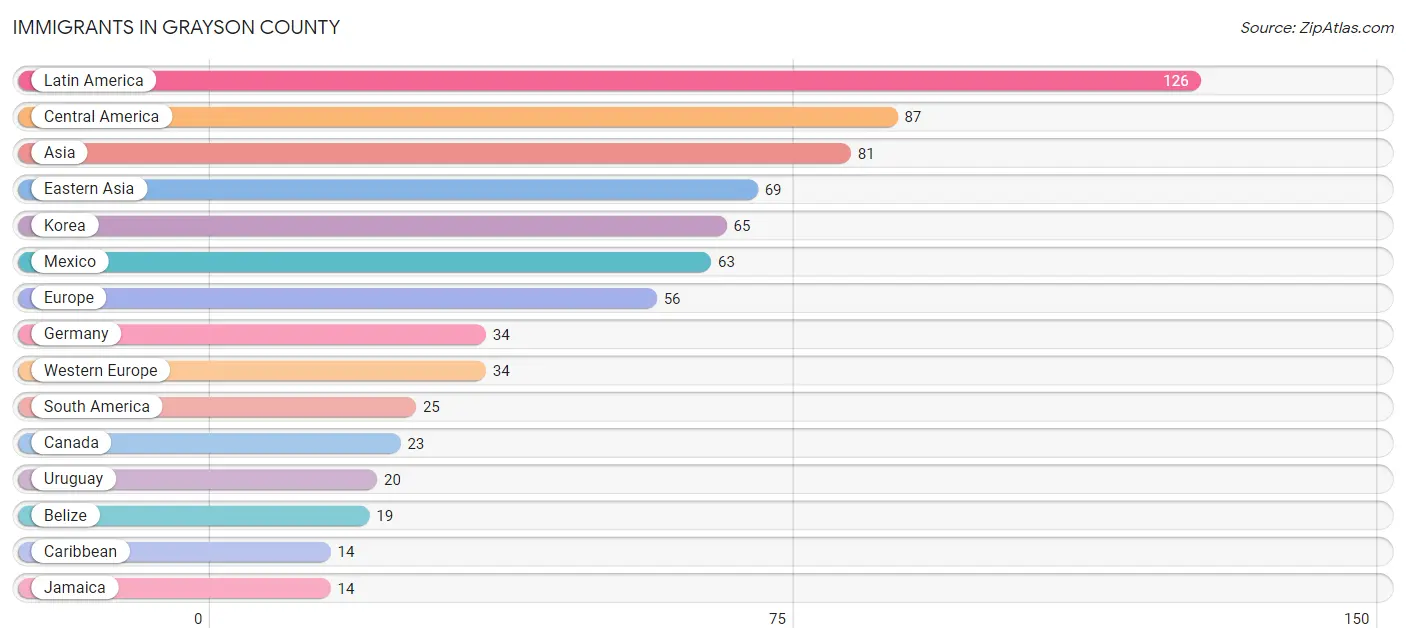
The most numerous immigrant groups reported in Grayson County came from Latin America (126 | 0.8%), Central America (87 | 0.6%), Asia (81 | 0.5%), Eastern Asia (69 | 0.4%), and Korea (65 | 0.4%), together accounting for 2.8% of all Grayson County residents.
| Immigration Origin | # Population | % Population |
| Asia | 81 | 0.5% |
| Belarus | 10 | 0.1% |
| Belize | 19 | 0.1% |
| Bolivia | 5 | 0.0% |
| Canada | 23 | 0.2% |
| Caribbean | 14 | 0.1% |
| Central America | 87 | 0.6% |
| China | 4 | 0.0% |
| Eastern Asia | 69 | 0.4% |
| Eastern Europe | 10 | 0.1% |
| El Salvador | 5 | 0.0% |
| England | 5 | 0.0% |
| Europe | 56 | 0.4% |
| Germany | 34 | 0.2% |
| Hong Kong | 3 | 0.0% |
| Jamaica | 14 | 0.1% |
| Korea | 65 | 0.4% |
| Latin America | 126 | 0.8% |
| Mexico | 63 | 0.4% |
| Northern Europe | 12 | 0.1% |
| South America | 25 | 0.2% |
| Uruguay | 20 | 0.1% |
| Western Asia | 12 | 0.1% |
| Western Europe | 34 | 0.2% | View All 24 Rows |
Sex and Age in Grayson County
Sex and Age in Grayson County
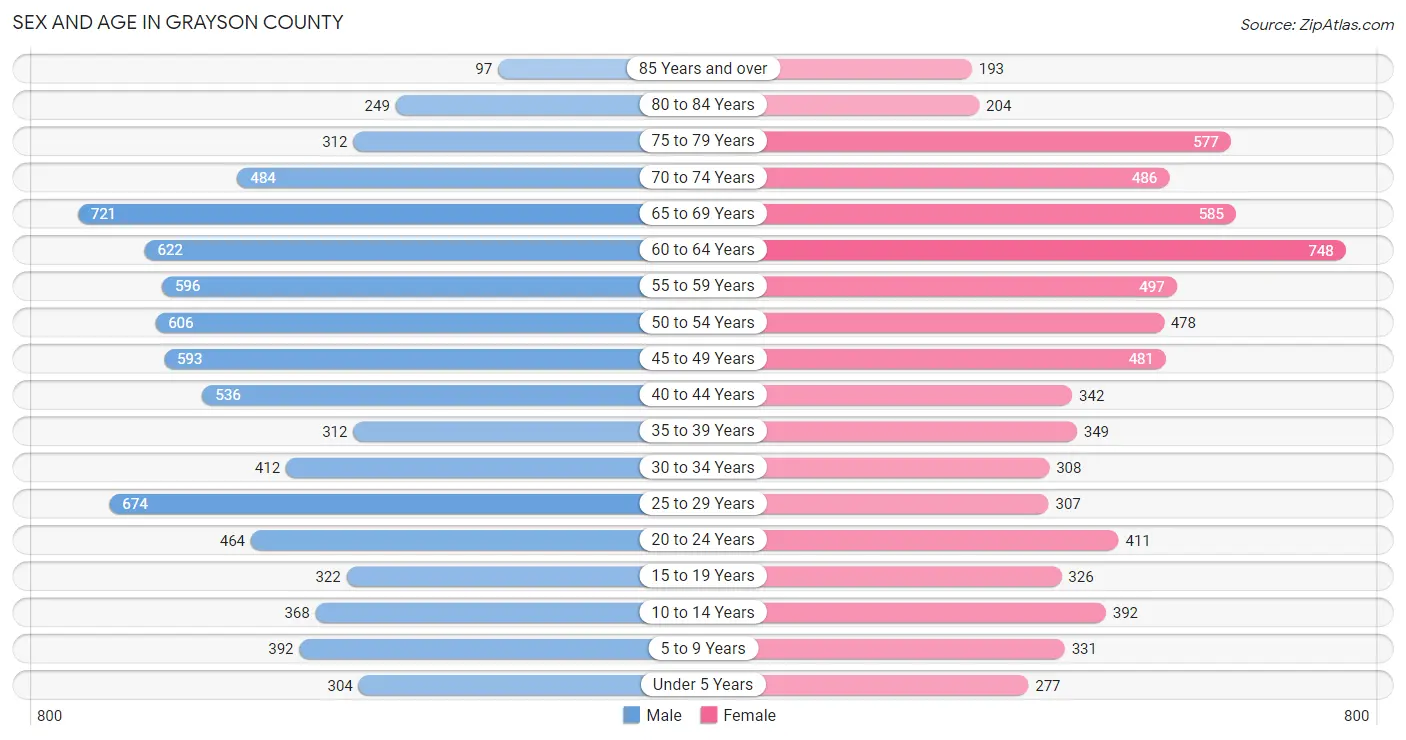
The most populous age groups in Grayson County are 65 to 69 Years (721 | 8.9%) for men and 60 to 64 Years (748 | 10.3%) for women.
| Age Bracket | Male | Female |
| Under 5 Years | 304 (3.8%) | 277 (3.8%) |
| 5 to 9 Years | 392 (4.9%) | 331 (4.5%) |
| 10 to 14 Years | 368 (4.6%) | 392 (5.4%) |
| 15 to 19 Years | 322 (4.0%) | 326 (4.5%) |
| 20 to 24 Years | 464 (5.8%) | 411 (5.6%) |
| 25 to 29 Years | 674 (8.4%) | 307 (4.2%) |
| 30 to 34 Years | 412 (5.1%) | 308 (4.2%) |
| 35 to 39 Years | 312 (3.9%) | 349 (4.8%) |
| 40 to 44 Years | 536 (6.7%) | 342 (4.7%) |
| 45 to 49 Years | 593 (7.3%) | 481 (6.6%) |
| 50 to 54 Years | 606 (7.5%) | 478 (6.6%) |
| 55 to 59 Years | 596 (7.4%) | 497 (6.8%) |
| 60 to 64 Years | 622 (7.7%) | 748 (10.3%) |
| 65 to 69 Years | 721 (8.9%) | 585 (8.0%) |
| 70 to 74 Years | 484 (6.0%) | 486 (6.7%) |
| 75 to 79 Years | 312 (3.9%) | 577 (7.9%) |
| 80 to 84 Years | 249 (3.1%) | 204 (2.8%) |
| 85 Years and over | 97 (1.2%) | 193 (2.6%) |
| Total | 8,064 (100.0%) | 7,292 (100.0%) |
Families and Households in Grayson County
Median Family Size in Grayson County
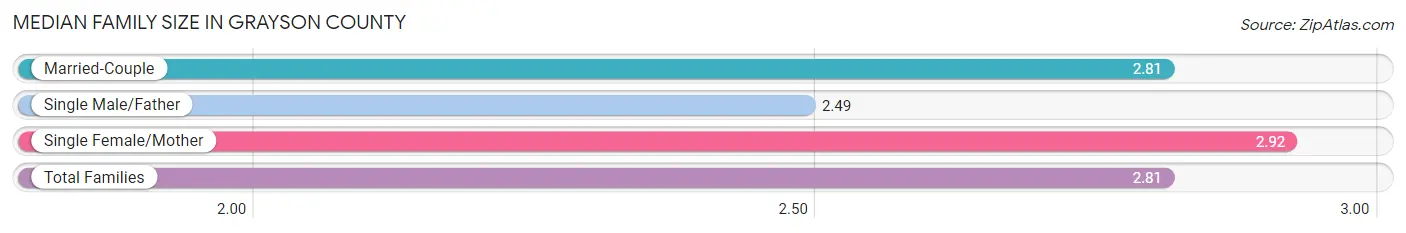
The median family size in Grayson County is 2.81 persons per family, with single female/mother families (713 | 17.1%) accounting for the largest median family size of 2.92 persons per family. On the other hand, single male/father families (252 | 6.0%) represent the smallest median family size with 2.49 persons per family.
| Family Type | # Families | Family Size |
| Married-Couple | 3,211 (76.9%) | 2.81 |
| Single Male/Father | 252 (6.0%) | 2.49 |
| Single Female/Mother | 713 (17.1%) | 2.92 |
| Total Families | 4,176 (100.0%) | 2.81 |
Median Household Size in Grayson County
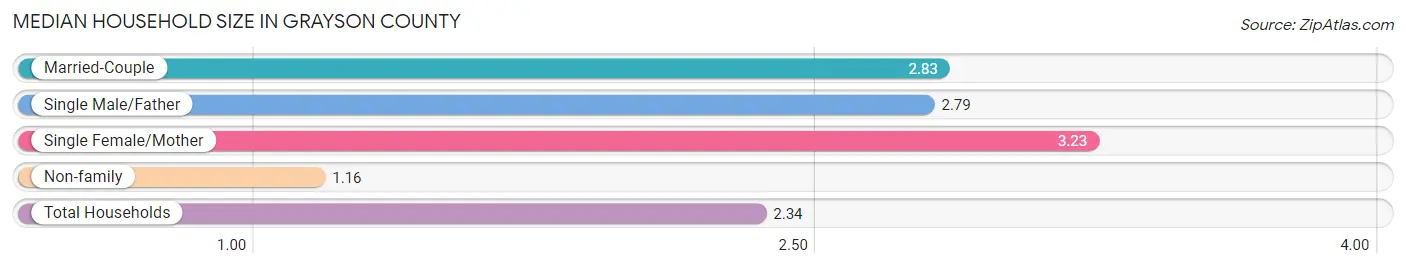
The median household size in Grayson County is 2.34 persons per household, with single female/mother households (713 | 11.6%) accounting for the largest median household size of 3.23 persons per household. non-family households (1,972 | 32.1%) represent the smallest median household size with 1.16 persons per household.
| Household Type | # Households | Household Size |
| Married-Couple | 3,211 (52.2%) | 2.83 |
| Single Male/Father | 252 (4.1%) | 2.79 |
| Single Female/Mother | 713 (11.6%) | 3.23 |
| Non-family | 1,972 (32.1%) | 1.16 |
| Total Households | 6,148 (100.0%) | 2.34 |
Household Size by Marriage Status in Grayson County
Out of a total of 6,148 households in Grayson County, 4,176 (67.9%) are family households, while 1,972 (32.1%) are nonfamily households. The most numerous type of family households are 2-person households, comprising 2,387, and the most common type of nonfamily households are 1-person households, comprising 1,778.
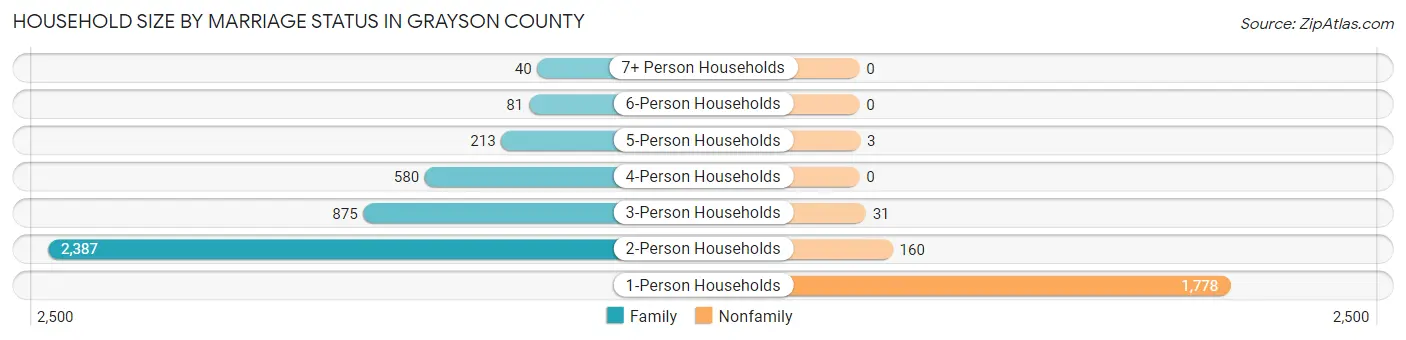
| Household Size | Family Households | Nonfamily Households |
| 1-Person Households | - | 1,778 (28.9%) |
| 2-Person Households | 2,387 (38.8%) | 160 (2.6%) |
| 3-Person Households | 875 (14.2%) | 31 (0.5%) |
| 4-Person Households | 580 (9.4%) | 0 (0.0%) |
| 5-Person Households | 213 (3.5%) | 3 (0.1%) |
| 6-Person Households | 81 (1.3%) | 0 (0.0%) |
| 7+ Person Households | 40 (0.6%) | 0 (0.0%) |
| Total | 4,176 (67.9%) | 1,972 (32.1%) |
Female Fertility in Grayson County
Fertility by Age in Grayson County
Average fertility rate in Grayson County is 43.0 births per 1,000 women. Women in the age bracket of 20 to 34 years have the highest fertility rate with 90.0 births per 1,000 women. Women in the age bracket of 20 to 34 years acount for 80.0% of all women with births.
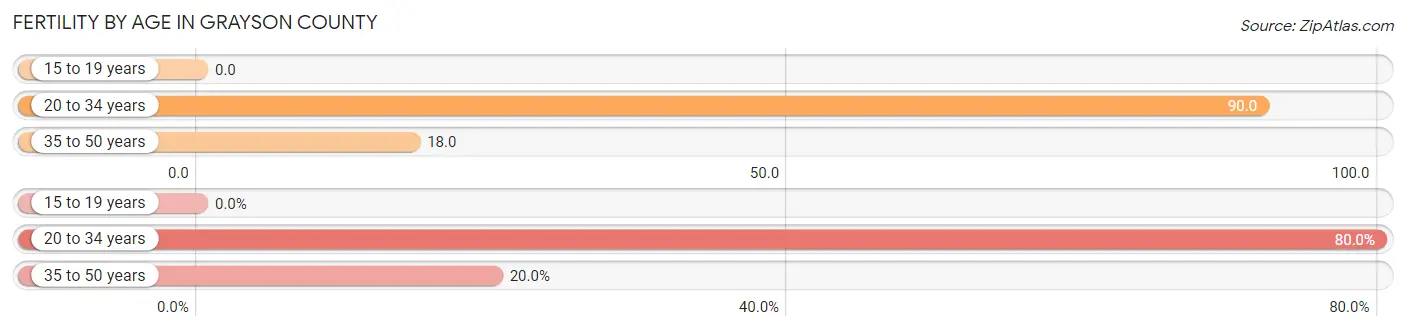
| Age Bracket | Women with Births | Births / 1,000 Women |
| 15 to 19 years | 0 (0.0%) | 0.0 |
| 20 to 34 years | 92 (80.0%) | 90.0 |
| 35 to 50 years | 23 (20.0%) | 18.0 |
| Total | 115 (100.0%) | 43.0 |
Fertility by Age by Marriage Status in Grayson County
72.2% of women with births (115) in Grayson County are married. The highest percentage of unmarried women with births falls into 35 to 50 years age bracket with 47.8% of them unmarried at the time of birth, while the lowest percentage of unmarried women with births belong to 20 to 34 years age bracket with 22.8% of them unmarried.
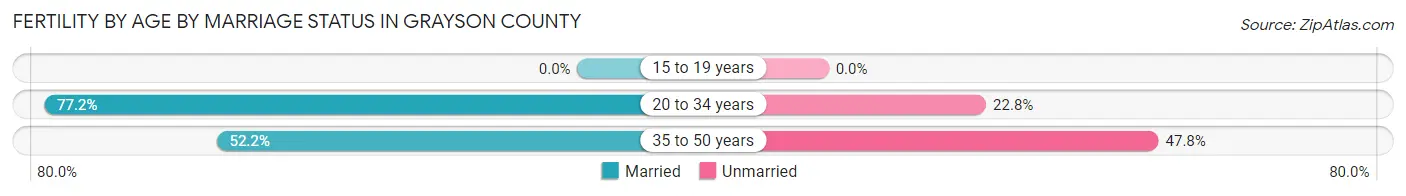
| Age Bracket | Married | Unmarried |
| 15 to 19 years | 0 (0.0%) | 0 (0.0%) |
| 20 to 34 years | 71 (77.2%) | 21 (22.8%) |
| 35 to 50 years | 12 (52.2%) | 11 (47.8%) |
| Total | 83 (72.2%) | 32 (27.8%) |
Fertility by Education in Grayson County
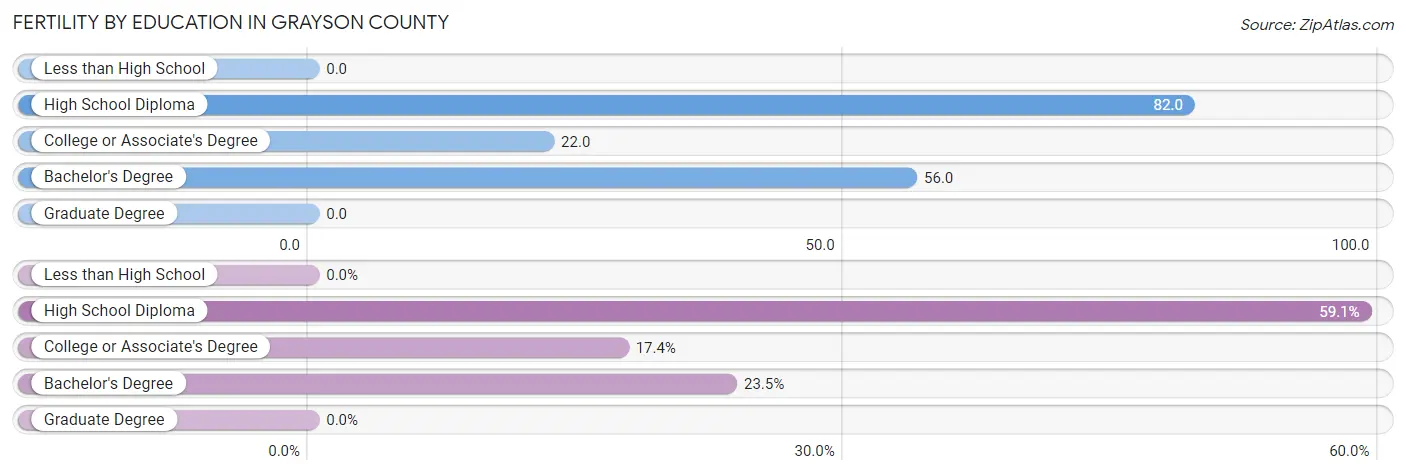
| Educational Attainment | Women with Births | Births / 1,000 Women |
| Less than High School | 0 (0.0%) | 0.0 |
| High School Diploma | 68 (59.1%) | 82.0 |
| College or Associate's Degree | 20 (17.4%) | 22.0 |
| Bachelor's Degree | 27 (23.5%) | 56.0 |
| Graduate Degree | 0 (0.0%) | 0.0 |
| Total | 115 (100.0%) | 43.0 |
Fertility by Education by Marriage Status in Grayson County
27.8% of women with births in Grayson County are unmarried. Women with the educational attainment of college or associate's degree are most likely to be married with 100.0% of them married at childbirth, while women with the educational attainment of bachelor's degree are least likely to be married with 40.7% of them unmarried at childbirth.
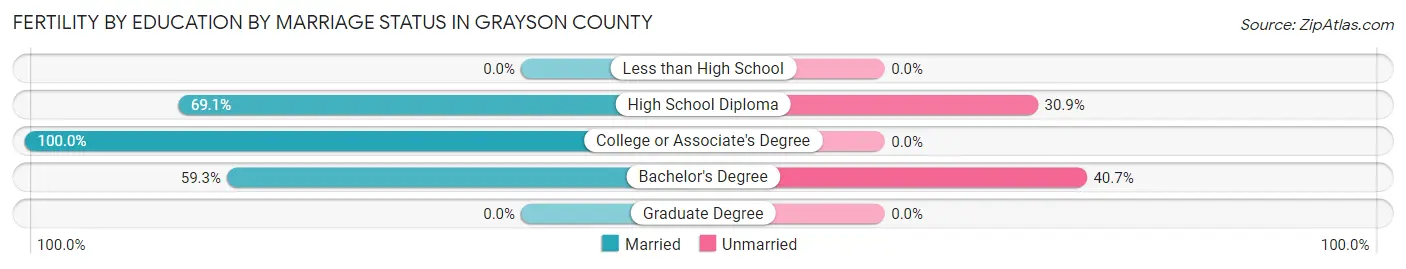
| Educational Attainment | Married | Unmarried |
| Less than High School | 0 (0.0%) | 0 (0.0%) |
| High School Diploma | 47 (69.1%) | 21 (30.9%) |
| College or Associate's Degree | 20 (100.0%) | 0 (0.0%) |
| Bachelor's Degree | 16 (59.3%) | 11 (40.7%) |
| Graduate Degree | 0 (0.0%) | 0 (0.0%) |
| Total | 83 (72.2%) | 32 (27.8%) |
Employment Characteristics in Grayson County
Employment by Class of Employer in Grayson County
Among the 5,827 employed individuals in Grayson County, private company employees (3,697 | 63.4%), state government employees (613 | 10.5%), and local government employees (605 | 10.4%) make up the most common classes of employment.
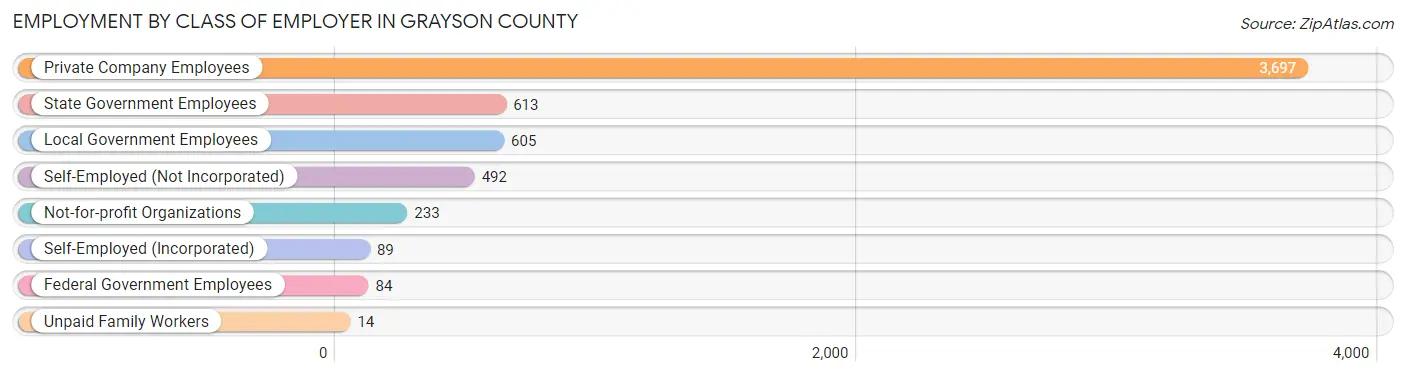
| Employer Class | # Employees | % Employees |
| Private Company Employees | 3,697 | 63.4% |
| Self-Employed (Incorporated) | 89 | 1.5% |
| Self-Employed (Not Incorporated) | 492 | 8.4% |
| Not-for-profit Organizations | 233 | 4.0% |
| Local Government Employees | 605 | 10.4% |
| State Government Employees | 613 | 10.5% |
| Federal Government Employees | 84 | 1.4% |
| Unpaid Family Workers | 14 | 0.2% |
| Total | 5,827 | 100.0% |
Employment Status by Age in Grayson County
According to the labor force statistics for Grayson County, out of the total population over 16 years of age (13,010), 47.9% or 6,232 individuals are in the labor force, with 4.3% or 268 of them unemployed. The age group with the highest labor force participation rate is 25 to 29 years, with 72.0% or 706 individuals in the labor force. Within the labor force, the 16 to 19 years age range has the highest percentage of unemployed individuals, with 25.6% or 50 of them being unemployed.
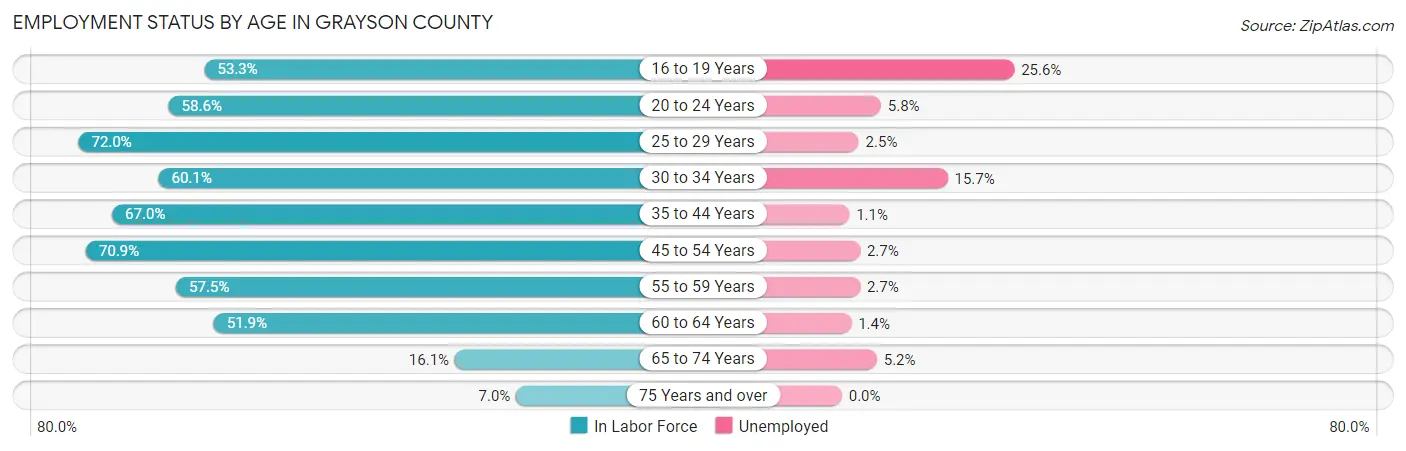
| Age Bracket | In Labor Force | Unemployed |
| 16 to 19 Years | 195 (53.3%) | 50 (25.6%) |
| 20 to 24 Years | 513 (58.6%) | 30 (5.8%) |
| 25 to 29 Years | 706 (72.0%) | 18 (2.5%) |
| 30 to 34 Years | 433 (60.1%) | 68 (15.7%) |
| 35 to 44 Years | 1,031 (67.0%) | 11 (1.1%) |
| 45 to 54 Years | 1,530 (70.9%) | 41 (2.7%) |
| 55 to 59 Years | 628 (57.5%) | 17 (2.7%) |
| 60 to 64 Years | 711 (51.9%) | 10 (1.4%) |
| 65 to 74 Years | 366 (16.1%) | 19 (5.2%) |
| 75 Years and over | 114 (7.0%) | 0 (0.0%) |
| Total | 6,232 (47.9%) | 268 (4.3%) |
Employment Status by Educational Attainment in Grayson County
According to labor force statistics for Grayson County, 64.1% of individuals (5,039) out of the total population between 25 and 64 years of age (7,861) are in the labor force, with 3.3% or 166 of them being unemployed. The group with the highest labor force participation rate are those with the educational attainment of college / associate degree, with 75.5% or 1,777 individuals in the labor force. Within the labor force, individuals with less than high school education have the highest percentage of unemployment, with 7.3% or 37 of them being unemployed.
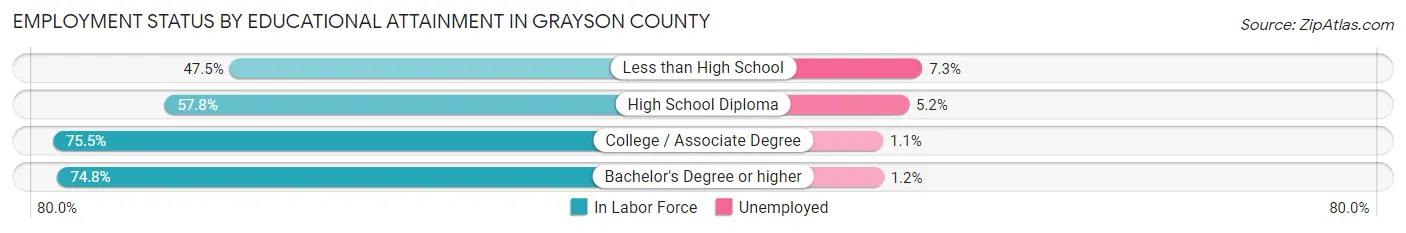
| Educational Attainment | In Labor Force | Unemployed |
| Less than High School | 510 (47.5%) | 78 (7.3%) |
| High School Diploma | 1,920 (57.8%) | 173 (5.2%) |
| College / Associate Degree | 1,777 (75.5%) | 26 (1.1%) |
| Bachelor's Degree or higher | 833 (74.8%) | 13 (1.2%) |
| Total | 5,039 (64.1%) | 259 (3.3%) |
Employment Occupations by Sex in Grayson County
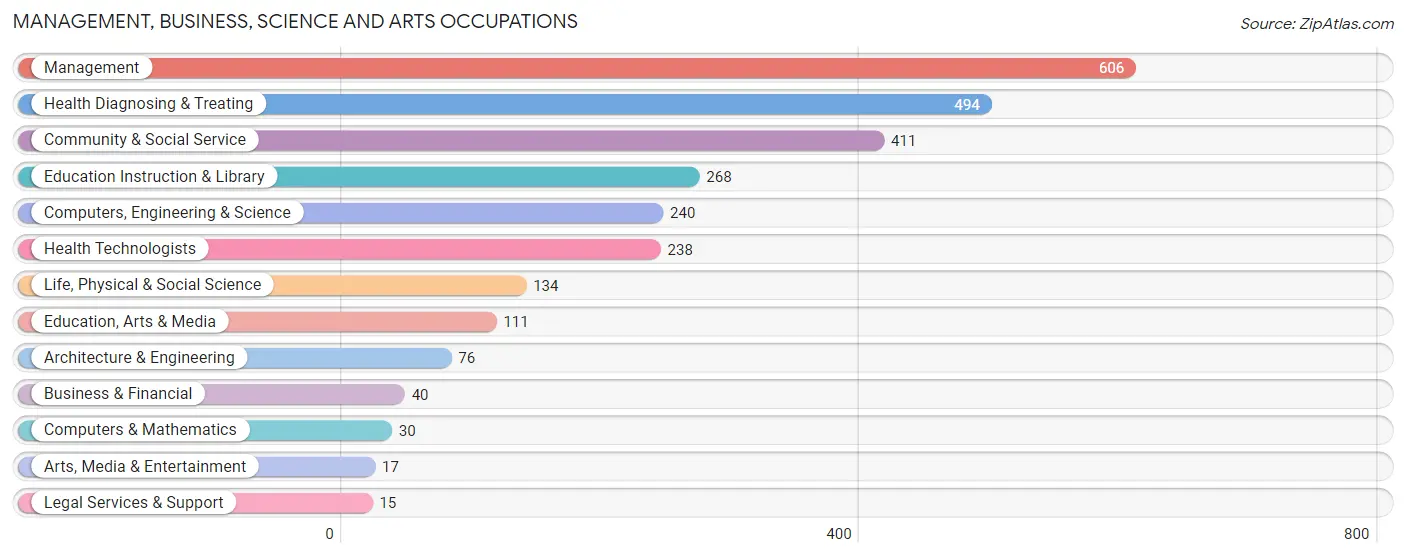
Management, Business, Science and Arts Occupations
The most common Management, Business, Science and Arts occupations in Grayson County are Management (606 | 10.2%), Health Diagnosing & Treating (494 | 8.3%), Community & Social Service (411 | 6.9%), Education Instruction & Library (268 | 4.5%), and Computers, Engineering & Science (240 | 4.0%).
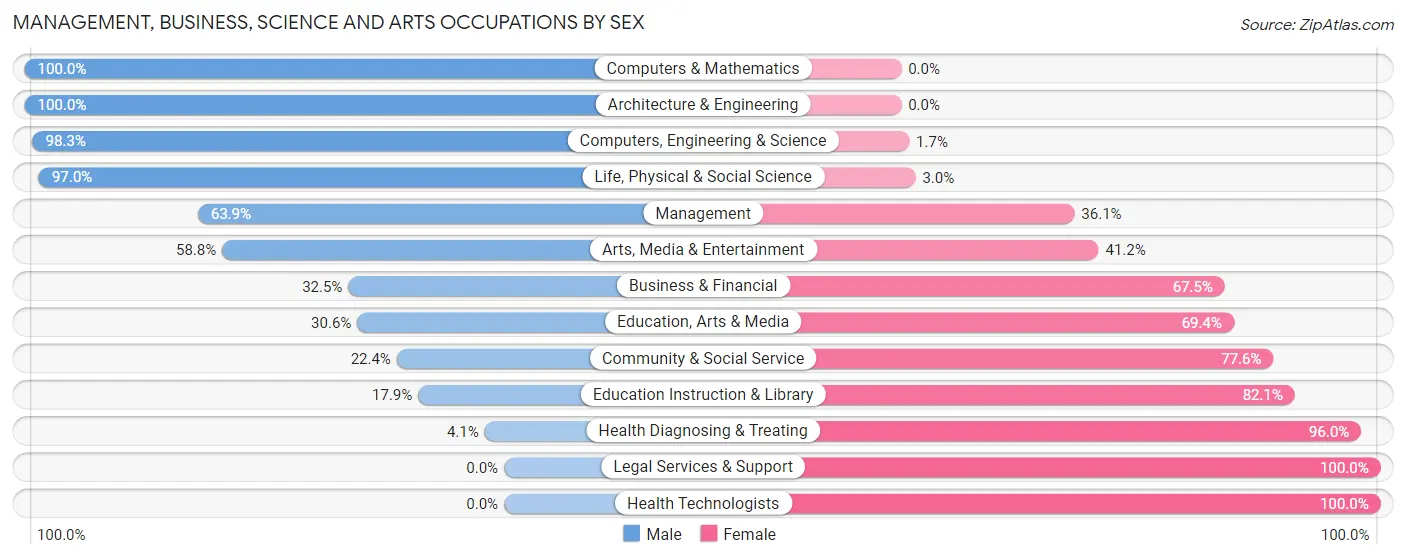
Management, Business, Science and Arts Occupations by Sex
Within the Management, Business, Science and Arts occupations in Grayson County, the most male-oriented occupations are Computers & Mathematics (100.0%), Architecture & Engineering (100.0%), and Computers, Engineering & Science (98.3%), while the most female-oriented occupations are Legal Services & Support (100.0%), Health Technologists (100.0%), and Health Diagnosing & Treating (96.0%).
| Occupation | Male | Female |
| Management | 387 (63.9%) | 219 (36.1%) |
| Business & Financial | 13 (32.5%) | 27 (67.5%) |
| Computers, Engineering & Science | 236 (98.3%) | 4 (1.7%) |
| Computers & Mathematics | 30 (100.0%) | 0 (0.0%) |
| Architecture & Engineering | 76 (100.0%) | 0 (0.0%) |
| Life, Physical & Social Science | 130 (97.0%) | 4 (3.0%) |
| Community & Social Service | 92 (22.4%) | 319 (77.6%) |
| Education, Arts & Media | 34 (30.6%) | 77 (69.4%) |
| Legal Services & Support | 0 (0.0%) | 15 (100.0%) |
| Education Instruction & Library | 48 (17.9%) | 220 (82.1%) |
| Arts, Media & Entertainment | 10 (58.8%) | 7 (41.2%) |
| Health Diagnosing & Treating | 20 (4.1%) | 474 (96.0%) |
| Health Technologists | 0 (0.0%) | 238 (100.0%) |
| Total (Category) | 748 (41.8%) | 1,043 (58.2%) |
| Total (Overall) | 3,102 (52.0%) | 2,861 (48.0%) |
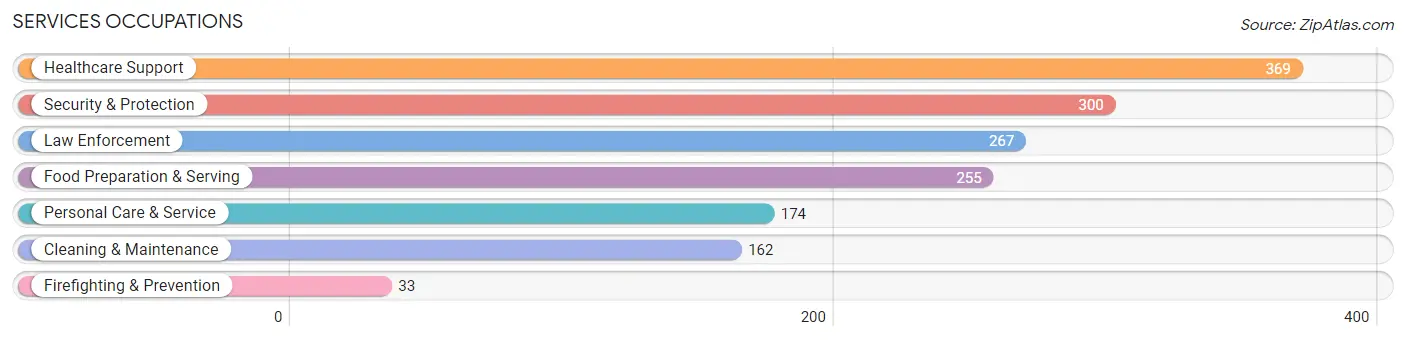
Services Occupations
The most common Services occupations in Grayson County are Healthcare Support (369 | 6.2%), Security & Protection (300 | 5.0%), Law Enforcement (267 | 4.5%), Food Preparation & Serving (255 | 4.3%), and Personal Care & Service (174 | 2.9%).
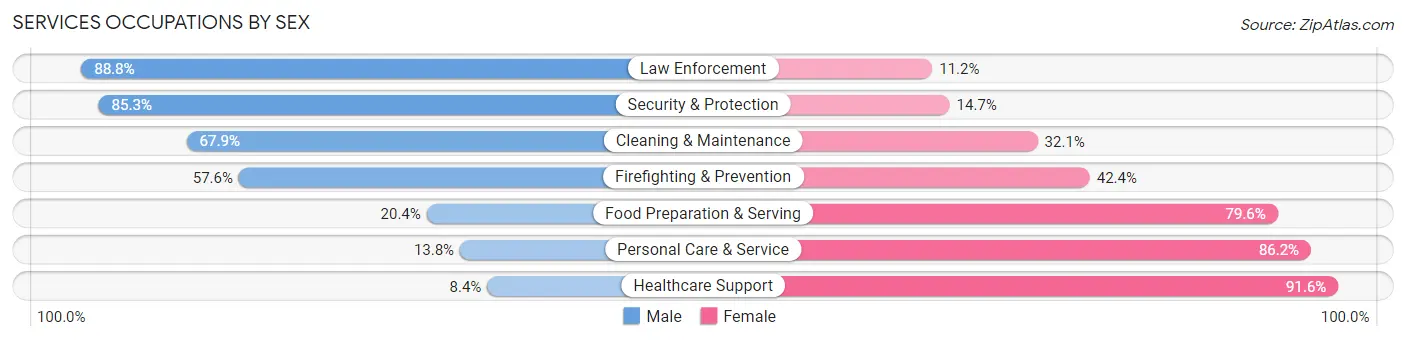
Services Occupations by Sex
Within the Services occupations in Grayson County, the most male-oriented occupations are Law Enforcement (88.8%), Security & Protection (85.3%), and Cleaning & Maintenance (67.9%), while the most female-oriented occupations are Healthcare Support (91.6%), Personal Care & Service (86.2%), and Food Preparation & Serving (79.6%).
| Occupation | Male | Female |
| Healthcare Support | 31 (8.4%) | 338 (91.6%) |
| Security & Protection | 256 (85.3%) | 44 (14.7%) |
| Firefighting & Prevention | 19 (57.6%) | 14 (42.4%) |
| Law Enforcement | 237 (88.8%) | 30 (11.2%) |
| Food Preparation & Serving | 52 (20.4%) | 203 (79.6%) |
| Cleaning & Maintenance | 110 (67.9%) | 52 (32.1%) |
| Personal Care & Service | 24 (13.8%) | 150 (86.2%) |
| Total (Category) | 473 (37.5%) | 787 (62.5%) |
| Total (Overall) | 3,102 (52.0%) | 2,861 (48.0%) |
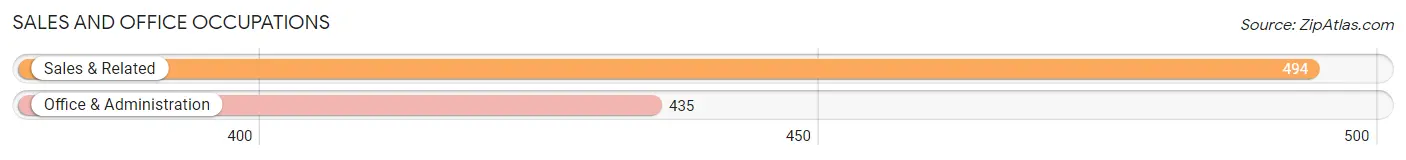
Sales and Office Occupations
The most common Sales and Office occupations in Grayson County are Sales & Related (494 | 8.3%), and Office & Administration (435 | 7.3%).
Sales and Office Occupations by Sex
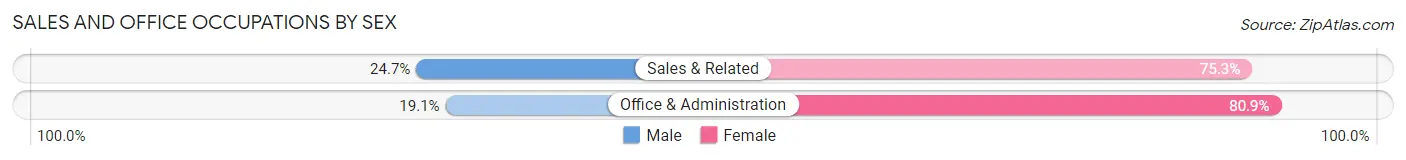
| Occupation | Male | Female |
| Sales & Related | 122 (24.7%) | 372 (75.3%) |
| Office & Administration | 83 (19.1%) | 352 (80.9%) |
| Total (Category) | 205 (22.1%) | 724 (77.9%) |
| Total (Overall) | 3,102 (52.0%) | 2,861 (48.0%) |
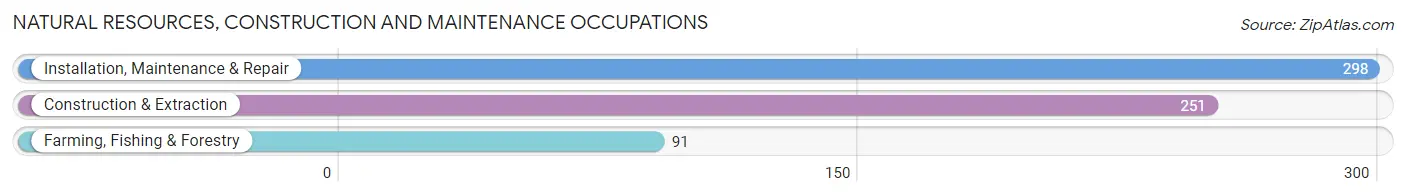
Natural Resources, Construction and Maintenance Occupations
The most common Natural Resources, Construction and Maintenance occupations in Grayson County are Installation, Maintenance & Repair (298 | 5.0%), Construction & Extraction (251 | 4.2%), and Farming, Fishing & Forestry (91 | 1.5%).
Natural Resources, Construction and Maintenance Occupations by Sex
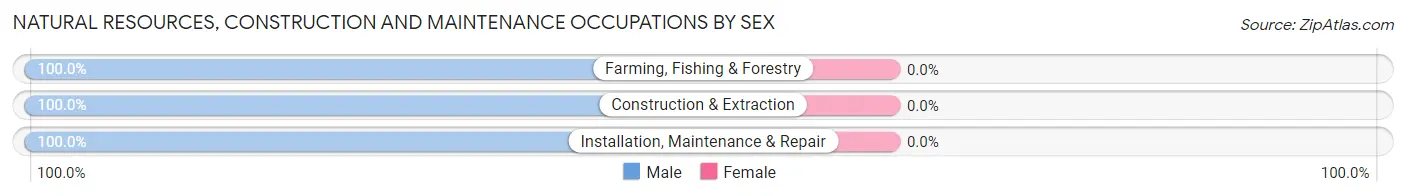
| Occupation | Male | Female |
| Farming, Fishing & Forestry | 91 (100.0%) | 0 (0.0%) |
| Construction & Extraction | 251 (100.0%) | 0 (0.0%) |
| Installation, Maintenance & Repair | 298 (100.0%) | 0 (0.0%) |
| Total (Category) | 640 (100.0%) | 0 (0.0%) |
| Total (Overall) | 3,102 (52.0%) | 2,861 (48.0%) |
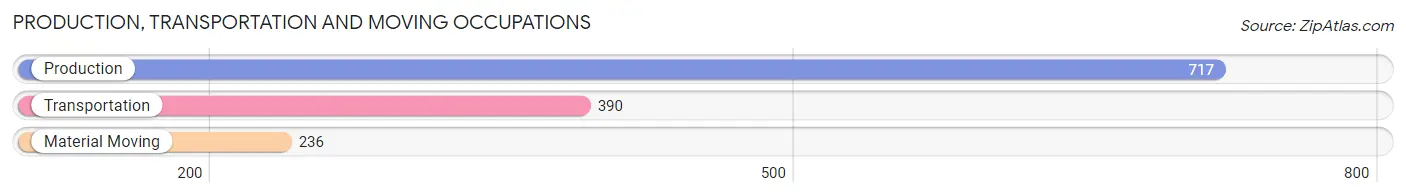
Production, Transportation and Moving Occupations
The most common Production, Transportation and Moving occupations in Grayson County are Production (717 | 12.0%), Transportation (390 | 6.5%), and Material Moving (236 | 4.0%).
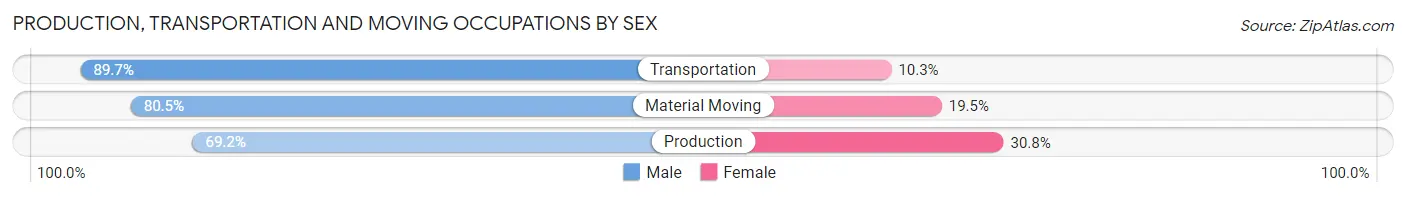
Production, Transportation and Moving Occupations by Sex
| Occupation | Male | Female |
| Production | 496 (69.2%) | 221 (30.8%) |
| Transportation | 350 (89.7%) | 40 (10.3%) |
| Material Moving | 190 (80.5%) | 46 (19.5%) |
| Total (Category) | 1,036 (77.1%) | 307 (22.9%) |
| Total (Overall) | 3,102 (52.0%) | 2,861 (48.0%) |
Employment Industries by Sex in Grayson County
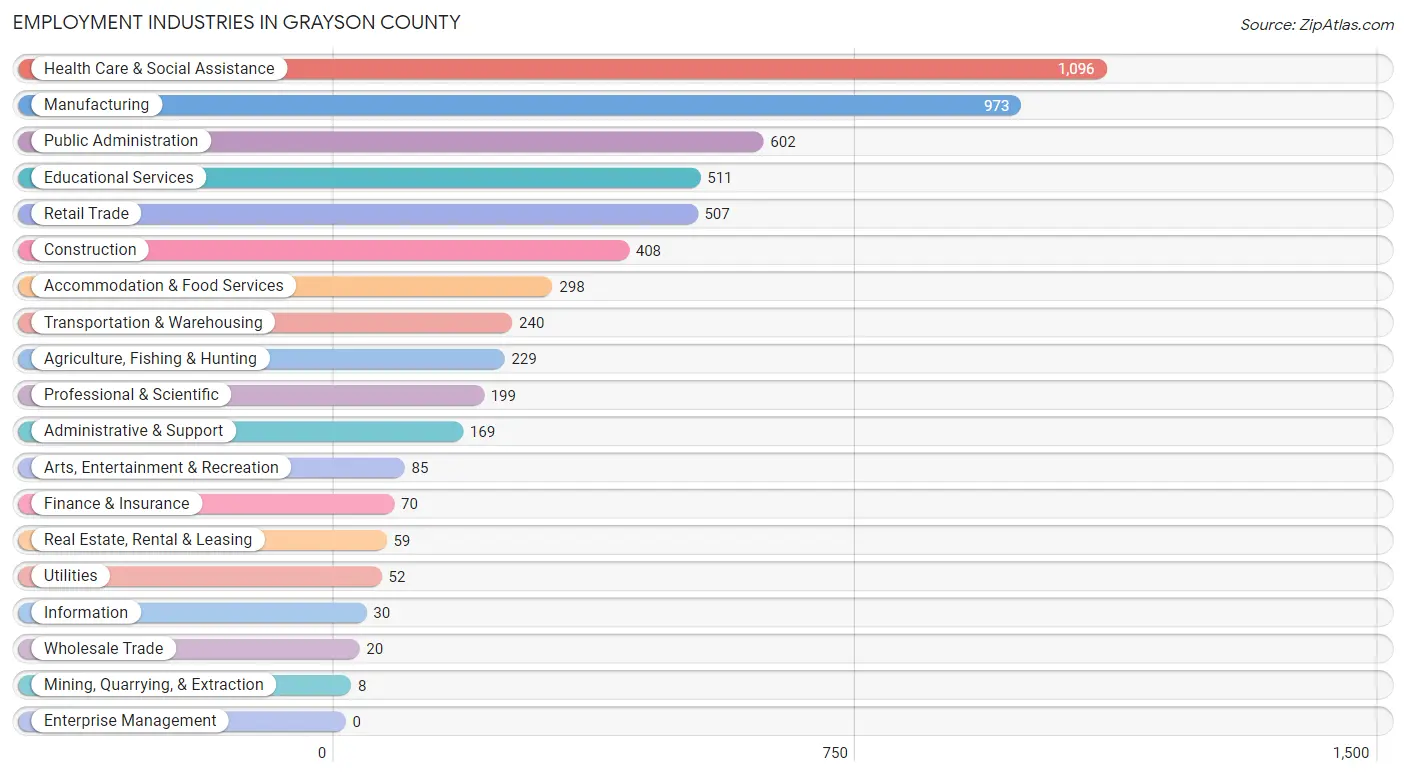
Employment Industries in Grayson County
The major employment industries in Grayson County include Health Care & Social Assistance (1,096 | 18.4%), Manufacturing (973 | 16.3%), Public Administration (602 | 10.1%), Educational Services (511 | 8.6%), and Retail Trade (507 | 8.5%).
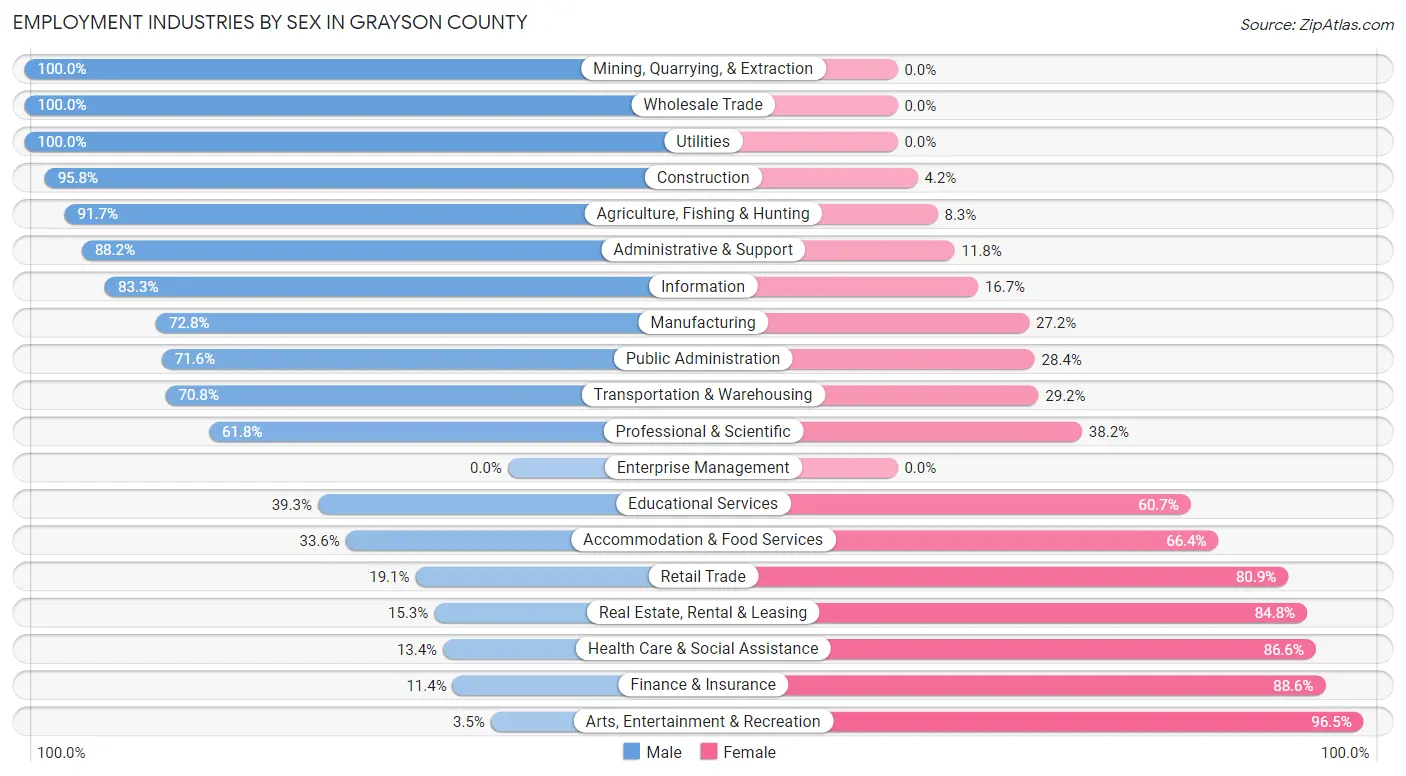
Employment Industries by Sex in Grayson County
The Grayson County industries that see more men than women are Mining, Quarrying, & Extraction (100.0%), Wholesale Trade (100.0%), and Utilities (100.0%), whereas the industries that tend to have a higher number of women are Arts, Entertainment & Recreation (96.5%), Finance & Insurance (88.6%), and Health Care & Social Assistance (86.6%).
| Industry | Male | Female |
| Agriculture, Fishing & Hunting | 210 (91.7%) | 19 (8.3%) |
| Mining, Quarrying, & Extraction | 8 (100.0%) | 0 (0.0%) |
| Construction | 391 (95.8%) | 17 (4.2%) |
| Manufacturing | 708 (72.8%) | 265 (27.2%) |
| Wholesale Trade | 20 (100.0%) | 0 (0.0%) |
| Retail Trade | 97 (19.1%) | 410 (80.9%) |
| Transportation & Warehousing | 170 (70.8%) | 70 (29.2%) |
| Utilities | 52 (100.0%) | 0 (0.0%) |
| Information | 25 (83.3%) | 5 (16.7%) |
| Finance & Insurance | 8 (11.4%) | 62 (88.6%) |
| Real Estate, Rental & Leasing | 9 (15.2%) | 50 (84.8%) |
| Professional & Scientific | 123 (61.8%) | 76 (38.2%) |
| Enterprise Management | 0 (0.0%) | 0 (0.0%) |
| Administrative & Support | 149 (88.2%) | 20 (11.8%) |
| Educational Services | 201 (39.3%) | 310 (60.7%) |
| Health Care & Social Assistance | 147 (13.4%) | 949 (86.6%) |
| Arts, Entertainment & Recreation | 3 (3.5%) | 82 (96.5%) |
| Accommodation & Food Services | 100 (33.6%) | 198 (66.4%) |
| Public Administration | 431 (71.6%) | 171 (28.4%) |
| Total | 3,102 (52.0%) | 2,861 (48.0%) |
Education in Grayson County
School Enrollment in Grayson County
The most common levels of schooling among the 2,342 students in Grayson County are middle school (551 | 23.5%), high school (514 | 22.0%), and elementary school (489 | 20.9%).
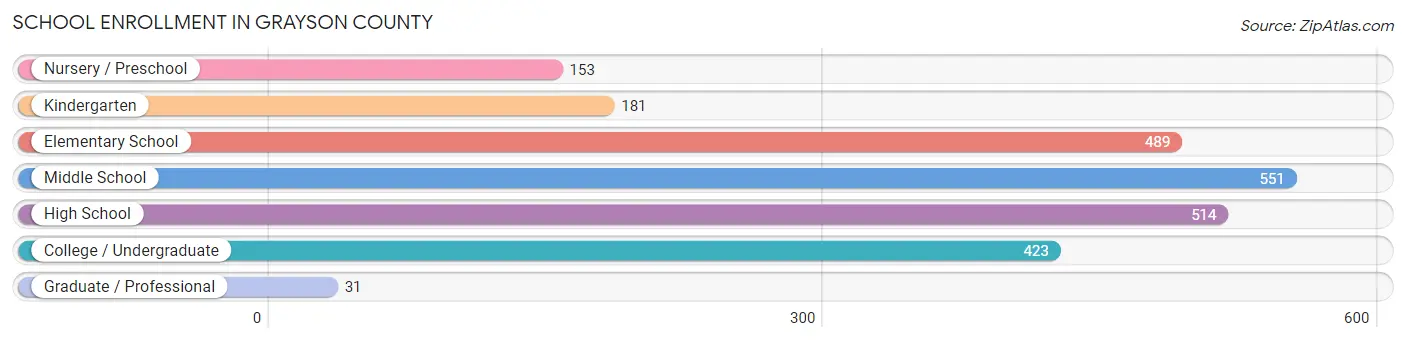
| School Level | # Students | % Students |
| Nursery / Preschool | 153 | 6.5% |
| Kindergarten | 181 | 7.7% |
| Elementary School | 489 | 20.9% |
| Middle School | 551 | 23.5% |
| High School | 514 | 22.0% |
| College / Undergraduate | 423 | 18.1% |
| Graduate / Professional | 31 | 1.3% |
| Total | 2,342 | 100.0% |
School Enrollment by Age by Funding Source in Grayson County
Out of a total of 2,342 students who are enrolled in schools in Grayson County, 265 (11.3%) attend a private institution, while the remaining 2,077 (88.7%) are enrolled in public schools. The age group of 35 years and over has the highest likelihood of being enrolled in private schools, with 79 (45.7% in the age bracket) enrolled. Conversely, the age group of 18 to 19 year olds has the lowest likelihood of being enrolled in a private school, with 110 (94.8% in the age bracket) attending a public institution.
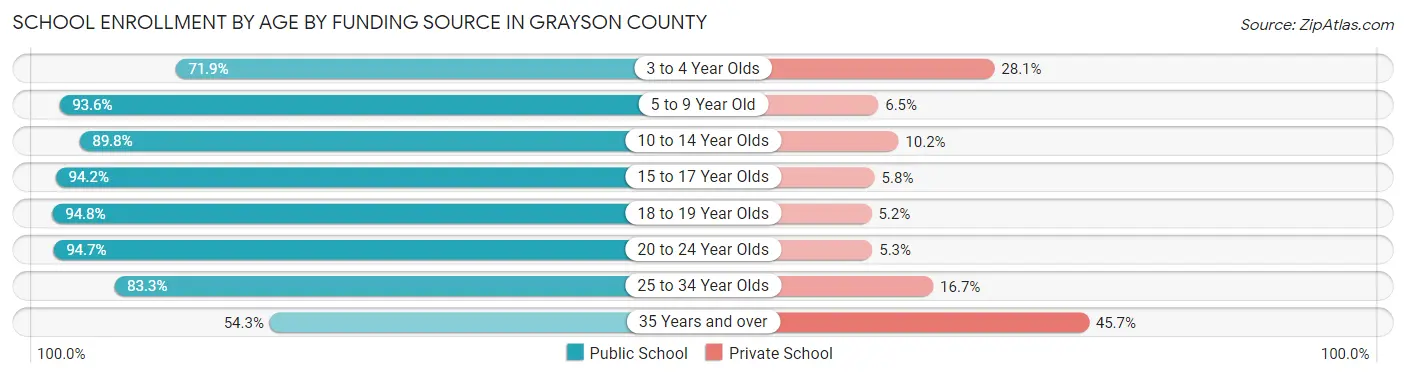
| Age Bracket | Public School | Private School |
| 3 to 4 Year Olds | 82 (71.9%) | 32 (28.1%) |
| 5 to 9 Year Old | 580 (93.5%) | 40 (6.5%) |
| 10 to 14 Year Olds | 582 (89.8%) | 66 (10.2%) |
| 15 to 17 Year Olds | 392 (94.2%) | 24 (5.8%) |
| 18 to 19 Year Olds | 110 (94.8%) | 6 (5.2%) |
| 20 to 24 Year Olds | 213 (94.7%) | 12 (5.3%) |
| 25 to 34 Year Olds | 25 (83.3%) | 5 (16.7%) |
| 35 Years and over | 94 (54.3%) | 79 (45.7%) |
| Total | 2,077 (88.7%) | 265 (11.3%) |
Educational Attainment by Field of Study in Grayson County
Education (327 | 18.9%), bio, nature & agricultural (215 | 12.4%), business (211 | 12.2%), science & technology (173 | 10.0%), and physical & health sciences (167 | 9.7%) are the most common fields of study among 1,730 individuals in Grayson County who have obtained a bachelor's degree or higher.
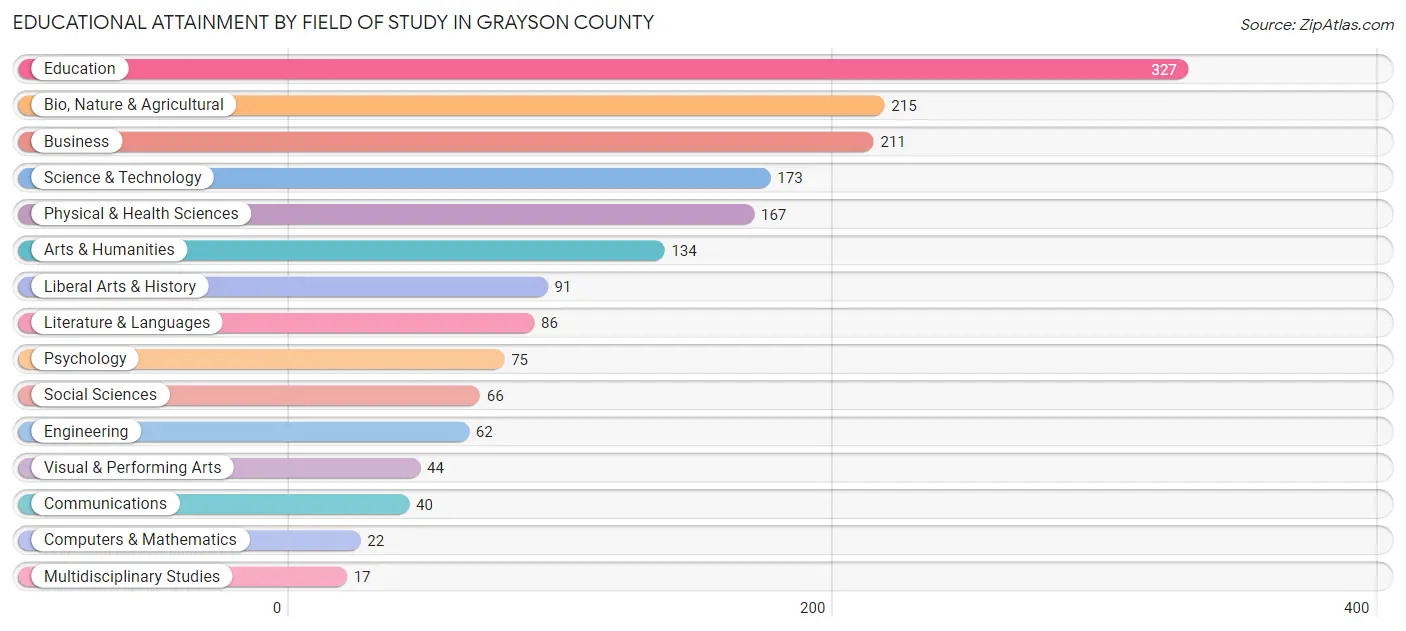
| Field of Study | # Graduates | % Graduates |
| Computers & Mathematics | 22 | 1.3% |
| Bio, Nature & Agricultural | 215 | 12.4% |
| Physical & Health Sciences | 167 | 9.7% |
| Psychology | 75 | 4.3% |
| Social Sciences | 66 | 3.8% |
| Engineering | 62 | 3.6% |
| Multidisciplinary Studies | 17 | 1.0% |
| Science & Technology | 173 | 10.0% |
| Business | 211 | 12.2% |
| Education | 327 | 18.9% |
| Literature & Languages | 86 | 5.0% |
| Liberal Arts & History | 91 | 5.3% |
| Visual & Performing Arts | 44 | 2.5% |
| Communications | 40 | 2.3% |
| Arts & Humanities | 134 | 7.7% |
| Total | 1,730 | 100.0% |
Transportation & Commute in Grayson County
Vehicle Availability by Sex in Grayson County
The most prevalent vehicle ownership categories in Grayson County are males with 2 vehicles (1,160, accounting for 38.9%) and females with 2 vehicles (1,224, making up 41.4%).
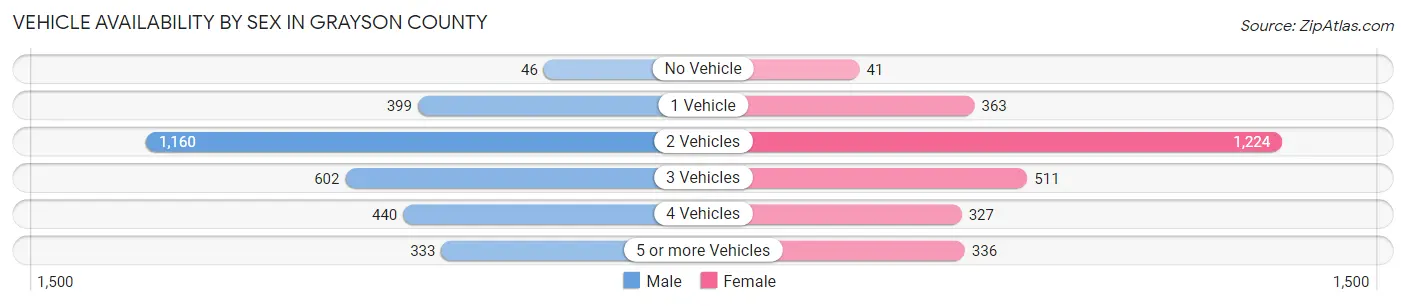
| Vehicles Available | Male | Female |
| No Vehicle | 46 (1.5%) | 41 (1.5%) |
| 1 Vehicle | 399 (13.4%) | 363 (13.0%) |
| 2 Vehicles | 1,160 (38.9%) | 1,224 (43.7%) |
| 3 Vehicles | 602 (20.2%) | 511 (18.2%) |
| 4 Vehicles | 440 (14.8%) | 327 (11.7%) |
| 5 or more Vehicles | 333 (11.2%) | 336 (12.0%) |
| Total | 2,980 (100.0%) | 2,802 (100.0%) |
Commute Time in Grayson County
The most frequently occuring commute durations in Grayson County are 30 to 34 minutes (972 commuters, 17.5%), 20 to 24 minutes (849 commuters, 15.3%), and 10 to 14 minutes (839 commuters, 15.1%).
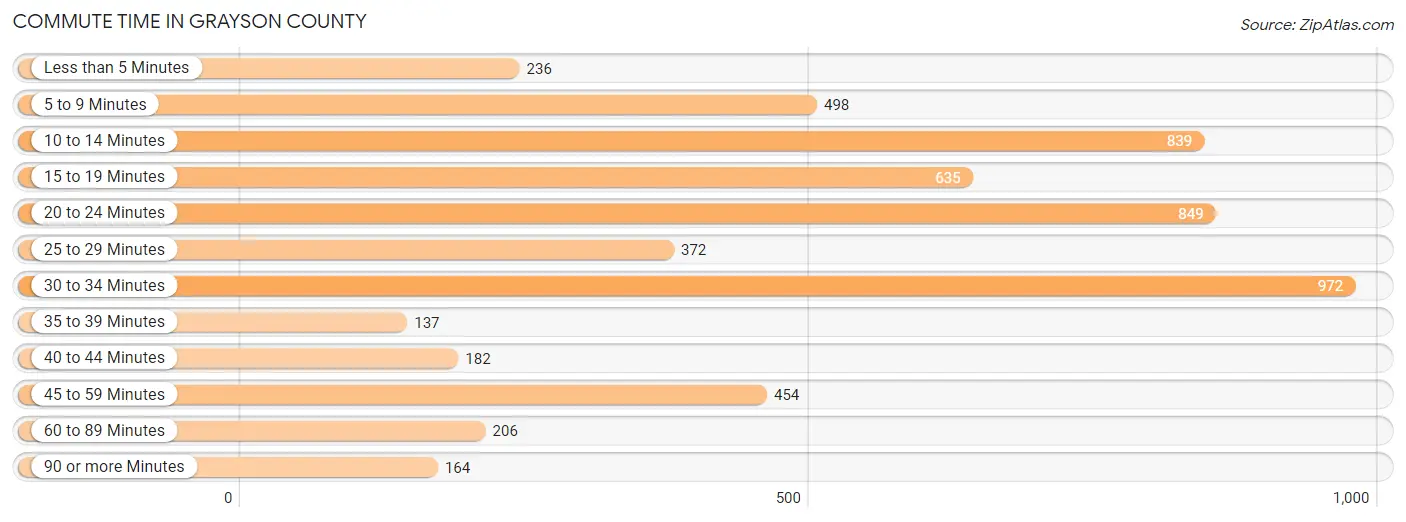
| Commute Time | # Commuters | % Commuters |
| Less than 5 Minutes | 236 | 4.3% |
| 5 to 9 Minutes | 498 | 9.0% |
| 10 to 14 Minutes | 839 | 15.1% |
| 15 to 19 Minutes | 635 | 11.5% |
| 20 to 24 Minutes | 849 | 15.3% |
| 25 to 29 Minutes | 372 | 6.7% |
| 30 to 34 Minutes | 972 | 17.5% |
| 35 to 39 Minutes | 137 | 2.5% |
| 40 to 44 Minutes | 182 | 3.3% |
| 45 to 59 Minutes | 454 | 8.2% |
| 60 to 89 Minutes | 206 | 3.7% |
| 90 or more Minutes | 164 | 3.0% |
Commute Time by Sex in Grayson County
The most common commute times in Grayson County are 10 to 14 minutes (492 commuters, 17.2%) for males and 30 to 34 minutes (530 commuters, 19.8%) for females.
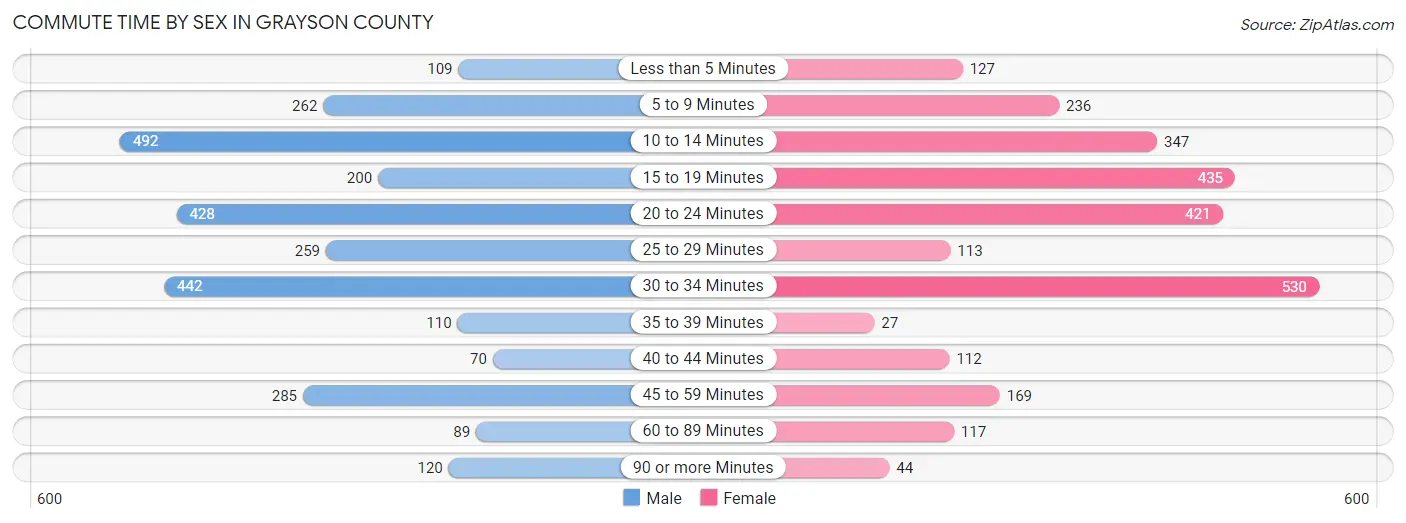
| Commute Time | Male | Female |
| Less than 5 Minutes | 109 (3.8%) | 127 (4.7%) |
| 5 to 9 Minutes | 262 (9.1%) | 236 (8.8%) |
| 10 to 14 Minutes | 492 (17.2%) | 347 (13.0%) |
| 15 to 19 Minutes | 200 (7.0%) | 435 (16.2%) |
| 20 to 24 Minutes | 428 (14.9%) | 421 (15.7%) |
| 25 to 29 Minutes | 259 (9.0%) | 113 (4.2%) |
| 30 to 34 Minutes | 442 (15.4%) | 530 (19.8%) |
| 35 to 39 Minutes | 110 (3.8%) | 27 (1.0%) |
| 40 to 44 Minutes | 70 (2.4%) | 112 (4.2%) |
| 45 to 59 Minutes | 285 (9.9%) | 169 (6.3%) |
| 60 to 89 Minutes | 89 (3.1%) | 117 (4.4%) |
| 90 or more Minutes | 120 (4.2%) | 44 (1.6%) |
Time of Departure to Work by Sex in Grayson County
The most frequent times of departure to work in Grayson County are 6:30 AM to 6:59 AM (632, 22.1%) for males and 7:30 AM to 7:59 AM (444, 16.6%) for females.
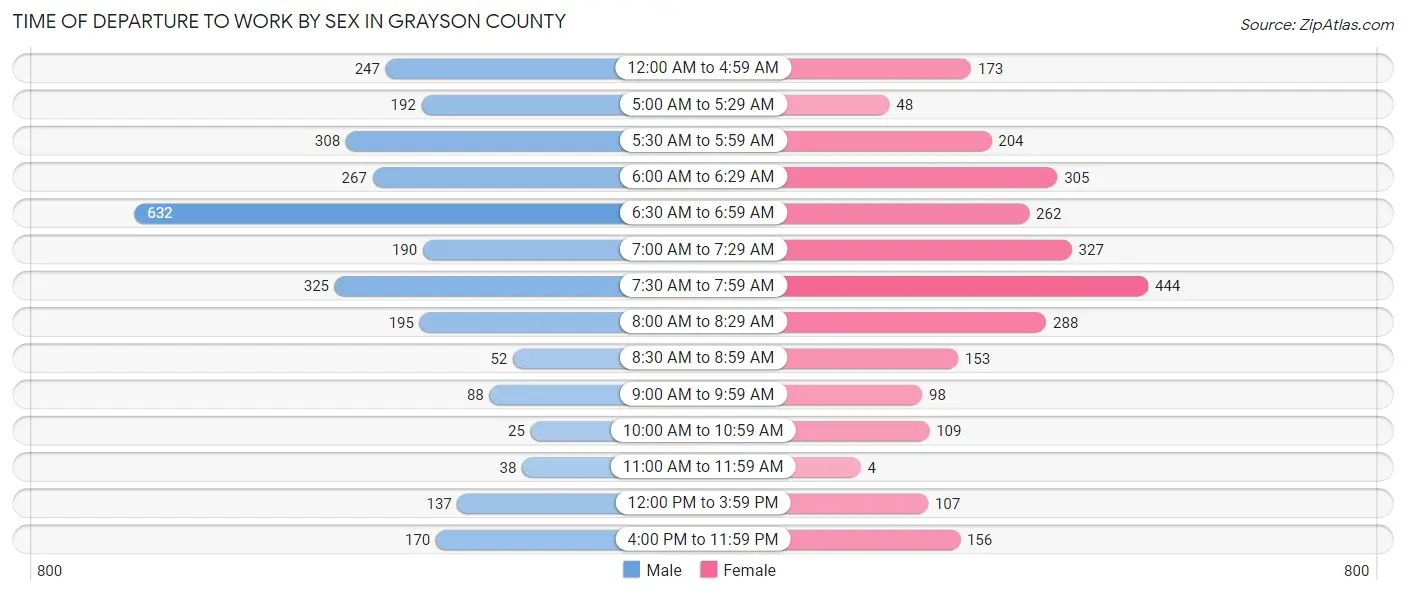
| Time of Departure | Male | Female |
| 12:00 AM to 4:59 AM | 247 (8.6%) | 173 (6.5%) |
| 5:00 AM to 5:29 AM | 192 (6.7%) | 48 (1.8%) |
| 5:30 AM to 5:59 AM | 308 (10.7%) | 204 (7.6%) |
| 6:00 AM to 6:29 AM | 267 (9.3%) | 305 (11.4%) |
| 6:30 AM to 6:59 AM | 632 (22.1%) | 262 (9.8%) |
| 7:00 AM to 7:29 AM | 190 (6.6%) | 327 (12.2%) |
| 7:30 AM to 7:59 AM | 325 (11.3%) | 444 (16.6%) |
| 8:00 AM to 8:29 AM | 195 (6.8%) | 288 (10.7%) |
| 8:30 AM to 8:59 AM | 52 (1.8%) | 153 (5.7%) |
| 9:00 AM to 9:59 AM | 88 (3.1%) | 98 (3.7%) |
| 10:00 AM to 10:59 AM | 25 (0.9%) | 109 (4.1%) |
| 11:00 AM to 11:59 AM | 38 (1.3%) | 4 (0.2%) |
| 12:00 PM to 3:59 PM | 137 (4.8%) | 107 (4.0%) |
| 4:00 PM to 11:59 PM | 170 (5.9%) | 156 (5.8%) |
| Total | 2,866 (100.0%) | 2,678 (100.0%) |
Housing Occupancy in Grayson County
Occupancy by Ownership in Grayson County
Of the total 6,148 dwellings in Grayson County, owner-occupied units account for 4,969 (80.8%), while renter-occupied units make up 1,179 (19.2%).
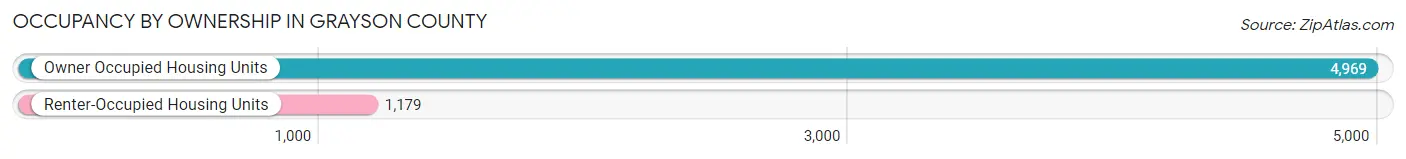
| Occupancy | # Housing Units | % Housing Units |
| Owner Occupied Housing Units | 4,969 | 80.8% |
| Renter-Occupied Housing Units | 1,179 | 19.2% |
| Total Occupied Housing Units | 6,148 | 100.0% |
Occupancy by Household Size in Grayson County
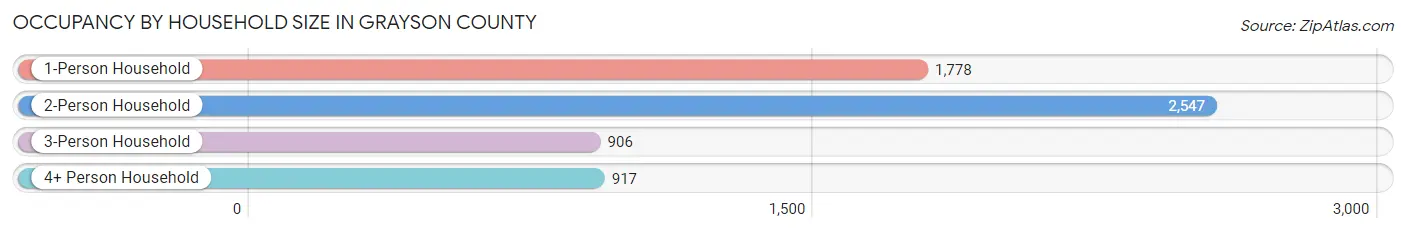
| Household Size | # Housing Units | % Housing Units |
| 1-Person Household | 1,778 | 28.9% |
| 2-Person Household | 2,547 | 41.4% |
| 3-Person Household | 906 | 14.7% |
| 4+ Person Household | 917 | 14.9% |
| Total Housing Units | 6,148 | 100.0% |
Occupancy by Ownership by Household Size in Grayson County
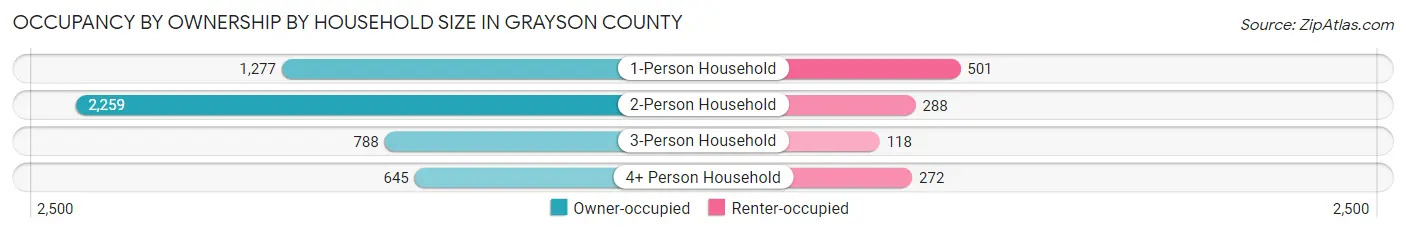
| Household Size | Owner-occupied | Renter-occupied |
| 1-Person Household | 1,277 (71.8%) | 501 (28.2%) |
| 2-Person Household | 2,259 (88.7%) | 288 (11.3%) |
| 3-Person Household | 788 (87.0%) | 118 (13.0%) |
| 4+ Person Household | 645 (70.3%) | 272 (29.7%) |
| Total Housing Units | 4,969 (80.8%) | 1,179 (19.2%) |
Occupancy by Educational Attainment in Grayson County
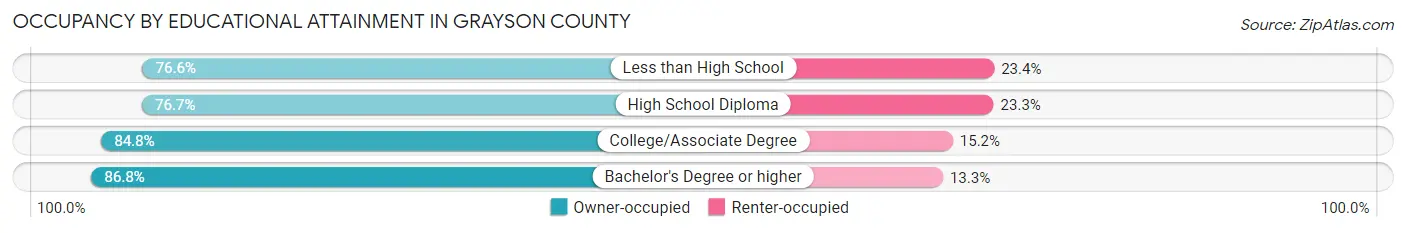
| Household Size | Owner-occupied | Renter-occupied |
| Less than High School | 700 (76.6%) | 214 (23.4%) |
| High School Diploma | 1,775 (76.7%) | 539 (23.3%) |
| College/Associate Degree | 1,689 (84.8%) | 303 (15.2%) |
| Bachelor's Degree or higher | 805 (86.8%) | 123 (13.3%) |
Occupancy by Age of Householder in Grayson County
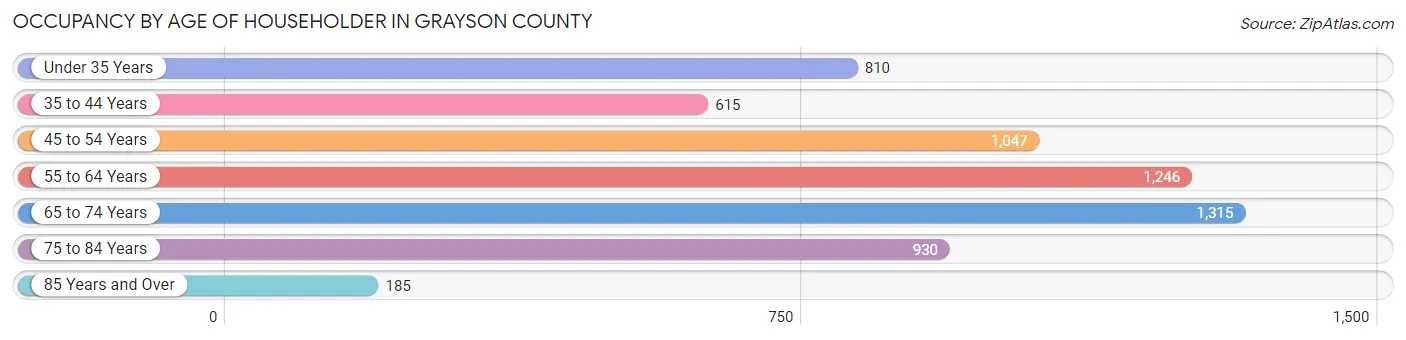
| Age Bracket | # Households | % Households |
| Under 35 Years | 810 | 13.2% |
| 35 to 44 Years | 615 | 10.0% |
| 45 to 54 Years | 1,047 | 17.0% |
| 55 to 64 Years | 1,246 | 20.3% |
| 65 to 74 Years | 1,315 | 21.4% |
| 75 to 84 Years | 930 | 15.1% |
| 85 Years and Over | 185 | 3.0% |
| Total | 6,148 | 100.0% |
Housing Finances in Grayson County
Median Income by Occupancy in Grayson County
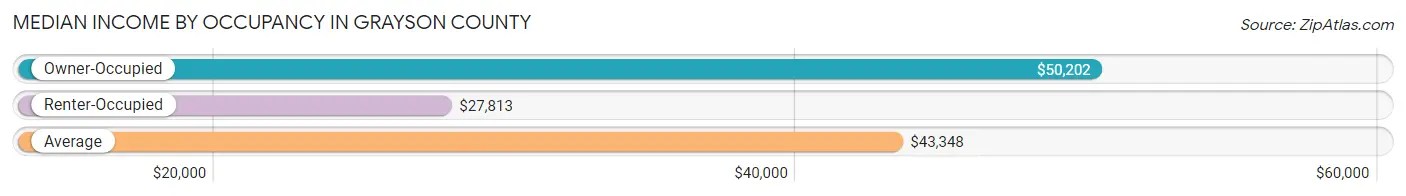
| Occupancy Type | # Households | Median Income |
| Owner-Occupied | 4,969 (80.8%) | $50,202 |
| Renter-Occupied | 1,179 (19.2%) | $27,813 |
| Average | 6,148 (100.0%) | $43,348 |
Occupancy by Householder Income Bracket in Grayson County
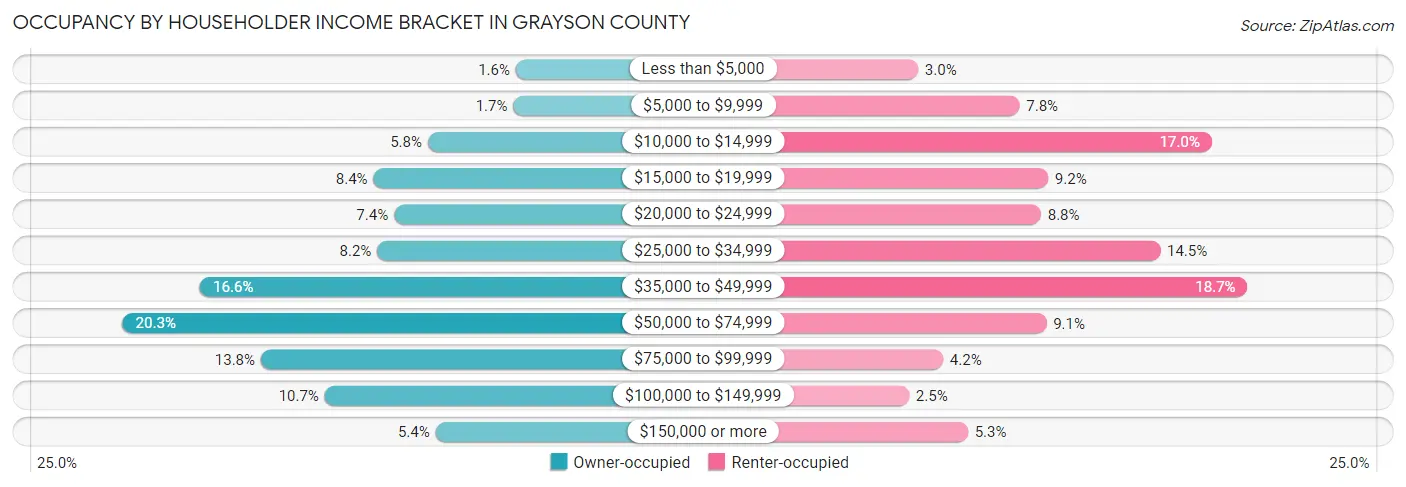
| Income Bracket | Owner-occupied | Renter-occupied |
| Less than $5,000 | 80 (1.6%) | 35 (3.0%) |
| $5,000 to $9,999 | 86 (1.7%) | 92 (7.8%) |
| $10,000 to $14,999 | 288 (5.8%) | 200 (17.0%) |
| $15,000 to $19,999 | 417 (8.4%) | 108 (9.2%) |
| $20,000 to $24,999 | 368 (7.4%) | 104 (8.8%) |
| $25,000 to $34,999 | 408 (8.2%) | 171 (14.5%) |
| $35,000 to $49,999 | 827 (16.6%) | 220 (18.7%) |
| $50,000 to $74,999 | 1,010 (20.3%) | 107 (9.1%) |
| $75,000 to $99,999 | 683 (13.8%) | 49 (4.2%) |
| $100,000 to $149,999 | 532 (10.7%) | 30 (2.5%) |
| $150,000 or more | 270 (5.4%) | 63 (5.3%) |
| Total | 4,969 (100.0%) | 1,179 (100.0%) |
Monthly Housing Cost Tiers in Grayson County
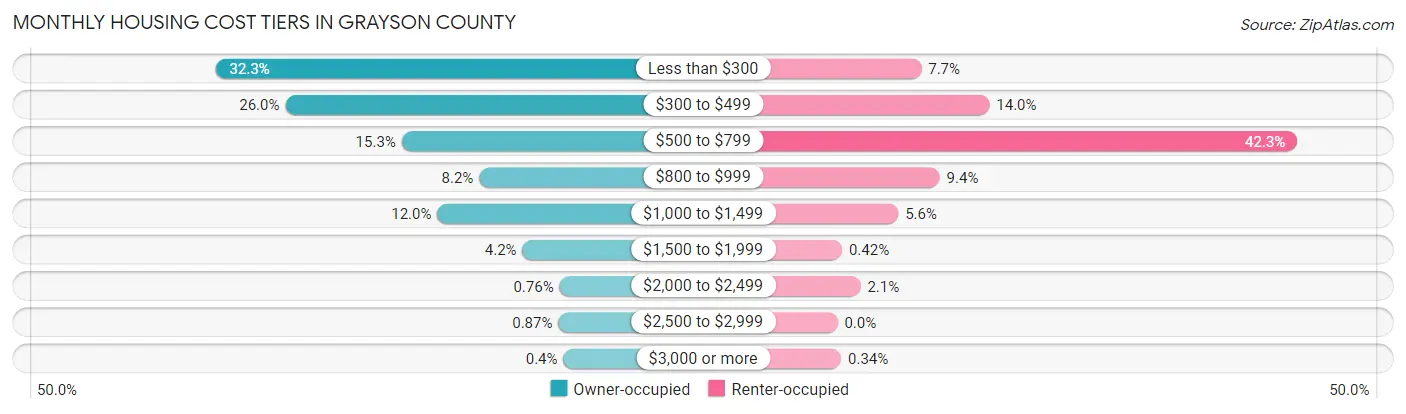
| Monthly Cost | Owner-occupied | Renter-occupied |
| Less than $300 | 1,607 (32.3%) | 91 (7.7%) |
| $300 to $499 | 1,292 (26.0%) | 165 (14.0%) |
| $500 to $799 | 760 (15.3%) | 499 (42.3%) |
| $800 to $999 | 405 (8.2%) | 111 (9.4%) |
| $1,000 to $1,499 | 597 (12.0%) | 66 (5.6%) |
| $1,500 to $1,999 | 207 (4.2%) | 5 (0.4%) |
| $2,000 to $2,499 | 38 (0.8%) | 25 (2.1%) |
| $2,500 to $2,999 | 43 (0.9%) | 0 (0.0%) |
| $3,000 or more | 20 (0.4%) | 4 (0.3%) |
| Total | 4,969 (100.0%) | 1,179 (100.0%) |
Physical Housing Characteristics in Grayson County
Housing Structures in Grayson County
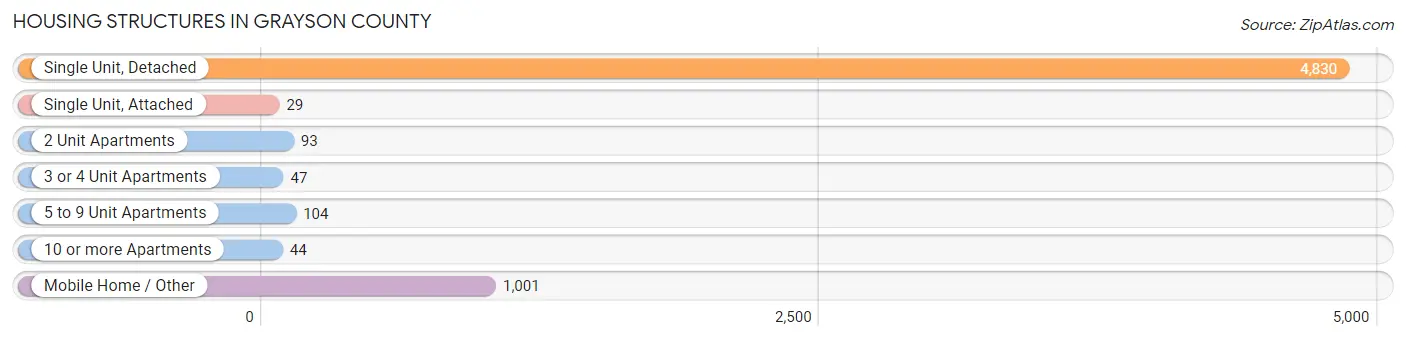
| Structure Type | # Housing Units | % Housing Units |
| Single Unit, Detached | 4,830 | 78.6% |
| Single Unit, Attached | 29 | 0.5% |
| 2 Unit Apartments | 93 | 1.5% |
| 3 or 4 Unit Apartments | 47 | 0.8% |
| 5 to 9 Unit Apartments | 104 | 1.7% |
| 10 or more Apartments | 44 | 0.7% |
| Mobile Home / Other | 1,001 | 16.3% |
| Total | 6,148 | 100.0% |
Housing Structures by Occupancy in Grayson County
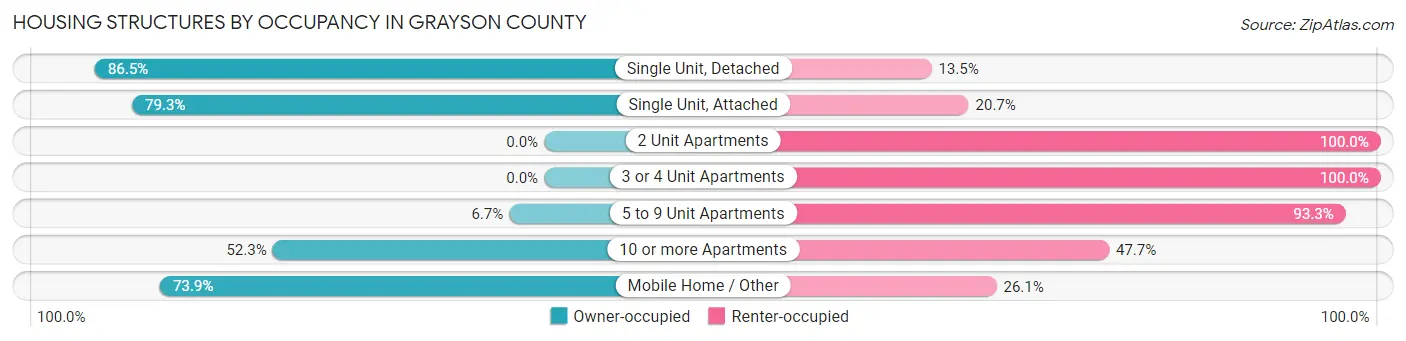
| Structure Type | Owner-occupied | Renter-occupied |
| Single Unit, Detached | 4,176 (86.5%) | 654 (13.5%) |
| Single Unit, Attached | 23 (79.3%) | 6 (20.7%) |
| 2 Unit Apartments | 0 (0.0%) | 93 (100.0%) |
| 3 or 4 Unit Apartments | 0 (0.0%) | 47 (100.0%) |
| 5 to 9 Unit Apartments | 7 (6.7%) | 97 (93.3%) |
| 10 or more Apartments | 23 (52.3%) | 21 (47.7%) |
| Mobile Home / Other | 740 (73.9%) | 261 (26.1%) |
| Total | 4,969 (80.8%) | 1,179 (19.2%) |
Housing Structures by Number of Rooms in Grayson County
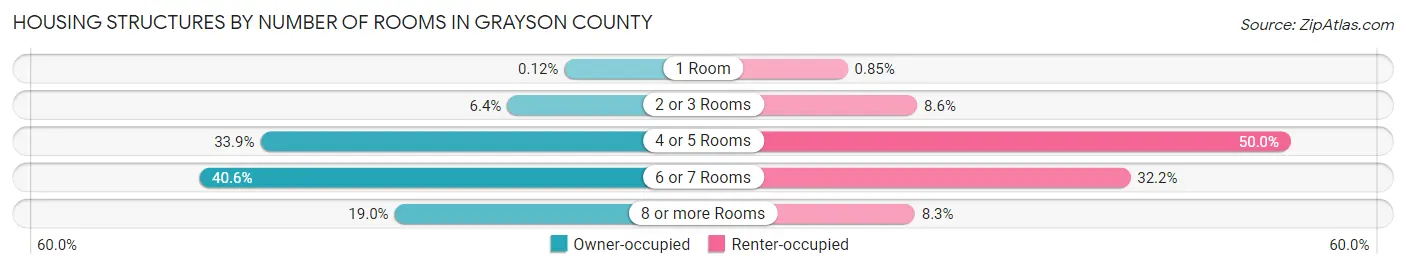
| Number of Rooms | Owner-occupied | Renter-occupied |
| 1 Room | 6 (0.1%) | 10 (0.9%) |
| 2 or 3 Rooms | 320 (6.4%) | 101 (8.6%) |
| 4 or 5 Rooms | 1,682 (33.9%) | 590 (50.0%) |
| 6 or 7 Rooms | 2,019 (40.6%) | 380 (32.2%) |
| 8 or more Rooms | 942 (19.0%) | 98 (8.3%) |
| Total | 4,969 (100.0%) | 1,179 (100.0%) |
Housing Structure by Heating Type in Grayson County
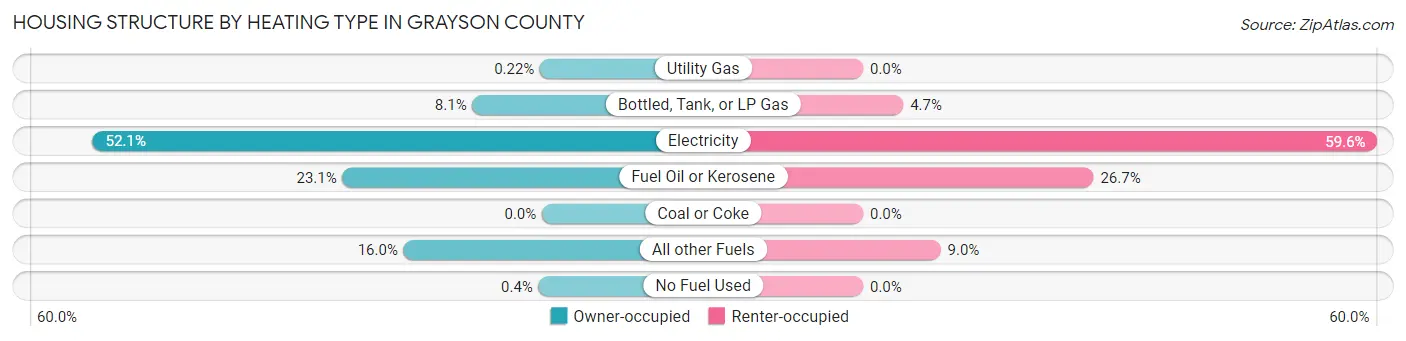
| Heating Type | Owner-occupied | Renter-occupied |
| Utility Gas | 11 (0.2%) | 0 (0.0%) |
| Bottled, Tank, or LP Gas | 401 (8.1%) | 55 (4.7%) |
| Electricity | 2,590 (52.1%) | 703 (59.6%) |
| Fuel Oil or Kerosene | 1,150 (23.1%) | 315 (26.7%) |
| Coal or Coke | 0 (0.0%) | 0 (0.0%) |
| All other Fuels | 797 (16.0%) | 106 (9.0%) |
| No Fuel Used | 20 (0.4%) | 0 (0.0%) |
| Total | 4,969 (100.0%) | 1,179 (100.0%) |
Household Vehicle Usage in Grayson County
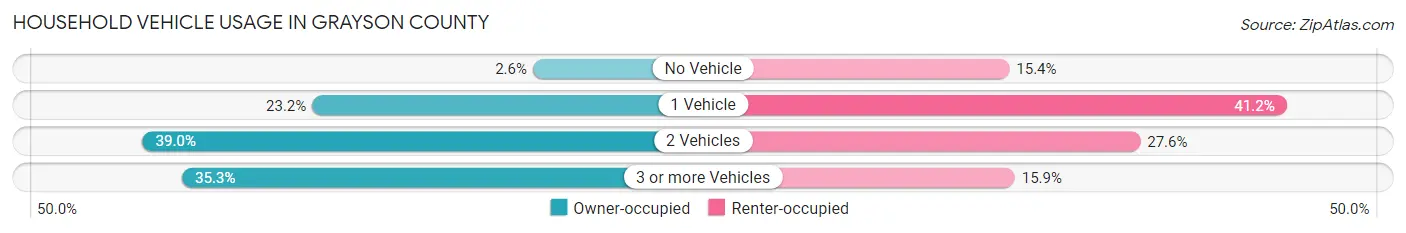
| Vehicles per Household | Owner-occupied | Renter-occupied |
| No Vehicle | 127 (2.6%) | 181 (15.3%) |
| 1 Vehicle | 1,151 (23.2%) | 486 (41.2%) |
| 2 Vehicles | 1,937 (39.0%) | 325 (27.6%) |
| 3 or more Vehicles | 1,754 (35.3%) | 187 (15.9%) |
| Total | 4,969 (100.0%) | 1,179 (100.0%) |
Real Estate & Mortgages in Grayson County
Real Estate and Mortgage Overview in Grayson County
| Characteristic | Without Mortgage | With Mortgage |
| Housing Units | 3,177 | 1,792 |
| Median Property Value | $114,500 | $147,500 |
| Median Household Income | $40,728 | $177 |
| Monthly Housing Costs | $303 | $20 |
| Real Estate Taxes | $701 | $13 |
Property Value by Mortgage Status in Grayson County
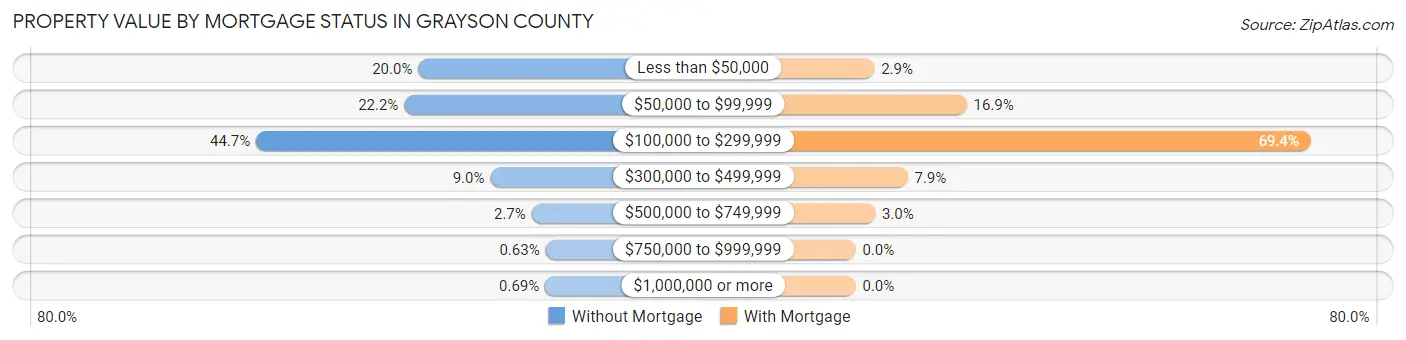
| Property Value | Without Mortgage | With Mortgage |
| Less than $50,000 | 636 (20.0%) | 51 (2.9%) |
| $50,000 to $99,999 | 704 (22.2%) | 303 (16.9%) |
| $100,000 to $299,999 | 1,421 (44.7%) | 1,243 (69.4%) |
| $300,000 to $499,999 | 287 (9.0%) | 142 (7.9%) |
| $500,000 to $749,999 | 87 (2.7%) | 53 (3.0%) |
| $750,000 to $999,999 | 20 (0.6%) | 0 (0.0%) |
| $1,000,000 or more | 22 (0.7%) | 0 (0.0%) |
| Total | 3,177 (100.0%) | 1,792 (100.0%) |
Household Income by Mortgage Status in Grayson County
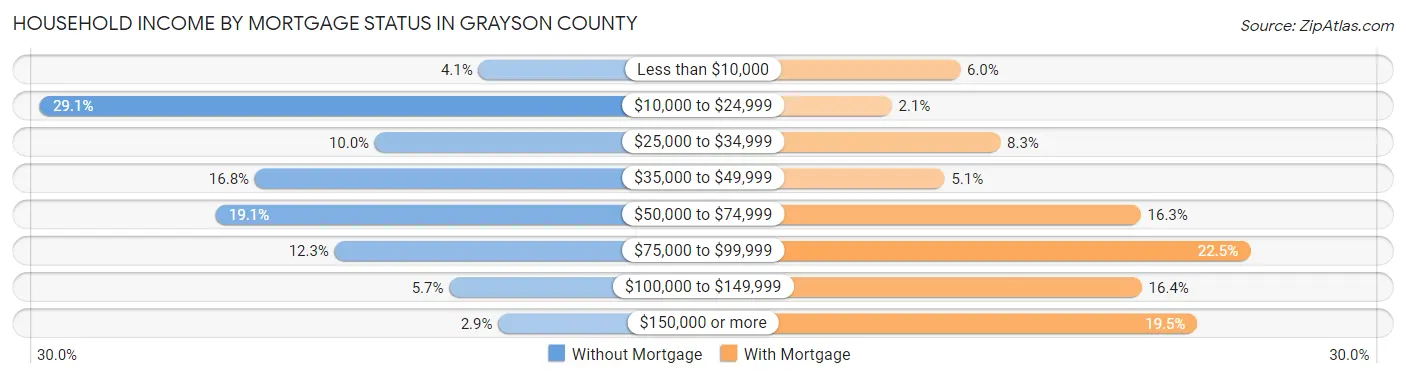
| Household Income | Without Mortgage | With Mortgage |
| Less than $10,000 | 129 (4.1%) | 107 (6.0%) |
| $10,000 to $24,999 | 925 (29.1%) | 37 (2.1%) |
| $25,000 to $34,999 | 317 (10.0%) | 148 (8.3%) |
| $35,000 to $49,999 | 535 (16.8%) | 91 (5.1%) |
| $50,000 to $74,999 | 606 (19.1%) | 292 (16.3%) |
| $75,000 to $99,999 | 390 (12.3%) | 404 (22.5%) |
| $100,000 to $149,999 | 182 (5.7%) | 293 (16.4%) |
| $150,000 or more | 93 (2.9%) | 350 (19.5%) |
| Total | 3,177 (100.0%) | 1,792 (100.0%) |
Property Value to Household Income Ratio in Grayson County
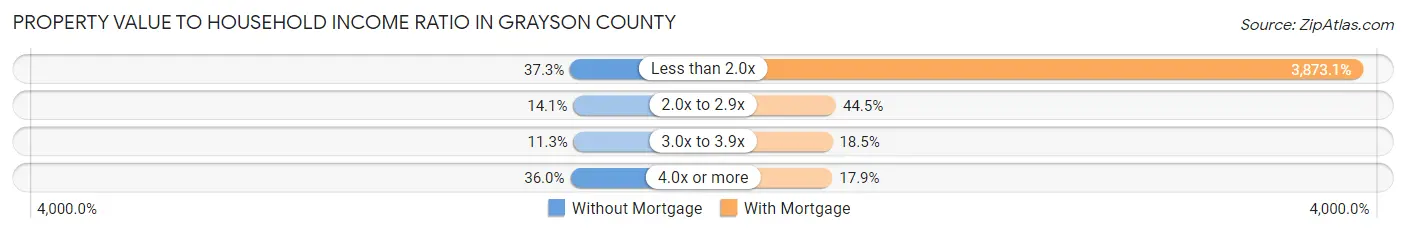
| Value-to-Income Ratio | Without Mortgage | With Mortgage |
| Less than 2.0x | 1,184 (37.3%) | 69,406 (3,873.1%) |
| 2.0x to 2.9x | 448 (14.1%) | 798 (44.5%) |
| 3.0x to 3.9x | 360 (11.3%) | 331 (18.5%) |
| 4.0x or more | 1,144 (36.0%) | 320 (17.9%) |
| Total | 3,177 (100.0%) | 1,792 (100.0%) |
Real Estate Taxes by Mortgage Status in Grayson County
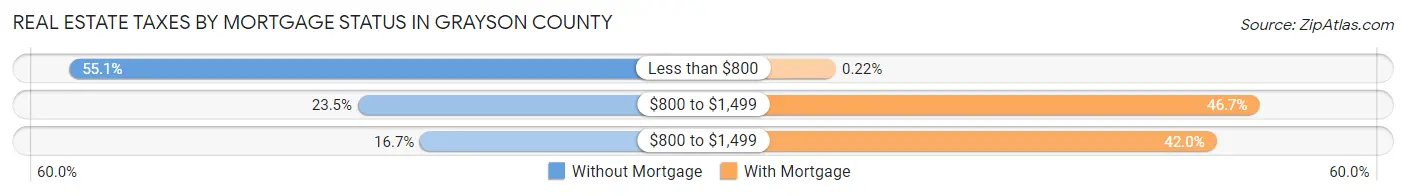
| Property Taxes | Without Mortgage | With Mortgage |
| Less than $800 | 1,751 (55.1%) | 4 (0.2%) |
| $800 to $1,499 | 746 (23.5%) | 837 (46.7%) |
| $800 to $1,499 | 529 (16.7%) | 753 (42.0%) |
| Total | 3,177 (100.0%) | 1,792 (100.0%) |
Health & Disability in Grayson County
Health Insurance Coverage by Age in Grayson County
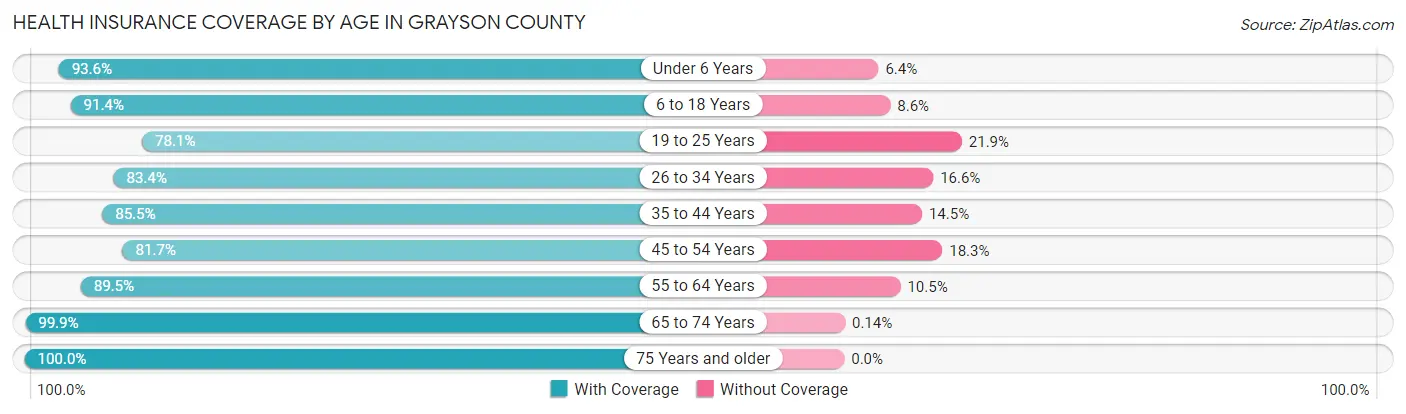
| Age Bracket | With Coverage | Without Coverage |
| Under 6 Years | 735 (93.6%) | 50 (6.4%) |
| 6 to 18 Years | 1,650 (91.4%) | 155 (8.6%) |
| 19 to 25 Years | 823 (78.1%) | 231 (21.9%) |
| 26 to 34 Years | 1,107 (83.4%) | 220 (16.6%) |
| 35 to 44 Years | 1,198 (85.5%) | 203 (14.5%) |
| 45 to 54 Years | 1,632 (81.7%) | 365 (18.3%) |
| 55 to 64 Years | 2,128 (89.5%) | 249 (10.5%) |
| 65 to 74 Years | 2,149 (99.9%) | 3 (0.1%) |
| 75 Years and older | 1,572 (100.0%) | 0 (0.0%) |
| Total | 12,994 (89.8%) | 1,476 (10.2%) |
Health Insurance Coverage by Citizenship Status in Grayson County
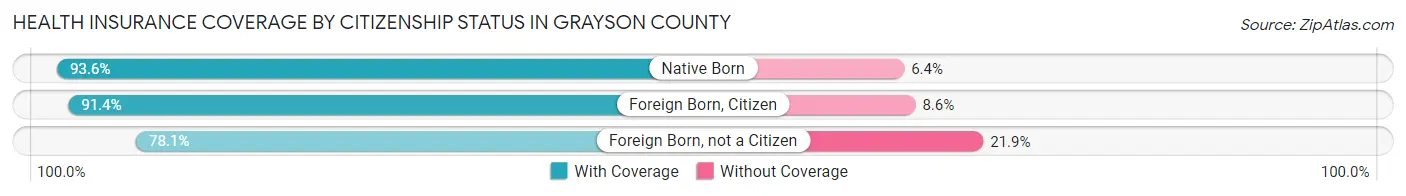
| Citizenship Status | With Coverage | Without Coverage |
| Native Born | 735 (93.6%) | 50 (6.4%) |
| Foreign Born, Citizen | 1,650 (91.4%) | 155 (8.6%) |
| Foreign Born, not a Citizen | 823 (78.1%) | 231 (21.9%) |
Health Insurance Coverage by Household Income in Grayson County
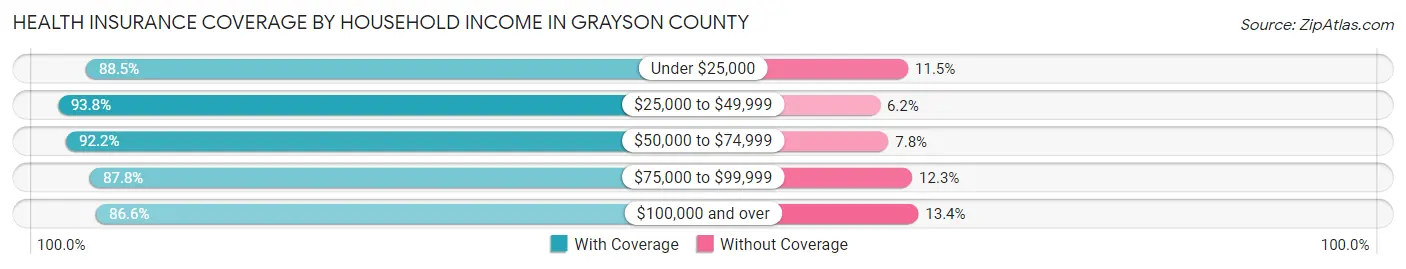
| Household Income | With Coverage | Without Coverage |
| Under $25,000 | 2,703 (88.5%) | 351 (11.5%) |
| $25,000 to $49,999 | 3,292 (93.8%) | 218 (6.2%) |
| $50,000 to $74,999 | 2,609 (92.2%) | 220 (7.8%) |
| $75,000 to $99,999 | 1,934 (87.7%) | 270 (12.2%) |
| $100,000 and over | 2,408 (86.6%) | 373 (13.4%) |
Public vs Private Health Insurance Coverage by Age in Grayson County
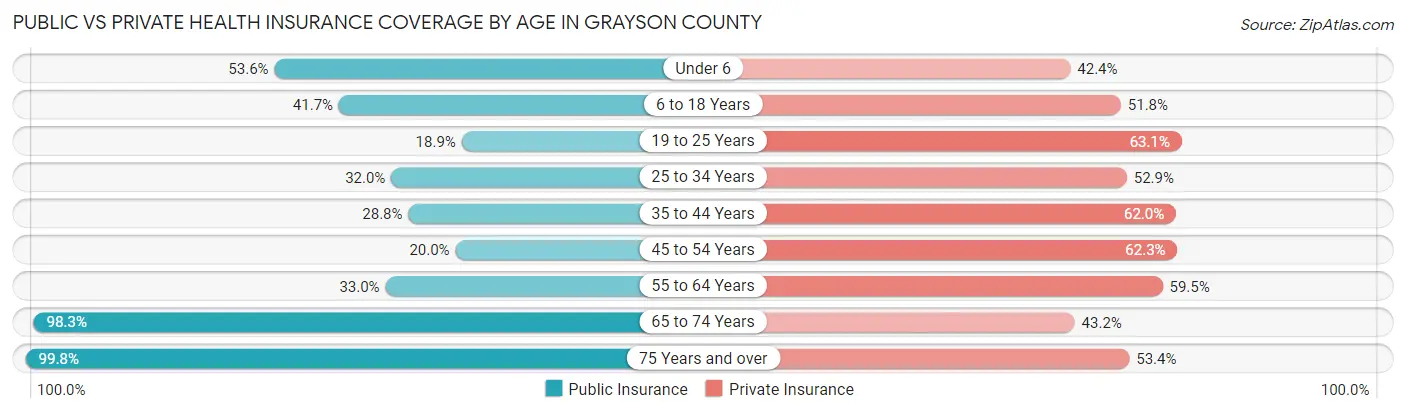
| Age Bracket | Public Insurance | Private Insurance |
| Under 6 | 421 (53.6%) | 333 (42.4%) |
| 6 to 18 Years | 752 (41.7%) | 935 (51.8%) |
| 19 to 25 Years | 199 (18.9%) | 665 (63.1%) |
| 25 to 34 Years | 424 (32.0%) | 702 (52.9%) |
| 35 to 44 Years | 403 (28.8%) | 869 (62.0%) |
| 45 to 54 Years | 400 (20.0%) | 1,244 (62.3%) |
| 55 to 64 Years | 785 (33.0%) | 1,415 (59.5%) |
| 65 to 74 Years | 2,116 (98.3%) | 930 (43.2%) |
| 75 Years and over | 1,569 (99.8%) | 839 (53.4%) |
| Total | 7,069 (48.8%) | 7,932 (54.8%) |
Disability Status by Sex by Age in Grayson County
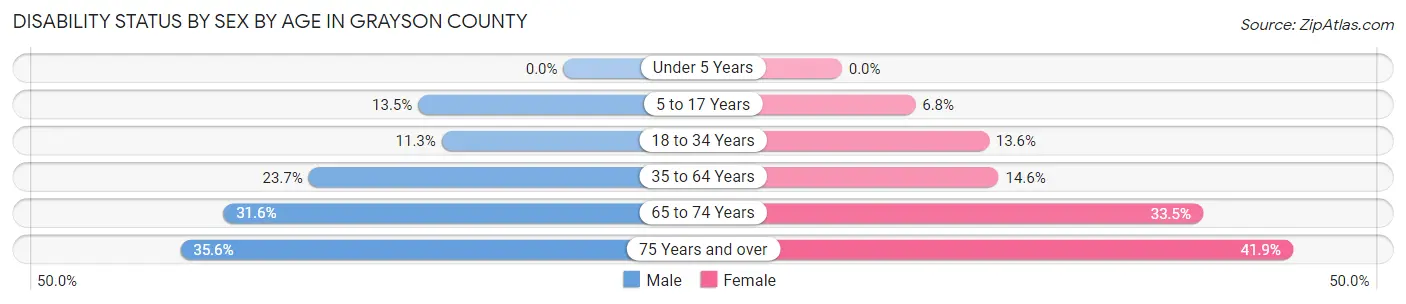
| Age Bracket | Male | Female |
| Under 5 Years | 0 (0.0%) | 0 (0.0%) |
| 5 to 17 Years | 132 (13.5%) | 64 (6.8%) |
| 18 to 34 Years | 151 (11.3%) | 155 (13.6%) |
| 35 to 64 Years | 683 (23.6%) | 420 (14.5%) |
| 65 to 74 Years | 356 (31.6%) | 343 (33.5%) |
| 75 Years and over | 225 (35.5%) | 393 (41.8%) |
Disability Class by Sex by Age in Grayson County
Disability Class: Hearing Difficulty
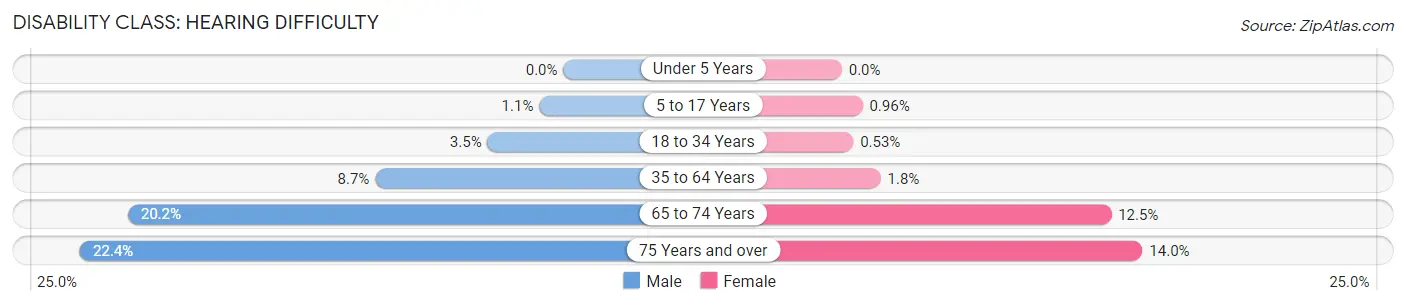
| Age Bracket | Male | Female |
| Under 5 Years | 0 (0.0%) | 0 (0.0%) |
| 5 to 17 Years | 11 (1.1%) | 9 (1.0%) |
| 18 to 34 Years | 47 (3.5%) | 6 (0.5%) |
| 35 to 64 Years | 252 (8.7%) | 52 (1.8%) |
| 65 to 74 Years | 228 (20.2%) | 128 (12.5%) |
| 75 Years and over | 142 (22.4%) | 131 (14.0%) |
Disability Class: Vision Difficulty
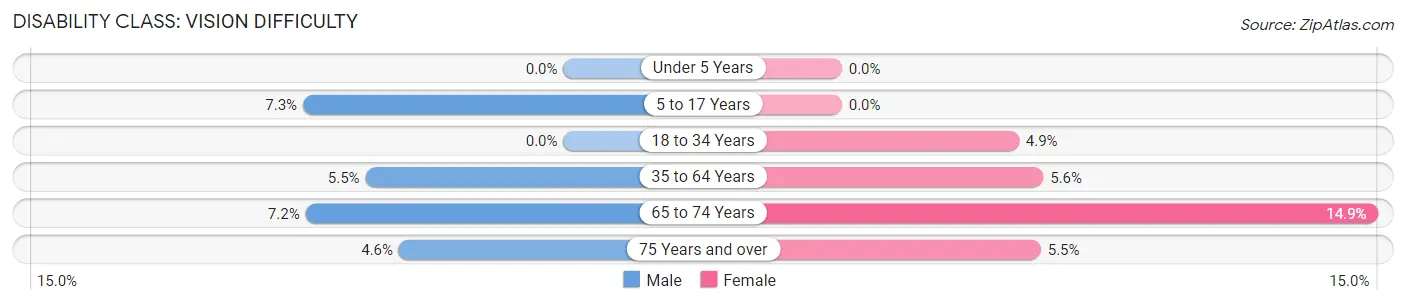
| Age Bracket | Male | Female |
| Under 5 Years | 0 (0.0%) | 0 (0.0%) |
| 5 to 17 Years | 71 (7.2%) | 0 (0.0%) |
| 18 to 34 Years | 0 (0.0%) | 56 (4.9%) |
| 35 to 64 Years | 159 (5.5%) | 162 (5.6%) |
| 65 to 74 Years | 81 (7.2%) | 153 (14.9%) |
| 75 Years and over | 29 (4.6%) | 52 (5.5%) |
Disability Class: Cognitive Difficulty
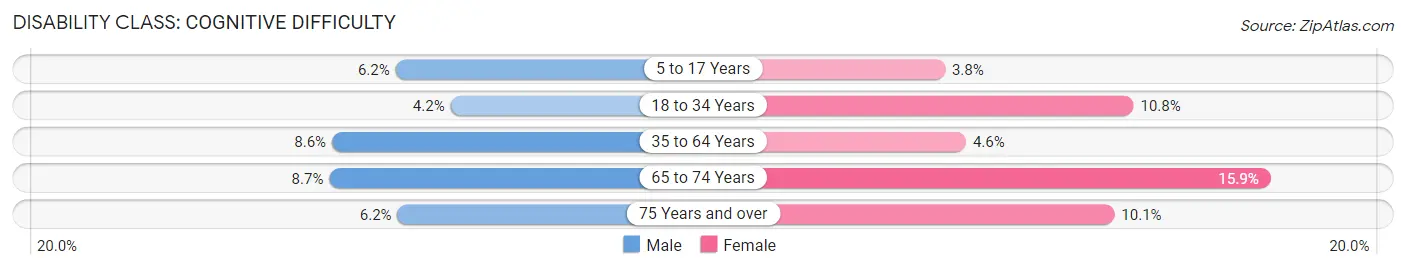
| Age Bracket | Male | Female |
| 5 to 17 Years | 61 (6.2%) | 36 (3.8%) |
| 18 to 34 Years | 56 (4.2%) | 123 (10.8%) |
| 35 to 64 Years | 248 (8.6%) | 133 (4.6%) |
| 65 to 74 Years | 98 (8.7%) | 163 (15.9%) |
| 75 Years and over | 39 (6.2%) | 95 (10.1%) |
Disability Class: Ambulatory Difficulty
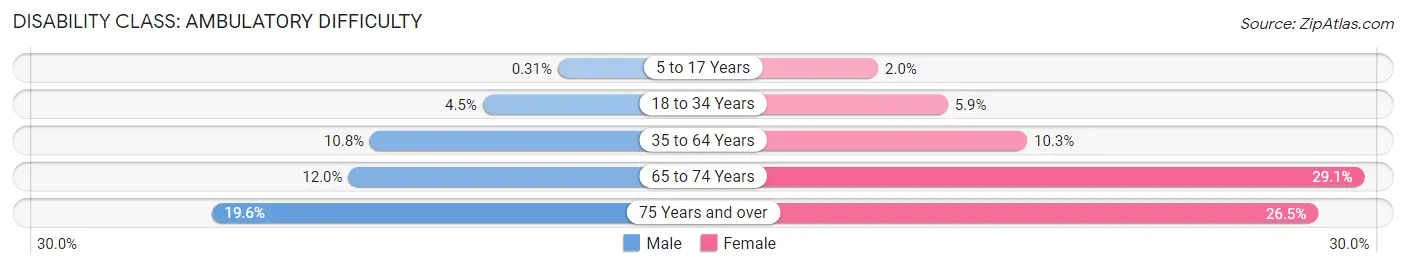
| Age Bracket | Male | Female |
| 5 to 17 Years | 3 (0.3%) | 19 (2.0%) |
| 18 to 34 Years | 60 (4.5%) | 67 (5.9%) |
| 35 to 64 Years | 311 (10.8%) | 298 (10.3%) |
| 65 to 74 Years | 135 (12.0%) | 298 (29.1%) |
| 75 Years and over | 124 (19.6%) | 249 (26.5%) |
Disability Class: Self-Care Difficulty
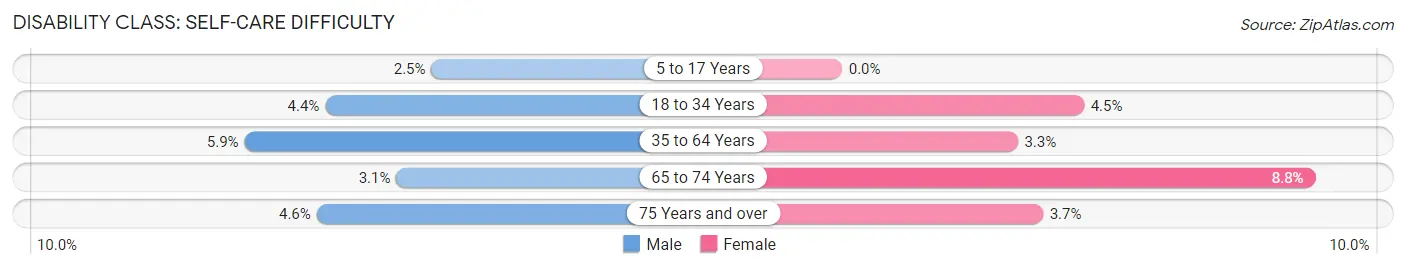
| Age Bracket | Male | Female |
| 5 to 17 Years | 24 (2.5%) | 0 (0.0%) |
| 18 to 34 Years | 59 (4.4%) | 51 (4.5%) |
| 35 to 64 Years | 171 (5.9%) | 94 (3.3%) |
| 65 to 74 Years | 35 (3.1%) | 90 (8.8%) |
| 75 Years and over | 29 (4.6%) | 35 (3.7%) |
Technology Access in Grayson County
Computing Device Access in Grayson County
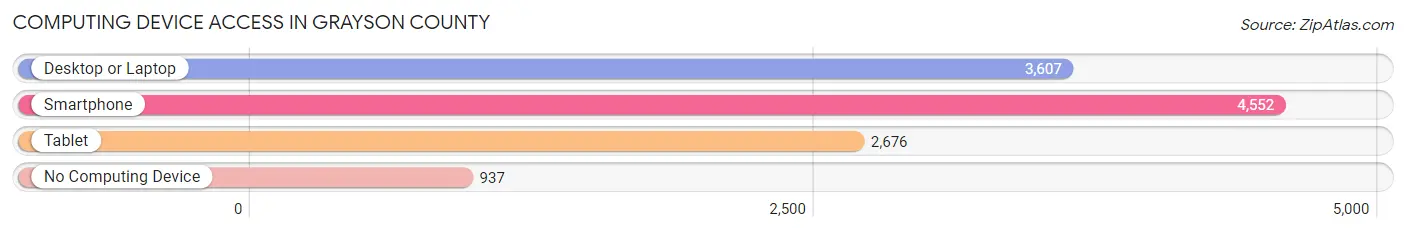
| Device Type | # Households | % Households |
| Desktop or Laptop | 3,607 | 58.7% |
| Smartphone | 4,552 | 74.0% |
| Tablet | 2,676 | 43.5% |
| No Computing Device | 937 | 15.2% |
| Total | 6,148 | 100.0% |
Internet Access in Grayson County
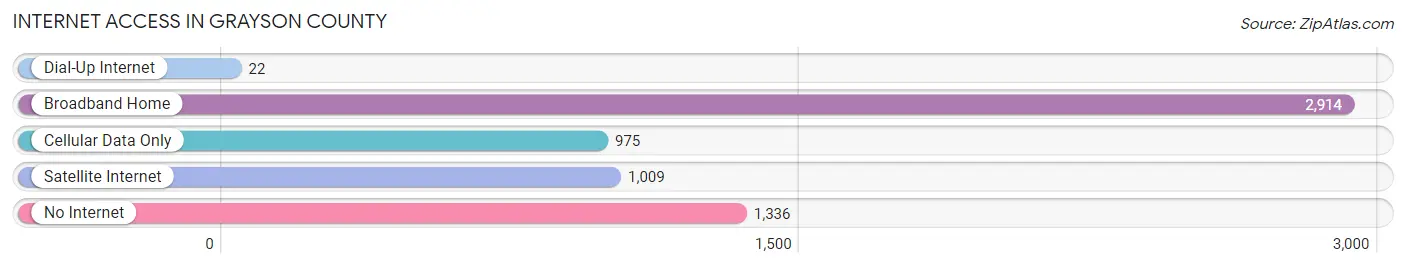
| Internet Type | # Households | % Households |
| Dial-Up Internet | 22 | 0.4% |
| Broadband Home | 2,914 | 47.4% |
| Cellular Data Only | 975 | 15.9% |
| Satellite Internet | 1,009 | 16.4% |
| No Internet | 1,336 | 21.7% |
| Total | 6,148 | 100.0% |
Grayson County Summary
Grayson County is located in the southwestern part of the Commonwealth of Virginia, and is part of the Blue Ridge Mountains region. It is bordered by Carroll County to the north, Wythe County to the east, Bland County to the south, and the state of North Carolina to the west. The county seat is Independence, and the county has a total area of 437 square miles.
History
Grayson County was formed in 1793 from parts of Wythe and Montgomery Counties. It was named for William Grayson, a Revolutionary War hero and one of the first two United States Senators from Virginia. The county was largely rural and agricultural until the mid-20th century, when the population began to grow rapidly due to the influx of people from other parts of the state and country.
Geography
Grayson County is located in the Blue Ridge Mountains region of Virginia. The terrain is mostly mountainous, with elevations ranging from 1,000 to 4,000 feet. The county is home to several state parks, including Grayson Highlands State Park, which is known for its wild ponies. The county is also home to the New River, which is one of the oldest rivers in the United States.
Economy
Grayson County has a diverse economy, with a mix of agriculture, manufacturing, and tourism. Agriculture is the largest sector of the economy, with the county producing a variety of crops, including corn, soybeans, hay, and tobacco. Manufacturing is also important to the economy, with the county home to several factories that produce furniture, textiles, and other products. Tourism is also an important part of the economy, with the county home to several popular attractions, including the New River, Grayson Highlands State Park, and the Virginia Creeper Trail.
Demographics
As of the 2010 census, Grayson County had a population of 15,533. The population is largely white (93.3%), with small percentages of African Americans (3.3%), Hispanics (1.7%), and Asians (0.7%). The median household income is $41,945, and the median age is 43.7.
Grayson County is a rural county, with most of the population living in small towns and villages. The largest town is Independence, which is the county seat. Other towns include Troutdale, Fries, and Mouth of Wilson.
Conclusion
Grayson County is a rural county located in the Blue Ridge Mountains region of Virginia. It has a diverse economy, with a mix of agriculture, manufacturing, and tourism. The population is largely white, with a median household income of $41,945 and a median age of 43.7. The county is home to several popular attractions, including the New River, Grayson Highlands State Park, and the Virginia Creeper Trail.
Common Questions
What is Per Capita Income in Grayson County?
Per Capita income in Grayson County is $26,270.
What is the Median Family Income in Grayson County?
Median Family Income in Grayson County is $58,588.
What is the Median Household income in Grayson County?
Median Household Income in Grayson County is $43,348.
What is Income or Wage Gap in Grayson County?
Income or Wage Gap in Grayson County is 10.7%.
Women in Grayson County earn 89.3 cents for every dollar earned by a man.
What is Family Income Deficit in Grayson County?
Family Income Deficit in Grayson County is $9,549.
Families that are below poverty line in Grayson County earn $9,549 less on average than the poverty threshold level.
What is Inequality or Gini Index in Grayson County?
Inequality or Gini Index in Grayson County is 0.47.
What is the Total Population of Grayson County?
Total Population of Grayson County is 15,356.
What is the Total Male Population of Grayson County?
Total Male Population of Grayson County is 8,064.
What is the Total Female Population of Grayson County?
Total Female Population of Grayson County is 7,292.
What is the Ratio of Males per 100 Females in Grayson County?
There are 110.59 Males per 100 Females in Grayson County.
What is the Ratio of Females per 100 Males in Grayson County?
There are 90.43 Females per 100 Males in Grayson County.
What is the Median Population Age in Grayson County?
Median Population Age in Grayson County is 49.0 Years.
What is the Average Family Size in Grayson County
Average Family Size in Grayson County is 2.8 People.
What is the Average Household Size in Grayson County
Average Household Size in Grayson County is 2.3 People.
How Large is the Labor Force in Grayson County?
There are 6,232 People in the Labor Forcein in Grayson County.
What is the Percentage of People in the Labor Force in Grayson County?
47.9% of People are in the Labor Force in Grayson County.
What is the Unemployment Rate in Grayson County?
Unemployment Rate in Grayson County is 4.3%.