Goochland County, VA Map & Demographics
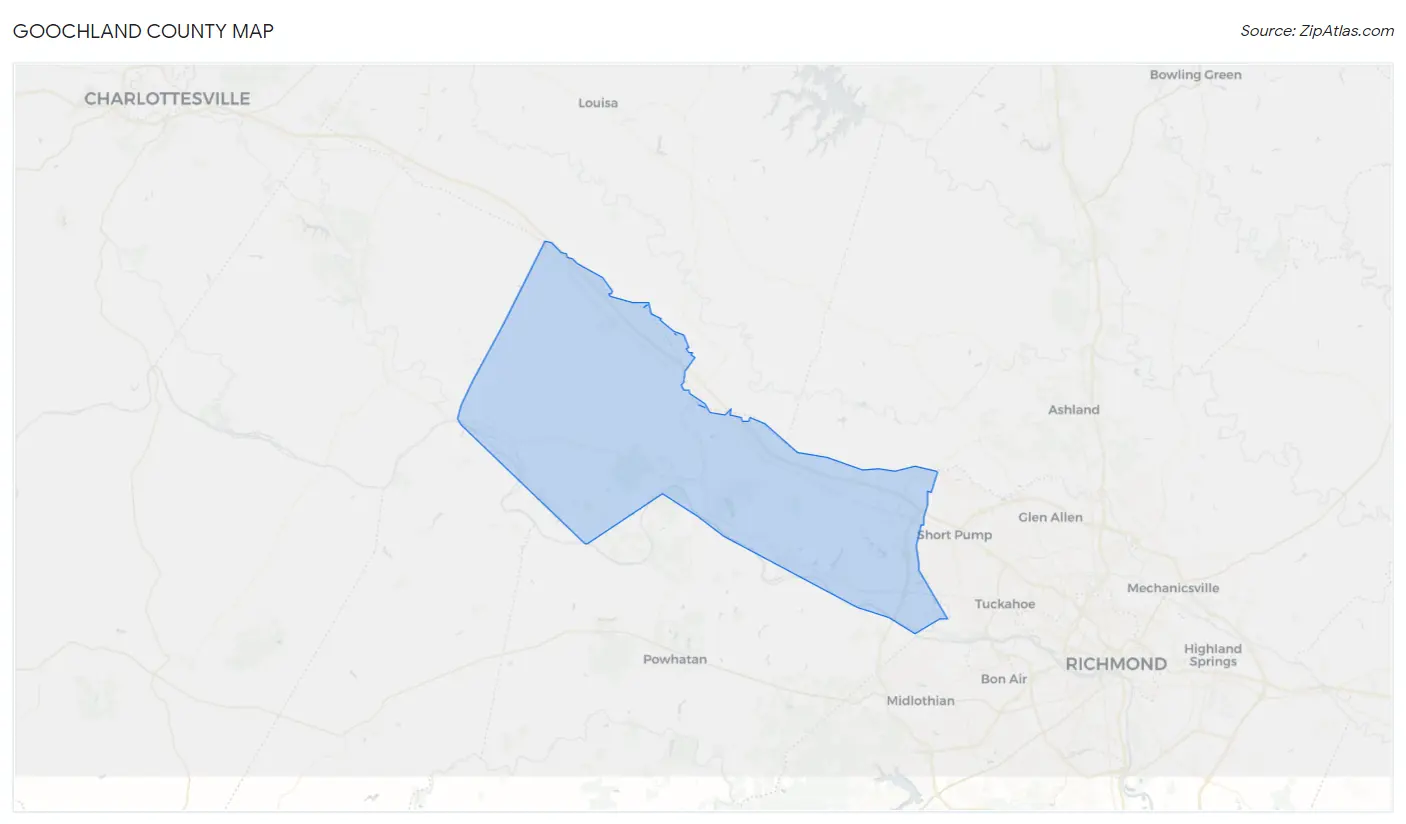
Goochland County Map
Goochland County Overview
$63,645
PER CAPITA INCOME
$125,391
AVG FAMILY INCOME
$105,600
AVG HOUSEHOLD INCOME
38.4%
WAGE / INCOME GAP [ % ]
61.6¢/ $1
WAGE / INCOME GAP [ $ ]
0.49
INEQUALITY / GINI INDEX
24,906
TOTAL POPULATION
12,404
MALE POPULATION
12,502
FEMALE POPULATION
99.22
MALES / 100 FEMALES
100.79
FEMALES / 100 MALES
49.0
MEDIAN AGE
2.9
AVG FAMILY SIZE
2.4
AVG HOUSEHOLD SIZE
11,986
LABOR FORCE [ PEOPLE ]
56.2%
PERCENT IN LABOR FORCE
2.4%
UNEMPLOYMENT RATE
Goochland County Area Codes
Income in Goochland County
Income Overview in Goochland County
Per Capita Income in Goochland County is $63,645, while median incomes of families and households are $125,391 and $105,600 respectively.
| Characteristic | Number | Measure |
| Per Capita Income | 24,906 | $63,645 |
| Median Family Income | 7,100 | $125,391 |
| Mean Family Income | 7,100 | $185,344 |
| Median Household Income | 9,788 | $105,600 |
| Mean Household Income | 9,788 | $159,778 |
| Income Deficit | 7,100 | $0 |
| Wage / Income Gap (%) | 24,906 | 38.35% |
| Wage / Income Gap ($) | 24,906 | 61.65¢ per $1 |
| Gini / Inequality Index | 24,906 | 0.49 |
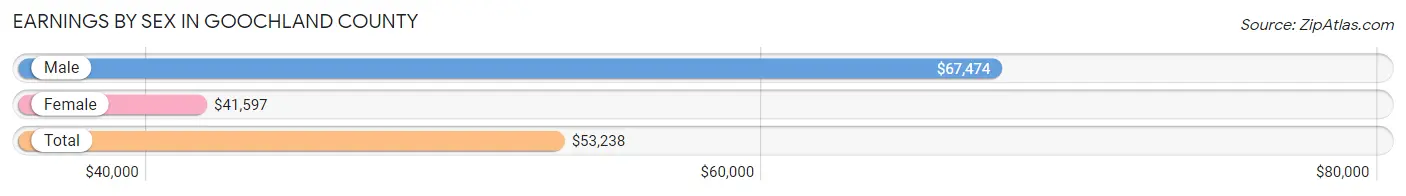
Earnings by Sex in Goochland County
Average Earnings in Goochland County are $53,238, $67,474 for men and $41,597 for women, a difference of 38.4%.
| Sex | Number | Average Earnings |
| Male | 6,574 (51.3%) | $67,474 |
| Female | 6,239 (48.7%) | $41,597 |
| Total | 12,813 (100.0%) | $53,238 |
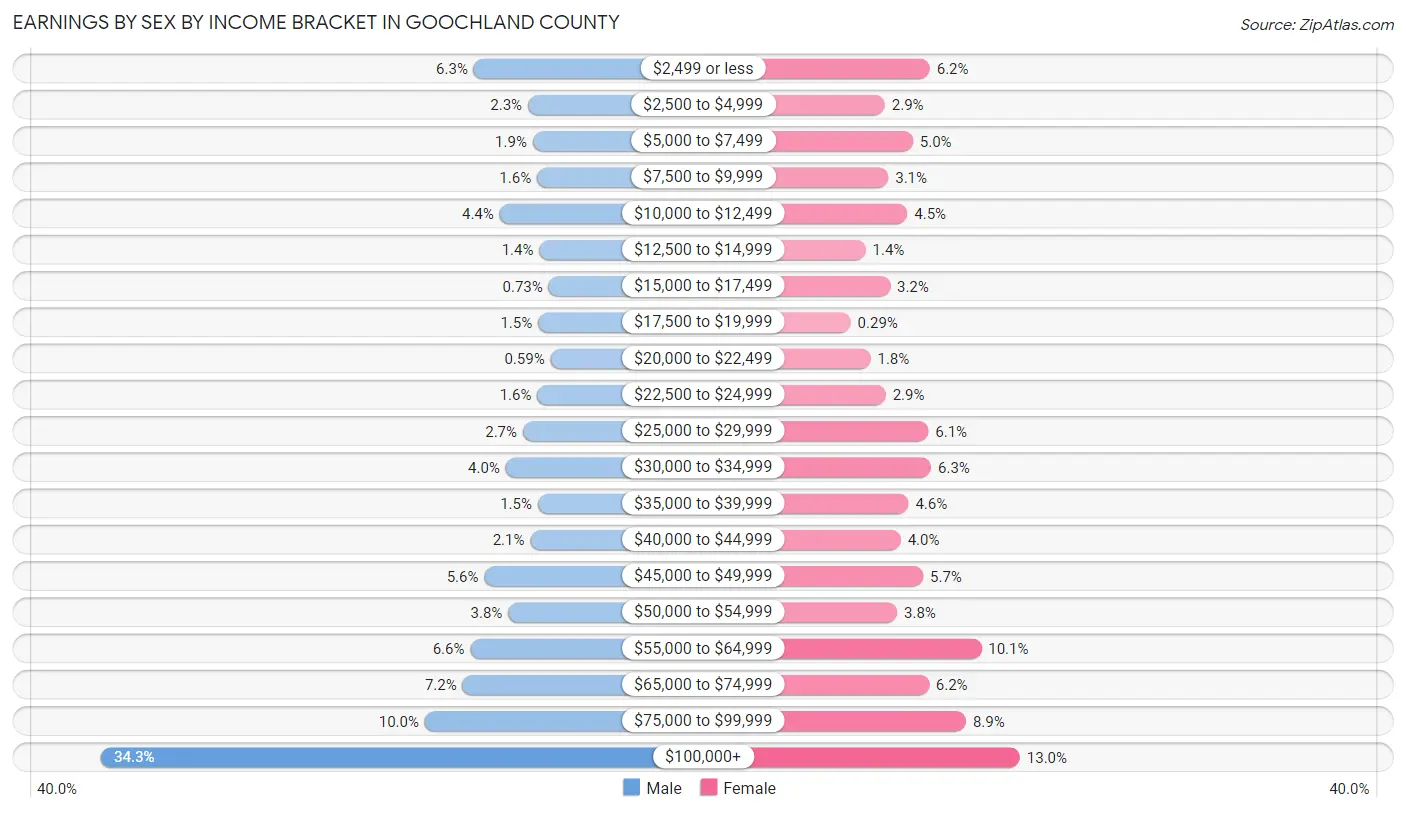
Earnings by Sex by Income Bracket in Goochland County
The most common earnings brackets in Goochland County are $100,000+ for men (2,252 | 34.3%) and $100,000+ for women (809 | 13.0%).
| Income | Male | Female |
| $2,499 or less | 417 (6.3%) | 388 (6.2%) |
| $2,500 to $4,999 | 150 (2.3%) | 178 (2.9%) |
| $5,000 to $7,499 | 126 (1.9%) | 309 (5.0%) |
| $7,500 to $9,999 | 105 (1.6%) | 194 (3.1%) |
| $10,000 to $12,499 | 289 (4.4%) | 283 (4.5%) |
| $12,500 to $14,999 | 94 (1.4%) | 88 (1.4%) |
| $15,000 to $17,499 | 48 (0.7%) | 202 (3.2%) |
| $17,500 to $19,999 | 100 (1.5%) | 18 (0.3%) |
| $20,000 to $22,499 | 39 (0.6%) | 111 (1.8%) |
| $22,500 to $24,999 | 104 (1.6%) | 182 (2.9%) |
| $25,000 to $29,999 | 175 (2.7%) | 381 (6.1%) |
| $30,000 to $34,999 | 260 (4.0%) | 394 (6.3%) |
| $35,000 to $39,999 | 101 (1.5%) | 288 (4.6%) |
| $40,000 to $44,999 | 138 (2.1%) | 252 (4.0%) |
| $45,000 to $49,999 | 365 (5.6%) | 357 (5.7%) |
| $50,000 to $54,999 | 247 (3.8%) | 235 (3.8%) |
| $55,000 to $64,999 | 434 (6.6%) | 629 (10.1%) |
| $65,000 to $74,999 | 472 (7.2%) | 384 (6.1%) |
| $75,000 to $99,999 | 658 (10.0%) | 557 (8.9%) |
| $100,000+ | 2,252 (34.3%) | 809 (13.0%) |
| Total | 6,574 (100.0%) | 6,239 (100.0%) |
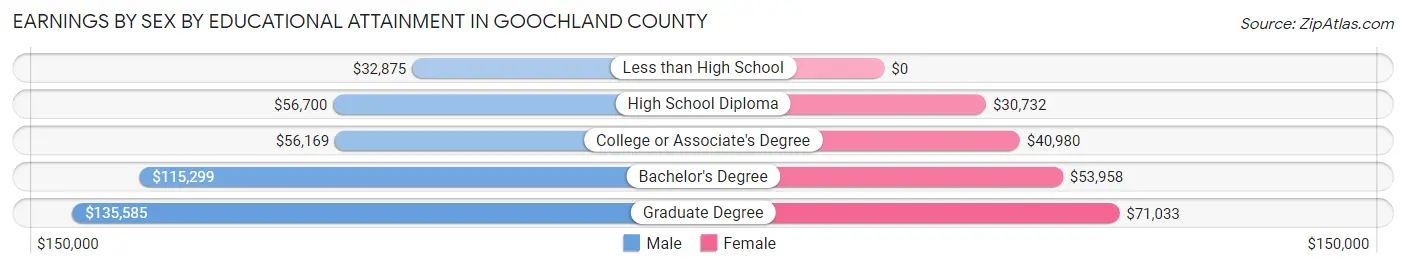
Earnings by Sex by Educational Attainment in Goochland County
Average earnings in Goochland County are $73,594 for men and $46,256 for women, a difference of 37.1%. Men with an educational attainment of graduate degree enjoy the highest average annual earnings of $135,585, while those with less than high school education earn the least with $32,875. Women with an educational attainment of graduate degree earn the most with the average annual earnings of $71,033, while those with high school diploma education have the smallest earnings of $30,732.
| Educational Attainment | Male Income | Female Income |
| Less than High School | $32,875 | $0 |
| High School Diploma | $56,700 | $30,732 |
| College or Associate's Degree | $56,169 | $40,980 |
| Bachelor's Degree | $115,299 | $53,958 |
| Graduate Degree | $135,585 | $71,033 |
| Total | $73,594 | $46,256 |
Family Income in Goochland County
Family Income Brackets in Goochland County
According to the Goochland County family income data, there are 1,988 families falling into the $200,000+ income range, which is the most common income bracket and makes up 28.0% of all families. Conversely, the $10,000 to $14,999 income bracket is the least frequent group with only 36 families (0.5%) belonging to this category.
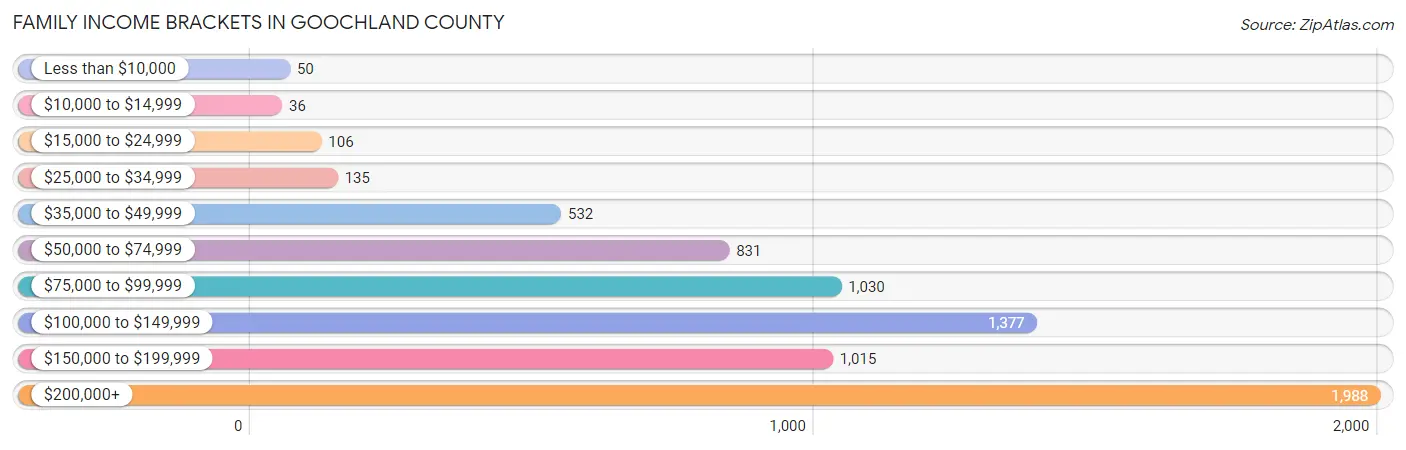
| Income Bracket | # Families | % Families |
| Less than $10,000 | 50 | 0.7% |
| $10,000 to $14,999 | 36 | 0.5% |
| $15,000 to $24,999 | 106 | 1.5% |
| $25,000 to $34,999 | 135 | 1.9% |
| $35,000 to $49,999 | 532 | 7.5% |
| $50,000 to $74,999 | 831 | 11.7% |
| $75,000 to $99,999 | 1,030 | 14.5% |
| $100,000 to $149,999 | 1,377 | 19.4% |
| $150,000 to $199,999 | 1,015 | 14.3% |
| $200,000+ | 1,988 | 28.0% |
Family Income by Famaliy Size in Goochland County
7+ person families (82 | 1.1%) account for the highest median family income in Goochland County with $208,816 per family, while 2-person families (4,218 | 59.4%) have the highest median income of $59,428 per family member.
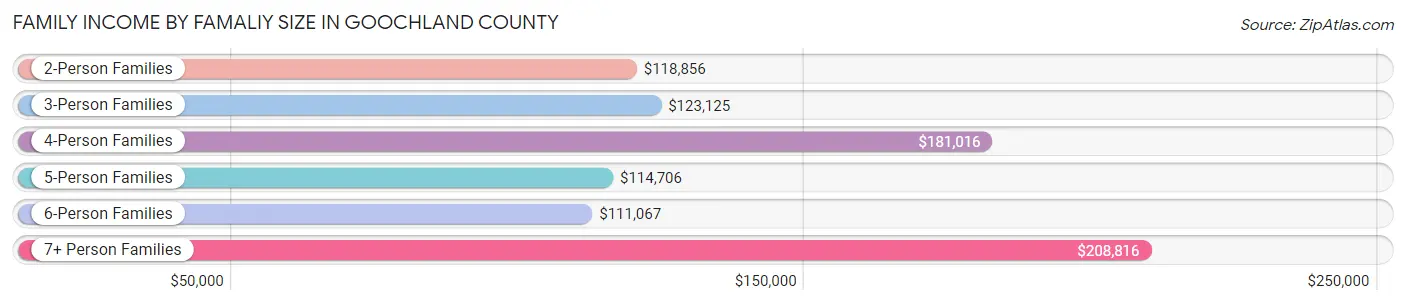
| Income Bracket | # Families | Median Income |
| 2-Person Families | 4,218 (59.4%) | $118,856 |
| 3-Person Families | 1,450 (20.4%) | $123,125 |
| 4-Person Families | 871 (12.3%) | $181,016 |
| 5-Person Families | 354 (5.0%) | $114,706 |
| 6-Person Families | 125 (1.8%) | $111,067 |
| 7+ Person Families | 82 (1.1%) | $208,816 |
| Total | 7,100 (100.0%) | $125,391 |
Family Income by Number of Earners in Goochland County
The median family income in Goochland County is $125,391, with families comprising 2 earners (3,066) having the highest median family income of $155,071, while families with no earners (1,623) have the lowest median family income of $92,774, accounting for 43.2% and 22.9% of families, respectively.
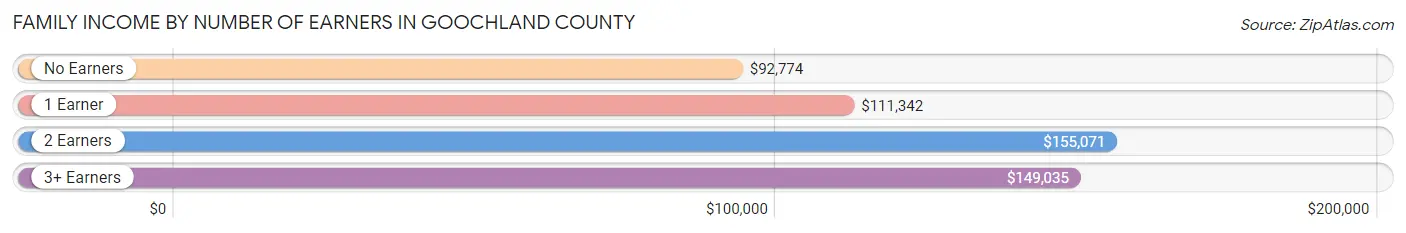
| Number of Earners | # Families | Median Income |
| No Earners | 1,623 (22.9%) | $92,774 |
| 1 Earner | 1,795 (25.3%) | $111,342 |
| 2 Earners | 3,066 (43.2%) | $155,071 |
| 3+ Earners | 616 (8.7%) | $149,035 |
| Total | 7,100 (100.0%) | $125,391 |
Household Income in Goochland County
Household Income Brackets in Goochland County
With 2,281 households falling in the category, the $200,000+ income range is the most frequent in Goochland County, accounting for 23.3% of all households. In contrast, only 245 households (2.5%) fall into the $10,000 to $14,999 income bracket, making it the least populous group.
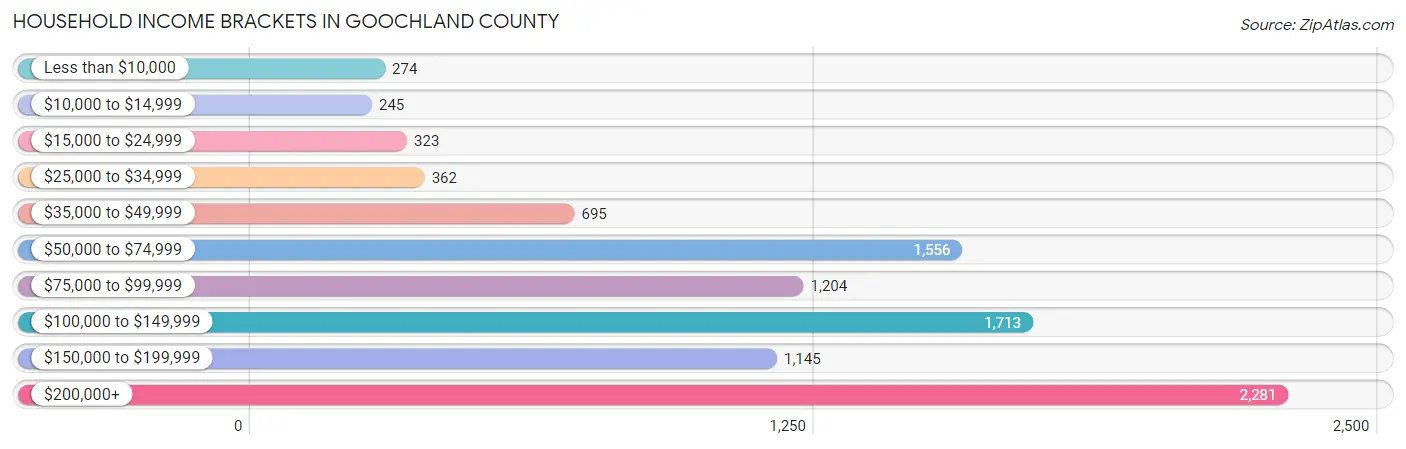
| Income Bracket | # Households | % Households |
| Less than $10,000 | 274 | 2.8% |
| $10,000 to $14,999 | 245 | 2.5% |
| $15,000 to $24,999 | 323 | 3.3% |
| $25,000 to $34,999 | 362 | 3.7% |
| $35,000 to $49,999 | 695 | 7.1% |
| $50,000 to $74,999 | 1,556 | 15.9% |
| $75,000 to $99,999 | 1,204 | 12.3% |
| $100,000 to $149,999 | 1,713 | 17.5% |
| $150,000 to $199,999 | 1,145 | 11.7% |
| $200,000+ | 2,281 | 23.3% |
Household Income by Householder Age in Goochland County
The median household income in Goochland County is $105,600, with the highest median household income of $135,469 found in the 45 to 64 years age bracket for the primary householder. A total of 4,065 households (41.5%) fall into this category. Meanwhile, the 15 to 24 years age bracket for the primary householder has the lowest median household income of $72,740, with 247 households (2.5%) in this group.
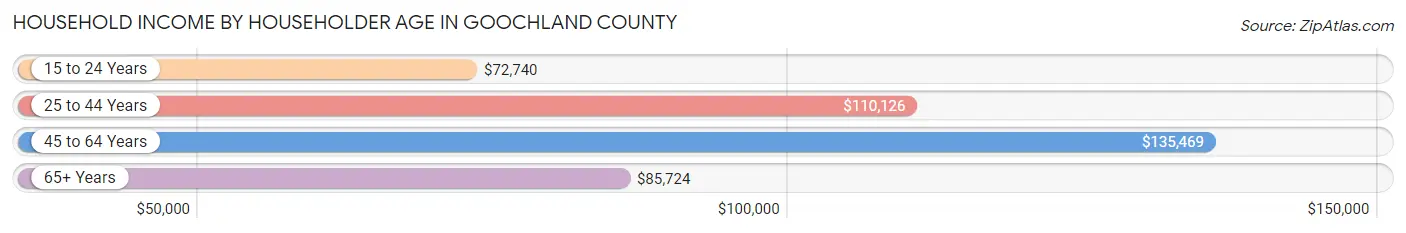
| Income Bracket | # Households | Median Income |
| 15 to 24 Years | 247 (2.5%) | $72,740 |
| 25 to 44 Years | 2,059 (21.0%) | $110,126 |
| 45 to 64 Years | 4,065 (41.5%) | $135,469 |
| 65+ Years | 3,417 (34.9%) | $85,724 |
| Total | 9,788 (100.0%) | $105,600 |
Poverty in Goochland County
Income Below Poverty by Sex and Age in Goochland County
With 2.9% poverty level for males and 5.6% for females among the residents of Goochland County, 16 and 17 year old males and 75 year old and over females are the most vulnerable to poverty, with 51 males (18.0%) and 161 females (13.7%) in their respective age groups living below the poverty level.
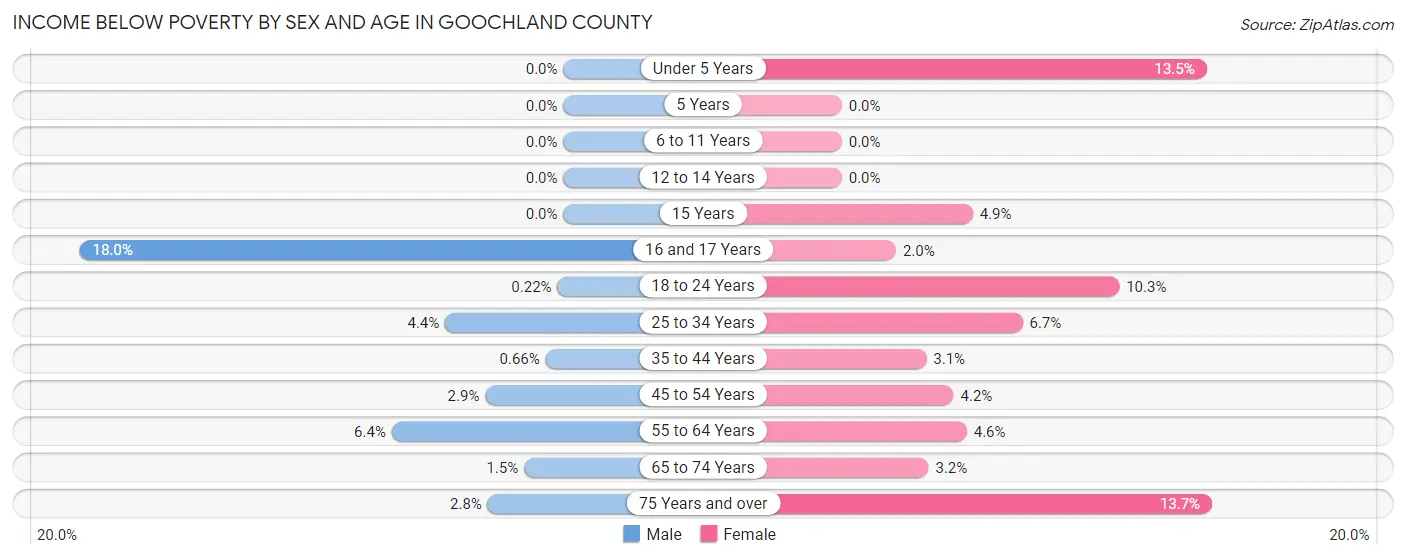
| Age Bracket | Male | Female |
| Under 5 Years | 0 (0.0%) | 49 (13.5%) |
| 5 Years | 0 (0.0%) | 0 (0.0%) |
| 6 to 11 Years | 0 (0.0%) | 0 (0.0%) |
| 12 to 14 Years | 0 (0.0%) | 0 (0.0%) |
| 15 Years | 0 (0.0%) | 9 (4.9%) |
| 16 and 17 Years | 51 (18.0%) | 7 (2.0%) |
| 18 to 24 Years | 2 (0.2%) | 94 (10.3%) |
| 25 to 34 Years | 42 (4.4%) | 86 (6.7%) |
| 35 to 44 Years | 8 (0.7%) | 35 (3.1%) |
| 45 to 54 Years | 49 (2.9%) | 72 (4.2%) |
| 55 to 64 Years | 131 (6.4%) | 104 (4.6%) |
| 65 to 74 Years | 26 (1.5%) | 57 (3.2%) |
| 75 Years and over | 26 (2.8%) | 161 (13.7%) |
| Total | 335 (2.9%) | 674 (5.6%) |
Income Above Poverty by Sex and Age in Goochland County
According to the poverty statistics in Goochland County, males aged under 5 years and females aged 5 years are the age groups that are most secure financially, with 100.0% of males and 100.0% of females in these age groups living above the poverty line.
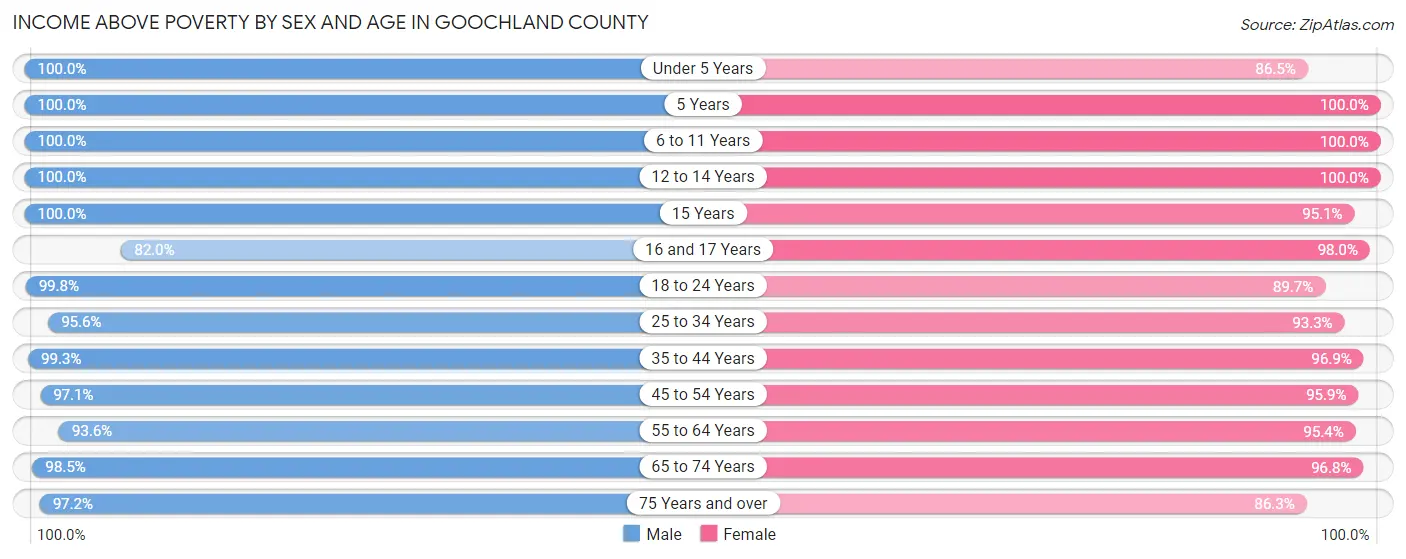
| Age Bracket | Male | Female |
| Under 5 Years | 515 (100.0%) | 313 (86.5%) |
| 5 Years | 149 (100.0%) | 89 (100.0%) |
| 6 to 11 Years | 802 (100.0%) | 650 (100.0%) |
| 12 to 14 Years | 368 (100.0%) | 254 (100.0%) |
| 15 Years | 114 (100.0%) | 176 (95.1%) |
| 16 and 17 Years | 233 (82.0%) | 342 (98.0%) |
| 18 to 24 Years | 898 (99.8%) | 819 (89.7%) |
| 25 to 34 Years | 914 (95.6%) | 1,195 (93.3%) |
| 35 to 44 Years | 1,212 (99.3%) | 1,081 (96.9%) |
| 45 to 54 Years | 1,643 (97.1%) | 1,663 (95.9%) |
| 55 to 64 Years | 1,927 (93.6%) | 2,135 (95.4%) |
| 65 to 74 Years | 1,753 (98.5%) | 1,713 (96.8%) |
| 75 Years and over | 898 (97.2%) | 1,011 (86.3%) |
| Total | 11,426 (97.2%) | 11,441 (94.4%) |
Income Below Poverty Among Married-Couple Families in Goochland County
The poverty statistics for married-couple families in Goochland County show that 1.8% or 117 of the total 6,322 families live below the poverty line. Families with 1 or 2 children have the highest poverty rate of 4.1%, comprising of 64 families. On the other hand, families with 3 or 4 children have the lowest poverty rate of 0.0%, which includes 0 families.
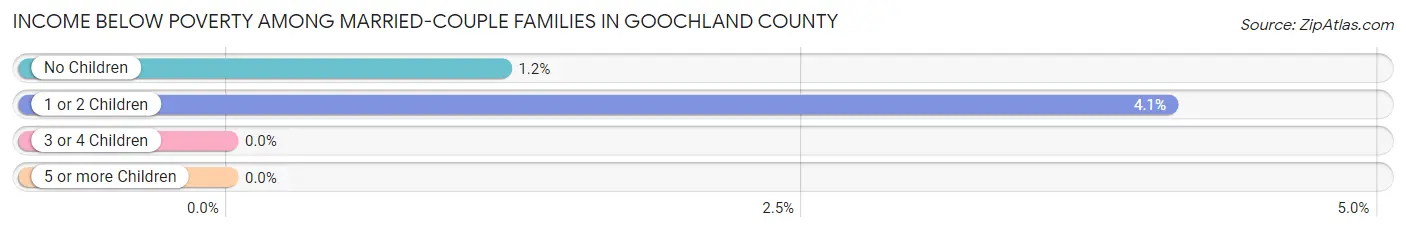
| Children | Above Poverty | Below Poverty |
| No Children | 4,391 (98.8%) | 53 (1.2%) |
| 1 or 2 Children | 1,502 (95.9%) | 64 (4.1%) |
| 3 or 4 Children | 293 (100.0%) | 0 (0.0%) |
| 5 or more Children | 19 (100.0%) | 0 (0.0%) |
| Total | 6,205 (98.2%) | 117 (1.8%) |
Income Below Poverty Among Single-Parent Households in Goochland County
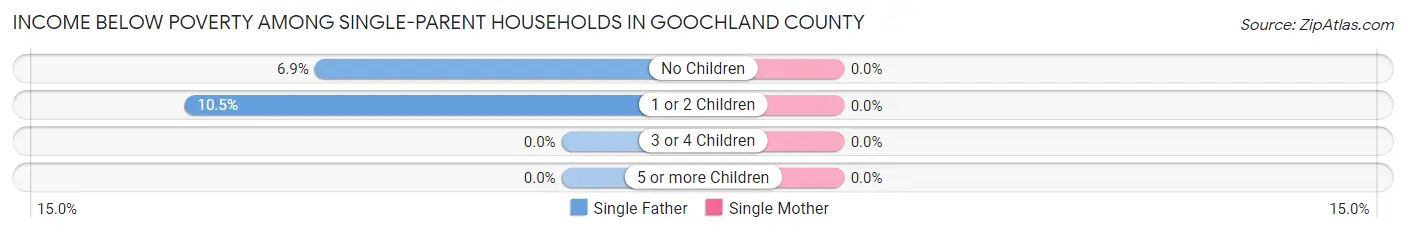
| Children | Single Father | Single Mother |
| No Children | 8 (6.9%) | 0 (0.0%) |
| 1 or 2 Children | 6 (10.5%) | 0 (0.0%) |
| 3 or 4 Children | 0 (0.0%) | 0 (0.0%) |
| 5 or more Children | 0 (0.0%) | 0 (0.0%) |
| Total | 14 (8.1%) | 0 (0.0%) |
Income Below Poverty Among Married-Couple vs Single-Parent Households in Goochland County
The poverty data for Goochland County shows that 117 of the married-couple family households (1.8%) and 14 of the single-parent households (1.8%) are living below the poverty level. Within the married-couple family households, those with 1 or 2 children have the highest poverty rate, with 64 households (4.1%) falling below the poverty line. Among the single-parent households, those with no children have the highest poverty rate, with 8 household (2.2%) living below poverty.
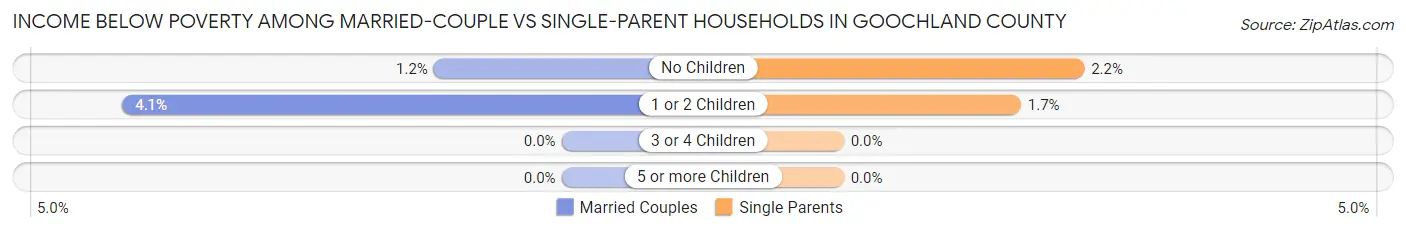
| Children | Married-Couple Families | Single-Parent Households |
| No Children | 53 (1.2%) | 8 (2.2%) |
| 1 or 2 Children | 64 (4.1%) | 6 (1.7%) |
| 3 or 4 Children | 0 (0.0%) | 0 (0.0%) |
| 5 or more Children | 0 (0.0%) | 0 (0.0%) |
| Total | 117 (1.8%) | 14 (1.8%) |
Race in Goochland County
The most populous races in Goochland County are White / Caucasian (19,629 | 78.8%), Black / African American (3,602 | 14.5%), and Hispanic or Latino (809 | 3.3%).
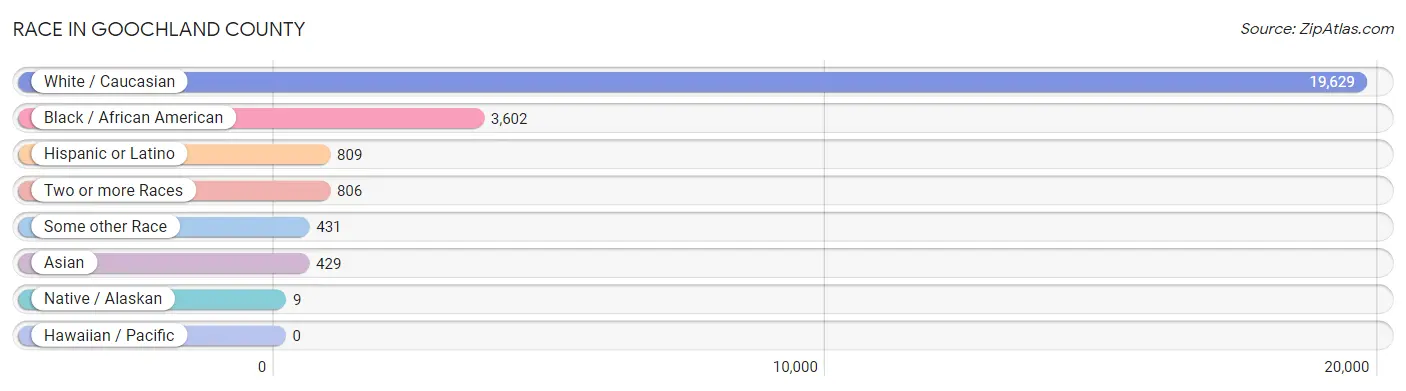
| Race | # Population | % Population |
| Asian | 429 | 1.7% |
| Black / African American | 3,602 | 14.5% |
| Hawaiian / Pacific | 0 | 0.0% |
| Hispanic or Latino | 809 | 3.3% |
| Native / Alaskan | 9 | 0.0% |
| White / Caucasian | 19,629 | 78.8% |
| Two or more Races | 806 | 3.2% |
| Some other Race | 431 | 1.7% |
| Total | 24,906 | 100.0% |
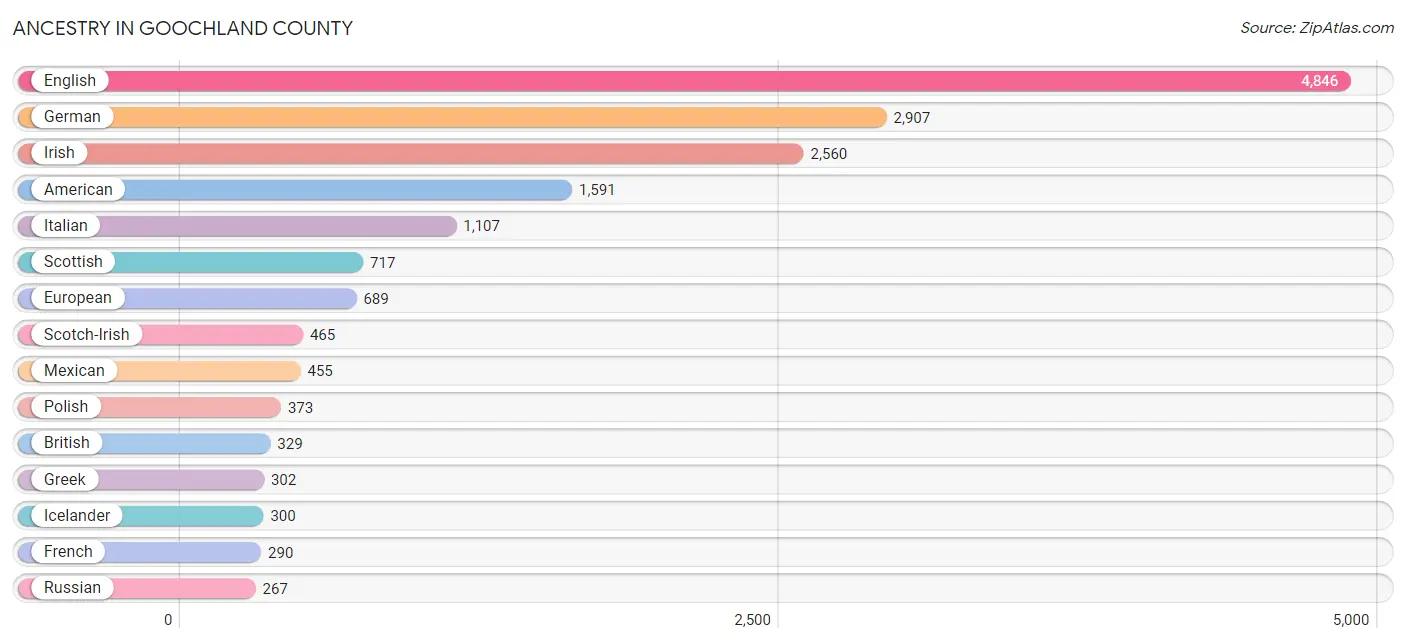
Ancestry in Goochland County
The most populous ancestries reported in Goochland County are English (4,846 | 19.5%), German (2,907 | 11.7%), Irish (2,560 | 10.3%), American (1,591 | 6.4%), and Italian (1,107 | 4.4%), together accounting for 52.2% of all Goochland County residents.
| Ancestry | # Population | % Population |
| African | 109 | 0.4% |
| American | 1,591 | 6.4% |
| Apache | 13 | 0.1% |
| Arab | 36 | 0.1% |
| Armenian | 13 | 0.1% |
| Austrian | 33 | 0.1% |
| Belgian | 12 | 0.1% |
| Bhutanese | 27 | 0.1% |
| Brazilian | 19 | 0.1% |
| British | 329 | 1.3% |
| Burmese | 20 | 0.1% |
| Central American | 27 | 0.1% |
| Colombian | 88 | 0.4% |
| Cuban | 22 | 0.1% |
| Czech | 97 | 0.4% |
| Czechoslovakian | 38 | 0.2% |
| Danish | 31 | 0.1% |
| Dominican | 6 | 0.0% |
| Dutch | 125 | 0.5% |
| Eastern European | 179 | 0.7% |
| English | 4,846 | 19.5% |
| Ethiopian | 3 | 0.0% |
| European | 689 | 2.8% |
| Finnish | 32 | 0.1% |
| French | 290 | 1.2% |
| French Canadian | 14 | 0.1% |
| German | 2,907 | 11.7% |
| Greek | 302 | 1.2% |
| Haitian | 2 | 0.0% |
| Hungarian | 106 | 0.4% |
| Icelander | 300 | 1.2% |
| Indian (Asian) | 85 | 0.3% |
| Inupiat | 5 | 0.0% |
| Iranian | 13 | 0.1% |
| Irish | 2,560 | 10.3% |
| Italian | 1,107 | 4.4% |
| Jamaican | 33 | 0.1% |
| Kenyan | 5 | 0.0% |
| Korean | 102 | 0.4% |
| Lebanese | 36 | 0.1% |
| Lithuanian | 54 | 0.2% |
| Mexican | 455 | 1.8% |
| Mongolian | 22 | 0.1% |
| Northern European | 14 | 0.1% |
| Norwegian | 67 | 0.3% |
| Pakistani | 19 | 0.1% |
| Polish | 373 | 1.5% |
| Portuguese | 93 | 0.4% |
| Puerto Rican | 141 | 0.6% |
| Romanian | 13 | 0.1% |
| Russian | 267 | 1.1% |
| Salvadoran | 27 | 0.1% |
| Scandinavian | 87 | 0.4% |
| Scotch-Irish | 465 | 1.9% |
| Scottish | 717 | 2.9% |
| Serbian | 64 | 0.3% |
| Slovak | 49 | 0.2% |
| South American | 88 | 0.4% |
| Spaniard | 13 | 0.1% |
| Sri Lankan | 266 | 1.1% |
| Subsaharan African | 117 | 0.5% |
| Swedish | 254 | 1.0% |
| Swiss | 9 | 0.0% |
| Thai | 74 | 0.3% |
| Ukrainian | 19 | 0.1% |
| Welsh | 168 | 0.7% |
| West Indian | 12 | 0.1% |
| Yugoslavian | 8 | 0.0% | View All 68 Rows |
Immigrants in Goochland County
The most numerous immigrant groups reported in Goochland County came from Europe (327 | 1.3%), Northern Europe (239 | 1.0%), Asia (230 | 0.9%), Latin America (227 | 0.9%), and South Eastern Asia (142 | 0.6%), together accounting for 4.7% of all Goochland County residents.
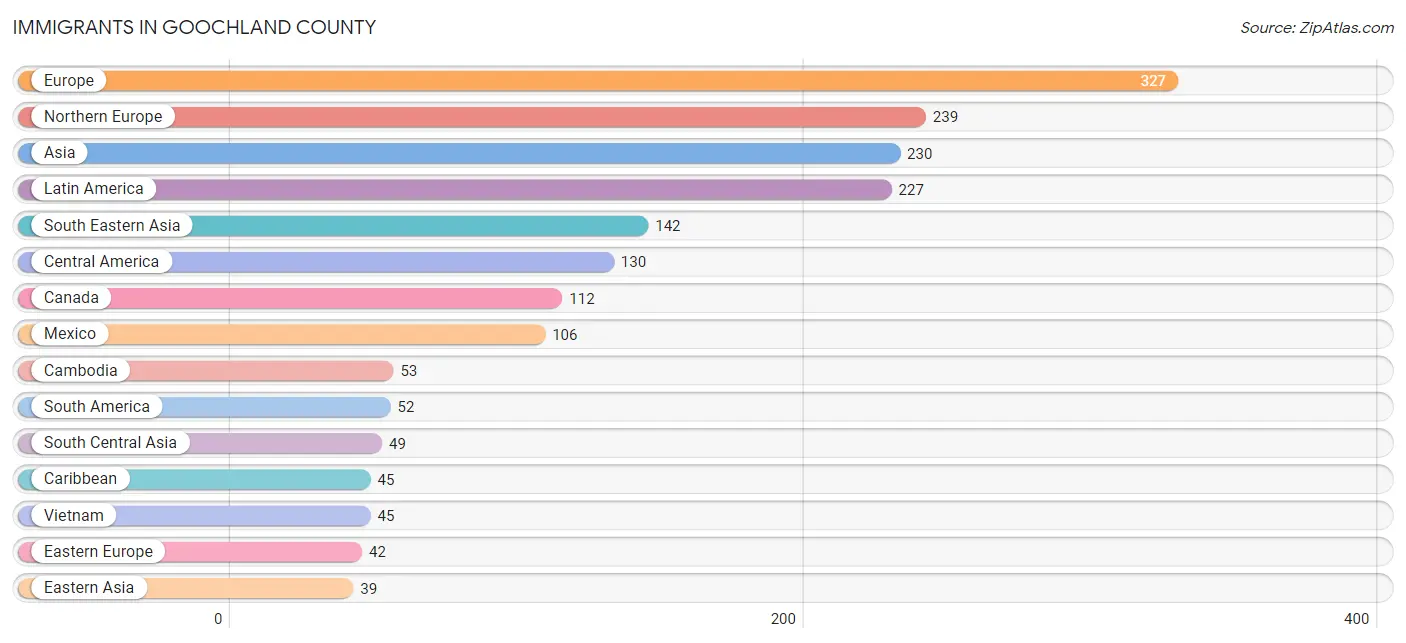
| Immigration Origin | # Population | % Population |
| Africa | 12 | 0.1% |
| Asia | 230 | 0.9% |
| Brazil | 27 | 0.1% |
| Cambodia | 53 | 0.2% |
| Canada | 112 | 0.4% |
| Caribbean | 45 | 0.2% |
| Central America | 130 | 0.5% |
| China | 19 | 0.1% |
| Colombia | 25 | 0.1% |
| Eastern Africa | 12 | 0.1% |
| Eastern Asia | 39 | 0.2% |
| Eastern Europe | 42 | 0.2% |
| El Salvador | 24 | 0.1% |
| England | 20 | 0.1% |
| Europe | 327 | 1.3% |
| Germany | 16 | 0.1% |
| India | 36 | 0.1% |
| Iran | 13 | 0.1% |
| Jamaica | 33 | 0.1% |
| Kenya | 12 | 0.1% |
| Korea | 20 | 0.1% |
| Latin America | 227 | 0.9% |
| Lithuania | 16 | 0.1% |
| Malaysia | 25 | 0.1% |
| Mexico | 106 | 0.4% |
| Northern Europe | 239 | 1.0% |
| Russia | 26 | 0.1% |
| Scotland | 24 | 0.1% |
| South America | 52 | 0.2% |
| South Central Asia | 49 | 0.2% |
| South Eastern Asia | 142 | 0.6% |
| Southern Europe | 10 | 0.0% |
| Spain | 10 | 0.0% |
| Switzerland | 20 | 0.1% |
| Thailand | 19 | 0.1% |
| Trinidad and Tobago | 12 | 0.1% |
| Vietnam | 45 | 0.2% |
| Western Europe | 36 | 0.1% | View All 38 Rows |
Sex and Age in Goochland County
Sex and Age in Goochland County
The most populous age groups in Goochland County are 55 to 59 Years (1,166 | 9.4%) for men and 55 to 59 Years (1,168 | 9.3%) for women.
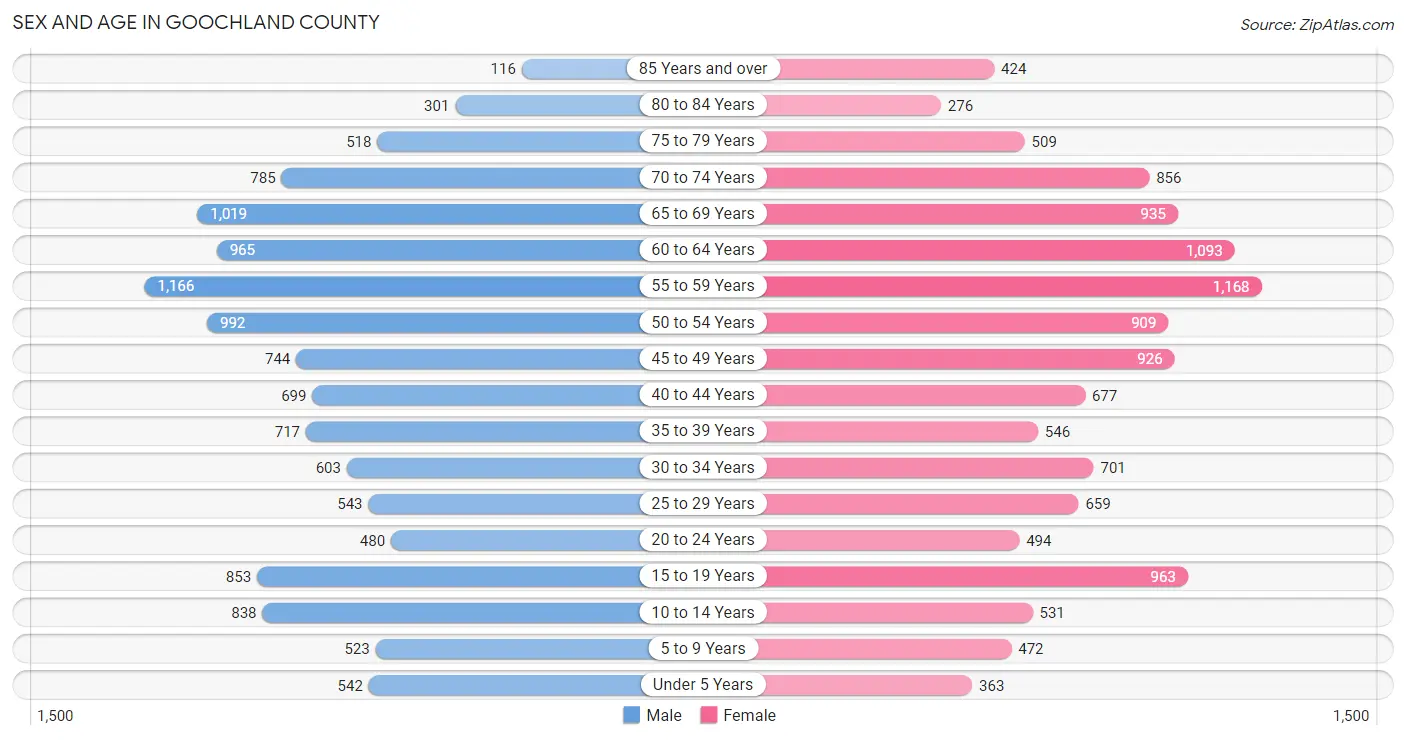
| Age Bracket | Male | Female |
| Under 5 Years | 542 (4.4%) | 363 (2.9%) |
| 5 to 9 Years | 523 (4.2%) | 472 (3.8%) |
| 10 to 14 Years | 838 (6.8%) | 531 (4.3%) |
| 15 to 19 Years | 853 (6.9%) | 963 (7.7%) |
| 20 to 24 Years | 480 (3.9%) | 494 (4.0%) |
| 25 to 29 Years | 543 (4.4%) | 659 (5.3%) |
| 30 to 34 Years | 603 (4.9%) | 701 (5.6%) |
| 35 to 39 Years | 717 (5.8%) | 546 (4.4%) |
| 40 to 44 Years | 699 (5.6%) | 677 (5.4%) |
| 45 to 49 Years | 744 (6.0%) | 926 (7.4%) |
| 50 to 54 Years | 992 (8.0%) | 909 (7.3%) |
| 55 to 59 Years | 1,166 (9.4%) | 1,168 (9.3%) |
| 60 to 64 Years | 965 (7.8%) | 1,093 (8.7%) |
| 65 to 69 Years | 1,019 (8.2%) | 935 (7.5%) |
| 70 to 74 Years | 785 (6.3%) | 856 (6.9%) |
| 75 to 79 Years | 518 (4.2%) | 509 (4.1%) |
| 80 to 84 Years | 301 (2.4%) | 276 (2.2%) |
| 85 Years and over | 116 (0.9%) | 424 (3.4%) |
| Total | 12,404 (100.0%) | 12,502 (100.0%) |
Families and Households in Goochland County
Median Family Size in Goochland County
The median family size in Goochland County is 2.89 persons per family, with single female/mother families (605 | 8.5%) accounting for the largest median family size of 3.27 persons per family. On the other hand, single male/father families (173 | 2.4%) represent the smallest median family size with 2.71 persons per family.
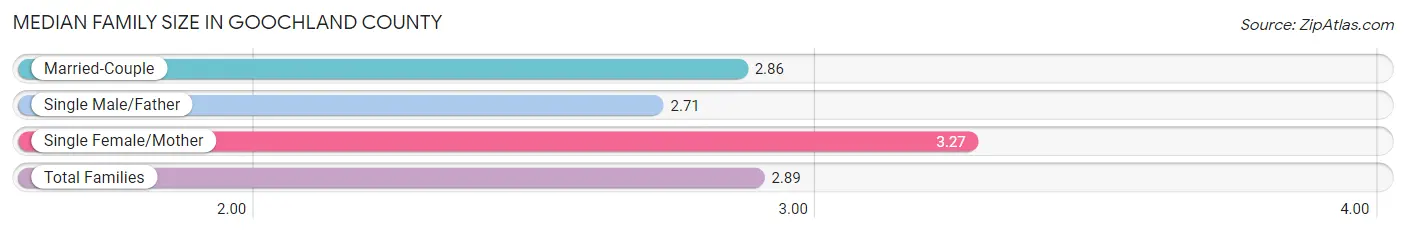
| Family Type | # Families | Family Size |
| Married-Couple | 6,322 (89.0%) | 2.86 |
| Single Male/Father | 173 (2.4%) | 2.71 |
| Single Female/Mother | 605 (8.5%) | 3.27 |
| Total Families | 7,100 (100.0%) | 2.89 |
Median Household Size in Goochland County
The median household size in Goochland County is 2.44 persons per household, with single female/mother households (605 | 6.2%) accounting for the largest median household size of 3.38 persons per household. non-family households (2,688 | 27.5%) represent the smallest median household size with 1.17 persons per household.
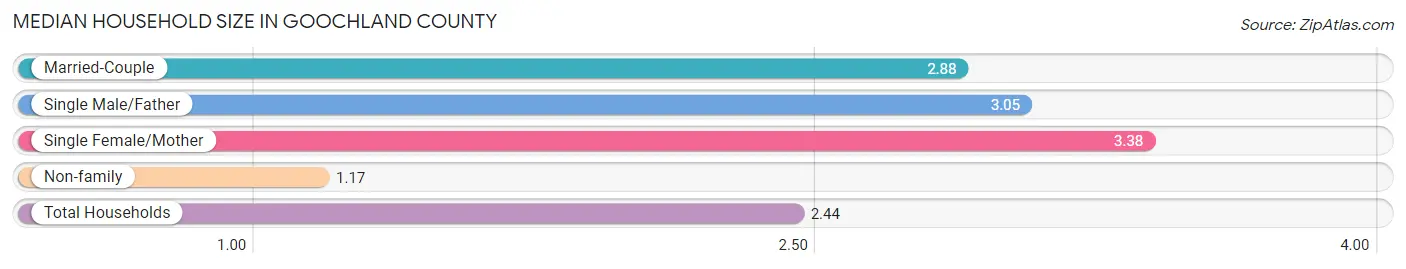
| Household Type | # Households | Household Size |
| Married-Couple | 6,322 (64.6%) | 2.88 |
| Single Male/Father | 173 (1.8%) | 3.05 |
| Single Female/Mother | 605 (6.2%) | 3.38 |
| Non-family | 2,688 (27.5%) | 1.17 |
| Total Households | 9,788 (100.0%) | 2.44 |
Household Size by Marriage Status in Goochland County
Out of a total of 9,788 households in Goochland County, 7,100 (72.5%) are family households, while 2,688 (27.5%) are nonfamily households. The most numerous type of family households are 2-person households, comprising 4,151, and the most common type of nonfamily households are 1-person households, comprising 2,311.
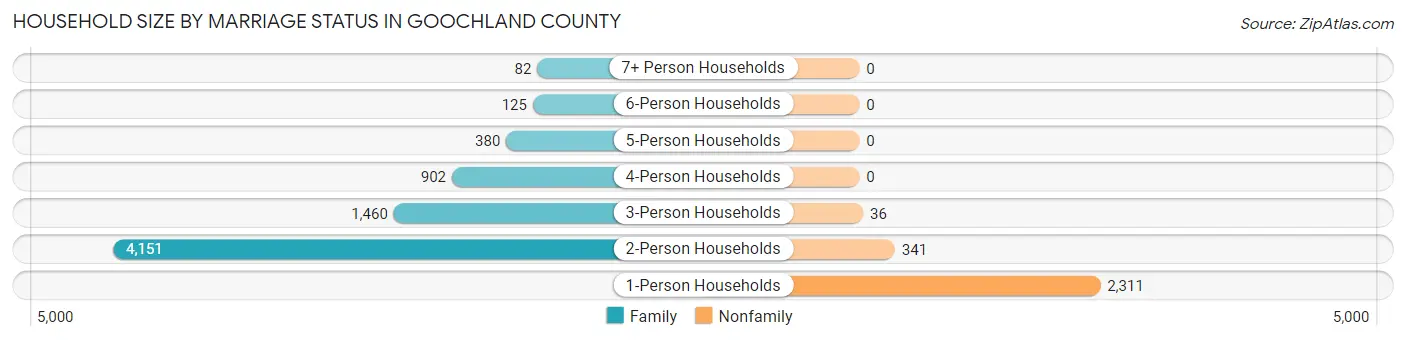
| Household Size | Family Households | Nonfamily Households |
| 1-Person Households | - | 2,311 (23.6%) |
| 2-Person Households | 4,151 (42.4%) | 341 (3.5%) |
| 3-Person Households | 1,460 (14.9%) | 36 (0.4%) |
| 4-Person Households | 902 (9.2%) | 0 (0.0%) |
| 5-Person Households | 380 (3.9%) | 0 (0.0%) |
| 6-Person Households | 125 (1.3%) | 0 (0.0%) |
| 7+ Person Households | 82 (0.8%) | 0 (0.0%) |
| Total | 7,100 (72.5%) | 2,688 (27.5%) |
Female Fertility in Goochland County
Fertility by Age in Goochland County
Average fertility rate in Goochland County is 50.0 births per 1,000 women. Women in the age bracket of 20 to 34 years have the highest fertility rate with 121.0 births per 1,000 women. Women in the age bracket of 20 to 34 years acount for 89.2% of all women with births.
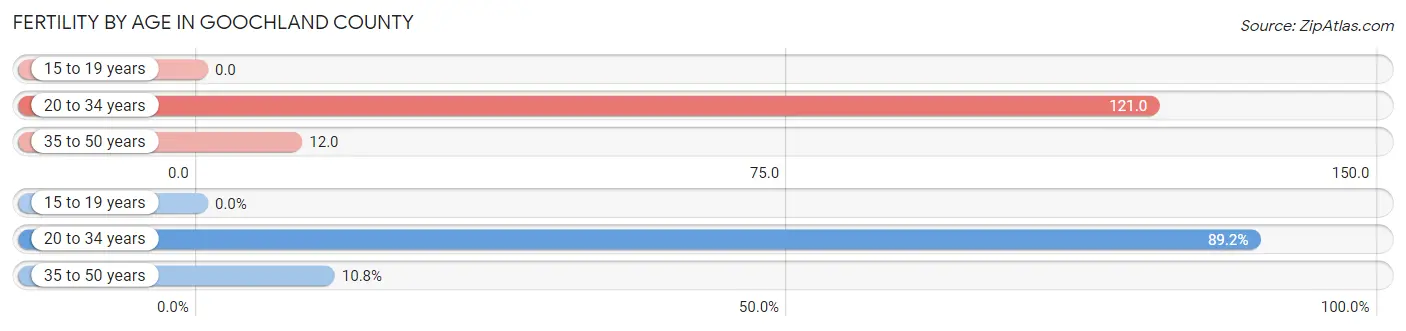
| Age Bracket | Women with Births | Births / 1,000 Women |
| 15 to 19 years | 0 (0.0%) | 0.0 |
| 20 to 34 years | 224 (89.2%) | 121.0 |
| 35 to 50 years | 27 (10.8%) | 12.0 |
| Total | 251 (100.0%) | 50.0 |
Fertility by Age by Marriage Status in Goochland County
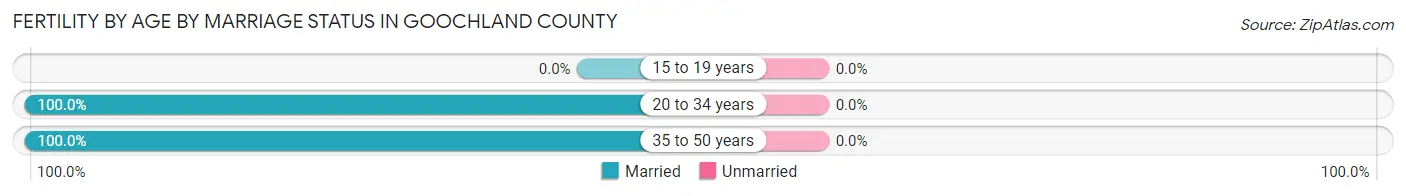
| Age Bracket | Married | Unmarried |
| 15 to 19 years | 0 (0.0%) | 0 (0.0%) |
| 20 to 34 years | 224 (100.0%) | 0 (0.0%) |
| 35 to 50 years | 27 (100.0%) | 0 (0.0%) |
| Total | 251 (100.0%) | 0 (0.0%) |
Fertility by Education in Goochland County
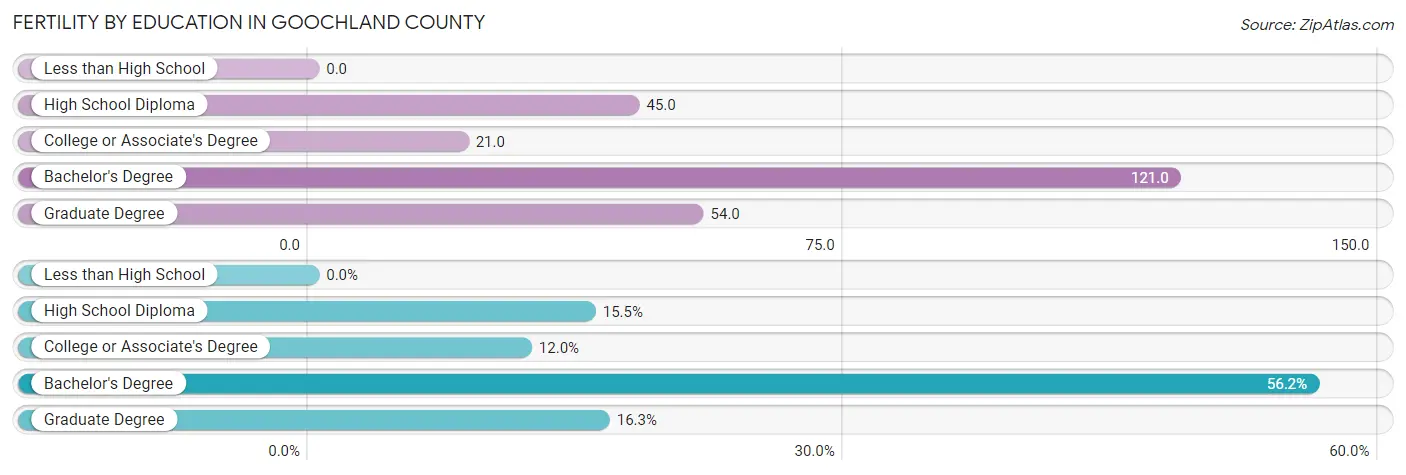
| Educational Attainment | Women with Births | Births / 1,000 Women |
| Less than High School | 0 (0.0%) | 0.0 |
| High School Diploma | 39 (15.5%) | 45.0 |
| College or Associate's Degree | 30 (11.9%) | 21.0 |
| Bachelor's Degree | 141 (56.2%) | 121.0 |
| Graduate Degree | 41 (16.3%) | 54.0 |
| Total | 251 (100.0%) | 50.0 |
Fertility by Education by Marriage Status in Goochland County
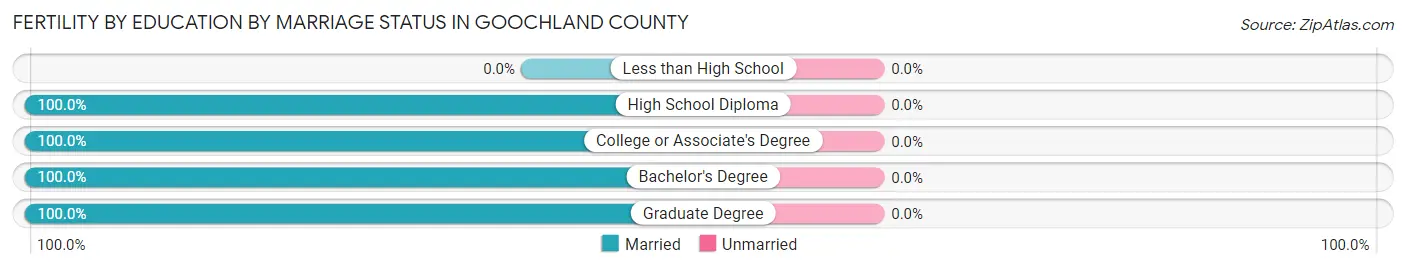
| Educational Attainment | Married | Unmarried |
| Less than High School | 0 (0.0%) | 0 (0.0%) |
| High School Diploma | 39 (100.0%) | 0 (0.0%) |
| College or Associate's Degree | 30 (100.0%) | 0 (0.0%) |
| Bachelor's Degree | 141 (100.0%) | 0 (0.0%) |
| Graduate Degree | 41 (100.0%) | 0 (0.0%) |
| Total | 251 (100.0%) | 0 (0.0%) |
Employment Characteristics in Goochland County
Employment by Class of Employer in Goochland County
Among the 11,326 employed individuals in Goochland County, private company employees (6,968 | 61.5%), not-for-profit organizations (1,183 | 10.4%), and self-employed (not incorporated) (1,036 | 9.1%) make up the most common classes of employment.
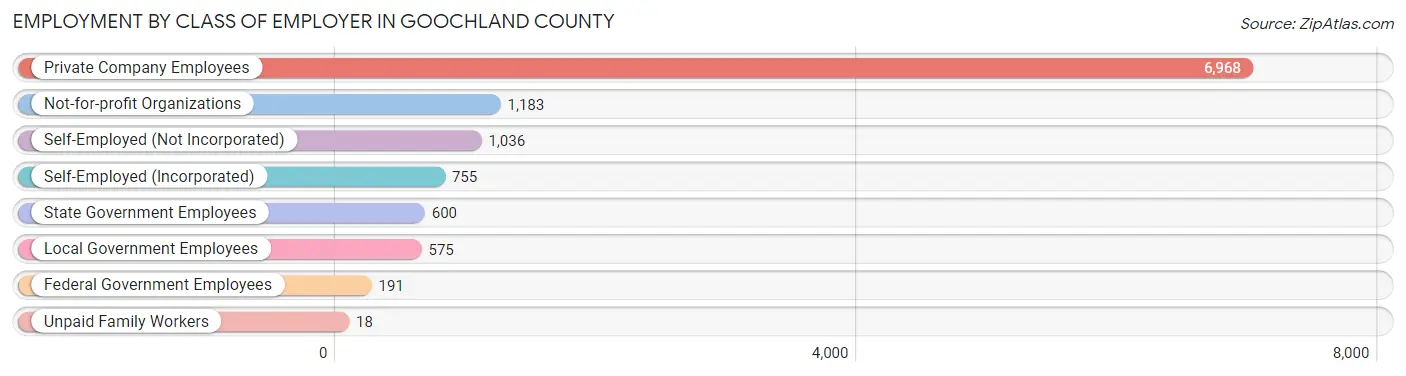
| Employer Class | # Employees | % Employees |
| Private Company Employees | 6,968 | 61.5% |
| Self-Employed (Incorporated) | 755 | 6.7% |
| Self-Employed (Not Incorporated) | 1,036 | 9.1% |
| Not-for-profit Organizations | 1,183 | 10.4% |
| Local Government Employees | 575 | 5.1% |
| State Government Employees | 600 | 5.3% |
| Federal Government Employees | 191 | 1.7% |
| Unpaid Family Workers | 18 | 0.2% |
| Total | 11,326 | 100.0% |
Employment Status by Age in Goochland County
According to the labor force statistics for Goochland County, out of the total population over 16 years of age (21,327), 56.2% or 11,986 individuals are in the labor force, with 2.4% or 288 of them unemployed. The age group with the highest labor force participation rate is 45 to 54 years, with 84.9% or 3,032 individuals in the labor force. Within the labor force, the 16 to 19 years age range has the highest percentage of unemployed individuals, with 9.7% or 49 of them being unemployed.
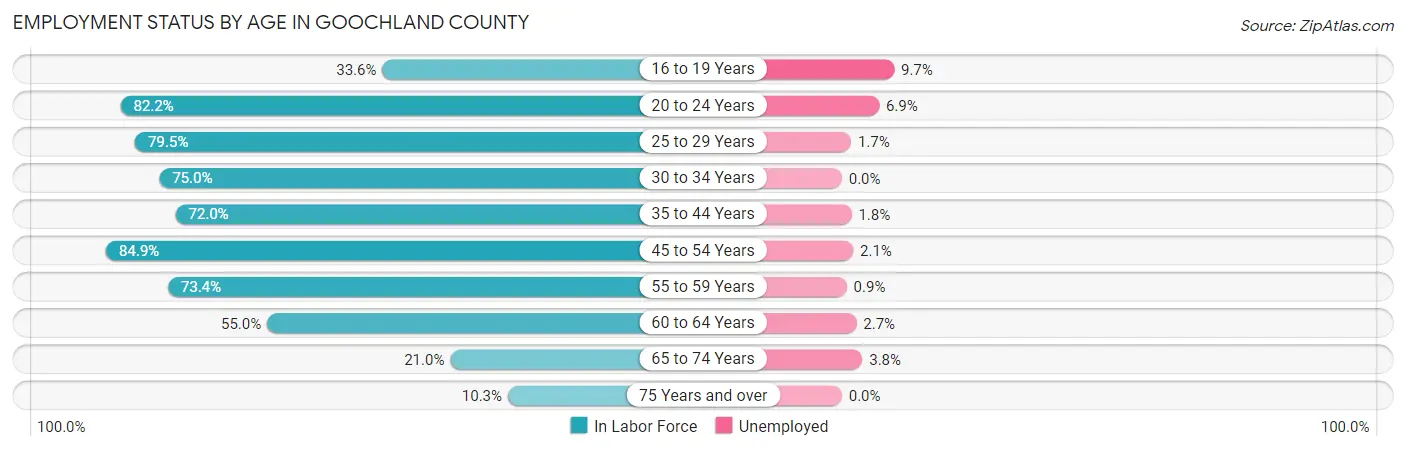
| Age Bracket | In Labor Force | Unemployed |
| 16 to 19 Years | 506 (33.6%) | 49 (9.7%) |
| 20 to 24 Years | 801 (82.2%) | 55 (6.9%) |
| 25 to 29 Years | 956 (79.5%) | 16 (1.7%) |
| 30 to 34 Years | 978 (75.0%) | 0 (0.0%) |
| 35 to 44 Years | 1,900 (72.0%) | 34 (1.8%) |
| 45 to 54 Years | 3,032 (84.9%) | 64 (2.1%) |
| 55 to 59 Years | 1,713 (73.4%) | 15 (0.9%) |
| 60 to 64 Years | 1,132 (55.0%) | 31 (2.7%) |
| 65 to 74 Years | 755 (21.0%) | 29 (3.8%) |
| 75 Years and over | 221 (10.3%) | 0 (0.0%) |
| Total | 11,986 (56.2%) | 288 (2.4%) |
Employment Status by Educational Attainment in Goochland County
According to labor force statistics for Goochland County, 74.1% of individuals (9,713) out of the total population between 25 and 64 years of age (13,108) are in the labor force, with 1.6% or 155 of them being unemployed. The group with the highest labor force participation rate are those with the educational attainment of bachelor's degree or higher, with 85.5% or 5,107 individuals in the labor force. Within the labor force, individuals with bachelor's degree or higher education have the highest percentage of unemployment, with 2.7% or 138 of them being unemployed.
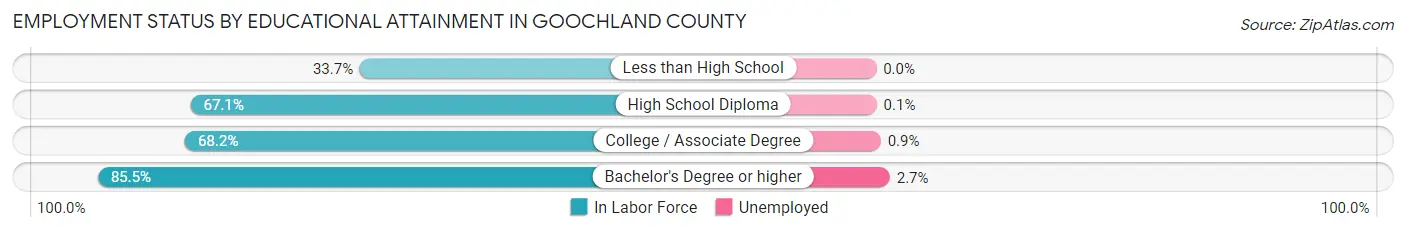
| Educational Attainment | In Labor Force | Unemployed |
| Less than High School | 221 (33.7%) | 0 (0.0%) |
| High School Diploma | 2,075 (67.1%) | 3 (0.1%) |
| College / Associate Degree | 2,309 (68.2%) | 30 (0.9%) |
| Bachelor's Degree or higher | 5,107 (85.5%) | 161 (2.7%) |
| Total | 9,713 (74.1%) | 210 (1.6%) |
Employment Occupations by Sex in Goochland County
Management, Business, Science and Arts Occupations
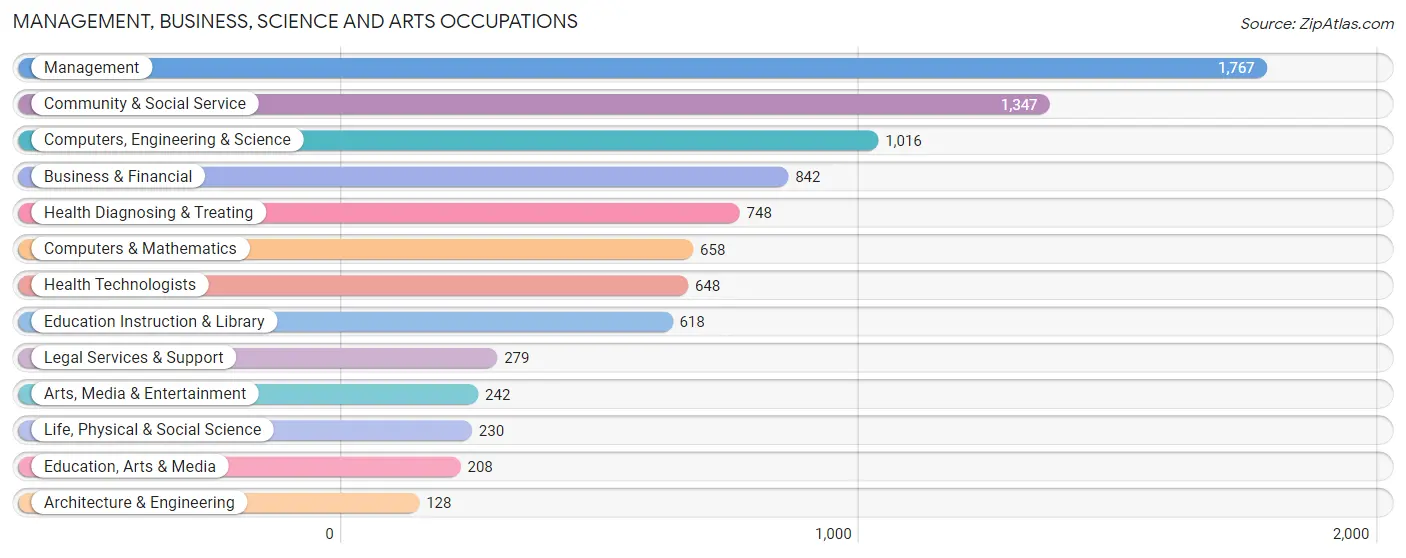
The most common Management, Business, Science and Arts occupations in Goochland County are Management (1,767 | 15.1%), Community & Social Service (1,347 | 11.5%), Computers, Engineering & Science (1,016 | 8.7%), Business & Financial (842 | 7.2%), and Health Diagnosing & Treating (748 | 6.4%).
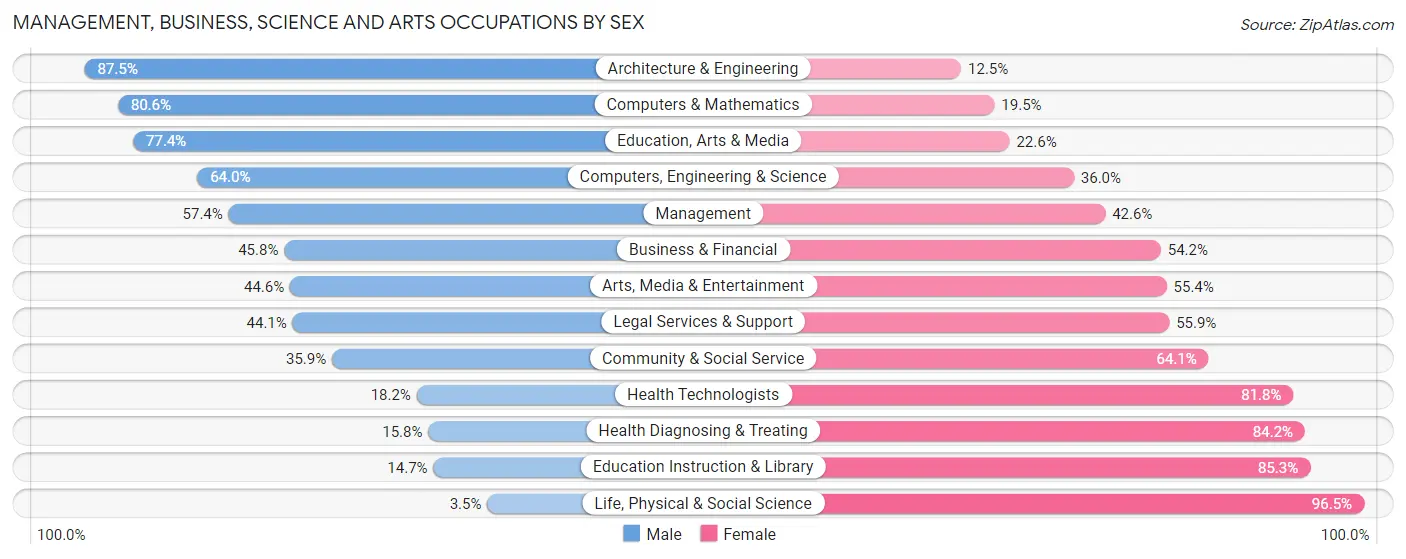
Management, Business, Science and Arts Occupations by Sex
Within the Management, Business, Science and Arts occupations in Goochland County, the most male-oriented occupations are Architecture & Engineering (87.5%), Computers & Mathematics (80.5%), and Education, Arts & Media (77.4%), while the most female-oriented occupations are Life, Physical & Social Science (96.5%), Education Instruction & Library (85.3%), and Health Diagnosing & Treating (84.2%).
| Occupation | Male | Female |
| Management | 1,015 (57.4%) | 752 (42.6%) |
| Business & Financial | 386 (45.8%) | 456 (54.2%) |
| Computers, Engineering & Science | 650 (64.0%) | 366 (36.0%) |
| Computers & Mathematics | 530 (80.5%) | 128 (19.5%) |
| Architecture & Engineering | 112 (87.5%) | 16 (12.5%) |
| Life, Physical & Social Science | 8 (3.5%) | 222 (96.5%) |
| Community & Social Service | 483 (35.9%) | 864 (64.1%) |
| Education, Arts & Media | 161 (77.4%) | 47 (22.6%) |
| Legal Services & Support | 123 (44.1%) | 156 (55.9%) |
| Education Instruction & Library | 91 (14.7%) | 527 (85.3%) |
| Arts, Media & Entertainment | 108 (44.6%) | 134 (55.4%) |
| Health Diagnosing & Treating | 118 (15.8%) | 630 (84.2%) |
| Health Technologists | 118 (18.2%) | 530 (81.8%) |
| Total (Category) | 2,652 (46.4%) | 3,068 (53.6%) |
| Total (Overall) | 5,905 (50.6%) | 5,775 (49.4%) |
Services Occupations
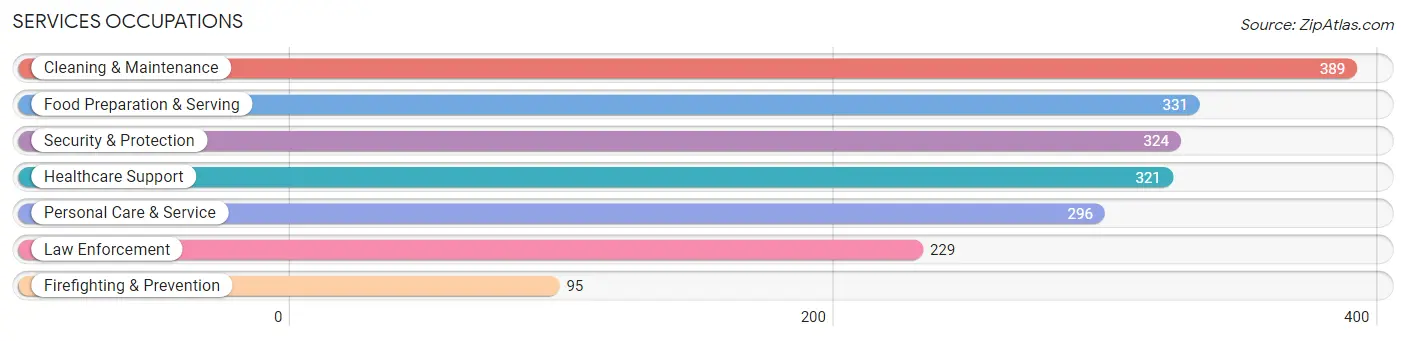
The most common Services occupations in Goochland County are Cleaning & Maintenance (389 | 3.3%), Food Preparation & Serving (331 | 2.8%), Security & Protection (324 | 2.8%), Healthcare Support (321 | 2.8%), and Personal Care & Service (296 | 2.5%).
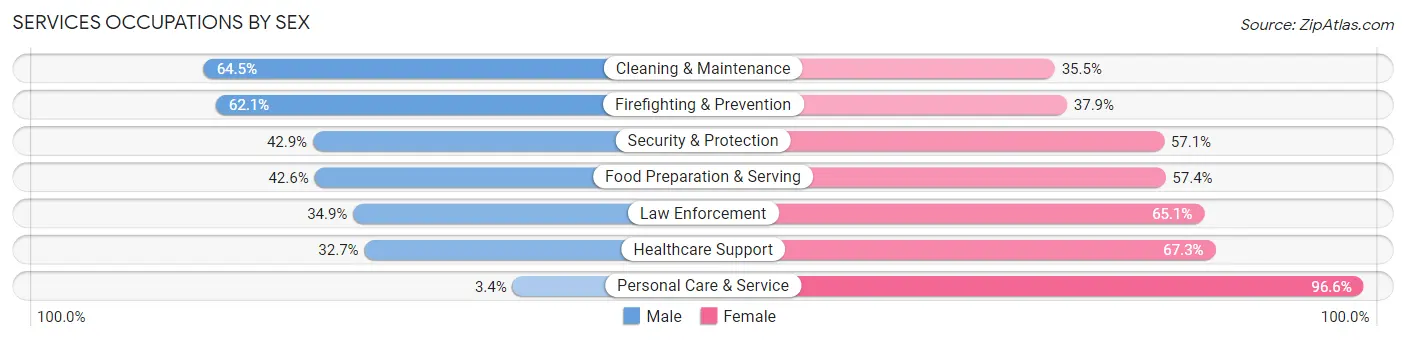
Services Occupations by Sex
Within the Services occupations in Goochland County, the most male-oriented occupations are Cleaning & Maintenance (64.5%), Firefighting & Prevention (62.1%), and Security & Protection (42.9%), while the most female-oriented occupations are Personal Care & Service (96.6%), Healthcare Support (67.3%), and Law Enforcement (65.1%).
| Occupation | Male | Female |
| Healthcare Support | 105 (32.7%) | 216 (67.3%) |
| Security & Protection | 139 (42.9%) | 185 (57.1%) |
| Firefighting & Prevention | 59 (62.1%) | 36 (37.9%) |
| Law Enforcement | 80 (34.9%) | 149 (65.1%) |
| Food Preparation & Serving | 141 (42.6%) | 190 (57.4%) |
| Cleaning & Maintenance | 251 (64.5%) | 138 (35.5%) |
| Personal Care & Service | 10 (3.4%) | 286 (96.6%) |
| Total (Category) | 646 (38.9%) | 1,015 (61.1%) |
| Total (Overall) | 5,905 (50.6%) | 5,775 (49.4%) |
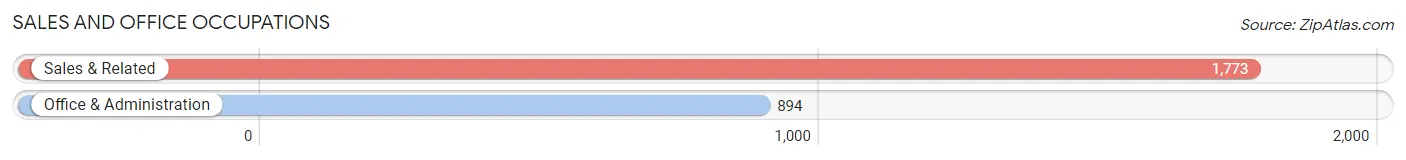
Sales and Office Occupations
The most common Sales and Office occupations in Goochland County are Sales & Related (1,773 | 15.2%), and Office & Administration (894 | 7.6%).
Sales and Office Occupations by Sex
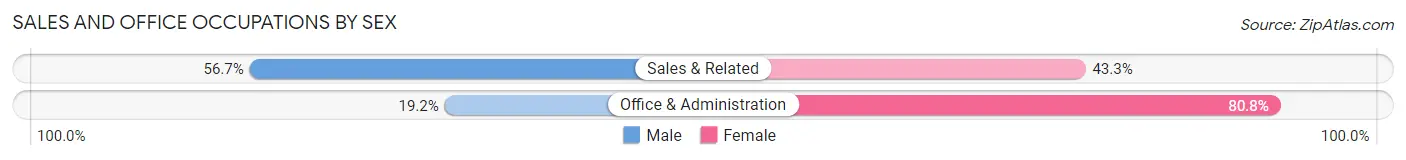
| Occupation | Male | Female |
| Sales & Related | 1,006 (56.7%) | 767 (43.3%) |
| Office & Administration | 172 (19.2%) | 722 (80.8%) |
| Total (Category) | 1,178 (44.2%) | 1,489 (55.8%) |
| Total (Overall) | 5,905 (50.6%) | 5,775 (49.4%) |
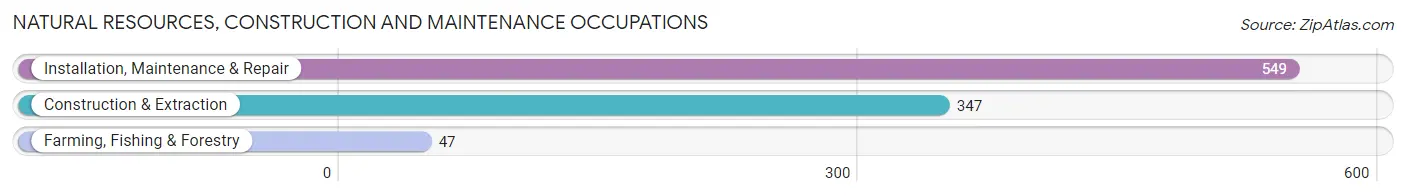
Natural Resources, Construction and Maintenance Occupations
The most common Natural Resources, Construction and Maintenance occupations in Goochland County are Installation, Maintenance & Repair (549 | 4.7%), Construction & Extraction (347 | 3.0%), and Farming, Fishing & Forestry (47 | 0.4%).
Natural Resources, Construction and Maintenance Occupations by Sex
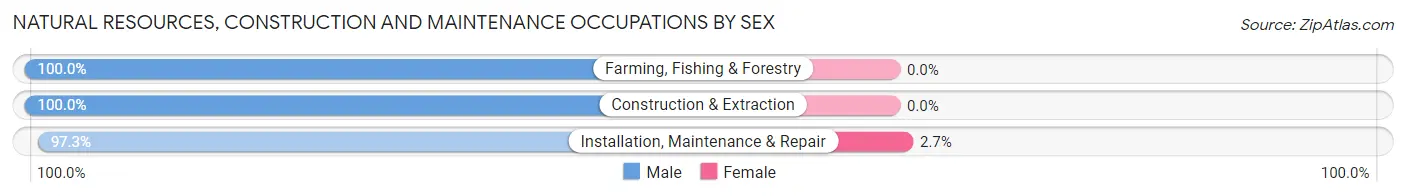
| Occupation | Male | Female |
| Farming, Fishing & Forestry | 47 (100.0%) | 0 (0.0%) |
| Construction & Extraction | 347 (100.0%) | 0 (0.0%) |
| Installation, Maintenance & Repair | 534 (97.3%) | 15 (2.7%) |
| Total (Category) | 928 (98.4%) | 15 (1.6%) |
| Total (Overall) | 5,905 (50.6%) | 5,775 (49.4%) |
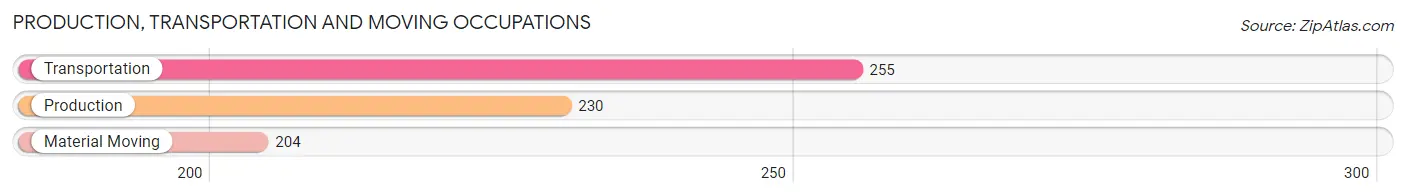
Production, Transportation and Moving Occupations
The most common Production, Transportation and Moving occupations in Goochland County are Transportation (255 | 2.2%), Production (230 | 2.0%), and Material Moving (204 | 1.8%).
Production, Transportation and Moving Occupations by Sex
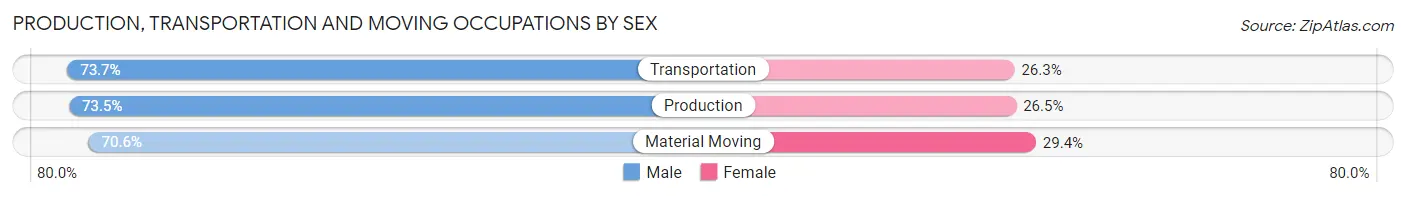
| Occupation | Male | Female |
| Production | 169 (73.5%) | 61 (26.5%) |
| Transportation | 188 (73.7%) | 67 (26.3%) |
| Material Moving | 144 (70.6%) | 60 (29.4%) |
| Total (Category) | 501 (72.7%) | 188 (27.3%) |
| Total (Overall) | 5,905 (50.6%) | 5,775 (49.4%) |
Employment Industries by Sex in Goochland County
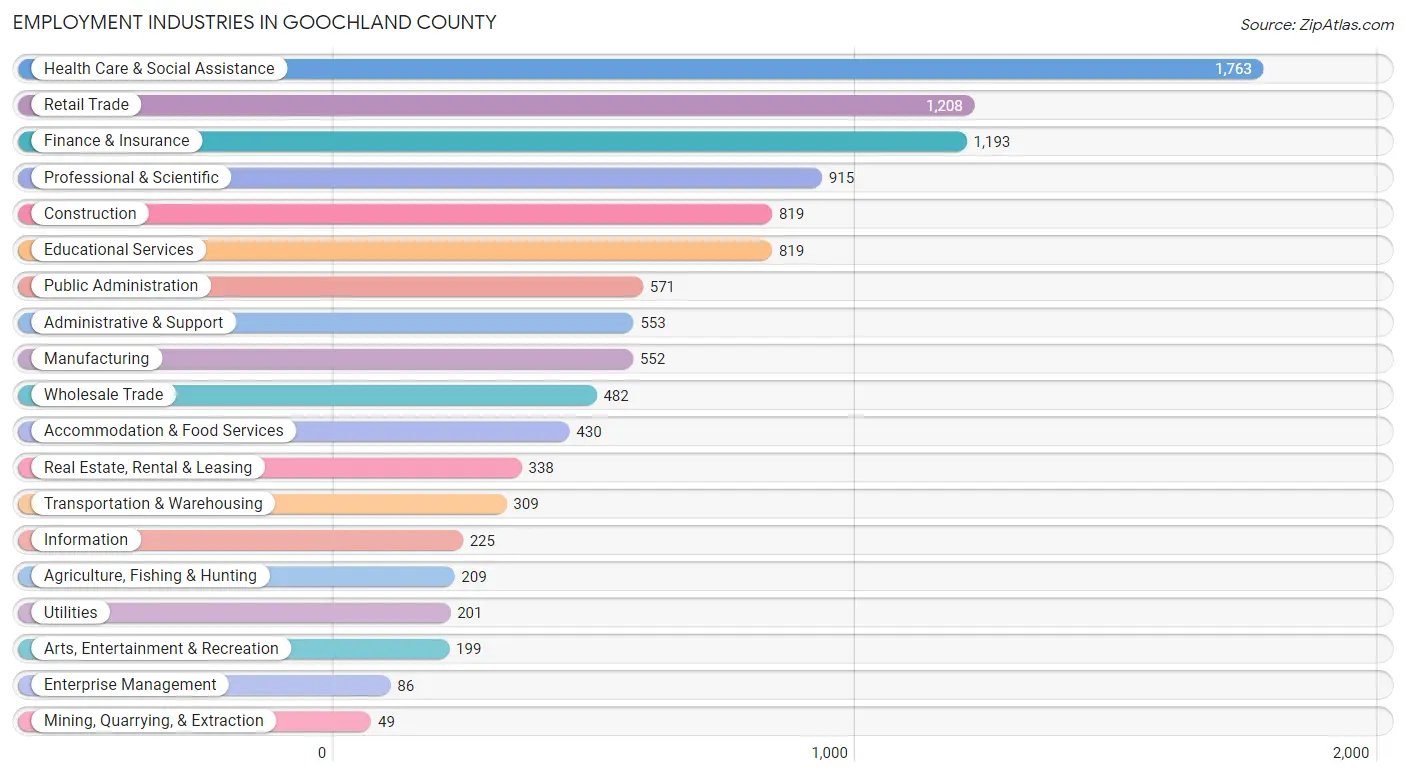
Employment Industries in Goochland County
The major employment industries in Goochland County include Health Care & Social Assistance (1,763 | 15.1%), Retail Trade (1,208 | 10.3%), Finance & Insurance (1,193 | 10.2%), Professional & Scientific (915 | 7.8%), and Construction (819 | 7.0%).
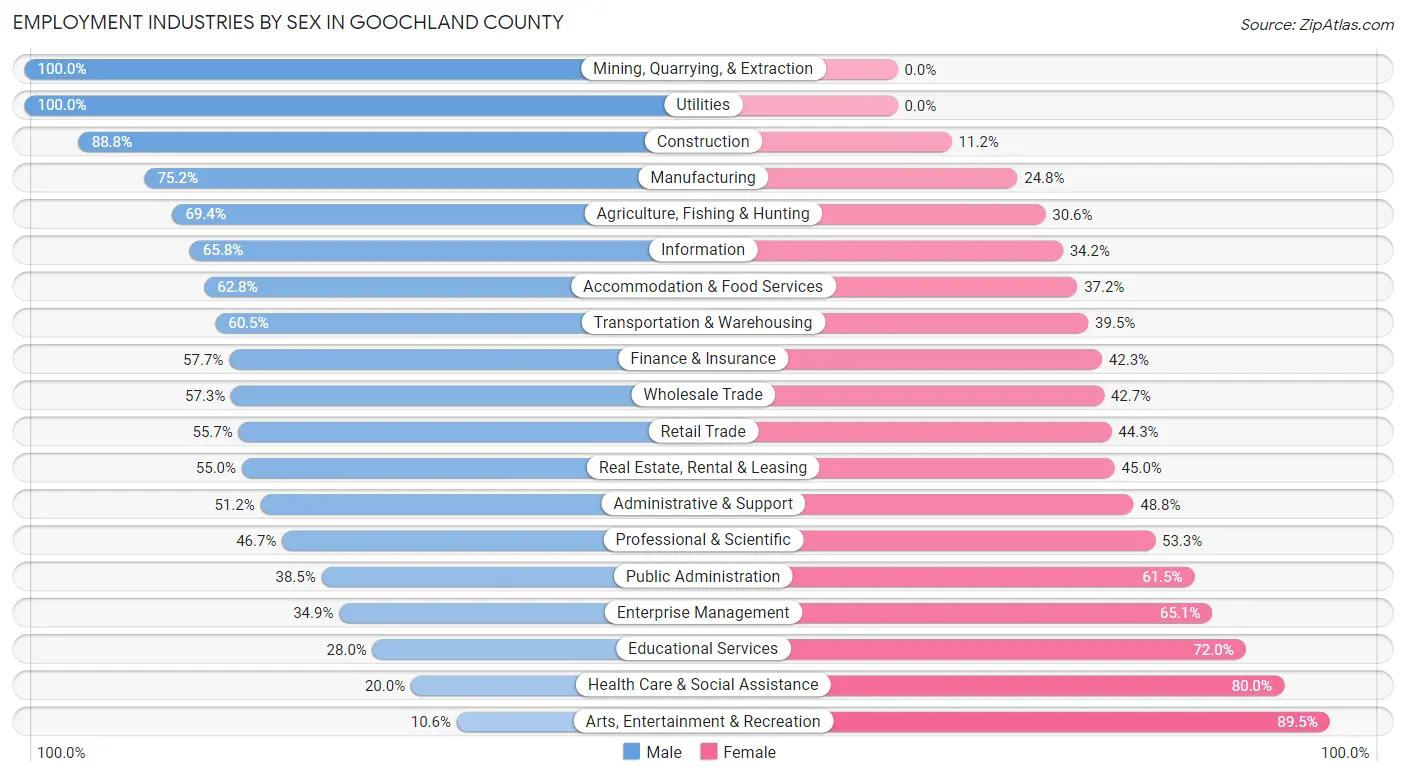
Employment Industries by Sex in Goochland County
The Goochland County industries that see more men than women are Mining, Quarrying, & Extraction (100.0%), Utilities (100.0%), and Construction (88.8%), whereas the industries that tend to have a higher number of women are Arts, Entertainment & Recreation (89.4%), Health Care & Social Assistance (80.0%), and Educational Services (72.0%).
| Industry | Male | Female |
| Agriculture, Fishing & Hunting | 145 (69.4%) | 64 (30.6%) |
| Mining, Quarrying, & Extraction | 49 (100.0%) | 0 (0.0%) |
| Construction | 727 (88.8%) | 92 (11.2%) |
| Manufacturing | 415 (75.2%) | 137 (24.8%) |
| Wholesale Trade | 276 (57.3%) | 206 (42.7%) |
| Retail Trade | 673 (55.7%) | 535 (44.3%) |
| Transportation & Warehousing | 187 (60.5%) | 122 (39.5%) |
| Utilities | 201 (100.0%) | 0 (0.0%) |
| Information | 148 (65.8%) | 77 (34.2%) |
| Finance & Insurance | 688 (57.7%) | 505 (42.3%) |
| Real Estate, Rental & Leasing | 186 (55.0%) | 152 (45.0%) |
| Professional & Scientific | 427 (46.7%) | 488 (53.3%) |
| Enterprise Management | 30 (34.9%) | 56 (65.1%) |
| Administrative & Support | 283 (51.2%) | 270 (48.8%) |
| Educational Services | 229 (28.0%) | 590 (72.0%) |
| Health Care & Social Assistance | 353 (20.0%) | 1,410 (80.0%) |
| Arts, Entertainment & Recreation | 21 (10.5%) | 178 (89.4%) |
| Accommodation & Food Services | 270 (62.8%) | 160 (37.2%) |
| Public Administration | 220 (38.5%) | 351 (61.5%) |
| Total | 5,905 (50.6%) | 5,775 (49.4%) |
Education in Goochland County
School Enrollment in Goochland County
The most common levels of schooling among the 4,616 students in Goochland County are high school (1,426 | 30.9%), middle school (1,072 | 23.2%), and elementary school (877 | 19.0%).
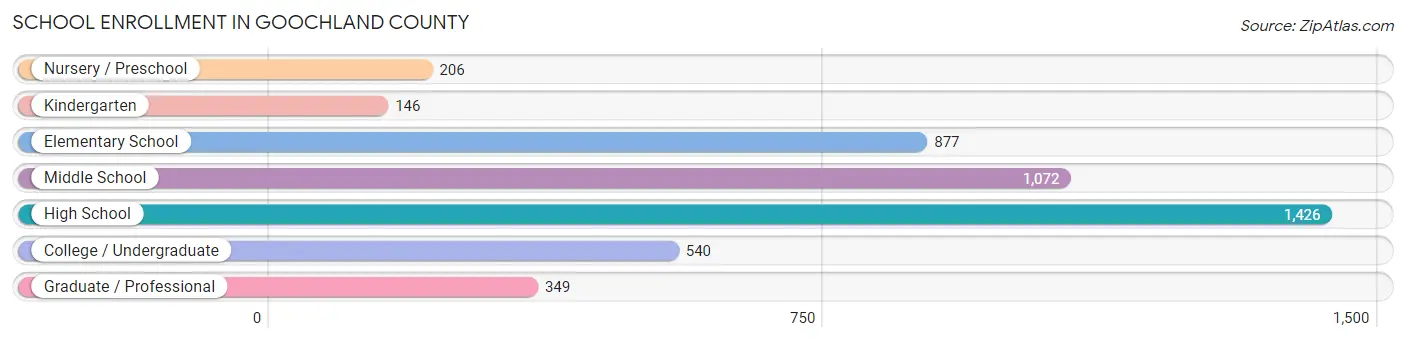
| School Level | # Students | % Students |
| Nursery / Preschool | 206 | 4.5% |
| Kindergarten | 146 | 3.2% |
| Elementary School | 877 | 19.0% |
| Middle School | 1,072 | 23.2% |
| High School | 1,426 | 30.9% |
| College / Undergraduate | 540 | 11.7% |
| Graduate / Professional | 349 | 7.6% |
| Total | 4,616 | 100.0% |
School Enrollment by Age by Funding Source in Goochland County
Out of a total of 4,616 students who are enrolled in schools in Goochland County, 1,011 (21.9%) attend a private institution, while the remaining 3,605 (78.1%) are enrolled in public schools. The age group of 3 to 4 year olds has the highest likelihood of being enrolled in private schools, with 104 (68.0% in the age bracket) enrolled. Conversely, the age group of 5 to 9 year old has the lowest likelihood of being enrolled in a private school, with 743 (86.3% in the age bracket) attending a public institution.
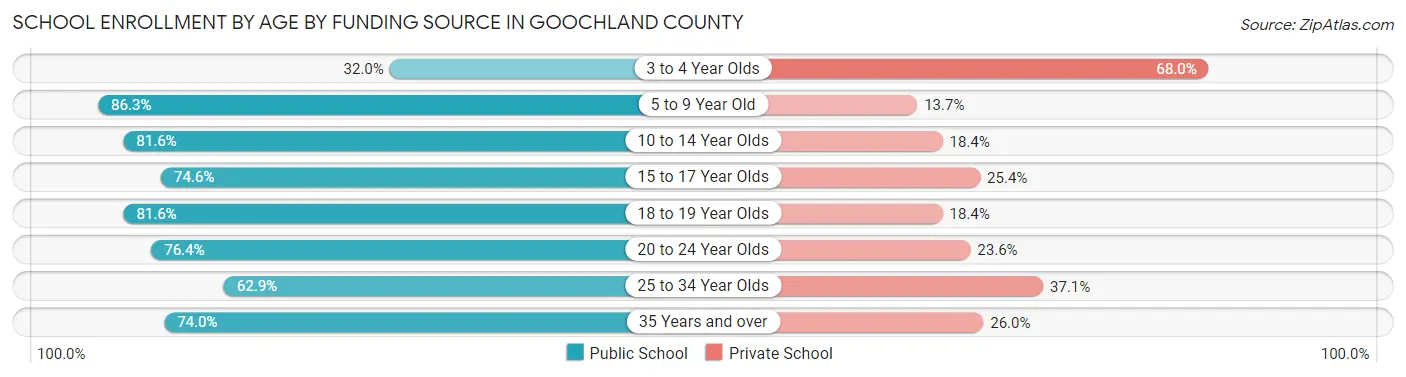
| Age Bracket | Public School | Private School |
| 3 to 4 Year Olds | 49 (32.0%) | 104 (68.0%) |
| 5 to 9 Year Old | 743 (86.3%) | 118 (13.7%) |
| 10 to 14 Year Olds | 1,095 (81.6%) | 247 (18.4%) |
| 15 to 17 Year Olds | 666 (74.6%) | 227 (25.4%) |
| 18 to 19 Year Olds | 580 (81.6%) | 131 (18.4%) |
| 20 to 24 Year Olds | 165 (76.4%) | 51 (23.6%) |
| 25 to 34 Year Olds | 105 (62.9%) | 62 (37.1%) |
| 35 Years and over | 202 (74.0%) | 71 (26.0%) |
| Total | 3,605 (78.1%) | 1,011 (21.9%) |
Educational Attainment by Field of Study in Goochland County
Business (1,908 | 20.9%), education (991 | 10.8%), social sciences (948 | 10.4%), science & technology (831 | 9.1%), and psychology (694 | 7.6%) are the most common fields of study among 9,145 individuals in Goochland County who have obtained a bachelor's degree or higher.
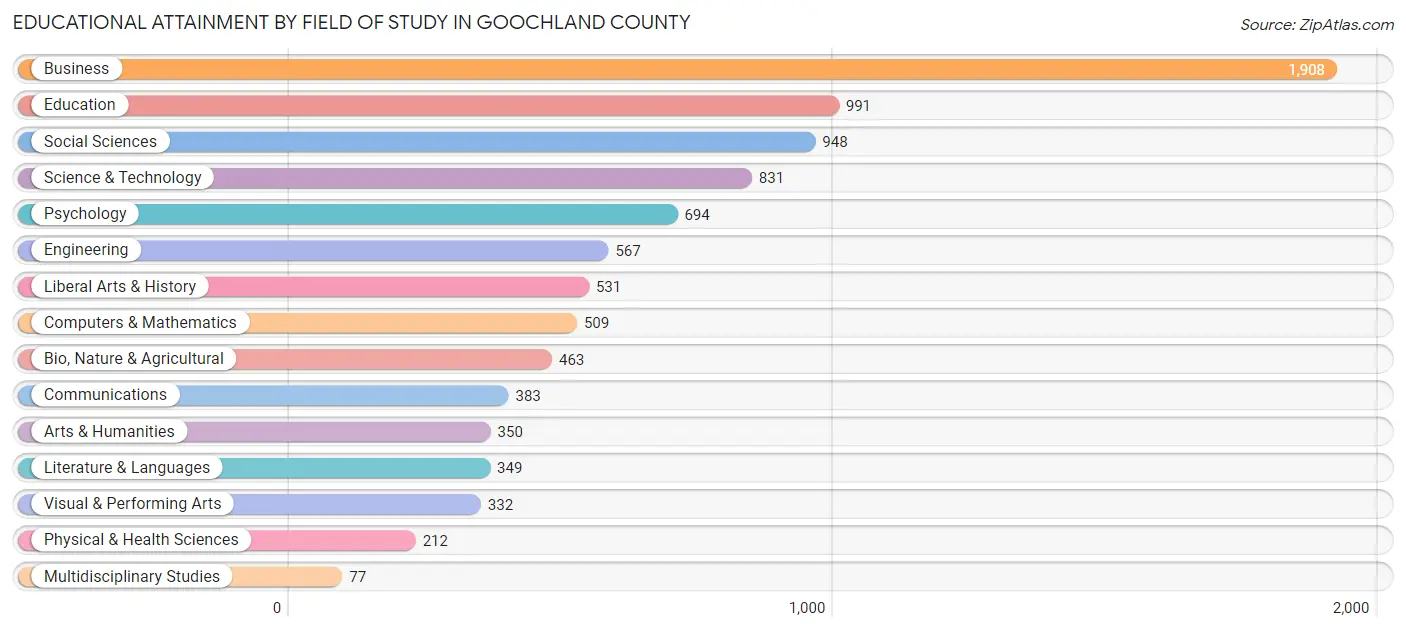
| Field of Study | # Graduates | % Graduates |
| Computers & Mathematics | 509 | 5.6% |
| Bio, Nature & Agricultural | 463 | 5.1% |
| Physical & Health Sciences | 212 | 2.3% |
| Psychology | 694 | 7.6% |
| Social Sciences | 948 | 10.4% |
| Engineering | 567 | 6.2% |
| Multidisciplinary Studies | 77 | 0.8% |
| Science & Technology | 831 | 9.1% |
| Business | 1,908 | 20.9% |
| Education | 991 | 10.8% |
| Literature & Languages | 349 | 3.8% |
| Liberal Arts & History | 531 | 5.8% |
| Visual & Performing Arts | 332 | 3.6% |
| Communications | 383 | 4.2% |
| Arts & Humanities | 350 | 3.8% |
| Total | 9,145 | 100.0% |
Transportation & Commute in Goochland County
Vehicle Availability by Sex in Goochland County
The most prevalent vehicle ownership categories in Goochland County are males with 2 vehicles (2,051, accounting for 35.4%) and females with 2 vehicles (1,792, making up 37.2%).
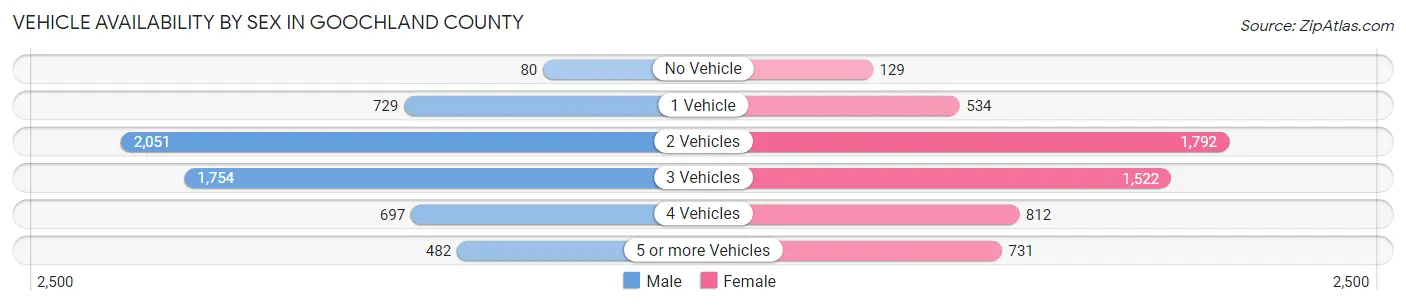
| Vehicles Available | Male | Female |
| No Vehicle | 80 (1.4%) | 129 (2.3%) |
| 1 Vehicle | 729 (12.6%) | 534 (9.7%) |
| 2 Vehicles | 2,051 (35.4%) | 1,792 (32.5%) |
| 3 Vehicles | 1,754 (30.3%) | 1,522 (27.6%) |
| 4 Vehicles | 697 (12.0%) | 812 (14.7%) |
| 5 or more Vehicles | 482 (8.3%) | 731 (13.2%) |
| Total | 5,793 (100.0%) | 5,520 (100.0%) |
Commute Time in Goochland County
The most frequently occuring commute durations in Goochland County are 30 to 34 minutes (1,510 commuters, 16.0%), 20 to 24 minutes (1,455 commuters, 15.4%), and 45 to 59 minutes (1,429 commuters, 15.2%).
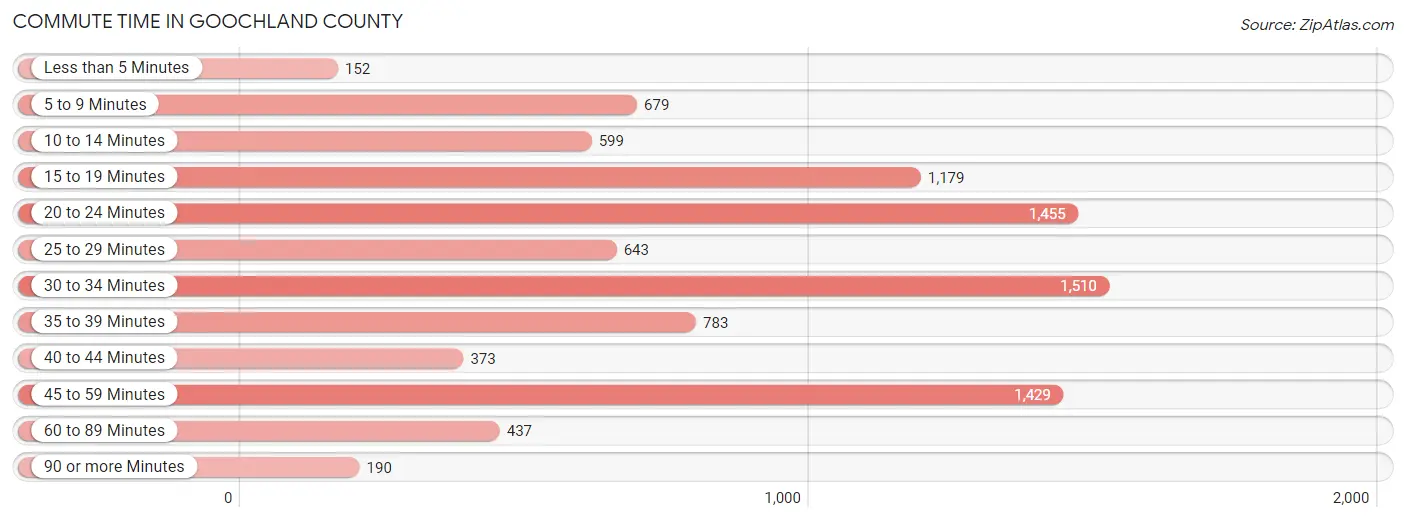
| Commute Time | # Commuters | % Commuters |
| Less than 5 Minutes | 152 | 1.6% |
| 5 to 9 Minutes | 679 | 7.2% |
| 10 to 14 Minutes | 599 | 6.4% |
| 15 to 19 Minutes | 1,179 | 12.5% |
| 20 to 24 Minutes | 1,455 | 15.4% |
| 25 to 29 Minutes | 643 | 6.8% |
| 30 to 34 Minutes | 1,510 | 16.0% |
| 35 to 39 Minutes | 783 | 8.3% |
| 40 to 44 Minutes | 373 | 4.0% |
| 45 to 59 Minutes | 1,429 | 15.2% |
| 60 to 89 Minutes | 437 | 4.6% |
| 90 or more Minutes | 190 | 2.0% |
Commute Time by Sex in Goochland County
The most common commute times in Goochland County are 45 to 59 minutes (871 commuters, 17.9%) for males and 30 to 34 minutes (887 commuters, 19.4%) for females.
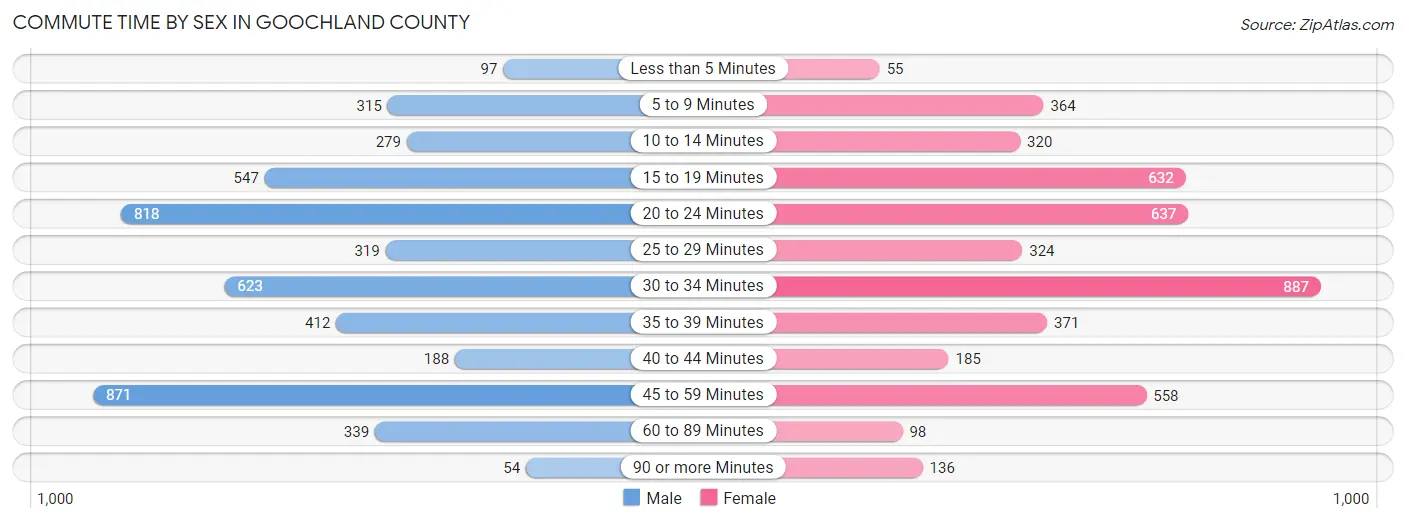
| Commute Time | Male | Female |
| Less than 5 Minutes | 97 (2.0%) | 55 (1.2%) |
| 5 to 9 Minutes | 315 (6.5%) | 364 (8.0%) |
| 10 to 14 Minutes | 279 (5.7%) | 320 (7.0%) |
| 15 to 19 Minutes | 547 (11.3%) | 632 (13.8%) |
| 20 to 24 Minutes | 818 (16.8%) | 637 (14.0%) |
| 25 to 29 Minutes | 319 (6.6%) | 324 (7.1%) |
| 30 to 34 Minutes | 623 (12.8%) | 887 (19.4%) |
| 35 to 39 Minutes | 412 (8.5%) | 371 (8.1%) |
| 40 to 44 Minutes | 188 (3.9%) | 185 (4.1%) |
| 45 to 59 Minutes | 871 (17.9%) | 558 (12.2%) |
| 60 to 89 Minutes | 339 (7.0%) | 98 (2.1%) |
| 90 or more Minutes | 54 (1.1%) | 136 (3.0%) |
Time of Departure to Work by Sex in Goochland County
The most frequent times of departure to work in Goochland County are 7:00 AM to 7:29 AM (1,004, 20.6%) for males and 7:00 AM to 7:29 AM (743, 16.3%) for females.
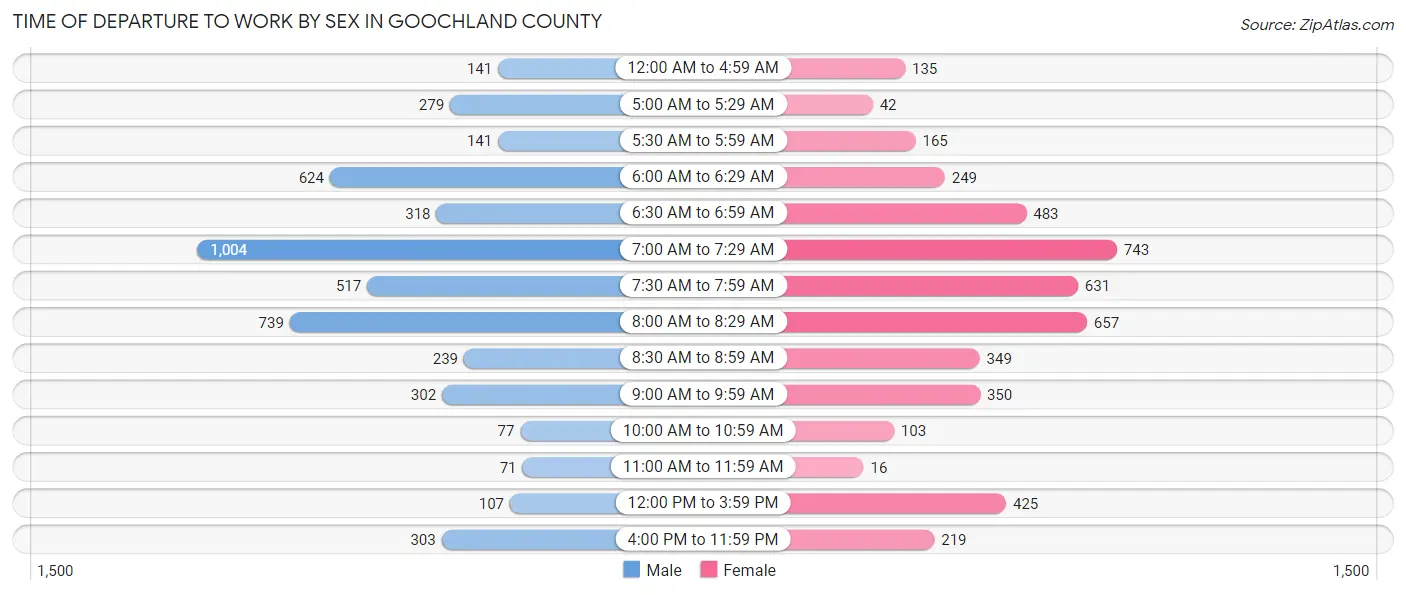
| Time of Departure | Male | Female |
| 12:00 AM to 4:59 AM | 141 (2.9%) | 135 (3.0%) |
| 5:00 AM to 5:29 AM | 279 (5.7%) | 42 (0.9%) |
| 5:30 AM to 5:59 AM | 141 (2.9%) | 165 (3.6%) |
| 6:00 AM to 6:29 AM | 624 (12.8%) | 249 (5.4%) |
| 6:30 AM to 6:59 AM | 318 (6.5%) | 483 (10.6%) |
| 7:00 AM to 7:29 AM | 1,004 (20.6%) | 743 (16.3%) |
| 7:30 AM to 7:59 AM | 517 (10.6%) | 631 (13.8%) |
| 8:00 AM to 8:29 AM | 739 (15.2%) | 657 (14.4%) |
| 8:30 AM to 8:59 AM | 239 (4.9%) | 349 (7.6%) |
| 9:00 AM to 9:59 AM | 302 (6.2%) | 350 (7.7%) |
| 10:00 AM to 10:59 AM | 77 (1.6%) | 103 (2.3%) |
| 11:00 AM to 11:59 AM | 71 (1.5%) | 16 (0.4%) |
| 12:00 PM to 3:59 PM | 107 (2.2%) | 425 (9.3%) |
| 4:00 PM to 11:59 PM | 303 (6.2%) | 219 (4.8%) |
| Total | 4,862 (100.0%) | 4,567 (100.0%) |
Housing Occupancy in Goochland County
Occupancy by Ownership in Goochland County
Of the total 9,788 dwellings in Goochland County, owner-occupied units account for 8,272 (84.5%), while renter-occupied units make up 1,516 (15.5%).
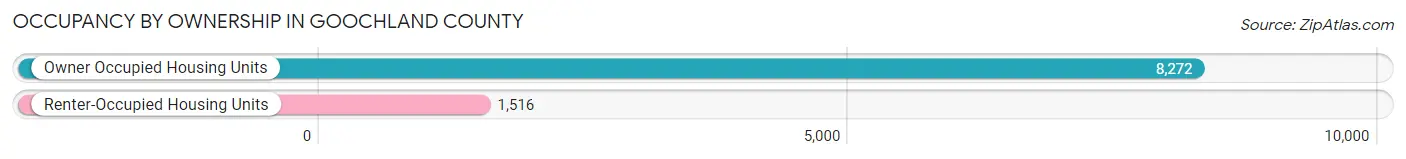
| Occupancy | # Housing Units | % Housing Units |
| Owner Occupied Housing Units | 8,272 | 84.5% |
| Renter-Occupied Housing Units | 1,516 | 15.5% |
| Total Occupied Housing Units | 9,788 | 100.0% |
Occupancy by Household Size in Goochland County
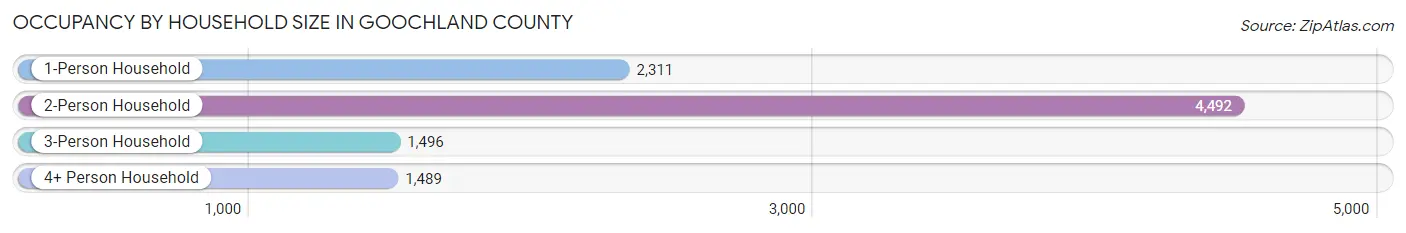
| Household Size | # Housing Units | % Housing Units |
| 1-Person Household | 2,311 | 23.6% |
| 2-Person Household | 4,492 | 45.9% |
| 3-Person Household | 1,496 | 15.3% |
| 4+ Person Household | 1,489 | 15.2% |
| Total Housing Units | 9,788 | 100.0% |
Occupancy by Ownership by Household Size in Goochland County
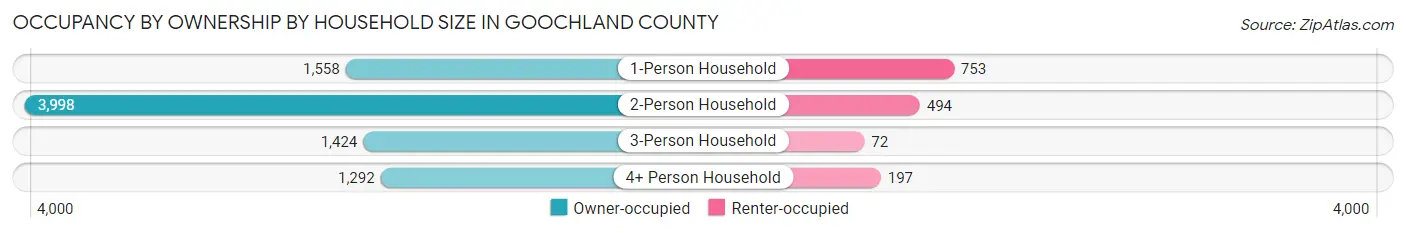
| Household Size | Owner-occupied | Renter-occupied |
| 1-Person Household | 1,558 (67.4%) | 753 (32.6%) |
| 2-Person Household | 3,998 (89.0%) | 494 (11.0%) |
| 3-Person Household | 1,424 (95.2%) | 72 (4.8%) |
| 4+ Person Household | 1,292 (86.8%) | 197 (13.2%) |
| Total Housing Units | 8,272 (84.5%) | 1,516 (15.5%) |
Occupancy by Educational Attainment in Goochland County
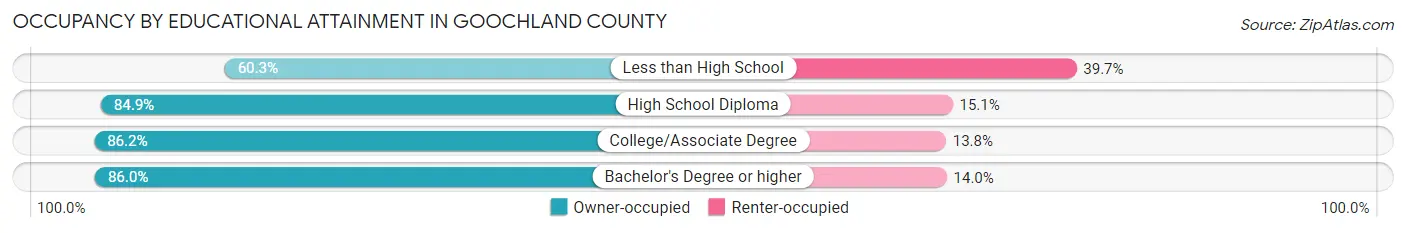
| Household Size | Owner-occupied | Renter-occupied |
| Less than High School | 313 (60.3%) | 206 (39.7%) |
| High School Diploma | 1,441 (84.9%) | 257 (15.1%) |
| College/Associate Degree | 2,216 (86.2%) | 355 (13.8%) |
| Bachelor's Degree or higher | 4,302 (86.0%) | 698 (14.0%) |
Occupancy by Age of Householder in Goochland County
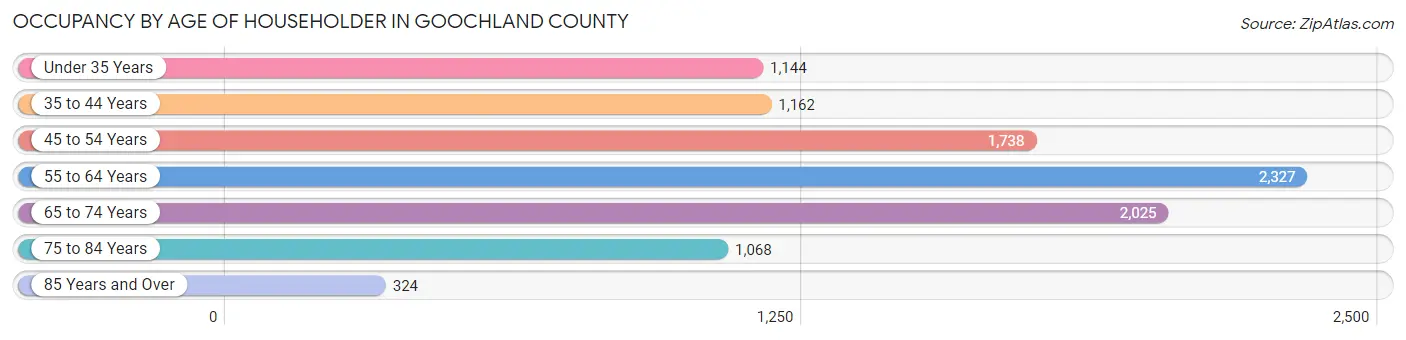
| Age Bracket | # Households | % Households |
| Under 35 Years | 1,144 | 11.7% |
| 35 to 44 Years | 1,162 | 11.9% |
| 45 to 54 Years | 1,738 | 17.8% |
| 55 to 64 Years | 2,327 | 23.8% |
| 65 to 74 Years | 2,025 | 20.7% |
| 75 to 84 Years | 1,068 | 10.9% |
| 85 Years and Over | 324 | 3.3% |
| Total | 9,788 | 100.0% |
Housing Finances in Goochland County
Median Income by Occupancy in Goochland County
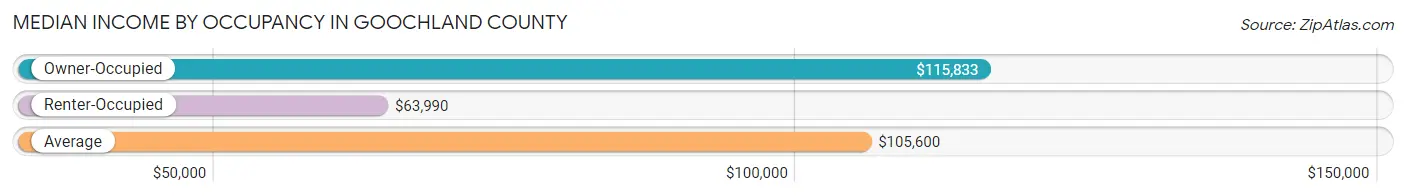
| Occupancy Type | # Households | Median Income |
| Owner-Occupied | 8,272 (84.5%) | $115,833 |
| Renter-Occupied | 1,516 (15.5%) | $63,990 |
| Average | 9,788 (100.0%) | $105,600 |
Occupancy by Householder Income Bracket in Goochland County
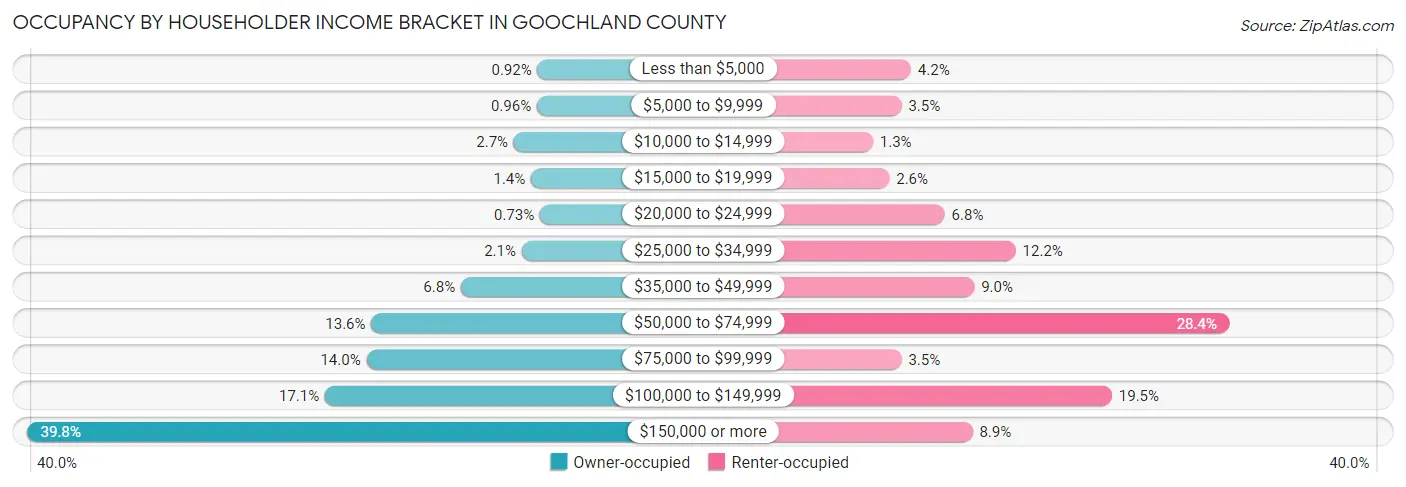
| Income Bracket | Owner-occupied | Renter-occupied |
| Less than $5,000 | 76 (0.9%) | 64 (4.2%) |
| $5,000 to $9,999 | 79 (1.0%) | 53 (3.5%) |
| $10,000 to $14,999 | 225 (2.7%) | 20 (1.3%) |
| $15,000 to $19,999 | 117 (1.4%) | 39 (2.6%) |
| $20,000 to $24,999 | 60 (0.7%) | 103 (6.8%) |
| $25,000 to $34,999 | 175 (2.1%) | 185 (12.2%) |
| $35,000 to $49,999 | 558 (6.8%) | 137 (9.0%) |
| $50,000 to $74,999 | 1,123 (13.6%) | 431 (28.4%) |
| $75,000 to $99,999 | 1,154 (14.0%) | 53 (3.5%) |
| $100,000 to $149,999 | 1,415 (17.1%) | 296 (19.5%) |
| $150,000 or more | 3,290 (39.8%) | 135 (8.9%) |
| Total | 8,272 (100.0%) | 1,516 (100.0%) |
Monthly Housing Cost Tiers in Goochland County
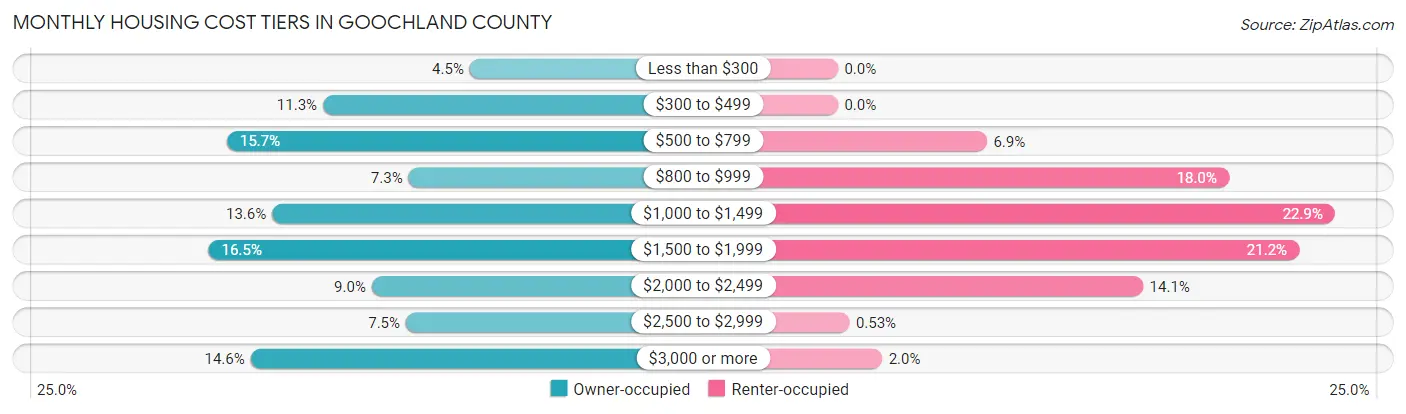
| Monthly Cost | Owner-occupied | Renter-occupied |
| Less than $300 | 373 (4.5%) | 0 (0.0%) |
| $300 to $499 | 932 (11.3%) | 0 (0.0%) |
| $500 to $799 | 1,298 (15.7%) | 104 (6.9%) |
| $800 to $999 | 606 (7.3%) | 273 (18.0%) |
| $1,000 to $1,499 | 1,126 (13.6%) | 347 (22.9%) |
| $1,500 to $1,999 | 1,367 (16.5%) | 322 (21.2%) |
| $2,000 to $2,499 | 746 (9.0%) | 213 (14.1%) |
| $2,500 to $2,999 | 616 (7.4%) | 8 (0.5%) |
| $3,000 or more | 1,208 (14.6%) | 31 (2.0%) |
| Total | 8,272 (100.0%) | 1,516 (100.0%) |
Physical Housing Characteristics in Goochland County
Housing Structures in Goochland County
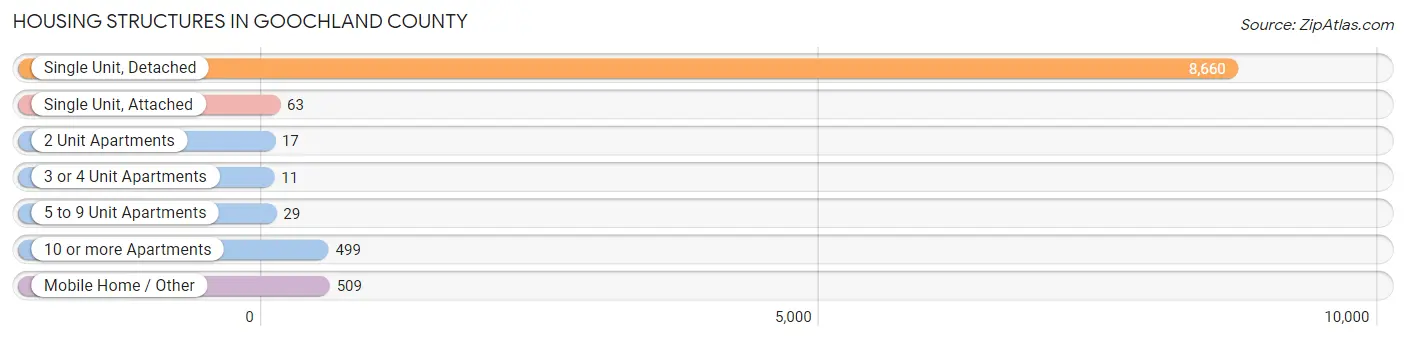
| Structure Type | # Housing Units | % Housing Units |
| Single Unit, Detached | 8,660 | 88.5% |
| Single Unit, Attached | 63 | 0.6% |
| 2 Unit Apartments | 17 | 0.2% |
| 3 or 4 Unit Apartments | 11 | 0.1% |
| 5 to 9 Unit Apartments | 29 | 0.3% |
| 10 or more Apartments | 499 | 5.1% |
| Mobile Home / Other | 509 | 5.2% |
| Total | 9,788 | 100.0% |
Housing Structures by Occupancy in Goochland County
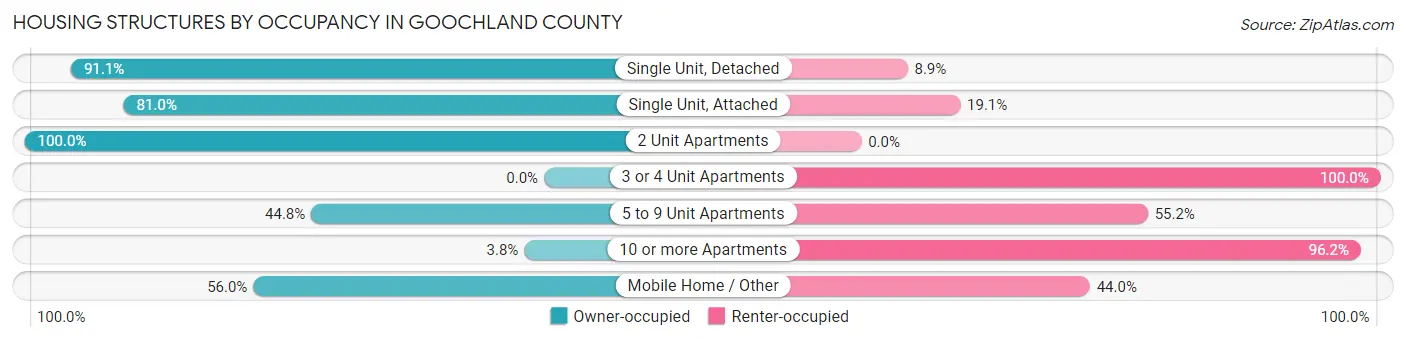
| Structure Type | Owner-occupied | Renter-occupied |
| Single Unit, Detached | 7,887 (91.1%) | 773 (8.9%) |
| Single Unit, Attached | 51 (80.9%) | 12 (19.1%) |
| 2 Unit Apartments | 17 (100.0%) | 0 (0.0%) |
| 3 or 4 Unit Apartments | 0 (0.0%) | 11 (100.0%) |
| 5 to 9 Unit Apartments | 13 (44.8%) | 16 (55.2%) |
| 10 or more Apartments | 19 (3.8%) | 480 (96.2%) |
| Mobile Home / Other | 285 (56.0%) | 224 (44.0%) |
| Total | 8,272 (84.5%) | 1,516 (15.5%) |
Housing Structures by Number of Rooms in Goochland County
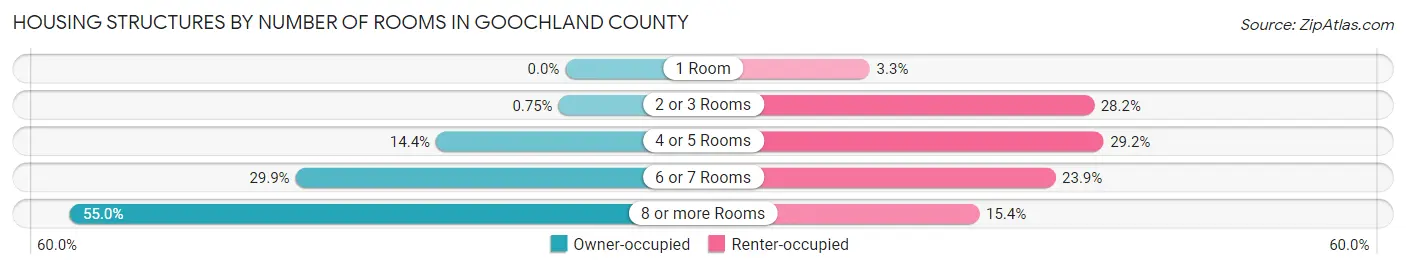
| Number of Rooms | Owner-occupied | Renter-occupied |
| 1 Room | 0 (0.0%) | 50 (3.3%) |
| 2 or 3 Rooms | 62 (0.7%) | 427 (28.2%) |
| 4 or 5 Rooms | 1,187 (14.3%) | 443 (29.2%) |
| 6 or 7 Rooms | 2,477 (29.9%) | 362 (23.9%) |
| 8 or more Rooms | 4,546 (55.0%) | 234 (15.4%) |
| Total | 8,272 (100.0%) | 1,516 (100.0%) |
Housing Structure by Heating Type in Goochland County
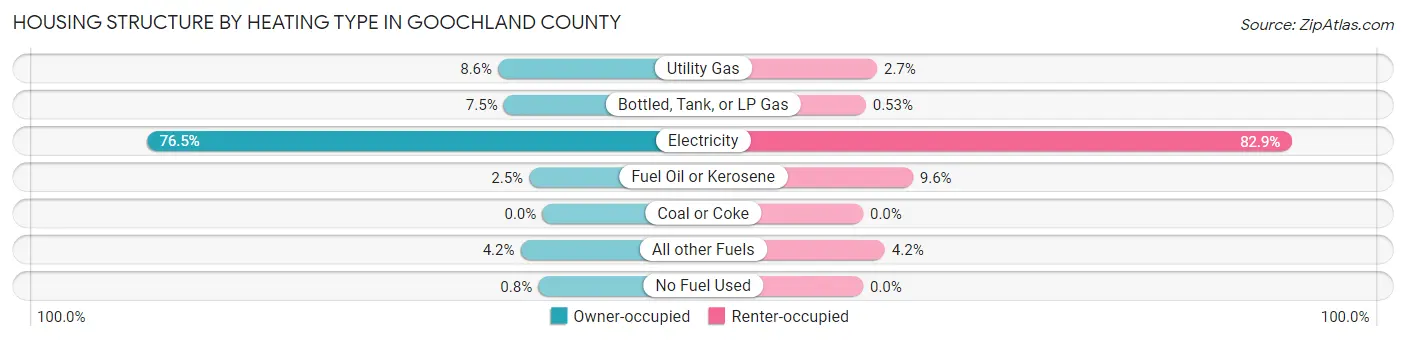
| Heating Type | Owner-occupied | Renter-occupied |
| Utility Gas | 707 (8.6%) | 41 (2.7%) |
| Bottled, Tank, or LP Gas | 617 (7.5%) | 8 (0.5%) |
| Electricity | 6,324 (76.4%) | 1,257 (82.9%) |
| Fuel Oil or Kerosene | 210 (2.5%) | 146 (9.6%) |
| Coal or Coke | 0 (0.0%) | 0 (0.0%) |
| All other Fuels | 348 (4.2%) | 64 (4.2%) |
| No Fuel Used | 66 (0.8%) | 0 (0.0%) |
| Total | 8,272 (100.0%) | 1,516 (100.0%) |
Household Vehicle Usage in Goochland County
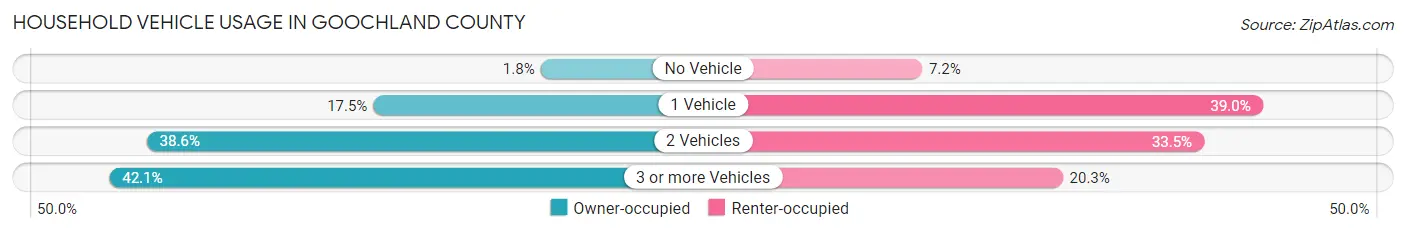
| Vehicles per Household | Owner-occupied | Renter-occupied |
| No Vehicle | 152 (1.8%) | 109 (7.2%) |
| 1 Vehicle | 1,444 (17.5%) | 591 (39.0%) |
| 2 Vehicles | 3,194 (38.6%) | 508 (33.5%) |
| 3 or more Vehicles | 3,482 (42.1%) | 308 (20.3%) |
| Total | 8,272 (100.0%) | 1,516 (100.0%) |
Real Estate & Mortgages in Goochland County
Real Estate and Mortgage Overview in Goochland County
| Characteristic | Without Mortgage | With Mortgage |
| Housing Units | 3,098 | 5,174 |
| Median Property Value | $429,700 | $435,000 |
| Median Household Income | $83,253 | $2,412 |
| Monthly Housing Costs | $549 | $1,208 |
| Real Estate Taxes | $2,277 | $173 |
Property Value by Mortgage Status in Goochland County
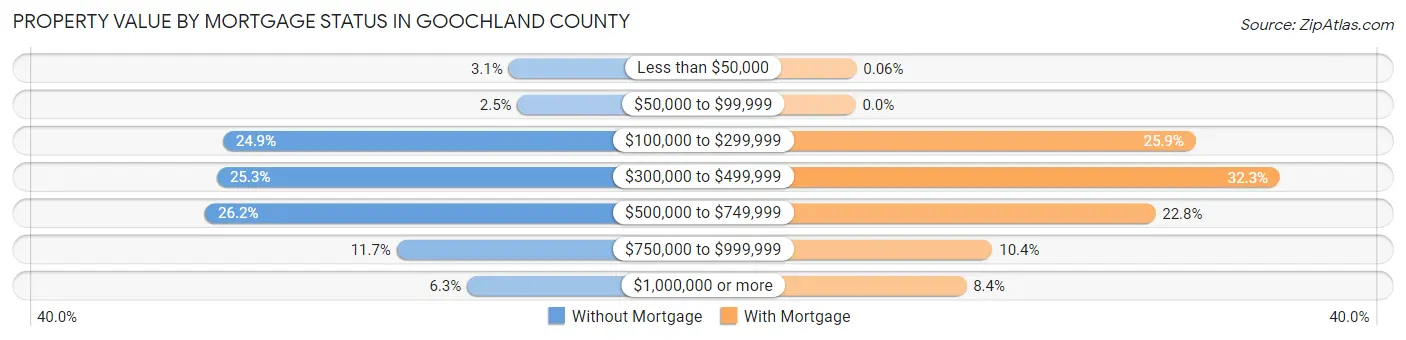
| Property Value | Without Mortgage | With Mortgage |
| Less than $50,000 | 97 (3.1%) | 3 (0.1%) |
| $50,000 to $99,999 | 76 (2.5%) | 0 (0.0%) |
| $100,000 to $299,999 | 771 (24.9%) | 1,341 (25.9%) |
| $300,000 to $499,999 | 785 (25.3%) | 1,673 (32.3%) |
| $500,000 to $749,999 | 813 (26.2%) | 1,182 (22.8%) |
| $750,000 to $999,999 | 361 (11.7%) | 539 (10.4%) |
| $1,000,000 or more | 195 (6.3%) | 436 (8.4%) |
| Total | 3,098 (100.0%) | 5,174 (100.0%) |
Household Income by Mortgage Status in Goochland County
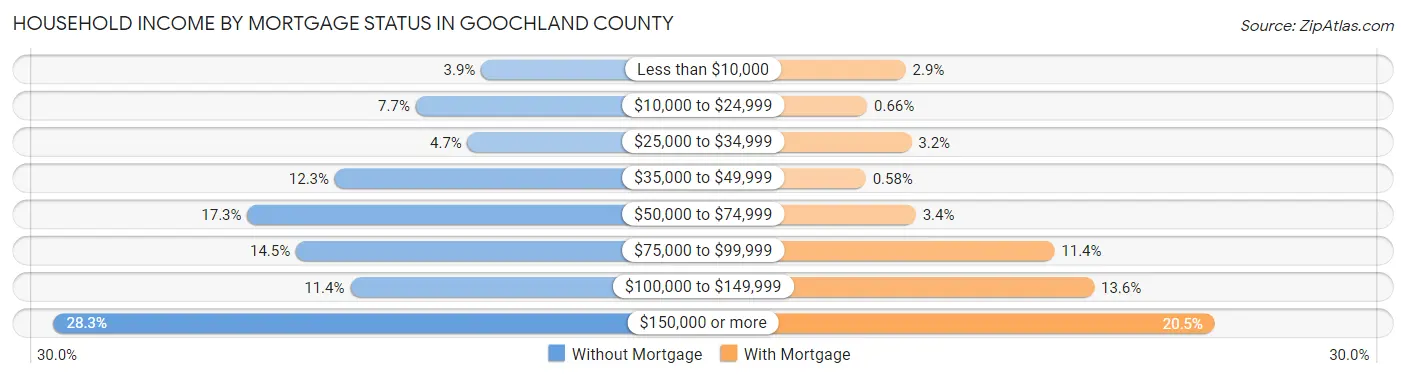
| Household Income | Without Mortgage | With Mortgage |
| Less than $10,000 | 121 (3.9%) | 148 (2.9%) |
| $10,000 to $24,999 | 237 (7.6%) | 34 (0.7%) |
| $25,000 to $34,999 | 145 (4.7%) | 165 (3.2%) |
| $35,000 to $49,999 | 380 (12.3%) | 30 (0.6%) |
| $50,000 to $74,999 | 535 (17.3%) | 178 (3.4%) |
| $75,000 to $99,999 | 449 (14.5%) | 588 (11.4%) |
| $100,000 to $149,999 | 353 (11.4%) | 705 (13.6%) |
| $150,000 or more | 878 (28.3%) | 1,062 (20.5%) |
| Total | 3,098 (100.0%) | 5,174 (100.0%) |
Property Value to Household Income Ratio in Goochland County
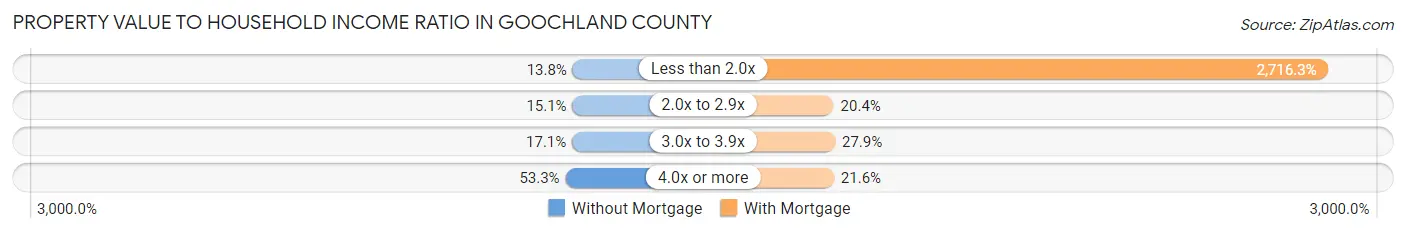
| Value-to-Income Ratio | Without Mortgage | With Mortgage |
| Less than 2.0x | 428 (13.8%) | 140,543 (2,716.3%) |
| 2.0x to 2.9x | 467 (15.1%) | 1,054 (20.4%) |
| 3.0x to 3.9x | 529 (17.1%) | 1,441 (27.9%) |
| 4.0x or more | 1,650 (53.3%) | 1,118 (21.6%) |
| Total | 3,098 (100.0%) | 5,174 (100.0%) |
Real Estate Taxes by Mortgage Status in Goochland County
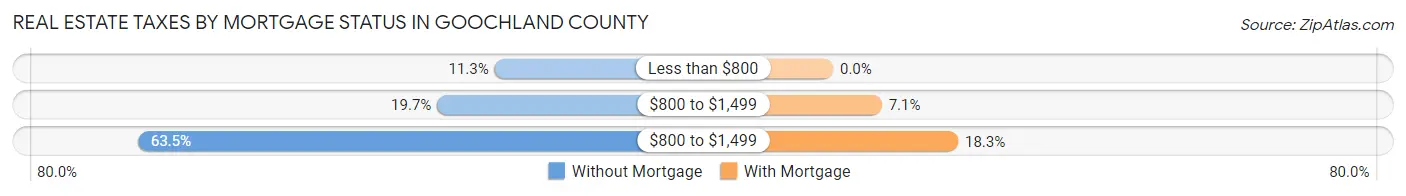
| Property Taxes | Without Mortgage | With Mortgage |
| Less than $800 | 351 (11.3%) | 0 (0.0%) |
| $800 to $1,499 | 611 (19.7%) | 368 (7.1%) |
| $800 to $1,499 | 1,966 (63.5%) | 945 (18.3%) |
| Total | 3,098 (100.0%) | 5,174 (100.0%) |
Health & Disability in Goochland County
Health Insurance Coverage by Age in Goochland County
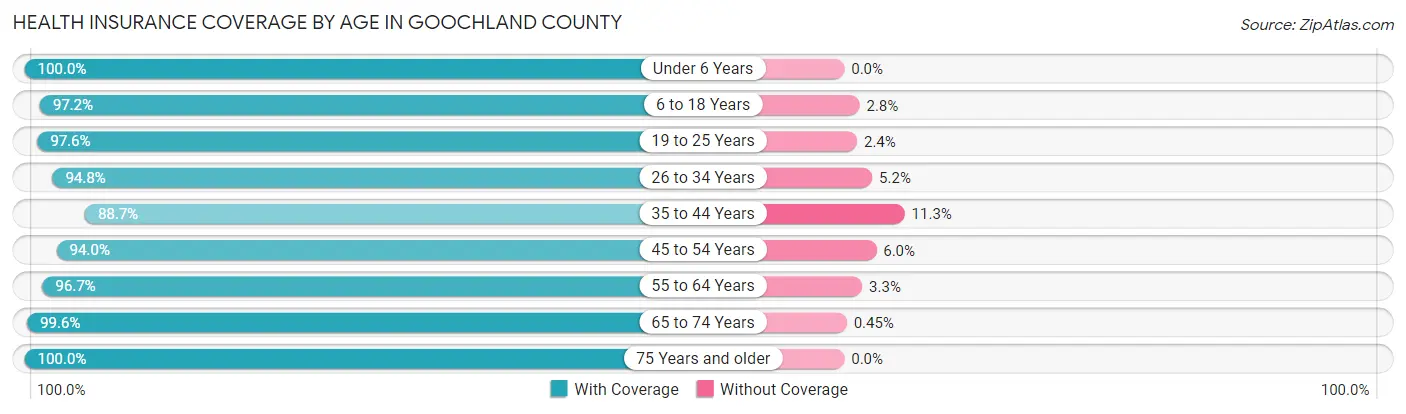
| Age Bracket | With Coverage | Without Coverage |
| Under 6 Years | 1,143 (100.0%) | 0 (0.0%) |
| 6 to 18 Years | 3,486 (97.2%) | 102 (2.8%) |
| 19 to 25 Years | 1,477 (97.6%) | 36 (2.4%) |
| 26 to 34 Years | 1,877 (94.8%) | 103 (5.2%) |
| 35 to 44 Years | 2,073 (88.7%) | 263 (11.3%) |
| 45 to 54 Years | 3,205 (94.0%) | 203 (6.0%) |
| 55 to 64 Years | 4,154 (96.7%) | 143 (3.3%) |
| 65 to 74 Years | 3,533 (99.6%) | 16 (0.4%) |
| 75 Years and older | 2,096 (100.0%) | 0 (0.0%) |
| Total | 23,044 (96.4%) | 866 (3.6%) |
Health Insurance Coverage by Citizenship Status in Goochland County
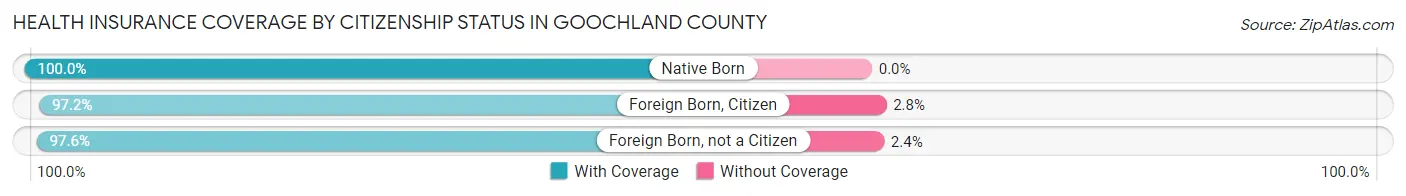
| Citizenship Status | With Coverage | Without Coverage |
| Native Born | 1,143 (100.0%) | 0 (0.0%) |
| Foreign Born, Citizen | 3,486 (97.2%) | 102 (2.8%) |
| Foreign Born, not a Citizen | 1,477 (97.6%) | 36 (2.4%) |
Health Insurance Coverage by Household Income in Goochland County
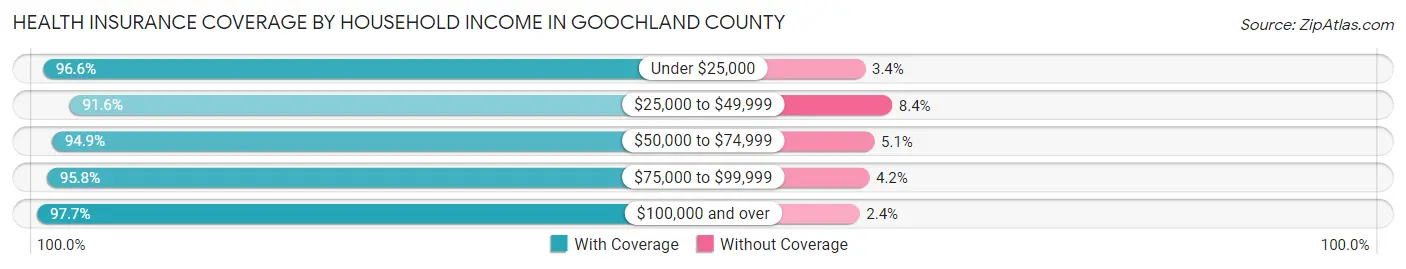
| Household Income | With Coverage | Without Coverage |
| Under $25,000 | 1,157 (96.6%) | 41 (3.4%) |
| $25,000 to $49,999 | 2,007 (91.6%) | 185 (8.4%) |
| $50,000 to $74,999 | 3,024 (94.9%) | 163 (5.1%) |
| $75,000 to $99,999 | 3,151 (95.8%) | 137 (4.2%) |
| $100,000 and over | 13,686 (97.7%) | 330 (2.4%) |
Public vs Private Health Insurance Coverage by Age in Goochland County
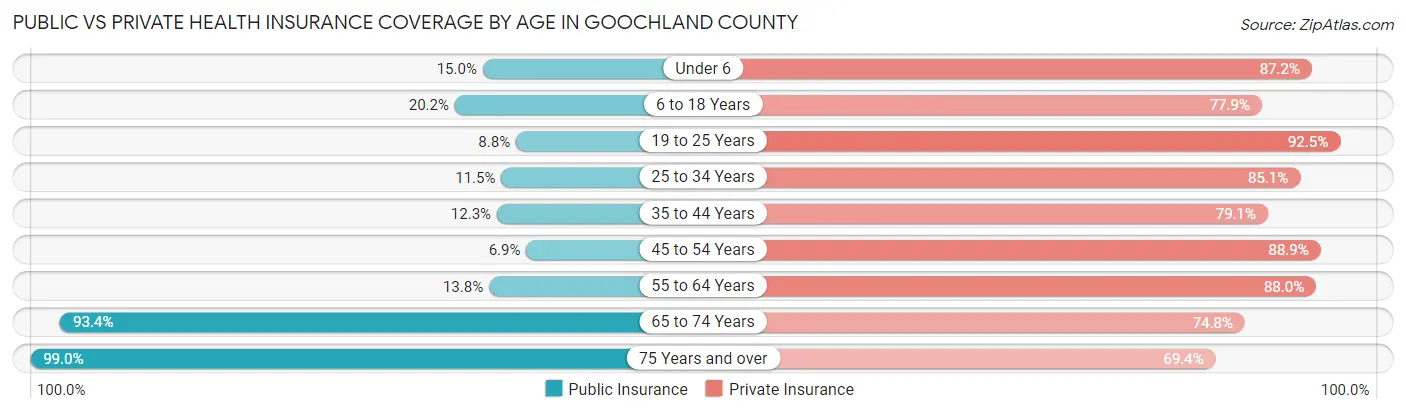
| Age Bracket | Public Insurance | Private Insurance |
| Under 6 | 171 (15.0%) | 997 (87.2%) |
| 6 to 18 Years | 723 (20.2%) | 2,796 (77.9%) |
| 19 to 25 Years | 133 (8.8%) | 1,399 (92.5%) |
| 25 to 34 Years | 228 (11.5%) | 1,684 (85.1%) |
| 35 to 44 Years | 288 (12.3%) | 1,847 (79.1%) |
| 45 to 54 Years | 234 (6.9%) | 3,028 (88.8%) |
| 55 to 64 Years | 593 (13.8%) | 3,782 (88.0%) |
| 65 to 74 Years | 3,315 (93.4%) | 2,655 (74.8%) |
| 75 Years and over | 2,074 (99.0%) | 1,454 (69.4%) |
| Total | 7,759 (32.5%) | 19,642 (82.2%) |
Disability Status by Sex by Age in Goochland County
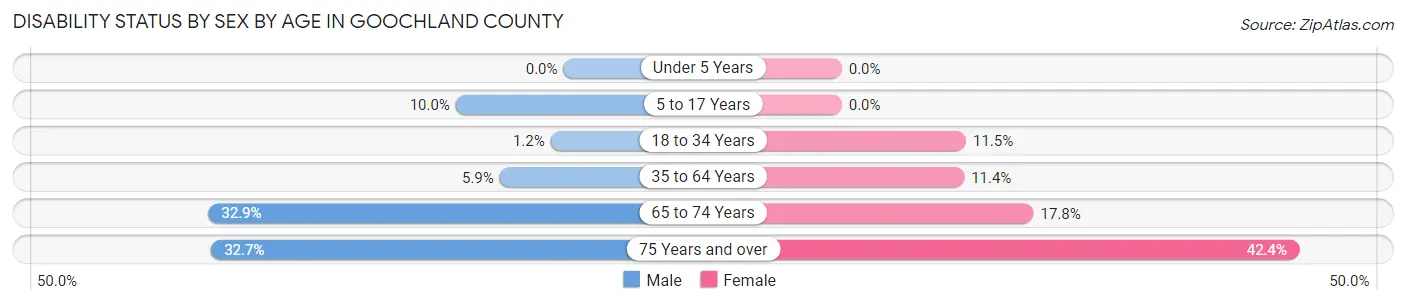
| Age Bracket | Male | Female |
| Under 5 Years | 0 (0.0%) | 0 (0.0%) |
| 5 to 17 Years | 174 (10.0%) | 0 (0.0%) |
| 18 to 34 Years | 22 (1.2%) | 253 (11.5%) |
| 35 to 64 Years | 293 (5.9%) | 578 (11.4%) |
| 65 to 74 Years | 586 (32.9%) | 315 (17.8%) |
| 75 Years and over | 302 (32.7%) | 497 (42.4%) |
Disability Class by Sex by Age in Goochland County
Disability Class: Hearing Difficulty
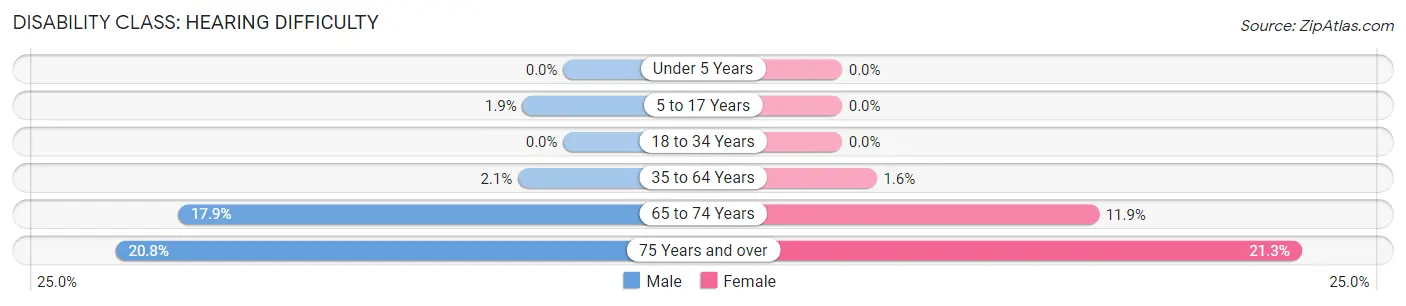
| Age Bracket | Male | Female |
| Under 5 Years | 0 (0.0%) | 0 (0.0%) |
| 5 to 17 Years | 33 (1.9%) | 0 (0.0%) |
| 18 to 34 Years | 0 (0.0%) | 0 (0.0%) |
| 35 to 64 Years | 104 (2.1%) | 82 (1.6%) |
| 65 to 74 Years | 318 (17.9%) | 211 (11.9%) |
| 75 Years and over | 192 (20.8%) | 250 (21.3%) |
Disability Class: Vision Difficulty
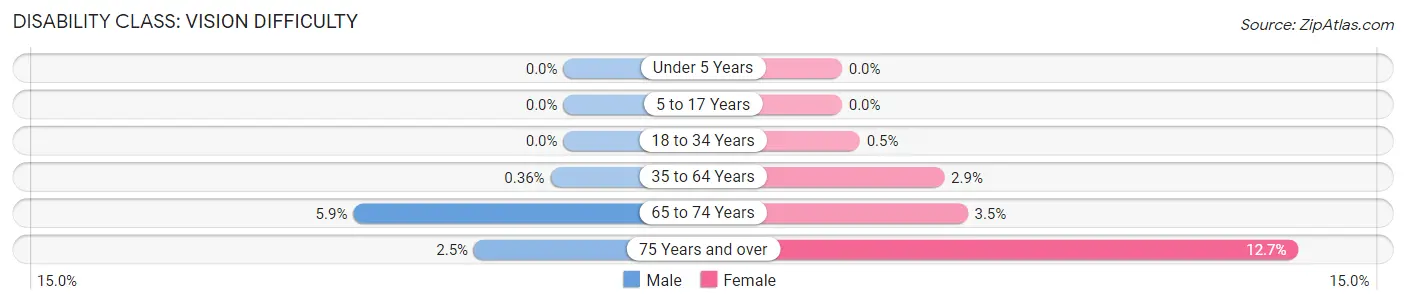
| Age Bracket | Male | Female |
| Under 5 Years | 0 (0.0%) | 0 (0.0%) |
| 5 to 17 Years | 0 (0.0%) | 0 (0.0%) |
| 18 to 34 Years | 0 (0.0%) | 11 (0.5%) |
| 35 to 64 Years | 18 (0.4%) | 145 (2.9%) |
| 65 to 74 Years | 104 (5.9%) | 62 (3.5%) |
| 75 Years and over | 23 (2.5%) | 149 (12.7%) |
Disability Class: Cognitive Difficulty
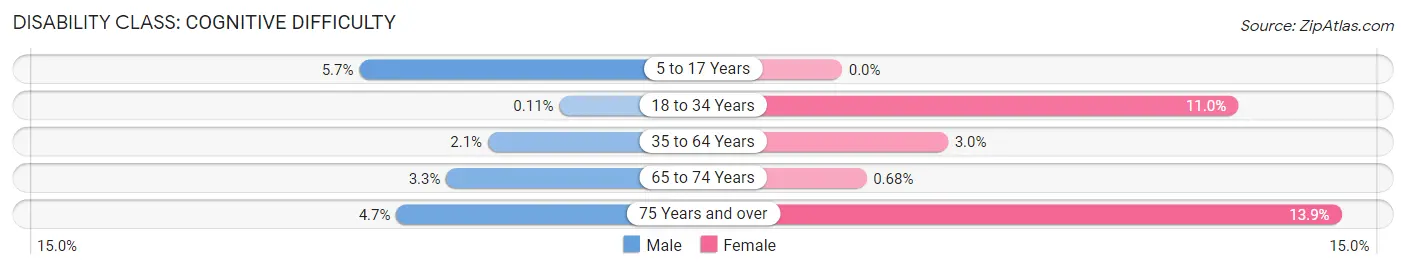
| Age Bracket | Male | Female |
| 5 to 17 Years | 99 (5.7%) | 0 (0.0%) |
| 18 to 34 Years | 2 (0.1%) | 242 (11.0%) |
| 35 to 64 Years | 104 (2.1%) | 150 (2.9%) |
| 65 to 74 Years | 58 (3.3%) | 12 (0.7%) |
| 75 Years and over | 43 (4.6%) | 163 (13.9%) |
Disability Class: Ambulatory Difficulty
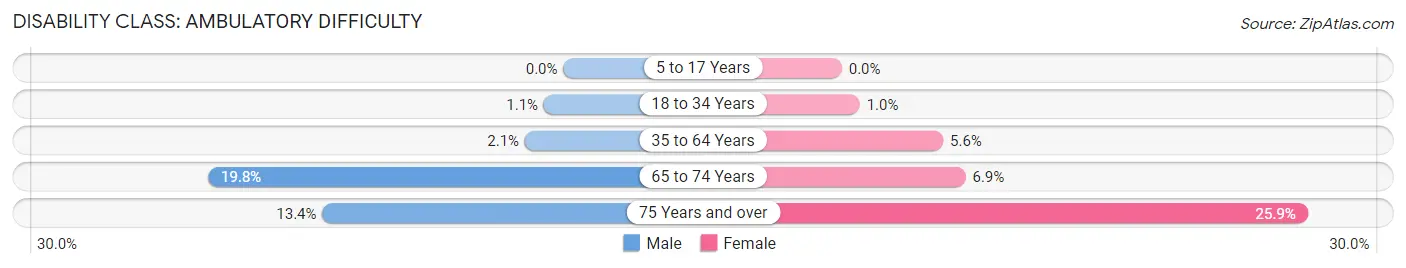
| Age Bracket | Male | Female |
| 5 to 17 Years | 0 (0.0%) | 0 (0.0%) |
| 18 to 34 Years | 20 (1.1%) | 22 (1.0%) |
| 35 to 64 Years | 106 (2.1%) | 287 (5.6%) |
| 65 to 74 Years | 352 (19.8%) | 122 (6.9%) |
| 75 Years and over | 124 (13.4%) | 304 (25.9%) |
Disability Class: Self-Care Difficulty
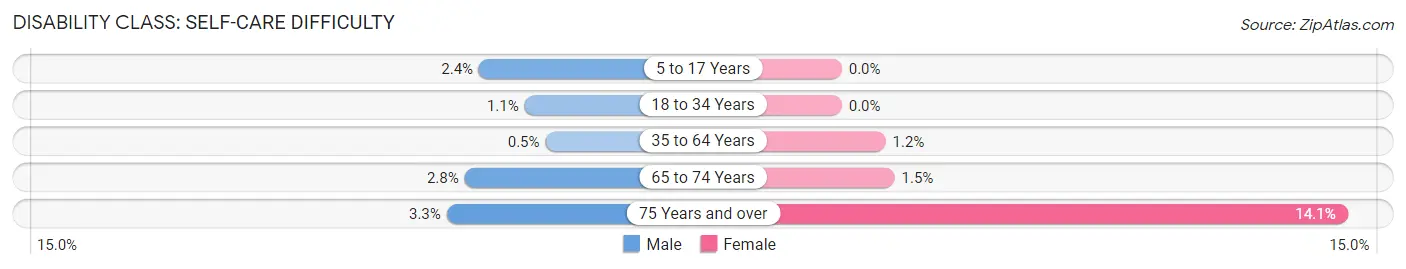
| Age Bracket | Male | Female |
| 5 to 17 Years | 41 (2.4%) | 0 (0.0%) |
| 18 to 34 Years | 20 (1.1%) | 0 (0.0%) |
| 35 to 64 Years | 25 (0.5%) | 62 (1.2%) |
| 65 to 74 Years | 49 (2.8%) | 26 (1.5%) |
| 75 Years and over | 30 (3.3%) | 165 (14.1%) |
Technology Access in Goochland County
Computing Device Access in Goochland County
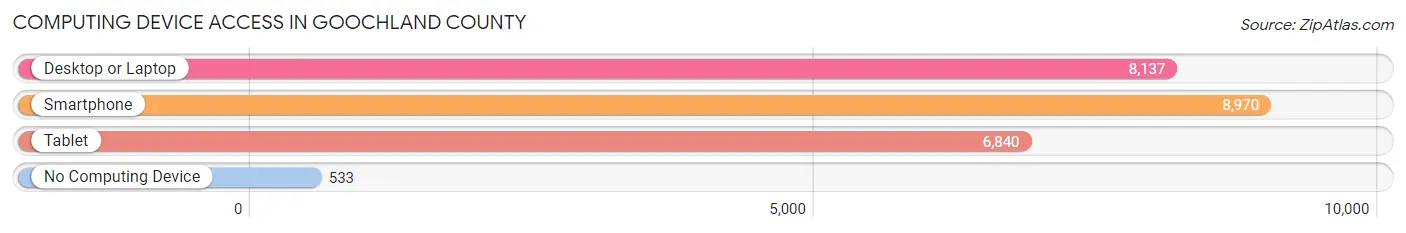
| Device Type | # Households | % Households |
| Desktop or Laptop | 8,137 | 83.1% |
| Smartphone | 8,970 | 91.6% |
| Tablet | 6,840 | 69.9% |
| No Computing Device | 533 | 5.4% |
| Total | 9,788 | 100.0% |
Internet Access in Goochland County
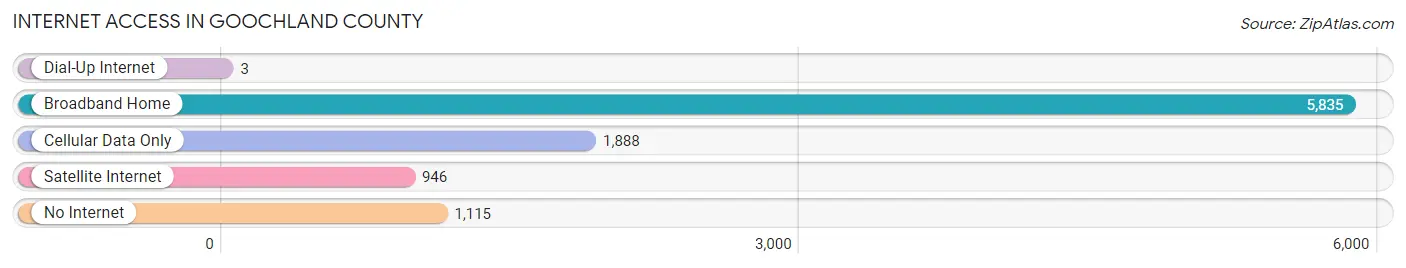
| Internet Type | # Households | % Households |
| Dial-Up Internet | 3 | 0.0% |
| Broadband Home | 5,835 | 59.6% |
| Cellular Data Only | 1,888 | 19.3% |
| Satellite Internet | 946 | 9.7% |
| No Internet | 1,115 | 11.4% |
| Total | 9,788 | 100.0% |
Goochland County Summary
Goochland County, Virginia is a rural county located in the central part of the state, just west of the capital city of Richmond. It is bordered by Louisa County to the north, Fluvanna County to the east, Cumberland County to the south, and Powhatan County to the west. The county seat is Goochland, and the county is part of the Greater Richmond Region.
History
Goochland County was formed in 1728 from Henrico County. It was named for Sir William Gooch, the lieutenant governor of Virginia from 1727 to 1749. The county was originally part of the Virginia Colony, and was home to many Native American tribes, including the Monacan, the Manahoac, and the Powhatan.
During the American Revolution, Goochland County was the site of several battles, including the Battle of Goochland Courthouse in 1781. The county was also home to several prominent figures in the Revolutionary War, including Patrick Henry, Thomas Jefferson, and James Madison.
In the 19th century, Goochland County was home to several prominent plantations, including the Tuckahoe Plantation, which was owned by Thomas Jefferson. The county was also home to several prominent families, including the Randolphs, the Harrisons, and the Carters.
Geography
Goochland County is located in the Piedmont region of Virginia, and is part of the Greater Richmond Region. The county is bordered by Louisa County to the north, Fluvanna County to the east, Cumberland County to the south, and Powhatan County to the west. The county is approximately 545 square miles in size, and is home to several rivers, including the James River, the Appomattox River, and the Chickahominy River.
The county is mostly rural, with the majority of the land being used for farming and forestry. The county is home to several state parks, including James River State Park, Twin Lakes State Park, and Pocahontas State Park.
Economy
Goochland County has a diverse economy, with the majority of the population employed in the service sector. The county is home to several large employers, including the University of Richmond, the Virginia Department of Transportation, and the Virginia State Police.
The county is also home to several small businesses, including wineries, breweries, and distilleries. The county is also home to several farms, which produce a variety of crops, including corn, soybeans, wheat, and hay.
Demographics
As of the 2010 census, Goochland County had a population of 21,717. The population is predominantly white (87.3%), with African Americans making up 8.2% of the population, and Hispanics making up 2.3%. The median household income is $68,845, and the median home value is $269,400.
Conclusion
Goochland County, Virginia is a rural county located in the central part of the state, just west of the capital city of Richmond. It is bordered by Louisa County to the north, Fluvanna County to the east, Cumberland County to the south, and Powhatan County to the west. The county has a diverse economy, with the majority of the population employed in the service sector. The county is also home to several small businesses, including wineries, breweries, and distilleries. The population is predominantly white, with African Americans making up 8.2% of the population, and Hispanics making up 2.3%. Goochland County is a rural county with a rich history and a diverse economy.
Common Questions
What is Per Capita Income in Goochland County?
Per Capita income in Goochland County is $63,645.
What is the Median Family Income in Goochland County?
Median Family Income in Goochland County is $125,391.
What is the Median Household income in Goochland County?
Median Household Income in Goochland County is $105,600.
What is Income or Wage Gap in Goochland County?
Income or Wage Gap in Goochland County is 38.4%.
Women in Goochland County earn 61.6 cents for every dollar earned by a man.
What is Inequality or Gini Index in Goochland County?
Inequality or Gini Index in Goochland County is 0.49.
What is the Total Population of Goochland County?
Total Population of Goochland County is 24,906.
What is the Total Male Population of Goochland County?
Total Male Population of Goochland County is 12,404.
What is the Total Female Population of Goochland County?
Total Female Population of Goochland County is 12,502.
What is the Ratio of Males per 100 Females in Goochland County?
There are 99.22 Males per 100 Females in Goochland County.
What is the Ratio of Females per 100 Males in Goochland County?
There are 100.79 Females per 100 Males in Goochland County.
What is the Median Population Age in Goochland County?
Median Population Age in Goochland County is 49.0 Years.
What is the Average Family Size in Goochland County
Average Family Size in Goochland County is 2.9 People.
What is the Average Household Size in Goochland County
Average Household Size in Goochland County is 2.4 People.
How Large is the Labor Force in Goochland County?
There are 11,986 People in the Labor Forcein in Goochland County.
What is the Percentage of People in the Labor Force in Goochland County?
56.2% of People are in the Labor Force in Goochland County.
What is the Unemployment Rate in Goochland County?
Unemployment Rate in Goochland County is 2.4%.