Gloucester County, VA Map & Demographics
Gloucester County Map
Gloucester County Overview
$39,450
PER CAPITA INCOME
$100,085
AVG FAMILY INCOME
$83,750
AVG HOUSEHOLD INCOME
31.6%
WAGE / INCOME GAP [ % ]
68.4¢/ $1
WAGE / INCOME GAP [ $ ]
$11,149
FAMILY INCOME DEFICIT
0.39
INEQUALITY / GINI INDEX
38,875
TOTAL POPULATION
19,309
MALE POPULATION
19,566
FEMALE POPULATION
98.69
MALES / 100 FEMALES
101.33
FEMALES / 100 MALES
44.3
MEDIAN AGE
3.0
AVG FAMILY SIZE
2.6
AVG HOUSEHOLD SIZE
20,135
LABOR FORCE [ PEOPLE ]
63.1%
PERCENT IN LABOR FORCE
3.4%
UNEMPLOYMENT RATE
Gloucester County Area Codes
Income in Gloucester County
Income Overview in Gloucester County
Per Capita Income in Gloucester County is $39,450, while median incomes of families and households are $100,085 and $83,750 respectively.
| Characteristic | Number | Measure |
| Per Capita Income | 38,875 | $39,450 |
| Median Family Income | 10,438 | $100,085 |
| Mean Family Income | 10,438 | $114,394 |
| Median Household Income | 14,857 | $83,750 |
| Mean Household Income | 14,857 | $100,712 |
| Income Deficit | 10,438 | $11,149 |
| Wage / Income Gap (%) | 38,875 | 31.63% |
| Wage / Income Gap ($) | 38,875 | 68.37¢ per $1 |
| Gini / Inequality Index | 38,875 | 0.39 |
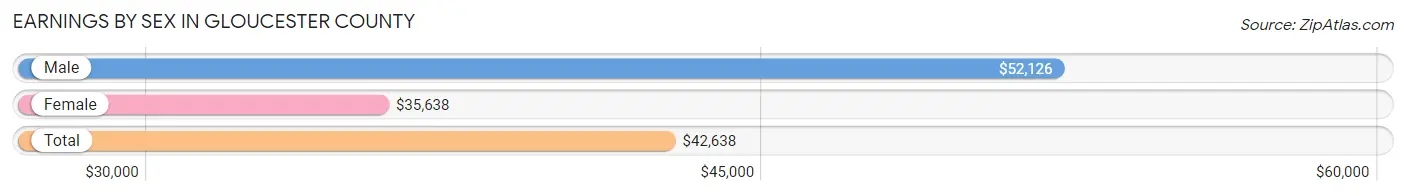
Earnings by Sex in Gloucester County
Average Earnings in Gloucester County are $42,638, $52,126 for men and $35,638 for women, a difference of 31.6%.
| Sex | Number | Average Earnings |
| Male | 11,139 (53.6%) | $52,126 |
| Female | 9,654 (46.4%) | $35,638 |
| Total | 20,793 (100.0%) | $42,638 |
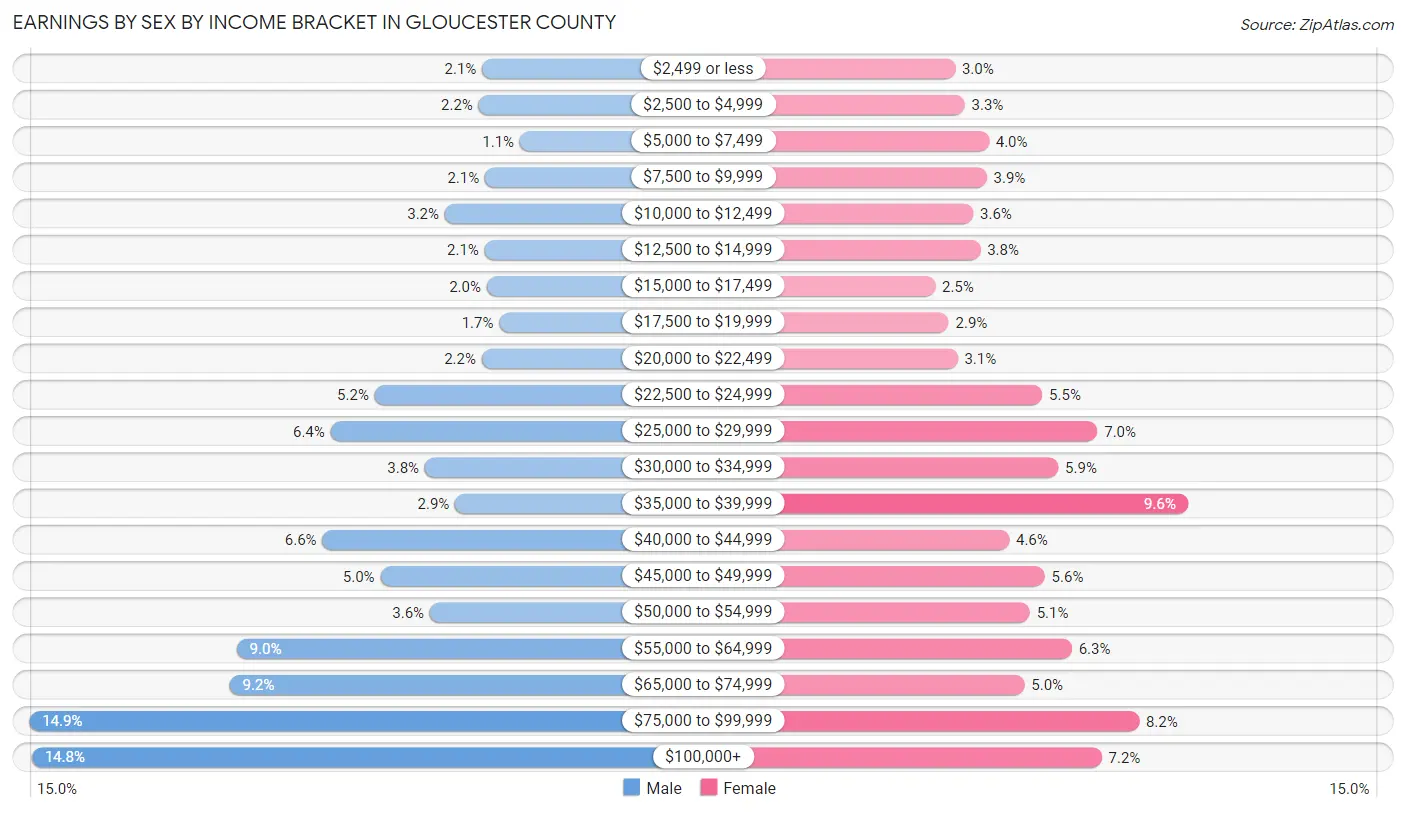
Earnings by Sex by Income Bracket in Gloucester County
The most common earnings brackets in Gloucester County are $75,000 to $99,999 for men (1,656 | 14.9%) and $35,000 to $39,999 for women (925 | 9.6%).
| Income | Male | Female |
| $2,499 or less | 238 (2.1%) | 293 (3.0%) |
| $2,500 to $4,999 | 249 (2.2%) | 320 (3.3%) |
| $5,000 to $7,499 | 120 (1.1%) | 385 (4.0%) |
| $7,500 to $9,999 | 229 (2.1%) | 379 (3.9%) |
| $10,000 to $12,499 | 355 (3.2%) | 343 (3.5%) |
| $12,500 to $14,999 | 231 (2.1%) | 362 (3.7%) |
| $15,000 to $17,499 | 224 (2.0%) | 239 (2.5%) |
| $17,500 to $19,999 | 185 (1.7%) | 276 (2.9%) |
| $20,000 to $22,499 | 240 (2.1%) | 300 (3.1%) |
| $22,500 to $24,999 | 575 (5.2%) | 530 (5.5%) |
| $25,000 to $29,999 | 713 (6.4%) | 680 (7.0%) |
| $30,000 to $34,999 | 418 (3.7%) | 573 (5.9%) |
| $35,000 to $39,999 | 323 (2.9%) | 925 (9.6%) |
| $40,000 to $44,999 | 739 (6.6%) | 440 (4.6%) |
| $45,000 to $49,999 | 557 (5.0%) | 537 (5.6%) |
| $50,000 to $54,999 | 402 (3.6%) | 496 (5.1%) |
| $55,000 to $64,999 | 1,007 (9.0%) | 610 (6.3%) |
| $65,000 to $74,999 | 1,029 (9.2%) | 482 (5.0%) |
| $75,000 to $99,999 | 1,656 (14.9%) | 793 (8.2%) |
| $100,000+ | 1,649 (14.8%) | 691 (7.2%) |
| Total | 11,139 (100.0%) | 9,654 (100.0%) |
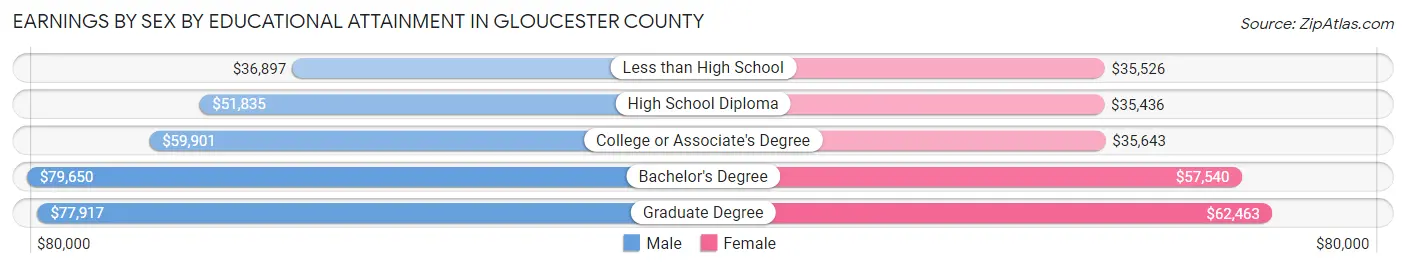
Earnings by Sex by Educational Attainment in Gloucester County
Average earnings in Gloucester County are $58,191 for men and $38,250 for women, a difference of 34.3%. Men with an educational attainment of bachelor's degree enjoy the highest average annual earnings of $79,650, while those with less than high school education earn the least with $36,897. Women with an educational attainment of graduate degree earn the most with the average annual earnings of $62,463, while those with high school diploma education have the smallest earnings of $35,436.
| Educational Attainment | Male Income | Female Income |
| Less than High School | $36,897 | $35,526 |
| High School Diploma | $51,835 | $35,436 |
| College or Associate's Degree | $59,901 | $35,643 |
| Bachelor's Degree | $79,650 | $57,540 |
| Graduate Degree | $77,917 | $62,463 |
| Total | $58,191 | $38,250 |
Family Income in Gloucester County
Family Income Brackets in Gloucester County
According to the Gloucester County family income data, there are 2,839 families falling into the $100,000 to $149,999 income range, which is the most common income bracket and makes up 27.2% of all families. Conversely, the $10,000 to $14,999 income bracket is the least frequent group with only 167 families (1.6%) belonging to this category.
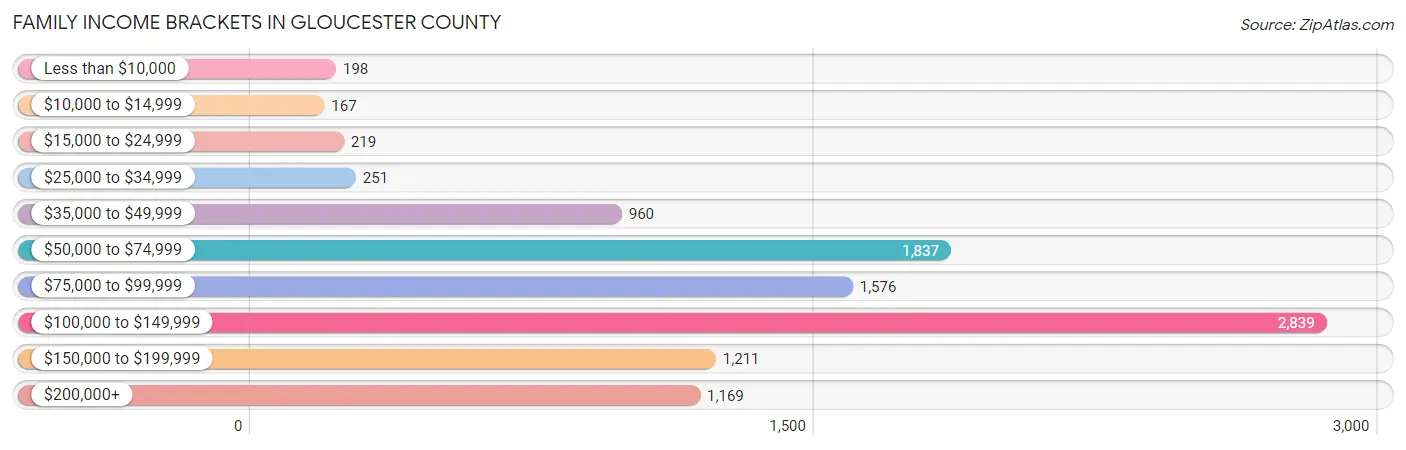
| Income Bracket | # Families | % Families |
| Less than $10,000 | 198 | 1.9% |
| $10,000 to $14,999 | 167 | 1.6% |
| $15,000 to $24,999 | 219 | 2.1% |
| $25,000 to $34,999 | 251 | 2.4% |
| $35,000 to $49,999 | 960 | 9.2% |
| $50,000 to $74,999 | 1,837 | 17.6% |
| $75,000 to $99,999 | 1,576 | 15.1% |
| $100,000 to $149,999 | 2,839 | 27.2% |
| $150,000 to $199,999 | 1,211 | 11.6% |
| $200,000+ | 1,169 | 11.2% |
Family Income by Famaliy Size in Gloucester County
5-person families (682 | 6.5%) account for the highest median family income in Gloucester County with $128,696 per family, while 2-person families (5,406 | 51.8%) have the highest median income of $46,242 per family member.
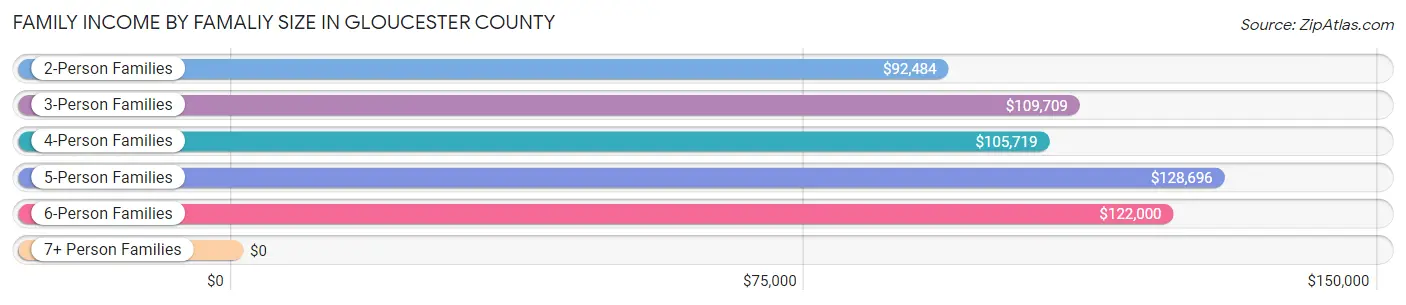
| Income Bracket | # Families | Median Income |
| 2-Person Families | 5,406 (51.8%) | $92,484 |
| 3-Person Families | 2,530 (24.2%) | $109,709 |
| 4-Person Families | 1,589 (15.2%) | $105,719 |
| 5-Person Families | 682 (6.5%) | $128,696 |
| 6-Person Families | 176 (1.7%) | $122,000 |
| 7+ Person Families | 55 (0.5%) | $0 |
| Total | 10,438 (100.0%) | $100,085 |
Family Income by Number of Earners in Gloucester County
The median family income in Gloucester County is $100,085, with families comprising 3+ earners (1,291) having the highest median family income of $144,776, while families with no earners (1,719) have the lowest median family income of $63,884, accounting for 12.4% and 16.5% of families, respectively.
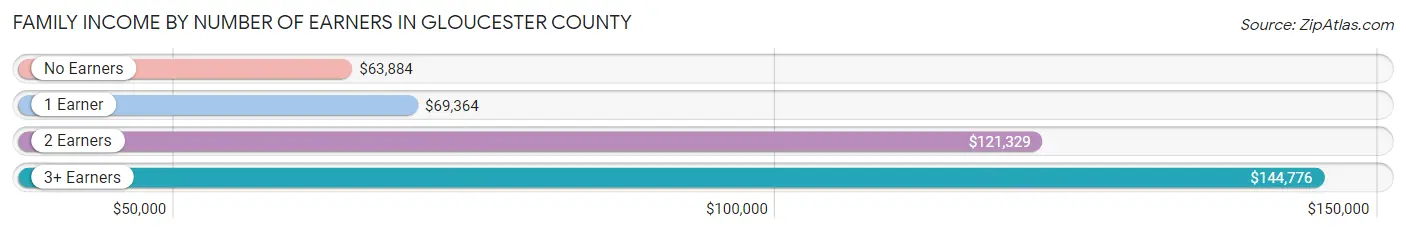
| Number of Earners | # Families | Median Income |
| No Earners | 1,719 (16.5%) | $63,884 |
| 1 Earner | 3,252 (31.2%) | $69,364 |
| 2 Earners | 4,176 (40.0%) | $121,329 |
| 3+ Earners | 1,291 (12.4%) | $144,776 |
| Total | 10,438 (100.0%) | $100,085 |
Household Income in Gloucester County
Household Income Brackets in Gloucester County
With 3,432 households falling in the category, the $100,000 to $149,999 income range is the most frequent in Gloucester County, accounting for 23.1% of all households. In contrast, only 386 households (2.6%) fall into the less than $10,000 income bracket, making it the least populous group.
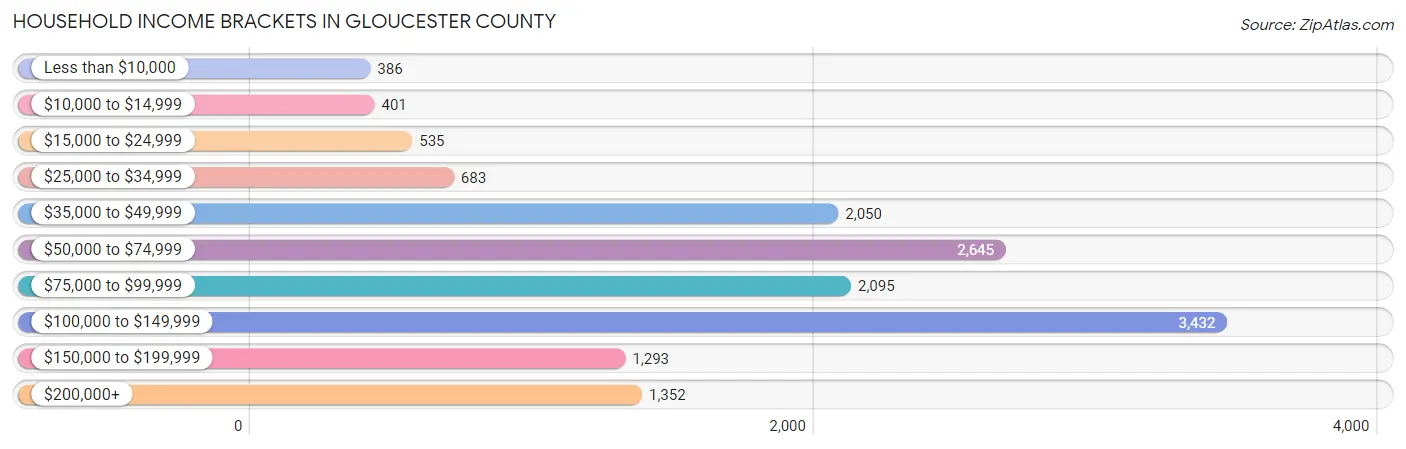
| Income Bracket | # Households | % Households |
| Less than $10,000 | 386 | 2.6% |
| $10,000 to $14,999 | 401 | 2.7% |
| $15,000 to $24,999 | 535 | 3.6% |
| $25,000 to $34,999 | 683 | 4.6% |
| $35,000 to $49,999 | 2,050 | 13.8% |
| $50,000 to $74,999 | 2,645 | 17.8% |
| $75,000 to $99,999 | 2,095 | 14.1% |
| $100,000 to $149,999 | 3,432 | 23.1% |
| $150,000 to $199,999 | 1,293 | 8.7% |
| $200,000+ | 1,352 | 9.1% |
Household Income by Householder Age in Gloucester County
The median household income in Gloucester County is $83,750, with the highest median household income of $104,598 found in the 45 to 64 years age bracket for the primary householder. A total of 6,319 households (42.5%) fall into this category. Meanwhile, the 15 to 24 years age bracket for the primary householder has the lowest median household income of $36,818, with 150 households (1.0%) in this group.
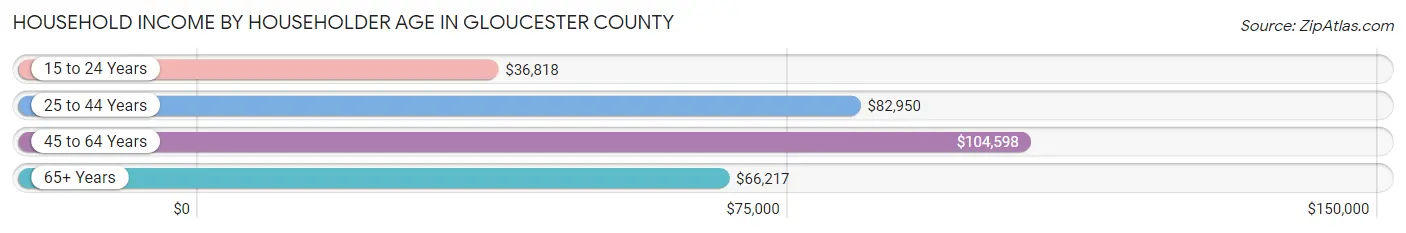
| Income Bracket | # Households | Median Income |
| 15 to 24 Years | 150 (1.0%) | $36,818 |
| 25 to 44 Years | 3,811 (25.7%) | $82,950 |
| 45 to 64 Years | 6,319 (42.5%) | $104,598 |
| 65+ Years | 4,577 (30.8%) | $66,217 |
| Total | 14,857 (100.0%) | $83,750 |
Poverty in Gloucester County
Income Below Poverty by Sex and Age in Gloucester County
With 5.8% poverty level for males and 9.1% for females among the residents of Gloucester County, 16 and 17 year old males and 12 to 14 year old females are the most vulnerable to poverty, with 126 males (28.1%) and 100 females (17.3%) in their respective age groups living below the poverty level.
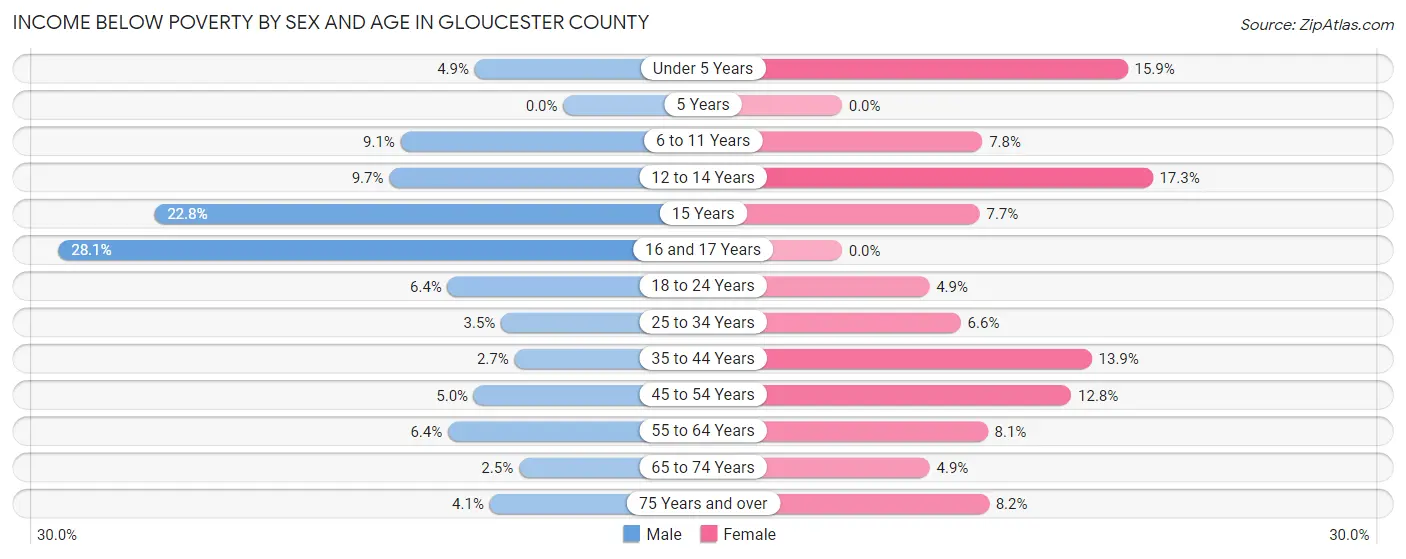
| Age Bracket | Male | Female |
| Under 5 Years | 34 (4.9%) | 122 (15.9%) |
| 5 Years | 0 (0.0%) | 0 (0.0%) |
| 6 to 11 Years | 115 (9.1%) | 110 (7.8%) |
| 12 to 14 Years | 95 (9.7%) | 100 (17.3%) |
| 15 Years | 59 (22.8%) | 25 (7.7%) |
| 16 and 17 Years | 126 (28.1%) | 0 (0.0%) |
| 18 to 24 Years | 99 (6.4%) | 64 (4.9%) |
| 25 to 34 Years | 73 (3.5%) | 142 (6.6%) |
| 35 to 44 Years | 66 (2.7%) | 335 (13.9%) |
| 45 to 54 Years | 120 (5.0%) | 331 (12.8%) |
| 55 to 64 Years | 204 (6.4%) | 271 (8.1%) |
| 65 to 74 Years | 56 (2.5%) | 114 (4.9%) |
| 75 Years and over | 48 (4.1%) | 137 (8.2%) |
| Total | 1,095 (5.8%) | 1,751 (9.1%) |
Income Above Poverty by Sex and Age in Gloucester County
According to the poverty statistics in Gloucester County, males aged 5 years and females aged 5 years are the age groups that are most secure financially, with 100.0% of males and 100.0% of females in these age groups living above the poverty line.
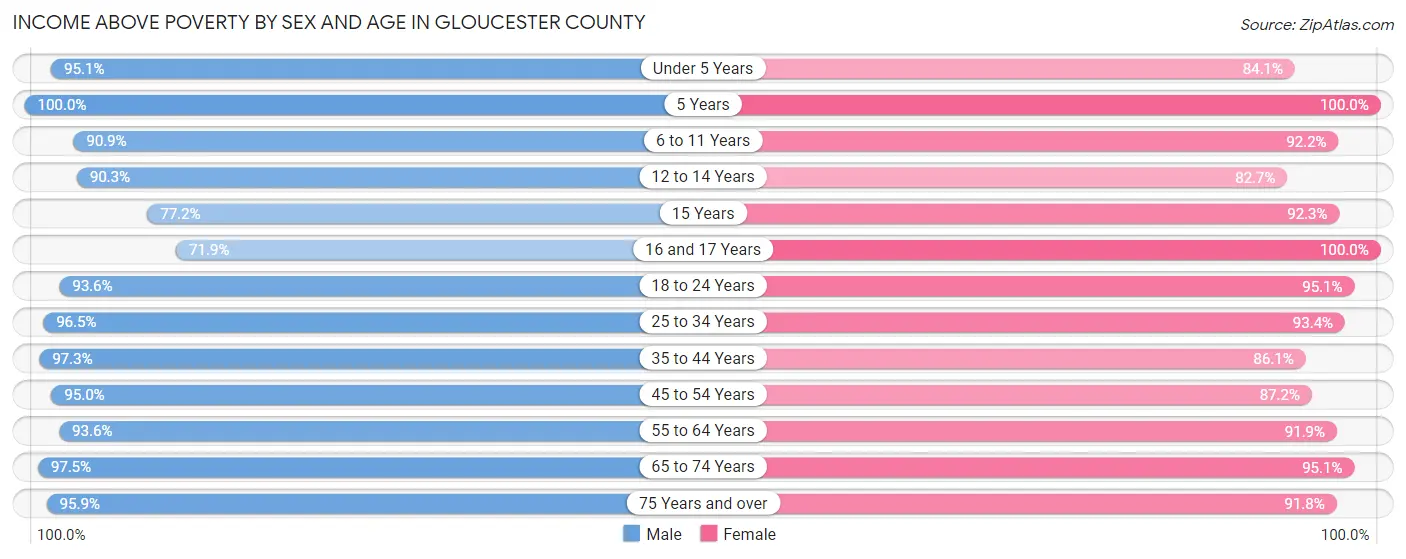
| Age Bracket | Male | Female |
| Under 5 Years | 656 (95.1%) | 645 (84.1%) |
| 5 Years | 145 (100.0%) | 73 (100.0%) |
| 6 to 11 Years | 1,155 (90.9%) | 1,296 (92.2%) |
| 12 to 14 Years | 885 (90.3%) | 478 (82.7%) |
| 15 Years | 200 (77.2%) | 301 (92.3%) |
| 16 and 17 Years | 322 (71.9%) | 338 (100.0%) |
| 18 to 24 Years | 1,438 (93.6%) | 1,250 (95.1%) |
| 25 to 34 Years | 2,034 (96.5%) | 2,002 (93.4%) |
| 35 to 44 Years | 2,359 (97.3%) | 2,073 (86.1%) |
| 45 to 54 Years | 2,288 (95.0%) | 2,262 (87.2%) |
| 55 to 64 Years | 2,975 (93.6%) | 3,066 (91.9%) |
| 65 to 74 Years | 2,209 (97.5%) | 2,217 (95.1%) |
| 75 Years and over | 1,122 (95.9%) | 1,537 (91.8%) |
| Total | 17,788 (94.2%) | 17,538 (90.9%) |
Income Below Poverty Among Married-Couple Families in Gloucester County
The poverty statistics for married-couple families in Gloucester County show that 1.8% or 150 of the total 8,223 families live below the poverty line. Families with no children have the highest poverty rate of 2.0%, comprising of 113 families. On the other hand, families with 3 or 4 children have the lowest poverty rate of 0.0%, which includes 0 families.
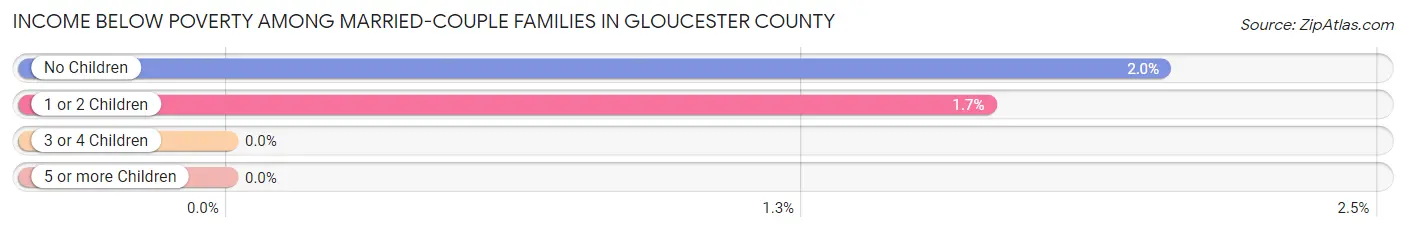
| Children | Above Poverty | Below Poverty |
| No Children | 5,450 (98.0%) | 113 (2.0%) |
| 1 or 2 Children | 2,201 (98.4%) | 37 (1.7%) |
| 3 or 4 Children | 394 (100.0%) | 0 (0.0%) |
| 5 or more Children | 28 (100.0%) | 0 (0.0%) |
| Total | 8,073 (98.2%) | 150 (1.8%) |
Income Below Poverty Among Single-Parent Households in Gloucester County
According to the poverty data in Gloucester County, 11.5% or 76 single-father households and 17.7% or 275 single-mother households are living below the poverty line. Among single-father households, those with 3 or 4 children have the highest poverty rate, with 39 households (32.5%) experiencing poverty. Likewise, among single-mother households, those with 3 or 4 children have the highest poverty rate, with 53 households (35.1%) falling below the poverty line.
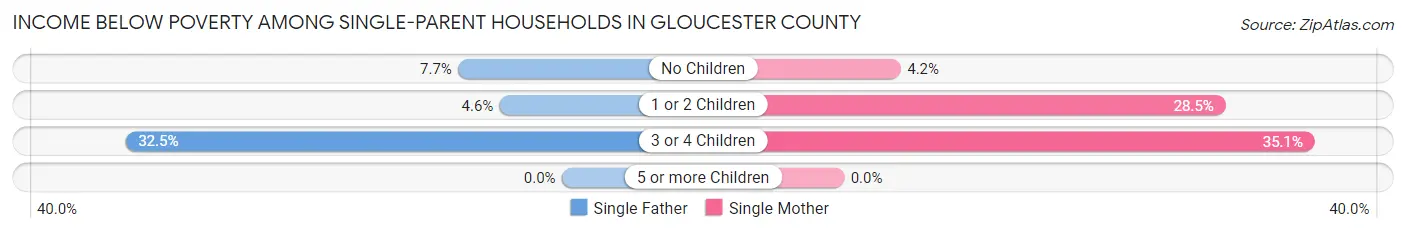
| Children | Single Father | Single Mother |
| No Children | 30 (7.7%) | 31 (4.2%) |
| 1 or 2 Children | 7 (4.6%) | 191 (28.5%) |
| 3 or 4 Children | 39 (32.5%) | 53 (35.1%) |
| 5 or more Children | 0 (0.0%) | 0 (0.0%) |
| Total | 76 (11.5%) | 275 (17.7%) |
Income Below Poverty Among Married-Couple vs Single-Parent Households in Gloucester County
The poverty data for Gloucester County shows that 150 of the married-couple family households (1.8%) and 351 of the single-parent households (15.9%) are living below the poverty level. Within the married-couple family households, those with no children have the highest poverty rate, with 113 households (2.0%) falling below the poverty line. Among the single-parent households, those with 3 or 4 children have the highest poverty rate, with 92 household (34.0%) living below poverty.
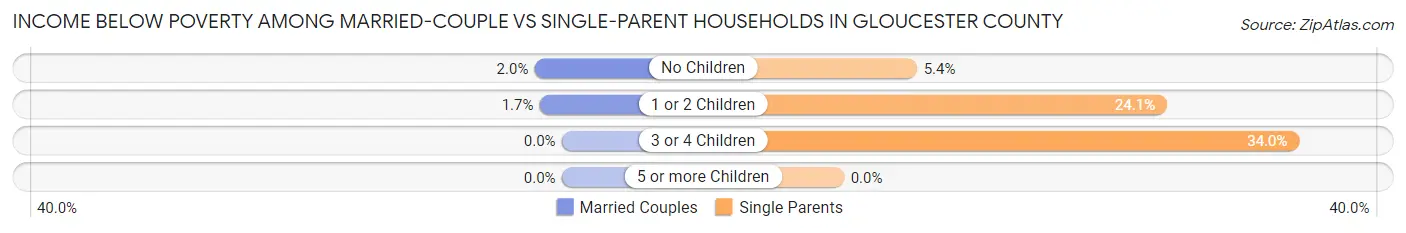
| Children | Married-Couple Families | Single-Parent Households |
| No Children | 113 (2.0%) | 61 (5.4%) |
| 1 or 2 Children | 37 (1.7%) | 198 (24.1%) |
| 3 or 4 Children | 0 (0.0%) | 92 (34.0%) |
| 5 or more Children | 0 (0.0%) | 0 (0.0%) |
| Total | 150 (1.8%) | 351 (15.9%) |
Race in Gloucester County
The most populous races in Gloucester County are White / Caucasian (32,867 | 84.6%), Black / African American (3,172 | 8.2%), and Two or more Races (2,200 | 5.7%).
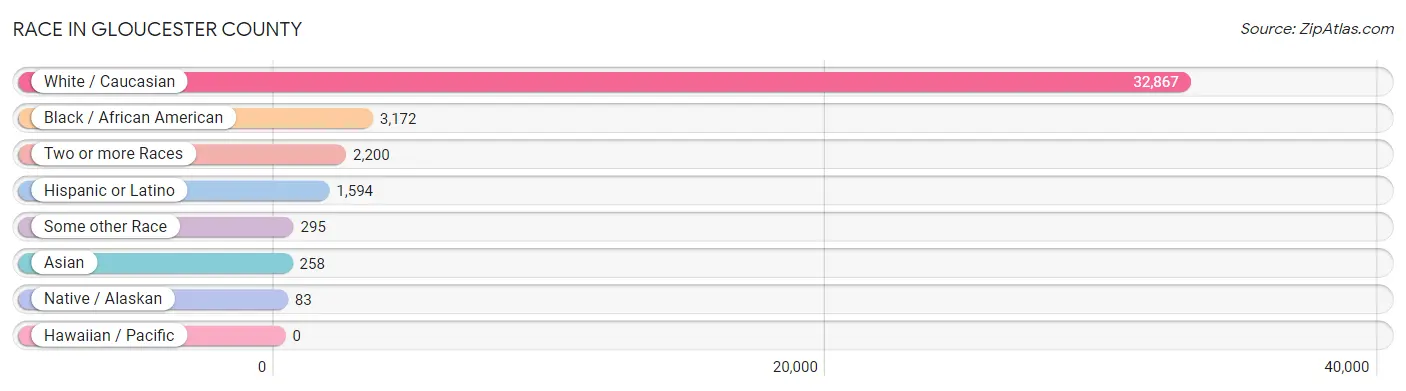
| Race | # Population | % Population |
| Asian | 258 | 0.7% |
| Black / African American | 3,172 | 8.2% |
| Hawaiian / Pacific | 0 | 0.0% |
| Hispanic or Latino | 1,594 | 4.1% |
| Native / Alaskan | 83 | 0.2% |
| White / Caucasian | 32,867 | 84.6% |
| Two or more Races | 2,200 | 5.7% |
| Some other Race | 295 | 0.8% |
| Total | 38,875 | 100.0% |
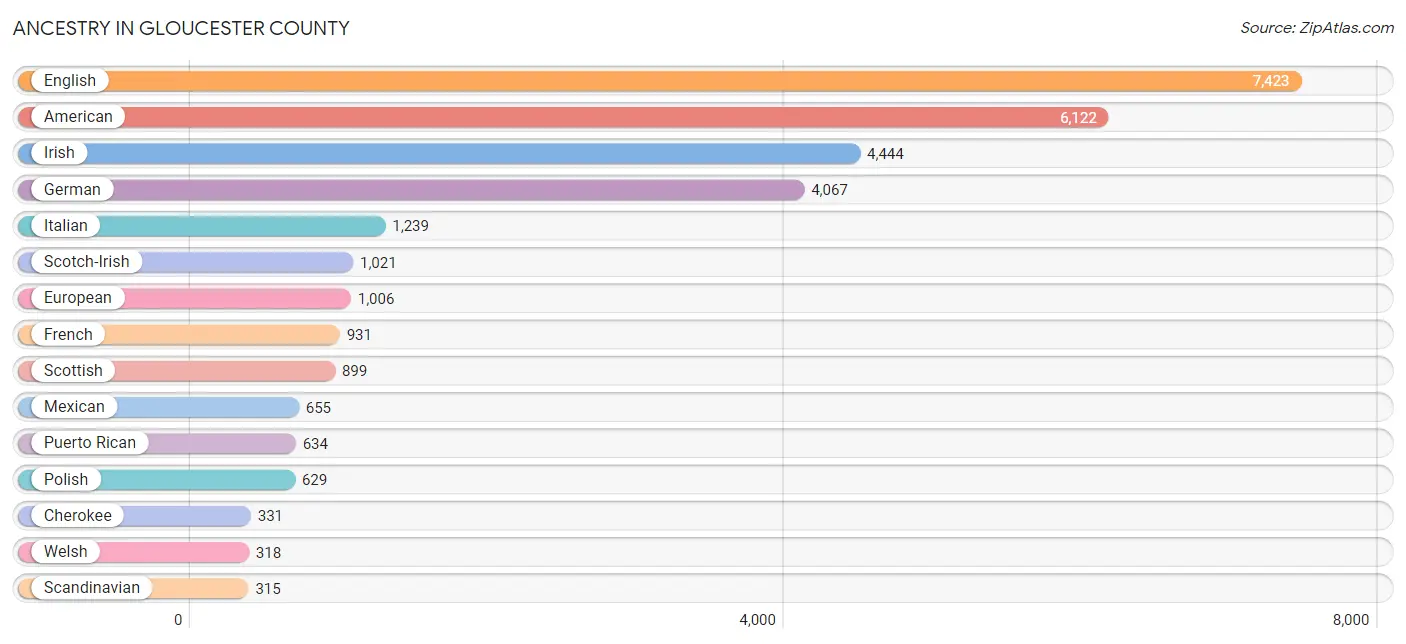
Ancestry in Gloucester County
The most populous ancestries reported in Gloucester County are English (7,423 | 19.1%), American (6,122 | 15.8%), Irish (4,444 | 11.4%), German (4,067 | 10.5%), and Italian (1,239 | 3.2%), together accounting for 59.9% of all Gloucester County residents.
| Ancestry | # Population | % Population |
| Afghan | 19 | 0.1% |
| African | 72 | 0.2% |
| American | 6,122 | 15.8% |
| Arab | 27 | 0.1% |
| Armenian | 10 | 0.0% |
| Austrian | 37 | 0.1% |
| Belgian | 14 | 0.0% |
| Bhutanese | 24 | 0.1% |
| Blackfeet | 73 | 0.2% |
| British | 254 | 0.6% |
| Burmese | 53 | 0.1% |
| Canadian | 43 | 0.1% |
| Central American | 60 | 0.2% |
| Cherokee | 331 | 0.9% |
| Colombian | 89 | 0.2% |
| Cuban | 53 | 0.1% |
| Czech | 21 | 0.1% |
| Danish | 210 | 0.5% |
| Dutch | 239 | 0.6% |
| Eastern European | 193 | 0.5% |
| English | 7,423 | 19.1% |
| Ethiopian | 27 | 0.1% |
| European | 1,006 | 2.6% |
| Filipino | 15 | 0.0% |
| Finnish | 15 | 0.0% |
| French | 931 | 2.4% |
| French Canadian | 40 | 0.1% |
| German | 4,067 | 10.5% |
| German Russian | 12 | 0.0% |
| Greek | 143 | 0.4% |
| Hungarian | 9 | 0.0% |
| Indian (Asian) | 123 | 0.3% |
| Irish | 4,444 | 11.4% |
| Italian | 1,239 | 3.2% |
| Korean | 57 | 0.2% |
| Lebanese | 8 | 0.0% |
| Lithuanian | 35 | 0.1% |
| Mexican | 655 | 1.7% |
| Navajo | 21 | 0.1% |
| Northern European | 38 | 0.1% |
| Norwegian | 206 | 0.5% |
| Pakistani | 61 | 0.2% |
| Panamanian | 12 | 0.0% |
| Pennsylvania German | 14 | 0.0% |
| Polish | 629 | 1.6% |
| Portuguese | 198 | 0.5% |
| Puerto Rican | 634 | 1.6% |
| Russian | 22 | 0.1% |
| Salvadoran | 48 | 0.1% |
| Scandinavian | 315 | 0.8% |
| Scotch-Irish | 1,021 | 2.6% |
| Scottish | 899 | 2.3% |
| Slavic | 13 | 0.0% |
| Slovak | 43 | 0.1% |
| Slovene | 14 | 0.0% |
| South American | 89 | 0.2% |
| Spaniard | 41 | 0.1% |
| Spanish | 13 | 0.0% |
| Sri Lankan | 33 | 0.1% |
| Subsaharan African | 99 | 0.3% |
| Swedish | 275 | 0.7% |
| Swiss | 77 | 0.2% |
| Syrian | 19 | 0.1% |
| Thai | 137 | 0.4% |
| Ukrainian | 133 | 0.3% |
| Welsh | 318 | 0.8% |
| Yaqui | 29 | 0.1% | View All 67 Rows |
Immigrants in Gloucester County
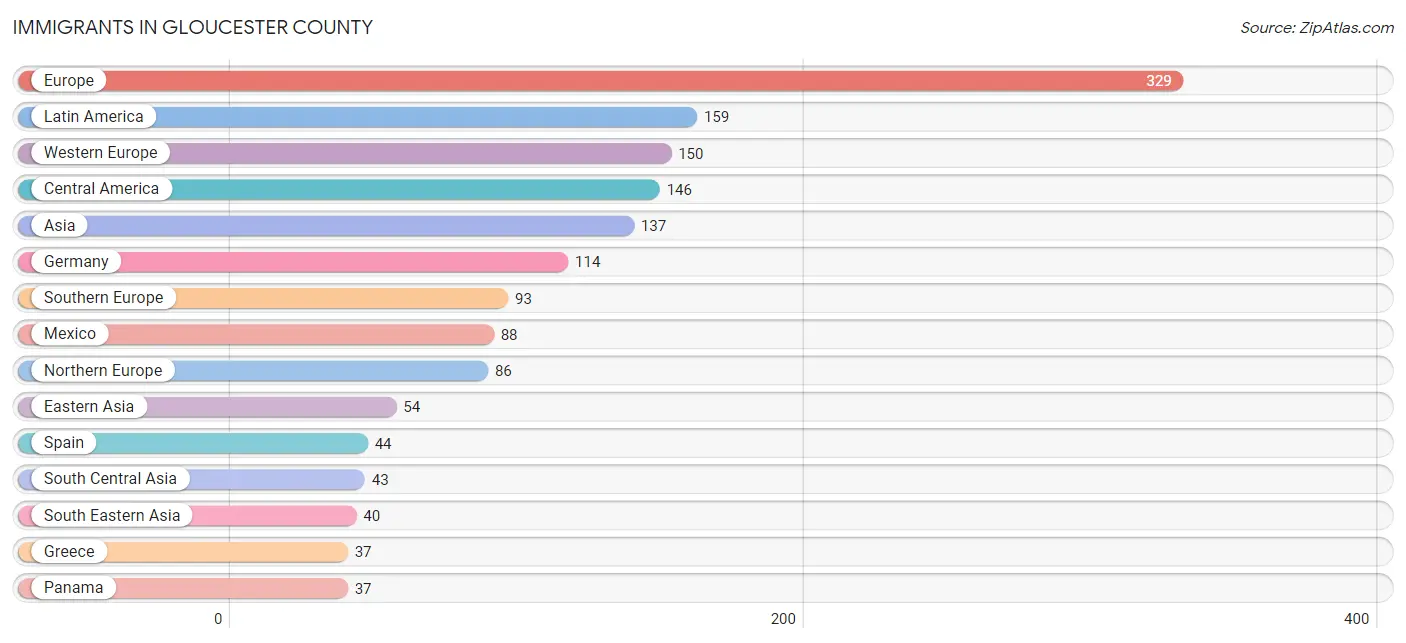
The most numerous immigrant groups reported in Gloucester County came from Europe (329 | 0.9%), Latin America (159 | 0.4%), Western Europe (150 | 0.4%), Central America (146 | 0.4%), and Asia (137 | 0.4%), together accounting for 2.4% of all Gloucester County residents.
| Immigration Origin | # Population | % Population |
| Afghanistan | 19 | 0.1% |
| Africa | 9 | 0.0% |
| Asia | 137 | 0.4% |
| Canada | 22 | 0.1% |
| Central America | 146 | 0.4% |
| China | 21 | 0.1% |
| Eastern Africa | 9 | 0.0% |
| Eastern Asia | 54 | 0.1% |
| El Salvador | 21 | 0.1% |
| England | 23 | 0.1% |
| Eritrea | 9 | 0.0% |
| Europe | 329 | 0.9% |
| France | 28 | 0.1% |
| Germany | 114 | 0.3% |
| Greece | 37 | 0.1% |
| Guyana | 13 | 0.0% |
| India | 24 | 0.1% |
| Italy | 12 | 0.0% |
| Korea | 33 | 0.1% |
| Latin America | 159 | 0.4% |
| Malaysia | 17 | 0.0% |
| Mexico | 88 | 0.2% |
| Northern Europe | 86 | 0.2% |
| Panama | 37 | 0.1% |
| South America | 13 | 0.0% |
| South Central Asia | 43 | 0.1% |
| South Eastern Asia | 40 | 0.1% |
| Southern Europe | 93 | 0.2% |
| Spain | 44 | 0.1% |
| Sweden | 9 | 0.0% |
| Switzerland | 8 | 0.0% |
| Thailand | 23 | 0.1% |
| Western Europe | 150 | 0.4% | View All 33 Rows |
Sex and Age in Gloucester County
Sex and Age in Gloucester County
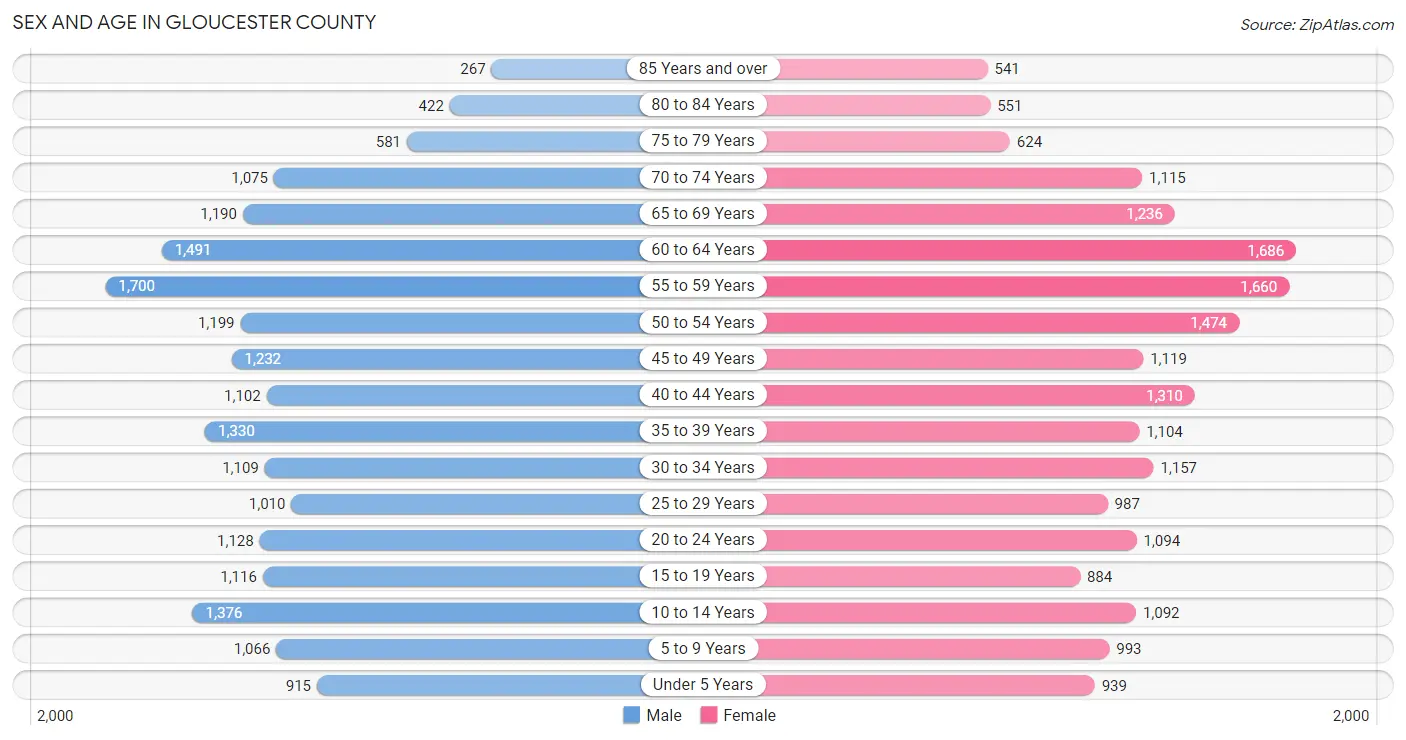
The most populous age groups in Gloucester County are 55 to 59 Years (1,700 | 8.8%) for men and 60 to 64 Years (1,686 | 8.6%) for women.
| Age Bracket | Male | Female |
| Under 5 Years | 915 (4.7%) | 939 (4.8%) |
| 5 to 9 Years | 1,066 (5.5%) | 993 (5.1%) |
| 10 to 14 Years | 1,376 (7.1%) | 1,092 (5.6%) |
| 15 to 19 Years | 1,116 (5.8%) | 884 (4.5%) |
| 20 to 24 Years | 1,128 (5.8%) | 1,094 (5.6%) |
| 25 to 29 Years | 1,010 (5.2%) | 987 (5.0%) |
| 30 to 34 Years | 1,109 (5.7%) | 1,157 (5.9%) |
| 35 to 39 Years | 1,330 (6.9%) | 1,104 (5.6%) |
| 40 to 44 Years | 1,102 (5.7%) | 1,310 (6.7%) |
| 45 to 49 Years | 1,232 (6.4%) | 1,119 (5.7%) |
| 50 to 54 Years | 1,199 (6.2%) | 1,474 (7.5%) |
| 55 to 59 Years | 1,700 (8.8%) | 1,660 (8.5%) |
| 60 to 64 Years | 1,491 (7.7%) | 1,686 (8.6%) |
| 65 to 69 Years | 1,190 (6.2%) | 1,236 (6.3%) |
| 70 to 74 Years | 1,075 (5.6%) | 1,115 (5.7%) |
| 75 to 79 Years | 581 (3.0%) | 624 (3.2%) |
| 80 to 84 Years | 422 (2.2%) | 551 (2.8%) |
| 85 Years and over | 267 (1.4%) | 541 (2.8%) |
| Total | 19,309 (100.0%) | 19,566 (100.0%) |
Families and Households in Gloucester County
Median Family Size in Gloucester County
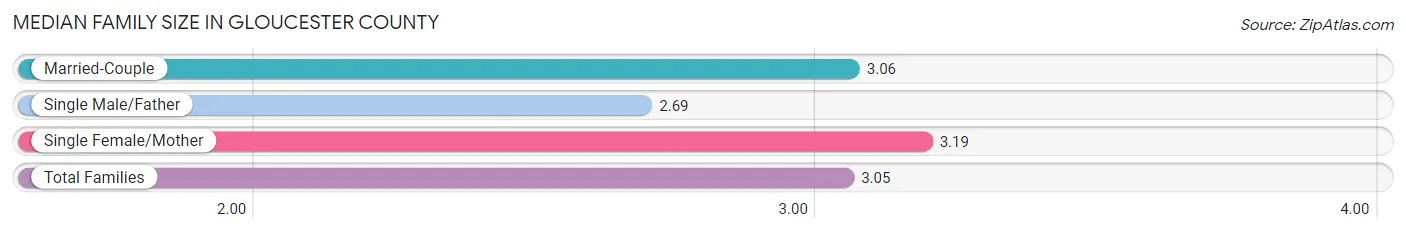
The median family size in Gloucester County is 3.05 persons per family, with single female/mother families (1,556 | 14.9%) accounting for the largest median family size of 3.19 persons per family. On the other hand, single male/father families (659 | 6.3%) represent the smallest median family size with 2.69 persons per family.
| Family Type | # Families | Family Size |
| Married-Couple | 8,223 (78.8%) | 3.06 |
| Single Male/Father | 659 (6.3%) | 2.69 |
| Single Female/Mother | 1,556 (14.9%) | 3.19 |
| Total Families | 10,438 (100.0%) | 3.05 |
Median Household Size in Gloucester County
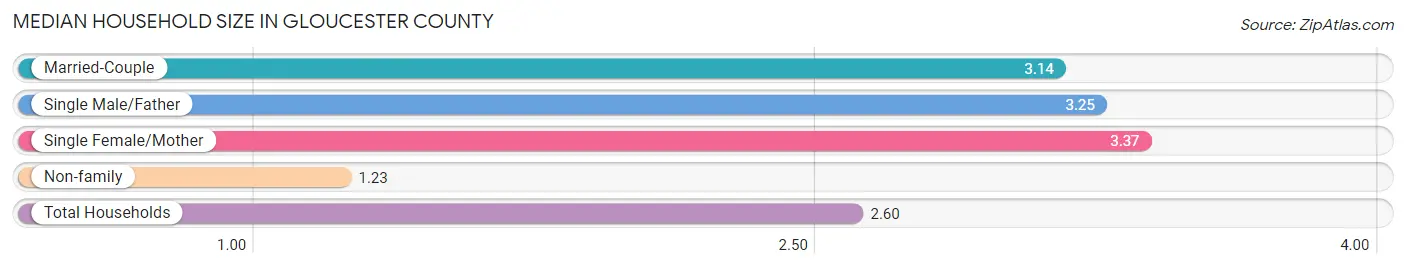
The median household size in Gloucester County is 2.60 persons per household, with single female/mother households (1,556 | 10.5%) accounting for the largest median household size of 3.37 persons per household. non-family households (4,419 | 29.7%) represent the smallest median household size with 1.23 persons per household.
| Household Type | # Households | Household Size |
| Married-Couple | 8,223 (55.3%) | 3.14 |
| Single Male/Father | 659 (4.4%) | 3.25 |
| Single Female/Mother | 1,556 (10.5%) | 3.37 |
| Non-family | 4,419 (29.7%) | 1.23 |
| Total Households | 14,857 (100.0%) | 2.60 |
Household Size by Marriage Status in Gloucester County
Out of a total of 14,857 households in Gloucester County, 10,438 (70.3%) are family households, while 4,419 (29.7%) are nonfamily households. The most numerous type of family households are 2-person households, comprising 5,181, and the most common type of nonfamily households are 1-person households, comprising 3,578.
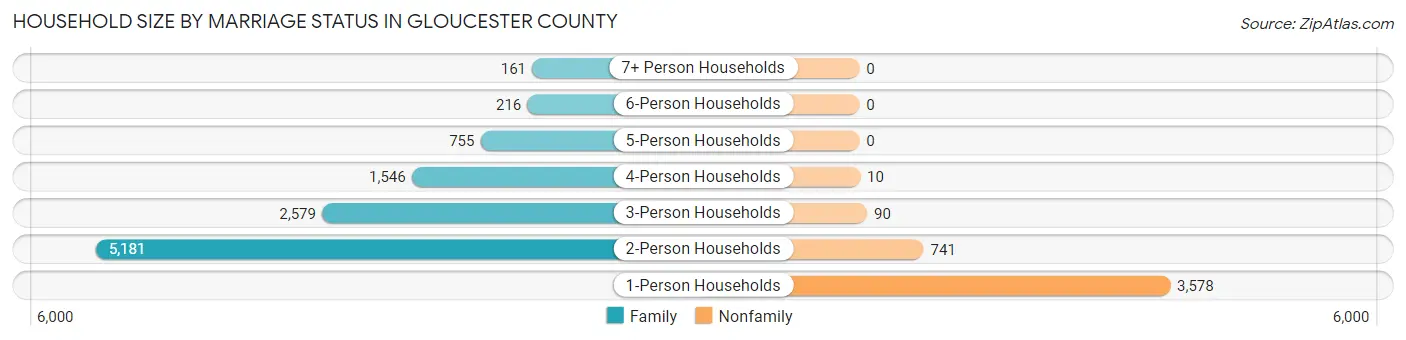
| Household Size | Family Households | Nonfamily Households |
| 1-Person Households | - | 3,578 (24.1%) |
| 2-Person Households | 5,181 (34.9%) | 741 (5.0%) |
| 3-Person Households | 2,579 (17.4%) | 90 (0.6%) |
| 4-Person Households | 1,546 (10.4%) | 10 (0.1%) |
| 5-Person Households | 755 (5.1%) | 0 (0.0%) |
| 6-Person Households | 216 (1.5%) | 0 (0.0%) |
| 7+ Person Households | 161 (1.1%) | 0 (0.0%) |
| Total | 10,438 (70.3%) | 4,419 (29.7%) |
Female Fertility in Gloucester County
Fertility by Age in Gloucester County
Average fertility rate in Gloucester County is 28.0 births per 1,000 women. Women in the age bracket of 20 to 34 years have the highest fertility rate with 38.0 births per 1,000 women. Women in the age bracket of 20 to 34 years acount for 54.0% of all women with births.
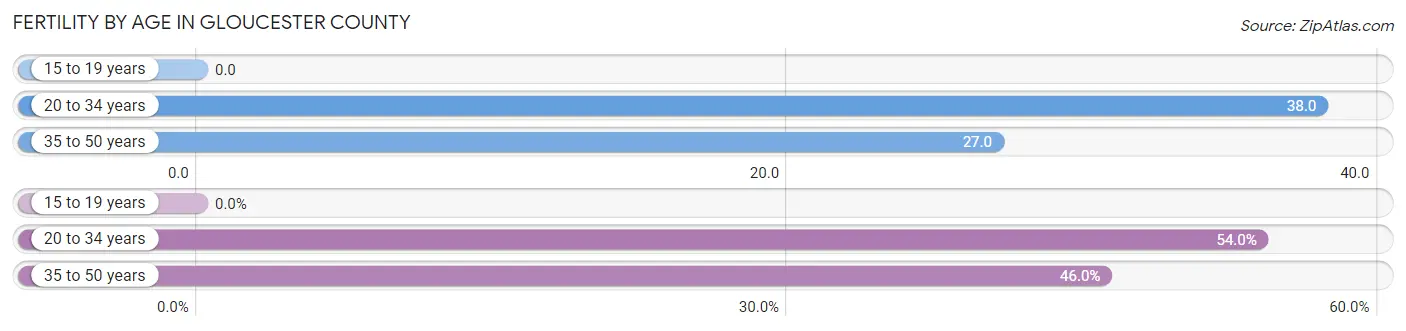
| Age Bracket | Women with Births | Births / 1,000 Women |
| 15 to 19 years | 0 (0.0%) | 0.0 |
| 20 to 34 years | 122 (54.0%) | 38.0 |
| 35 to 50 years | 104 (46.0%) | 27.0 |
| Total | 226 (100.0%) | 28.0 |
Fertility by Age by Marriage Status in Gloucester County
83.2% of women with births (226) in Gloucester County are married. The highest percentage of unmarried women with births falls into 20 to 34 years age bracket with 23.0% of them unmarried at the time of birth, while the lowest percentage of unmarried women with births belong to 35 to 50 years age bracket with 9.6% of them unmarried.
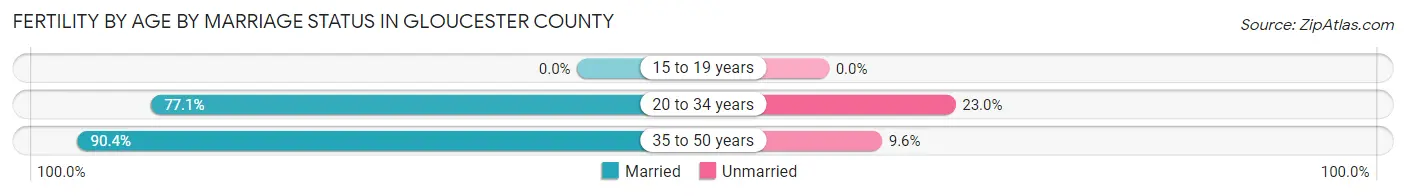
| Age Bracket | Married | Unmarried |
| 15 to 19 years | 0 (0.0%) | 0 (0.0%) |
| 20 to 34 years | 94 (77.0%) | 28 (23.0%) |
| 35 to 50 years | 94 (90.4%) | 10 (9.6%) |
| Total | 188 (83.2%) | 38 (16.8%) |
Fertility by Education in Gloucester County
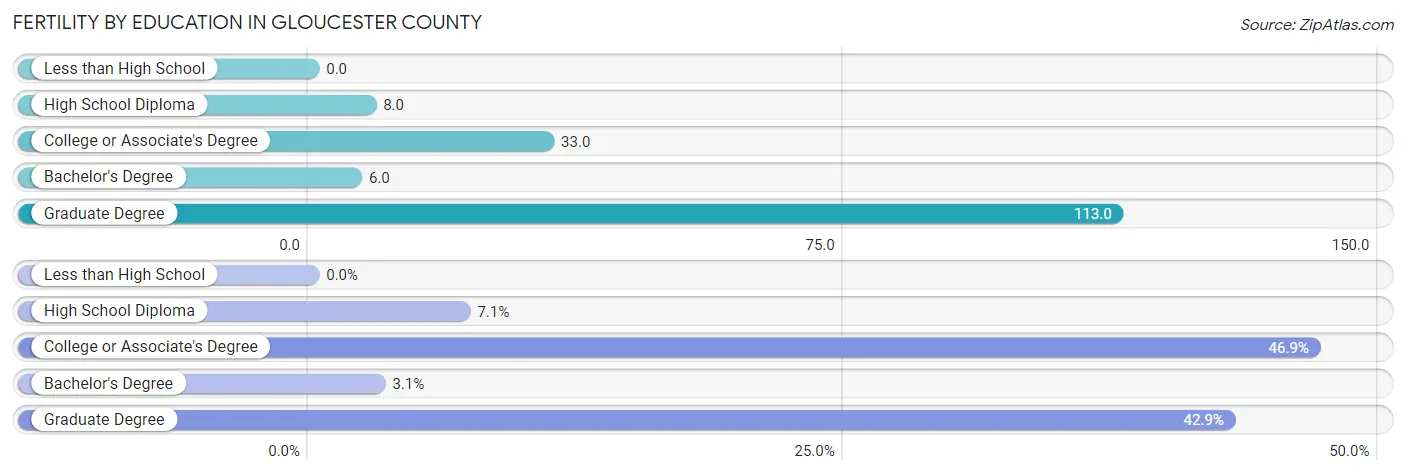
| Educational Attainment | Women with Births | Births / 1,000 Women |
| Less than High School | 0 (0.0%) | 0.0 |
| High School Diploma | 16 (7.1%) | 8.0 |
| College or Associate's Degree | 106 (46.9%) | 33.0 |
| Bachelor's Degree | 7 (3.1%) | 6.0 |
| Graduate Degree | 97 (42.9%) | 113.0 |
| Total | 226 (100.0%) | 28.0 |
Fertility by Education by Marriage Status in Gloucester County
16.8% of women with births in Gloucester County are unmarried. Women with the educational attainment of bachelor's degree are most likely to be married with 100.0% of them married at childbirth, while women with the educational attainment of high school diploma are least likely to be married with 31.2% of them unmarried at childbirth.
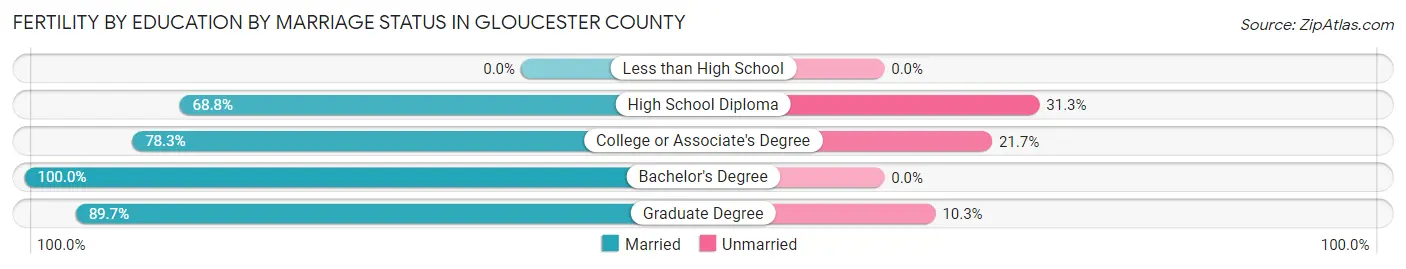
| Educational Attainment | Married | Unmarried |
| Less than High School | 0 (0.0%) | 0 (0.0%) |
| High School Diploma | 11 (68.8%) | 5 (31.2%) |
| College or Associate's Degree | 83 (78.3%) | 23 (21.7%) |
| Bachelor's Degree | 7 (100.0%) | 0 (0.0%) |
| Graduate Degree | 87 (89.7%) | 10 (10.3%) |
| Total | 188 (83.2%) | 38 (16.8%) |
Employment Characteristics in Gloucester County
Employment by Class of Employer in Gloucester County
Among the 19,083 employed individuals in Gloucester County, private company employees (11,748 | 61.6%), local government employees (2,063 | 10.8%), and federal government employees (1,549 | 8.1%) make up the most common classes of employment.
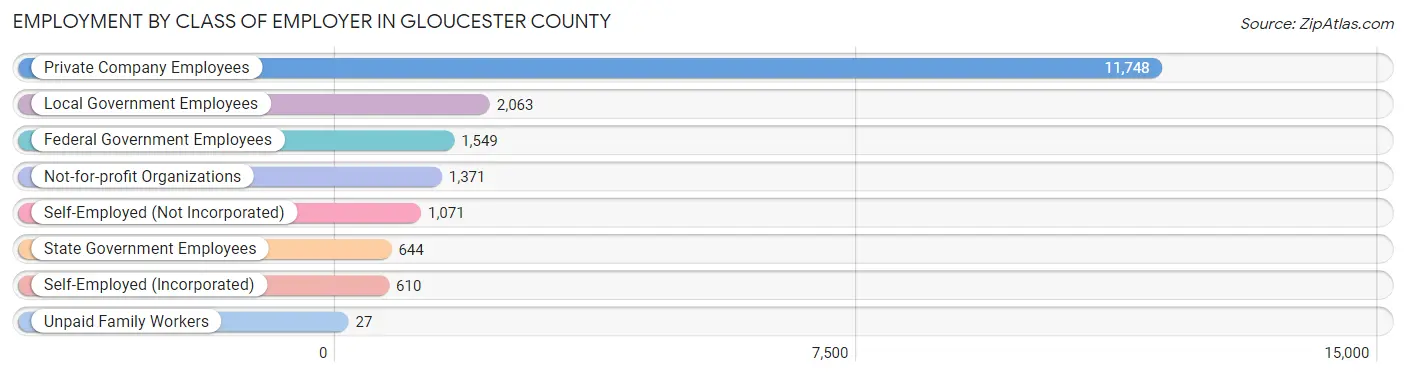
| Employer Class | # Employees | % Employees |
| Private Company Employees | 11,748 | 61.6% |
| Self-Employed (Incorporated) | 610 | 3.2% |
| Self-Employed (Not Incorporated) | 1,071 | 5.6% |
| Not-for-profit Organizations | 1,371 | 7.2% |
| Local Government Employees | 2,063 | 10.8% |
| State Government Employees | 644 | 3.4% |
| Federal Government Employees | 1,549 | 8.1% |
| Unpaid Family Workers | 27 | 0.1% |
| Total | 19,083 | 100.0% |
Employment Status by Age in Gloucester County
According to the labor force statistics for Gloucester County, out of the total population over 16 years of age (31,909), 63.1% or 20,135 individuals are in the labor force, with 3.4% or 685 of them unemployed. The age group with the highest labor force participation rate is 25 to 29 years, with 89.5% or 1,787 individuals in the labor force. Within the labor force, the 16 to 19 years age range has the highest percentage of unemployed individuals, with 14.6% or 74 of them being unemployed.
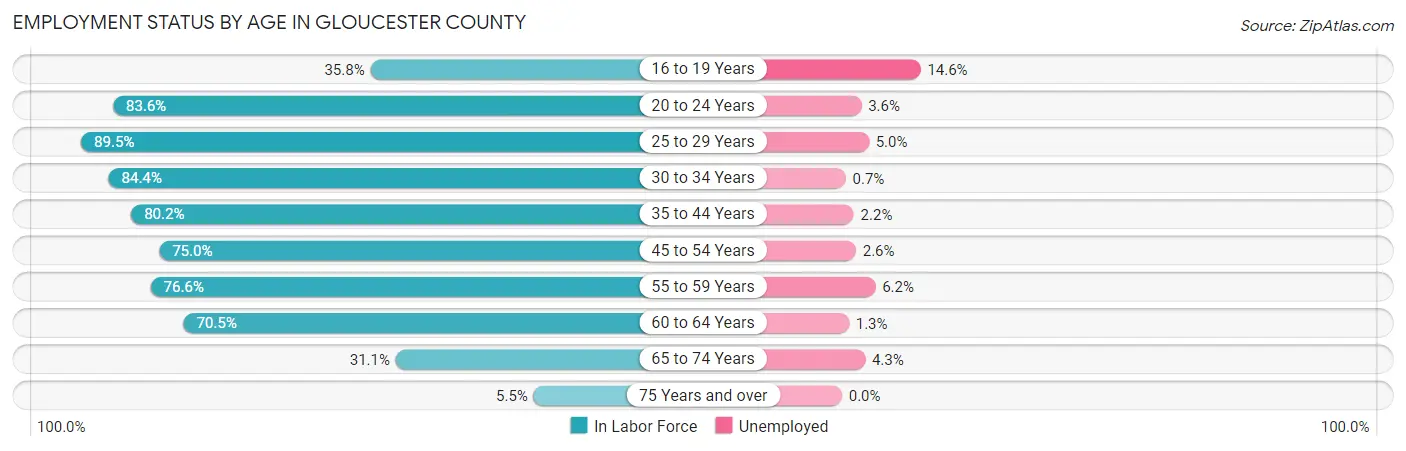
| Age Bracket | In Labor Force | Unemployed |
| 16 to 19 Years | 507 (35.8%) | 74 (14.6%) |
| 20 to 24 Years | 1,858 (83.6%) | 67 (3.6%) |
| 25 to 29 Years | 1,787 (89.5%) | 89 (5.0%) |
| 30 to 34 Years | 1,913 (84.4%) | 13 (0.7%) |
| 35 to 44 Years | 3,886 (80.2%) | 85 (2.2%) |
| 45 to 54 Years | 3,768 (75.0%) | 98 (2.6%) |
| 55 to 59 Years | 2,574 (76.6%) | 160 (6.2%) |
| 60 to 64 Years | 2,240 (70.5%) | 29 (1.3%) |
| 65 to 74 Years | 1,436 (31.1%) | 62 (4.3%) |
| 75 Years and over | 164 (5.5%) | 0 (0.0%) |
| Total | 20,135 (63.1%) | 685 (3.4%) |
Employment Status by Educational Attainment in Gloucester County
According to labor force statistics for Gloucester County, 78.2% of individuals (16,164) out of the total population between 25 and 64 years of age (20,670) are in the labor force, with 3.0% or 485 of them being unemployed. The group with the highest labor force participation rate are those with the educational attainment of bachelor's degree or higher, with 83.3% or 4,345 individuals in the labor force. Within the labor force, individuals with high school diploma education have the highest percentage of unemployment, with 3.7% or 178 of them being unemployed.
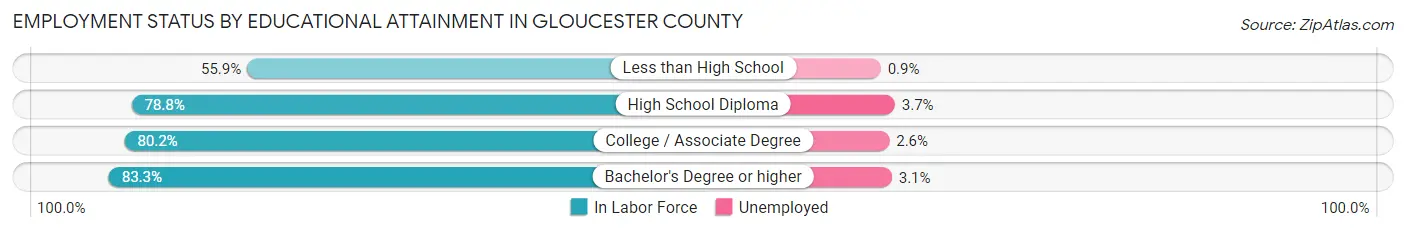
| Educational Attainment | In Labor Force | Unemployed |
| Less than High School | 1,103 (55.9%) | 18 (0.9%) |
| High School Diploma | 4,807 (78.8%) | 226 (3.7%) |
| College / Associate Degree | 5,920 (80.2%) | 192 (2.6%) |
| Bachelor's Degree or higher | 4,345 (83.3%) | 162 (3.1%) |
| Total | 16,164 (78.2%) | 620 (3.0%) |
Employment Occupations by Sex in Gloucester County
Management, Business, Science and Arts Occupations
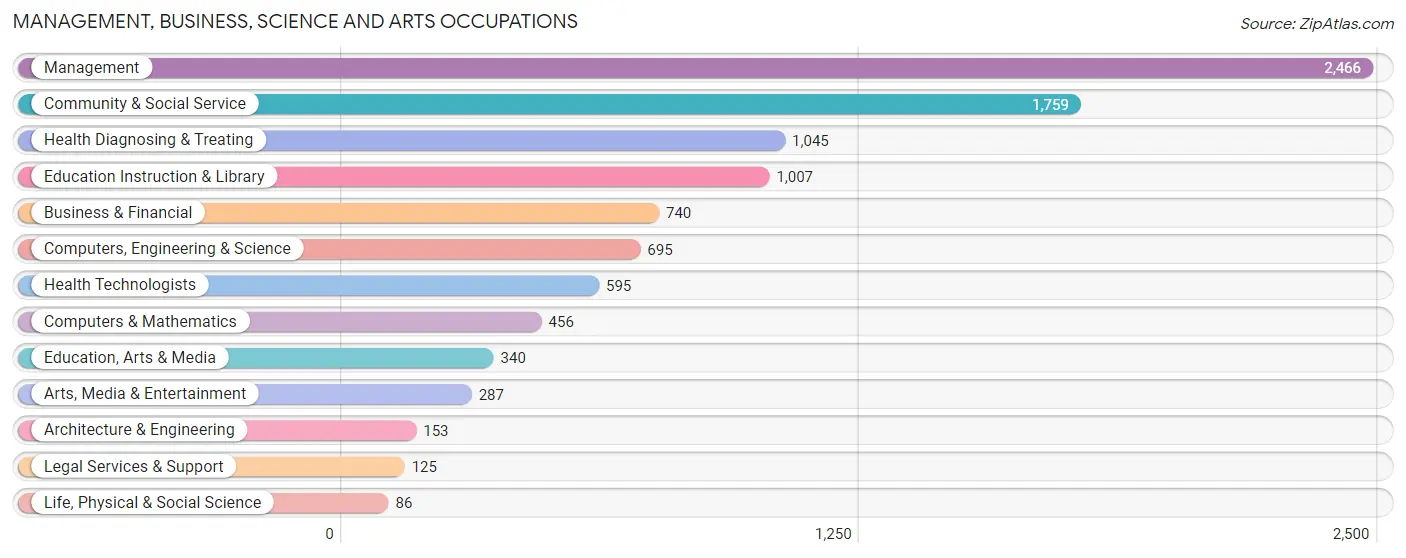
The most common Management, Business, Science and Arts occupations in Gloucester County are Management (2,466 | 13.0%), Community & Social Service (1,759 | 9.2%), Health Diagnosing & Treating (1,045 | 5.5%), Education Instruction & Library (1,007 | 5.3%), and Business & Financial (740 | 3.9%).
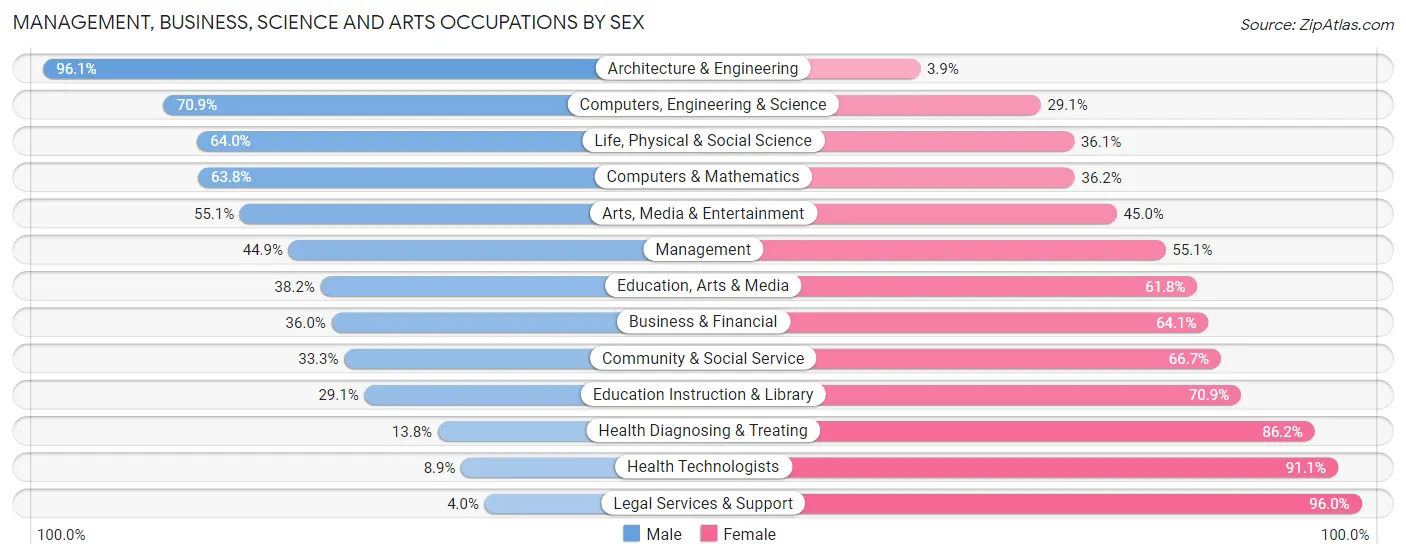
Management, Business, Science and Arts Occupations by Sex
Within the Management, Business, Science and Arts occupations in Gloucester County, the most male-oriented occupations are Architecture & Engineering (96.1%), Computers, Engineering & Science (70.9%), and Life, Physical & Social Science (63.9%), while the most female-oriented occupations are Legal Services & Support (96.0%), Health Technologists (91.1%), and Health Diagnosing & Treating (86.2%).
| Occupation | Male | Female |
| Management | 1,107 (44.9%) | 1,359 (55.1%) |
| Business & Financial | 266 (35.9%) | 474 (64.0%) |
| Computers, Engineering & Science | 493 (70.9%) | 202 (29.1%) |
| Computers & Mathematics | 291 (63.8%) | 165 (36.2%) |
| Architecture & Engineering | 147 (96.1%) | 6 (3.9%) |
| Life, Physical & Social Science | 55 (63.9%) | 31 (36.0%) |
| Community & Social Service | 586 (33.3%) | 1,173 (66.7%) |
| Education, Arts & Media | 130 (38.2%) | 210 (61.8%) |
| Legal Services & Support | 5 (4.0%) | 120 (96.0%) |
| Education Instruction & Library | 293 (29.1%) | 714 (70.9%) |
| Arts, Media & Entertainment | 158 (55.0%) | 129 (45.0%) |
| Health Diagnosing & Treating | 144 (13.8%) | 901 (86.2%) |
| Health Technologists | 53 (8.9%) | 542 (91.1%) |
| Total (Category) | 2,596 (38.7%) | 4,109 (61.3%) |
| Total (Overall) | 10,221 (53.7%) | 8,799 (46.3%) |
Services Occupations
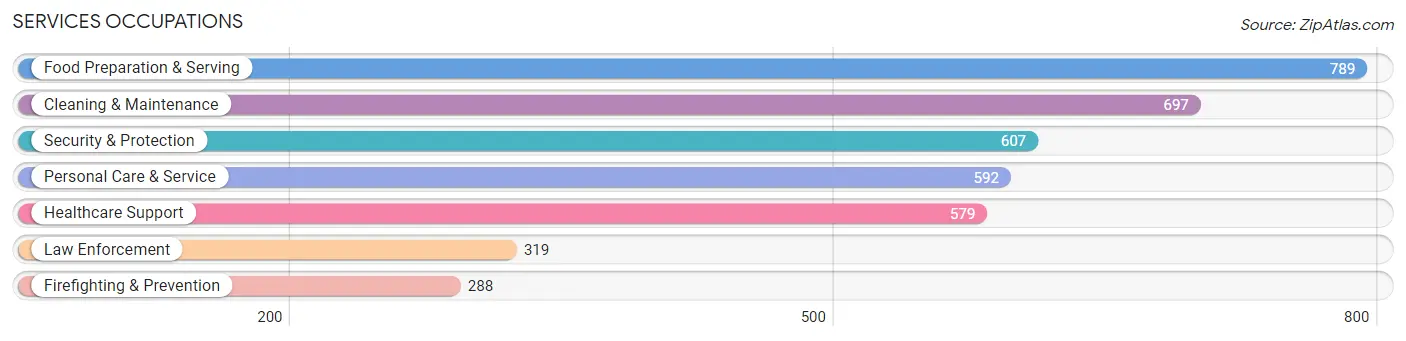
The most common Services occupations in Gloucester County are Food Preparation & Serving (789 | 4.2%), Cleaning & Maintenance (697 | 3.7%), Security & Protection (607 | 3.2%), Personal Care & Service (592 | 3.1%), and Healthcare Support (579 | 3.0%).
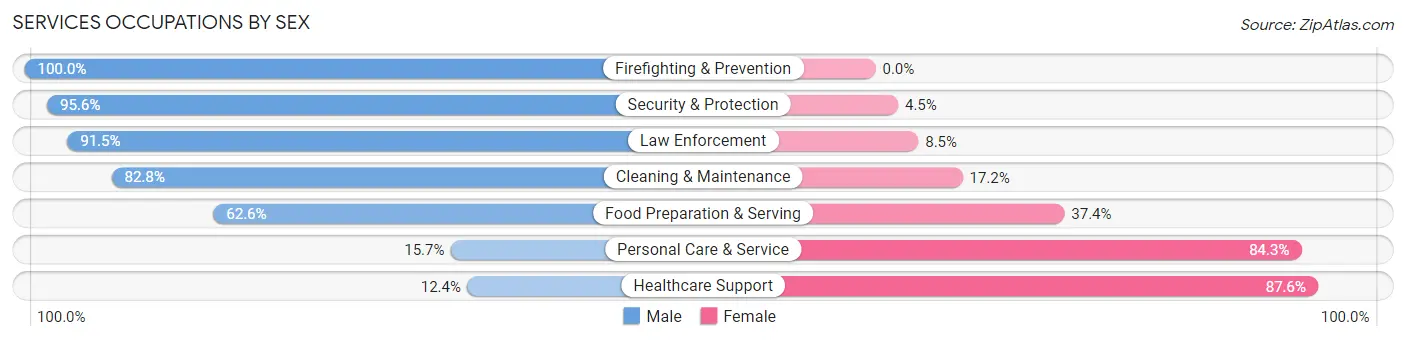
Services Occupations by Sex
Within the Services occupations in Gloucester County, the most male-oriented occupations are Firefighting & Prevention (100.0%), Security & Protection (95.6%), and Law Enforcement (91.5%), while the most female-oriented occupations are Healthcare Support (87.6%), Personal Care & Service (84.3%), and Food Preparation & Serving (37.4%).
| Occupation | Male | Female |
| Healthcare Support | 72 (12.4%) | 507 (87.6%) |
| Security & Protection | 580 (95.6%) | 27 (4.4%) |
| Firefighting & Prevention | 288 (100.0%) | 0 (0.0%) |
| Law Enforcement | 292 (91.5%) | 27 (8.5%) |
| Food Preparation & Serving | 494 (62.6%) | 295 (37.4%) |
| Cleaning & Maintenance | 577 (82.8%) | 120 (17.2%) |
| Personal Care & Service | 93 (15.7%) | 499 (84.3%) |
| Total (Category) | 1,816 (55.6%) | 1,448 (44.4%) |
| Total (Overall) | 10,221 (53.7%) | 8,799 (46.3%) |
Sales and Office Occupations
The most common Sales and Office occupations in Gloucester County are Office & Administration (2,139 | 11.3%), and Sales & Related (2,000 | 10.5%).
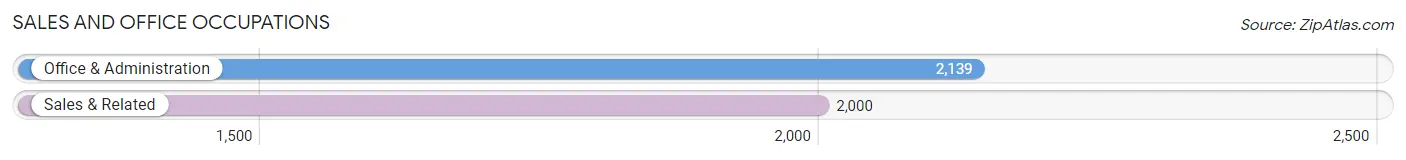
Sales and Office Occupations by Sex
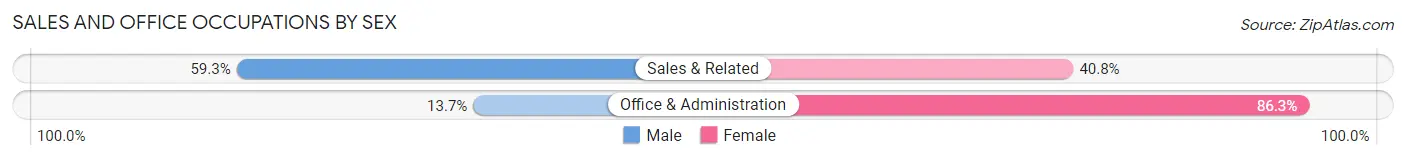
| Occupation | Male | Female |
| Sales & Related | 1,185 (59.3%) | 815 (40.7%) |
| Office & Administration | 294 (13.7%) | 1,845 (86.3%) |
| Total (Category) | 1,479 (35.7%) | 2,660 (64.3%) |
| Total (Overall) | 10,221 (53.7%) | 8,799 (46.3%) |
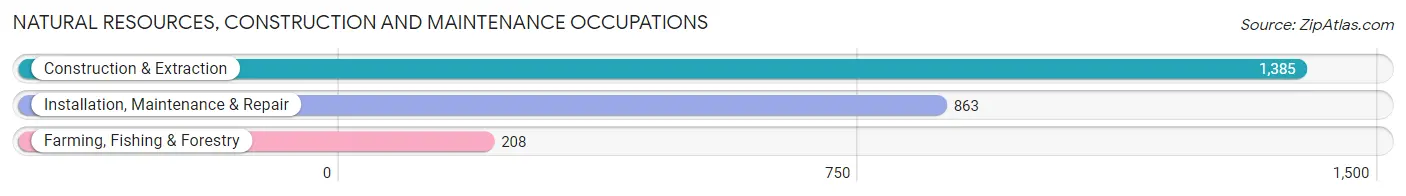
Natural Resources, Construction and Maintenance Occupations
The most common Natural Resources, Construction and Maintenance occupations in Gloucester County are Construction & Extraction (1,385 | 7.3%), Installation, Maintenance & Repair (863 | 4.5%), and Farming, Fishing & Forestry (208 | 1.1%).
Natural Resources, Construction and Maintenance Occupations by Sex
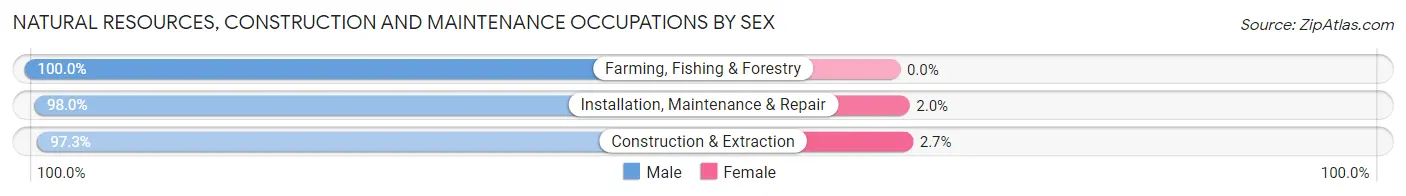
| Occupation | Male | Female |
| Farming, Fishing & Forestry | 208 (100.0%) | 0 (0.0%) |
| Construction & Extraction | 1,348 (97.3%) | 37 (2.7%) |
| Installation, Maintenance & Repair | 846 (98.0%) | 17 (2.0%) |
| Total (Category) | 2,402 (97.8%) | 54 (2.2%) |
| Total (Overall) | 10,221 (53.7%) | 8,799 (46.3%) |
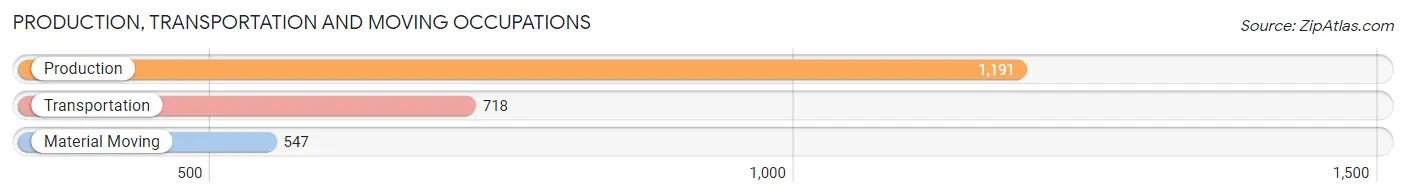
Production, Transportation and Moving Occupations
The most common Production, Transportation and Moving occupations in Gloucester County are Production (1,191 | 6.3%), Transportation (718 | 3.8%), and Material Moving (547 | 2.9%).
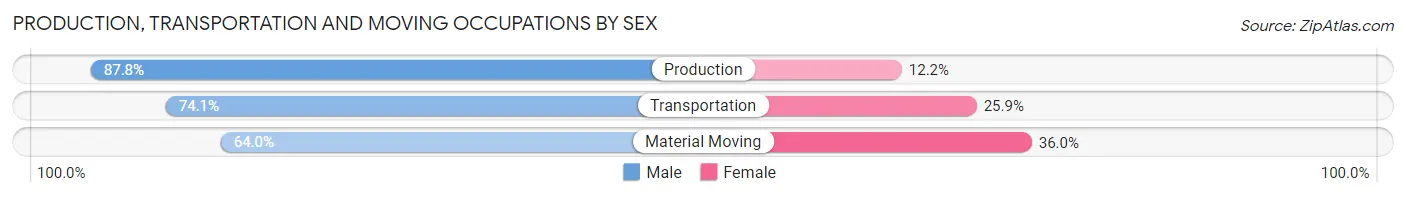
Production, Transportation and Moving Occupations by Sex
| Occupation | Male | Female |
| Production | 1,046 (87.8%) | 145 (12.2%) |
| Transportation | 532 (74.1%) | 186 (25.9%) |
| Material Moving | 350 (64.0%) | 197 (36.0%) |
| Total (Category) | 1,928 (78.5%) | 528 (21.5%) |
| Total (Overall) | 10,221 (53.7%) | 8,799 (46.3%) |
Employment Industries by Sex in Gloucester County
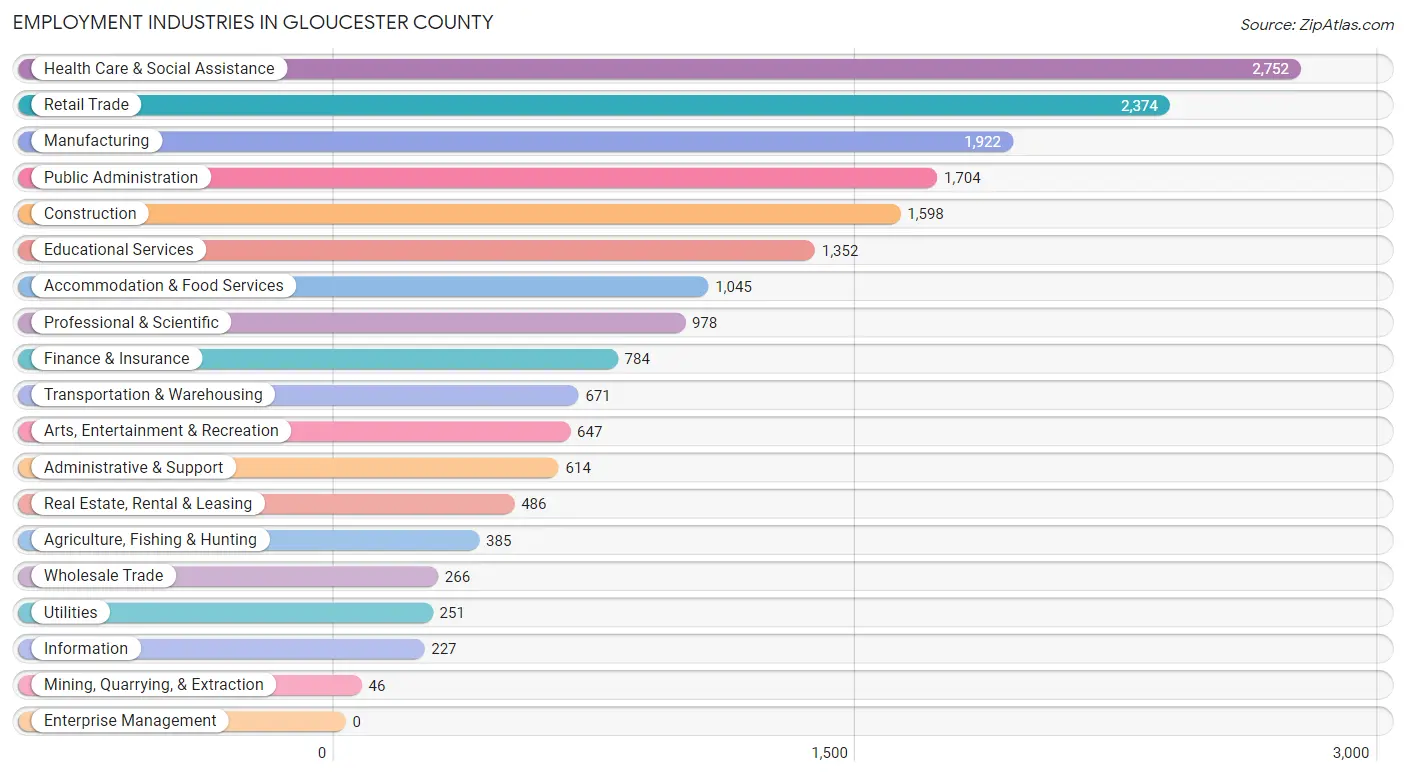
Employment Industries in Gloucester County
The major employment industries in Gloucester County include Health Care & Social Assistance (2,752 | 14.5%), Retail Trade (2,374 | 12.5%), Manufacturing (1,922 | 10.1%), Public Administration (1,704 | 9.0%), and Construction (1,598 | 8.4%).
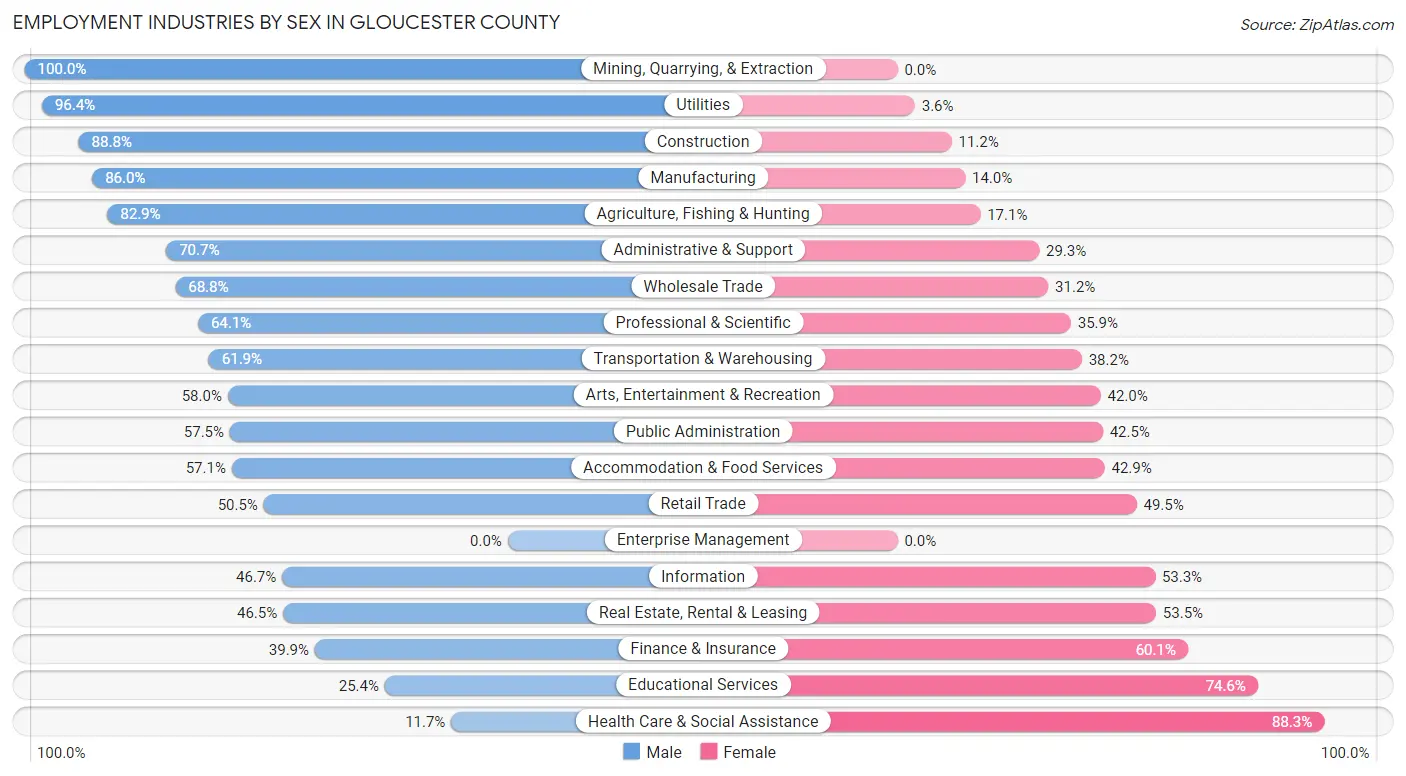
Employment Industries by Sex in Gloucester County
The Gloucester County industries that see more men than women are Mining, Quarrying, & Extraction (100.0%), Utilities (96.4%), and Construction (88.8%), whereas the industries that tend to have a higher number of women are Health Care & Social Assistance (88.3%), Educational Services (74.6%), and Finance & Insurance (60.1%).
| Industry | Male | Female |
| Agriculture, Fishing & Hunting | 319 (82.9%) | 66 (17.1%) |
| Mining, Quarrying, & Extraction | 46 (100.0%) | 0 (0.0%) |
| Construction | 1,419 (88.8%) | 179 (11.2%) |
| Manufacturing | 1,653 (86.0%) | 269 (14.0%) |
| Wholesale Trade | 183 (68.8%) | 83 (31.2%) |
| Retail Trade | 1,199 (50.5%) | 1,175 (49.5%) |
| Transportation & Warehousing | 415 (61.9%) | 256 (38.2%) |
| Utilities | 242 (96.4%) | 9 (3.6%) |
| Information | 106 (46.7%) | 121 (53.3%) |
| Finance & Insurance | 313 (39.9%) | 471 (60.1%) |
| Real Estate, Rental & Leasing | 226 (46.5%) | 260 (53.5%) |
| Professional & Scientific | 627 (64.1%) | 351 (35.9%) |
| Enterprise Management | 0 (0.0%) | 0 (0.0%) |
| Administrative & Support | 434 (70.7%) | 180 (29.3%) |
| Educational Services | 344 (25.4%) | 1,008 (74.6%) |
| Health Care & Social Assistance | 322 (11.7%) | 2,430 (88.3%) |
| Arts, Entertainment & Recreation | 375 (58.0%) | 272 (42.0%) |
| Accommodation & Food Services | 597 (57.1%) | 448 (42.9%) |
| Public Administration | 980 (57.5%) | 724 (42.5%) |
| Total | 10,221 (53.7%) | 8,799 (46.3%) |
Education in Gloucester County
School Enrollment in Gloucester County
The most common levels of schooling among the 8,003 students in Gloucester County are middle school (2,023 | 25.3%), elementary school (1,828 | 22.8%), and high school (1,704 | 21.3%).
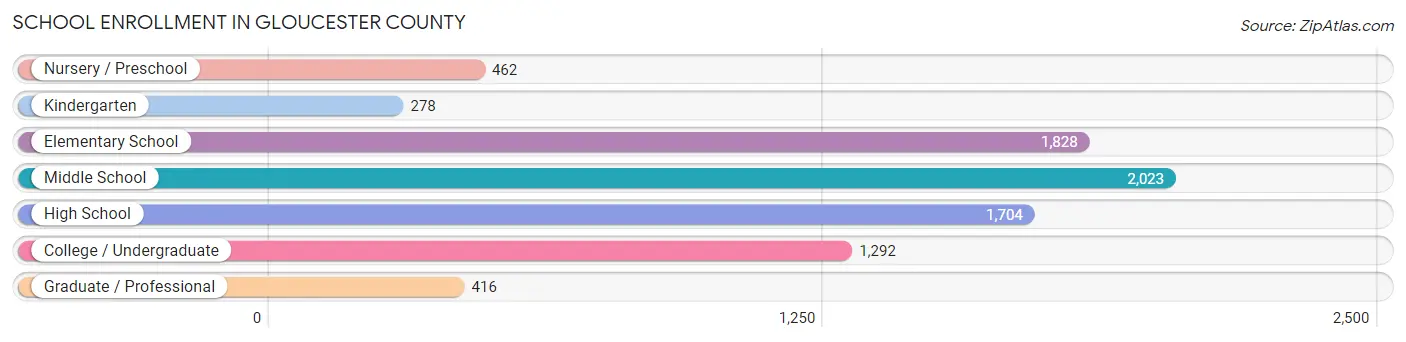
| School Level | # Students | % Students |
| Nursery / Preschool | 462 | 5.8% |
| Kindergarten | 278 | 3.5% |
| Elementary School | 1,828 | 22.8% |
| Middle School | 2,023 | 25.3% |
| High School | 1,704 | 21.3% |
| College / Undergraduate | 1,292 | 16.1% |
| Graduate / Professional | 416 | 5.2% |
| Total | 8,003 | 100.0% |
School Enrollment by Age by Funding Source in Gloucester County
Out of a total of 8,003 students who are enrolled in schools in Gloucester County, 1,176 (14.7%) attend a private institution, while the remaining 6,827 (85.3%) are enrolled in public schools. The age group of 35 years and over has the highest likelihood of being enrolled in private schools, with 254 (56.4% in the age bracket) enrolled. Conversely, the age group of 18 to 19 year olds has the lowest likelihood of being enrolled in a private school, with 361 (98.9% in the age bracket) attending a public institution.
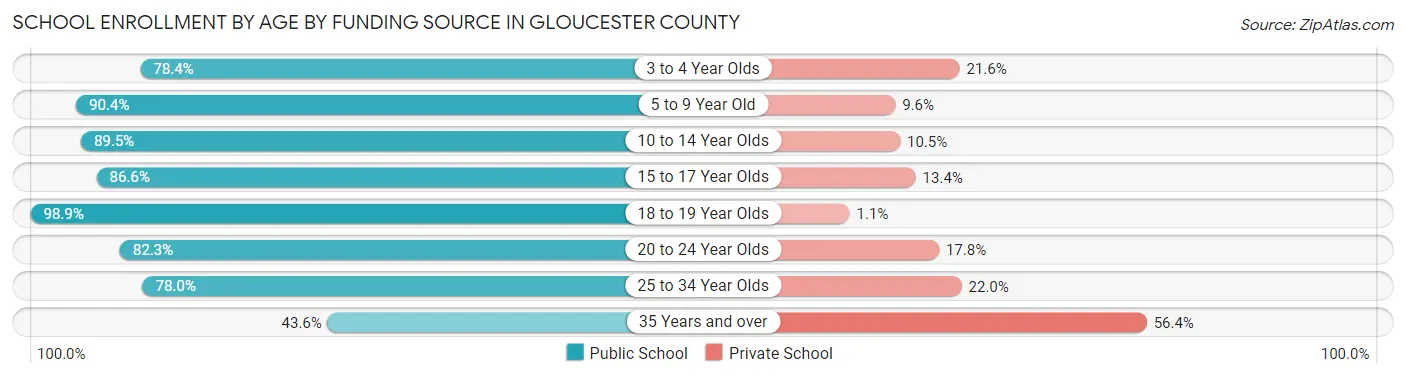
| Age Bracket | Public School | Private School |
| 3 to 4 Year Olds | 367 (78.4%) | 101 (21.6%) |
| 5 to 9 Year Old | 1,761 (90.4%) | 187 (9.6%) |
| 10 to 14 Year Olds | 2,164 (89.5%) | 254 (10.5%) |
| 15 to 17 Year Olds | 1,149 (86.6%) | 178 (13.4%) |
| 18 to 19 Year Olds | 361 (98.9%) | 4 (1.1%) |
| 20 to 24 Year Olds | 519 (82.3%) | 112 (17.7%) |
| 25 to 34 Year Olds | 309 (78.0%) | 87 (22.0%) |
| 35 Years and over | 196 (43.6%) | 254 (56.4%) |
| Total | 6,827 (85.3%) | 1,176 (14.7%) |
Educational Attainment by Field of Study in Gloucester County
Business (1,573 | 19.5%), arts & humanities (1,068 | 13.3%), social sciences (777 | 9.6%), education (722 | 9.0%), and science & technology (569 | 7.1%) are the most common fields of study among 8,061 individuals in Gloucester County who have obtained a bachelor's degree or higher.
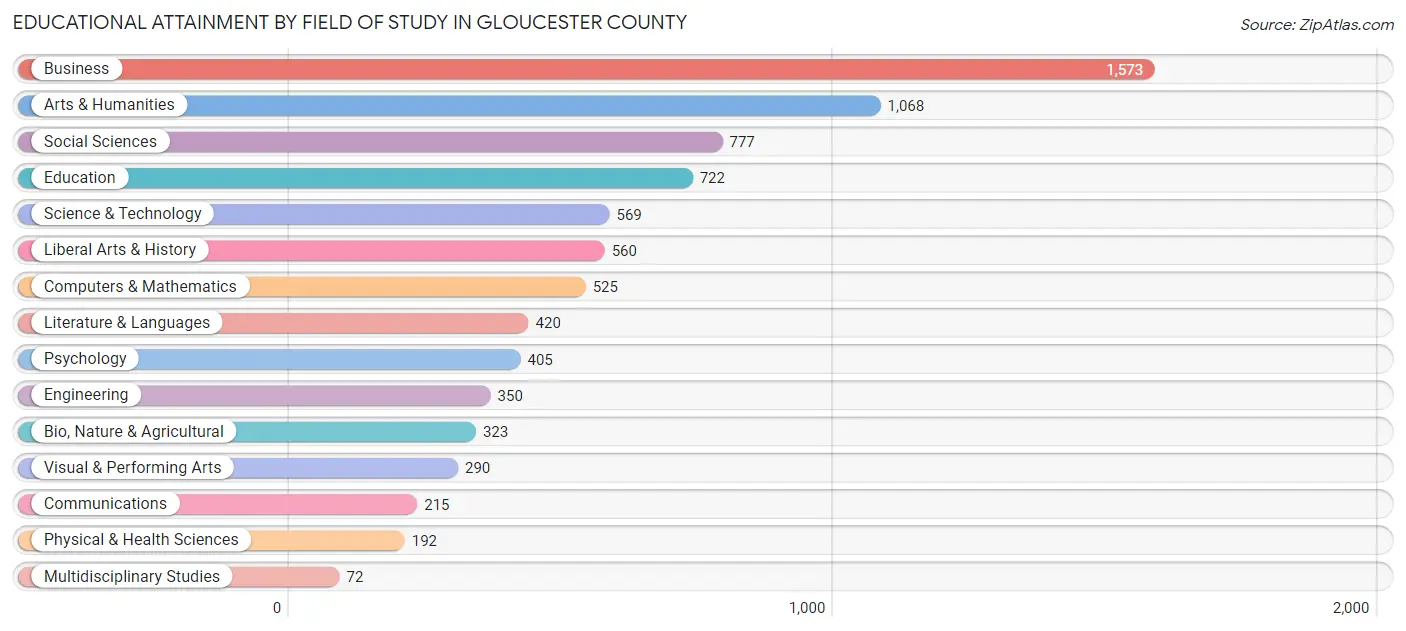
| Field of Study | # Graduates | % Graduates |
| Computers & Mathematics | 525 | 6.5% |
| Bio, Nature & Agricultural | 323 | 4.0% |
| Physical & Health Sciences | 192 | 2.4% |
| Psychology | 405 | 5.0% |
| Social Sciences | 777 | 9.6% |
| Engineering | 350 | 4.3% |
| Multidisciplinary Studies | 72 | 0.9% |
| Science & Technology | 569 | 7.1% |
| Business | 1,573 | 19.5% |
| Education | 722 | 9.0% |
| Literature & Languages | 420 | 5.2% |
| Liberal Arts & History | 560 | 7.0% |
| Visual & Performing Arts | 290 | 3.6% |
| Communications | 215 | 2.7% |
| Arts & Humanities | 1,068 | 13.3% |
| Total | 8,061 | 100.0% |
Transportation & Commute in Gloucester County
Vehicle Availability by Sex in Gloucester County
The most prevalent vehicle ownership categories in Gloucester County are males with 2 vehicles (3,426, accounting for 33.0%) and females with 2 vehicles (3,350, making up 39.3%).
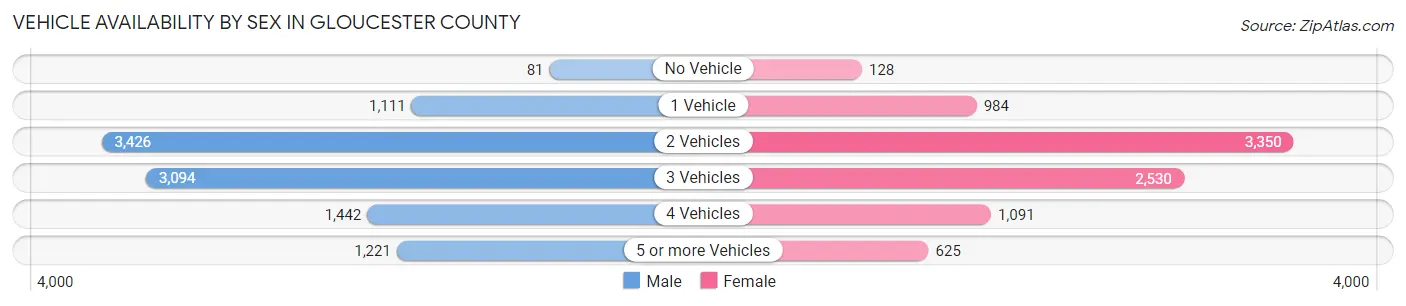
| Vehicles Available | Male | Female |
| No Vehicle | 81 (0.8%) | 128 (1.5%) |
| 1 Vehicle | 1,111 (10.7%) | 984 (11.3%) |
| 2 Vehicles | 3,426 (33.0%) | 3,350 (38.5%) |
| 3 Vehicles | 3,094 (29.8%) | 2,530 (29.0%) |
| 4 Vehicles | 1,442 (13.9%) | 1,091 (12.5%) |
| 5 or more Vehicles | 1,221 (11.8%) | 625 (7.2%) |
| Total | 10,375 (100.0%) | 8,708 (100.0%) |
Commute Time in Gloucester County
The most frequently occuring commute durations in Gloucester County are 45 to 59 minutes (2,899 commuters, 16.4%), 30 to 34 minutes (2,546 commuters, 14.4%), and 60 to 89 minutes (2,425 commuters, 13.7%).
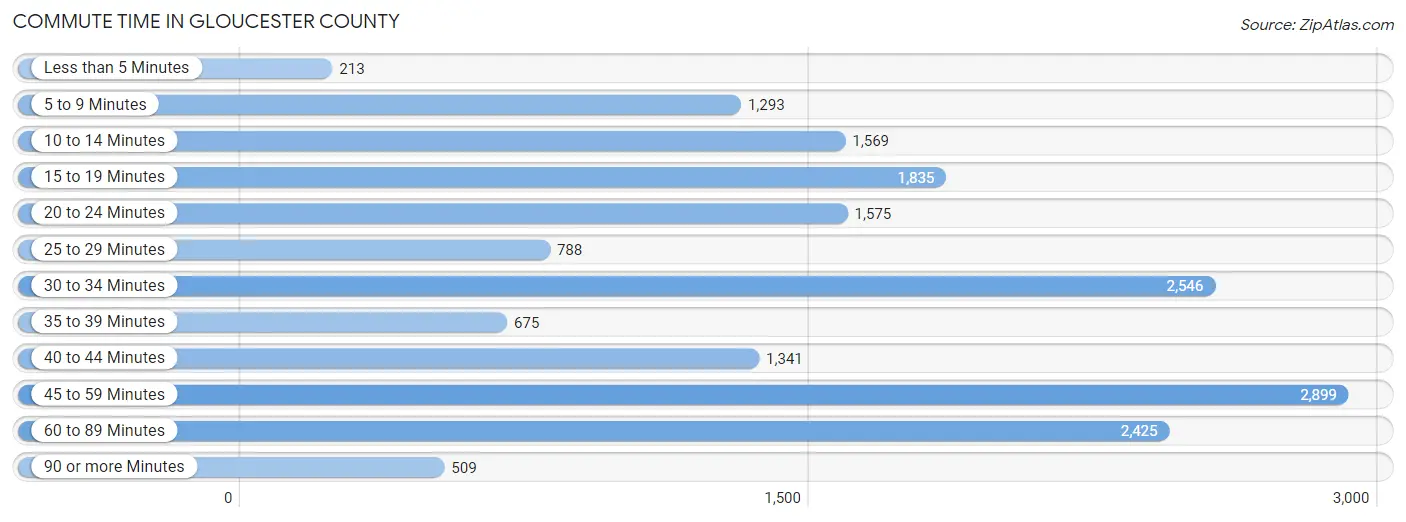
| Commute Time | # Commuters | % Commuters |
| Less than 5 Minutes | 213 | 1.2% |
| 5 to 9 Minutes | 1,293 | 7.3% |
| 10 to 14 Minutes | 1,569 | 8.9% |
| 15 to 19 Minutes | 1,835 | 10.4% |
| 20 to 24 Minutes | 1,575 | 8.9% |
| 25 to 29 Minutes | 788 | 4.5% |
| 30 to 34 Minutes | 2,546 | 14.4% |
| 35 to 39 Minutes | 675 | 3.8% |
| 40 to 44 Minutes | 1,341 | 7.6% |
| 45 to 59 Minutes | 2,899 | 16.4% |
| 60 to 89 Minutes | 2,425 | 13.7% |
| 90 or more Minutes | 509 | 2.9% |
Commute Time by Sex in Gloucester County
The most common commute times in Gloucester County are 60 to 89 minutes (1,957 commuters, 20.8%) for males and 30 to 34 minutes (1,239 commuters, 15.0%) for females.
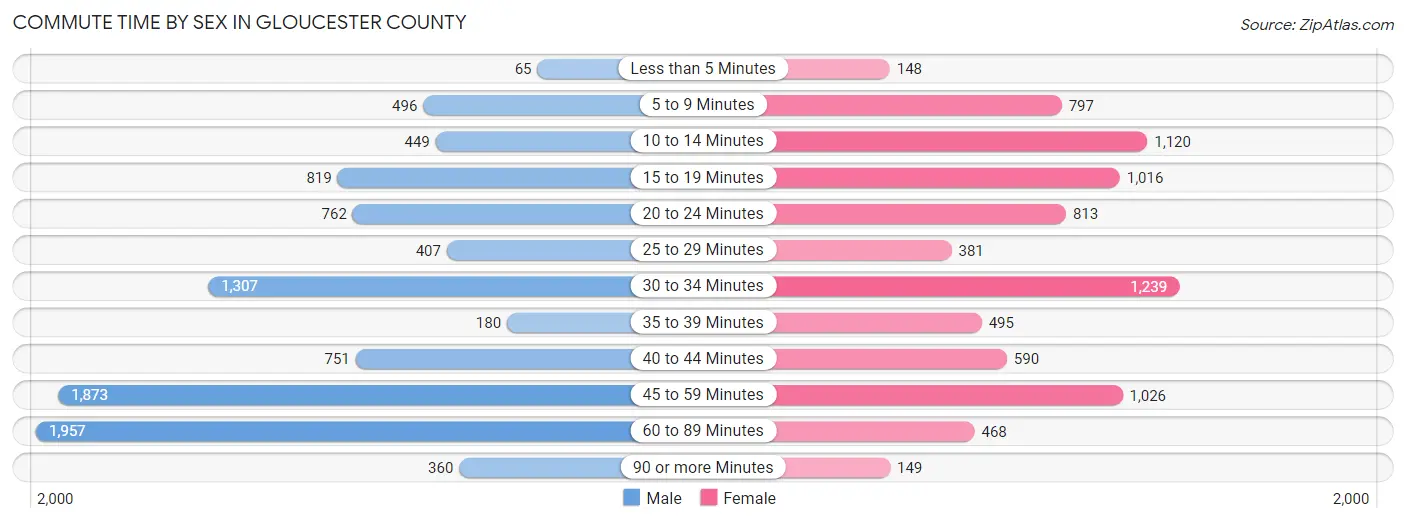
| Commute Time | Male | Female |
| Less than 5 Minutes | 65 (0.7%) | 148 (1.8%) |
| 5 to 9 Minutes | 496 (5.3%) | 797 (9.7%) |
| 10 to 14 Minutes | 449 (4.8%) | 1,120 (13.6%) |
| 15 to 19 Minutes | 819 (8.7%) | 1,016 (12.3%) |
| 20 to 24 Minutes | 762 (8.1%) | 813 (9.9%) |
| 25 to 29 Minutes | 407 (4.3%) | 381 (4.6%) |
| 30 to 34 Minutes | 1,307 (13.9%) | 1,239 (15.0%) |
| 35 to 39 Minutes | 180 (1.9%) | 495 (6.0%) |
| 40 to 44 Minutes | 751 (8.0%) | 590 (7.2%) |
| 45 to 59 Minutes | 1,873 (19.9%) | 1,026 (12.4%) |
| 60 to 89 Minutes | 1,957 (20.8%) | 468 (5.7%) |
| 90 or more Minutes | 360 (3.8%) | 149 (1.8%) |
Time of Departure to Work by Sex in Gloucester County
The most frequent times of departure to work in Gloucester County are 6:00 AM to 6:29 AM (1,246, 13.2%) for males and 7:00 AM to 7:29 AM (1,954, 23.7%) for females.
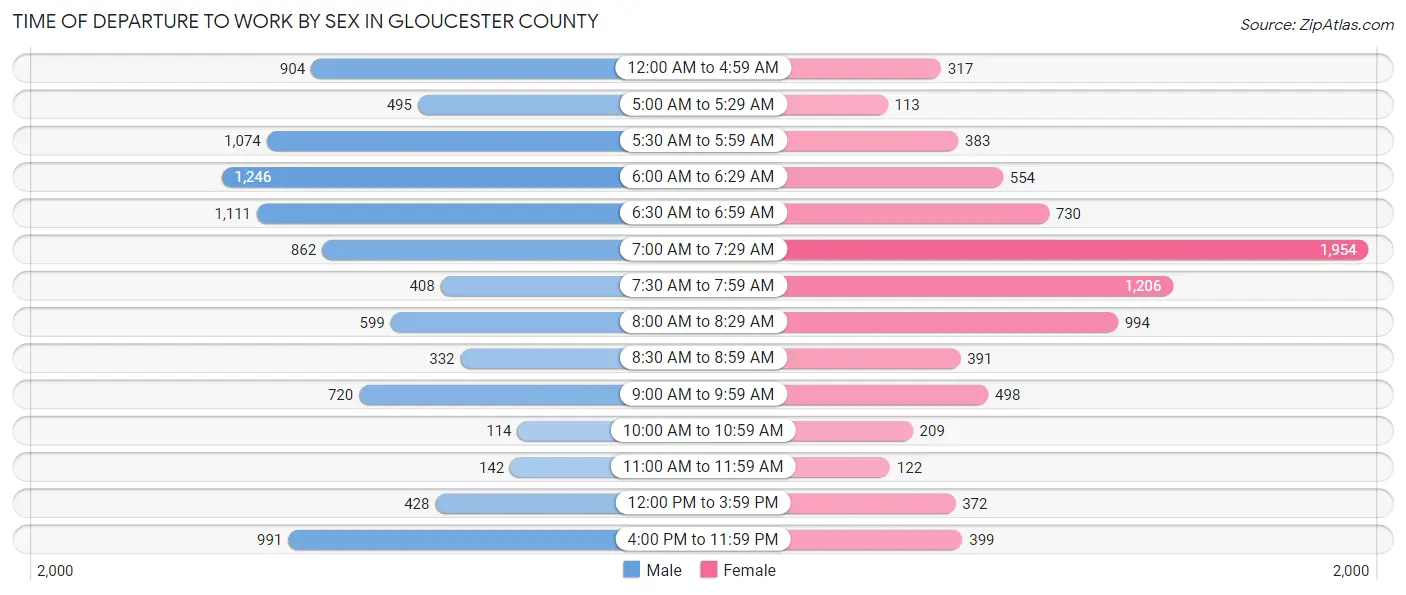
| Time of Departure | Male | Female |
| 12:00 AM to 4:59 AM | 904 (9.6%) | 317 (3.8%) |
| 5:00 AM to 5:29 AM | 495 (5.2%) | 113 (1.4%) |
| 5:30 AM to 5:59 AM | 1,074 (11.4%) | 383 (4.6%) |
| 6:00 AM to 6:29 AM | 1,246 (13.2%) | 554 (6.7%) |
| 6:30 AM to 6:59 AM | 1,111 (11.8%) | 730 (8.9%) |
| 7:00 AM to 7:29 AM | 862 (9.1%) | 1,954 (23.7%) |
| 7:30 AM to 7:59 AM | 408 (4.3%) | 1,206 (14.6%) |
| 8:00 AM to 8:29 AM | 599 (6.4%) | 994 (12.1%) |
| 8:30 AM to 8:59 AM | 332 (3.5%) | 391 (4.7%) |
| 9:00 AM to 9:59 AM | 720 (7.6%) | 498 (6.0%) |
| 10:00 AM to 10:59 AM | 114 (1.2%) | 209 (2.5%) |
| 11:00 AM to 11:59 AM | 142 (1.5%) | 122 (1.5%) |
| 12:00 PM to 3:59 PM | 428 (4.5%) | 372 (4.5%) |
| 4:00 PM to 11:59 PM | 991 (10.5%) | 399 (4.8%) |
| Total | 9,426 (100.0%) | 8,242 (100.0%) |
Housing Occupancy in Gloucester County
Occupancy by Ownership in Gloucester County
Of the total 14,857 dwellings in Gloucester County, owner-occupied units account for 11,754 (79.1%), while renter-occupied units make up 3,103 (20.9%).
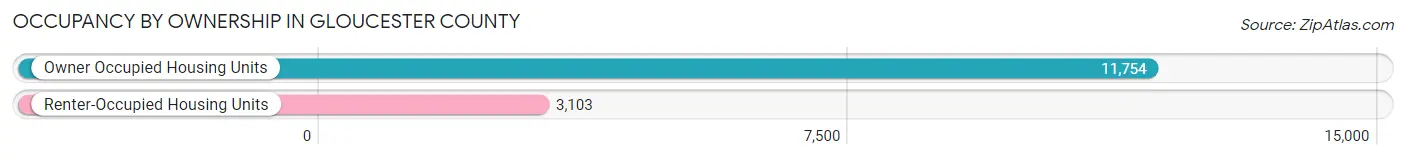
| Occupancy | # Housing Units | % Housing Units |
| Owner Occupied Housing Units | 11,754 | 79.1% |
| Renter-Occupied Housing Units | 3,103 | 20.9% |
| Total Occupied Housing Units | 14,857 | 100.0% |
Occupancy by Household Size in Gloucester County
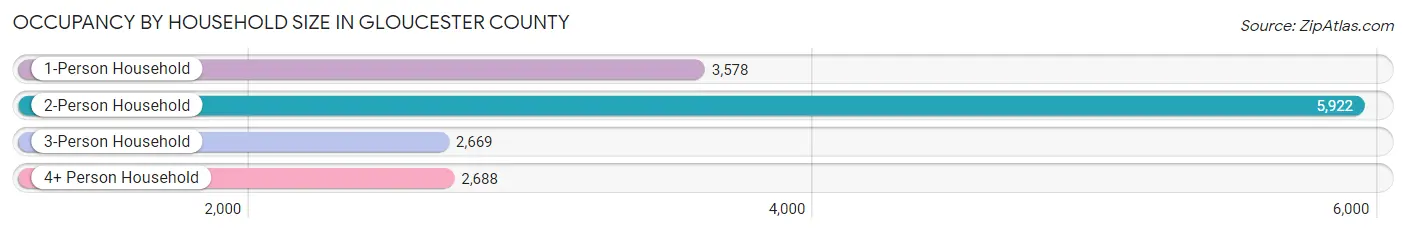
| Household Size | # Housing Units | % Housing Units |
| 1-Person Household | 3,578 | 24.1% |
| 2-Person Household | 5,922 | 39.9% |
| 3-Person Household | 2,669 | 18.0% |
| 4+ Person Household | 2,688 | 18.1% |
| Total Housing Units | 14,857 | 100.0% |
Occupancy by Ownership by Household Size in Gloucester County
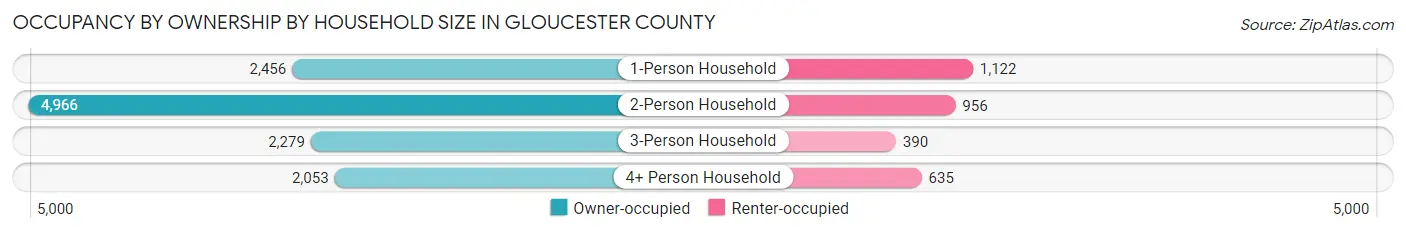
| Household Size | Owner-occupied | Renter-occupied |
| 1-Person Household | 2,456 (68.6%) | 1,122 (31.4%) |
| 2-Person Household | 4,966 (83.9%) | 956 (16.1%) |
| 3-Person Household | 2,279 (85.4%) | 390 (14.6%) |
| 4+ Person Household | 2,053 (76.4%) | 635 (23.6%) |
| Total Housing Units | 11,754 (79.1%) | 3,103 (20.9%) |
Occupancy by Educational Attainment in Gloucester County
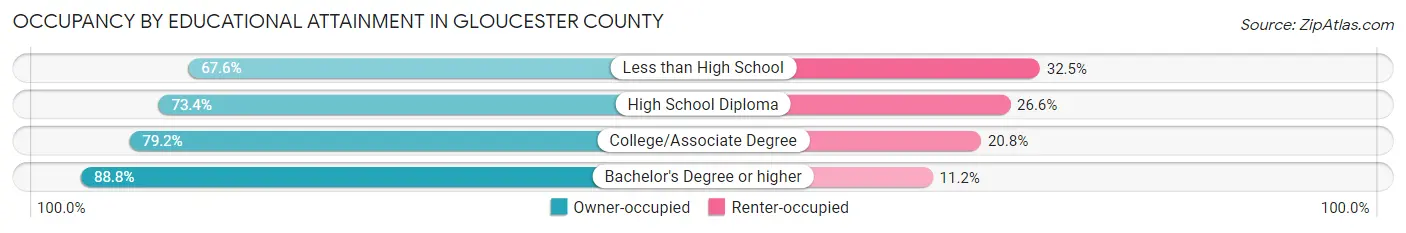
| Household Size | Owner-occupied | Renter-occupied |
| Less than High School | 889 (67.5%) | 427 (32.5%) |
| High School Diploma | 3,006 (73.4%) | 1,087 (26.6%) |
| College/Associate Degree | 4,387 (79.2%) | 1,151 (20.8%) |
| Bachelor's Degree or higher | 3,472 (88.8%) | 438 (11.2%) |
Occupancy by Age of Householder in Gloucester County
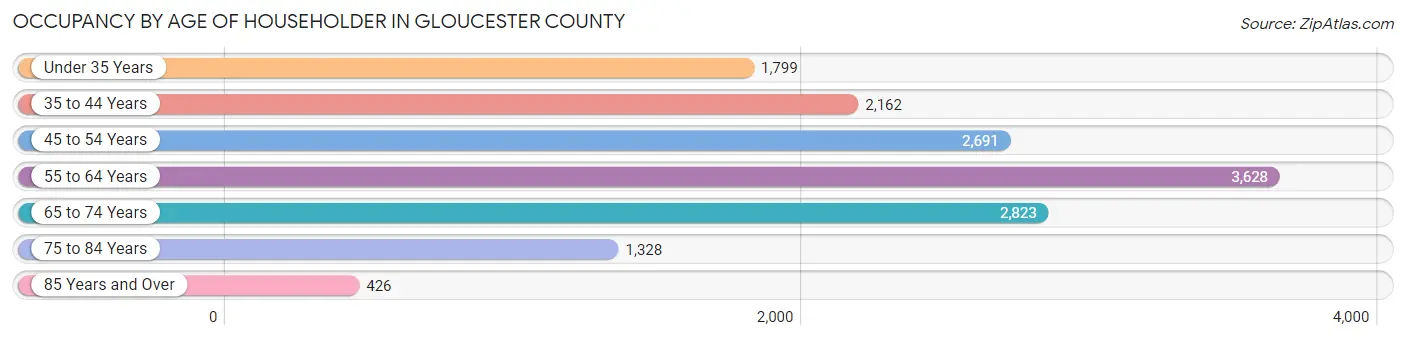
| Age Bracket | # Households | % Households |
| Under 35 Years | 1,799 | 12.1% |
| 35 to 44 Years | 2,162 | 14.5% |
| 45 to 54 Years | 2,691 | 18.1% |
| 55 to 64 Years | 3,628 | 24.4% |
| 65 to 74 Years | 2,823 | 19.0% |
| 75 to 84 Years | 1,328 | 8.9% |
| 85 Years and Over | 426 | 2.9% |
| Total | 14,857 | 100.0% |
Housing Finances in Gloucester County
Median Income by Occupancy in Gloucester County
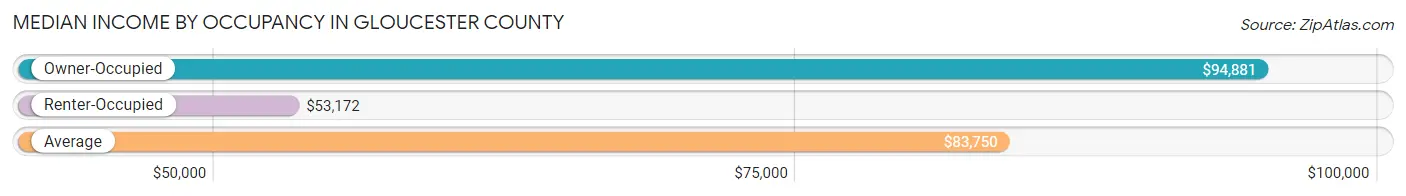
| Occupancy Type | # Households | Median Income |
| Owner-Occupied | 11,754 (79.1%) | $94,881 |
| Renter-Occupied | 3,103 (20.9%) | $53,172 |
| Average | 14,857 (100.0%) | $83,750 |
Occupancy by Householder Income Bracket in Gloucester County
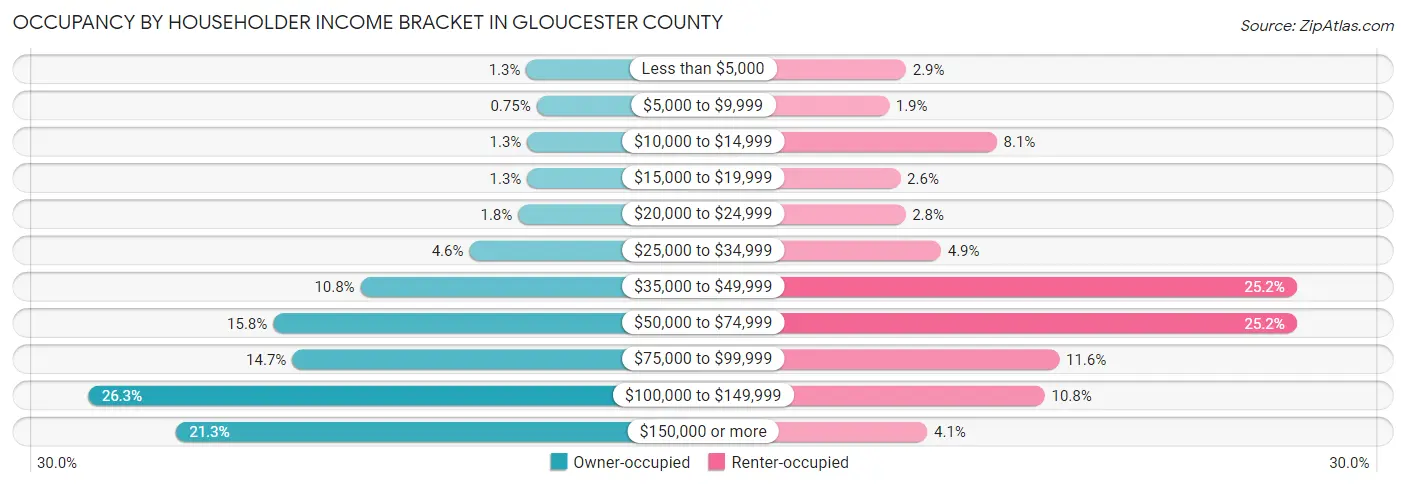
| Income Bracket | Owner-occupied | Renter-occupied |
| Less than $5,000 | 156 (1.3%) | 89 (2.9%) |
| $5,000 to $9,999 | 88 (0.7%) | 59 (1.9%) |
| $10,000 to $14,999 | 150 (1.3%) | 250 (8.1%) |
| $15,000 to $19,999 | 150 (1.3%) | 79 (2.5%) |
| $20,000 to $24,999 | 212 (1.8%) | 88 (2.8%) |
| $25,000 to $34,999 | 539 (4.6%) | 151 (4.9%) |
| $35,000 to $49,999 | 1,271 (10.8%) | 782 (25.2%) |
| $50,000 to $74,999 | 1,857 (15.8%) | 782 (25.2%) |
| $75,000 to $99,999 | 1,729 (14.7%) | 361 (11.6%) |
| $100,000 to $149,999 | 3,095 (26.3%) | 335 (10.8%) |
| $150,000 or more | 2,507 (21.3%) | 127 (4.1%) |
| Total | 11,754 (100.0%) | 3,103 (100.0%) |
Monthly Housing Cost Tiers in Gloucester County
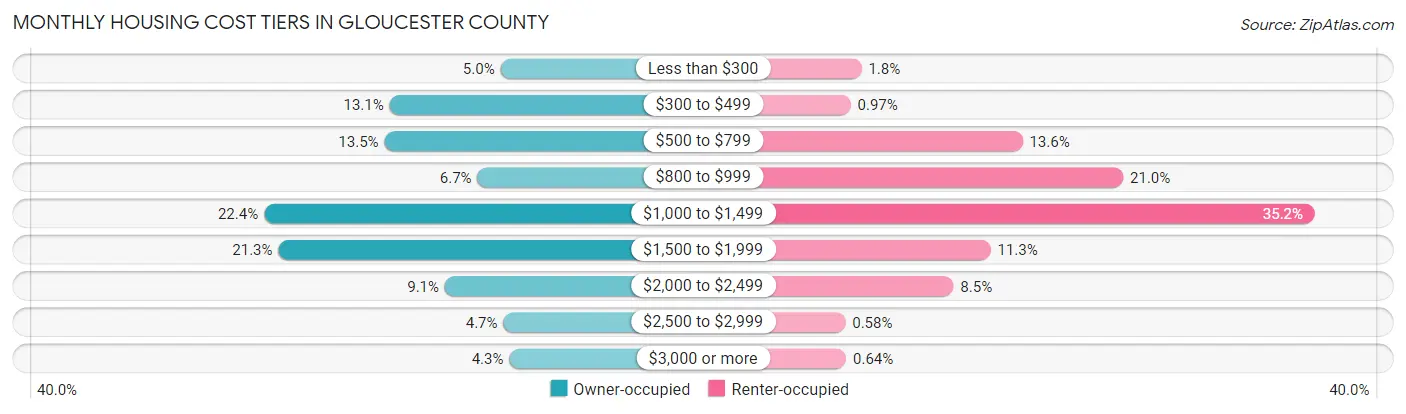
| Monthly Cost | Owner-occupied | Renter-occupied |
| Less than $300 | 582 (5.0%) | 55 (1.8%) |
| $300 to $499 | 1,542 (13.1%) | 30 (1.0%) |
| $500 to $799 | 1,587 (13.5%) | 423 (13.6%) |
| $800 to $999 | 782 (6.7%) | 653 (21.0%) |
| $1,000 to $1,499 | 2,629 (22.4%) | 1,091 (35.2%) |
| $1,500 to $1,999 | 2,505 (21.3%) | 350 (11.3%) |
| $2,000 to $2,499 | 1,064 (9.0%) | 265 (8.5%) |
| $2,500 to $2,999 | 557 (4.7%) | 18 (0.6%) |
| $3,000 or more | 506 (4.3%) | 20 (0.6%) |
| Total | 11,754 (100.0%) | 3,103 (100.0%) |
Physical Housing Characteristics in Gloucester County
Housing Structures in Gloucester County
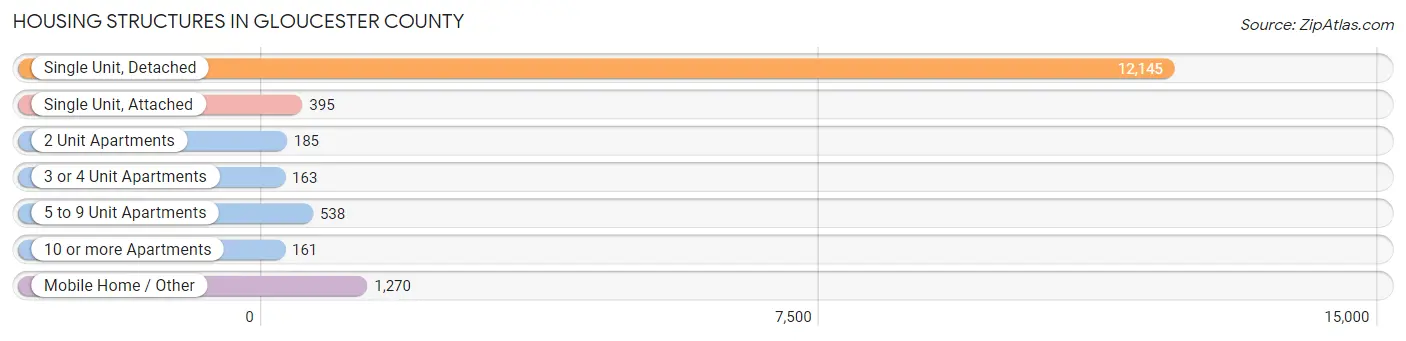
| Structure Type | # Housing Units | % Housing Units |
| Single Unit, Detached | 12,145 | 81.8% |
| Single Unit, Attached | 395 | 2.7% |
| 2 Unit Apartments | 185 | 1.3% |
| 3 or 4 Unit Apartments | 163 | 1.1% |
| 5 to 9 Unit Apartments | 538 | 3.6% |
| 10 or more Apartments | 161 | 1.1% |
| Mobile Home / Other | 1,270 | 8.6% |
| Total | 14,857 | 100.0% |
Housing Structures by Occupancy in Gloucester County
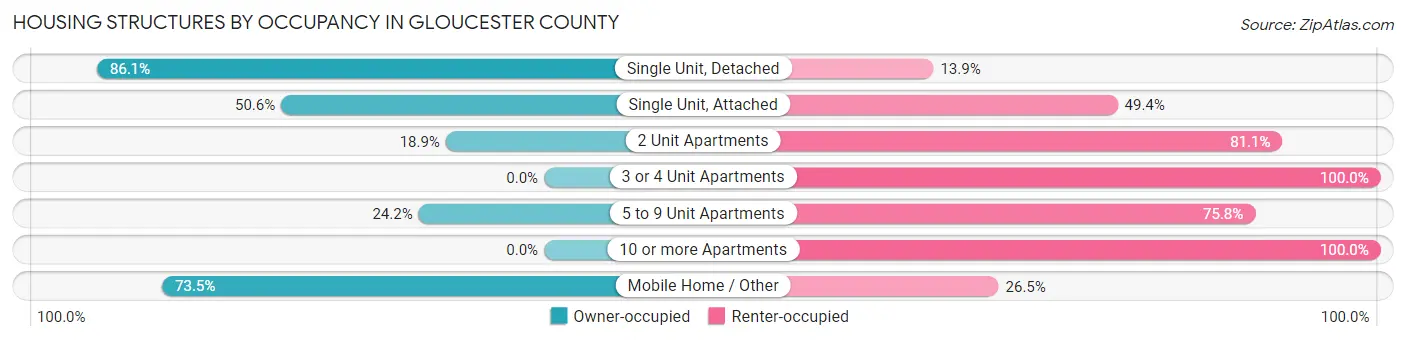
| Structure Type | Owner-occupied | Renter-occupied |
| Single Unit, Detached | 10,455 (86.1%) | 1,690 (13.9%) |
| Single Unit, Attached | 200 (50.6%) | 195 (49.4%) |
| 2 Unit Apartments | 35 (18.9%) | 150 (81.1%) |
| 3 or 4 Unit Apartments | 0 (0.0%) | 163 (100.0%) |
| 5 to 9 Unit Apartments | 130 (24.2%) | 408 (75.8%) |
| 10 or more Apartments | 0 (0.0%) | 161 (100.0%) |
| Mobile Home / Other | 934 (73.5%) | 336 (26.5%) |
| Total | 11,754 (79.1%) | 3,103 (20.9%) |
Housing Structures by Number of Rooms in Gloucester County
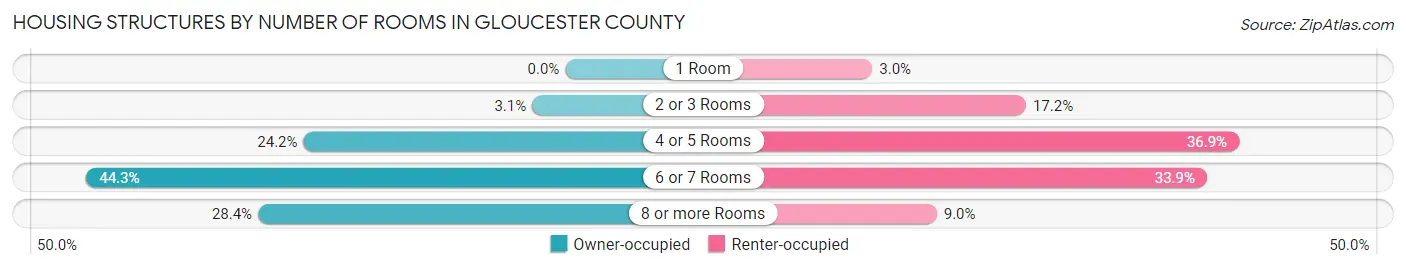
| Number of Rooms | Owner-occupied | Renter-occupied |
| 1 Room | 0 (0.0%) | 93 (3.0%) |
| 2 or 3 Rooms | 361 (3.1%) | 534 (17.2%) |
| 4 or 5 Rooms | 2,847 (24.2%) | 1,145 (36.9%) |
| 6 or 7 Rooms | 5,206 (44.3%) | 1,053 (33.9%) |
| 8 or more Rooms | 3,340 (28.4%) | 278 (9.0%) |
| Total | 11,754 (100.0%) | 3,103 (100.0%) |
Housing Structure by Heating Type in Gloucester County
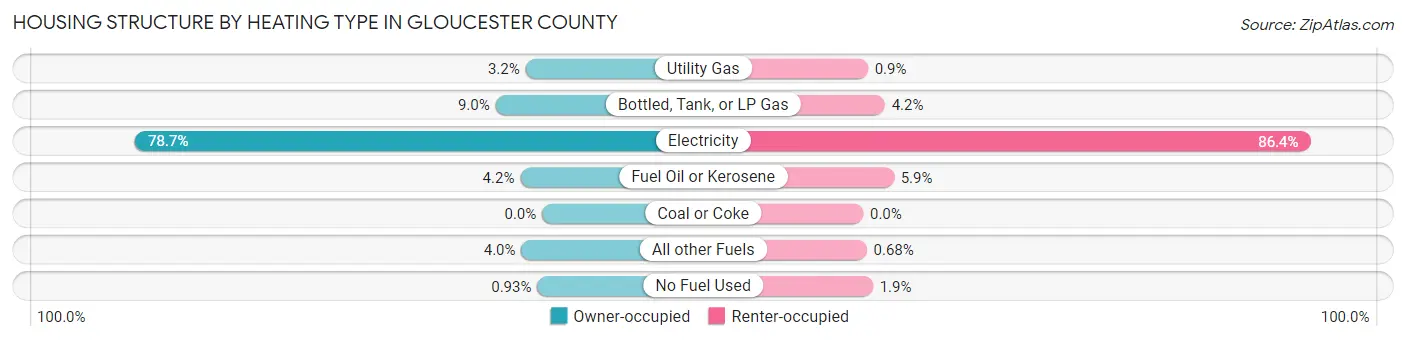
| Heating Type | Owner-occupied | Renter-occupied |
| Utility Gas | 375 (3.2%) | 28 (0.9%) |
| Bottled, Tank, or LP Gas | 1,057 (9.0%) | 130 (4.2%) |
| Electricity | 9,246 (78.7%) | 2,682 (86.4%) |
| Fuel Oil or Kerosene | 496 (4.2%) | 184 (5.9%) |
| Coal or Coke | 0 (0.0%) | 0 (0.0%) |
| All other Fuels | 471 (4.0%) | 21 (0.7%) |
| No Fuel Used | 109 (0.9%) | 58 (1.9%) |
| Total | 11,754 (100.0%) | 3,103 (100.0%) |
Household Vehicle Usage in Gloucester County
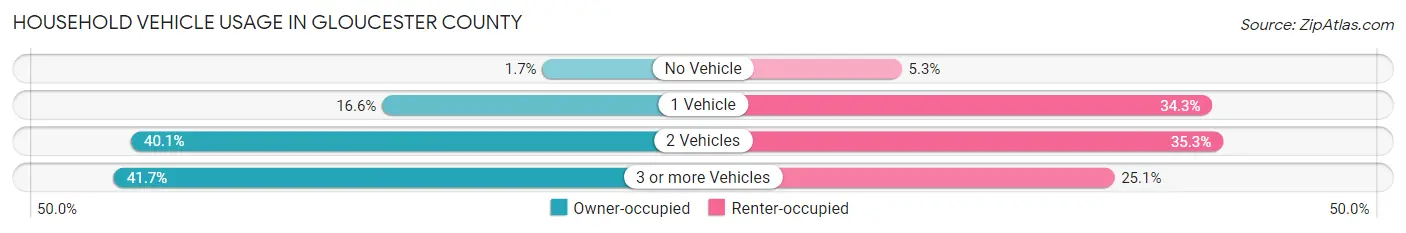
| Vehicles per Household | Owner-occupied | Renter-occupied |
| No Vehicle | 195 (1.7%) | 164 (5.3%) |
| 1 Vehicle | 1,953 (16.6%) | 1,064 (34.3%) |
| 2 Vehicles | 4,709 (40.1%) | 1,095 (35.3%) |
| 3 or more Vehicles | 4,897 (41.7%) | 780 (25.1%) |
| Total | 11,754 (100.0%) | 3,103 (100.0%) |
Real Estate & Mortgages in Gloucester County
Real Estate and Mortgage Overview in Gloucester County
| Characteristic | Without Mortgage | With Mortgage |
| Housing Units | 3,812 | 7,942 |
| Median Property Value | $254,100 | $280,800 |
| Median Household Income | $71,735 | $1,874 |
| Monthly Housing Costs | $482 | $506 |
| Real Estate Taxes | $1,629 | $194 |
Property Value by Mortgage Status in Gloucester County
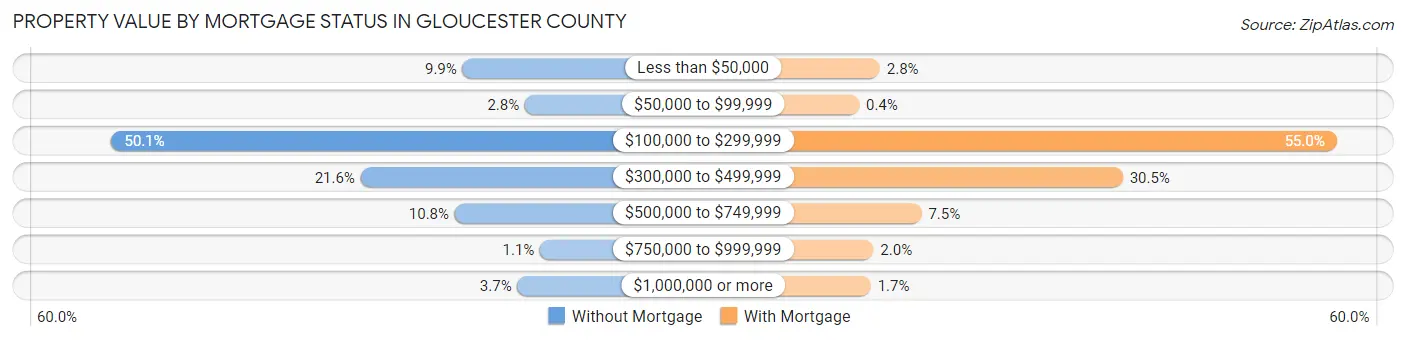
| Property Value | Without Mortgage | With Mortgage |
| Less than $50,000 | 379 (9.9%) | 221 (2.8%) |
| $50,000 to $99,999 | 107 (2.8%) | 32 (0.4%) |
| $100,000 to $299,999 | 1,909 (50.1%) | 4,367 (55.0%) |
| $300,000 to $499,999 | 823 (21.6%) | 2,425 (30.5%) |
| $500,000 to $749,999 | 413 (10.8%) | 598 (7.5%) |
| $750,000 to $999,999 | 41 (1.1%) | 162 (2.0%) |
| $1,000,000 or more | 140 (3.7%) | 137 (1.7%) |
| Total | 3,812 (100.0%) | 7,942 (100.0%) |
Household Income by Mortgage Status in Gloucester County
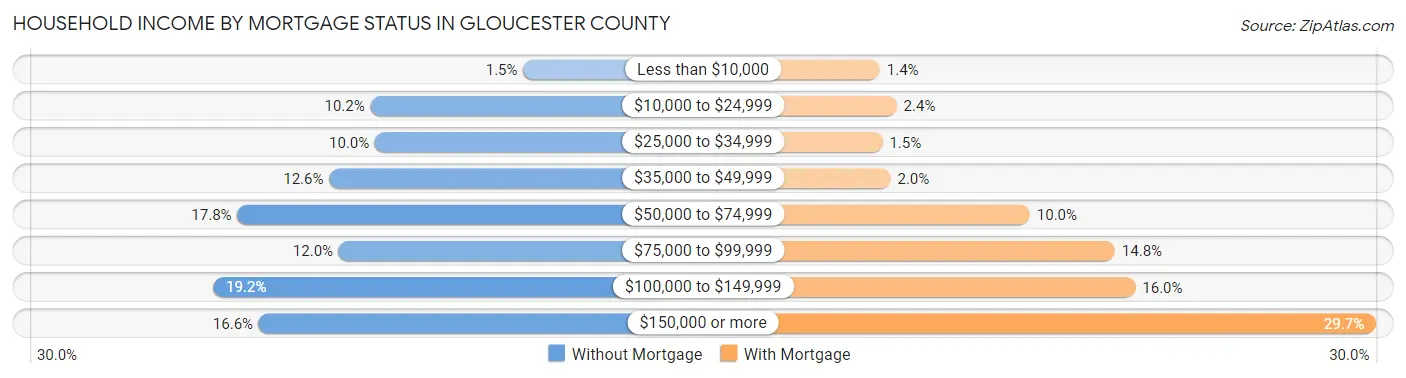
| Household Income | Without Mortgage | With Mortgage |
| Less than $10,000 | 57 (1.5%) | 110 (1.4%) |
| $10,000 to $24,999 | 390 (10.2%) | 187 (2.4%) |
| $25,000 to $34,999 | 380 (10.0%) | 122 (1.5%) |
| $35,000 to $49,999 | 480 (12.6%) | 159 (2.0%) |
| $50,000 to $74,999 | 680 (17.8%) | 791 (10.0%) |
| $75,000 to $99,999 | 459 (12.0%) | 1,177 (14.8%) |
| $100,000 to $149,999 | 733 (19.2%) | 1,270 (16.0%) |
| $150,000 or more | 633 (16.6%) | 2,362 (29.7%) |
| Total | 3,812 (100.0%) | 7,942 (100.0%) |
Property Value to Household Income Ratio in Gloucester County
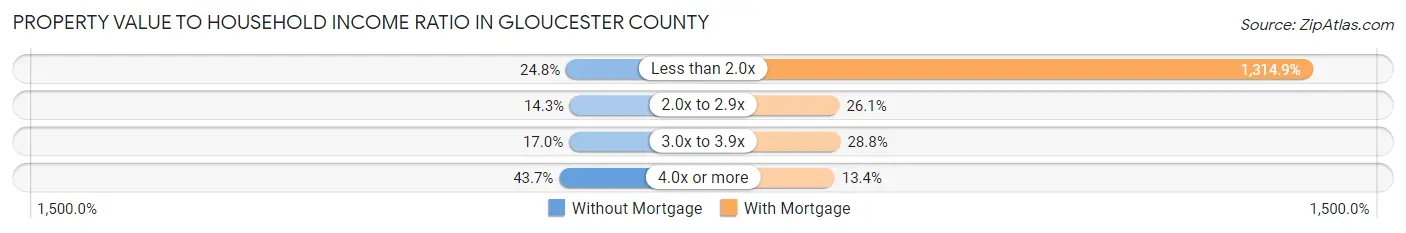
| Value-to-Income Ratio | Without Mortgage | With Mortgage |
| Less than 2.0x | 944 (24.8%) | 104,427 (1,314.9%) |
| 2.0x to 2.9x | 546 (14.3%) | 2,073 (26.1%) |
| 3.0x to 3.9x | 646 (17.0%) | 2,286 (28.8%) |
| 4.0x or more | 1,667 (43.7%) | 1,064 (13.4%) |
| Total | 3,812 (100.0%) | 7,942 (100.0%) |
Real Estate Taxes by Mortgage Status in Gloucester County
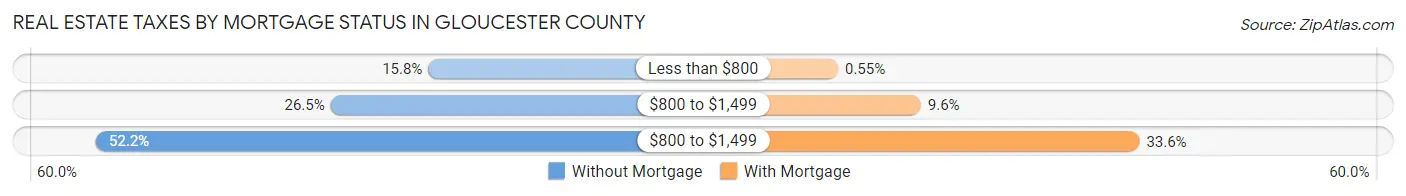
| Property Taxes | Without Mortgage | With Mortgage |
| Less than $800 | 601 (15.8%) | 44 (0.5%) |
| $800 to $1,499 | 1,009 (26.5%) | 764 (9.6%) |
| $800 to $1,499 | 1,989 (52.2%) | 2,667 (33.6%) |
| Total | 3,812 (100.0%) | 7,942 (100.0%) |
Health & Disability in Gloucester County
Health Insurance Coverage by Age in Gloucester County
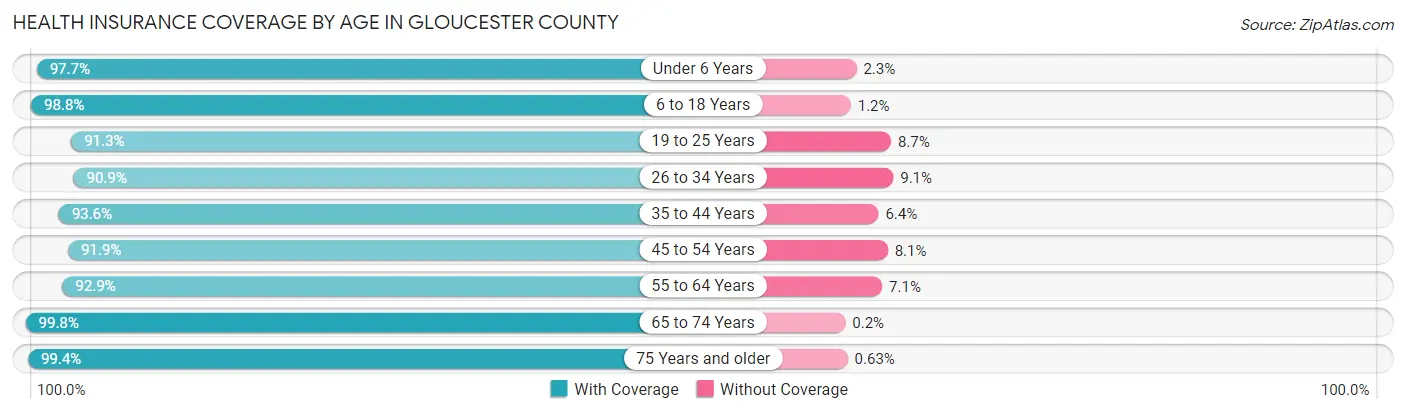
| Age Bracket | With Coverage | Without Coverage |
| Under 6 Years | 2,025 (97.7%) | 47 (2.3%) |
| 6 to 18 Years | 5,973 (98.8%) | 73 (1.2%) |
| 19 to 25 Years | 2,602 (91.3%) | 248 (8.7%) |
| 26 to 34 Years | 3,448 (90.9%) | 347 (9.1%) |
| 35 to 44 Years | 4,266 (93.6%) | 290 (6.4%) |
| 45 to 54 Years | 4,528 (91.9%) | 399 (8.1%) |
| 55 to 64 Years | 6,056 (92.9%) | 460 (7.1%) |
| 65 to 74 Years | 4,587 (99.8%) | 9 (0.2%) |
| 75 Years and older | 2,826 (99.4%) | 18 (0.6%) |
| Total | 36,311 (95.1%) | 1,891 (5.0%) |
Health Insurance Coverage by Citizenship Status in Gloucester County
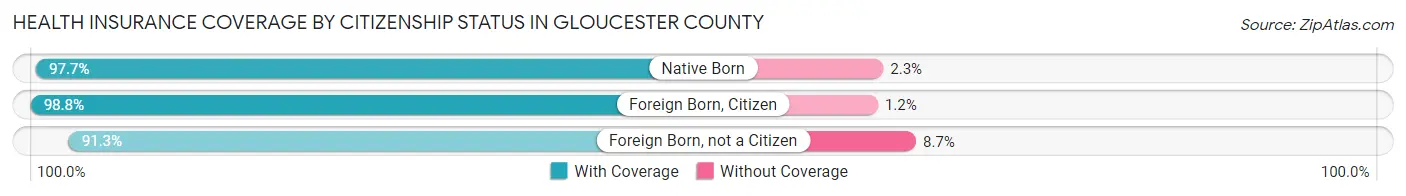
| Citizenship Status | With Coverage | Without Coverage |
| Native Born | 2,025 (97.7%) | 47 (2.3%) |
| Foreign Born, Citizen | 5,973 (98.8%) | 73 (1.2%) |
| Foreign Born, not a Citizen | 2,602 (91.3%) | 248 (8.7%) |
Health Insurance Coverage by Household Income in Gloucester County
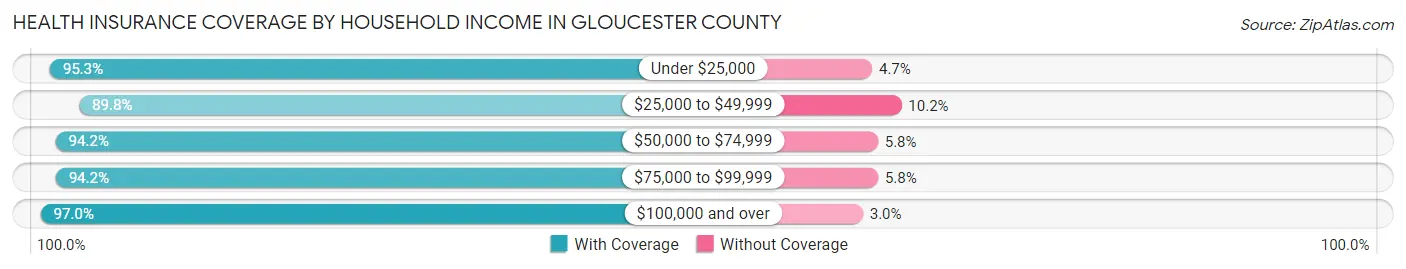
| Household Income | With Coverage | Without Coverage |
| Under $25,000 | 2,397 (95.3%) | 119 (4.7%) |
| $25,000 to $49,999 | 4,371 (89.8%) | 498 (10.2%) |
| $50,000 to $74,999 | 7,038 (94.2%) | 433 (5.8%) |
| $75,000 to $99,999 | 4,744 (94.2%) | 294 (5.8%) |
| $100,000 and over | 17,727 (97.0%) | 547 (3.0%) |
Public vs Private Health Insurance Coverage by Age in Gloucester County
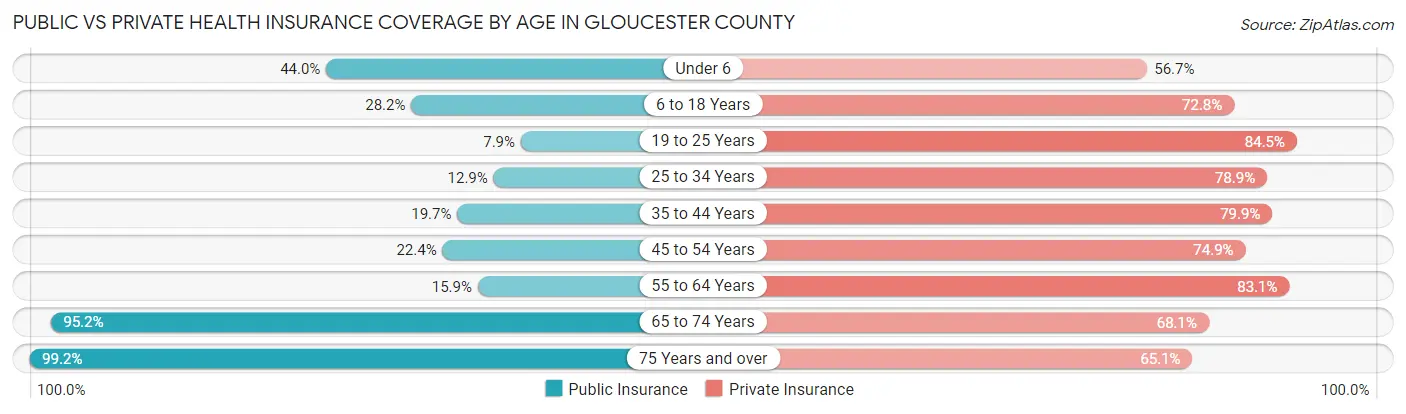
| Age Bracket | Public Insurance | Private Insurance |
| Under 6 | 912 (44.0%) | 1,175 (56.7%) |
| 6 to 18 Years | 1,707 (28.2%) | 4,402 (72.8%) |
| 19 to 25 Years | 225 (7.9%) | 2,407 (84.5%) |
| 25 to 34 Years | 491 (12.9%) | 2,995 (78.9%) |
| 35 to 44 Years | 897 (19.7%) | 3,640 (79.9%) |
| 45 to 54 Years | 1,105 (22.4%) | 3,691 (74.9%) |
| 55 to 64 Years | 1,035 (15.9%) | 5,413 (83.1%) |
| 65 to 74 Years | 4,377 (95.2%) | 3,131 (68.1%) |
| 75 Years and over | 2,820 (99.2%) | 1,851 (65.1%) |
| Total | 13,569 (35.5%) | 28,705 (75.1%) |
Disability Status by Sex by Age in Gloucester County
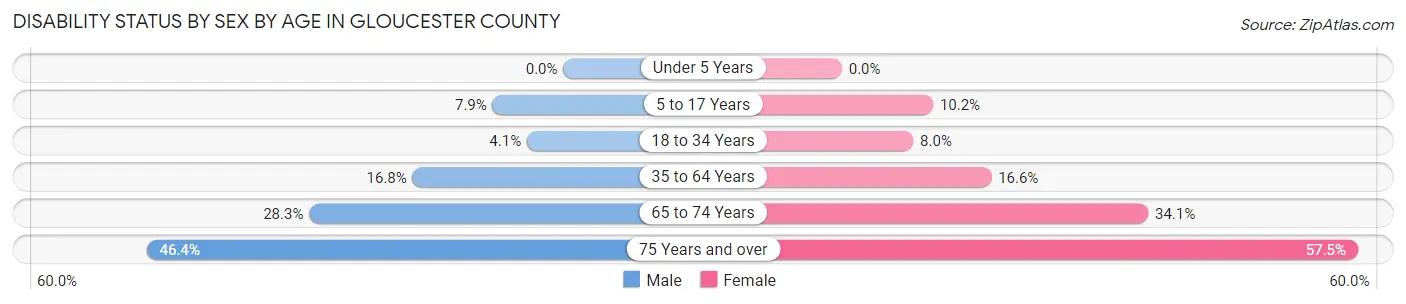
| Age Bracket | Male | Female |
| Under 5 Years | 0 (0.0%) | 0 (0.0%) |
| 5 to 17 Years | 248 (7.9%) | 279 (10.2%) |
| 18 to 34 Years | 144 (4.1%) | 275 (8.0%) |
| 35 to 64 Years | 1,293 (16.8%) | 1,381 (16.6%) |
| 65 to 74 Years | 641 (28.3%) | 795 (34.1%) |
| 75 Years and over | 543 (46.4%) | 962 (57.5%) |
Disability Class by Sex by Age in Gloucester County
Disability Class: Hearing Difficulty
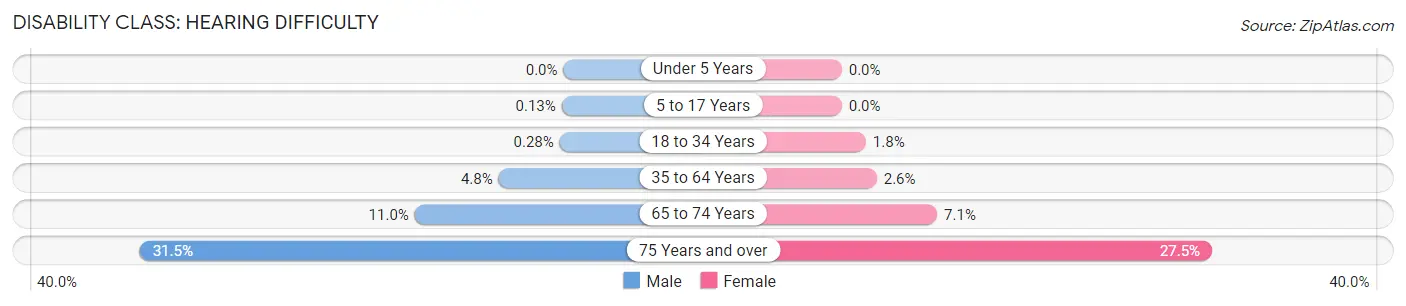
| Age Bracket | Male | Female |
| Under 5 Years | 0 (0.0%) | 0 (0.0%) |
| 5 to 17 Years | 4 (0.1%) | 0 (0.0%) |
| 18 to 34 Years | 10 (0.3%) | 62 (1.8%) |
| 35 to 64 Years | 370 (4.8%) | 216 (2.6%) |
| 65 to 74 Years | 250 (11.0%) | 165 (7.1%) |
| 75 Years and over | 368 (31.5%) | 460 (27.5%) |
Disability Class: Vision Difficulty
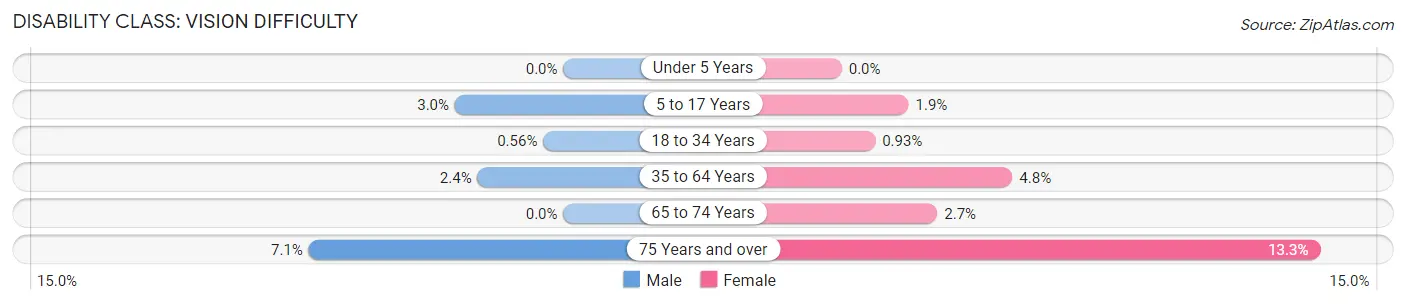
| Age Bracket | Male | Female |
| Under 5 Years | 0 (0.0%) | 0 (0.0%) |
| 5 to 17 Years | 95 (3.0%) | 51 (1.9%) |
| 18 to 34 Years | 20 (0.6%) | 32 (0.9%) |
| 35 to 64 Years | 184 (2.4%) | 394 (4.8%) |
| 65 to 74 Years | 0 (0.0%) | 62 (2.7%) |
| 75 Years and over | 83 (7.1%) | 223 (13.3%) |
Disability Class: Cognitive Difficulty
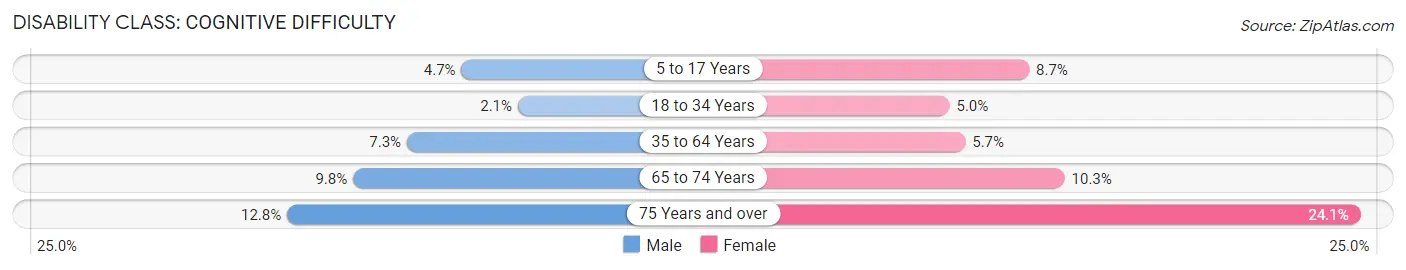
| Age Bracket | Male | Female |
| 5 to 17 Years | 149 (4.7%) | 239 (8.7%) |
| 18 to 34 Years | 75 (2.1%) | 173 (5.0%) |
| 35 to 64 Years | 559 (7.3%) | 476 (5.7%) |
| 65 to 74 Years | 221 (9.8%) | 241 (10.3%) |
| 75 Years and over | 150 (12.8%) | 403 (24.1%) |
Disability Class: Ambulatory Difficulty
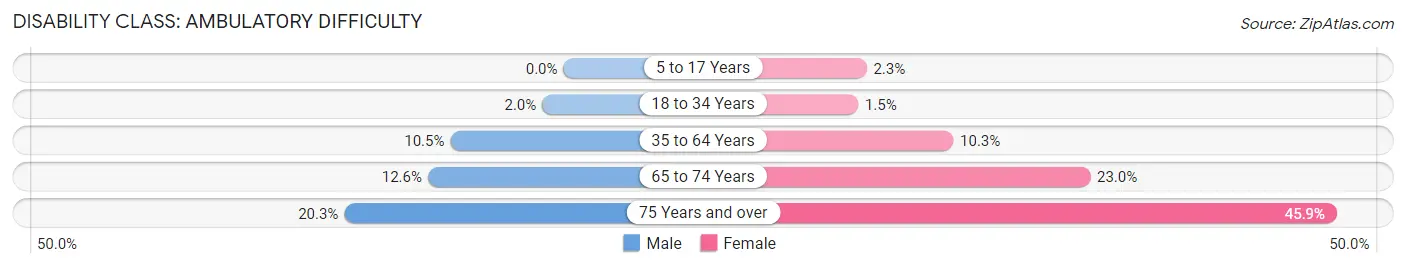
| Age Bracket | Male | Female |
| 5 to 17 Years | 0 (0.0%) | 63 (2.3%) |
| 18 to 34 Years | 70 (2.0%) | 52 (1.5%) |
| 35 to 64 Years | 808 (10.5%) | 857 (10.3%) |
| 65 to 74 Years | 285 (12.6%) | 537 (23.0%) |
| 75 Years and over | 238 (20.3%) | 769 (45.9%) |
Disability Class: Self-Care Difficulty
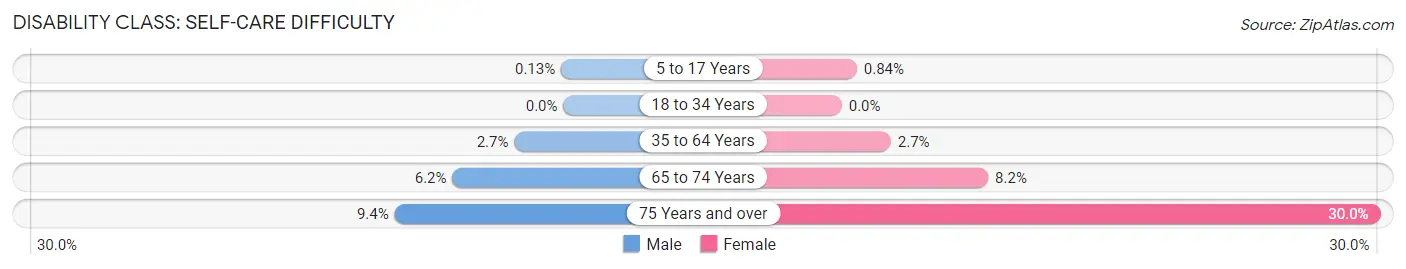
| Age Bracket | Male | Female |
| 5 to 17 Years | 4 (0.1%) | 23 (0.8%) |
| 18 to 34 Years | 0 (0.0%) | 0 (0.0%) |
| 35 to 64 Years | 210 (2.7%) | 227 (2.7%) |
| 65 to 74 Years | 140 (6.2%) | 190 (8.2%) |
| 75 Years and over | 110 (9.4%) | 502 (30.0%) |
Technology Access in Gloucester County
Computing Device Access in Gloucester County
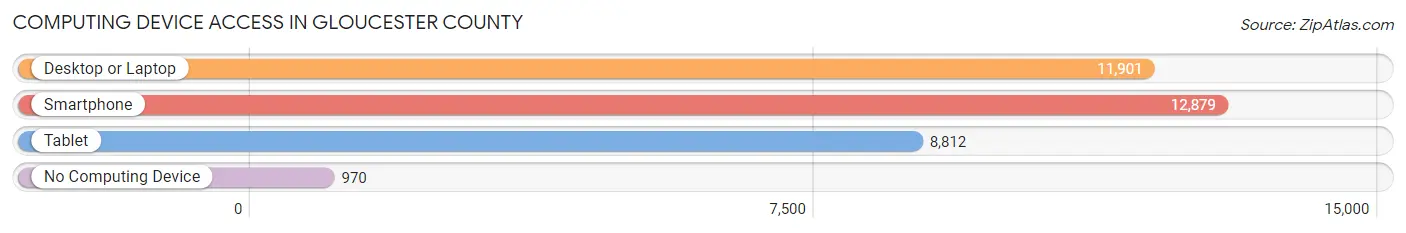
| Device Type | # Households | % Households |
| Desktop or Laptop | 11,901 | 80.1% |
| Smartphone | 12,879 | 86.7% |
| Tablet | 8,812 | 59.3% |
| No Computing Device | 970 | 6.5% |
| Total | 14,857 | 100.0% |
Internet Access in Gloucester County
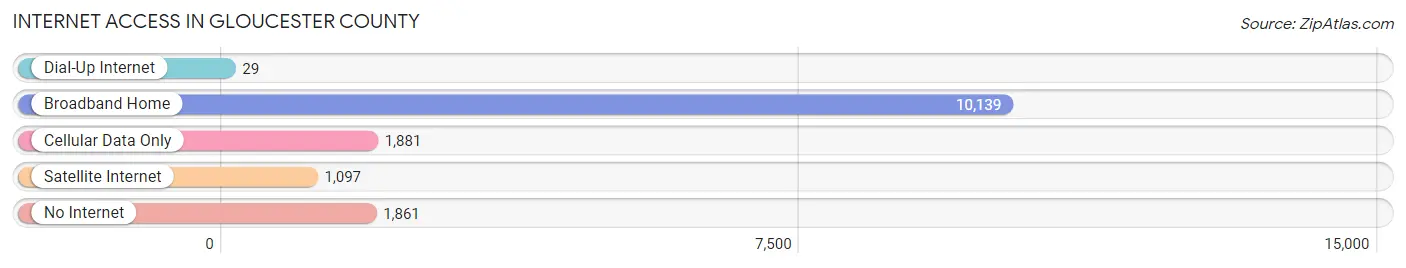
| Internet Type | # Households | % Households |
| Dial-Up Internet | 29 | 0.2% |
| Broadband Home | 10,139 | 68.2% |
| Cellular Data Only | 1,881 | 12.7% |
| Satellite Internet | 1,097 | 7.4% |
| No Internet | 1,861 | 12.5% |
| Total | 14,857 | 100.0% |
Gloucester County Summary
Gloucester County, Virginia is located in the Middle Peninsula region of the state, and is bordered by the York River to the north, the Rappahannock River to the south, and the Chesapeake Bay to the east. The county is home to a population of approximately 36,000 people, and is known for its rural character and natural beauty.
Geography
Gloucester County is located in the Middle Peninsula region of Virginia, and is bordered by the York River to the north, the Rappahannock River to the south, and the Chesapeake Bay to the east. The county is approximately 50 miles east of Richmond, and is situated between the James and York Rivers. The county is divided into two distinct regions: the Northern Neck and the Middle Peninsula. The Northern Neck is characterized by its flat terrain and is home to the majority of the county’s population. The Middle Peninsula is more hilly and is home to the county’s rural areas. The county is home to a variety of wildlife, including deer, foxes, and bald eagles.
History
Gloucester County was established in 1651 and is one of the oldest counties in Virginia. The county was named after Henry Stuart, the Duke of Gloucester, who was the son of King Charles I of England. The county was originally part of York County, but was split off in 1651. The county was home to a variety of Native American tribes, including the Powhatan, Rappahannock, and Nottoway. The county was also home to a number of colonial settlements, including Gloucester Town, which was established in 1651.
The county was an important center of trade and commerce during the colonial period, and was home to a number of plantations. The county was also home to a number of Revolutionary War battles, including the Battle of Gloucester Point in 1781. The county was also home to a number of Civil War battles, including the Battle of Gloucester Courthouse in 1862.
Economy
Gloucester County is home to a variety of industries, including agriculture, manufacturing, and tourism. The county is home to a number of farms, which produce a variety of crops, including corn, soybeans, and wheat. The county is also home to a number of manufacturing companies, which produce a variety of products, including furniture, textiles, and electronics. The county is also home to a number of tourist attractions, including the Gloucester County Historical Society, the Gloucester County Courthouse, and the Gloucester County Museum.
Demographics
As of the 2010 census, Gloucester County had a population of 36,000 people. The population is predominantly white (87.3%), with African Americans making up 8.2% of the population, and Hispanics making up 2.3% of the population. The median household income in the county is $60,000, and the median home value is $250,000. The county is home to a variety of religious denominations, including Baptist, Methodist, and Catholic.
Conclusion
Gloucester County, Virginia is a rural county located in the Middle Peninsula region of the state. The county is home to a population of approximately 36,000 people, and is known for its rural character and natural beauty. The county is home to a variety of industries, including agriculture, manufacturing, and tourism. The county is predominantly white, with African Americans and Hispanics making up a small portion of the population. The county is home to a variety of religious denominations, and is an important center of trade and commerce.
Common Questions
What is Per Capita Income in Gloucester County?
Per Capita income in Gloucester County is $39,450.
What is the Median Family Income in Gloucester County?
Median Family Income in Gloucester County is $100,085.
What is the Median Household income in Gloucester County?
Median Household Income in Gloucester County is $83,750.
What is Income or Wage Gap in Gloucester County?
Income or Wage Gap in Gloucester County is 31.6%.
Women in Gloucester County earn 68.4 cents for every dollar earned by a man.
What is Family Income Deficit in Gloucester County?
Family Income Deficit in Gloucester County is $11,149.
Families that are below poverty line in Gloucester County earn $11,149 less on average than the poverty threshold level.
What is Inequality or Gini Index in Gloucester County?
Inequality or Gini Index in Gloucester County is 0.39.
What is the Total Population of Gloucester County?
Total Population of Gloucester County is 38,875.
What is the Total Male Population of Gloucester County?
Total Male Population of Gloucester County is 19,309.
What is the Total Female Population of Gloucester County?
Total Female Population of Gloucester County is 19,566.
What is the Ratio of Males per 100 Females in Gloucester County?
There are 98.69 Males per 100 Females in Gloucester County.
What is the Ratio of Females per 100 Males in Gloucester County?
There are 101.33 Females per 100 Males in Gloucester County.
What is the Median Population Age in Gloucester County?
Median Population Age in Gloucester County is 44.3 Years.
What is the Average Family Size in Gloucester County
Average Family Size in Gloucester County is 3.0 People.
What is the Average Household Size in Gloucester County
Average Household Size in Gloucester County is 2.6 People.
How Large is the Labor Force in Gloucester County?
There are 20,135 People in the Labor Forcein in Gloucester County.
What is the Percentage of People in the Labor Force in Gloucester County?
63.1% of People are in the Labor Force in Gloucester County.
What is the Unemployment Rate in Gloucester County?
Unemployment Rate in Gloucester County is 3.4%.