Fredericksburg city, VA Map & Demographics
Fredericksburg city Map
Fredericksburg city Overview
$43,063
PER CAPITA INCOME
$121,781
AVG FAMILY INCOME
$83,445
AVG HOUSEHOLD INCOME
40.8%
WAGE / INCOME GAP [ % ]
59.2¢/ $1
WAGE / INCOME GAP [ $ ]
0.46
INEQUALITY / GINI INDEX
28,258
TOTAL POPULATION
13,202
MALE POPULATION
15,056
FEMALE POPULATION
87.69
MALES / 100 FEMALES
114.04
FEMALES / 100 MALES
30.9
MEDIAN AGE
3.1
AVG FAMILY SIZE
2.3
AVG HOUSEHOLD SIZE
15,720
LABOR FORCE [ PEOPLE ]
68.6%
PERCENT IN LABOR FORCE
5.2%
UNEMPLOYMENT RATE
Fredericksburg city Area Codes
Income in Fredericksburg city
Income Overview in Fredericksburg city
Per Capita Income in Fredericksburg city is $43,063, while median incomes of families and households are $121,781 and $83,445 respectively.
| Characteristic | Number | Measure |
| Per Capita Income | 28,258 | $43,063 |
| Median Family Income | 5,851 | $121,781 |
| Mean Family Income | 5,851 | $141,663 |
| Median Household Income | 11,276 | $83,445 |
| Mean Household Income | 11,276 | $110,066 |
| Income Deficit | 5,851 | $0 |
| Wage / Income Gap (%) | 28,258 | 40.76% |
| Wage / Income Gap ($) | 28,258 | 59.24¢ per $1 |
| Gini / Inequality Index | 28,258 | 0.46 |
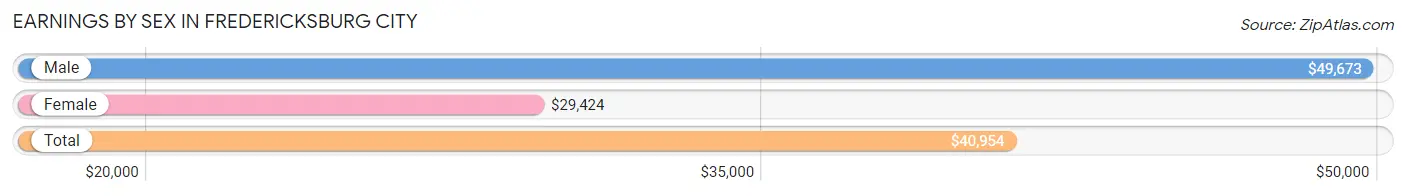
Earnings by Sex in Fredericksburg city
Average Earnings in Fredericksburg city are $40,954, $49,673 for men and $29,424 for women, a difference of 40.8%.
| Sex | Number | Average Earnings |
| Male | 8,115 (49.0%) | $49,673 |
| Female | 8,450 (51.0%) | $29,424 |
| Total | 16,565 (100.0%) | $40,954 |
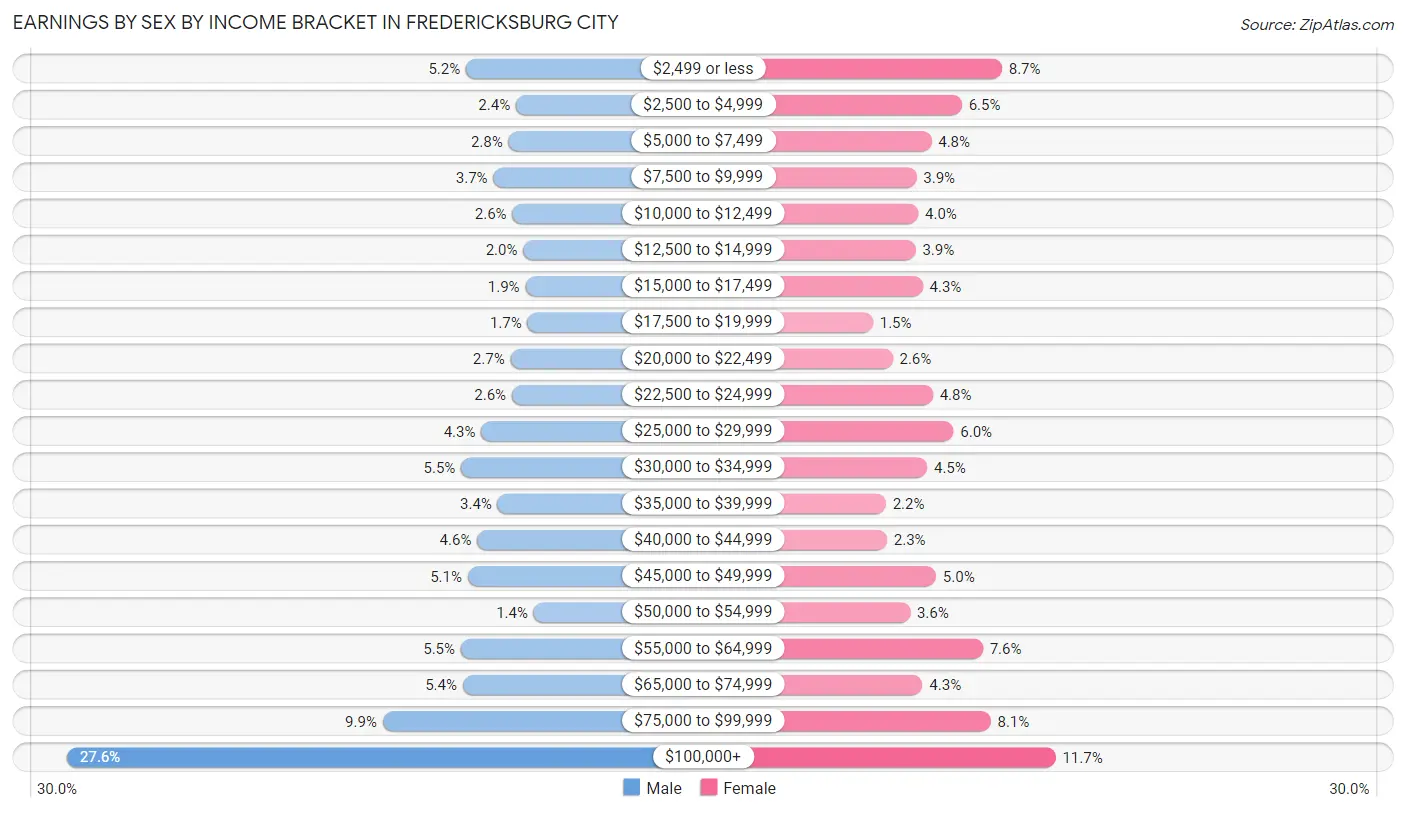
Earnings by Sex by Income Bracket in Fredericksburg city
The most common earnings brackets in Fredericksburg city are $100,000+ for men (2,241 | 27.6%) and $100,000+ for women (991 | 11.7%).
| Income | Male | Female |
| $2,499 or less | 421 (5.2%) | 736 (8.7%) |
| $2,500 to $4,999 | 193 (2.4%) | 546 (6.5%) |
| $5,000 to $7,499 | 227 (2.8%) | 401 (4.8%) |
| $7,500 to $9,999 | 296 (3.6%) | 330 (3.9%) |
| $10,000 to $12,499 | 209 (2.6%) | 339 (4.0%) |
| $12,500 to $14,999 | 160 (2.0%) | 326 (3.9%) |
| $15,000 to $17,499 | 150 (1.8%) | 360 (4.3%) |
| $17,500 to $19,999 | 140 (1.7%) | 123 (1.5%) |
| $20,000 to $22,499 | 218 (2.7%) | 217 (2.6%) |
| $22,500 to $24,999 | 212 (2.6%) | 408 (4.8%) |
| $25,000 to $29,999 | 351 (4.3%) | 506 (6.0%) |
| $30,000 to $34,999 | 443 (5.5%) | 381 (4.5%) |
| $35,000 to $39,999 | 277 (3.4%) | 185 (2.2%) |
| $40,000 to $44,999 | 370 (4.6%) | 190 (2.2%) |
| $45,000 to $49,999 | 413 (5.1%) | 423 (5.0%) |
| $50,000 to $54,999 | 112 (1.4%) | 300 (3.5%) |
| $55,000 to $64,999 | 445 (5.5%) | 646 (7.6%) |
| $65,000 to $74,999 | 436 (5.4%) | 359 (4.3%) |
| $75,000 to $99,999 | 801 (9.9%) | 683 (8.1%) |
| $100,000+ | 2,241 (27.6%) | 991 (11.7%) |
| Total | 8,115 (100.0%) | 8,450 (100.0%) |
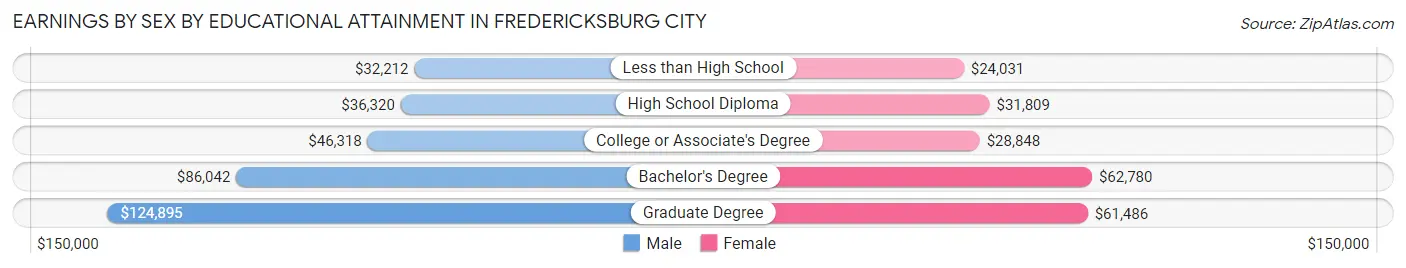
Earnings by Sex by Educational Attainment in Fredericksburg city
Average earnings in Fredericksburg city are $69,245 for men and $47,450 for women, a difference of 31.5%. Men with an educational attainment of graduate degree enjoy the highest average annual earnings of $124,895, while those with less than high school education earn the least with $32,212. Women with an educational attainment of bachelor's degree earn the most with the average annual earnings of $62,780, while those with less than high school education have the smallest earnings of $24,031.
| Educational Attainment | Male Income | Female Income |
| Less than High School | $32,212 | $24,031 |
| High School Diploma | $36,320 | $31,809 |
| College or Associate's Degree | $46,318 | $28,848 |
| Bachelor's Degree | $86,042 | $62,780 |
| Graduate Degree | $124,895 | $61,486 |
| Total | $69,245 | $47,450 |
Family Income in Fredericksburg city
Family Income Brackets in Fredericksburg city
According to the Fredericksburg city family income data, there are 1,141 families falling into the $200,000+ income range, which is the most common income bracket and makes up 19.5% of all families. Conversely, the $10,000 to $14,999 income bracket is the least frequent group with only 64 families (1.1%) belonging to this category.
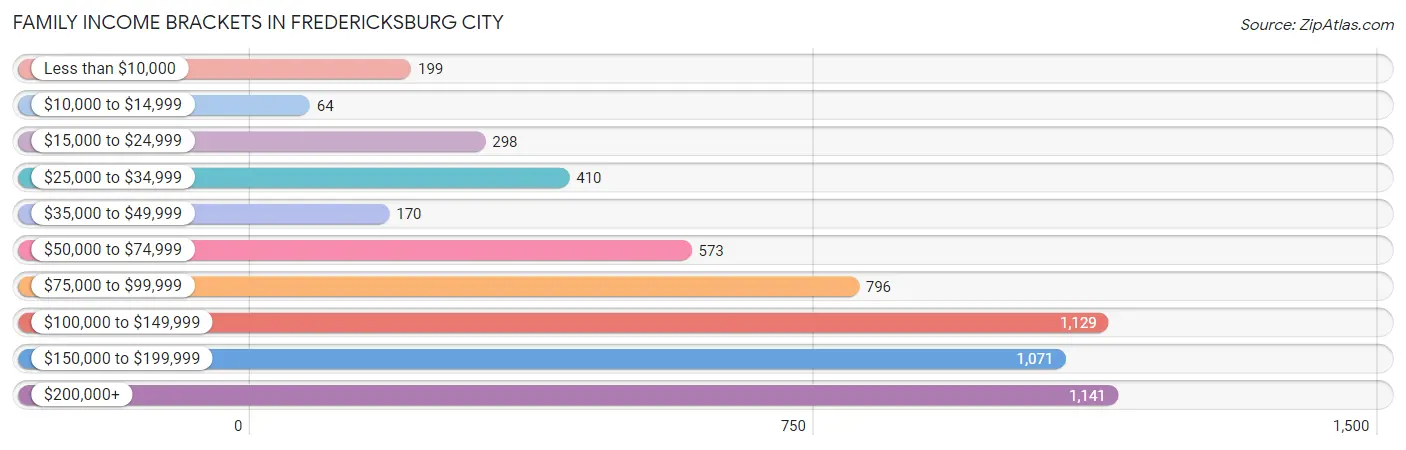
| Income Bracket | # Families | % Families |
| Less than $10,000 | 199 | 3.4% |
| $10,000 to $14,999 | 64 | 1.1% |
| $15,000 to $24,999 | 298 | 5.1% |
| $25,000 to $34,999 | 410 | 7.0% |
| $35,000 to $49,999 | 170 | 2.9% |
| $50,000 to $74,999 | 573 | 9.8% |
| $75,000 to $99,999 | 796 | 13.6% |
| $100,000 to $149,999 | 1,129 | 19.3% |
| $150,000 to $199,999 | 1,071 | 18.3% |
| $200,000+ | 1,141 | 19.5% |
Family Income by Famaliy Size in Fredericksburg city
5-person families (285 | 4.9%) account for the highest median family income in Fredericksburg city with $173,211 per family, while 2-person families (2,974 | 50.8%) have the highest median income of $52,945 per family member.
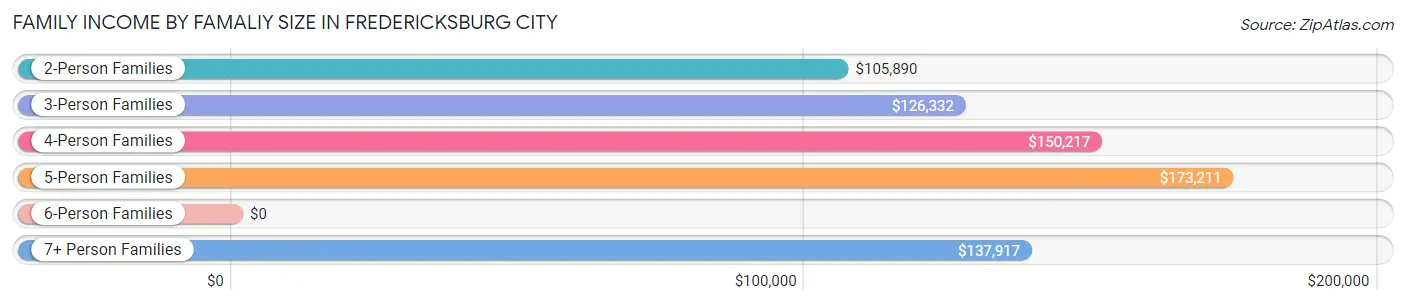
| Income Bracket | # Families | Median Income |
| 2-Person Families | 2,974 (50.8%) | $105,890 |
| 3-Person Families | 1,182 (20.2%) | $126,332 |
| 4-Person Families | 926 (15.8%) | $150,217 |
| 5-Person Families | 285 (4.9%) | $173,211 |
| 6-Person Families | 399 (6.8%) | $0 |
| 7+ Person Families | 85 (1.5%) | $137,917 |
| Total | 5,851 (100.0%) | $121,781 |
Family Income by Number of Earners in Fredericksburg city
The median family income in Fredericksburg city is $121,781, with families comprising 3+ earners (519) having the highest median family income of $192,375, while families with no earners (604) have the lowest median family income of $75,513, accounting for 8.9% and 10.3% of families, respectively.
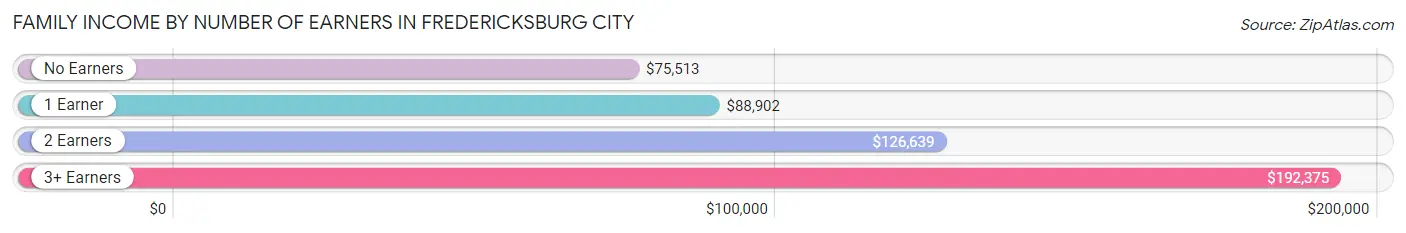
| Number of Earners | # Families | Median Income |
| No Earners | 604 (10.3%) | $75,513 |
| 1 Earner | 1,847 (31.6%) | $88,902 |
| 2 Earners | 2,881 (49.2%) | $126,639 |
| 3+ Earners | 519 (8.9%) | $192,375 |
| Total | 5,851 (100.0%) | $121,781 |
Household Income in Fredericksburg city
Household Income Brackets in Fredericksburg city
With 1,793 households falling in the category, the $100,000 to $149,999 income range is the most frequent in Fredericksburg city, accounting for 15.9% of all households. In contrast, only 428 households (3.8%) fall into the $10,000 to $14,999 income bracket, making it the least populous group.
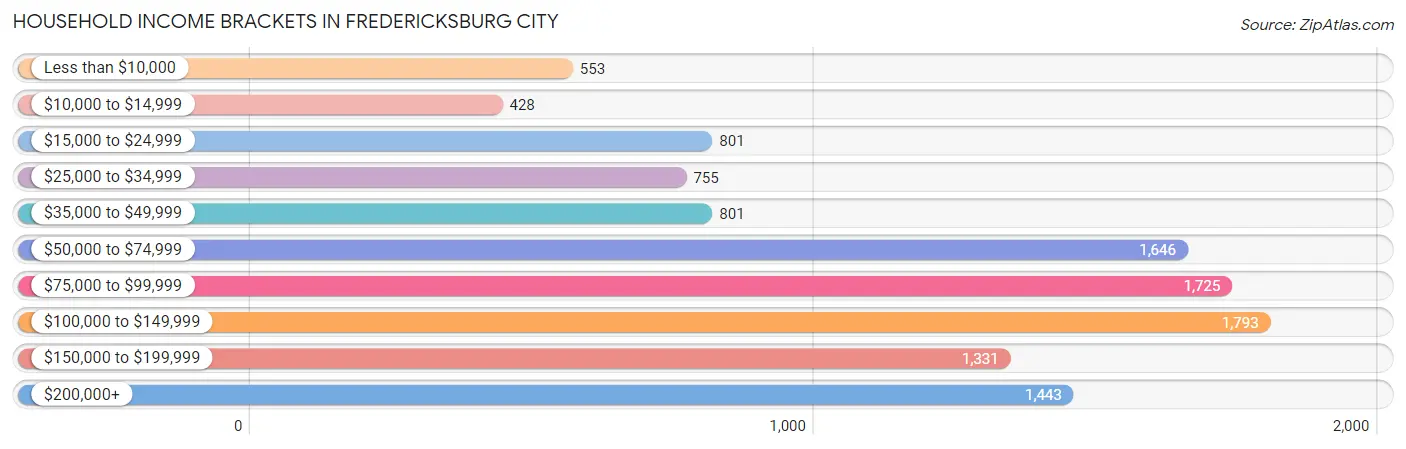
| Income Bracket | # Households | % Households |
| Less than $10,000 | 553 | 4.9% |
| $10,000 to $14,999 | 428 | 3.8% |
| $15,000 to $24,999 | 801 | 7.1% |
| $25,000 to $34,999 | 755 | 6.7% |
| $35,000 to $49,999 | 801 | 7.1% |
| $50,000 to $74,999 | 1,646 | 14.6% |
| $75,000 to $99,999 | 1,725 | 15.3% |
| $100,000 to $149,999 | 1,793 | 15.9% |
| $150,000 to $199,999 | 1,331 | 11.8% |
| $200,000+ | 1,443 | 12.8% |
Household Income by Householder Age in Fredericksburg city
The median household income in Fredericksburg city is $83,445, with the highest median household income of $127,313 found in the 45 to 64 years age bracket for the primary householder. A total of 3,642 households (32.3%) fall into this category. Meanwhile, the 15 to 24 years age bracket for the primary householder has the lowest median household income of $49,071, with 1,074 households (9.5%) in this group.
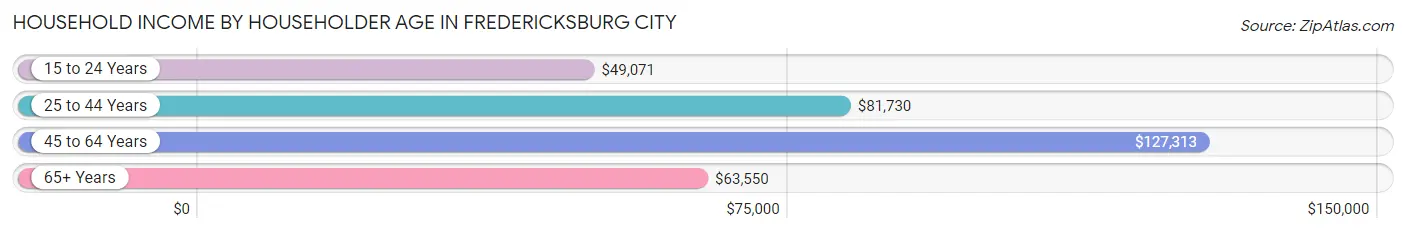
| Income Bracket | # Households | Median Income |
| 15 to 24 Years | 1,074 (9.5%) | $49,071 |
| 25 to 44 Years | 4,197 (37.2%) | $81,730 |
| 45 to 64 Years | 3,642 (32.3%) | $127,313 |
| 65+ Years | 2,363 (21.0%) | $63,550 |
| Total | 11,276 (100.0%) | $83,445 |
Poverty in Fredericksburg city
Income Below Poverty by Sex and Age in Fredericksburg city
With 18.2% poverty level for males and 17.8% for females among the residents of Fredericksburg city, 5 year old males and 15 year old females are the most vulnerable to poverty, with 151 males (79.9%) and 61 females (36.1%) in their respective age groups living below the poverty level.
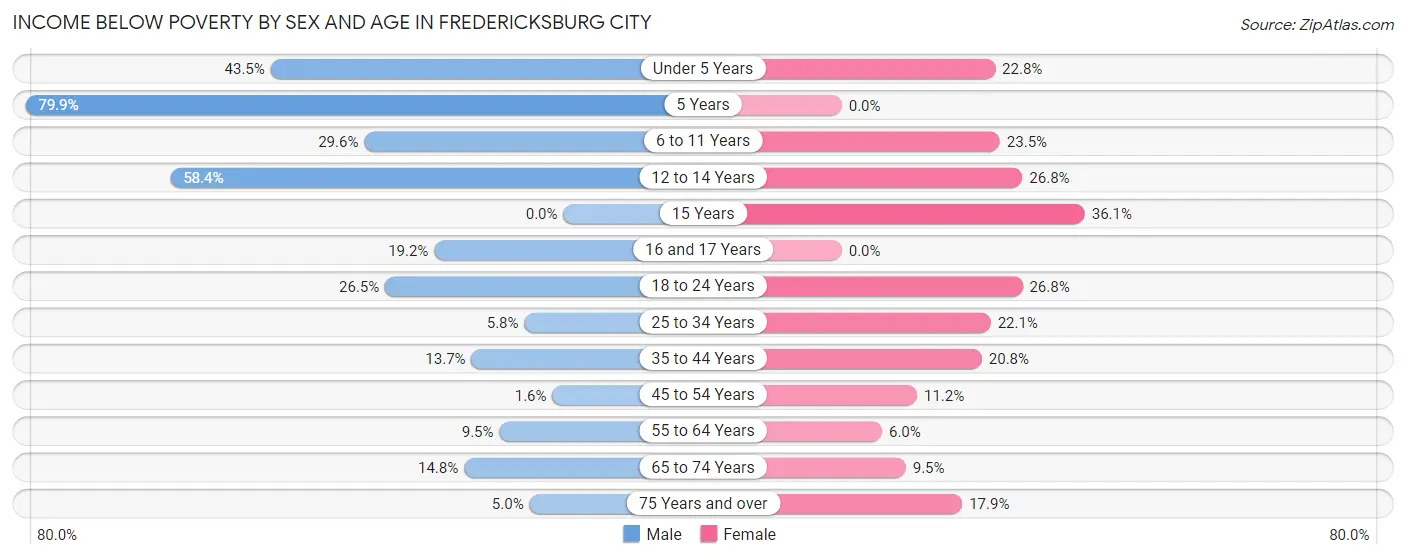
| Age Bracket | Male | Female |
| Under 5 Years | 373 (43.5%) | 171 (22.8%) |
| 5 Years | 151 (79.9%) | 0 (0.0%) |
| 6 to 11 Years | 283 (29.6%) | 231 (23.5%) |
| 12 to 14 Years | 352 (58.4%) | 140 (26.8%) |
| 15 Years | 0 (0.0%) | 61 (36.1%) |
| 16 and 17 Years | 56 (19.2%) | 0 (0.0%) |
| 18 to 24 Years | 429 (26.5%) | 432 (26.8%) |
| 25 to 34 Years | 126 (5.8%) | 464 (22.1%) |
| 35 to 44 Years | 204 (13.7%) | 365 (20.8%) |
| 45 to 54 Years | 26 (1.6%) | 189 (11.2%) |
| 55 to 64 Years | 132 (9.5%) | 92 (6.0%) |
| 65 to 74 Years | 133 (14.7%) | 102 (9.5%) |
| 75 Years and over | 22 (5.0%) | 133 (17.9%) |
| Total | 2,287 (18.2%) | 2,380 (17.8%) |
Income Above Poverty by Sex and Age in Fredericksburg city
According to the poverty statistics in Fredericksburg city, males aged 15 years and females aged 5 years are the age groups that are most secure financially, with 100.0% of males and 100.0% of females in these age groups living above the poverty line.
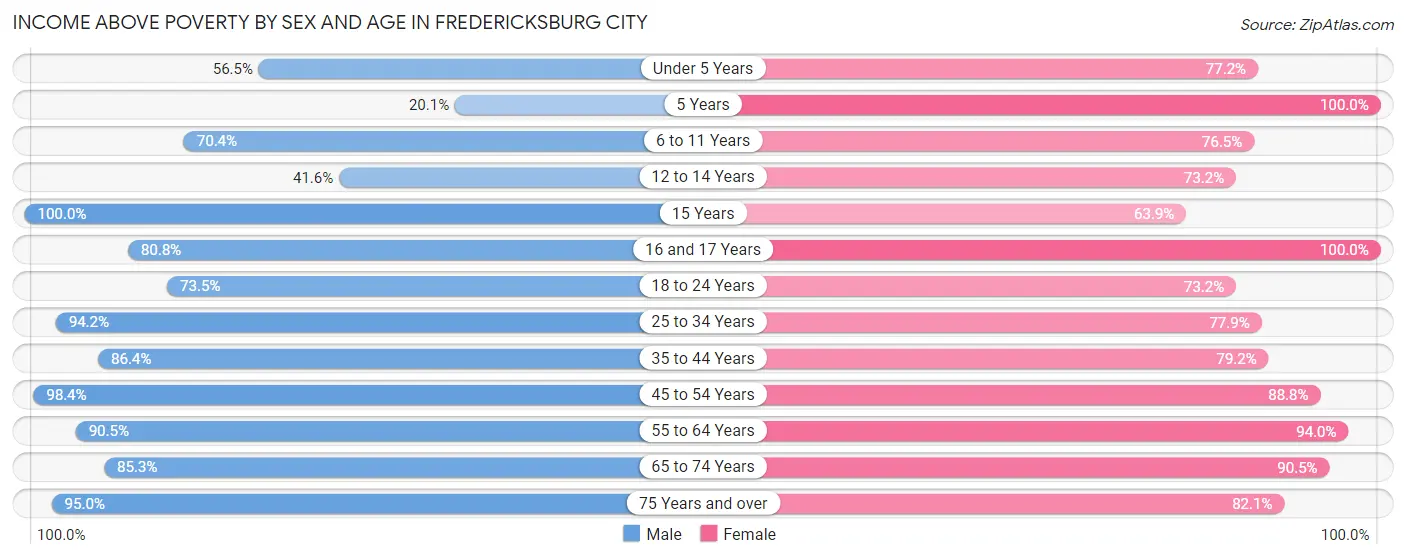
| Age Bracket | Male | Female |
| Under 5 Years | 485 (56.5%) | 580 (77.2%) |
| 5 Years | 38 (20.1%) | 147 (100.0%) |
| 6 to 11 Years | 674 (70.4%) | 753 (76.5%) |
| 12 to 14 Years | 251 (41.6%) | 382 (73.2%) |
| 15 Years | 13 (100.0%) | 108 (63.9%) |
| 16 and 17 Years | 236 (80.8%) | 267 (100.0%) |
| 18 to 24 Years | 1,192 (73.5%) | 1,178 (73.2%) |
| 25 to 34 Years | 2,051 (94.2%) | 1,635 (77.9%) |
| 35 to 44 Years | 1,291 (86.4%) | 1,390 (79.2%) |
| 45 to 54 Years | 1,570 (98.4%) | 1,501 (88.8%) |
| 55 to 64 Years | 1,258 (90.5%) | 1,446 (94.0%) |
| 65 to 74 Years | 769 (85.3%) | 972 (90.5%) |
| 75 Years and over | 415 (95.0%) | 611 (82.1%) |
| Total | 10,243 (81.8%) | 10,970 (82.2%) |
Income Below Poverty Among Married-Couple Families in Fredericksburg city
The poverty statistics for married-couple families in Fredericksburg city show that 6.1% or 245 of the total 3,988 families live below the poverty line. Families with 3 or 4 children have the highest poverty rate of 30.5%, comprising of 110 families. On the other hand, families with 5 or more children have the lowest poverty rate of 0.0%, which includes 0 families.
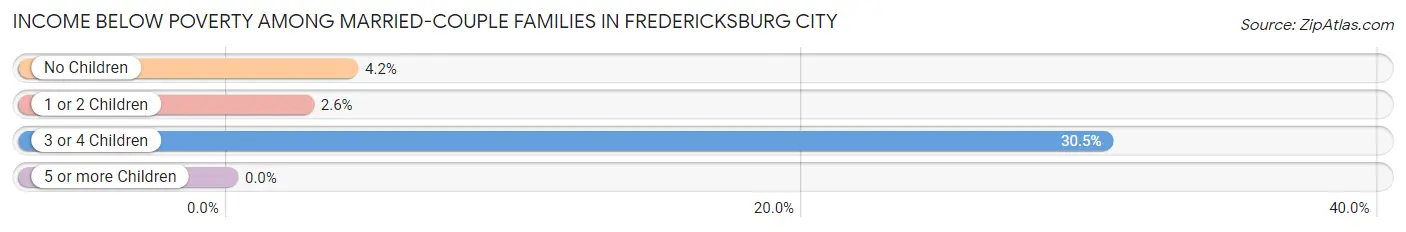
| Children | Above Poverty | Below Poverty |
| No Children | 2,476 (95.8%) | 108 (4.2%) |
| 1 or 2 Children | 996 (97.4%) | 27 (2.6%) |
| 3 or 4 Children | 251 (69.5%) | 110 (30.5%) |
| 5 or more Children | 20 (100.0%) | 0 (0.0%) |
| Total | 3,743 (93.9%) | 245 (6.1%) |
Income Below Poverty Among Single-Parent Households in Fredericksburg city
According to the poverty data in Fredericksburg city, 3.3% or 18 single-father households and 34.6% or 457 single-mother households are living below the poverty line. Among single-father households, those with no children have the highest poverty rate, with 18 households (7.0%) experiencing poverty. Likewise, among single-mother households, those with 5 or more children have the highest poverty rate, with 172 households (100.0%) falling below the poverty line.
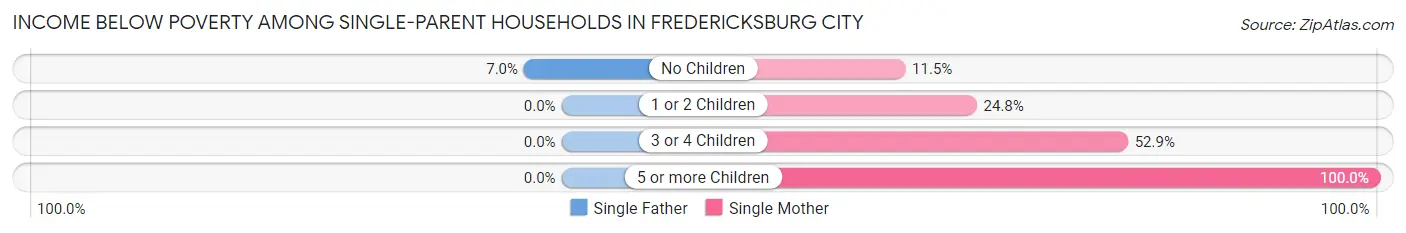
| Children | Single Father | Single Mother |
| No Children | 18 (7.0%) | 41 (11.5%) |
| 1 or 2 Children | 0 (0.0%) | 153 (24.8%) |
| 3 or 4 Children | 0 (0.0%) | 91 (52.9%) |
| 5 or more Children | 0 (0.0%) | 172 (100.0%) |
| Total | 18 (3.3%) | 457 (34.6%) |
Income Below Poverty Among Married-Couple vs Single-Parent Households in Fredericksburg city
The poverty data for Fredericksburg city shows that 245 of the married-couple family households (6.1%) and 475 of the single-parent households (25.5%) are living below the poverty level. Within the married-couple family households, those with 3 or 4 children have the highest poverty rate, with 110 households (30.5%) falling below the poverty line. Among the single-parent households, those with 5 or more children have the highest poverty rate, with 172 household (100.0%) living below poverty.
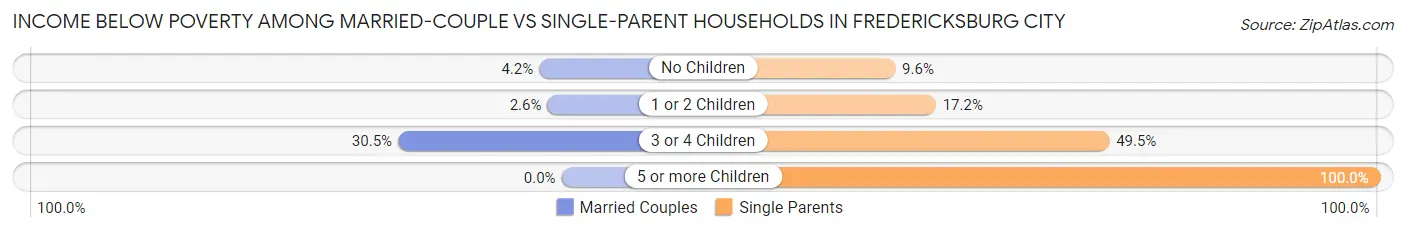
| Children | Married-Couple Families | Single-Parent Households |
| No Children | 108 (4.2%) | 59 (9.6%) |
| 1 or 2 Children | 27 (2.6%) | 153 (17.2%) |
| 3 or 4 Children | 110 (30.5%) | 91 (49.5%) |
| 5 or more Children | 0 (0.0%) | 172 (100.0%) |
| Total | 245 (6.1%) | 475 (25.5%) |
Race in Fredericksburg city
The most populous races in Fredericksburg city are White / Caucasian (16,923 | 59.9%), Black / African American (6,084 | 21.5%), and Hispanic or Latino (3,308 | 11.7%).
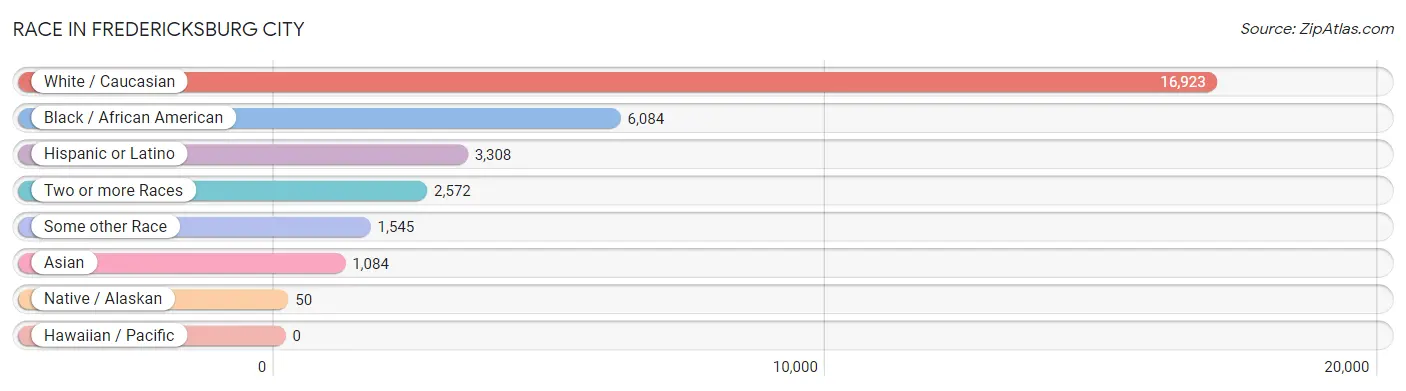
| Race | # Population | % Population |
| Asian | 1,084 | 3.8% |
| Black / African American | 6,084 | 21.5% |
| Hawaiian / Pacific | 0 | 0.0% |
| Hispanic or Latino | 3,308 | 11.7% |
| Native / Alaskan | 50 | 0.2% |
| White / Caucasian | 16,923 | 59.9% |
| Two or more Races | 2,572 | 9.1% |
| Some other Race | 1,545 | 5.5% |
| Total | 28,258 | 100.0% |
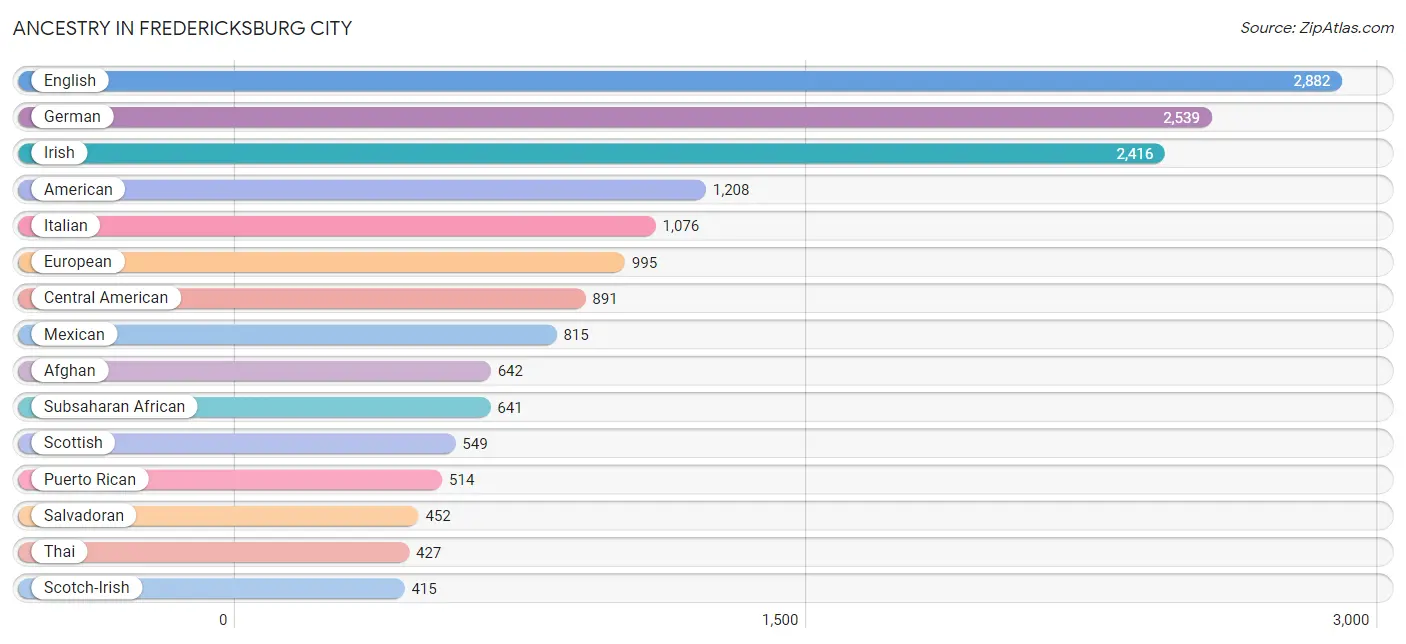
Ancestry in Fredericksburg city
The most populous ancestries reported in Fredericksburg city are English (2,882 | 10.2%), German (2,539 | 9.0%), Irish (2,416 | 8.6%), American (1,208 | 4.3%), and Italian (1,076 | 3.8%), together accounting for 35.8% of all Fredericksburg city residents.
| Ancestry | # Population | % Population |
| Afghan | 642 | 2.3% |
| African | 248 | 0.9% |
| American | 1,208 | 4.3% |
| Arab | 369 | 1.3% |
| Argentinean | 12 | 0.0% |
| Austrian | 40 | 0.1% |
| Barbadian | 10 | 0.0% |
| Belgian | 5 | 0.0% |
| Bhutanese | 51 | 0.2% |
| Blackfeet | 36 | 0.1% |
| Bolivian | 27 | 0.1% |
| British | 258 | 0.9% |
| Burmese | 113 | 0.4% |
| Canadian | 25 | 0.1% |
| Celtic | 5 | 0.0% |
| Central American | 891 | 3.2% |
| Cherokee | 102 | 0.4% |
| Chilean | 44 | 0.2% |
| Choctaw | 5 | 0.0% |
| Colombian | 69 | 0.2% |
| Costa Rican | 43 | 0.2% |
| Creek | 5 | 0.0% |
| Croatian | 50 | 0.2% |
| Cuban | 53 | 0.2% |
| Czech | 21 | 0.1% |
| Danish | 49 | 0.2% |
| Dutch | 187 | 0.7% |
| Eastern European | 16 | 0.1% |
| Ecuadorian | 106 | 0.4% |
| Egyptian | 34 | 0.1% |
| English | 2,882 | 10.2% |
| European | 995 | 3.5% |
| Finnish | 20 | 0.1% |
| French | 316 | 1.1% |
| French Canadian | 92 | 0.3% |
| German | 2,539 | 9.0% |
| Ghanaian | 35 | 0.1% |
| Greek | 66 | 0.2% |
| Guatemalan | 170 | 0.6% |
| Haitian | 48 | 0.2% |
| Honduran | 100 | 0.4% |
| Hungarian | 109 | 0.4% |
| Indian (Asian) | 230 | 0.8% |
| Iranian | 153 | 0.5% |
| Irish | 2,416 | 8.6% |
| Italian | 1,076 | 3.8% |
| Jamaican | 154 | 0.5% |
| Korean | 197 | 0.7% |
| Lebanese | 244 | 0.9% |
| Lithuanian | 77 | 0.3% |
| Luxembourger | 14 | 0.1% |
| Mexican | 815 | 2.9% |
| Mexican American Indian | 7 | 0.0% |
| Mongolian | 11 | 0.0% |
| Native Hawaiian | 51 | 0.2% |
| Navajo | 13 | 0.1% |
| Nicaraguan | 90 | 0.3% |
| Nigerian | 35 | 0.1% |
| Northern European | 21 | 0.1% |
| Norwegian | 237 | 0.8% |
| Pakistani | 4 | 0.0% |
| Palestinian | 82 | 0.3% |
| Panamanian | 36 | 0.1% |
| Peruvian | 19 | 0.1% |
| Polish | 393 | 1.4% |
| Portuguese | 62 | 0.2% |
| Puerto Rican | 514 | 1.8% |
| Russian | 118 | 0.4% |
| Salvadoran | 452 | 1.6% |
| Scandinavian | 11 | 0.0% |
| Scotch-Irish | 415 | 1.5% |
| Scottish | 549 | 1.9% |
| Seminole | 4 | 0.0% |
| Sierra Leonean | 180 | 0.6% |
| Slavic | 27 | 0.1% |
| Slovak | 21 | 0.1% |
| Slovene | 5 | 0.0% |
| South American | 277 | 1.0% |
| Spaniard | 27 | 0.1% |
| Spanish | 36 | 0.1% |
| Sri Lankan | 58 | 0.2% |
| Subsaharan African | 641 | 2.3% |
| Swedish | 110 | 0.4% |
| Swiss | 36 | 0.1% |
| Syrian | 9 | 0.0% |
| Thai | 427 | 1.5% |
| Ugandan | 143 | 0.5% |
| Ukrainian | 30 | 0.1% |
| Welsh | 324 | 1.1% |
| West Indian | 32 | 0.1% |
| Yugoslavian | 29 | 0.1% | View All 91 Rows |
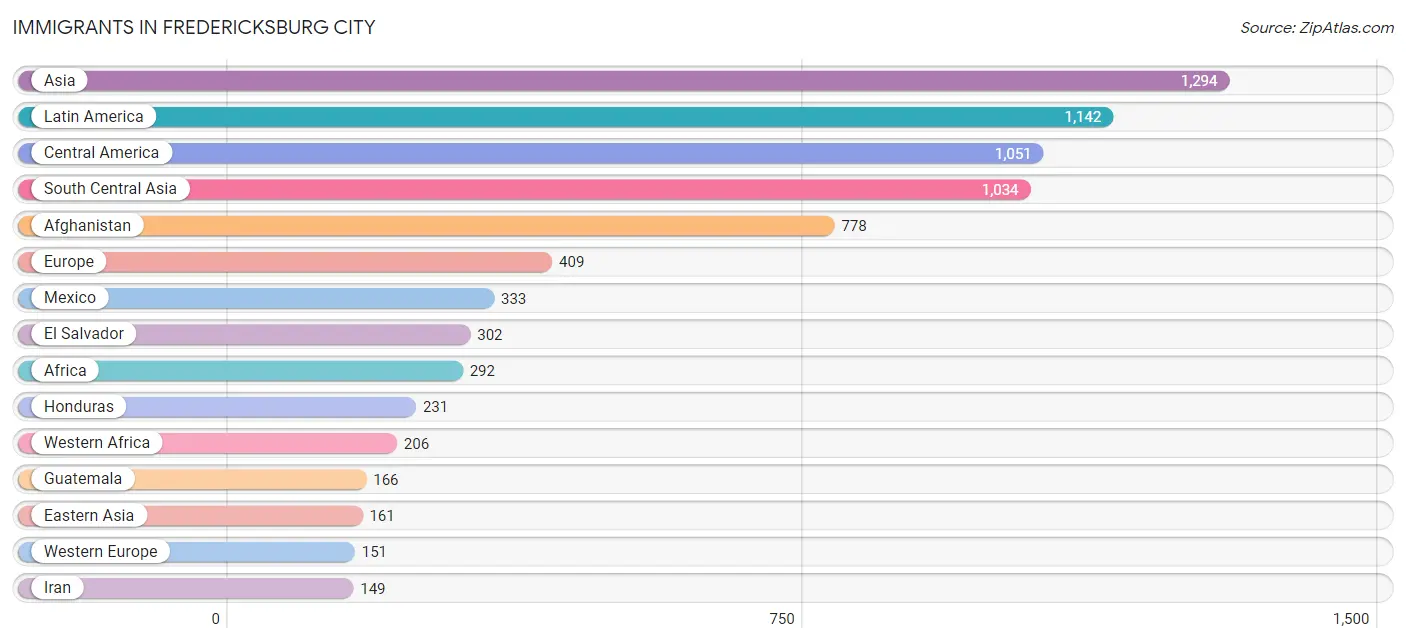
Immigrants in Fredericksburg city
The most numerous immigrant groups reported in Fredericksburg city came from Asia (1,294 | 4.6%), Latin America (1,142 | 4.0%), Central America (1,051 | 3.7%), South Central Asia (1,034 | 3.7%), and Afghanistan (778 | 2.8%), together accounting for 18.8% of all Fredericksburg city residents.
| Immigration Origin | # Population | % Population |
| Afghanistan | 778 | 2.8% |
| Africa | 292 | 1.0% |
| Argentina | 12 | 0.0% |
| Asia | 1,294 | 4.6% |
| Austria | 6 | 0.0% |
| Bolivia | 27 | 0.1% |
| Canada | 59 | 0.2% |
| Caribbean | 21 | 0.1% |
| Central America | 1,051 | 3.7% |
| China | 65 | 0.2% |
| Colombia | 31 | 0.1% |
| Cuba | 9 | 0.0% |
| Eastern Africa | 43 | 0.2% |
| Eastern Asia | 161 | 0.6% |
| Eastern Europe | 116 | 0.4% |
| Egypt | 15 | 0.1% |
| El Salvador | 302 | 1.1% |
| England | 20 | 0.1% |
| Europe | 409 | 1.5% |
| France | 49 | 0.2% |
| Germany | 96 | 0.3% |
| Ghana | 92 | 0.3% |
| Greece | 10 | 0.0% |
| Guatemala | 166 | 0.6% |
| Honduras | 231 | 0.8% |
| Hong Kong | 12 | 0.0% |
| Iran | 149 | 0.5% |
| Italy | 3 | 0.0% |
| Jamaica | 12 | 0.0% |
| Japan | 18 | 0.1% |
| Kazakhstan | 22 | 0.1% |
| Korea | 78 | 0.3% |
| Latin America | 1,142 | 4.0% |
| Mexico | 333 | 1.2% |
| Nigeria | 25 | 0.1% |
| Northern Africa | 15 | 0.1% |
| Northern Europe | 129 | 0.5% |
| Pakistan | 27 | 0.1% |
| Panama | 19 | 0.1% |
| Philippines | 13 | 0.1% |
| Russia | 116 | 0.4% |
| Saudi Arabia | 36 | 0.1% |
| Sierra Leone | 89 | 0.3% |
| South America | 70 | 0.3% |
| South Central Asia | 1,034 | 3.7% |
| South Eastern Asia | 56 | 0.2% |
| Southern Europe | 13 | 0.1% |
| Sweden | 12 | 0.0% |
| Thailand | 4 | 0.0% |
| Uganda | 43 | 0.2% |
| Vietnam | 39 | 0.1% |
| Western Africa | 206 | 0.7% |
| Western Asia | 36 | 0.1% |
| Western Europe | 151 | 0.5% | View All 54 Rows |
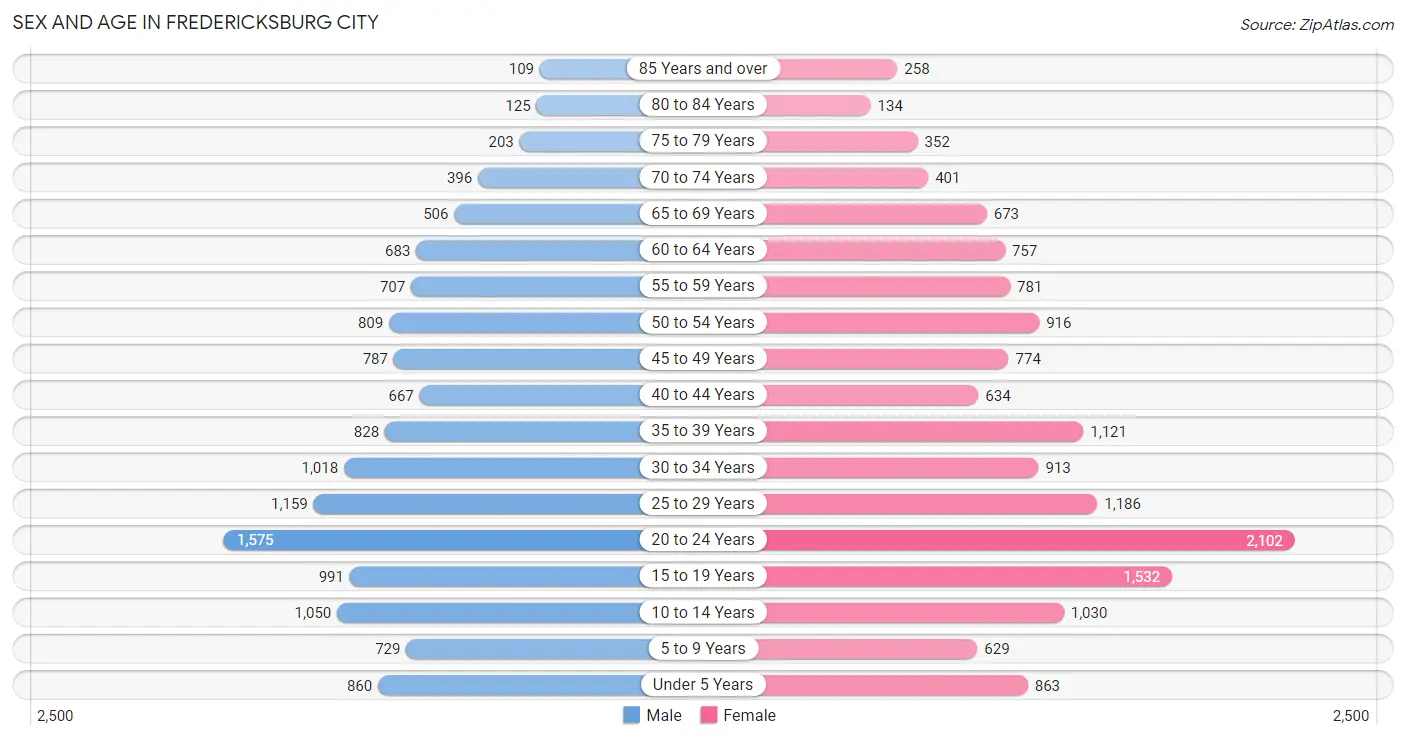
Sex and Age in Fredericksburg city
Sex and Age in Fredericksburg city
The most populous age groups in Fredericksburg city are 20 to 24 Years (1,575 | 11.9%) for men and 20 to 24 Years (2,102 | 14.0%) for women.
| Age Bracket | Male | Female |
| Under 5 Years | 860 (6.5%) | 863 (5.7%) |
| 5 to 9 Years | 729 (5.5%) | 629 (4.2%) |
| 10 to 14 Years | 1,050 (8.0%) | 1,030 (6.8%) |
| 15 to 19 Years | 991 (7.5%) | 1,532 (10.2%) |
| 20 to 24 Years | 1,575 (11.9%) | 2,102 (14.0%) |
| 25 to 29 Years | 1,159 (8.8%) | 1,186 (7.9%) |
| 30 to 34 Years | 1,018 (7.7%) | 913 (6.1%) |
| 35 to 39 Years | 828 (6.3%) | 1,121 (7.4%) |
| 40 to 44 Years | 667 (5.1%) | 634 (4.2%) |
| 45 to 49 Years | 787 (6.0%) | 774 (5.1%) |
| 50 to 54 Years | 809 (6.1%) | 916 (6.1%) |
| 55 to 59 Years | 707 (5.4%) | 781 (5.2%) |
| 60 to 64 Years | 683 (5.2%) | 757 (5.0%) |
| 65 to 69 Years | 506 (3.8%) | 673 (4.5%) |
| 70 to 74 Years | 396 (3.0%) | 401 (2.7%) |
| 75 to 79 Years | 203 (1.5%) | 352 (2.3%) |
| 80 to 84 Years | 125 (0.9%) | 134 (0.9%) |
| 85 Years and over | 109 (0.8%) | 258 (1.7%) |
| Total | 13,202 (100.0%) | 15,056 (100.0%) |
Families and Households in Fredericksburg city
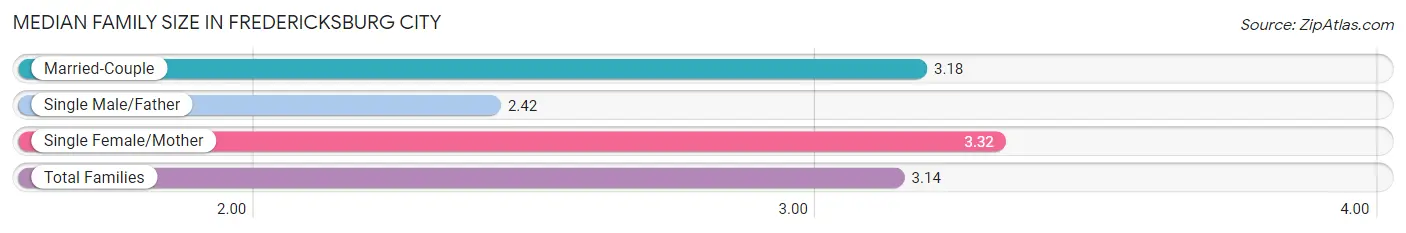
Median Family Size in Fredericksburg city
The median family size in Fredericksburg city is 3.14 persons per family, with single female/mother families (1,320 | 22.6%) accounting for the largest median family size of 3.32 persons per family. On the other hand, single male/father families (543 | 9.3%) represent the smallest median family size with 2.42 persons per family.
| Family Type | # Families | Family Size |
| Married-Couple | 3,988 (68.2%) | 3.18 |
| Single Male/Father | 543 (9.3%) | 2.42 |
| Single Female/Mother | 1,320 (22.6%) | 3.32 |
| Total Families | 5,851 (100.0%) | 3.14 |
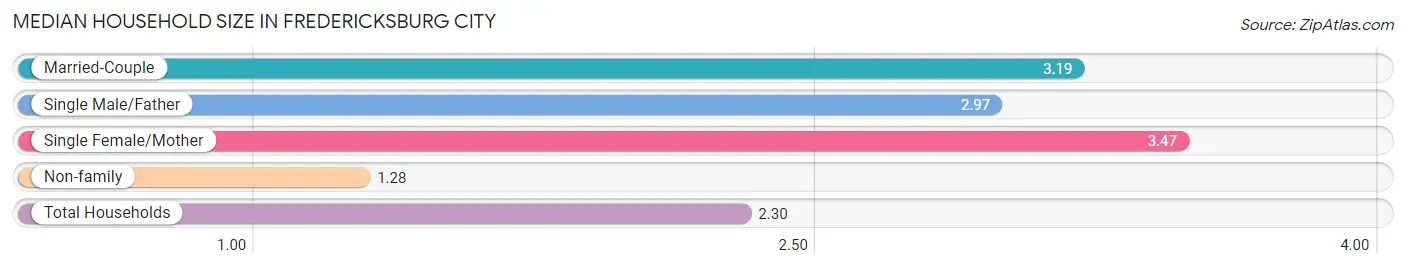
Median Household Size in Fredericksburg city
The median household size in Fredericksburg city is 2.30 persons per household, with single female/mother households (1,320 | 11.7%) accounting for the largest median household size of 3.47 persons per household. non-family households (5,425 | 48.1%) represent the smallest median household size with 1.28 persons per household.
| Household Type | # Households | Household Size |
| Married-Couple | 3,988 (35.4%) | 3.19 |
| Single Male/Father | 543 (4.8%) | 2.97 |
| Single Female/Mother | 1,320 (11.7%) | 3.47 |
| Non-family | 5,425 (48.1%) | 1.28 |
| Total Households | 11,276 (100.0%) | 2.30 |
Household Size by Marriage Status in Fredericksburg city
Out of a total of 11,276 households in Fredericksburg city, 5,851 (51.9%) are family households, while 5,425 (48.1%) are nonfamily households. The most numerous type of family households are 2-person households, comprising 2,725, and the most common type of nonfamily households are 1-person households, comprising 3,992.
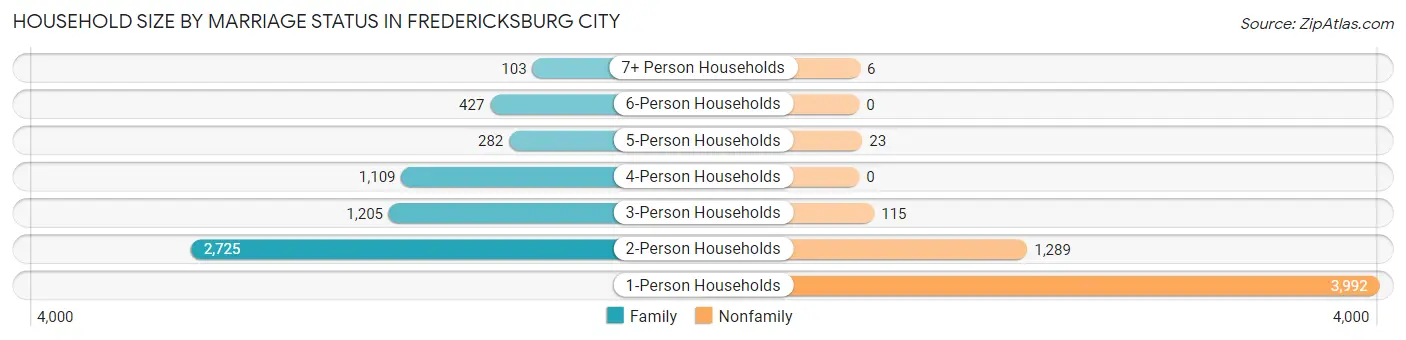
| Household Size | Family Households | Nonfamily Households |
| 1-Person Households | - | 3,992 (35.4%) |
| 2-Person Households | 2,725 (24.2%) | 1,289 (11.4%) |
| 3-Person Households | 1,205 (10.7%) | 115 (1.0%) |
| 4-Person Households | 1,109 (9.8%) | 0 (0.0%) |
| 5-Person Households | 282 (2.5%) | 23 (0.2%) |
| 6-Person Households | 427 (3.8%) | 0 (0.0%) |
| 7+ Person Households | 103 (0.9%) | 6 (0.1%) |
| Total | 5,851 (51.9%) | 5,425 (48.1%) |
Female Fertility in Fredericksburg city
Fertility by Age in Fredericksburg city
Average fertility rate in Fredericksburg city is 28.0 births per 1,000 women. Women in the age bracket of 20 to 34 years have the highest fertility rate with 47.0 births per 1,000 women. Women in the age bracket of 20 to 34 years acount for 82.0% of all women with births.
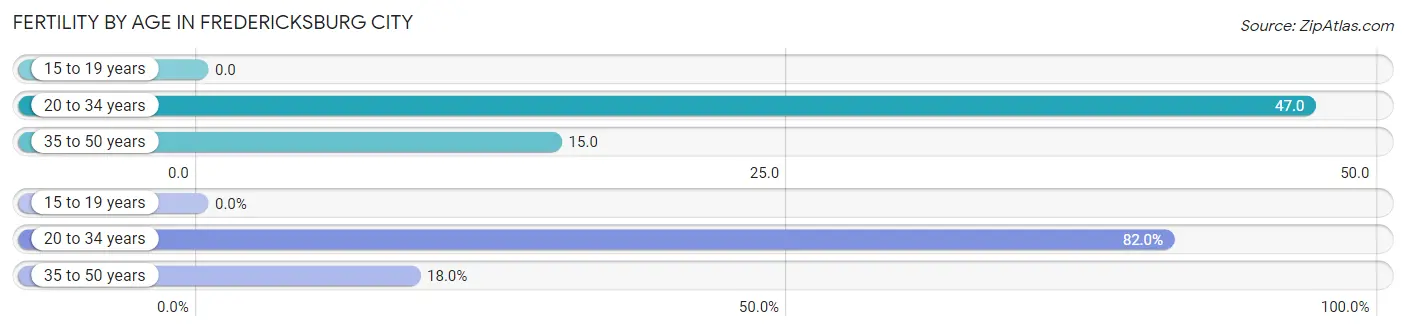
| Age Bracket | Women with Births | Births / 1,000 Women |
| 15 to 19 years | 0 (0.0%) | 0.0 |
| 20 to 34 years | 196 (82.0%) | 47.0 |
| 35 to 50 years | 43 (18.0%) | 15.0 |
| Total | 239 (100.0%) | 28.0 |
Fertility by Age by Marriage Status in Fredericksburg city
72.8% of women with births (239) in Fredericksburg city are married. The highest percentage of unmarried women with births falls into 20 to 34 years age bracket with 30.1% of them unmarried at the time of birth, while the lowest percentage of unmarried women with births belong to 35 to 50 years age bracket with 13.9% of them unmarried.
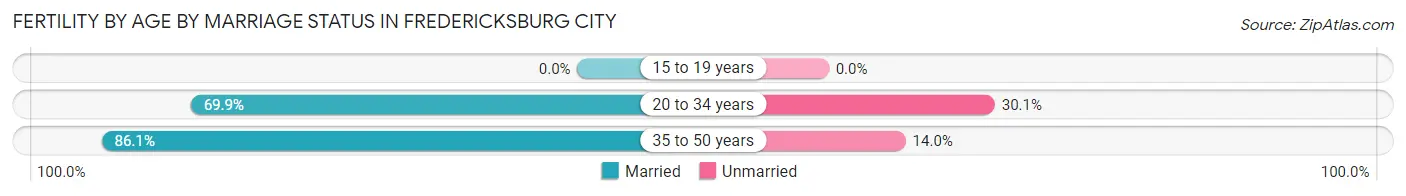
| Age Bracket | Married | Unmarried |
| 15 to 19 years | 0 (0.0%) | 0 (0.0%) |
| 20 to 34 years | 137 (69.9%) | 59 (30.1%) |
| 35 to 50 years | 37 (86.1%) | 6 (14.0%) |
| Total | 174 (72.8%) | 65 (27.2%) |
Fertility by Education in Fredericksburg city
Average fertility rate in Fredericksburg city is 28.0 births per 1,000 women. Women with the education attainment of less than high school have the highest fertility rate of 103.0 births per 1,000 women, while women with the education attainment of high school diploma have the lowest fertility at 6.0 births per 1,000 women. Women with the education attainment of less than high school represent 41.0% of all women with births.
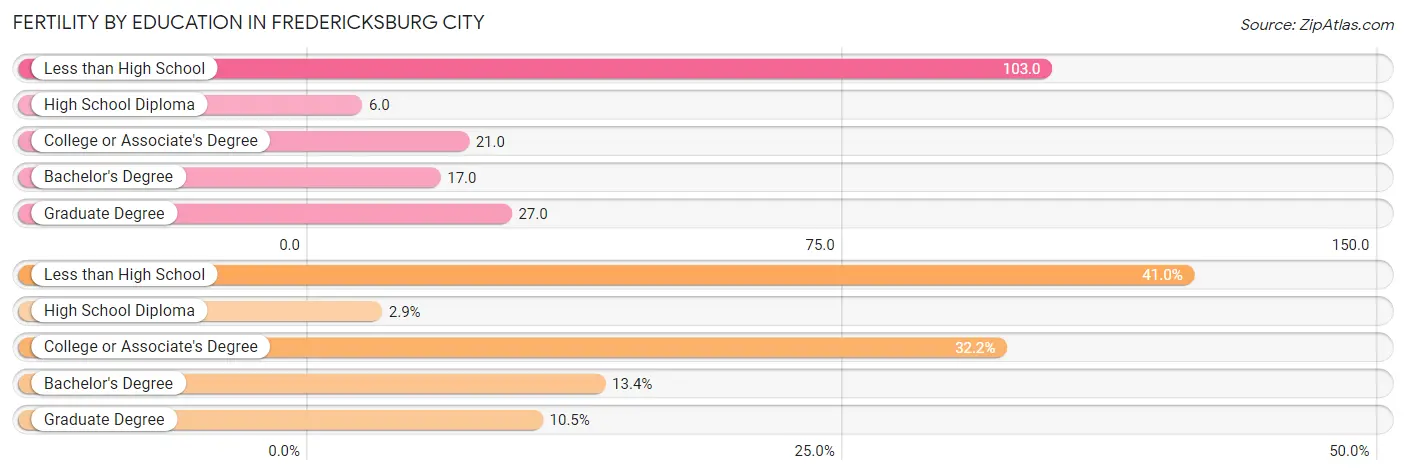
| Educational Attainment | Women with Births | Births / 1,000 Women |
| Less than High School | 98 (41.0%) | 103.0 |
| High School Diploma | 7 (2.9%) | 6.0 |
| College or Associate's Degree | 77 (32.2%) | 21.0 |
| Bachelor's Degree | 32 (13.4%) | 17.0 |
| Graduate Degree | 25 (10.5%) | 27.0 |
| Total | 239 (100.0%) | 28.0 |
Fertility by Education by Marriage Status in Fredericksburg city
27.2% of women with births in Fredericksburg city are unmarried. Women with the educational attainment of less than high school are most likely to be married with 100.0% of them married at childbirth, while women with the educational attainment of college or associate's degree are least likely to be married with 76.6% of them unmarried at childbirth.
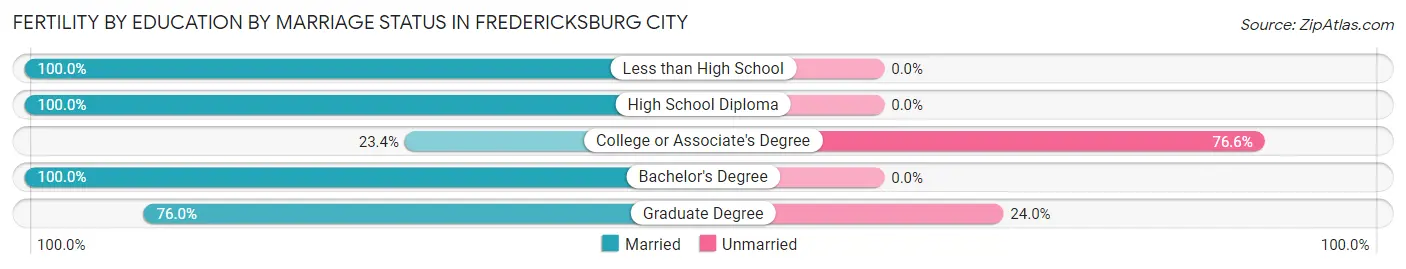
| Educational Attainment | Married | Unmarried |
| Less than High School | 98 (100.0%) | 0 (0.0%) |
| High School Diploma | 7 (100.0%) | 0 (0.0%) |
| College or Associate's Degree | 18 (23.4%) | 59 (76.6%) |
| Bachelor's Degree | 32 (100.0%) | 0 (0.0%) |
| Graduate Degree | 19 (76.0%) | 6 (24.0%) |
| Total | 174 (72.8%) | 65 (27.2%) |
Employment Characteristics in Fredericksburg city
Employment by Class of Employer in Fredericksburg city
Among the 14,354 employed individuals in Fredericksburg city, private company employees (8,637 | 60.2%), federal government employees (1,902 | 13.3%), and not-for-profit organizations (1,081 | 7.5%) make up the most common classes of employment.
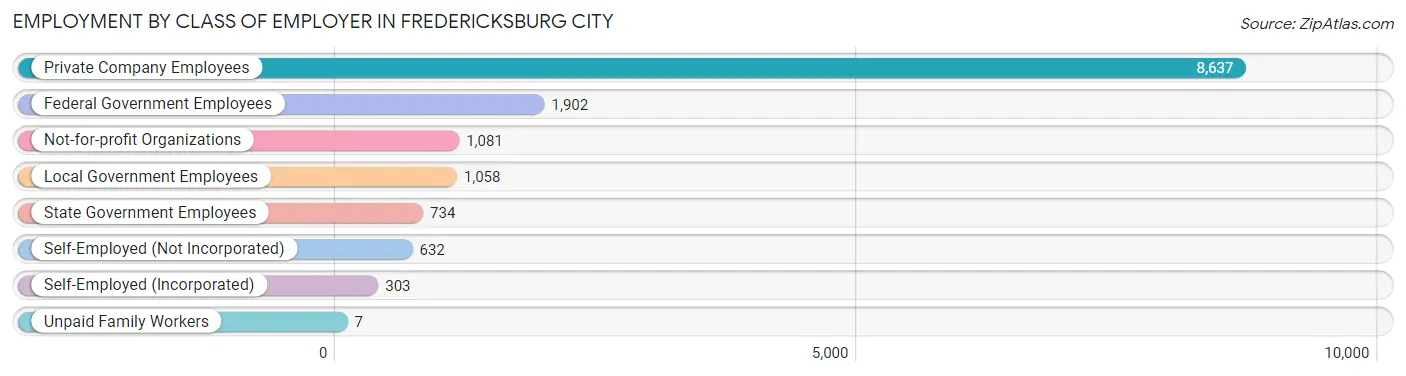
| Employer Class | # Employees | % Employees |
| Private Company Employees | 8,637 | 60.2% |
| Self-Employed (Incorporated) | 303 | 2.1% |
| Self-Employed (Not Incorporated) | 632 | 4.4% |
| Not-for-profit Organizations | 1,081 | 7.5% |
| Local Government Employees | 1,058 | 7.4% |
| State Government Employees | 734 | 5.1% |
| Federal Government Employees | 1,902 | 13.3% |
| Unpaid Family Workers | 7 | 0.1% |
| Total | 14,354 | 100.0% |
Employment Status by Age in Fredericksburg city
According to the labor force statistics for Fredericksburg city, out of the total population over 16 years of age (22,915), 68.6% or 15,720 individuals are in the labor force, with 5.2% or 817 of them unemployed. The age group with the highest labor force participation rate is 25 to 29 years, with 96.2% or 2,256 individuals in the labor force. Within the labor force, the 16 to 19 years age range has the highest percentage of unemployed individuals, with 24.5% or 259 of them being unemployed.
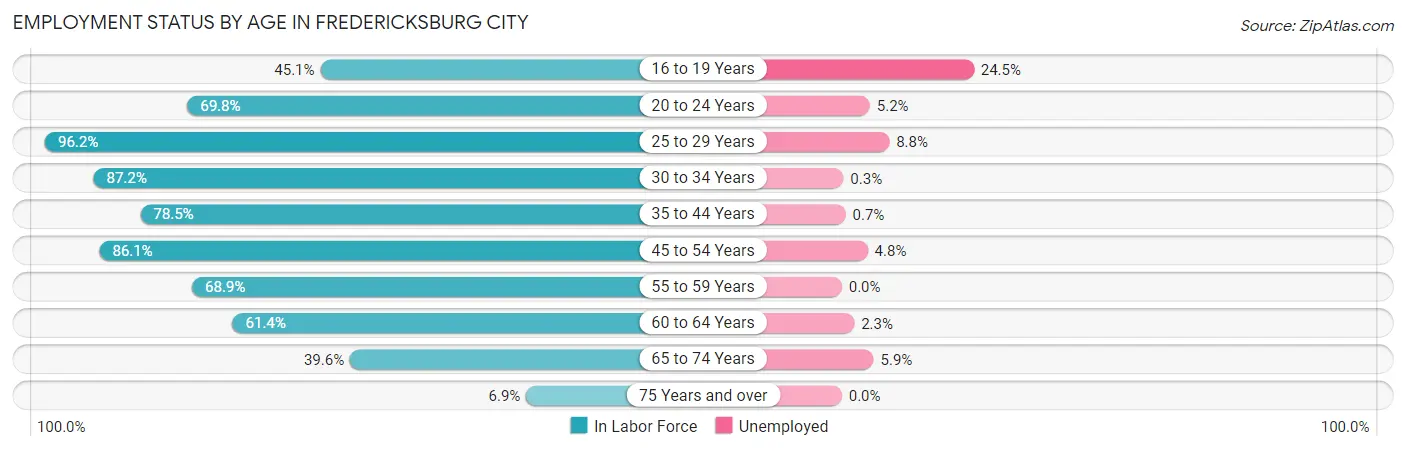
| Age Bracket | In Labor Force | Unemployed |
| 16 to 19 Years | 1,056 (45.1%) | 259 (24.5%) |
| 20 to 24 Years | 2,567 (69.8%) | 133 (5.2%) |
| 25 to 29 Years | 2,256 (96.2%) | 199 (8.8%) |
| 30 to 34 Years | 1,684 (87.2%) | 5 (0.3%) |
| 35 to 44 Years | 2,551 (78.5%) | 18 (0.7%) |
| 45 to 54 Years | 2,829 (86.1%) | 136 (4.8%) |
| 55 to 59 Years | 1,025 (68.9%) | 0 (0.0%) |
| 60 to 64 Years | 884 (61.4%) | 20 (2.3%) |
| 65 to 74 Years | 782 (39.6%) | 46 (5.9%) |
| 75 Years and over | 81 (6.9%) | 0 (0.0%) |
| Total | 15,720 (68.6%) | 817 (5.2%) |
Employment Status by Educational Attainment in Fredericksburg city
According to labor force statistics for Fredericksburg city, 81.7% of individuals (11,226) out of the total population between 25 and 64 years of age (13,740) are in the labor force, with 3.3% or 370 of them being unemployed. The group with the highest labor force participation rate are those with the educational attainment of bachelor's degree or higher, with 89.9% or 5,505 individuals in the labor force. Within the labor force, individuals with college / associate degree education have the highest percentage of unemployment, with 6.9% or 205 of them being unemployed.
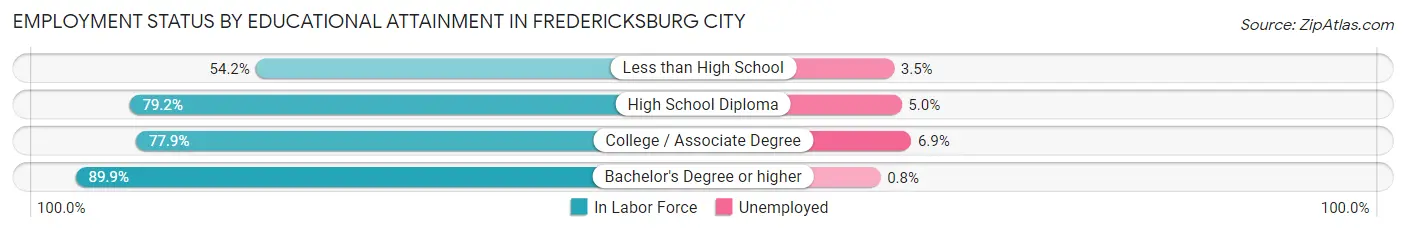
| Educational Attainment | In Labor Force | Unemployed |
| Less than High School | 572 (54.2%) | 37 (3.5%) |
| High School Diploma | 2,169 (79.2%) | 137 (5.0%) |
| College / Associate Degree | 2,977 (77.9%) | 264 (6.9%) |
| Bachelor's Degree or higher | 5,505 (89.9%) | 49 (0.8%) |
| Total | 11,226 (81.7%) | 453 (3.3%) |
Employment Occupations by Sex in Fredericksburg city
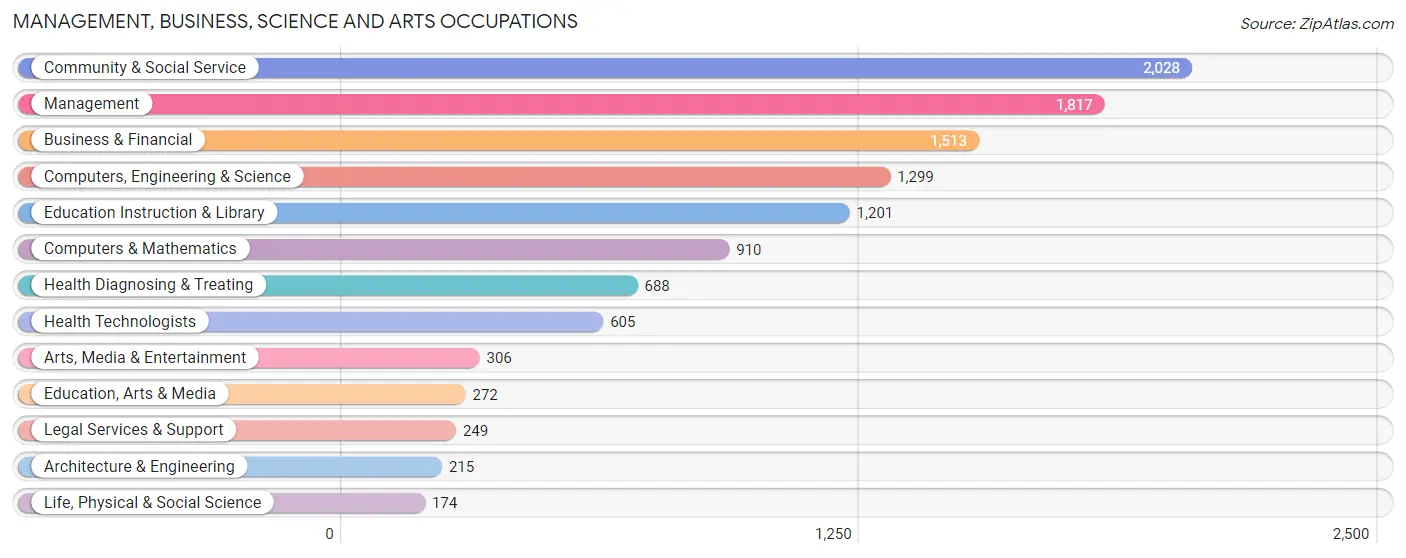
Management, Business, Science and Arts Occupations
The most common Management, Business, Science and Arts occupations in Fredericksburg city are Community & Social Service (2,028 | 13.8%), Management (1,817 | 12.3%), Business & Financial (1,513 | 10.3%), Computers, Engineering & Science (1,299 | 8.8%), and Education Instruction & Library (1,201 | 8.2%).
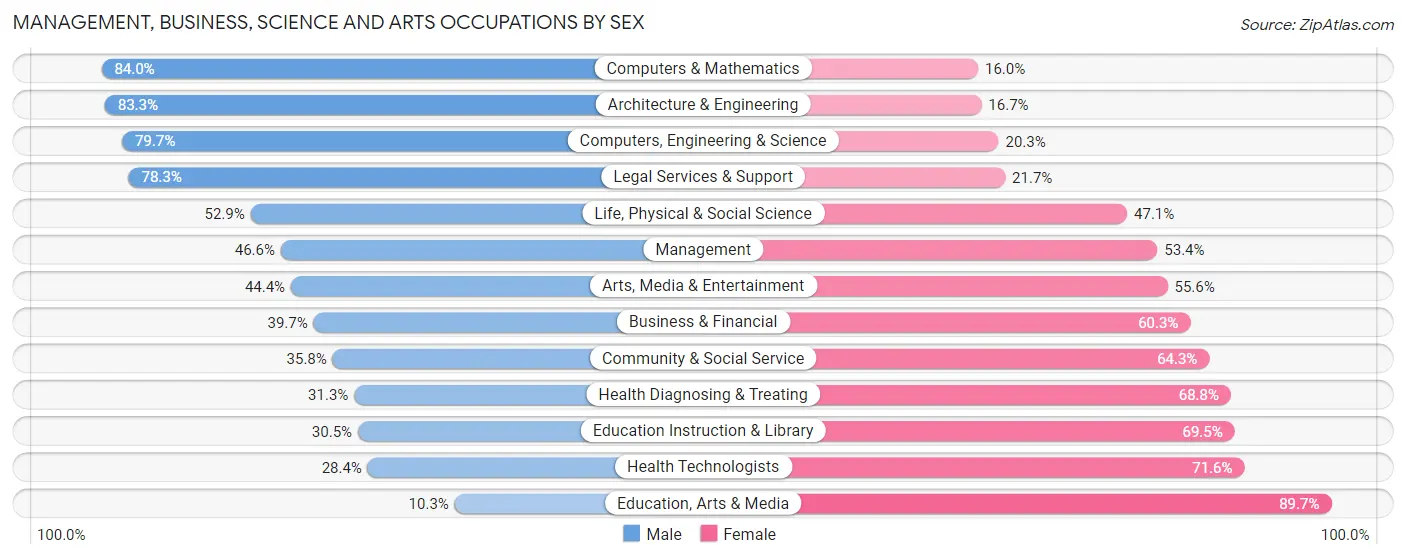
Management, Business, Science and Arts Occupations by Sex
Within the Management, Business, Science and Arts occupations in Fredericksburg city, the most male-oriented occupations are Computers & Mathematics (84.0%), Architecture & Engineering (83.3%), and Computers, Engineering & Science (79.7%), while the most female-oriented occupations are Education, Arts & Media (89.7%), Health Technologists (71.6%), and Education Instruction & Library (69.5%).
| Occupation | Male | Female |
| Management | 846 (46.6%) | 971 (53.4%) |
| Business & Financial | 601 (39.7%) | 912 (60.3%) |
| Computers, Engineering & Science | 1,035 (79.7%) | 264 (20.3%) |
| Computers & Mathematics | 764 (84.0%) | 146 (16.0%) |
| Architecture & Engineering | 179 (83.3%) | 36 (16.7%) |
| Life, Physical & Social Science | 92 (52.9%) | 82 (47.1%) |
| Community & Social Service | 725 (35.7%) | 1,303 (64.2%) |
| Education, Arts & Media | 28 (10.3%) | 244 (89.7%) |
| Legal Services & Support | 195 (78.3%) | 54 (21.7%) |
| Education Instruction & Library | 366 (30.5%) | 835 (69.5%) |
| Arts, Media & Entertainment | 136 (44.4%) | 170 (55.6%) |
| Health Diagnosing & Treating | 215 (31.2%) | 473 (68.8%) |
| Health Technologists | 172 (28.4%) | 433 (71.6%) |
| Total (Category) | 3,422 (46.6%) | 3,923 (53.4%) |
| Total (Overall) | 7,346 (49.8%) | 7,399 (50.2%) |
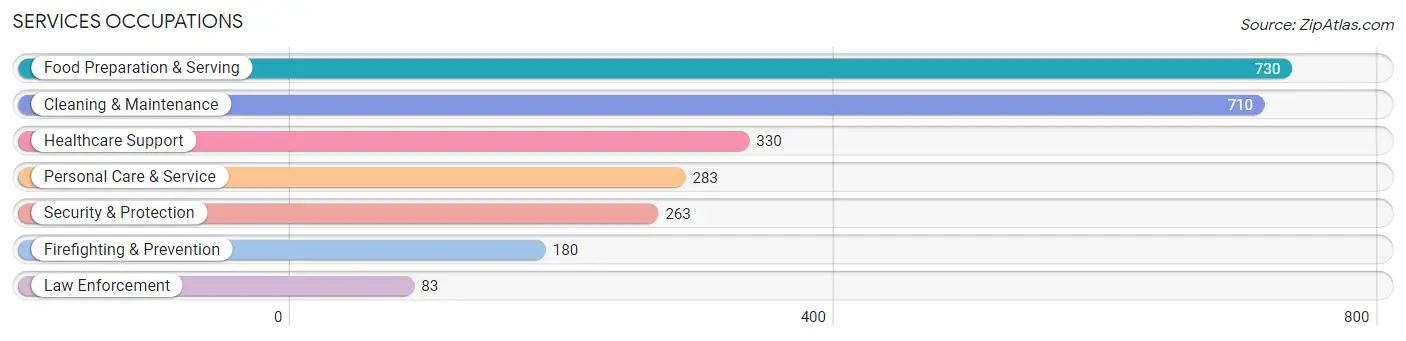
Services Occupations
The most common Services occupations in Fredericksburg city are Food Preparation & Serving (730 | 5.0%), Cleaning & Maintenance (710 | 4.8%), Healthcare Support (330 | 2.2%), Personal Care & Service (283 | 1.9%), and Security & Protection (263 | 1.8%).
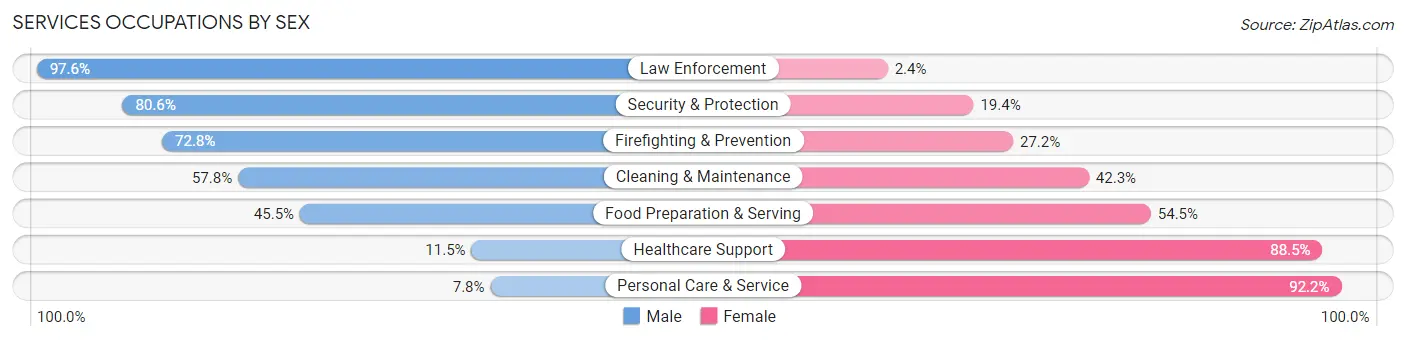
Services Occupations by Sex
Within the Services occupations in Fredericksburg city, the most male-oriented occupations are Law Enforcement (97.6%), Security & Protection (80.6%), and Firefighting & Prevention (72.8%), while the most female-oriented occupations are Personal Care & Service (92.2%), Healthcare Support (88.5%), and Food Preparation & Serving (54.5%).
| Occupation | Male | Female |
| Healthcare Support | 38 (11.5%) | 292 (88.5%) |
| Security & Protection | 212 (80.6%) | 51 (19.4%) |
| Firefighting & Prevention | 131 (72.8%) | 49 (27.2%) |
| Law Enforcement | 81 (97.6%) | 2 (2.4%) |
| Food Preparation & Serving | 332 (45.5%) | 398 (54.5%) |
| Cleaning & Maintenance | 410 (57.8%) | 300 (42.2%) |
| Personal Care & Service | 22 (7.8%) | 261 (92.2%) |
| Total (Category) | 1,014 (43.8%) | 1,302 (56.2%) |
| Total (Overall) | 7,346 (49.8%) | 7,399 (50.2%) |
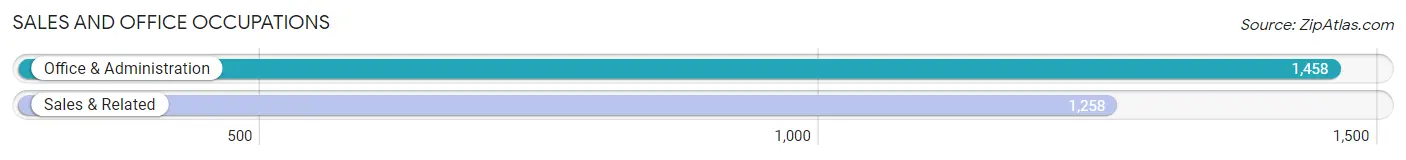
Sales and Office Occupations
The most common Sales and Office occupations in Fredericksburg city are Office & Administration (1,458 | 9.9%), and Sales & Related (1,258 | 8.5%).
Sales and Office Occupations by Sex
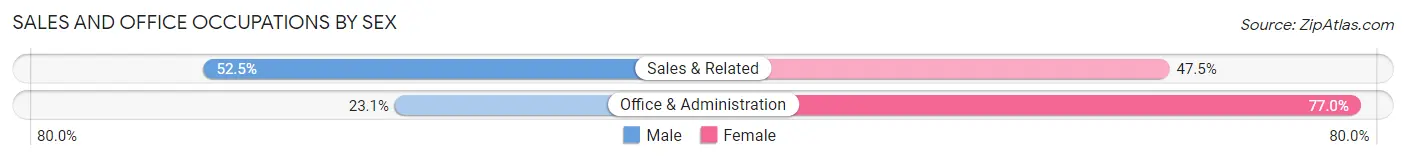
| Occupation | Male | Female |
| Sales & Related | 660 (52.5%) | 598 (47.5%) |
| Office & Administration | 336 (23.1%) | 1,122 (76.9%) |
| Total (Category) | 996 (36.7%) | 1,720 (63.3%) |
| Total (Overall) | 7,346 (49.8%) | 7,399 (50.2%) |
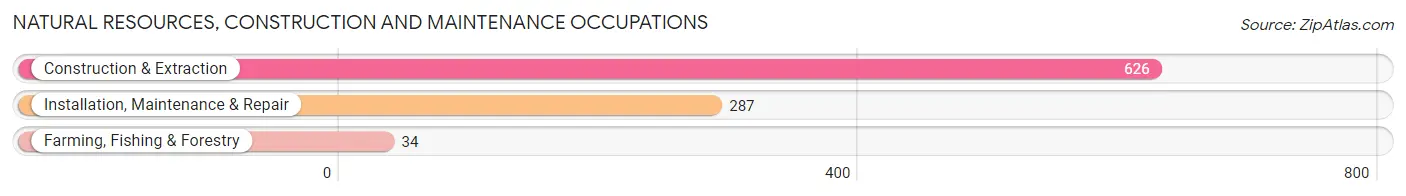
Natural Resources, Construction and Maintenance Occupations
The most common Natural Resources, Construction and Maintenance occupations in Fredericksburg city are Construction & Extraction (626 | 4.3%), Installation, Maintenance & Repair (287 | 1.9%), and Farming, Fishing & Forestry (34 | 0.2%).
Natural Resources, Construction and Maintenance Occupations by Sex
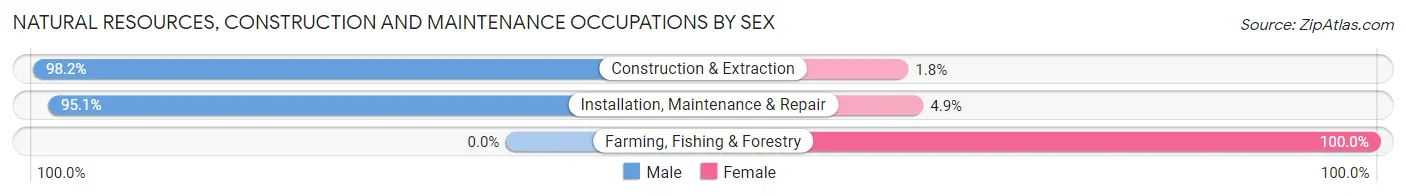
| Occupation | Male | Female |
| Farming, Fishing & Forestry | 0 (0.0%) | 34 (100.0%) |
| Construction & Extraction | 615 (98.2%) | 11 (1.8%) |
| Installation, Maintenance & Repair | 273 (95.1%) | 14 (4.9%) |
| Total (Category) | 888 (93.8%) | 59 (6.2%) |
| Total (Overall) | 7,346 (49.8%) | 7,399 (50.2%) |
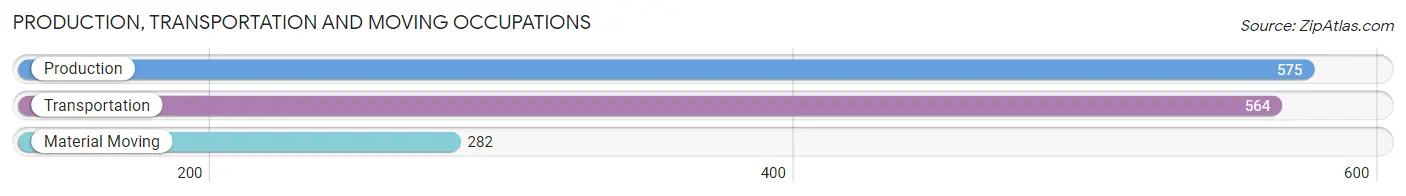
Production, Transportation and Moving Occupations
The most common Production, Transportation and Moving occupations in Fredericksburg city are Production (575 | 3.9%), Transportation (564 | 3.8%), and Material Moving (282 | 1.9%).
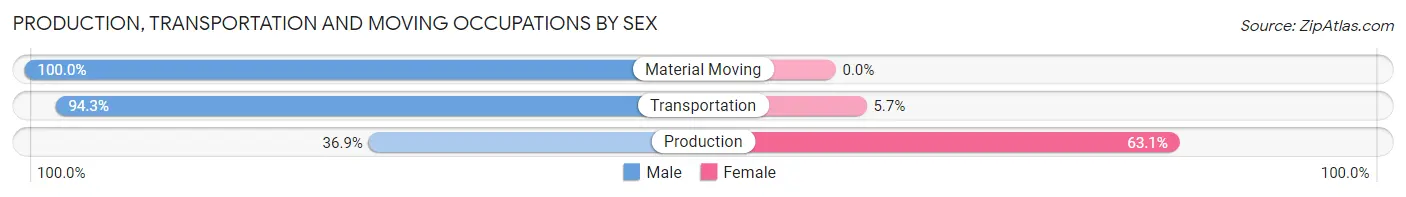
Production, Transportation and Moving Occupations by Sex
| Occupation | Male | Female |
| Production | 212 (36.9%) | 363 (63.1%) |
| Transportation | 532 (94.3%) | 32 (5.7%) |
| Material Moving | 282 (100.0%) | 0 (0.0%) |
| Total (Category) | 1,026 (72.2%) | 395 (27.8%) |
| Total (Overall) | 7,346 (49.8%) | 7,399 (50.2%) |
Employment Industries by Sex in Fredericksburg city
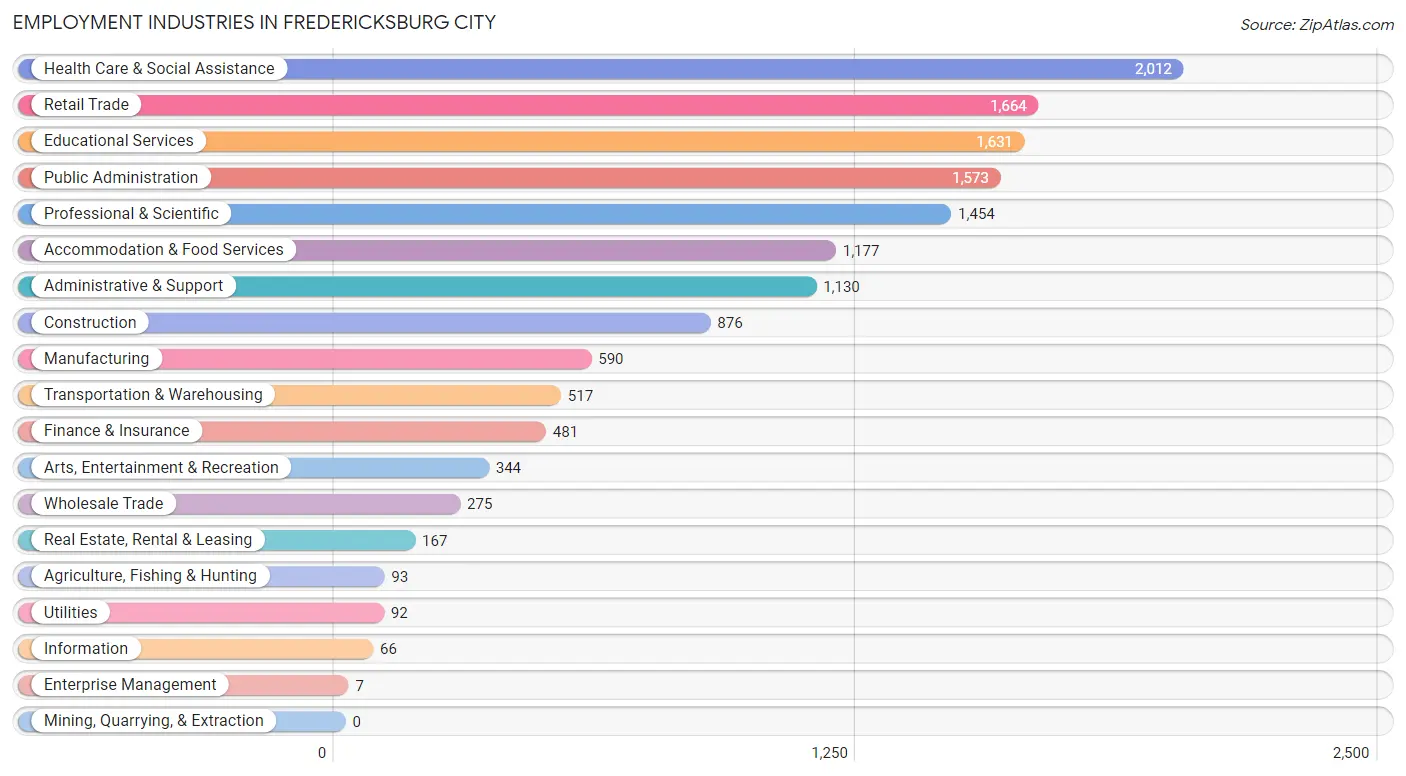
Employment Industries in Fredericksburg city
The major employment industries in Fredericksburg city include Health Care & Social Assistance (2,012 | 13.7%), Retail Trade (1,664 | 11.3%), Educational Services (1,631 | 11.1%), Public Administration (1,573 | 10.7%), and Professional & Scientific (1,454 | 9.9%).
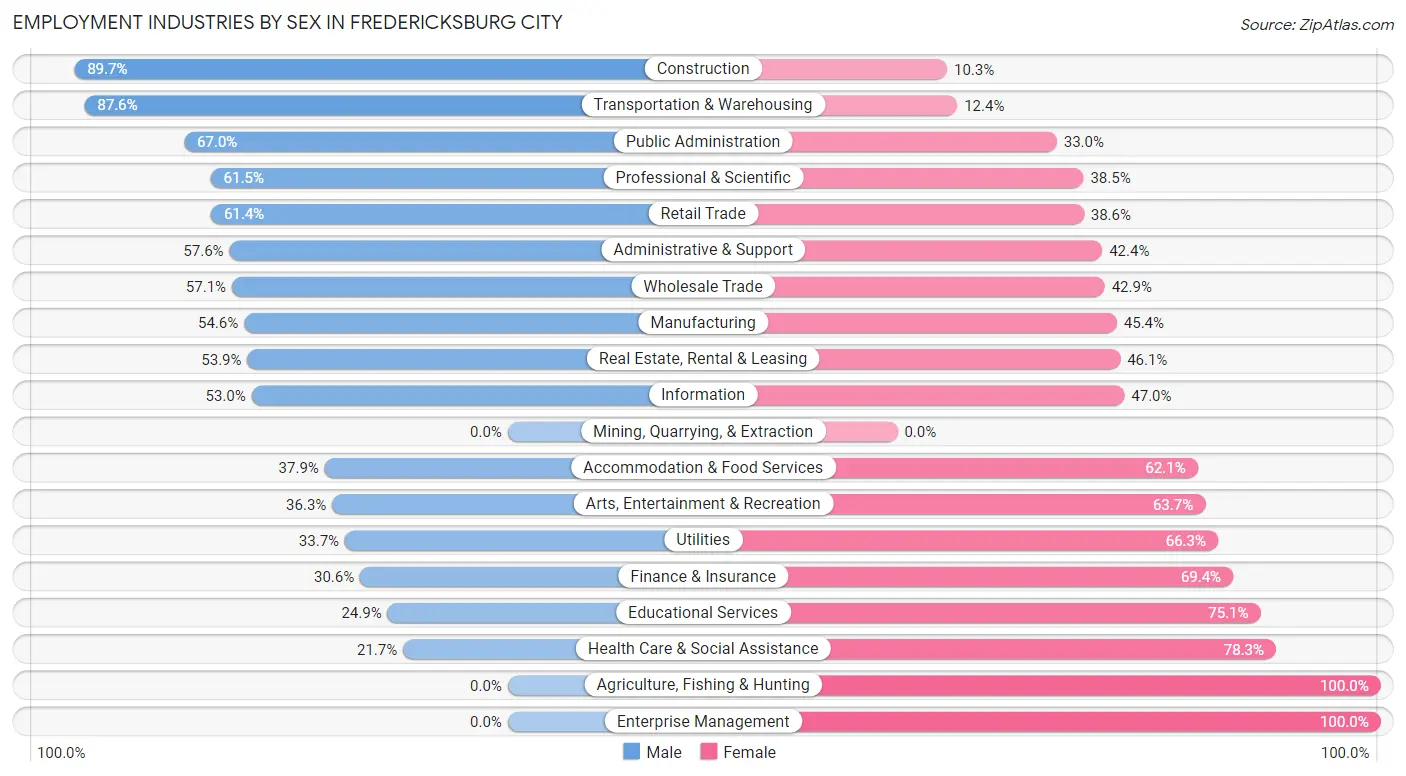
Employment Industries by Sex in Fredericksburg city
The Fredericksburg city industries that see more men than women are Construction (89.7%), Transportation & Warehousing (87.6%), and Public Administration (67.0%), whereas the industries that tend to have a higher number of women are Agriculture, Fishing & Hunting (100.0%), Enterprise Management (100.0%), and Health Care & Social Assistance (78.3%).
| Industry | Male | Female |
| Agriculture, Fishing & Hunting | 0 (0.0%) | 93 (100.0%) |
| Mining, Quarrying, & Extraction | 0 (0.0%) | 0 (0.0%) |
| Construction | 786 (89.7%) | 90 (10.3%) |
| Manufacturing | 322 (54.6%) | 268 (45.4%) |
| Wholesale Trade | 157 (57.1%) | 118 (42.9%) |
| Retail Trade | 1,022 (61.4%) | 642 (38.6%) |
| Transportation & Warehousing | 453 (87.6%) | 64 (12.4%) |
| Utilities | 31 (33.7%) | 61 (66.3%) |
| Information | 35 (53.0%) | 31 (47.0%) |
| Finance & Insurance | 147 (30.6%) | 334 (69.4%) |
| Real Estate, Rental & Leasing | 90 (53.9%) | 77 (46.1%) |
| Professional & Scientific | 894 (61.5%) | 560 (38.5%) |
| Enterprise Management | 0 (0.0%) | 7 (100.0%) |
| Administrative & Support | 651 (57.6%) | 479 (42.4%) |
| Educational Services | 406 (24.9%) | 1,225 (75.1%) |
| Health Care & Social Assistance | 436 (21.7%) | 1,576 (78.3%) |
| Arts, Entertainment & Recreation | 125 (36.3%) | 219 (63.7%) |
| Accommodation & Food Services | 446 (37.9%) | 731 (62.1%) |
| Public Administration | 1,054 (67.0%) | 519 (33.0%) |
| Total | 7,346 (49.8%) | 7,399 (50.2%) |
Education in Fredericksburg city
School Enrollment in Fredericksburg city
The most common levels of schooling among the 8,890 students in Fredericksburg city are college / undergraduate (4,020 | 45.2%), middle school (1,492 | 16.8%), and elementary school (1,343 | 15.1%).
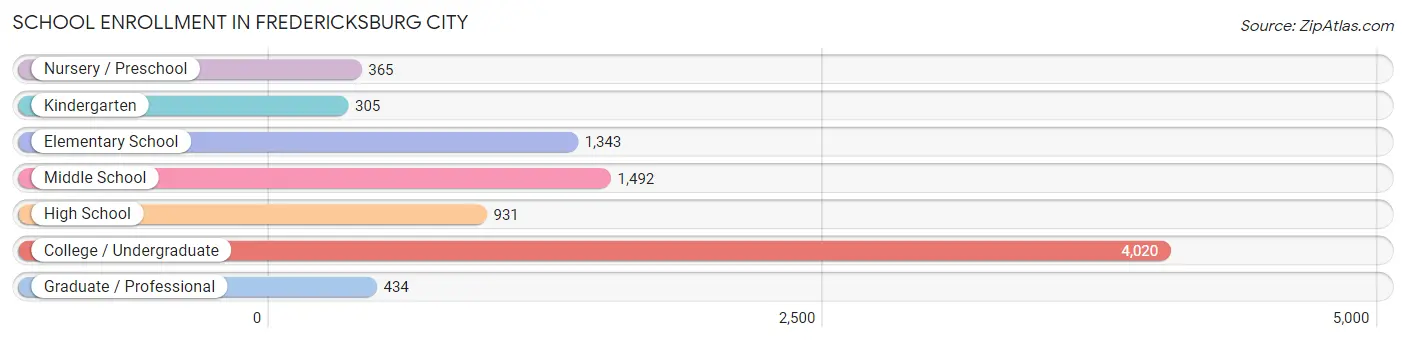
| School Level | # Students | % Students |
| Nursery / Preschool | 365 | 4.1% |
| Kindergarten | 305 | 3.4% |
| Elementary School | 1,343 | 15.1% |
| Middle School | 1,492 | 16.8% |
| High School | 931 | 10.5% |
| College / Undergraduate | 4,020 | 45.2% |
| Graduate / Professional | 434 | 4.9% |
| Total | 8,890 | 100.0% |
School Enrollment by Age by Funding Source in Fredericksburg city
Out of a total of 8,890 students who are enrolled in schools in Fredericksburg city, 1,076 (12.1%) attend a private institution, while the remaining 7,814 (87.9%) are enrolled in public schools. The age group of 35 years and over has the highest likelihood of being enrolled in private schools, with 125 (32.3% in the age bracket) enrolled. Conversely, the age group of 20 to 24 year olds has the lowest likelihood of being enrolled in a private school, with 1,972 (94.5% in the age bracket) attending a public institution.
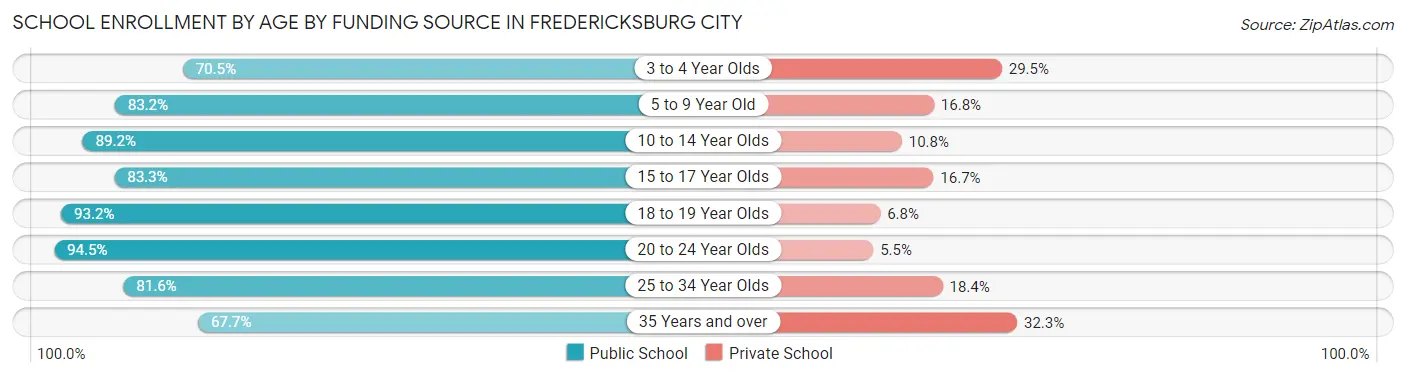
| Age Bracket | Public School | Private School |
| 3 to 4 Year Olds | 158 (70.5%) | 66 (29.5%) |
| 5 to 9 Year Old | 1,099 (83.2%) | 222 (16.8%) |
| 10 to 14 Year Olds | 1,855 (89.2%) | 225 (10.8%) |
| 15 to 17 Year Olds | 618 (83.3%) | 124 (16.7%) |
| 18 to 19 Year Olds | 1,464 (93.2%) | 107 (6.8%) |
| 20 to 24 Year Olds | 1,972 (94.5%) | 115 (5.5%) |
| 25 to 34 Year Olds | 390 (81.6%) | 88 (18.4%) |
| 35 Years and over | 262 (67.7%) | 125 (32.3%) |
| Total | 7,814 (87.9%) | 1,076 (12.1%) |
Educational Attainment by Field of Study in Fredericksburg city
Business (1,676 | 20.2%), education (913 | 11.0%), social sciences (786 | 9.5%), liberal arts & history (679 | 8.2%), and literature & languages (616 | 7.4%) are the most common fields of study among 8,299 individuals in Fredericksburg city who have obtained a bachelor's degree or higher.
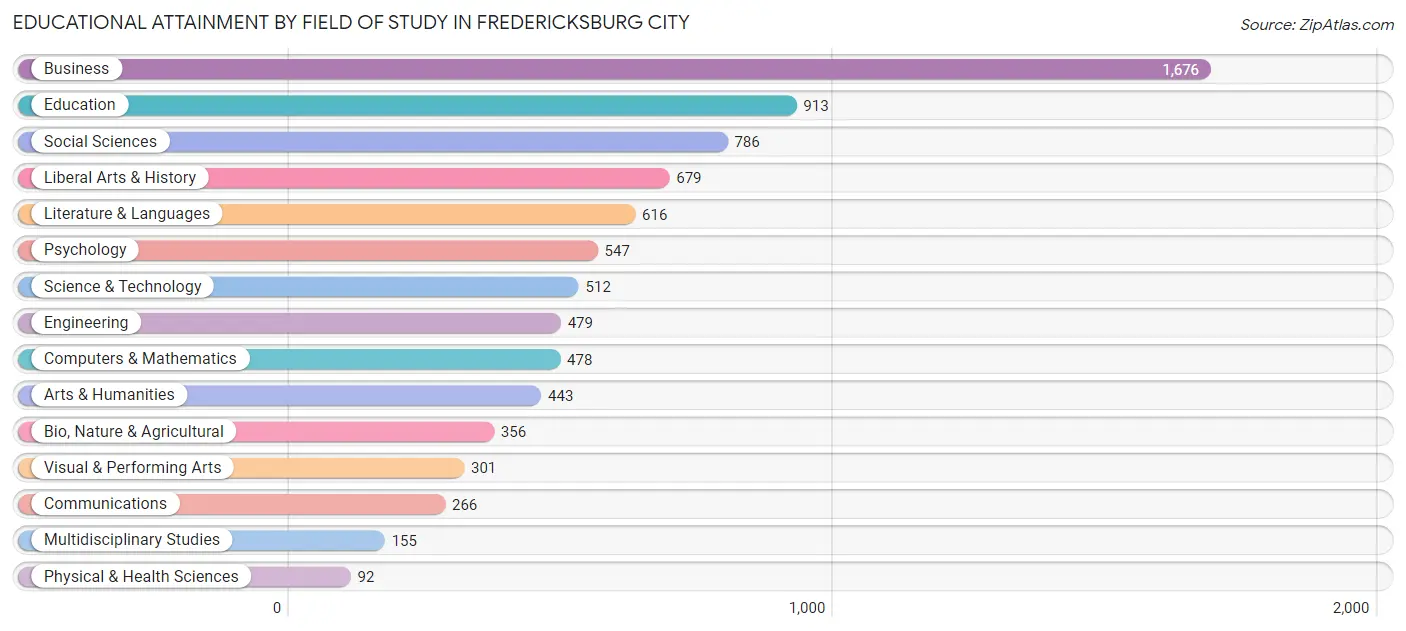
| Field of Study | # Graduates | % Graduates |
| Computers & Mathematics | 478 | 5.8% |
| Bio, Nature & Agricultural | 356 | 4.3% |
| Physical & Health Sciences | 92 | 1.1% |
| Psychology | 547 | 6.6% |
| Social Sciences | 786 | 9.5% |
| Engineering | 479 | 5.8% |
| Multidisciplinary Studies | 155 | 1.9% |
| Science & Technology | 512 | 6.2% |
| Business | 1,676 | 20.2% |
| Education | 913 | 11.0% |
| Literature & Languages | 616 | 7.4% |
| Liberal Arts & History | 679 | 8.2% |
| Visual & Performing Arts | 301 | 3.6% |
| Communications | 266 | 3.2% |
| Arts & Humanities | 443 | 5.3% |
| Total | 8,299 | 100.0% |
Transportation & Commute in Fredericksburg city
Vehicle Availability by Sex in Fredericksburg city
The most prevalent vehicle ownership categories in Fredericksburg city are males with 2 vehicles (3,644, accounting for 50.5%) and females with 2 vehicles (2,545, making up 57.5%).
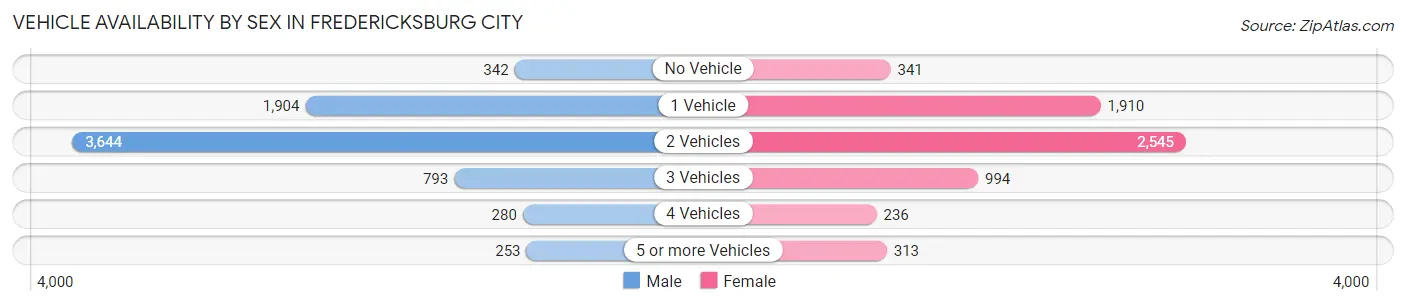
| Vehicles Available | Male | Female |
| No Vehicle | 342 (4.7%) | 341 (5.4%) |
| 1 Vehicle | 1,904 (26.4%) | 1,910 (30.1%) |
| 2 Vehicles | 3,644 (50.5%) | 2,545 (40.2%) |
| 3 Vehicles | 793 (11.0%) | 994 (15.7%) |
| 4 Vehicles | 280 (3.9%) | 236 (3.7%) |
| 5 or more Vehicles | 253 (3.5%) | 313 (4.9%) |
| Total | 7,216 (100.0%) | 6,339 (100.0%) |
Commute Time in Fredericksburg city
The most frequently occuring commute durations in Fredericksburg city are 10 to 14 minutes (2,517 commuters, 19.9%), 5 to 9 minutes (1,698 commuters, 13.4%), and 15 to 19 minutes (1,379 commuters, 10.9%).
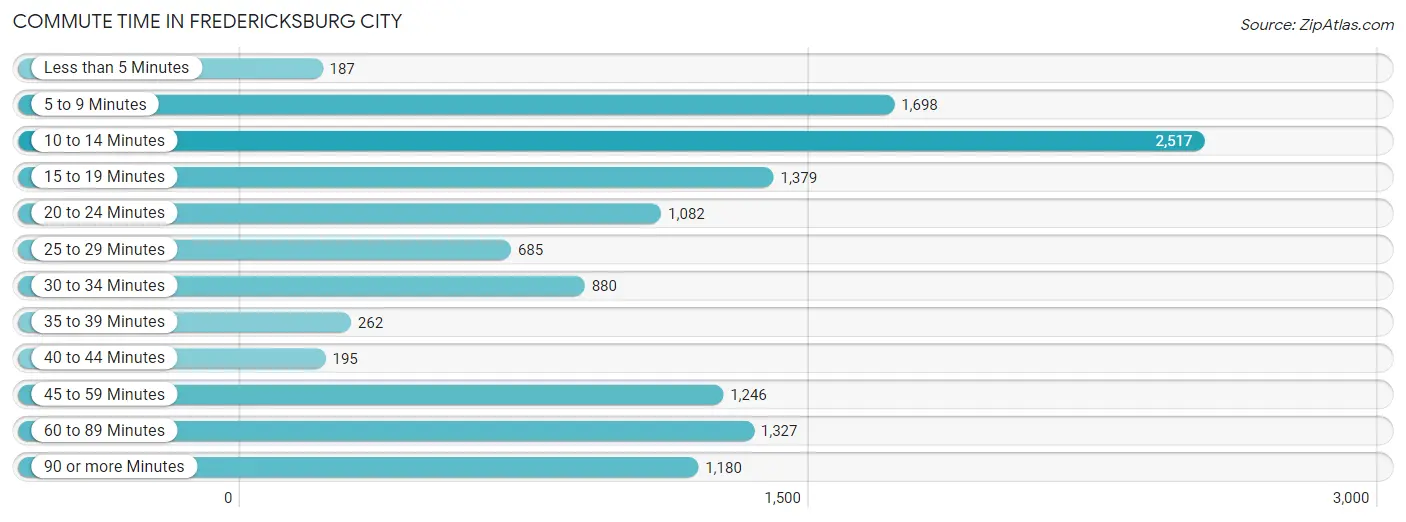
| Commute Time | # Commuters | % Commuters |
| Less than 5 Minutes | 187 | 1.5% |
| 5 to 9 Minutes | 1,698 | 13.4% |
| 10 to 14 Minutes | 2,517 | 19.9% |
| 15 to 19 Minutes | 1,379 | 10.9% |
| 20 to 24 Minutes | 1,082 | 8.6% |
| 25 to 29 Minutes | 685 | 5.4% |
| 30 to 34 Minutes | 880 | 7.0% |
| 35 to 39 Minutes | 262 | 2.1% |
| 40 to 44 Minutes | 195 | 1.5% |
| 45 to 59 Minutes | 1,246 | 9.9% |
| 60 to 89 Minutes | 1,327 | 10.5% |
| 90 or more Minutes | 1,180 | 9.3% |
Commute Time by Sex in Fredericksburg city
The most common commute times in Fredericksburg city are 10 to 14 minutes (1,039 commuters, 15.6%) for males and 10 to 14 minutes (1,478 commuters, 24.8%) for females.
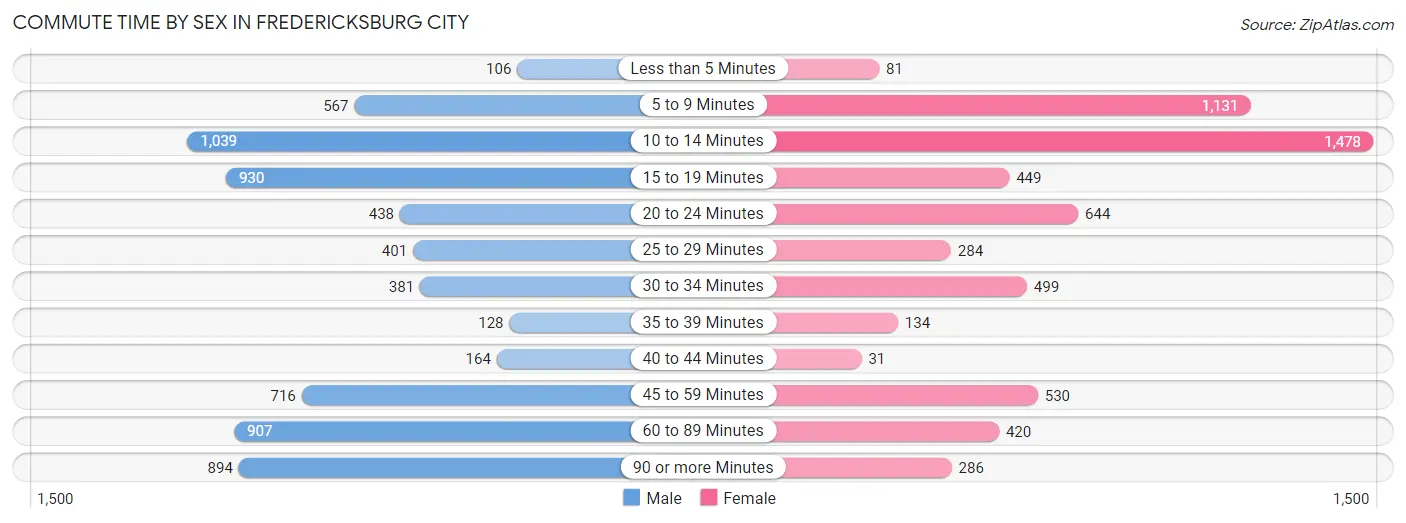
| Commute Time | Male | Female |
| Less than 5 Minutes | 106 (1.6%) | 81 (1.4%) |
| 5 to 9 Minutes | 567 (8.5%) | 1,131 (19.0%) |
| 10 to 14 Minutes | 1,039 (15.6%) | 1,478 (24.8%) |
| 15 to 19 Minutes | 930 (13.9%) | 449 (7.5%) |
| 20 to 24 Minutes | 438 (6.6%) | 644 (10.8%) |
| 25 to 29 Minutes | 401 (6.0%) | 284 (4.8%) |
| 30 to 34 Minutes | 381 (5.7%) | 499 (8.4%) |
| 35 to 39 Minutes | 128 (1.9%) | 134 (2.2%) |
| 40 to 44 Minutes | 164 (2.5%) | 31 (0.5%) |
| 45 to 59 Minutes | 716 (10.7%) | 530 (8.9%) |
| 60 to 89 Minutes | 907 (13.6%) | 420 (7.0%) |
| 90 or more Minutes | 894 (13.4%) | 286 (4.8%) |
Time of Departure to Work by Sex in Fredericksburg city
The most frequent times of departure to work in Fredericksburg city are 6:00 AM to 6:29 AM (851, 12.8%) for males and 8:00 AM to 8:29 AM (1,009, 16.9%) for females.
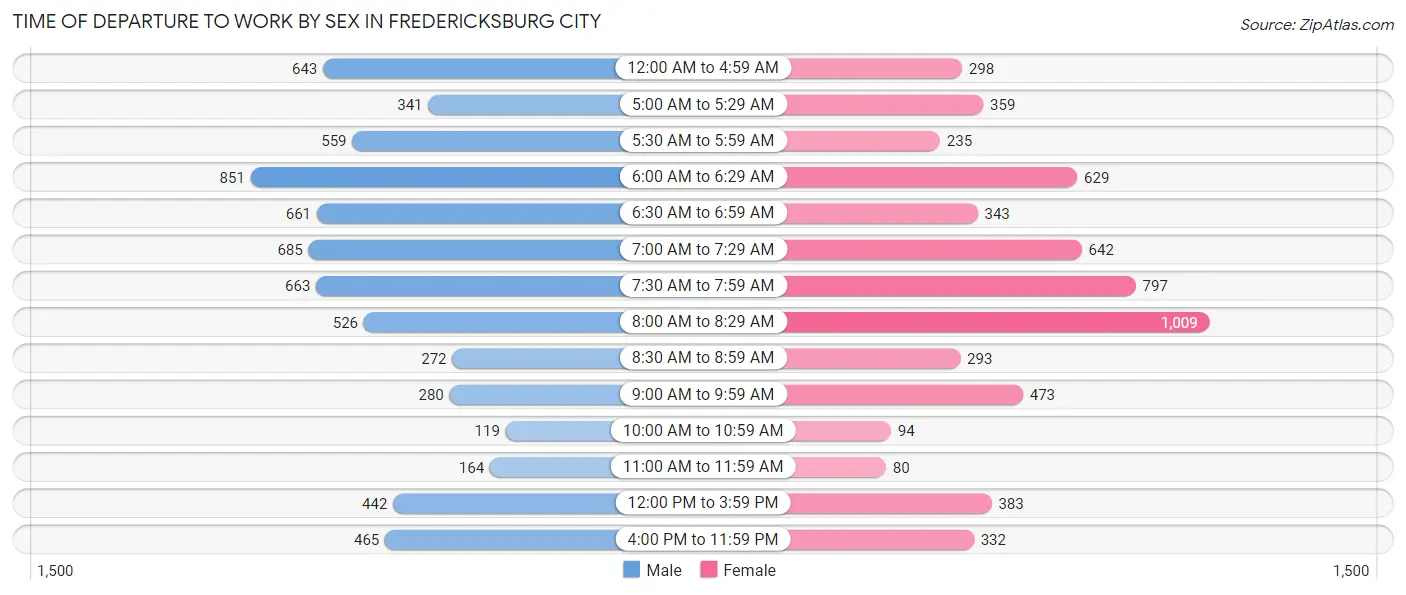
| Time of Departure | Male | Female |
| 12:00 AM to 4:59 AM | 643 (9.6%) | 298 (5.0%) |
| 5:00 AM to 5:29 AM | 341 (5.1%) | 359 (6.0%) |
| 5:30 AM to 5:59 AM | 559 (8.4%) | 235 (3.9%) |
| 6:00 AM to 6:29 AM | 851 (12.8%) | 629 (10.5%) |
| 6:30 AM to 6:59 AM | 661 (9.9%) | 343 (5.8%) |
| 7:00 AM to 7:29 AM | 685 (10.3%) | 642 (10.8%) |
| 7:30 AM to 7:59 AM | 663 (9.9%) | 797 (13.4%) |
| 8:00 AM to 8:29 AM | 526 (7.9%) | 1,009 (16.9%) |
| 8:30 AM to 8:59 AM | 272 (4.1%) | 293 (4.9%) |
| 9:00 AM to 9:59 AM | 280 (4.2%) | 473 (7.9%) |
| 10:00 AM to 10:59 AM | 119 (1.8%) | 94 (1.6%) |
| 11:00 AM to 11:59 AM | 164 (2.5%) | 80 (1.3%) |
| 12:00 PM to 3:59 PM | 442 (6.6%) | 383 (6.4%) |
| 4:00 PM to 11:59 PM | 465 (7.0%) | 332 (5.6%) |
| Total | 6,671 (100.0%) | 5,967 (100.0%) |
Housing Occupancy in Fredericksburg city
Occupancy by Ownership in Fredericksburg city
Of the total 11,276 dwellings in Fredericksburg city, owner-occupied units account for 4,336 (38.5%), while renter-occupied units make up 6,940 (61.6%).
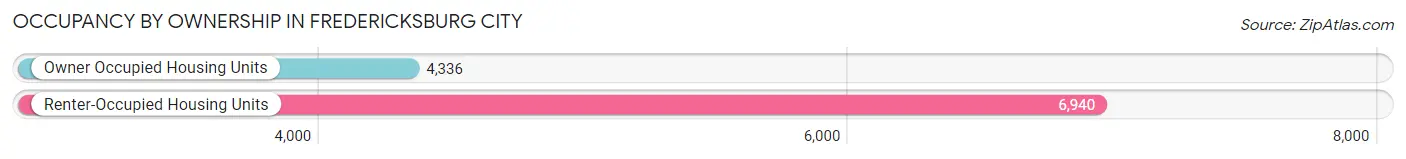
| Occupancy | # Housing Units | % Housing Units |
| Owner Occupied Housing Units | 4,336 | 38.5% |
| Renter-Occupied Housing Units | 6,940 | 61.6% |
| Total Occupied Housing Units | 11,276 | 100.0% |
Occupancy by Household Size in Fredericksburg city
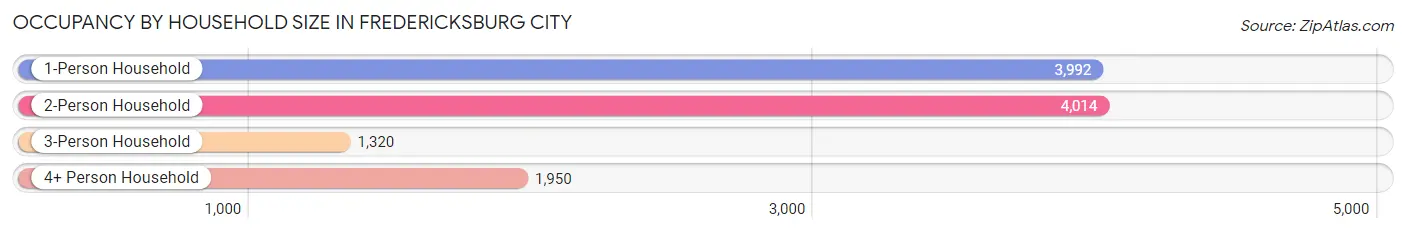
| Household Size | # Housing Units | % Housing Units |
| 1-Person Household | 3,992 | 35.4% |
| 2-Person Household | 4,014 | 35.6% |
| 3-Person Household | 1,320 | 11.7% |
| 4+ Person Household | 1,950 | 17.3% |
| Total Housing Units | 11,276 | 100.0% |
Occupancy by Ownership by Household Size in Fredericksburg city
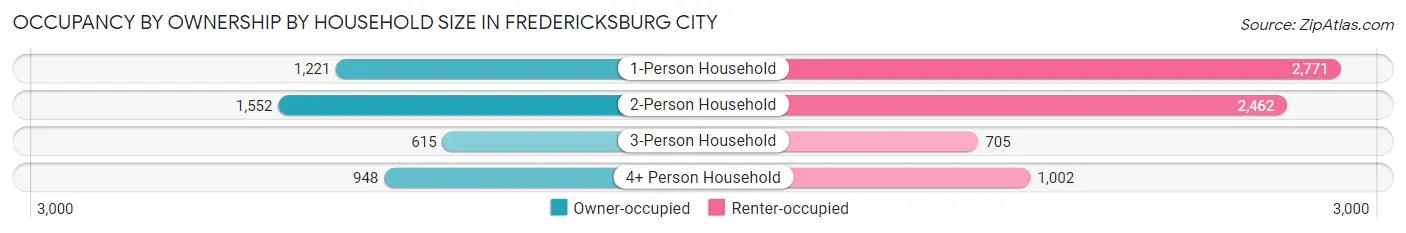
| Household Size | Owner-occupied | Renter-occupied |
| 1-Person Household | 1,221 (30.6%) | 2,771 (69.4%) |
| 2-Person Household | 1,552 (38.7%) | 2,462 (61.3%) |
| 3-Person Household | 615 (46.6%) | 705 (53.4%) |
| 4+ Person Household | 948 (48.6%) | 1,002 (51.4%) |
| Total Housing Units | 4,336 (38.5%) | 6,940 (61.6%) |
Occupancy by Educational Attainment in Fredericksburg city
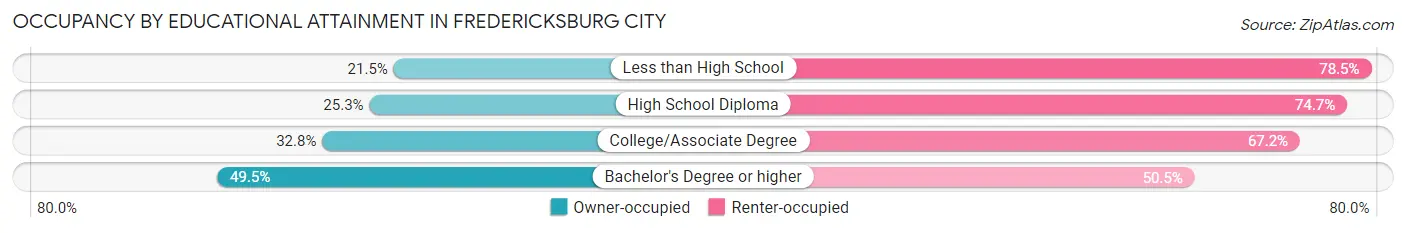
| Household Size | Owner-occupied | Renter-occupied |
| Less than High School | 144 (21.5%) | 527 (78.5%) |
| High School Diploma | 559 (25.3%) | 1,650 (74.7%) |
| College/Associate Degree | 1,024 (32.8%) | 2,099 (67.2%) |
| Bachelor's Degree or higher | 2,609 (49.5%) | 2,664 (50.5%) |
Occupancy by Age of Householder in Fredericksburg city
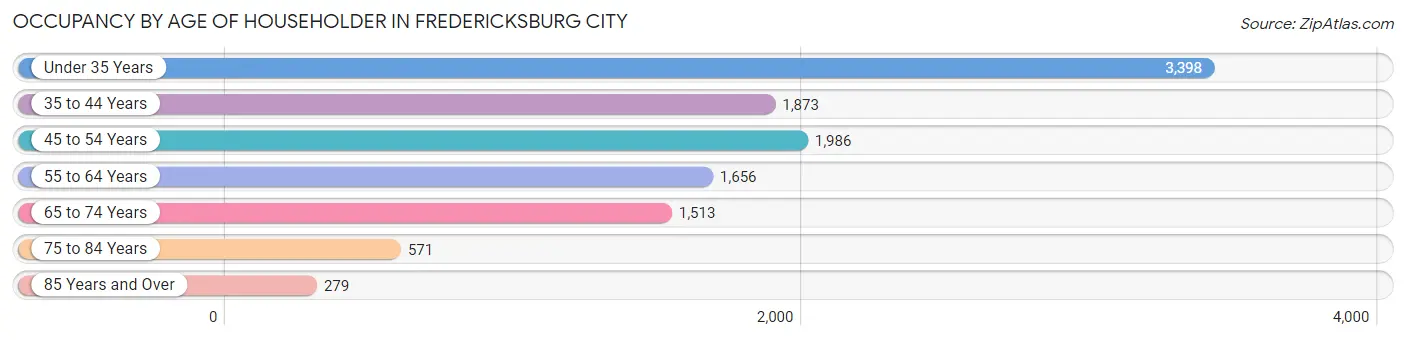
| Age Bracket | # Households | % Households |
| Under 35 Years | 3,398 | 30.1% |
| 35 to 44 Years | 1,873 | 16.6% |
| 45 to 54 Years | 1,986 | 17.6% |
| 55 to 64 Years | 1,656 | 14.7% |
| 65 to 74 Years | 1,513 | 13.4% |
| 75 to 84 Years | 571 | 5.1% |
| 85 Years and Over | 279 | 2.5% |
| Total | 11,276 | 100.0% |
Housing Finances in Fredericksburg city
Median Income by Occupancy in Fredericksburg city
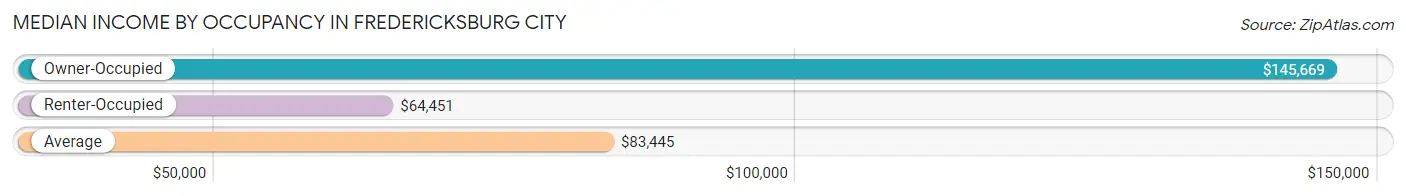
| Occupancy Type | # Households | Median Income |
| Owner-Occupied | 4,336 (38.5%) | $145,669 |
| Renter-Occupied | 6,940 (61.6%) | $64,451 |
| Average | 11,276 (100.0%) | $83,445 |
Occupancy by Householder Income Bracket in Fredericksburg city
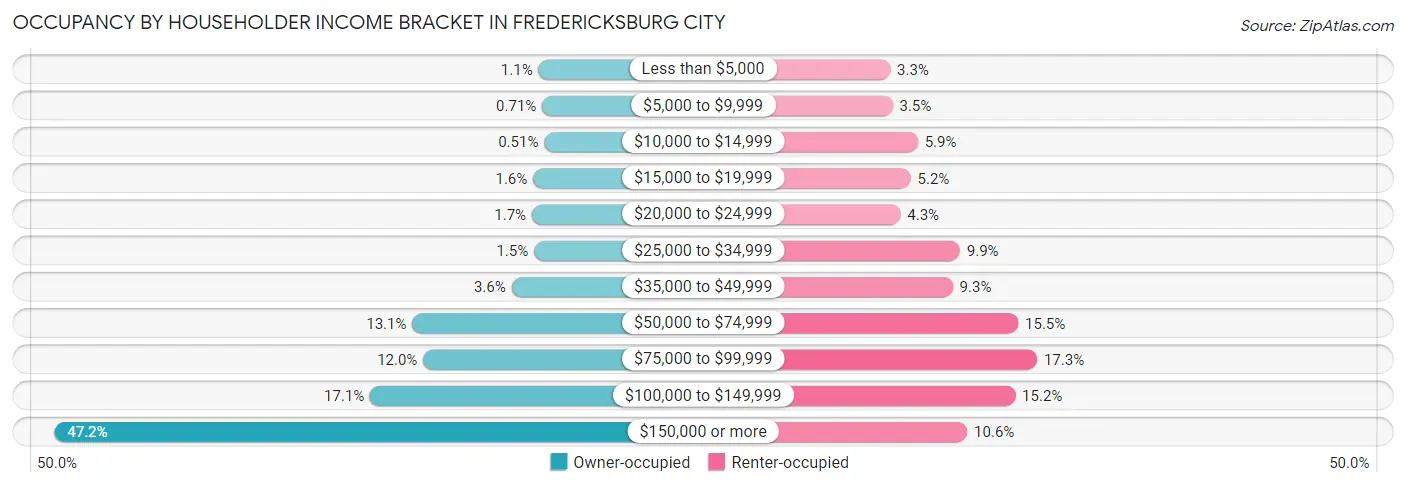
| Income Bracket | Owner-occupied | Renter-occupied |
| Less than $5,000 | 46 (1.1%) | 228 (3.3%) |
| $5,000 to $9,999 | 31 (0.7%) | 244 (3.5%) |
| $10,000 to $14,999 | 22 (0.5%) | 411 (5.9%) |
| $15,000 to $19,999 | 68 (1.6%) | 364 (5.2%) |
| $20,000 to $24,999 | 73 (1.7%) | 296 (4.3%) |
| $25,000 to $34,999 | 64 (1.5%) | 689 (9.9%) |
| $35,000 to $49,999 | 157 (3.6%) | 642 (9.2%) |
| $50,000 to $74,999 | 567 (13.1%) | 1,074 (15.5%) |
| $75,000 to $99,999 | 522 (12.0%) | 1,199 (17.3%) |
| $100,000 to $149,999 | 741 (17.1%) | 1,055 (15.2%) |
| $150,000 or more | 2,045 (47.2%) | 738 (10.6%) |
| Total | 4,336 (100.0%) | 6,940 (100.0%) |
Monthly Housing Cost Tiers in Fredericksburg city
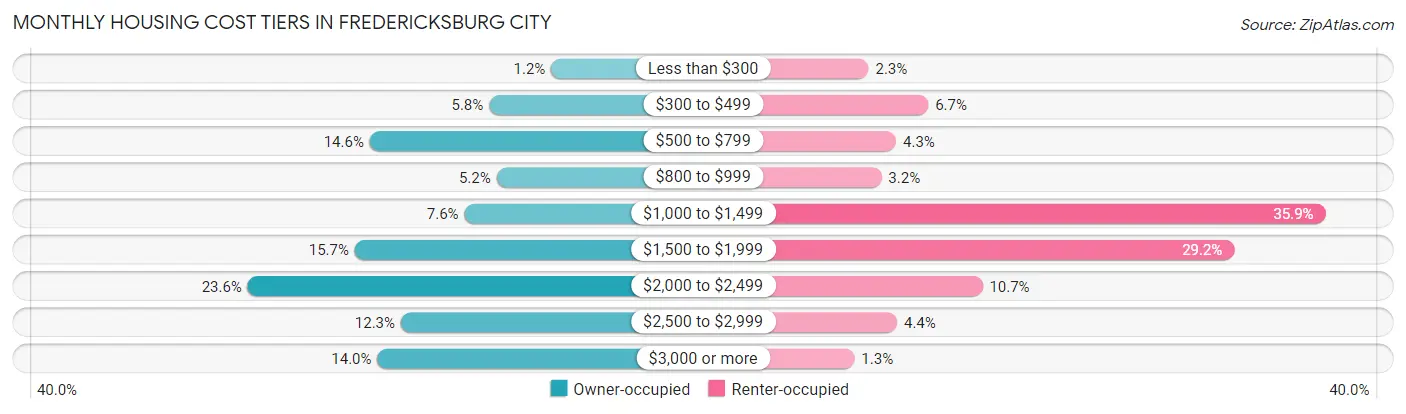
| Monthly Cost | Owner-occupied | Renter-occupied |
| Less than $300 | 53 (1.2%) | 159 (2.3%) |
| $300 to $499 | 251 (5.8%) | 464 (6.7%) |
| $500 to $799 | 632 (14.6%) | 300 (4.3%) |
| $800 to $999 | 227 (5.2%) | 225 (3.2%) |
| $1,000 to $1,499 | 330 (7.6%) | 2,494 (35.9%) |
| $1,500 to $1,999 | 680 (15.7%) | 2,028 (29.2%) |
| $2,000 to $2,499 | 1,022 (23.6%) | 741 (10.7%) |
| $2,500 to $2,999 | 533 (12.3%) | 305 (4.4%) |
| $3,000 or more | 608 (14.0%) | 87 (1.3%) |
| Total | 4,336 (100.0%) | 6,940 (100.0%) |
Physical Housing Characteristics in Fredericksburg city
Housing Structures in Fredericksburg city
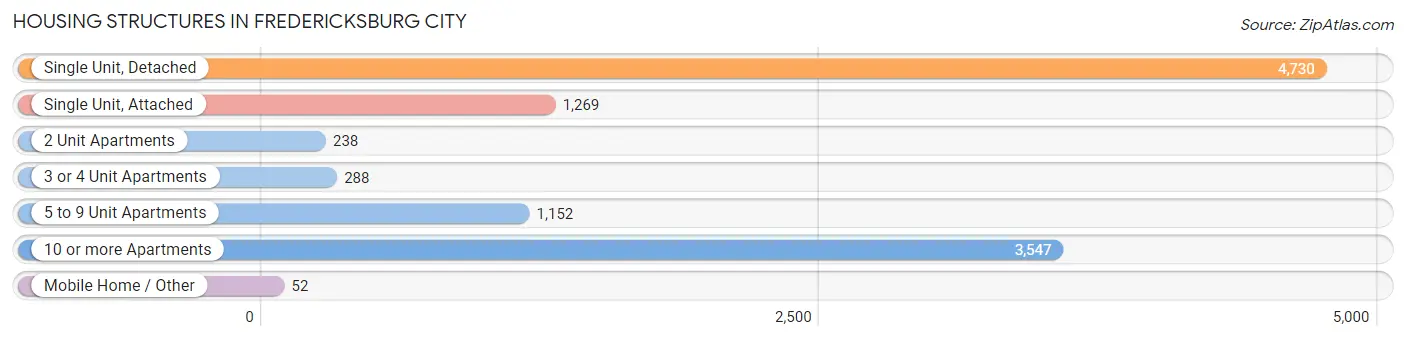
| Structure Type | # Housing Units | % Housing Units |
| Single Unit, Detached | 4,730 | 41.9% |
| Single Unit, Attached | 1,269 | 11.3% |
| 2 Unit Apartments | 238 | 2.1% |
| 3 or 4 Unit Apartments | 288 | 2.5% |
| 5 to 9 Unit Apartments | 1,152 | 10.2% |
| 10 or more Apartments | 3,547 | 31.5% |
| Mobile Home / Other | 52 | 0.5% |
| Total | 11,276 | 100.0% |
Housing Structures by Occupancy in Fredericksburg city
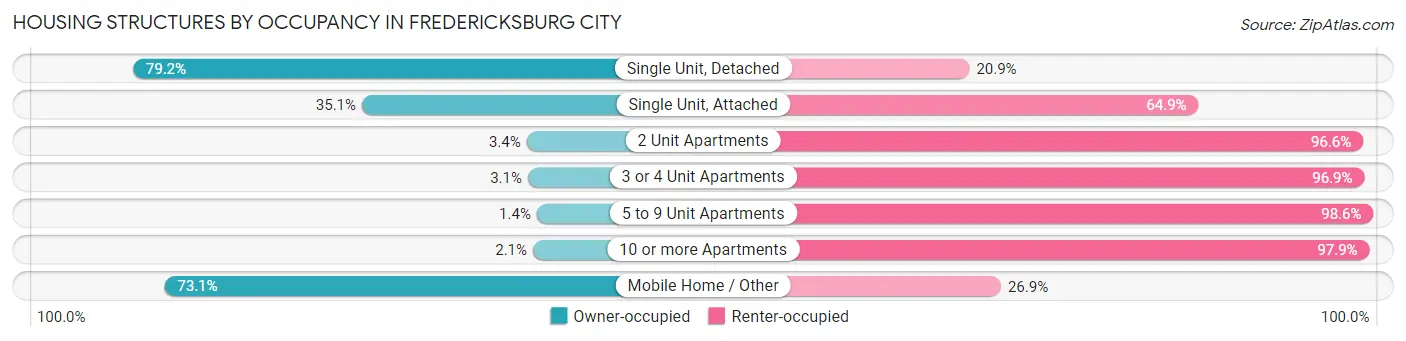
| Structure Type | Owner-occupied | Renter-occupied |
| Single Unit, Detached | 3,744 (79.1%) | 986 (20.8%) |
| Single Unit, Attached | 445 (35.1%) | 824 (64.9%) |
| 2 Unit Apartments | 8 (3.4%) | 230 (96.6%) |
| 3 or 4 Unit Apartments | 9 (3.1%) | 279 (96.9%) |
| 5 to 9 Unit Apartments | 16 (1.4%) | 1,136 (98.6%) |
| 10 or more Apartments | 76 (2.1%) | 3,471 (97.9%) |
| Mobile Home / Other | 38 (73.1%) | 14 (26.9%) |
| Total | 4,336 (38.5%) | 6,940 (61.6%) |
Housing Structures by Number of Rooms in Fredericksburg city
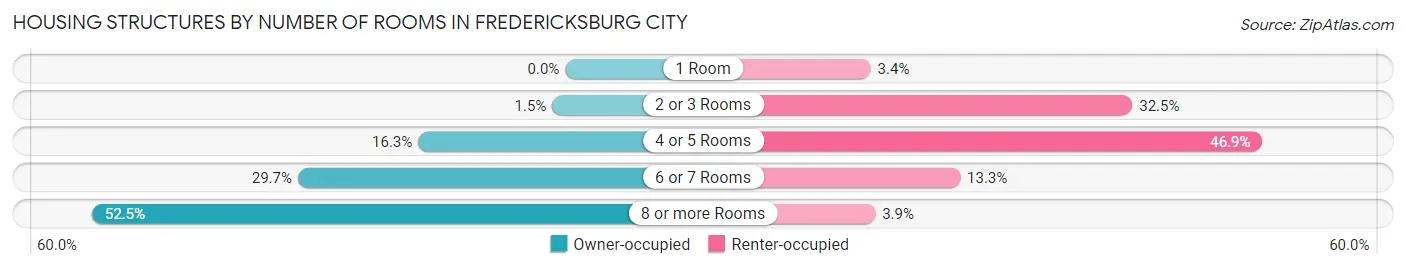
| Number of Rooms | Owner-occupied | Renter-occupied |
| 1 Room | 0 (0.0%) | 237 (3.4%) |
| 2 or 3 Rooms | 63 (1.5%) | 2,252 (32.5%) |
| 4 or 5 Rooms | 708 (16.3%) | 3,253 (46.9%) |
| 6 or 7 Rooms | 1,287 (29.7%) | 926 (13.3%) |
| 8 or more Rooms | 2,278 (52.5%) | 272 (3.9%) |
| Total | 4,336 (100.0%) | 6,940 (100.0%) |
Housing Structure by Heating Type in Fredericksburg city
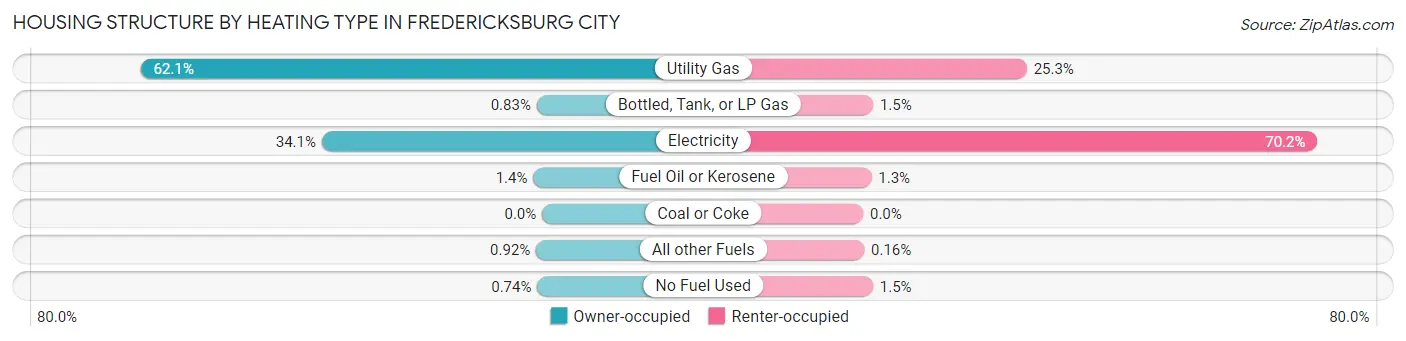
| Heating Type | Owner-occupied | Renter-occupied |
| Utility Gas | 2,692 (62.1%) | 1,756 (25.3%) |
| Bottled, Tank, or LP Gas | 36 (0.8%) | 106 (1.5%) |
| Electricity | 1,477 (34.1%) | 4,873 (70.2%) |
| Fuel Oil or Kerosene | 59 (1.4%) | 89 (1.3%) |
| Coal or Coke | 0 (0.0%) | 0 (0.0%) |
| All other Fuels | 40 (0.9%) | 11 (0.2%) |
| No Fuel Used | 32 (0.7%) | 105 (1.5%) |
| Total | 4,336 (100.0%) | 6,940 (100.0%) |
Household Vehicle Usage in Fredericksburg city
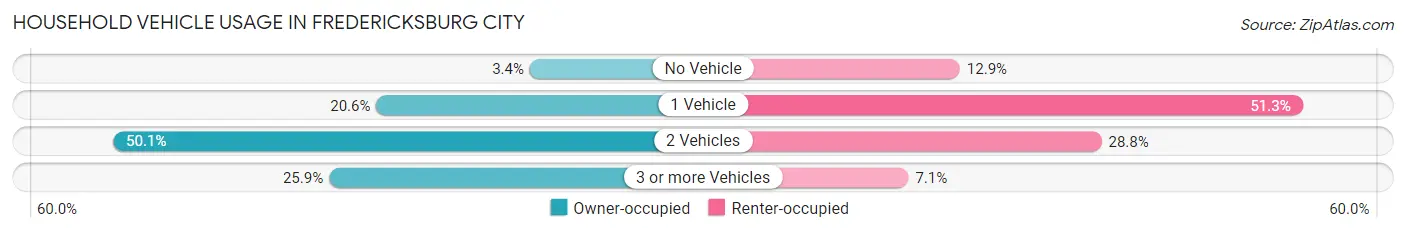
| Vehicles per Household | Owner-occupied | Renter-occupied |
| No Vehicle | 148 (3.4%) | 894 (12.9%) |
| 1 Vehicle | 893 (20.6%) | 3,557 (51.2%) |
| 2 Vehicles | 2,172 (50.1%) | 1,995 (28.7%) |
| 3 or more Vehicles | 1,123 (25.9%) | 494 (7.1%) |
| Total | 4,336 (100.0%) | 6,940 (100.0%) |
Real Estate & Mortgages in Fredericksburg city
Real Estate and Mortgage Overview in Fredericksburg city
| Characteristic | Without Mortgage | With Mortgage |
| Housing Units | 1,219 | 3,117 |
| Median Property Value | $406,300 | $447,100 |
| Median Household Income | $84,063 | $1,721 |
| Monthly Housing Costs | $638 | $608 |
| Real Estate Taxes | $2,717 | $17 |
Property Value by Mortgage Status in Fredericksburg city
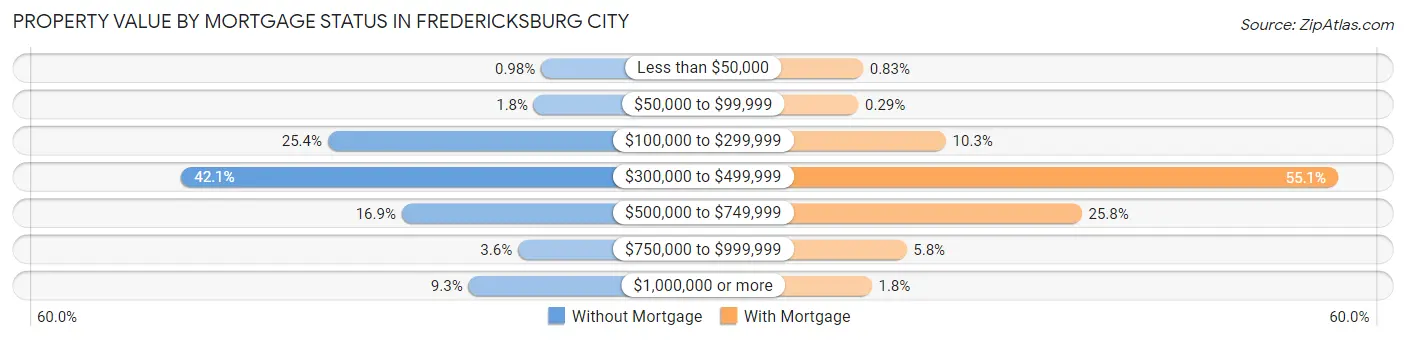
| Property Value | Without Mortgage | With Mortgage |
| Less than $50,000 | 12 (1.0%) | 26 (0.8%) |
| $50,000 to $99,999 | 22 (1.8%) | 9 (0.3%) |
| $100,000 to $299,999 | 309 (25.4%) | 321 (10.3%) |
| $300,000 to $499,999 | 513 (42.1%) | 1,718 (55.1%) |
| $500,000 to $749,999 | 206 (16.9%) | 805 (25.8%) |
| $750,000 to $999,999 | 44 (3.6%) | 181 (5.8%) |
| $1,000,000 or more | 113 (9.3%) | 57 (1.8%) |
| Total | 1,219 (100.0%) | 3,117 (100.0%) |
Household Income by Mortgage Status in Fredericksburg city
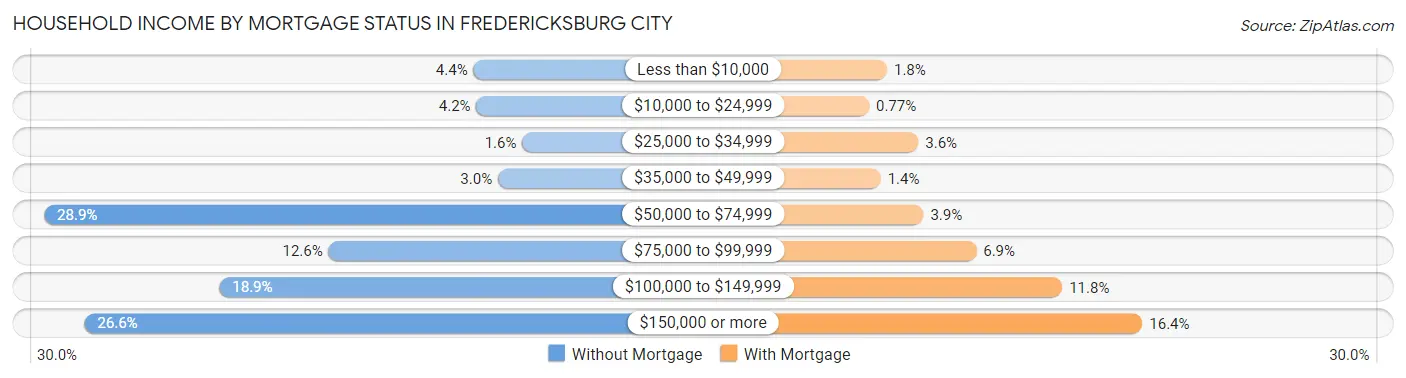
| Household Income | Without Mortgage | With Mortgage |
| Less than $10,000 | 53 (4.3%) | 56 (1.8%) |
| $10,000 to $24,999 | 51 (4.2%) | 24 (0.8%) |
| $25,000 to $34,999 | 19 (1.6%) | 112 (3.6%) |
| $35,000 to $49,999 | 36 (2.9%) | 45 (1.4%) |
| $50,000 to $74,999 | 352 (28.9%) | 121 (3.9%) |
| $75,000 to $99,999 | 154 (12.6%) | 215 (6.9%) |
| $100,000 to $149,999 | 230 (18.9%) | 368 (11.8%) |
| $150,000 or more | 324 (26.6%) | 511 (16.4%) |
| Total | 1,219 (100.0%) | 3,117 (100.0%) |
Property Value to Household Income Ratio in Fredericksburg city
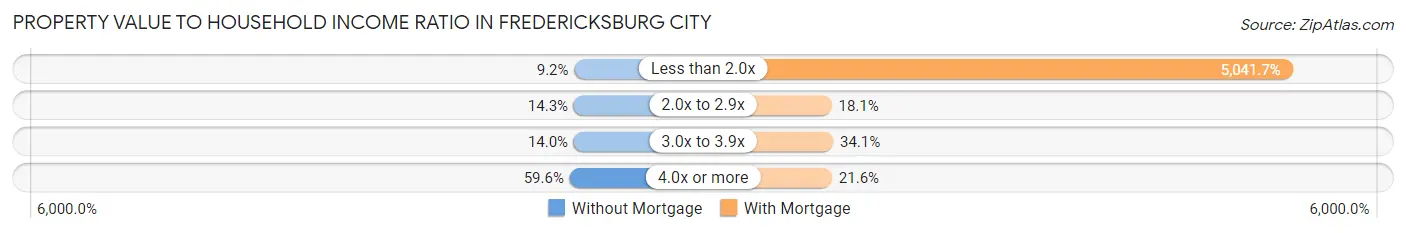
| Value-to-Income Ratio | Without Mortgage | With Mortgage |
| Less than 2.0x | 112 (9.2%) | 157,150 (5,041.7%) |
| 2.0x to 2.9x | 174 (14.3%) | 563 (18.1%) |
| 3.0x to 3.9x | 170 (14.0%) | 1,064 (34.1%) |
| 4.0x or more | 727 (59.6%) | 674 (21.6%) |
| Total | 1,219 (100.0%) | 3,117 (100.0%) |
Real Estate Taxes by Mortgage Status in Fredericksburg city
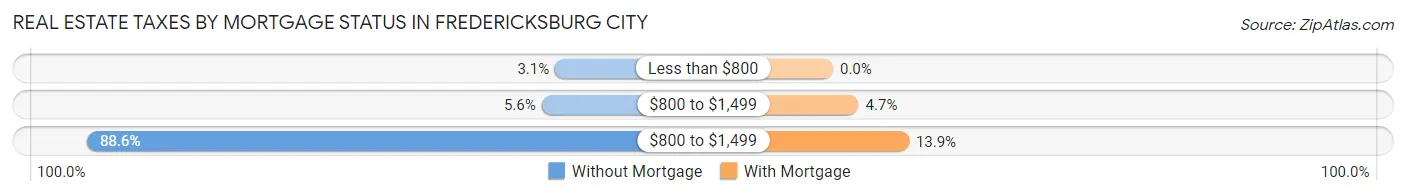
| Property Taxes | Without Mortgage | With Mortgage |
| Less than $800 | 38 (3.1%) | 0 (0.0%) |
| $800 to $1,499 | 68 (5.6%) | 146 (4.7%) |
| $800 to $1,499 | 1,080 (88.6%) | 432 (13.9%) |
| Total | 1,219 (100.0%) | 3,117 (100.0%) |
Health & Disability in Fredericksburg city
Health Insurance Coverage by Age in Fredericksburg city
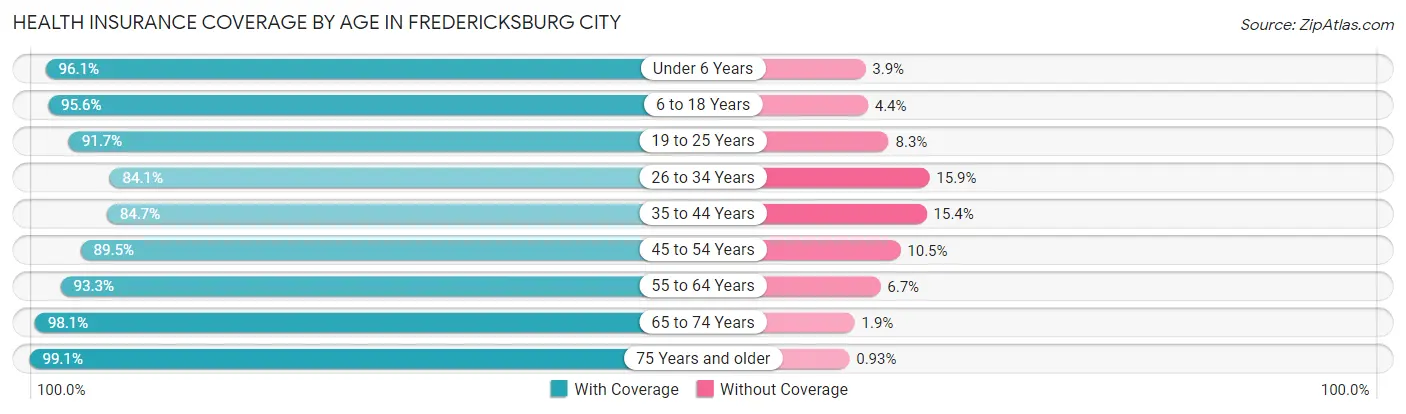
| Age Bracket | With Coverage | Without Coverage |
| Under 6 Years | 1,978 (96.1%) | 81 (3.9%) |
| 6 to 18 Years | 4,258 (95.6%) | 195 (4.4%) |
| 19 to 25 Years | 4,865 (91.7%) | 438 (8.3%) |
| 26 to 34 Years | 3,140 (84.1%) | 592 (15.9%) |
| 35 to 44 Years | 2,730 (84.7%) | 495 (15.3%) |
| 45 to 54 Years | 2,894 (89.5%) | 338 (10.5%) |
| 55 to 64 Years | 2,731 (93.3%) | 197 (6.7%) |
| 65 to 74 Years | 1,938 (98.1%) | 38 (1.9%) |
| 75 Years and older | 1,170 (99.1%) | 11 (0.9%) |
| Total | 25,704 (91.5%) | 2,385 (8.5%) |
Health Insurance Coverage by Citizenship Status in Fredericksburg city
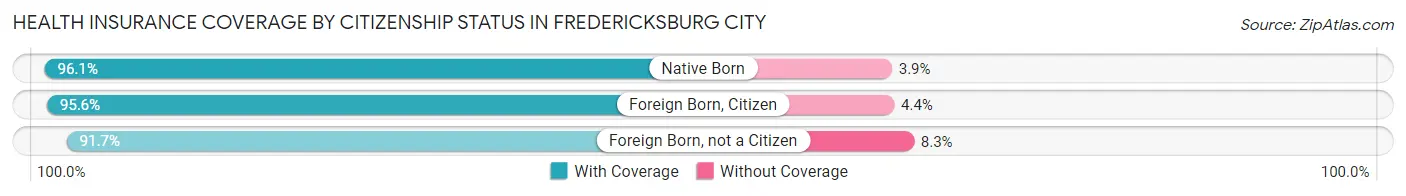
| Citizenship Status | With Coverage | Without Coverage |
| Native Born | 1,978 (96.1%) | 81 (3.9%) |
| Foreign Born, Citizen | 4,258 (95.6%) | 195 (4.4%) |
| Foreign Born, not a Citizen | 4,865 (91.7%) | 438 (8.3%) |
Health Insurance Coverage by Household Income in Fredericksburg city
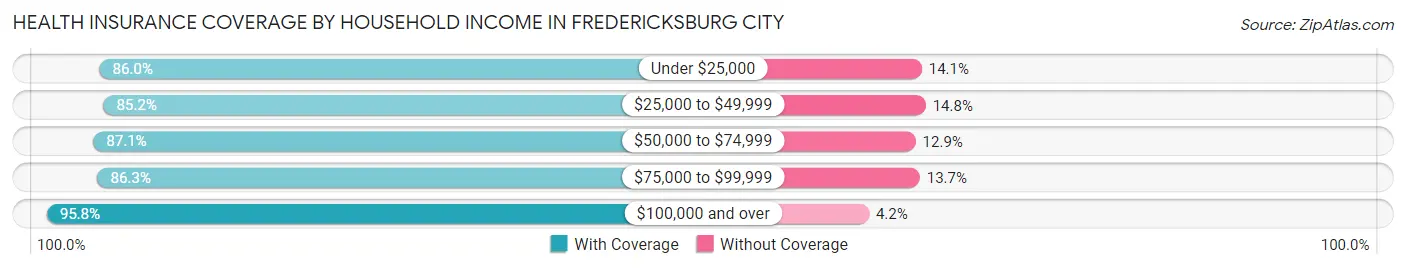
| Household Income | With Coverage | Without Coverage |
| Under $25,000 | 2,960 (86.0%) | 484 (14.1%) |
| $25,000 to $49,999 | 2,627 (85.2%) | 456 (14.8%) |
| $50,000 to $74,999 | 2,498 (87.1%) | 370 (12.9%) |
| $75,000 to $99,999 | 3,464 (86.3%) | 549 (13.7%) |
| $100,000 and over | 11,811 (95.8%) | 513 (4.2%) |
Public vs Private Health Insurance Coverage by Age in Fredericksburg city
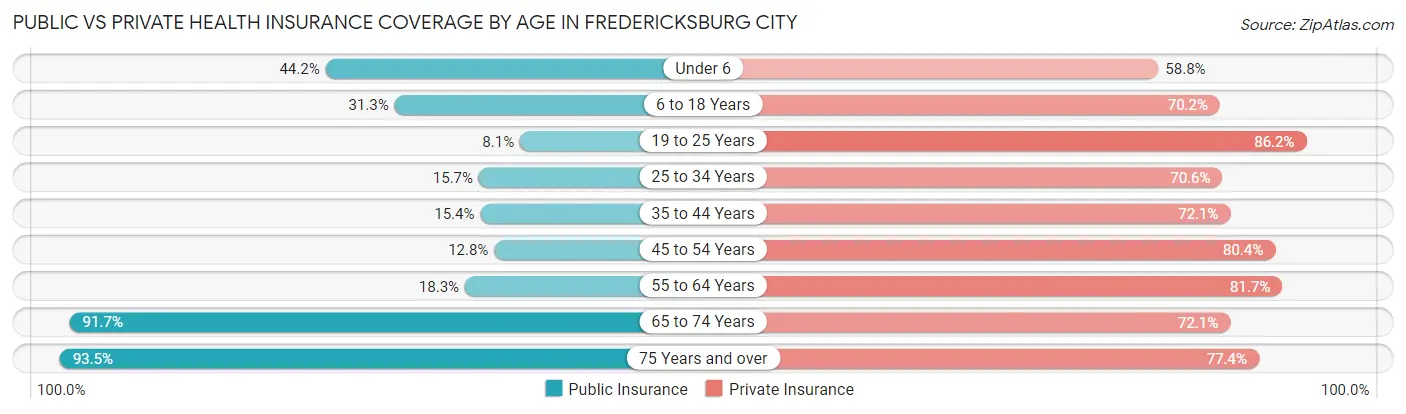
| Age Bracket | Public Insurance | Private Insurance |
| Under 6 | 909 (44.2%) | 1,210 (58.8%) |
| 6 to 18 Years | 1,395 (31.3%) | 3,124 (70.2%) |
| 19 to 25 Years | 427 (8.1%) | 4,572 (86.2%) |
| 25 to 34 Years | 585 (15.7%) | 2,636 (70.6%) |
| 35 to 44 Years | 497 (15.4%) | 2,326 (72.1%) |
| 45 to 54 Years | 415 (12.8%) | 2,599 (80.4%) |
| 55 to 64 Years | 535 (18.3%) | 2,393 (81.7%) |
| 65 to 74 Years | 1,811 (91.6%) | 1,424 (72.1%) |
| 75 Years and over | 1,104 (93.5%) | 914 (77.4%) |
| Total | 7,678 (27.3%) | 21,198 (75.5%) |
Disability Status by Sex by Age in Fredericksburg city
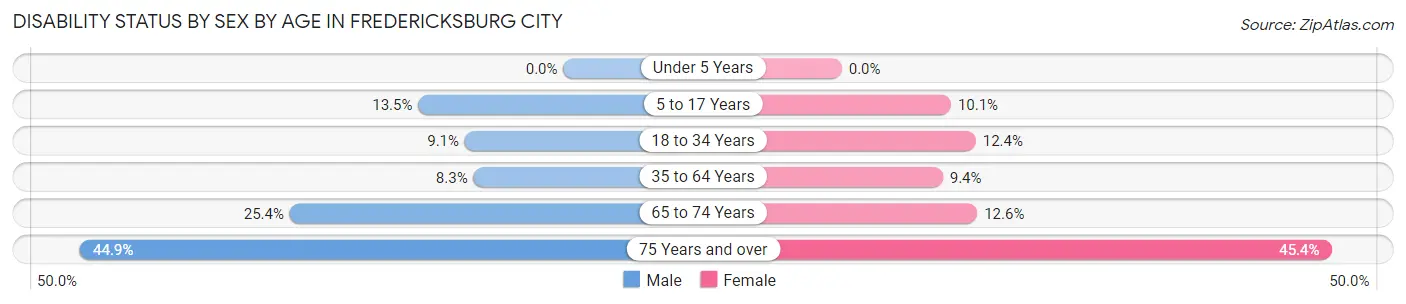
| Age Bracket | Male | Female |
| Under 5 Years | 0 (0.0%) | 0 (0.0%) |
| 5 to 17 Years | 280 (13.5%) | 212 (10.1%) |
| 18 to 34 Years | 398 (9.1%) | 659 (12.4%) |
| 35 to 64 Years | 367 (8.3%) | 467 (9.4%) |
| 65 to 74 Years | 229 (25.4%) | 135 (12.6%) |
| 75 Years and over | 196 (44.9%) | 338 (45.4%) |
Disability Class by Sex by Age in Fredericksburg city
Disability Class: Hearing Difficulty
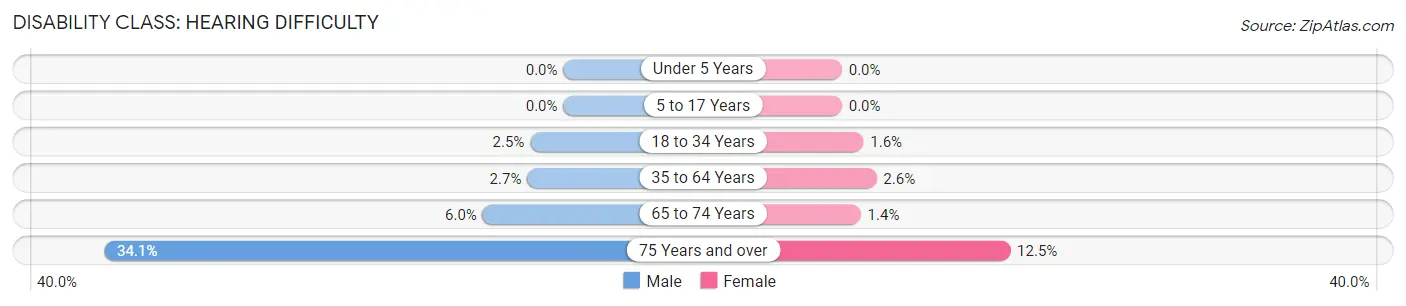
| Age Bracket | Male | Female |
| Under 5 Years | 0 (0.0%) | 0 (0.0%) |
| 5 to 17 Years | 0 (0.0%) | 0 (0.0%) |
| 18 to 34 Years | 107 (2.5%) | 85 (1.6%) |
| 35 to 64 Years | 118 (2.7%) | 128 (2.6%) |
| 65 to 74 Years | 54 (6.0%) | 15 (1.4%) |
| 75 Years and over | 149 (34.1%) | 93 (12.5%) |
Disability Class: Vision Difficulty
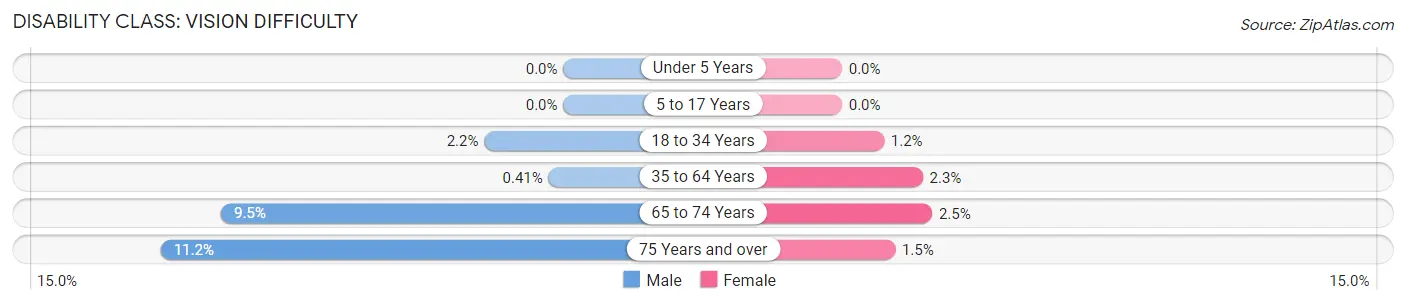
| Age Bracket | Male | Female |
| Under 5 Years | 0 (0.0%) | 0 (0.0%) |
| 5 to 17 Years | 0 (0.0%) | 0 (0.0%) |
| 18 to 34 Years | 96 (2.2%) | 62 (1.2%) |
| 35 to 64 Years | 18 (0.4%) | 112 (2.2%) |
| 65 to 74 Years | 86 (9.5%) | 27 (2.5%) |
| 75 Years and over | 49 (11.2%) | 11 (1.5%) |
Disability Class: Cognitive Difficulty
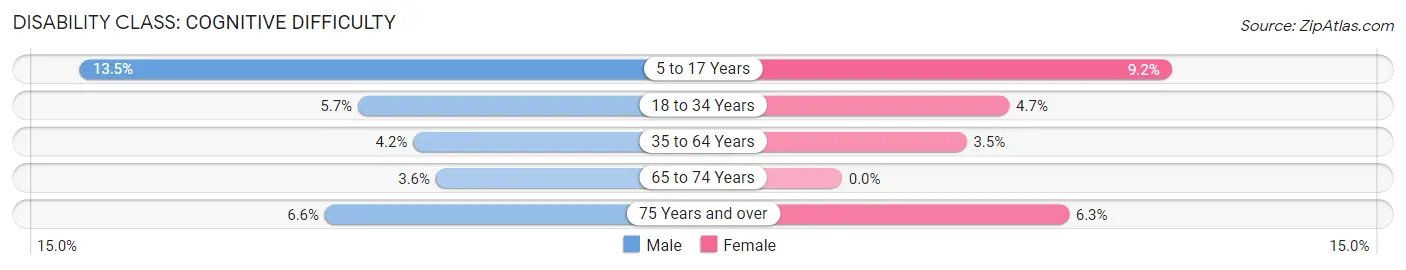
| Age Bracket | Male | Female |
| 5 to 17 Years | 280 (13.5%) | 192 (9.2%) |
| 18 to 34 Years | 249 (5.7%) | 247 (4.7%) |
| 35 to 64 Years | 184 (4.2%) | 173 (3.5%) |
| 65 to 74 Years | 32 (3.5%) | 0 (0.0%) |
| 75 Years and over | 29 (6.6%) | 47 (6.3%) |
Disability Class: Ambulatory Difficulty
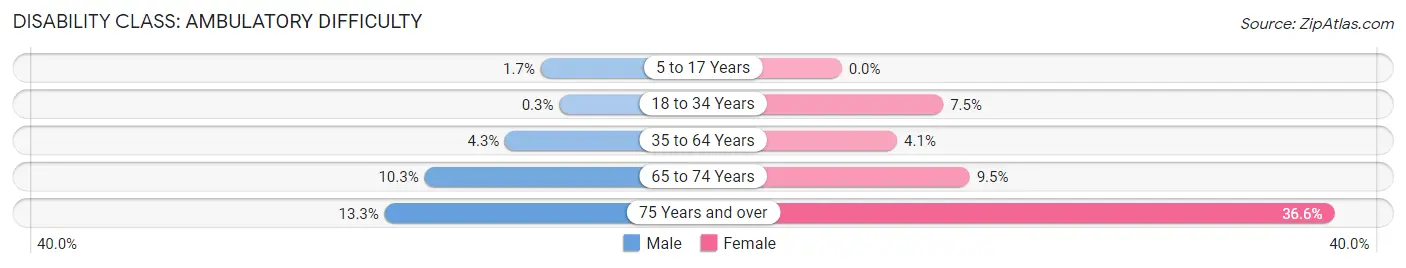
| Age Bracket | Male | Female |
| 5 to 17 Years | 35 (1.7%) | 0 (0.0%) |
| 18 to 34 Years | 13 (0.3%) | 399 (7.5%) |
| 35 to 64 Years | 190 (4.3%) | 205 (4.1%) |
| 65 to 74 Years | 93 (10.3%) | 102 (9.5%) |
| 75 Years and over | 58 (13.3%) | 272 (36.6%) |
Disability Class: Self-Care Difficulty
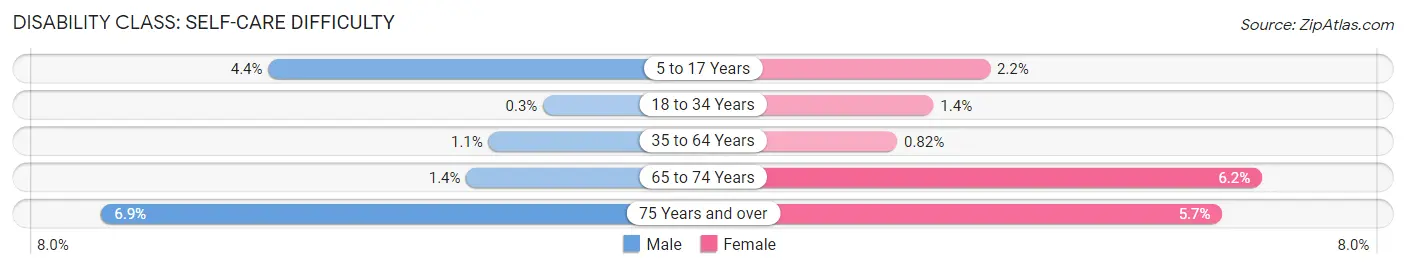
| Age Bracket | Male | Female |
| 5 to 17 Years | 91 (4.4%) | 46 (2.2%) |
| 18 to 34 Years | 13 (0.3%) | 72 (1.4%) |
| 35 to 64 Years | 49 (1.1%) | 41 (0.8%) |
| 65 to 74 Years | 13 (1.4%) | 67 (6.2%) |
| 75 Years and over | 30 (6.9%) | 42 (5.7%) |
Technology Access in Fredericksburg city
Computing Device Access in Fredericksburg city
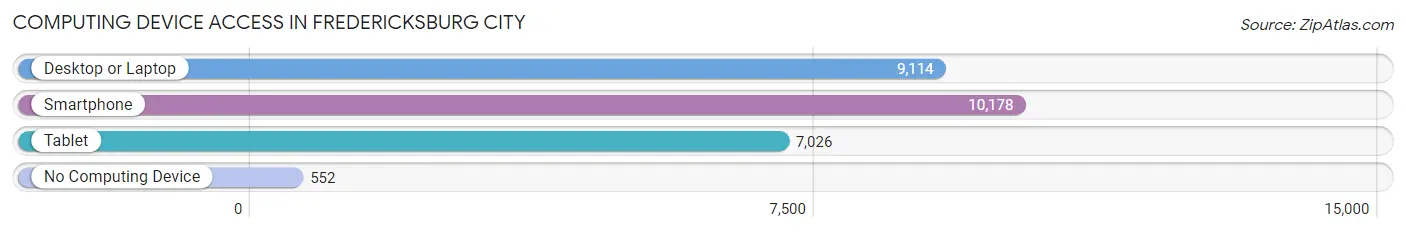
| Device Type | # Households | % Households |
| Desktop or Laptop | 9,114 | 80.8% |
| Smartphone | 10,178 | 90.3% |
| Tablet | 7,026 | 62.3% |
| No Computing Device | 552 | 4.9% |
| Total | 11,276 | 100.0% |
Internet Access in Fredericksburg city
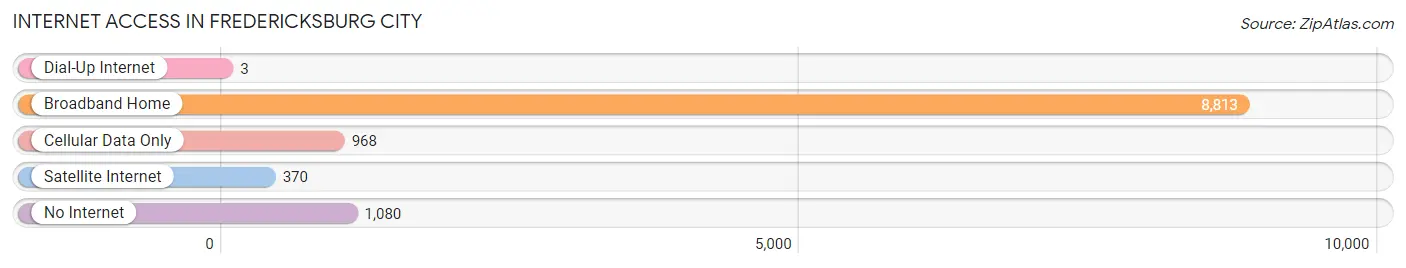
| Internet Type | # Households | % Households |
| Dial-Up Internet | 3 | 0.0% |
| Broadband Home | 8,813 | 78.2% |
| Cellular Data Only | 968 | 8.6% |
| Satellite Internet | 370 | 3.3% |
| No Internet | 1,080 | 9.6% |
| Total | 11,276 | 100.0% |
Fredericksburg city Summary
Fredericksburg City, VA is located in the Commonwealth of Virginia, in the United States of America. It is situated in the northern part of the state, about halfway between Washington, D.C. and Richmond. The city is the county seat of Spotsylvania County and is part of the Washington-Arlington-Alexandria metropolitan area. As of the 2010 census, the population of Fredericksburg City was 24,286.
History
The area that is now Fredericksburg City was first settled by Europeans in 1671, when William Fitzhugh established a trading post on the Rappahannock River. The town was named after Frederick, Prince of Wales, and was officially established in 1727. During the American Revolution, the town was the site of several battles, including the Battle of Fredericksburg in December 1862. The town was also the site of the Battle of Chancellorsville in May 1863.
In the 19th century, Fredericksburg City became an important center for trade and industry. The city was home to several factories, including a cotton mill, a paper mill, and a foundry. The city also became a major transportation hub, with the construction of the Richmond, Fredericksburg, and Potomac Railroad in 1836.
Geography
Fredericksburg City is located in the northern part of Virginia, about halfway between Washington, D.C. and Richmond. The city is situated on the Rappahannock River, which forms the northern boundary of the city. The city is located in the Piedmont region of Virginia, and is surrounded by rolling hills and forests. The city has a total area of 8.3 square miles, of which 8.2 square miles is land and 0.1 square mile is water.
Economy
Fredericksburg City has a diverse economy, with a mix of manufacturing, retail, and service industries. The city is home to several large employers, including the University of Mary Washington, Mary Washington Healthcare, and the U.S. Army’s Fort A.P. Hill. The city is also home to several large retail stores, including Walmart, Target, and Lowe’s.
Demographics
As of the 2010 census, the population of Fredericksburg City was 24,286. The racial makeup of the city was 73.3% White, 17.2% African American, 0.4% Native American, 2.3% Asian, 0.1% Pacific Islander, 4.2% from other races, and 2.5% from two or more races. Hispanic or Latino of any race were 8.7% of the population.
The median income for a household in the city was $50,867, and the median income for a family was $62,837. The per capita income for the city was $25,945. About 11.3% of families and 14.7% of the population were below the poverty line, including 19.2% of those under age 18 and 8.2% of those age 65 or over.
Common Questions
What is Per Capita Income in Fredericksburg city?
Per Capita income in Fredericksburg city is $43,063.
What is the Median Family Income in Fredericksburg city?
Median Family Income in Fredericksburg city is $121,781.
What is the Median Household income in Fredericksburg city?
Median Household Income in Fredericksburg city is $83,445.
What is Income or Wage Gap in Fredericksburg city?
Income or Wage Gap in Fredericksburg city is 40.8%.
Women in Fredericksburg city earn 59.2 cents for every dollar earned by a man.
What is Inequality or Gini Index in Fredericksburg city?
Inequality or Gini Index in Fredericksburg city is 0.46.
What is the Total Population of Fredericksburg city?
Total Population of Fredericksburg city is 28,258.
What is the Total Male Population of Fredericksburg city?
Total Male Population of Fredericksburg city is 13,202.
What is the Total Female Population of Fredericksburg city?
Total Female Population of Fredericksburg city is 15,056.
What is the Ratio of Males per 100 Females in Fredericksburg city?
There are 87.69 Males per 100 Females in Fredericksburg city.
What is the Ratio of Females per 100 Males in Fredericksburg city?
There are 114.04 Females per 100 Males in Fredericksburg city.
What is the Median Population Age in Fredericksburg city?
Median Population Age in Fredericksburg city is 30.9 Years.
What is the Average Family Size in Fredericksburg city
Average Family Size in Fredericksburg city is 3.1 People.
What is the Average Household Size in Fredericksburg city
Average Household Size in Fredericksburg city is 2.3 People.
How Large is the Labor Force in Fredericksburg city?
There are 15,720 People in the Labor Forcein in Fredericksburg city.
What is the Percentage of People in the Labor Force in Fredericksburg city?
68.6% of People are in the Labor Force in Fredericksburg city.
What is the Unemployment Rate in Fredericksburg city?
Unemployment Rate in Fredericksburg city is 5.2%.