Frederick County, VA Map & Demographics
Frederick County Overview
$43,375
PER CAPITA INCOME
$107,040
AVG FAMILY INCOME
$92,443
AVG HOUSEHOLD INCOME
29.2%
WAGE / INCOME GAP [ % ]
70.8¢/ $1
WAGE / INCOME GAP [ $ ]
$11,941
FAMILY INCOME DEFICIT
0.40
INEQUALITY / GINI INDEX
92,007
TOTAL POPULATION
46,279
MALE POPULATION
45,728
FEMALE POPULATION
101.20
MALES / 100 FEMALES
98.81
FEMALES / 100 MALES
40.6
MEDIAN AGE
3.1
AVG FAMILY SIZE
2.7
AVG HOUSEHOLD SIZE
47,197
LABOR FORCE [ PEOPLE ]
64.1%
PERCENT IN LABOR FORCE
4.2%
UNEMPLOYMENT RATE
Frederick County Area Codes
Income in Frederick County
Income Overview in Frederick County
Per Capita Income in Frederick County is $43,375, while median incomes of families and households are $107,040 and $92,443 respectively.
| Characteristic | Number | Measure |
| Per Capita Income | 92,007 | $43,375 |
| Median Family Income | 24,291 | $107,040 |
| Mean Family Income | 24,291 | $126,953 |
| Median Household Income | 33,534 | $92,443 |
| Mean Household Income | 33,534 | $114,214 |
| Income Deficit | 24,291 | $11,941 |
| Wage / Income Gap (%) | 92,007 | 29.19% |
| Wage / Income Gap ($) | 92,007 | 70.81¢ per $1 |
| Gini / Inequality Index | 92,007 | 0.40 |
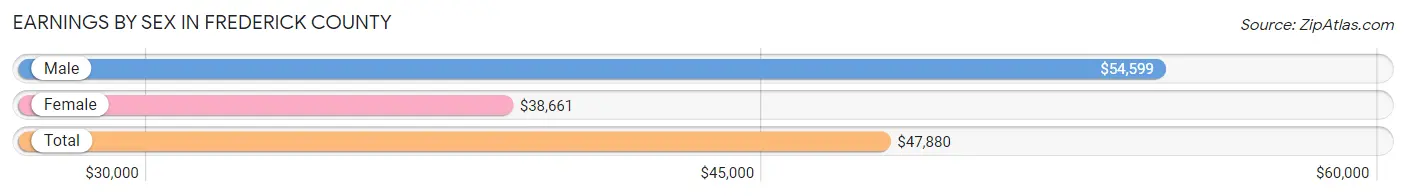
Earnings by Sex in Frederick County
Average Earnings in Frederick County are $47,880, $54,599 for men and $38,661 for women, a difference of 29.2%.
| Sex | Number | Average Earnings |
| Male | 26,774 (53.7%) | $54,599 |
| Female | 23,056 (46.3%) | $38,661 |
| Total | 49,830 (100.0%) | $47,880 |
Earnings by Sex by Income Bracket in Frederick County
The most common earnings brackets in Frederick County are $100,000+ for men (5,648 | 21.1%) and $100,000+ for women (2,229 | 9.7%).

| Income | Male | Female |
| $2,499 or less | 1,210 (4.5%) | 1,188 (5.1%) |
| $2,500 to $4,999 | 536 (2.0%) | 974 (4.2%) |
| $5,000 to $7,499 | 621 (2.3%) | 924 (4.0%) |
| $7,500 to $9,999 | 509 (1.9%) | 698 (3.0%) |
| $10,000 to $12,499 | 597 (2.2%) | 708 (3.1%) |
| $12,500 to $14,999 | 475 (1.8%) | 735 (3.2%) |
| $15,000 to $17,499 | 569 (2.1%) | 757 (3.3%) |
| $17,500 to $19,999 | 317 (1.2%) | 405 (1.8%) |
| $20,000 to $22,499 | 338 (1.3%) | 702 (3.0%) |
| $22,500 to $24,999 | 715 (2.7%) | 634 (2.8%) |
| $25,000 to $29,999 | 1,259 (4.7%) | 1,267 (5.5%) |
| $30,000 to $34,999 | 1,077 (4.0%) | 1,487 (6.5%) |
| $35,000 to $39,999 | 1,001 (3.7%) | 1,350 (5.9%) |
| $40,000 to $44,999 | 1,281 (4.8%) | 1,105 (4.8%) |
| $45,000 to $49,999 | 1,217 (4.5%) | 1,011 (4.4%) |
| $50,000 to $54,999 | 1,795 (6.7%) | 986 (4.3%) |
| $55,000 to $64,999 | 2,410 (9.0%) | 2,086 (9.0%) |
| $65,000 to $74,999 | 1,745 (6.5%) | 1,669 (7.2%) |
| $75,000 to $99,999 | 3,454 (12.9%) | 2,141 (9.3%) |
| $100,000+ | 5,648 (21.1%) | 2,229 (9.7%) |
| Total | 26,774 (100.0%) | 23,056 (100.0%) |
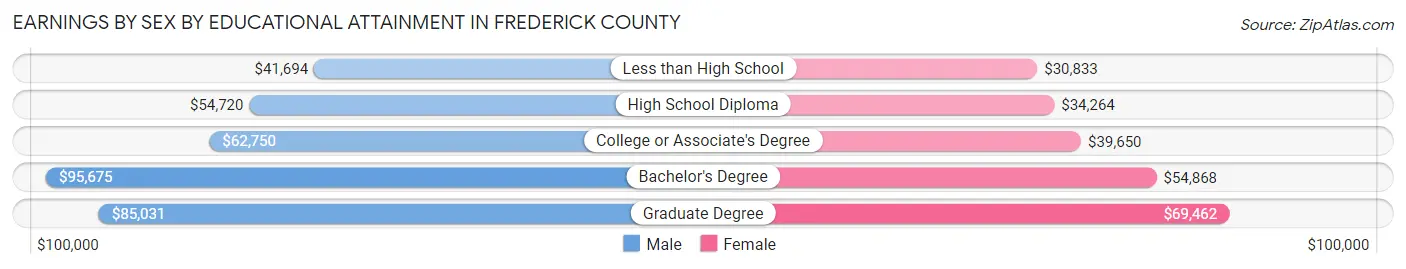
Earnings by Sex by Educational Attainment in Frederick County
Average earnings in Frederick County are $61,053 for men and $43,913 for women, a difference of 28.1%. Men with an educational attainment of bachelor's degree enjoy the highest average annual earnings of $95,675, while those with less than high school education earn the least with $41,694. Women with an educational attainment of graduate degree earn the most with the average annual earnings of $69,462, while those with less than high school education have the smallest earnings of $30,833.
| Educational Attainment | Male Income | Female Income |
| Less than High School | $41,694 | $30,833 |
| High School Diploma | $54,720 | $34,264 |
| College or Associate's Degree | $62,750 | $39,650 |
| Bachelor's Degree | $95,675 | $54,868 |
| Graduate Degree | $85,031 | $69,462 |
| Total | $61,053 | $43,913 |
Family Income in Frederick County
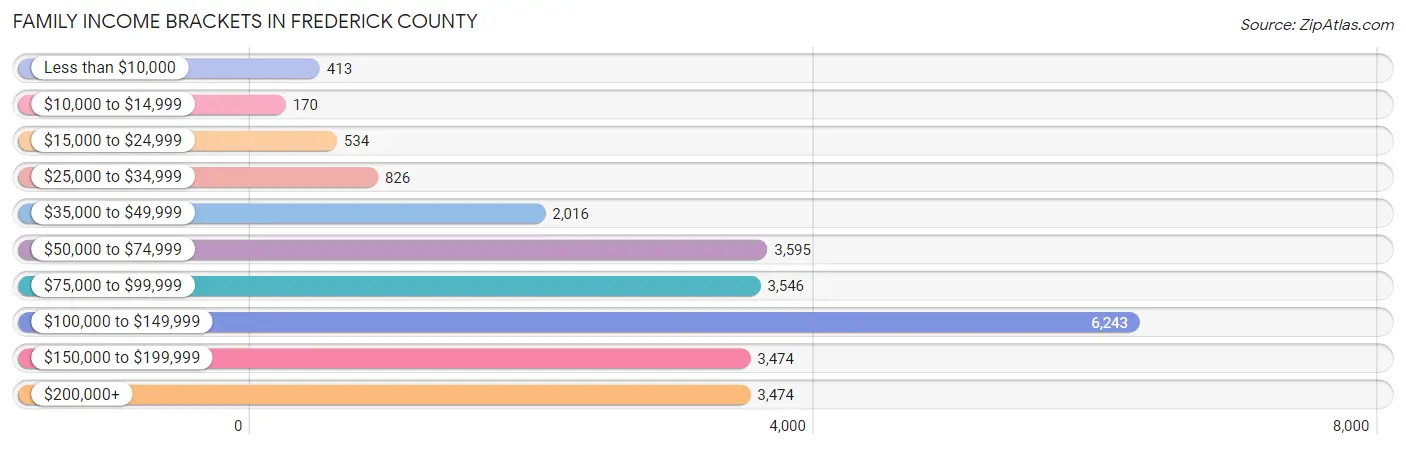
Family Income Brackets in Frederick County
According to the Frederick County family income data, there are 6,243 families falling into the $100,000 to $149,999 income range, which is the most common income bracket and makes up 25.7% of all families. Conversely, the $10,000 to $14,999 income bracket is the least frequent group with only 170 families (0.7%) belonging to this category.
| Income Bracket | # Families | % Families |
| Less than $10,000 | 413 | 1.7% |
| $10,000 to $14,999 | 170 | 0.7% |
| $15,000 to $24,999 | 534 | 2.2% |
| $25,000 to $34,999 | 826 | 3.4% |
| $35,000 to $49,999 | 2,016 | 8.3% |
| $50,000 to $74,999 | 3,595 | 14.8% |
| $75,000 to $99,999 | 3,546 | 14.6% |
| $100,000 to $149,999 | 6,243 | 25.7% |
| $150,000 to $199,999 | 3,474 | 14.3% |
| $200,000+ | 3,474 | 14.3% |
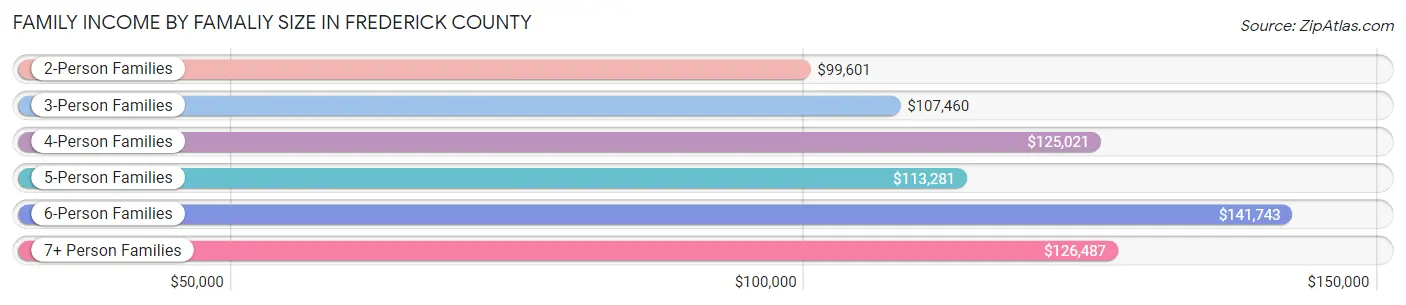
Family Income by Famaliy Size in Frederick County
6-person families (605 | 2.5%) account for the highest median family income in Frederick County with $141,743 per family, while 2-person families (12,237 | 50.4%) have the highest median income of $49,800 per family member.
| Income Bracket | # Families | Median Income |
| 2-Person Families | 12,237 (50.4%) | $99,601 |
| 3-Person Families | 4,863 (20.0%) | $107,460 |
| 4-Person Families | 4,087 (16.8%) | $125,021 |
| 5-Person Families | 1,998 (8.2%) | $113,281 |
| 6-Person Families | 605 (2.5%) | $141,743 |
| 7+ Person Families | 501 (2.1%) | $126,487 |
| Total | 24,291 (100.0%) | $107,040 |
Family Income by Number of Earners in Frederick County
The median family income in Frederick County is $107,040, with families comprising 3+ earners (3,025) having the highest median family income of $154,057, while families with no earners (3,375) have the lowest median family income of $69,583, accounting for 12.4% and 13.9% of families, respectively.
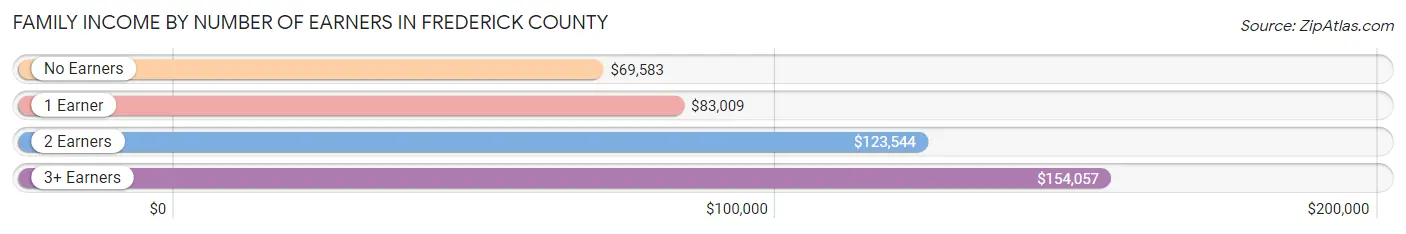
| Number of Earners | # Families | Median Income |
| No Earners | 3,375 (13.9%) | $69,583 |
| 1 Earner | 7,015 (28.9%) | $83,009 |
| 2 Earners | 10,876 (44.8%) | $123,544 |
| 3+ Earners | 3,025 (12.4%) | $154,057 |
| Total | 24,291 (100.0%) | $107,040 |
Household Income in Frederick County
Household Income Brackets in Frederick County
With 7,646 households falling in the category, the $100,000 to $149,999 income range is the most frequent in Frederick County, accounting for 22.8% of all households. In contrast, only 503 households (1.5%) fall into the $10,000 to $14,999 income bracket, making it the least populous group.
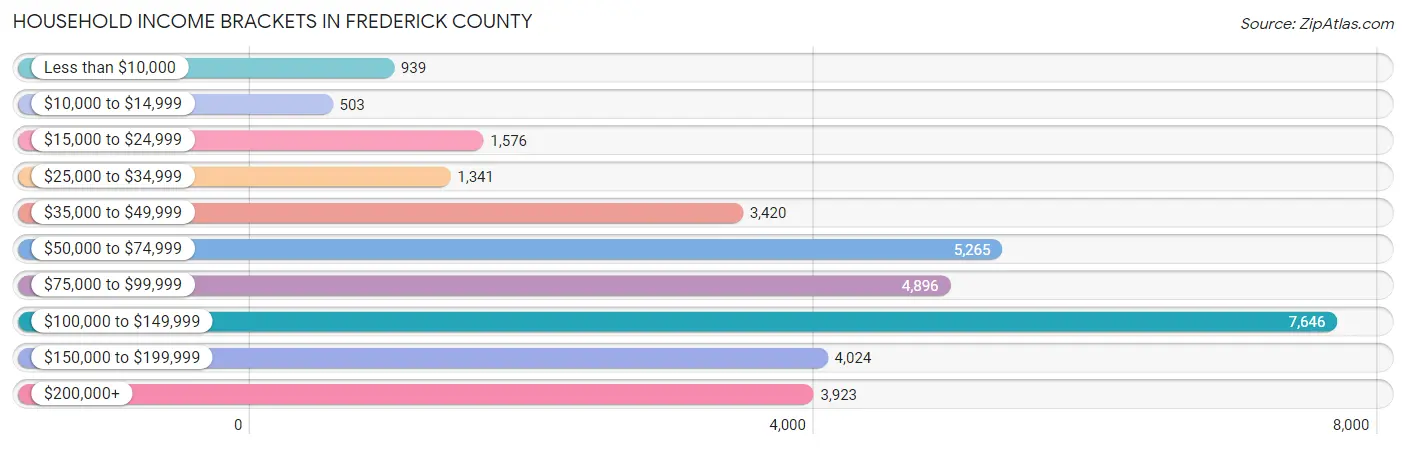
| Income Bracket | # Households | % Households |
| Less than $10,000 | 939 | 2.8% |
| $10,000 to $14,999 | 503 | 1.5% |
| $15,000 to $24,999 | 1,576 | 4.7% |
| $25,000 to $34,999 | 1,341 | 4.0% |
| $35,000 to $49,999 | 3,420 | 10.2% |
| $50,000 to $74,999 | 5,265 | 15.7% |
| $75,000 to $99,999 | 4,896 | 14.6% |
| $100,000 to $149,999 | 7,646 | 22.8% |
| $150,000 to $199,999 | 4,024 | 12.0% |
| $200,000+ | 3,923 | 11.7% |
Household Income by Householder Age in Frederick County
The median household income in Frederick County is $92,443, with the highest median household income of $110,840 found in the 45 to 64 years age bracket for the primary householder. A total of 13,176 households (39.3%) fall into this category. Meanwhile, the 15 to 24 years age bracket for the primary householder has the lowest median household income of $47,098, with 607 households (1.8%) in this group.
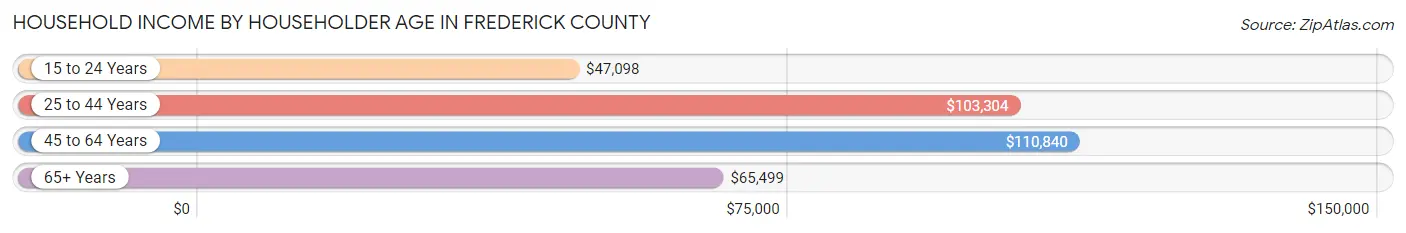
| Income Bracket | # Households | Median Income |
| 15 to 24 Years | 607 (1.8%) | $47,098 |
| 25 to 44 Years | 9,980 (29.8%) | $103,304 |
| 45 to 64 Years | 13,176 (39.3%) | $110,840 |
| 65+ Years | 9,771 (29.1%) | $65,499 |
| Total | 33,534 (100.0%) | $92,443 |
Poverty in Frederick County
Income Below Poverty by Sex and Age in Frederick County
With 6.2% poverty level for males and 7.3% for females among the residents of Frederick County, 16 and 17 year old males and 18 to 24 year old females are the most vulnerable to poverty, with 378 males (24.5%) and 546 females (16.5%) in their respective age groups living below the poverty level.
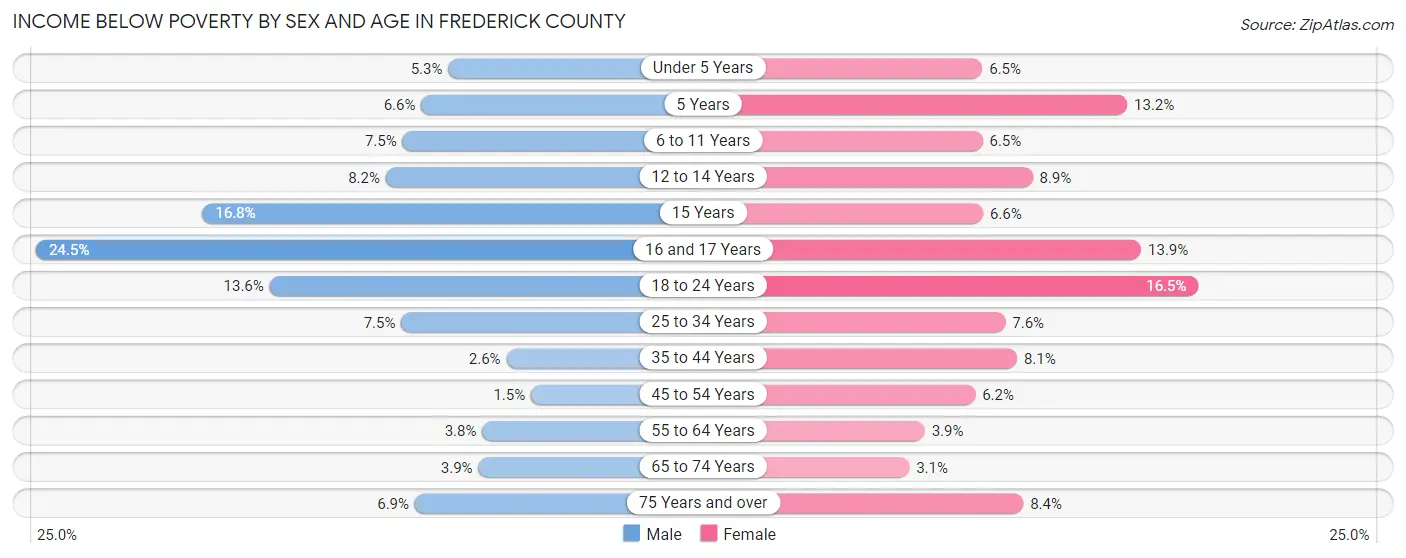
| Age Bracket | Male | Female |
| Under 5 Years | 150 (5.3%) | 149 (6.5%) |
| 5 Years | 42 (6.6%) | 67 (13.2%) |
| 6 to 11 Years | 269 (7.5%) | 203 (6.5%) |
| 12 to 14 Years | 143 (8.2%) | 171 (8.8%) |
| 15 Years | 99 (16.8%) | 45 (6.6%) |
| 16 and 17 Years | 378 (24.5%) | 134 (13.9%) |
| 18 to 24 Years | 480 (13.6%) | 546 (16.5%) |
| 25 to 34 Years | 403 (7.5%) | 411 (7.6%) |
| 35 to 44 Years | 148 (2.6%) | 476 (8.1%) |
| 45 to 54 Years | 90 (1.5%) | 356 (6.2%) |
| 55 to 64 Years | 233 (3.8%) | 245 (3.8%) |
| 65 to 74 Years | 183 (3.9%) | 154 (3.1%) |
| 75 Years and over | 201 (6.9%) | 338 (8.4%) |
| Total | 2,819 (6.2%) | 3,295 (7.3%) |
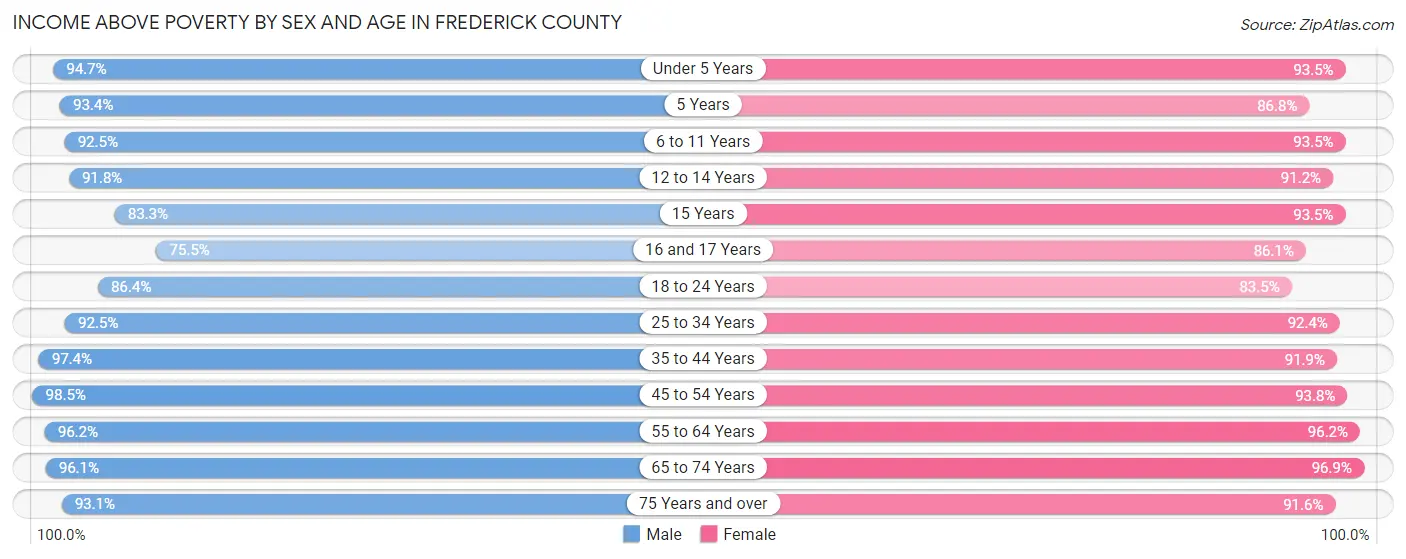
Income Above Poverty by Sex and Age in Frederick County
According to the poverty statistics in Frederick County, males aged 45 to 54 years and females aged 65 to 74 years are the age groups that are most secure financially, with 98.5% of males and 96.9% of females in these age groups living above the poverty line.
| Age Bracket | Male | Female |
| Under 5 Years | 2,658 (94.7%) | 2,136 (93.5%) |
| 5 Years | 595 (93.4%) | 439 (86.8%) |
| 6 to 11 Years | 3,338 (92.5%) | 2,907 (93.5%) |
| 12 to 14 Years | 1,592 (91.8%) | 1,762 (91.1%) |
| 15 Years | 492 (83.3%) | 642 (93.4%) |
| 16 and 17 Years | 1,167 (75.5%) | 831 (86.1%) |
| 18 to 24 Years | 3,041 (86.4%) | 2,755 (83.5%) |
| 25 to 34 Years | 4,953 (92.5%) | 5,002 (92.4%) |
| 35 to 44 Years | 5,465 (97.4%) | 5,380 (91.9%) |
| 45 to 54 Years | 5,929 (98.5%) | 5,398 (93.8%) |
| 55 to 64 Years | 5,965 (96.2%) | 6,124 (96.2%) |
| 65 to 74 Years | 4,465 (96.1%) | 4,770 (96.9%) |
| 75 Years and over | 2,715 (93.1%) | 3,676 (91.6%) |
| Total | 42,375 (93.8%) | 41,822 (92.7%) |
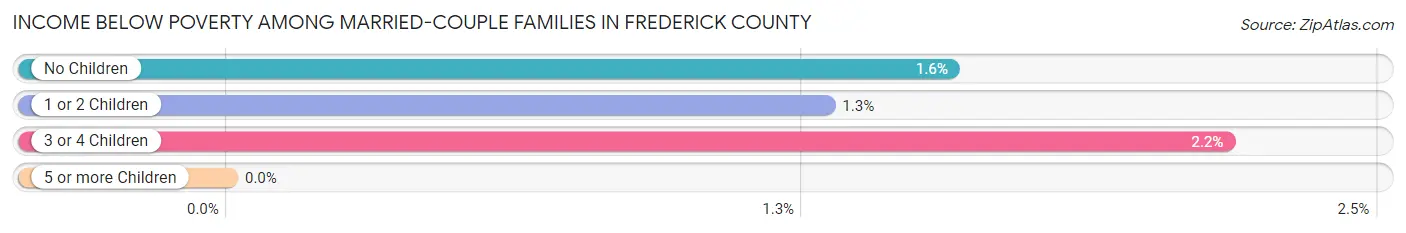
Income Below Poverty Among Married-Couple Families in Frederick County
The poverty statistics for married-couple families in Frederick County show that 1.5% or 297 of the total 19,192 families live below the poverty line. Families with 3 or 4 children have the highest poverty rate of 2.2%, comprising of 41 families. On the other hand, families with 5 or more children have the lowest poverty rate of 0.0%, which includes 0 families.
| Children | Above Poverty | Below Poverty |
| No Children | 11,721 (98.4%) | 187 (1.6%) |
| 1 or 2 Children | 5,220 (98.7%) | 69 (1.3%) |
| 3 or 4 Children | 1,852 (97.8%) | 41 (2.2%) |
| 5 or more Children | 102 (100.0%) | 0 (0.0%) |
| Total | 18,895 (98.5%) | 297 (1.5%) |
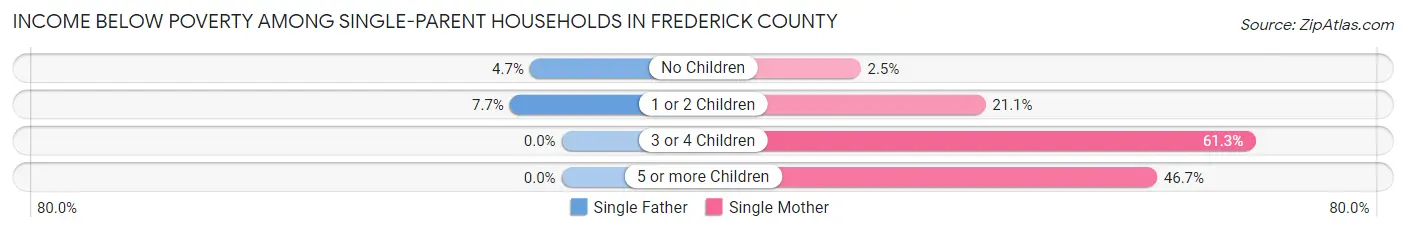
Income Below Poverty Among Single-Parent Households in Frederick County
According to the poverty data in Frederick County, 5.6% or 89 single-father households and 17.5% or 617 single-mother households are living below the poverty line. Among single-father households, those with 1 or 2 children have the highest poverty rate, with 52 households (7.7%) experiencing poverty. Likewise, among single-mother households, those with 3 or 4 children have the highest poverty rate, with 198 households (61.3%) falling below the poverty line.
| Children | Single Father | Single Mother |
| No Children | 37 (4.7%) | 35 (2.5%) |
| 1 or 2 Children | 52 (7.7%) | 377 (21.1%) |
| 3 or 4 Children | 0 (0.0%) | 198 (61.3%) |
| 5 or more Children | 0 (0.0%) | 7 (46.7%) |
| Total | 89 (5.6%) | 617 (17.5%) |
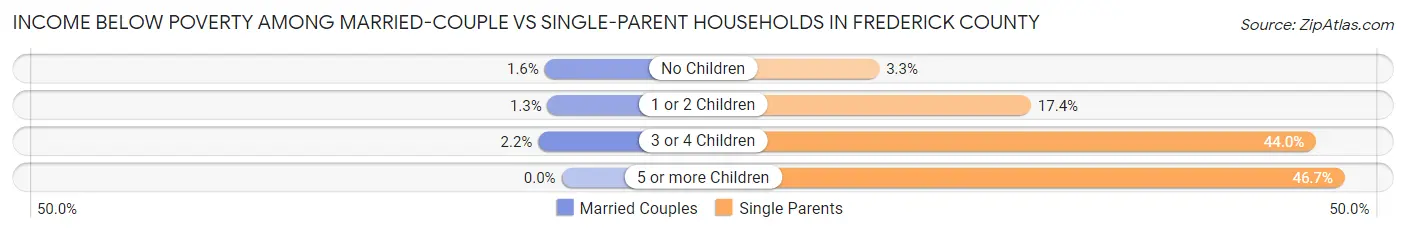
Income Below Poverty Among Married-Couple vs Single-Parent Households in Frederick County
The poverty data for Frederick County shows that 297 of the married-couple family households (1.5%) and 706 of the single-parent households (13.9%) are living below the poverty level. Within the married-couple family households, those with 3 or 4 children have the highest poverty rate, with 41 households (2.2%) falling below the poverty line. Among the single-parent households, those with 5 or more children have the highest poverty rate, with 7 household (46.7%) living below poverty.
| Children | Married-Couple Families | Single-Parent Households |
| No Children | 187 (1.6%) | 72 (3.3%) |
| 1 or 2 Children | 69 (1.3%) | 429 (17.4%) |
| 3 or 4 Children | 41 (2.2%) | 198 (44.0%) |
| 5 or more Children | 0 (0.0%) | 7 (46.7%) |
| Total | 297 (1.5%) | 706 (13.9%) |
Race in Frederick County
The most populous races in Frederick County are White / Caucasian (79,098 | 86.0%), Hispanic or Latino (9,317 | 10.1%), and Two or more Races (4,010 | 4.4%).
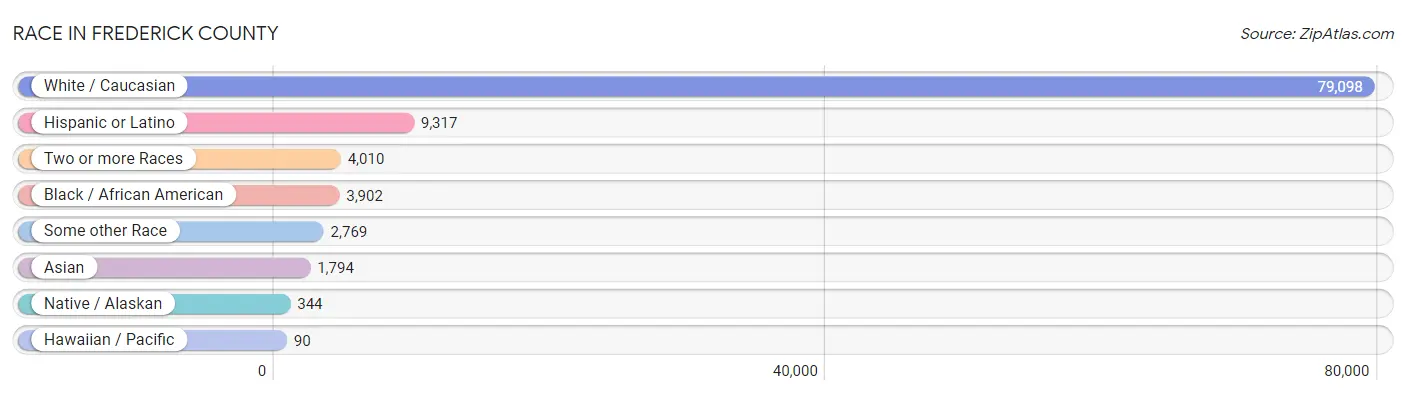
| Race | # Population | % Population |
| Asian | 1,794 | 1.9% |
| Black / African American | 3,902 | 4.2% |
| Hawaiian / Pacific | 90 | 0.1% |
| Hispanic or Latino | 9,317 | 10.1% |
| Native / Alaskan | 344 | 0.4% |
| White / Caucasian | 79,098 | 86.0% |
| Two or more Races | 4,010 | 4.4% |
| Some other Race | 2,769 | 3.0% |
| Total | 92,007 | 100.0% |
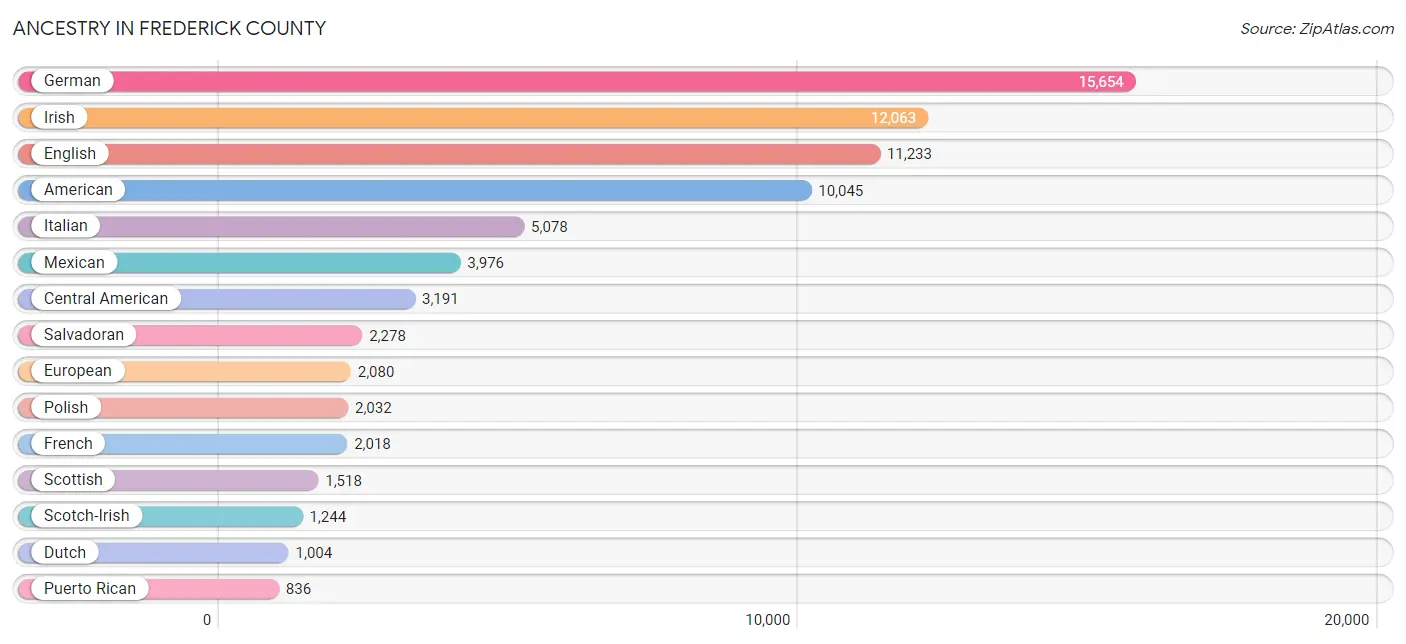
Ancestry in Frederick County
The most populous ancestries reported in Frederick County are German (15,654 | 17.0%), Irish (12,063 | 13.1%), English (11,233 | 12.2%), American (10,045 | 10.9%), and Italian (5,078 | 5.5%), together accounting for 58.8% of all Frederick County residents.
| Ancestry | # Population | % Population |
| African | 159 | 0.2% |
| Alsatian | 23 | 0.0% |
| American | 10,045 | 10.9% |
| Arab | 85 | 0.1% |
| Argentinean | 6 | 0.0% |
| Armenian | 50 | 0.1% |
| Austrian | 195 | 0.2% |
| Belgian | 29 | 0.0% |
| Belizean | 29 | 0.0% |
| Bhutanese | 117 | 0.1% |
| Blackfeet | 2 | 0.0% |
| Bolivian | 358 | 0.4% |
| British | 440 | 0.5% |
| Bulgarian | 77 | 0.1% |
| Burmese | 90 | 0.1% |
| Cambodian | 12 | 0.0% |
| Canadian | 107 | 0.1% |
| Celtic | 2 | 0.0% |
| Central American | 3,191 | 3.5% |
| Central American Indian | 106 | 0.1% |
| Cherokee | 101 | 0.1% |
| Chilean | 8 | 0.0% |
| Choctaw | 6 | 0.0% |
| Colombian | 44 | 0.1% |
| Costa Rican | 31 | 0.0% |
| Cree | 4 | 0.0% |
| Croatian | 36 | 0.0% |
| Cuban | 19 | 0.0% |
| Czech | 105 | 0.1% |
| Czechoslovakian | 87 | 0.1% |
| Danish | 82 | 0.1% |
| Dominican | 48 | 0.1% |
| Dutch | 1,004 | 1.1% |
| Dutch West Indian | 35 | 0.0% |
| Eastern European | 202 | 0.2% |
| Ecuadorian | 27 | 0.0% |
| Egyptian | 20 | 0.0% |
| English | 11,233 | 12.2% |
| Ethiopian | 16 | 0.0% |
| European | 2,080 | 2.3% |
| Fijian | 14 | 0.0% |
| Finnish | 56 | 0.1% |
| French | 2,018 | 2.2% |
| French Canadian | 734 | 0.8% |
| German | 15,654 | 17.0% |
| Ghanaian | 10 | 0.0% |
| Greek | 291 | 0.3% |
| Guamanian / Chamorro | 92 | 0.1% |
| Guatemalan | 62 | 0.1% |
| Honduran | 801 | 0.9% |
| Hungarian | 276 | 0.3% |
| Icelander | 15 | 0.0% |
| Indian (Asian) | 257 | 0.3% |
| Iranian | 12 | 0.0% |
| Iraqi | 2 | 0.0% |
| Irish | 12,063 | 13.1% |
| Iroquois | 19 | 0.0% |
| Israeli | 15 | 0.0% |
| Italian | 5,078 | 5.5% |
| Jamaican | 153 | 0.2% |
| Japanese | 168 | 0.2% |
| Jordanian | 7 | 0.0% |
| Kenyan | 12 | 0.0% |
| Korean | 769 | 0.8% |
| Lebanese | 32 | 0.0% |
| Lithuanian | 91 | 0.1% |
| Lumbee | 21 | 0.0% |
| Mexican | 3,976 | 4.3% |
| Mexican American Indian | 334 | 0.4% |
| Native Hawaiian | 90 | 0.1% |
| Navajo | 36 | 0.0% |
| Nicaraguan | 19 | 0.0% |
| Nigerian | 210 | 0.2% |
| Northern European | 193 | 0.2% |
| Norwegian | 492 | 0.5% |
| Pakistani | 228 | 0.3% |
| Pennsylvania German | 15 | 0.0% |
| Peruvian | 92 | 0.1% |
| Polish | 2,032 | 2.2% |
| Portuguese | 49 | 0.1% |
| Puerto Rican | 836 | 0.9% |
| Romanian | 10 | 0.0% |
| Russian | 324 | 0.4% |
| Salvadoran | 2,278 | 2.5% |
| Samoan | 42 | 0.1% |
| Scandinavian | 169 | 0.2% |
| Scotch-Irish | 1,244 | 1.3% |
| Scottish | 1,518 | 1.7% |
| Serbian | 9 | 0.0% |
| Sioux | 22 | 0.0% |
| Slavic | 74 | 0.1% |
| Slovak | 77 | 0.1% |
| Slovene | 16 | 0.0% |
| South American | 734 | 0.8% |
| South American Indian | 150 | 0.2% |
| Spaniard | 149 | 0.2% |
| Spanish | 26 | 0.0% |
| Sri Lankan | 232 | 0.3% |
| Subsaharan African | 413 | 0.4% |
| Swedish | 496 | 0.5% |
| Swiss | 293 | 0.3% |
| Thai | 473 | 0.5% |
| Trinidadian and Tobagonian | 65 | 0.1% |
| Turkish | 17 | 0.0% |
| Ukrainian | 50 | 0.1% |
| Venezuelan | 101 | 0.1% |
| Welsh | 614 | 0.7% |
| West Indian | 14 | 0.0% |
| Yugoslavian | 9 | 0.0% |
| Zimbabwean | 3 | 0.0% | View All 110 Rows |
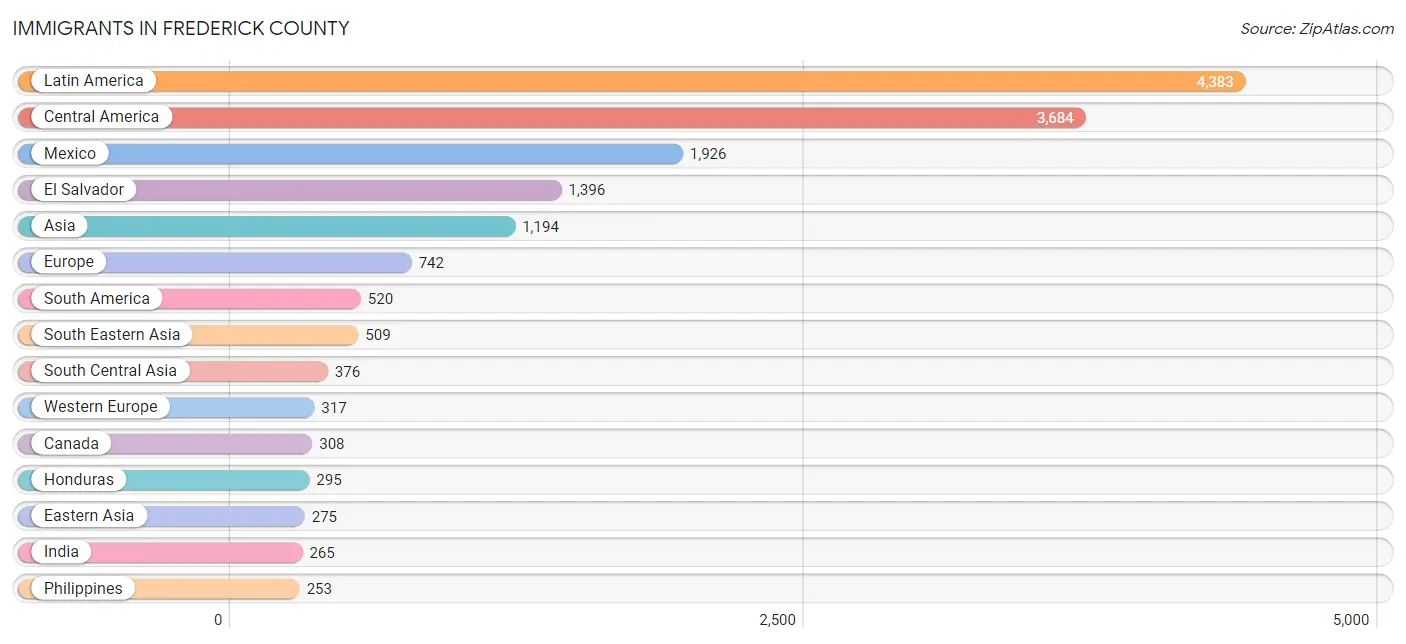
Immigrants in Frederick County
The most numerous immigrant groups reported in Frederick County came from Latin America (4,383 | 4.8%), Central America (3,684 | 4.0%), Mexico (1,926 | 2.1%), El Salvador (1,396 | 1.5%), and Asia (1,194 | 1.3%), together accounting for 13.7% of all Frederick County residents.
| Immigration Origin | # Population | % Population |
| Africa | 216 | 0.2% |
| Asia | 1,194 | 1.3% |
| Belgium | 76 | 0.1% |
| Bolivia | 231 | 0.3% |
| Brazil | 8 | 0.0% |
| Bulgaria | 27 | 0.0% |
| Cambodia | 52 | 0.1% |
| Canada | 308 | 0.3% |
| Caribbean | 179 | 0.2% |
| Central America | 3,684 | 4.0% |
| China | 150 | 0.2% |
| Colombia | 44 | 0.1% |
| Congo | 2 | 0.0% |
| Costa Rica | 12 | 0.0% |
| Dominican Republic | 32 | 0.0% |
| Eastern Africa | 60 | 0.1% |
| Eastern Asia | 275 | 0.3% |
| Eastern Europe | 108 | 0.1% |
| Ecuador | 124 | 0.1% |
| Egypt | 39 | 0.0% |
| El Salvador | 1,396 | 1.5% |
| England | 84 | 0.1% |
| Ethiopia | 16 | 0.0% |
| Europe | 742 | 0.8% |
| France | 22 | 0.0% |
| Germany | 160 | 0.2% |
| Ghana | 23 | 0.0% |
| Greece | 10 | 0.0% |
| Guatemala | 8 | 0.0% |
| Haiti | 12 | 0.0% |
| Honduras | 295 | 0.3% |
| India | 265 | 0.3% |
| Iran | 12 | 0.0% |
| Ireland | 19 | 0.0% |
| Italy | 20 | 0.0% |
| Jamaica | 100 | 0.1% |
| Japan | 89 | 0.1% |
| Kazakhstan | 17 | 0.0% |
| Kenya | 40 | 0.0% |
| Korea | 24 | 0.0% |
| Latin America | 4,383 | 4.8% |
| Mexico | 1,926 | 2.1% |
| Middle Africa | 2 | 0.0% |
| Nepal | 68 | 0.1% |
| Netherlands | 59 | 0.1% |
| Nicaragua | 21 | 0.0% |
| Nigeria | 63 | 0.1% |
| Northern Africa | 39 | 0.0% |
| Northern Europe | 229 | 0.3% |
| Norway | 7 | 0.0% |
| Oceania | 20 | 0.0% |
| Pakistan | 14 | 0.0% |
| Panama | 26 | 0.0% |
| Peru | 73 | 0.1% |
| Philippines | 253 | 0.3% |
| Poland | 43 | 0.1% |
| Portugal | 18 | 0.0% |
| Romania | 5 | 0.0% |
| Russia | 26 | 0.0% |
| South America | 520 | 0.6% |
| South Central Asia | 376 | 0.4% |
| South Eastern Asia | 509 | 0.5% |
| Southern Europe | 88 | 0.1% |
| Spain | 40 | 0.0% |
| Sweden | 12 | 0.0% |
| Taiwan | 10 | 0.0% |
| Thailand | 141 | 0.2% |
| Trinidad and Tobago | 21 | 0.0% |
| Turkey | 17 | 0.0% |
| Ukraine | 7 | 0.0% |
| Venezuela | 40 | 0.0% |
| Vietnam | 63 | 0.1% |
| Western Africa | 86 | 0.1% |
| Western Asia | 17 | 0.0% |
| Western Europe | 317 | 0.3% |
| Zimbabwe | 3 | 0.0% | View All 76 Rows |
Sex and Age in Frederick County
Sex and Age in Frederick County
The most populous age groups in Frederick County are 15 to 19 Years (3,269 | 7.1%) for men and 60 to 64 Years (3,570 | 7.8%) for women.
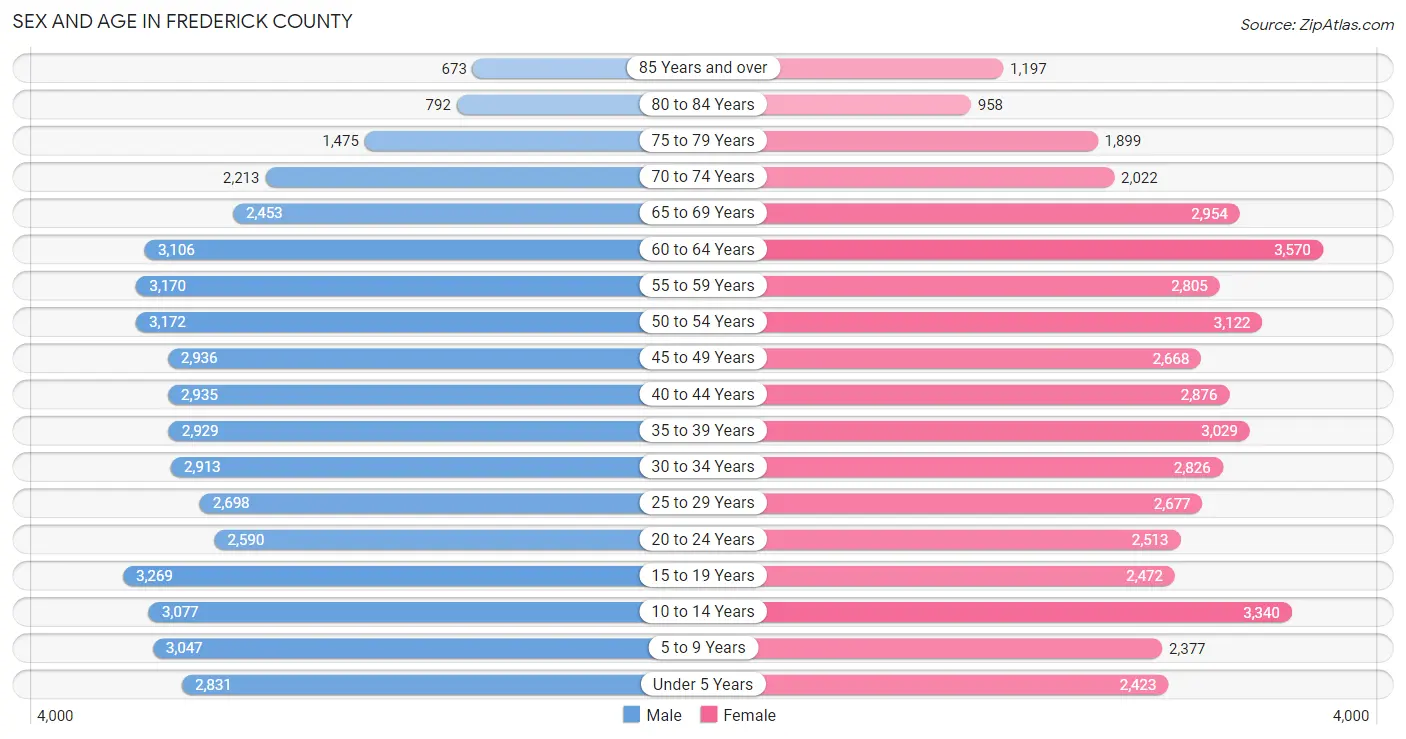
| Age Bracket | Male | Female |
| Under 5 Years | 2,831 (6.1%) | 2,423 (5.3%) |
| 5 to 9 Years | 3,047 (6.6%) | 2,377 (5.2%) |
| 10 to 14 Years | 3,077 (6.7%) | 3,340 (7.3%) |
| 15 to 19 Years | 3,269 (7.1%) | 2,472 (5.4%) |
| 20 to 24 Years | 2,590 (5.6%) | 2,513 (5.5%) |
| 25 to 29 Years | 2,698 (5.8%) | 2,677 (5.9%) |
| 30 to 34 Years | 2,913 (6.3%) | 2,826 (6.2%) |
| 35 to 39 Years | 2,929 (6.3%) | 3,029 (6.6%) |
| 40 to 44 Years | 2,935 (6.3%) | 2,876 (6.3%) |
| 45 to 49 Years | 2,936 (6.3%) | 2,668 (5.8%) |
| 50 to 54 Years | 3,172 (6.9%) | 3,122 (6.8%) |
| 55 to 59 Years | 3,170 (6.9%) | 2,805 (6.1%) |
| 60 to 64 Years | 3,106 (6.7%) | 3,570 (7.8%) |
| 65 to 69 Years | 2,453 (5.3%) | 2,954 (6.5%) |
| 70 to 74 Years | 2,213 (4.8%) | 2,022 (4.4%) |
| 75 to 79 Years | 1,475 (3.2%) | 1,899 (4.2%) |
| 80 to 84 Years | 792 (1.7%) | 958 (2.1%) |
| 85 Years and over | 673 (1.5%) | 1,197 (2.6%) |
| Total | 46,279 (100.0%) | 45,728 (100.0%) |
Families and Households in Frederick County
Median Family Size in Frederick County
The median family size in Frederick County is 3.15 persons per family, with single female/mother families (3,516 | 14.5%) accounting for the largest median family size of 3.38 persons per family. On the other hand, single male/father families (1,583 | 6.5%) represent the smallest median family size with 3.02 persons per family.
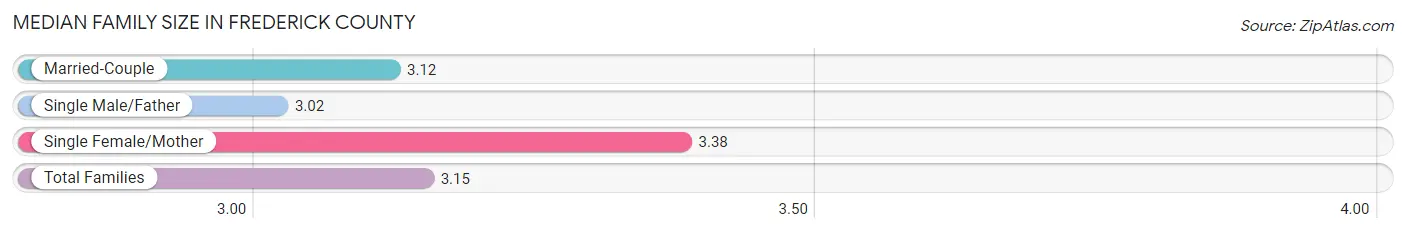
| Family Type | # Families | Family Size |
| Married-Couple | 19,192 (79.0%) | 3.12 |
| Single Male/Father | 1,583 (6.5%) | 3.02 |
| Single Female/Mother | 3,516 (14.5%) | 3.38 |
| Total Families | 24,291 (100.0%) | 3.15 |
Median Household Size in Frederick County
The median household size in Frederick County is 2.70 persons per household, with single female/mother households (3,516 | 10.5%) accounting for the largest median household size of 3.62 persons per household. non-family households (9,243 | 27.6%) represent the smallest median household size with 1.25 persons per household.
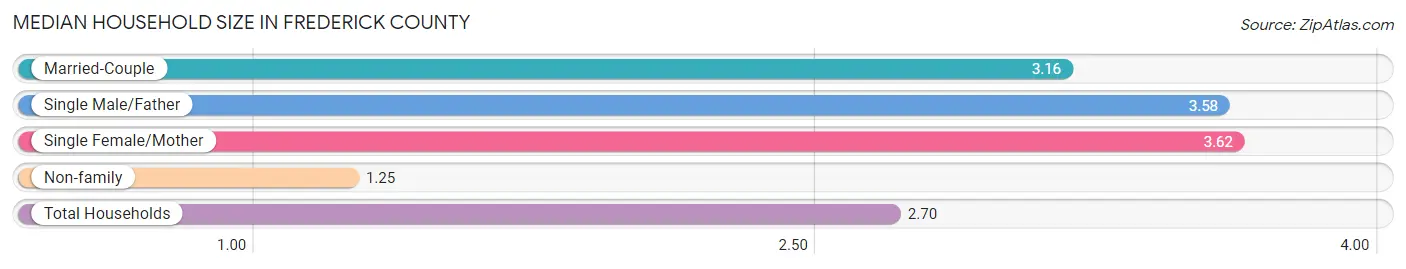
| Household Type | # Households | Household Size |
| Married-Couple | 19,192 (57.2%) | 3.16 |
| Single Male/Father | 1,583 (4.7%) | 3.58 |
| Single Female/Mother | 3,516 (10.5%) | 3.62 |
| Non-family | 9,243 (27.6%) | 1.25 |
| Total Households | 33,534 (100.0%) | 2.70 |
Household Size by Marriage Status in Frederick County
Out of a total of 33,534 households in Frederick County, 24,291 (72.4%) are family households, while 9,243 (27.6%) are nonfamily households. The most numerous type of family households are 2-person households, comprising 11,723, and the most common type of nonfamily households are 1-person households, comprising 7,499.
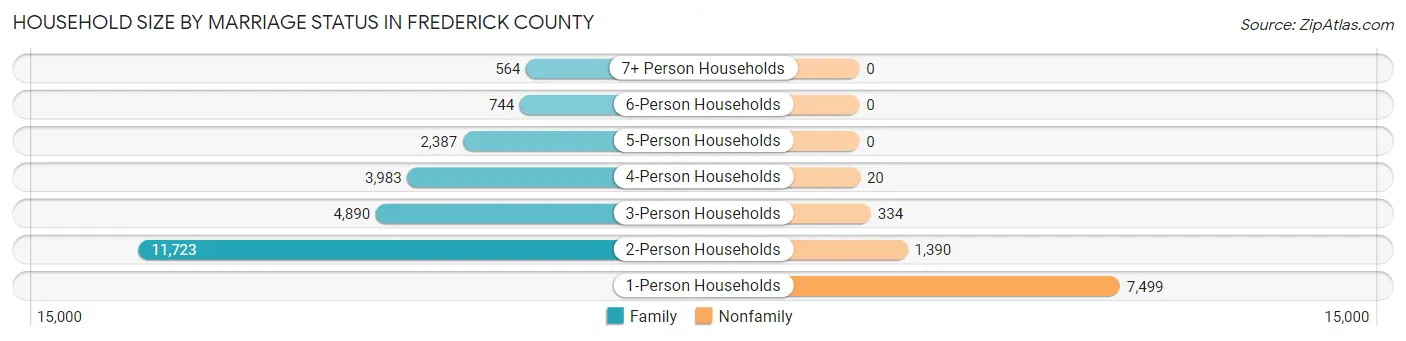
| Household Size | Family Households | Nonfamily Households |
| 1-Person Households | - | 7,499 (22.4%) |
| 2-Person Households | 11,723 (35.0%) | 1,390 (4.2%) |
| 3-Person Households | 4,890 (14.6%) | 334 (1.0%) |
| 4-Person Households | 3,983 (11.9%) | 20 (0.1%) |
| 5-Person Households | 2,387 (7.1%) | 0 (0.0%) |
| 6-Person Households | 744 (2.2%) | 0 (0.0%) |
| 7+ Person Households | 564 (1.7%) | 0 (0.0%) |
| Total | 24,291 (72.4%) | 9,243 (27.6%) |
Female Fertility in Frederick County
Fertility by Age in Frederick County
Average fertility rate in Frederick County is 50.0 births per 1,000 women. Women in the age bracket of 20 to 34 years have the highest fertility rate with 93.0 births per 1,000 women. Women in the age bracket of 20 to 34 years acount for 75.0% of all women with births.
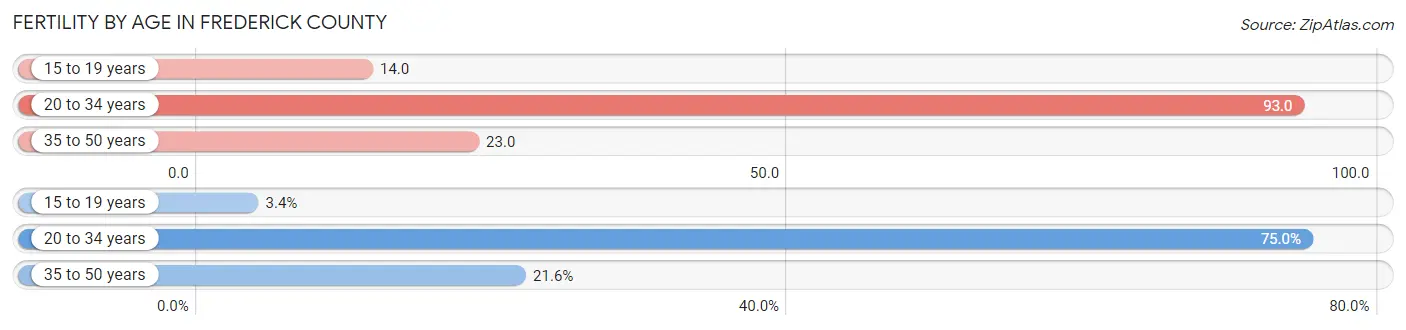
| Age Bracket | Women with Births | Births / 1,000 Women |
| 15 to 19 years | 34 (3.4%) | 14.0 |
| 20 to 34 years | 743 (75.0%) | 93.0 |
| 35 to 50 years | 214 (21.6%) | 23.0 |
| Total | 991 (100.0%) | 50.0 |
Fertility by Age by Marriage Status in Frederick County
63.7% of women with births (991) in Frederick County are married. The highest percentage of unmarried women with births falls into 15 to 19 years age bracket with 100.0% of them unmarried at the time of birth, while the lowest percentage of unmarried women with births belong to 35 to 50 years age bracket with 31.3% of them unmarried.
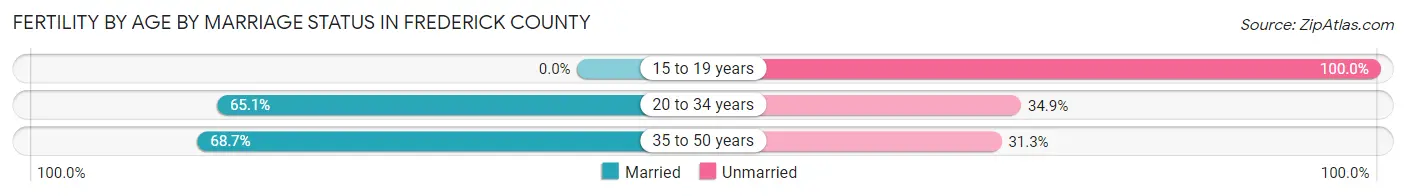
| Age Bracket | Married | Unmarried |
| 15 to 19 years | 0 (0.0%) | 34 (100.0%) |
| 20 to 34 years | 484 (65.1%) | 259 (34.9%) |
| 35 to 50 years | 147 (68.7%) | 67 (31.3%) |
| Total | 631 (63.7%) | 360 (36.3%) |
Fertility by Education in Frederick County
Average fertility rate in Frederick County is 50.0 births per 1,000 women. Women with the education attainment of bachelor's degree have the highest fertility rate of 70.0 births per 1,000 women, while women with the education attainment of less than high school have the lowest fertility at 11.0 births per 1,000 women. Women with the education attainment of high school diploma represent 30.3% of all women with births.
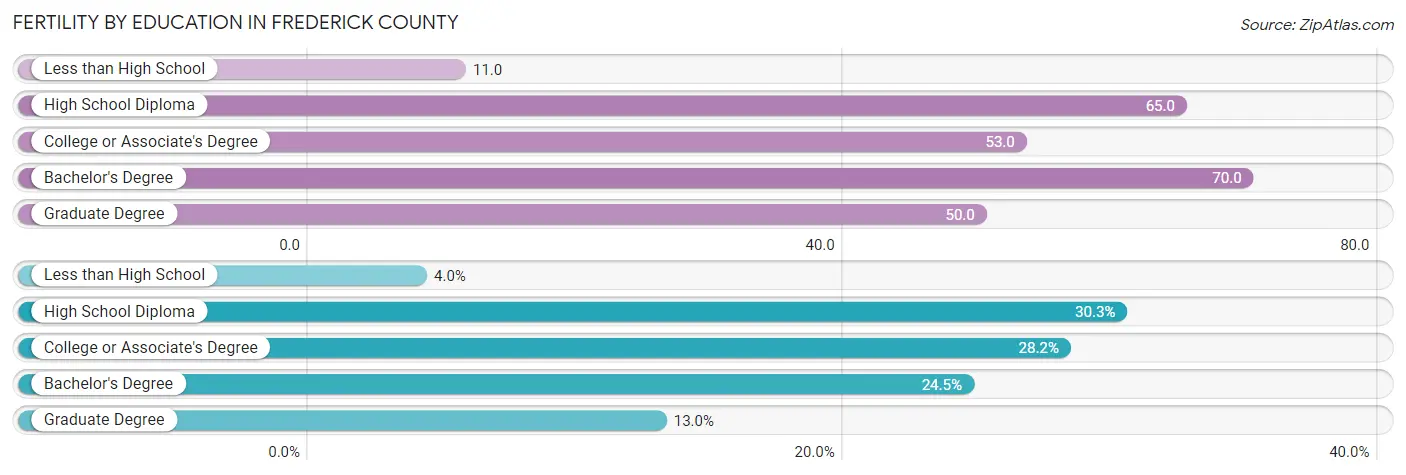
| Educational Attainment | Women with Births | Births / 1,000 Women |
| Less than High School | 40 (4.0%) | 11.0 |
| High School Diploma | 300 (30.3%) | 65.0 |
| College or Associate's Degree | 279 (28.1%) | 53.0 |
| Bachelor's Degree | 243 (24.5%) | 70.0 |
| Graduate Degree | 129 (13.0%) | 50.0 |
| Total | 991 (100.0%) | 50.0 |
Fertility by Education by Marriage Status in Frederick County
36.3% of women with births in Frederick County are unmarried. Women with the educational attainment of less than high school are most likely to be married with 100.0% of them married at childbirth, while women with the educational attainment of high school diploma are least likely to be married with 72.0% of them unmarried at childbirth.
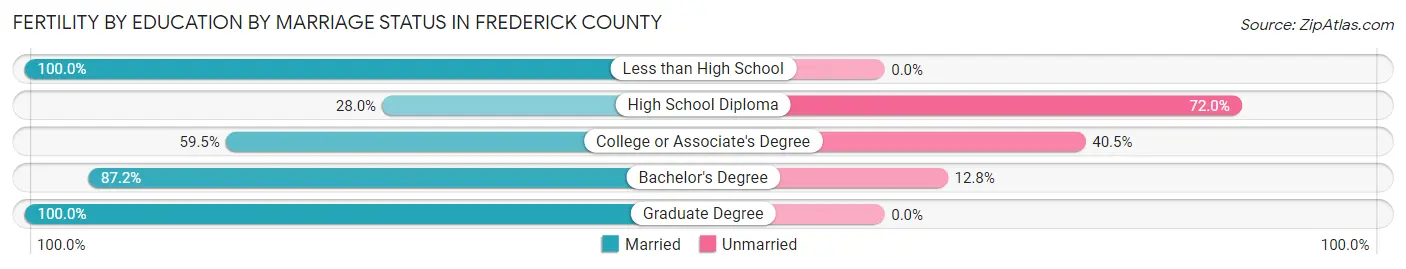
| Educational Attainment | Married | Unmarried |
| Less than High School | 40 (100.0%) | 0 (0.0%) |
| High School Diploma | 84 (28.0%) | 216 (72.0%) |
| College or Associate's Degree | 166 (59.5%) | 113 (40.5%) |
| Bachelor's Degree | 212 (87.2%) | 31 (12.8%) |
| Graduate Degree | 129 (100.0%) | 0 (0.0%) |
| Total | 631 (63.7%) | 360 (36.3%) |
Employment Characteristics in Frederick County
Employment by Class of Employer in Frederick County
Among the 44,501 employed individuals in Frederick County, private company employees (29,280 | 65.8%), local government employees (3,874 | 8.7%), and not-for-profit organizations (3,546 | 8.0%) make up the most common classes of employment.
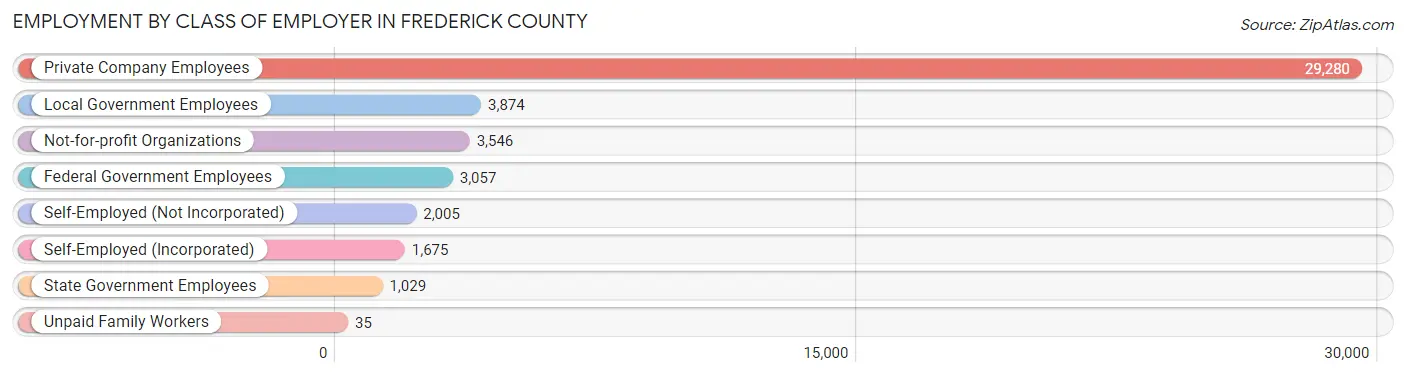
| Employer Class | # Employees | % Employees |
| Private Company Employees | 29,280 | 65.8% |
| Self-Employed (Incorporated) | 1,675 | 3.8% |
| Self-Employed (Not Incorporated) | 2,005 | 4.5% |
| Not-for-profit Organizations | 3,546 | 8.0% |
| Local Government Employees | 3,874 | 8.7% |
| State Government Employees | 1,029 | 2.3% |
| Federal Government Employees | 3,057 | 6.9% |
| Unpaid Family Workers | 35 | 0.1% |
| Total | 44,501 | 100.0% |
Employment Status by Age in Frederick County
According to the labor force statistics for Frederick County, out of the total population over 16 years of age (73,630), 64.1% or 47,197 individuals are in the labor force, with 4.2% or 1,982 of them unemployed. The age group with the highest labor force participation rate is 45 to 54 years, with 87.4% or 10,399 individuals in the labor force. Within the labor force, the 20 to 24 years age range has the highest percentage of unemployed individuals, with 7.3% or 301 of them being unemployed.
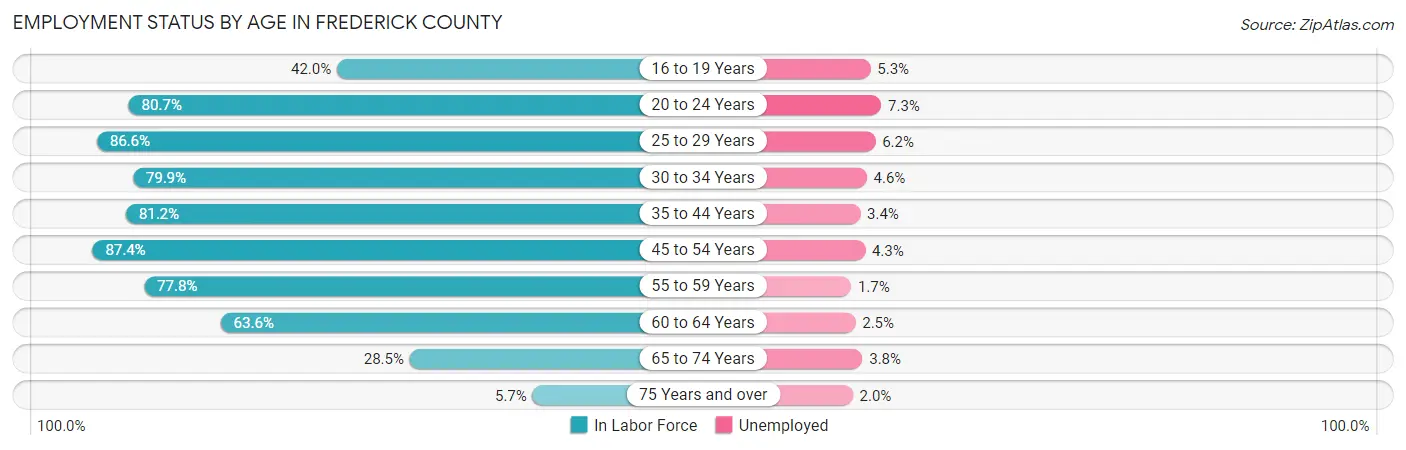
| Age Bracket | In Labor Force | Unemployed |
| 16 to 19 Years | 1,873 (42.0%) | 99 (5.3%) |
| 20 to 24 Years | 4,118 (80.7%) | 301 (7.3%) |
| 25 to 29 Years | 4,655 (86.6%) | 289 (6.2%) |
| 30 to 34 Years | 4,585 (79.9%) | 211 (4.6%) |
| 35 to 44 Years | 9,556 (81.2%) | 325 (3.4%) |
| 45 to 54 Years | 10,399 (87.4%) | 447 (4.3%) |
| 55 to 59 Years | 4,649 (77.8%) | 79 (1.7%) |
| 60 to 64 Years | 4,246 (63.6%) | 106 (2.5%) |
| 65 to 74 Years | 2,748 (28.5%) | 104 (3.8%) |
| 75 Years and over | 399 (5.7%) | 8 (2.0%) |
| Total | 47,197 (64.1%) | 1,982 (4.2%) |
Employment Status by Educational Attainment in Frederick County
According to labor force statistics for Frederick County, 80.3% of individuals (38,088) out of the total population between 25 and 64 years of age (47,432) are in the labor force, with 3.8% or 1,447 of them being unemployed. The group with the highest labor force participation rate are those with the educational attainment of bachelor's degree or higher, with 88.4% or 12,348 individuals in the labor force. Within the labor force, individuals with less than high school education have the highest percentage of unemployment, with 11.2% or 374 of them being unemployed.
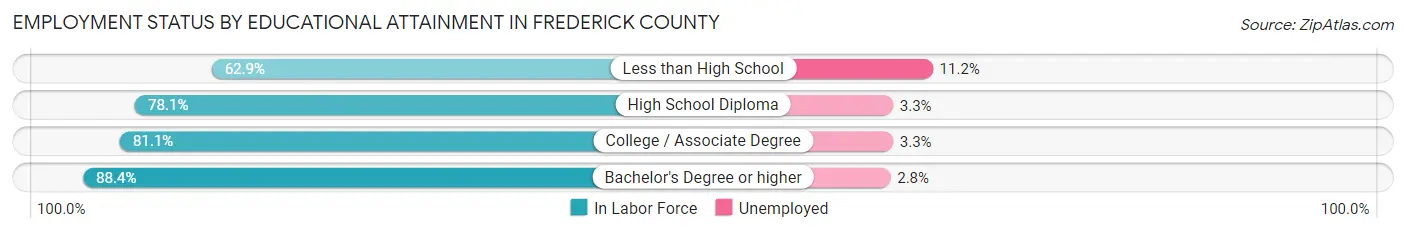
| Educational Attainment | In Labor Force | Unemployed |
| Less than High School | 3,343 (62.9%) | 595 (11.2%) |
| High School Diploma | 11,298 (78.1%) | 477 (3.3%) |
| College / Associate Degree | 11,097 (81.1%) | 452 (3.3%) |
| Bachelor's Degree or higher | 12,348 (88.4%) | 391 (2.8%) |
| Total | 38,088 (80.3%) | 1,802 (3.8%) |
Employment Occupations by Sex in Frederick County
Management, Business, Science and Arts Occupations
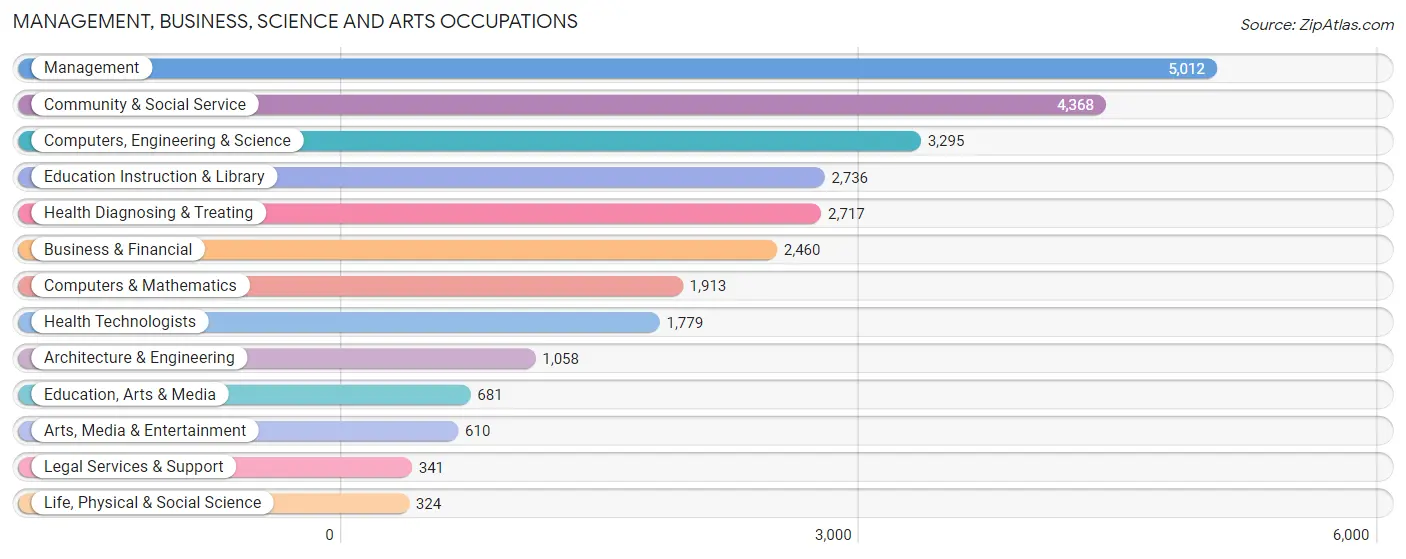
The most common Management, Business, Science and Arts occupations in Frederick County are Management (5,012 | 11.2%), Community & Social Service (4,368 | 9.7%), Computers, Engineering & Science (3,295 | 7.3%), Education Instruction & Library (2,736 | 6.1%), and Health Diagnosing & Treating (2,717 | 6.0%).
Management, Business, Science and Arts Occupations by Sex
Within the Management, Business, Science and Arts occupations in Frederick County, the most male-oriented occupations are Computers & Mathematics (80.0%), Architecture & Engineering (77.9%), and Computers, Engineering & Science (74.6%), while the most female-oriented occupations are Health Technologists (81.6%), Education Instruction & Library (78.7%), and Health Diagnosing & Treating (78.1%).
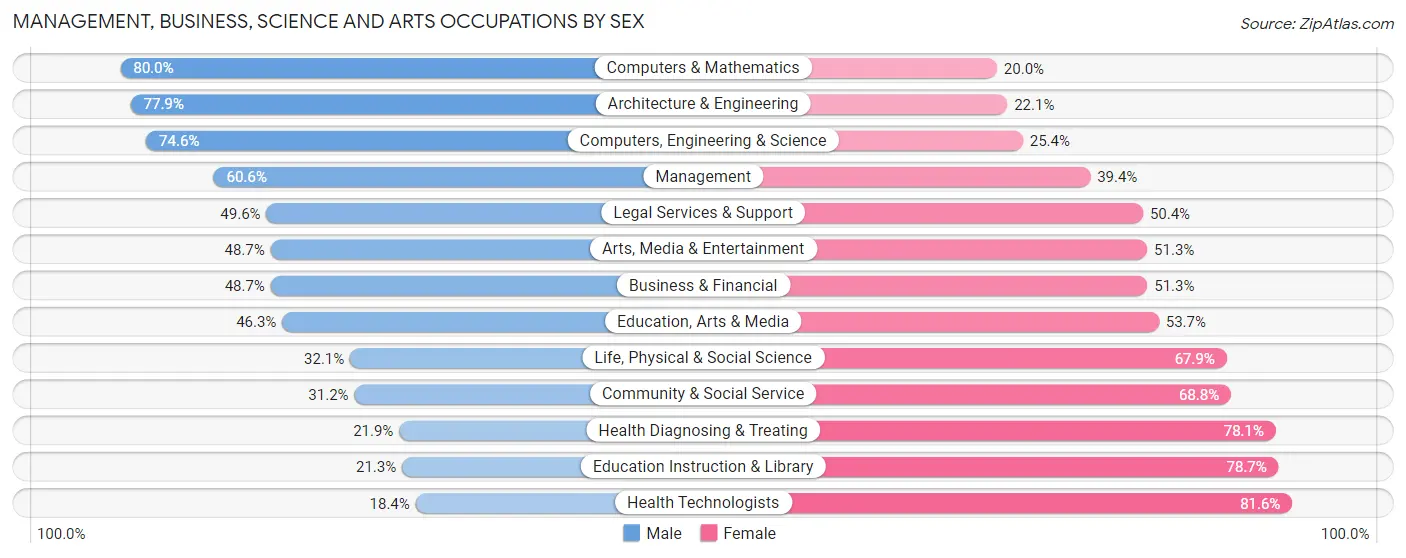
| Occupation | Male | Female |
| Management | 3,036 (60.6%) | 1,976 (39.4%) |
| Business & Financial | 1,197 (48.7%) | 1,263 (51.3%) |
| Computers, Engineering & Science | 2,459 (74.6%) | 836 (25.4%) |
| Computers & Mathematics | 1,531 (80.0%) | 382 (20.0%) |
| Architecture & Engineering | 824 (77.9%) | 234 (22.1%) |
| Life, Physical & Social Science | 104 (32.1%) | 220 (67.9%) |
| Community & Social Service | 1,363 (31.2%) | 3,005 (68.8%) |
| Education, Arts & Media | 315 (46.3%) | 366 (53.7%) |
| Legal Services & Support | 169 (49.6%) | 172 (50.4%) |
| Education Instruction & Library | 582 (21.3%) | 2,154 (78.7%) |
| Arts, Media & Entertainment | 297 (48.7%) | 313 (51.3%) |
| Health Diagnosing & Treating | 594 (21.9%) | 2,123 (78.1%) |
| Health Technologists | 328 (18.4%) | 1,451 (81.6%) |
| Total (Category) | 8,649 (48.4%) | 9,203 (51.5%) |
| Total (Overall) | 24,185 (53.9%) | 20,703 (46.1%) |
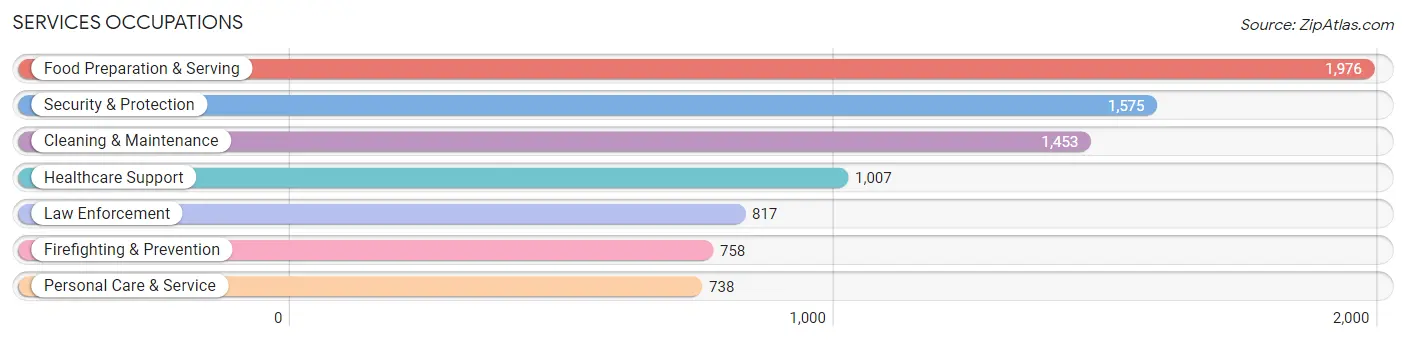
Services Occupations
The most common Services occupations in Frederick County are Food Preparation & Serving (1,976 | 4.4%), Security & Protection (1,575 | 3.5%), Cleaning & Maintenance (1,453 | 3.2%), Healthcare Support (1,007 | 2.2%), and Law Enforcement (817 | 1.8%).
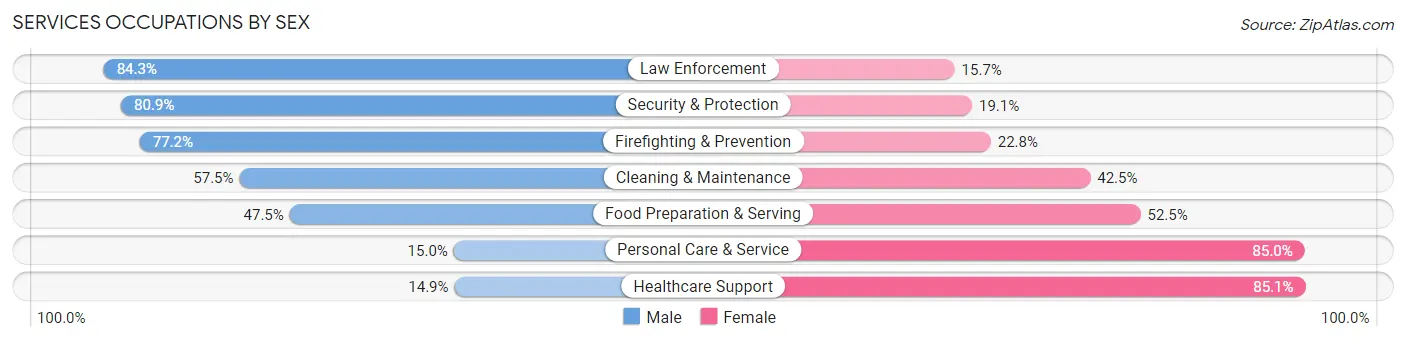
Services Occupations by Sex
Within the Services occupations in Frederick County, the most male-oriented occupations are Law Enforcement (84.3%), Security & Protection (80.9%), and Firefighting & Prevention (77.2%), while the most female-oriented occupations are Healthcare Support (85.1%), Personal Care & Service (85.0%), and Food Preparation & Serving (52.5%).
| Occupation | Male | Female |
| Healthcare Support | 150 (14.9%) | 857 (85.1%) |
| Security & Protection | 1,274 (80.9%) | 301 (19.1%) |
| Firefighting & Prevention | 585 (77.2%) | 173 (22.8%) |
| Law Enforcement | 689 (84.3%) | 128 (15.7%) |
| Food Preparation & Serving | 939 (47.5%) | 1,037 (52.5%) |
| Cleaning & Maintenance | 835 (57.5%) | 618 (42.5%) |
| Personal Care & Service | 111 (15.0%) | 627 (85.0%) |
| Total (Category) | 3,309 (49.0%) | 3,440 (51.0%) |
| Total (Overall) | 24,185 (53.9%) | 20,703 (46.1%) |
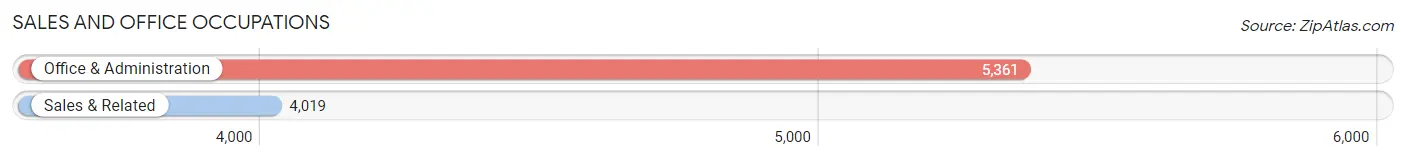
Sales and Office Occupations
The most common Sales and Office occupations in Frederick County are Office & Administration (5,361 | 11.9%), and Sales & Related (4,019 | 8.9%).
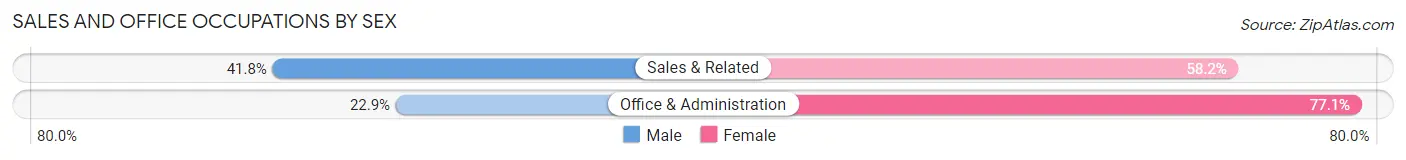
Sales and Office Occupations by Sex
| Occupation | Male | Female |
| Sales & Related | 1,681 (41.8%) | 2,338 (58.2%) |
| Office & Administration | 1,226 (22.9%) | 4,135 (77.1%) |
| Total (Category) | 2,907 (31.0%) | 6,473 (69.0%) |
| Total (Overall) | 24,185 (53.9%) | 20,703 (46.1%) |
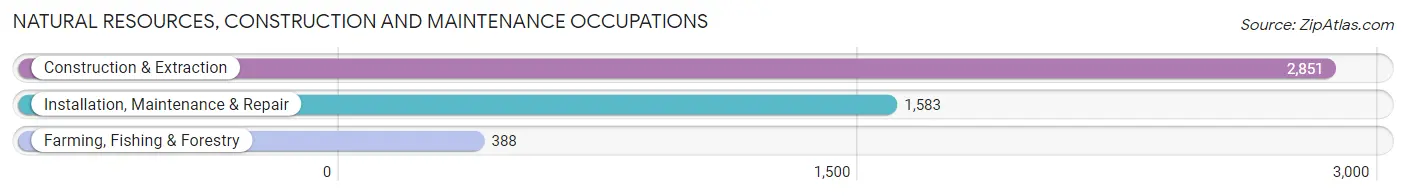
Natural Resources, Construction and Maintenance Occupations
The most common Natural Resources, Construction and Maintenance occupations in Frederick County are Construction & Extraction (2,851 | 6.4%), Installation, Maintenance & Repair (1,583 | 3.5%), and Farming, Fishing & Forestry (388 | 0.9%).
Natural Resources, Construction and Maintenance Occupations by Sex
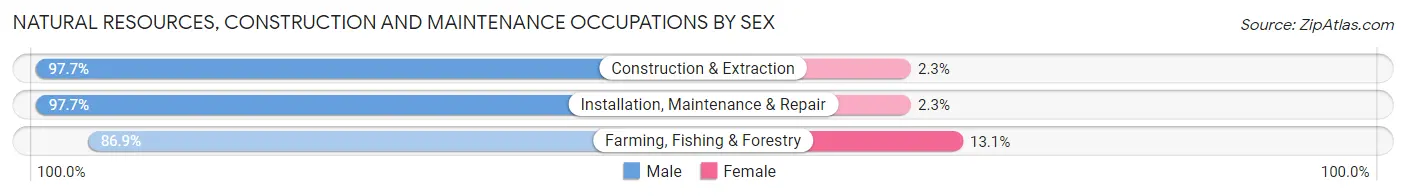
| Occupation | Male | Female |
| Farming, Fishing & Forestry | 337 (86.9%) | 51 (13.1%) |
| Construction & Extraction | 2,785 (97.7%) | 66 (2.3%) |
| Installation, Maintenance & Repair | 1,546 (97.7%) | 37 (2.3%) |
| Total (Category) | 4,668 (96.8%) | 154 (3.2%) |
| Total (Overall) | 24,185 (53.9%) | 20,703 (46.1%) |
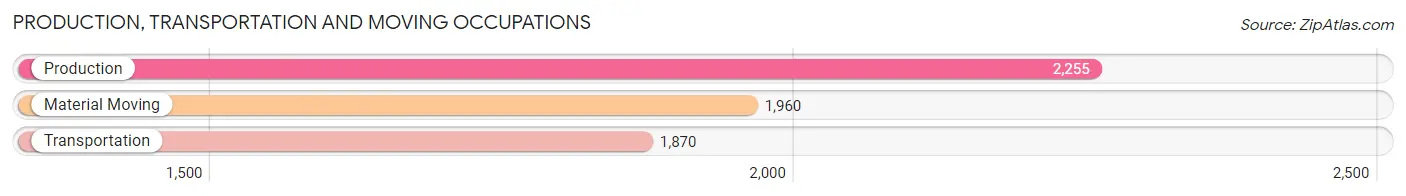
Production, Transportation and Moving Occupations
The most common Production, Transportation and Moving occupations in Frederick County are Production (2,255 | 5.0%), Material Moving (1,960 | 4.4%), and Transportation (1,870 | 4.2%).
Production, Transportation and Moving Occupations by Sex
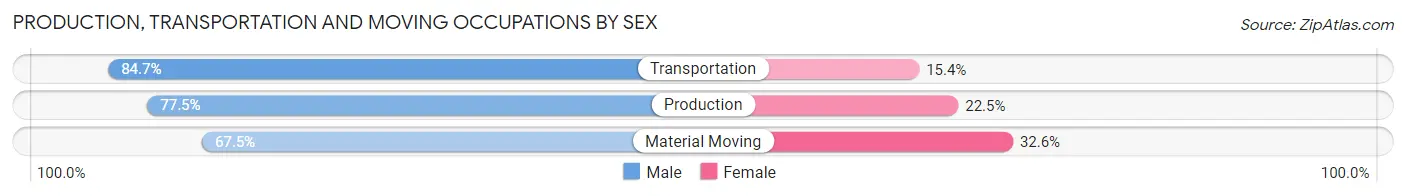
| Occupation | Male | Female |
| Production | 1,747 (77.5%) | 508 (22.5%) |
| Transportation | 1,583 (84.7%) | 287 (15.3%) |
| Material Moving | 1,322 (67.4%) | 638 (32.6%) |
| Total (Category) | 4,652 (76.4%) | 1,433 (23.5%) |
| Total (Overall) | 24,185 (53.9%) | 20,703 (46.1%) |
Employment Industries by Sex in Frederick County
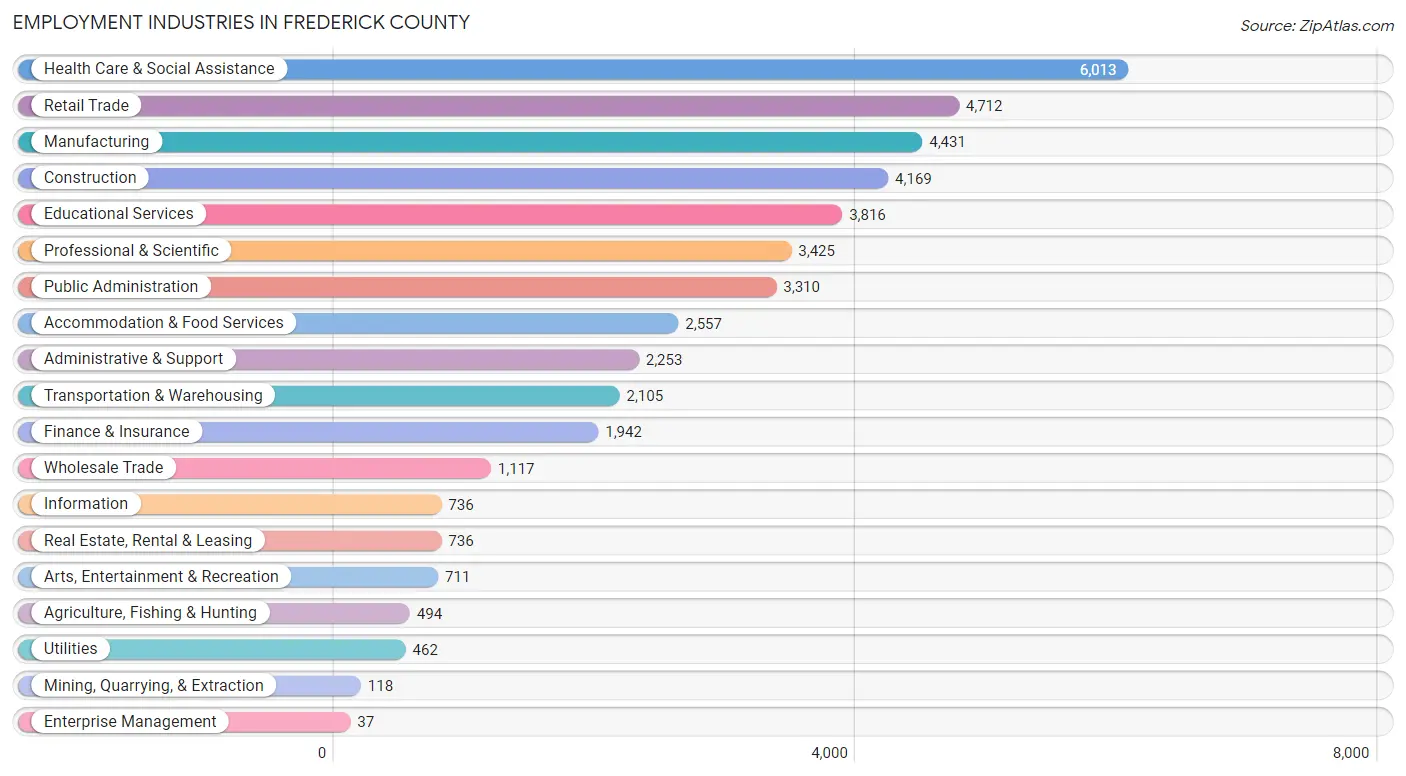
Employment Industries in Frederick County
The major employment industries in Frederick County include Health Care & Social Assistance (6,013 | 13.4%), Retail Trade (4,712 | 10.5%), Manufacturing (4,431 | 9.9%), Construction (4,169 | 9.3%), and Educational Services (3,816 | 8.5%).
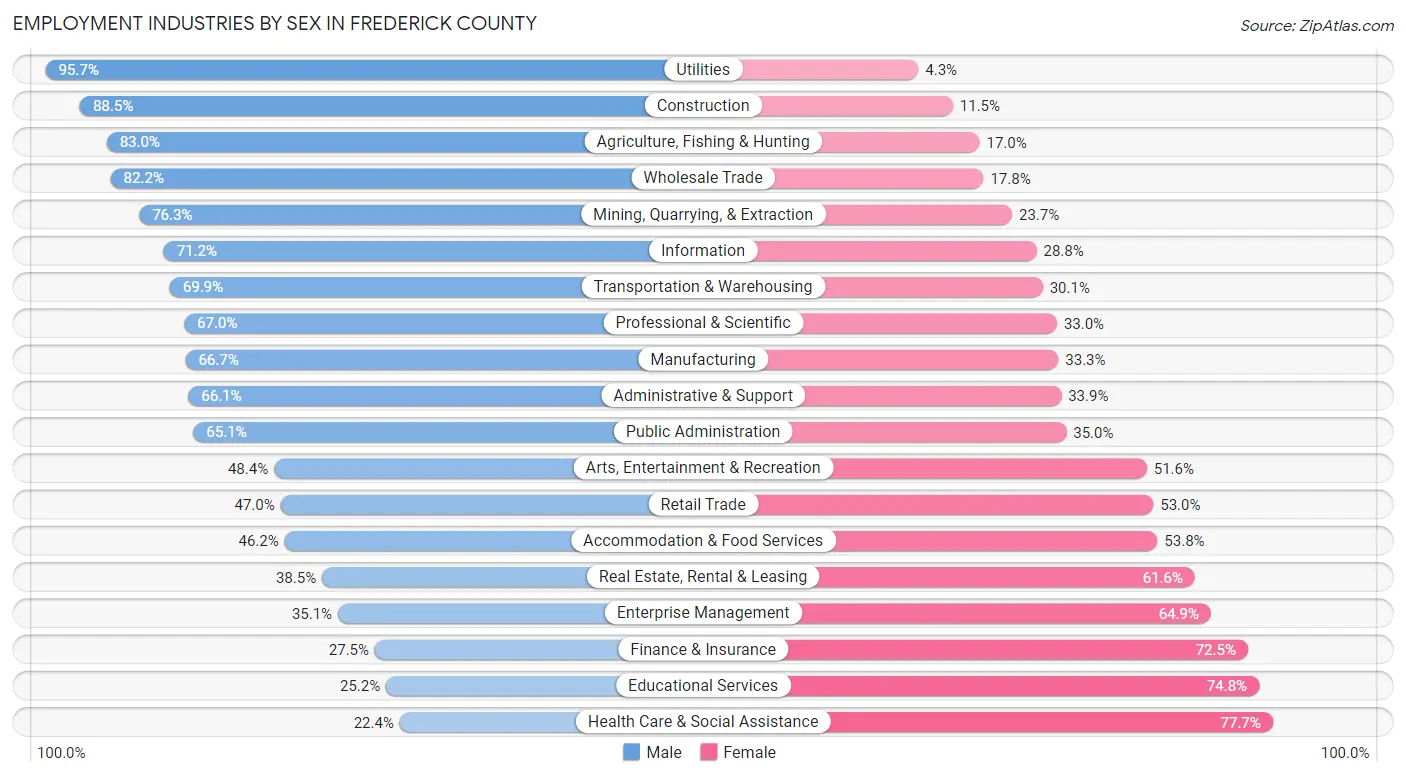
Employment Industries by Sex in Frederick County
The Frederick County industries that see more men than women are Utilities (95.7%), Construction (88.5%), and Agriculture, Fishing & Hunting (83.0%), whereas the industries that tend to have a higher number of women are Health Care & Social Assistance (77.6%), Educational Services (74.8%), and Finance & Insurance (72.5%).
| Industry | Male | Female |
| Agriculture, Fishing & Hunting | 410 (83.0%) | 84 (17.0%) |
| Mining, Quarrying, & Extraction | 90 (76.3%) | 28 (23.7%) |
| Construction | 3,691 (88.5%) | 478 (11.5%) |
| Manufacturing | 2,955 (66.7%) | 1,476 (33.3%) |
| Wholesale Trade | 918 (82.2%) | 199 (17.8%) |
| Retail Trade | 2,216 (47.0%) | 2,496 (53.0%) |
| Transportation & Warehousing | 1,472 (69.9%) | 633 (30.1%) |
| Utilities | 442 (95.7%) | 20 (4.3%) |
| Information | 524 (71.2%) | 212 (28.8%) |
| Finance & Insurance | 534 (27.5%) | 1,408 (72.5%) |
| Real Estate, Rental & Leasing | 283 (38.5%) | 453 (61.6%) |
| Professional & Scientific | 2,294 (67.0%) | 1,131 (33.0%) |
| Enterprise Management | 13 (35.1%) | 24 (64.9%) |
| Administrative & Support | 1,489 (66.1%) | 764 (33.9%) |
| Educational Services | 961 (25.2%) | 2,855 (74.8%) |
| Health Care & Social Assistance | 1,344 (22.4%) | 4,669 (77.6%) |
| Arts, Entertainment & Recreation | 344 (48.4%) | 367 (51.6%) |
| Accommodation & Food Services | 1,181 (46.2%) | 1,376 (53.8%) |
| Public Administration | 2,153 (65.0%) | 1,157 (34.9%) |
| Total | 24,185 (53.9%) | 20,703 (46.1%) |
Education in Frederick County
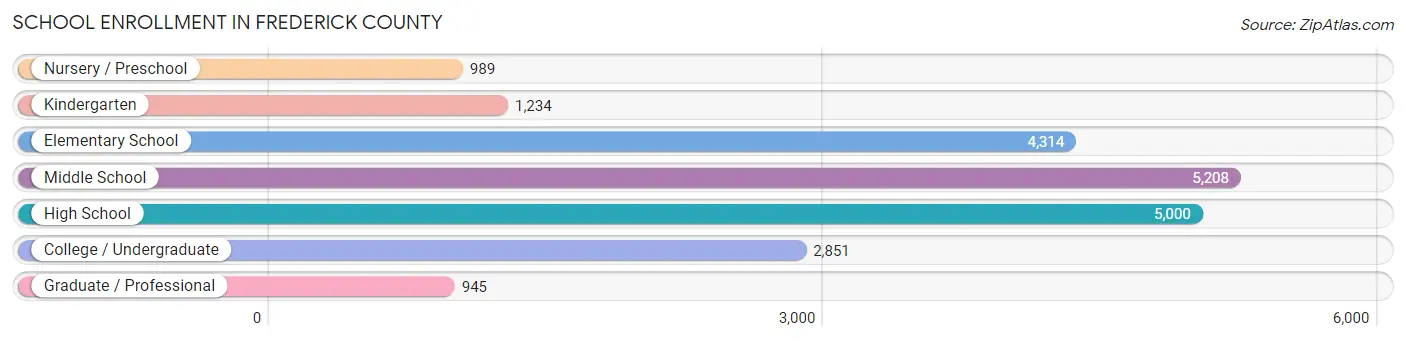
School Enrollment in Frederick County
The most common levels of schooling among the 20,541 students in Frederick County are middle school (5,208 | 25.4%), high school (5,000 | 24.3%), and elementary school (4,314 | 21.0%).
| School Level | # Students | % Students |
| Nursery / Preschool | 989 | 4.8% |
| Kindergarten | 1,234 | 6.0% |
| Elementary School | 4,314 | 21.0% |
| Middle School | 5,208 | 25.4% |
| High School | 5,000 | 24.3% |
| College / Undergraduate | 2,851 | 13.9% |
| Graduate / Professional | 945 | 4.6% |
| Total | 20,541 | 100.0% |
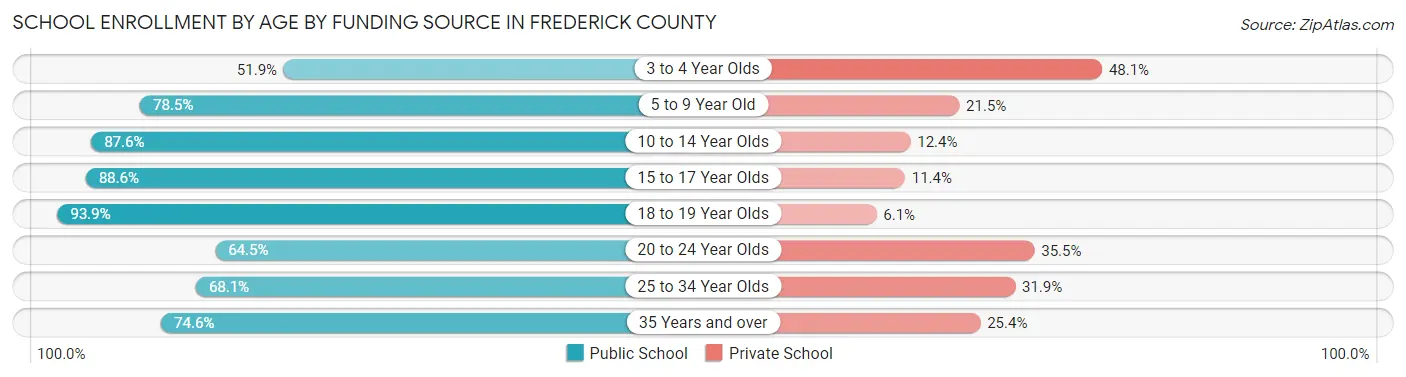
School Enrollment by Age by Funding Source in Frederick County
Out of a total of 20,541 students who are enrolled in schools in Frederick County, 3,862 (18.8%) attend a private institution, while the remaining 16,679 (81.2%) are enrolled in public schools. The age group of 3 to 4 year olds has the highest likelihood of being enrolled in private schools, with 421 (48.1% in the age bracket) enrolled. Conversely, the age group of 18 to 19 year olds has the lowest likelihood of being enrolled in a private school, with 1,079 (93.9% in the age bracket) attending a public institution.
| Age Bracket | Public School | Private School |
| 3 to 4 Year Olds | 454 (51.9%) | 421 (48.1%) |
| 5 to 9 Year Old | 4,031 (78.5%) | 1,105 (21.5%) |
| 10 to 14 Year Olds | 5,539 (87.6%) | 785 (12.4%) |
| 15 to 17 Year Olds | 3,297 (88.6%) | 424 (11.4%) |
| 18 to 19 Year Olds | 1,079 (93.9%) | 70 (6.1%) |
| 20 to 24 Year Olds | 977 (64.5%) | 538 (35.5%) |
| 25 to 34 Year Olds | 659 (68.1%) | 309 (31.9%) |
| 35 Years and over | 636 (74.6%) | 217 (25.4%) |
| Total | 16,679 (81.2%) | 3,862 (18.8%) |
Educational Attainment by Field of Study in Frederick County
Business (3,664 | 18.0%), education (2,852 | 14.1%), science & technology (2,059 | 10.1%), social sciences (1,637 | 8.1%), and arts & humanities (1,418 | 7.0%) are the most common fields of study among 20,301 individuals in Frederick County who have obtained a bachelor's degree or higher.
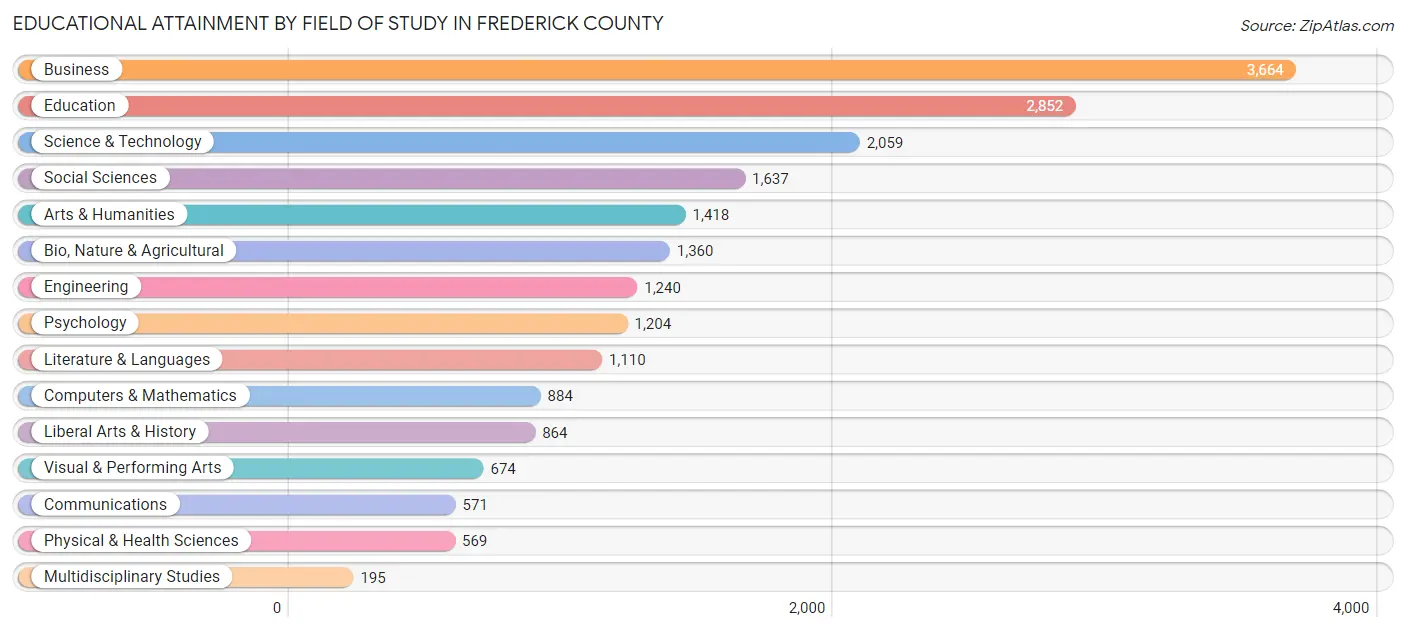
| Field of Study | # Graduates | % Graduates |
| Computers & Mathematics | 884 | 4.3% |
| Bio, Nature & Agricultural | 1,360 | 6.7% |
| Physical & Health Sciences | 569 | 2.8% |
| Psychology | 1,204 | 5.9% |
| Social Sciences | 1,637 | 8.1% |
| Engineering | 1,240 | 6.1% |
| Multidisciplinary Studies | 195 | 1.0% |
| Science & Technology | 2,059 | 10.1% |
| Business | 3,664 | 18.0% |
| Education | 2,852 | 14.1% |
| Literature & Languages | 1,110 | 5.5% |
| Liberal Arts & History | 864 | 4.3% |
| Visual & Performing Arts | 674 | 3.3% |
| Communications | 571 | 2.8% |
| Arts & Humanities | 1,418 | 7.0% |
| Total | 20,301 | 100.0% |
Transportation & Commute in Frederick County
Vehicle Availability by Sex in Frederick County
The most prevalent vehicle ownership categories in Frederick County are males with 2 vehicles (9,412, accounting for 39.1%) and females with 2 vehicles (8,034, making up 46.3%).
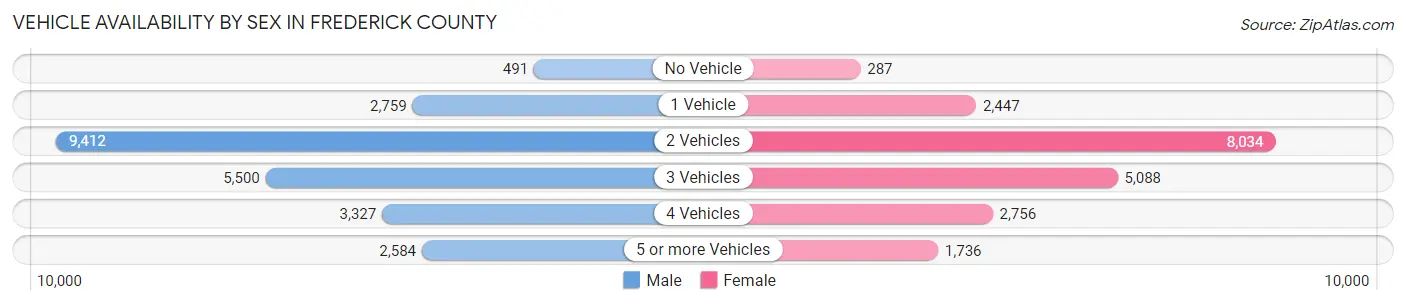
| Vehicles Available | Male | Female |
| No Vehicle | 491 (2.0%) | 287 (1.4%) |
| 1 Vehicle | 2,759 (11.5%) | 2,447 (12.0%) |
| 2 Vehicles | 9,412 (39.1%) | 8,034 (39.5%) |
| 3 Vehicles | 5,500 (22.9%) | 5,088 (25.0%) |
| 4 Vehicles | 3,327 (13.8%) | 2,756 (13.5%) |
| 5 or more Vehicles | 2,584 (10.7%) | 1,736 (8.5%) |
| Total | 24,073 (100.0%) | 20,348 (100.0%) |
Commute Time in Frederick County
The most frequently occuring commute durations in Frederick County are 15 to 19 minutes (8,176 commuters, 20.3%), 20 to 24 minutes (5,536 commuters, 13.7%), and 10 to 14 minutes (4,908 commuters, 12.2%).
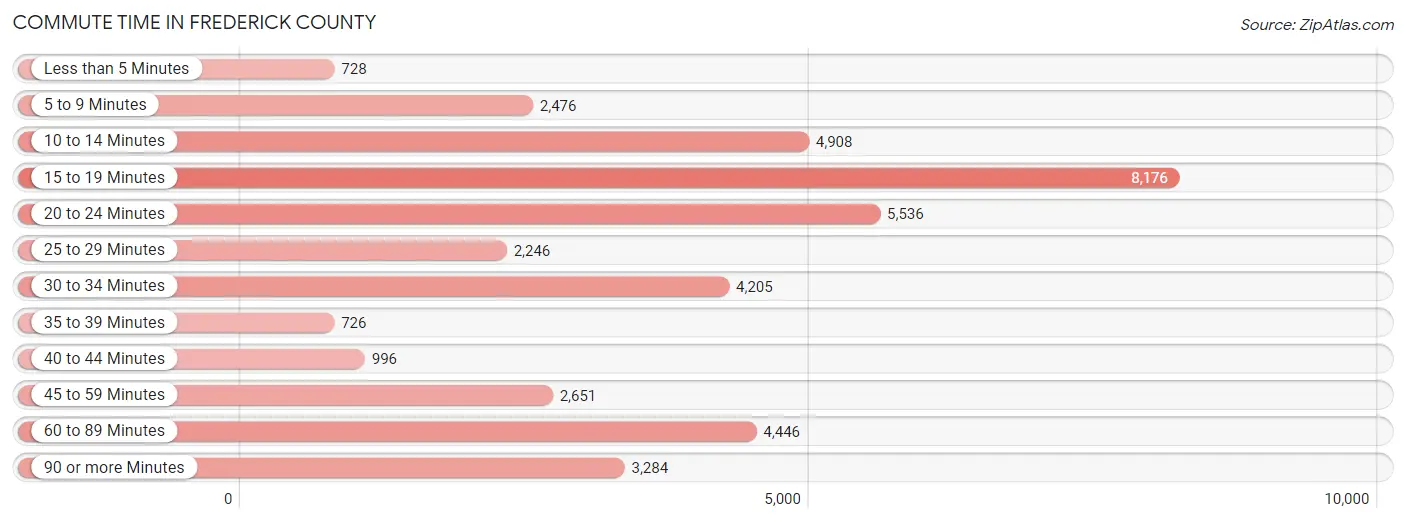
| Commute Time | # Commuters | % Commuters |
| Less than 5 Minutes | 728 | 1.8% |
| 5 to 9 Minutes | 2,476 | 6.1% |
| 10 to 14 Minutes | 4,908 | 12.2% |
| 15 to 19 Minutes | 8,176 | 20.3% |
| 20 to 24 Minutes | 5,536 | 13.7% |
| 25 to 29 Minutes | 2,246 | 5.6% |
| 30 to 34 Minutes | 4,205 | 10.4% |
| 35 to 39 Minutes | 726 | 1.8% |
| 40 to 44 Minutes | 996 | 2.5% |
| 45 to 59 Minutes | 2,651 | 6.6% |
| 60 to 89 Minutes | 4,446 | 11.0% |
| 90 or more Minutes | 3,284 | 8.1% |
Commute Time by Sex in Frederick County
The most common commute times in Frederick County are 15 to 19 minutes (3,882 commuters, 17.5%) for males and 15 to 19 minutes (4,294 commuters, 23.5%) for females.
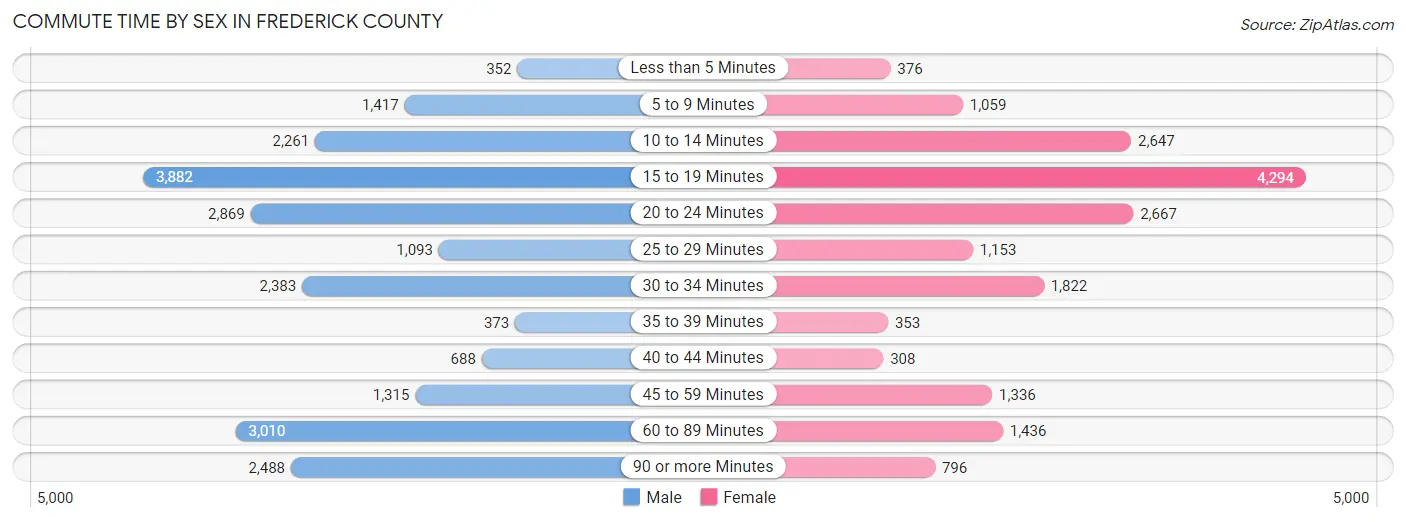
| Commute Time | Male | Female |
| Less than 5 Minutes | 352 (1.6%) | 376 (2.1%) |
| 5 to 9 Minutes | 1,417 (6.4%) | 1,059 (5.8%) |
| 10 to 14 Minutes | 2,261 (10.2%) | 2,647 (14.5%) |
| 15 to 19 Minutes | 3,882 (17.5%) | 4,294 (23.5%) |
| 20 to 24 Minutes | 2,869 (13.0%) | 2,667 (14.6%) |
| 25 to 29 Minutes | 1,093 (4.9%) | 1,153 (6.3%) |
| 30 to 34 Minutes | 2,383 (10.8%) | 1,822 (10.0%) |
| 35 to 39 Minutes | 373 (1.7%) | 353 (1.9%) |
| 40 to 44 Minutes | 688 (3.1%) | 308 (1.7%) |
| 45 to 59 Minutes | 1,315 (5.9%) | 1,336 (7.3%) |
| 60 to 89 Minutes | 3,010 (13.6%) | 1,436 (7.9%) |
| 90 or more Minutes | 2,488 (11.2%) | 796 (4.4%) |
Time of Departure to Work by Sex in Frederick County
The most frequent times of departure to work in Frederick County are 6:00 AM to 6:29 AM (2,845, 12.9%) for males and 7:30 AM to 7:59 AM (2,926, 16.0%) for females.
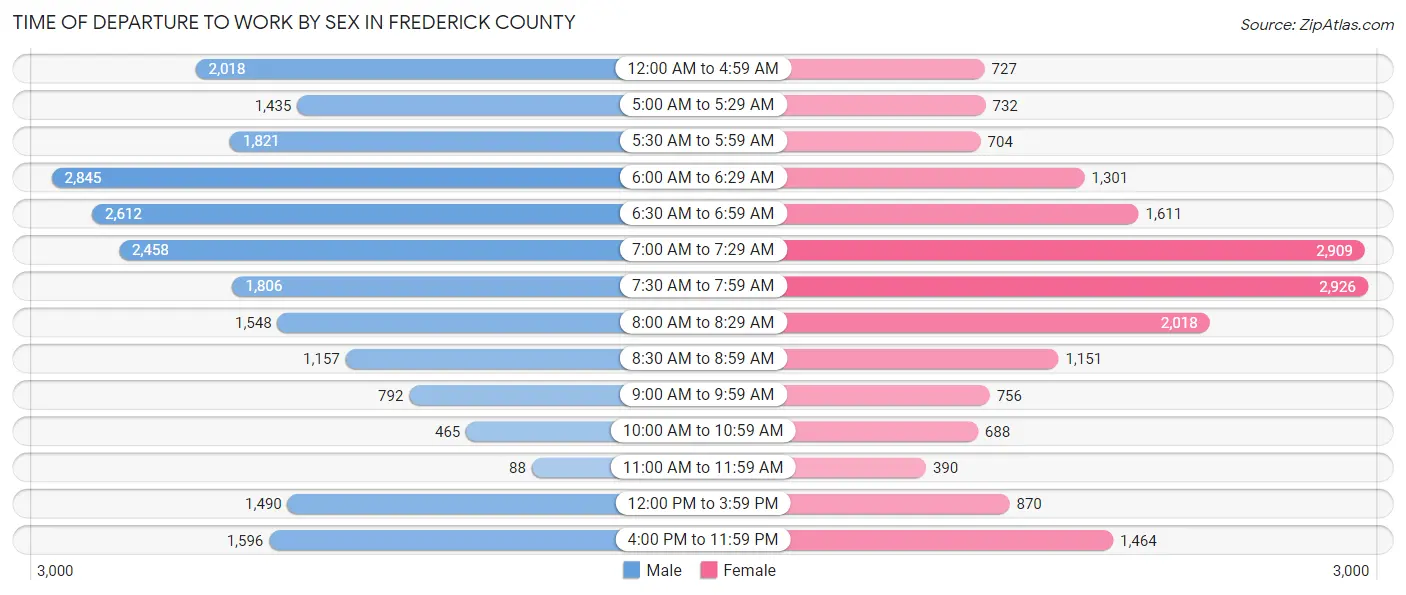
| Time of Departure | Male | Female |
| 12:00 AM to 4:59 AM | 2,018 (9.1%) | 727 (4.0%) |
| 5:00 AM to 5:29 AM | 1,435 (6.5%) | 732 (4.0%) |
| 5:30 AM to 5:59 AM | 1,821 (8.2%) | 704 (3.9%) |
| 6:00 AM to 6:29 AM | 2,845 (12.9%) | 1,301 (7.1%) |
| 6:30 AM to 6:59 AM | 2,612 (11.8%) | 1,611 (8.8%) |
| 7:00 AM to 7:29 AM | 2,458 (11.1%) | 2,909 (15.9%) |
| 7:30 AM to 7:59 AM | 1,806 (8.2%) | 2,926 (16.0%) |
| 8:00 AM to 8:29 AM | 1,548 (7.0%) | 2,018 (11.1%) |
| 8:30 AM to 8:59 AM | 1,157 (5.2%) | 1,151 (6.3%) |
| 9:00 AM to 9:59 AM | 792 (3.6%) | 756 (4.1%) |
| 10:00 AM to 10:59 AM | 465 (2.1%) | 688 (3.8%) |
| 11:00 AM to 11:59 AM | 88 (0.4%) | 390 (2.1%) |
| 12:00 PM to 3:59 PM | 1,490 (6.7%) | 870 (4.8%) |
| 4:00 PM to 11:59 PM | 1,596 (7.2%) | 1,464 (8.0%) |
| Total | 22,131 (100.0%) | 18,247 (100.0%) |
Housing Occupancy in Frederick County
Occupancy by Ownership in Frederick County
Of the total 33,534 dwellings in Frederick County, owner-occupied units account for 25,973 (77.4%), while renter-occupied units make up 7,561 (22.6%).
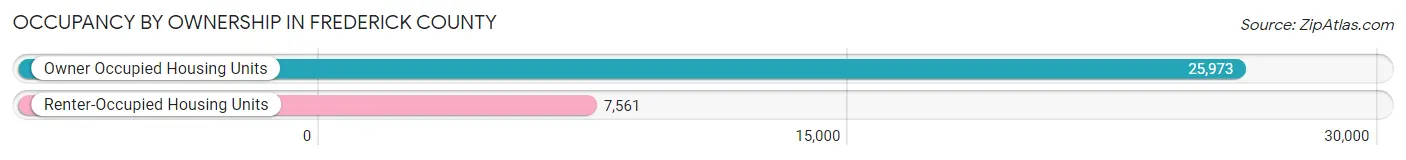
| Occupancy | # Housing Units | % Housing Units |
| Owner Occupied Housing Units | 25,973 | 77.4% |
| Renter-Occupied Housing Units | 7,561 | 22.6% |
| Total Occupied Housing Units | 33,534 | 100.0% |
Occupancy by Household Size in Frederick County
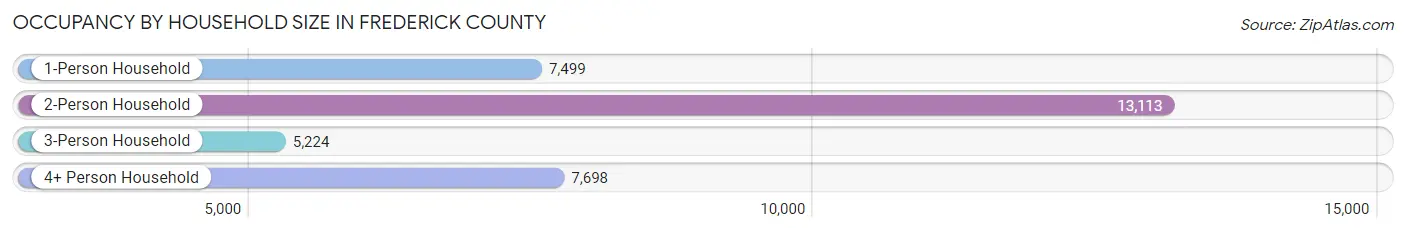
| Household Size | # Housing Units | % Housing Units |
| 1-Person Household | 7,499 | 22.4% |
| 2-Person Household | 13,113 | 39.1% |
| 3-Person Household | 5,224 | 15.6% |
| 4+ Person Household | 7,698 | 23.0% |
| Total Housing Units | 33,534 | 100.0% |
Occupancy by Ownership by Household Size in Frederick County
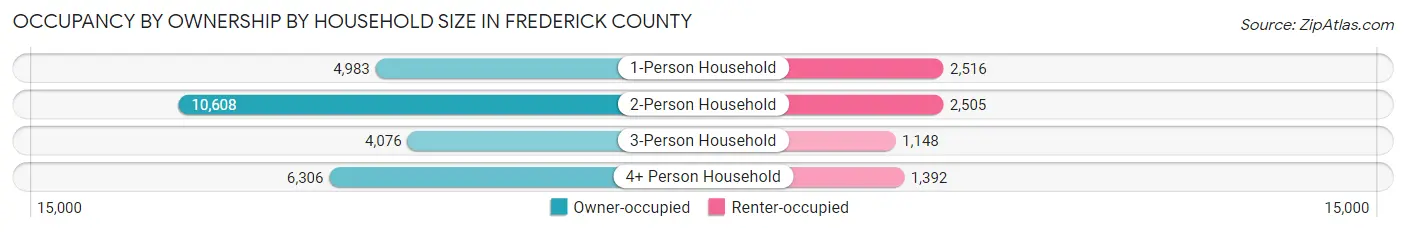
| Household Size | Owner-occupied | Renter-occupied |
| 1-Person Household | 4,983 (66.4%) | 2,516 (33.6%) |
| 2-Person Household | 10,608 (80.9%) | 2,505 (19.1%) |
| 3-Person Household | 4,076 (78.0%) | 1,148 (22.0%) |
| 4+ Person Household | 6,306 (81.9%) | 1,392 (18.1%) |
| Total Housing Units | 25,973 (77.4%) | 7,561 (22.6%) |
Occupancy by Educational Attainment in Frederick County
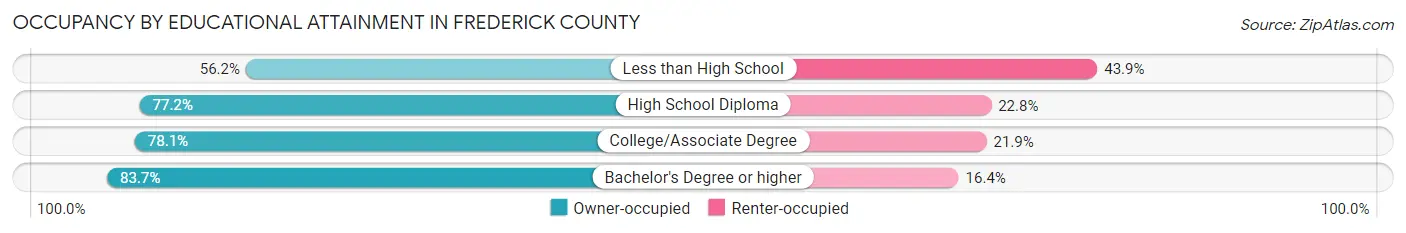
| Household Size | Owner-occupied | Renter-occupied |
| Less than High School | 1,876 (56.1%) | 1,465 (43.9%) |
| High School Diploma | 7,260 (77.2%) | 2,145 (22.8%) |
| College/Associate Degree | 7,789 (78.1%) | 2,182 (21.9%) |
| Bachelor's Degree or higher | 9,048 (83.7%) | 1,769 (16.4%) |
Occupancy by Age of Householder in Frederick County
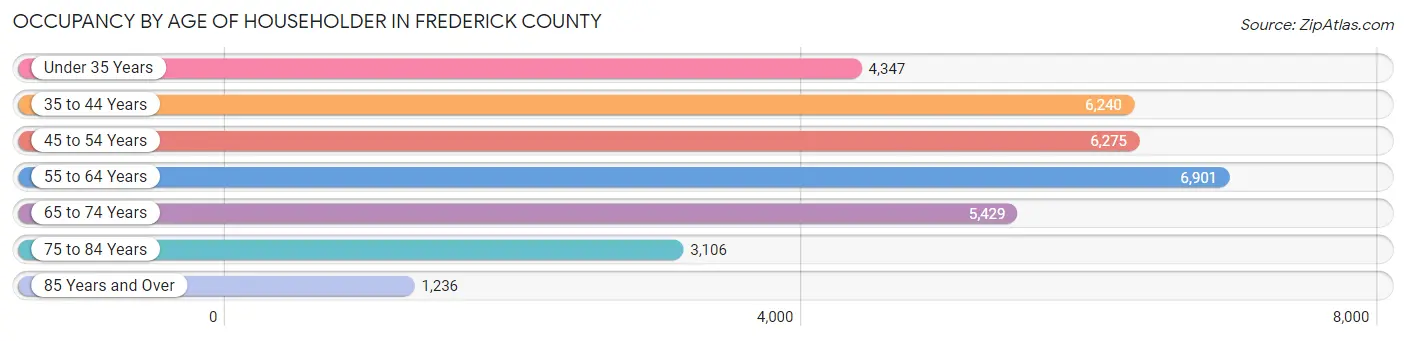
| Age Bracket | # Households | % Households |
| Under 35 Years | 4,347 | 13.0% |
| 35 to 44 Years | 6,240 | 18.6% |
| 45 to 54 Years | 6,275 | 18.7% |
| 55 to 64 Years | 6,901 | 20.6% |
| 65 to 74 Years | 5,429 | 16.2% |
| 75 to 84 Years | 3,106 | 9.3% |
| 85 Years and Over | 1,236 | 3.7% |
| Total | 33,534 | 100.0% |
Housing Finances in Frederick County
Median Income by Occupancy in Frederick County
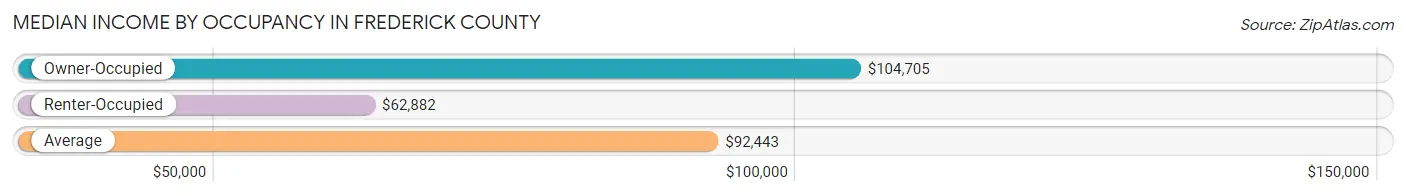
| Occupancy Type | # Households | Median Income |
| Owner-Occupied | 25,973 (77.4%) | $104,705 |
| Renter-Occupied | 7,561 (22.6%) | $62,882 |
| Average | 33,534 (100.0%) | $92,443 |
Occupancy by Householder Income Bracket in Frederick County
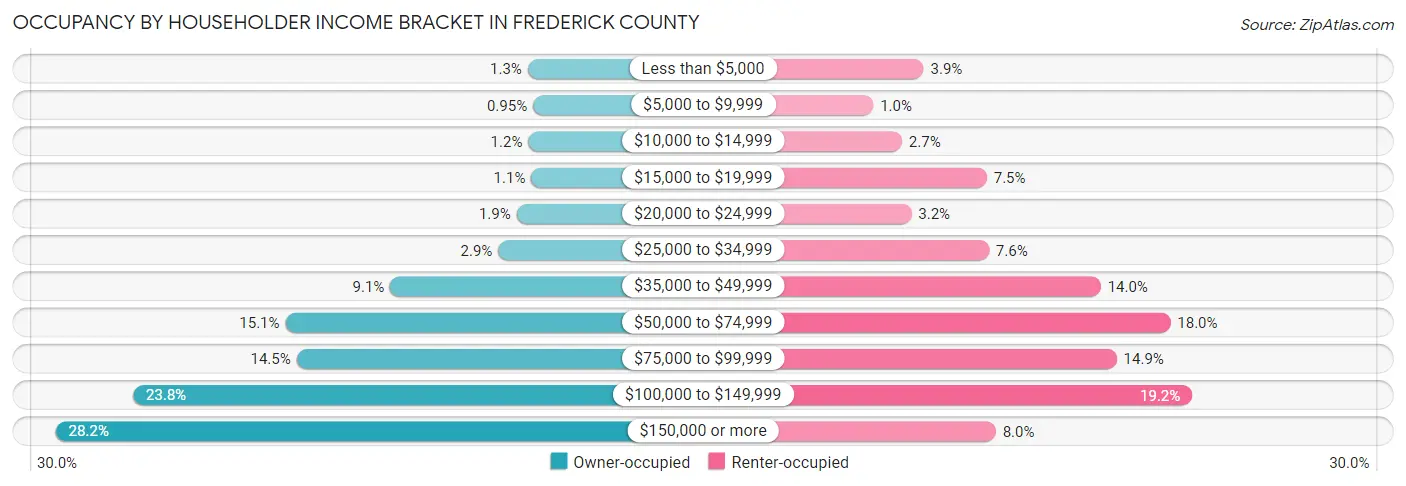
| Income Bracket | Owner-occupied | Renter-occupied |
| Less than $5,000 | 325 (1.3%) | 294 (3.9%) |
| $5,000 to $9,999 | 248 (0.9%) | 76 (1.0%) |
| $10,000 to $14,999 | 316 (1.2%) | 200 (2.6%) |
| $15,000 to $19,999 | 272 (1.1%) | 567 (7.5%) |
| $20,000 to $24,999 | 492 (1.9%) | 241 (3.2%) |
| $25,000 to $34,999 | 763 (2.9%) | 576 (7.6%) |
| $35,000 to $49,999 | 2,365 (9.1%) | 1,059 (14.0%) |
| $50,000 to $74,999 | 3,921 (15.1%) | 1,360 (18.0%) |
| $75,000 to $99,999 | 3,755 (14.5%) | 1,128 (14.9%) |
| $100,000 to $149,999 | 6,185 (23.8%) | 1,454 (19.2%) |
| $150,000 or more | 7,331 (28.2%) | 606 (8.0%) |
| Total | 25,973 (100.0%) | 7,561 (100.0%) |
Monthly Housing Cost Tiers in Frederick County
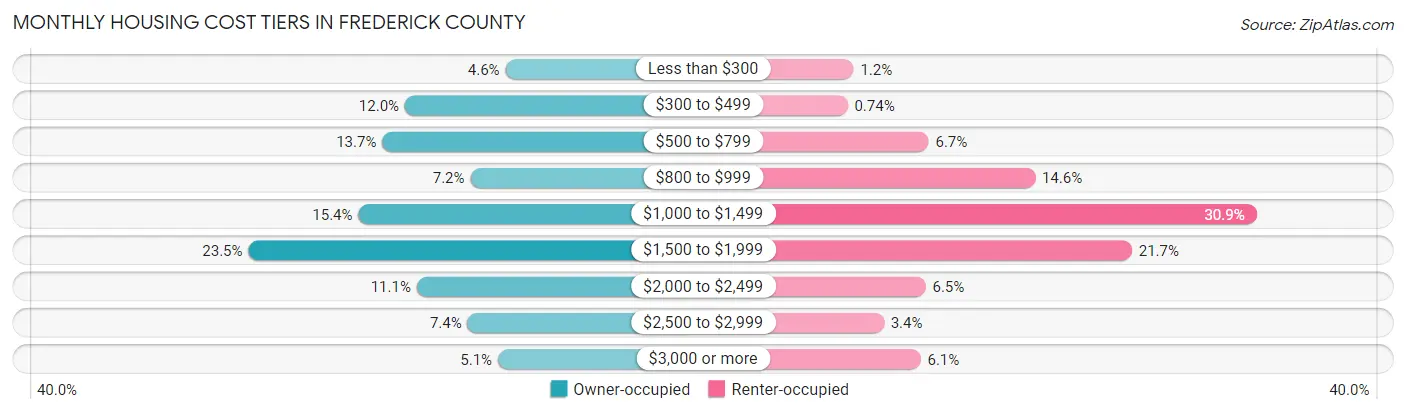
| Monthly Cost | Owner-occupied | Renter-occupied |
| Less than $300 | 1,192 (4.6%) | 89 (1.2%) |
| $300 to $499 | 3,115 (12.0%) | 56 (0.7%) |
| $500 to $799 | 3,548 (13.7%) | 507 (6.7%) |
| $800 to $999 | 1,863 (7.2%) | 1,100 (14.5%) |
| $1,000 to $1,499 | 4,005 (15.4%) | 2,333 (30.9%) |
| $1,500 to $1,999 | 6,108 (23.5%) | 1,639 (21.7%) |
| $2,000 to $2,499 | 2,888 (11.1%) | 491 (6.5%) |
| $2,500 to $2,999 | 1,918 (7.4%) | 258 (3.4%) |
| $3,000 or more | 1,336 (5.1%) | 463 (6.1%) |
| Total | 25,973 (100.0%) | 7,561 (100.0%) |
Physical Housing Characteristics in Frederick County
Housing Structures in Frederick County
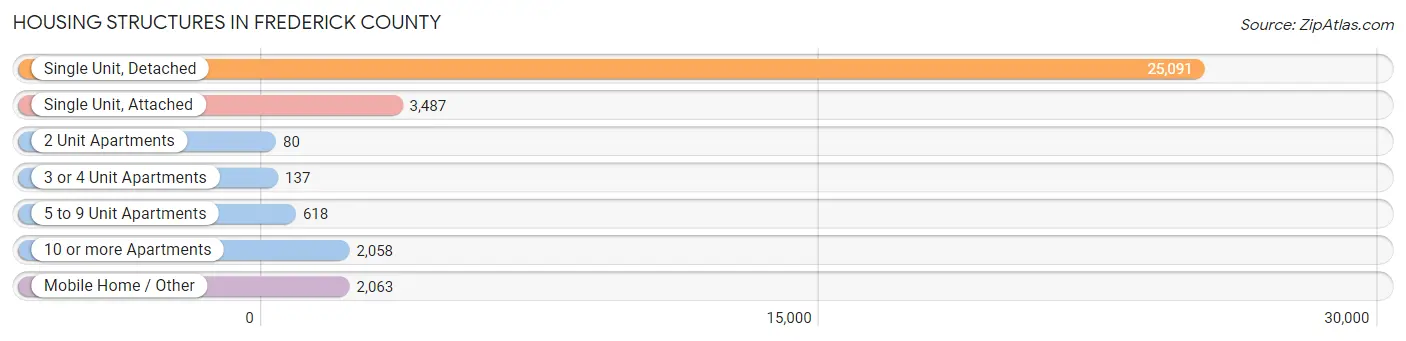
| Structure Type | # Housing Units | % Housing Units |
| Single Unit, Detached | 25,091 | 74.8% |
| Single Unit, Attached | 3,487 | 10.4% |
| 2 Unit Apartments | 80 | 0.2% |
| 3 or 4 Unit Apartments | 137 | 0.4% |
| 5 to 9 Unit Apartments | 618 | 1.8% |
| 10 or more Apartments | 2,058 | 6.1% |
| Mobile Home / Other | 2,063 | 6.1% |
| Total | 33,534 | 100.0% |
Housing Structures by Occupancy in Frederick County
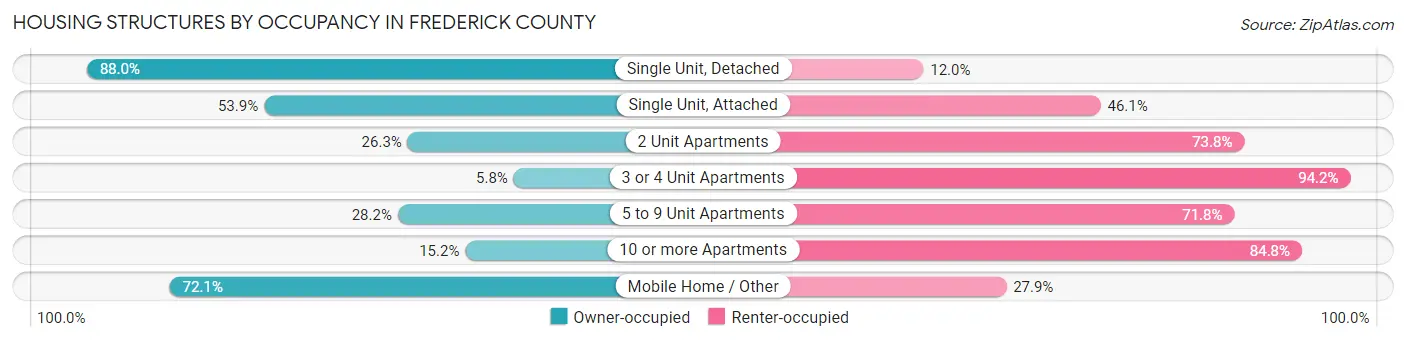
| Structure Type | Owner-occupied | Renter-occupied |
| Single Unit, Detached | 22,091 (88.0%) | 3,000 (12.0%) |
| Single Unit, Attached | 1,880 (53.9%) | 1,607 (46.1%) |
| 2 Unit Apartments | 21 (26.3%) | 59 (73.8%) |
| 3 or 4 Unit Apartments | 8 (5.8%) | 129 (94.2%) |
| 5 to 9 Unit Apartments | 174 (28.2%) | 444 (71.8%) |
| 10 or more Apartments | 312 (15.2%) | 1,746 (84.8%) |
| Mobile Home / Other | 1,487 (72.1%) | 576 (27.9%) |
| Total | 25,973 (77.4%) | 7,561 (22.6%) |
Housing Structures by Number of Rooms in Frederick County
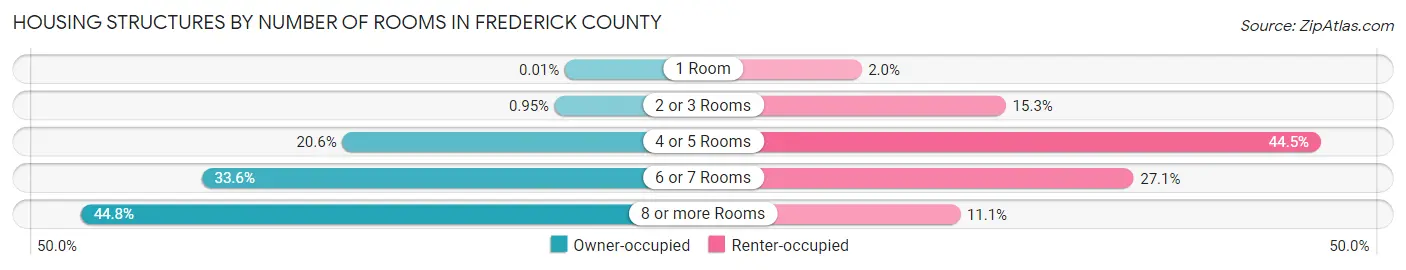
| Number of Rooms | Owner-occupied | Renter-occupied |
| 1 Room | 3 (0.0%) | 149 (2.0%) |
| 2 or 3 Rooms | 247 (0.9%) | 1,159 (15.3%) |
| 4 or 5 Rooms | 5,351 (20.6%) | 3,363 (44.5%) |
| 6 or 7 Rooms | 8,734 (33.6%) | 2,051 (27.1%) |
| 8 or more Rooms | 11,638 (44.8%) | 839 (11.1%) |
| Total | 25,973 (100.0%) | 7,561 (100.0%) |
Housing Structure by Heating Type in Frederick County
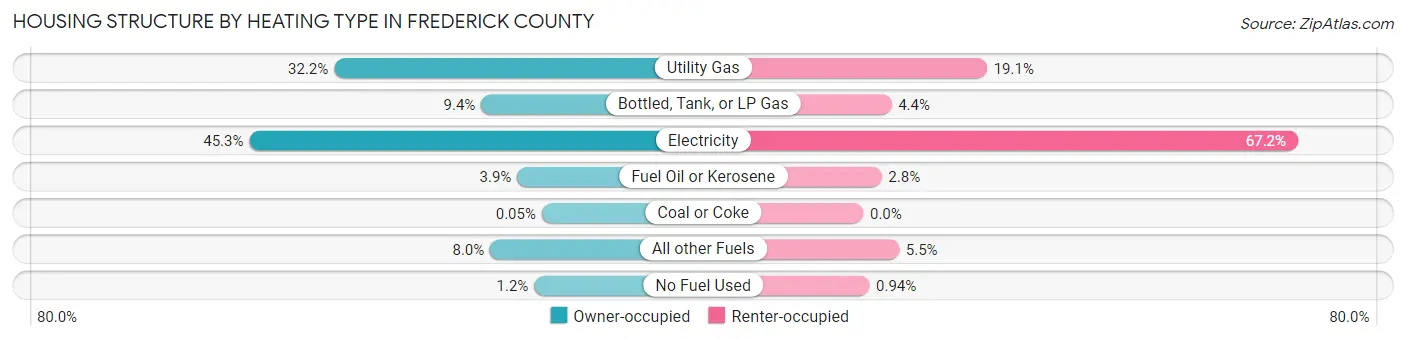
| Heating Type | Owner-occupied | Renter-occupied |
| Utility Gas | 8,350 (32.2%) | 1,446 (19.1%) |
| Bottled, Tank, or LP Gas | 2,447 (9.4%) | 329 (4.3%) |
| Electricity | 11,756 (45.3%) | 5,082 (67.2%) |
| Fuel Oil or Kerosene | 999 (3.8%) | 215 (2.8%) |
| Coal or Coke | 14 (0.1%) | 0 (0.0%) |
| All other Fuels | 2,089 (8.0%) | 418 (5.5%) |
| No Fuel Used | 318 (1.2%) | 71 (0.9%) |
| Total | 25,973 (100.0%) | 7,561 (100.0%) |
Household Vehicle Usage in Frederick County
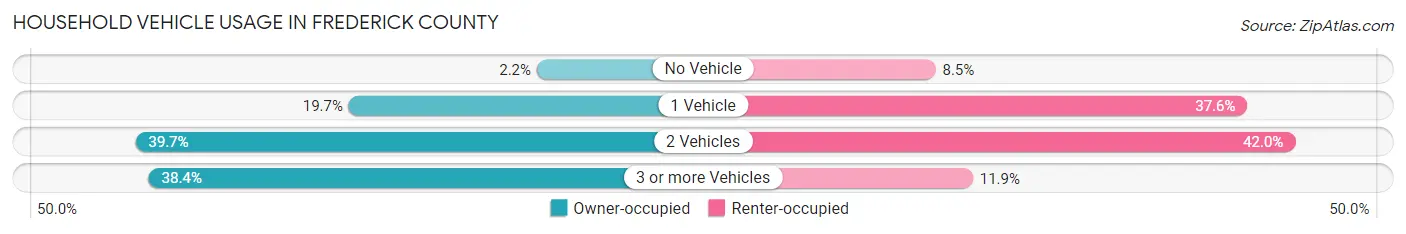
| Vehicles per Household | Owner-occupied | Renter-occupied |
| No Vehicle | 567 (2.2%) | 640 (8.5%) |
| 1 Vehicle | 5,126 (19.7%) | 2,840 (37.6%) |
| 2 Vehicles | 10,301 (39.7%) | 3,178 (42.0%) |
| 3 or more Vehicles | 9,979 (38.4%) | 903 (11.9%) |
| Total | 25,973 (100.0%) | 7,561 (100.0%) |
Real Estate & Mortgages in Frederick County
Real Estate and Mortgage Overview in Frederick County
| Characteristic | Without Mortgage | With Mortgage |
| Housing Units | 8,439 | 17,534 |
| Median Property Value | $312,800 | $341,700 |
| Median Household Income | $71,669 | $5,885 |
| Monthly Housing Costs | $506 | $1,314 |
| Real Estate Taxes | $1,749 | $360 |
Property Value by Mortgage Status in Frederick County
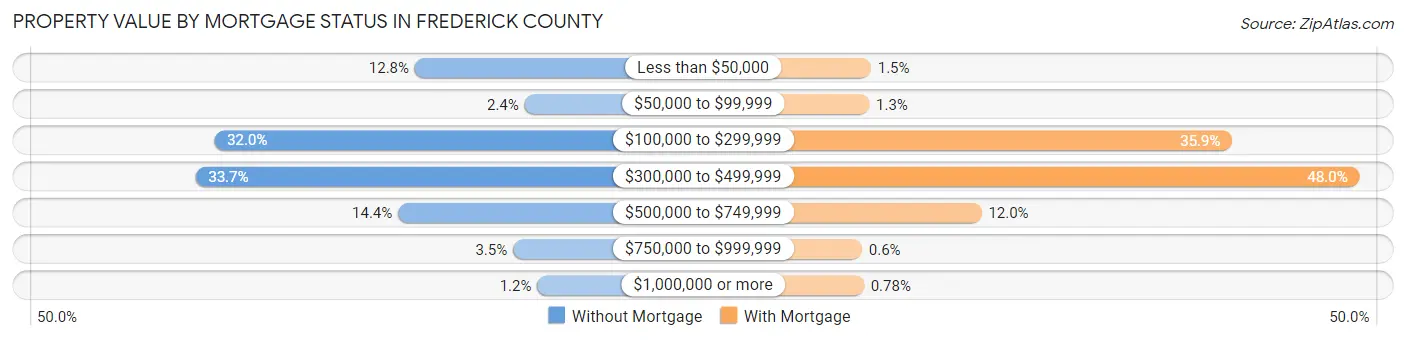
| Property Value | Without Mortgage | With Mortgage |
| Less than $50,000 | 1,083 (12.8%) | 255 (1.5%) |
| $50,000 to $99,999 | 201 (2.4%) | 227 (1.3%) |
| $100,000 to $299,999 | 2,697 (32.0%) | 6,291 (35.9%) |
| $300,000 to $499,999 | 2,847 (33.7%) | 8,416 (48.0%) |
| $500,000 to $749,999 | 1,218 (14.4%) | 2,102 (12.0%) |
| $750,000 to $999,999 | 294 (3.5%) | 106 (0.6%) |
| $1,000,000 or more | 99 (1.2%) | 137 (0.8%) |
| Total | 8,439 (100.0%) | 17,534 (100.0%) |
Household Income by Mortgage Status in Frederick County
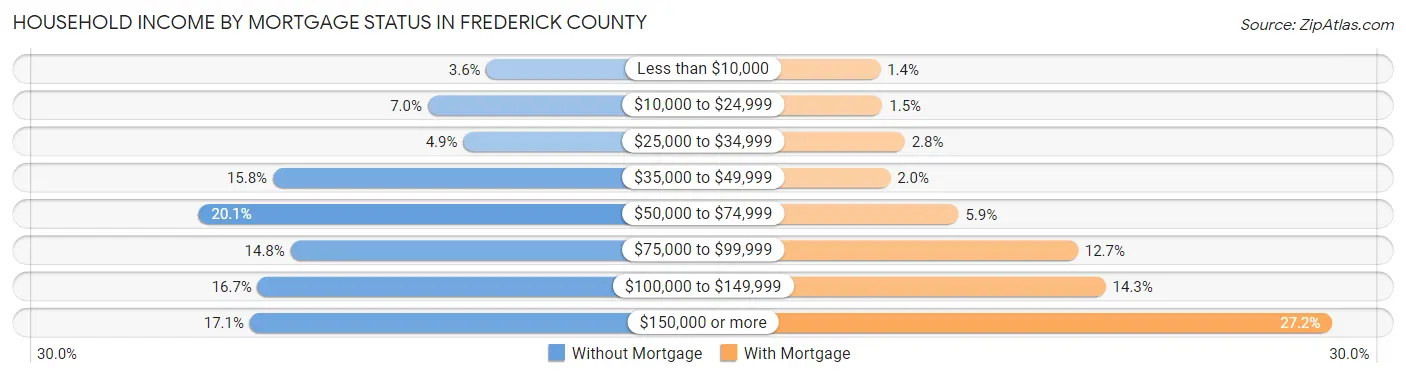
| Household Income | Without Mortgage | With Mortgage |
| Less than $10,000 | 305 (3.6%) | 248 (1.4%) |
| $10,000 to $24,999 | 587 (7.0%) | 268 (1.5%) |
| $25,000 to $34,999 | 416 (4.9%) | 493 (2.8%) |
| $35,000 to $49,999 | 1,334 (15.8%) | 347 (2.0%) |
| $50,000 to $74,999 | 1,694 (20.1%) | 1,031 (5.9%) |
| $75,000 to $99,999 | 1,249 (14.8%) | 2,227 (12.7%) |
| $100,000 to $149,999 | 1,408 (16.7%) | 2,506 (14.3%) |
| $150,000 or more | 1,446 (17.1%) | 4,777 (27.2%) |
| Total | 8,439 (100.0%) | 17,534 (100.0%) |
Property Value to Household Income Ratio in Frederick County
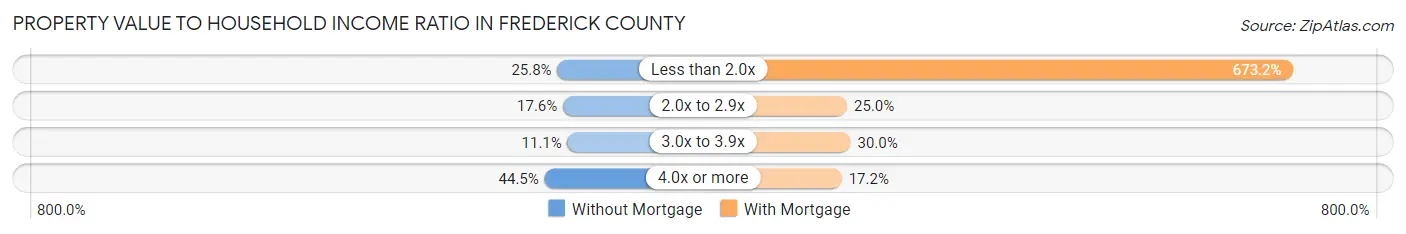
| Value-to-Income Ratio | Without Mortgage | With Mortgage |
| Less than 2.0x | 2,178 (25.8%) | 118,045 (673.2%) |
| 2.0x to 2.9x | 1,488 (17.6%) | 4,375 (24.9%) |
| 3.0x to 3.9x | 933 (11.1%) | 5,264 (30.0%) |
| 4.0x or more | 3,752 (44.5%) | 3,013 (17.2%) |
| Total | 8,439 (100.0%) | 17,534 (100.0%) |
Real Estate Taxes by Mortgage Status in Frederick County
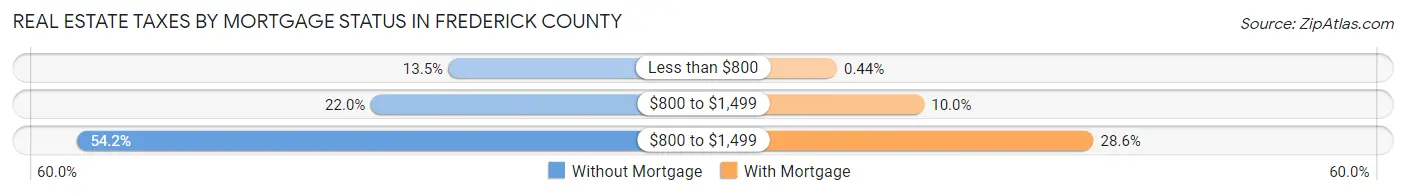
| Property Taxes | Without Mortgage | With Mortgage |
| Less than $800 | 1,139 (13.5%) | 77 (0.4%) |
| $800 to $1,499 | 1,858 (22.0%) | 1,753 (10.0%) |
| $800 to $1,499 | 4,574 (54.2%) | 5,008 (28.6%) |
| Total | 8,439 (100.0%) | 17,534 (100.0%) |
Health & Disability in Frederick County
Health Insurance Coverage by Age in Frederick County
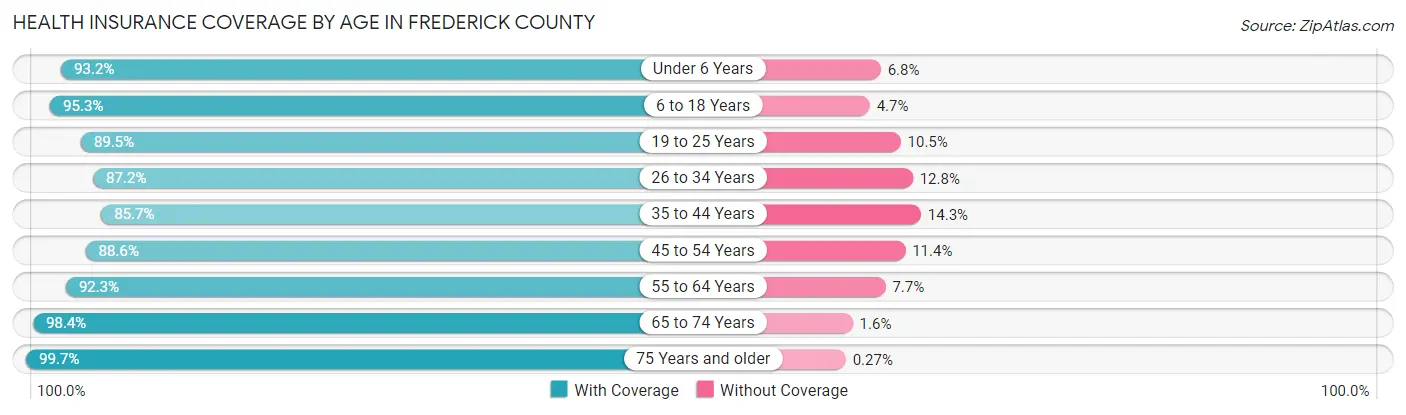
| Age Bracket | With Coverage | Without Coverage |
| Under 6 Years | 6,030 (93.2%) | 439 (6.8%) |
| 6 to 18 Years | 14,682 (95.3%) | 731 (4.7%) |
| 19 to 25 Years | 6,136 (89.5%) | 720 (10.5%) |
| 26 to 34 Years | 8,420 (87.2%) | 1,231 (12.8%) |
| 35 to 44 Years | 9,768 (85.7%) | 1,629 (14.3%) |
| 45 to 54 Years | 10,319 (88.6%) | 1,322 (11.4%) |
| 55 to 64 Years | 11,602 (92.3%) | 965 (7.7%) |
| 65 to 74 Years | 9,423 (98.4%) | 149 (1.6%) |
| 75 Years and older | 6,911 (99.7%) | 19 (0.3%) |
| Total | 83,291 (92.0%) | 7,205 (8.0%) |
Health Insurance Coverage by Citizenship Status in Frederick County
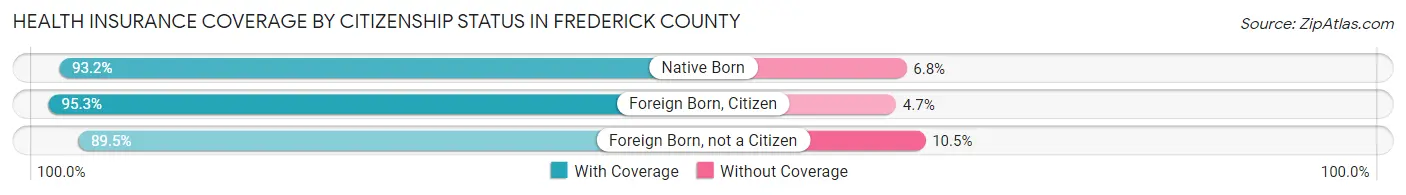
| Citizenship Status | With Coverage | Without Coverage |
| Native Born | 6,030 (93.2%) | 439 (6.8%) |
| Foreign Born, Citizen | 14,682 (95.3%) | 731 (4.7%) |
| Foreign Born, not a Citizen | 6,136 (89.5%) | 720 (10.5%) |
Health Insurance Coverage by Household Income in Frederick County
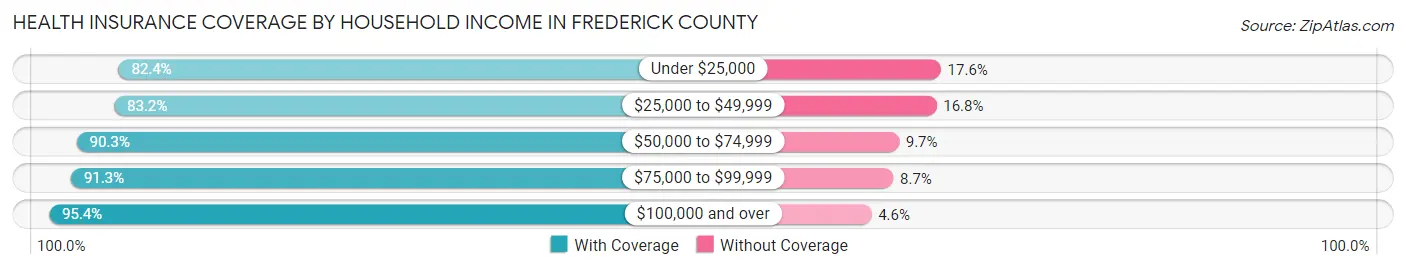
| Household Income | With Coverage | Without Coverage |
| Under $25,000 | 4,277 (82.4%) | 913 (17.6%) |
| $25,000 to $49,999 | 8,162 (83.2%) | 1,643 (16.8%) |
| $50,000 to $74,999 | 11,268 (90.3%) | 1,216 (9.7%) |
| $75,000 to $99,999 | 11,956 (91.3%) | 1,135 (8.7%) |
| $100,000 and over | 47,447 (95.4%) | 2,271 (4.6%) |
Public vs Private Health Insurance Coverage by Age in Frederick County
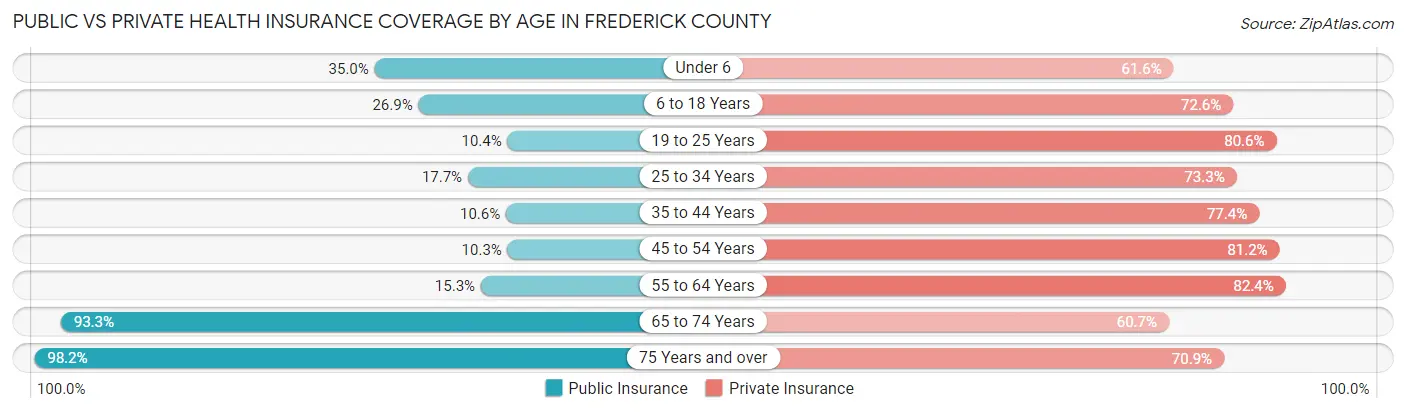
| Age Bracket | Public Insurance | Private Insurance |
| Under 6 | 2,266 (35.0%) | 3,983 (61.6%) |
| 6 to 18 Years | 4,145 (26.9%) | 11,195 (72.6%) |
| 19 to 25 Years | 710 (10.4%) | 5,529 (80.6%) |
| 25 to 34 Years | 1,709 (17.7%) | 7,069 (73.3%) |
| 35 to 44 Years | 1,213 (10.6%) | 8,825 (77.4%) |
| 45 to 54 Years | 1,204 (10.3%) | 9,456 (81.2%) |
| 55 to 64 Years | 1,923 (15.3%) | 10,352 (82.4%) |
| 65 to 74 Years | 8,928 (93.3%) | 5,809 (60.7%) |
| 75 Years and over | 6,805 (98.2%) | 4,915 (70.9%) |
| Total | 28,903 (31.9%) | 67,133 (74.2%) |
Disability Status by Sex by Age in Frederick County
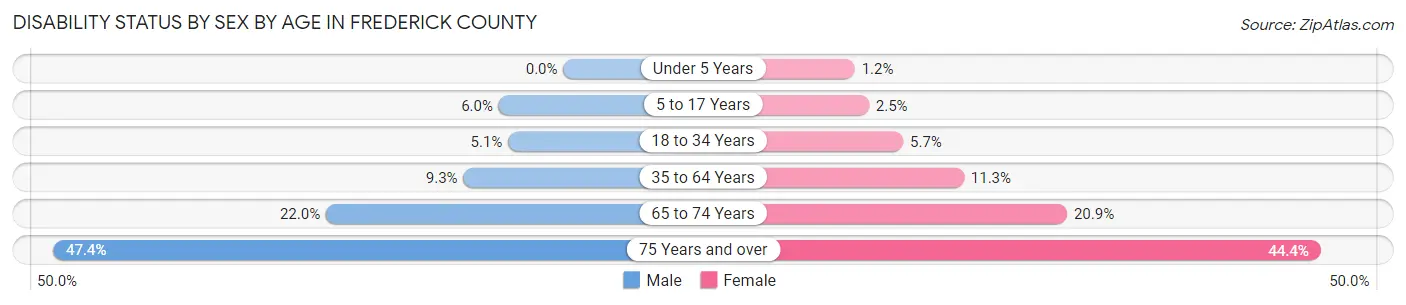
| Age Bracket | Male | Female |
| Under 5 Years | 0 (0.0%) | 29 (1.2%) |
| 5 to 17 Years | 495 (6.0%) | 185 (2.5%) |
| 18 to 34 Years | 451 (5.1%) | 495 (5.7%) |
| 35 to 64 Years | 1,635 (9.3%) | 2,034 (11.3%) |
| 65 to 74 Years | 1,024 (22.0%) | 1,029 (20.9%) |
| 75 Years and over | 1,381 (47.4%) | 1,784 (44.4%) |
Disability Class by Sex by Age in Frederick County
Disability Class: Hearing Difficulty
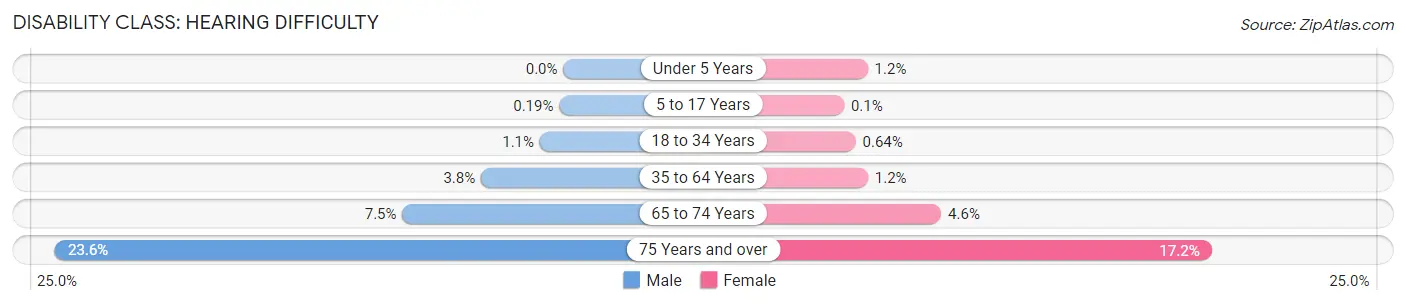
| Age Bracket | Male | Female |
| Under 5 Years | 0 (0.0%) | 29 (1.2%) |
| 5 to 17 Years | 16 (0.2%) | 7 (0.1%) |
| 18 to 34 Years | 96 (1.1%) | 56 (0.6%) |
| 35 to 64 Years | 674 (3.8%) | 217 (1.2%) |
| 65 to 74 Years | 347 (7.5%) | 227 (4.6%) |
| 75 Years and over | 688 (23.6%) | 689 (17.2%) |
Disability Class: Vision Difficulty
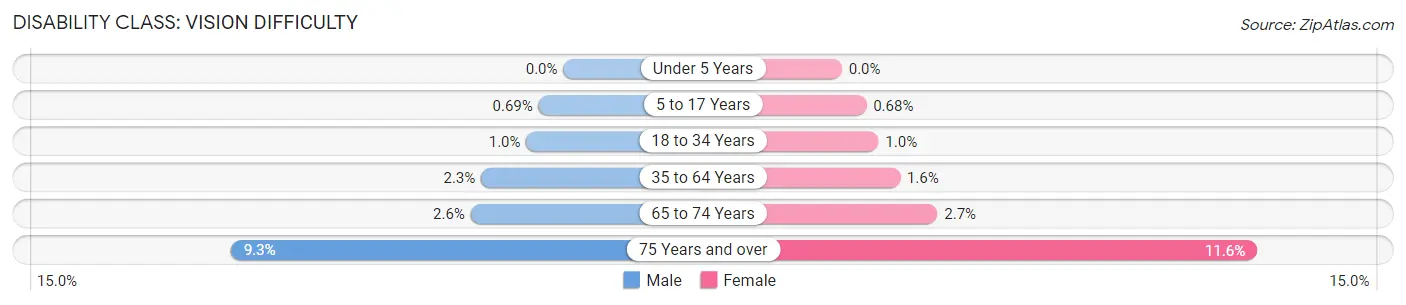
| Age Bracket | Male | Female |
| Under 5 Years | 0 (0.0%) | 0 (0.0%) |
| 5 to 17 Years | 57 (0.7%) | 50 (0.7%) |
| 18 to 34 Years | 91 (1.0%) | 89 (1.0%) |
| 35 to 64 Years | 404 (2.3%) | 291 (1.6%) |
| 65 to 74 Years | 120 (2.6%) | 131 (2.7%) |
| 75 Years and over | 270 (9.3%) | 464 (11.6%) |
Disability Class: Cognitive Difficulty
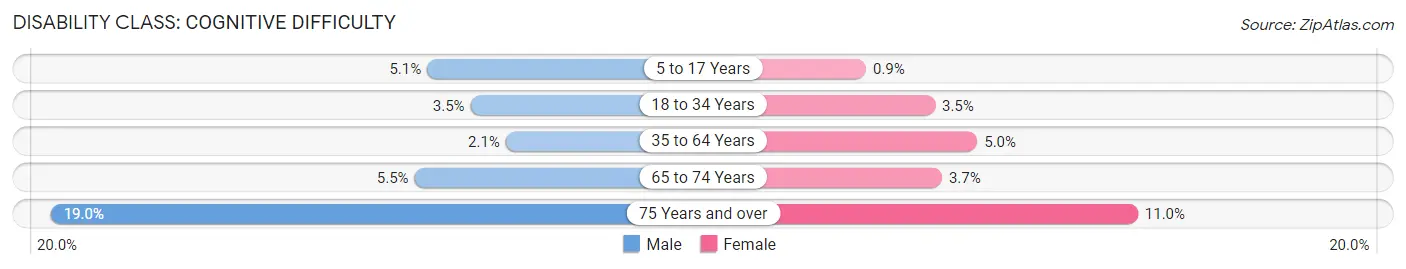
| Age Bracket | Male | Female |
| 5 to 17 Years | 418 (5.1%) | 66 (0.9%) |
| 18 to 34 Years | 304 (3.5%) | 301 (3.5%) |
| 35 to 64 Years | 377 (2.1%) | 903 (5.0%) |
| 65 to 74 Years | 257 (5.5%) | 183 (3.7%) |
| 75 Years and over | 555 (19.0%) | 441 (11.0%) |
Disability Class: Ambulatory Difficulty
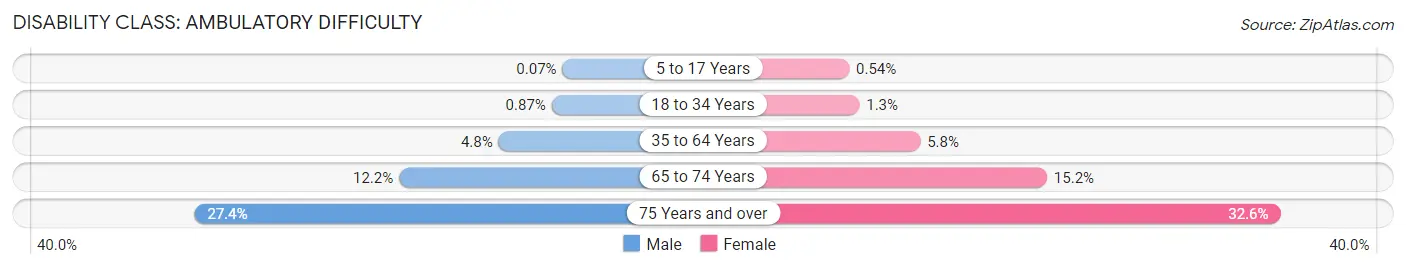
| Age Bracket | Male | Female |
| 5 to 17 Years | 6 (0.1%) | 40 (0.5%) |
| 18 to 34 Years | 77 (0.9%) | 113 (1.3%) |
| 35 to 64 Years | 848 (4.8%) | 1,045 (5.8%) |
| 65 to 74 Years | 567 (12.2%) | 750 (15.2%) |
| 75 Years and over | 799 (27.4%) | 1,307 (32.6%) |
Disability Class: Self-Care Difficulty
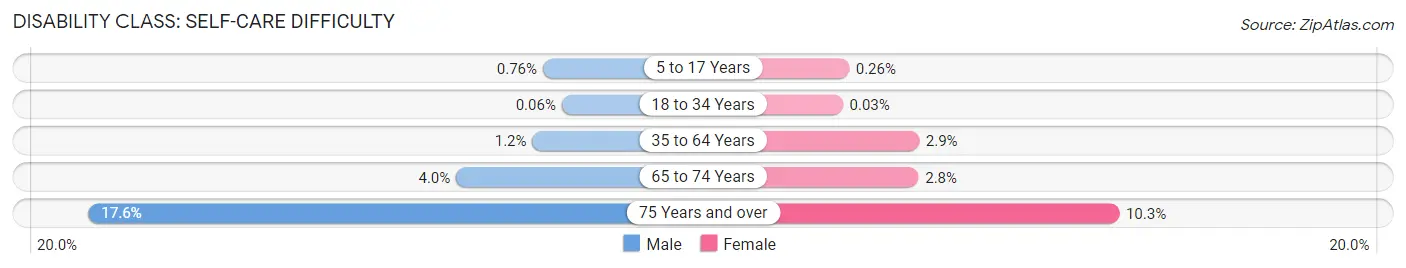
| Age Bracket | Male | Female |
| 5 to 17 Years | 63 (0.8%) | 19 (0.3%) |
| 18 to 34 Years | 5 (0.1%) | 3 (0.0%) |
| 35 to 64 Years | 203 (1.1%) | 514 (2.9%) |
| 65 to 74 Years | 185 (4.0%) | 140 (2.8%) |
| 75 Years and over | 514 (17.6%) | 413 (10.3%) |
Technology Access in Frederick County
Computing Device Access in Frederick County
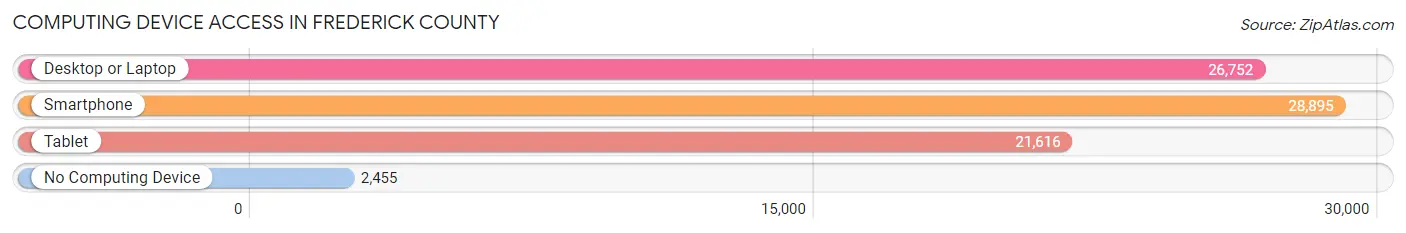
| Device Type | # Households | % Households |
| Desktop or Laptop | 26,752 | 79.8% |
| Smartphone | 28,895 | 86.2% |
| Tablet | 21,616 | 64.5% |
| No Computing Device | 2,455 | 7.3% |
| Total | 33,534 | 100.0% |
Internet Access in Frederick County
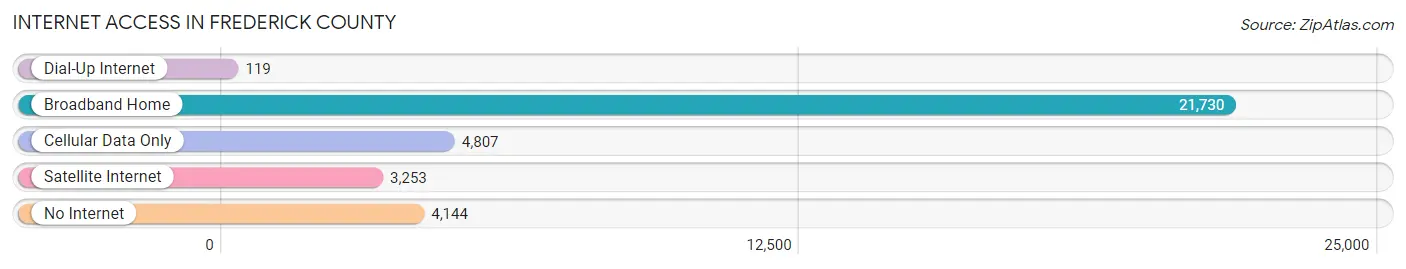
| Internet Type | # Households | % Households |
| Dial-Up Internet | 119 | 0.4% |
| Broadband Home | 21,730 | 64.8% |
| Cellular Data Only | 4,807 | 14.3% |
| Satellite Internet | 3,253 | 9.7% |
| No Internet | 4,144 | 12.4% |
| Total | 33,534 | 100.0% |
Frederick County Summary
Frederick County, Virginia is located in the northern part of the state, and is part of the Shenandoah Valley region. It is bordered by Clarke County to the north, Warren County to the east, Shenandoah County to the south, and the City of Winchester to the west. The county seat is Winchester, and the county is home to a population of approximately 78,305 people, according to the 2019 U.S. Census.
History
Frederick County was established in 1743 from parts of Orange and Augusta counties. It was named for Frederick Louis, Prince of Wales, the son of King George II of England. The county was originally part of the Northern Neck Proprietary, a large land grant given to seven Englishmen by King Charles II in 1649. The county was home to several Native American tribes, including the Iroquois, Shawnee, and Susquehannock.
During the American Revolution, Frederick County was the site of several battles, including the Battle of Cedar Creek in October of 1864. The county was also home to several prominent figures in American history, including George Washington, who owned a large estate in the county, and Stonewall Jackson, who was born in the county.
Geography
Frederick County is located in the northern part of Virginia, and is part of the Shenandoah Valley region. It is bordered by Clarke County to the north, Warren County to the east, Shenandoah County to the south, and the City of Winchester to the west. The county is home to the Blue Ridge Mountains, which form the eastern border of the county. The county is also home to the Shenandoah River, which flows through the county from north to south.
The county has a total area of 517 square miles, of which 514 square miles is land and 3 square miles is water. The county is home to several parks and recreational areas, including the George Washington National Forest, the Shenandoah National Park, and the Skyline Drive.
Economy
Frederick County has a diverse economy, with a mix of agriculture, manufacturing, and services. The county is home to several large employers, including the Winchester Medical Center, Valley Health System, and the City of Winchester. The county is also home to several wineries, breweries, and distilleries, as well as a number of small businesses.
Agriculture is an important part of the county’s economy, with the county being home to several large farms. The county is also home to several large manufacturing companies, including the Winchester Ammunition Company, which produces ammunition for the military and law enforcement.
Demographics
According to the 2019 U.S. Census, Frederick County has a population of 78,305 people. The population is made up of a diverse mix of races and ethnicities, with the largest group being White (77.3%), followed by Black or African American (14.2%), Hispanic or Latino (4.7%), and Asian (2.7%). The median household income in the county is $63,945, and the median home value is $269,400.
Conclusion
Frederick County, Virginia is a diverse and vibrant county located in the northern part of the state. It is home to a population of 78,305 people, and has a diverse economy that includes agriculture, manufacturing, and services. The county is home to several parks and recreational areas, as well as several wineries, breweries, and distilleries. The county is also home to several prominent figures in American history, including George Washington and Stonewall Jackson.
Common Questions
What is Per Capita Income in Frederick County?
Per Capita income in Frederick County is $43,375.
What is the Median Family Income in Frederick County?
Median Family Income in Frederick County is $107,040.
What is the Median Household income in Frederick County?
Median Household Income in Frederick County is $92,443.
What is Income or Wage Gap in Frederick County?
Income or Wage Gap in Frederick County is 29.2%.
Women in Frederick County earn 70.8 cents for every dollar earned by a man.
What is Family Income Deficit in Frederick County?
Family Income Deficit in Frederick County is $11,941.
Families that are below poverty line in Frederick County earn $11,941 less on average than the poverty threshold level.
What is Inequality or Gini Index in Frederick County?
Inequality or Gini Index in Frederick County is 0.40.
What is the Total Population of Frederick County?
Total Population of Frederick County is 92,007.
What is the Total Male Population of Frederick County?
Total Male Population of Frederick County is 46,279.
What is the Total Female Population of Frederick County?
Total Female Population of Frederick County is 45,728.
What is the Ratio of Males per 100 Females in Frederick County?
There are 101.20 Males per 100 Females in Frederick County.
What is the Ratio of Females per 100 Males in Frederick County?
There are 98.81 Females per 100 Males in Frederick County.
What is the Median Population Age in Frederick County?
Median Population Age in Frederick County is 40.6 Years.
What is the Average Family Size in Frederick County
Average Family Size in Frederick County is 3.1 People.
What is the Average Household Size in Frederick County
Average Household Size in Frederick County is 2.7 People.
How Large is the Labor Force in Frederick County?
There are 47,197 People in the Labor Forcein in Frederick County.
What is the Percentage of People in the Labor Force in Frederick County?
64.1% of People are in the Labor Force in Frederick County.
What is the Unemployment Rate in Frederick County?
Unemployment Rate in Frederick County is 4.2%.