Floyd County, VA Map & Demographics
Floyd County Map
Floyd County Overview
$31,788
PER CAPITA INCOME
$76,534
AVG FAMILY INCOME
$57,146
AVG HOUSEHOLD INCOME
23.9%
WAGE / INCOME GAP [ % ]
76.1¢/ $1
WAGE / INCOME GAP [ $ ]
0.42
INEQUALITY / GINI INDEX
15,532
TOTAL POPULATION
7,649
MALE POPULATION
7,883
FEMALE POPULATION
97.03
MALES / 100 FEMALES
103.06
FEMALES / 100 MALES
48.4
MEDIAN AGE
2.9
AVG FAMILY SIZE
2.3
AVG HOUSEHOLD SIZE
7,869
LABOR FORCE [ PEOPLE ]
60.1%
PERCENT IN LABOR FORCE
2.6%
UNEMPLOYMENT RATE
Floyd County Area Codes
Income in Floyd County
Income Overview in Floyd County
Per Capita Income in Floyd County is $31,788, while median incomes of families and households are $76,534 and $57,146 respectively.
| Characteristic | Number | Measure |
| Per Capita Income | 15,532 | $31,788 |
| Median Family Income | 4,270 | $76,534 |
| Mean Family Income | 4,270 | $85,503 |
| Median Household Income | 6,655 | $57,146 |
| Mean Household Income | 6,655 | $71,387 |
| Income Deficit | 4,270 | $0 |
| Wage / Income Gap (%) | 15,532 | 23.92% |
| Wage / Income Gap ($) | 15,532 | 76.08¢ per $1 |
| Gini / Inequality Index | 15,532 | 0.42 |
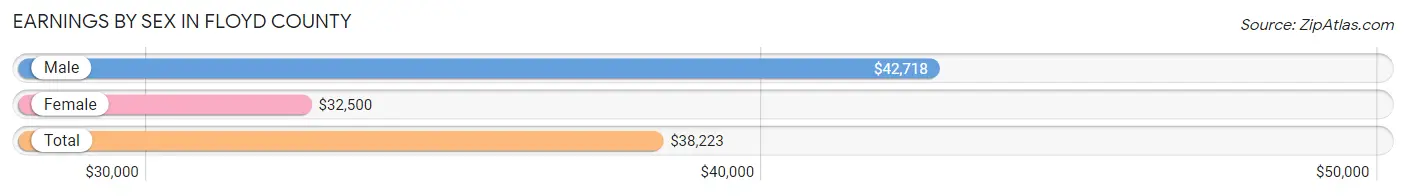
Earnings by Sex in Floyd County
Average Earnings in Floyd County are $38,223, $42,718 for men and $32,500 for women, a difference of 23.9%.
| Sex | Number | Average Earnings |
| Male | 4,068 (50.1%) | $42,718 |
| Female | 4,048 (49.9%) | $32,500 |
| Total | 8,116 (100.0%) | $38,223 |
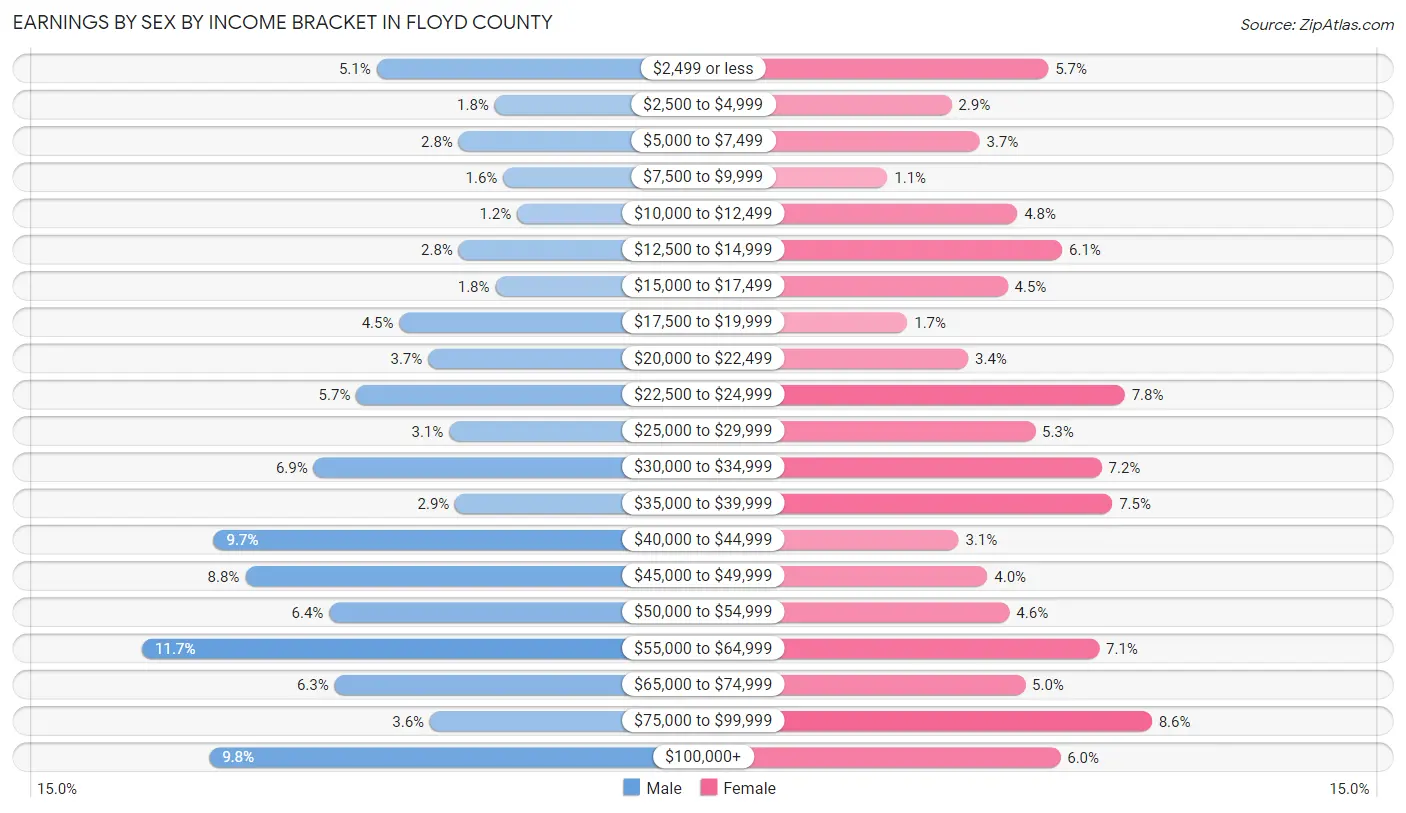
Earnings by Sex by Income Bracket in Floyd County
The most common earnings brackets in Floyd County are $55,000 to $64,999 for men (476 | 11.7%) and $75,000 to $99,999 for women (347 | 8.6%).
| Income | Male | Female |
| $2,499 or less | 208 (5.1%) | 229 (5.7%) |
| $2,500 to $4,999 | 73 (1.8%) | 119 (2.9%) |
| $5,000 to $7,499 | 114 (2.8%) | 151 (3.7%) |
| $7,500 to $9,999 | 63 (1.5%) | 46 (1.1%) |
| $10,000 to $12,499 | 47 (1.2%) | 194 (4.8%) |
| $12,500 to $14,999 | 114 (2.8%) | 245 (6.0%) |
| $15,000 to $17,499 | 72 (1.8%) | 183 (4.5%) |
| $17,500 to $19,999 | 182 (4.5%) | 69 (1.7%) |
| $20,000 to $22,499 | 149 (3.7%) | 138 (3.4%) |
| $22,500 to $24,999 | 231 (5.7%) | 316 (7.8%) |
| $25,000 to $29,999 | 125 (3.1%) | 214 (5.3%) |
| $30,000 to $34,999 | 280 (6.9%) | 290 (7.2%) |
| $35,000 to $39,999 | 118 (2.9%) | 302 (7.5%) |
| $40,000 to $44,999 | 394 (9.7%) | 127 (3.1%) |
| $45,000 to $49,999 | 358 (8.8%) | 160 (4.0%) |
| $50,000 to $54,999 | 262 (6.4%) | 185 (4.6%) |
| $55,000 to $64,999 | 476 (11.7%) | 287 (7.1%) |
| $65,000 to $74,999 | 256 (6.3%) | 203 (5.0%) |
| $75,000 to $99,999 | 147 (3.6%) | 347 (8.6%) |
| $100,000+ | 399 (9.8%) | 243 (6.0%) |
| Total | 4,068 (100.0%) | 4,048 (100.0%) |
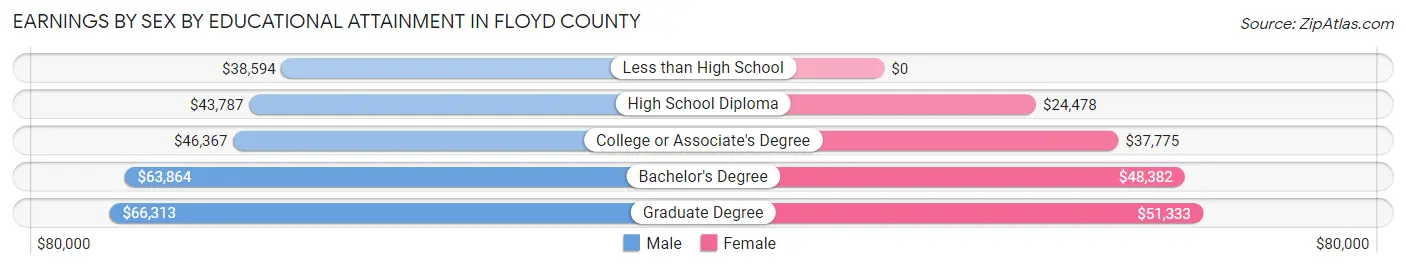
Earnings by Sex by Educational Attainment in Floyd County
Average earnings in Floyd County are $45,748 for men and $35,421 for women, a difference of 22.6%. Men with an educational attainment of graduate degree enjoy the highest average annual earnings of $66,313, while those with less than high school education earn the least with $38,594. Women with an educational attainment of graduate degree earn the most with the average annual earnings of $51,333, while those with high school diploma education have the smallest earnings of $24,478.
| Educational Attainment | Male Income | Female Income |
| Less than High School | $38,594 | $0 |
| High School Diploma | $43,787 | $24,478 |
| College or Associate's Degree | $46,367 | $37,775 |
| Bachelor's Degree | $63,864 | $48,382 |
| Graduate Degree | $66,313 | $51,333 |
| Total | $45,748 | $35,421 |
Family Income in Floyd County
Family Income Brackets in Floyd County
According to the Floyd County family income data, there are 888 families falling into the $75,000 to $99,999 income range, which is the most common income bracket and makes up 20.8% of all families. Conversely, the $10,000 to $14,999 income bracket is the least frequent group with only 26 families (0.6%) belonging to this category.
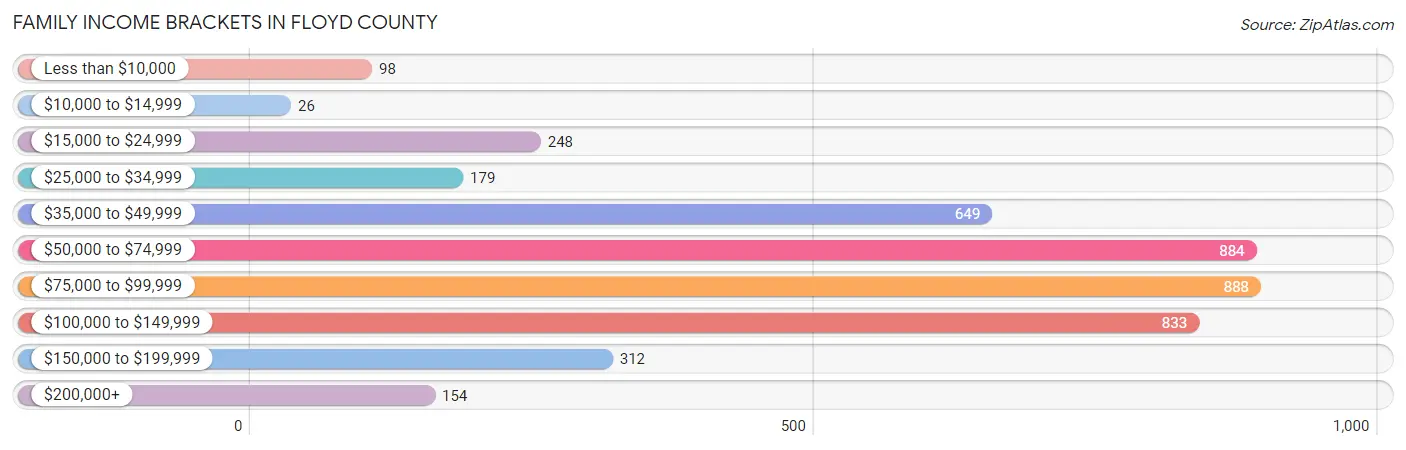
| Income Bracket | # Families | % Families |
| Less than $10,000 | 98 | 2.3% |
| $10,000 to $14,999 | 26 | 0.6% |
| $15,000 to $24,999 | 248 | 5.8% |
| $25,000 to $34,999 | 179 | 4.2% |
| $35,000 to $49,999 | 649 | 15.2% |
| $50,000 to $74,999 | 884 | 20.7% |
| $75,000 to $99,999 | 888 | 20.8% |
| $100,000 to $149,999 | 833 | 19.5% |
| $150,000 to $199,999 | 312 | 7.3% |
| $200,000+ | 154 | 3.6% |
Family Income by Famaliy Size in Floyd County
5-person families (229 | 5.4%) account for the highest median family income in Floyd County with $99,583 per family, while 2-person families (2,349 | 55.0%) have the highest median income of $32,420 per family member.
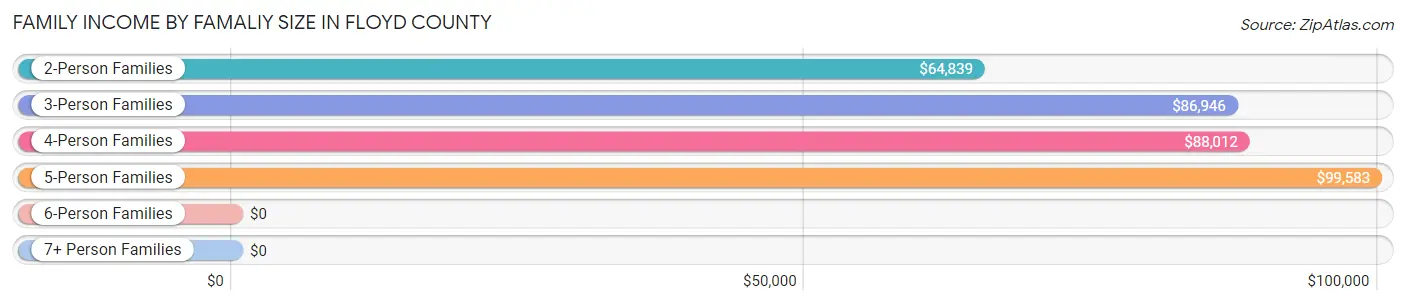
| Income Bracket | # Families | Median Income |
| 2-Person Families | 2,349 (55.0%) | $64,839 |
| 3-Person Families | 1,033 (24.2%) | $86,946 |
| 4-Person Families | 607 (14.2%) | $88,012 |
| 5-Person Families | 229 (5.4%) | $99,583 |
| 6-Person Families | 44 (1.0%) | $0 |
| 7+ Person Families | 8 (0.2%) | $0 |
| Total | 4,270 (100.0%) | $76,534 |
Family Income by Number of Earners in Floyd County
The median family income in Floyd County is $76,534, with families comprising 3+ earners (526) having the highest median family income of $113,276, while families with no earners (862) have the lowest median family income of $50,703, accounting for 12.3% and 20.2% of families, respectively.
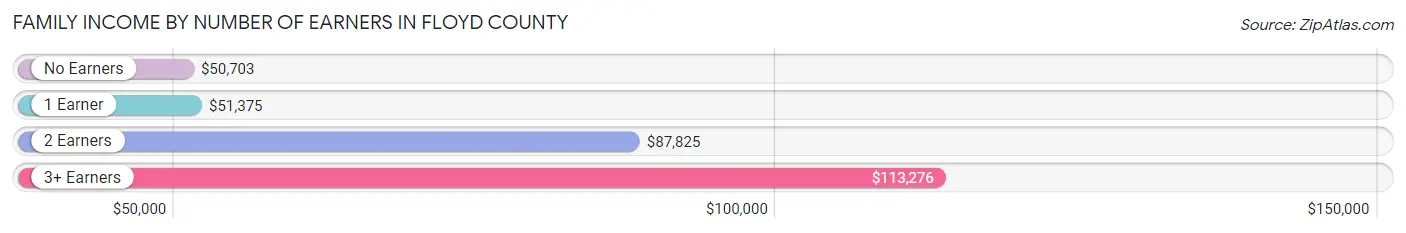
| Number of Earners | # Families | Median Income |
| No Earners | 862 (20.2%) | $50,703 |
| 1 Earner | 1,230 (28.8%) | $51,375 |
| 2 Earners | 1,652 (38.7%) | $87,825 |
| 3+ Earners | 526 (12.3%) | $113,276 |
| Total | 4,270 (100.0%) | $76,534 |
Household Income in Floyd County
Household Income Brackets in Floyd County
With 1,078 households falling in the category, the $50,000 to $74,999 income range is the most frequent in Floyd County, accounting for 16.2% of all households. In contrast, only 173 households (2.6%) fall into the $200,000+ income bracket, making it the least populous group.
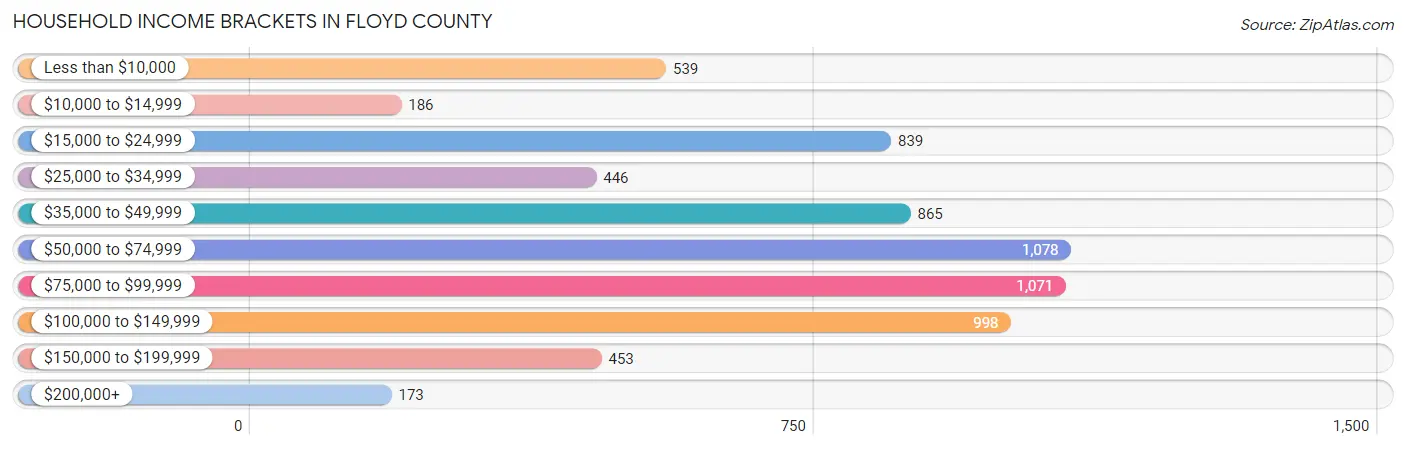
| Income Bracket | # Households | % Households |
| Less than $10,000 | 539 | 8.1% |
| $10,000 to $14,999 | 186 | 2.8% |
| $15,000 to $24,999 | 839 | 12.6% |
| $25,000 to $34,999 | 446 | 6.7% |
| $35,000 to $49,999 | 865 | 13.0% |
| $50,000 to $74,999 | 1,078 | 16.2% |
| $75,000 to $99,999 | 1,071 | 16.1% |
| $100,000 to $149,999 | 998 | 15.0% |
| $150,000 to $199,999 | 453 | 6.8% |
| $200,000+ | 173 | 2.6% |
Household Income by Householder Age in Floyd County
The median household income in Floyd County is $57,146, with the highest median household income of $77,127 found in the 25 to 44 years age bracket for the primary householder. A total of 1,739 households (26.1%) fall into this category. Meanwhile, the 15 to 24 years age bracket for the primary householder has the lowest median household income of $0, with 40 households (0.6%) in this group.
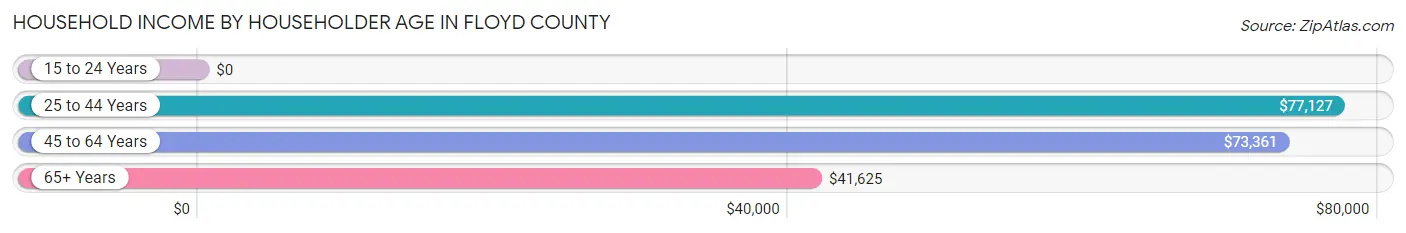
| Income Bracket | # Households | Median Income |
| 15 to 24 Years | 40 (0.6%) | $0 |
| 25 to 44 Years | 1,739 (26.1%) | $77,127 |
| 45 to 64 Years | 2,492 (37.4%) | $73,361 |
| 65+ Years | 2,384 (35.8%) | $41,625 |
| Total | 6,655 (100.0%) | $57,146 |
Poverty in Floyd County
Income Below Poverty by Sex and Age in Floyd County
With 9.5% poverty level for males and 9.4% for females among the residents of Floyd County, 12 to 14 year old males and 6 to 11 year old females are the most vulnerable to poverty, with 54 males (33.8%) and 98 females (23.7%) in their respective age groups living below the poverty level.
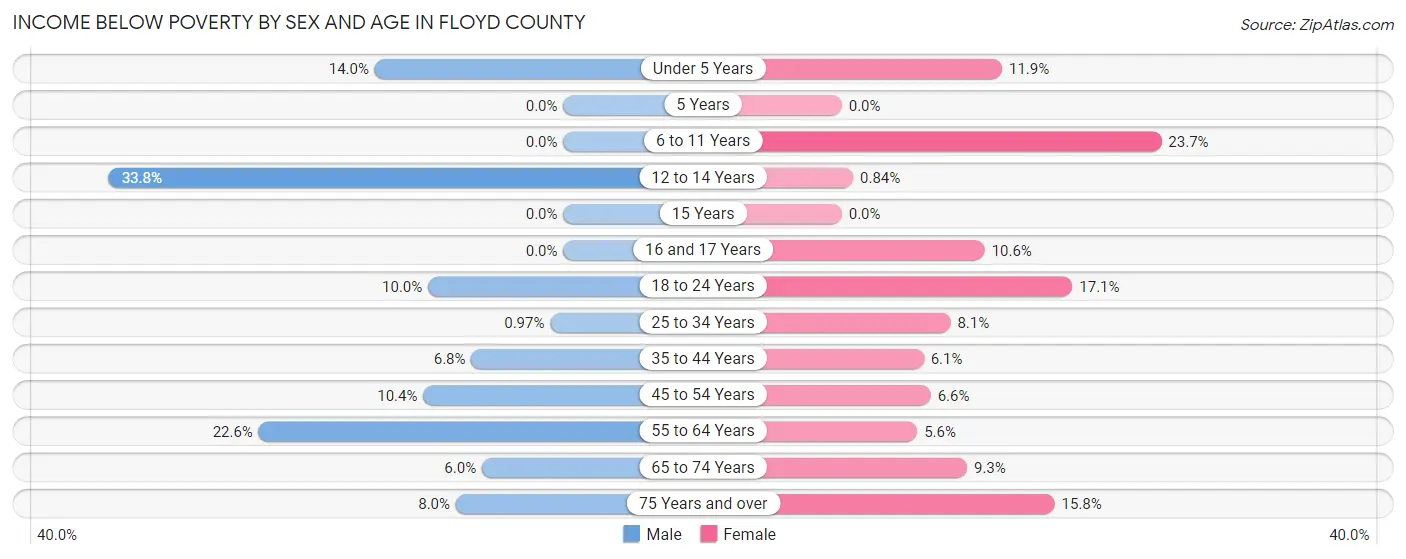
| Age Bracket | Male | Female |
| Under 5 Years | 49 (14.0%) | 37 (11.9%) |
| 5 Years | 0 (0.0%) | 0 (0.0%) |
| 6 to 11 Years | 0 (0.0%) | 98 (23.7%) |
| 12 to 14 Years | 54 (33.8%) | 3 (0.8%) |
| 15 Years | 0 (0.0%) | 0 (0.0%) |
| 16 and 17 Years | 0 (0.0%) | 14 (10.6%) |
| 18 to 24 Years | 56 (10.0%) | 82 (17.1%) |
| 25 to 34 Years | 8 (1.0%) | 64 (8.1%) |
| 35 to 44 Years | 57 (6.8%) | 48 (6.1%) |
| 45 to 54 Years | 113 (10.4%) | 65 (6.6%) |
| 55 to 64 Years | 269 (22.6%) | 78 (5.6%) |
| 65 to 74 Years | 62 (6.0%) | 104 (9.3%) |
| 75 Years and over | 52 (8.0%) | 140 (15.8%) |
| Total | 720 (9.5%) | 733 (9.4%) |
Income Above Poverty by Sex and Age in Floyd County
According to the poverty statistics in Floyd County, males aged 5 years and females aged 5 years are the age groups that are most secure financially, with 100.0% of males and 100.0% of females in these age groups living above the poverty line.
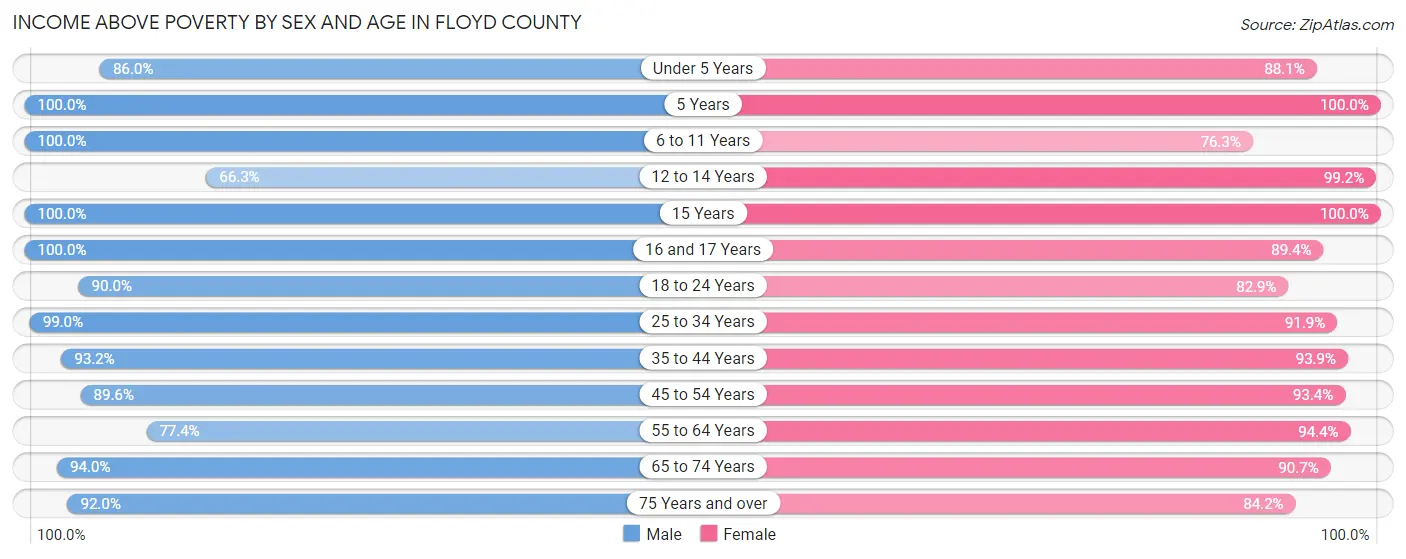
| Age Bracket | Male | Female |
| Under 5 Years | 301 (86.0%) | 274 (88.1%) |
| 5 Years | 51 (100.0%) | 12 (100.0%) |
| 6 to 11 Years | 595 (100.0%) | 315 (76.3%) |
| 12 to 14 Years | 106 (66.2%) | 355 (99.2%) |
| 15 Years | 40 (100.0%) | 136 (100.0%) |
| 16 and 17 Years | 239 (100.0%) | 118 (89.4%) |
| 18 to 24 Years | 502 (90.0%) | 397 (82.9%) |
| 25 to 34 Years | 816 (99.0%) | 729 (91.9%) |
| 35 to 44 Years | 778 (93.2%) | 742 (93.9%) |
| 45 to 54 Years | 974 (89.6%) | 920 (93.4%) |
| 55 to 64 Years | 920 (77.4%) | 1,316 (94.4%) |
| 65 to 74 Years | 965 (94.0%) | 1,014 (90.7%) |
| 75 Years and over | 600 (92.0%) | 746 (84.2%) |
| Total | 6,887 (90.5%) | 7,074 (90.6%) |
Income Below Poverty Among Married-Couple Families in Floyd County
The poverty statistics for married-couple families in Floyd County show that 4.2% or 146 of the total 3,482 families live below the poverty line. Families with 3 or 4 children have the highest poverty rate of 27.5%, comprising of 39 families. On the other hand, families with 1 or 2 children have the lowest poverty rate of 1.6%, which includes 18 families.
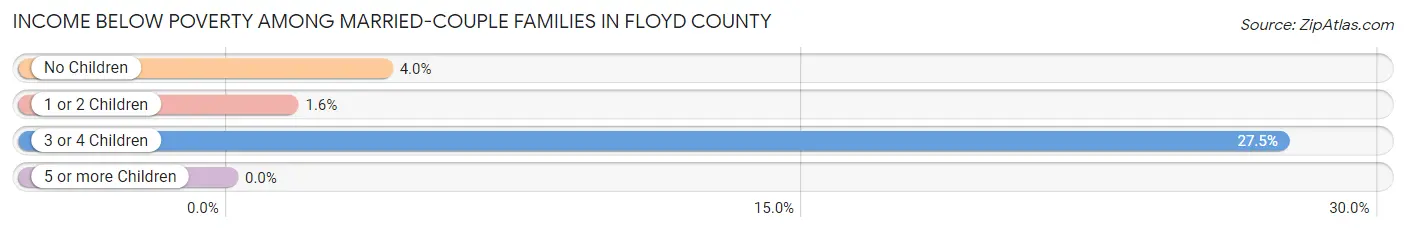
| Children | Above Poverty | Below Poverty |
| No Children | 2,115 (96.0%) | 89 (4.0%) |
| 1 or 2 Children | 1,118 (98.4%) | 18 (1.6%) |
| 3 or 4 Children | 103 (72.5%) | 39 (27.5%) |
| 5 or more Children | 0 (0.0%) | 0 (0.0%) |
| Total | 3,336 (95.8%) | 146 (4.2%) |
Income Below Poverty Among Single-Parent Households in Floyd County
According to the poverty data in Floyd County, 6.0% or 17 single-father households and 12.9% or 65 single-mother households are living below the poverty line. Among single-father households, those with 1 or 2 children have the highest poverty rate, with 17 households (10.0%) experiencing poverty. Likewise, among single-mother households, those with 1 or 2 children have the highest poverty rate, with 63 households (31.8%) falling below the poverty line.
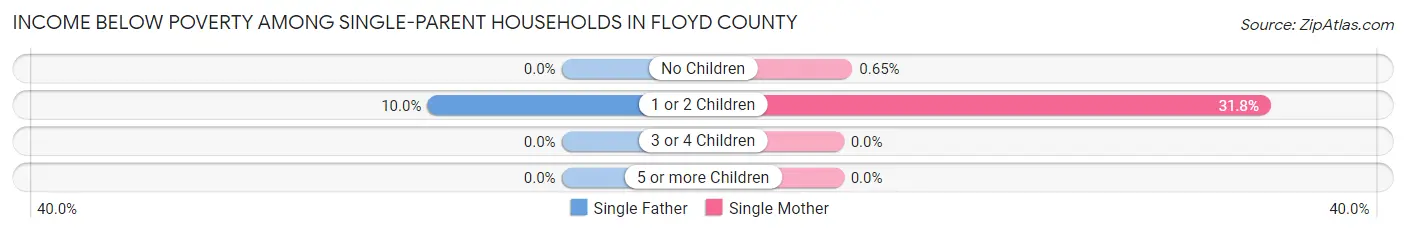
| Children | Single Father | Single Mother |
| No Children | 0 (0.0%) | 2 (0.6%) |
| 1 or 2 Children | 17 (10.0%) | 63 (31.8%) |
| 3 or 4 Children | 0 (0.0%) | 0 (0.0%) |
| 5 or more Children | 0 (0.0%) | 0 (0.0%) |
| Total | 17 (6.0%) | 65 (12.9%) |
Income Below Poverty Among Married-Couple vs Single-Parent Households in Floyd County
The poverty data for Floyd County shows that 146 of the married-couple family households (4.2%) and 82 of the single-parent households (10.4%) are living below the poverty level. Within the married-couple family households, those with 3 or 4 children have the highest poverty rate, with 39 households (27.5%) falling below the poverty line. Among the single-parent households, those with 1 or 2 children have the highest poverty rate, with 80 household (21.7%) living below poverty.
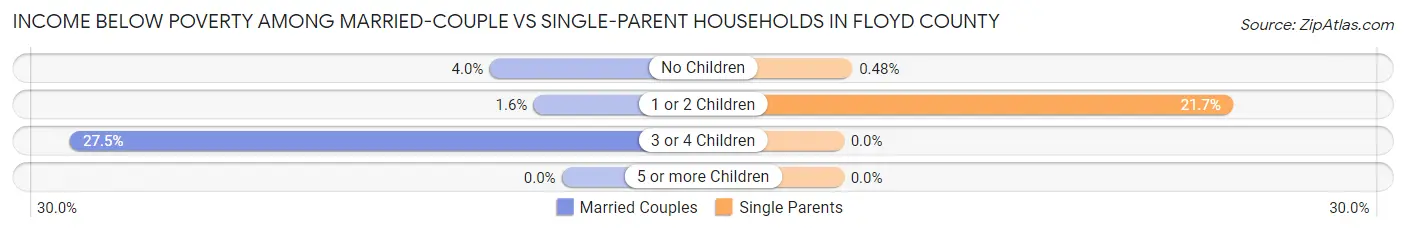
| Children | Married-Couple Families | Single-Parent Households |
| No Children | 89 (4.0%) | 2 (0.5%) |
| 1 or 2 Children | 18 (1.6%) | 80 (21.7%) |
| 3 or 4 Children | 39 (27.5%) | 0 (0.0%) |
| 5 or more Children | 0 (0.0%) | 0 (0.0%) |
| Total | 146 (4.2%) | 82 (10.4%) |
Race in Floyd County
The most populous races in Floyd County are White / Caucasian (14,621 | 94.1%), Black / African American (469 | 3.0%), and Hispanic or Latino (456 | 2.9%).
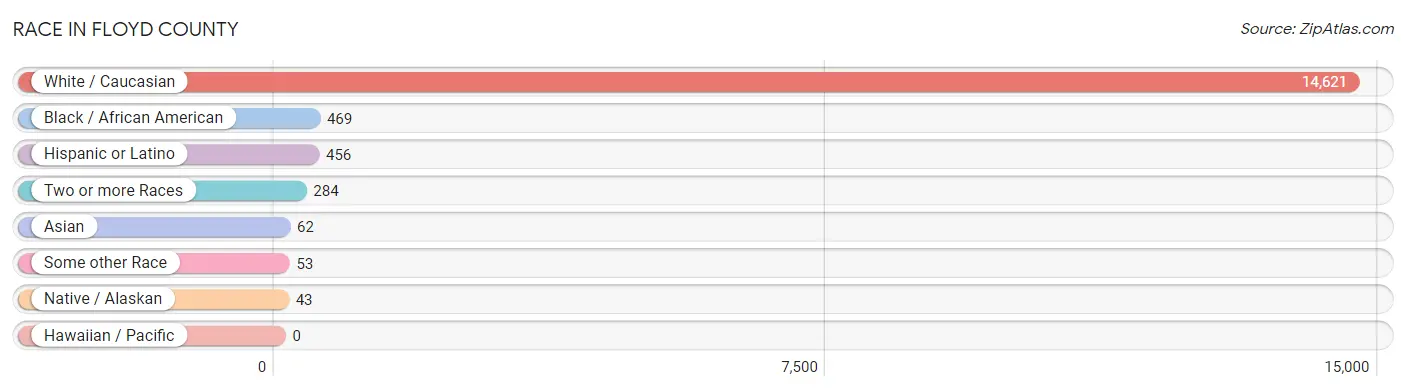
| Race | # Population | % Population |
| Asian | 62 | 0.4% |
| Black / African American | 469 | 3.0% |
| Hawaiian / Pacific | 0 | 0.0% |
| Hispanic or Latino | 456 | 2.9% |
| Native / Alaskan | 43 | 0.3% |
| White / Caucasian | 14,621 | 94.1% |
| Two or more Races | 284 | 1.8% |
| Some other Race | 53 | 0.3% |
| Total | 15,532 | 100.0% |
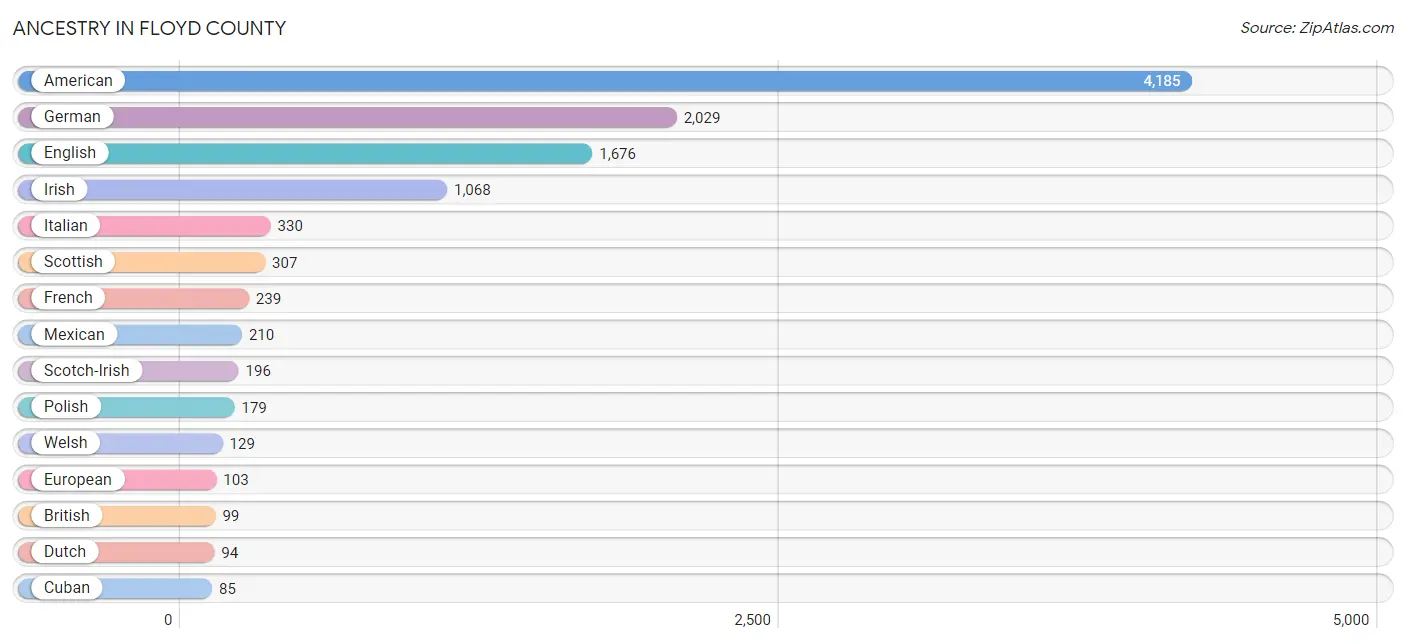
Ancestry in Floyd County
The most populous ancestries reported in Floyd County are American (4,185 | 26.9%), German (2,029 | 13.1%), English (1,676 | 10.8%), Irish (1,068 | 6.9%), and Italian (330 | 2.1%), together accounting for 59.8% of all Floyd County residents.
| Ancestry | # Population | % Population |
| American | 4,185 | 26.9% |
| Arab | 34 | 0.2% |
| Austrian | 33 | 0.2% |
| Bhutanese | 7 | 0.1% |
| Blackfeet | 5 | 0.0% |
| British | 99 | 0.6% |
| Burmese | 11 | 0.1% |
| Cherokee | 17 | 0.1% |
| Croatian | 17 | 0.1% |
| Cuban | 85 | 0.5% |
| Czech | 5 | 0.0% |
| Danish | 13 | 0.1% |
| Dutch | 94 | 0.6% |
| Eastern European | 34 | 0.2% |
| Egyptian | 34 | 0.2% |
| English | 1,676 | 10.8% |
| Estonian | 24 | 0.2% |
| European | 103 | 0.7% |
| French | 239 | 1.5% |
| German | 2,029 | 13.1% |
| Indian (Asian) | 40 | 0.3% |
| Irish | 1,068 | 6.9% |
| Italian | 330 | 2.1% |
| Korean | 41 | 0.3% |
| Lithuanian | 26 | 0.2% |
| Mexican | 210 | 1.3% |
| Norwegian | 23 | 0.2% |
| Pakistani | 7 | 0.1% |
| Peruvian | 27 | 0.2% |
| Polish | 179 | 1.1% |
| Puerto Rican | 78 | 0.5% |
| Romanian | 5 | 0.0% |
| Russian | 15 | 0.1% |
| Scandinavian | 13 | 0.1% |
| Scotch-Irish | 196 | 1.3% |
| Scottish | 307 | 2.0% |
| Serbian | 55 | 0.4% |
| Slovak | 28 | 0.2% |
| South American | 27 | 0.2% |
| Spanish | 53 | 0.3% |
| Sri Lankan | 20 | 0.1% |
| Swedish | 24 | 0.2% |
| Swiss | 20 | 0.1% |
| Ukrainian | 34 | 0.2% |
| Welsh | 129 | 0.8% | View All 45 Rows |
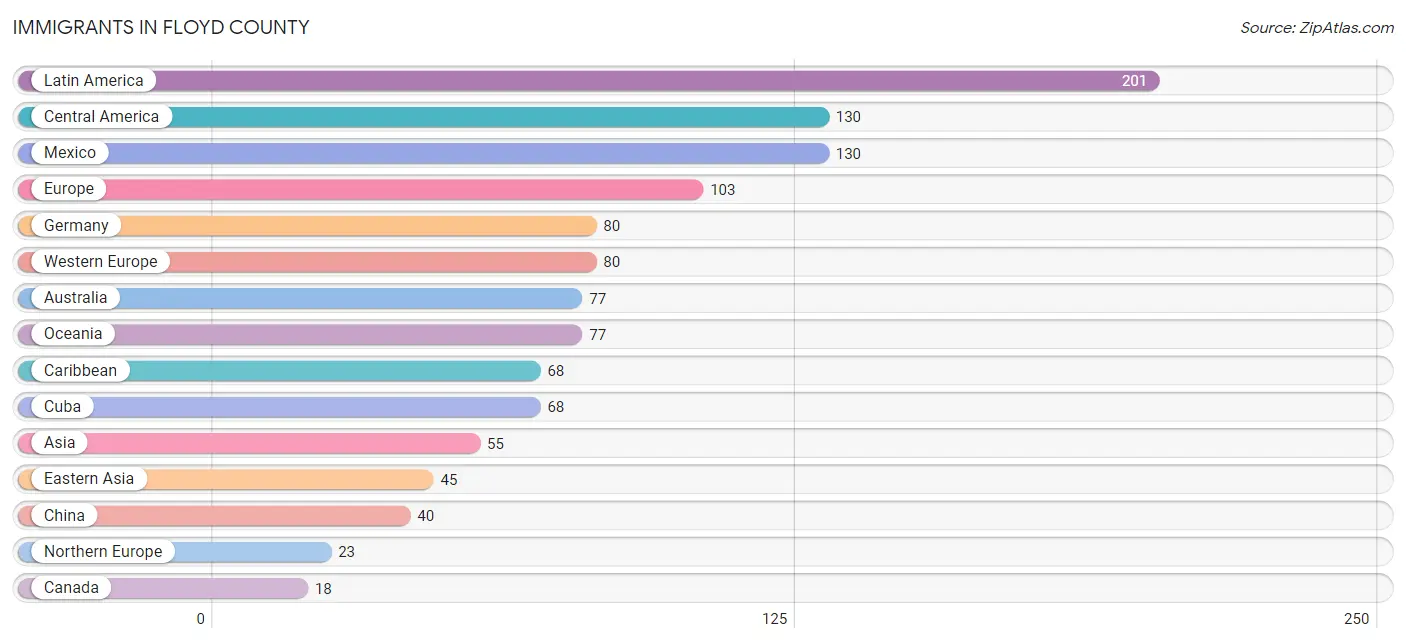
Immigrants in Floyd County
The most numerous immigrant groups reported in Floyd County came from Latin America (201 | 1.3%), Central America (130 | 0.8%), Mexico (130 | 0.8%), Europe (103 | 0.7%), and Germany (80 | 0.5%), together accounting for 4.1% of all Floyd County residents.
| Immigration Origin | # Population | % Population |
| Africa | 10 | 0.1% |
| Asia | 55 | 0.4% |
| Australia | 77 | 0.5% |
| Bolivia | 3 | 0.0% |
| Canada | 18 | 0.1% |
| Caribbean | 68 | 0.4% |
| Central America | 130 | 0.8% |
| China | 40 | 0.3% |
| Cuba | 68 | 0.4% |
| Eastern Asia | 45 | 0.3% |
| Egypt | 10 | 0.1% |
| Europe | 103 | 0.7% |
| Germany | 80 | 0.5% |
| Korea | 5 | 0.0% |
| Latin America | 201 | 1.3% |
| Mexico | 130 | 0.8% |
| Northern Africa | 10 | 0.1% |
| Northern Europe | 23 | 0.2% |
| Oceania | 77 | 0.5% |
| Philippines | 10 | 0.1% |
| South America | 3 | 0.0% |
| South Eastern Asia | 10 | 0.1% |
| Sweden | 11 | 0.1% |
| Western Europe | 80 | 0.5% | View All 24 Rows |
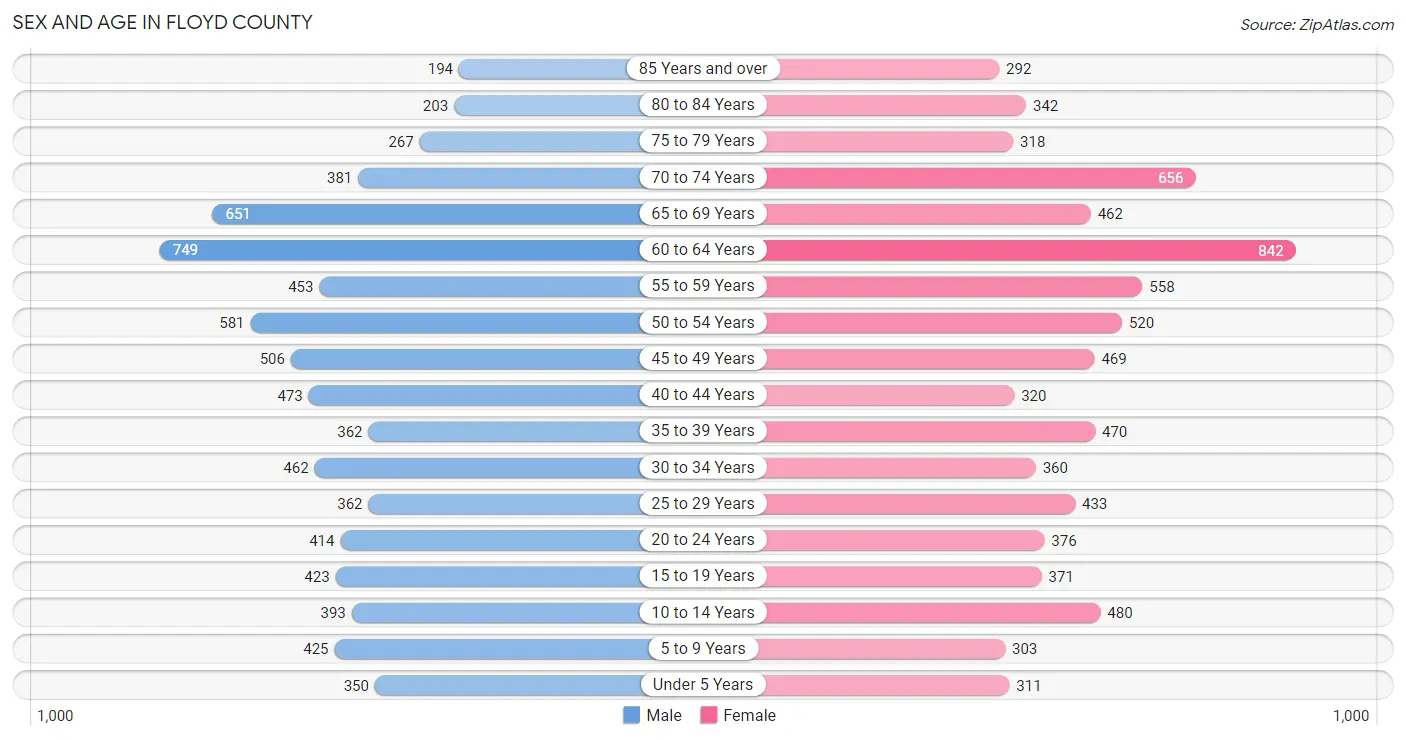
Sex and Age in Floyd County
Sex and Age in Floyd County
The most populous age groups in Floyd County are 60 to 64 Years (749 | 9.8%) for men and 60 to 64 Years (842 | 10.7%) for women.
| Age Bracket | Male | Female |
| Under 5 Years | 350 (4.6%) | 311 (4.0%) |
| 5 to 9 Years | 425 (5.6%) | 303 (3.8%) |
| 10 to 14 Years | 393 (5.1%) | 480 (6.1%) |
| 15 to 19 Years | 423 (5.5%) | 371 (4.7%) |
| 20 to 24 Years | 414 (5.4%) | 376 (4.8%) |
| 25 to 29 Years | 362 (4.7%) | 433 (5.5%) |
| 30 to 34 Years | 462 (6.0%) | 360 (4.6%) |
| 35 to 39 Years | 362 (4.7%) | 470 (6.0%) |
| 40 to 44 Years | 473 (6.2%) | 320 (4.1%) |
| 45 to 49 Years | 506 (6.6%) | 469 (5.9%) |
| 50 to 54 Years | 581 (7.6%) | 520 (6.6%) |
| 55 to 59 Years | 453 (5.9%) | 558 (7.1%) |
| 60 to 64 Years | 749 (9.8%) | 842 (10.7%) |
| 65 to 69 Years | 651 (8.5%) | 462 (5.9%) |
| 70 to 74 Years | 381 (5.0%) | 656 (8.3%) |
| 75 to 79 Years | 267 (3.5%) | 318 (4.0%) |
| 80 to 84 Years | 203 (2.6%) | 342 (4.3%) |
| 85 Years and over | 194 (2.5%) | 292 (3.7%) |
| Total | 7,649 (100.0%) | 7,883 (100.0%) |
Families and Households in Floyd County
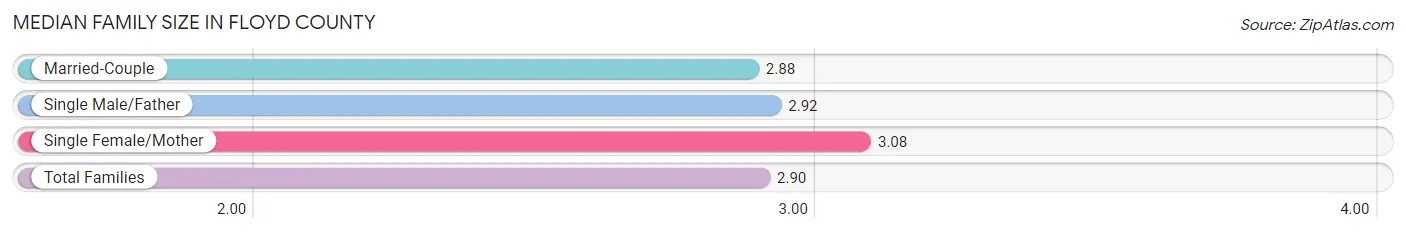
Median Family Size in Floyd County
The median family size in Floyd County is 2.90 persons per family, with single female/mother families (504 | 11.8%) accounting for the largest median family size of 3.08 persons per family. On the other hand, married-couple families (3,482 | 81.6%) represent the smallest median family size with 2.88 persons per family.
| Family Type | # Families | Family Size |
| Married-Couple | 3,482 (81.6%) | 2.88 |
| Single Male/Father | 284 (6.7%) | 2.92 |
| Single Female/Mother | 504 (11.8%) | 3.08 |
| Total Families | 4,270 (100.0%) | 2.90 |
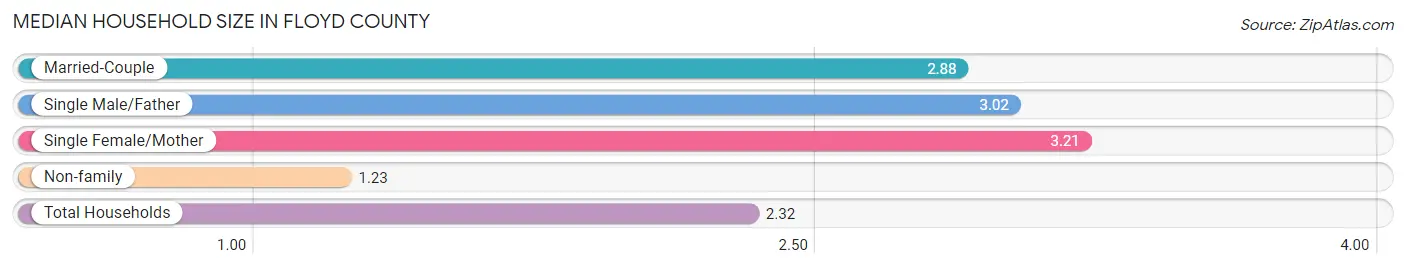
Median Household Size in Floyd County
The median household size in Floyd County is 2.32 persons per household, with single female/mother households (504 | 7.6%) accounting for the largest median household size of 3.21 persons per household. non-family households (2,385 | 35.8%) represent the smallest median household size with 1.23 persons per household.
| Household Type | # Households | Household Size |
| Married-Couple | 3,482 (52.3%) | 2.88 |
| Single Male/Father | 284 (4.3%) | 3.02 |
| Single Female/Mother | 504 (7.6%) | 3.21 |
| Non-family | 2,385 (35.8%) | 1.23 |
| Total Households | 6,655 (100.0%) | 2.32 |
Household Size by Marriage Status in Floyd County
Out of a total of 6,655 households in Floyd County, 4,270 (64.2%) are family households, while 2,385 (35.8%) are nonfamily households. The most numerous type of family households are 2-person households, comprising 2,319, and the most common type of nonfamily households are 1-person households, comprising 2,030.
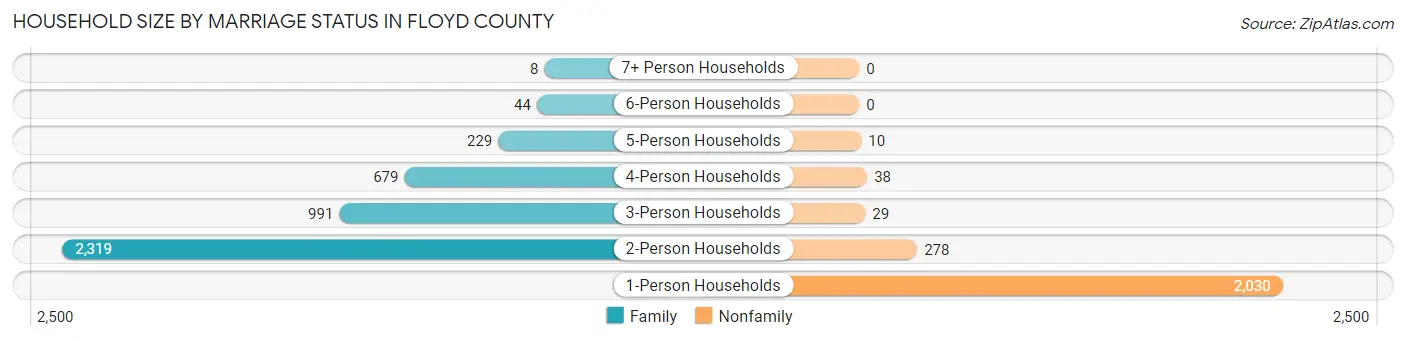
| Household Size | Family Households | Nonfamily Households |
| 1-Person Households | - | 2,030 (30.5%) |
| 2-Person Households | 2,319 (34.8%) | 278 (4.2%) |
| 3-Person Households | 991 (14.9%) | 29 (0.4%) |
| 4-Person Households | 679 (10.2%) | 38 (0.6%) |
| 5-Person Households | 229 (3.4%) | 10 (0.2%) |
| 6-Person Households | 44 (0.7%) | 0 (0.0%) |
| 7+ Person Households | 8 (0.1%) | 0 (0.0%) |
| Total | 4,270 (64.2%) | 2,385 (35.8%) |
Female Fertility in Floyd County
Fertility by Age in Floyd County
Average fertility rate in Floyd County is 32.0 births per 1,000 women. Women in the age bracket of 20 to 34 years have the highest fertility rate with 53.0 births per 1,000 women. Women in the age bracket of 20 to 34 years acount for 66.7% of all women with births.
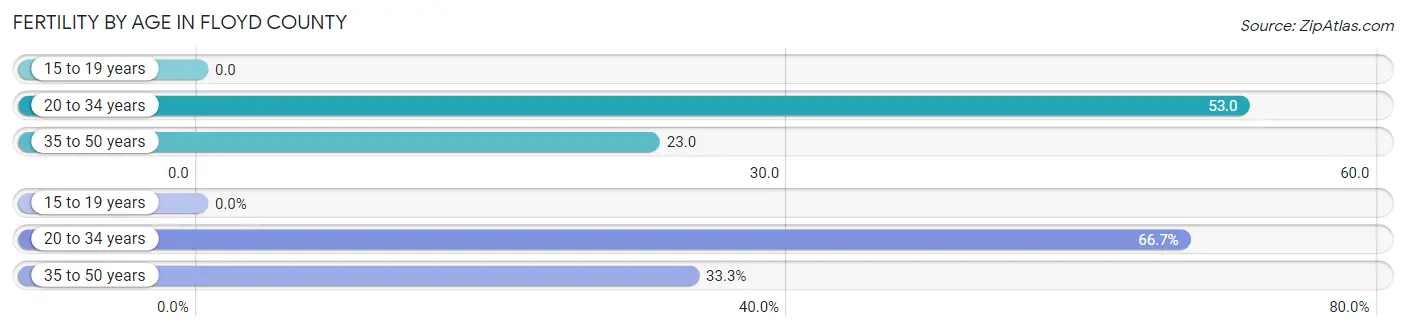
| Age Bracket | Women with Births | Births / 1,000 Women |
| 15 to 19 years | 0 (0.0%) | 0.0 |
| 20 to 34 years | 62 (66.7%) | 53.0 |
| 35 to 50 years | 31 (33.3%) | 23.0 |
| Total | 93 (100.0%) | 32.0 |
Fertility by Age by Marriage Status in Floyd County
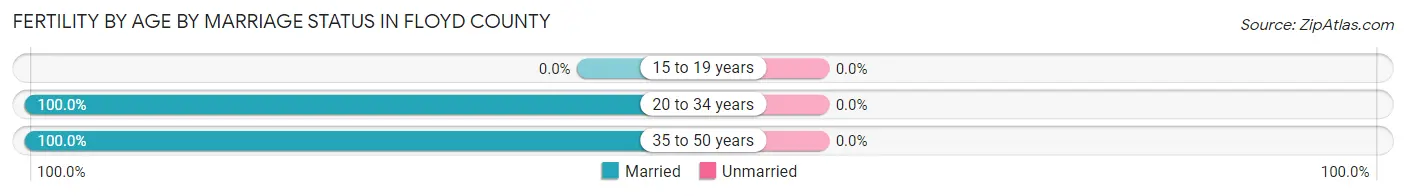
| Age Bracket | Married | Unmarried |
| 15 to 19 years | 0 (0.0%) | 0 (0.0%) |
| 20 to 34 years | 62 (100.0%) | 0 (0.0%) |
| 35 to 50 years | 31 (100.0%) | 0 (0.0%) |
| Total | 93 (100.0%) | 0 (0.0%) |
Fertility by Education in Floyd County
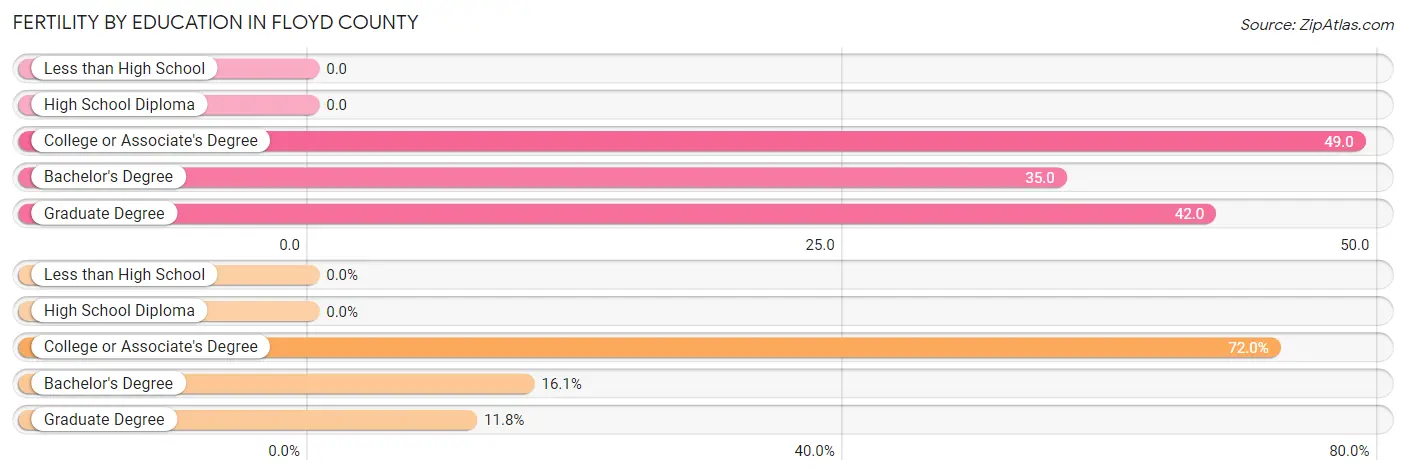
| Educational Attainment | Women with Births | Births / 1,000 Women |
| Less than High School | 0 (0.0%) | 0.0 |
| High School Diploma | 0 (0.0%) | 0.0 |
| College or Associate's Degree | 67 (72.0%) | 49.0 |
| Bachelor's Degree | 15 (16.1%) | 35.0 |
| Graduate Degree | 11 (11.8%) | 42.0 |
| Total | 93 (100.0%) | 32.0 |
Fertility by Education by Marriage Status in Floyd County
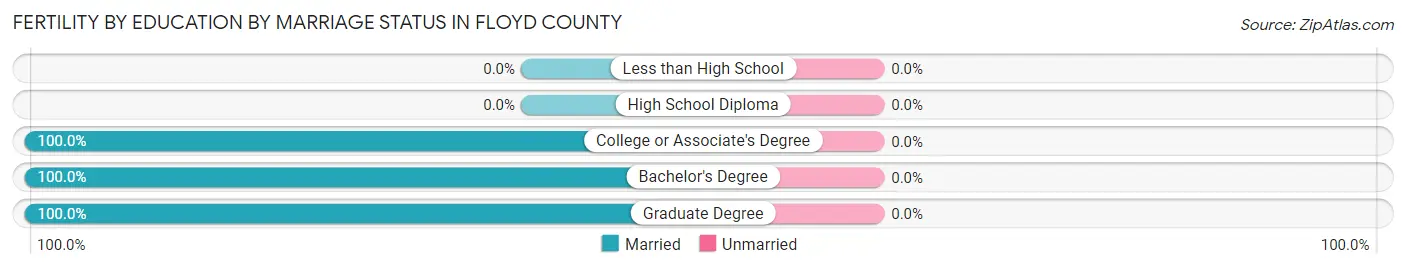
| Educational Attainment | Married | Unmarried |
| Less than High School | 0 (0.0%) | 0 (0.0%) |
| High School Diploma | 0 (0.0%) | 0 (0.0%) |
| College or Associate's Degree | 67 (100.0%) | 0 (0.0%) |
| Bachelor's Degree | 15 (100.0%) | 0 (0.0%) |
| Graduate Degree | 11 (100.0%) | 0 (0.0%) |
| Total | 93 (100.0%) | 0 (0.0%) |
Employment Characteristics in Floyd County
Employment by Class of Employer in Floyd County
Among the 7,584 employed individuals in Floyd County, private company employees (5,326 | 70.2%), not-for-profit organizations (560 | 7.4%), and self-employed (not incorporated) (523 | 6.9%) make up the most common classes of employment.
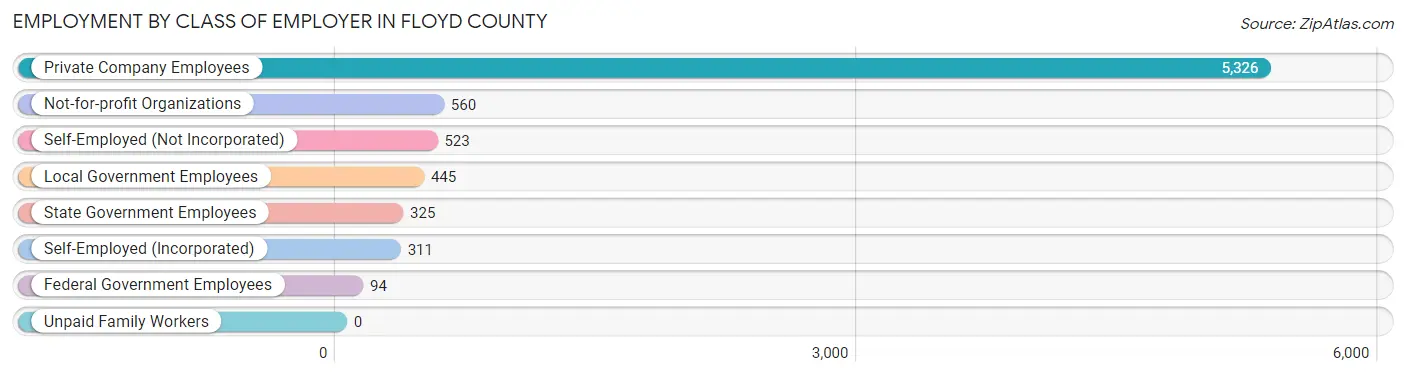
| Employer Class | # Employees | % Employees |
| Private Company Employees | 5,326 | 70.2% |
| Self-Employed (Incorporated) | 311 | 4.1% |
| Self-Employed (Not Incorporated) | 523 | 6.9% |
| Not-for-profit Organizations | 560 | 7.4% |
| Local Government Employees | 445 | 5.9% |
| State Government Employees | 325 | 4.3% |
| Federal Government Employees | 94 | 1.2% |
| Unpaid Family Workers | 0 | 0.0% |
| Total | 7,584 | 100.0% |
Employment Status by Age in Floyd County
According to the labor force statistics for Floyd County, out of the total population over 16 years of age (13,094), 60.1% or 7,869 individuals are in the labor force, with 2.6% or 205 of them unemployed. The age group with the highest labor force participation rate is 25 to 29 years, with 94.8% or 754 individuals in the labor force. Within the labor force, the 30 to 34 years age range has the highest percentage of unemployed individuals, with 5.3% or 39 of them being unemployed.
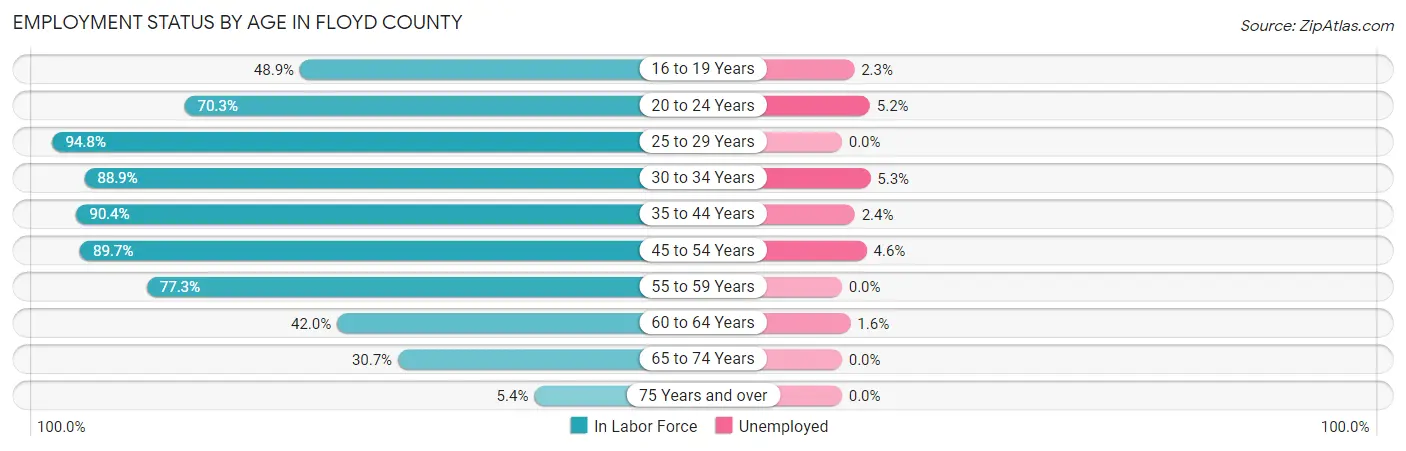
| Age Bracket | In Labor Force | Unemployed |
| 16 to 19 Years | 302 (48.9%) | 7 (2.3%) |
| 20 to 24 Years | 555 (70.3%) | 29 (5.2%) |
| 25 to 29 Years | 754 (94.8%) | 0 (0.0%) |
| 30 to 34 Years | 731 (88.9%) | 39 (5.3%) |
| 35 to 44 Years | 1,469 (90.4%) | 35 (2.4%) |
| 45 to 54 Years | 1,862 (89.7%) | 86 (4.6%) |
| 55 to 59 Years | 782 (77.3%) | 0 (0.0%) |
| 60 to 64 Years | 668 (42.0%) | 11 (1.6%) |
| 65 to 74 Years | 660 (30.7%) | 0 (0.0%) |
| 75 Years and over | 87 (5.4%) | 0 (0.0%) |
| Total | 7,869 (60.1%) | 205 (2.6%) |
Employment Status by Educational Attainment in Floyd County
According to labor force statistics for Floyd County, 79.1% of individuals (6,265) out of the total population between 25 and 64 years of age (7,920) are in the labor force, with 2.7% or 169 of them being unemployed. The group with the highest labor force participation rate are those with the educational attainment of college / associate degree, with 89.1% or 2,328 individuals in the labor force. Within the labor force, individuals with bachelor's degree or higher education have the highest percentage of unemployment, with 6.0% or 88 of them being unemployed.
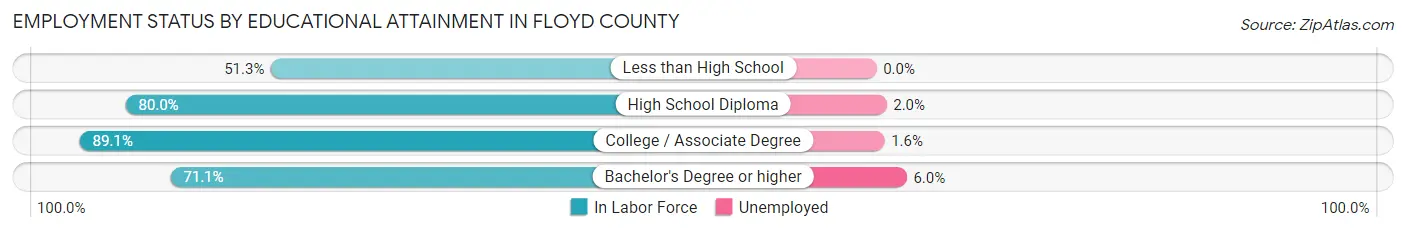
| Educational Attainment | In Labor Force | Unemployed |
| Less than High School | 217 (51.3%) | 0 (0.0%) |
| High School Diploma | 2,248 (80.0%) | 56 (2.0%) |
| College / Associate Degree | 2,328 (89.1%) | 42 (1.6%) |
| Bachelor's Degree or higher | 1,475 (71.1%) | 124 (6.0%) |
| Total | 6,265 (79.1%) | 214 (2.7%) |
Employment Occupations by Sex in Floyd County
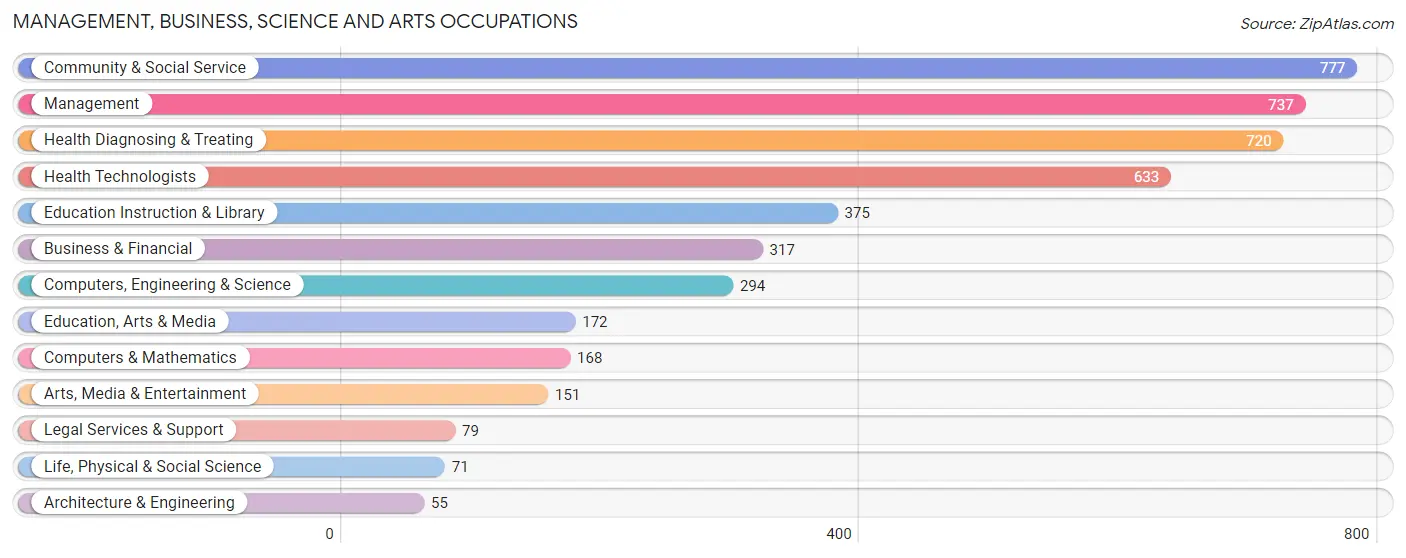
Management, Business, Science and Arts Occupations
The most common Management, Business, Science and Arts occupations in Floyd County are Community & Social Service (777 | 10.2%), Management (737 | 9.6%), Health Diagnosing & Treating (720 | 9.4%), Health Technologists (633 | 8.3%), and Education Instruction & Library (375 | 4.9%).
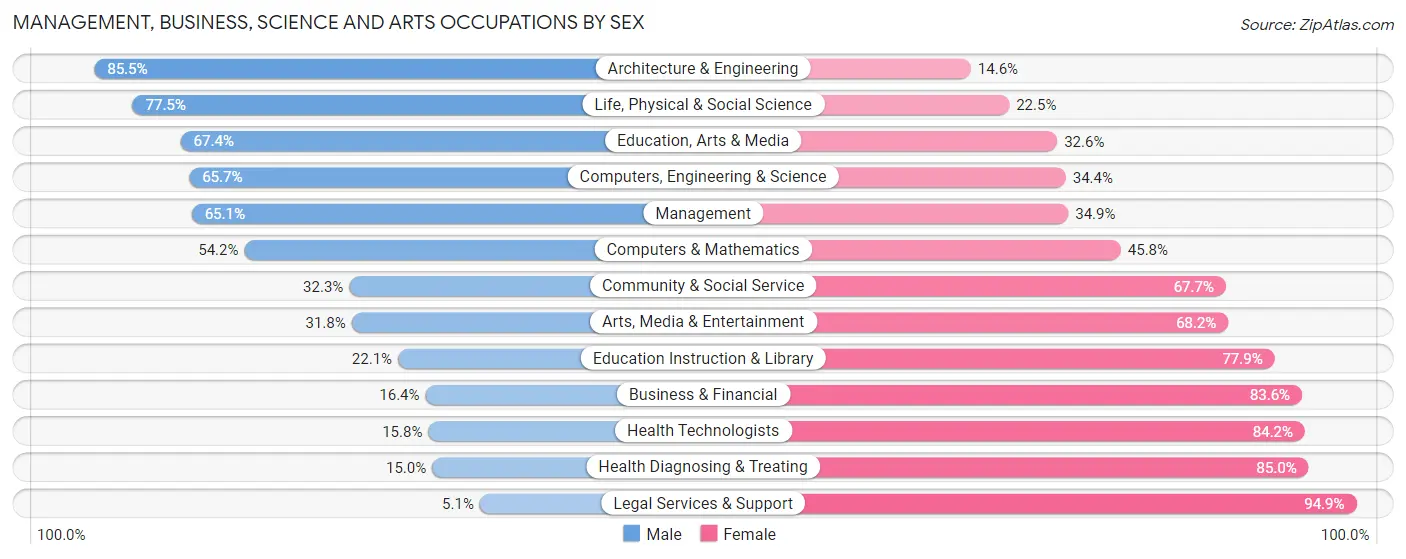
Management, Business, Science and Arts Occupations by Sex
Within the Management, Business, Science and Arts occupations in Floyd County, the most male-oriented occupations are Architecture & Engineering (85.5%), Life, Physical & Social Science (77.5%), and Education, Arts & Media (67.4%), while the most female-oriented occupations are Legal Services & Support (94.9%), Health Diagnosing & Treating (85.0%), and Health Technologists (84.2%).
| Occupation | Male | Female |
| Management | 480 (65.1%) | 257 (34.9%) |
| Business & Financial | 52 (16.4%) | 265 (83.6%) |
| Computers, Engineering & Science | 193 (65.6%) | 101 (34.4%) |
| Computers & Mathematics | 91 (54.2%) | 77 (45.8%) |
| Architecture & Engineering | 47 (85.5%) | 8 (14.5%) |
| Life, Physical & Social Science | 55 (77.5%) | 16 (22.5%) |
| Community & Social Service | 251 (32.3%) | 526 (67.7%) |
| Education, Arts & Media | 116 (67.4%) | 56 (32.6%) |
| Legal Services & Support | 4 (5.1%) | 75 (94.9%) |
| Education Instruction & Library | 83 (22.1%) | 292 (77.9%) |
| Arts, Media & Entertainment | 48 (31.8%) | 103 (68.2%) |
| Health Diagnosing & Treating | 108 (15.0%) | 612 (85.0%) |
| Health Technologists | 100 (15.8%) | 533 (84.2%) |
| Total (Category) | 1,084 (38.1%) | 1,761 (61.9%) |
| Total (Overall) | 3,804 (49.7%) | 3,848 (50.3%) |
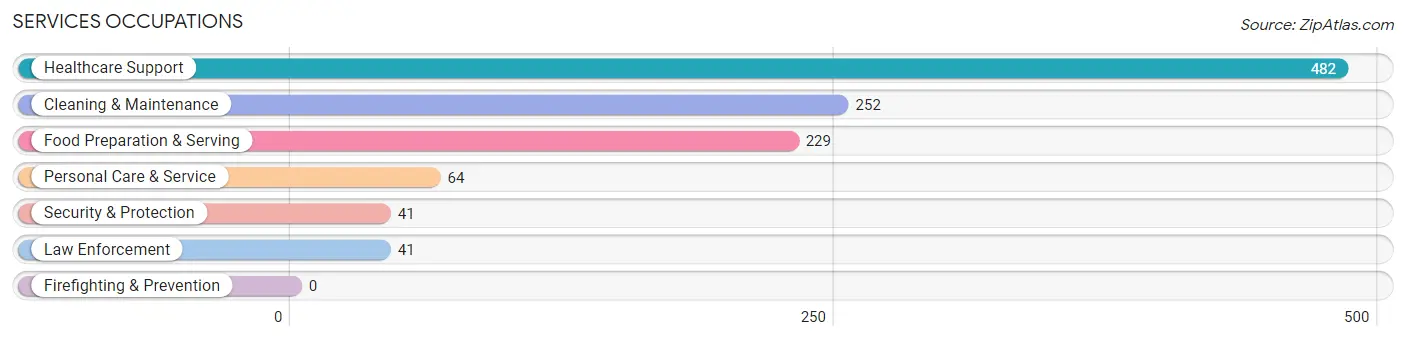
Services Occupations
The most common Services occupations in Floyd County are Healthcare Support (482 | 6.3%), Cleaning & Maintenance (252 | 3.3%), Food Preparation & Serving (229 | 3.0%), Personal Care & Service (64 | 0.8%), and Security & Protection (41 | 0.5%).
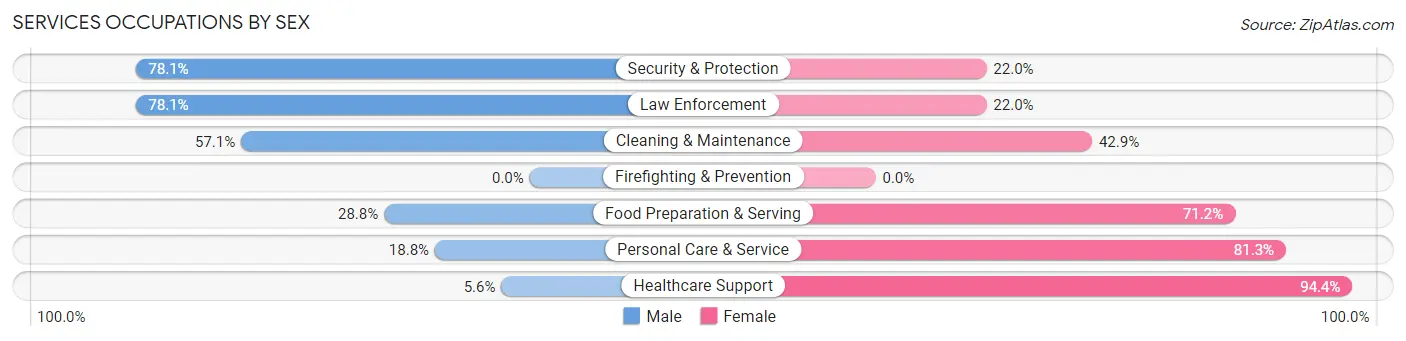
Services Occupations by Sex
Within the Services occupations in Floyd County, the most male-oriented occupations are Security & Protection (78.0%), Law Enforcement (78.0%), and Cleaning & Maintenance (57.1%), while the most female-oriented occupations are Healthcare Support (94.4%), Personal Care & Service (81.2%), and Food Preparation & Serving (71.2%).
| Occupation | Male | Female |
| Healthcare Support | 27 (5.6%) | 455 (94.4%) |
| Security & Protection | 32 (78.0%) | 9 (22.0%) |
| Firefighting & Prevention | 0 (0.0%) | 0 (0.0%) |
| Law Enforcement | 32 (78.0%) | 9 (22.0%) |
| Food Preparation & Serving | 66 (28.8%) | 163 (71.2%) |
| Cleaning & Maintenance | 144 (57.1%) | 108 (42.9%) |
| Personal Care & Service | 12 (18.8%) | 52 (81.2%) |
| Total (Category) | 281 (26.3%) | 787 (73.7%) |
| Total (Overall) | 3,804 (49.7%) | 3,848 (50.3%) |
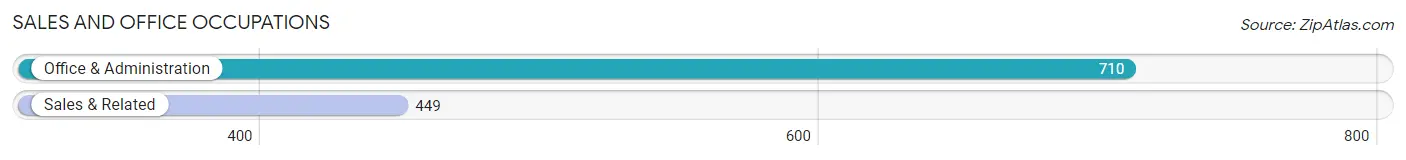
Sales and Office Occupations
The most common Sales and Office occupations in Floyd County are Office & Administration (710 | 9.3%), and Sales & Related (449 | 5.9%).
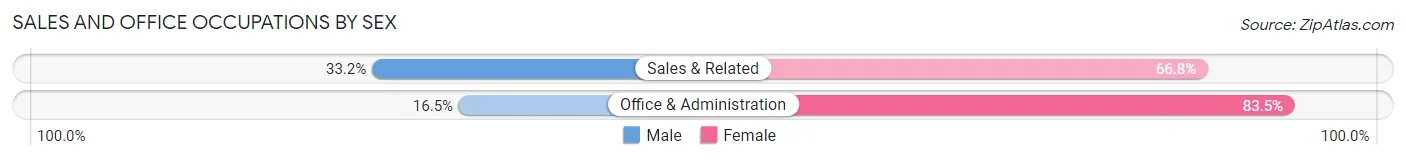
Sales and Office Occupations by Sex
| Occupation | Male | Female |
| Sales & Related | 149 (33.2%) | 300 (66.8%) |
| Office & Administration | 117 (16.5%) | 593 (83.5%) |
| Total (Category) | 266 (23.0%) | 893 (77.0%) |
| Total (Overall) | 3,804 (49.7%) | 3,848 (50.3%) |
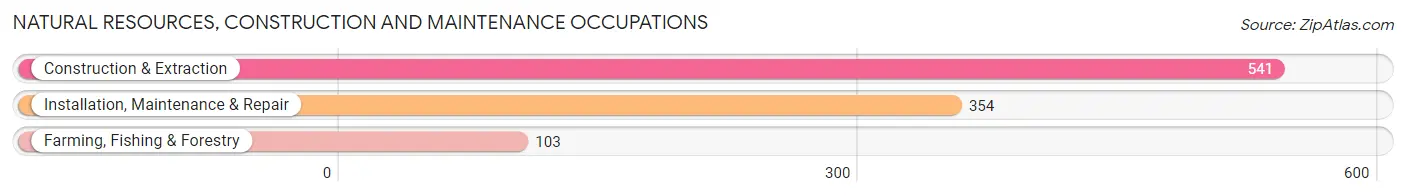
Natural Resources, Construction and Maintenance Occupations
The most common Natural Resources, Construction and Maintenance occupations in Floyd County are Construction & Extraction (541 | 7.1%), Installation, Maintenance & Repair (354 | 4.6%), and Farming, Fishing & Forestry (103 | 1.3%).
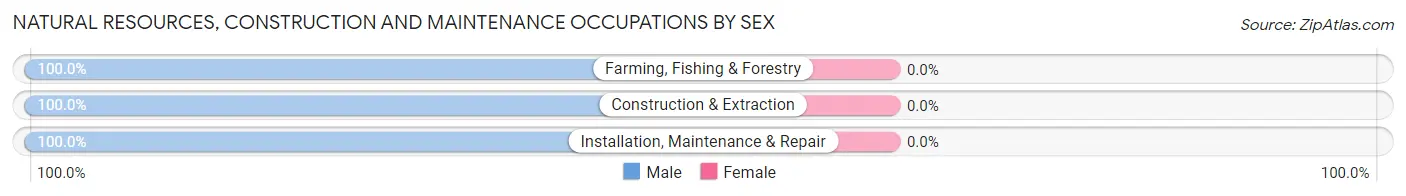
Natural Resources, Construction and Maintenance Occupations by Sex
| Occupation | Male | Female |
| Farming, Fishing & Forestry | 103 (100.0%) | 0 (0.0%) |
| Construction & Extraction | 541 (100.0%) | 0 (0.0%) |
| Installation, Maintenance & Repair | 354 (100.0%) | 0 (0.0%) |
| Total (Category) | 998 (100.0%) | 0 (0.0%) |
| Total (Overall) | 3,804 (49.7%) | 3,848 (50.3%) |
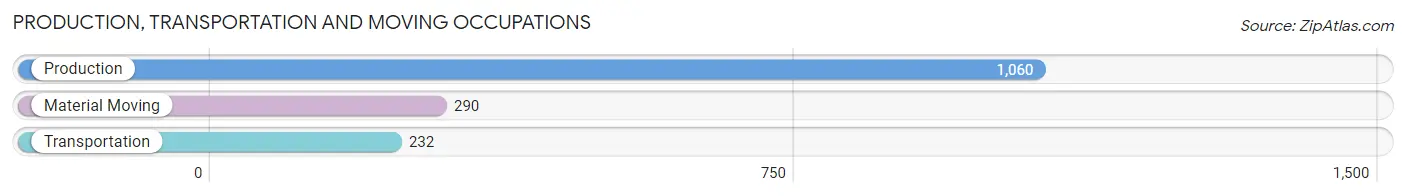
Production, Transportation and Moving Occupations
The most common Production, Transportation and Moving occupations in Floyd County are Production (1,060 | 13.9%), Material Moving (290 | 3.8%), and Transportation (232 | 3.0%).
Production, Transportation and Moving Occupations by Sex
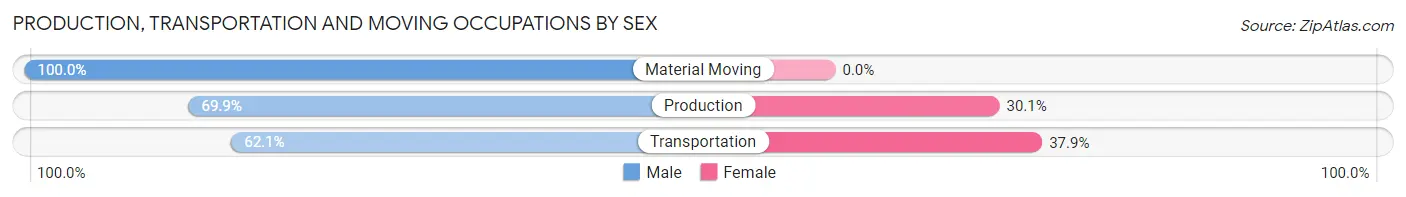
| Occupation | Male | Female |
| Production | 741 (69.9%) | 319 (30.1%) |
| Transportation | 144 (62.1%) | 88 (37.9%) |
| Material Moving | 290 (100.0%) | 0 (0.0%) |
| Total (Category) | 1,175 (74.3%) | 407 (25.7%) |
| Total (Overall) | 3,804 (49.7%) | 3,848 (50.3%) |
Employment Industries by Sex in Floyd County
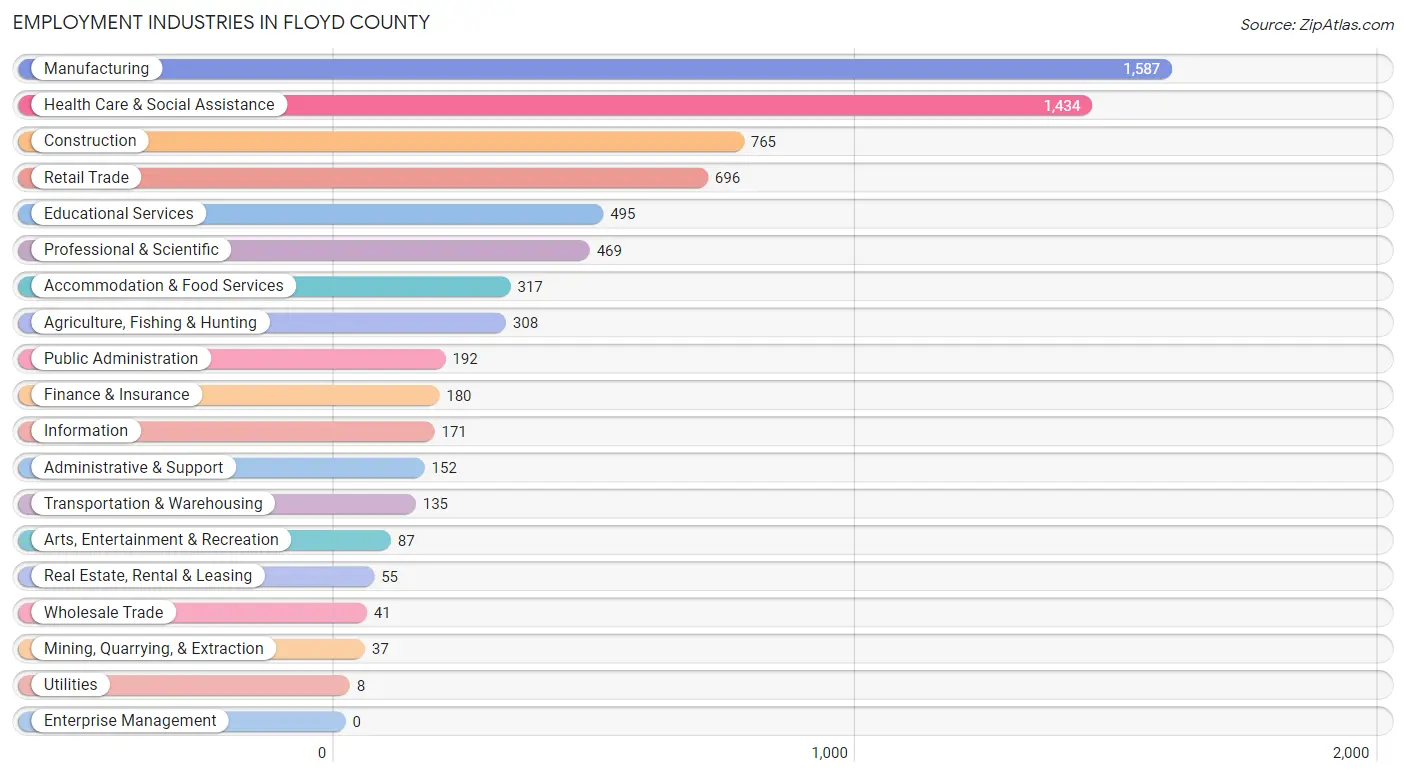
Employment Industries in Floyd County
The major employment industries in Floyd County include Manufacturing (1,587 | 20.7%), Health Care & Social Assistance (1,434 | 18.7%), Construction (765 | 10.0%), Retail Trade (696 | 9.1%), and Educational Services (495 | 6.5%).
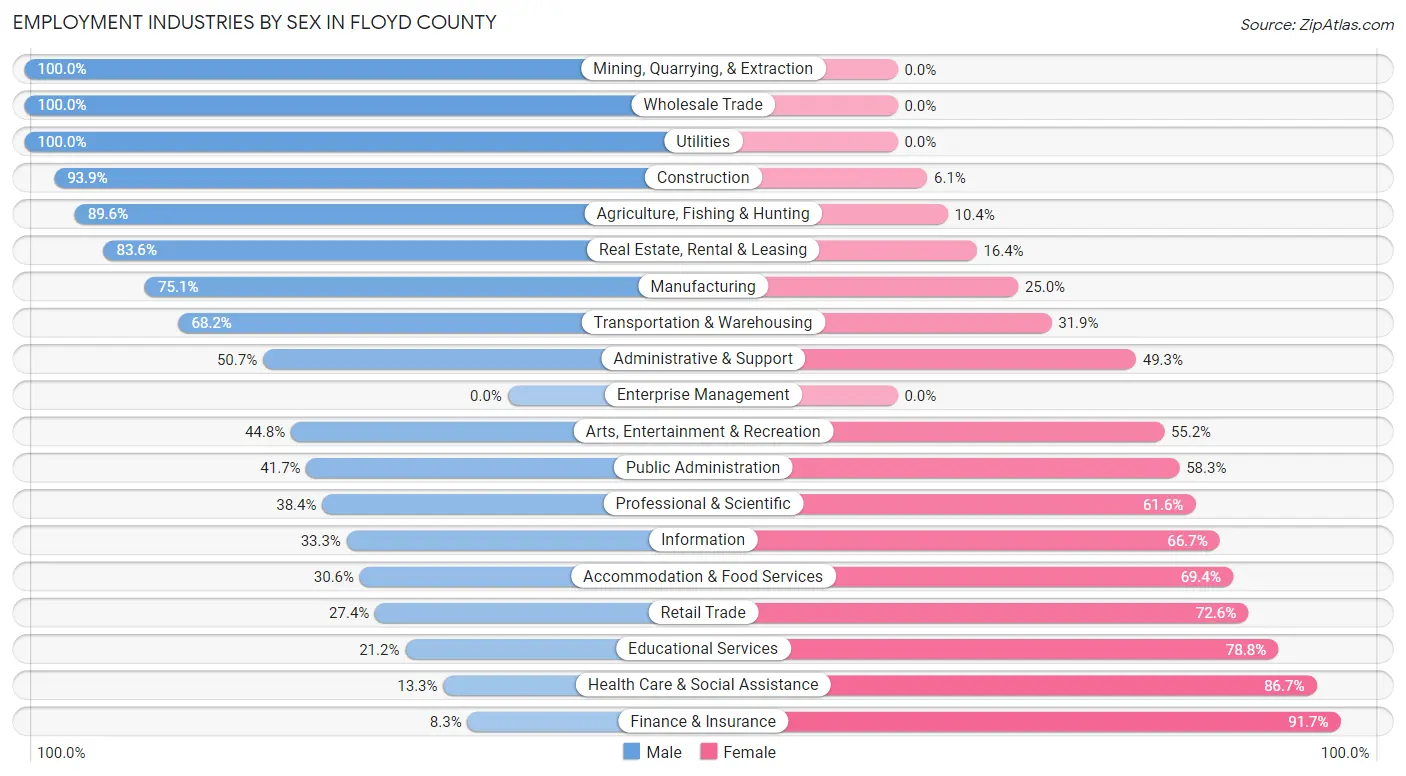
Employment Industries by Sex in Floyd County
The Floyd County industries that see more men than women are Mining, Quarrying, & Extraction (100.0%), Wholesale Trade (100.0%), and Utilities (100.0%), whereas the industries that tend to have a higher number of women are Finance & Insurance (91.7%), Health Care & Social Assistance (86.7%), and Educational Services (78.8%).
| Industry | Male | Female |
| Agriculture, Fishing & Hunting | 276 (89.6%) | 32 (10.4%) |
| Mining, Quarrying, & Extraction | 37 (100.0%) | 0 (0.0%) |
| Construction | 718 (93.9%) | 47 (6.1%) |
| Manufacturing | 1,191 (75.0%) | 396 (24.9%) |
| Wholesale Trade | 41 (100.0%) | 0 (0.0%) |
| Retail Trade | 191 (27.4%) | 505 (72.6%) |
| Transportation & Warehousing | 92 (68.1%) | 43 (31.9%) |
| Utilities | 8 (100.0%) | 0 (0.0%) |
| Information | 57 (33.3%) | 114 (66.7%) |
| Finance & Insurance | 15 (8.3%) | 165 (91.7%) |
| Real Estate, Rental & Leasing | 46 (83.6%) | 9 (16.4%) |
| Professional & Scientific | 180 (38.4%) | 289 (61.6%) |
| Enterprise Management | 0 (0.0%) | 0 (0.0%) |
| Administrative & Support | 77 (50.7%) | 75 (49.3%) |
| Educational Services | 105 (21.2%) | 390 (78.8%) |
| Health Care & Social Assistance | 191 (13.3%) | 1,243 (86.7%) |
| Arts, Entertainment & Recreation | 39 (44.8%) | 48 (55.2%) |
| Accommodation & Food Services | 97 (30.6%) | 220 (69.4%) |
| Public Administration | 80 (41.7%) | 112 (58.3%) |
| Total | 3,804 (49.7%) | 3,848 (50.3%) |
Education in Floyd County
School Enrollment in Floyd County
The most common levels of schooling among the 2,592 students in Floyd County are elementary school (672 | 25.9%), high school (653 | 25.2%), and middle school (641 | 24.7%).
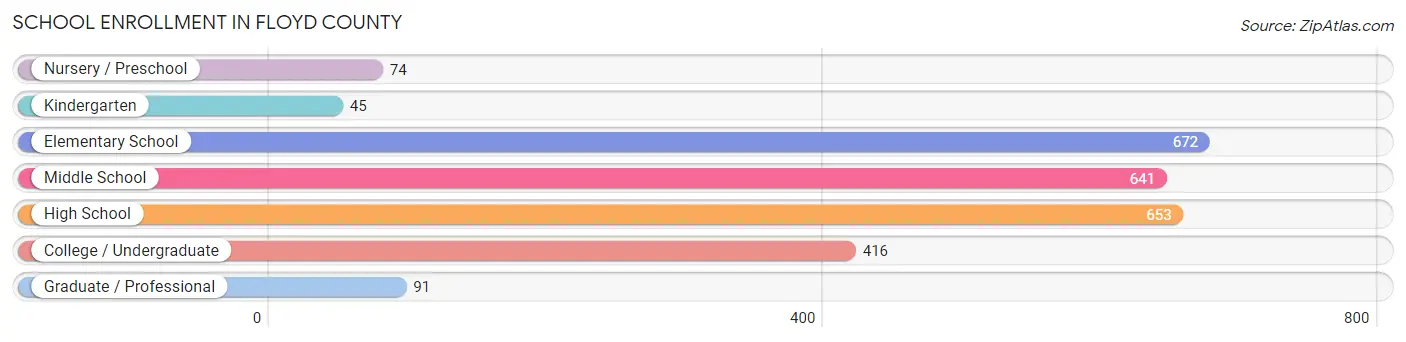
| School Level | # Students | % Students |
| Nursery / Preschool | 74 | 2.9% |
| Kindergarten | 45 | 1.7% |
| Elementary School | 672 | 25.9% |
| Middle School | 641 | 24.7% |
| High School | 653 | 25.2% |
| College / Undergraduate | 416 | 16.1% |
| Graduate / Professional | 91 | 3.5% |
| Total | 2,592 | 100.0% |
School Enrollment by Age by Funding Source in Floyd County
Out of a total of 2,592 students who are enrolled in schools in Floyd County, 480 (18.5%) attend a private institution, while the remaining 2,112 (81.5%) are enrolled in public schools. The age group of 3 to 4 year olds has the highest likelihood of being enrolled in private schools, with 43 (55.1% in the age bracket) enrolled. Conversely, the age group of 10 to 14 year olds has the lowest likelihood of being enrolled in a private school, with 828 (94.9% in the age bracket) attending a public institution.
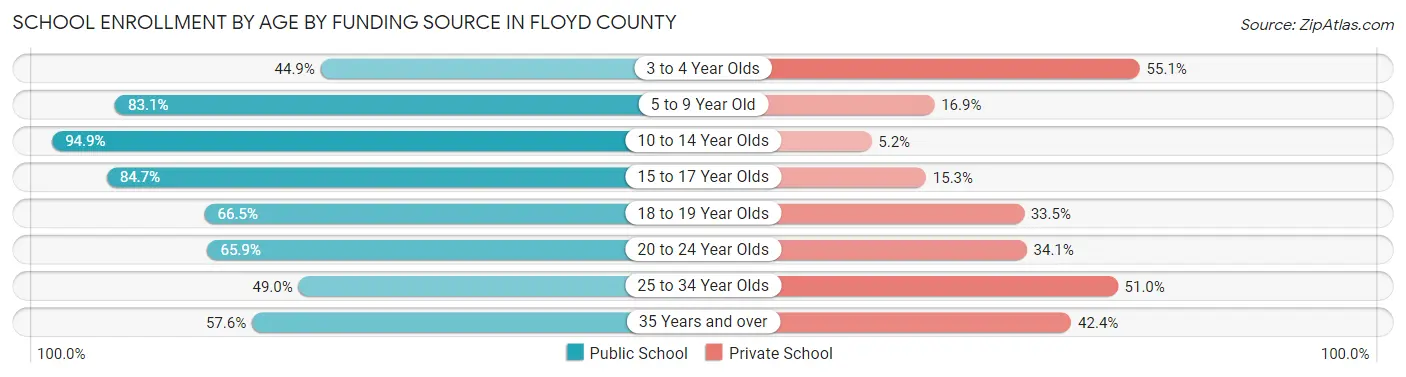
| Age Bracket | Public School | Private School |
| 3 to 4 Year Olds | 35 (44.9%) | 43 (55.1%) |
| 5 to 9 Year Old | 468 (83.1%) | 95 (16.9%) |
| 10 to 14 Year Olds | 828 (94.9%) | 45 (5.1%) |
| 15 to 17 Year Olds | 415 (84.7%) | 75 (15.3%) |
| 18 to 19 Year Olds | 109 (66.5%) | 55 (33.5%) |
| 20 to 24 Year Olds | 176 (65.9%) | 91 (34.1%) |
| 25 to 34 Year Olds | 48 (49.0%) | 50 (51.0%) |
| 35 Years and over | 34 (57.6%) | 25 (42.4%) |
| Total | 2,112 (81.5%) | 480 (18.5%) |
Educational Attainment by Field of Study in Floyd County
Bio, nature & agricultural (493 | 17.2%), education (468 | 16.3%), science & technology (391 | 13.6%), business (284 | 9.9%), and social sciences (241 | 8.4%) are the most common fields of study among 2,869 individuals in Floyd County who have obtained a bachelor's degree or higher.
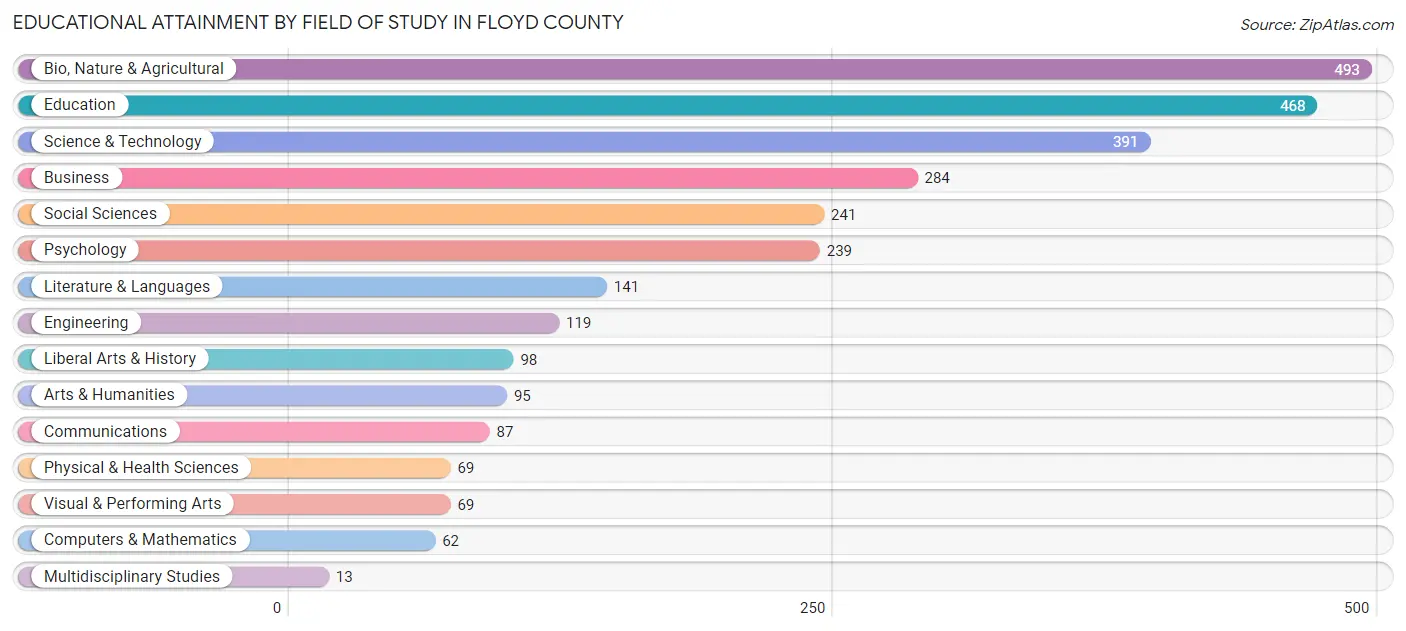
| Field of Study | # Graduates | % Graduates |
| Computers & Mathematics | 62 | 2.2% |
| Bio, Nature & Agricultural | 493 | 17.2% |
| Physical & Health Sciences | 69 | 2.4% |
| Psychology | 239 | 8.3% |
| Social Sciences | 241 | 8.4% |
| Engineering | 119 | 4.2% |
| Multidisciplinary Studies | 13 | 0.4% |
| Science & Technology | 391 | 13.6% |
| Business | 284 | 9.9% |
| Education | 468 | 16.3% |
| Literature & Languages | 141 | 4.9% |
| Liberal Arts & History | 98 | 3.4% |
| Visual & Performing Arts | 69 | 2.4% |
| Communications | 87 | 3.0% |
| Arts & Humanities | 95 | 3.3% |
| Total | 2,869 | 100.0% |
Transportation & Commute in Floyd County
Vehicle Availability by Sex in Floyd County
The most prevalent vehicle ownership categories in Floyd County are males with 2 vehicles (1,226, accounting for 32.3%) and females with 2 vehicles (1,200, making up 32.3%).
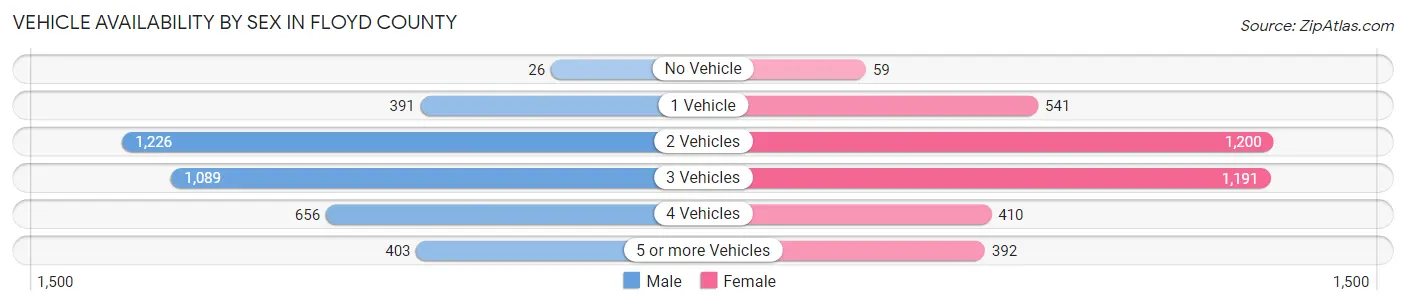
| Vehicles Available | Male | Female |
| No Vehicle | 26 (0.7%) | 59 (1.6%) |
| 1 Vehicle | 391 (10.3%) | 541 (14.3%) |
| 2 Vehicles | 1,226 (32.3%) | 1,200 (31.6%) |
| 3 Vehicles | 1,089 (28.7%) | 1,191 (31.4%) |
| 4 Vehicles | 656 (17.3%) | 410 (10.8%) |
| 5 or more Vehicles | 403 (10.6%) | 392 (10.3%) |
| Total | 3,791 (100.0%) | 3,793 (100.0%) |
Commute Time in Floyd County
The most frequently occuring commute durations in Floyd County are 45 to 59 minutes (1,041 commuters, 15.3%), 60 to 89 minutes (986 commuters, 14.5%), and 30 to 34 minutes (936 commuters, 13.7%).
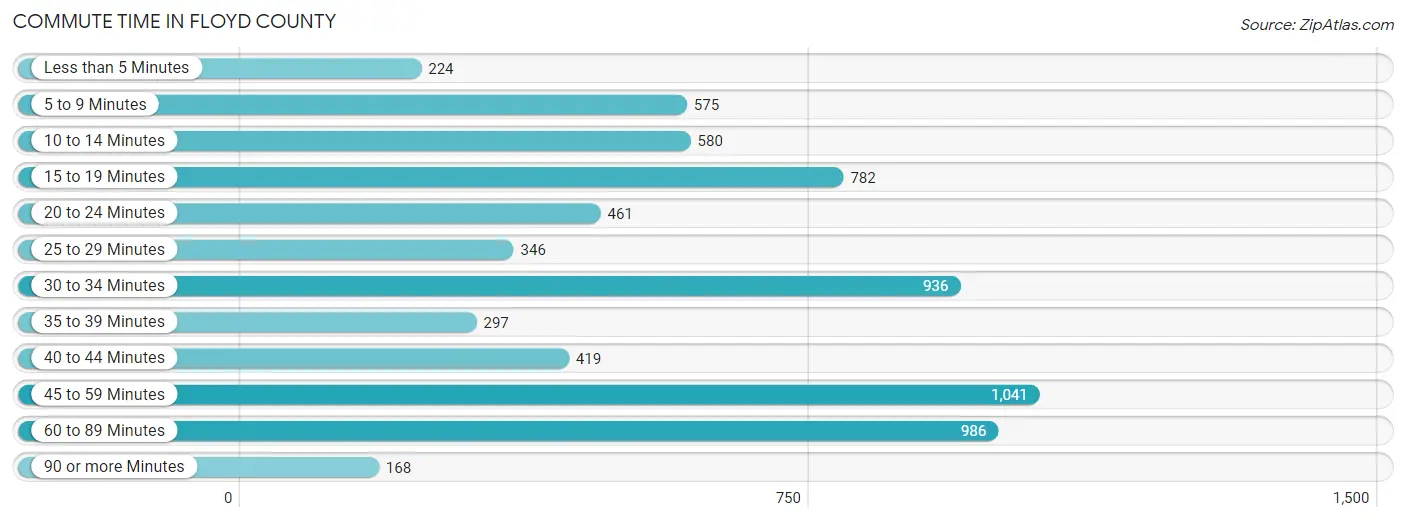
| Commute Time | # Commuters | % Commuters |
| Less than 5 Minutes | 224 | 3.3% |
| 5 to 9 Minutes | 575 | 8.4% |
| 10 to 14 Minutes | 580 | 8.5% |
| 15 to 19 Minutes | 782 | 11.5% |
| 20 to 24 Minutes | 461 | 6.8% |
| 25 to 29 Minutes | 346 | 5.1% |
| 30 to 34 Minutes | 936 | 13.7% |
| 35 to 39 Minutes | 297 | 4.4% |
| 40 to 44 Minutes | 419 | 6.1% |
| 45 to 59 Minutes | 1,041 | 15.3% |
| 60 to 89 Minutes | 986 | 14.5% |
| 90 or more Minutes | 168 | 2.5% |
Commute Time by Sex in Floyd County
The most common commute times in Floyd County are 45 to 59 minutes (635 commuters, 17.9%) for males and 15 to 19 minutes (525 commuters, 16.1%) for females.
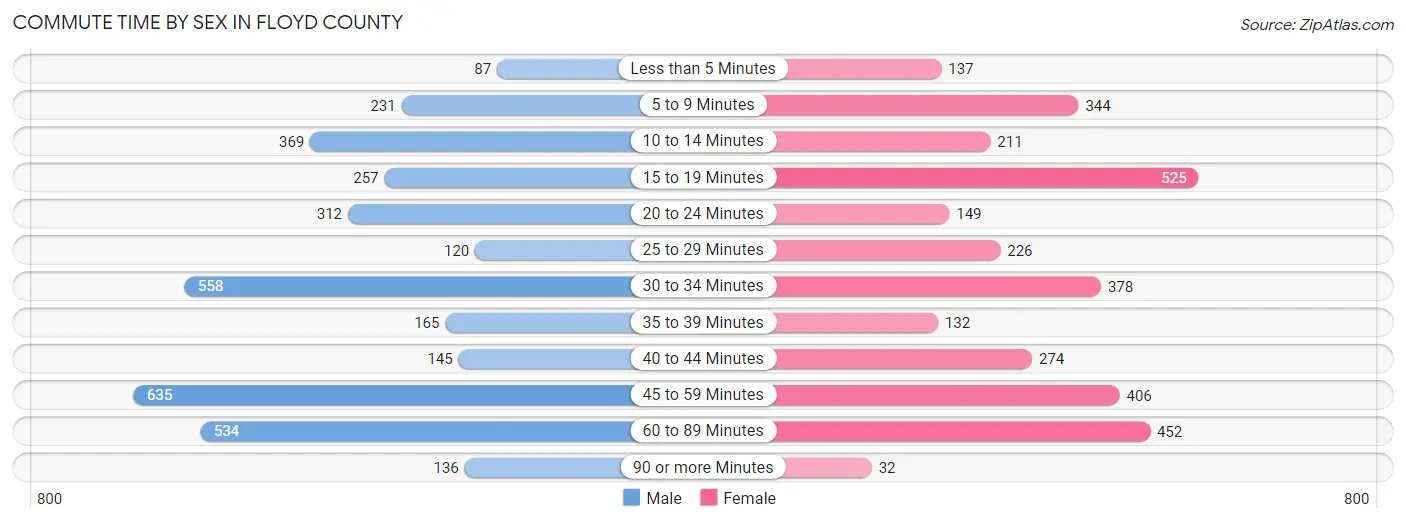
| Commute Time | Male | Female |
| Less than 5 Minutes | 87 (2.5%) | 137 (4.2%) |
| 5 to 9 Minutes | 231 (6.5%) | 344 (10.5%) |
| 10 to 14 Minutes | 369 (10.4%) | 211 (6.5%) |
| 15 to 19 Minutes | 257 (7.2%) | 525 (16.1%) |
| 20 to 24 Minutes | 312 (8.8%) | 149 (4.6%) |
| 25 to 29 Minutes | 120 (3.4%) | 226 (6.9%) |
| 30 to 34 Minutes | 558 (15.7%) | 378 (11.6%) |
| 35 to 39 Minutes | 165 (4.6%) | 132 (4.0%) |
| 40 to 44 Minutes | 145 (4.1%) | 274 (8.4%) |
| 45 to 59 Minutes | 635 (17.9%) | 406 (12.4%) |
| 60 to 89 Minutes | 534 (15.0%) | 452 (13.8%) |
| 90 or more Minutes | 136 (3.8%) | 32 (1.0%) |
Time of Departure to Work by Sex in Floyd County
The most frequent times of departure to work in Floyd County are 7:00 AM to 7:29 AM (750, 21.1%) for males and 7:00 AM to 7:29 AM (850, 26.0%) for females.
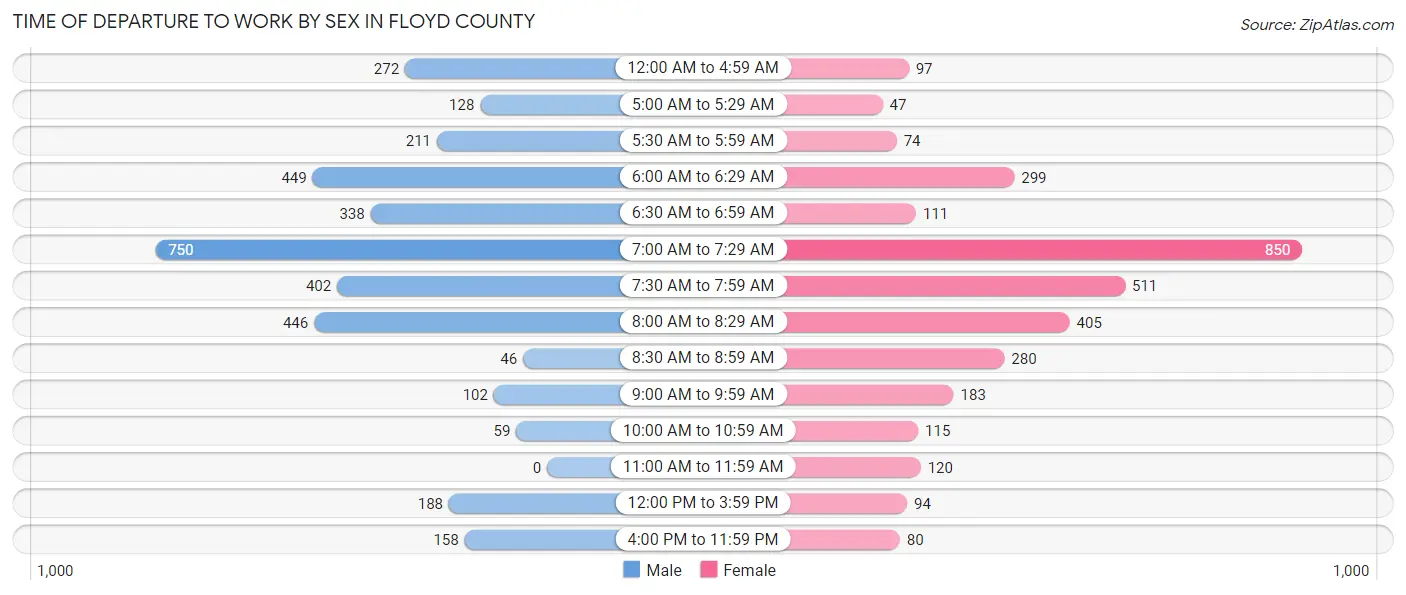
| Time of Departure | Male | Female |
| 12:00 AM to 4:59 AM | 272 (7.7%) | 97 (3.0%) |
| 5:00 AM to 5:29 AM | 128 (3.6%) | 47 (1.4%) |
| 5:30 AM to 5:59 AM | 211 (5.9%) | 74 (2.3%) |
| 6:00 AM to 6:29 AM | 449 (12.7%) | 299 (9.1%) |
| 6:30 AM to 6:59 AM | 338 (9.5%) | 111 (3.4%) |
| 7:00 AM to 7:29 AM | 750 (21.1%) | 850 (26.0%) |
| 7:30 AM to 7:59 AM | 402 (11.3%) | 511 (15.7%) |
| 8:00 AM to 8:29 AM | 446 (12.6%) | 405 (12.4%) |
| 8:30 AM to 8:59 AM | 46 (1.3%) | 280 (8.6%) |
| 9:00 AM to 9:59 AM | 102 (2.9%) | 183 (5.6%) |
| 10:00 AM to 10:59 AM | 59 (1.7%) | 115 (3.5%) |
| 11:00 AM to 11:59 AM | 0 (0.0%) | 120 (3.7%) |
| 12:00 PM to 3:59 PM | 188 (5.3%) | 94 (2.9%) |
| 4:00 PM to 11:59 PM | 158 (4.4%) | 80 (2.5%) |
| Total | 3,549 (100.0%) | 3,266 (100.0%) |
Housing Occupancy in Floyd County
Occupancy by Ownership in Floyd County
Of the total 6,655 dwellings in Floyd County, owner-occupied units account for 5,742 (86.3%), while renter-occupied units make up 913 (13.7%).
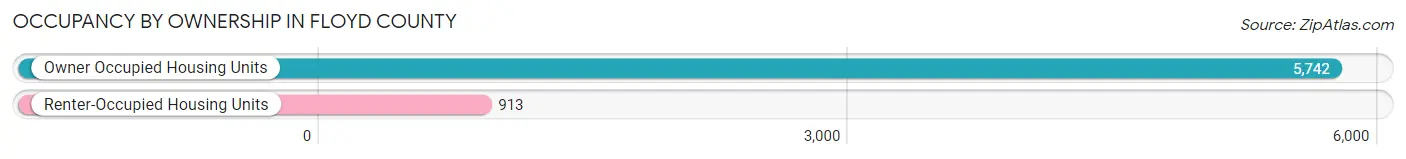
| Occupancy | # Housing Units | % Housing Units |
| Owner Occupied Housing Units | 5,742 | 86.3% |
| Renter-Occupied Housing Units | 913 | 13.7% |
| Total Occupied Housing Units | 6,655 | 100.0% |
Occupancy by Household Size in Floyd County
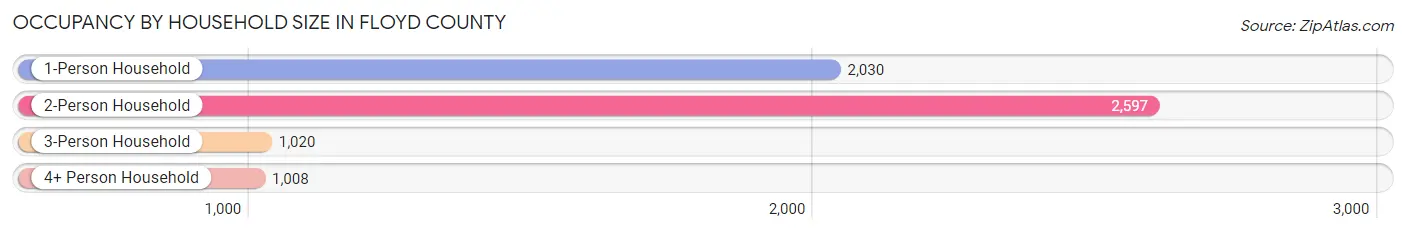
| Household Size | # Housing Units | % Housing Units |
| 1-Person Household | 2,030 | 30.5% |
| 2-Person Household | 2,597 | 39.0% |
| 3-Person Household | 1,020 | 15.3% |
| 4+ Person Household | 1,008 | 15.1% |
| Total Housing Units | 6,655 | 100.0% |
Occupancy by Ownership by Household Size in Floyd County
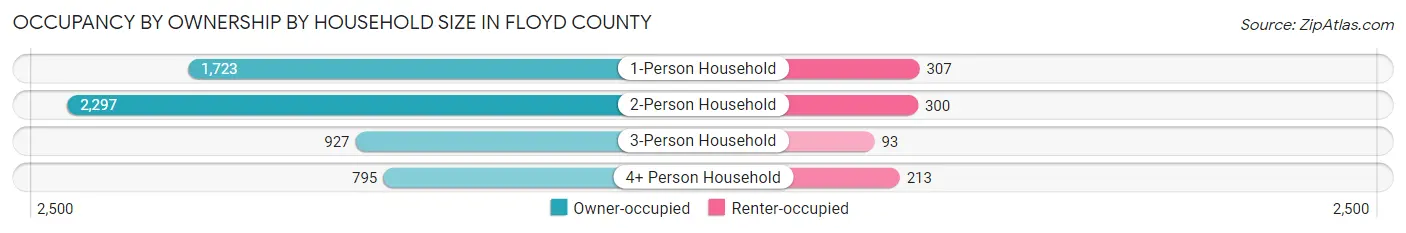
| Household Size | Owner-occupied | Renter-occupied |
| 1-Person Household | 1,723 (84.9%) | 307 (15.1%) |
| 2-Person Household | 2,297 (88.4%) | 300 (11.6%) |
| 3-Person Household | 927 (90.9%) | 93 (9.1%) |
| 4+ Person Household | 795 (78.9%) | 213 (21.1%) |
| Total Housing Units | 5,742 (86.3%) | 913 (13.7%) |
Occupancy by Educational Attainment in Floyd County
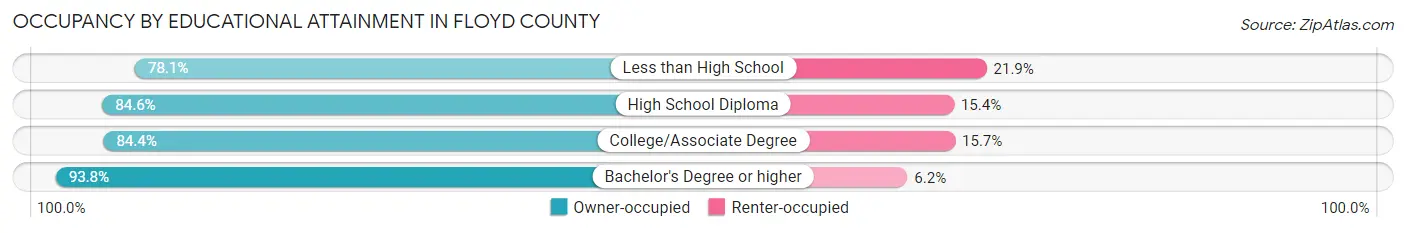
| Household Size | Owner-occupied | Renter-occupied |
| Less than High School | 428 (78.1%) | 120 (21.9%) |
| High School Diploma | 2,044 (84.6%) | 373 (15.4%) |
| College/Associate Degree | 1,709 (84.4%) | 317 (15.7%) |
| Bachelor's Degree or higher | 1,561 (93.8%) | 103 (6.2%) |
Occupancy by Age of Householder in Floyd County
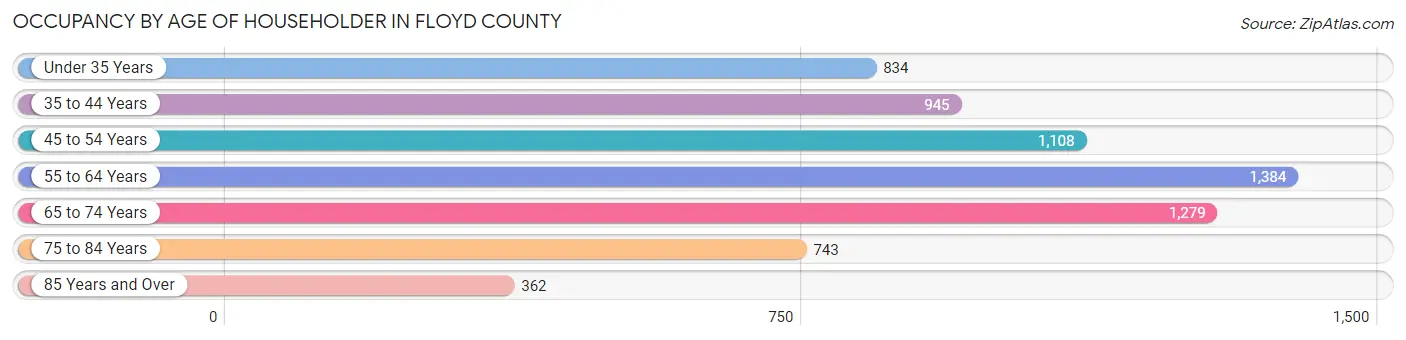
| Age Bracket | # Households | % Households |
| Under 35 Years | 834 | 12.5% |
| 35 to 44 Years | 945 | 14.2% |
| 45 to 54 Years | 1,108 | 16.7% |
| 55 to 64 Years | 1,384 | 20.8% |
| 65 to 74 Years | 1,279 | 19.2% |
| 75 to 84 Years | 743 | 11.2% |
| 85 Years and Over | 362 | 5.4% |
| Total | 6,655 | 100.0% |
Housing Finances in Floyd County
Median Income by Occupancy in Floyd County
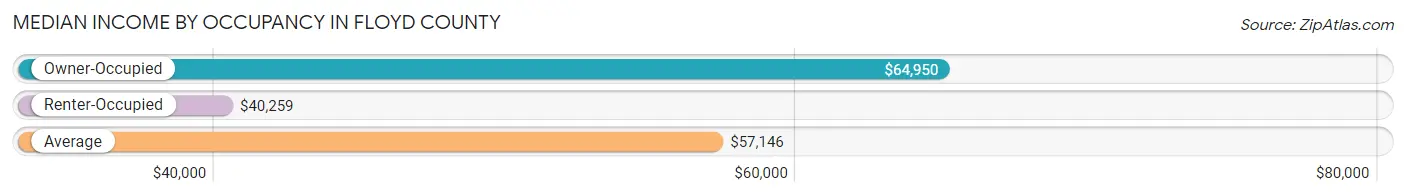
| Occupancy Type | # Households | Median Income |
| Owner-Occupied | 5,742 (86.3%) | $64,950 |
| Renter-Occupied | 913 (13.7%) | $40,259 |
| Average | 6,655 (100.0%) | $57,146 |
Occupancy by Householder Income Bracket in Floyd County
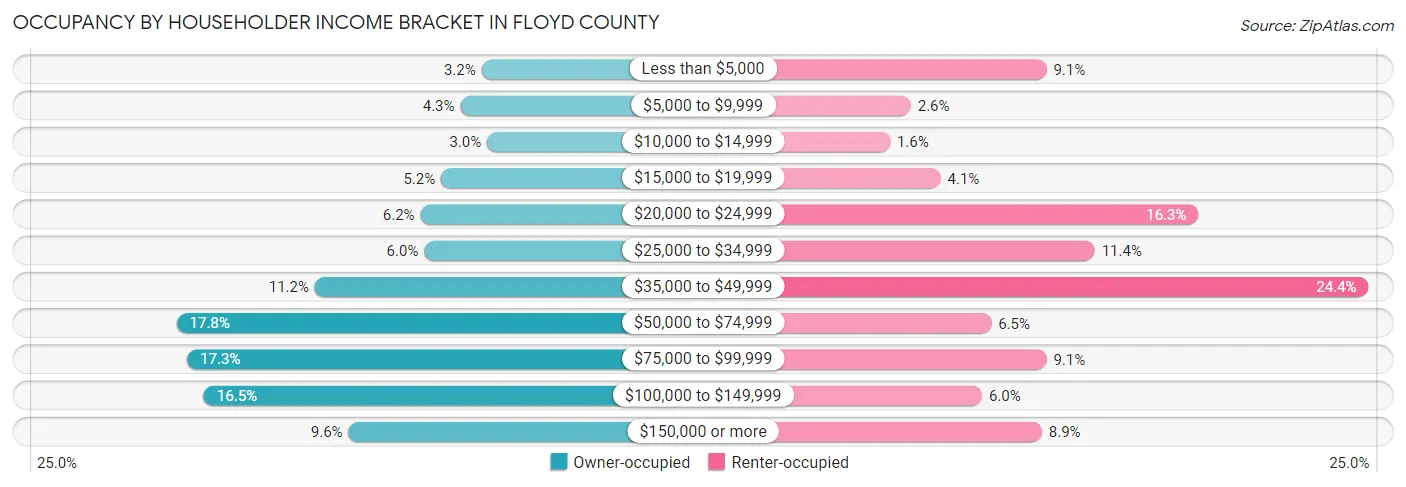
| Income Bracket | Owner-occupied | Renter-occupied |
| Less than $5,000 | 186 (3.2%) | 83 (9.1%) |
| $5,000 to $9,999 | 244 (4.3%) | 24 (2.6%) |
| $10,000 to $14,999 | 171 (3.0%) | 15 (1.6%) |
| $15,000 to $19,999 | 297 (5.2%) | 37 (4.1%) |
| $20,000 to $24,999 | 353 (6.1%) | 149 (16.3%) |
| $25,000 to $34,999 | 343 (6.0%) | 104 (11.4%) |
| $35,000 to $49,999 | 642 (11.2%) | 223 (24.4%) |
| $50,000 to $74,999 | 1,020 (17.8%) | 59 (6.5%) |
| $75,000 to $99,999 | 991 (17.3%) | 83 (9.1%) |
| $100,000 to $149,999 | 945 (16.5%) | 55 (6.0%) |
| $150,000 or more | 550 (9.6%) | 81 (8.9%) |
| Total | 5,742 (100.0%) | 913 (100.0%) |
Monthly Housing Cost Tiers in Floyd County
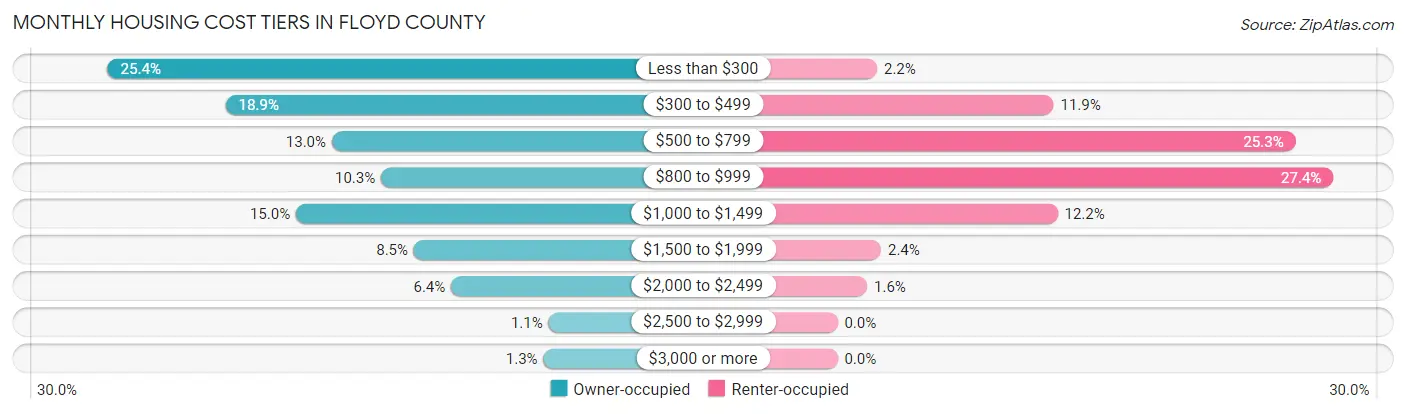
| Monthly Cost | Owner-occupied | Renter-occupied |
| Less than $300 | 1,459 (25.4%) | 20 (2.2%) |
| $300 to $499 | 1,085 (18.9%) | 109 (11.9%) |
| $500 to $799 | 748 (13.0%) | 231 (25.3%) |
| $800 to $999 | 592 (10.3%) | 250 (27.4%) |
| $1,000 to $1,499 | 862 (15.0%) | 111 (12.2%) |
| $1,500 to $1,999 | 488 (8.5%) | 22 (2.4%) |
| $2,000 to $2,499 | 370 (6.4%) | 15 (1.6%) |
| $2,500 to $2,999 | 61 (1.1%) | 0 (0.0%) |
| $3,000 or more | 77 (1.3%) | 0 (0.0%) |
| Total | 5,742 (100.0%) | 913 (100.0%) |
Physical Housing Characteristics in Floyd County
Housing Structures in Floyd County
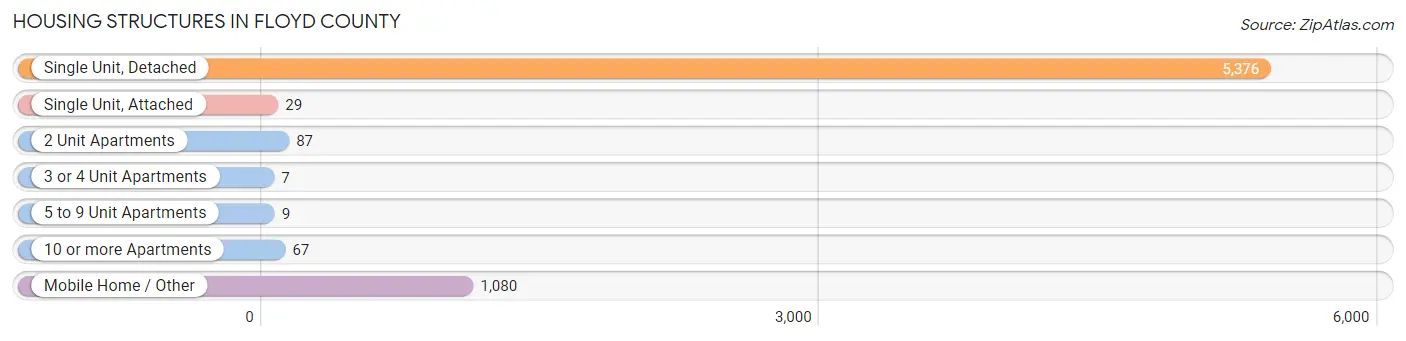
| Structure Type | # Housing Units | % Housing Units |
| Single Unit, Detached | 5,376 | 80.8% |
| Single Unit, Attached | 29 | 0.4% |
| 2 Unit Apartments | 87 | 1.3% |
| 3 or 4 Unit Apartments | 7 | 0.1% |
| 5 to 9 Unit Apartments | 9 | 0.1% |
| 10 or more Apartments | 67 | 1.0% |
| Mobile Home / Other | 1,080 | 16.2% |
| Total | 6,655 | 100.0% |
Housing Structures by Occupancy in Floyd County
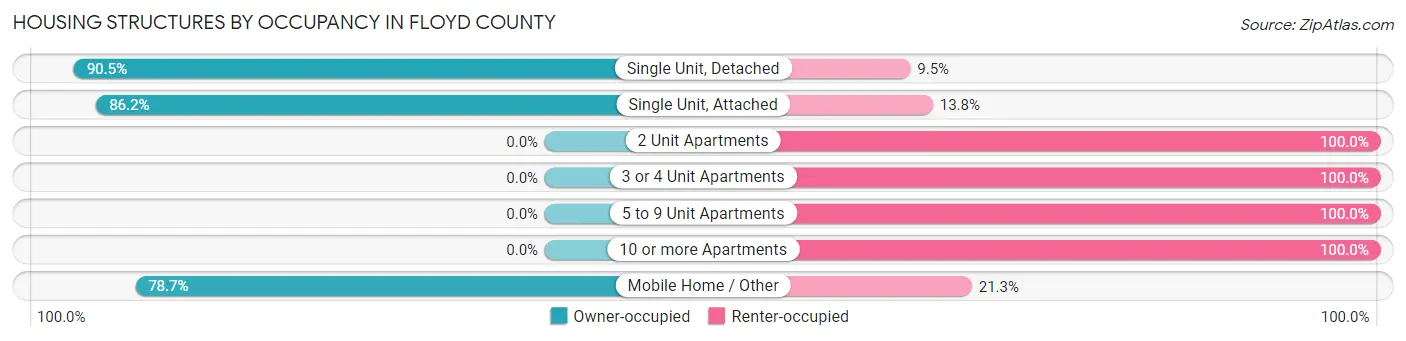
| Structure Type | Owner-occupied | Renter-occupied |
| Single Unit, Detached | 4,867 (90.5%) | 509 (9.5%) |
| Single Unit, Attached | 25 (86.2%) | 4 (13.8%) |
| 2 Unit Apartments | 0 (0.0%) | 87 (100.0%) |
| 3 or 4 Unit Apartments | 0 (0.0%) | 7 (100.0%) |
| 5 to 9 Unit Apartments | 0 (0.0%) | 9 (100.0%) |
| 10 or more Apartments | 0 (0.0%) | 67 (100.0%) |
| Mobile Home / Other | 850 (78.7%) | 230 (21.3%) |
| Total | 5,742 (86.3%) | 913 (13.7%) |
Housing Structures by Number of Rooms in Floyd County
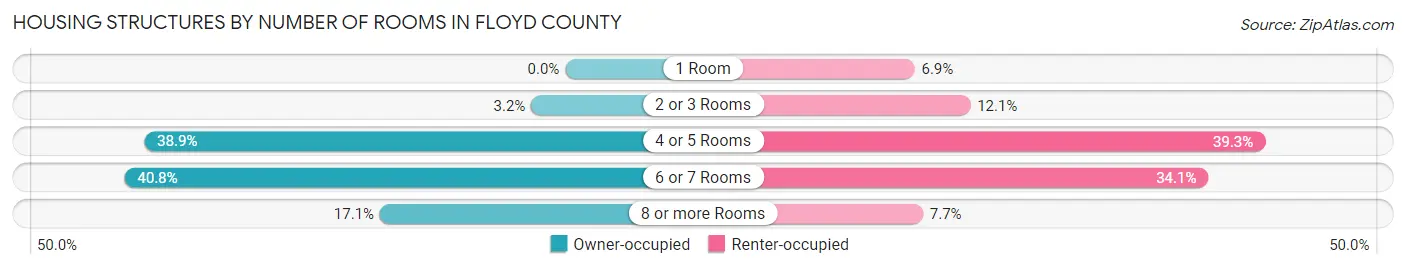
| Number of Rooms | Owner-occupied | Renter-occupied |
| 1 Room | 0 (0.0%) | 63 (6.9%) |
| 2 or 3 Rooms | 181 (3.2%) | 110 (12.0%) |
| 4 or 5 Rooms | 2,236 (38.9%) | 359 (39.3%) |
| 6 or 7 Rooms | 2,341 (40.8%) | 311 (34.1%) |
| 8 or more Rooms | 984 (17.1%) | 70 (7.7%) |
| Total | 5,742 (100.0%) | 913 (100.0%) |
Housing Structure by Heating Type in Floyd County
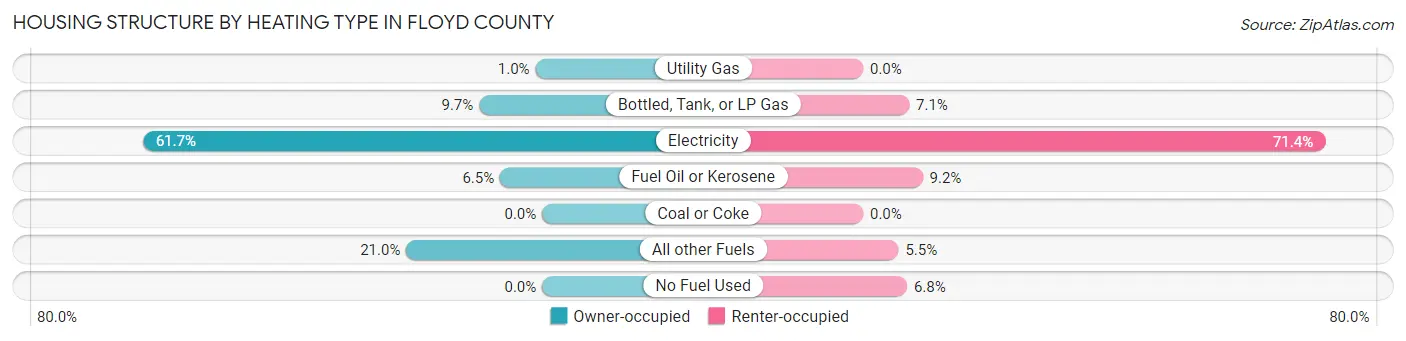
| Heating Type | Owner-occupied | Renter-occupied |
| Utility Gas | 59 (1.0%) | 0 (0.0%) |
| Bottled, Tank, or LP Gas | 559 (9.7%) | 65 (7.1%) |
| Electricity | 3,545 (61.7%) | 652 (71.4%) |
| Fuel Oil or Kerosene | 373 (6.5%) | 84 (9.2%) |
| Coal or Coke | 0 (0.0%) | 0 (0.0%) |
| All other Fuels | 1,206 (21.0%) | 50 (5.5%) |
| No Fuel Used | 0 (0.0%) | 62 (6.8%) |
| Total | 5,742 (100.0%) | 913 (100.0%) |
Household Vehicle Usage in Floyd County
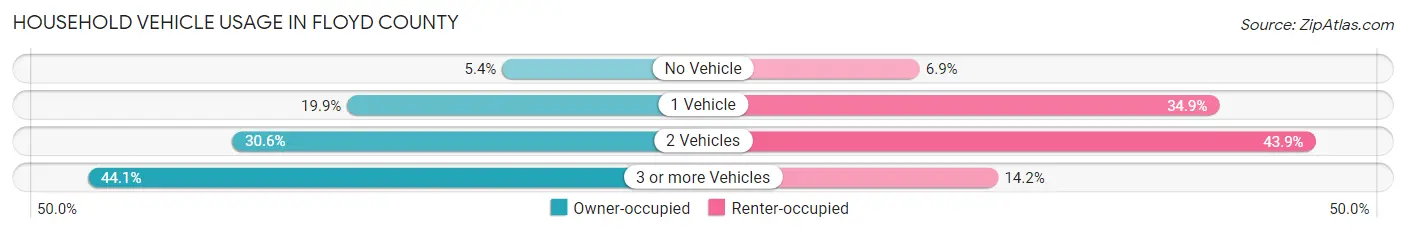
| Vehicles per Household | Owner-occupied | Renter-occupied |
| No Vehicle | 311 (5.4%) | 63 (6.9%) |
| 1 Vehicle | 1,142 (19.9%) | 319 (34.9%) |
| 2 Vehicles | 1,758 (30.6%) | 401 (43.9%) |
| 3 or more Vehicles | 2,531 (44.1%) | 130 (14.2%) |
| Total | 5,742 (100.0%) | 913 (100.0%) |
Real Estate & Mortgages in Floyd County
Real Estate and Mortgage Overview in Floyd County
| Characteristic | Without Mortgage | With Mortgage |
| Housing Units | 3,190 | 2,552 |
| Median Property Value | $201,700 | $212,100 |
| Median Household Income | $47,971 | $446 |
| Monthly Housing Costs | $329 | $77 |
| Real Estate Taxes | $1,075 | $130 |
Property Value by Mortgage Status in Floyd County
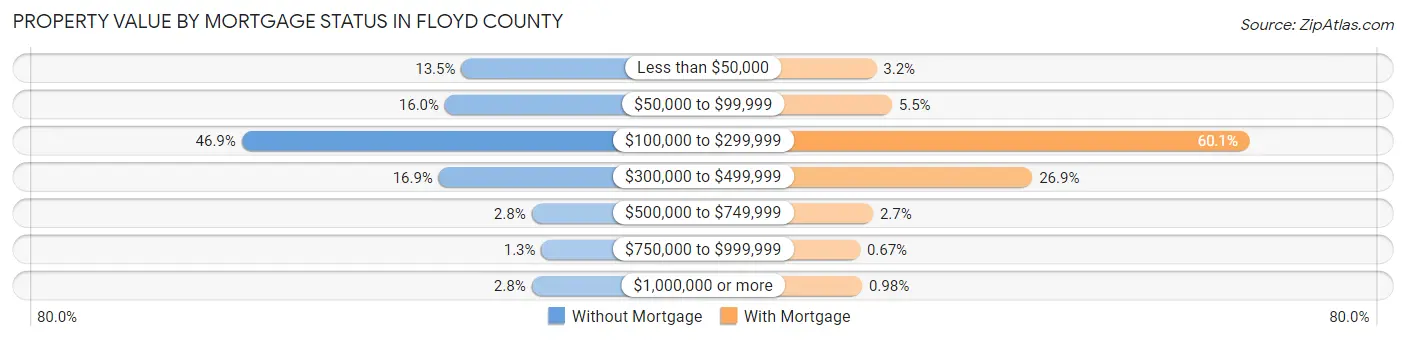
| Property Value | Without Mortgage | With Mortgage |
| Less than $50,000 | 429 (13.5%) | 81 (3.2%) |
| $50,000 to $99,999 | 509 (16.0%) | 141 (5.5%) |
| $100,000 to $299,999 | 1,497 (46.9%) | 1,533 (60.1%) |
| $300,000 to $499,999 | 539 (16.9%) | 687 (26.9%) |
| $500,000 to $749,999 | 88 (2.8%) | 68 (2.7%) |
| $750,000 to $999,999 | 40 (1.3%) | 17 (0.7%) |
| $1,000,000 or more | 88 (2.8%) | 25 (1.0%) |
| Total | 3,190 (100.0%) | 2,552 (100.0%) |
Household Income by Mortgage Status in Floyd County
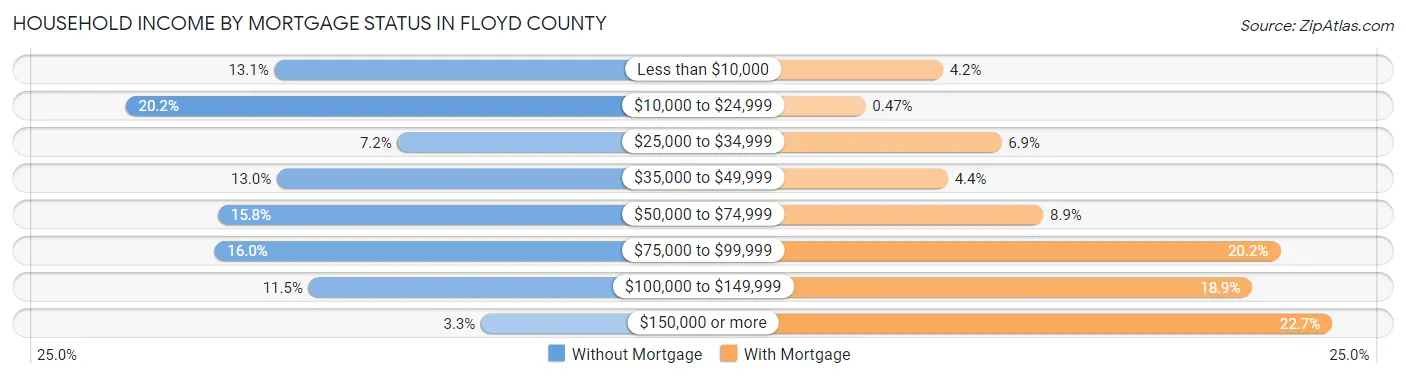
| Household Income | Without Mortgage | With Mortgage |
| Less than $10,000 | 418 (13.1%) | 106 (4.2%) |
| $10,000 to $24,999 | 644 (20.2%) | 12 (0.5%) |
| $25,000 to $34,999 | 231 (7.2%) | 177 (6.9%) |
| $35,000 to $49,999 | 414 (13.0%) | 112 (4.4%) |
| $50,000 to $74,999 | 504 (15.8%) | 228 (8.9%) |
| $75,000 to $99,999 | 509 (16.0%) | 516 (20.2%) |
| $100,000 to $149,999 | 366 (11.5%) | 482 (18.9%) |
| $150,000 or more | 104 (3.3%) | 579 (22.7%) |
| Total | 3,190 (100.0%) | 2,552 (100.0%) |
Property Value to Household Income Ratio in Floyd County
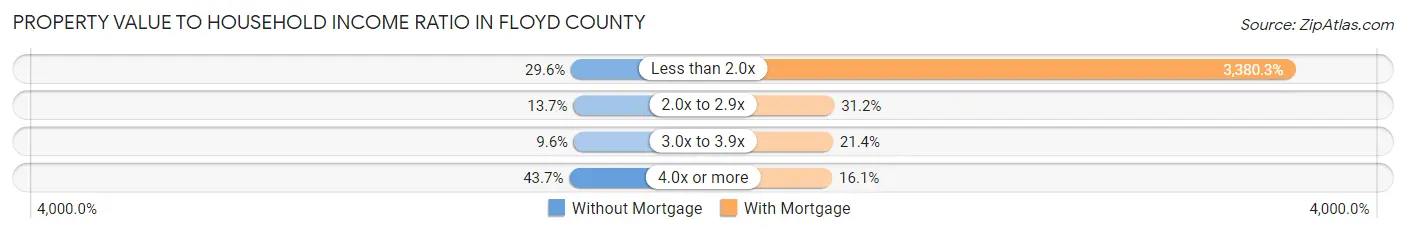
| Value-to-Income Ratio | Without Mortgage | With Mortgage |
| Less than 2.0x | 945 (29.6%) | 86,266 (3,380.3%) |
| 2.0x to 2.9x | 436 (13.7%) | 795 (31.1%) |
| 3.0x to 3.9x | 307 (9.6%) | 547 (21.4%) |
| 4.0x or more | 1,394 (43.7%) | 411 (16.1%) |
| Total | 3,190 (100.0%) | 2,552 (100.0%) |
Real Estate Taxes by Mortgage Status in Floyd County
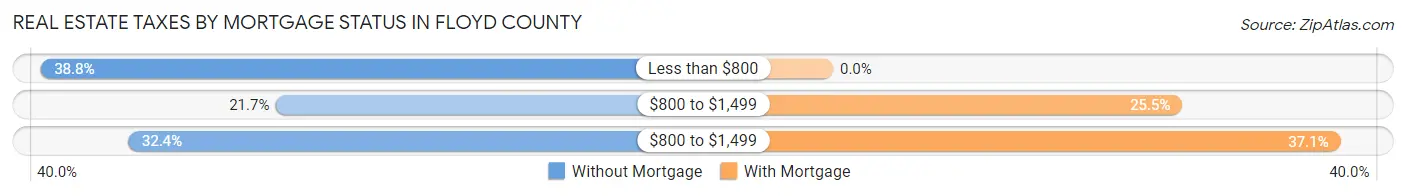
| Property Taxes | Without Mortgage | With Mortgage |
| Less than $800 | 1,237 (38.8%) | 0 (0.0%) |
| $800 to $1,499 | 692 (21.7%) | 651 (25.5%) |
| $800 to $1,499 | 1,033 (32.4%) | 946 (37.1%) |
| Total | 3,190 (100.0%) | 2,552 (100.0%) |
Health & Disability in Floyd County
Health Insurance Coverage by Age in Floyd County
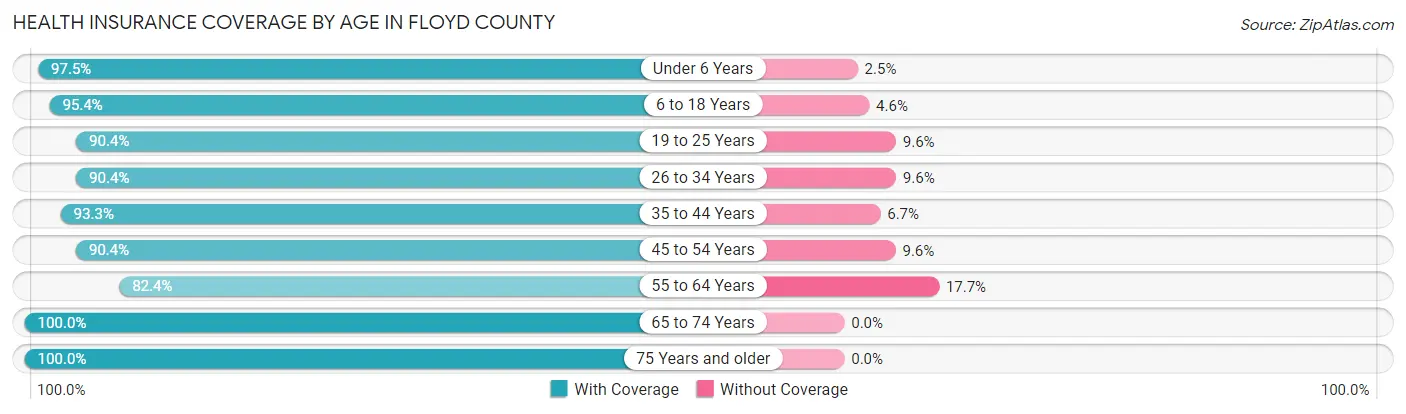
| Age Bracket | With Coverage | Without Coverage |
| Under 6 Years | 706 (97.5%) | 18 (2.5%) |
| 6 to 18 Years | 2,077 (95.4%) | 101 (4.6%) |
| 19 to 25 Years | 1,129 (90.4%) | 120 (9.6%) |
| 26 to 34 Years | 1,175 (90.4%) | 125 (9.6%) |
| 35 to 44 Years | 1,516 (93.3%) | 109 (6.7%) |
| 45 to 54 Years | 1,874 (90.4%) | 198 (9.6%) |
| 55 to 64 Years | 2,127 (82.4%) | 456 (17.6%) |
| 65 to 74 Years | 2,145 (100.0%) | 0 (0.0%) |
| 75 Years and older | 1,538 (100.0%) | 0 (0.0%) |
| Total | 14,287 (92.7%) | 1,127 (7.3%) |
Health Insurance Coverage by Citizenship Status in Floyd County
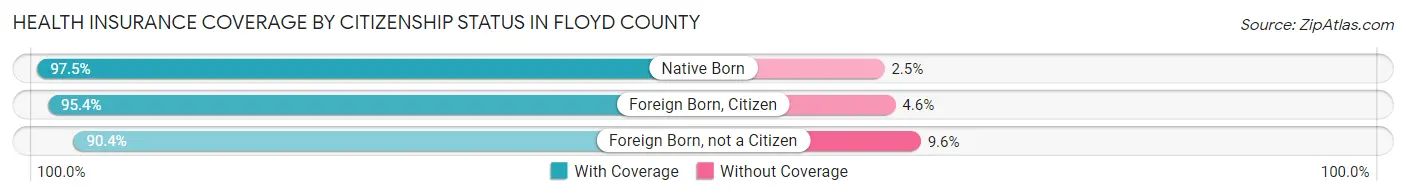
| Citizenship Status | With Coverage | Without Coverage |
| Native Born | 706 (97.5%) | 18 (2.5%) |
| Foreign Born, Citizen | 2,077 (95.4%) | 101 (4.6%) |
| Foreign Born, not a Citizen | 1,129 (90.4%) | 120 (9.6%) |
Health Insurance Coverage by Household Income in Floyd County
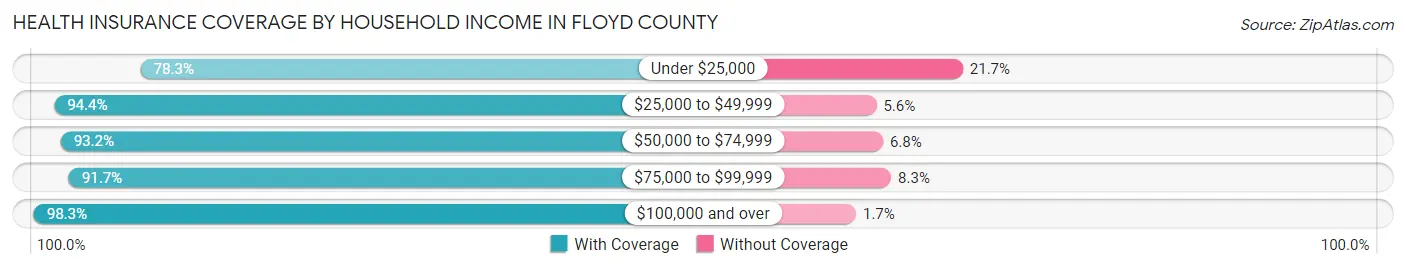
| Household Income | With Coverage | Without Coverage |
| Under $25,000 | 1,649 (78.3%) | 458 (21.7%) |
| $25,000 to $49,999 | 2,753 (94.4%) | 162 (5.6%) |
| $50,000 to $74,999 | 2,528 (93.2%) | 184 (6.8%) |
| $75,000 to $99,999 | 2,649 (91.7%) | 240 (8.3%) |
| $100,000 and over | 4,708 (98.3%) | 83 (1.7%) |
Public vs Private Health Insurance Coverage by Age in Floyd County
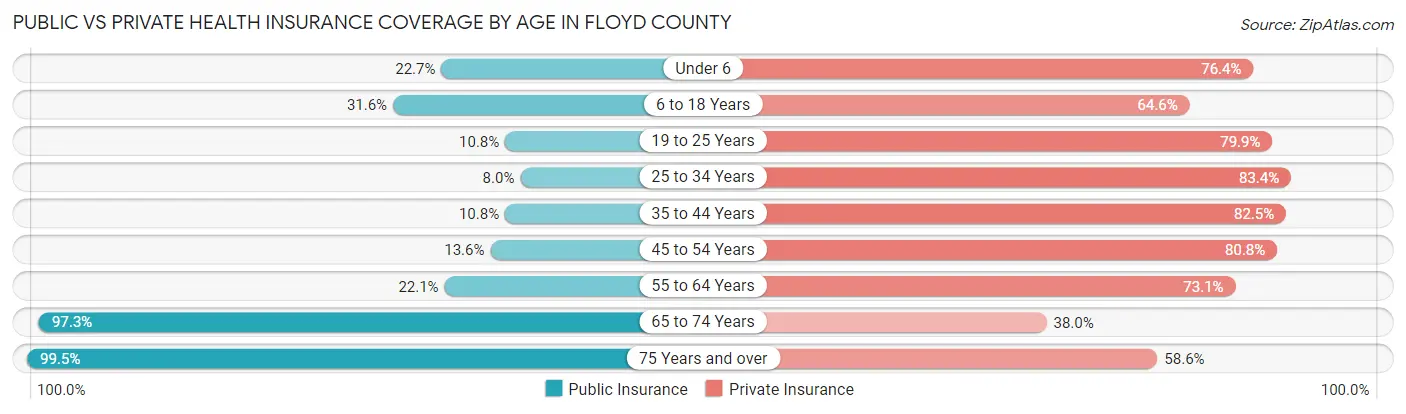
| Age Bracket | Public Insurance | Private Insurance |
| Under 6 | 164 (22.7%) | 553 (76.4%) |
| 6 to 18 Years | 689 (31.6%) | 1,406 (64.5%) |
| 19 to 25 Years | 135 (10.8%) | 998 (79.9%) |
| 25 to 34 Years | 104 (8.0%) | 1,084 (83.4%) |
| 35 to 44 Years | 176 (10.8%) | 1,340 (82.5%) |
| 45 to 54 Years | 281 (13.6%) | 1,674 (80.8%) |
| 55 to 64 Years | 570 (22.1%) | 1,887 (73.1%) |
| 65 to 74 Years | 2,088 (97.3%) | 815 (38.0%) |
| 75 Years and over | 1,531 (99.5%) | 901 (58.6%) |
| Total | 5,738 (37.2%) | 10,658 (69.1%) |
Disability Status by Sex by Age in Floyd County
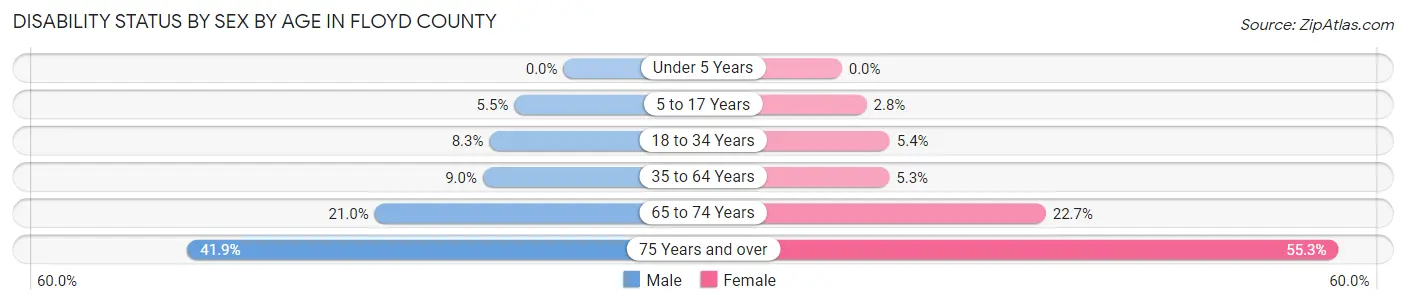
| Age Bracket | Male | Female |
| Under 5 Years | 0 (0.0%) | 0 (0.0%) |
| 5 to 17 Years | 60 (5.5%) | 29 (2.8%) |
| 18 to 34 Years | 113 (8.3%) | 68 (5.3%) |
| 35 to 64 Years | 279 (9.0%) | 168 (5.3%) |
| 65 to 74 Years | 216 (21.0%) | 254 (22.7%) |
| 75 Years and over | 273 (41.9%) | 490 (55.3%) |
Disability Class by Sex by Age in Floyd County
Disability Class: Hearing Difficulty
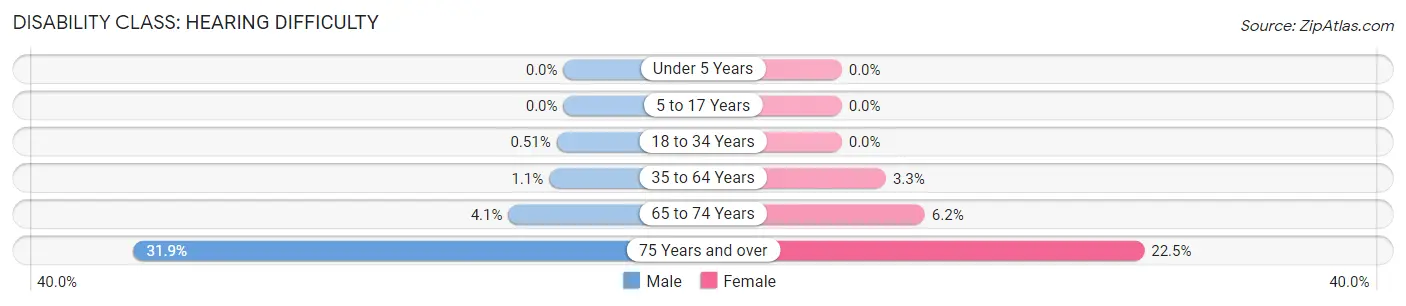
| Age Bracket | Male | Female |
| Under 5 Years | 0 (0.0%) | 0 (0.0%) |
| 5 to 17 Years | 0 (0.0%) | 0 (0.0%) |
| 18 to 34 Years | 7 (0.5%) | 0 (0.0%) |
| 35 to 64 Years | 33 (1.1%) | 104 (3.3%) |
| 65 to 74 Years | 42 (4.1%) | 69 (6.2%) |
| 75 Years and over | 208 (31.9%) | 199 (22.5%) |
Disability Class: Vision Difficulty
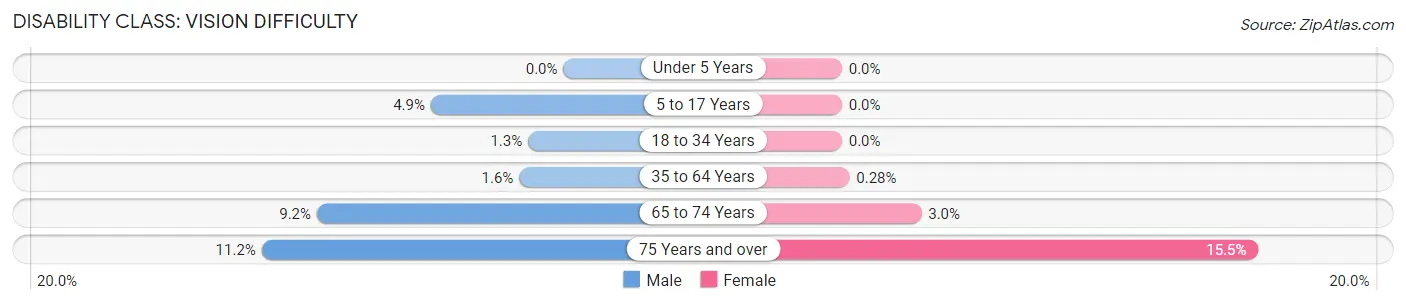
| Age Bracket | Male | Female |
| Under 5 Years | 0 (0.0%) | 0 (0.0%) |
| 5 to 17 Years | 54 (4.9%) | 0 (0.0%) |
| 18 to 34 Years | 18 (1.3%) | 0 (0.0%) |
| 35 to 64 Years | 51 (1.6%) | 9 (0.3%) |
| 65 to 74 Years | 94 (9.1%) | 33 (2.9%) |
| 75 Years and over | 73 (11.2%) | 137 (15.5%) |
Disability Class: Cognitive Difficulty
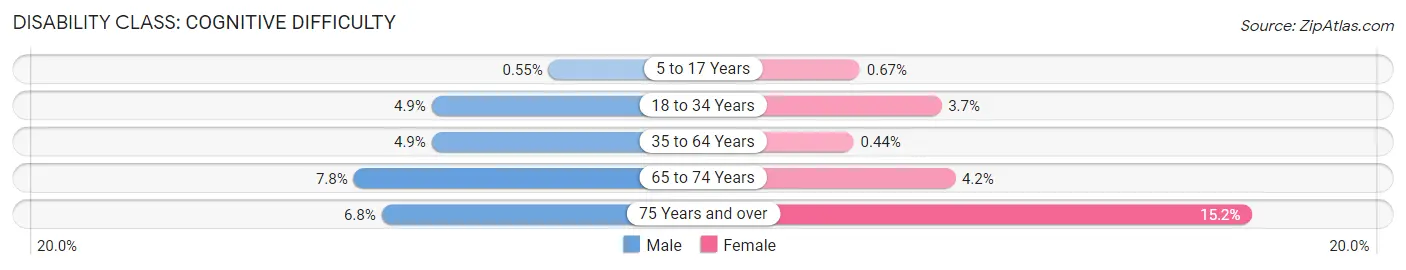
| Age Bracket | Male | Female |
| 5 to 17 Years | 6 (0.5%) | 7 (0.7%) |
| 18 to 34 Years | 67 (4.9%) | 47 (3.7%) |
| 35 to 64 Years | 152 (4.9%) | 14 (0.4%) |
| 65 to 74 Years | 80 (7.8%) | 47 (4.2%) |
| 75 Years and over | 44 (6.8%) | 135 (15.2%) |
Disability Class: Ambulatory Difficulty
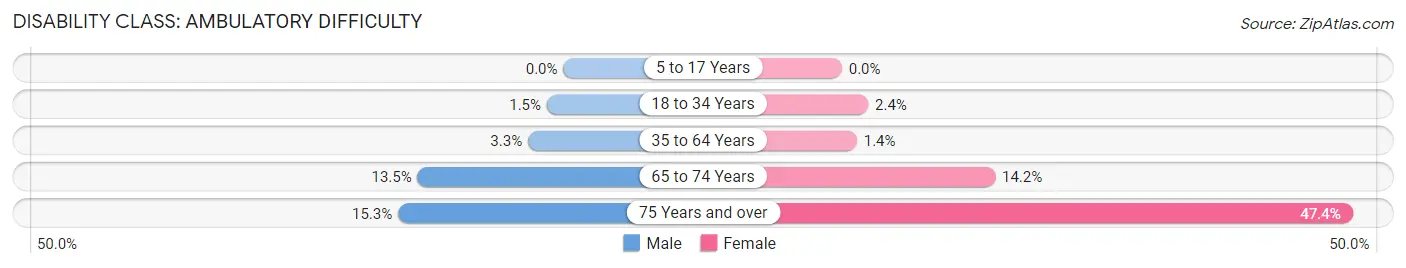
| Age Bracket | Male | Female |
| 5 to 17 Years | 0 (0.0%) | 0 (0.0%) |
| 18 to 34 Years | 21 (1.5%) | 31 (2.4%) |
| 35 to 64 Years | 102 (3.3%) | 44 (1.4%) |
| 65 to 74 Years | 139 (13.5%) | 159 (14.2%) |
| 75 Years and over | 100 (15.3%) | 420 (47.4%) |
Disability Class: Self-Care Difficulty
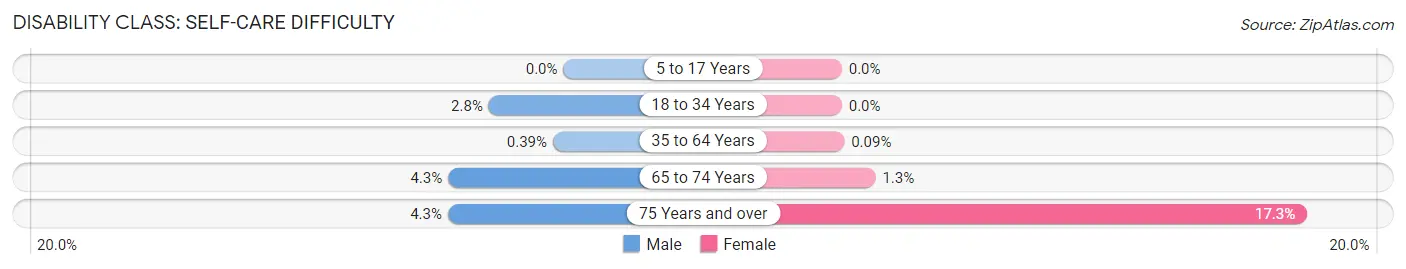
| Age Bracket | Male | Female |
| 5 to 17 Years | 0 (0.0%) | 0 (0.0%) |
| 18 to 34 Years | 38 (2.8%) | 0 (0.0%) |
| 35 to 64 Years | 12 (0.4%) | 3 (0.1%) |
| 65 to 74 Years | 44 (4.3%) | 14 (1.3%) |
| 75 Years and over | 28 (4.3%) | 153 (17.3%) |
Technology Access in Floyd County
Computing Device Access in Floyd County
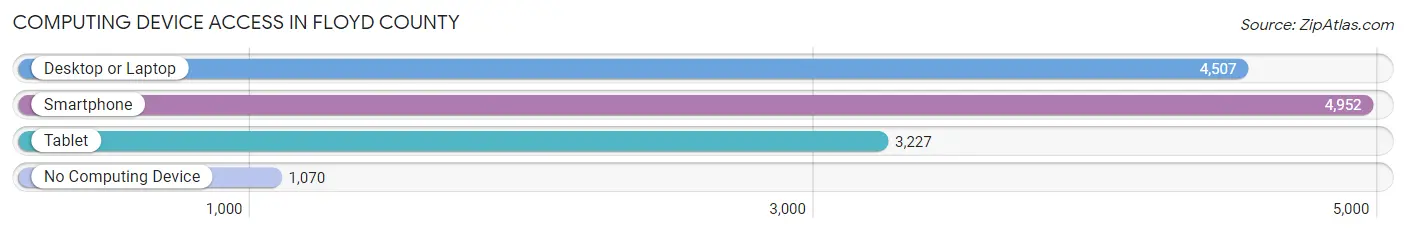
| Device Type | # Households | % Households |
| Desktop or Laptop | 4,507 | 67.7% |
| Smartphone | 4,952 | 74.4% |
| Tablet | 3,227 | 48.5% |
| No Computing Device | 1,070 | 16.1% |
| Total | 6,655 | 100.0% |
Internet Access in Floyd County
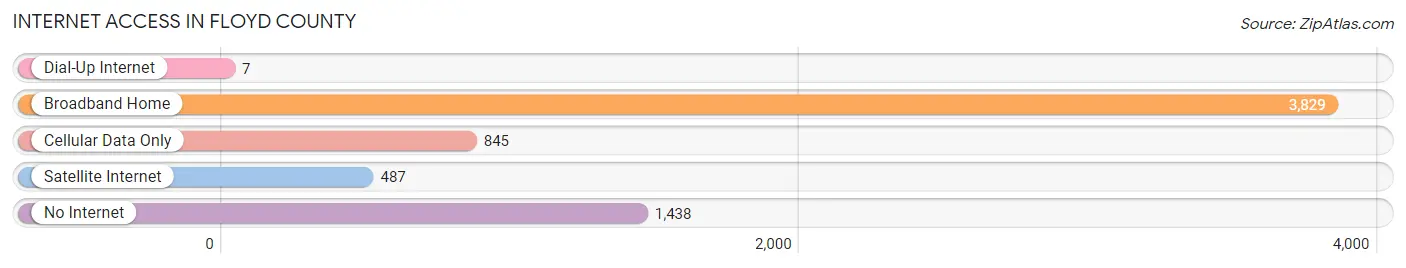
| Internet Type | # Households | % Households |
| Dial-Up Internet | 7 | 0.1% |
| Broadband Home | 3,829 | 57.5% |
| Cellular Data Only | 845 | 12.7% |
| Satellite Internet | 487 | 7.3% |
| No Internet | 1,438 | 21.6% |
| Total | 6,655 | 100.0% |
Floyd County Summary
Floyd County, Virginia is located in the Blue Ridge Mountains of southwestern Virginia. It is bordered by Patrick County to the north, Carroll County to the east, Franklin County to the south, and Montgomery County to the west. The county seat is Floyd, and the county is named for Colonel John Floyd, a Revolutionary War hero.
Geography
Floyd County is located in the Blue Ridge Mountains of southwestern Virginia. It is bordered by Patrick County to the north, Carroll County to the east, Franklin County to the south, and Montgomery County to the west. The county is divided into two distinct regions: the Blue Ridge Mountains to the east and the Appalachian Plateau to the west. The county is home to several mountain peaks, including Flat Top Mountain, which is the highest point in the county at 4,001 feet. The county is also home to several rivers, including the Little River, the New River, and the Roanoke River.
The county has a total area of 437 square miles, of which 434 square miles is land and 3 square miles is water. The county is home to several state parks, including the New River Trail State Park, the Blue Ridge Parkway, and the Jefferson National Forest.
History
Floyd County was formed in 1831 from parts of Franklin, Patrick, and Montgomery counties. The county was named for Colonel John Floyd, a Revolutionary War hero. The county seat is Floyd, which was named for the county.
The county was largely rural until the 1950s, when the construction of the Blue Ridge Parkway and the Jefferson National Forest brought an influx of tourists to the area. The county has since become a popular destination for outdoor recreation, including camping, fishing, hunting, and hiking.
Economy
The economy of Floyd County is largely based on agriculture and tourism. The county is home to several farms, which produce a variety of crops, including corn, soybeans, hay, and tobacco. The county is also home to several wineries, which produce a variety of wines.
Tourism is a major industry in the county, with visitors coming to enjoy the area's natural beauty and outdoor recreation opportunities. The county is home to several state parks, including the New River Trail State Park, the Blue Ridge Parkway, and the Jefferson National Forest. The county is also home to several festivals and events, including the Floyd County Fair and the Floyd Country Store Jamboree.
Demographics
As of the 2010 census, Floyd County had a population of 15,279. The racial makeup of the county was 94.3% White, 2.7% Black or African American, 0.3% Native American, 0.4% Asian, 0.1% Pacific Islander, 0.7% from other races, and 1.5% from two or more races. Hispanic or Latino of any race were 2.2% of the population.
The median income for a household in the county was $35,945, and the median income for a family was $43,945. The per capita income for the county was $19,945. About 13.3% of families and 17.2% of the population were below the poverty line, including 22.2% of those under age 18 and 11.2% of those age 65 or over.
Floyd County is served by the Floyd County Public Schools system, which consists of five elementary schools, two middle schools, and one high school. The county is also home to several private schools, including Floyd Christian School and Floyd Academy.
Common Questions
What is Per Capita Income in Floyd County?
Per Capita income in Floyd County is $31,788.
What is the Median Family Income in Floyd County?
Median Family Income in Floyd County is $76,534.
What is the Median Household income in Floyd County?
Median Household Income in Floyd County is $57,146.
What is Income or Wage Gap in Floyd County?
Income or Wage Gap in Floyd County is 23.9%.
Women in Floyd County earn 76.1 cents for every dollar earned by a man.
What is Inequality or Gini Index in Floyd County?
Inequality or Gini Index in Floyd County is 0.42.
What is the Total Population of Floyd County?
Total Population of Floyd County is 15,532.
What is the Total Male Population of Floyd County?
Total Male Population of Floyd County is 7,649.
What is the Total Female Population of Floyd County?
Total Female Population of Floyd County is 7,883.
What is the Ratio of Males per 100 Females in Floyd County?
There are 97.03 Males per 100 Females in Floyd County.
What is the Ratio of Females per 100 Males in Floyd County?
There are 103.06 Females per 100 Males in Floyd County.
What is the Median Population Age in Floyd County?
Median Population Age in Floyd County is 48.4 Years.
What is the Average Family Size in Floyd County
Average Family Size in Floyd County is 2.9 People.
What is the Average Household Size in Floyd County
Average Household Size in Floyd County is 2.3 People.
How Large is the Labor Force in Floyd County?
There are 7,869 People in the Labor Forcein in Floyd County.
What is the Percentage of People in the Labor Force in Floyd County?
60.1% of People are in the Labor Force in Floyd County.
What is the Unemployment Rate in Floyd County?
Unemployment Rate in Floyd County is 2.6%.