Fairfax County, VA Map & Demographics
Fairfax County Map
Fairfax County Overview
$67,598
PER CAPITA INCOME
$172,110
AVG FAMILY INCOME
$145,165
AVG HOUSEHOLD INCOME
31.5%
WAGE / INCOME GAP [ % ]
68.5¢/ $1
WAGE / INCOME GAP [ $ ]
$11,439
FAMILY INCOME DEFICIT
0.43
INEQUALITY / GINI INDEX
1,145,354
TOTAL POPULATION
573,140
MALE POPULATION
572,214
FEMALE POPULATION
100.16
MALES / 100 FEMALES
99.84
FEMALES / 100 MALES
38.6
MEDIAN AGE
3.3
AVG FAMILY SIZE
2.8
AVG HOUSEHOLD SIZE
648,195
LABOR FORCE [ PEOPLE ]
71.2%
PERCENT IN LABOR FORCE
4.1%
UNEMPLOYMENT RATE
Income in Fairfax County
Income Overview in Fairfax County
Per Capita Income in Fairfax County is $67,598, while median incomes of families and households are $172,110 and $145,165 respectively.
| Characteristic | Number | Measure |
| Per Capita Income | 1,145,354 | $67,598 |
| Median Family Income | 287,539 | $172,110 |
| Mean Family Income | 287,539 | $211,803 |
| Median Household Income | 410,844 | $145,165 |
| Mean Household Income | 410,844 | $185,205 |
| Income Deficit | 287,539 | $11,439 |
| Wage / Income Gap (%) | 1,145,354 | 31.54% |
| Wage / Income Gap ($) | 1,145,354 | 68.46¢ per $1 |
| Gini / Inequality Index | 1,145,354 | 0.43 |
Earnings by Sex in Fairfax County
Average Earnings in Fairfax County are $68,796, $81,866 for men and $56,043 for women, a difference of 31.5%.
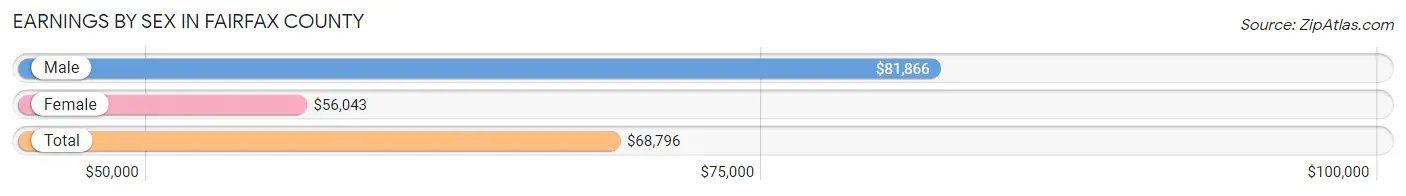
| Sex | Number | Average Earnings |
| Male | 360,680 (53.6%) | $81,866 |
| Female | 312,735 (46.4%) | $56,043 |
| Total | 673,415 (100.0%) | $68,796 |
Earnings by Sex by Income Bracket in Fairfax County
The most common earnings brackets in Fairfax County are $100,000+ for men (153,695 | 42.6%) and $100,000+ for women (85,827 | 27.4%).
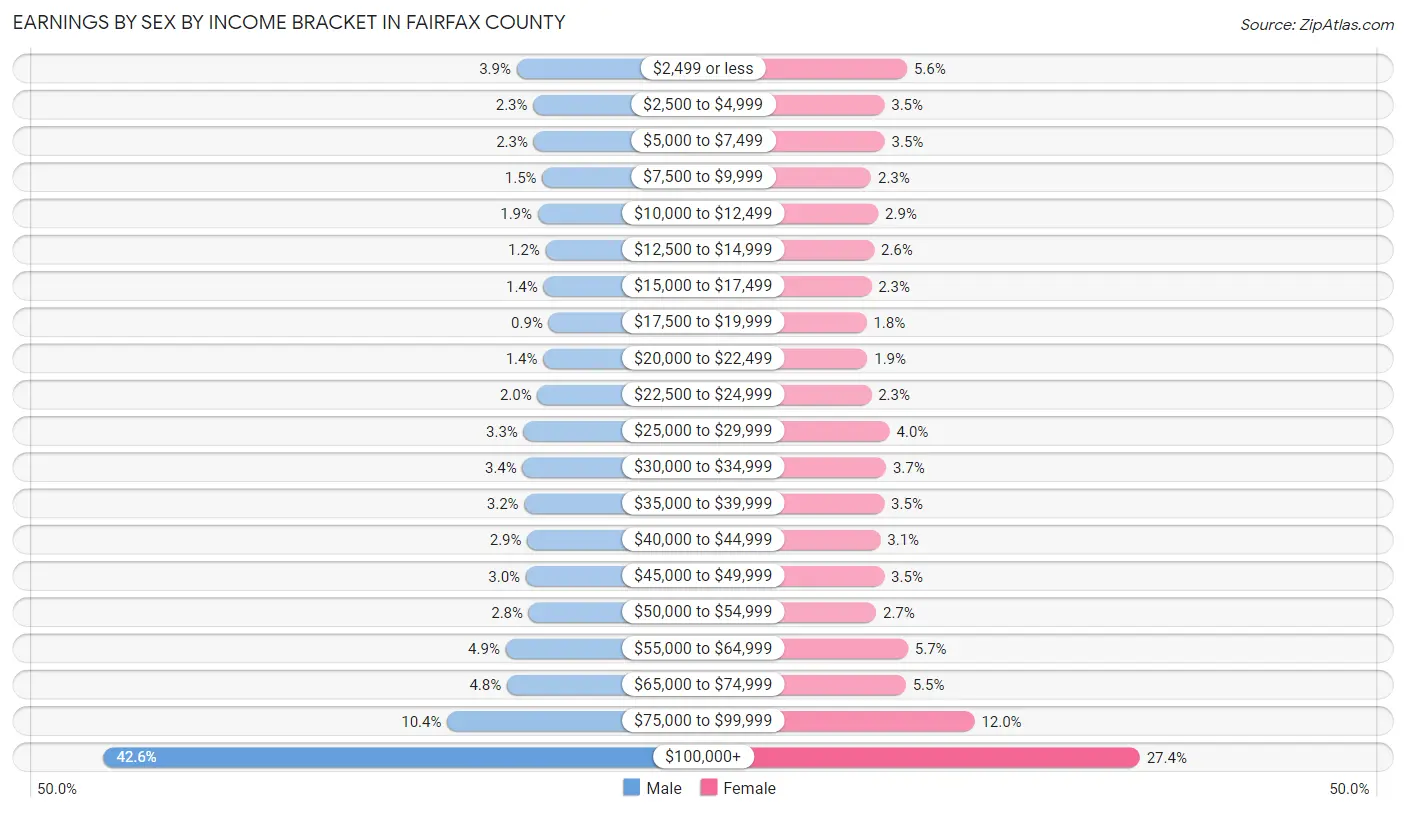
| Income | Male | Female |
| $2,499 or less | 14,016 (3.9%) | 17,653 (5.6%) |
| $2,500 to $4,999 | 8,428 (2.3%) | 10,986 (3.5%) |
| $5,000 to $7,499 | 8,299 (2.3%) | 11,062 (3.5%) |
| $7,500 to $9,999 | 5,366 (1.5%) | 7,099 (2.3%) |
| $10,000 to $12,499 | 6,935 (1.9%) | 9,183 (2.9%) |
| $12,500 to $14,999 | 4,298 (1.2%) | 7,971 (2.5%) |
| $15,000 to $17,499 | 4,979 (1.4%) | 7,164 (2.3%) |
| $17,500 to $19,999 | 3,245 (0.9%) | 5,754 (1.8%) |
| $20,000 to $22,499 | 5,084 (1.4%) | 6,013 (1.9%) |
| $22,500 to $24,999 | 7,046 (1.9%) | 7,147 (2.3%) |
| $25,000 to $29,999 | 11,739 (3.3%) | 12,532 (4.0%) |
| $30,000 to $34,999 | 12,073 (3.4%) | 11,466 (3.7%) |
| $35,000 to $39,999 | 11,476 (3.2%) | 10,956 (3.5%) |
| $40,000 to $44,999 | 10,454 (2.9%) | 9,820 (3.1%) |
| $45,000 to $49,999 | 10,973 (3.0%) | 10,946 (3.5%) |
| $50,000 to $54,999 | 9,940 (2.8%) | 8,575 (2.7%) |
| $55,000 to $64,999 | 17,785 (4.9%) | 17,895 (5.7%) |
| $65,000 to $74,999 | 17,353 (4.8%) | 17,273 (5.5%) |
| $75,000 to $99,999 | 37,496 (10.4%) | 37,413 (12.0%) |
| $100,000+ | 153,695 (42.6%) | 85,827 (27.4%) |
| Total | 360,680 (100.0%) | 312,735 (100.0%) |
Earnings by Sex by Educational Attainment in Fairfax County
Average earnings in Fairfax County are $95,222 for men and $67,488 for women, a difference of 29.1%. Men with an educational attainment of graduate degree enjoy the highest average annual earnings of $147,378, while those with less than high school education earn the least with $39,105. Women with an educational attainment of graduate degree earn the most with the average annual earnings of $100,890, while those with less than high school education have the smallest earnings of $22,013.
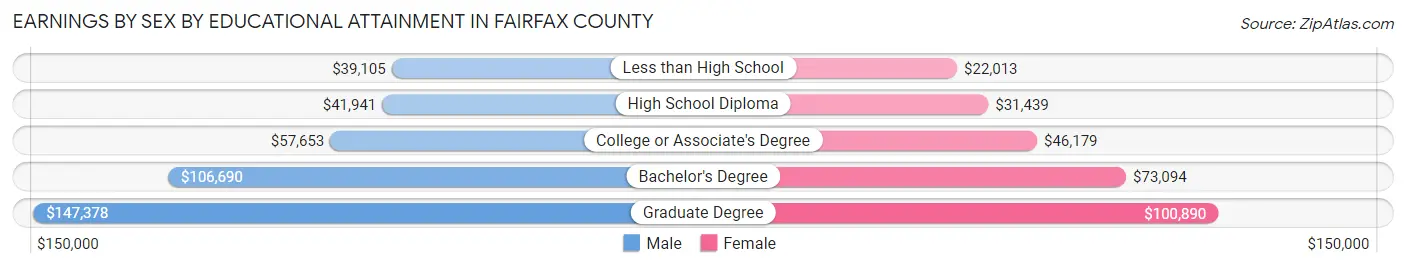
| Educational Attainment | Male Income | Female Income |
| Less than High School | $39,105 | $22,013 |
| High School Diploma | $41,941 | $31,439 |
| College or Associate's Degree | $57,653 | $46,179 |
| Bachelor's Degree | $106,690 | $73,094 |
| Graduate Degree | $147,378 | $100,890 |
| Total | $95,222 | $67,488 |
Family Income in Fairfax County
Family Income Brackets in Fairfax County
According to the Fairfax County family income data, there are 118,466 families falling into the $200,000+ income range, which is the most common income bracket and makes up 41.2% of all families. Conversely, the $10,000 to $14,999 income bracket is the least frequent group with only 2,013 families (0.7%) belonging to this category.
| Income Bracket | # Families | % Families |
| Less than $10,000 | 4,601 | 1.6% |
| $10,000 to $14,999 | 2,013 | 0.7% |
| $15,000 to $24,999 | 5,463 | 1.9% |
| $25,000 to $34,999 | 6,613 | 2.3% |
| $35,000 to $49,999 | 11,502 | 4.0% |
| $50,000 to $74,999 | 20,990 | 7.3% |
| $75,000 to $99,999 | 23,003 | 8.0% |
| $100,000 to $149,999 | 48,019 | 16.7% |
| $150,000 to $199,999 | 46,581 | 16.2% |
| $200,000+ | 118,466 | 41.2% |
Family Income by Famaliy Size in Fairfax County
4-person families (63,750 | 22.2%) account for the highest median family income in Fairfax County with $199,124 per family, while 2-person families (114,960 | 40.0%) have the highest median income of $78,042 per family member.
| Income Bracket | # Families | Median Income |
| 2-Person Families | 114,960 (40.0%) | $156,083 |
| 3-Person Families | 68,879 (23.9%) | $178,299 |
| 4-Person Families | 63,750 (22.2%) | $199,124 |
| 5-Person Families | 26,841 (9.3%) | $173,281 |
| 6-Person Families | 8,904 (3.1%) | $164,971 |
| 7+ Person Families | 4,205 (1.5%) | $171,767 |
| Total | 287,539 (100.0%) | $172,110 |
Family Income by Number of Earners in Fairfax County
The median family income in Fairfax County is $172,110, with families comprising 2 earners (142,364) having the highest median family income of $205,186, while families with no earners (25,374) have the lowest median family income of $110,543, accounting for 49.5% and 8.8% of families, respectively.
| Number of Earners | # Families | Median Income |
| No Earners | 25,374 (8.8%) | $110,543 |
| 1 Earner | 76,862 (26.7%) | $124,304 |
| 2 Earners | 142,364 (49.5%) | $205,186 |
| 3+ Earners | 42,939 (14.9%) | $199,073 |
| Total | 287,539 (100.0%) | $172,110 |
Household Income in Fairfax County
Household Income Brackets in Fairfax County
With 136,400 households falling in the category, the $200,000+ income range is the most frequent in Fairfax County, accounting for 33.2% of all households. In contrast, only 4,930 households (1.2%) fall into the $10,000 to $14,999 income bracket, making it the least populous group.
| Income Bracket | # Households | % Households |
| Less than $10,000 | 10,271 | 2.5% |
| $10,000 to $14,999 | 4,930 | 1.2% |
| $15,000 to $24,999 | 10,271 | 2.5% |
| $25,000 to $34,999 | 12,325 | 3.0% |
| $35,000 to $49,999 | 20,542 | 5.0% |
| $50,000 to $74,999 | 37,387 | 9.1% |
| $75,000 to $99,999 | 40,674 | 9.9% |
| $100,000 to $149,999 | 75,184 | 18.3% |
| $150,000 to $199,999 | 62,859 | 15.3% |
| $200,000+ | 136,400 | 33.2% |
Household Income by Householder Age in Fairfax County
The median household income in Fairfax County is $145,165, with the highest median household income of $173,771 found in the 45 to 64 years age bracket for the primary householder. A total of 165,799 households (40.4%) fall into this category. Meanwhile, the 15 to 24 years age bracket for the primary householder has the lowest median household income of $64,752, with 10,002 households (2.4%) in this group.
| Income Bracket | # Households | Median Income |
| 15 to 24 Years | 10,002 (2.4%) | $64,752 |
| 25 to 44 Years | 141,317 (34.4%) | $143,874 |
| 45 to 64 Years | 165,799 (40.4%) | $173,771 |
| 65+ Years | 93,726 (22.8%) | $113,488 |
| Total | 410,844 (100.0%) | $145,165 |
Poverty in Fairfax County
Income Below Poverty by Sex and Age in Fairfax County
With 5.3% poverty level for males and 6.7% for females among the residents of Fairfax County, 18 to 24 year old males and 18 to 24 year old females are the most vulnerable to poverty, with 4,276 males (9.0%) and 5,681 females (12.5%) in their respective age groups living below the poverty level.
| Age Bracket | Male | Female |
| Under 5 Years | 2,714 (7.7%) | 2,608 (7.8%) |
| 5 Years | 345 (5.1%) | 708 (9.9%) |
| 6 to 11 Years | 4,065 (8.7%) | 2,844 (6.9%) |
| 12 to 14 Years | 1,616 (7.1%) | 2,053 (8.9%) |
| 15 Years | 571 (6.6%) | 516 (6.5%) |
| 16 and 17 Years | 1,231 (8.0%) | 792 (5.5%) |
| 18 to 24 Years | 4,276 (9.0%) | 5,681 (12.5%) |
| 25 to 34 Years | 3,116 (4.1%) | 5,112 (7.1%) |
| 35 to 44 Years | 3,310 (4.0%) | 5,239 (6.3%) |
| 45 to 54 Years | 3,088 (3.9%) | 3,598 (4.5%) |
| 55 to 64 Years | 2,550 (3.5%) | 3,629 (5.0%) |
| 65 to 74 Years | 1,670 (3.6%) | 2,223 (4.4%) |
| 75 Years and over | 1,608 (5.8%) | 2,738 (7.6%) |
| Total | 30,160 (5.3%) | 37,741 (6.7%) |
Income Above Poverty by Sex and Age in Fairfax County
According to the poverty statistics in Fairfax County, males aged 55 to 64 years and females aged 65 to 74 years are the age groups that are most secure financially, with 96.5% of males and 95.6% of females in these age groups living above the poverty line.
| Age Bracket | Male | Female |
| Under 5 Years | 32,380 (92.3%) | 30,793 (92.2%) |
| 5 Years | 6,486 (95.0%) | 6,449 (90.1%) |
| 6 to 11 Years | 42,490 (91.3%) | 38,505 (93.1%) |
| 12 to 14 Years | 21,046 (92.9%) | 20,963 (91.1%) |
| 15 Years | 8,091 (93.4%) | 7,416 (93.5%) |
| 16 and 17 Years | 14,215 (92.0%) | 13,647 (94.5%) |
| 18 to 24 Years | 43,059 (91.0%) | 39,753 (87.5%) |
| 25 to 34 Years | 73,287 (95.9%) | 67,300 (92.9%) |
| 35 to 44 Years | 79,736 (96.0%) | 77,583 (93.7%) |
| 45 to 54 Years | 76,701 (96.1%) | 76,592 (95.5%) |
| 55 to 64 Years | 69,620 (96.5%) | 68,816 (95.0%) |
| 65 to 74 Years | 44,625 (96.4%) | 48,140 (95.6%) |
| 75 Years and over | 26,031 (94.2%) | 33,356 (92.4%) |
| Total | 537,767 (94.7%) | 529,313 (93.3%) |
Income Below Poverty Among Married-Couple Families in Fairfax County
The poverty statistics for married-couple families in Fairfax County show that 2.5% or 5,787 of the total 235,729 families live below the poverty line. Families with 5 or more children have the highest poverty rate of 17.1%, comprising of 170 families. On the other hand, families with no children have the lowest poverty rate of 1.8%, which includes 2,165 families.
| Children | Above Poverty | Below Poverty |
| No Children | 120,865 (98.2%) | 2,165 (1.8%) |
| 1 or 2 Children | 90,065 (97.7%) | 2,116 (2.3%) |
| 3 or 4 Children | 18,190 (93.2%) | 1,336 (6.8%) |
| 5 or more Children | 822 (82.9%) | 170 (17.1%) |
| Total | 229,942 (97.6%) | 5,787 (2.5%) |
Income Below Poverty Among Single-Parent Households in Fairfax County
According to the poverty data in Fairfax County, 7.4% or 1,239 single-father households and 14.6% or 5,102 single-mother households are living below the poverty line. Among single-father households, those with 3 or 4 children have the highest poverty rate, with 138 households (15.8%) experiencing poverty. Likewise, among single-mother households, those with 5 or more children have the highest poverty rate, with 161 households (89.4%) falling below the poverty line.
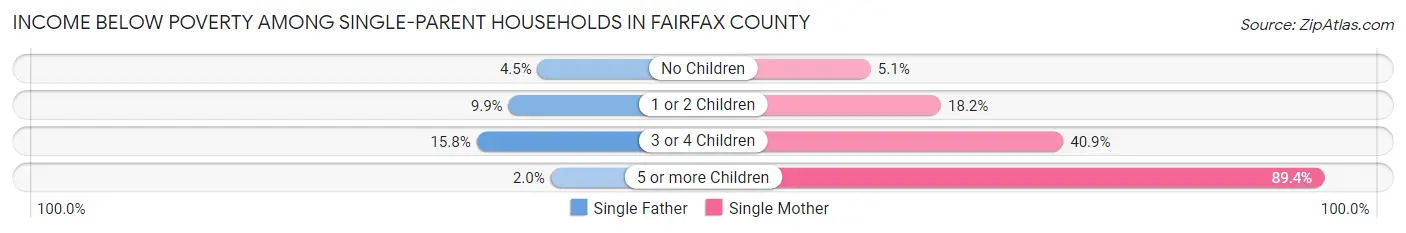
| Children | Single Father | Single Mother |
| No Children | 382 (4.5%) | 768 (5.1%) |
| 1 or 2 Children | 717 (9.9%) | 3,097 (18.1%) |
| 3 or 4 Children | 138 (15.8%) | 1,076 (40.9%) |
| 5 or more Children | 2 (2.0%) | 161 (89.4%) |
| Total | 1,239 (7.4%) | 5,102 (14.6%) |
Income Below Poverty Among Married-Couple vs Single-Parent Households in Fairfax County
The poverty data for Fairfax County shows that 5,787 of the married-couple family households (2.5%) and 6,341 of the single-parent households (12.2%) are living below the poverty level. Within the married-couple family households, those with 5 or more children have the highest poverty rate, with 170 households (17.1%) falling below the poverty line. Among the single-parent households, those with 5 or more children have the highest poverty rate, with 163 household (58.6%) living below poverty.
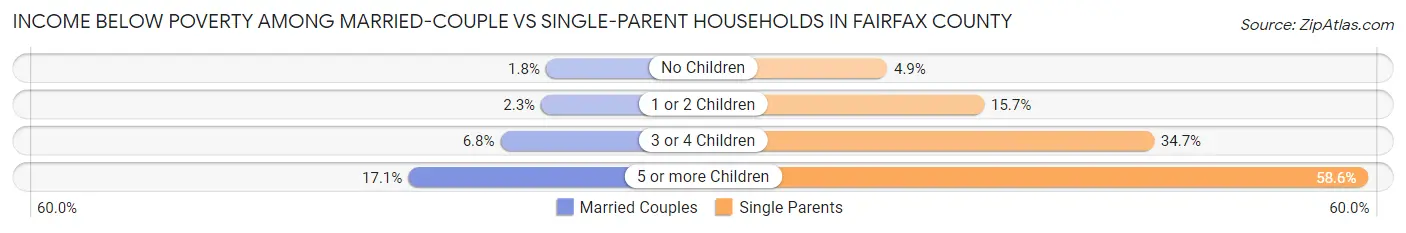
| Children | Married-Couple Families | Single-Parent Households |
| No Children | 2,165 (1.8%) | 1,150 (4.9%) |
| 1 or 2 Children | 2,116 (2.3%) | 3,814 (15.7%) |
| 3 or 4 Children | 1,336 (6.8%) | 1,214 (34.7%) |
| 5 or more Children | 170 (17.1%) | 163 (58.6%) |
| Total | 5,787 (2.5%) | 6,341 (12.2%) |
Race in Fairfax County
The most populous races in Fairfax County are White / Caucasian (620,521 | 54.2%), Asian (231,660 | 20.2%), and Hispanic or Latino (189,282 | 16.5%).
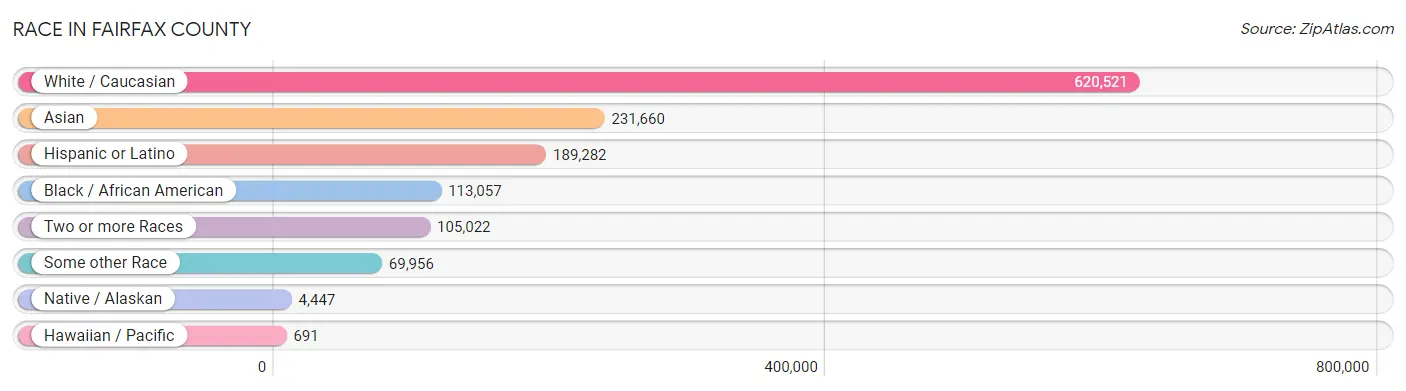
| Race | # Population | % Population |
| Asian | 231,660 | 20.2% |
| Black / African American | 113,057 | 9.9% |
| Hawaiian / Pacific | 691 | 0.1% |
| Hispanic or Latino | 189,282 | 16.5% |
| Native / Alaskan | 4,447 | 0.4% |
| White / Caucasian | 620,521 | 54.2% |
| Two or more Races | 105,022 | 9.2% |
| Some other Race | 69,956 | 6.1% |
| Total | 1,145,354 | 100.0% |
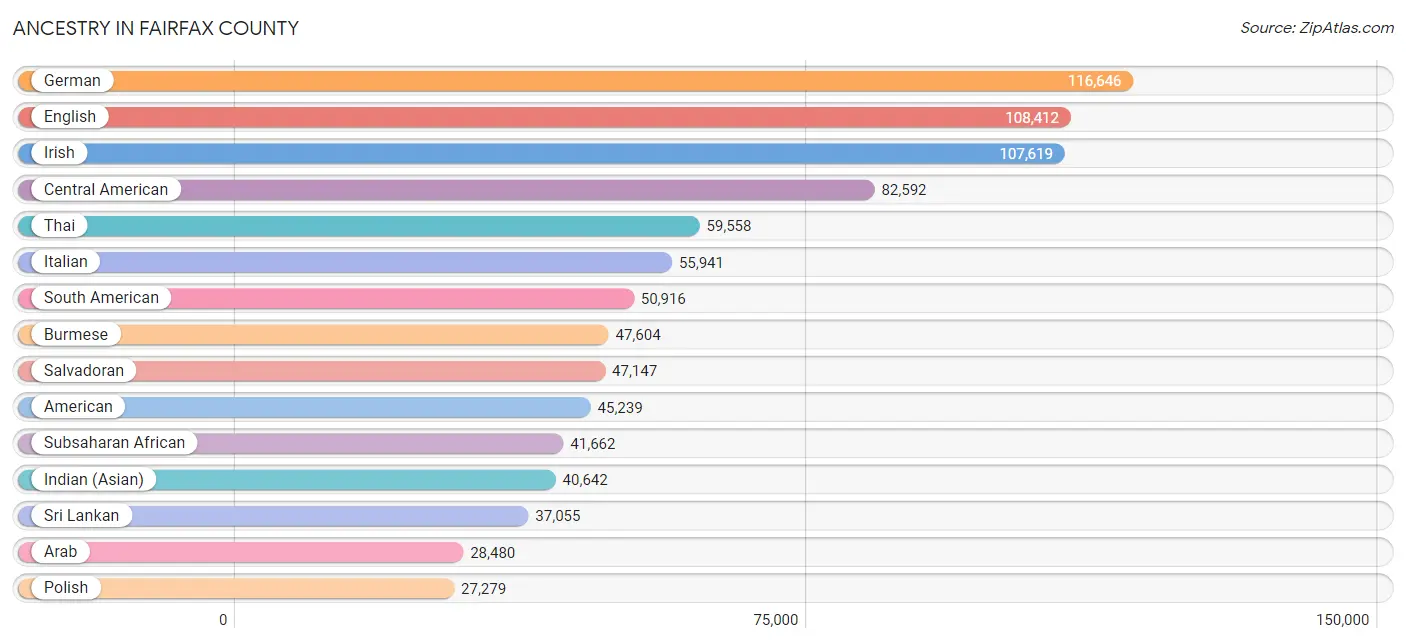
Ancestry in Fairfax County
The most populous ancestries reported in Fairfax County are German (116,646 | 10.2%), English (108,412 | 9.5%), Irish (107,619 | 9.4%), Central American (82,592 | 7.2%), and Thai (59,558 | 5.2%), together accounting for 41.5% of all Fairfax County residents.
| Ancestry | # Population | % Population |
| Afghan | 8,118 | 0.7% |
| African | 8,276 | 0.7% |
| Alaska Native | 24 | 0.0% |
| Alaskan Athabascan | 40 | 0.0% |
| Albanian | 996 | 0.1% |
| Aleut | 22 | 0.0% |
| Alsatian | 32 | 0.0% |
| American | 45,239 | 4.0% |
| Apache | 240 | 0.0% |
| Arab | 28,480 | 2.5% |
| Argentinean | 2,787 | 0.2% |
| Armenian | 2,557 | 0.2% |
| Assyrian / Chaldean / Syriac | 36 | 0.0% |
| Australian | 406 | 0.0% |
| Austrian | 3,316 | 0.3% |
| Bangladeshi | 34 | 0.0% |
| Barbadian | 196 | 0.0% |
| Basque | 111 | 0.0% |
| Belgian | 981 | 0.1% |
| Belizean | 59 | 0.0% |
| Bhutanese | 7,144 | 0.6% |
| Blackfeet | 187 | 0.0% |
| Bolivian | 17,589 | 1.5% |
| Brazilian | 1,884 | 0.2% |
| British | 10,632 | 0.9% |
| British West Indian | 107 | 0.0% |
| Bulgarian | 1,230 | 0.1% |
| Burmese | 47,604 | 4.2% |
| Cajun | 161 | 0.0% |
| Cambodian | 819 | 0.1% |
| Canadian | 2,322 | 0.2% |
| Cape Verdean | 233 | 0.0% |
| Carpatho Rusyn | 28 | 0.0% |
| Celtic | 309 | 0.0% |
| Central American | 82,592 | 7.2% |
| Central American Indian | 3,052 | 0.3% |
| Cherokee | 1,744 | 0.2% |
| Chickasaw | 149 | 0.0% |
| Chilean | 1,953 | 0.2% |
| Chinese | 107 | 0.0% |
| Chippewa | 77 | 0.0% |
| Choctaw | 340 | 0.0% |
| Colombian | 6,574 | 0.6% |
| Comanche | 13 | 0.0% |
| Costa Rican | 1,341 | 0.1% |
| Cree | 116 | 0.0% |
| Creek | 109 | 0.0% |
| Croatian | 1,276 | 0.1% |
| Cuban | 3,404 | 0.3% |
| Cypriot | 124 | 0.0% |
| Czech | 4,391 | 0.4% |
| Czechoslovakian | 844 | 0.1% |
| Danish | 3,677 | 0.3% |
| Delaware | 10 | 0.0% |
| Dominican | 2,389 | 0.2% |
| Dutch | 8,738 | 0.8% |
| Dutch West Indian | 38 | 0.0% |
| Eastern European | 5,996 | 0.5% |
| Ecuadorian | 3,037 | 0.3% |
| Egyptian | 5,011 | 0.4% |
| English | 108,412 | 9.5% |
| Estonian | 329 | 0.0% |
| Ethiopian | 17,172 | 1.5% |
| European | 26,982 | 2.4% |
| Filipino | 2,599 | 0.2% |
| Finnish | 1,600 | 0.1% |
| French | 18,755 | 1.6% |
| French American Indian | 80 | 0.0% |
| French Canadian | 4,064 | 0.4% |
| German | 116,646 | 10.2% |
| German Russian | 41 | 0.0% |
| Ghanaian | 4,256 | 0.4% |
| Greek | 6,348 | 0.5% |
| Guamanian / Chamorro | 816 | 0.1% |
| Guatemalan | 15,264 | 1.3% |
| Guyanese | 228 | 0.0% |
| Haitian | 830 | 0.1% |
| Honduran | 13,628 | 1.2% |
| Hopi | 22 | 0.0% |
| Hungarian | 4,786 | 0.4% |
| Icelander | 67 | 0.0% |
| Indian (Asian) | 40,642 | 3.5% |
| Indonesian | 392 | 0.0% |
| Inupiat | 52 | 0.0% |
| Iranian | 10,177 | 0.9% |
| Iraqi | 2,080 | 0.2% |
| Irish | 107,619 | 9.4% |
| Iroquois | 247 | 0.0% |
| Israeli | 370 | 0.0% |
| Italian | 55,941 | 4.9% |
| Jamaican | 2,090 | 0.2% |
| Japanese | 3,211 | 0.3% |
| Jordanian | 1,185 | 0.1% |
| Kenyan | 1,364 | 0.1% |
| Kiowa | 13 | 0.0% |
| Korean | 23,576 | 2.1% |
| Laotian | 1,192 | 0.1% |
| Latvian | 579 | 0.1% |
| Lebanese | 5,135 | 0.4% |
| Liberian | 400 | 0.0% |
| Lithuanian | 3,176 | 0.3% |
| Lumbee | 91 | 0.0% |
| Luxembourger | 71 | 0.0% |
| Macedonian | 167 | 0.0% |
| Malaysian | 2,132 | 0.2% |
| Maltese | 39 | 0.0% |
| Mexican | 21,284 | 1.9% |
| Mexican American Indian | 1,065 | 0.1% |
| Mongolian | 698 | 0.1% |
| Moroccan | 3,997 | 0.4% |
| Native Hawaiian | 924 | 0.1% |
| Navajo | 122 | 0.0% |
| New Zealander | 74 | 0.0% |
| Nicaraguan | 3,447 | 0.3% |
| Nigerian | 1,238 | 0.1% |
| Northern European | 2,985 | 0.3% |
| Norwegian | 7,814 | 0.7% |
| Okinawan | 72 | 0.0% |
| Osage | 16 | 0.0% |
| Ottawa | 3 | 0.0% |
| Pakistani | 3,799 | 0.3% |
| Palestinian | 2,033 | 0.2% |
| Panamanian | 1,484 | 0.1% |
| Paraguayan | 600 | 0.1% |
| Pennsylvania German | 270 | 0.0% |
| Peruvian | 15,413 | 1.3% |
| Polish | 27,279 | 2.4% |
| Portuguese | 3,042 | 0.3% |
| Pueblo | 28 | 0.0% |
| Puerto Rican | 12,024 | 1.1% |
| Puget Sound Salish | 4 | 0.0% |
| Romanian | 2,139 | 0.2% |
| Russian | 11,136 | 1.0% |
| Salvadoran | 47,147 | 4.1% |
| Samoan | 167 | 0.0% |
| Scandinavian | 2,721 | 0.2% |
| Scotch-Irish | 11,373 | 1.0% |
| Scottish | 19,580 | 1.7% |
| Seminole | 148 | 0.0% |
| Senegalese | 196 | 0.0% |
| Serbian | 974 | 0.1% |
| Shoshone | 19 | 0.0% |
| Sierra Leonean | 2,136 | 0.2% |
| Sioux | 148 | 0.0% |
| Slavic | 1,107 | 0.1% |
| Slovak | 3,201 | 0.3% |
| Slovene | 592 | 0.1% |
| Somali | 2,147 | 0.2% |
| South African | 540 | 0.1% |
| South American | 50,916 | 4.4% |
| South American Indian | 1,447 | 0.1% |
| Spaniard | 3,648 | 0.3% |
| Spanish | 2,820 | 0.3% |
| Spanish American | 101 | 0.0% |
| Sri Lankan | 37,055 | 3.2% |
| Subsaharan African | 41,662 | 3.6% |
| Sudanese | 1,566 | 0.1% |
| Swedish | 9,984 | 0.9% |
| Swiss | 2,999 | 0.3% |
| Syrian | 1,382 | 0.1% |
| Taiwanese | 13 | 0.0% |
| Thai | 59,558 | 5.2% |
| Tlingit-Haida | 17 | 0.0% |
| Tongan | 21 | 0.0% |
| Trinidadian and Tobagonian | 565 | 0.1% |
| Turkish | 3,576 | 0.3% |
| U.S. Virgin Islander | 5 | 0.0% |
| Ugandan | 223 | 0.0% |
| Ukrainian | 5,007 | 0.4% |
| Uruguayan | 561 | 0.1% |
| Ute | 19 | 0.0% |
| Venezuelan | 2,142 | 0.2% |
| Vietnamese | 4,615 | 0.4% |
| Welsh | 8,142 | 0.7% |
| West Indian | 893 | 0.1% |
| Yaqui | 66 | 0.0% |
| Yugoslavian | 373 | 0.0% |
| Zimbabwean | 180 | 0.0% | View All 178 Rows |
Immigrants in Fairfax County
The most numerous immigrant groups reported in Fairfax County came from Asia (183,887 | 16.1%), Latin America (99,527 | 8.7%), South Central Asia (68,723 | 6.0%), Central America (57,704 | 5.0%), and Eastern Asia (56,049 | 4.9%), together accounting for 40.7% of all Fairfax County residents.
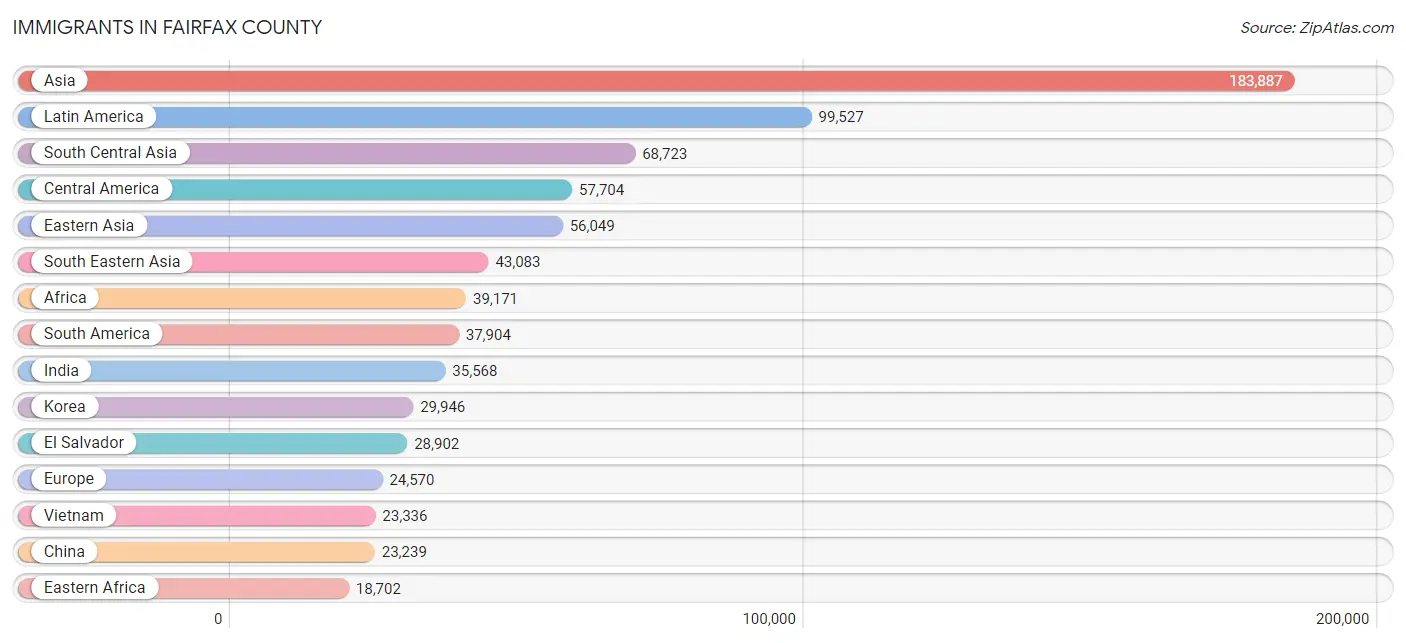
| Immigration Origin | # Population | % Population |
| Afghanistan | 6,995 | 0.6% |
| Africa | 39,171 | 3.4% |
| Albania | 598 | 0.1% |
| Argentina | 1,938 | 0.2% |
| Armenia | 486 | 0.0% |
| Asia | 183,887 | 16.1% |
| Australia | 527 | 0.1% |
| Austria | 276 | 0.0% |
| Bangladesh | 3,979 | 0.4% |
| Barbados | 130 | 0.0% |
| Belarus | 316 | 0.0% |
| Belgium | 214 | 0.0% |
| Bolivia | 12,497 | 1.1% |
| Bosnia and Herzegovina | 272 | 0.0% |
| Brazil | 1,935 | 0.2% |
| Bulgaria | 1,109 | 0.1% |
| Cambodia | 1,678 | 0.2% |
| Cameroon | 436 | 0.0% |
| Canada | 2,804 | 0.2% |
| Caribbean | 3,919 | 0.3% |
| Central America | 57,704 | 5.0% |
| Chile | 1,436 | 0.1% |
| China | 23,239 | 2.0% |
| Colombia | 4,095 | 0.4% |
| Congo | 156 | 0.0% |
| Costa Rica | 417 | 0.0% |
| Croatia | 85 | 0.0% |
| Cuba | 790 | 0.1% |
| Czechoslovakia | 333 | 0.0% |
| Denmark | 147 | 0.0% |
| Dominica | 55 | 0.0% |
| Dominican Republic | 830 | 0.1% |
| Eastern Africa | 18,702 | 1.6% |
| Eastern Asia | 56,049 | 4.9% |
| Eastern Europe | 10,411 | 0.9% |
| Ecuador | 1,616 | 0.1% |
| Egypt | 3,802 | 0.3% |
| El Salvador | 28,902 | 2.5% |
| England | 1,492 | 0.1% |
| Eritrea | 1,585 | 0.1% |
| Ethiopia | 13,764 | 1.2% |
| Europe | 24,570 | 2.1% |
| Fiji | 31 | 0.0% |
| France | 1,330 | 0.1% |
| Germany | 3,339 | 0.3% |
| Ghana | 3,463 | 0.3% |
| Greece | 717 | 0.1% |
| Grenada | 28 | 0.0% |
| Guatemala | 9,370 | 0.8% |
| Guyana | 484 | 0.0% |
| Haiti | 572 | 0.1% |
| Honduras | 9,149 | 0.8% |
| Hong Kong | 1,321 | 0.1% |
| Hungary | 292 | 0.0% |
| India | 35,568 | 3.1% |
| Indonesia | 841 | 0.1% |
| Iran | 7,286 | 0.6% |
| Iraq | 3,032 | 0.3% |
| Ireland | 505 | 0.0% |
| Israel | 575 | 0.1% |
| Italy | 913 | 0.1% |
| Jamaica | 851 | 0.1% |
| Japan | 2,390 | 0.2% |
| Jordan | 1,038 | 0.1% |
| Kazakhstan | 265 | 0.0% |
| Kenya | 1,393 | 0.1% |
| Korea | 29,946 | 2.6% |
| Kuwait | 432 | 0.0% |
| Laos | 1,109 | 0.1% |
| Latin America | 99,527 | 8.7% |
| Latvia | 143 | 0.0% |
| Lebanon | 2,055 | 0.2% |
| Liberia | 221 | 0.0% |
| Lithuania | 82 | 0.0% |
| Malaysia | 1,038 | 0.1% |
| Mexico | 6,383 | 0.6% |
| Micronesia | 27 | 0.0% |
| Middle Africa | 1,339 | 0.1% |
| Moldova | 536 | 0.1% |
| Morocco | 3,348 | 0.3% |
| Nepal | 4,643 | 0.4% |
| Netherlands | 733 | 0.1% |
| Nicaragua | 2,825 | 0.3% |
| Nigeria | 513 | 0.0% |
| North Macedonia | 77 | 0.0% |
| Northern Africa | 9,581 | 0.8% |
| Northern Europe | 5,135 | 0.4% |
| Norway | 50 | 0.0% |
| Oceania | 733 | 0.1% |
| Pakistan | 8,437 | 0.7% |
| Panama | 611 | 0.1% |
| Peru | 11,073 | 1.0% |
| Philippines | 11,870 | 1.0% |
| Poland | 889 | 0.1% |
| Portugal | 454 | 0.0% |
| Romania | 796 | 0.1% |
| Russia | 2,820 | 0.3% |
| Saudi Arabia | 2,264 | 0.2% |
| Scotland | 114 | 0.0% |
| Senegal | 184 | 0.0% |
| Serbia | 168 | 0.0% |
| Sierra Leone | 2,247 | 0.2% |
| Singapore | 208 | 0.0% |
| Somalia | 1,180 | 0.1% |
| South Africa | 871 | 0.1% |
| South America | 37,904 | 3.3% |
| South Central Asia | 68,723 | 6.0% |
| South Eastern Asia | 43,083 | 3.8% |
| Southern Europe | 2,844 | 0.3% |
| Spain | 760 | 0.1% |
| Sri Lanka | 910 | 0.1% |
| St. Vincent and the Grenadines | 44 | 0.0% |
| Sudan | 1,783 | 0.2% |
| Sweden | 360 | 0.0% |
| Switzerland | 138 | 0.0% |
| Syria | 1,023 | 0.1% |
| Taiwan | 3,781 | 0.3% |
| Thailand | 2,617 | 0.2% |
| Trinidad and Tobago | 471 | 0.0% |
| Turkey | 2,623 | 0.2% |
| Uganda | 161 | 0.0% |
| Ukraine | 1,345 | 0.1% |
| Uruguay | 332 | 0.0% |
| Uzbekistan | 329 | 0.0% |
| Venezuela | 1,835 | 0.2% |
| Vietnam | 23,336 | 2.0% |
| Western Africa | 7,158 | 0.6% |
| Western Asia | 15,447 | 1.3% |
| Western Europe | 6,035 | 0.5% |
| Yemen | 284 | 0.0% |
| Zaire | 388 | 0.0% |
| Zimbabwe | 147 | 0.0% | View All 132 Rows |
Sex and Age in Fairfax County
Sex and Age in Fairfax County
The most populous age groups in Fairfax County are 35 to 39 Years (41,692 | 7.3%) for men and 35 to 39 Years (43,401 | 7.6%) for women.
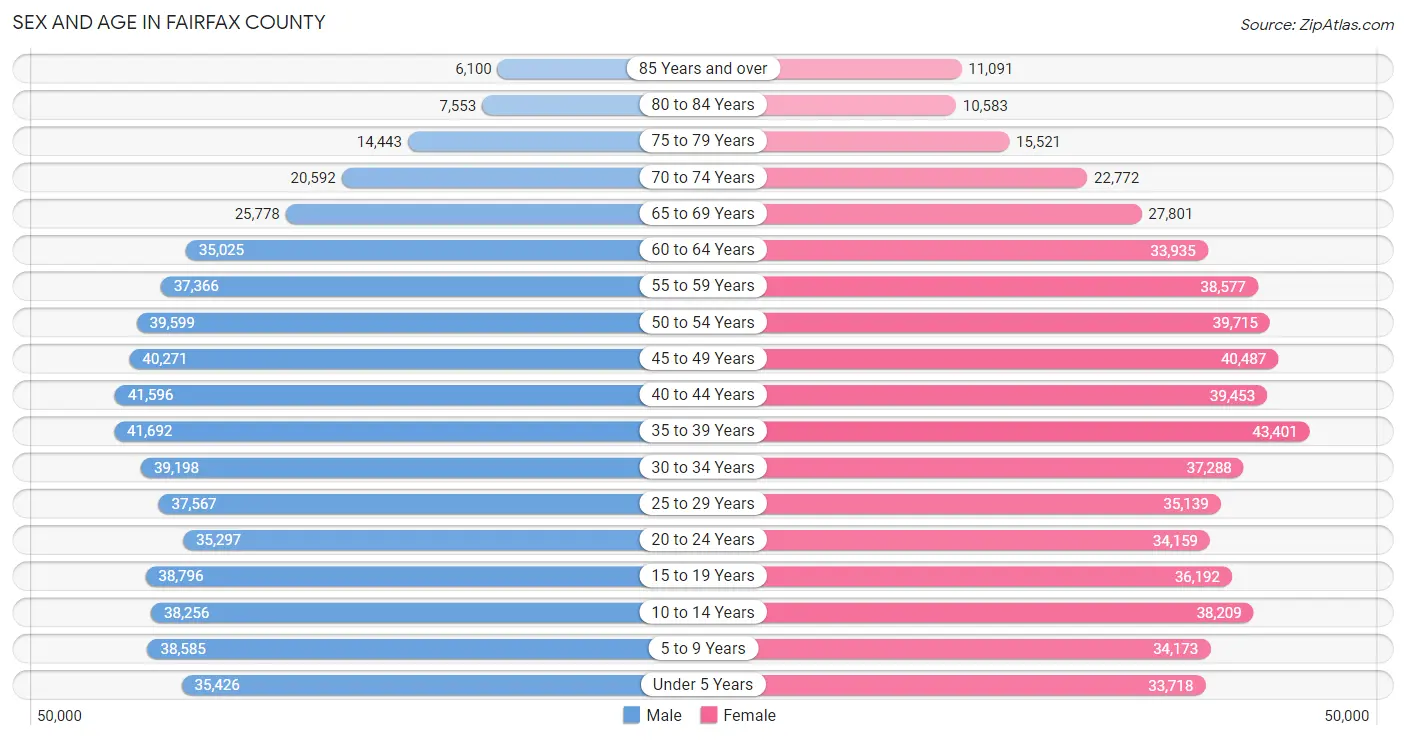
| Age Bracket | Male | Female |
| Under 5 Years | 35,426 (6.2%) | 33,718 (5.9%) |
| 5 to 9 Years | 38,585 (6.7%) | 34,173 (6.0%) |
| 10 to 14 Years | 38,256 (6.7%) | 38,209 (6.7%) |
| 15 to 19 Years | 38,796 (6.8%) | 36,192 (6.3%) |
| 20 to 24 Years | 35,297 (6.2%) | 34,159 (6.0%) |
| 25 to 29 Years | 37,567 (6.6%) | 35,139 (6.1%) |
| 30 to 34 Years | 39,198 (6.8%) | 37,288 (6.5%) |
| 35 to 39 Years | 41,692 (7.3%) | 43,401 (7.6%) |
| 40 to 44 Years | 41,596 (7.3%) | 39,453 (6.9%) |
| 45 to 49 Years | 40,271 (7.0%) | 40,487 (7.1%) |
| 50 to 54 Years | 39,599 (6.9%) | 39,715 (6.9%) |
| 55 to 59 Years | 37,366 (6.5%) | 38,577 (6.7%) |
| 60 to 64 Years | 35,025 (6.1%) | 33,935 (5.9%) |
| 65 to 69 Years | 25,778 (4.5%) | 27,801 (4.9%) |
| 70 to 74 Years | 20,592 (3.6%) | 22,772 (4.0%) |
| 75 to 79 Years | 14,443 (2.5%) | 15,521 (2.7%) |
| 80 to 84 Years | 7,553 (1.3%) | 10,583 (1.8%) |
| 85 Years and over | 6,100 (1.1%) | 11,091 (1.9%) |
| Total | 573,140 (100.0%) | 572,214 (100.0%) |
Families and Households in Fairfax County
Median Family Size in Fairfax County
The median family size in Fairfax County is 3.31 persons per family, with married-couple families (235,729 | 82.0%) accounting for the largest median family size of 3.34 persons per family. On the other hand, single male/father families (16,791 | 5.8%) represent the smallest median family size with 3.13 persons per family.
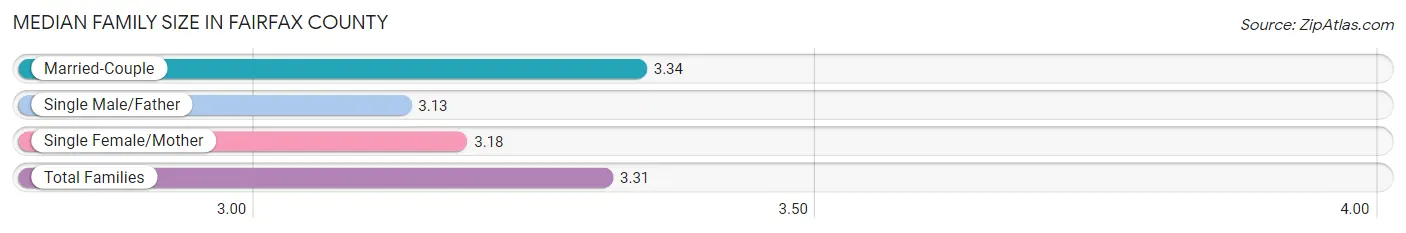
| Family Type | # Families | Family Size |
| Married-Couple | 235,729 (82.0%) | 3.34 |
| Single Male/Father | 16,791 (5.8%) | 3.13 |
| Single Female/Mother | 35,019 (12.2%) | 3.18 |
| Total Families | 287,539 (100.0%) | 3.31 |
Median Household Size in Fairfax County
The median household size in Fairfax County is 2.76 persons per household, with single male/father households (16,791 | 4.1%) accounting for the largest median household size of 3.52 persons per household. non-family households (123,305 | 30.0%) represent the smallest median household size with 1.30 persons per household.
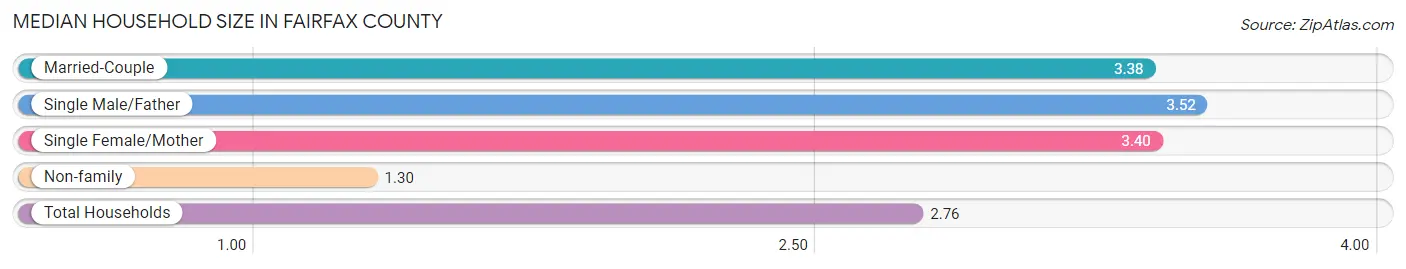
| Household Type | # Households | Household Size |
| Married-Couple | 235,729 (57.4%) | 3.38 |
| Single Male/Father | 16,791 (4.1%) | 3.52 |
| Single Female/Mother | 35,019 (8.5%) | 3.40 |
| Non-family | 123,305 (30.0%) | 1.30 |
| Total Households | 410,844 (100.0%) | 2.76 |
Household Size by Marriage Status in Fairfax County
Out of a total of 410,844 households in Fairfax County, 287,539 (70.0%) are family households, while 123,305 (30.0%) are nonfamily households. The most numerous type of family households are 2-person households, comprising 109,108, and the most common type of nonfamily households are 1-person households, comprising 97,248.
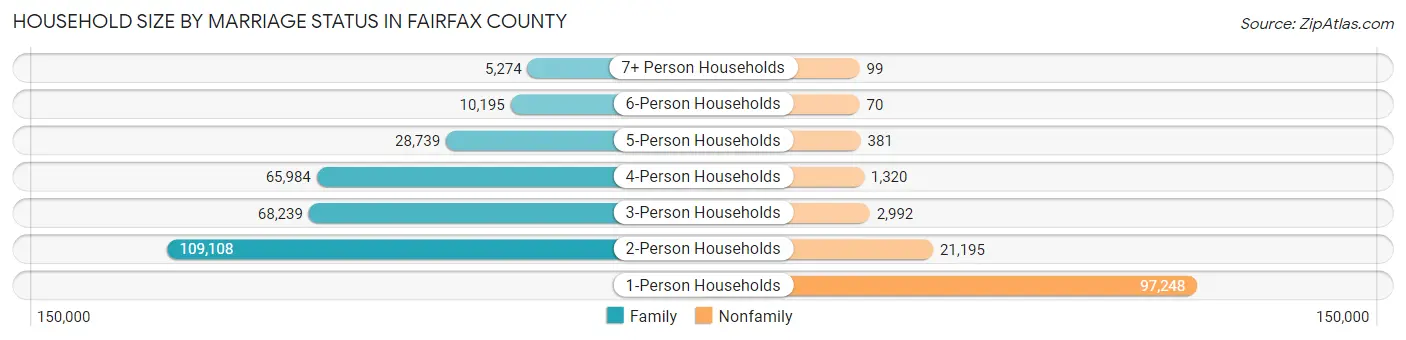
| Household Size | Family Households | Nonfamily Households |
| 1-Person Households | - | 97,248 (23.7%) |
| 2-Person Households | 109,108 (26.6%) | 21,195 (5.2%) |
| 3-Person Households | 68,239 (16.6%) | 2,992 (0.7%) |
| 4-Person Households | 65,984 (16.1%) | 1,320 (0.3%) |
| 5-Person Households | 28,739 (7.0%) | 381 (0.1%) |
| 6-Person Households | 10,195 (2.5%) | 70 (0.0%) |
| 7+ Person Households | 5,274 (1.3%) | 99 (0.0%) |
| Total | 287,539 (70.0%) | 123,305 (30.0%) |
Female Fertility in Fairfax County
Fertility by Age in Fairfax County
Average fertility rate in Fairfax County is 51.0 births per 1,000 women. Women in the age bracket of 20 to 34 years have the highest fertility rate with 72.0 births per 1,000 women. Women in the age bracket of 20 to 34 years acount for 55.3% of all women with births.
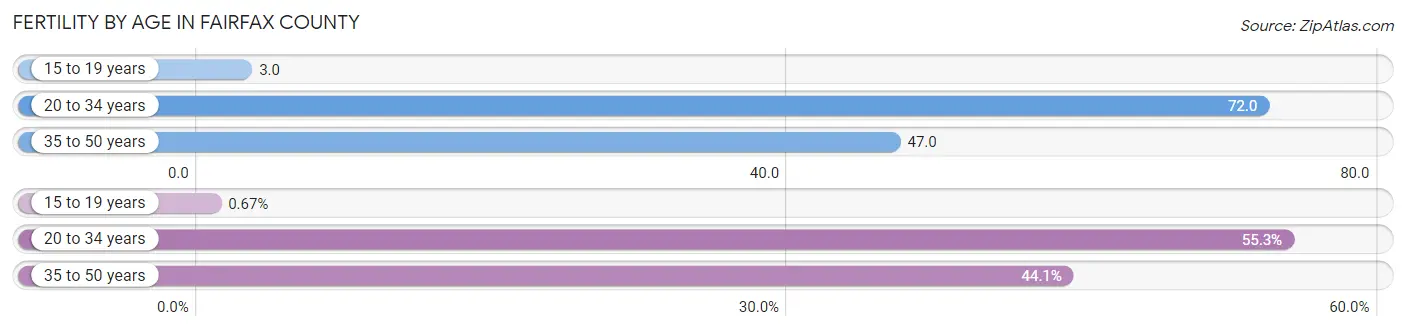
| Age Bracket | Women with Births | Births / 1,000 Women |
| 15 to 19 years | 93 (0.7%) | 3.0 |
| 20 to 34 years | 7,679 (55.3%) | 72.0 |
| 35 to 50 years | 6,122 (44.1%) | 47.0 |
| Total | 13,894 (100.0%) | 51.0 |
Fertility by Age by Marriage Status in Fairfax County
86.2% of women with births (13,894) in Fairfax County are married. The highest percentage of unmarried women with births falls into 15 to 19 years age bracket with 100.0% of them unmarried at the time of birth, while the lowest percentage of unmarried women with births belong to 35 to 50 years age bracket with 11.1% of them unmarried.
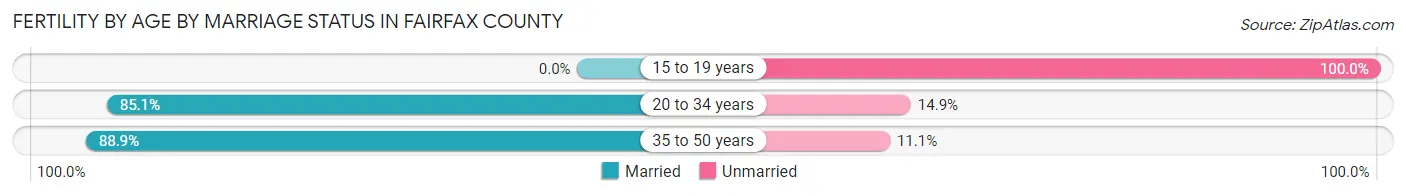
| Age Bracket | Married | Unmarried |
| 15 to 19 years | 0 (0.0%) | 93 (100.0%) |
| 20 to 34 years | 6,535 (85.1%) | 1,144 (14.9%) |
| 35 to 50 years | 5,442 (88.9%) | 680 (11.1%) |
| Total | 11,977 (86.2%) | 1,917 (13.8%) |
Fertility by Education in Fairfax County
Average fertility rate in Fairfax County is 51.0 births per 1,000 women. Women with the education attainment of graduate degree have the highest fertility rate of 66.0 births per 1,000 women, while women with the education attainment of less than high school have the lowest fertility at 32.0 births per 1,000 women. Women with the education attainment of graduate degree represent 34.1% of all women with births.
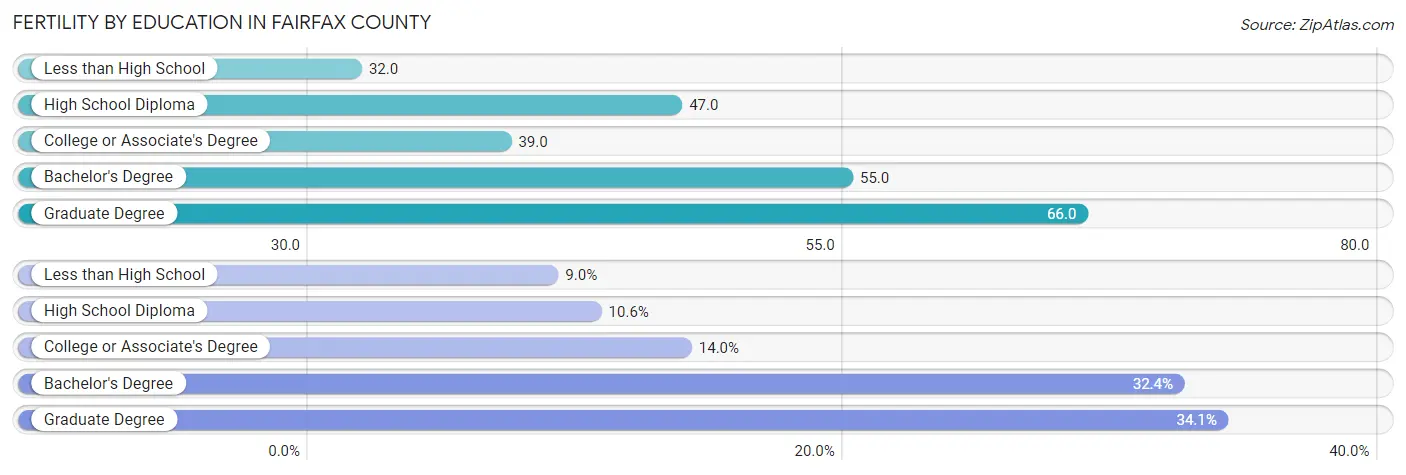
| Educational Attainment | Women with Births | Births / 1,000 Women |
| Less than High School | 1,245 (9.0%) | 32.0 |
| High School Diploma | 1,470 (10.6%) | 47.0 |
| College or Associate's Degree | 1,940 (14.0%) | 39.0 |
| Bachelor's Degree | 4,506 (32.4%) | 55.0 |
| Graduate Degree | 4,733 (34.1%) | 66.0 |
| Total | 13,894 (100.0%) | 51.0 |
Fertility by Education by Marriage Status in Fairfax County
13.8% of women with births in Fairfax County are unmarried. Women with the educational attainment of graduate degree are most likely to be married with 96.5% of them married at childbirth, while women with the educational attainment of less than high school are least likely to be married with 46.1% of them unmarried at childbirth.
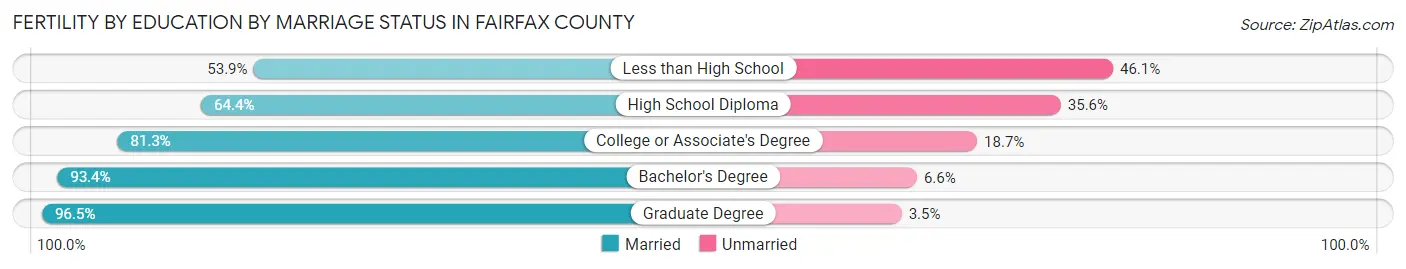
| Educational Attainment | Married | Unmarried |
| Less than High School | 671 (53.9%) | 574 (46.1%) |
| High School Diploma | 947 (64.4%) | 523 (35.6%) |
| College or Associate's Degree | 1,577 (81.3%) | 363 (18.7%) |
| Bachelor's Degree | 4,209 (93.4%) | 297 (6.6%) |
| Graduate Degree | 4,567 (96.5%) | 166 (3.5%) |
| Total | 11,977 (86.2%) | 1,917 (13.8%) |
Employment Characteristics in Fairfax County
Employment by Class of Employer in Fairfax County
Among the 611,718 employed individuals in Fairfax County, private company employees (356,779 | 58.3%), federal government employees (92,690 | 15.1%), and not-for-profit organizations (55,799 | 9.1%) make up the most common classes of employment.
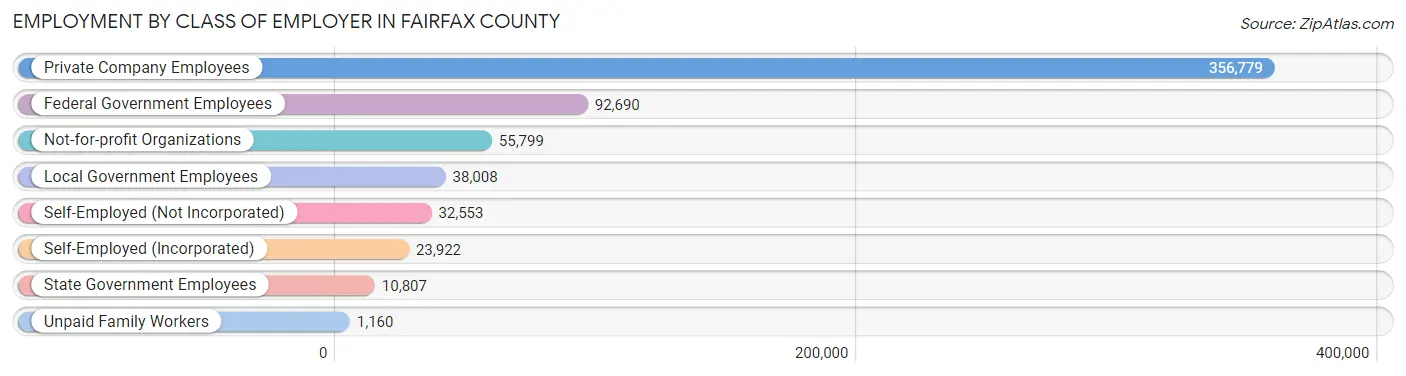
| Employer Class | # Employees | % Employees |
| Private Company Employees | 356,779 | 58.3% |
| Self-Employed (Incorporated) | 23,922 | 3.9% |
| Self-Employed (Not Incorporated) | 32,553 | 5.3% |
| Not-for-profit Organizations | 55,799 | 9.1% |
| Local Government Employees | 38,008 | 6.2% |
| State Government Employees | 10,807 | 1.8% |
| Federal Government Employees | 92,690 | 15.1% |
| Unpaid Family Workers | 1,160 | 0.2% |
| Total | 611,718 | 100.0% |
Employment Status by Age in Fairfax County
According to the labor force statistics for Fairfax County, out of the total population over 16 years of age (910,386), 71.2% or 648,195 individuals are in the labor force, with 4.1% or 26,576 of them unemployed. The age group with the highest labor force participation rate is 25 to 29 years, with 88.3% or 64,199 individuals in the labor force. Within the labor force, the 16 to 19 years age range has the highest percentage of unemployed individuals, with 16.4% or 3,342 of them being unemployed.
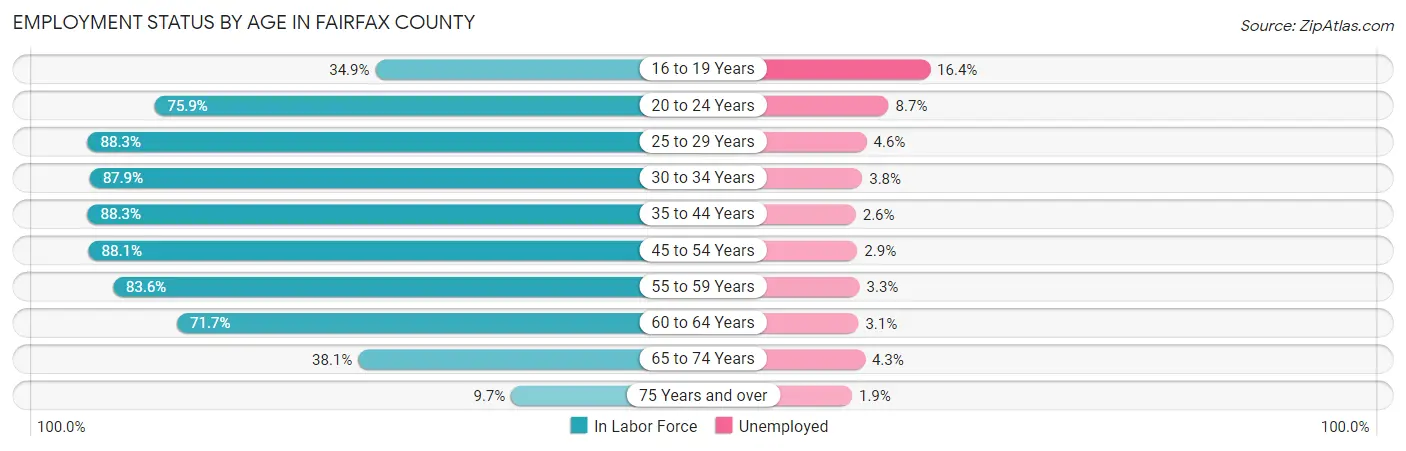
| Age Bracket | In Labor Force | Unemployed |
| 16 to 19 Years | 20,377 (34.9%) | 3,342 (16.4%) |
| 20 to 24 Years | 52,717 (75.9%) | 4,586 (8.7%) |
| 25 to 29 Years | 64,199 (88.3%) | 2,953 (4.6%) |
| 30 to 34 Years | 67,231 (87.9%) | 2,555 (3.8%) |
| 35 to 44 Years | 146,703 (88.3%) | 3,814 (2.6%) |
| 45 to 54 Years | 141,023 (88.1%) | 4,090 (2.9%) |
| 55 to 59 Years | 63,488 (83.6%) | 2,095 (3.3%) |
| 60 to 64 Years | 49,444 (71.7%) | 1,533 (3.1%) |
| 65 to 74 Years | 36,935 (38.1%) | 1,588 (4.3%) |
| 75 Years and over | 6,333 (9.7%) | 120 (1.9%) |
| Total | 648,195 (71.2%) | 26,576 (4.1%) |
Employment Status by Educational Attainment in Fairfax County
According to labor force statistics for Fairfax County, 85.8% of individuals (532,225) out of the total population between 25 and 64 years of age (620,309) are in the labor force, with 3.2% or 17,031 of them being unemployed. The group with the highest labor force participation rate are those with the educational attainment of bachelor's degree or higher, with 88.7% or 362,697 individuals in the labor force. Within the labor force, individuals with high school diploma education have the highest percentage of unemployment, with 5.4% or 2,961 of them being unemployed.
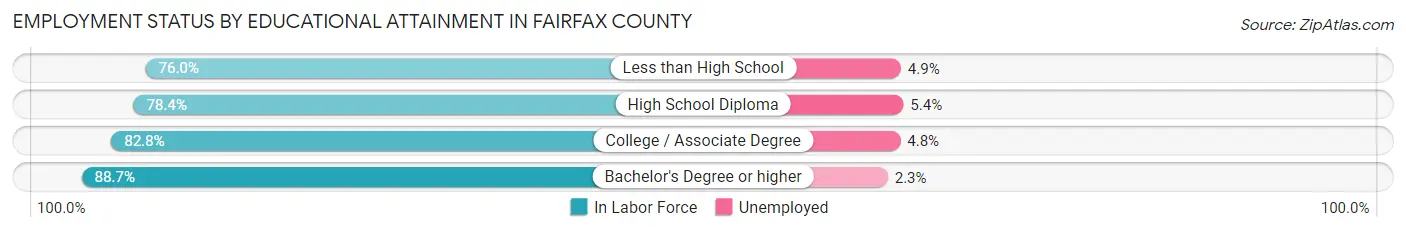
| Educational Attainment | In Labor Force | Unemployed |
| Less than High School | 29,711 (76.0%) | 1,916 (4.9%) |
| High School Diploma | 54,836 (78.4%) | 3,777 (5.4%) |
| College / Associate Degree | 84,761 (82.8%) | 4,914 (4.8%) |
| Bachelor's Degree or higher | 362,697 (88.7%) | 9,405 (2.3%) |
| Total | 532,225 (85.8%) | 19,850 (3.2%) |
Employment Occupations by Sex in Fairfax County
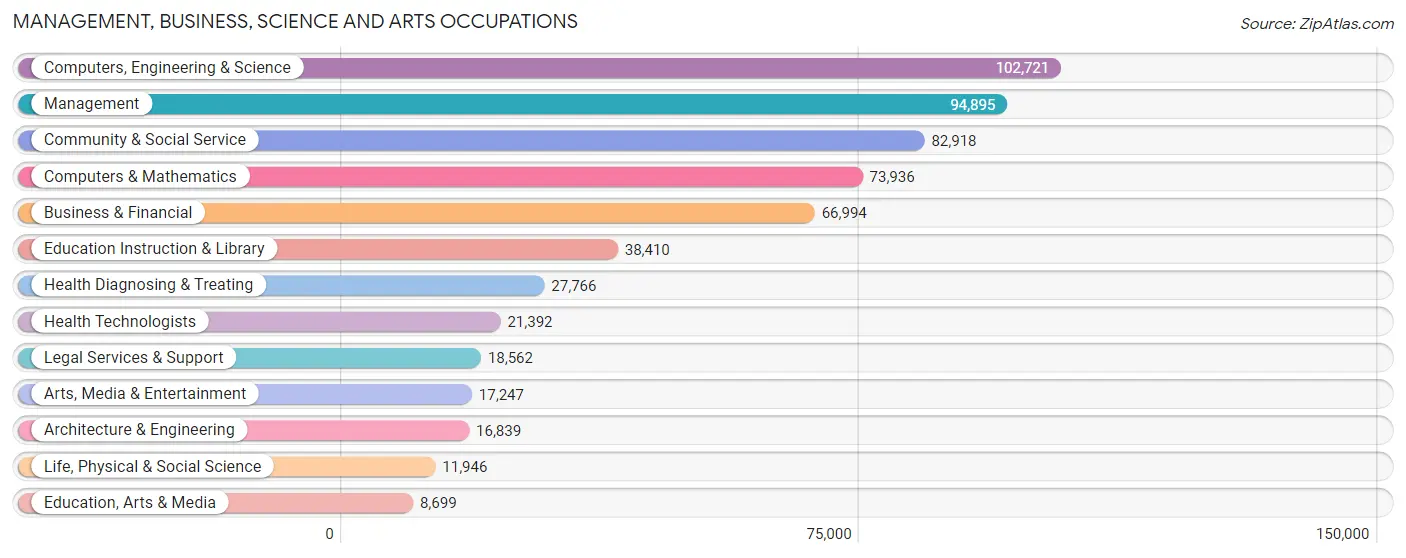
Management, Business, Science and Arts Occupations
The most common Management, Business, Science and Arts occupations in Fairfax County are Computers, Engineering & Science (102,721 | 16.8%), Management (94,895 | 15.5%), Community & Social Service (82,918 | 13.6%), Computers & Mathematics (73,936 | 12.1%), and Business & Financial (66,994 | 11.0%).
Management, Business, Science and Arts Occupations by Sex
Within the Management, Business, Science and Arts occupations in Fairfax County, the most male-oriented occupations are Architecture & Engineering (77.6%), Computers & Mathematics (72.1%), and Computers, Engineering & Science (70.7%), while the most female-oriented occupations are Education Instruction & Library (74.1%), Health Technologists (73.1%), and Health Diagnosing & Treating (72.7%).
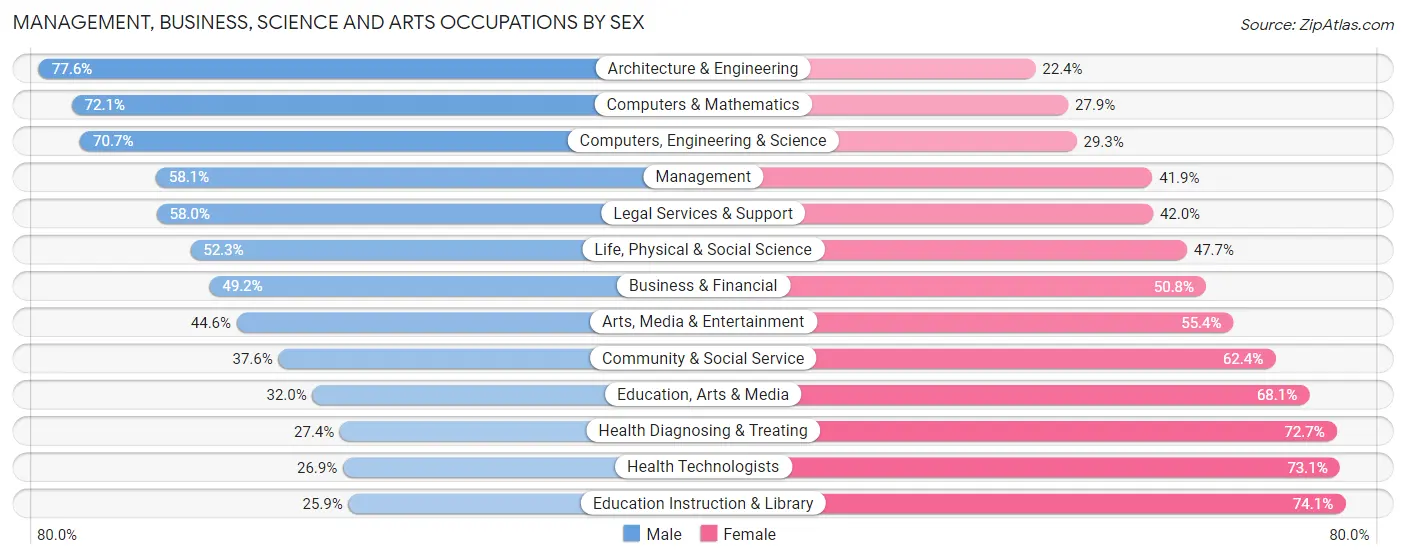
| Occupation | Male | Female |
| Management | 55,128 (58.1%) | 39,767 (41.9%) |
| Business & Financial | 32,937 (49.2%) | 34,057 (50.8%) |
| Computers, Engineering & Science | 72,657 (70.7%) | 30,064 (29.3%) |
| Computers & Mathematics | 53,337 (72.1%) | 20,599 (27.9%) |
| Architecture & Engineering | 13,068 (77.6%) | 3,771 (22.4%) |
| Life, Physical & Social Science | 6,252 (52.3%) | 5,694 (47.7%) |
| Community & Social Service | 31,192 (37.6%) | 51,726 (62.4%) |
| Education, Arts & Media | 2,779 (32.0%) | 5,920 (68.0%) |
| Legal Services & Support | 10,762 (58.0%) | 7,800 (42.0%) |
| Education Instruction & Library | 9,962 (25.9%) | 28,448 (74.1%) |
| Arts, Media & Entertainment | 7,689 (44.6%) | 9,558 (55.4%) |
| Health Diagnosing & Treating | 7,593 (27.4%) | 20,173 (72.7%) |
| Health Technologists | 5,745 (26.9%) | 15,647 (73.1%) |
| Total (Category) | 199,507 (53.2%) | 175,787 (46.8%) |
| Total (Overall) | 326,303 (53.5%) | 283,962 (46.5%) |
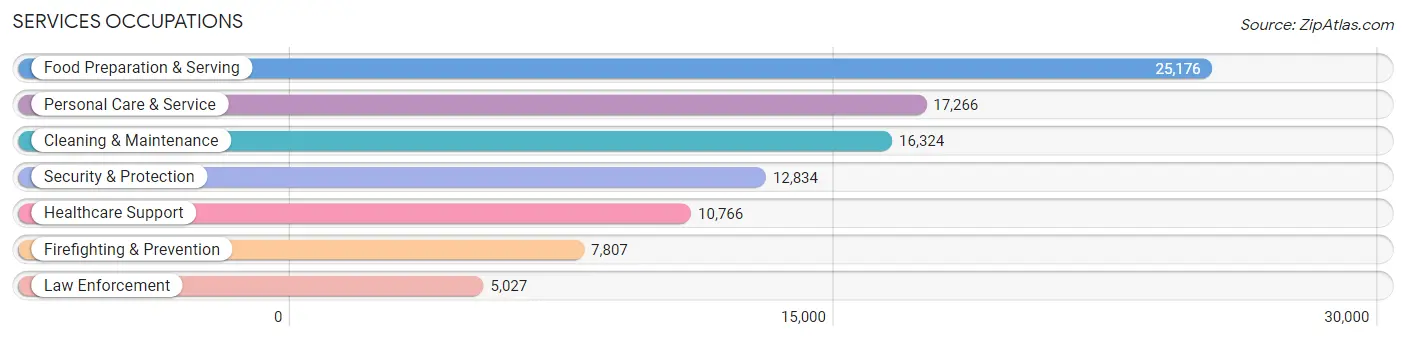
Services Occupations
The most common Services occupations in Fairfax County are Food Preparation & Serving (25,176 | 4.1%), Personal Care & Service (17,266 | 2.8%), Cleaning & Maintenance (16,324 | 2.7%), Security & Protection (12,834 | 2.1%), and Healthcare Support (10,766 | 1.8%).
Services Occupations by Sex
Within the Services occupations in Fairfax County, the most male-oriented occupations are Law Enforcement (81.5%), Security & Protection (76.6%), and Firefighting & Prevention (73.5%), while the most female-oriented occupations are Healthcare Support (78.9%), Personal Care & Service (78.9%), and Cleaning & Maintenance (52.8%).
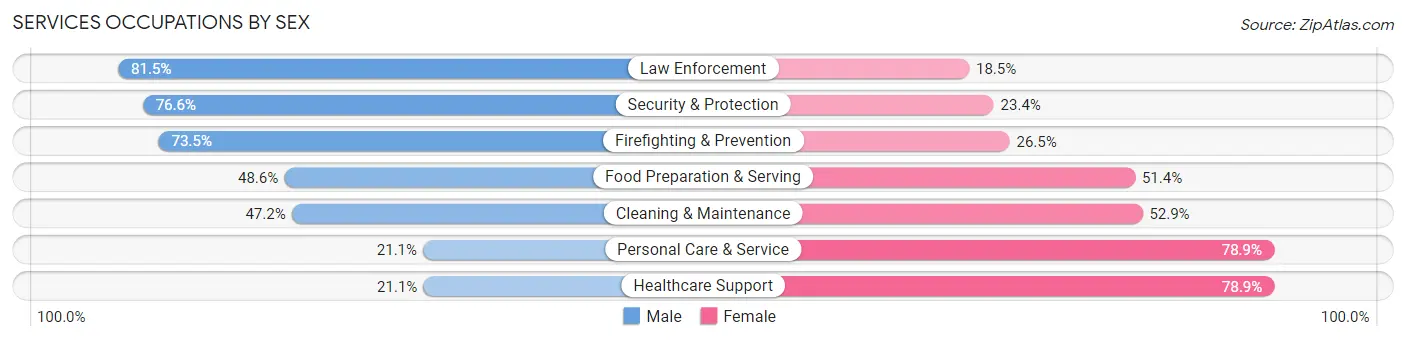
| Occupation | Male | Female |
| Healthcare Support | 2,269 (21.1%) | 8,497 (78.9%) |
| Security & Protection | 9,832 (76.6%) | 3,002 (23.4%) |
| Firefighting & Prevention | 5,736 (73.5%) | 2,071 (26.5%) |
| Law Enforcement | 4,096 (81.5%) | 931 (18.5%) |
| Food Preparation & Serving | 12,244 (48.6%) | 12,932 (51.4%) |
| Cleaning & Maintenance | 7,697 (47.1%) | 8,627 (52.8%) |
| Personal Care & Service | 3,650 (21.1%) | 13,616 (78.9%) |
| Total (Category) | 35,692 (43.3%) | 46,674 (56.7%) |
| Total (Overall) | 326,303 (53.5%) | 283,962 (46.5%) |
Sales and Office Occupations
The most common Sales and Office occupations in Fairfax County are Office & Administration (47,234 | 7.7%), and Sales & Related (45,184 | 7.4%).

Sales and Office Occupations by Sex
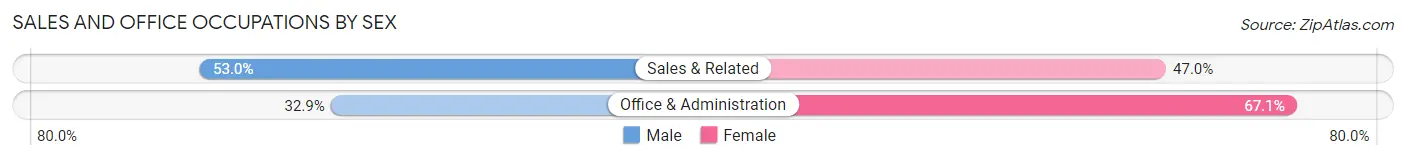
| Occupation | Male | Female |
| Sales & Related | 23,944 (53.0%) | 21,240 (47.0%) |
| Office & Administration | 15,553 (32.9%) | 31,681 (67.1%) |
| Total (Category) | 39,497 (42.7%) | 52,921 (57.3%) |
| Total (Overall) | 326,303 (53.5%) | 283,962 (46.5%) |
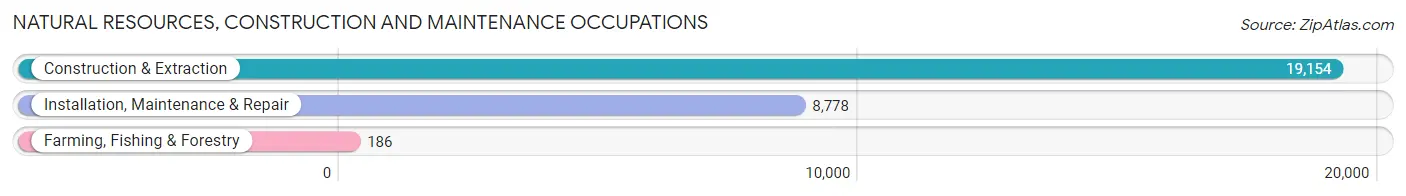
Natural Resources, Construction and Maintenance Occupations
The most common Natural Resources, Construction and Maintenance occupations in Fairfax County are Construction & Extraction (19,154 | 3.1%), Installation, Maintenance & Repair (8,778 | 1.4%), and Farming, Fishing & Forestry (186 | 0.0%).
Natural Resources, Construction and Maintenance Occupations by Sex
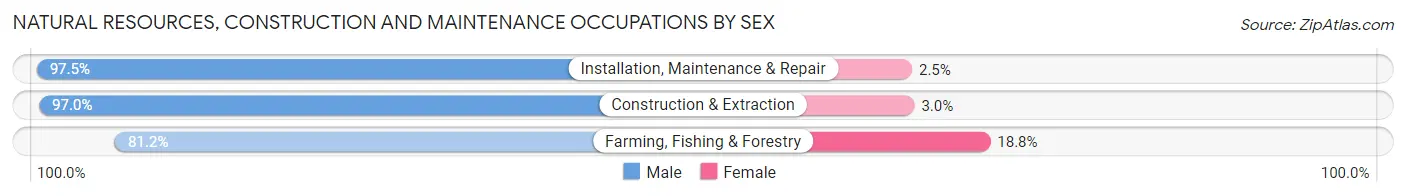
| Occupation | Male | Female |
| Farming, Fishing & Forestry | 151 (81.2%) | 35 (18.8%) |
| Construction & Extraction | 18,573 (97.0%) | 581 (3.0%) |
| Installation, Maintenance & Repair | 8,557 (97.5%) | 221 (2.5%) |
| Total (Category) | 27,281 (97.0%) | 837 (3.0%) |
| Total (Overall) | 326,303 (53.5%) | 283,962 (46.5%) |
Production, Transportation and Moving Occupations
The most common Production, Transportation and Moving occupations in Fairfax County are Transportation (14,485 | 2.4%), Production (9,210 | 1.5%), and Material Moving (8,374 | 1.4%).
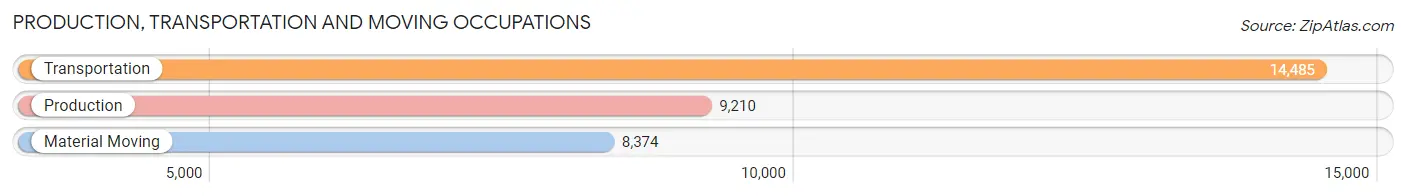
Production, Transportation and Moving Occupations by Sex
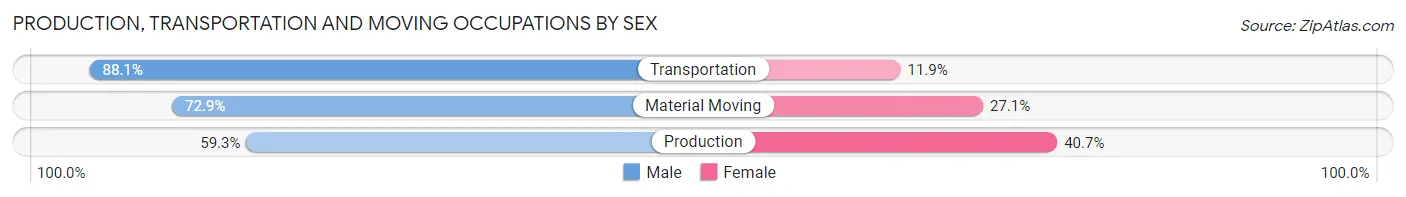
| Occupation | Male | Female |
| Production | 5,463 (59.3%) | 3,747 (40.7%) |
| Transportation | 12,756 (88.1%) | 1,729 (11.9%) |
| Material Moving | 6,107 (72.9%) | 2,267 (27.1%) |
| Total (Category) | 24,326 (75.9%) | 7,743 (24.1%) |
| Total (Overall) | 326,303 (53.5%) | 283,962 (46.5%) |
Employment Industries by Sex in Fairfax County
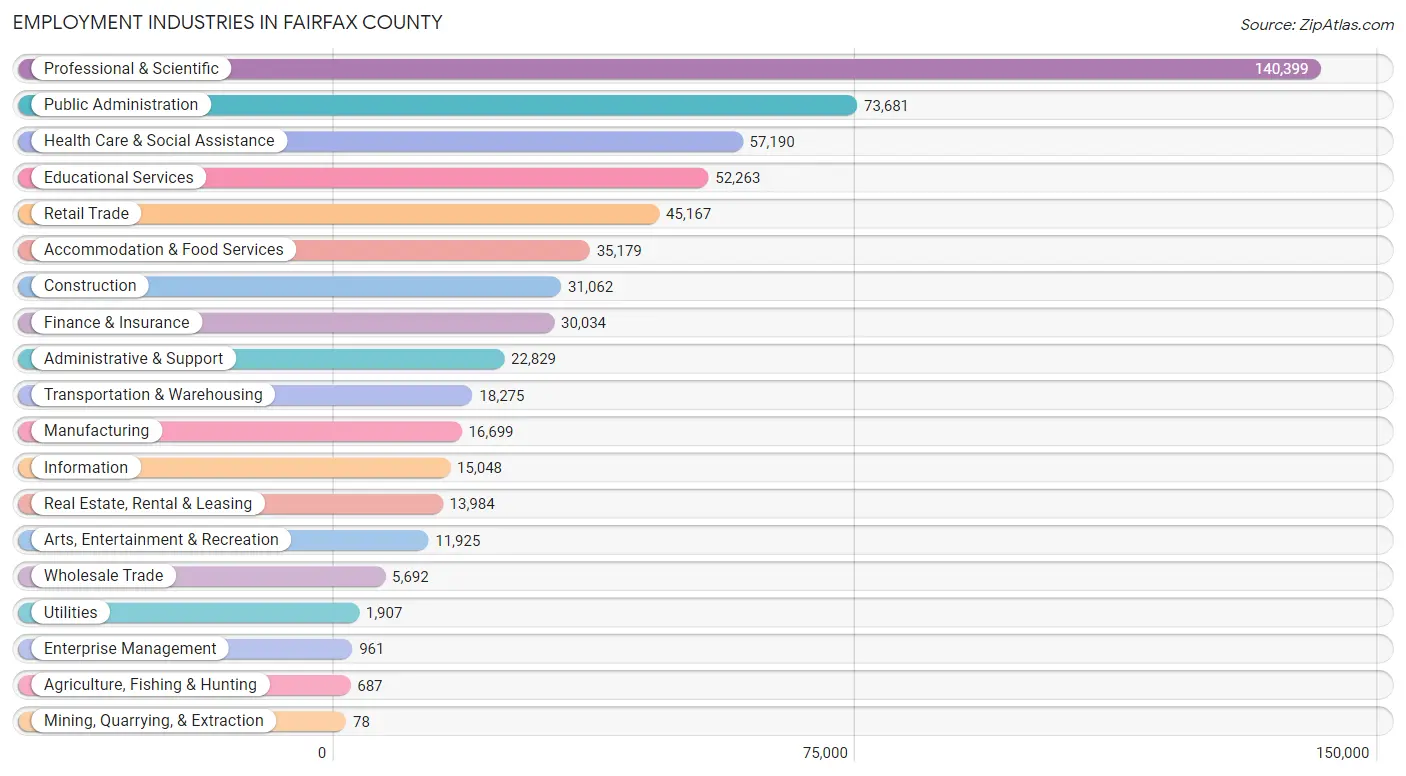
Employment Industries in Fairfax County
The major employment industries in Fairfax County include Professional & Scientific (140,399 | 23.0%), Public Administration (73,681 | 12.1%), Health Care & Social Assistance (57,190 | 9.4%), Educational Services (52,263 | 8.6%), and Retail Trade (45,167 | 7.4%).
Employment Industries by Sex in Fairfax County
The Fairfax County industries that see more men than women are Mining, Quarrying, & Extraction (92.3%), Construction (87.2%), and Transportation & Warehousing (80.4%), whereas the industries that tend to have a higher number of women are Health Care & Social Assistance (75.2%), Educational Services (70.1%), and Enterprise Management (59.9%).
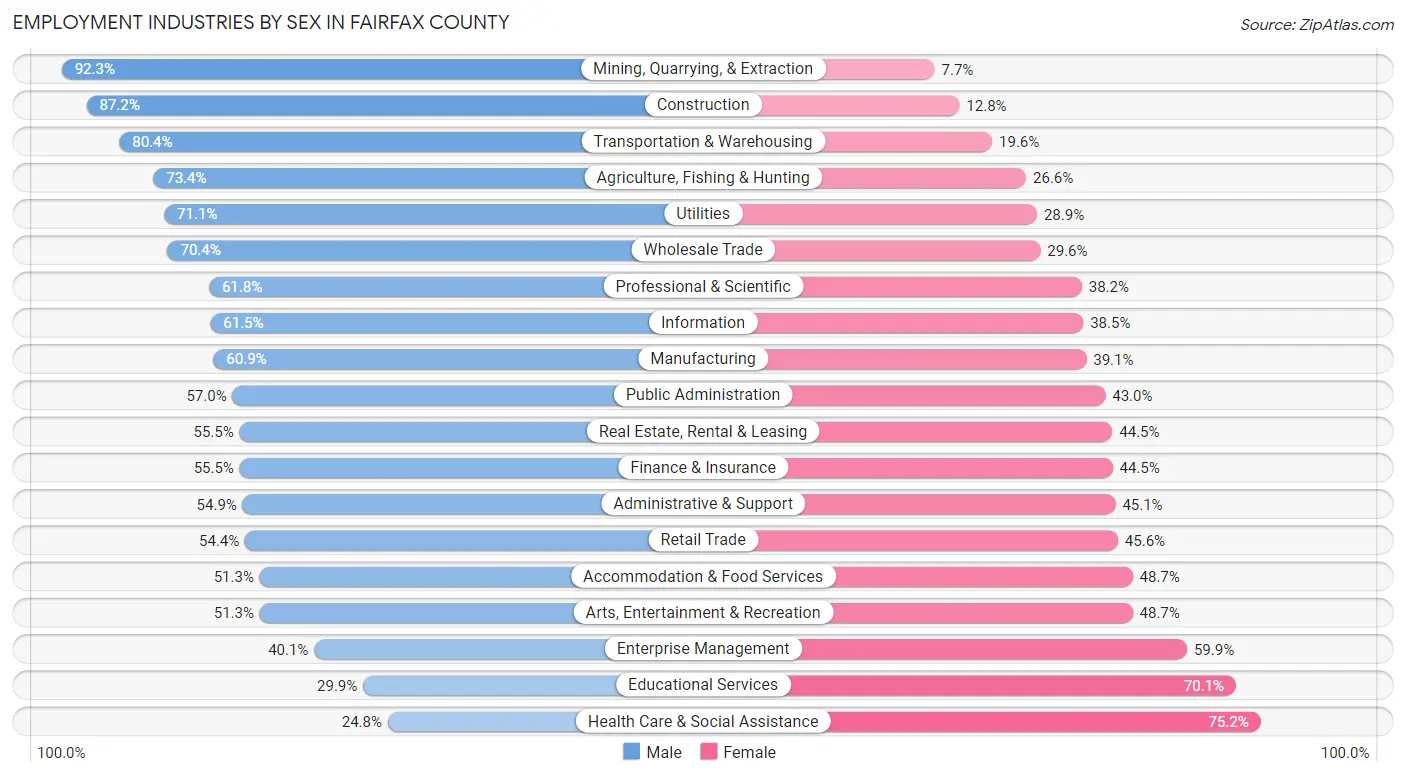
| Industry | Male | Female |
| Agriculture, Fishing & Hunting | 504 (73.4%) | 183 (26.6%) |
| Mining, Quarrying, & Extraction | 72 (92.3%) | 6 (7.7%) |
| Construction | 27,077 (87.2%) | 3,985 (12.8%) |
| Manufacturing | 10,171 (60.9%) | 6,528 (39.1%) |
| Wholesale Trade | 4,008 (70.4%) | 1,684 (29.6%) |
| Retail Trade | 24,553 (54.4%) | 20,614 (45.6%) |
| Transportation & Warehousing | 14,694 (80.4%) | 3,581 (19.6%) |
| Utilities | 1,356 (71.1%) | 551 (28.9%) |
| Information | 9,260 (61.5%) | 5,788 (38.5%) |
| Finance & Insurance | 16,663 (55.5%) | 13,371 (44.5%) |
| Real Estate, Rental & Leasing | 7,762 (55.5%) | 6,222 (44.5%) |
| Professional & Scientific | 86,809 (61.8%) | 53,590 (38.2%) |
| Enterprise Management | 385 (40.1%) | 576 (59.9%) |
| Administrative & Support | 12,527 (54.9%) | 10,302 (45.1%) |
| Educational Services | 15,650 (29.9%) | 36,613 (70.1%) |
| Health Care & Social Assistance | 14,198 (24.8%) | 42,992 (75.2%) |
| Arts, Entertainment & Recreation | 6,120 (51.3%) | 5,805 (48.7%) |
| Accommodation & Food Services | 18,056 (51.3%) | 17,123 (48.7%) |
| Public Administration | 41,973 (57.0%) | 31,708 (43.0%) |
| Total | 326,303 (53.5%) | 283,962 (46.5%) |
Education in Fairfax County
School Enrollment in Fairfax County
The most common levels of schooling among the 300,347 students in Fairfax County are high school (65,754 | 21.9%), middle school (59,949 | 20.0%), and college / undergraduate (59,662 | 19.9%).
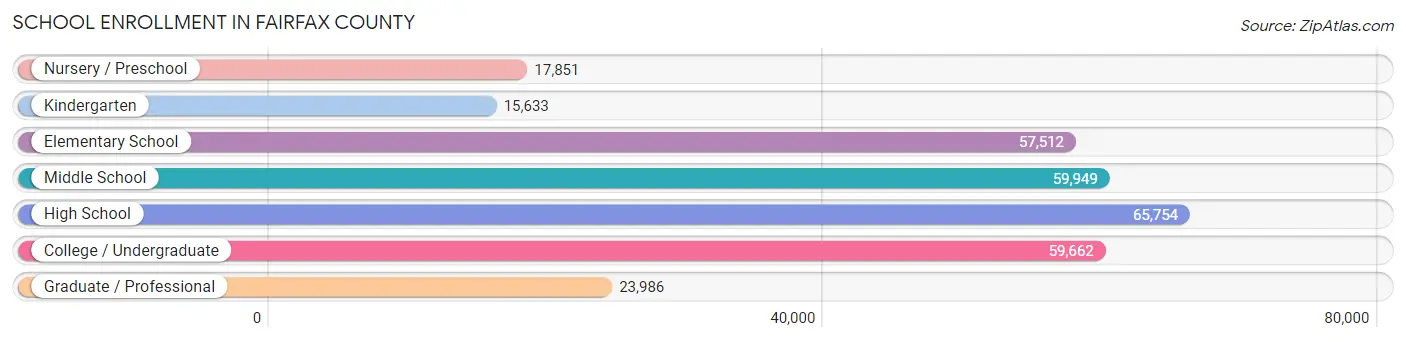
| School Level | # Students | % Students |
| Nursery / Preschool | 17,851 | 5.9% |
| Kindergarten | 15,633 | 5.2% |
| Elementary School | 57,512 | 19.2% |
| Middle School | 59,949 | 20.0% |
| High School | 65,754 | 21.9% |
| College / Undergraduate | 59,662 | 19.9% |
| Graduate / Professional | 23,986 | 8.0% |
| Total | 300,347 | 100.0% |
School Enrollment by Age by Funding Source in Fairfax County
Out of a total of 300,347 students who are enrolled in schools in Fairfax County, 57,066 (19.0%) attend a private institution, while the remaining 243,281 (81.0%) are enrolled in public schools. The age group of 3 to 4 year olds has the highest likelihood of being enrolled in private schools, with 10,514 (70.2% in the age bracket) enrolled. Conversely, the age group of 10 to 14 year olds has the lowest likelihood of being enrolled in a private school, with 67,156 (89.4% in the age bracket) attending a public institution.
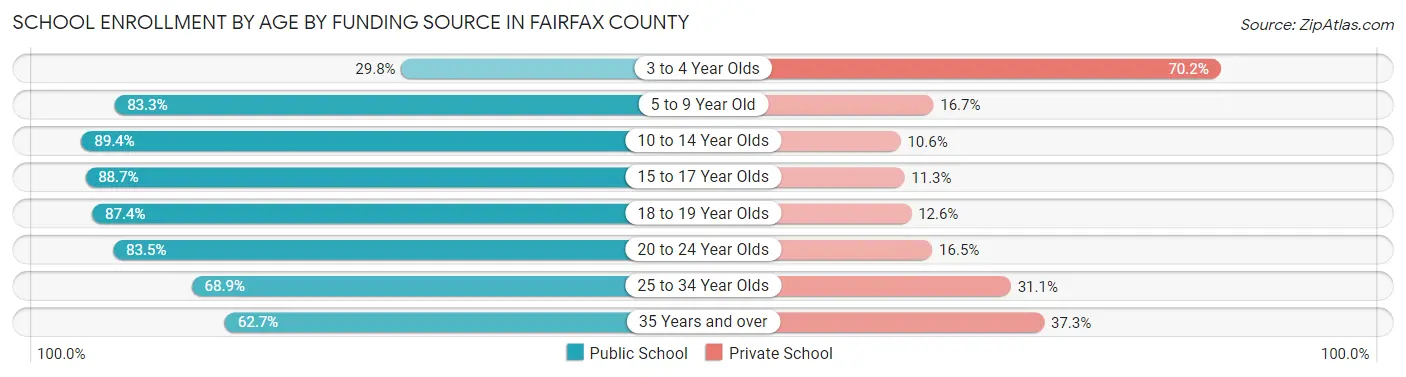
| Age Bracket | Public School | Private School |
| 3 to 4 Year Olds | 4,467 (29.8%) | 10,514 (70.2%) |
| 5 to 9 Year Old | 57,278 (83.3%) | 11,486 (16.7%) |
| 10 to 14 Year Olds | 67,156 (89.4%) | 7,947 (10.6%) |
| 15 to 17 Year Olds | 40,331 (88.7%) | 5,139 (11.3%) |
| 18 to 19 Year Olds | 20,715 (87.4%) | 2,980 (12.6%) |
| 20 to 24 Year Olds | 27,332 (83.5%) | 5,395 (16.5%) |
| 25 to 34 Year Olds | 13,719 (68.9%) | 6,199 (31.1%) |
| 35 Years and over | 12,342 (62.7%) | 7,347 (37.3%) |
| Total | 243,281 (81.0%) | 57,066 (19.0%) |
Educational Attainment by Field of Study in Fairfax County
Business (98,168 | 17.9%), social sciences (75,396 | 13.8%), engineering (58,854 | 10.8%), computers & mathematics (49,523 | 9.0%), and literature & languages (33,278 | 6.1%) are the most common fields of study among 547,013 individuals in Fairfax County who have obtained a bachelor's degree or higher.
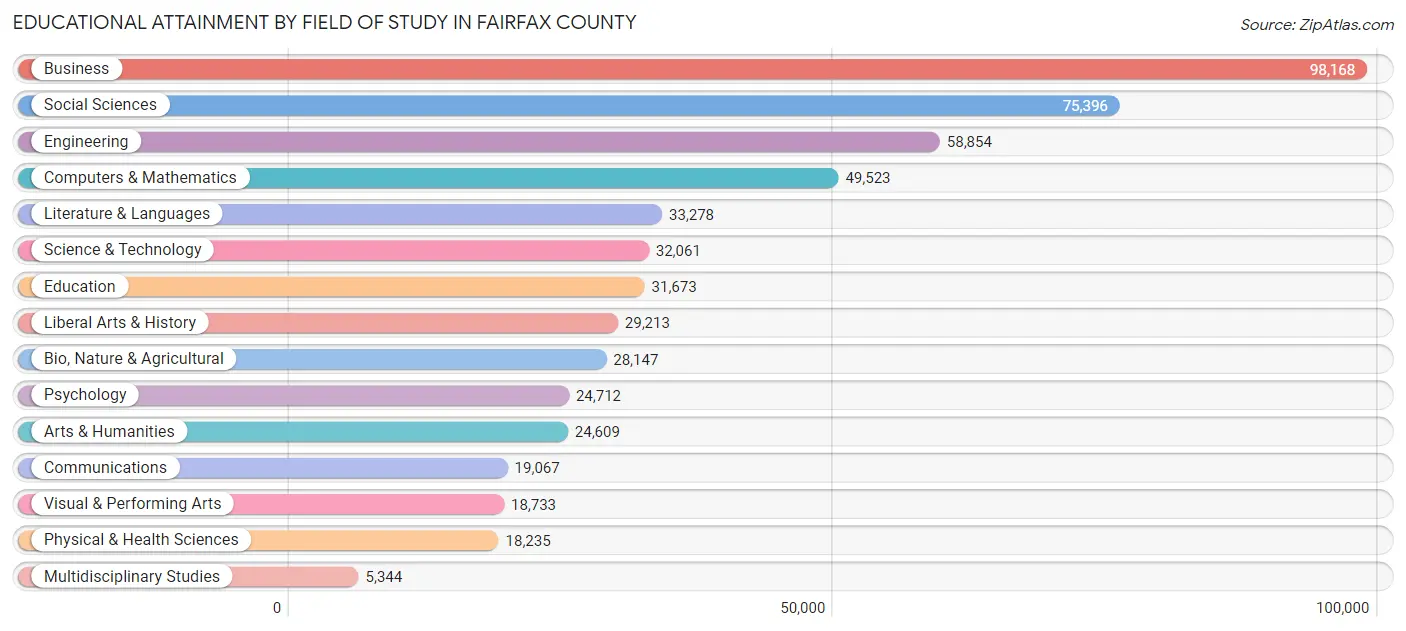
| Field of Study | # Graduates | % Graduates |
| Computers & Mathematics | 49,523 | 9.0% |
| Bio, Nature & Agricultural | 28,147 | 5.1% |
| Physical & Health Sciences | 18,235 | 3.3% |
| Psychology | 24,712 | 4.5% |
| Social Sciences | 75,396 | 13.8% |
| Engineering | 58,854 | 10.8% |
| Multidisciplinary Studies | 5,344 | 1.0% |
| Science & Technology | 32,061 | 5.9% |
| Business | 98,168 | 17.9% |
| Education | 31,673 | 5.8% |
| Literature & Languages | 33,278 | 6.1% |
| Liberal Arts & History | 29,213 | 5.3% |
| Visual & Performing Arts | 18,733 | 3.4% |
| Communications | 19,067 | 3.5% |
| Arts & Humanities | 24,609 | 4.5% |
| Total | 547,013 | 100.0% |
Transportation & Commute in Fairfax County
Vehicle Availability by Sex in Fairfax County
The most prevalent vehicle ownership categories in Fairfax County are males with 2 vehicles (149,044, accounting for 45.1%) and females with 2 vehicles (123,147, making up 53.5%).
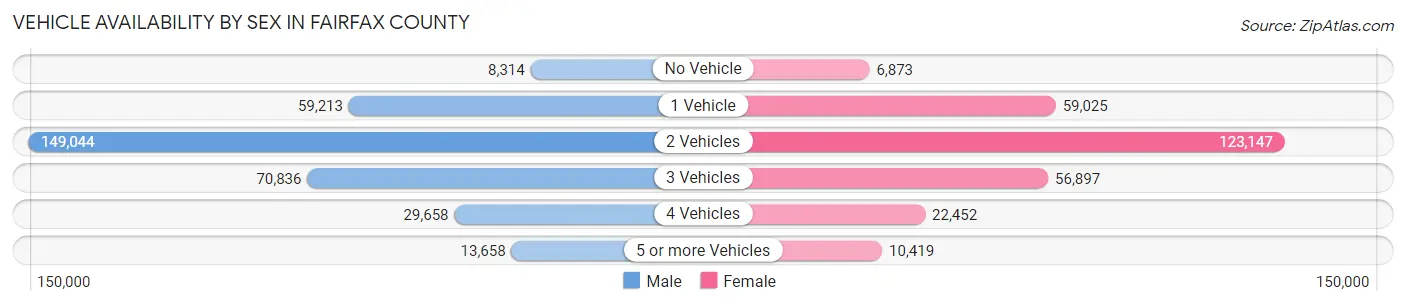
| Vehicles Available | Male | Female |
| No Vehicle | 8,314 (2.5%) | 6,873 (2.5%) |
| 1 Vehicle | 59,213 (17.9%) | 59,025 (21.2%) |
| 2 Vehicles | 149,044 (45.1%) | 123,147 (44.2%) |
| 3 Vehicles | 70,836 (21.4%) | 56,897 (20.4%) |
| 4 Vehicles | 29,658 (9.0%) | 22,452 (8.1%) |
| 5 or more Vehicles | 13,658 (4.1%) | 10,419 (3.7%) |
| Total | 330,723 (100.0%) | 278,813 (100.0%) |
Commute Time in Fairfax County
The most frequently occuring commute durations in Fairfax County are 30 to 34 minutes (81,952 commuters, 17.1%), 20 to 24 minutes (66,587 commuters, 13.9%), and 15 to 19 minutes (60,457 commuters, 12.6%).
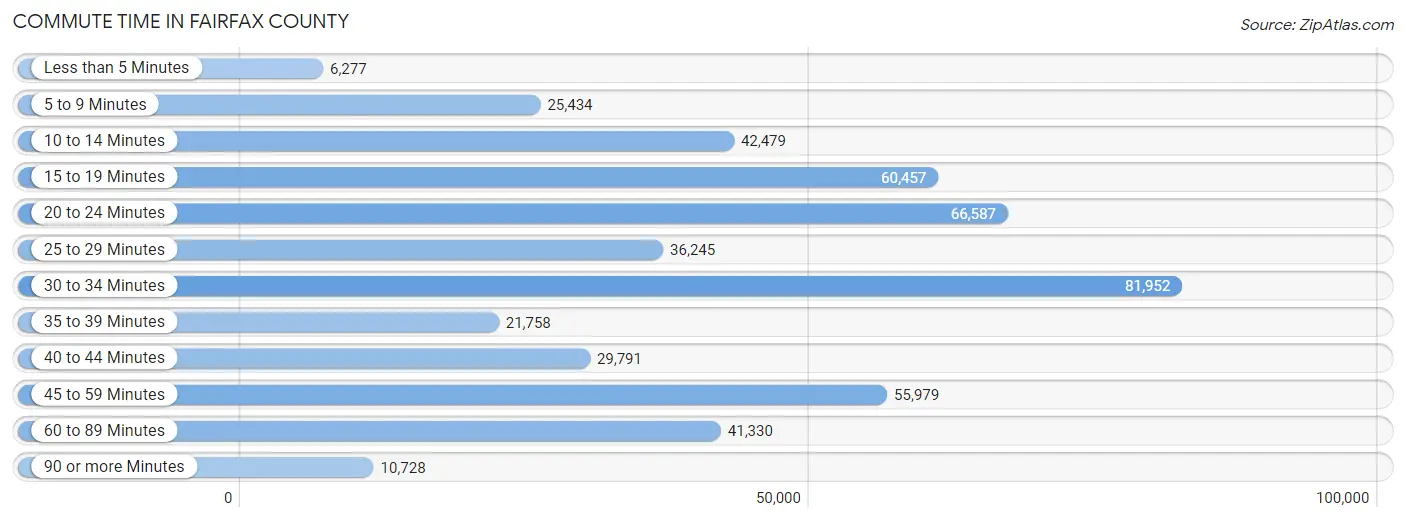
| Commute Time | # Commuters | % Commuters |
| Less than 5 Minutes | 6,277 | 1.3% |
| 5 to 9 Minutes | 25,434 | 5.3% |
| 10 to 14 Minutes | 42,479 | 8.9% |
| 15 to 19 Minutes | 60,457 | 12.6% |
| 20 to 24 Minutes | 66,587 | 13.9% |
| 25 to 29 Minutes | 36,245 | 7.6% |
| 30 to 34 Minutes | 81,952 | 17.1% |
| 35 to 39 Minutes | 21,758 | 4.5% |
| 40 to 44 Minutes | 29,791 | 6.2% |
| 45 to 59 Minutes | 55,979 | 11.7% |
| 60 to 89 Minutes | 41,330 | 8.6% |
| 90 or more Minutes | 10,728 | 2.2% |
Commute Time by Sex in Fairfax County
The most common commute times in Fairfax County are 30 to 34 minutes (45,729 commuters, 17.5%) for males and 30 to 34 minutes (36,223 commuters, 16.7%) for females.
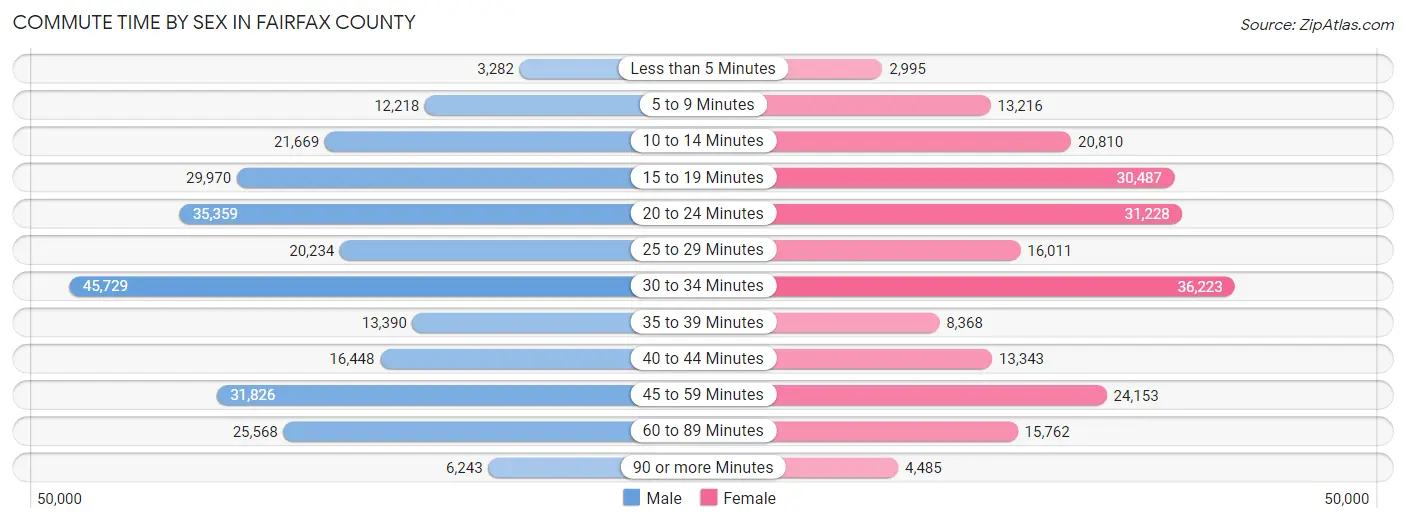
| Commute Time | Male | Female |
| Less than 5 Minutes | 3,282 (1.3%) | 2,995 (1.4%) |
| 5 to 9 Minutes | 12,218 (4.7%) | 13,216 (6.1%) |
| 10 to 14 Minutes | 21,669 (8.3%) | 20,810 (9.6%) |
| 15 to 19 Minutes | 29,970 (11.4%) | 30,487 (14.0%) |
| 20 to 24 Minutes | 35,359 (13.5%) | 31,228 (14.4%) |
| 25 to 29 Minutes | 20,234 (7.7%) | 16,011 (7.4%) |
| 30 to 34 Minutes | 45,729 (17.5%) | 36,223 (16.7%) |
| 35 to 39 Minutes | 13,390 (5.1%) | 8,368 (3.8%) |
| 40 to 44 Minutes | 16,448 (6.3%) | 13,343 (6.1%) |
| 45 to 59 Minutes | 31,826 (12.1%) | 24,153 (11.1%) |
| 60 to 89 Minutes | 25,568 (9.8%) | 15,762 (7.3%) |
| 90 or more Minutes | 6,243 (2.4%) | 4,485 (2.1%) |
Time of Departure to Work by Sex in Fairfax County
The most frequent times of departure to work in Fairfax County are 7:00 AM to 7:29 AM (36,886, 14.1%) for males and 8:00 AM to 8:29 AM (33,798, 15.6%) for females.
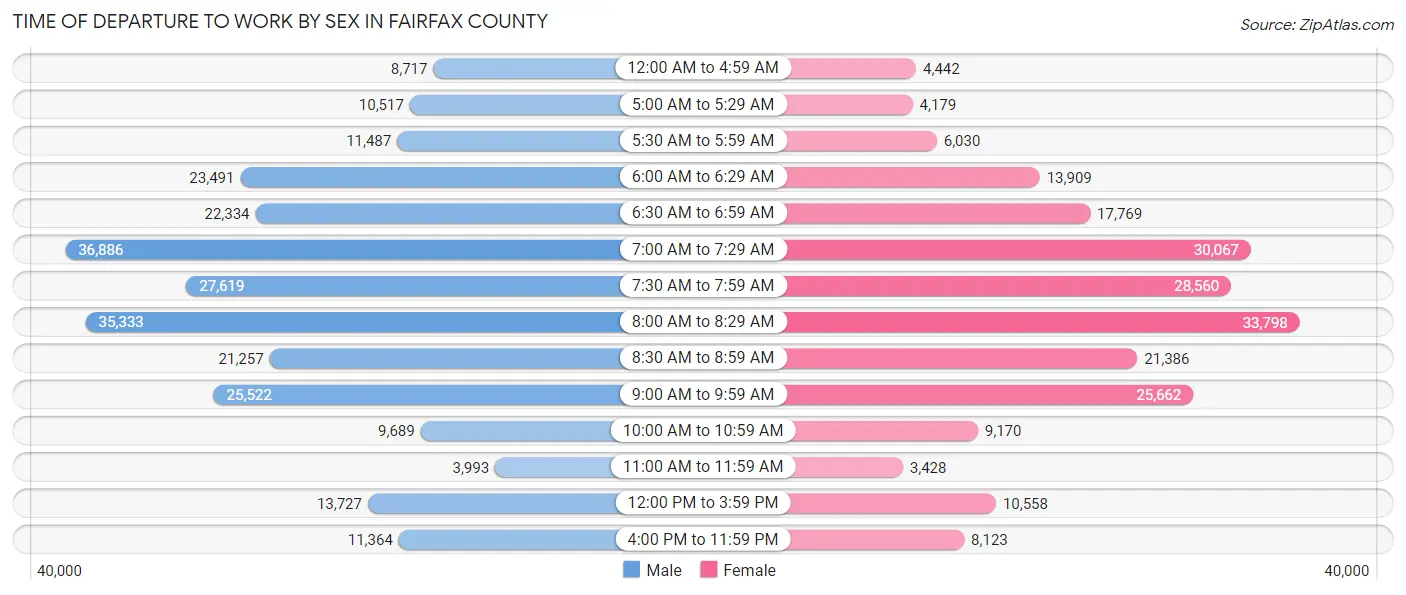
| Time of Departure | Male | Female |
| 12:00 AM to 4:59 AM | 8,717 (3.3%) | 4,442 (2.1%) |
| 5:00 AM to 5:29 AM | 10,517 (4.0%) | 4,179 (1.9%) |
| 5:30 AM to 5:59 AM | 11,487 (4.4%) | 6,030 (2.8%) |
| 6:00 AM to 6:29 AM | 23,491 (9.0%) | 13,909 (6.4%) |
| 6:30 AM to 6:59 AM | 22,334 (8.5%) | 17,769 (8.2%) |
| 7:00 AM to 7:29 AM | 36,886 (14.1%) | 30,067 (13.9%) |
| 7:30 AM to 7:59 AM | 27,619 (10.5%) | 28,560 (13.2%) |
| 8:00 AM to 8:29 AM | 35,333 (13.5%) | 33,798 (15.6%) |
| 8:30 AM to 8:59 AM | 21,257 (8.1%) | 21,386 (9.9%) |
| 9:00 AM to 9:59 AM | 25,522 (9.7%) | 25,662 (11.8%) |
| 10:00 AM to 10:59 AM | 9,689 (3.7%) | 9,170 (4.2%) |
| 11:00 AM to 11:59 AM | 3,993 (1.5%) | 3,428 (1.6%) |
| 12:00 PM to 3:59 PM | 13,727 (5.2%) | 10,558 (4.9%) |
| 4:00 PM to 11:59 PM | 11,364 (4.3%) | 8,123 (3.7%) |
| Total | 261,936 (100.0%) | 217,081 (100.0%) |
Housing Occupancy in Fairfax County
Occupancy by Ownership in Fairfax County
Of the total 410,844 dwellings in Fairfax County, owner-occupied units account for 281,648 (68.5%), while renter-occupied units make up 129,196 (31.5%).
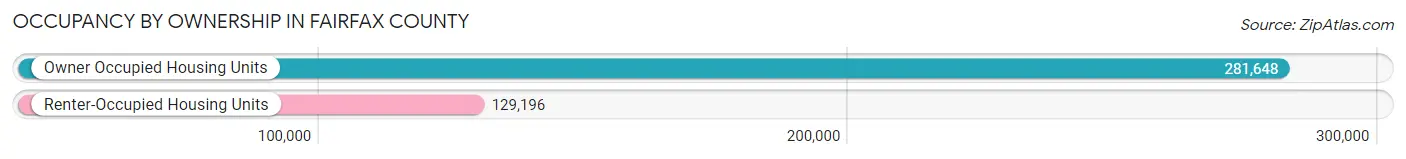
| Occupancy | # Housing Units | % Housing Units |
| Owner Occupied Housing Units | 281,648 | 68.5% |
| Renter-Occupied Housing Units | 129,196 | 31.5% |
| Total Occupied Housing Units | 410,844 | 100.0% |
Occupancy by Household Size in Fairfax County
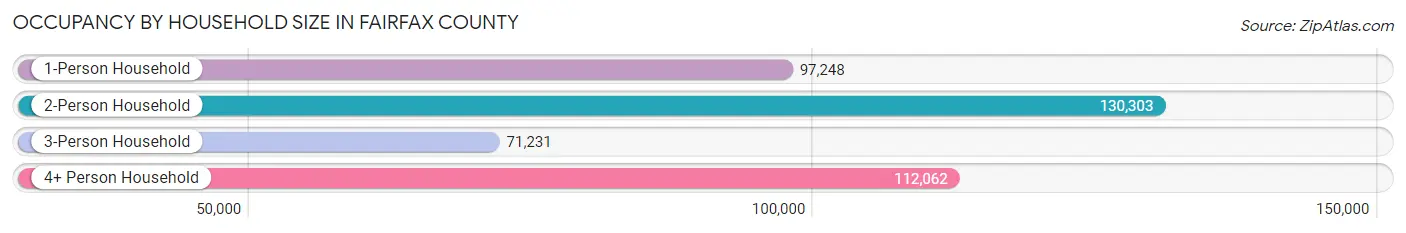
| Household Size | # Housing Units | % Housing Units |
| 1-Person Household | 97,248 | 23.7% |
| 2-Person Household | 130,303 | 31.7% |
| 3-Person Household | 71,231 | 17.3% |
| 4+ Person Household | 112,062 | 27.3% |
| Total Housing Units | 410,844 | 100.0% |
Occupancy by Ownership by Household Size in Fairfax County
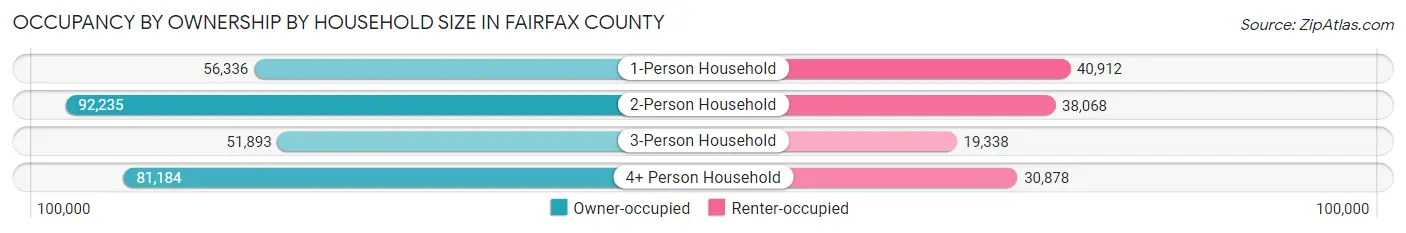
| Household Size | Owner-occupied | Renter-occupied |
| 1-Person Household | 56,336 (57.9%) | 40,912 (42.1%) |
| 2-Person Household | 92,235 (70.8%) | 38,068 (29.2%) |
| 3-Person Household | 51,893 (72.9%) | 19,338 (27.2%) |
| 4+ Person Household | 81,184 (72.5%) | 30,878 (27.6%) |
| Total Housing Units | 281,648 (68.5%) | 129,196 (31.5%) |
Occupancy by Educational Attainment in Fairfax County
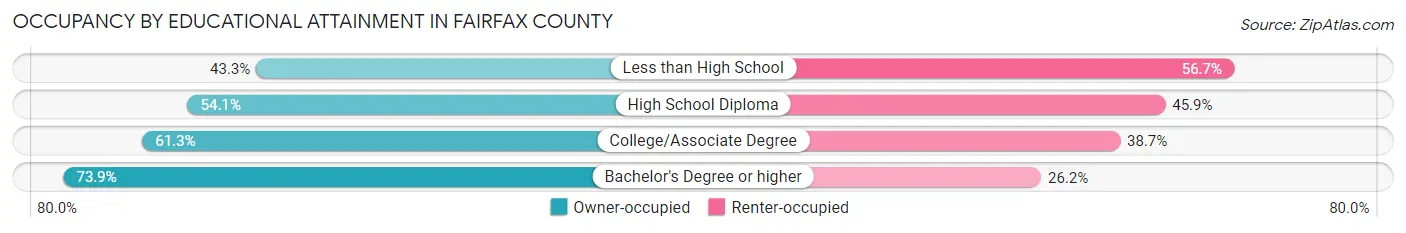
| Household Size | Owner-occupied | Renter-occupied |
| Less than High School | 8,535 (43.3%) | 11,186 (56.7%) |
| High School Diploma | 20,056 (54.1%) | 16,986 (45.9%) |
| College/Associate Degree | 41,210 (61.3%) | 25,997 (38.7%) |
| Bachelor's Degree or higher | 211,847 (73.9%) | 75,027 (26.2%) |
Occupancy by Age of Householder in Fairfax County
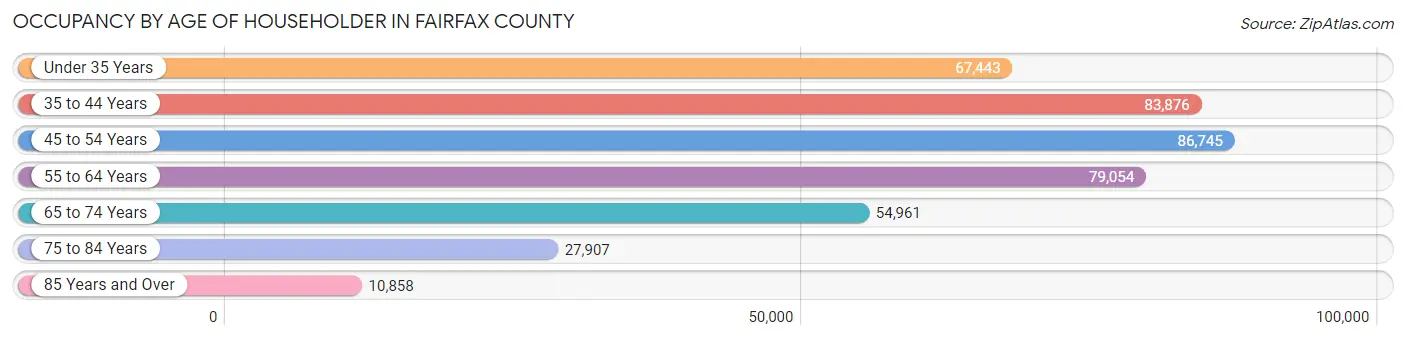
| Age Bracket | # Households | % Households |
| Under 35 Years | 67,443 | 16.4% |
| 35 to 44 Years | 83,876 | 20.4% |
| 45 to 54 Years | 86,745 | 21.1% |
| 55 to 64 Years | 79,054 | 19.2% |
| 65 to 74 Years | 54,961 | 13.4% |
| 75 to 84 Years | 27,907 | 6.8% |
| 85 Years and Over | 10,858 | 2.6% |
| Total | 410,844 | 100.0% |
Housing Finances in Fairfax County
Median Income by Occupancy in Fairfax County
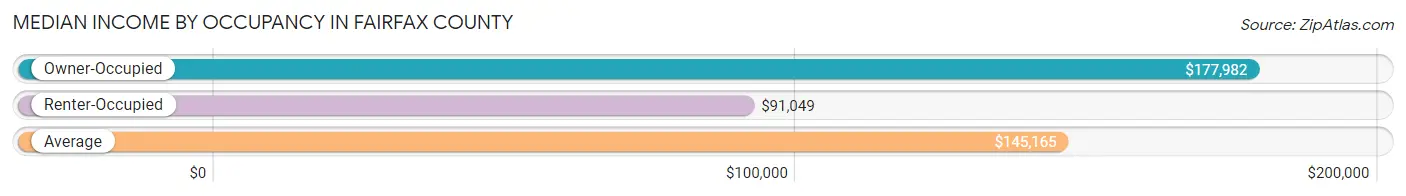
| Occupancy Type | # Households | Median Income |
| Owner-Occupied | 281,648 (68.5%) | $177,982 |
| Renter-Occupied | 129,196 (31.5%) | $91,049 |
| Average | 410,844 (100.0%) | $145,165 |
Occupancy by Householder Income Bracket in Fairfax County
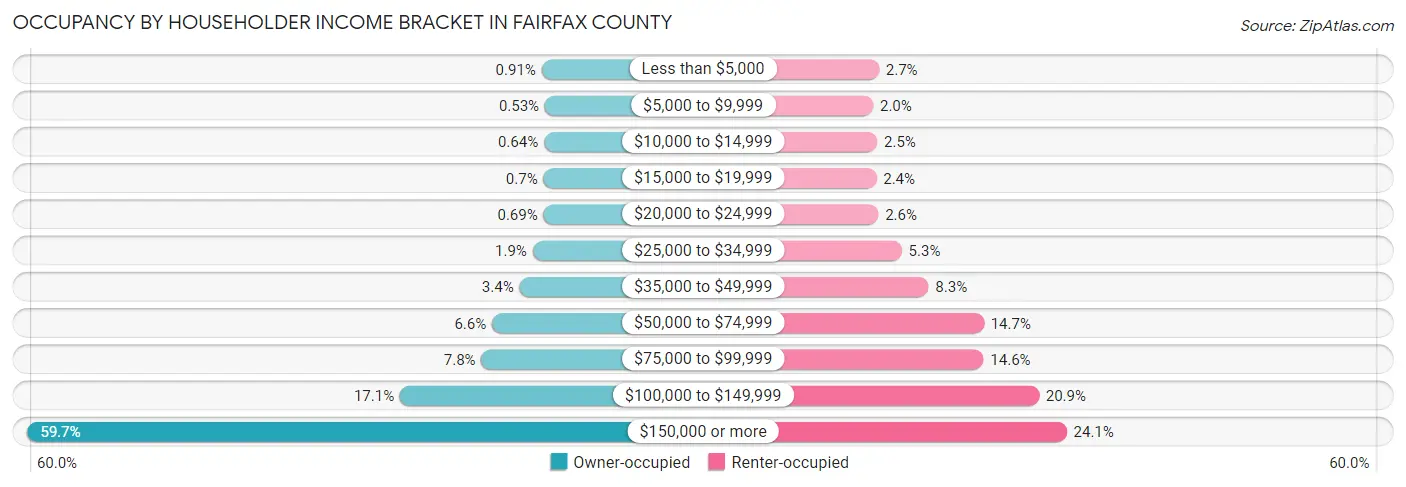
| Income Bracket | Owner-occupied | Renter-occupied |
| Less than $5,000 | 2,571 (0.9%) | 3,438 (2.7%) |
| $5,000 to $9,999 | 1,485 (0.5%) | 2,580 (2.0%) |
| $10,000 to $14,999 | 1,798 (0.6%) | 3,179 (2.5%) |
| $15,000 to $19,999 | 1,971 (0.7%) | 3,067 (2.4%) |
| $20,000 to $24,999 | 1,942 (0.7%) | 3,346 (2.6%) |
| $25,000 to $34,999 | 5,430 (1.9%) | 6,810 (5.3%) |
| $35,000 to $49,999 | 9,694 (3.4%) | 10,760 (8.3%) |
| $50,000 to $74,999 | 18,535 (6.6%) | 18,924 (14.6%) |
| $75,000 to $99,999 | 21,931 (7.8%) | 18,878 (14.6%) |
| $100,000 to $149,999 | 48,170 (17.1%) | 27,057 (20.9%) |
| $150,000 or more | 168,121 (59.7%) | 31,157 (24.1%) |
| Total | 281,648 (100.0%) | 129,196 (100.0%) |
Monthly Housing Cost Tiers in Fairfax County
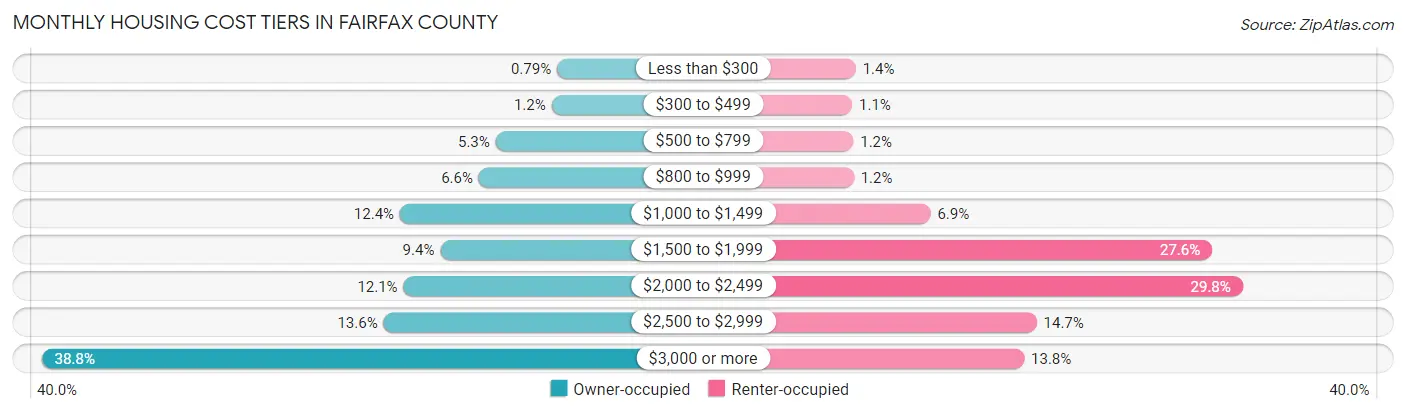
| Monthly Cost | Owner-occupied | Renter-occupied |
| Less than $300 | 2,218 (0.8%) | 1,744 (1.3%) |
| $300 to $499 | 3,348 (1.2%) | 1,390 (1.1%) |
| $500 to $799 | 14,956 (5.3%) | 1,511 (1.2%) |
| $800 to $999 | 18,443 (6.6%) | 1,552 (1.2%) |
| $1,000 to $1,499 | 34,799 (12.4%) | 8,848 (6.9%) |
| $1,500 to $1,999 | 26,457 (9.4%) | 35,649 (27.6%) |
| $2,000 to $2,499 | 34,086 (12.1%) | 38,550 (29.8%) |
| $2,500 to $2,999 | 38,210 (13.6%) | 18,952 (14.7%) |
| $3,000 or more | 109,131 (38.8%) | 17,770 (13.8%) |
| Total | 281,648 (100.0%) | 129,196 (100.0%) |
Physical Housing Characteristics in Fairfax County
Housing Structures in Fairfax County
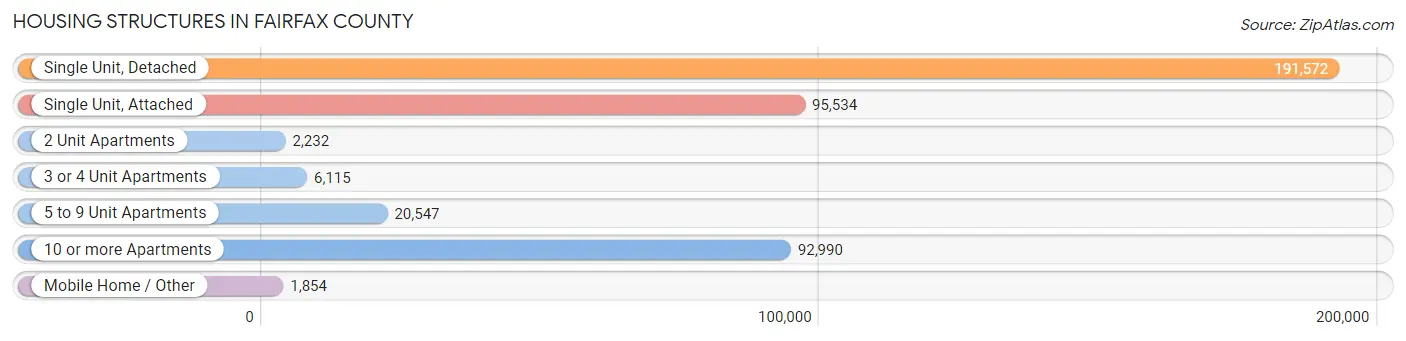
| Structure Type | # Housing Units | % Housing Units |
| Single Unit, Detached | 191,572 | 46.6% |
| Single Unit, Attached | 95,534 | 23.3% |
| 2 Unit Apartments | 2,232 | 0.5% |
| 3 or 4 Unit Apartments | 6,115 | 1.5% |
| 5 to 9 Unit Apartments | 20,547 | 5.0% |
| 10 or more Apartments | 92,990 | 22.6% |
| Mobile Home / Other | 1,854 | 0.4% |
| Total | 410,844 | 100.0% |
Housing Structures by Occupancy in Fairfax County
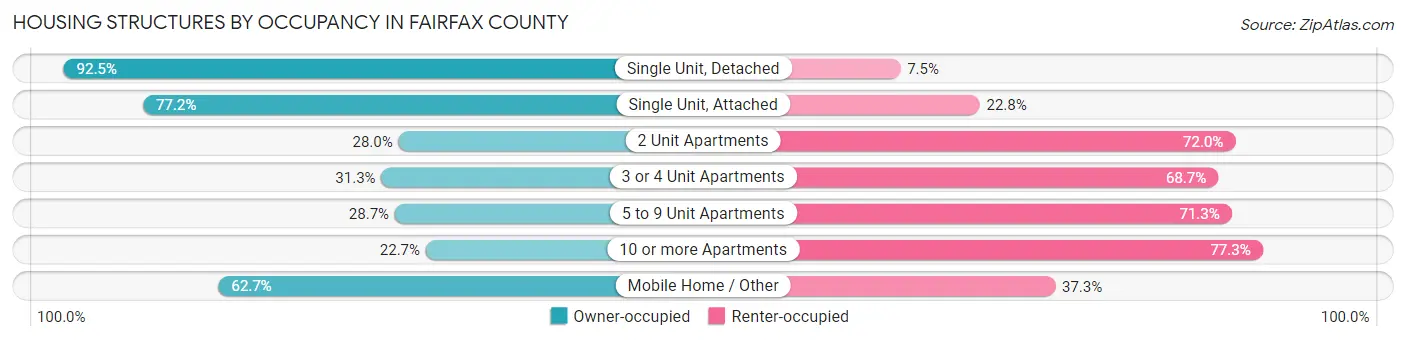
| Structure Type | Owner-occupied | Renter-occupied |
| Single Unit, Detached | 177,158 (92.5%) | 14,414 (7.5%) |
| Single Unit, Attached | 73,748 (77.2%) | 21,786 (22.8%) |
| 2 Unit Apartments | 625 (28.0%) | 1,607 (72.0%) |
| 3 or 4 Unit Apartments | 1,914 (31.3%) | 4,201 (68.7%) |
| 5 to 9 Unit Apartments | 5,896 (28.7%) | 14,651 (71.3%) |
| 10 or more Apartments | 21,145 (22.7%) | 71,845 (77.3%) |
| Mobile Home / Other | 1,162 (62.7%) | 692 (37.3%) |
| Total | 281,648 (68.5%) | 129,196 (31.5%) |
Housing Structures by Number of Rooms in Fairfax County
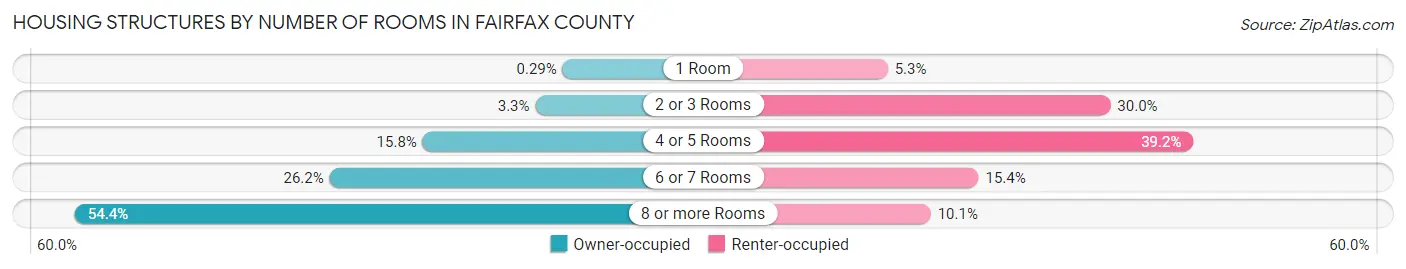
| Number of Rooms | Owner-occupied | Renter-occupied |
| 1 Room | 828 (0.3%) | 6,842 (5.3%) |
| 2 or 3 Rooms | 9,321 (3.3%) | 38,788 (30.0%) |
| 4 or 5 Rooms | 44,551 (15.8%) | 50,662 (39.2%) |
| 6 or 7 Rooms | 73,692 (26.2%) | 19,882 (15.4%) |
| 8 or more Rooms | 153,256 (54.4%) | 13,022 (10.1%) |
| Total | 281,648 (100.0%) | 129,196 (100.0%) |
Housing Structure by Heating Type in Fairfax County
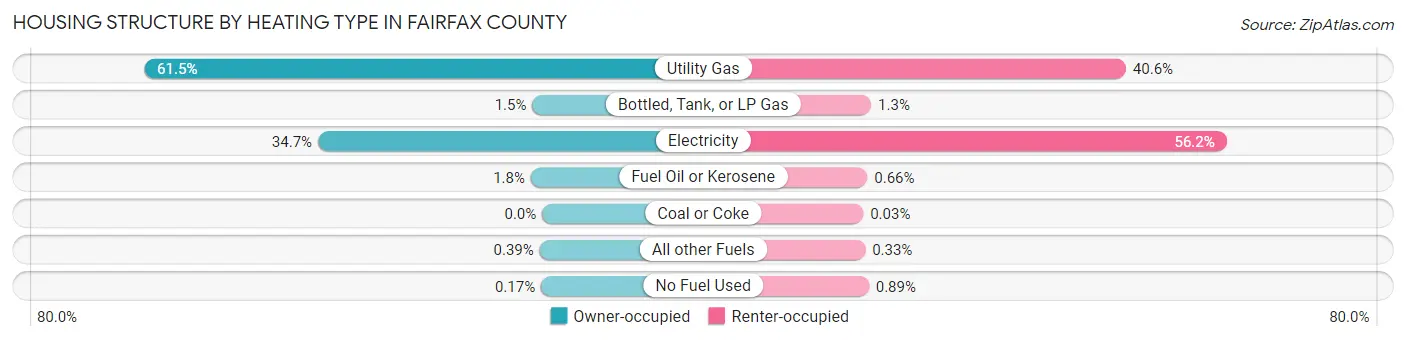
| Heating Type | Owner-occupied | Renter-occupied |
| Utility Gas | 173,232 (61.5%) | 52,511 (40.6%) |
| Bottled, Tank, or LP Gas | 4,283 (1.5%) | 1,611 (1.3%) |
| Electricity | 97,610 (34.7%) | 72,594 (56.2%) |
| Fuel Oil or Kerosene | 4,932 (1.8%) | 858 (0.7%) |
| Coal or Coke | 6 (0.0%) | 44 (0.0%) |
| All other Fuels | 1,097 (0.4%) | 431 (0.3%) |
| No Fuel Used | 488 (0.2%) | 1,147 (0.9%) |
| Total | 281,648 (100.0%) | 129,196 (100.0%) |
Household Vehicle Usage in Fairfax County
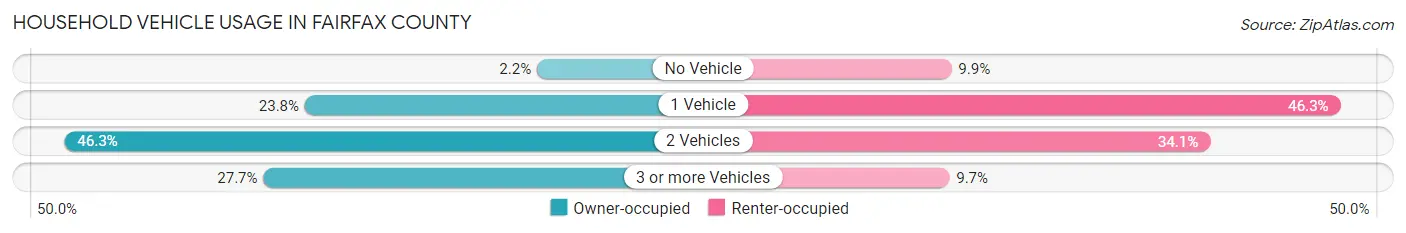
| Vehicles per Household | Owner-occupied | Renter-occupied |
| No Vehicle | 6,104 (2.2%) | 12,842 (9.9%) |
| 1 Vehicle | 67,144 (23.8%) | 59,748 (46.3%) |
| 2 Vehicles | 130,342 (46.3%) | 44,025 (34.1%) |
| 3 or more Vehicles | 78,058 (27.7%) | 12,581 (9.7%) |
| Total | 281,648 (100.0%) | 129,196 (100.0%) |
Real Estate & Mortgages in Fairfax County
Real Estate and Mortgage Overview in Fairfax County
| Characteristic | Without Mortgage | With Mortgage |
| Housing Units | 73,220 | 208,428 |
| Median Property Value | $664,900 | $667,500 |
| Median Household Income | $139,028 | $134,035 |
| Monthly Housing Costs | $1,004 | $108,174 |
| Real Estate Taxes | $7,190 | $4,044 |
Property Value by Mortgage Status in Fairfax County
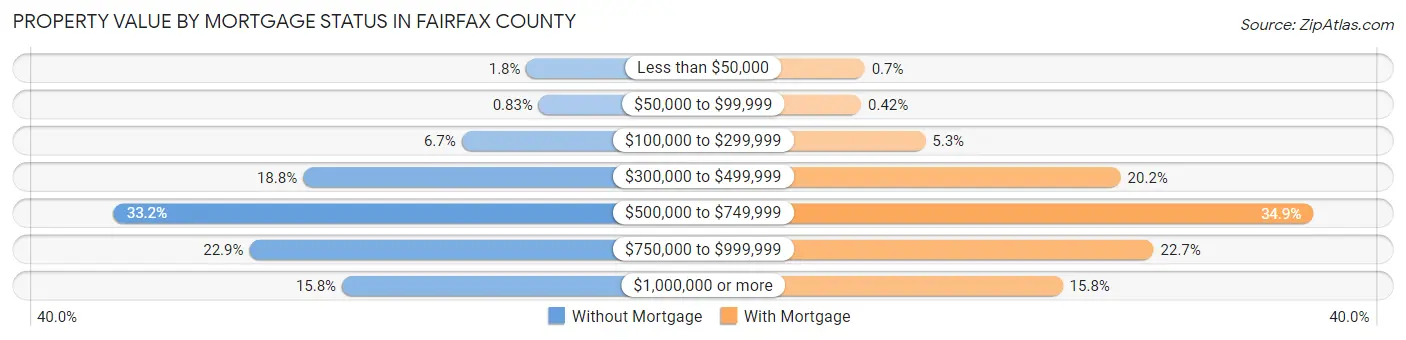
| Property Value | Without Mortgage | With Mortgage |
| Less than $50,000 | 1,295 (1.8%) | 1,457 (0.7%) |
| $50,000 to $99,999 | 609 (0.8%) | 881 (0.4%) |
| $100,000 to $299,999 | 4,914 (6.7%) | 11,086 (5.3%) |
| $300,000 to $499,999 | 13,757 (18.8%) | 42,101 (20.2%) |
| $500,000 to $749,999 | 24,307 (33.2%) | 72,671 (34.9%) |
| $750,000 to $999,999 | 16,752 (22.9%) | 47,333 (22.7%) |
| $1,000,000 or more | 11,586 (15.8%) | 32,899 (15.8%) |
| Total | 73,220 (100.0%) | 208,428 (100.0%) |
Household Income by Mortgage Status in Fairfax County
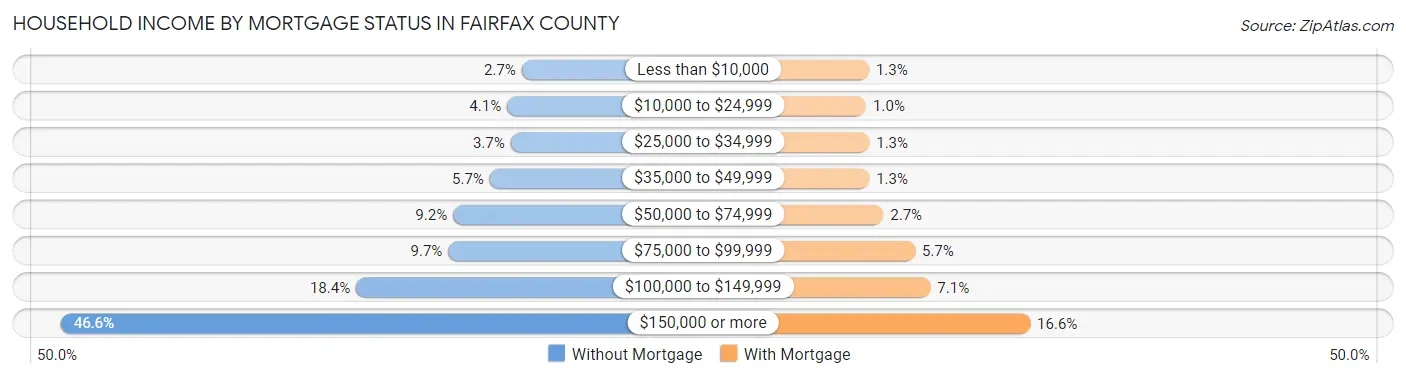
| Household Income | Without Mortgage | With Mortgage |
| Less than $10,000 | 1,946 (2.7%) | 2,677 (1.3%) |
| $10,000 to $24,999 | 2,973 (4.1%) | 2,110 (1.0%) |
| $25,000 to $34,999 | 2,723 (3.7%) | 2,738 (1.3%) |
| $35,000 to $49,999 | 4,181 (5.7%) | 2,707 (1.3%) |
| $50,000 to $74,999 | 6,734 (9.2%) | 5,513 (2.6%) |
| $75,000 to $99,999 | 7,072 (9.7%) | 11,801 (5.7%) |
| $100,000 to $149,999 | 13,505 (18.4%) | 14,859 (7.1%) |
| $150,000 or more | 34,086 (46.6%) | 34,665 (16.6%) |
| Total | 73,220 (100.0%) | 208,428 (100.0%) |
Property Value to Household Income Ratio in Fairfax County
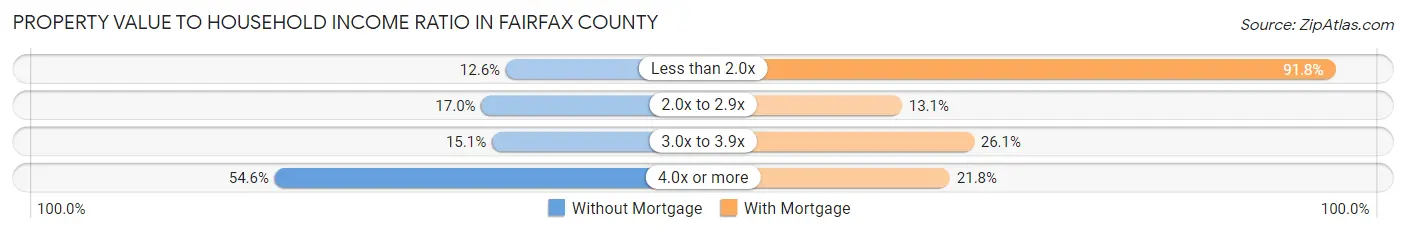
| Value-to-Income Ratio | Without Mortgage | With Mortgage |
| Less than 2.0x | 9,217 (12.6%) | 191,305 (91.8%) |
| 2.0x to 2.9x | 12,475 (17.0%) | 27,191 (13.1%) |
| 3.0x to 3.9x | 11,071 (15.1%) | 54,467 (26.1%) |
| 4.0x or more | 39,947 (54.6%) | 45,388 (21.8%) |
| Total | 73,220 (100.0%) | 208,428 (100.0%) |
Real Estate Taxes by Mortgage Status in Fairfax County
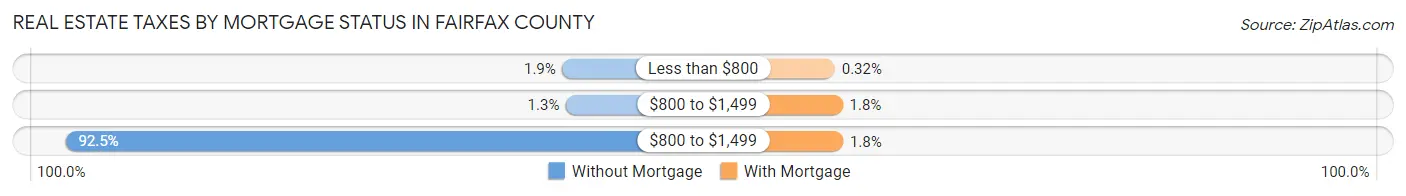
| Property Taxes | Without Mortgage | With Mortgage |
| Less than $800 | 1,395 (1.9%) | 662 (0.3%) |
| $800 to $1,499 | 914 (1.3%) | 3,656 (1.8%) |
| $800 to $1,499 | 67,749 (92.5%) | 3,770 (1.8%) |
| Total | 73,220 (100.0%) | 208,428 (100.0%) |
Health & Disability in Fairfax County
Health Insurance Coverage by Age in Fairfax County
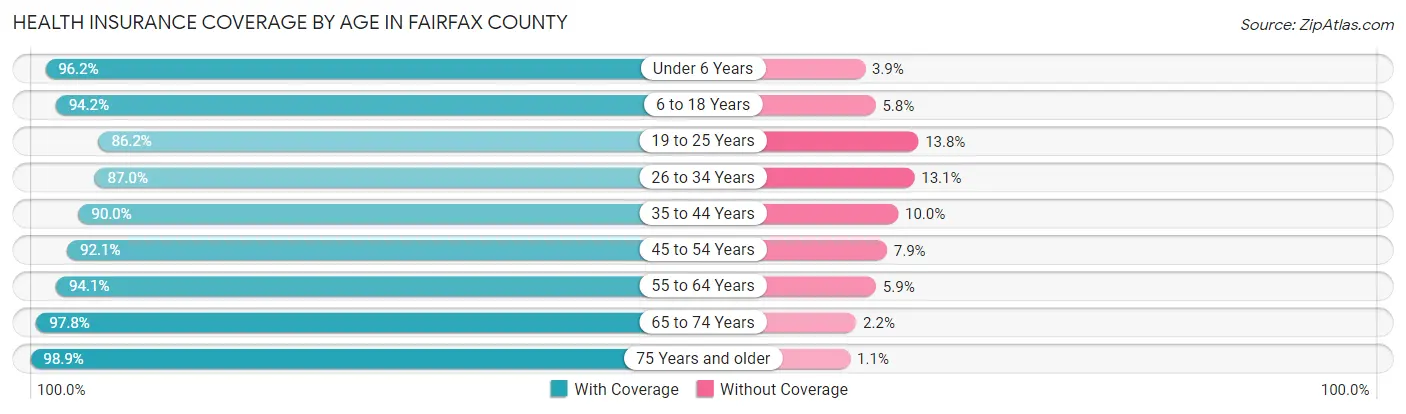
| Age Bracket | With Coverage | Without Coverage |
| Under 6 Years | 79,966 (96.2%) | 3,204 (3.8%) |
| 6 to 18 Years | 186,632 (94.2%) | 11,516 (5.8%) |
| 19 to 25 Years | 81,974 (86.2%) | 13,104 (13.8%) |
| 26 to 34 Years | 114,208 (87.0%) | 17,136 (13.1%) |
| 35 to 44 Years | 144,286 (90.0%) | 16,085 (10.0%) |
| 45 to 54 Years | 144,991 (92.1%) | 12,494 (7.9%) |
| 55 to 64 Years | 135,813 (94.1%) | 8,506 (5.9%) |
| 65 to 74 Years | 94,518 (97.8%) | 2,140 (2.2%) |
| 75 Years and older | 63,040 (98.9%) | 693 (1.1%) |
| Total | 1,045,428 (92.5%) | 84,878 (7.5%) |
Health Insurance Coverage by Citizenship Status in Fairfax County
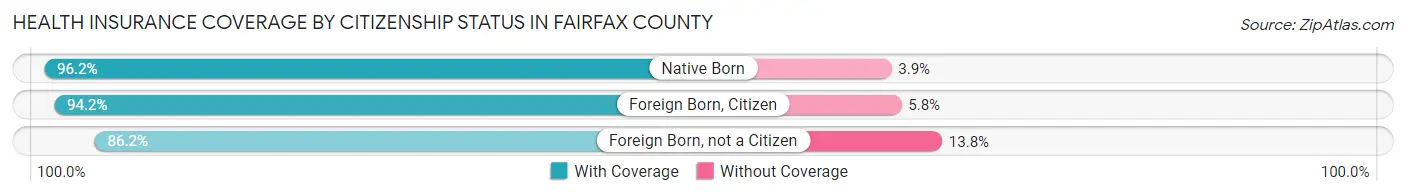
| Citizenship Status | With Coverage | Without Coverage |
| Native Born | 79,966 (96.2%) | 3,204 (3.8%) |
| Foreign Born, Citizen | 186,632 (94.2%) | 11,516 (5.8%) |
| Foreign Born, not a Citizen | 81,974 (86.2%) | 13,104 (13.8%) |
Health Insurance Coverage by Household Income in Fairfax County
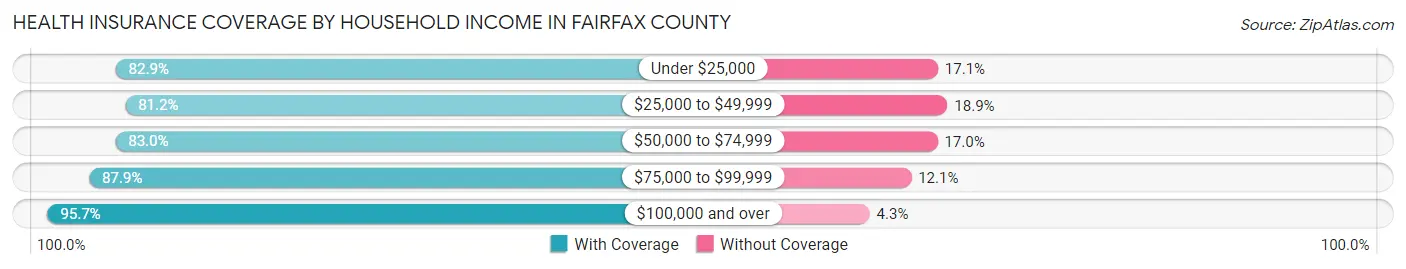
| Household Income | With Coverage | Without Coverage |
| Under $25,000 | 41,689 (82.9%) | 8,582 (17.1%) |
| $25,000 to $49,999 | 61,318 (81.1%) | 14,243 (18.9%) |
| $50,000 to $74,999 | 72,300 (83.0%) | 14,799 (17.0%) |
| $75,000 to $99,999 | 85,603 (87.9%) | 11,756 (12.1%) |
| $100,000 and over | 778,968 (95.7%) | 34,847 (4.3%) |
Public vs Private Health Insurance Coverage by Age in Fairfax County
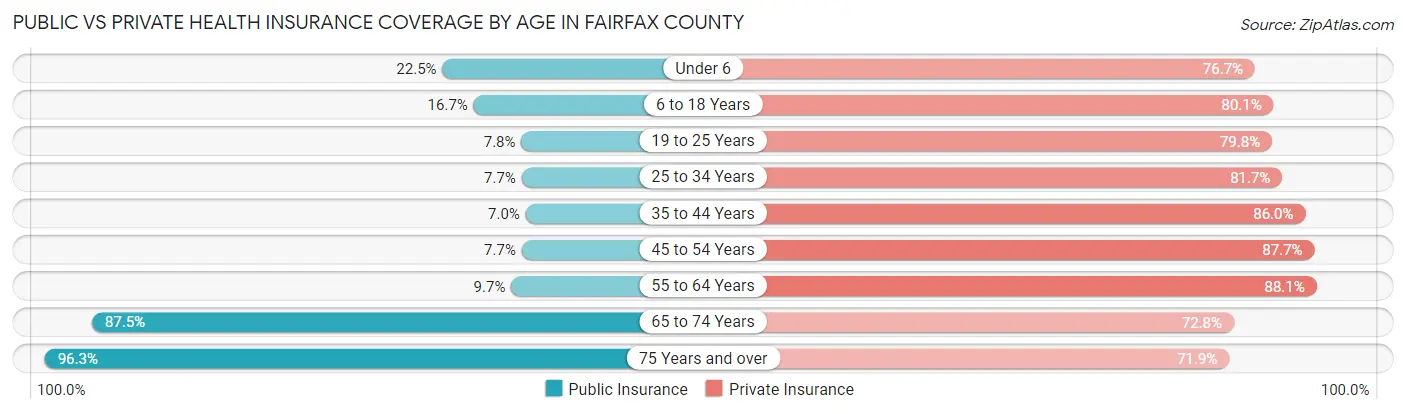
| Age Bracket | Public Insurance | Private Insurance |
| Under 6 | 18,672 (22.5%) | 63,766 (76.7%) |
| 6 to 18 Years | 32,984 (16.7%) | 158,775 (80.1%) |
| 19 to 25 Years | 7,403 (7.8%) | 75,915 (79.8%) |
| 25 to 34 Years | 10,151 (7.7%) | 107,360 (81.7%) |
| 35 to 44 Years | 11,223 (7.0%) | 137,950 (86.0%) |
| 45 to 54 Years | 12,157 (7.7%) | 138,152 (87.7%) |
| 55 to 64 Years | 13,959 (9.7%) | 127,158 (88.1%) |
| 65 to 74 Years | 84,579 (87.5%) | 70,335 (72.8%) |
| 75 Years and over | 61,349 (96.3%) | 45,822 (71.9%) |
| Total | 252,477 (22.3%) | 925,233 (81.9%) |
Disability Status by Sex by Age in Fairfax County
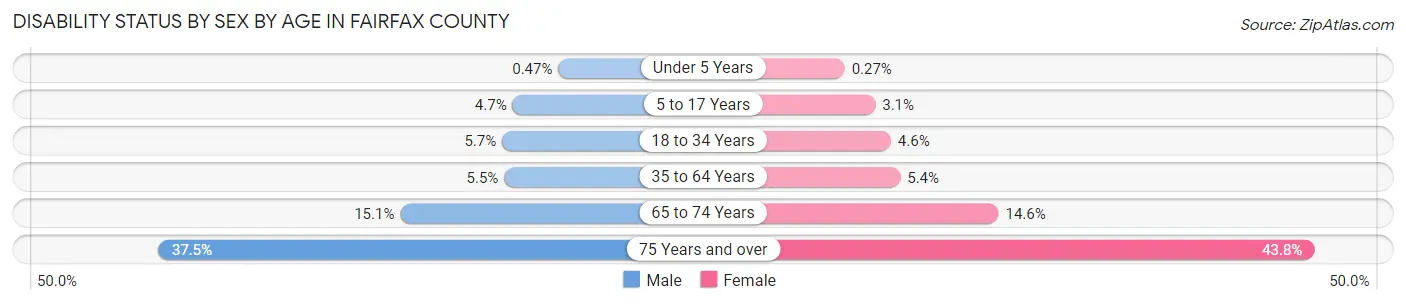
| Age Bracket | Male | Female |
| Under 5 Years | 166 (0.5%) | 91 (0.3%) |
| 5 to 17 Years | 4,768 (4.7%) | 2,944 (3.1%) |
| 18 to 34 Years | 7,024 (5.7%) | 5,454 (4.6%) |
| 35 to 64 Years | 12,519 (5.5%) | 12,694 (5.4%) |
| 65 to 74 Years | 7,010 (15.1%) | 7,328 (14.5%) |
| 75 Years and over | 10,377 (37.5%) | 15,825 (43.8%) |
Disability Class by Sex by Age in Fairfax County
Disability Class: Hearing Difficulty
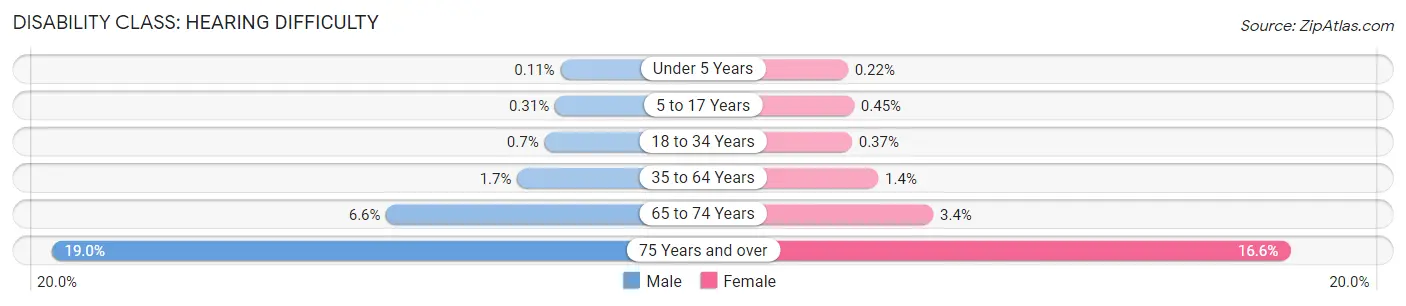
| Age Bracket | Male | Female |
| Under 5 Years | 39 (0.1%) | 75 (0.2%) |
| 5 to 17 Years | 317 (0.3%) | 430 (0.4%) |
| 18 to 34 Years | 860 (0.7%) | 442 (0.4%) |
| 35 to 64 Years | 3,895 (1.7%) | 3,154 (1.3%) |
| 65 to 74 Years | 3,042 (6.6%) | 1,708 (3.4%) |
| 75 Years and over | 5,252 (19.0%) | 6,006 (16.6%) |
Disability Class: Vision Difficulty
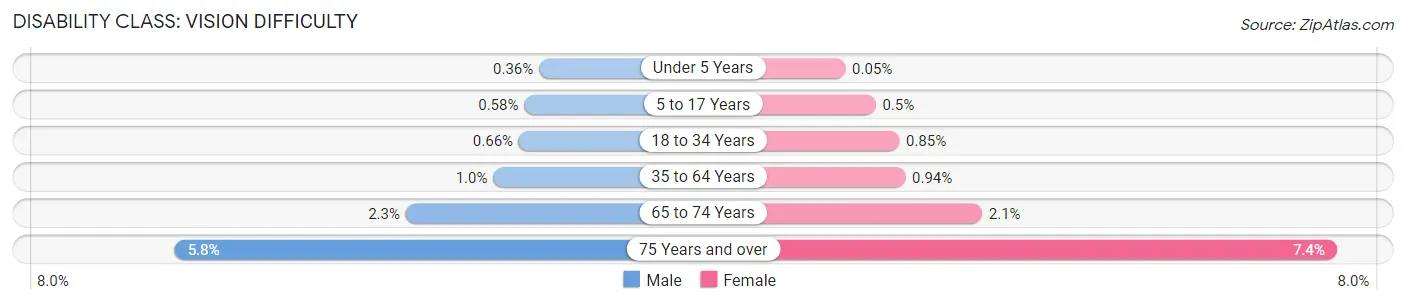
| Age Bracket | Male | Female |
| Under 5 Years | 127 (0.4%) | 16 (0.1%) |
| 5 to 17 Years | 582 (0.6%) | 471 (0.5%) |
| 18 to 34 Years | 818 (0.7%) | 1,019 (0.9%) |
| 35 to 64 Years | 2,374 (1.0%) | 2,198 (0.9%) |
| 65 to 74 Years | 1,082 (2.3%) | 1,046 (2.1%) |
| 75 Years and over | 1,596 (5.8%) | 2,653 (7.3%) |
Disability Class: Cognitive Difficulty
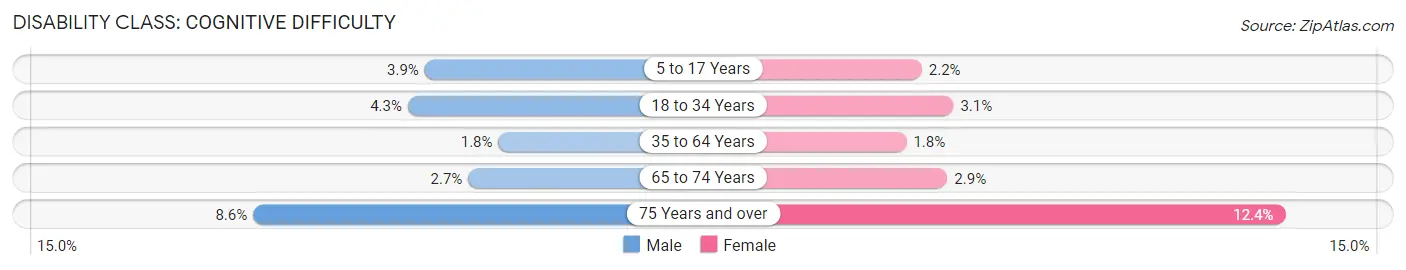
| Age Bracket | Male | Female |
| 5 to 17 Years | 3,900 (3.9%) | 2,114 (2.2%) |
| 18 to 34 Years | 5,345 (4.3%) | 3,719 (3.1%) |
| 35 to 64 Years | 4,140 (1.8%) | 4,201 (1.8%) |
| 65 to 74 Years | 1,226 (2.6%) | 1,480 (2.9%) |
| 75 Years and over | 2,389 (8.6%) | 4,458 (12.3%) |
Disability Class: Ambulatory Difficulty
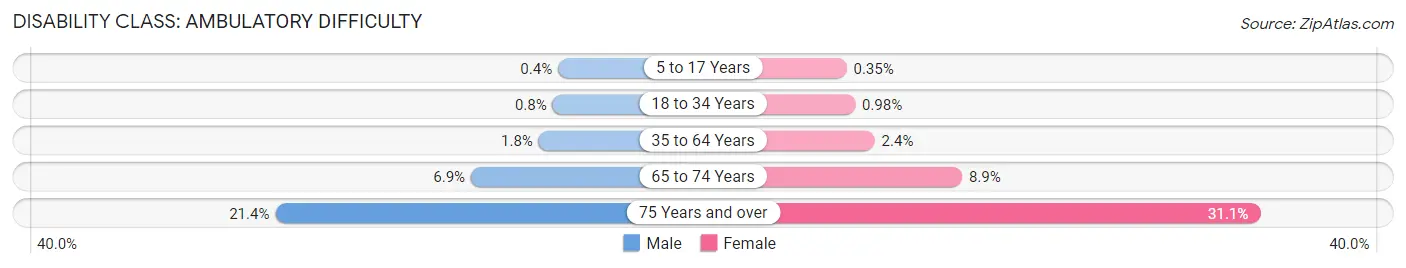
| Age Bracket | Male | Female |
| 5 to 17 Years | 404 (0.4%) | 327 (0.4%) |
| 18 to 34 Years | 989 (0.8%) | 1,173 (1.0%) |
| 35 to 64 Years | 4,185 (1.8%) | 5,699 (2.4%) |
| 65 to 74 Years | 3,176 (6.9%) | 4,493 (8.9%) |
| 75 Years and over | 5,912 (21.4%) | 11,211 (31.1%) |
Disability Class: Self-Care Difficulty
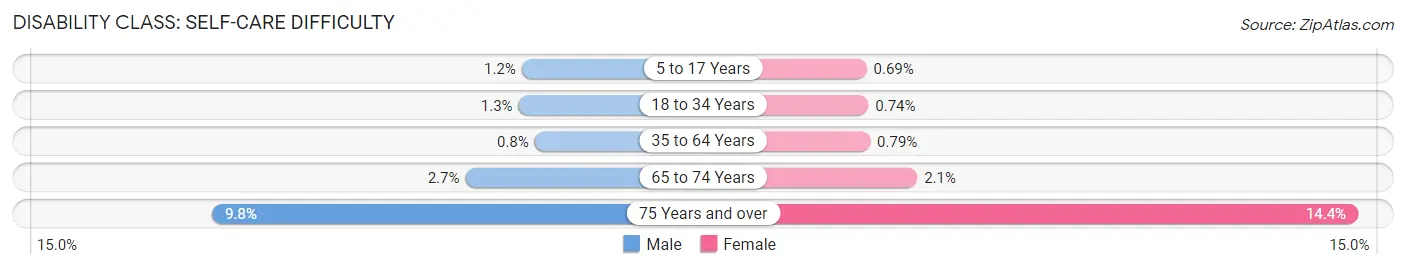
| Age Bracket | Male | Female |
| 5 to 17 Years | 1,169 (1.2%) | 658 (0.7%) |
| 18 to 34 Years | 1,537 (1.3%) | 886 (0.7%) |
| 35 to 64 Years | 1,834 (0.8%) | 1,845 (0.8%) |
| 65 to 74 Years | 1,264 (2.7%) | 1,058 (2.1%) |
| 75 Years and over | 2,702 (9.8%) | 5,185 (14.4%) |
Technology Access in Fairfax County
Computing Device Access in Fairfax County
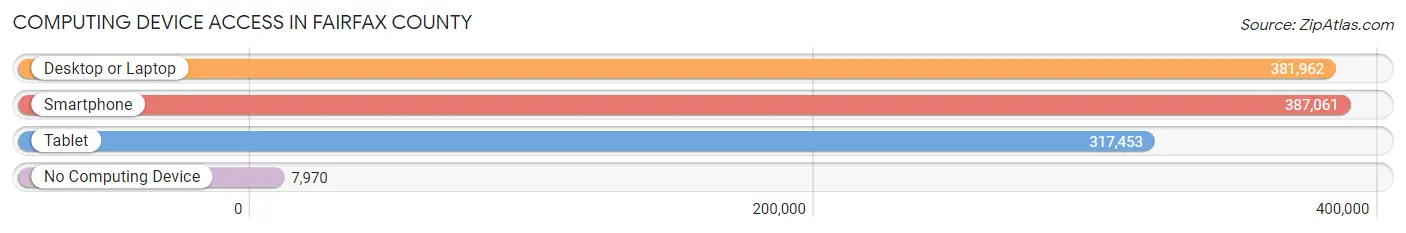
| Device Type | # Households | % Households |
| Desktop or Laptop | 381,962 | 93.0% |
| Smartphone | 387,061 | 94.2% |
| Tablet | 317,453 | 77.3% |
| No Computing Device | 7,970 | 1.9% |
| Total | 410,844 | 100.0% |
Internet Access in Fairfax County
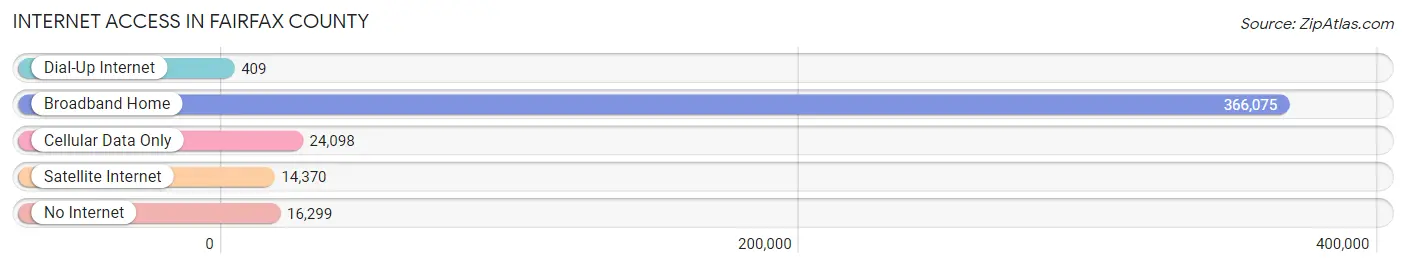
| Internet Type | # Households | % Households |
| Dial-Up Internet | 409 | 0.1% |
| Broadband Home | 366,075 | 89.1% |
| Cellular Data Only | 24,098 | 5.9% |
| Satellite Internet | 14,370 | 3.5% |
| No Internet | 16,299 | 4.0% |
| Total | 410,844 | 100.0% |
Fairfax County Summary
Fairfax County, Virginia is a county located in the Commonwealth of Virginia. It is the most populous county in the state, with a population of 1,081,726 as of the 2019 census. The county seat is Fairfax, and the county is part of the Washington-Arlington-Alexandria metropolitan area. Fairfax County is home to many of the nation’s most important government institutions, including the Central Intelligence Agency, the Pentagon, and the National Counterterrorism Center.
Geography
Fairfax County is located in the northern part of Virginia, just south of Washington, D.C. It is bordered by Loudoun County to the north, Prince William County to the south, and the Potomac River to the east. The county covers an area of 406 square miles, making it the largest county in Virginia by area. The terrain is mostly rolling hills, with the highest point being the Bull Run Mountains in the western part of the county. The county is drained by the Potomac River and its tributaries, including the Occoquan and Bull Run Rivers.
Economy
Fairfax County is one of the wealthiest counties in the United States, with a median household income of $117,843 in 2019. The county’s economy is largely driven by the federal government, with many government agencies and contractors located in the county. The county is also home to many large corporations, including Northrop Grumman, General Dynamics, and Booz Allen Hamilton. The county is also home to many technology companies, such as Amazon, Microsoft, and AOL.
Demographics
As of the 2019 census, Fairfax County had a population of 1,081,726. The racial makeup of the county was 68.3% White, 15.2% Asian, 8.7% Black or African American, 0.4% Native American, 0.1% Pacific Islander, and 6.3% from other races. The median age was 37.7 years, and the median household income was $117,843.
The county is home to many immigrants, with the largest groups being from El Salvador, India, and Vietnam. The county is also home to a large number of foreign-born residents, with the largest groups being from India, China, and the Philippines.
Conclusion
Fairfax County, Virginia is a large and diverse county located in the northern part of the state. It is home to many important government institutions, and its economy is largely driven by the federal government. The county is also home to many large corporations and technology companies. The population of the county is diverse, with the largest racial groups being White, Asian, and Black or African American. The county is also home to many immigrants, with the largest groups being from El Salvador, India, and Vietnam.
Common Questions
What is Per Capita Income in Fairfax County?
Per Capita income in Fairfax County is $67,598.
What is the Median Family Income in Fairfax County?
Median Family Income in Fairfax County is $172,110.
What is the Median Household income in Fairfax County?
Median Household Income in Fairfax County is $145,165.
What is Income or Wage Gap in Fairfax County?
Income or Wage Gap in Fairfax County is 31.5%.
Women in Fairfax County earn 68.5 cents for every dollar earned by a man.
What is Family Income Deficit in Fairfax County?
Family Income Deficit in Fairfax County is $11,439.
Families that are below poverty line in Fairfax County earn $11,439 less on average than the poverty threshold level.
What is Inequality or Gini Index in Fairfax County?
Inequality or Gini Index in Fairfax County is 0.43.
What is the Total Population of Fairfax County?
Total Population of Fairfax County is 1,145,354.
What is the Total Male Population of Fairfax County?
Total Male Population of Fairfax County is 573,140.
What is the Total Female Population of Fairfax County?
Total Female Population of Fairfax County is 572,214.
What is the Ratio of Males per 100 Females in Fairfax County?
There are 100.16 Males per 100 Females in Fairfax County.
What is the Ratio of Females per 100 Males in Fairfax County?
There are 99.84 Females per 100 Males in Fairfax County.
What is the Median Population Age in Fairfax County?
Median Population Age in Fairfax County is 38.6 Years.
What is the Average Family Size in Fairfax County
Average Family Size in Fairfax County is 3.3 People.
What is the Average Household Size in Fairfax County
Average Household Size in Fairfax County is 2.8 People.
How Large is the Labor Force in Fairfax County?
There are 648,195 People in the Labor Forcein in Fairfax County.
What is the Percentage of People in the Labor Force in Fairfax County?
71.2% of People are in the Labor Force in Fairfax County.
What is the Unemployment Rate in Fairfax County?
Unemployment Rate in Fairfax County is 4.1%.