Fairfax City, VA Map & Demographics
Fairfax City Map
Fairfax City Overview
$59,688
PER CAPITA INCOME
$170,100
AVG FAMILY INCOME
$128,708
AVG HOUSEHOLD INCOME
32.3%
WAGE / INCOME GAP [ % ]
67.7¢/ $1
WAGE / INCOME GAP [ $ ]
0.43
INEQUALITY / GINI INDEX
24,242
TOTAL POPULATION
11,945
MALE POPULATION
12,297
FEMALE POPULATION
97.14
MALES / 100 FEMALES
102.95
FEMALES / 100 MALES
37.5
MEDIAN AGE
3.1
AVG FAMILY SIZE
2.6
AVG HOUSEHOLD SIZE
13,687
LABOR FORCE [ PEOPLE ]
71.5%
PERCENT IN LABOR FORCE
3.7%
UNEMPLOYMENT RATE
Income in Fairfax City
Income Overview in Fairfax City
Per Capita Income in Fairfax City is $59,688, while median incomes of families and households are $170,100 and $128,708 respectively.
| Characteristic | Number | Measure |
| Per Capita Income | 24,242 | $59,688 |
| Median Family Income | 5,905 | $170,100 |
| Mean Family Income | 5,905 | $186,611 |
| Median Household Income | 9,129 | $128,708 |
| Mean Household Income | 9,129 | $160,337 |
| Income Deficit | 5,905 | $0 |
| Wage / Income Gap (%) | 24,242 | 32.30% |
| Wage / Income Gap ($) | 24,242 | 67.70¢ per $1 |
| Gini / Inequality Index | 24,242 | 0.43 |
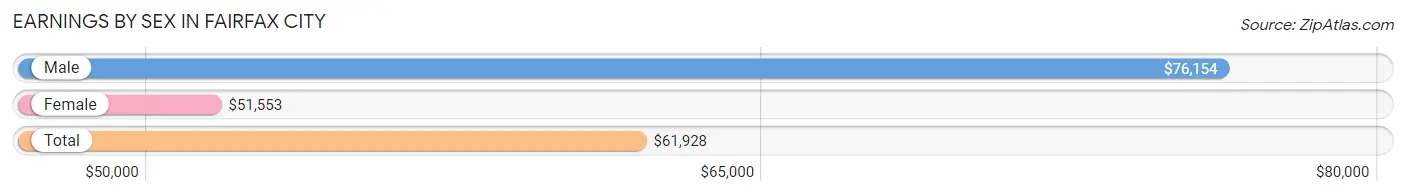
Earnings by Sex in Fairfax City
Average Earnings in Fairfax City are $61,928, $76,154 for men and $51,553 for women, a difference of 32.3%.
| Sex | Number | Average Earnings |
| Male | 7,462 (53.1%) | $76,154 |
| Female | 6,583 (46.9%) | $51,553 |
| Total | 14,045 (100.0%) | $61,928 |
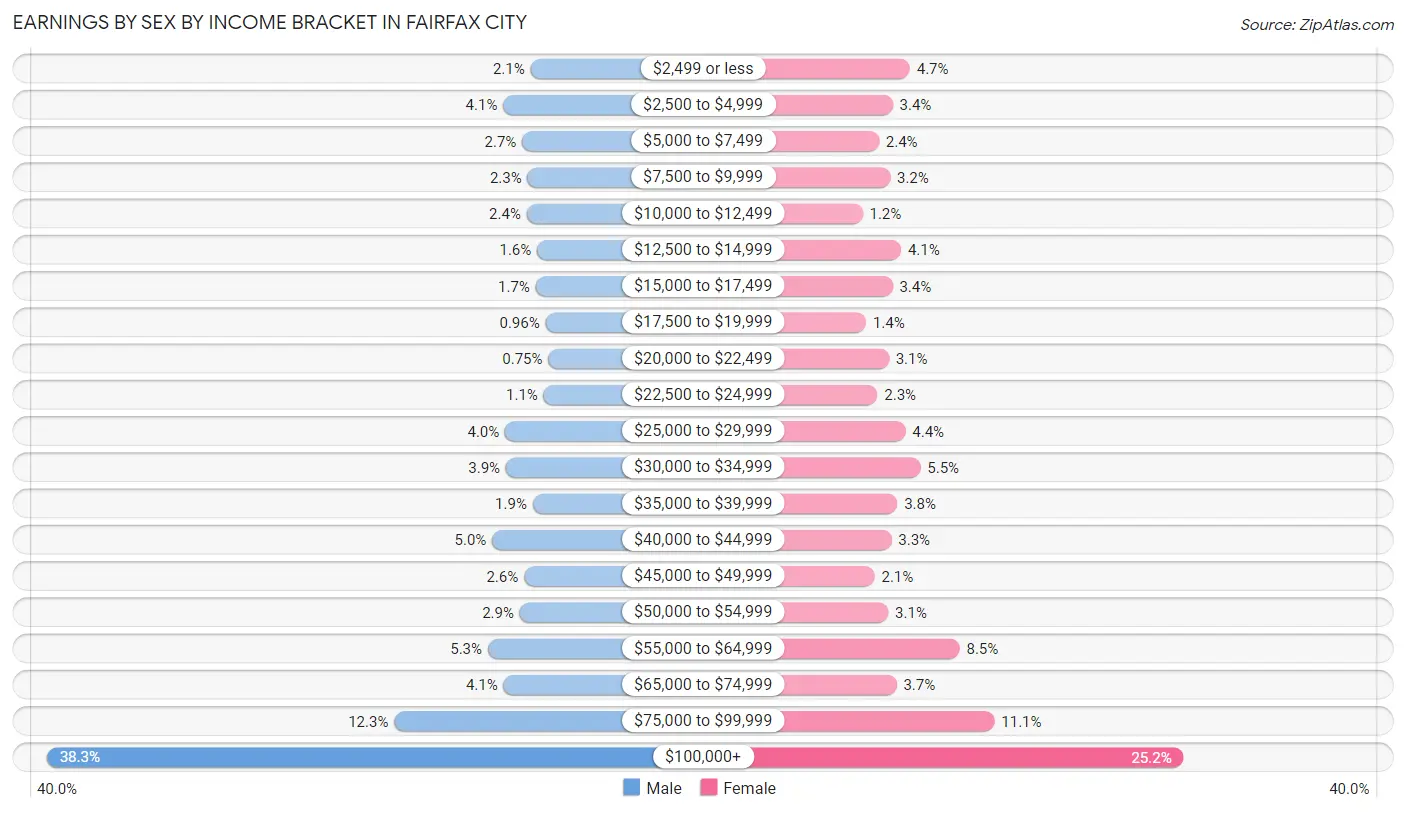
Earnings by Sex by Income Bracket in Fairfax City
The most common earnings brackets in Fairfax City are $100,000+ for men (2,861 | 38.3%) and $100,000+ for women (1,661 | 25.2%).
| Income | Male | Female |
| $2,499 or less | 155 (2.1%) | 311 (4.7%) |
| $2,500 to $4,999 | 308 (4.1%) | 226 (3.4%) |
| $5,000 to $7,499 | 202 (2.7%) | 158 (2.4%) |
| $7,500 to $9,999 | 172 (2.3%) | 213 (3.2%) |
| $10,000 to $12,499 | 177 (2.4%) | 78 (1.2%) |
| $12,500 to $14,999 | 119 (1.6%) | 267 (4.1%) |
| $15,000 to $17,499 | 127 (1.7%) | 225 (3.4%) |
| $17,500 to $19,999 | 72 (1.0%) | 95 (1.4%) |
| $20,000 to $22,499 | 56 (0.7%) | 207 (3.1%) |
| $22,500 to $24,999 | 82 (1.1%) | 151 (2.3%) |
| $25,000 to $29,999 | 298 (4.0%) | 289 (4.4%) |
| $30,000 to $34,999 | 293 (3.9%) | 363 (5.5%) |
| $35,000 to $39,999 | 143 (1.9%) | 249 (3.8%) |
| $40,000 to $44,999 | 370 (5.0%) | 220 (3.3%) |
| $45,000 to $49,999 | 192 (2.6%) | 137 (2.1%) |
| $50,000 to $54,999 | 216 (2.9%) | 204 (3.1%) |
| $55,000 to $64,999 | 394 (5.3%) | 556 (8.5%) |
| $65,000 to $74,999 | 307 (4.1%) | 245 (3.7%) |
| $75,000 to $99,999 | 918 (12.3%) | 728 (11.1%) |
| $100,000+ | 2,861 (38.3%) | 1,661 (25.2%) |
| Total | 7,462 (100.0%) | 6,583 (100.0%) |
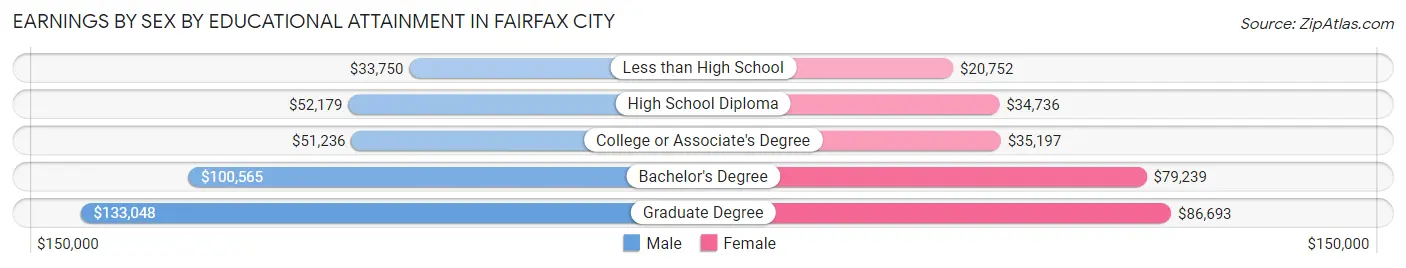
Earnings by Sex by Educational Attainment in Fairfax City
Average earnings in Fairfax City are $87,359 for men and $58,333 for women, a difference of 33.2%. Men with an educational attainment of graduate degree enjoy the highest average annual earnings of $133,048, while those with less than high school education earn the least with $33,750. Women with an educational attainment of graduate degree earn the most with the average annual earnings of $86,693, while those with less than high school education have the smallest earnings of $20,752.
| Educational Attainment | Male Income | Female Income |
| Less than High School | $33,750 | $20,752 |
| High School Diploma | $52,179 | $34,736 |
| College or Associate's Degree | $51,236 | $35,197 |
| Bachelor's Degree | $100,565 | $79,239 |
| Graduate Degree | $133,048 | $86,693 |
| Total | $87,359 | $58,333 |
Family Income in Fairfax City
Family Income Brackets in Fairfax City
According to the Fairfax City family income data, there are 2,120 families falling into the $200,000+ income range, which is the most common income bracket and makes up 35.9% of all families. Conversely, the $10,000 to $14,999 income bracket is the least frequent group with only 59 families (1.0%) belonging to this category.
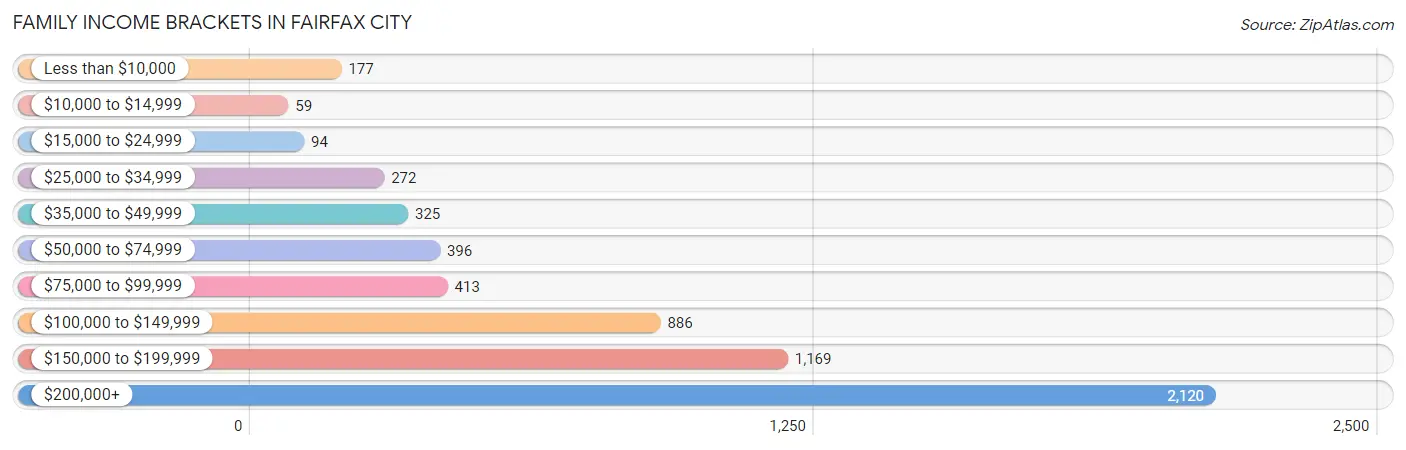
| Income Bracket | # Families | % Families |
| Less than $10,000 | 177 | 3.0% |
| $10,000 to $14,999 | 59 | 1.0% |
| $15,000 to $24,999 | 94 | 1.6% |
| $25,000 to $34,999 | 272 | 4.6% |
| $35,000 to $49,999 | 325 | 5.5% |
| $50,000 to $74,999 | 396 | 6.7% |
| $75,000 to $99,999 | 413 | 7.0% |
| $100,000 to $149,999 | 886 | 15.0% |
| $150,000 to $199,999 | 1,169 | 19.8% |
| $200,000+ | 2,120 | 35.9% |
Family Income by Famaliy Size in Fairfax City
6-person families (90 | 1.5%) account for the highest median family income in Fairfax City with $250,001 per family, while 2-person families (2,377 | 40.3%) have the highest median income of $68,469 per family member.
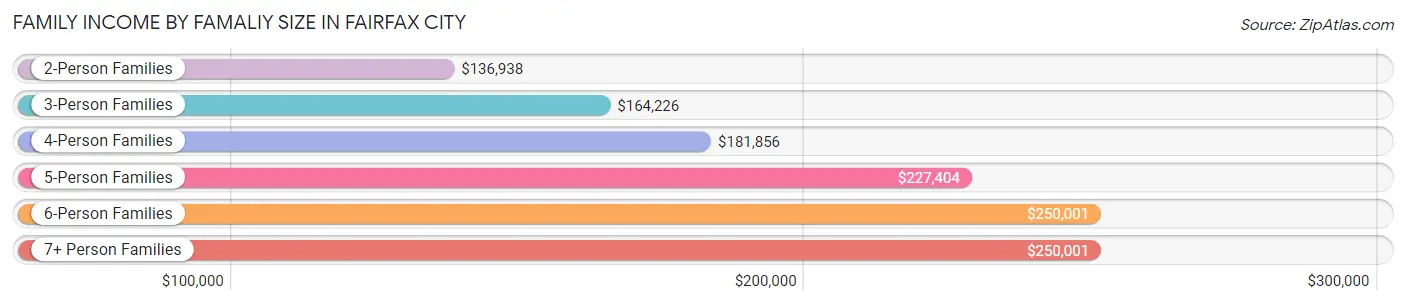
| Income Bracket | # Families | Median Income |
| 2-Person Families | 2,377 (40.3%) | $136,938 |
| 3-Person Families | 1,518 (25.7%) | $164,226 |
| 4-Person Families | 1,436 (24.3%) | $181,856 |
| 5-Person Families | 395 (6.7%) | $227,404 |
| 6-Person Families | 90 (1.5%) | $250,001 |
| 7+ Person Families | 89 (1.5%) | $250,001 |
| Total | 5,905 (100.0%) | $170,100 |
Family Income by Number of Earners in Fairfax City
The median family income in Fairfax City is $170,100, with families comprising 2 earners (2,794) having the highest median family income of $189,439, while families with no earners (619) have the lowest median family income of $66,359, accounting for 47.3% and 10.5% of families, respectively.
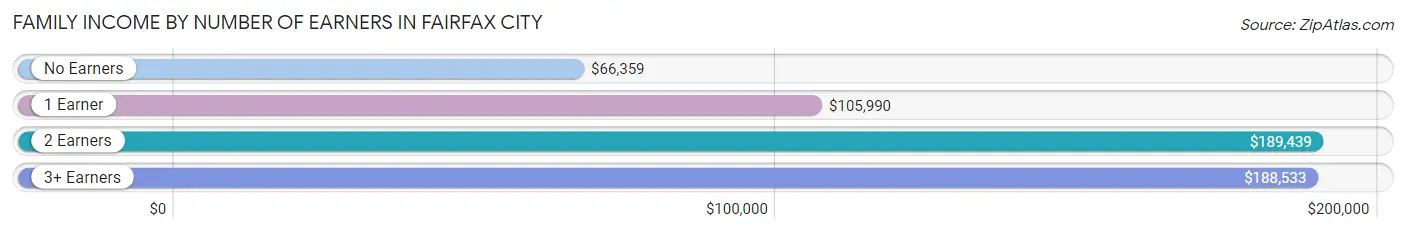
| Number of Earners | # Families | Median Income |
| No Earners | 619 (10.5%) | $66,359 |
| 1 Earner | 1,529 (25.9%) | $105,990 |
| 2 Earners | 2,794 (47.3%) | $189,439 |
| 3+ Earners | 963 (16.3%) | $188,533 |
| Total | 5,905 (100.0%) | $170,100 |
Household Income in Fairfax City
Household Income Brackets in Fairfax City
With 2,711 households falling in the category, the $200,000+ income range is the most frequent in Fairfax City, accounting for 29.7% of all households. In contrast, only 82 households (0.9%) fall into the $10,000 to $14,999 income bracket, making it the least populous group.
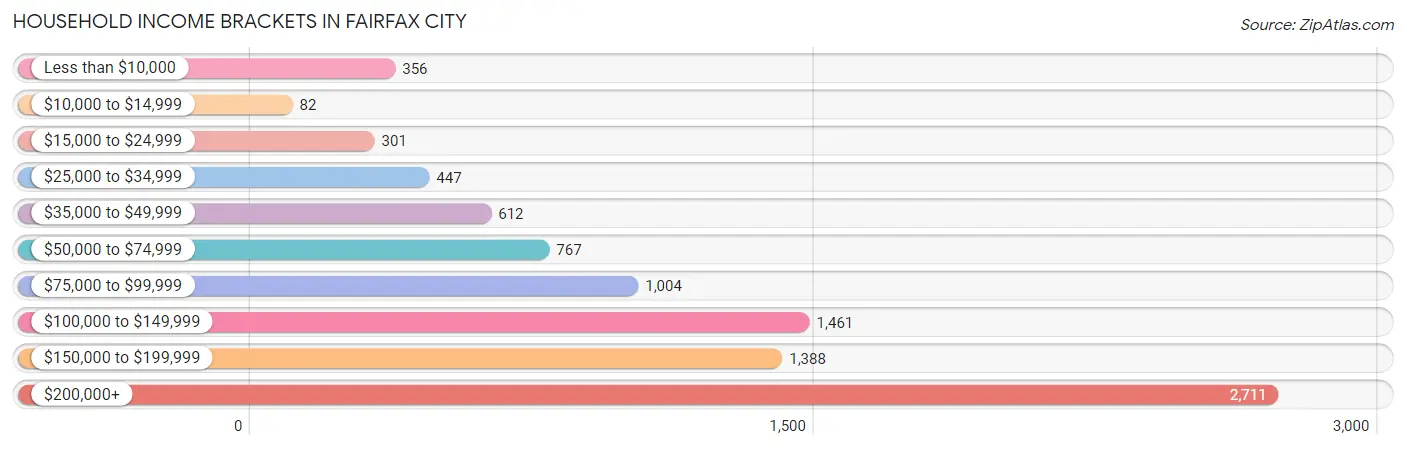
| Income Bracket | # Households | % Households |
| Less than $10,000 | 356 | 3.9% |
| $10,000 to $14,999 | 82 | 0.9% |
| $15,000 to $24,999 | 301 | 3.3% |
| $25,000 to $34,999 | 447 | 4.9% |
| $35,000 to $49,999 | 612 | 6.7% |
| $50,000 to $74,999 | 767 | 8.4% |
| $75,000 to $99,999 | 1,004 | 11.0% |
| $100,000 to $149,999 | 1,461 | 16.0% |
| $150,000 to $199,999 | 1,388 | 15.2% |
| $200,000+ | 2,711 | 29.7% |
Household Income by Householder Age in Fairfax City
The median household income in Fairfax City is $128,708, with the highest median household income of $170,616 found in the 45 to 64 years age bracket for the primary householder. A total of 3,592 households (39.4%) fall into this category. Meanwhile, the 15 to 24 years age bracket for the primary householder has the lowest median household income of $40,823, with 635 households (7.0%) in this group.
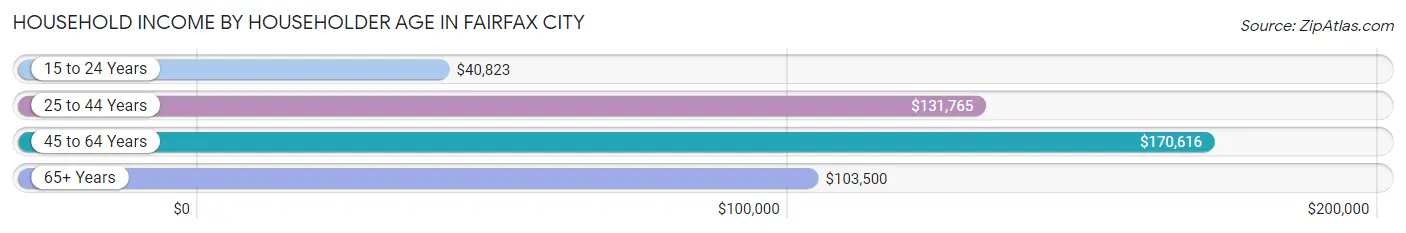
| Income Bracket | # Households | Median Income |
| 15 to 24 Years | 635 (7.0%) | $40,823 |
| 25 to 44 Years | 3,118 (34.2%) | $131,765 |
| 45 to 64 Years | 3,592 (39.4%) | $170,616 |
| 65+ Years | 1,784 (19.5%) | $103,500 |
| Total | 9,129 (100.0%) | $128,708 |
Poverty in Fairfax City
Income Below Poverty by Sex and Age in Fairfax City
With 7.6% poverty level for males and 12.4% for females among the residents of Fairfax City, 18 to 24 year old males and 18 to 24 year old females are the most vulnerable to poverty, with 309 males (27.7%) and 461 females (43.7%) in their respective age groups living below the poverty level.
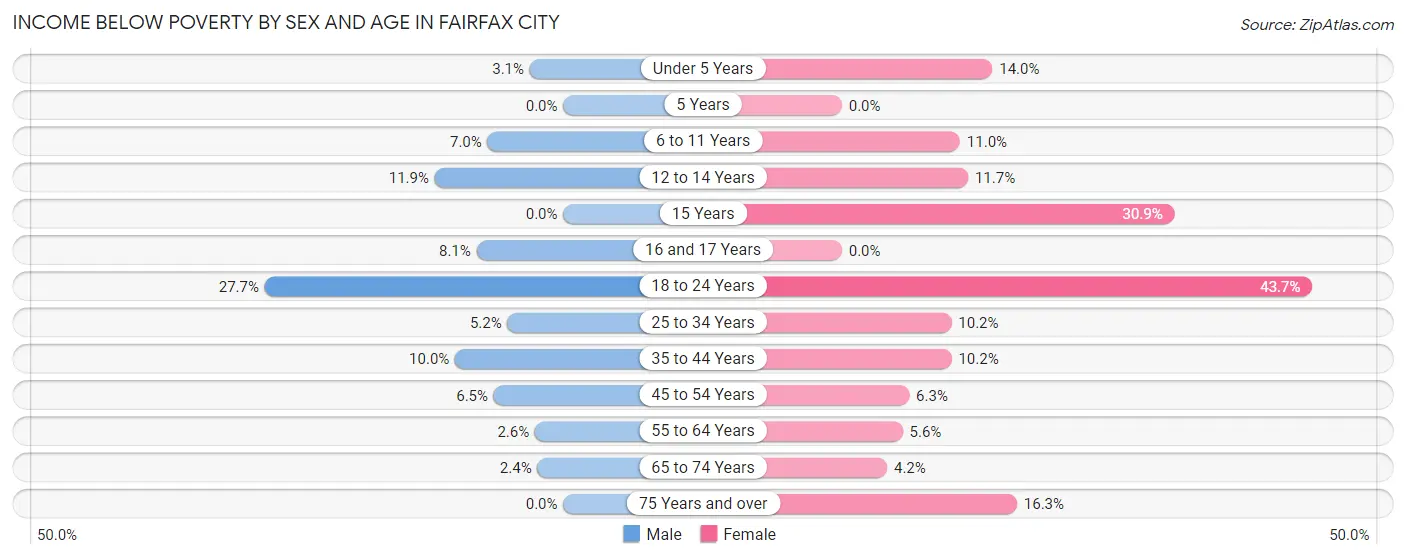
| Age Bracket | Male | Female |
| Under 5 Years | 25 (3.1%) | 122 (14.0%) |
| 5 Years | 0 (0.0%) | 0 (0.0%) |
| 6 to 11 Years | 60 (7.0%) | 91 (11.0%) |
| 12 to 14 Years | 55 (11.9%) | 35 (11.7%) |
| 15 Years | 0 (0.0%) | 80 (30.9%) |
| 16 and 17 Years | 24 (8.1%) | 0 (0.0%) |
| 18 to 24 Years | 309 (27.7%) | 461 (43.7%) |
| 25 to 34 Years | 89 (5.2%) | 155 (10.2%) |
| 35 to 44 Years | 164 (10.0%) | 173 (10.2%) |
| 45 to 54 Years | 101 (6.5%) | 95 (6.2%) |
| 55 to 64 Years | 41 (2.6%) | 88 (5.6%) |
| 65 to 74 Years | 22 (2.4%) | 43 (4.2%) |
| 75 Years and over | 0 (0.0%) | 104 (16.3%) |
| Total | 890 (7.6%) | 1,447 (12.4%) |
Income Above Poverty by Sex and Age in Fairfax City
According to the poverty statistics in Fairfax City, males aged 5 years and females aged 5 years are the age groups that are most secure financially, with 100.0% of males and 100.0% of females in these age groups living above the poverty line.
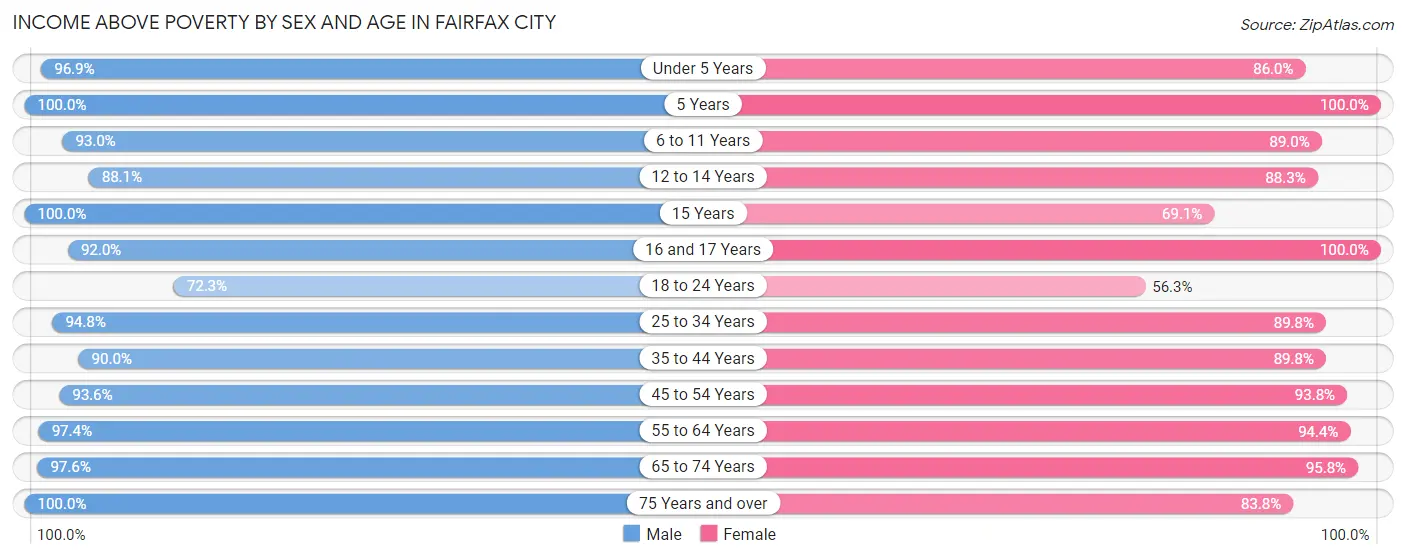
| Age Bracket | Male | Female |
| Under 5 Years | 779 (96.9%) | 751 (86.0%) |
| 5 Years | 232 (100.0%) | 182 (100.0%) |
| 6 to 11 Years | 794 (93.0%) | 739 (89.0%) |
| 12 to 14 Years | 406 (88.1%) | 264 (88.3%) |
| 15 Years | 62 (100.0%) | 179 (69.1%) |
| 16 and 17 Years | 274 (91.9%) | 208 (100.0%) |
| 18 to 24 Years | 806 (72.3%) | 595 (56.3%) |
| 25 to 34 Years | 1,629 (94.8%) | 1,369 (89.8%) |
| 35 to 44 Years | 1,469 (90.0%) | 1,526 (89.8%) |
| 45 to 54 Years | 1,465 (93.5%) | 1,424 (93.8%) |
| 55 to 64 Years | 1,515 (97.4%) | 1,471 (94.4%) |
| 65 to 74 Years | 894 (97.6%) | 980 (95.8%) |
| 75 Years and over | 488 (100.0%) | 536 (83.8%) |
| Total | 10,813 (92.4%) | 10,224 (87.6%) |
Income Below Poverty Among Married-Couple Families in Fairfax City
The poverty statistics for married-couple families in Fairfax City show that 3.9% or 190 of the total 4,905 families live below the poverty line. Families with 1 or 2 children have the highest poverty rate of 8.7%, comprising of 177 families. On the other hand, families with 3 or 4 children have the lowest poverty rate of 0.0%, which includes 0 families.
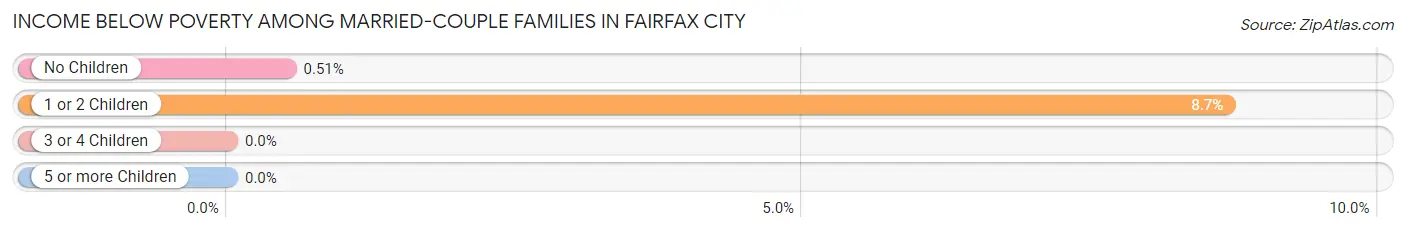
| Children | Above Poverty | Below Poverty |
| No Children | 2,520 (99.5%) | 13 (0.5%) |
| 1 or 2 Children | 1,862 (91.3%) | 177 (8.7%) |
| 3 or 4 Children | 306 (100.0%) | 0 (0.0%) |
| 5 or more Children | 27 (100.0%) | 0 (0.0%) |
| Total | 4,715 (96.1%) | 190 (3.9%) |
Income Below Poverty Among Single-Parent Households in Fairfax City
According to the poverty data in Fairfax City, 14.4% or 77 single-father households and 17.6% or 82 single-mother households are living below the poverty line. Among single-father households, those with 1 or 2 children have the highest poverty rate, with 36 households (19.6%) experiencing poverty. Likewise, among single-mother households, those with 3 or 4 children have the highest poverty rate, with 40 households (80.0%) falling below the poverty line.
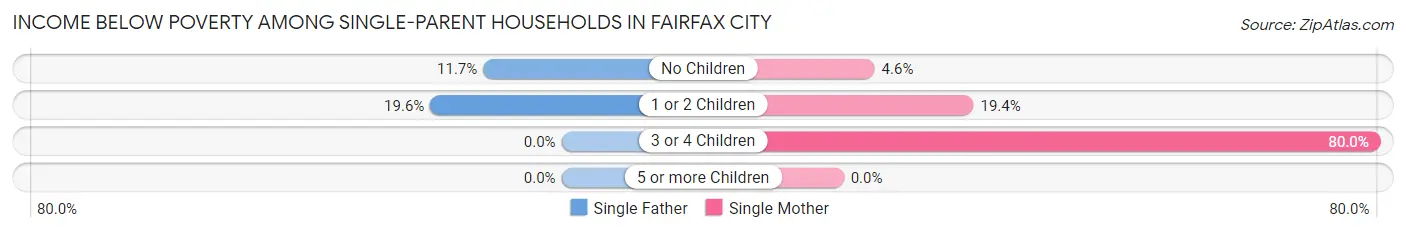
| Children | Single Father | Single Mother |
| No Children | 41 (11.7%) | 12 (4.6%) |
| 1 or 2 Children | 36 (19.6%) | 30 (19.4%) |
| 3 or 4 Children | 0 (0.0%) | 40 (80.0%) |
| 5 or more Children | 0 (0.0%) | 0 (0.0%) |
| Total | 77 (14.4%) | 82 (17.6%) |
Income Below Poverty Among Married-Couple vs Single-Parent Households in Fairfax City
The poverty data for Fairfax City shows that 190 of the married-couple family households (3.9%) and 159 of the single-parent households (15.9%) are living below the poverty level. Within the married-couple family households, those with 1 or 2 children have the highest poverty rate, with 177 households (8.7%) falling below the poverty line. Among the single-parent households, those with 3 or 4 children have the highest poverty rate, with 40 household (80.0%) living below poverty.
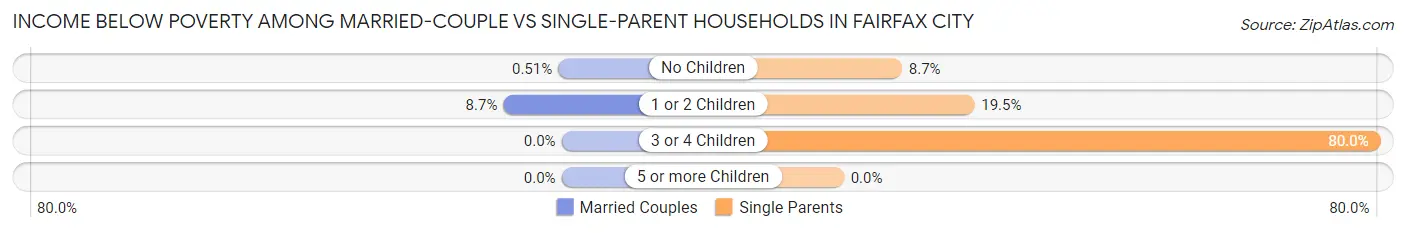
| Children | Married-Couple Families | Single-Parent Households |
| No Children | 13 (0.5%) | 53 (8.7%) |
| 1 or 2 Children | 177 (8.7%) | 66 (19.5%) |
| 3 or 4 Children | 0 (0.0%) | 40 (80.0%) |
| 5 or more Children | 0 (0.0%) | 0 (0.0%) |
| Total | 190 (3.9%) | 159 (15.9%) |
Race in Fairfax City
The most populous races in Fairfax City are White / Caucasian (14,452 | 59.6%), Hispanic or Latino (4,397 | 18.1%), and Asian (4,230 | 17.4%).
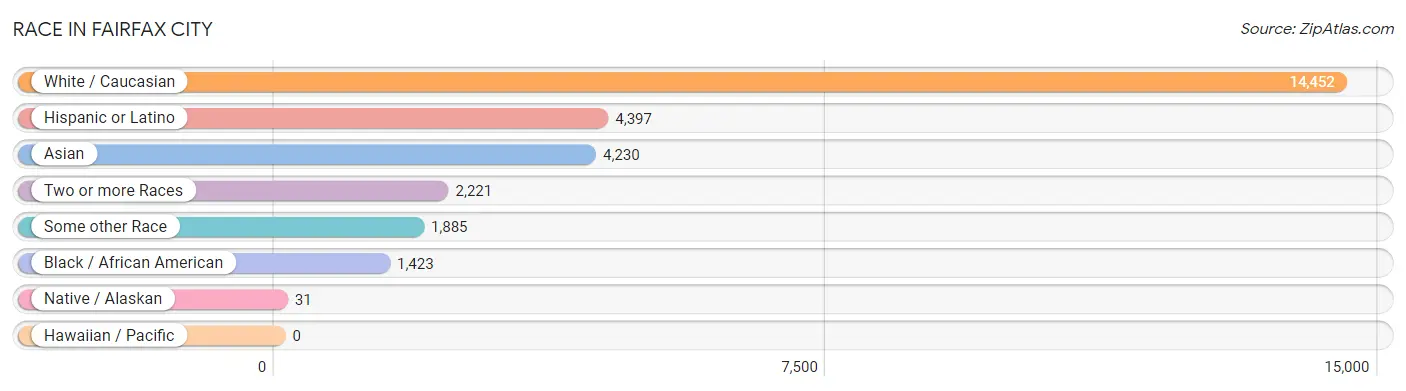
| Race | # Population | % Population |
| Asian | 4,230 | 17.4% |
| Black / African American | 1,423 | 5.9% |
| Hawaiian / Pacific | 0 | 0.0% |
| Hispanic or Latino | 4,397 | 18.1% |
| Native / Alaskan | 31 | 0.1% |
| White / Caucasian | 14,452 | 59.6% |
| Two or more Races | 2,221 | 9.2% |
| Some other Race | 1,885 | 7.8% |
| Total | 24,242 | 100.0% |
Ancestry in Fairfax City
The most populous ancestries reported in Fairfax City are English (2,710 | 11.2%), Irish (2,575 | 10.6%), German (2,520 | 10.4%), South American (1,858 | 7.7%), and Central American (1,308 | 5.4%), together accounting for 45.3% of all Fairfax City residents.
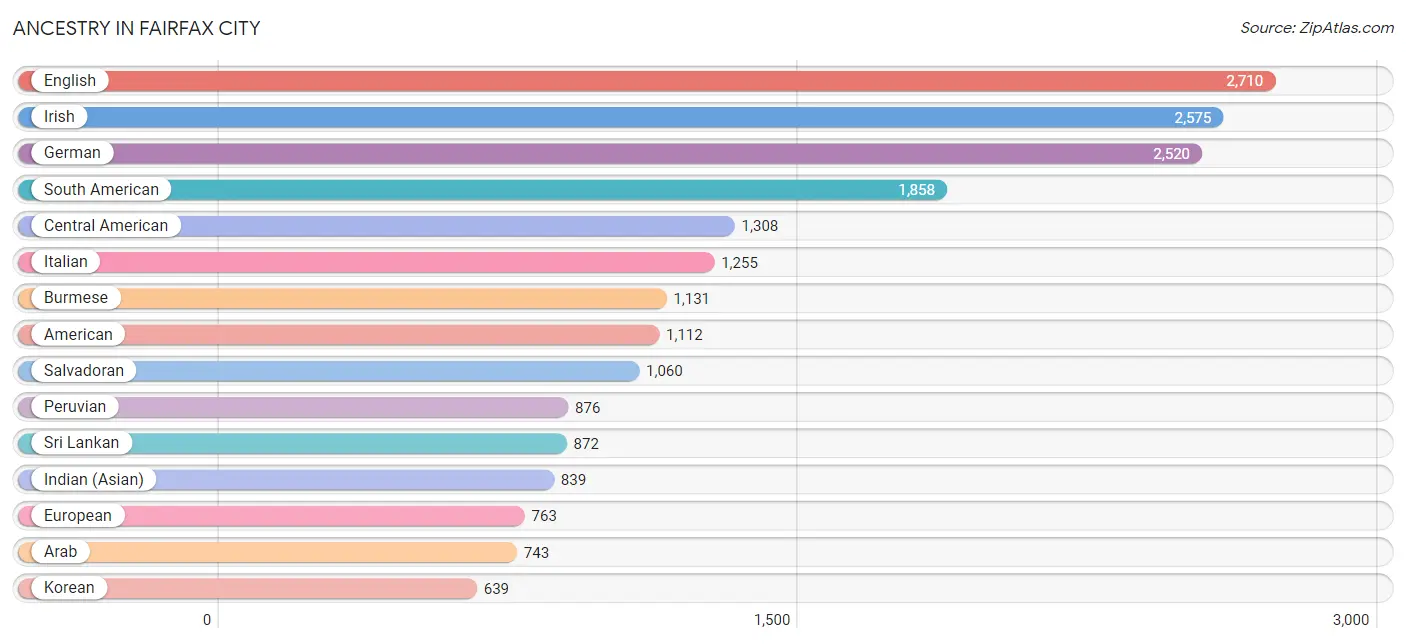
| Ancestry | # Population | % Population |
| Afghan | 186 | 0.8% |
| African | 155 | 0.6% |
| American | 1,112 | 4.6% |
| Apache | 1 | 0.0% |
| Arab | 743 | 3.1% |
| Argentinean | 304 | 1.3% |
| Armenian | 38 | 0.2% |
| Bhutanese | 56 | 0.2% |
| Bolivian | 524 | 2.2% |
| Brazilian | 40 | 0.2% |
| British | 200 | 0.8% |
| Burmese | 1,131 | 4.7% |
| Cambodian | 13 | 0.1% |
| Canadian | 16 | 0.1% |
| Central American | 1,308 | 5.4% |
| Central American Indian | 56 | 0.2% |
| Cherokee | 34 | 0.1% |
| Chilean | 94 | 0.4% |
| Colombian | 43 | 0.2% |
| Comanche | 23 | 0.1% |
| Creek | 6 | 0.0% |
| Croatian | 44 | 0.2% |
| Cuban | 7 | 0.0% |
| Czech | 18 | 0.1% |
| Czechoslovakian | 23 | 0.1% |
| Danish | 129 | 0.5% |
| Dominican | 3 | 0.0% |
| Dutch | 104 | 0.4% |
| Dutch West Indian | 10 | 0.0% |
| Eastern European | 187 | 0.8% |
| Egyptian | 235 | 1.0% |
| English | 2,710 | 11.2% |
| Ethiopian | 18 | 0.1% |
| European | 763 | 3.2% |
| Filipino | 95 | 0.4% |
| Finnish | 41 | 0.2% |
| French | 351 | 1.5% |
| French Canadian | 88 | 0.4% |
| German | 2,520 | 10.4% |
| Greek | 70 | 0.3% |
| Guamanian / Chamorro | 10 | 0.0% |
| Guatemalan | 86 | 0.4% |
| Guyanese | 19 | 0.1% |
| Honduran | 162 | 0.7% |
| Hungarian | 87 | 0.4% |
| Indian (Asian) | 839 | 3.5% |
| Iranian | 94 | 0.4% |
| Irish | 2,575 | 10.6% |
| Italian | 1,255 | 5.2% |
| Jamaican | 90 | 0.4% |
| Japanese | 66 | 0.3% |
| Kenyan | 10 | 0.0% |
| Korean | 639 | 2.6% |
| Laotian | 98 | 0.4% |
| Latvian | 121 | 0.5% |
| Lebanese | 113 | 0.5% |
| Lithuanian | 71 | 0.3% |
| Mexican | 620 | 2.6% |
| Mongolian | 11 | 0.1% |
| Navajo | 21 | 0.1% |
| Nigerian | 11 | 0.1% |
| Northern European | 23 | 0.1% |
| Norwegian | 152 | 0.6% |
| Pakistani | 79 | 0.3% |
| Palestinian | 79 | 0.3% |
| Paraguayan | 5 | 0.0% |
| Pennsylvania German | 9 | 0.0% |
| Peruvian | 876 | 3.6% |
| Polish | 468 | 1.9% |
| Portuguese | 186 | 0.8% |
| Puerto Rican | 224 | 0.9% |
| Russian | 246 | 1.0% |
| Salvadoran | 1,060 | 4.4% |
| Scandinavian | 68 | 0.3% |
| Scotch-Irish | 170 | 0.7% |
| Scottish | 543 | 2.2% |
| Serbian | 23 | 0.1% |
| Sierra Leonean | 23 | 0.1% |
| Slavic | 34 | 0.1% |
| Slovak | 96 | 0.4% |
| South African | 15 | 0.1% |
| South American | 1,858 | 7.7% |
| South American Indian | 22 | 0.1% |
| Spaniard | 121 | 0.5% |
| Spanish | 43 | 0.2% |
| Sri Lankan | 872 | 3.6% |
| Subsaharan African | 253 | 1.0% |
| Swedish | 193 | 0.8% |
| Swiss | 73 | 0.3% |
| Syrian | 32 | 0.1% |
| Thai | 622 | 2.6% |
| Turkish | 80 | 0.3% |
| Ukrainian | 56 | 0.2% |
| Venezuelan | 12 | 0.1% |
| Welsh | 181 | 0.7% |
| Yugoslavian | 21 | 0.1% | View All 96 Rows |
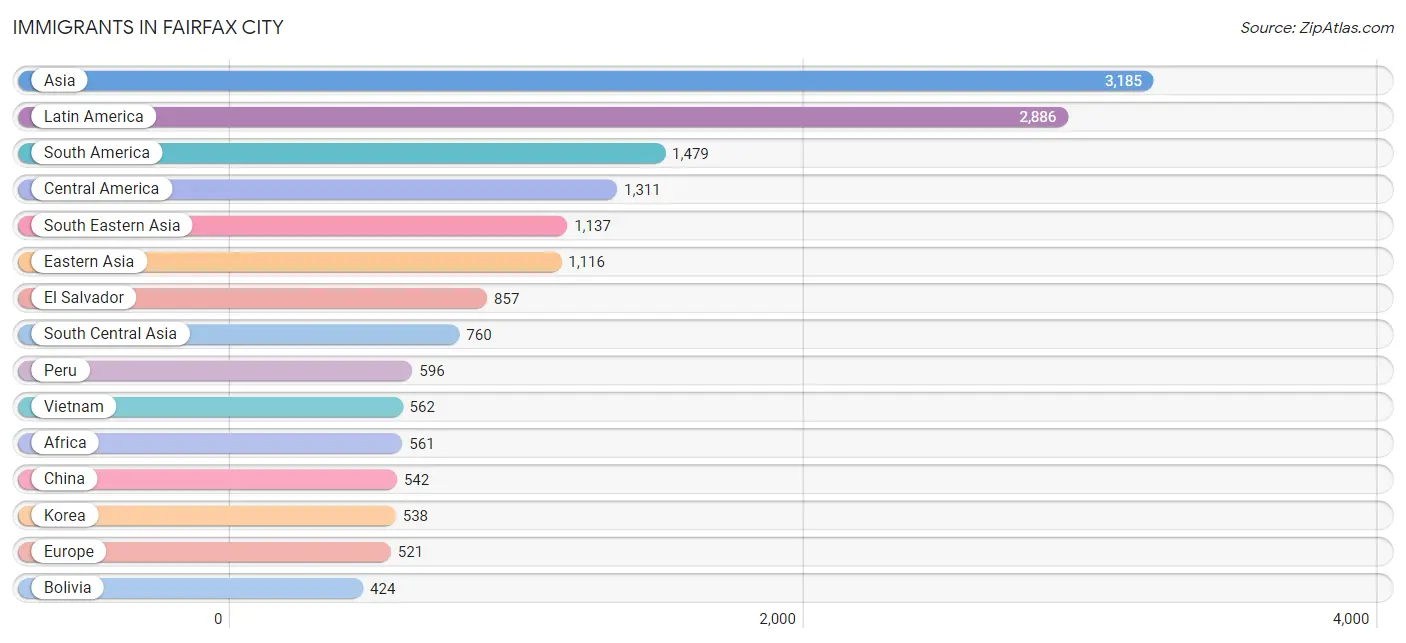
Immigrants in Fairfax City
The most numerous immigrant groups reported in Fairfax City came from Asia (3,185 | 13.1%), Latin America (2,886 | 11.9%), South America (1,479 | 6.1%), Central America (1,311 | 5.4%), and South Eastern Asia (1,137 | 4.7%), together accounting for 41.2% of all Fairfax City residents.
| Immigration Origin | # Population | % Population |
| Afghanistan | 111 | 0.5% |
| Africa | 561 | 2.3% |
| Argentina | 282 | 1.2% |
| Asia | 3,185 | 13.1% |
| Bangladesh | 12 | 0.1% |
| Barbados | 9 | 0.0% |
| Bolivia | 424 | 1.8% |
| Bosnia and Herzegovina | 21 | 0.1% |
| Brazil | 40 | 0.2% |
| Cambodia | 18 | 0.1% |
| Canada | 18 | 0.1% |
| Caribbean | 96 | 0.4% |
| Central America | 1,311 | 5.4% |
| Chile | 64 | 0.3% |
| China | 542 | 2.2% |
| Colombia | 43 | 0.2% |
| Cuba | 11 | 0.1% |
| Denmark | 9 | 0.0% |
| Dominican Republic | 17 | 0.1% |
| Eastern Africa | 103 | 0.4% |
| Eastern Asia | 1,116 | 4.6% |
| Eastern Europe | 109 | 0.4% |
| Egypt | 225 | 0.9% |
| El Salvador | 857 | 3.5% |
| England | 8 | 0.0% |
| Ethiopia | 18 | 0.1% |
| Europe | 521 | 2.1% |
| France | 24 | 0.1% |
| Germany | 50 | 0.2% |
| Guatemala | 38 | 0.2% |
| Guyana | 13 | 0.1% |
| Honduras | 112 | 0.5% |
| Hong Kong | 39 | 0.2% |
| Hungary | 13 | 0.1% |
| India | 342 | 1.4% |
| Indonesia | 84 | 0.4% |
| Iran | 107 | 0.4% |
| Ireland | 6 | 0.0% |
| Italy | 13 | 0.1% |
| Jamaica | 59 | 0.2% |
| Japan | 23 | 0.1% |
| Kazakhstan | 43 | 0.2% |
| Korea | 538 | 2.2% |
| Latin America | 2,886 | 11.9% |
| Liberia | 27 | 0.1% |
| Malaysia | 11 | 0.1% |
| Mexico | 304 | 1.3% |
| Morocco | 9 | 0.0% |
| Nepal | 79 | 0.3% |
| Netherlands | 10 | 0.0% |
| Northern Africa | 346 | 1.4% |
| Northern Europe | 192 | 0.8% |
| Norway | 10 | 0.0% |
| Pakistan | 52 | 0.2% |
| Peru | 596 | 2.5% |
| Philippines | 377 | 1.6% |
| Poland | 20 | 0.1% |
| Portugal | 109 | 0.4% |
| Russia | 10 | 0.0% |
| Saudi Arabia | 99 | 0.4% |
| Serbia | 32 | 0.1% |
| Sierra Leone | 60 | 0.3% |
| South Africa | 25 | 0.1% |
| South America | 1,479 | 6.1% |
| South Central Asia | 760 | 3.1% |
| South Eastern Asia | 1,137 | 4.7% |
| Southern Europe | 136 | 0.6% |
| Spain | 14 | 0.1% |
| Syria | 7 | 0.0% |
| Taiwan | 58 | 0.2% |
| Thailand | 85 | 0.4% |
| Turkey | 34 | 0.1% |
| Ukraine | 13 | 0.1% |
| Venezuela | 12 | 0.1% |
| Vietnam | 562 | 2.3% |
| Western Africa | 87 | 0.4% |
| Western Asia | 140 | 0.6% |
| Western Europe | 84 | 0.4% |
| Zimbabwe | 11 | 0.1% | View All 79 Rows |
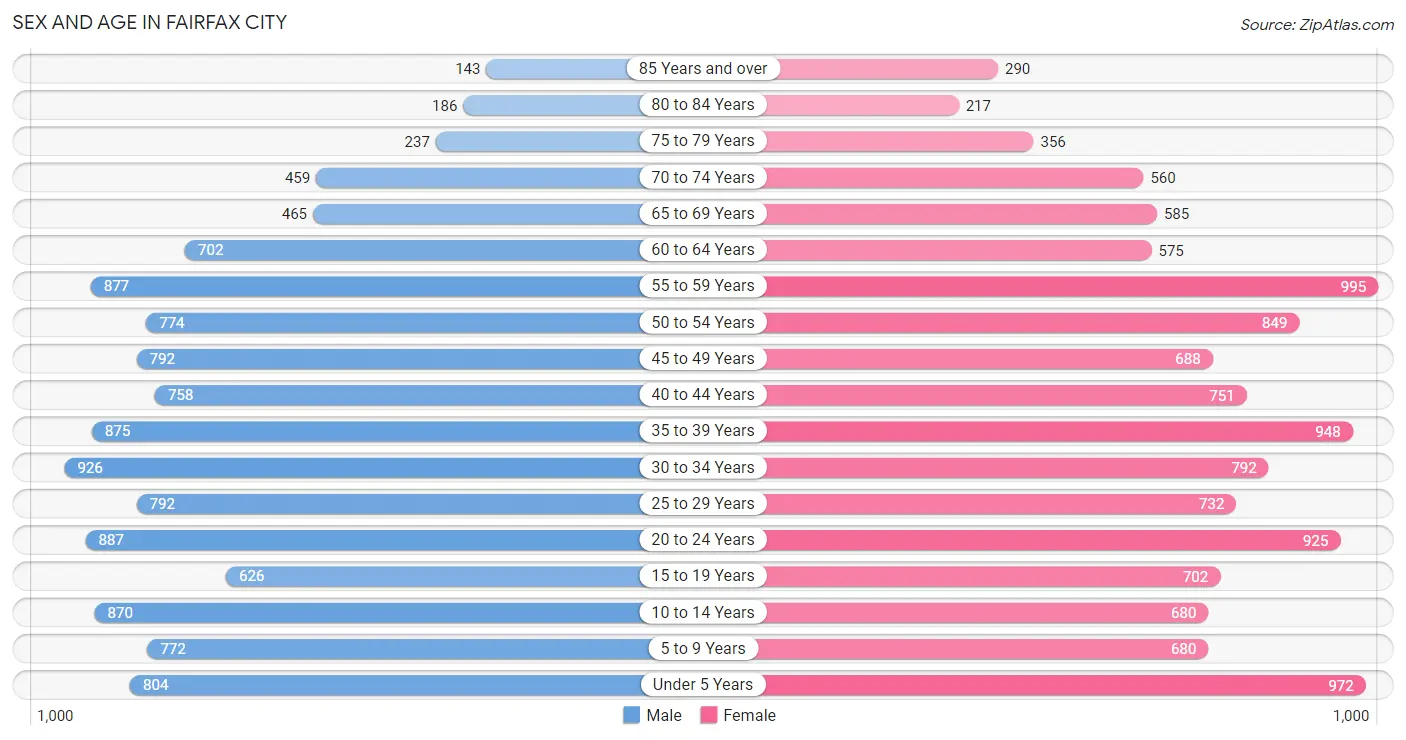
Sex and Age in Fairfax City
Sex and Age in Fairfax City
The most populous age groups in Fairfax City are 30 to 34 Years (926 | 7.7%) for men and 55 to 59 Years (995 | 8.1%) for women.
| Age Bracket | Male | Female |
| Under 5 Years | 804 (6.7%) | 972 (7.9%) |
| 5 to 9 Years | 772 (6.5%) | 680 (5.5%) |
| 10 to 14 Years | 870 (7.3%) | 680 (5.5%) |
| 15 to 19 Years | 626 (5.2%) | 702 (5.7%) |
| 20 to 24 Years | 887 (7.4%) | 925 (7.5%) |
| 25 to 29 Years | 792 (6.6%) | 732 (5.9%) |
| 30 to 34 Years | 926 (7.7%) | 792 (6.4%) |
| 35 to 39 Years | 875 (7.3%) | 948 (7.7%) |
| 40 to 44 Years | 758 (6.4%) | 751 (6.1%) |
| 45 to 49 Years | 792 (6.6%) | 688 (5.6%) |
| 50 to 54 Years | 774 (6.5%) | 849 (6.9%) |
| 55 to 59 Years | 877 (7.3%) | 995 (8.1%) |
| 60 to 64 Years | 702 (5.9%) | 575 (4.7%) |
| 65 to 69 Years | 465 (3.9%) | 585 (4.8%) |
| 70 to 74 Years | 459 (3.8%) | 560 (4.5%) |
| 75 to 79 Years | 237 (2.0%) | 356 (2.9%) |
| 80 to 84 Years | 186 (1.6%) | 217 (1.8%) |
| 85 Years and over | 143 (1.2%) | 290 (2.4%) |
| Total | 11,945 (100.0%) | 12,297 (100.0%) |
Families and Households in Fairfax City
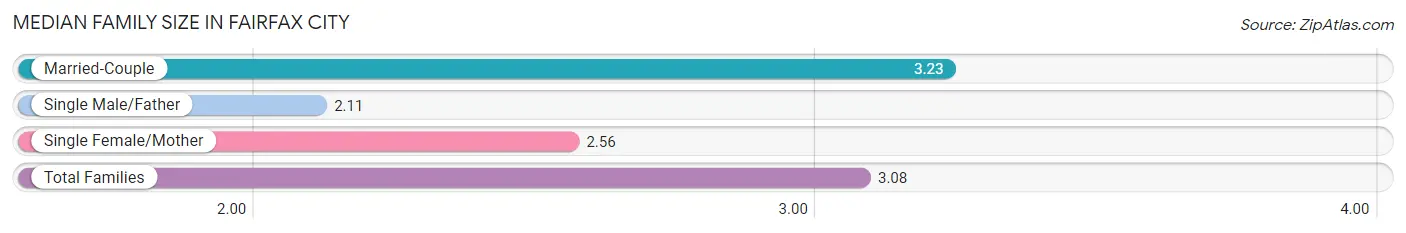
Median Family Size in Fairfax City
The median family size in Fairfax City is 3.08 persons per family, with married-couple families (4,905 | 83.1%) accounting for the largest median family size of 3.23 persons per family. On the other hand, single male/father families (535 | 9.1%) represent the smallest median family size with 2.11 persons per family.
| Family Type | # Families | Family Size |
| Married-Couple | 4,905 (83.1%) | 3.23 |
| Single Male/Father | 535 (9.1%) | 2.11 |
| Single Female/Mother | 465 (7.9%) | 2.56 |
| Total Families | 5,905 (100.0%) | 3.08 |
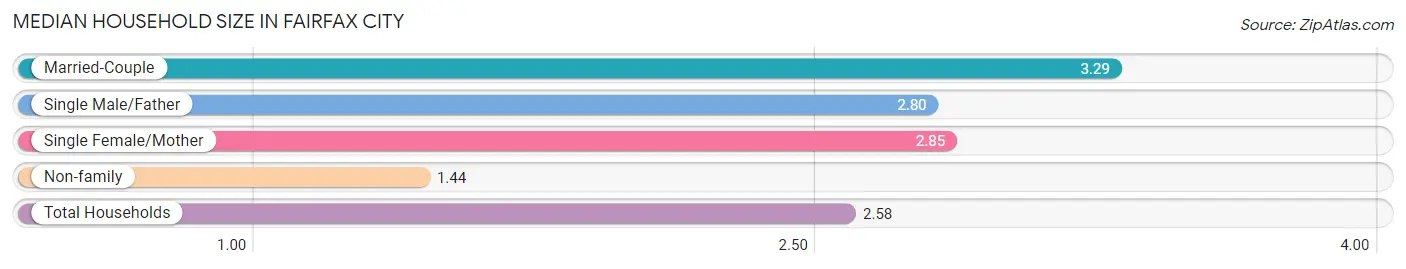
Median Household Size in Fairfax City
The median household size in Fairfax City is 2.58 persons per household, with married-couple households (4,905 | 53.7%) accounting for the largest median household size of 3.29 persons per household. non-family households (3,224 | 35.3%) represent the smallest median household size with 1.44 persons per household.
| Household Type | # Households | Household Size |
| Married-Couple | 4,905 (53.7%) | 3.29 |
| Single Male/Father | 535 (5.9%) | 2.80 |
| Single Female/Mother | 465 (5.1%) | 2.85 |
| Non-family | 3,224 (35.3%) | 1.44 |
| Total Households | 9,129 (100.0%) | 2.58 |
Household Size by Marriage Status in Fairfax City
Out of a total of 9,129 households in Fairfax City, 5,905 (64.7%) are family households, while 3,224 (35.3%) are nonfamily households. The most numerous type of family households are 2-person households, comprising 2,167, and the most common type of nonfamily households are 1-person households, comprising 2,067.
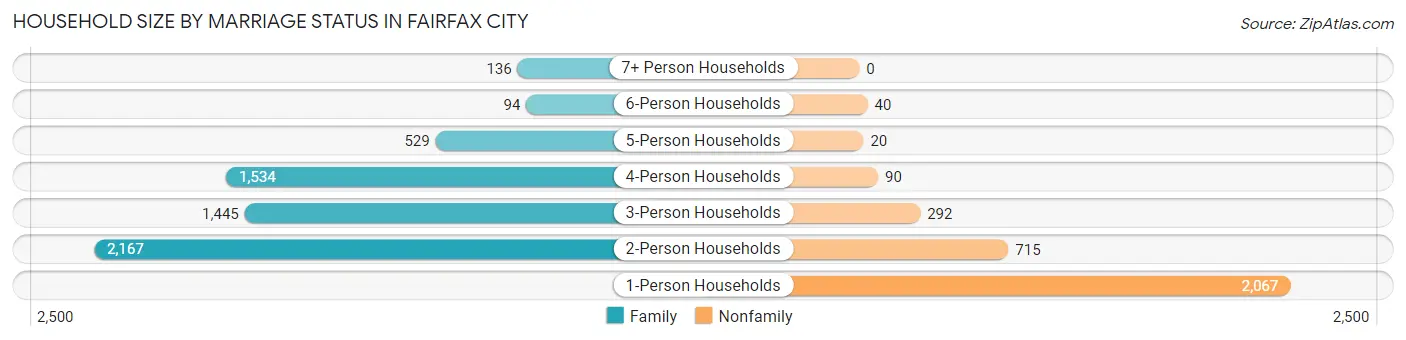
| Household Size | Family Households | Nonfamily Households |
| 1-Person Households | - | 2,067 (22.6%) |
| 2-Person Households | 2,167 (23.7%) | 715 (7.8%) |
| 3-Person Households | 1,445 (15.8%) | 292 (3.2%) |
| 4-Person Households | 1,534 (16.8%) | 90 (1.0%) |
| 5-Person Households | 529 (5.8%) | 20 (0.2%) |
| 6-Person Households | 94 (1.0%) | 40 (0.4%) |
| 7+ Person Households | 136 (1.5%) | 0 (0.0%) |
| Total | 5,905 (64.7%) | 3,224 (35.3%) |
Female Fertility in Fairfax City
Fertility by Age in Fairfax City
Average fertility rate in Fairfax City is 69.0 births per 1,000 women. Women in the age bracket of 20 to 34 years have the highest fertility rate with 78.0 births per 1,000 women. Women in the age bracket of 20 to 34 years acount for 48.7% of all women with births.
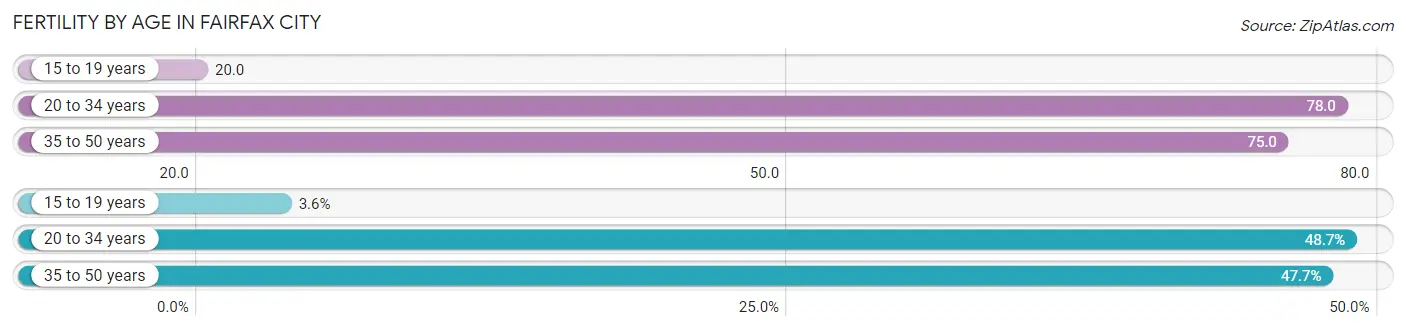
| Age Bracket | Women with Births | Births / 1,000 Women |
| 15 to 19 years | 14 (3.5%) | 20.0 |
| 20 to 34 years | 192 (48.7%) | 78.0 |
| 35 to 50 years | 188 (47.7%) | 75.0 |
| Total | 394 (100.0%) | 69.0 |
Fertility by Age by Marriage Status in Fairfax City
88.6% of women with births (394) in Fairfax City are married. The highest percentage of unmarried women with births falls into 15 to 19 years age bracket with 100.0% of them unmarried at the time of birth, while the lowest percentage of unmarried women with births belong to 35 to 50 years age bracket with 6.4% of them unmarried.
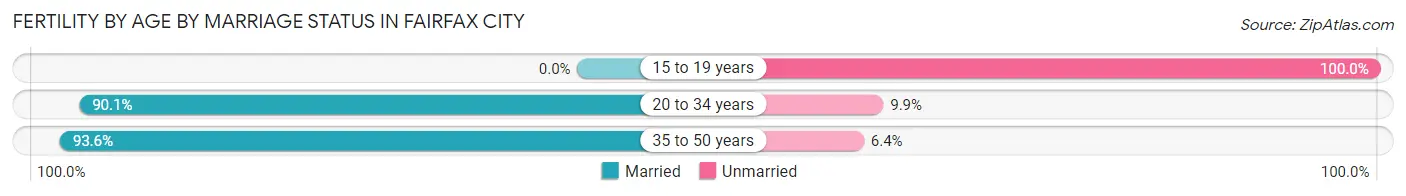
| Age Bracket | Married | Unmarried |
| 15 to 19 years | 0 (0.0%) | 14 (100.0%) |
| 20 to 34 years | 173 (90.1%) | 19 (9.9%) |
| 35 to 50 years | 176 (93.6%) | 12 (6.4%) |
| Total | 349 (88.6%) | 45 (11.4%) |
Fertility by Education in Fairfax City
Average fertility rate in Fairfax City is 69.0 births per 1,000 women. Women with the education attainment of graduate degree have the highest fertility rate of 90.0 births per 1,000 women, while women with the education attainment of college or associate's degree have the lowest fertility at 24.0 births per 1,000 women. Women with the education attainment of graduate degree represent 38.3% of all women with births.
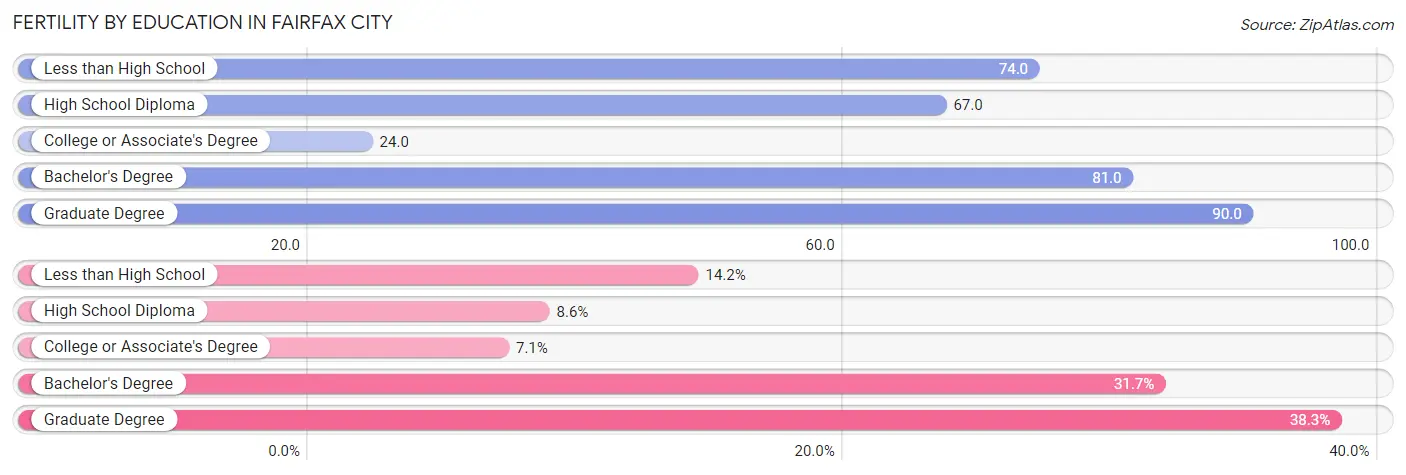
| Educational Attainment | Women with Births | Births / 1,000 Women |
| Less than High School | 56 (14.2%) | 74.0 |
| High School Diploma | 34 (8.6%) | 67.0 |
| College or Associate's Degree | 28 (7.1%) | 24.0 |
| Bachelor's Degree | 125 (31.7%) | 81.0 |
| Graduate Degree | 151 (38.3%) | 90.0 |
| Total | 394 (100.0%) | 69.0 |
Fertility by Education by Marriage Status in Fairfax City
11.4% of women with births in Fairfax City are unmarried. Women with the educational attainment of college or associate's degree are most likely to be married with 100.0% of them married at childbirth, while women with the educational attainment of less than high school are least likely to be married with 66.1% of them unmarried at childbirth.
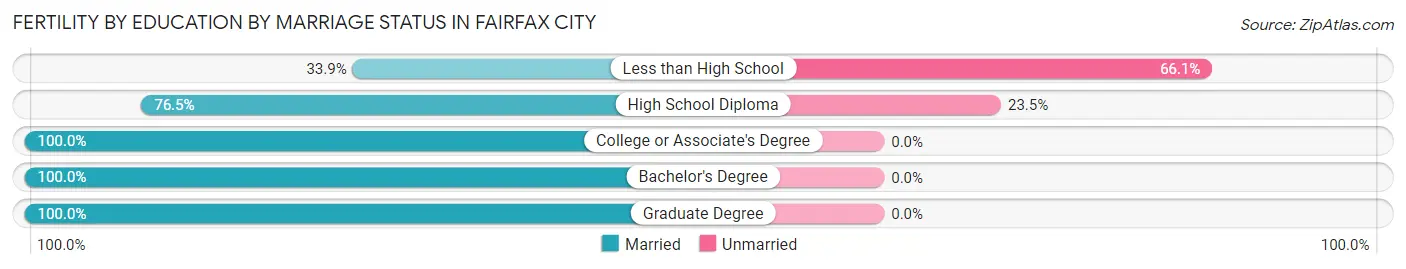
| Educational Attainment | Married | Unmarried |
| Less than High School | 19 (33.9%) | 37 (66.1%) |
| High School Diploma | 26 (76.5%) | 8 (23.5%) |
| College or Associate's Degree | 28 (100.0%) | 0 (0.0%) |
| Bachelor's Degree | 125 (100.0%) | 0 (0.0%) |
| Graduate Degree | 151 (100.0%) | 0 (0.0%) |
| Total | 349 (88.6%) | 45 (11.4%) |
Employment Characteristics in Fairfax City
Employment by Class of Employer in Fairfax City
Among the 12,943 employed individuals in Fairfax City, private company employees (8,064 | 62.3%), federal government employees (1,219 | 9.4%), and not-for-profit organizations (1,033 | 8.0%) make up the most common classes of employment.
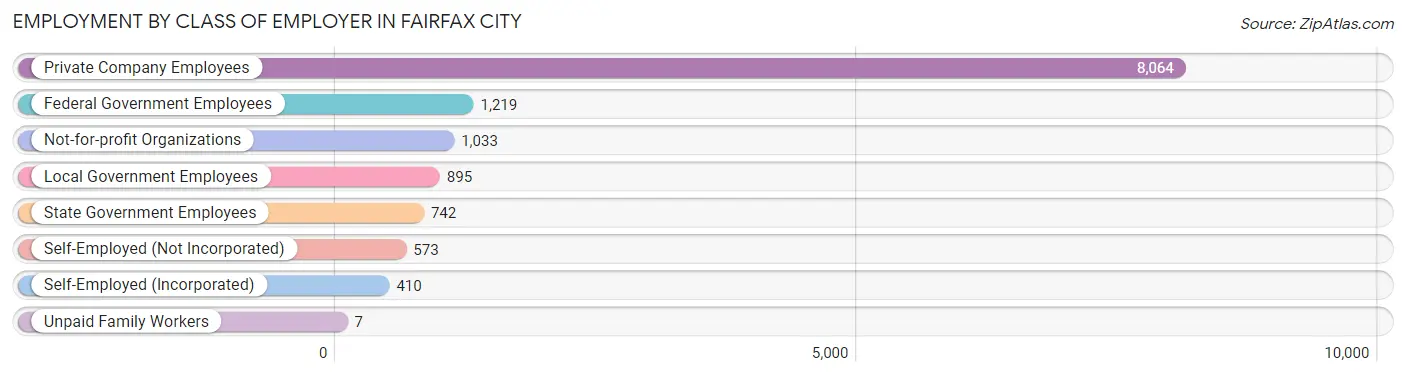
| Employer Class | # Employees | % Employees |
| Private Company Employees | 8,064 | 62.3% |
| Self-Employed (Incorporated) | 410 | 3.2% |
| Self-Employed (Not Incorporated) | 573 | 4.4% |
| Not-for-profit Organizations | 1,033 | 8.0% |
| Local Government Employees | 895 | 6.9% |
| State Government Employees | 742 | 5.7% |
| Federal Government Employees | 1,219 | 9.4% |
| Unpaid Family Workers | 7 | 0.1% |
| Total | 12,943 | 100.0% |
Employment Status by Age in Fairfax City
According to the labor force statistics for Fairfax City, out of the total population over 16 years of age (19,143), 71.5% or 13,687 individuals are in the labor force, with 3.7% or 506 of them unemployed. The age group with the highest labor force participation rate is 45 to 54 years, with 91.6% or 2,842 individuals in the labor force. Within the labor force, the 20 to 24 years age range has the highest percentage of unemployed individuals, with 13.1% or 184 of them being unemployed.
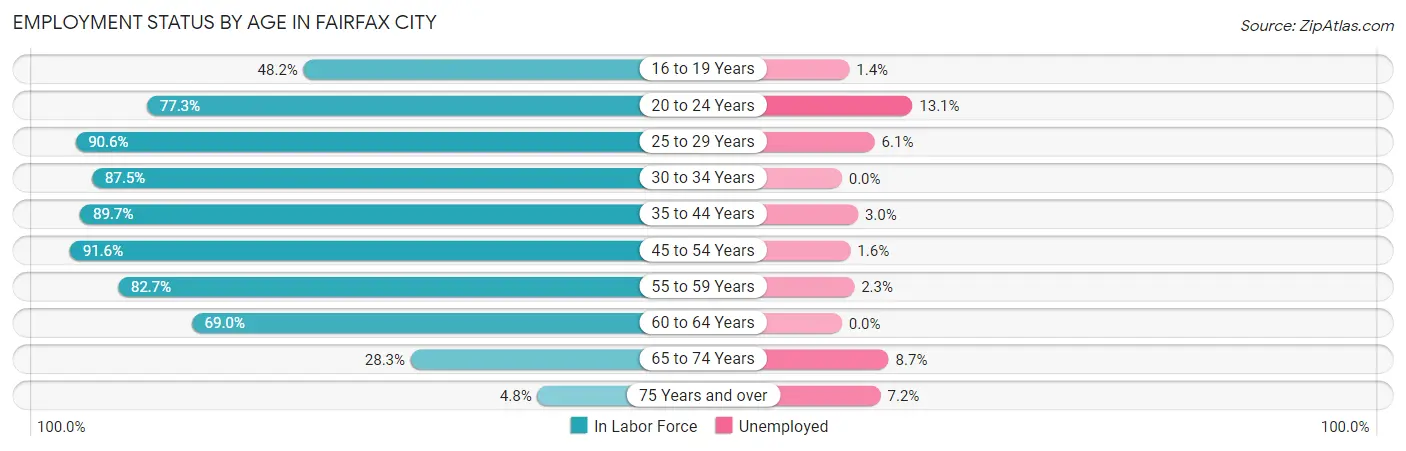
| Age Bracket | In Labor Force | Unemployed |
| 16 to 19 Years | 485 (48.2%) | 7 (1.4%) |
| 20 to 24 Years | 1,401 (77.3%) | 184 (13.1%) |
| 25 to 29 Years | 1,381 (90.6%) | 84 (6.1%) |
| 30 to 34 Years | 1,503 (87.5%) | 0 (0.0%) |
| 35 to 44 Years | 2,989 (89.7%) | 90 (3.0%) |
| 45 to 54 Years | 2,842 (91.6%) | 45 (1.6%) |
| 55 to 59 Years | 1,548 (82.7%) | 36 (2.3%) |
| 60 to 64 Years | 881 (69.0%) | 0 (0.0%) |
| 65 to 74 Years | 586 (28.3%) | 51 (8.7%) |
| 75 Years and over | 69 (4.8%) | 5 (7.2%) |
| Total | 13,687 (71.5%) | 506 (3.7%) |
Employment Status by Educational Attainment in Fairfax City
According to labor force statistics for Fairfax City, 86.9% of individuals (11,146) out of the total population between 25 and 64 years of age (12,826) are in the labor force, with 2.3% or 256 of them being unemployed. The group with the highest labor force participation rate are those with the educational attainment of bachelor's degree or higher, with 88.3% or 7,080 individuals in the labor force. Within the labor force, individuals with college / associate degree education have the highest percentage of unemployment, with 4.5% or 85 of them being unemployed.
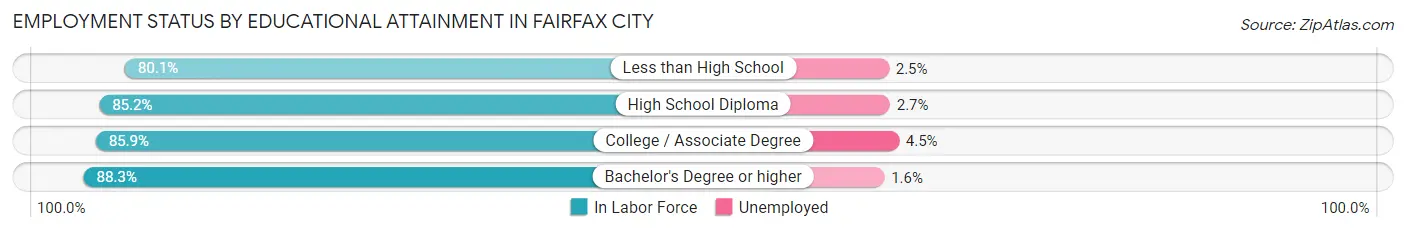
| Educational Attainment | In Labor Force | Unemployed |
| Less than High School | 761 (80.1%) | 24 (2.5%) |
| High School Diploma | 1,413 (85.2%) | 45 (2.7%) |
| College / Associate Degree | 1,889 (85.9%) | 99 (4.5%) |
| Bachelor's Degree or higher | 7,080 (88.3%) | 128 (1.6%) |
| Total | 11,146 (86.9%) | 295 (2.3%) |
Employment Occupations by Sex in Fairfax City
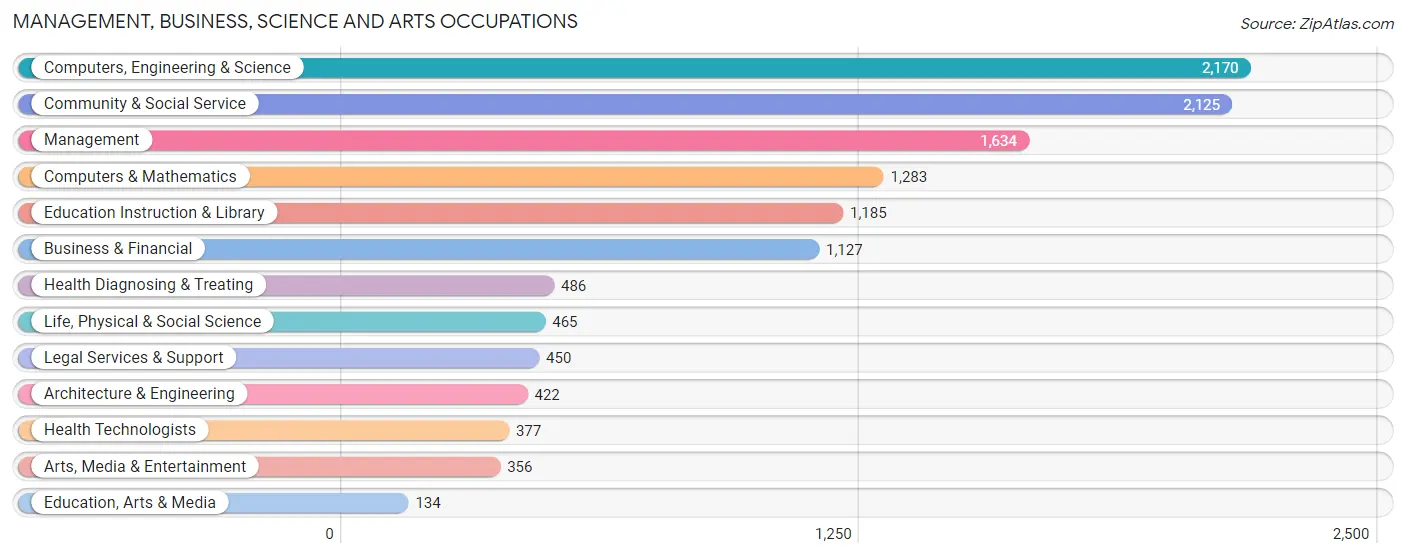
Management, Business, Science and Arts Occupations
The most common Management, Business, Science and Arts occupations in Fairfax City are Computers, Engineering & Science (2,170 | 16.5%), Community & Social Service (2,125 | 16.2%), Management (1,634 | 12.4%), Computers & Mathematics (1,283 | 9.8%), and Education Instruction & Library (1,185 | 9.0%).
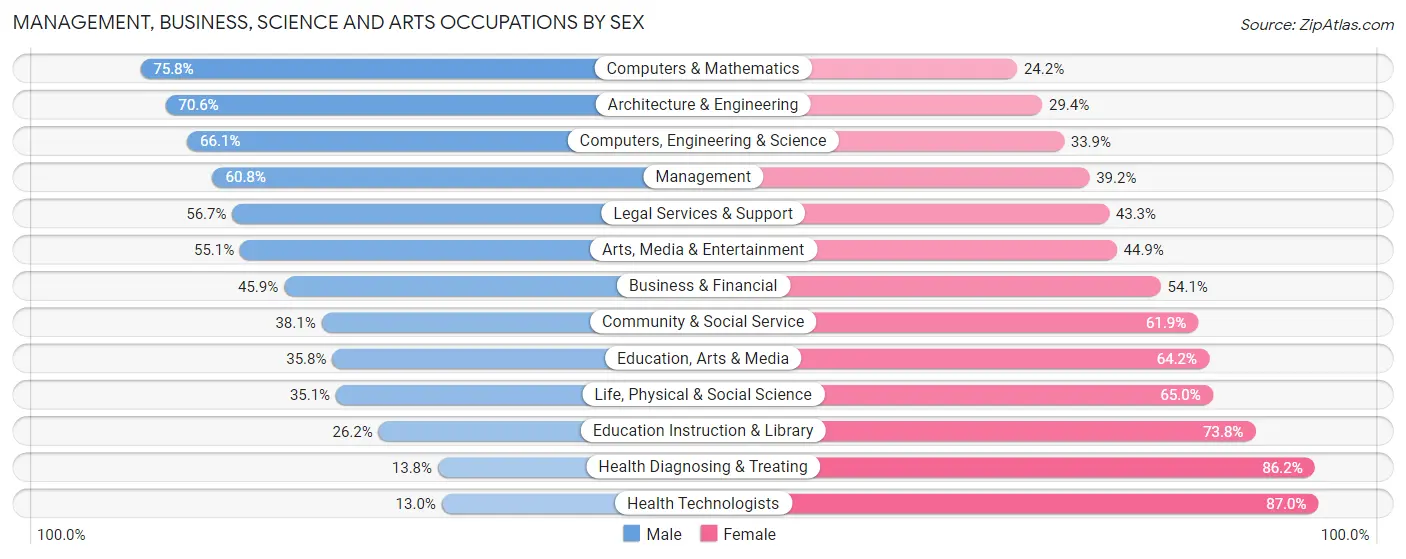
Management, Business, Science and Arts Occupations by Sex
Within the Management, Business, Science and Arts occupations in Fairfax City, the most male-oriented occupations are Computers & Mathematics (75.8%), Architecture & Engineering (70.6%), and Computers, Engineering & Science (66.1%), while the most female-oriented occupations are Health Technologists (87.0%), Health Diagnosing & Treating (86.2%), and Education Instruction & Library (73.8%).
| Occupation | Male | Female |
| Management | 993 (60.8%) | 641 (39.2%) |
| Business & Financial | 517 (45.9%) | 610 (54.1%) |
| Computers, Engineering & Science | 1,434 (66.1%) | 736 (33.9%) |
| Computers & Mathematics | 973 (75.8%) | 310 (24.2%) |
| Architecture & Engineering | 298 (70.6%) | 124 (29.4%) |
| Life, Physical & Social Science | 163 (35.0%) | 302 (64.9%) |
| Community & Social Service | 809 (38.1%) | 1,316 (61.9%) |
| Education, Arts & Media | 48 (35.8%) | 86 (64.2%) |
| Legal Services & Support | 255 (56.7%) | 195 (43.3%) |
| Education Instruction & Library | 310 (26.2%) | 875 (73.8%) |
| Arts, Media & Entertainment | 196 (55.1%) | 160 (44.9%) |
| Health Diagnosing & Treating | 67 (13.8%) | 419 (86.2%) |
| Health Technologists | 49 (13.0%) | 328 (87.0%) |
| Total (Category) | 3,820 (50.6%) | 3,722 (49.3%) |
| Total (Overall) | 7,034 (53.5%) | 6,103 (46.5%) |
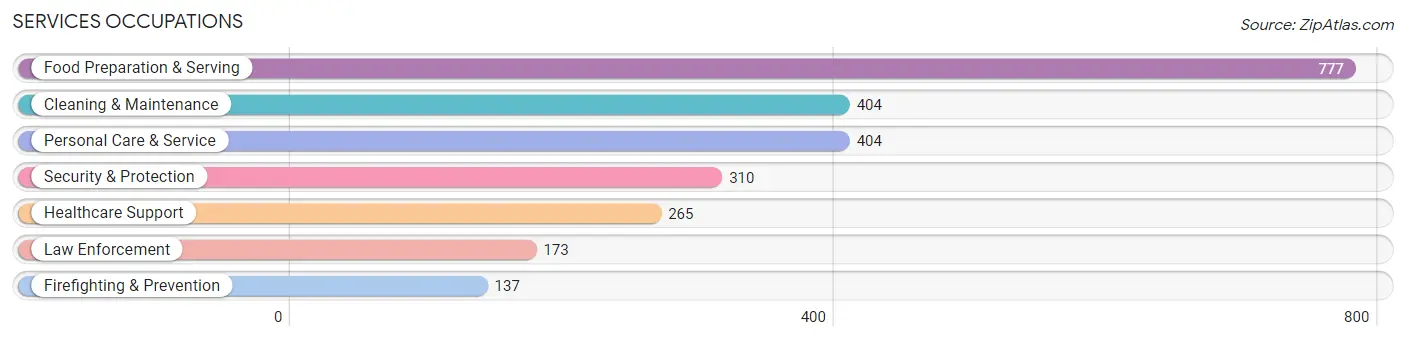
Services Occupations
The most common Services occupations in Fairfax City are Food Preparation & Serving (777 | 5.9%), Cleaning & Maintenance (404 | 3.1%), Personal Care & Service (404 | 3.1%), Security & Protection (310 | 2.4%), and Healthcare Support (265 | 2.0%).
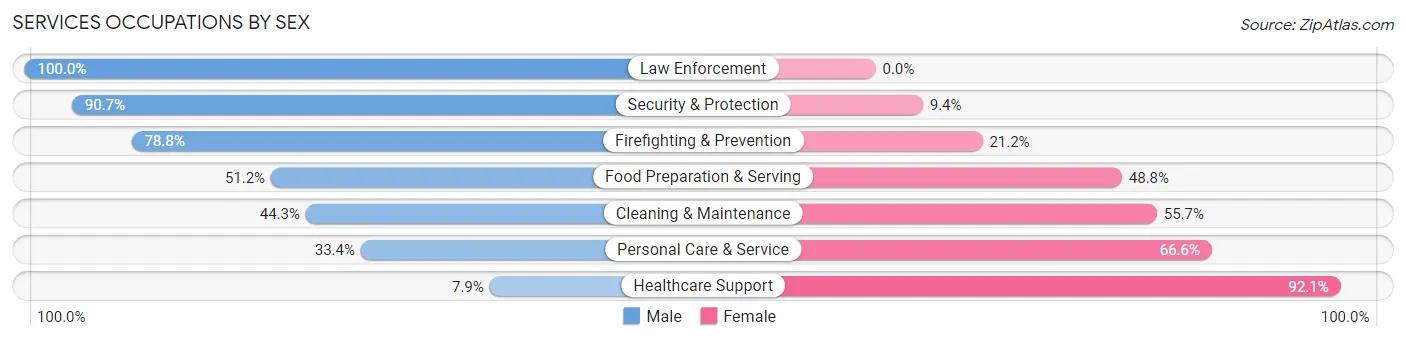
Services Occupations by Sex
Within the Services occupations in Fairfax City, the most male-oriented occupations are Law Enforcement (100.0%), Security & Protection (90.6%), and Firefighting & Prevention (78.8%), while the most female-oriented occupations are Healthcare Support (92.1%), Personal Care & Service (66.6%), and Cleaning & Maintenance (55.7%).
| Occupation | Male | Female |
| Healthcare Support | 21 (7.9%) | 244 (92.1%) |
| Security & Protection | 281 (90.6%) | 29 (9.3%) |
| Firefighting & Prevention | 108 (78.8%) | 29 (21.2%) |
| Law Enforcement | 173 (100.0%) | 0 (0.0%) |
| Food Preparation & Serving | 398 (51.2%) | 379 (48.8%) |
| Cleaning & Maintenance | 179 (44.3%) | 225 (55.7%) |
| Personal Care & Service | 135 (33.4%) | 269 (66.6%) |
| Total (Category) | 1,014 (46.9%) | 1,146 (53.1%) |
| Total (Overall) | 7,034 (53.5%) | 6,103 (46.5%) |
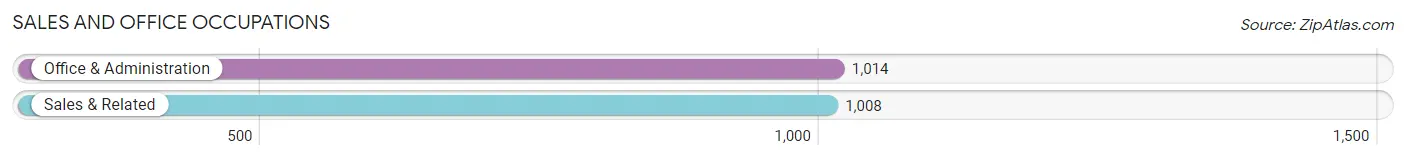
Sales and Office Occupations
The most common Sales and Office occupations in Fairfax City are Office & Administration (1,014 | 7.7%), and Sales & Related (1,008 | 7.7%).
Sales and Office Occupations by Sex
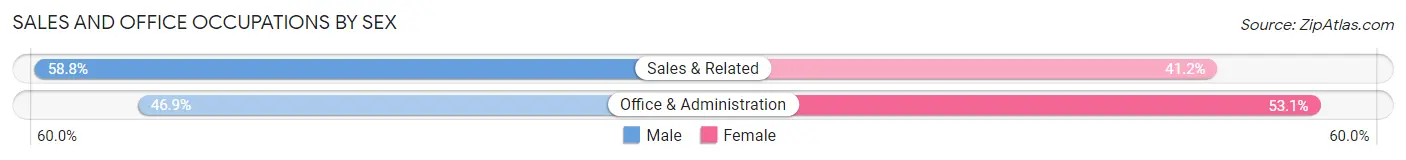
| Occupation | Male | Female |
| Sales & Related | 593 (58.8%) | 415 (41.2%) |
| Office & Administration | 476 (46.9%) | 538 (53.1%) |
| Total (Category) | 1,069 (52.9%) | 953 (47.1%) |
| Total (Overall) | 7,034 (53.5%) | 6,103 (46.5%) |
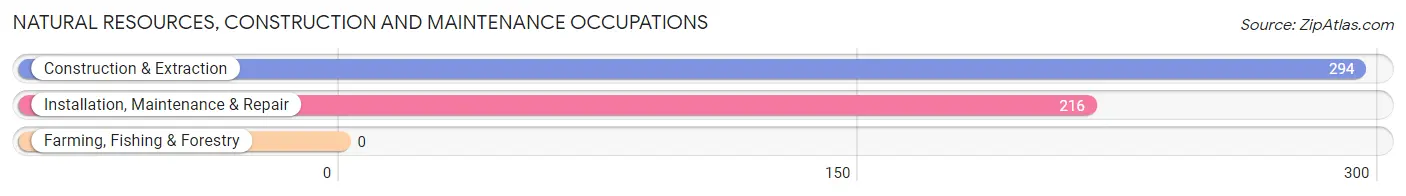
Natural Resources, Construction and Maintenance Occupations
The most common Natural Resources, Construction and Maintenance occupations in Fairfax City are Construction & Extraction (294 | 2.2%), and Installation, Maintenance & Repair (216 | 1.6%).
Natural Resources, Construction and Maintenance Occupations by Sex
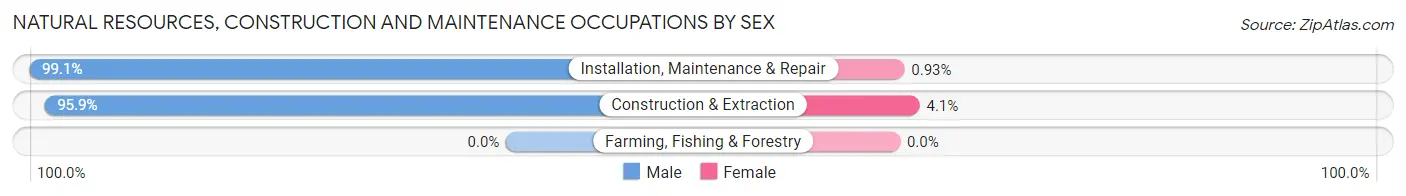
| Occupation | Male | Female |
| Farming, Fishing & Forestry | 0 (0.0%) | 0 (0.0%) |
| Construction & Extraction | 282 (95.9%) | 12 (4.1%) |
| Installation, Maintenance & Repair | 214 (99.1%) | 2 (0.9%) |
| Total (Category) | 496 (97.3%) | 14 (2.8%) |
| Total (Overall) | 7,034 (53.5%) | 6,103 (46.5%) |
Production, Transportation and Moving Occupations
The most common Production, Transportation and Moving occupations in Fairfax City are Transportation (358 | 2.7%), Production (345 | 2.6%), and Material Moving (200 | 1.5%).
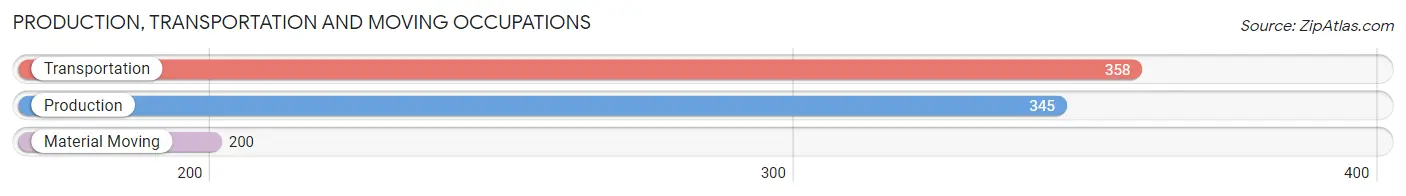
Production, Transportation and Moving Occupations by Sex
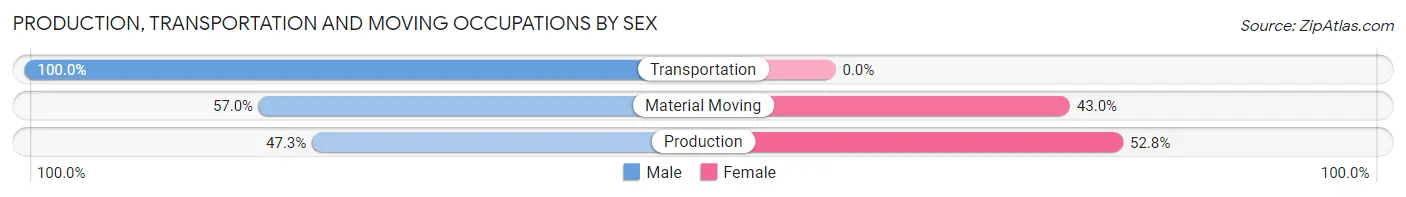
| Occupation | Male | Female |
| Production | 163 (47.2%) | 182 (52.7%) |
| Transportation | 358 (100.0%) | 0 (0.0%) |
| Material Moving | 114 (57.0%) | 86 (43.0%) |
| Total (Category) | 635 (70.3%) | 268 (29.7%) |
| Total (Overall) | 7,034 (53.5%) | 6,103 (46.5%) |
Employment Industries by Sex in Fairfax City
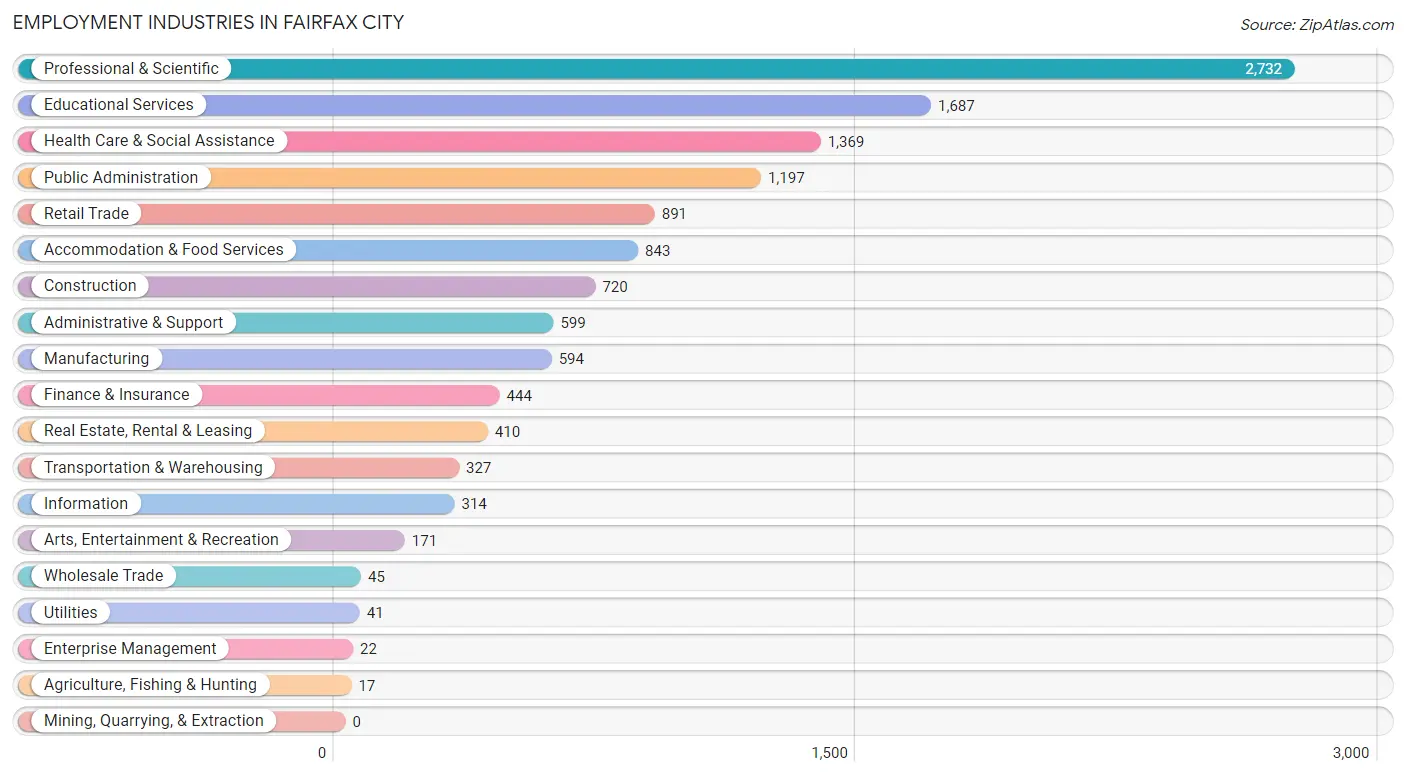
Employment Industries in Fairfax City
The major employment industries in Fairfax City include Professional & Scientific (2,732 | 20.8%), Educational Services (1,687 | 12.8%), Health Care & Social Assistance (1,369 | 10.4%), Public Administration (1,197 | 9.1%), and Retail Trade (891 | 6.8%).
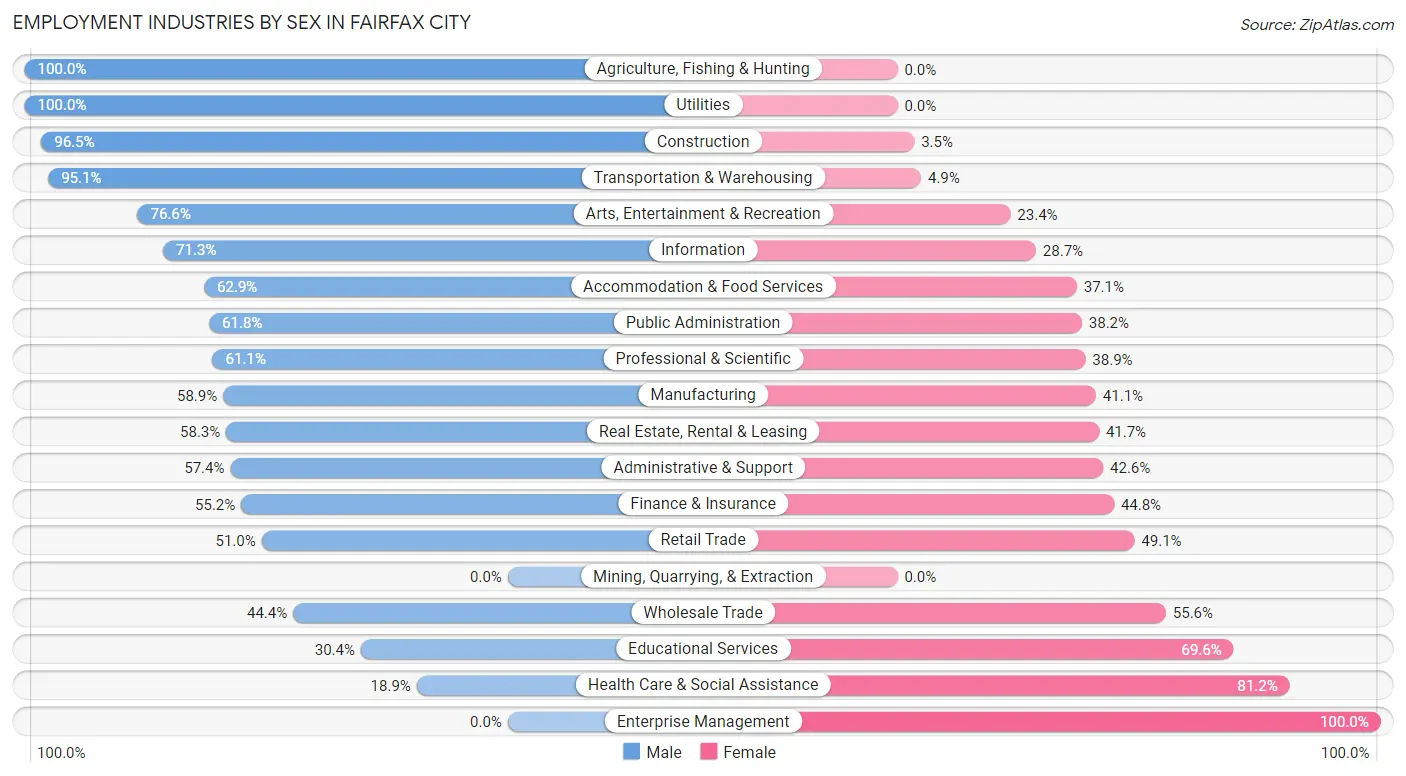
Employment Industries by Sex in Fairfax City
The Fairfax City industries that see more men than women are Agriculture, Fishing & Hunting (100.0%), Utilities (100.0%), and Construction (96.5%), whereas the industries that tend to have a higher number of women are Enterprise Management (100.0%), Health Care & Social Assistance (81.1%), and Educational Services (69.6%).
| Industry | Male | Female |
| Agriculture, Fishing & Hunting | 17 (100.0%) | 0 (0.0%) |
| Mining, Quarrying, & Extraction | 0 (0.0%) | 0 (0.0%) |
| Construction | 695 (96.5%) | 25 (3.5%) |
| Manufacturing | 350 (58.9%) | 244 (41.1%) |
| Wholesale Trade | 20 (44.4%) | 25 (55.6%) |
| Retail Trade | 454 (50.9%) | 437 (49.0%) |
| Transportation & Warehousing | 311 (95.1%) | 16 (4.9%) |
| Utilities | 41 (100.0%) | 0 (0.0%) |
| Information | 224 (71.3%) | 90 (28.7%) |
| Finance & Insurance | 245 (55.2%) | 199 (44.8%) |
| Real Estate, Rental & Leasing | 239 (58.3%) | 171 (41.7%) |
| Professional & Scientific | 1,669 (61.1%) | 1,063 (38.9%) |
| Enterprise Management | 0 (0.0%) | 22 (100.0%) |
| Administrative & Support | 344 (57.4%) | 255 (42.6%) |
| Educational Services | 513 (30.4%) | 1,174 (69.6%) |
| Health Care & Social Assistance | 258 (18.9%) | 1,111 (81.1%) |
| Arts, Entertainment & Recreation | 131 (76.6%) | 40 (23.4%) |
| Accommodation & Food Services | 530 (62.9%) | 313 (37.1%) |
| Public Administration | 740 (61.8%) | 457 (38.2%) |
| Total | 7,034 (53.5%) | 6,103 (46.5%) |
Education in Fairfax City
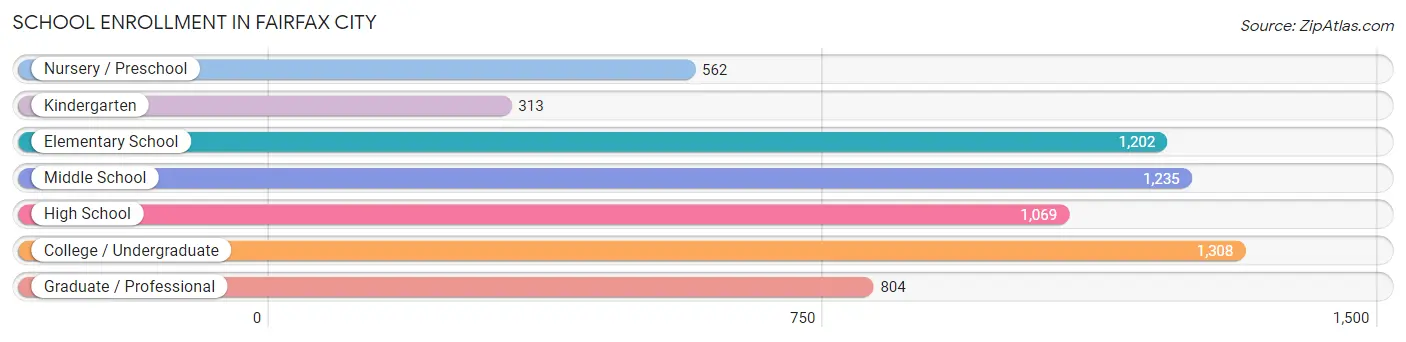
School Enrollment in Fairfax City
The most common levels of schooling among the 6,493 students in Fairfax City are college / undergraduate (1,308 | 20.1%), middle school (1,235 | 19.0%), and elementary school (1,202 | 18.5%).
| School Level | # Students | % Students |
| Nursery / Preschool | 562 | 8.7% |
| Kindergarten | 313 | 4.8% |
| Elementary School | 1,202 | 18.5% |
| Middle School | 1,235 | 19.0% |
| High School | 1,069 | 16.5% |
| College / Undergraduate | 1,308 | 20.1% |
| Graduate / Professional | 804 | 12.4% |
| Total | 6,493 | 100.0% |
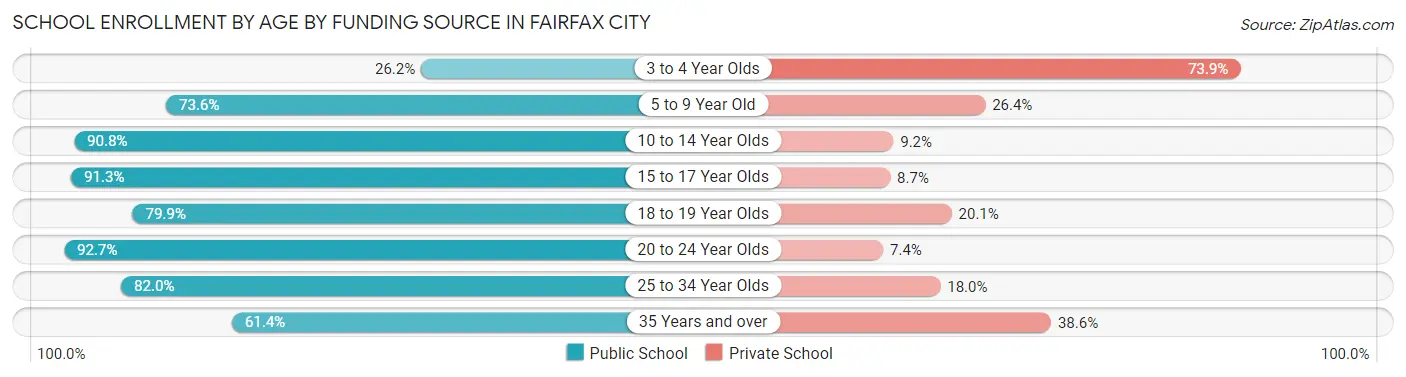
School Enrollment by Age by Funding Source in Fairfax City
Out of a total of 6,493 students who are enrolled in schools in Fairfax City, 1,325 (20.4%) attend a private institution, while the remaining 5,168 (79.6%) are enrolled in public schools. The age group of 3 to 4 year olds has the highest likelihood of being enrolled in private schools, with 336 (73.9% in the age bracket) enrolled. Conversely, the age group of 20 to 24 year olds has the lowest likelihood of being enrolled in a private school, with 958 (92.6% in the age bracket) attending a public institution.
| Age Bracket | Public School | Private School |
| 3 to 4 Year Olds | 119 (26.2%) | 336 (73.9%) |
| 5 to 9 Year Old | 1,025 (73.6%) | 367 (26.4%) |
| 10 to 14 Year Olds | 1,395 (90.8%) | 142 (9.2%) |
| 15 to 17 Year Olds | 749 (91.3%) | 71 (8.7%) |
| 18 to 19 Year Olds | 278 (79.9%) | 70 (20.1%) |
| 20 to 24 Year Olds | 958 (92.6%) | 76 (7.3%) |
| 25 to 34 Year Olds | 351 (82.0%) | 77 (18.0%) |
| 35 Years and over | 294 (61.4%) | 185 (38.6%) |
| Total | 5,168 (79.6%) | 1,325 (20.4%) |
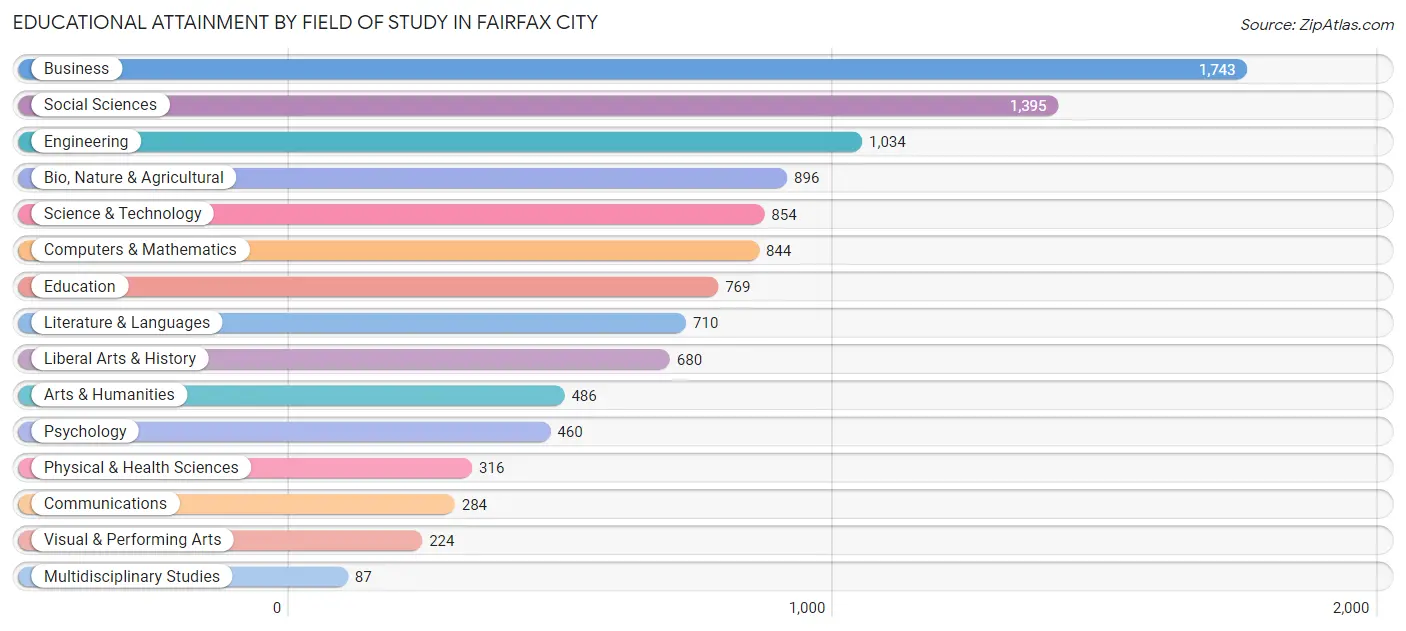
Educational Attainment by Field of Study in Fairfax City
Business (1,743 | 16.2%), social sciences (1,395 | 12.9%), engineering (1,034 | 9.6%), bio, nature & agricultural (896 | 8.3%), and science & technology (854 | 7.9%) are the most common fields of study among 10,782 individuals in Fairfax City who have obtained a bachelor's degree or higher.
| Field of Study | # Graduates | % Graduates |
| Computers & Mathematics | 844 | 7.8% |
| Bio, Nature & Agricultural | 896 | 8.3% |
| Physical & Health Sciences | 316 | 2.9% |
| Psychology | 460 | 4.3% |
| Social Sciences | 1,395 | 12.9% |
| Engineering | 1,034 | 9.6% |
| Multidisciplinary Studies | 87 | 0.8% |
| Science & Technology | 854 | 7.9% |
| Business | 1,743 | 16.2% |
| Education | 769 | 7.1% |
| Literature & Languages | 710 | 6.6% |
| Liberal Arts & History | 680 | 6.3% |
| Visual & Performing Arts | 224 | 2.1% |
| Communications | 284 | 2.6% |
| Arts & Humanities | 486 | 4.5% |
| Total | 10,782 | 100.0% |
Transportation & Commute in Fairfax City
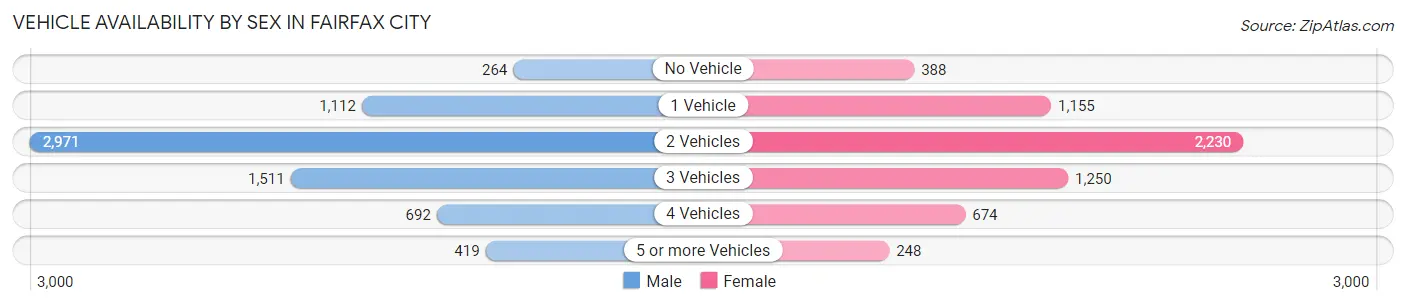
Vehicle Availability by Sex in Fairfax City
The most prevalent vehicle ownership categories in Fairfax City are males with 2 vehicles (2,971, accounting for 42.6%) and females with 2 vehicles (2,230, making up 50.0%).
| Vehicles Available | Male | Female |
| No Vehicle | 264 (3.8%) | 388 (6.5%) |
| 1 Vehicle | 1,112 (16.0%) | 1,155 (19.4%) |
| 2 Vehicles | 2,971 (42.6%) | 2,230 (37.5%) |
| 3 Vehicles | 1,511 (21.7%) | 1,250 (21.0%) |
| 4 Vehicles | 692 (9.9%) | 674 (11.3%) |
| 5 or more Vehicles | 419 (6.0%) | 248 (4.2%) |
| Total | 6,969 (100.0%) | 5,945 (100.0%) |
Commute Time in Fairfax City
The most frequently occuring commute durations in Fairfax City are 30 to 34 minutes (2,135 commuters, 20.7%), 20 to 24 minutes (1,240 commuters, 12.0%), and 45 to 59 minutes (1,230 commuters, 11.9%).
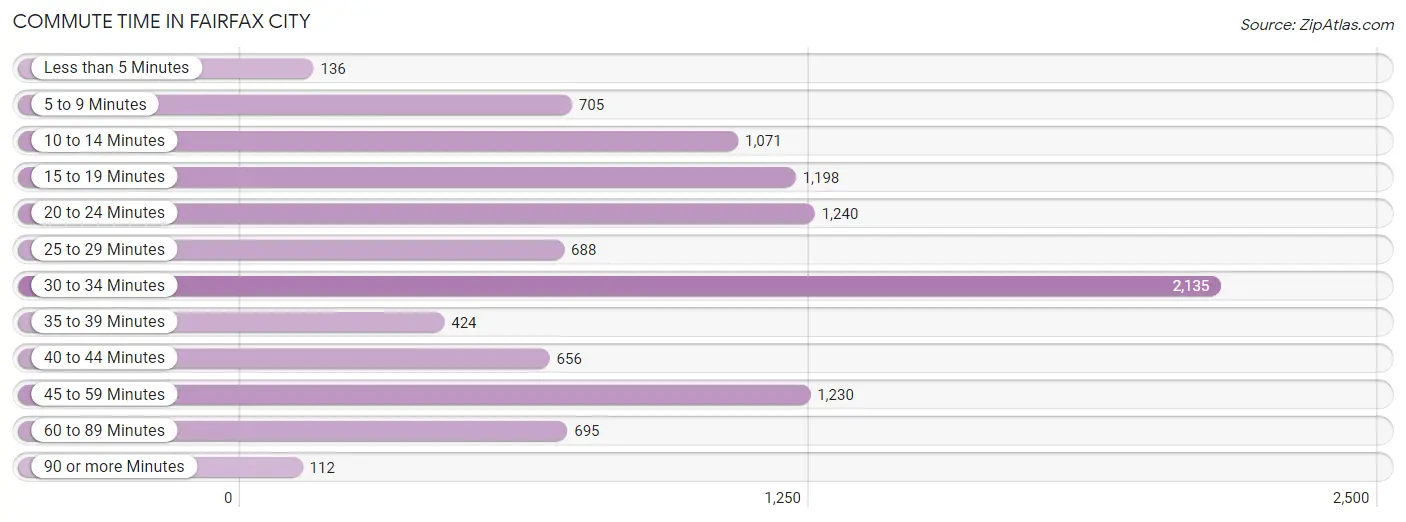
| Commute Time | # Commuters | % Commuters |
| Less than 5 Minutes | 136 | 1.3% |
| 5 to 9 Minutes | 705 | 6.9% |
| 10 to 14 Minutes | 1,071 | 10.4% |
| 15 to 19 Minutes | 1,198 | 11.6% |
| 20 to 24 Minutes | 1,240 | 12.0% |
| 25 to 29 Minutes | 688 | 6.7% |
| 30 to 34 Minutes | 2,135 | 20.7% |
| 35 to 39 Minutes | 424 | 4.1% |
| 40 to 44 Minutes | 656 | 6.4% |
| 45 to 59 Minutes | 1,230 | 11.9% |
| 60 to 89 Minutes | 695 | 6.8% |
| 90 or more Minutes | 112 | 1.1% |
Commute Time by Sex in Fairfax City
The most common commute times in Fairfax City are 30 to 34 minutes (1,337 commuters, 24.1%) for males and 30 to 34 minutes (798 commuters, 16.8%) for females.
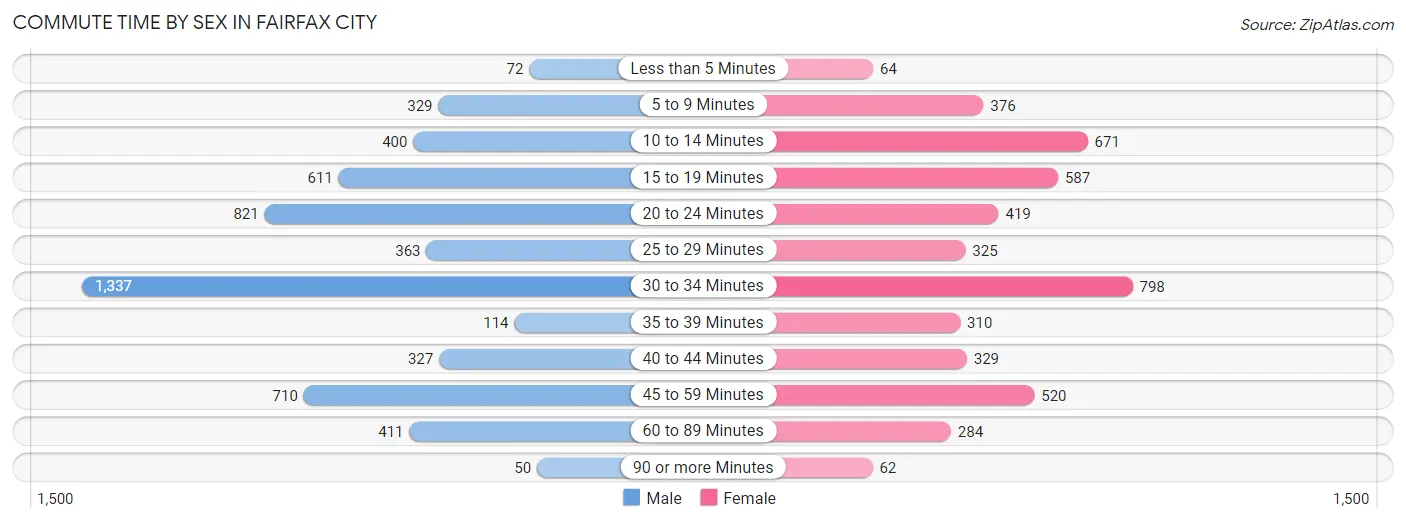
| Commute Time | Male | Female |
| Less than 5 Minutes | 72 (1.3%) | 64 (1.3%) |
| 5 to 9 Minutes | 329 (5.9%) | 376 (7.9%) |
| 10 to 14 Minutes | 400 (7.2%) | 671 (14.1%) |
| 15 to 19 Minutes | 611 (11.0%) | 587 (12.4%) |
| 20 to 24 Minutes | 821 (14.8%) | 419 (8.8%) |
| 25 to 29 Minutes | 363 (6.6%) | 325 (6.9%) |
| 30 to 34 Minutes | 1,337 (24.1%) | 798 (16.8%) |
| 35 to 39 Minutes | 114 (2.1%) | 310 (6.5%) |
| 40 to 44 Minutes | 327 (5.9%) | 329 (6.9%) |
| 45 to 59 Minutes | 710 (12.8%) | 520 (11.0%) |
| 60 to 89 Minutes | 411 (7.4%) | 284 (6.0%) |
| 90 or more Minutes | 50 (0.9%) | 62 (1.3%) |
Time of Departure to Work by Sex in Fairfax City
The most frequent times of departure to work in Fairfax City are 7:30 AM to 7:59 AM (724, 13.1%) for males and 8:00 AM to 8:29 AM (829, 17.5%) for females.
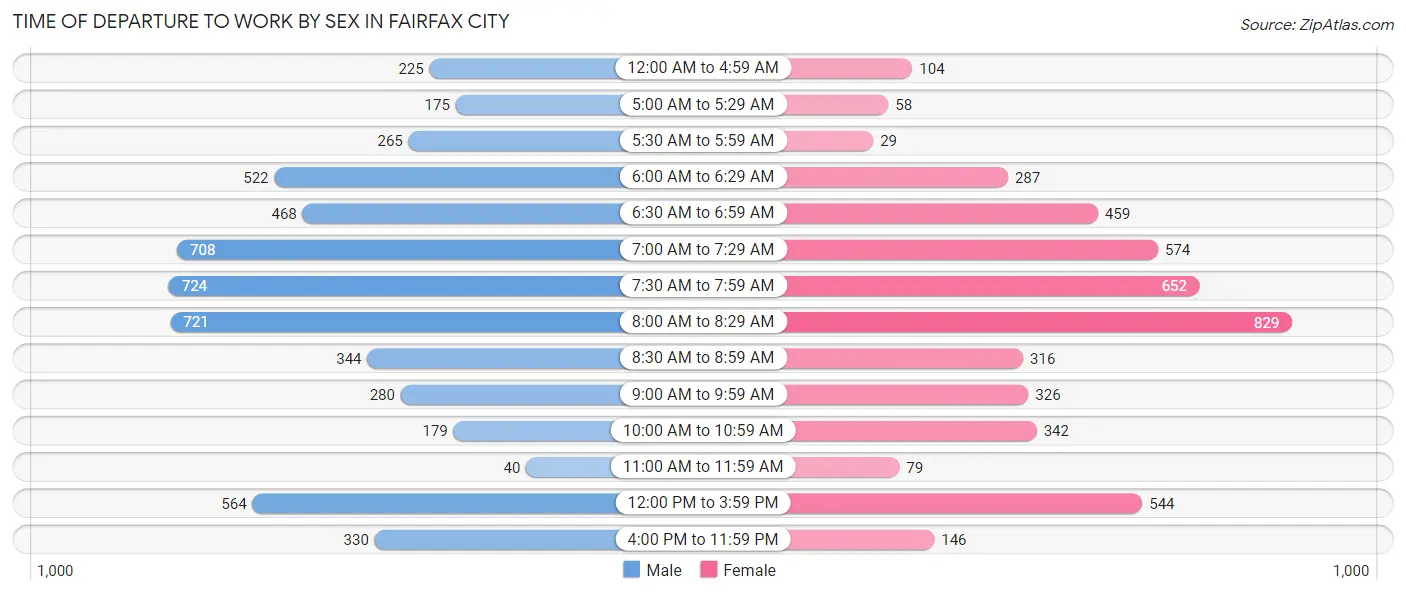
| Time of Departure | Male | Female |
| 12:00 AM to 4:59 AM | 225 (4.1%) | 104 (2.2%) |
| 5:00 AM to 5:29 AM | 175 (3.2%) | 58 (1.2%) |
| 5:30 AM to 5:59 AM | 265 (4.8%) | 29 (0.6%) |
| 6:00 AM to 6:29 AM | 522 (9.4%) | 287 (6.0%) |
| 6:30 AM to 6:59 AM | 468 (8.4%) | 459 (9.7%) |
| 7:00 AM to 7:29 AM | 708 (12.8%) | 574 (12.1%) |
| 7:30 AM to 7:59 AM | 724 (13.1%) | 652 (13.7%) |
| 8:00 AM to 8:29 AM | 721 (13.0%) | 829 (17.5%) |
| 8:30 AM to 8:59 AM | 344 (6.2%) | 316 (6.7%) |
| 9:00 AM to 9:59 AM | 280 (5.1%) | 326 (6.9%) |
| 10:00 AM to 10:59 AM | 179 (3.2%) | 342 (7.2%) |
| 11:00 AM to 11:59 AM | 40 (0.7%) | 79 (1.7%) |
| 12:00 PM to 3:59 PM | 564 (10.2%) | 544 (11.5%) |
| 4:00 PM to 11:59 PM | 330 (5.9%) | 146 (3.1%) |
| Total | 5,545 (100.0%) | 4,745 (100.0%) |
Housing Occupancy in Fairfax City
Occupancy by Ownership in Fairfax City
Of the total 9,129 dwellings in Fairfax City, owner-occupied units account for 6,231 (68.3%), while renter-occupied units make up 2,898 (31.7%).
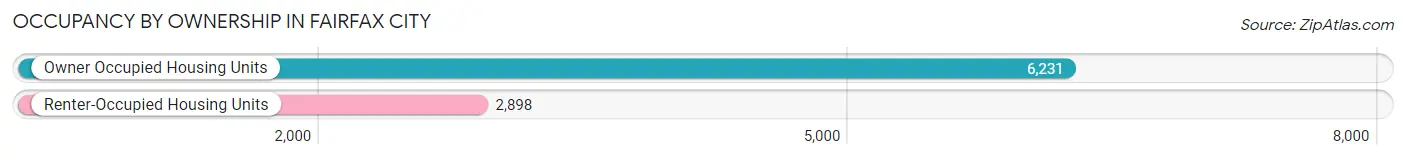
| Occupancy | # Housing Units | % Housing Units |
| Owner Occupied Housing Units | 6,231 | 68.3% |
| Renter-Occupied Housing Units | 2,898 | 31.7% |
| Total Occupied Housing Units | 9,129 | 100.0% |
Occupancy by Household Size in Fairfax City
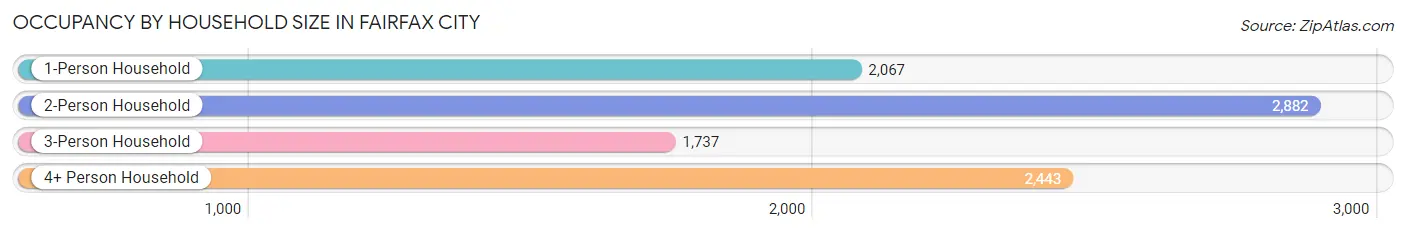
| Household Size | # Housing Units | % Housing Units |
| 1-Person Household | 2,067 | 22.6% |
| 2-Person Household | 2,882 | 31.6% |
| 3-Person Household | 1,737 | 19.0% |
| 4+ Person Household | 2,443 | 26.8% |
| Total Housing Units | 9,129 | 100.0% |
Occupancy by Ownership by Household Size in Fairfax City
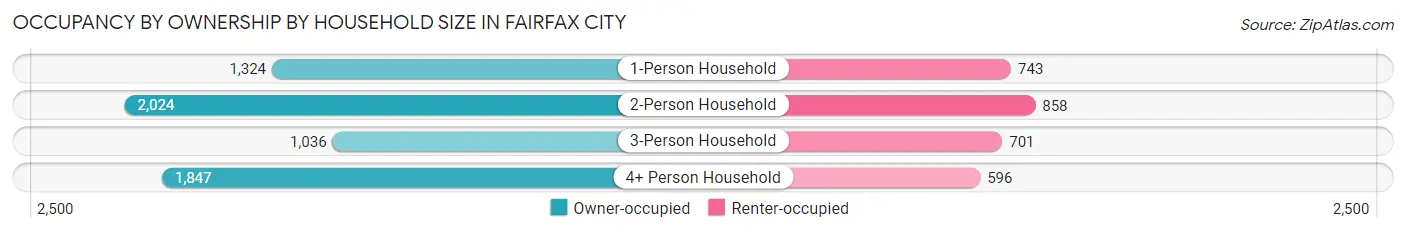
| Household Size | Owner-occupied | Renter-occupied |
| 1-Person Household | 1,324 (64.0%) | 743 (35.9%) |
| 2-Person Household | 2,024 (70.2%) | 858 (29.8%) |
| 3-Person Household | 1,036 (59.6%) | 701 (40.4%) |
| 4+ Person Household | 1,847 (75.6%) | 596 (24.4%) |
| Total Housing Units | 6,231 (68.3%) | 2,898 (31.7%) |
Occupancy by Educational Attainment in Fairfax City
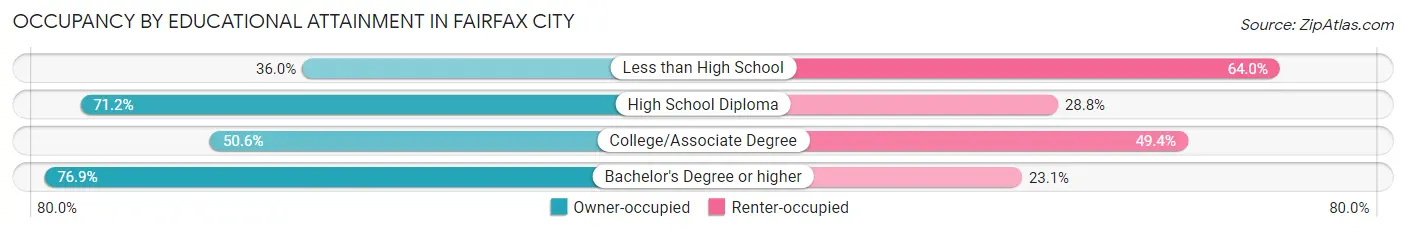
| Household Size | Owner-occupied | Renter-occupied |
| Less than High School | 257 (36.0%) | 457 (64.0%) |
| High School Diploma | 580 (71.2%) | 235 (28.8%) |
| College/Associate Degree | 864 (50.6%) | 844 (49.4%) |
| Bachelor's Degree or higher | 4,530 (76.9%) | 1,362 (23.1%) |
Occupancy by Age of Householder in Fairfax City
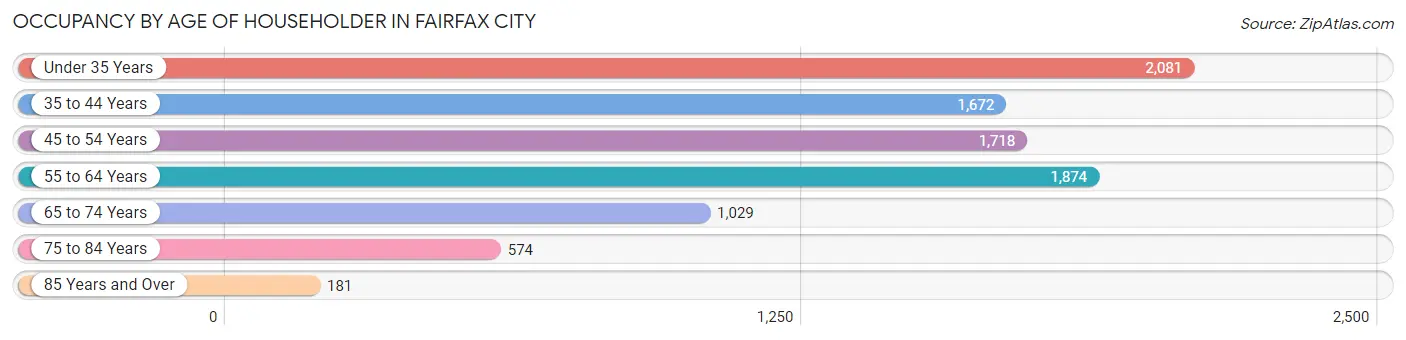
| Age Bracket | # Households | % Households |
| Under 35 Years | 2,081 | 22.8% |
| 35 to 44 Years | 1,672 | 18.3% |
| 45 to 54 Years | 1,718 | 18.8% |
| 55 to 64 Years | 1,874 | 20.5% |
| 65 to 74 Years | 1,029 | 11.3% |
| 75 to 84 Years | 574 | 6.3% |
| 85 Years and Over | 181 | 2.0% |
| Total | 9,129 | 100.0% |
Housing Finances in Fairfax City
Median Income by Occupancy in Fairfax City
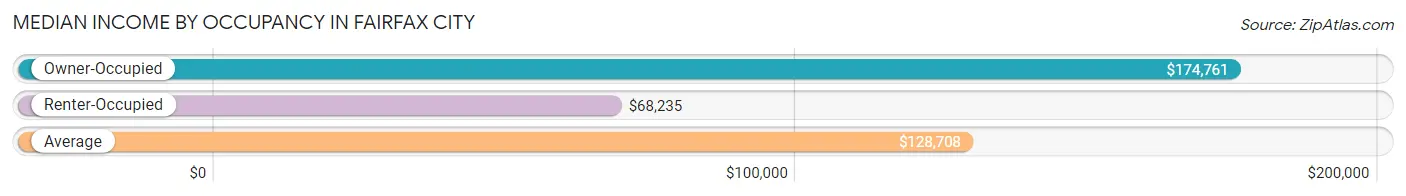
| Occupancy Type | # Households | Median Income |
| Owner-Occupied | 6,231 (68.3%) | $174,761 |
| Renter-Occupied | 2,898 (31.7%) | $68,235 |
| Average | 9,129 (100.0%) | $128,708 |
Occupancy by Householder Income Bracket in Fairfax City
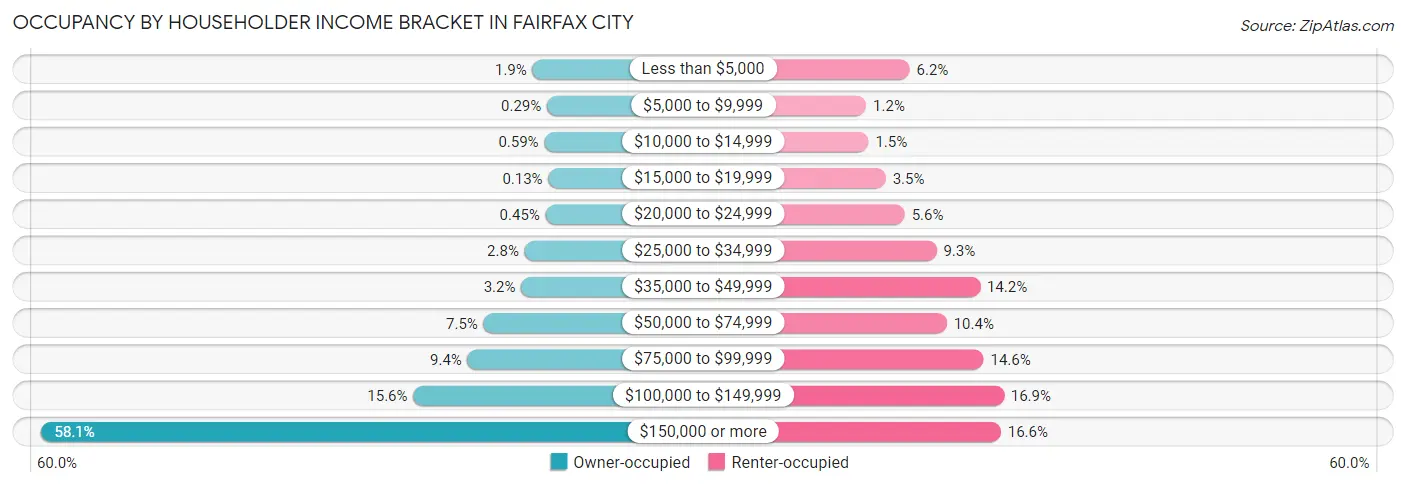
| Income Bracket | Owner-occupied | Renter-occupied |
| Less than $5,000 | 121 (1.9%) | 179 (6.2%) |
| $5,000 to $9,999 | 18 (0.3%) | 35 (1.2%) |
| $10,000 to $14,999 | 37 (0.6%) | 43 (1.5%) |
| $15,000 to $19,999 | 8 (0.1%) | 100 (3.5%) |
| $20,000 to $24,999 | 28 (0.4%) | 163 (5.6%) |
| $25,000 to $34,999 | 177 (2.8%) | 268 (9.2%) |
| $35,000 to $49,999 | 201 (3.2%) | 412 (14.2%) |
| $50,000 to $74,999 | 469 (7.5%) | 302 (10.4%) |
| $75,000 to $99,999 | 583 (9.4%) | 424 (14.6%) |
| $100,000 to $149,999 | 970 (15.6%) | 491 (16.9%) |
| $150,000 or more | 3,619 (58.1%) | 481 (16.6%) |
| Total | 6,231 (100.0%) | 2,898 (100.0%) |
Monthly Housing Cost Tiers in Fairfax City
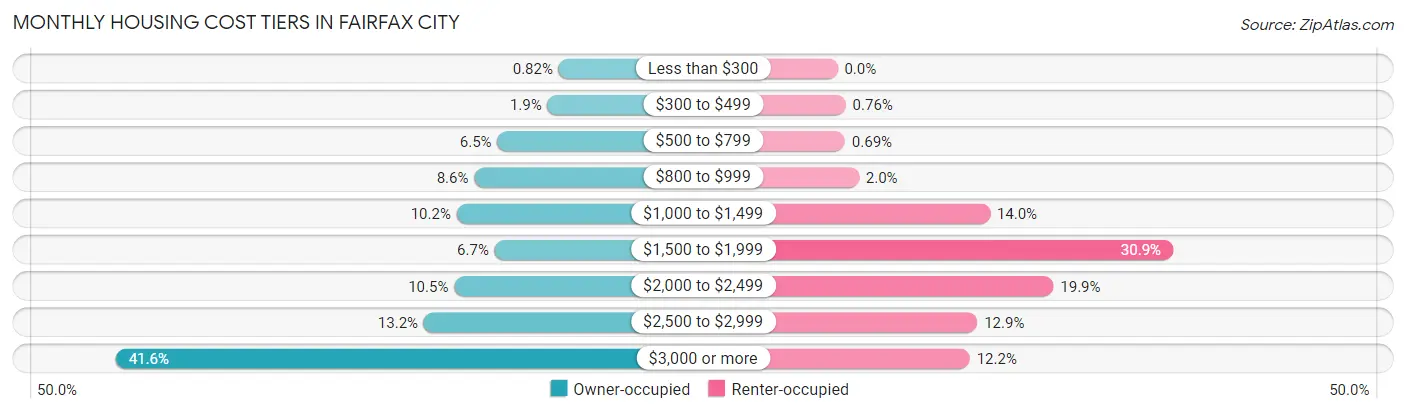
| Monthly Cost | Owner-occupied | Renter-occupied |
| Less than $300 | 51 (0.8%) | 0 (0.0%) |
| $300 to $499 | 116 (1.9%) | 22 (0.8%) |
| $500 to $799 | 403 (6.5%) | 20 (0.7%) |
| $800 to $999 | 536 (8.6%) | 57 (2.0%) |
| $1,000 to $1,499 | 637 (10.2%) | 407 (14.0%) |
| $1,500 to $1,999 | 419 (6.7%) | 895 (30.9%) |
| $2,000 to $2,499 | 651 (10.4%) | 576 (19.9%) |
| $2,500 to $2,999 | 825 (13.2%) | 373 (12.9%) |
| $3,000 or more | 2,593 (41.6%) | 353 (12.2%) |
| Total | 6,231 (100.0%) | 2,898 (100.0%) |
Physical Housing Characteristics in Fairfax City
Housing Structures in Fairfax City
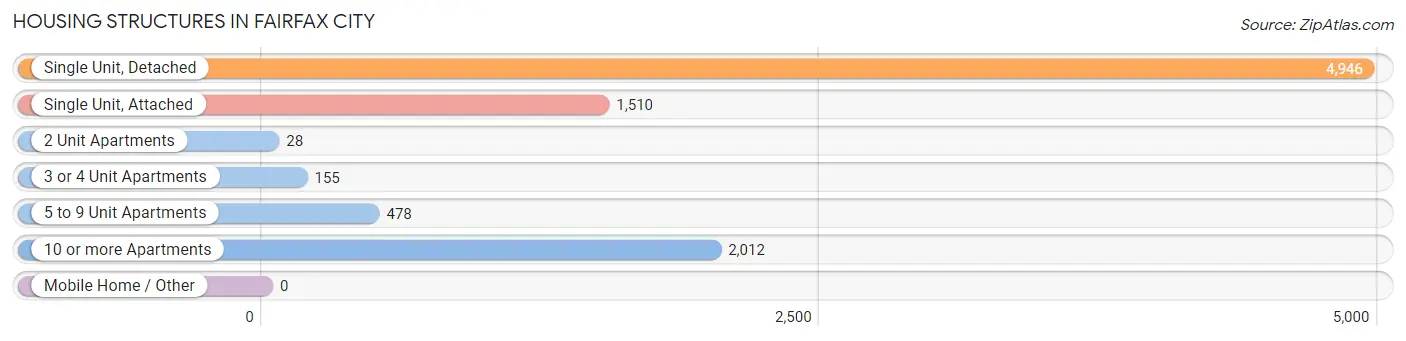
| Structure Type | # Housing Units | % Housing Units |
| Single Unit, Detached | 4,946 | 54.2% |
| Single Unit, Attached | 1,510 | 16.5% |
| 2 Unit Apartments | 28 | 0.3% |
| 3 or 4 Unit Apartments | 155 | 1.7% |
| 5 to 9 Unit Apartments | 478 | 5.2% |
| 10 or more Apartments | 2,012 | 22.0% |
| Mobile Home / Other | 0 | 0.0% |
| Total | 9,129 | 100.0% |
Housing Structures by Occupancy in Fairfax City
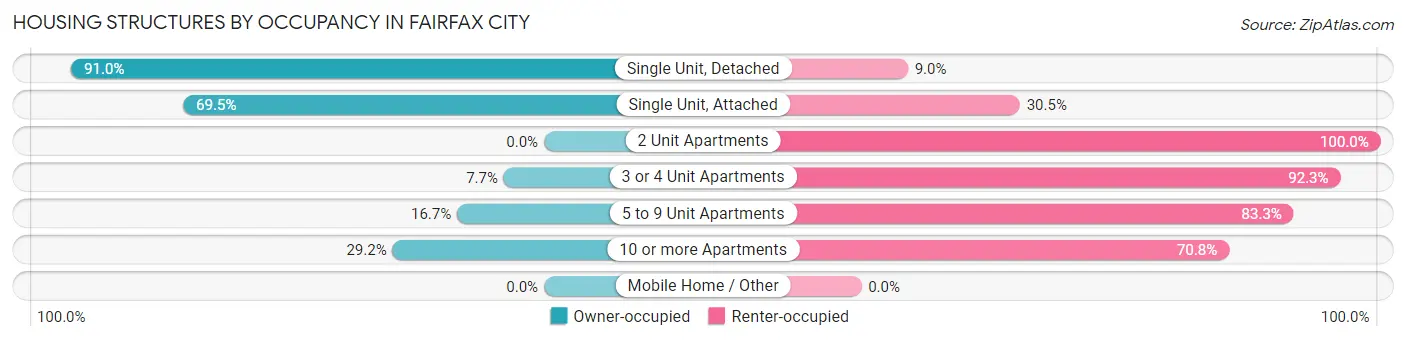
| Structure Type | Owner-occupied | Renter-occupied |
| Single Unit, Detached | 4,503 (91.0%) | 443 (9.0%) |
| Single Unit, Attached | 1,049 (69.5%) | 461 (30.5%) |
| 2 Unit Apartments | 0 (0.0%) | 28 (100.0%) |
| 3 or 4 Unit Apartments | 12 (7.7%) | 143 (92.3%) |
| 5 to 9 Unit Apartments | 80 (16.7%) | 398 (83.3%) |
| 10 or more Apartments | 587 (29.2%) | 1,425 (70.8%) |
| Mobile Home / Other | 0 (0.0%) | 0 (0.0%) |
| Total | 6,231 (68.3%) | 2,898 (31.7%) |
Housing Structures by Number of Rooms in Fairfax City
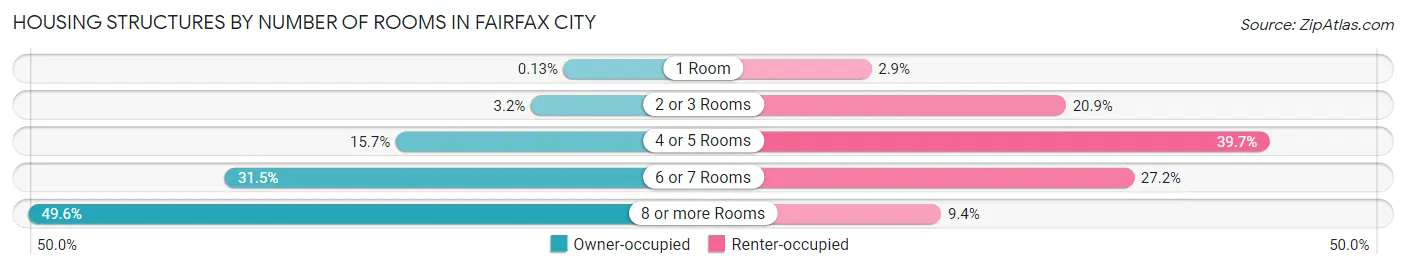
| Number of Rooms | Owner-occupied | Renter-occupied |
| 1 Room | 8 (0.1%) | 84 (2.9%) |
| 2 or 3 Rooms | 196 (3.2%) | 605 (20.9%) |
| 4 or 5 Rooms | 975 (15.7%) | 1,150 (39.7%) |
| 6 or 7 Rooms | 1,960 (31.5%) | 788 (27.2%) |
| 8 or more Rooms | 3,092 (49.6%) | 271 (9.3%) |
| Total | 6,231 (100.0%) | 2,898 (100.0%) |
Housing Structure by Heating Type in Fairfax City
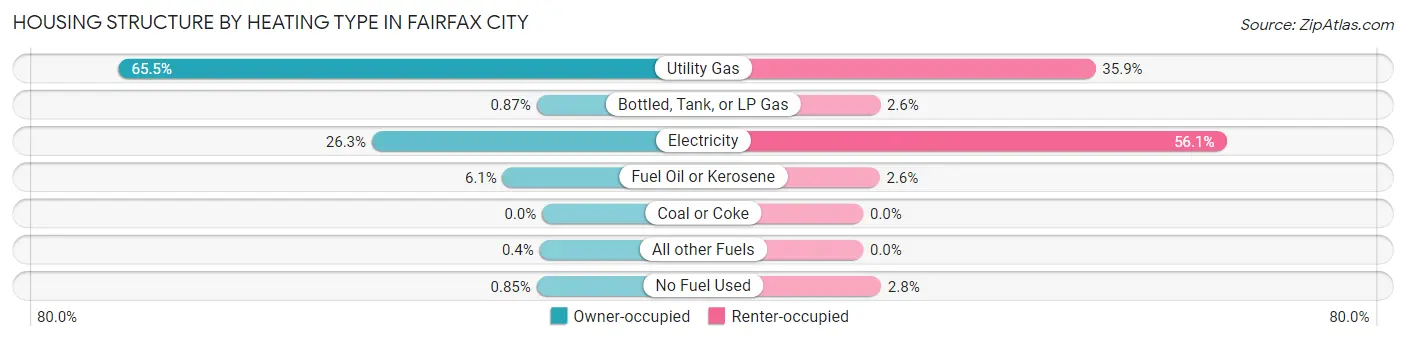
| Heating Type | Owner-occupied | Renter-occupied |
| Utility Gas | 4,079 (65.5%) | 1,041 (35.9%) |
| Bottled, Tank, or LP Gas | 54 (0.9%) | 76 (2.6%) |
| Electricity | 1,640 (26.3%) | 1,627 (56.1%) |
| Fuel Oil or Kerosene | 380 (6.1%) | 74 (2.5%) |
| Coal or Coke | 0 (0.0%) | 0 (0.0%) |
| All other Fuels | 25 (0.4%) | 0 (0.0%) |
| No Fuel Used | 53 (0.9%) | 80 (2.8%) |
| Total | 6,231 (100.0%) | 2,898 (100.0%) |
Household Vehicle Usage in Fairfax City
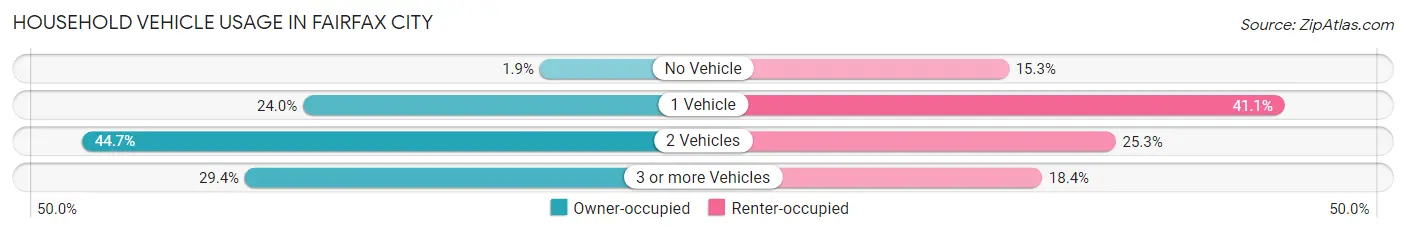
| Vehicles per Household | Owner-occupied | Renter-occupied |
| No Vehicle | 119 (1.9%) | 443 (15.3%) |
| 1 Vehicle | 1,496 (24.0%) | 1,190 (41.1%) |
| 2 Vehicles | 2,782 (44.7%) | 732 (25.3%) |
| 3 or more Vehicles | 1,834 (29.4%) | 533 (18.4%) |
| Total | 6,231 (100.0%) | 2,898 (100.0%) |
Real Estate & Mortgages in Fairfax City
Real Estate and Mortgage Overview in Fairfax City
| Characteristic | Without Mortgage | With Mortgage |
| Housing Units | 1,519 | 4,712 |
| Median Property Value | $599,200 | $665,500 |
| Median Household Income | $96,563 | $3,090 |
| Monthly Housing Costs | $878 | $2,593 |
| Real Estate Taxes | $6,055 | $219 |
Property Value by Mortgage Status in Fairfax City
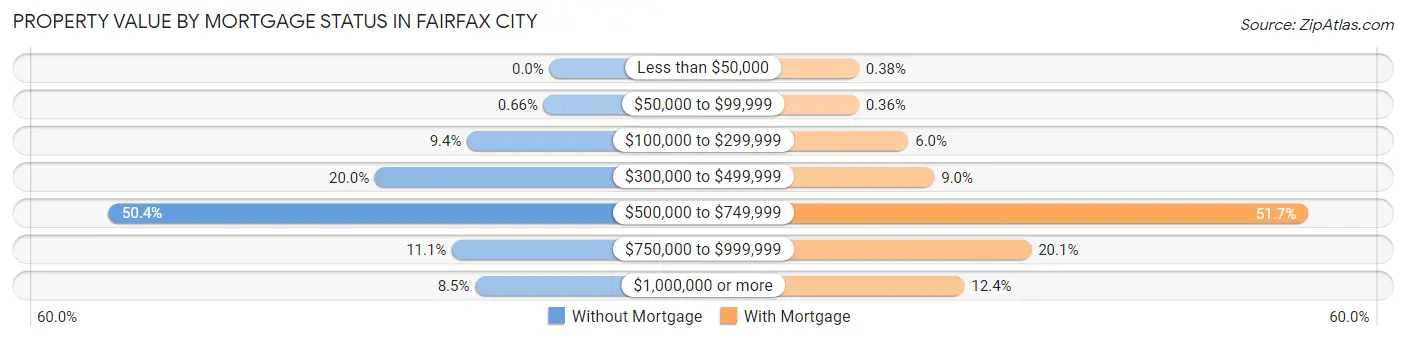
| Property Value | Without Mortgage | With Mortgage |
| Less than $50,000 | 0 (0.0%) | 18 (0.4%) |
| $50,000 to $99,999 | 10 (0.7%) | 17 (0.4%) |
| $100,000 to $299,999 | 143 (9.4%) | 284 (6.0%) |
| $300,000 to $499,999 | 303 (20.0%) | 424 (9.0%) |
| $500,000 to $749,999 | 765 (50.4%) | 2,437 (51.7%) |
| $750,000 to $999,999 | 169 (11.1%) | 946 (20.1%) |
| $1,000,000 or more | 129 (8.5%) | 586 (12.4%) |
| Total | 1,519 (100.0%) | 4,712 (100.0%) |
Household Income by Mortgage Status in Fairfax City
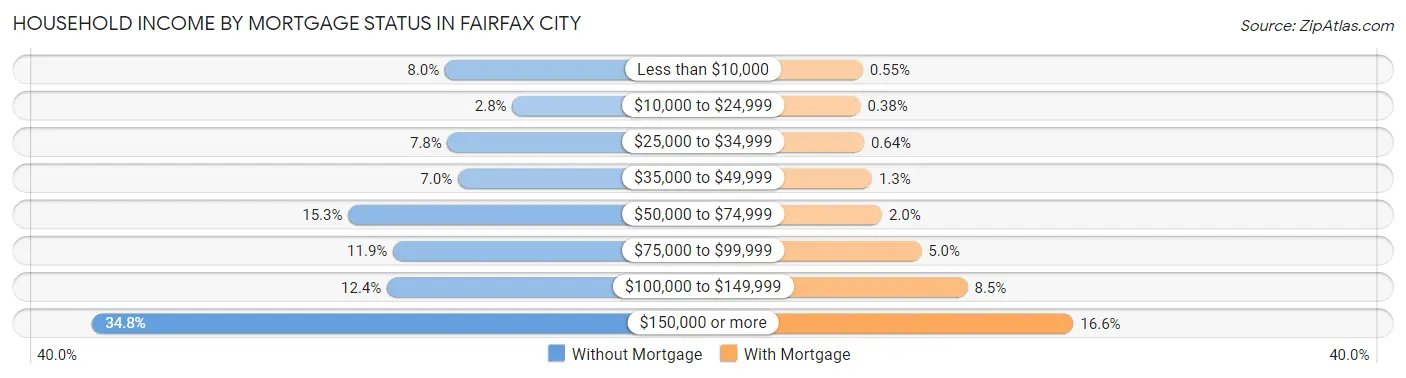
| Household Income | Without Mortgage | With Mortgage |
| Less than $10,000 | 121 (8.0%) | 26 (0.5%) |
| $10,000 to $24,999 | 43 (2.8%) | 18 (0.4%) |
| $25,000 to $34,999 | 118 (7.8%) | 30 (0.6%) |
| $35,000 to $49,999 | 106 (7.0%) | 59 (1.3%) |
| $50,000 to $74,999 | 233 (15.3%) | 95 (2.0%) |
| $75,000 to $99,999 | 181 (11.9%) | 236 (5.0%) |
| $100,000 to $149,999 | 188 (12.4%) | 402 (8.5%) |
| $150,000 or more | 529 (34.8%) | 782 (16.6%) |
| Total | 1,519 (100.0%) | 4,712 (100.0%) |
Property Value to Household Income Ratio in Fairfax City
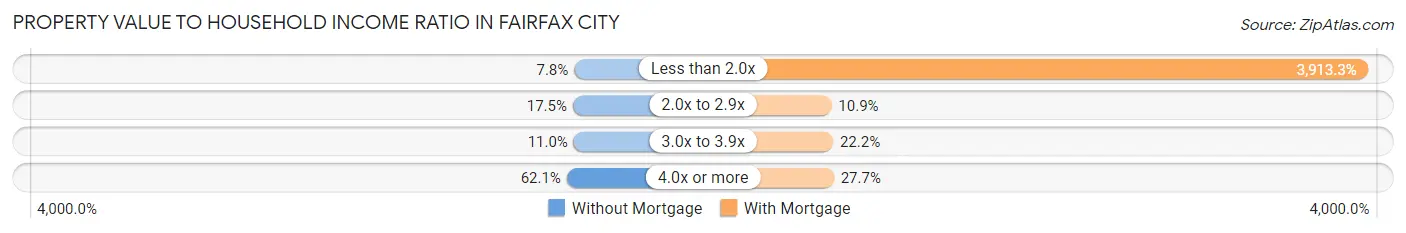
| Value-to-Income Ratio | Without Mortgage | With Mortgage |
| Less than 2.0x | 119 (7.8%) | 184,394 (3,913.3%) |
| 2.0x to 2.9x | 266 (17.5%) | 514 (10.9%) |
| 3.0x to 3.9x | 167 (11.0%) | 1,045 (22.2%) |
| 4.0x or more | 943 (62.1%) | 1,305 (27.7%) |
| Total | 1,519 (100.0%) | 4,712 (100.0%) |
Real Estate Taxes by Mortgage Status in Fairfax City
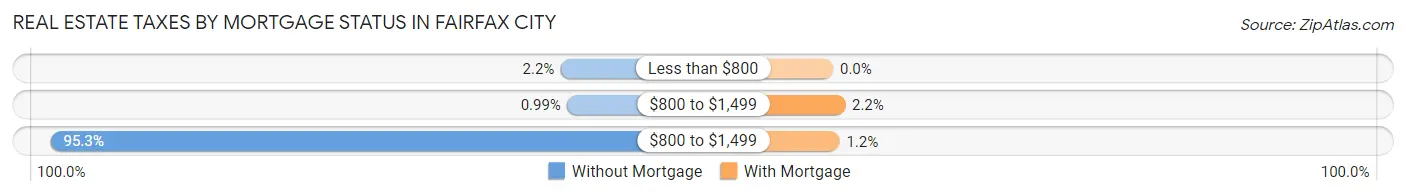
| Property Taxes | Without Mortgage | With Mortgage |
| Less than $800 | 33 (2.2%) | 0 (0.0%) |
| $800 to $1,499 | 15 (1.0%) | 103 (2.2%) |
| $800 to $1,499 | 1,447 (95.3%) | 55 (1.2%) |
| Total | 1,519 (100.0%) | 4,712 (100.0%) |
Health & Disability in Fairfax City
Health Insurance Coverage by Age in Fairfax City
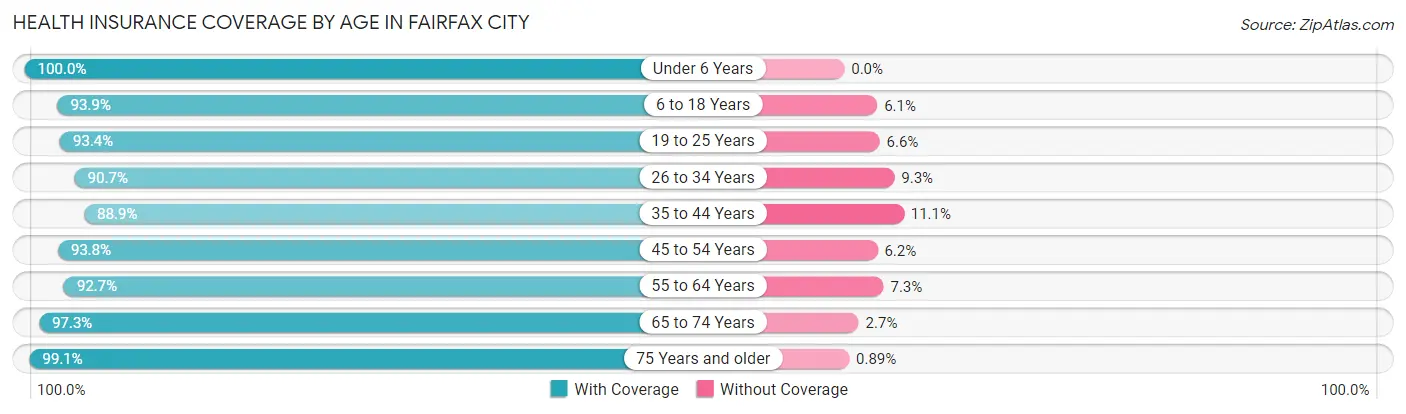
| Age Bracket | With Coverage | Without Coverage |
| Under 6 Years | 2,190 (100.0%) | 0 (0.0%) |
| 6 to 18 Years | 3,410 (93.9%) | 223 (6.1%) |
| 19 to 25 Years | 2,159 (93.4%) | 152 (6.6%) |
| 26 to 34 Years | 2,722 (90.7%) | 280 (9.3%) |
| 35 to 44 Years | 2,958 (88.9%) | 369 (11.1%) |
| 45 to 54 Years | 2,866 (93.8%) | 189 (6.2%) |
| 55 to 64 Years | 2,887 (92.7%) | 228 (7.3%) |
| 65 to 74 Years | 1,887 (97.3%) | 52 (2.7%) |
| 75 Years and older | 1,118 (99.1%) | 10 (0.9%) |
| Total | 22,197 (93.7%) | 1,503 (6.3%) |
Health Insurance Coverage by Citizenship Status in Fairfax City
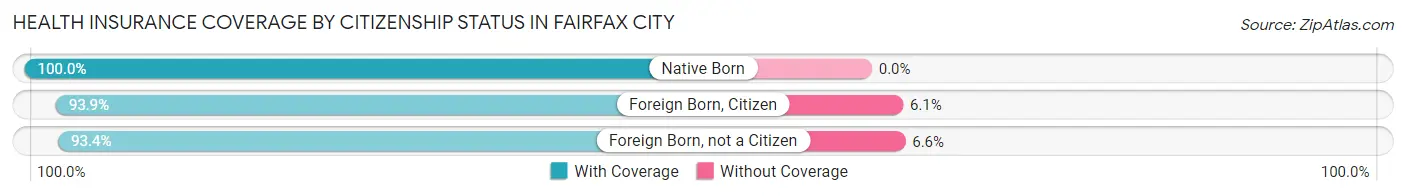
| Citizenship Status | With Coverage | Without Coverage |
| Native Born | 2,190 (100.0%) | 0 (0.0%) |
| Foreign Born, Citizen | 3,410 (93.9%) | 223 (6.1%) |
| Foreign Born, not a Citizen | 2,159 (93.4%) | 152 (6.6%) |
Health Insurance Coverage by Household Income in Fairfax City
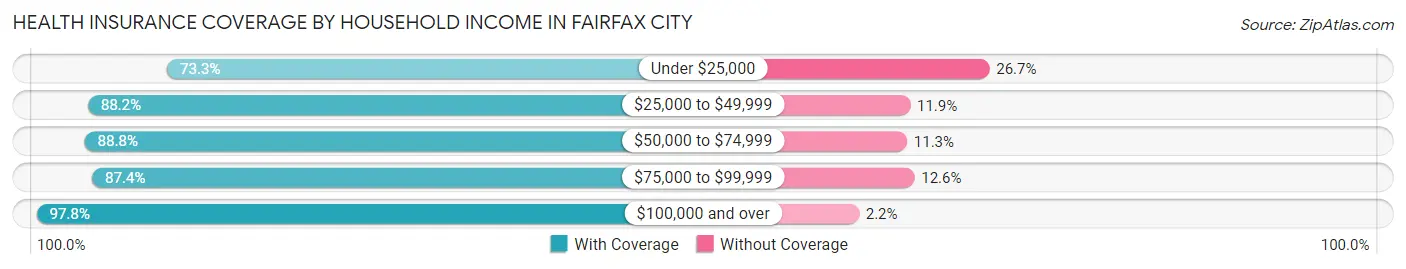
| Household Income | With Coverage | Without Coverage |
| Under $25,000 | 969 (73.3%) | 353 (26.7%) |
| $25,000 to $49,999 | 2,299 (88.1%) | 309 (11.8%) |
| $50,000 to $74,999 | 1,507 (88.7%) | 191 (11.3%) |
| $75,000 to $99,999 | 2,038 (87.4%) | 295 (12.6%) |
| $100,000 and over | 15,223 (97.8%) | 349 (2.2%) |
Public vs Private Health Insurance Coverage by Age in Fairfax City
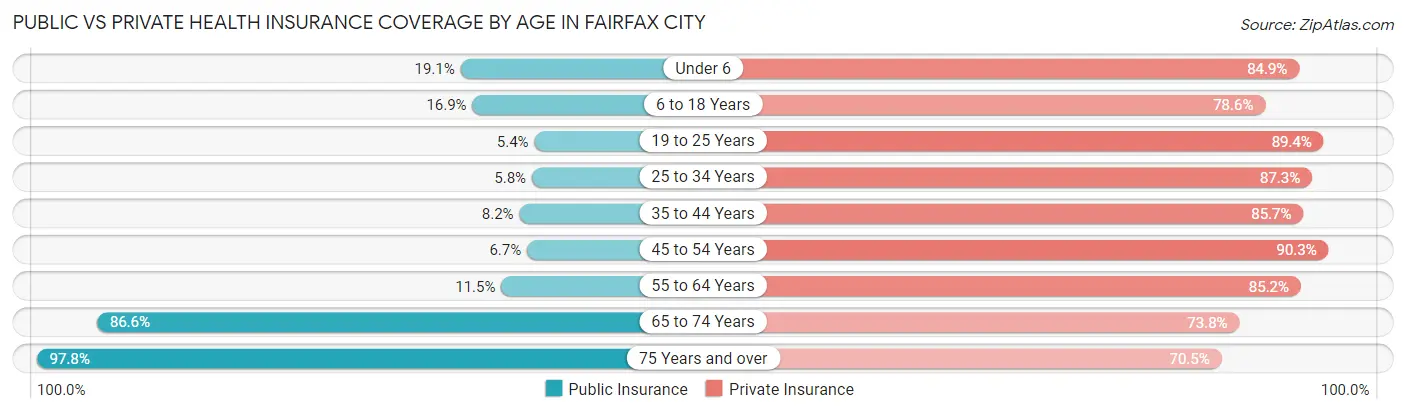
| Age Bracket | Public Insurance | Private Insurance |
| Under 6 | 418 (19.1%) | 1,859 (84.9%) |
| 6 to 18 Years | 613 (16.9%) | 2,855 (78.6%) |
| 19 to 25 Years | 124 (5.4%) | 2,067 (89.4%) |
| 25 to 34 Years | 175 (5.8%) | 2,620 (87.3%) |
| 35 to 44 Years | 271 (8.2%) | 2,850 (85.7%) |
| 45 to 54 Years | 206 (6.7%) | 2,760 (90.3%) |
| 55 to 64 Years | 359 (11.5%) | 2,654 (85.2%) |
| 65 to 74 Years | 1,679 (86.6%) | 1,431 (73.8%) |
| 75 Years and over | 1,103 (97.8%) | 795 (70.5%) |
| Total | 4,948 (20.9%) | 19,891 (83.9%) |
Disability Status by Sex by Age in Fairfax City
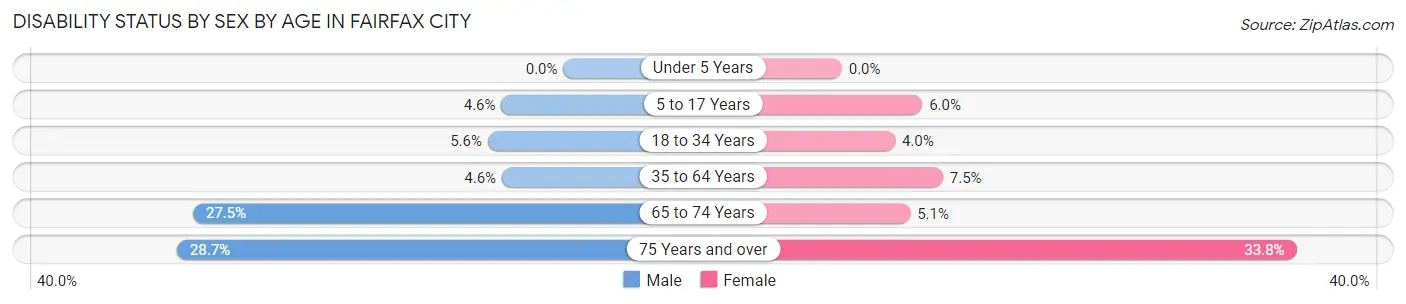
| Age Bracket | Male | Female |
| Under 5 Years | 0 (0.0%) | 0 (0.0%) |
| 5 to 17 Years | 92 (4.6%) | 109 (6.0%) |
| 18 to 34 Years | 161 (5.6%) | 105 (4.0%) |
| 35 to 64 Years | 216 (4.6%) | 357 (7.5%) |
| 65 to 74 Years | 252 (27.5%) | 52 (5.1%) |
| 75 Years and over | 140 (28.7%) | 216 (33.8%) |
Disability Class by Sex by Age in Fairfax City
Disability Class: Hearing Difficulty
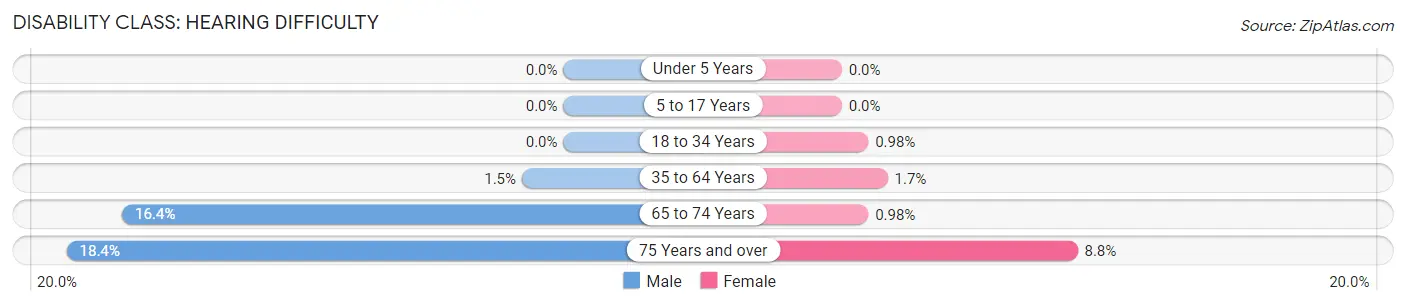
| Age Bracket | Male | Female |
| Under 5 Years | 0 (0.0%) | 0 (0.0%) |
| 5 to 17 Years | 0 (0.0%) | 0 (0.0%) |
| 18 to 34 Years | 0 (0.0%) | 26 (1.0%) |
| 35 to 64 Years | 73 (1.5%) | 81 (1.7%) |
| 65 to 74 Years | 150 (16.4%) | 10 (1.0%) |
| 75 Years and over | 90 (18.4%) | 56 (8.7%) |
Disability Class: Vision Difficulty
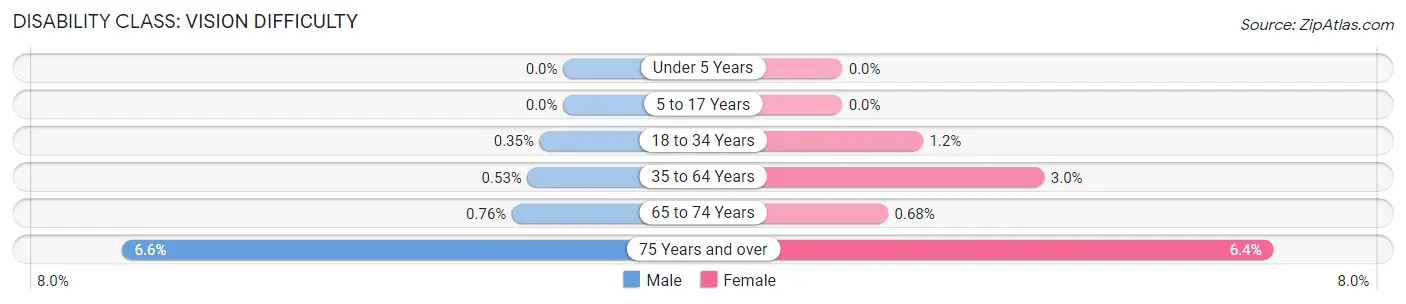
| Age Bracket | Male | Female |
| Under 5 Years | 0 (0.0%) | 0 (0.0%) |
| 5 to 17 Years | 0 (0.0%) | 0 (0.0%) |
| 18 to 34 Years | 10 (0.4%) | 32 (1.2%) |
| 35 to 64 Years | 25 (0.5%) | 143 (3.0%) |
| 65 to 74 Years | 7 (0.8%) | 7 (0.7%) |
| 75 Years and over | 32 (6.6%) | 41 (6.4%) |
Disability Class: Cognitive Difficulty
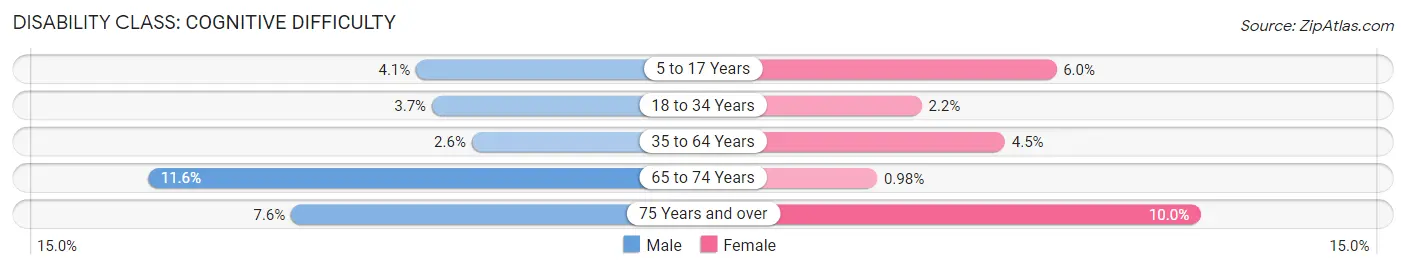
| Age Bracket | Male | Female |
| 5 to 17 Years | 82 (4.1%) | 109 (6.0%) |
| 18 to 34 Years | 105 (3.7%) | 59 (2.2%) |
| 35 to 64 Years | 121 (2.5%) | 216 (4.5%) |
| 65 to 74 Years | 106 (11.6%) | 10 (1.0%) |
| 75 Years and over | 37 (7.6%) | 64 (10.0%) |
Disability Class: Ambulatory Difficulty
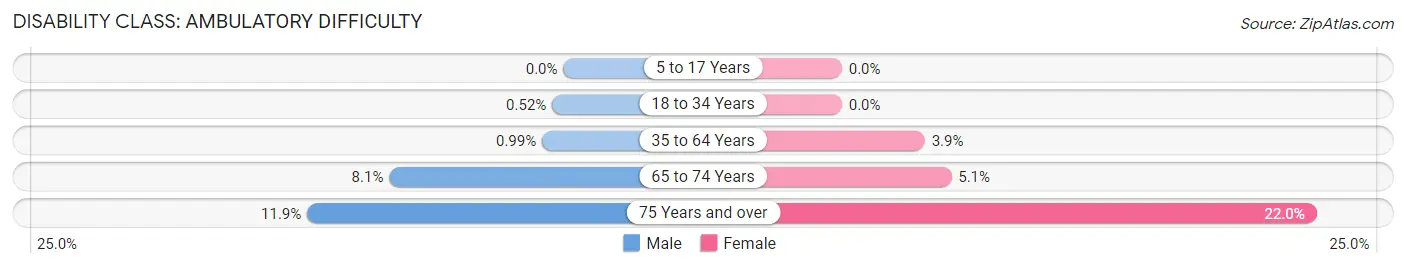
| Age Bracket | Male | Female |
| 5 to 17 Years | 0 (0.0%) | 0 (0.0%) |
| 18 to 34 Years | 15 (0.5%) | 0 (0.0%) |
| 35 to 64 Years | 47 (1.0%) | 183 (3.8%) |
| 65 to 74 Years | 74 (8.1%) | 52 (5.1%) |
| 75 Years and over | 58 (11.9%) | 141 (22.0%) |
Disability Class: Self-Care Difficulty
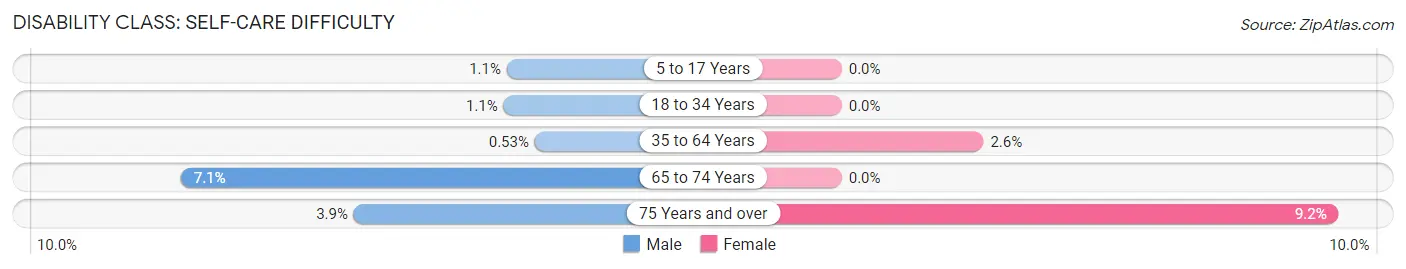
| Age Bracket | Male | Female |
| 5 to 17 Years | 21 (1.1%) | 0 (0.0%) |
| 18 to 34 Years | 32 (1.1%) | 0 (0.0%) |
| 35 to 64 Years | 25 (0.5%) | 125 (2.6%) |
| 65 to 74 Years | 65 (7.1%) | 0 (0.0%) |
| 75 Years and over | 19 (3.9%) | 59 (9.2%) |
Technology Access in Fairfax City
Computing Device Access in Fairfax City
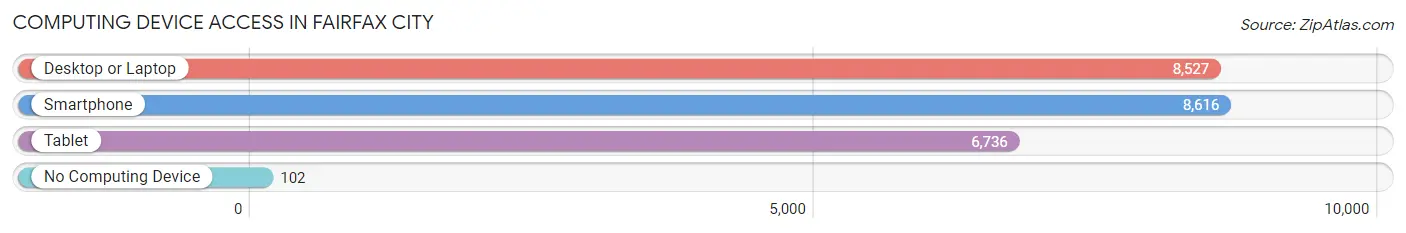
| Device Type | # Households | % Households |
| Desktop or Laptop | 8,527 | 93.4% |
| Smartphone | 8,616 | 94.4% |
| Tablet | 6,736 | 73.8% |
| No Computing Device | 102 | 1.1% |
| Total | 9,129 | 100.0% |
Internet Access in Fairfax City
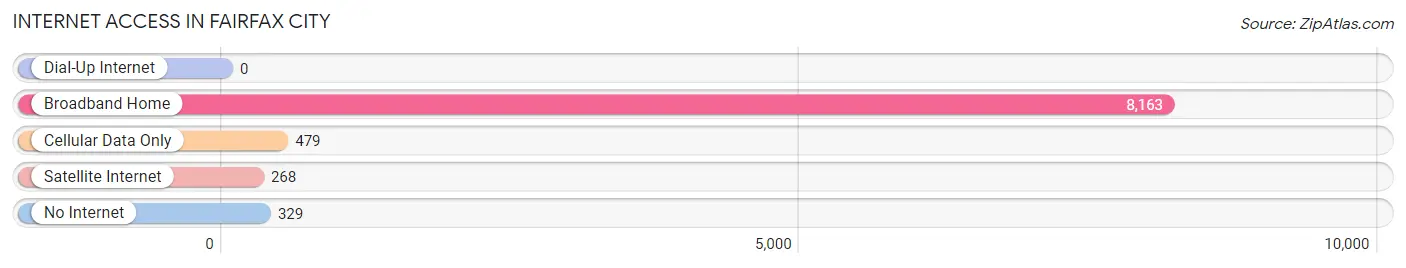
| Internet Type | # Households | % Households |
| Dial-Up Internet | 0 | 0.0% |
| Broadband Home | 8,163 | 89.4% |
| Cellular Data Only | 479 | 5.2% |
| Satellite Internet | 268 | 2.9% |
| No Internet | 329 | 3.6% |
| Total | 9,129 | 100.0% |
Fairfax City Summary
Fairfax City, Virginia is a small independent city located in the northern part of the state, just outside of Washington, D.C. It is the county seat of Fairfax County and is part of the Washington Metropolitan Area. The city has a population of 24,013 as of the 2019 census, making it the smallest independent city in Virginia.
History
The area that is now Fairfax City was first settled in the early 1700s by English colonists. The city was officially established in 1805 and was named after Thomas Fairfax, the 6th Lord Fairfax of Cameron. The city was originally part of Fairfax County, but in 1961, it was incorporated as an independent city.
Geography
Fairfax City is located in the northern part of Virginia, just outside of Washington, D.C. It is bordered by Fairfax County to the north, Loudoun County to the west, and Prince William County to the south. The city covers an area of 6.3 square miles and is located at an elevation of 441 feet. The city is located in the Piedmont region of Virginia and is part of the Washington Metropolitan Area.
Climate
Fairfax City has a humid subtropical climate, with hot, humid summers and mild winters. The average annual temperature is 54°F, with an average high of 79°F in July and an average low of 30°F in January. The average annual precipitation is 40 inches, with the most precipitation occurring in June and July.
Economy
Fairfax City is home to a variety of businesses and industries. The city is home to several large employers, including George Mason University, Inova Fairfax Hospital, and the Fairfax County Government. The city is also home to several technology companies, including AOL, Capital One, and Northrop Grumman.
Demographics
As of the 2019 census, Fairfax City had a population of 24,013. The racial makeup of the city was 68.3% White, 16.2% Asian, 8.2% Black, and 5.3% Hispanic or Latino. The median household income was $107,837, and the median home value was $521,000.
Conclusion
Fairfax City, Virginia is a small independent city located in the northern part of the state, just outside of Washington, D.C. It has a population of 24,013 and is home to a variety of businesses and industries. The city has a humid subtropical climate, with hot, humid summers and mild winters. The median household income is $107,837, and the median home value is $521,000.
Common Questions
What is Per Capita Income in Fairfax City?
Per Capita income in Fairfax City is $59,688.
What is the Median Family Income in Fairfax City?
Median Family Income in Fairfax City is $170,100.
What is the Median Household income in Fairfax City?
Median Household Income in Fairfax City is $128,708.
What is Income or Wage Gap in Fairfax City?
Income or Wage Gap in Fairfax City is 32.3%.
Women in Fairfax City earn 67.7 cents for every dollar earned by a man.
What is Inequality or Gini Index in Fairfax City?
Inequality or Gini Index in Fairfax City is 0.43.
What is the Total Population of Fairfax City?
Total Population of Fairfax City is 24,242.
What is the Total Male Population of Fairfax City?
Total Male Population of Fairfax City is 11,945.
What is the Total Female Population of Fairfax City?
Total Female Population of Fairfax City is 12,297.
What is the Ratio of Males per 100 Females in Fairfax City?
There are 97.14 Males per 100 Females in Fairfax City.
What is the Ratio of Females per 100 Males in Fairfax City?
There are 102.95 Females per 100 Males in Fairfax City.
What is the Median Population Age in Fairfax City?
Median Population Age in Fairfax City is 37.5 Years.
What is the Average Family Size in Fairfax City
Average Family Size in Fairfax City is 3.1 People.
What is the Average Household Size in Fairfax City
Average Household Size in Fairfax City is 2.6 People.
How Large is the Labor Force in Fairfax City?
There are 13,687 People in the Labor Forcein in Fairfax City.
What is the Percentage of People in the Labor Force in Fairfax City?
71.5% of People are in the Labor Force in Fairfax City.
What is the Unemployment Rate in Fairfax City?
Unemployment Rate in Fairfax City is 3.7%.