Dinwiddie County, VA Map & Demographics
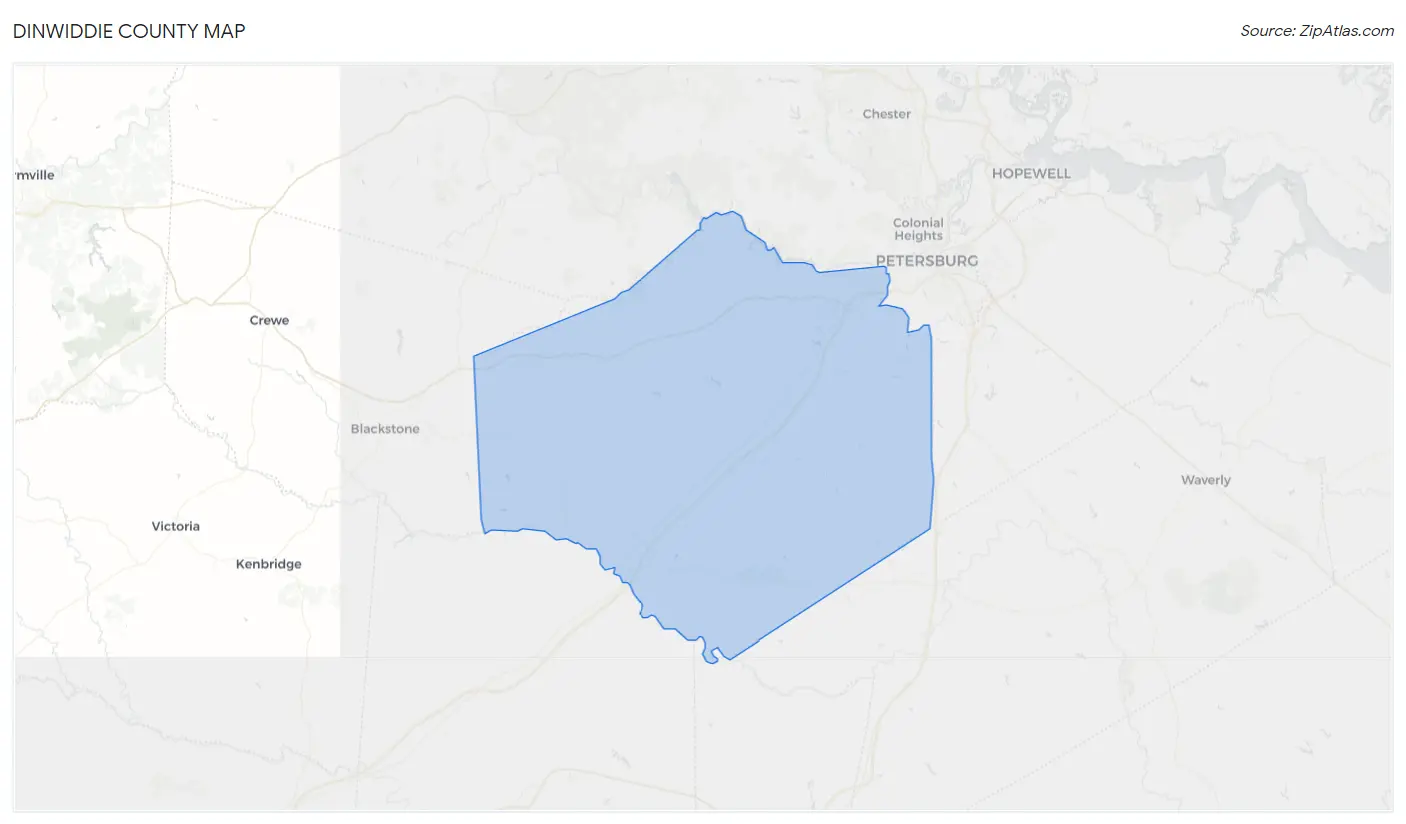
Dinwiddie County Map
Dinwiddie County Overview
$35,506
PER CAPITA INCOME
$92,397
AVG FAMILY INCOME
$77,225
AVG HOUSEHOLD INCOME
29.0%
WAGE / INCOME GAP [ % ]
71.0¢/ $1
WAGE / INCOME GAP [ $ ]
$12,687
FAMILY INCOME DEFICIT
0.42
INEQUALITY / GINI INDEX
28,057
TOTAL POPULATION
14,111
MALE POPULATION
13,946
FEMALE POPULATION
101.18
MALES / 100 FEMALES
98.83
FEMALES / 100 MALES
43.4
MEDIAN AGE
3.1
AVG FAMILY SIZE
2.6
AVG HOUSEHOLD SIZE
14,225
LABOR FORCE [ PEOPLE ]
61.6%
PERCENT IN LABOR FORCE
4.7%
UNEMPLOYMENT RATE
Dinwiddie County Area Codes
Income in Dinwiddie County
Income Overview in Dinwiddie County
Per Capita Income in Dinwiddie County is $35,506, while median incomes of families and households are $92,397 and $77,225 respectively.
| Characteristic | Number | Measure |
| Per Capita Income | 28,057 | $35,506 |
| Median Family Income | 7,268 | $92,397 |
| Mean Family Income | 7,268 | $105,276 |
| Median Household Income | 10,432 | $77,225 |
| Mean Household Income | 10,432 | $92,305 |
| Income Deficit | 7,268 | $12,687 |
| Wage / Income Gap (%) | 28,057 | 29.02% |
| Wage / Income Gap ($) | 28,057 | 70.98¢ per $1 |
| Gini / Inequality Index | 28,057 | 0.42 |
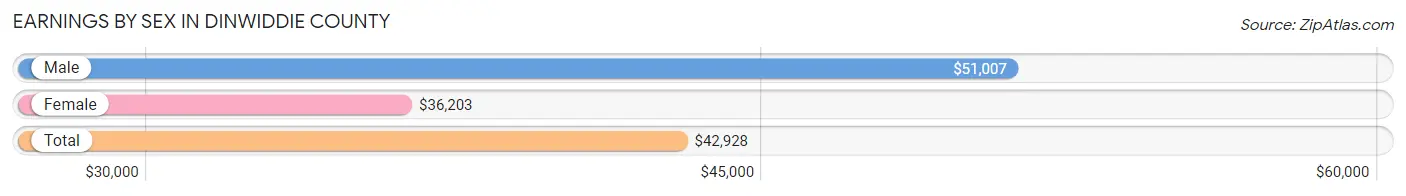
Earnings by Sex in Dinwiddie County
Average Earnings in Dinwiddie County are $42,928, $51,007 for men and $36,203 for women, a difference of 29.0%.
| Sex | Number | Average Earnings |
| Male | 7,659 (52.4%) | $51,007 |
| Female | 6,961 (47.6%) | $36,203 |
| Total | 14,620 (100.0%) | $42,928 |
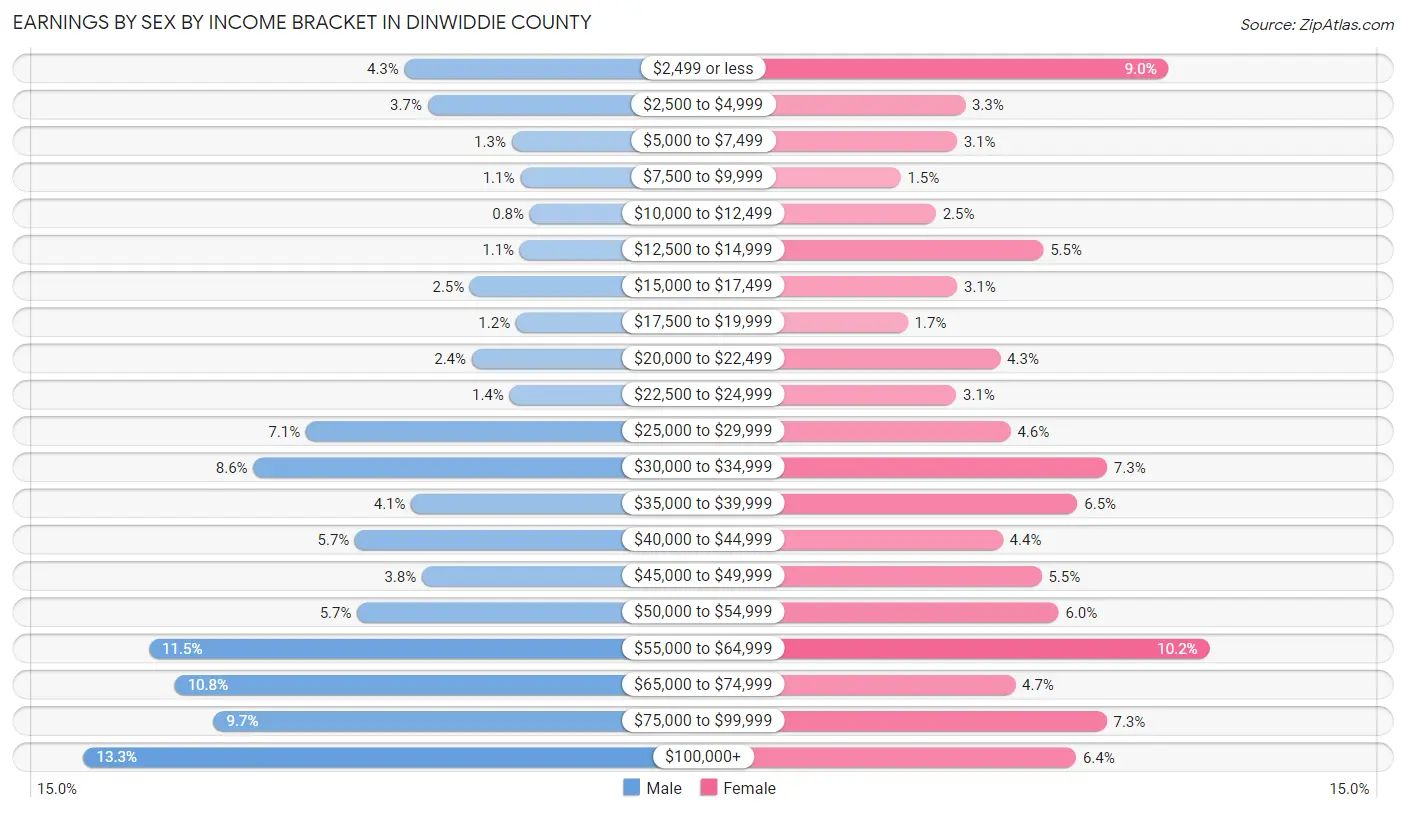
Earnings by Sex by Income Bracket in Dinwiddie County
The most common earnings brackets in Dinwiddie County are $100,000+ for men (1,022 | 13.3%) and $55,000 to $64,999 for women (709 | 10.2%).
| Income | Male | Female |
| $2,499 or less | 331 (4.3%) | 629 (9.0%) |
| $2,500 to $4,999 | 281 (3.7%) | 231 (3.3%) |
| $5,000 to $7,499 | 100 (1.3%) | 215 (3.1%) |
| $7,500 to $9,999 | 82 (1.1%) | 105 (1.5%) |
| $10,000 to $12,499 | 61 (0.8%) | 174 (2.5%) |
| $12,500 to $14,999 | 83 (1.1%) | 384 (5.5%) |
| $15,000 to $17,499 | 190 (2.5%) | 216 (3.1%) |
| $17,500 to $19,999 | 91 (1.2%) | 119 (1.7%) |
| $20,000 to $22,499 | 186 (2.4%) | 300 (4.3%) |
| $22,500 to $24,999 | 105 (1.4%) | 214 (3.1%) |
| $25,000 to $29,999 | 543 (7.1%) | 320 (4.6%) |
| $30,000 to $34,999 | 656 (8.6%) | 509 (7.3%) |
| $35,000 to $39,999 | 316 (4.1%) | 451 (6.5%) |
| $40,000 to $44,999 | 437 (5.7%) | 305 (4.4%) |
| $45,000 to $49,999 | 293 (3.8%) | 381 (5.5%) |
| $50,000 to $54,999 | 433 (5.7%) | 414 (5.9%) |
| $55,000 to $64,999 | 881 (11.5%) | 709 (10.2%) |
| $65,000 to $74,999 | 826 (10.8%) | 329 (4.7%) |
| $75,000 to $99,999 | 742 (9.7%) | 508 (7.3%) |
| $100,000+ | 1,022 (13.3%) | 448 (6.4%) |
| Total | 7,659 (100.0%) | 6,961 (100.0%) |
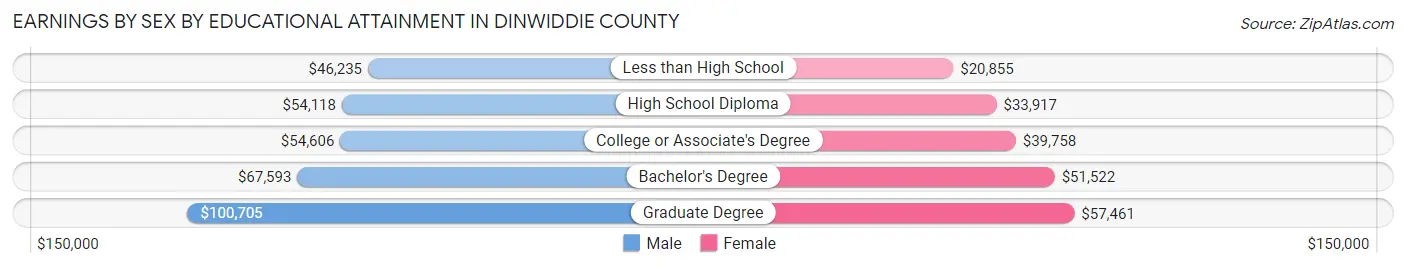
Earnings by Sex by Educational Attainment in Dinwiddie County
Average earnings in Dinwiddie County are $56,728 for men and $39,188 for women, a difference of 30.9%. Men with an educational attainment of graduate degree enjoy the highest average annual earnings of $100,705, while those with less than high school education earn the least with $46,235. Women with an educational attainment of graduate degree earn the most with the average annual earnings of $57,461, while those with less than high school education have the smallest earnings of $20,855.
| Educational Attainment | Male Income | Female Income |
| Less than High School | $46,235 | $20,855 |
| High School Diploma | $54,118 | $33,917 |
| College or Associate's Degree | $54,606 | $39,758 |
| Bachelor's Degree | $67,593 | $51,522 |
| Graduate Degree | $100,705 | $57,461 |
| Total | $56,728 | $39,188 |
Family Income in Dinwiddie County
Family Income Brackets in Dinwiddie County
According to the Dinwiddie County family income data, there are 1,919 families falling into the $100,000 to $149,999 income range, which is the most common income bracket and makes up 26.4% of all families. Conversely, the $15,000 to $24,999 income bracket is the least frequent group with only 124 families (1.7%) belonging to this category.
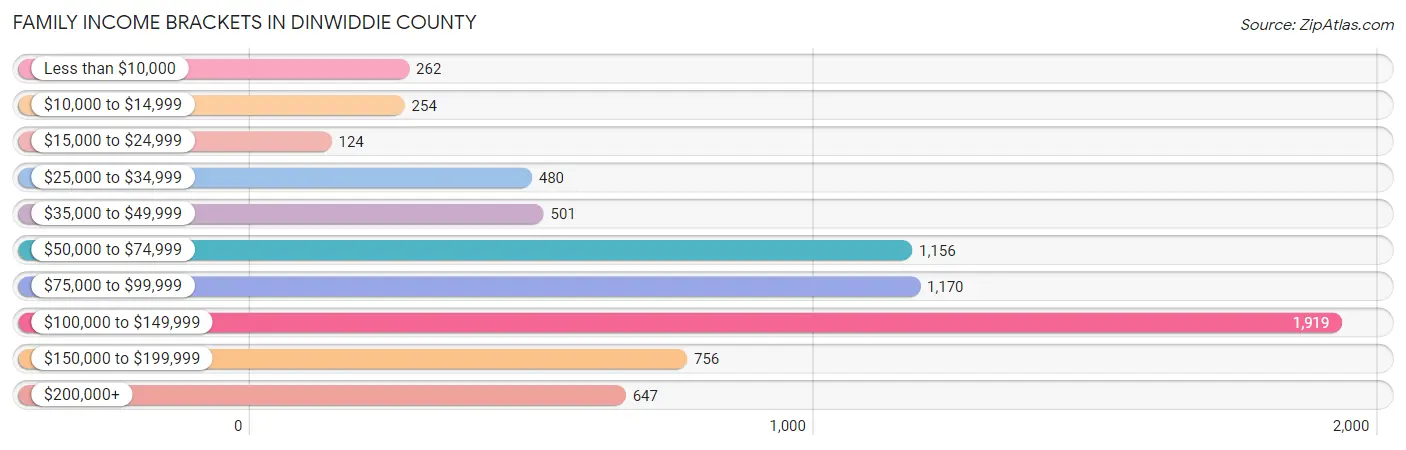
| Income Bracket | # Families | % Families |
| Less than $10,000 | 262 | 3.6% |
| $10,000 to $14,999 | 254 | 3.5% |
| $15,000 to $24,999 | 124 | 1.7% |
| $25,000 to $34,999 | 480 | 6.6% |
| $35,000 to $49,999 | 501 | 6.9% |
| $50,000 to $74,999 | 1,156 | 15.9% |
| $75,000 to $99,999 | 1,170 | 16.1% |
| $100,000 to $149,999 | 1,919 | 26.4% |
| $150,000 to $199,999 | 756 | 10.4% |
| $200,000+ | 647 | 8.9% |
Family Income by Famaliy Size in Dinwiddie County
4-person families (1,127 | 15.5%) account for the highest median family income in Dinwiddie County with $127,829 per family, while 2-person families (3,620 | 49.8%) have the highest median income of $40,000 per family member.
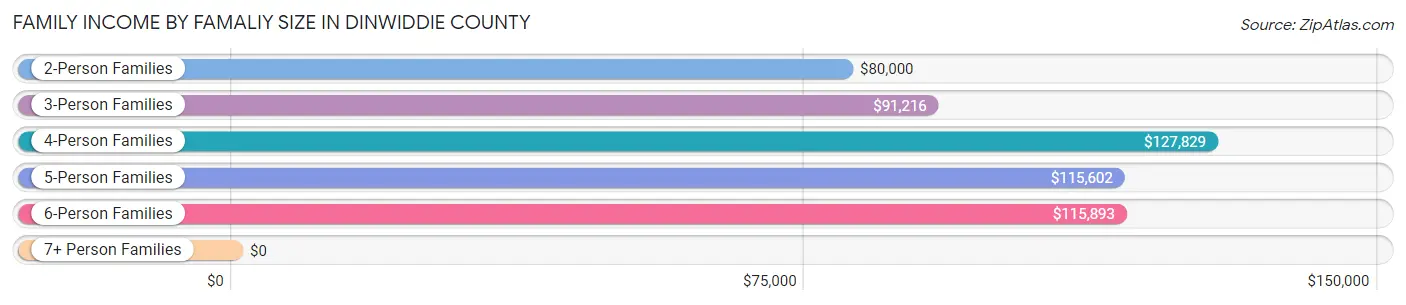
| Income Bracket | # Families | Median Income |
| 2-Person Families | 3,620 (49.8%) | $80,000 |
| 3-Person Families | 1,704 (23.4%) | $91,216 |
| 4-Person Families | 1,127 (15.5%) | $127,829 |
| 5-Person Families | 521 (7.2%) | $115,602 |
| 6-Person Families | 231 (3.2%) | $115,893 |
| 7+ Person Families | 65 (0.9%) | $0 |
| Total | 7,268 (100.0%) | $92,397 |
Family Income by Number of Earners in Dinwiddie County
The median family income in Dinwiddie County is $92,397, with families comprising 3+ earners (755) having the highest median family income of $159,225, while families with no earners (1,160) have the lowest median family income of $58,929, accounting for 10.4% and 16.0% of families, respectively.
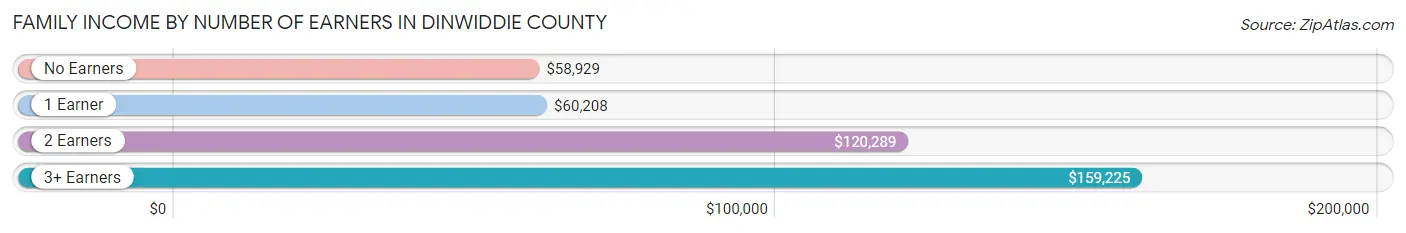
| Number of Earners | # Families | Median Income |
| No Earners | 1,160 (16.0%) | $58,929 |
| 1 Earner | 2,227 (30.6%) | $60,208 |
| 2 Earners | 3,126 (43.0%) | $120,289 |
| 3+ Earners | 755 (10.4%) | $159,225 |
| Total | 7,268 (100.0%) | $92,397 |
Household Income in Dinwiddie County
Household Income Brackets in Dinwiddie County
With 2,118 households falling in the category, the $100,000 to $149,999 income range is the most frequent in Dinwiddie County, accounting for 20.3% of all households. In contrast, only 428 households (4.1%) fall into the $10,000 to $14,999 income bracket, making it the least populous group.
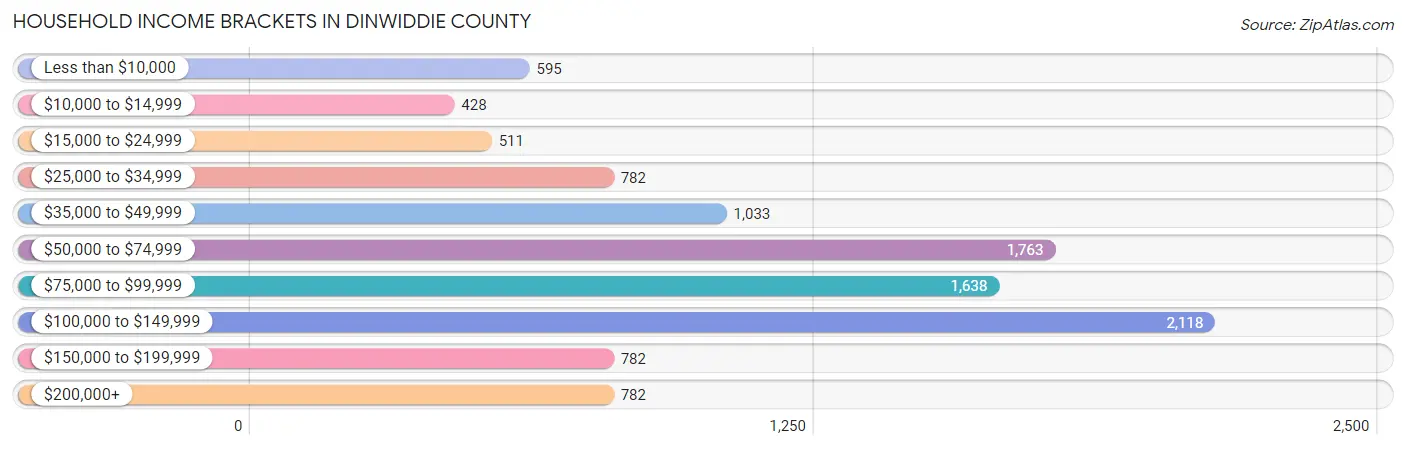
| Income Bracket | # Households | % Households |
| Less than $10,000 | 595 | 5.7% |
| $10,000 to $14,999 | 428 | 4.1% |
| $15,000 to $24,999 | 511 | 4.9% |
| $25,000 to $34,999 | 782 | 7.5% |
| $35,000 to $49,999 | 1,033 | 9.9% |
| $50,000 to $74,999 | 1,763 | 16.9% |
| $75,000 to $99,999 | 1,638 | 15.7% |
| $100,000 to $149,999 | 2,118 | 20.3% |
| $150,000 to $199,999 | 782 | 7.5% |
| $200,000+ | 782 | 7.5% |
Household Income by Householder Age in Dinwiddie County
The median household income in Dinwiddie County is $77,225, with the highest median household income of $87,841 found in the 25 to 44 years age bracket for the primary householder. A total of 2,751 households (26.4%) fall into this category. Meanwhile, the 65+ years age bracket for the primary householder has the lowest median household income of $58,398, with 3,374 households (32.3%) in this group.
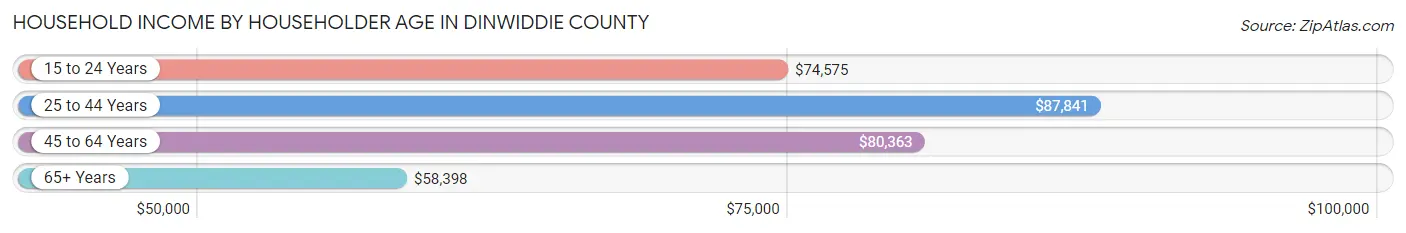
| Income Bracket | # Households | Median Income |
| 15 to 24 Years | 213 (2.0%) | $74,575 |
| 25 to 44 Years | 2,751 (26.4%) | $87,841 |
| 45 to 64 Years | 4,094 (39.2%) | $80,363 |
| 65+ Years | 3,374 (32.3%) | $58,398 |
| Total | 10,432 (100.0%) | $77,225 |
Poverty in Dinwiddie County
Income Below Poverty by Sex and Age in Dinwiddie County
With 9.2% poverty level for males and 12.9% for females among the residents of Dinwiddie County, 16 and 17 year old males and 75 year old and over females are the most vulnerable to poverty, with 159 males (38.4%) and 227 females (19.5%) in their respective age groups living below the poverty level.
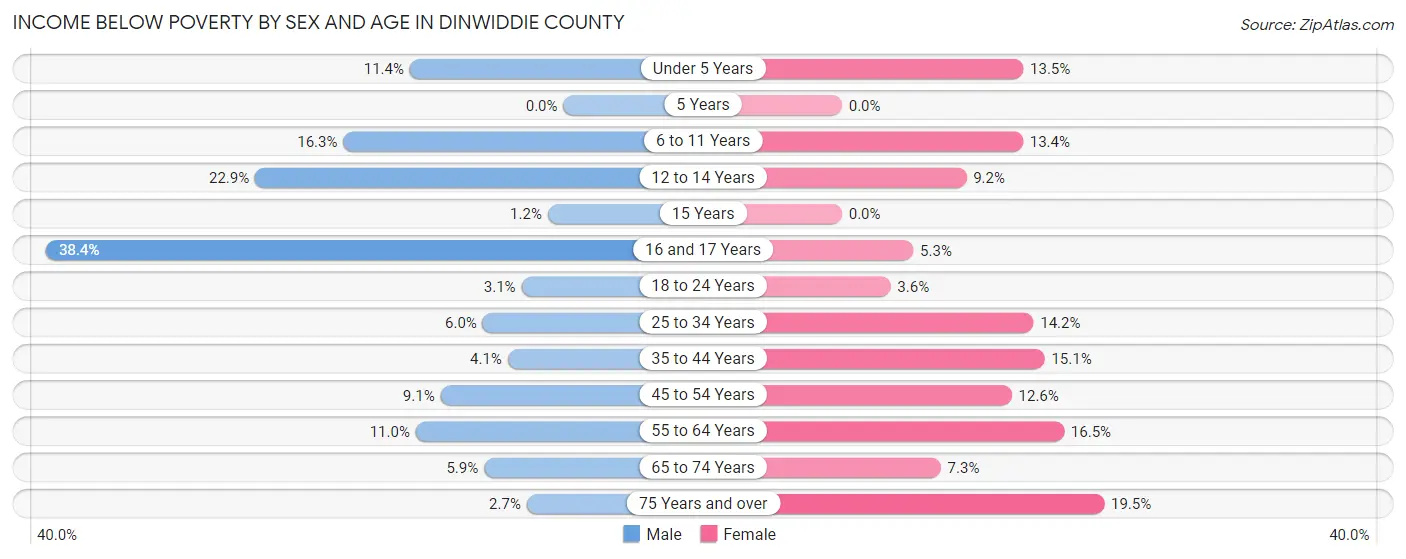
| Age Bracket | Male | Female |
| Under 5 Years | 87 (11.4%) | 89 (13.5%) |
| 5 Years | 0 (0.0%) | 0 (0.0%) |
| 6 to 11 Years | 152 (16.3%) | 149 (13.4%) |
| 12 to 14 Years | 144 (22.9%) | 29 (9.2%) |
| 15 Years | 1 (1.2%) | 0 (0.0%) |
| 16 and 17 Years | 159 (38.4%) | 17 (5.3%) |
| 18 to 24 Years | 34 (3.1%) | 27 (3.6%) |
| 25 to 34 Years | 99 (6.0%) | 261 (14.2%) |
| 35 to 44 Years | 62 (4.1%) | 235 (15.0%) |
| 45 to 54 Years | 168 (9.1%) | 240 (12.6%) |
| 55 to 64 Years | 238 (11.0%) | 368 (16.5%) |
| 65 to 74 Years | 86 (5.9%) | 118 (7.3%) |
| 75 Years and over | 24 (2.7%) | 227 (19.5%) |
| Total | 1,254 (9.2%) | 1,760 (12.9%) |
Income Above Poverty by Sex and Age in Dinwiddie County
According to the poverty statistics in Dinwiddie County, males aged 5 years and females aged 5 years are the age groups that are most secure financially, with 100.0% of males and 100.0% of females in these age groups living above the poverty line.
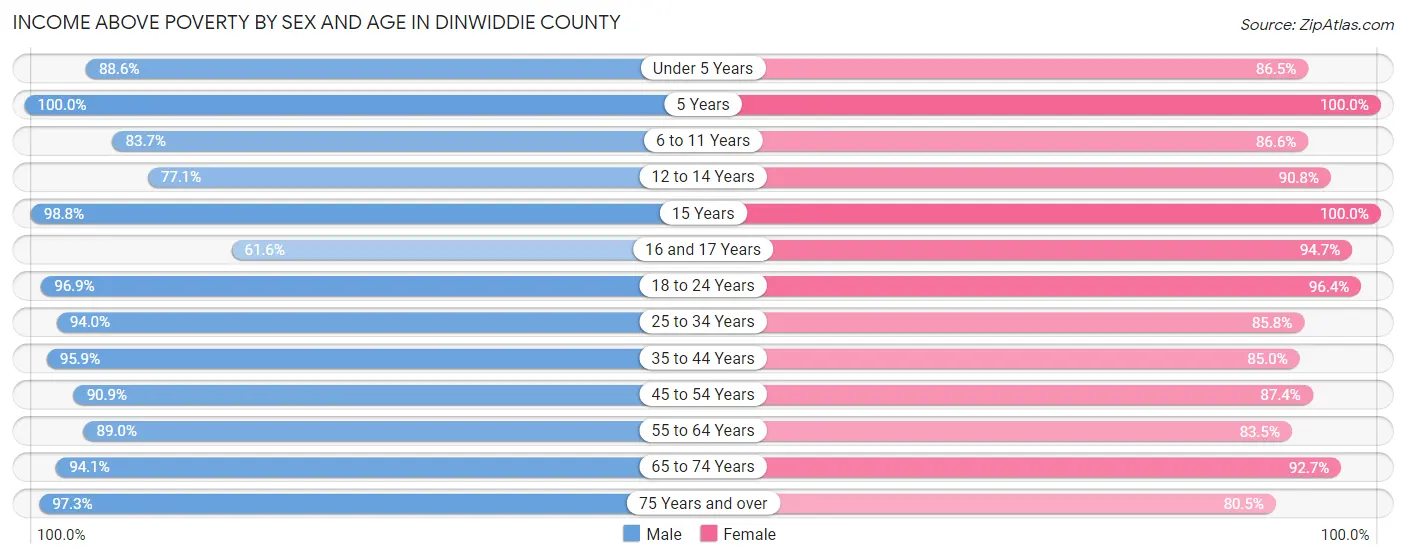
| Age Bracket | Male | Female |
| Under 5 Years | 676 (88.6%) | 572 (86.5%) |
| 5 Years | 179 (100.0%) | 77 (100.0%) |
| 6 to 11 Years | 778 (83.7%) | 960 (86.6%) |
| 12 to 14 Years | 485 (77.1%) | 285 (90.8%) |
| 15 Years | 85 (98.8%) | 142 (100.0%) |
| 16 and 17 Years | 255 (61.6%) | 304 (94.7%) |
| 18 to 24 Years | 1,058 (96.9%) | 721 (96.4%) |
| 25 to 34 Years | 1,554 (94.0%) | 1,574 (85.8%) |
| 35 to 44 Years | 1,439 (95.9%) | 1,326 (85.0%) |
| 45 to 54 Years | 1,675 (90.9%) | 1,663 (87.4%) |
| 55 to 64 Years | 1,933 (89.0%) | 1,863 (83.5%) |
| 65 to 74 Years | 1,373 (94.1%) | 1,490 (92.7%) |
| 75 Years and over | 859 (97.3%) | 939 (80.5%) |
| Total | 12,349 (90.8%) | 11,916 (87.1%) |
Income Below Poverty Among Married-Couple Families in Dinwiddie County
The poverty statistics for married-couple families in Dinwiddie County show that 3.3% or 181 of the total 5,494 families live below the poverty line. Families with no children have the highest poverty rate of 3.6%, comprising of 113 families. On the other hand, families with 3 or 4 children have the lowest poverty rate of 0.0%, which includes 0 families.
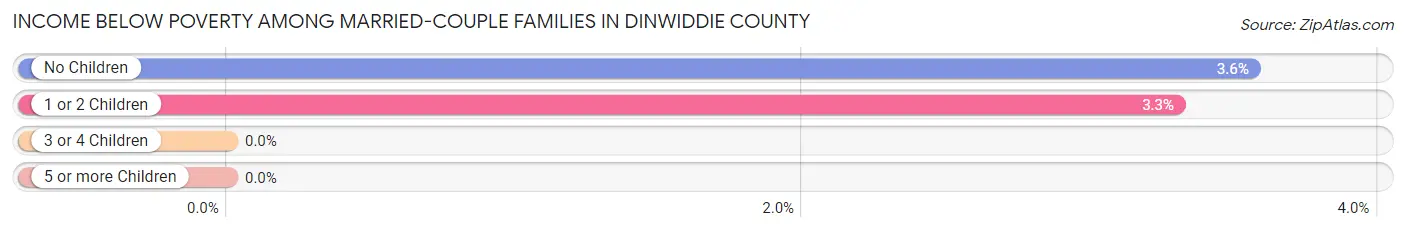
| Children | Above Poverty | Below Poverty |
| No Children | 3,058 (96.4%) | 113 (3.6%) |
| 1 or 2 Children | 1,994 (96.7%) | 68 (3.3%) |
| 3 or 4 Children | 232 (100.0%) | 0 (0.0%) |
| 5 or more Children | 29 (100.0%) | 0 (0.0%) |
| Total | 5,313 (96.7%) | 181 (3.3%) |
Income Below Poverty Among Single-Parent Households in Dinwiddie County
According to the poverty data in Dinwiddie County, 15.0% or 73 single-father households and 28.3% or 364 single-mother households are living below the poverty line. Among single-father households, those with 1 or 2 children have the highest poverty rate, with 55 households (23.3%) experiencing poverty. Likewise, among single-mother households, those with 5 or more children have the highest poverty rate, with 11 households (100.0%) falling below the poverty line.
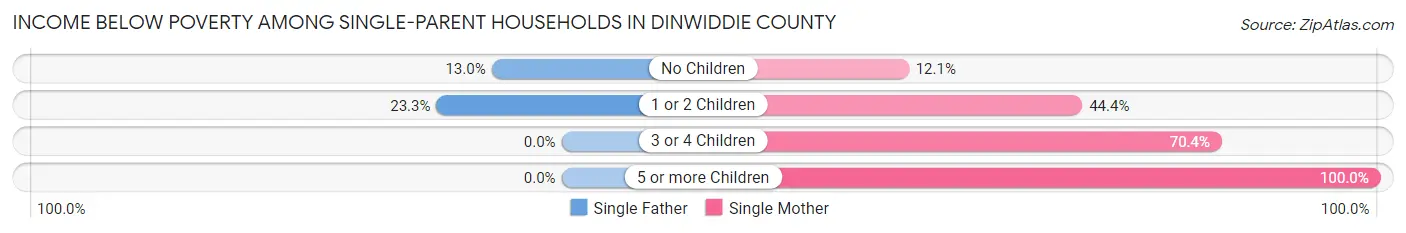
| Children | Single Father | Single Mother |
| No Children | 18 (13.0%) | 87 (12.1%) |
| 1 or 2 Children | 55 (23.3%) | 216 (44.4%) |
| 3 or 4 Children | 0 (0.0%) | 50 (70.4%) |
| 5 or more Children | 0 (0.0%) | 11 (100.0%) |
| Total | 73 (15.0%) | 364 (28.3%) |
Income Below Poverty Among Married-Couple vs Single-Parent Households in Dinwiddie County
The poverty data for Dinwiddie County shows that 181 of the married-couple family households (3.3%) and 437 of the single-parent households (24.6%) are living below the poverty level. Within the married-couple family households, those with no children have the highest poverty rate, with 113 households (3.6%) falling below the poverty line. Among the single-parent households, those with 5 or more children have the highest poverty rate, with 11 household (100.0%) living below poverty.
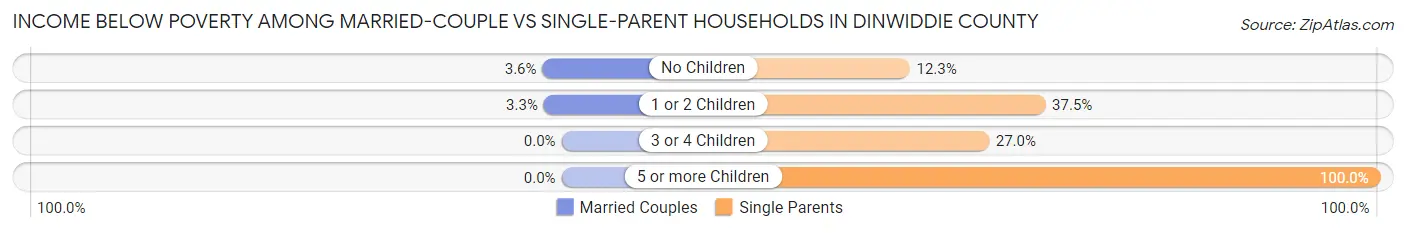
| Children | Married-Couple Families | Single-Parent Households |
| No Children | 113 (3.6%) | 105 (12.3%) |
| 1 or 2 Children | 68 (3.3%) | 271 (37.5%) |
| 3 or 4 Children | 0 (0.0%) | 50 (27.0%) |
| 5 or more Children | 0 (0.0%) | 11 (100.0%) |
| Total | 181 (3.3%) | 437 (24.6%) |
Race in Dinwiddie County
The most populous races in Dinwiddie County are White / Caucasian (18,340 | 65.4%), Black / African American (8,635 | 30.8%), and Hispanic or Latino (1,106 | 3.9%).
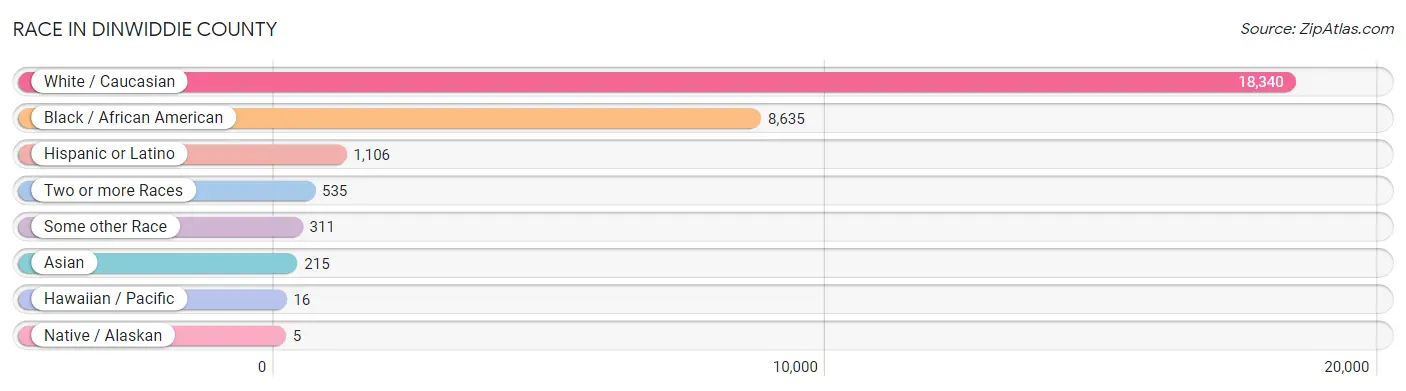
| Race | # Population | % Population |
| Asian | 215 | 0.8% |
| Black / African American | 8,635 | 30.8% |
| Hawaiian / Pacific | 16 | 0.1% |
| Hispanic or Latino | 1,106 | 3.9% |
| Native / Alaskan | 5 | 0.0% |
| White / Caucasian | 18,340 | 65.4% |
| Two or more Races | 535 | 1.9% |
| Some other Race | 311 | 1.1% |
| Total | 28,057 | 100.0% |
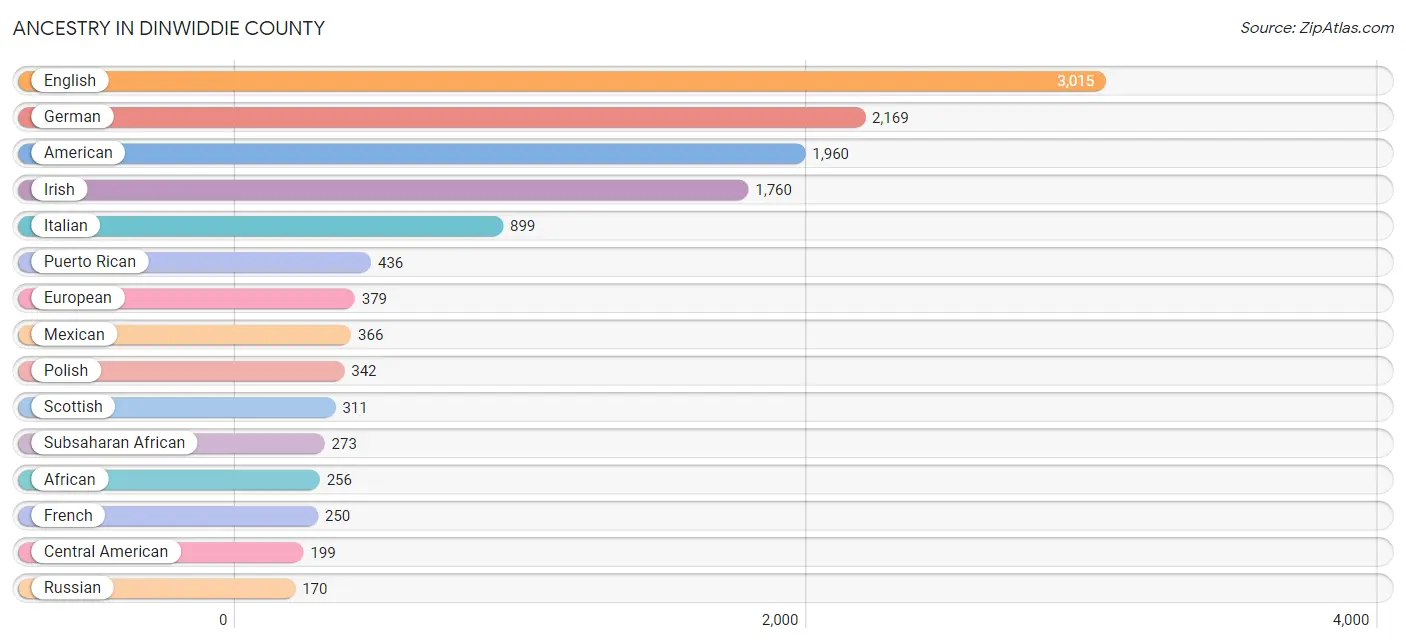
Ancestry in Dinwiddie County
The most populous ancestries reported in Dinwiddie County are English (3,015 | 10.7%), German (2,169 | 7.7%), American (1,960 | 7.0%), Irish (1,760 | 6.3%), and Italian (899 | 3.2%), together accounting for 34.9% of all Dinwiddie County residents.
| Ancestry | # Population | % Population |
| African | 256 | 0.9% |
| American | 1,960 | 7.0% |
| Arab | 45 | 0.2% |
| Australian | 7 | 0.0% |
| Bhutanese | 60 | 0.2% |
| Blackfeet | 7 | 0.0% |
| Bolivian | 34 | 0.1% |
| British | 76 | 0.3% |
| Burmese | 25 | 0.1% |
| Canadian | 56 | 0.2% |
| Central American | 199 | 0.7% |
| Cherokee | 5 | 0.0% |
| Choctaw | 7 | 0.0% |
| Colombian | 10 | 0.0% |
| Czech | 95 | 0.3% |
| Czechoslovakian | 37 | 0.1% |
| Danish | 6 | 0.0% |
| Dutch | 129 | 0.5% |
| Eastern European | 50 | 0.2% |
| English | 3,015 | 10.7% |
| Ethiopian | 6 | 0.0% |
| European | 379 | 1.3% |
| French | 250 | 0.9% |
| French American Indian | 4 | 0.0% |
| French Canadian | 11 | 0.0% |
| German | 2,169 | 7.7% |
| Ghanaian | 7 | 0.0% |
| Greek | 10 | 0.0% |
| Guamanian / Chamorro | 22 | 0.1% |
| Guyanese | 13 | 0.1% |
| Haitian | 17 | 0.1% |
| Honduran | 110 | 0.4% |
| Hungarian | 29 | 0.1% |
| Indian (Asian) | 101 | 0.4% |
| Irish | 1,760 | 6.3% |
| Italian | 899 | 3.2% |
| Jamaican | 29 | 0.1% |
| Japanese | 5 | 0.0% |
| Korean | 86 | 0.3% |
| Lebanese | 45 | 0.2% |
| Luxembourger | 56 | 0.2% |
| Mexican | 366 | 1.3% |
| Northern European | 19 | 0.1% |
| Norwegian | 114 | 0.4% |
| Pakistani | 32 | 0.1% |
| Polish | 342 | 1.2% |
| Puerto Rican | 436 | 1.5% |
| Romanian | 59 | 0.2% |
| Russian | 170 | 0.6% |
| Salvadoran | 89 | 0.3% |
| Scandinavian | 15 | 0.1% |
| Scotch-Irish | 138 | 0.5% |
| Scottish | 311 | 1.1% |
| Slavic | 8 | 0.0% |
| Slovak | 80 | 0.3% |
| South American | 44 | 0.2% |
| Spaniard | 21 | 0.1% |
| Sri Lankan | 44 | 0.2% |
| Subsaharan African | 273 | 1.0% |
| Swedish | 34 | 0.1% |
| Swiss | 10 | 0.0% |
| Thai | 6 | 0.0% |
| Tlingit-Haida | 5 | 0.0% |
| Ugandan | 1 | 0.0% |
| Ukrainian | 27 | 0.1% |
| Welsh | 12 | 0.0% | View All 66 Rows |
Immigrants in Dinwiddie County
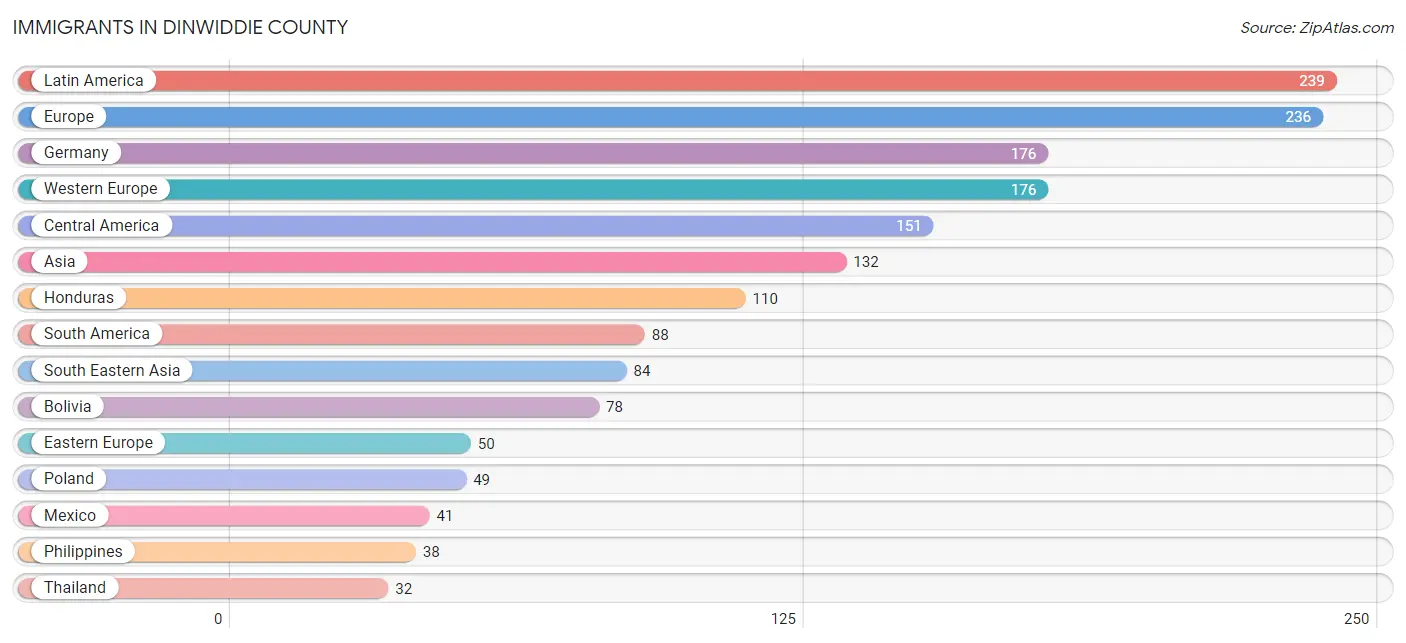
The most numerous immigrant groups reported in Dinwiddie County came from Latin America (239 | 0.9%), Europe (236 | 0.8%), Germany (176 | 0.6%), Western Europe (176 | 0.6%), and Central America (151 | 0.5%), together accounting for 3.5% of all Dinwiddie County residents.
| Immigration Origin | # Population | % Population |
| Africa | 3 | 0.0% |
| Asia | 132 | 0.5% |
| Bolivia | 78 | 0.3% |
| Cameroon | 2 | 0.0% |
| Canada | 28 | 0.1% |
| Central America | 151 | 0.5% |
| China | 15 | 0.1% |
| Colombia | 10 | 0.0% |
| Eastern Africa | 1 | 0.0% |
| Eastern Asia | 31 | 0.1% |
| Eastern Europe | 50 | 0.2% |
| Europe | 236 | 0.8% |
| Germany | 176 | 0.6% |
| Honduras | 110 | 0.4% |
| Hong Kong | 8 | 0.0% |
| India | 17 | 0.1% |
| Korea | 16 | 0.1% |
| Latin America | 239 | 0.9% |
| Mexico | 41 | 0.2% |
| Middle Africa | 2 | 0.0% |
| Philippines | 38 | 0.1% |
| Poland | 49 | 0.2% |
| South America | 88 | 0.3% |
| South Central Asia | 17 | 0.1% |
| South Eastern Asia | 84 | 0.3% |
| Southern Europe | 10 | 0.0% |
| Spain | 10 | 0.0% |
| Thailand | 32 | 0.1% |
| Vietnam | 14 | 0.1% |
| Western Europe | 176 | 0.6% | View All 30 Rows |
Sex and Age in Dinwiddie County
Sex and Age in Dinwiddie County
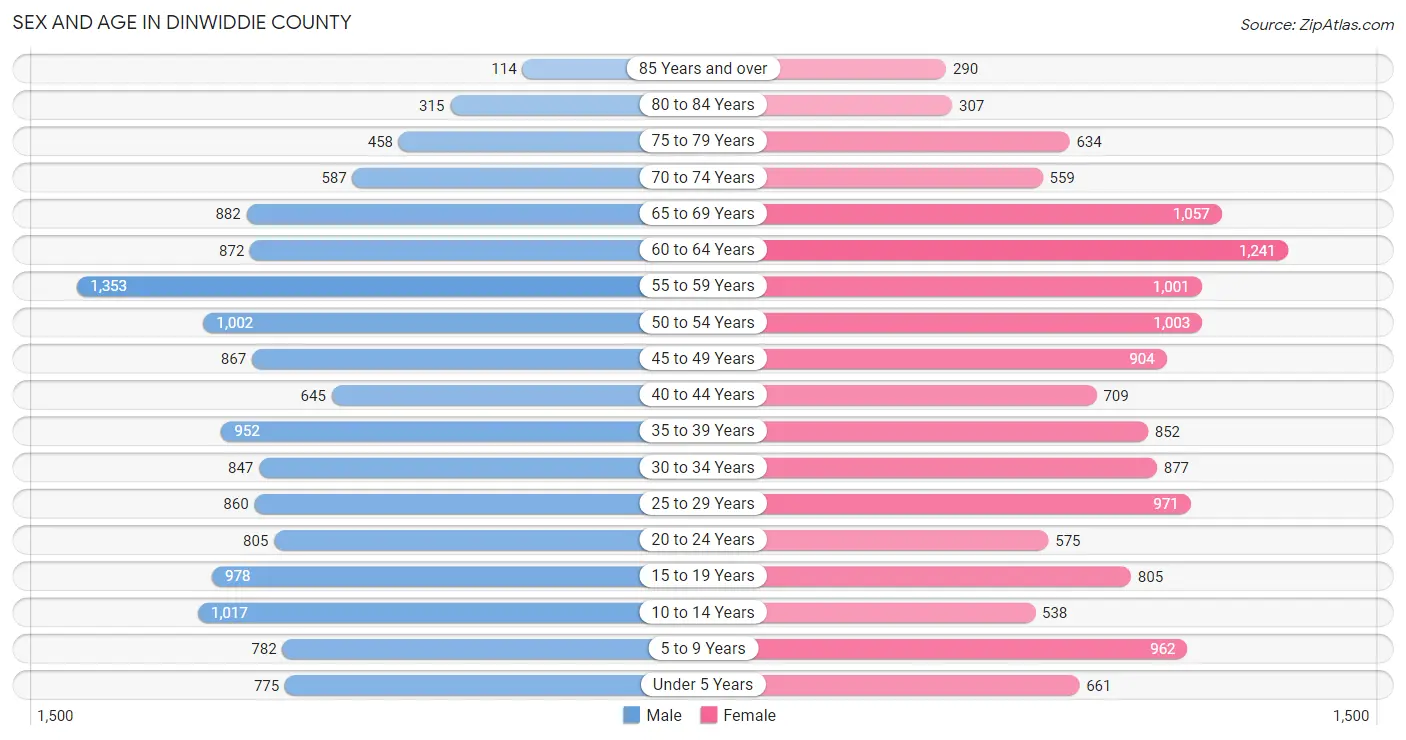
The most populous age groups in Dinwiddie County are 55 to 59 Years (1,353 | 9.6%) for men and 60 to 64 Years (1,241 | 8.9%) for women.
| Age Bracket | Male | Female |
| Under 5 Years | 775 (5.5%) | 661 (4.7%) |
| 5 to 9 Years | 782 (5.5%) | 962 (6.9%) |
| 10 to 14 Years | 1,017 (7.2%) | 538 (3.9%) |
| 15 to 19 Years | 978 (6.9%) | 805 (5.8%) |
| 20 to 24 Years | 805 (5.7%) | 575 (4.1%) |
| 25 to 29 Years | 860 (6.1%) | 971 (7.0%) |
| 30 to 34 Years | 847 (6.0%) | 877 (6.3%) |
| 35 to 39 Years | 952 (6.8%) | 852 (6.1%) |
| 40 to 44 Years | 645 (4.6%) | 709 (5.1%) |
| 45 to 49 Years | 867 (6.1%) | 904 (6.5%) |
| 50 to 54 Years | 1,002 (7.1%) | 1,003 (7.2%) |
| 55 to 59 Years | 1,353 (9.6%) | 1,001 (7.2%) |
| 60 to 64 Years | 872 (6.2%) | 1,241 (8.9%) |
| 65 to 69 Years | 882 (6.2%) | 1,057 (7.6%) |
| 70 to 74 Years | 587 (4.2%) | 559 (4.0%) |
| 75 to 79 Years | 458 (3.3%) | 634 (4.5%) |
| 80 to 84 Years | 315 (2.2%) | 307 (2.2%) |
| 85 Years and over | 114 (0.8%) | 290 (2.1%) |
| Total | 14,111 (100.0%) | 13,946 (100.0%) |
Families and Households in Dinwiddie County
Median Family Size in Dinwiddie County
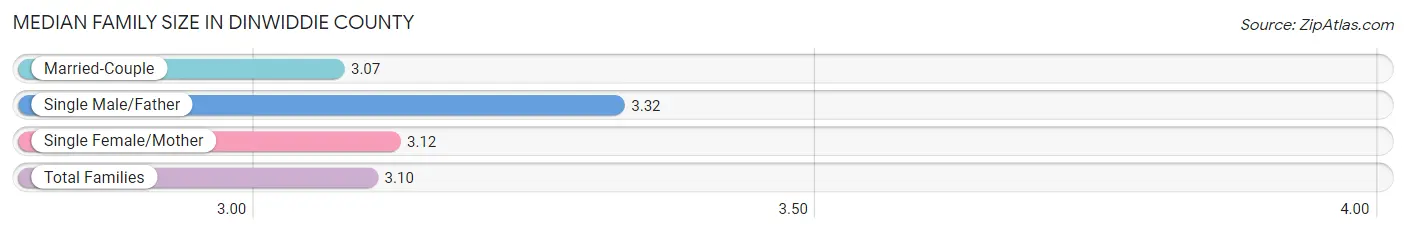
The median family size in Dinwiddie County is 3.10 persons per family, with single male/father families (488 | 6.7%) accounting for the largest median family size of 3.32 persons per family. On the other hand, married-couple families (5,494 | 75.6%) represent the smallest median family size with 3.07 persons per family.
| Family Type | # Families | Family Size |
| Married-Couple | 5,494 (75.6%) | 3.07 |
| Single Male/Father | 488 (6.7%) | 3.32 |
| Single Female/Mother | 1,286 (17.7%) | 3.12 |
| Total Families | 7,268 (100.0%) | 3.10 |
Median Household Size in Dinwiddie County
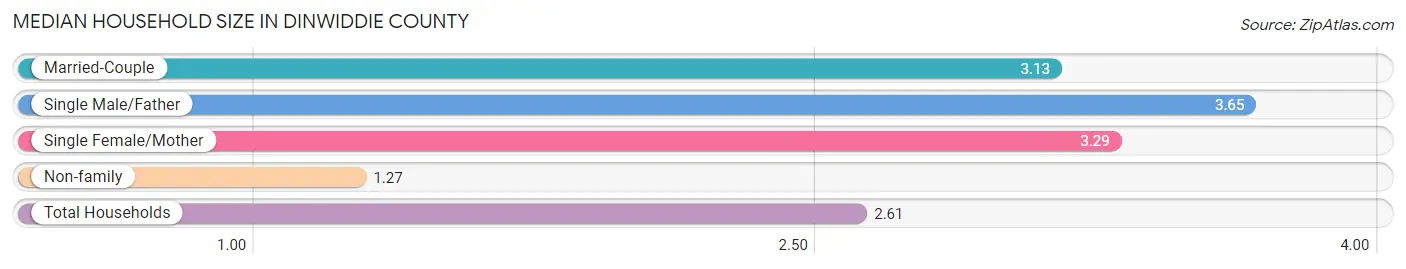
The median household size in Dinwiddie County is 2.61 persons per household, with single male/father households (488 | 4.7%) accounting for the largest median household size of 3.65 persons per household. non-family households (3,164 | 30.3%) represent the smallest median household size with 1.27 persons per household.
| Household Type | # Households | Household Size |
| Married-Couple | 5,494 (52.7%) | 3.13 |
| Single Male/Father | 488 (4.7%) | 3.65 |
| Single Female/Mother | 1,286 (12.3%) | 3.29 |
| Non-family | 3,164 (30.3%) | 1.27 |
| Total Households | 10,432 (100.0%) | 2.61 |
Household Size by Marriage Status in Dinwiddie County
Out of a total of 10,432 households in Dinwiddie County, 7,268 (69.7%) are family households, while 3,164 (30.3%) are nonfamily households. The most numerous type of family households are 2-person households, comprising 3,374, and the most common type of nonfamily households are 1-person households, comprising 2,488.
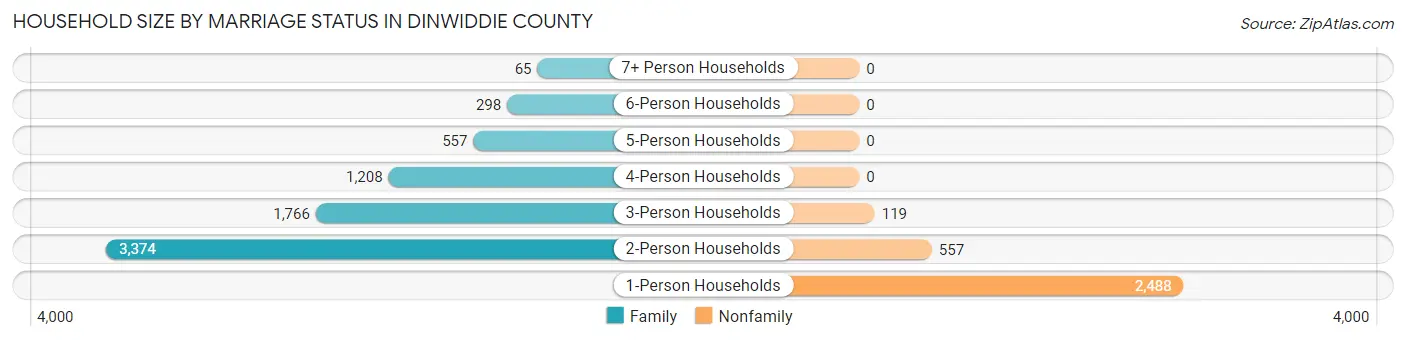
| Household Size | Family Households | Nonfamily Households |
| 1-Person Households | - | 2,488 (23.8%) |
| 2-Person Households | 3,374 (32.3%) | 557 (5.3%) |
| 3-Person Households | 1,766 (16.9%) | 119 (1.1%) |
| 4-Person Households | 1,208 (11.6%) | 0 (0.0%) |
| 5-Person Households | 557 (5.3%) | 0 (0.0%) |
| 6-Person Households | 298 (2.9%) | 0 (0.0%) |
| 7+ Person Households | 65 (0.6%) | 0 (0.0%) |
| Total | 7,268 (69.7%) | 3,164 (30.3%) |
Female Fertility in Dinwiddie County
Fertility by Age in Dinwiddie County
Average fertility rate in Dinwiddie County is 57.0 births per 1,000 women. Women in the age bracket of 20 to 34 years have the highest fertility rate with 106.0 births per 1,000 women. Women in the age bracket of 20 to 34 years acount for 77.6% of all women with births.
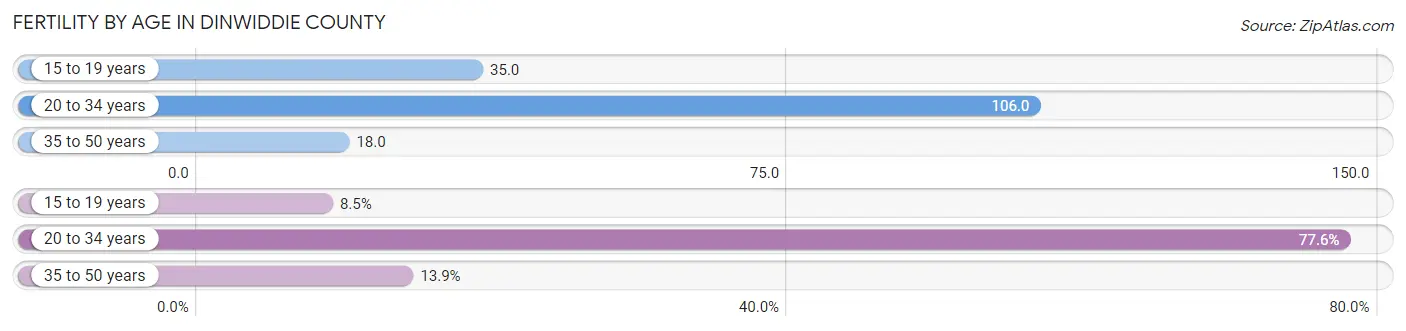
| Age Bracket | Women with Births | Births / 1,000 Women |
| 15 to 19 years | 28 (8.5%) | 35.0 |
| 20 to 34 years | 256 (77.6%) | 106.0 |
| 35 to 50 years | 46 (13.9%) | 18.0 |
| Total | 330 (100.0%) | 57.0 |
Fertility by Age by Marriage Status in Dinwiddie County
58.2% of women with births (330) in Dinwiddie County are married. The highest percentage of unmarried women with births falls into 15 to 19 years age bracket with 100.0% of them unmarried at the time of birth, while the lowest percentage of unmarried women with births belong to 20 to 34 years age bracket with 35.2% of them unmarried.
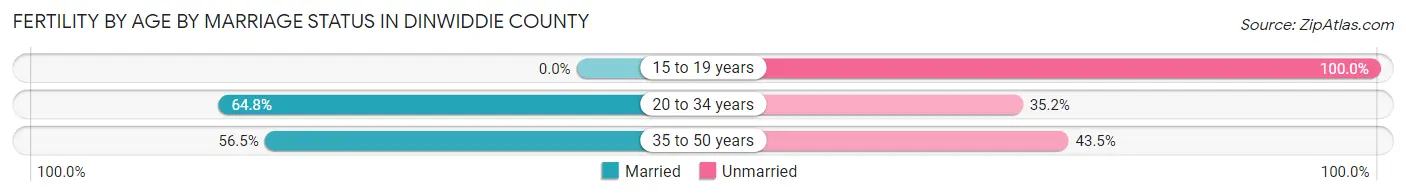
| Age Bracket | Married | Unmarried |
| 15 to 19 years | 0 (0.0%) | 28 (100.0%) |
| 20 to 34 years | 166 (64.8%) | 90 (35.2%) |
| 35 to 50 years | 26 (56.5%) | 20 (43.5%) |
| Total | 192 (58.2%) | 138 (41.8%) |
Fertility by Education in Dinwiddie County
Average fertility rate in Dinwiddie County is 57.0 births per 1,000 women. Women with the education attainment of high school diploma have the highest fertility rate of 77.0 births per 1,000 women, while women with the education attainment of graduate degree have the lowest fertility at 10.0 births per 1,000 women. Women with the education attainment of college or associate's degree represent 41.2% of all women with births.
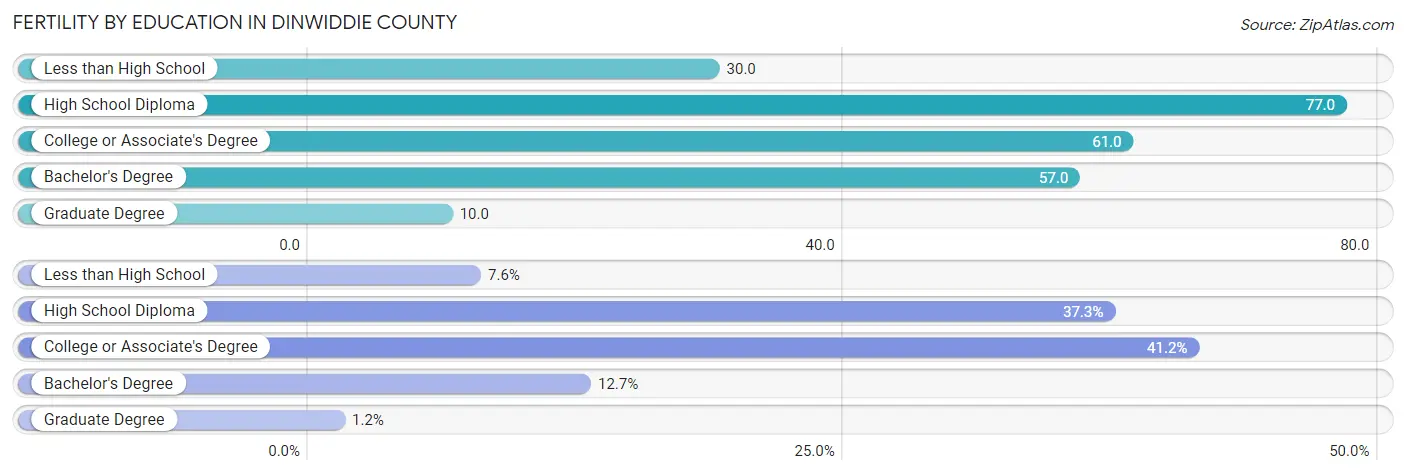
| Educational Attainment | Women with Births | Births / 1,000 Women |
| Less than High School | 25 (7.6%) | 30.0 |
| High School Diploma | 123 (37.3%) | 77.0 |
| College or Associate's Degree | 136 (41.2%) | 61.0 |
| Bachelor's Degree | 42 (12.7%) | 57.0 |
| Graduate Degree | 4 (1.2%) | 10.0 |
| Total | 330 (100.0%) | 57.0 |
Fertility by Education by Marriage Status in Dinwiddie County
41.8% of women with births in Dinwiddie County are unmarried. Women with the educational attainment of graduate degree are most likely to be married with 100.0% of them married at childbirth, while women with the educational attainment of college or associate's degree are least likely to be married with 53.7% of them unmarried at childbirth.
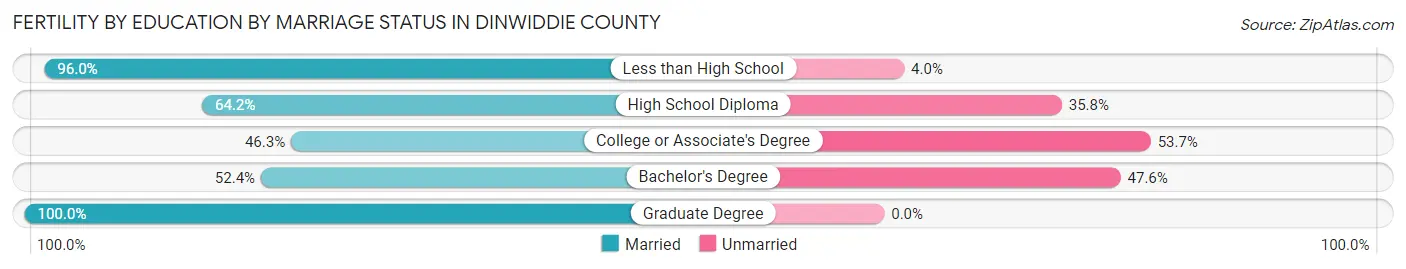
| Educational Attainment | Married | Unmarried |
| Less than High School | 24 (96.0%) | 1 (4.0%) |
| High School Diploma | 79 (64.2%) | 44 (35.8%) |
| College or Associate's Degree | 63 (46.3%) | 73 (53.7%) |
| Bachelor's Degree | 22 (52.4%) | 20 (47.6%) |
| Graduate Degree | 4 (100.0%) | 0 (0.0%) |
| Total | 192 (58.2%) | 138 (41.8%) |
Employment Characteristics in Dinwiddie County
Employment by Class of Employer in Dinwiddie County
Among the 13,371 employed individuals in Dinwiddie County, private company employees (8,763 | 65.5%), local government employees (1,300 | 9.7%), and federal government employees (989 | 7.4%) make up the most common classes of employment.
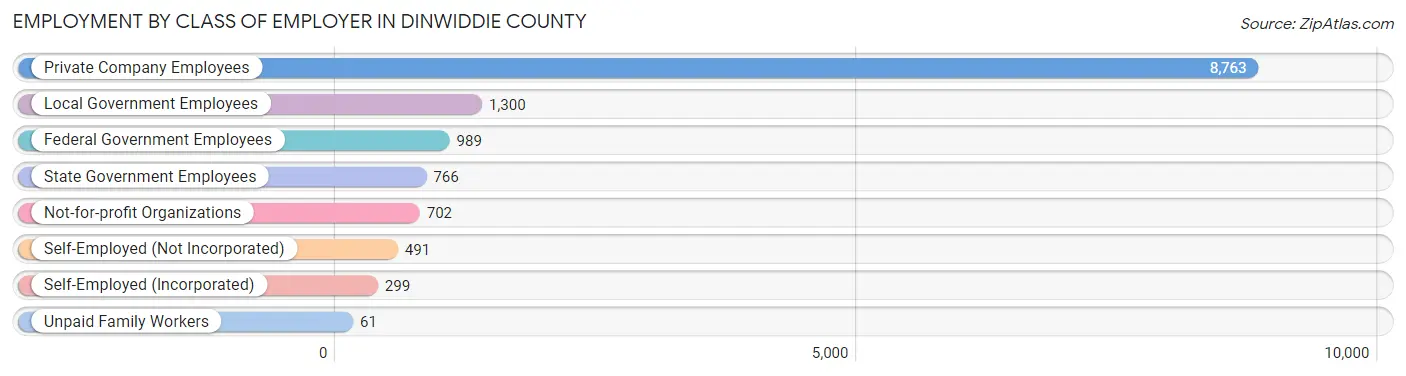
| Employer Class | # Employees | % Employees |
| Private Company Employees | 8,763 | 65.5% |
| Self-Employed (Incorporated) | 299 | 2.2% |
| Self-Employed (Not Incorporated) | 491 | 3.7% |
| Not-for-profit Organizations | 702 | 5.2% |
| Local Government Employees | 1,300 | 9.7% |
| State Government Employees | 766 | 5.7% |
| Federal Government Employees | 989 | 7.4% |
| Unpaid Family Workers | 61 | 0.5% |
| Total | 13,371 | 100.0% |
Employment Status by Age in Dinwiddie County
According to the labor force statistics for Dinwiddie County, out of the total population over 16 years of age (23,092), 61.6% or 14,225 individuals are in the labor force, with 4.7% or 669 of them unemployed. The age group with the highest labor force participation rate is 30 to 34 years, with 92.3% or 1,591 individuals in the labor force. Within the labor force, the 16 to 19 years age range has the highest percentage of unemployed individuals, with 13.1% or 94 of them being unemployed.
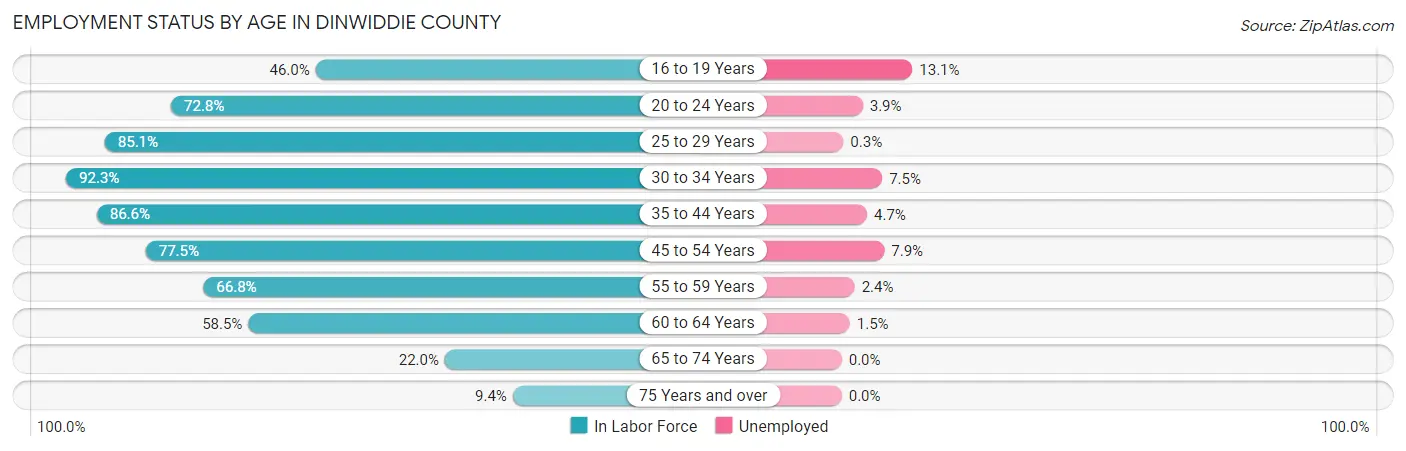
| Age Bracket | In Labor Force | Unemployed |
| 16 to 19 Years | 714 (46.0%) | 94 (13.1%) |
| 20 to 24 Years | 1,005 (72.8%) | 39 (3.9%) |
| 25 to 29 Years | 1,558 (85.1%) | 5 (0.3%) |
| 30 to 34 Years | 1,591 (92.3%) | 119 (7.5%) |
| 35 to 44 Years | 2,735 (86.6%) | 129 (4.7%) |
| 45 to 54 Years | 2,926 (77.5%) | 231 (7.9%) |
| 55 to 59 Years | 1,572 (66.8%) | 38 (2.4%) |
| 60 to 64 Years | 1,236 (58.5%) | 19 (1.5%) |
| 65 to 74 Years | 679 (22.0%) | 0 (0.0%) |
| 75 Years and over | 199 (9.4%) | 0 (0.0%) |
| Total | 14,225 (61.6%) | 669 (4.7%) |
Employment Status by Educational Attainment in Dinwiddie County
According to labor force statistics for Dinwiddie County, 77.7% of individuals (11,621) out of the total population between 25 and 64 years of age (14,956) are in the labor force, with 4.6% or 535 of them being unemployed. The group with the highest labor force participation rate are those with the educational attainment of bachelor's degree or higher, with 90.0% or 2,461 individuals in the labor force. Within the labor force, individuals with less than high school education have the highest percentage of unemployment, with 7.3% or 56 of them being unemployed.
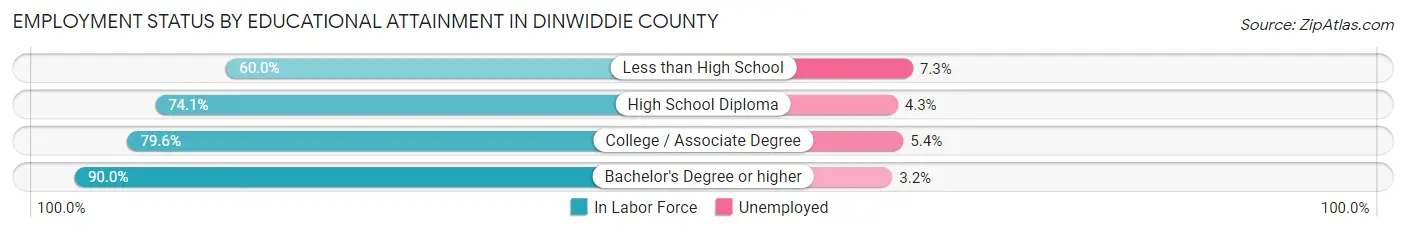
| Educational Attainment | In Labor Force | Unemployed |
| Less than High School | 766 (60.0%) | 93 (7.3%) |
| High School Diploma | 4,350 (74.1%) | 252 (4.3%) |
| College / Associate Degree | 4,040 (79.6%) | 274 (5.4%) |
| Bachelor's Degree or higher | 2,461 (90.0%) | 87 (3.2%) |
| Total | 11,621 (77.7%) | 688 (4.6%) |
Employment Occupations by Sex in Dinwiddie County
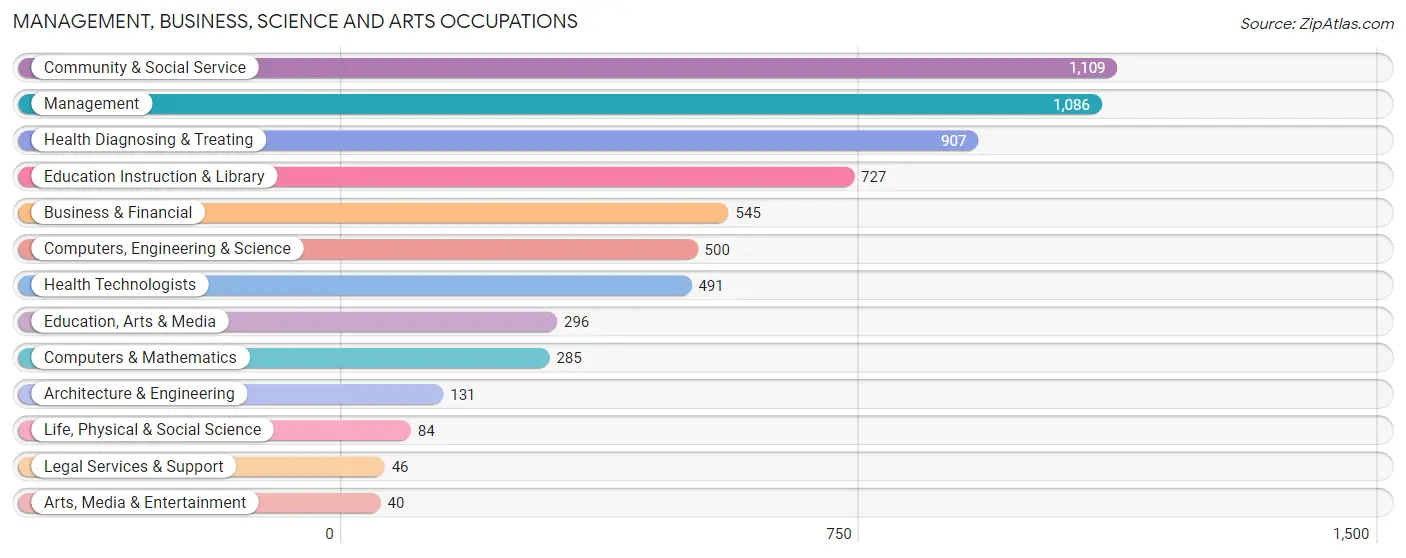
Management, Business, Science and Arts Occupations
The most common Management, Business, Science and Arts occupations in Dinwiddie County are Community & Social Service (1,109 | 8.2%), Management (1,086 | 8.0%), Health Diagnosing & Treating (907 | 6.7%), Education Instruction & Library (727 | 5.4%), and Business & Financial (545 | 4.0%).
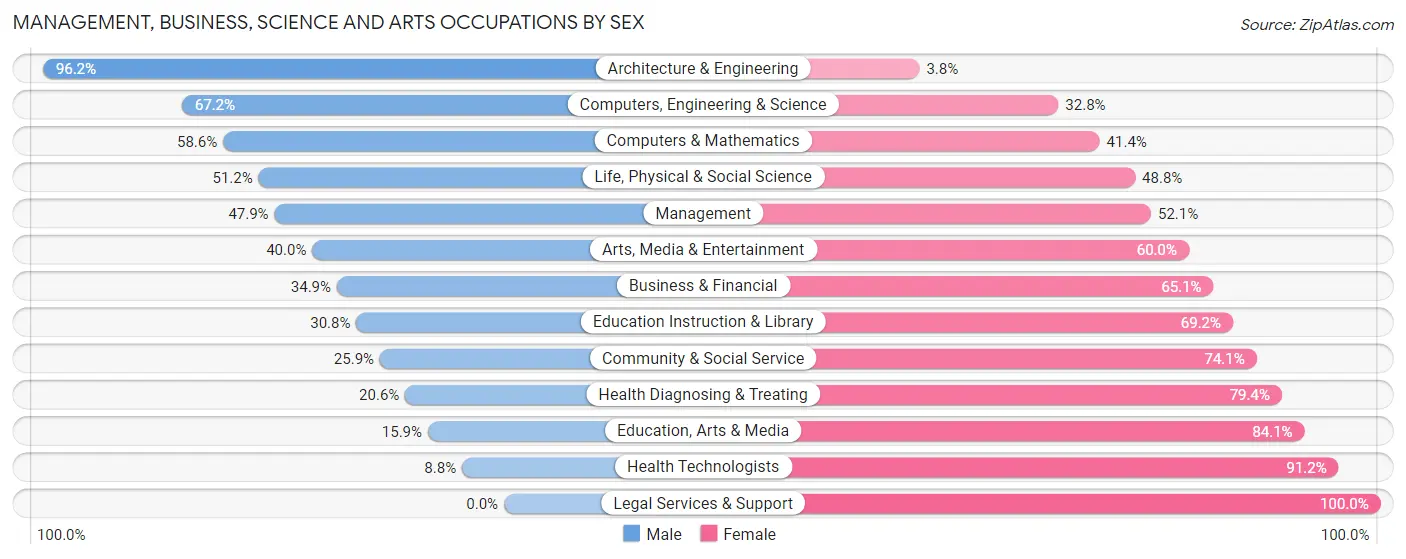
Management, Business, Science and Arts Occupations by Sex
Within the Management, Business, Science and Arts occupations in Dinwiddie County, the most male-oriented occupations are Architecture & Engineering (96.2%), Computers, Engineering & Science (67.2%), and Computers & Mathematics (58.6%), while the most female-oriented occupations are Legal Services & Support (100.0%), Health Technologists (91.2%), and Education, Arts & Media (84.1%).
| Occupation | Male | Female |
| Management | 520 (47.9%) | 566 (52.1%) |
| Business & Financial | 190 (34.9%) | 355 (65.1%) |
| Computers, Engineering & Science | 336 (67.2%) | 164 (32.8%) |
| Computers & Mathematics | 167 (58.6%) | 118 (41.4%) |
| Architecture & Engineering | 126 (96.2%) | 5 (3.8%) |
| Life, Physical & Social Science | 43 (51.2%) | 41 (48.8%) |
| Community & Social Service | 287 (25.9%) | 822 (74.1%) |
| Education, Arts & Media | 47 (15.9%) | 249 (84.1%) |
| Legal Services & Support | 0 (0.0%) | 46 (100.0%) |
| Education Instruction & Library | 224 (30.8%) | 503 (69.2%) |
| Arts, Media & Entertainment | 16 (40.0%) | 24 (60.0%) |
| Health Diagnosing & Treating | 187 (20.6%) | 720 (79.4%) |
| Health Technologists | 43 (8.8%) | 448 (91.2%) |
| Total (Category) | 1,520 (36.6%) | 2,627 (63.3%) |
| Total (Overall) | 7,170 (53.0%) | 6,346 (46.9%) |
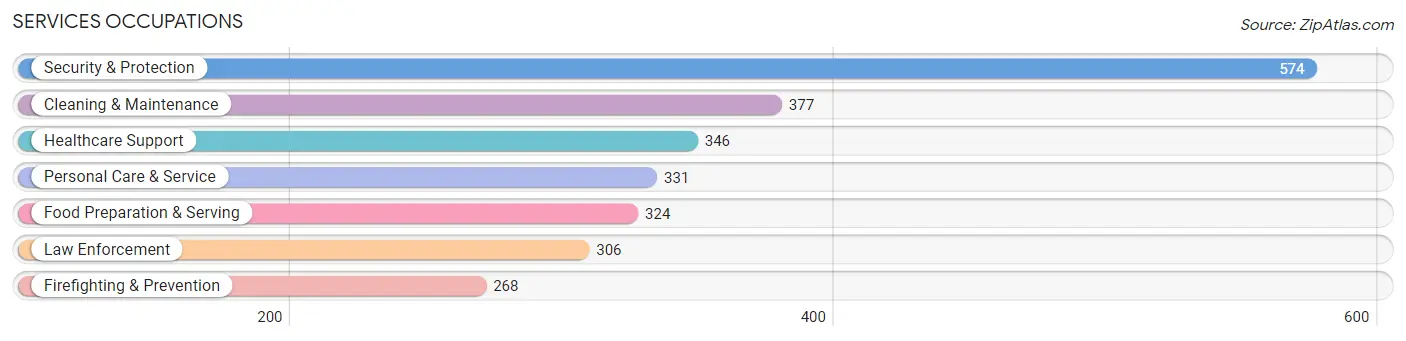
Services Occupations
The most common Services occupations in Dinwiddie County are Security & Protection (574 | 4.3%), Cleaning & Maintenance (377 | 2.8%), Healthcare Support (346 | 2.6%), Personal Care & Service (331 | 2.5%), and Food Preparation & Serving (324 | 2.4%).
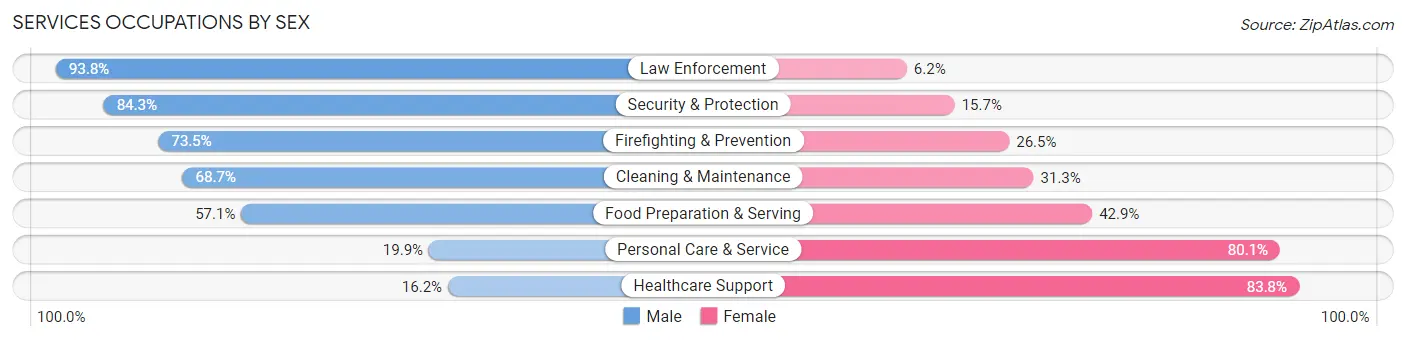
Services Occupations by Sex
Within the Services occupations in Dinwiddie County, the most male-oriented occupations are Law Enforcement (93.8%), Security & Protection (84.3%), and Firefighting & Prevention (73.5%), while the most female-oriented occupations are Healthcare Support (83.8%), Personal Care & Service (80.1%), and Food Preparation & Serving (42.9%).
| Occupation | Male | Female |
| Healthcare Support | 56 (16.2%) | 290 (83.8%) |
| Security & Protection | 484 (84.3%) | 90 (15.7%) |
| Firefighting & Prevention | 197 (73.5%) | 71 (26.5%) |
| Law Enforcement | 287 (93.8%) | 19 (6.2%) |
| Food Preparation & Serving | 185 (57.1%) | 139 (42.9%) |
| Cleaning & Maintenance | 259 (68.7%) | 118 (31.3%) |
| Personal Care & Service | 66 (19.9%) | 265 (80.1%) |
| Total (Category) | 1,050 (53.8%) | 902 (46.2%) |
| Total (Overall) | 7,170 (53.0%) | 6,346 (46.9%) |
Sales and Office Occupations
The most common Sales and Office occupations in Dinwiddie County are Office & Administration (1,840 | 13.6%), and Sales & Related (1,264 | 9.3%).

Sales and Office Occupations by Sex
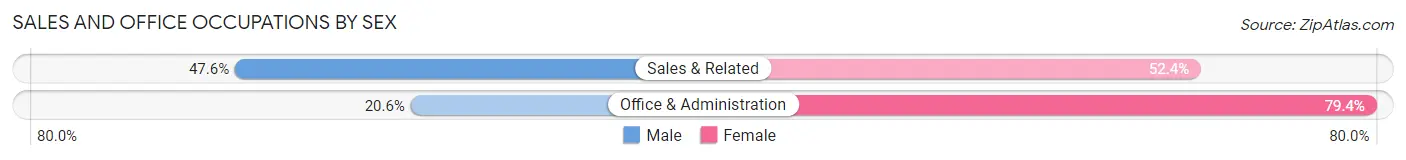
| Occupation | Male | Female |
| Sales & Related | 602 (47.6%) | 662 (52.4%) |
| Office & Administration | 379 (20.6%) | 1,461 (79.4%) |
| Total (Category) | 981 (31.6%) | 2,123 (68.4%) |
| Total (Overall) | 7,170 (53.0%) | 6,346 (46.9%) |
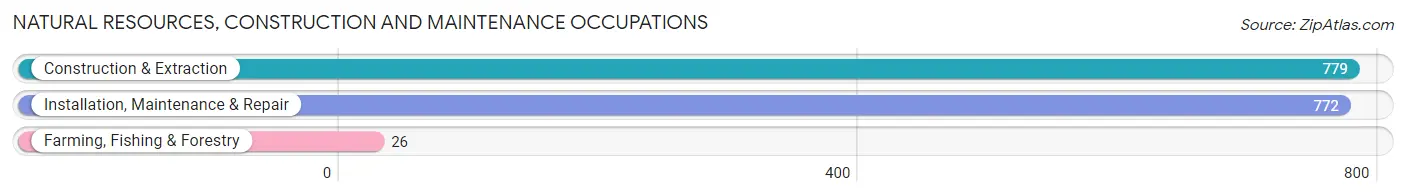
Natural Resources, Construction and Maintenance Occupations
The most common Natural Resources, Construction and Maintenance occupations in Dinwiddie County are Construction & Extraction (779 | 5.8%), Installation, Maintenance & Repair (772 | 5.7%), and Farming, Fishing & Forestry (26 | 0.2%).
Natural Resources, Construction and Maintenance Occupations by Sex
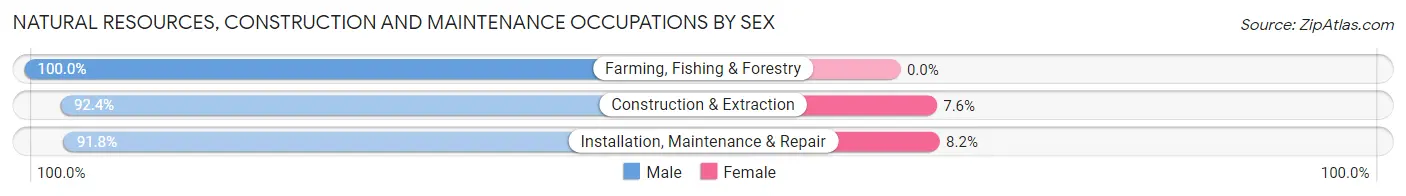
| Occupation | Male | Female |
| Farming, Fishing & Forestry | 26 (100.0%) | 0 (0.0%) |
| Construction & Extraction | 720 (92.4%) | 59 (7.6%) |
| Installation, Maintenance & Repair | 709 (91.8%) | 63 (8.2%) |
| Total (Category) | 1,455 (92.3%) | 122 (7.7%) |
| Total (Overall) | 7,170 (53.0%) | 6,346 (46.9%) |
Production, Transportation and Moving Occupations
The most common Production, Transportation and Moving occupations in Dinwiddie County are Transportation (1,085 | 8.0%), Production (910 | 6.7%), and Material Moving (741 | 5.5%).
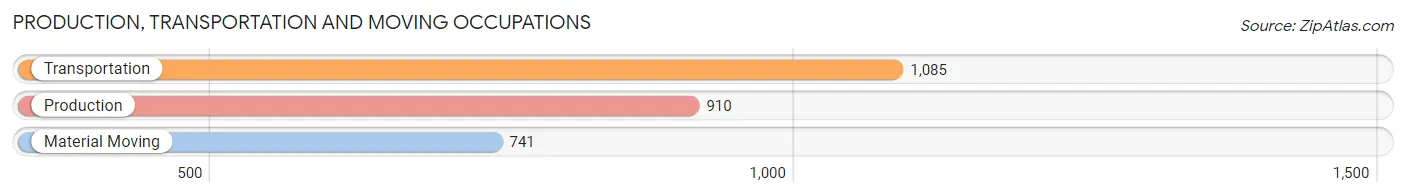
Production, Transportation and Moving Occupations by Sex
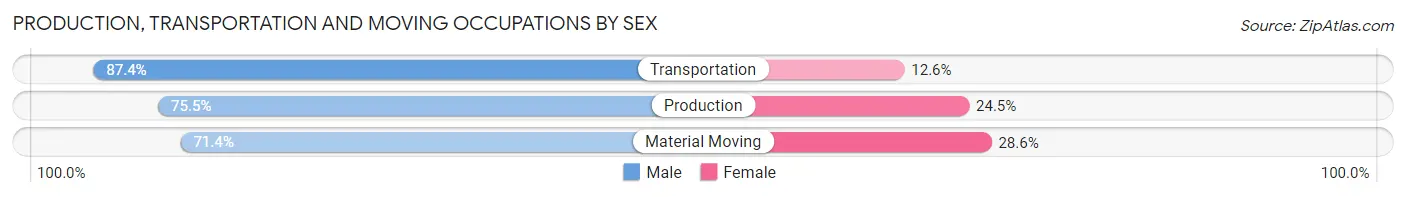
| Occupation | Male | Female |
| Production | 687 (75.5%) | 223 (24.5%) |
| Transportation | 948 (87.4%) | 137 (12.6%) |
| Material Moving | 529 (71.4%) | 212 (28.6%) |
| Total (Category) | 2,164 (79.1%) | 572 (20.9%) |
| Total (Overall) | 7,170 (53.0%) | 6,346 (46.9%) |
Employment Industries by Sex in Dinwiddie County
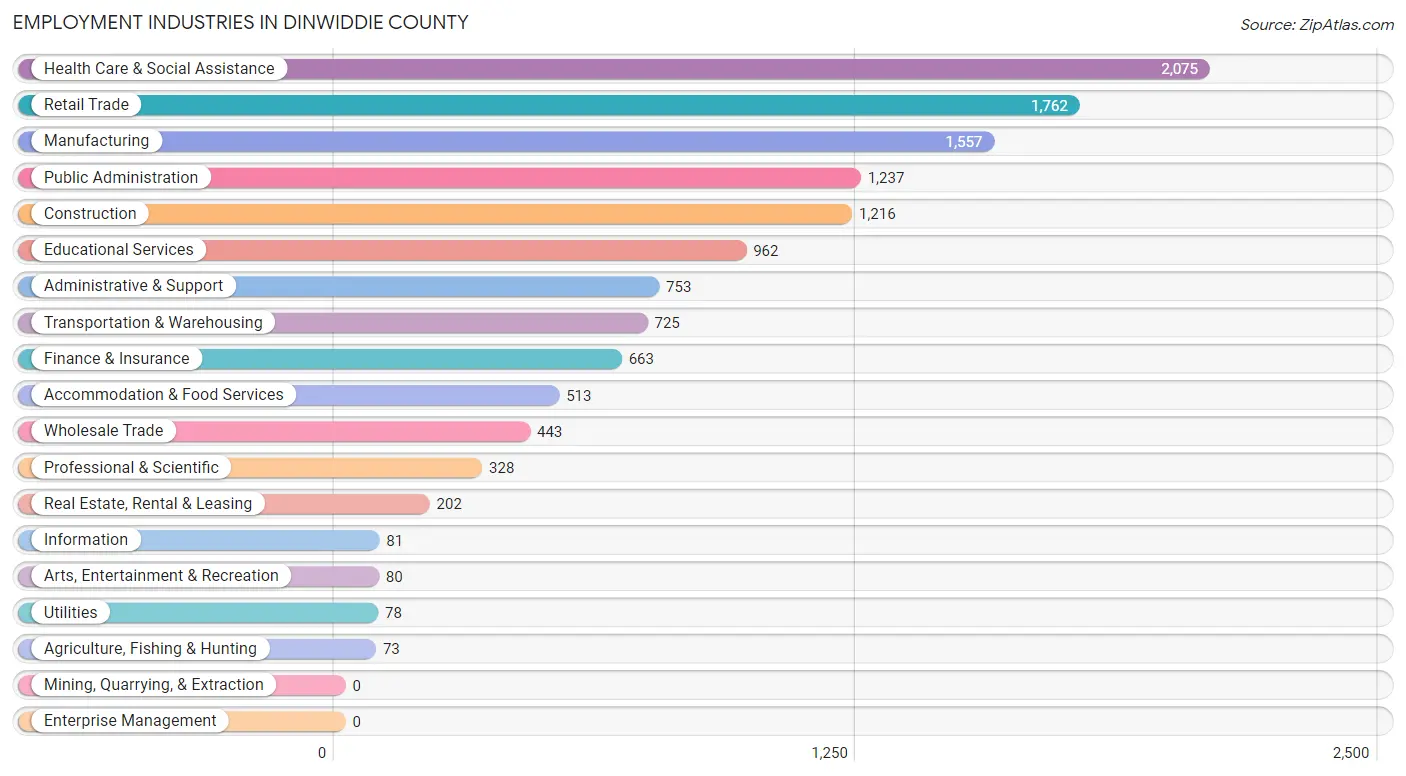
Employment Industries in Dinwiddie County
The major employment industries in Dinwiddie County include Health Care & Social Assistance (2,075 | 15.3%), Retail Trade (1,762 | 13.0%), Manufacturing (1,557 | 11.5%), Public Administration (1,237 | 9.1%), and Construction (1,216 | 9.0%).
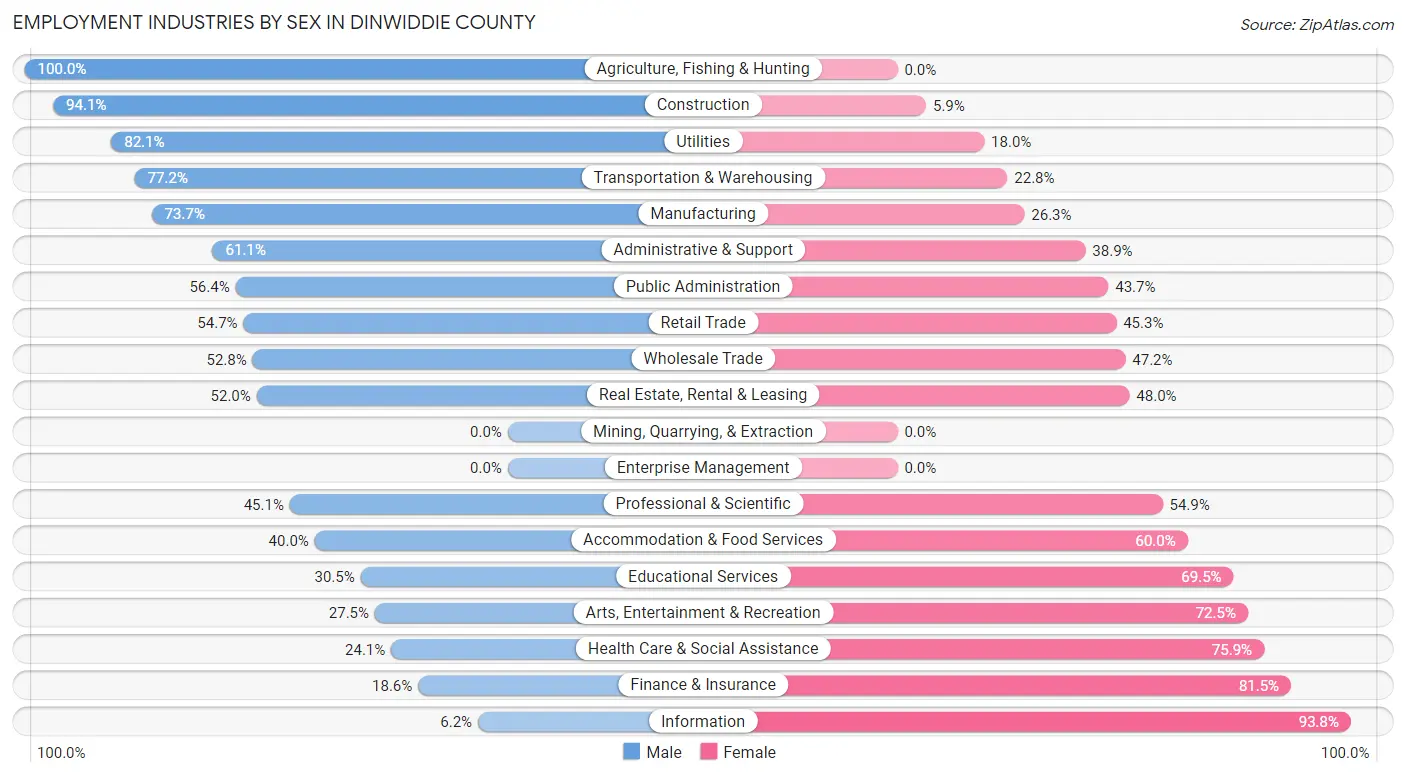
Employment Industries by Sex in Dinwiddie County
The Dinwiddie County industries that see more men than women are Agriculture, Fishing & Hunting (100.0%), Construction (94.1%), and Utilities (82.1%), whereas the industries that tend to have a higher number of women are Information (93.8%), Finance & Insurance (81.5%), and Health Care & Social Assistance (75.9%).
| Industry | Male | Female |
| Agriculture, Fishing & Hunting | 73 (100.0%) | 0 (0.0%) |
| Mining, Quarrying, & Extraction | 0 (0.0%) | 0 (0.0%) |
| Construction | 1,144 (94.1%) | 72 (5.9%) |
| Manufacturing | 1,148 (73.7%) | 409 (26.3%) |
| Wholesale Trade | 234 (52.8%) | 209 (47.2%) |
| Retail Trade | 964 (54.7%) | 798 (45.3%) |
| Transportation & Warehousing | 560 (77.2%) | 165 (22.8%) |
| Utilities | 64 (82.1%) | 14 (17.9%) |
| Information | 5 (6.2%) | 76 (93.8%) |
| Finance & Insurance | 123 (18.5%) | 540 (81.5%) |
| Real Estate, Rental & Leasing | 105 (52.0%) | 97 (48.0%) |
| Professional & Scientific | 148 (45.1%) | 180 (54.9%) |
| Enterprise Management | 0 (0.0%) | 0 (0.0%) |
| Administrative & Support | 460 (61.1%) | 293 (38.9%) |
| Educational Services | 293 (30.5%) | 669 (69.5%) |
| Health Care & Social Assistance | 501 (24.1%) | 1,574 (75.9%) |
| Arts, Entertainment & Recreation | 22 (27.5%) | 58 (72.5%) |
| Accommodation & Food Services | 205 (40.0%) | 308 (60.0%) |
| Public Administration | 697 (56.4%) | 540 (43.6%) |
| Total | 7,170 (53.0%) | 6,346 (46.9%) |
Education in Dinwiddie County
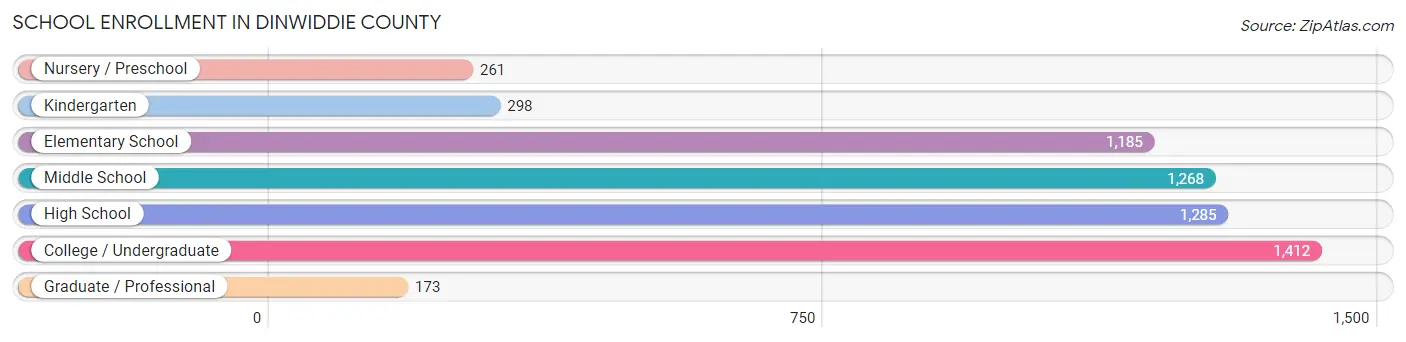
School Enrollment in Dinwiddie County
The most common levels of schooling among the 5,882 students in Dinwiddie County are college / undergraduate (1,412 | 24.0%), high school (1,285 | 21.8%), and middle school (1,268 | 21.6%).
| School Level | # Students | % Students |
| Nursery / Preschool | 261 | 4.4% |
| Kindergarten | 298 | 5.1% |
| Elementary School | 1,185 | 20.2% |
| Middle School | 1,268 | 21.6% |
| High School | 1,285 | 21.8% |
| College / Undergraduate | 1,412 | 24.0% |
| Graduate / Professional | 173 | 2.9% |
| Total | 5,882 | 100.0% |
School Enrollment by Age by Funding Source in Dinwiddie County
Out of a total of 5,882 students who are enrolled in schools in Dinwiddie County, 1,212 (20.6%) attend a private institution, while the remaining 4,670 (79.4%) are enrolled in public schools. The age group of 35 years and over has the highest likelihood of being enrolled in private schools, with 195 (62.9% in the age bracket) enrolled. Conversely, the age group of 20 to 24 year olds has the lowest likelihood of being enrolled in a private school, with 526 (92.4% in the age bracket) attending a public institution.
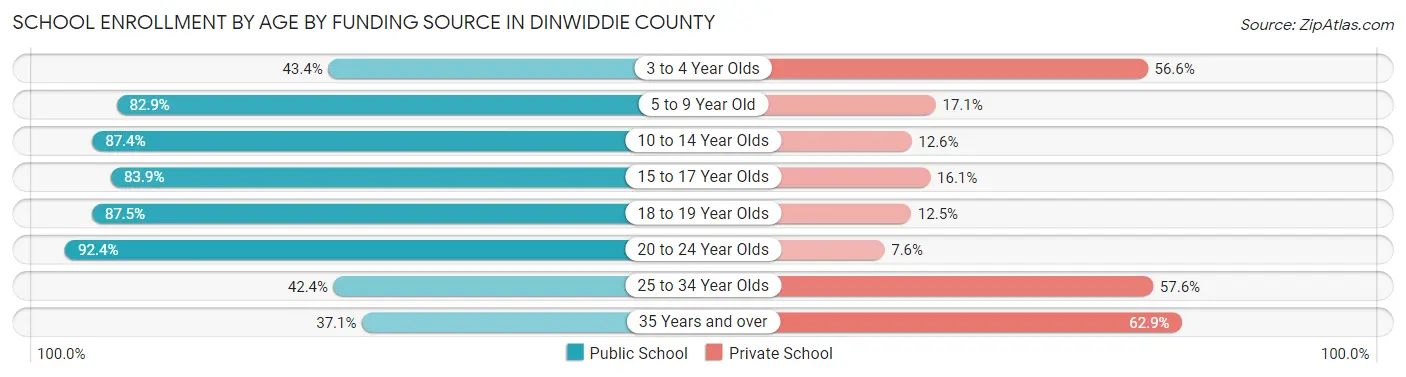
| Age Bracket | Public School | Private School |
| 3 to 4 Year Olds | 92 (43.4%) | 120 (56.6%) |
| 5 to 9 Year Old | 1,177 (82.9%) | 243 (17.1%) |
| 10 to 14 Year Olds | 1,275 (87.4%) | 184 (12.6%) |
| 15 to 17 Year Olds | 808 (83.9%) | 155 (16.1%) |
| 18 to 19 Year Olds | 531 (87.5%) | 76 (12.5%) |
| 20 to 24 Year Olds | 526 (92.4%) | 43 (7.6%) |
| 25 to 34 Year Olds | 145 (42.4%) | 197 (57.6%) |
| 35 Years and over | 115 (37.1%) | 195 (62.9%) |
| Total | 4,670 (79.4%) | 1,212 (20.6%) |
Educational Attainment by Field of Study in Dinwiddie County
Business (737 | 18.6%), education (547 | 13.8%), arts & humanities (488 | 12.3%), science & technology (435 | 11.0%), and literature & languages (297 | 7.5%) are the most common fields of study among 3,966 individuals in Dinwiddie County who have obtained a bachelor's degree or higher.
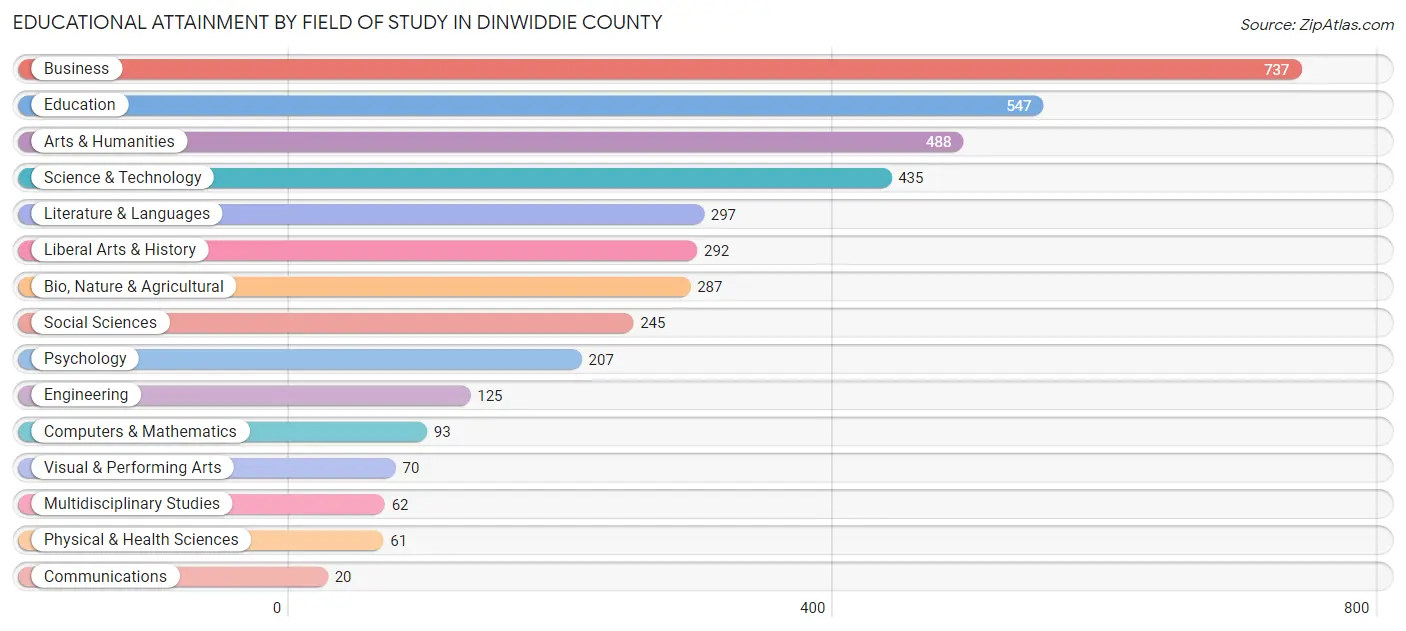
| Field of Study | # Graduates | % Graduates |
| Computers & Mathematics | 93 | 2.3% |
| Bio, Nature & Agricultural | 287 | 7.2% |
| Physical & Health Sciences | 61 | 1.5% |
| Psychology | 207 | 5.2% |
| Social Sciences | 245 | 6.2% |
| Engineering | 125 | 3.2% |
| Multidisciplinary Studies | 62 | 1.6% |
| Science & Technology | 435 | 11.0% |
| Business | 737 | 18.6% |
| Education | 547 | 13.8% |
| Literature & Languages | 297 | 7.5% |
| Liberal Arts & History | 292 | 7.4% |
| Visual & Performing Arts | 70 | 1.8% |
| Communications | 20 | 0.5% |
| Arts & Humanities | 488 | 12.3% |
| Total | 3,966 | 100.0% |
Transportation & Commute in Dinwiddie County
Vehicle Availability by Sex in Dinwiddie County
The most prevalent vehicle ownership categories in Dinwiddie County are males with 3 vehicles (2,757, accounting for 39.0%) and females with 3 vehicles (2,051, making up 44.4%).
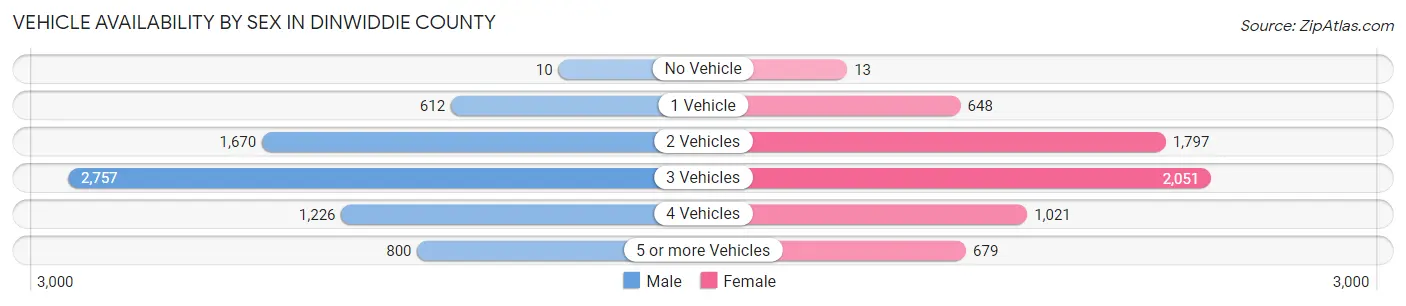
| Vehicles Available | Male | Female |
| No Vehicle | 10 (0.1%) | 13 (0.2%) |
| 1 Vehicle | 612 (8.6%) | 648 (10.4%) |
| 2 Vehicles | 1,670 (23.6%) | 1,797 (28.9%) |
| 3 Vehicles | 2,757 (39.0%) | 2,051 (33.0%) |
| 4 Vehicles | 1,226 (17.3%) | 1,021 (16.4%) |
| 5 or more Vehicles | 800 (11.3%) | 679 (10.9%) |
| Total | 7,075 (100.0%) | 6,209 (100.0%) |
Commute Time in Dinwiddie County
The most frequently occuring commute durations in Dinwiddie County are 30 to 34 minutes (1,864 commuters, 15.3%), 45 to 59 minutes (1,562 commuters, 12.8%), and 20 to 24 minutes (1,379 commuters, 11.3%).
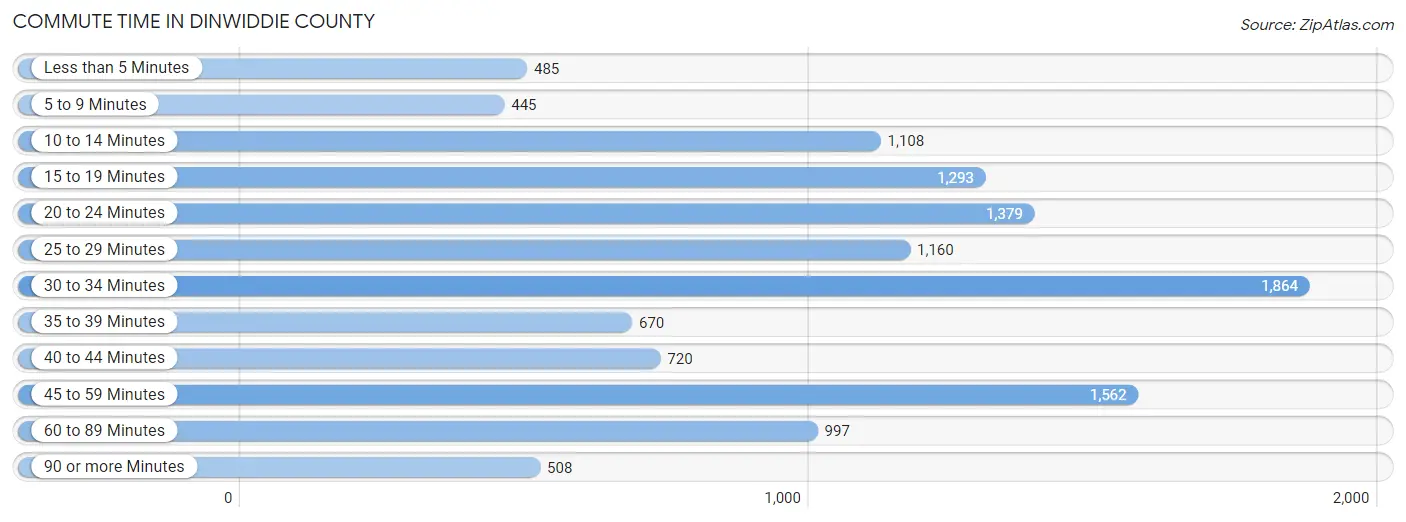
| Commute Time | # Commuters | % Commuters |
| Less than 5 Minutes | 485 | 4.0% |
| 5 to 9 Minutes | 445 | 3.6% |
| 10 to 14 Minutes | 1,108 | 9.1% |
| 15 to 19 Minutes | 1,293 | 10.6% |
| 20 to 24 Minutes | 1,379 | 11.3% |
| 25 to 29 Minutes | 1,160 | 9.5% |
| 30 to 34 Minutes | 1,864 | 15.3% |
| 35 to 39 Minutes | 670 | 5.5% |
| 40 to 44 Minutes | 720 | 5.9% |
| 45 to 59 Minutes | 1,562 | 12.8% |
| 60 to 89 Minutes | 997 | 8.2% |
| 90 or more Minutes | 508 | 4.2% |
Commute Time by Sex in Dinwiddie County
The most common commute times in Dinwiddie County are 30 to 34 minutes (1,067 commuters, 16.0%) for males and 30 to 34 minutes (797 commuters, 14.4%) for females.
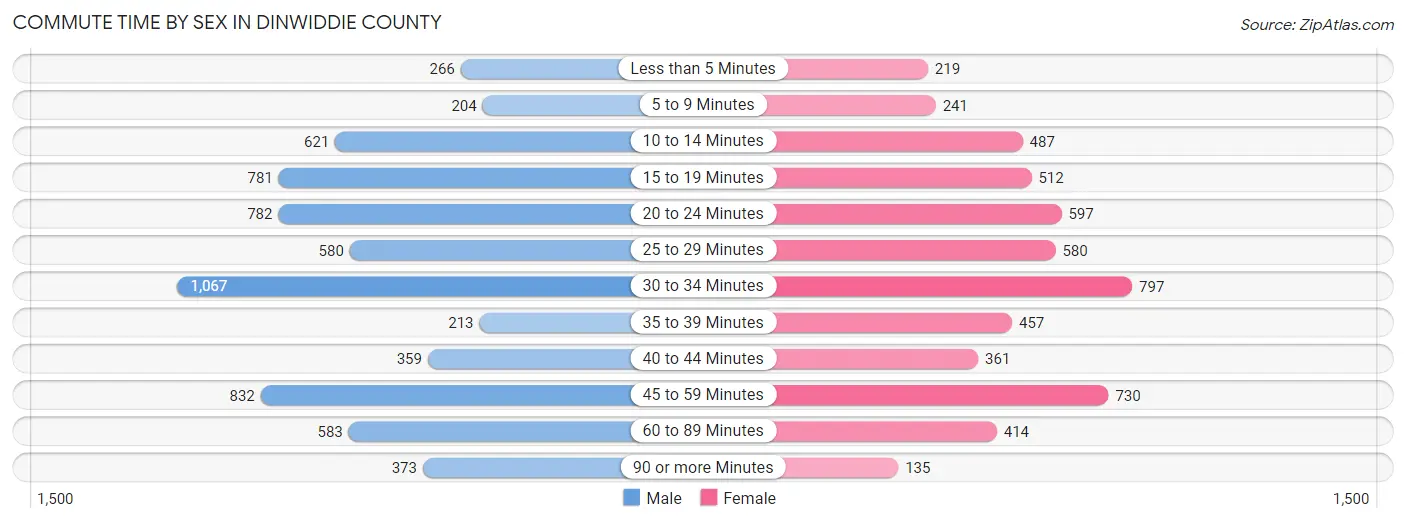
| Commute Time | Male | Female |
| Less than 5 Minutes | 266 (4.0%) | 219 (4.0%) |
| 5 to 9 Minutes | 204 (3.1%) | 241 (4.4%) |
| 10 to 14 Minutes | 621 (9.3%) | 487 (8.8%) |
| 15 to 19 Minutes | 781 (11.7%) | 512 (9.3%) |
| 20 to 24 Minutes | 782 (11.7%) | 597 (10.8%) |
| 25 to 29 Minutes | 580 (8.7%) | 580 (10.5%) |
| 30 to 34 Minutes | 1,067 (16.0%) | 797 (14.4%) |
| 35 to 39 Minutes | 213 (3.2%) | 457 (8.3%) |
| 40 to 44 Minutes | 359 (5.4%) | 361 (6.5%) |
| 45 to 59 Minutes | 832 (12.5%) | 730 (13.2%) |
| 60 to 89 Minutes | 583 (8.7%) | 414 (7.5%) |
| 90 or more Minutes | 373 (5.6%) | 135 (2.4%) |
Time of Departure to Work by Sex in Dinwiddie County
The most frequent times of departure to work in Dinwiddie County are 6:00 AM to 6:29 AM (1,092, 16.4%) for males and 6:00 AM to 6:29 AM (939, 17.0%) for females.
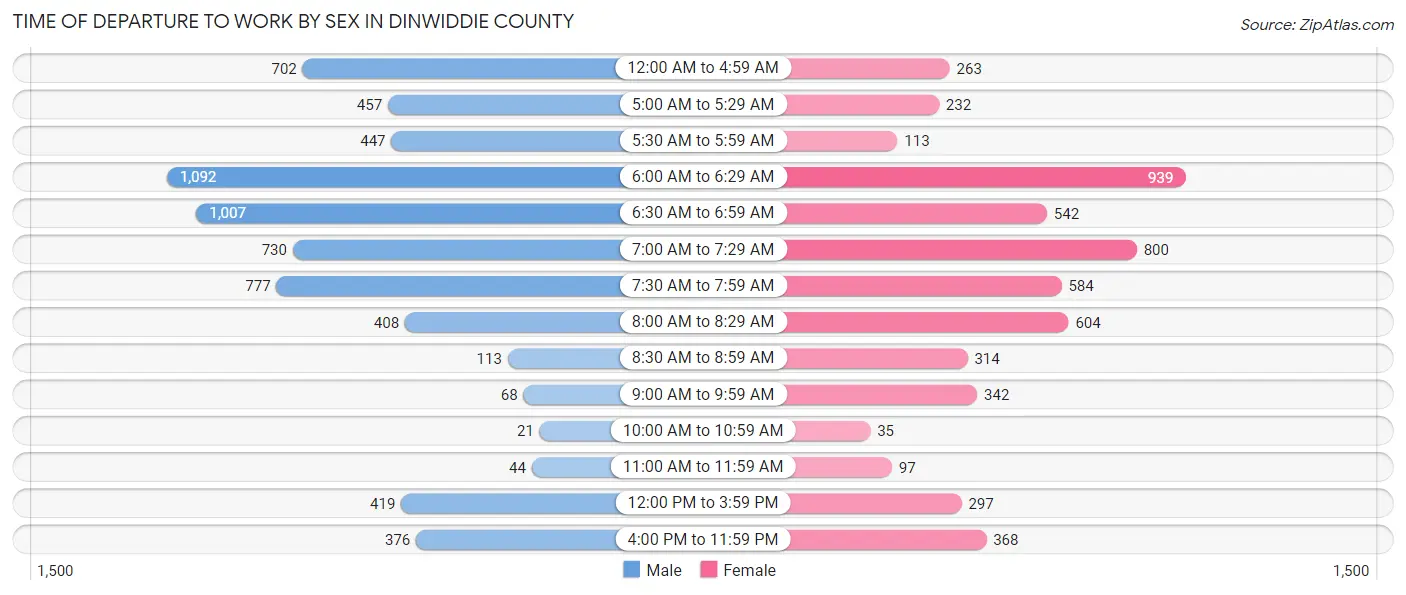
| Time of Departure | Male | Female |
| 12:00 AM to 4:59 AM | 702 (10.5%) | 263 (4.8%) |
| 5:00 AM to 5:29 AM | 457 (6.9%) | 232 (4.2%) |
| 5:30 AM to 5:59 AM | 447 (6.7%) | 113 (2.0%) |
| 6:00 AM to 6:29 AM | 1,092 (16.4%) | 939 (17.0%) |
| 6:30 AM to 6:59 AM | 1,007 (15.1%) | 542 (9.8%) |
| 7:00 AM to 7:29 AM | 730 (11.0%) | 800 (14.5%) |
| 7:30 AM to 7:59 AM | 777 (11.7%) | 584 (10.6%) |
| 8:00 AM to 8:29 AM | 408 (6.1%) | 604 (10.9%) |
| 8:30 AM to 8:59 AM | 113 (1.7%) | 314 (5.7%) |
| 9:00 AM to 9:59 AM | 68 (1.0%) | 342 (6.2%) |
| 10:00 AM to 10:59 AM | 21 (0.3%) | 35 (0.6%) |
| 11:00 AM to 11:59 AM | 44 (0.7%) | 97 (1.8%) |
| 12:00 PM to 3:59 PM | 419 (6.3%) | 297 (5.4%) |
| 4:00 PM to 11:59 PM | 376 (5.6%) | 368 (6.7%) |
| Total | 6,661 (100.0%) | 5,530 (100.0%) |
Housing Occupancy in Dinwiddie County
Occupancy by Ownership in Dinwiddie County
Of the total 10,432 dwellings in Dinwiddie County, owner-occupied units account for 8,194 (78.5%), while renter-occupied units make up 2,238 (21.4%).
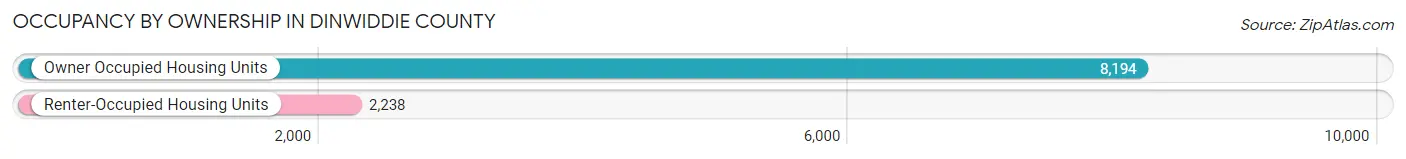
| Occupancy | # Housing Units | % Housing Units |
| Owner Occupied Housing Units | 8,194 | 78.5% |
| Renter-Occupied Housing Units | 2,238 | 21.4% |
| Total Occupied Housing Units | 10,432 | 100.0% |
Occupancy by Household Size in Dinwiddie County
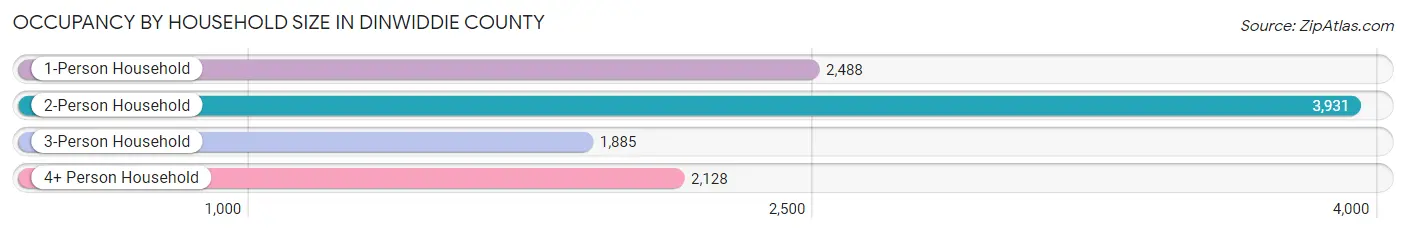
| Household Size | # Housing Units | % Housing Units |
| 1-Person Household | 2,488 | 23.8% |
| 2-Person Household | 3,931 | 37.7% |
| 3-Person Household | 1,885 | 18.1% |
| 4+ Person Household | 2,128 | 20.4% |
| Total Housing Units | 10,432 | 100.0% |
Occupancy by Ownership by Household Size in Dinwiddie County
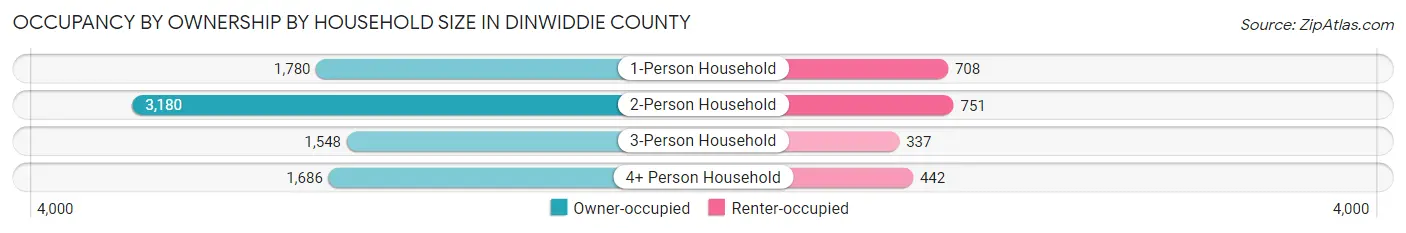
| Household Size | Owner-occupied | Renter-occupied |
| 1-Person Household | 1,780 (71.5%) | 708 (28.5%) |
| 2-Person Household | 3,180 (80.9%) | 751 (19.1%) |
| 3-Person Household | 1,548 (82.1%) | 337 (17.9%) |
| 4+ Person Household | 1,686 (79.2%) | 442 (20.8%) |
| Total Housing Units | 8,194 (78.5%) | 2,238 (21.4%) |
Occupancy by Educational Attainment in Dinwiddie County
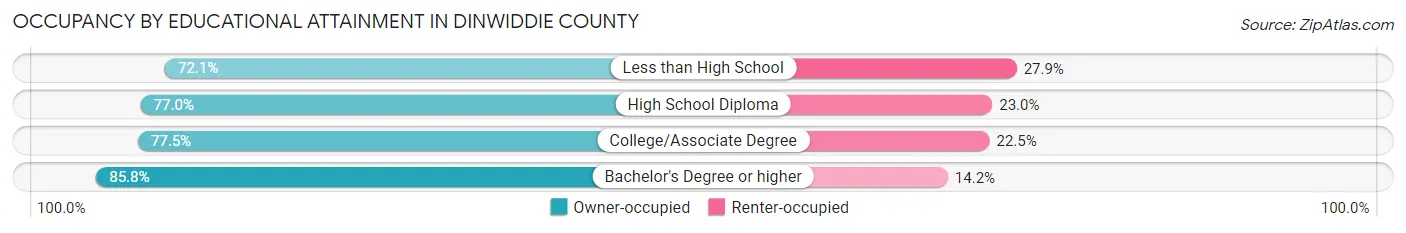
| Household Size | Owner-occupied | Renter-occupied |
| Less than High School | 624 (72.1%) | 241 (27.9%) |
| High School Diploma | 3,050 (77.0%) | 912 (23.0%) |
| College/Associate Degree | 2,704 (77.5%) | 784 (22.5%) |
| Bachelor's Degree or higher | 1,816 (85.8%) | 301 (14.2%) |
Occupancy by Age of Householder in Dinwiddie County
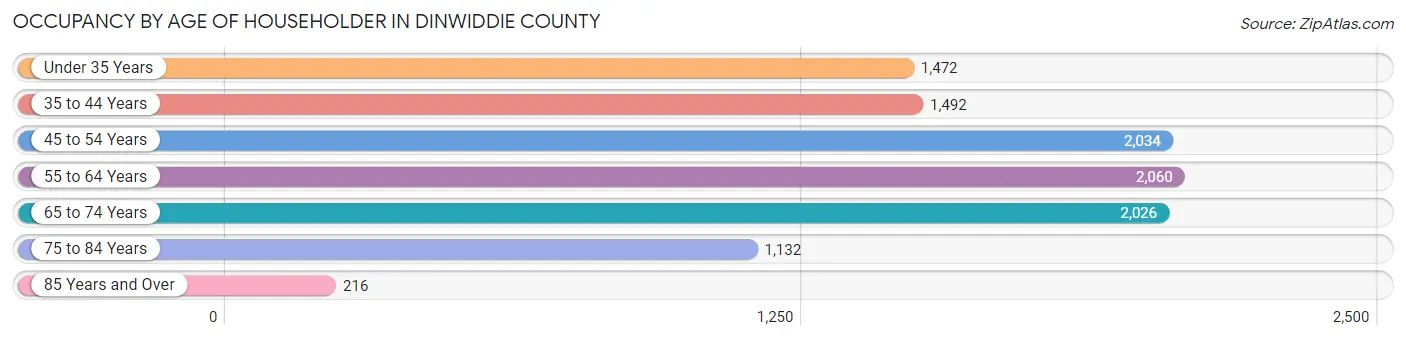
| Age Bracket | # Households | % Households |
| Under 35 Years | 1,472 | 14.1% |
| 35 to 44 Years | 1,492 | 14.3% |
| 45 to 54 Years | 2,034 | 19.5% |
| 55 to 64 Years | 2,060 | 19.8% |
| 65 to 74 Years | 2,026 | 19.4% |
| 75 to 84 Years | 1,132 | 10.8% |
| 85 Years and Over | 216 | 2.1% |
| Total | 10,432 | 100.0% |
Housing Finances in Dinwiddie County
Median Income by Occupancy in Dinwiddie County
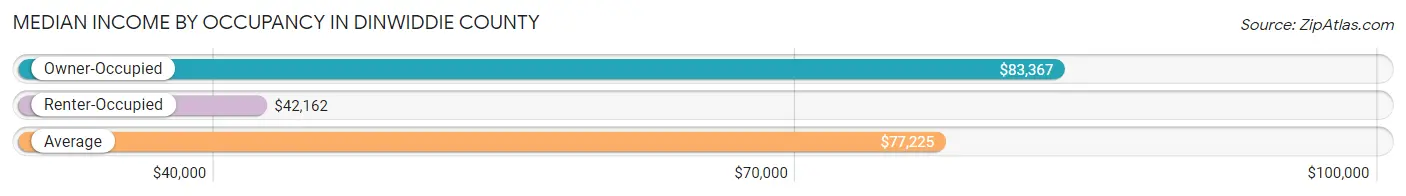
| Occupancy Type | # Households | Median Income |
| Owner-Occupied | 8,194 (78.5%) | $83,367 |
| Renter-Occupied | 2,238 (21.4%) | $42,162 |
| Average | 10,432 (100.0%) | $77,225 |
Occupancy by Householder Income Bracket in Dinwiddie County
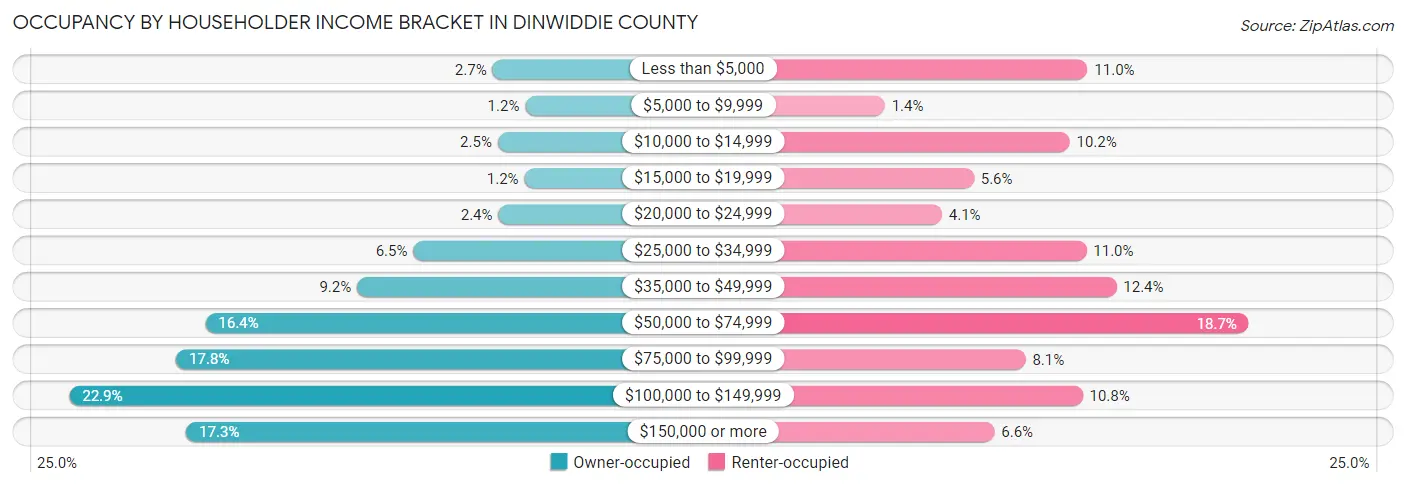
| Income Bracket | Owner-occupied | Renter-occupied |
| Less than $5,000 | 223 (2.7%) | 247 (11.0%) |
| $5,000 to $9,999 | 95 (1.2%) | 31 (1.4%) |
| $10,000 to $14,999 | 202 (2.5%) | 228 (10.2%) |
| $15,000 to $19,999 | 98 (1.2%) | 126 (5.6%) |
| $20,000 to $24,999 | 200 (2.4%) | 92 (4.1%) |
| $25,000 to $34,999 | 532 (6.5%) | 246 (11.0%) |
| $35,000 to $49,999 | 751 (9.2%) | 278 (12.4%) |
| $50,000 to $74,999 | 1,343 (16.4%) | 419 (18.7%) |
| $75,000 to $99,999 | 1,458 (17.8%) | 181 (8.1%) |
| $100,000 to $149,999 | 1,874 (22.9%) | 242 (10.8%) |
| $150,000 or more | 1,418 (17.3%) | 148 (6.6%) |
| Total | 8,194 (100.0%) | 2,238 (100.0%) |
Monthly Housing Cost Tiers in Dinwiddie County
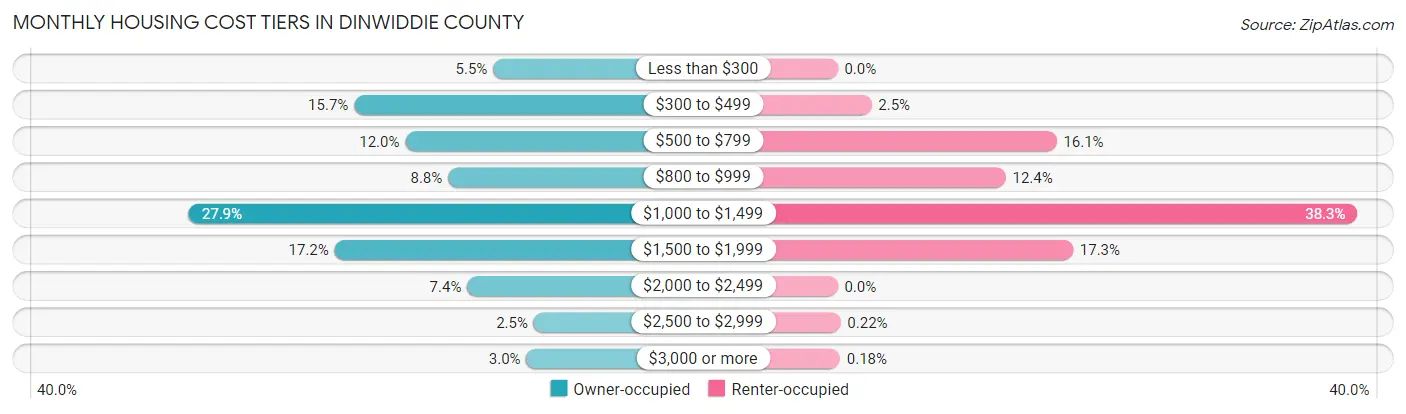
| Monthly Cost | Owner-occupied | Renter-occupied |
| Less than $300 | 450 (5.5%) | 0 (0.0%) |
| $300 to $499 | 1,289 (15.7%) | 56 (2.5%) |
| $500 to $799 | 980 (12.0%) | 361 (16.1%) |
| $800 to $999 | 722 (8.8%) | 277 (12.4%) |
| $1,000 to $1,499 | 2,286 (27.9%) | 857 (38.3%) |
| $1,500 to $1,999 | 1,407 (17.2%) | 388 (17.3%) |
| $2,000 to $2,499 | 606 (7.4%) | 0 (0.0%) |
| $2,500 to $2,999 | 205 (2.5%) | 5 (0.2%) |
| $3,000 or more | 249 (3.0%) | 4 (0.2%) |
| Total | 8,194 (100.0%) | 2,238 (100.0%) |
Physical Housing Characteristics in Dinwiddie County
Housing Structures in Dinwiddie County
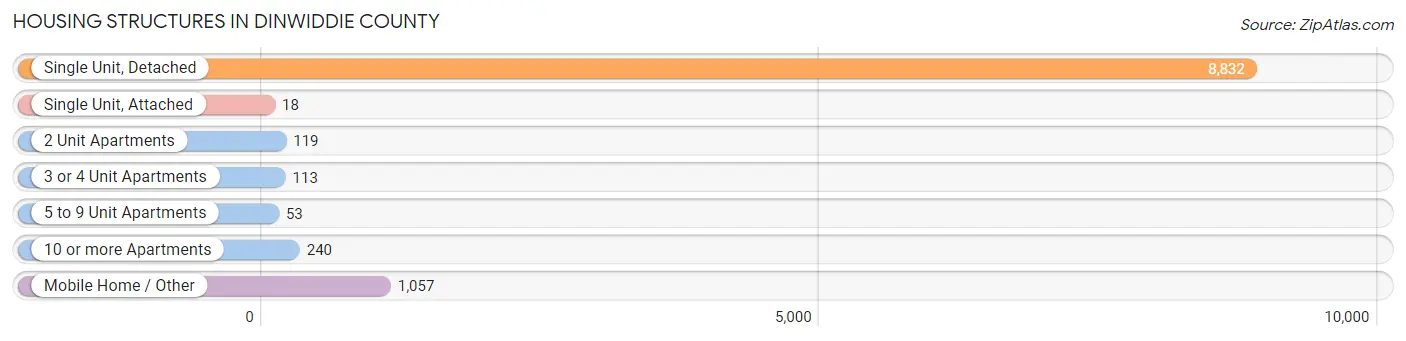
| Structure Type | # Housing Units | % Housing Units |
| Single Unit, Detached | 8,832 | 84.7% |
| Single Unit, Attached | 18 | 0.2% |
| 2 Unit Apartments | 119 | 1.1% |
| 3 or 4 Unit Apartments | 113 | 1.1% |
| 5 to 9 Unit Apartments | 53 | 0.5% |
| 10 or more Apartments | 240 | 2.3% |
| Mobile Home / Other | 1,057 | 10.1% |
| Total | 10,432 | 100.0% |
Housing Structures by Occupancy in Dinwiddie County
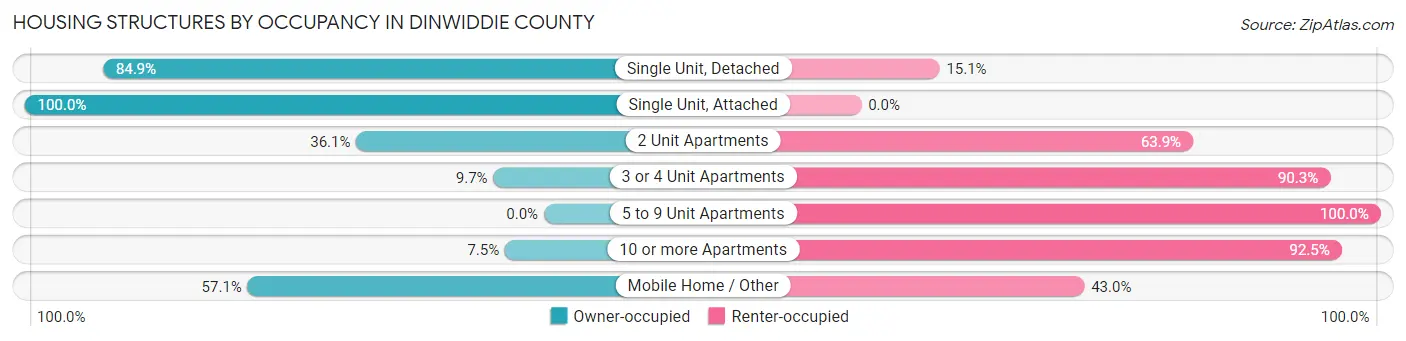
| Structure Type | Owner-occupied | Renter-occupied |
| Single Unit, Detached | 7,501 (84.9%) | 1,331 (15.1%) |
| Single Unit, Attached | 18 (100.0%) | 0 (0.0%) |
| 2 Unit Apartments | 43 (36.1%) | 76 (63.9%) |
| 3 or 4 Unit Apartments | 11 (9.7%) | 102 (90.3%) |
| 5 to 9 Unit Apartments | 0 (0.0%) | 53 (100.0%) |
| 10 or more Apartments | 18 (7.5%) | 222 (92.5%) |
| Mobile Home / Other | 603 (57.1%) | 454 (42.9%) |
| Total | 8,194 (78.5%) | 2,238 (21.4%) |
Housing Structures by Number of Rooms in Dinwiddie County
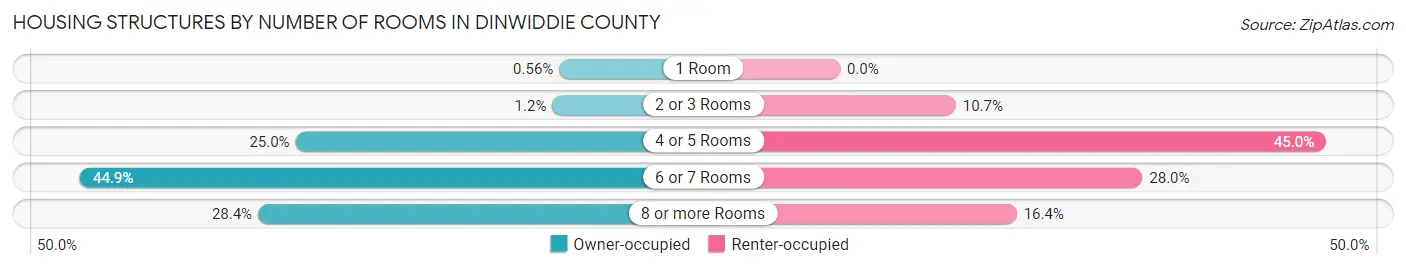
| Number of Rooms | Owner-occupied | Renter-occupied |
| 1 Room | 46 (0.6%) | 0 (0.0%) |
| 2 or 3 Rooms | 98 (1.2%) | 240 (10.7%) |
| 4 or 5 Rooms | 2,044 (24.9%) | 1,006 (45.0%) |
| 6 or 7 Rooms | 3,677 (44.9%) | 626 (28.0%) |
| 8 or more Rooms | 2,329 (28.4%) | 366 (16.4%) |
| Total | 8,194 (100.0%) | 2,238 (100.0%) |
Housing Structure by Heating Type in Dinwiddie County
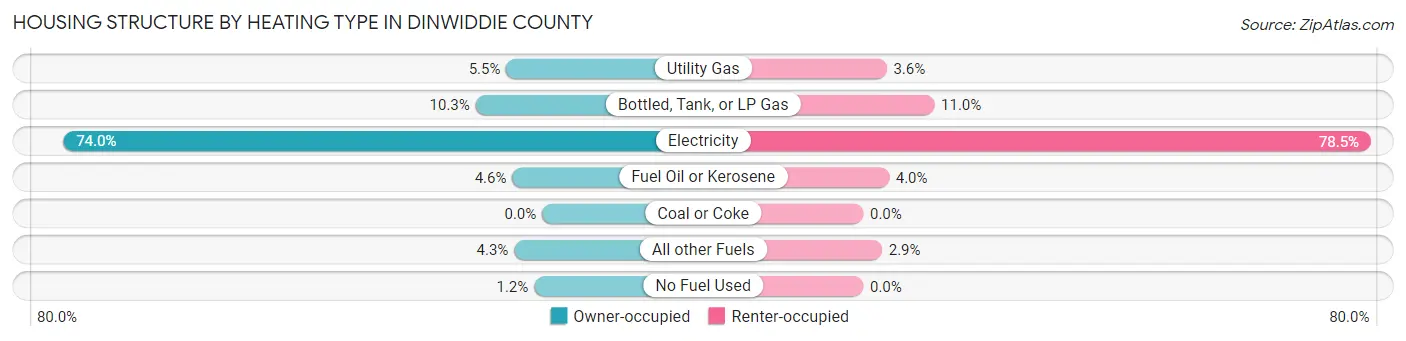
| Heating Type | Owner-occupied | Renter-occupied |
| Utility Gas | 453 (5.5%) | 81 (3.6%) |
| Bottled, Tank, or LP Gas | 842 (10.3%) | 246 (11.0%) |
| Electricity | 6,066 (74.0%) | 1,757 (78.5%) |
| Fuel Oil or Kerosene | 378 (4.6%) | 89 (4.0%) |
| Coal or Coke | 0 (0.0%) | 0 (0.0%) |
| All other Fuels | 354 (4.3%) | 65 (2.9%) |
| No Fuel Used | 101 (1.2%) | 0 (0.0%) |
| Total | 8,194 (100.0%) | 2,238 (100.0%) |
Household Vehicle Usage in Dinwiddie County
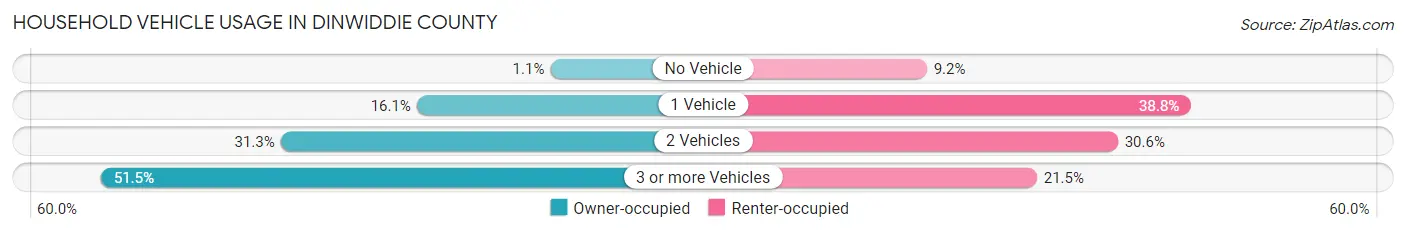
| Vehicles per Household | Owner-occupied | Renter-occupied |
| No Vehicle | 92 (1.1%) | 205 (9.2%) |
| 1 Vehicle | 1,318 (16.1%) | 868 (38.8%) |
| 2 Vehicles | 2,567 (31.3%) | 684 (30.6%) |
| 3 or more Vehicles | 4,217 (51.5%) | 481 (21.5%) |
| Total | 8,194 (100.0%) | 2,238 (100.0%) |
Real Estate & Mortgages in Dinwiddie County
Real Estate and Mortgage Overview in Dinwiddie County
| Characteristic | Without Mortgage | With Mortgage |
| Housing Units | 2,671 | 5,523 |
| Median Property Value | $186,100 | $237,800 |
| Median Household Income | $64,059 | $1,115 |
| Monthly Housing Costs | $457 | $249 |
| Real Estate Taxes | $1,434 | $221 |
Property Value by Mortgage Status in Dinwiddie County
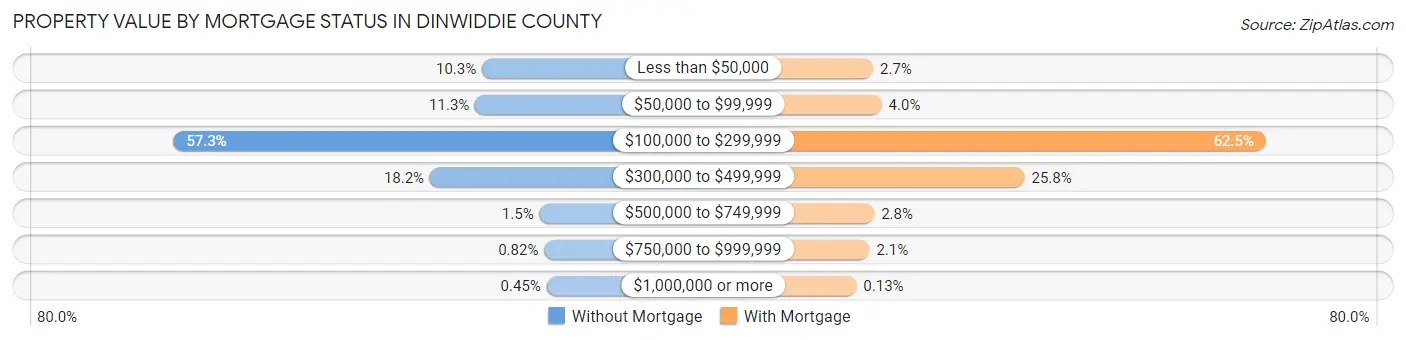
| Property Value | Without Mortgage | With Mortgage |
| Less than $50,000 | 275 (10.3%) | 148 (2.7%) |
| $50,000 to $99,999 | 303 (11.3%) | 220 (4.0%) |
| $100,000 to $299,999 | 1,531 (57.3%) | 3,452 (62.5%) |
| $300,000 to $499,999 | 487 (18.2%) | 1,422 (25.8%) |
| $500,000 to $749,999 | 41 (1.5%) | 157 (2.8%) |
| $750,000 to $999,999 | 22 (0.8%) | 117 (2.1%) |
| $1,000,000 or more | 12 (0.4%) | 7 (0.1%) |
| Total | 2,671 (100.0%) | 5,523 (100.0%) |
Household Income by Mortgage Status in Dinwiddie County
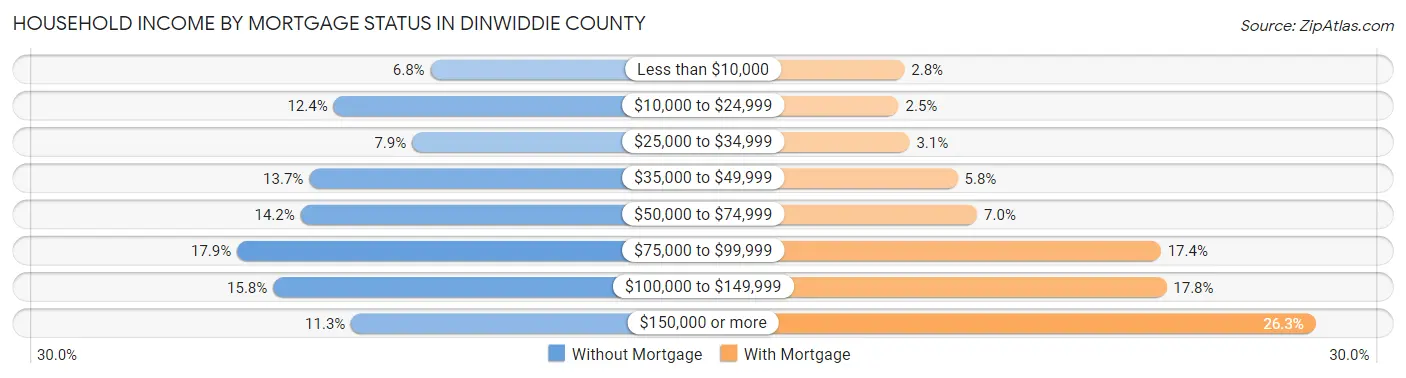
| Household Income | Without Mortgage | With Mortgage |
| Less than $10,000 | 182 (6.8%) | 154 (2.8%) |
| $10,000 to $24,999 | 330 (12.3%) | 136 (2.5%) |
| $25,000 to $34,999 | 210 (7.9%) | 170 (3.1%) |
| $35,000 to $49,999 | 367 (13.7%) | 322 (5.8%) |
| $50,000 to $74,999 | 380 (14.2%) | 384 (7.0%) |
| $75,000 to $99,999 | 477 (17.9%) | 963 (17.4%) |
| $100,000 to $149,999 | 422 (15.8%) | 981 (17.8%) |
| $150,000 or more | 303 (11.3%) | 1,452 (26.3%) |
| Total | 2,671 (100.0%) | 5,523 (100.0%) |
Property Value to Household Income Ratio in Dinwiddie County
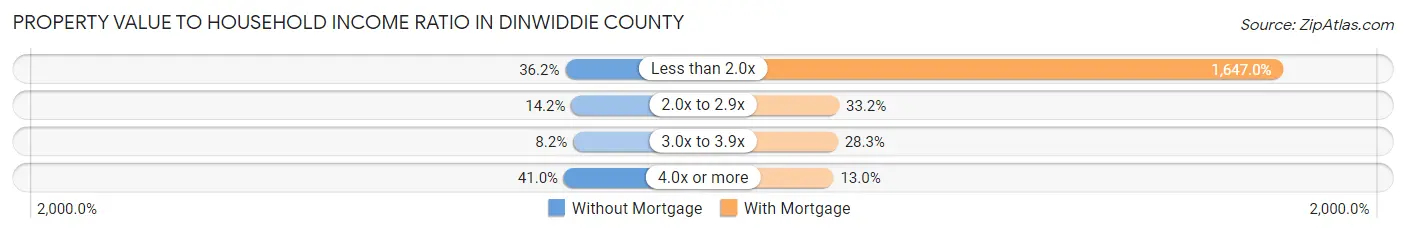
| Value-to-Income Ratio | Without Mortgage | With Mortgage |
| Less than 2.0x | 968 (36.2%) | 90,966 (1,647.0%) |
| 2.0x to 2.9x | 380 (14.2%) | 1,834 (33.2%) |
| 3.0x to 3.9x | 218 (8.2%) | 1,563 (28.3%) |
| 4.0x or more | 1,096 (41.0%) | 715 (13.0%) |
| Total | 2,671 (100.0%) | 5,523 (100.0%) |
Real Estate Taxes by Mortgage Status in Dinwiddie County
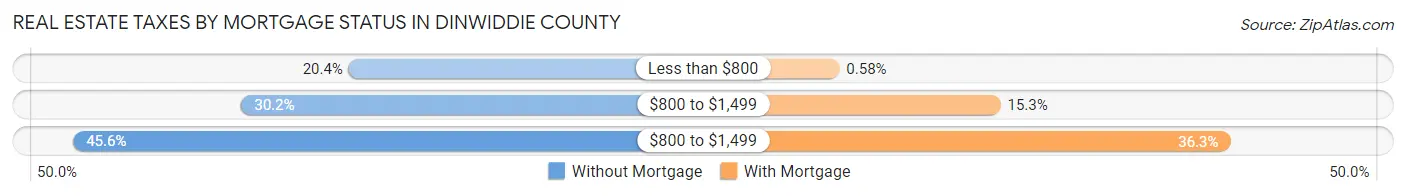
| Property Taxes | Without Mortgage | With Mortgage |
| Less than $800 | 545 (20.4%) | 32 (0.6%) |
| $800 to $1,499 | 807 (30.2%) | 845 (15.3%) |
| $800 to $1,499 | 1,217 (45.6%) | 2,004 (36.3%) |
| Total | 2,671 (100.0%) | 5,523 (100.0%) |
Health & Disability in Dinwiddie County
Health Insurance Coverage by Age in Dinwiddie County
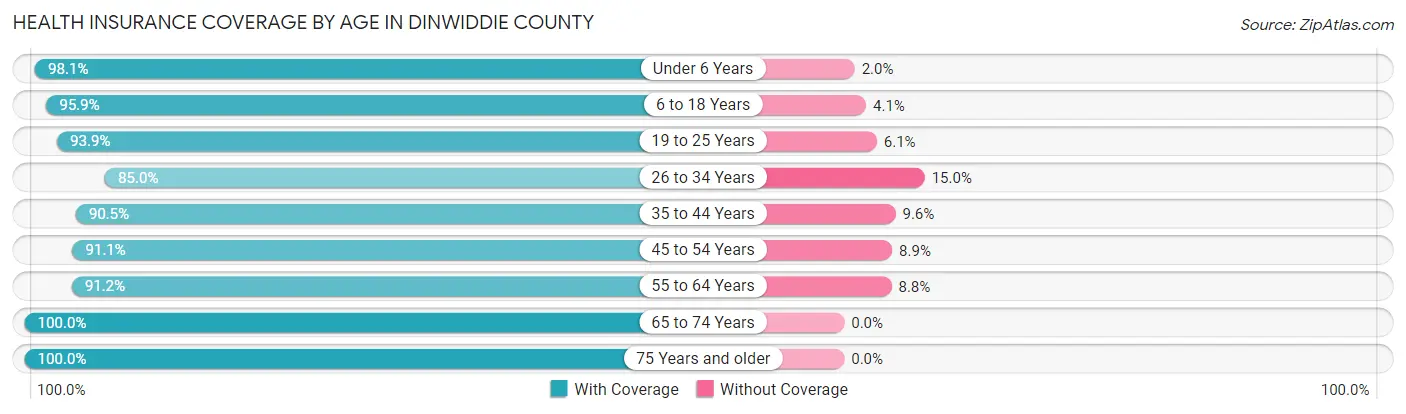
| Age Bracket | With Coverage | Without Coverage |
| Under 6 Years | 1,658 (98.1%) | 33 (1.9%) |
| 6 to 18 Years | 4,372 (95.9%) | 185 (4.1%) |
| 19 to 25 Years | 1,732 (93.9%) | 112 (6.1%) |
| 26 to 34 Years | 2,738 (85.0%) | 483 (15.0%) |
| 35 to 44 Years | 2,757 (90.4%) | 291 (9.6%) |
| 45 to 54 Years | 3,412 (91.1%) | 334 (8.9%) |
| 55 to 64 Years | 4,014 (91.2%) | 388 (8.8%) |
| 65 to 74 Years | 3,067 (100.0%) | 0 (0.0%) |
| 75 Years and older | 2,049 (100.0%) | 0 (0.0%) |
| Total | 25,799 (93.4%) | 1,826 (6.6%) |
Health Insurance Coverage by Citizenship Status in Dinwiddie County
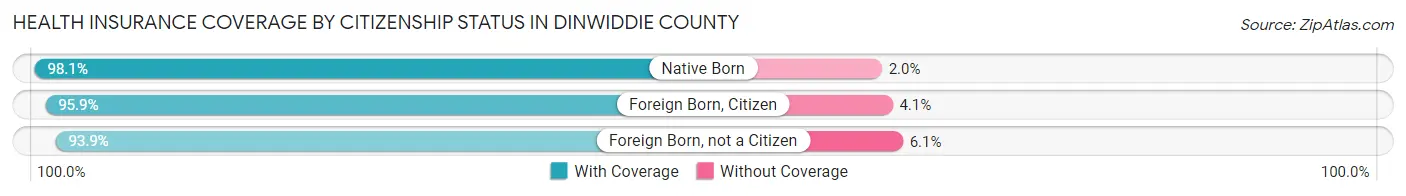
| Citizenship Status | With Coverage | Without Coverage |
| Native Born | 1,658 (98.1%) | 33 (1.9%) |
| Foreign Born, Citizen | 4,372 (95.9%) | 185 (4.1%) |
| Foreign Born, not a Citizen | 1,732 (93.9%) | 112 (6.1%) |
Health Insurance Coverage by Household Income in Dinwiddie County
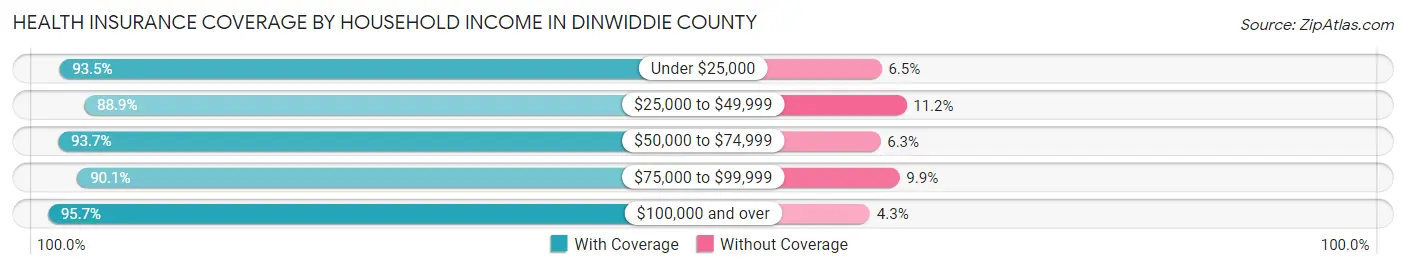
| Household Income | With Coverage | Without Coverage |
| Under $25,000 | 2,551 (93.5%) | 177 (6.5%) |
| $25,000 to $49,999 | 3,036 (88.8%) | 381 (11.2%) |
| $50,000 to $74,999 | 3,945 (93.7%) | 264 (6.3%) |
| $75,000 to $99,999 | 3,866 (90.1%) | 423 (9.9%) |
| $100,000 and over | 11,995 (95.7%) | 543 (4.3%) |
Public vs Private Health Insurance Coverage by Age in Dinwiddie County
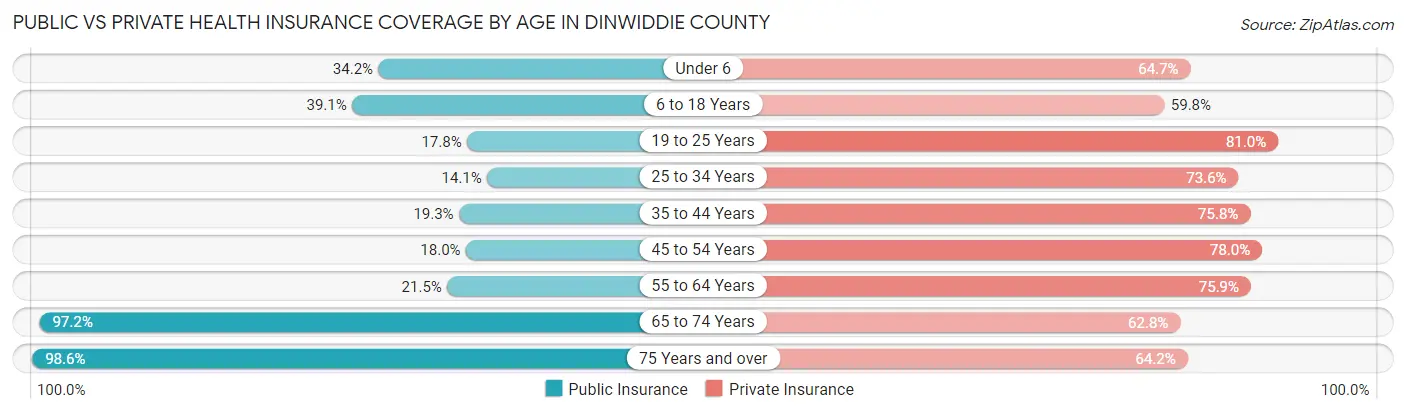
| Age Bracket | Public Insurance | Private Insurance |
| Under 6 | 579 (34.2%) | 1,094 (64.7%) |
| 6 to 18 Years | 1,783 (39.1%) | 2,724 (59.8%) |
| 19 to 25 Years | 328 (17.8%) | 1,493 (81.0%) |
| 25 to 34 Years | 453 (14.1%) | 2,371 (73.6%) |
| 35 to 44 Years | 588 (19.3%) | 2,310 (75.8%) |
| 45 to 54 Years | 674 (18.0%) | 2,922 (78.0%) |
| 55 to 64 Years | 945 (21.5%) | 3,342 (75.9%) |
| 65 to 74 Years | 2,982 (97.2%) | 1,926 (62.8%) |
| 75 Years and over | 2,020 (98.6%) | 1,315 (64.2%) |
| Total | 10,352 (37.5%) | 19,497 (70.6%) |
Disability Status by Sex by Age in Dinwiddie County
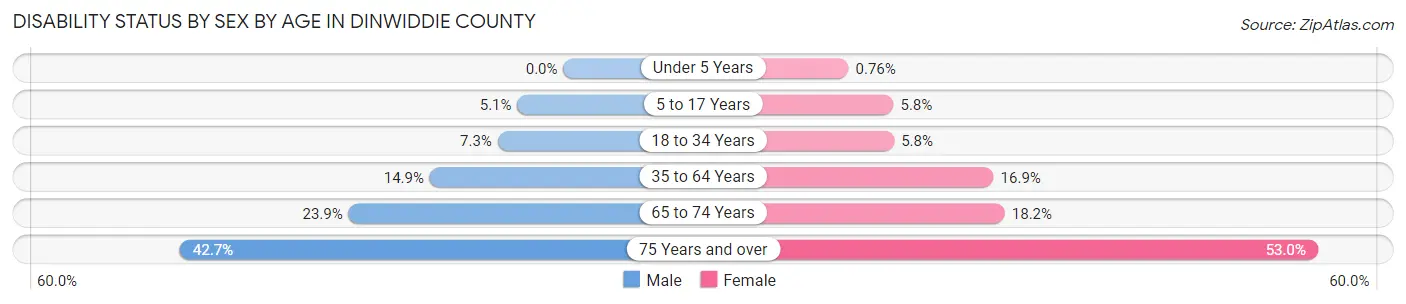
| Age Bracket | Male | Female |
| Under 5 Years | 0 (0.0%) | 5 (0.8%) |
| 5 to 17 Years | 118 (5.1%) | 113 (5.8%) |
| 18 to 34 Years | 211 (7.3%) | 159 (5.8%) |
| 35 to 64 Years | 818 (14.9%) | 963 (16.9%) |
| 65 to 74 Years | 349 (23.9%) | 292 (18.2%) |
| 75 Years and over | 377 (42.7%) | 618 (53.0%) |
Disability Class by Sex by Age in Dinwiddie County
Disability Class: Hearing Difficulty
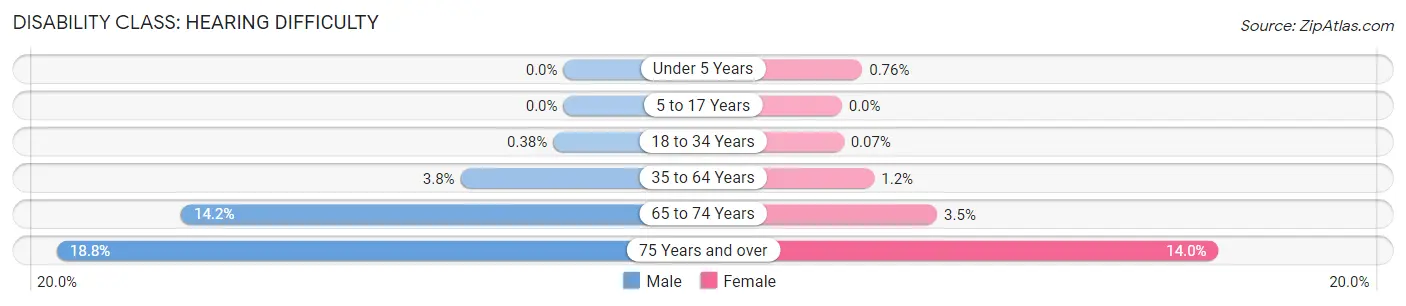
| Age Bracket | Male | Female |
| Under 5 Years | 0 (0.0%) | 5 (0.8%) |
| 5 to 17 Years | 0 (0.0%) | 0 (0.0%) |
| 18 to 34 Years | 11 (0.4%) | 2 (0.1%) |
| 35 to 64 Years | 210 (3.8%) | 69 (1.2%) |
| 65 to 74 Years | 207 (14.2%) | 57 (3.5%) |
| 75 Years and over | 166 (18.8%) | 163 (14.0%) |
Disability Class: Vision Difficulty
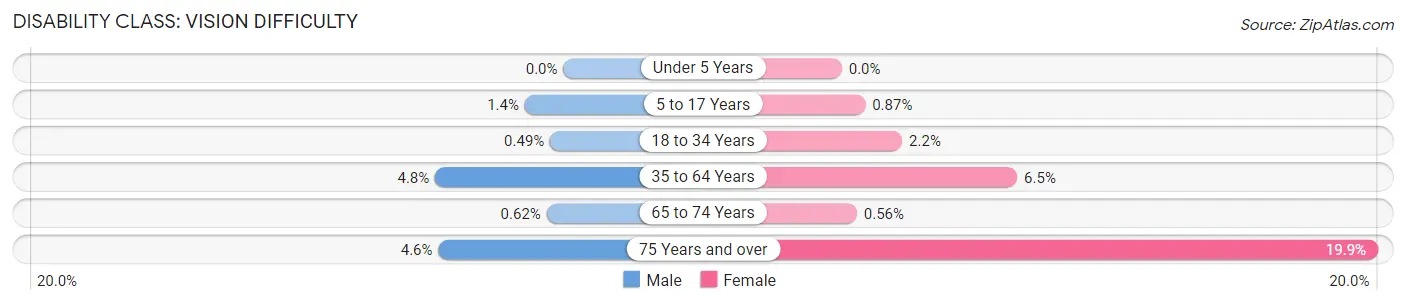
| Age Bracket | Male | Female |
| Under 5 Years | 0 (0.0%) | 0 (0.0%) |
| 5 to 17 Years | 33 (1.4%) | 17 (0.9%) |
| 18 to 34 Years | 14 (0.5%) | 61 (2.2%) |
| 35 to 64 Years | 262 (4.8%) | 371 (6.5%) |
| 65 to 74 Years | 9 (0.6%) | 9 (0.6%) |
| 75 Years and over | 41 (4.6%) | 232 (19.9%) |
Disability Class: Cognitive Difficulty
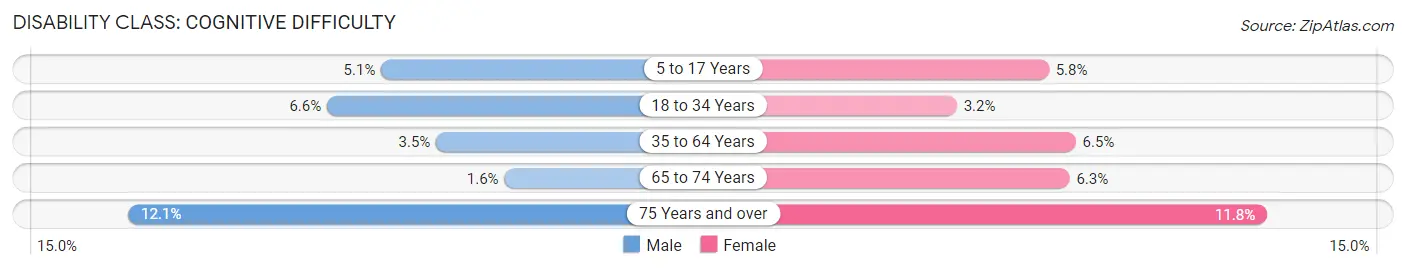
| Age Bracket | Male | Female |
| 5 to 17 Years | 117 (5.1%) | 113 (5.8%) |
| 18 to 34 Years | 190 (6.6%) | 87 (3.2%) |
| 35 to 64 Years | 195 (3.5%) | 371 (6.5%) |
| 65 to 74 Years | 24 (1.6%) | 102 (6.3%) |
| 75 Years and over | 107 (12.1%) | 138 (11.8%) |
Disability Class: Ambulatory Difficulty
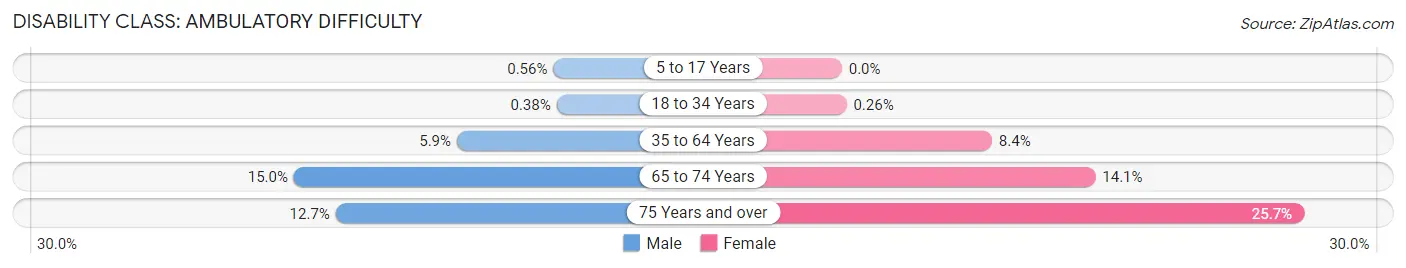
| Age Bracket | Male | Female |
| 5 to 17 Years | 13 (0.6%) | 0 (0.0%) |
| 18 to 34 Years | 11 (0.4%) | 7 (0.3%) |
| 35 to 64 Years | 326 (5.9%) | 476 (8.4%) |
| 65 to 74 Years | 219 (15.0%) | 227 (14.1%) |
| 75 Years and over | 112 (12.7%) | 300 (25.7%) |
Disability Class: Self-Care Difficulty
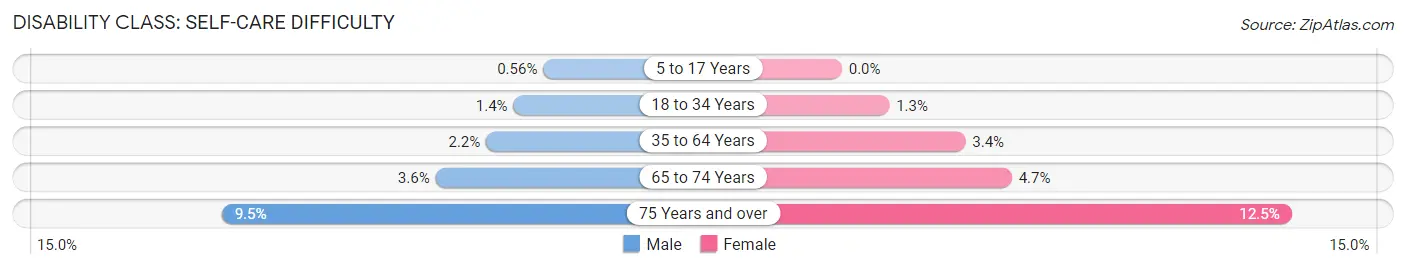
| Age Bracket | Male | Female |
| 5 to 17 Years | 13 (0.6%) | 0 (0.0%) |
| 18 to 34 Years | 40 (1.4%) | 36 (1.3%) |
| 35 to 64 Years | 118 (2.1%) | 196 (3.4%) |
| 65 to 74 Years | 52 (3.6%) | 76 (4.7%) |
| 75 Years and over | 84 (9.5%) | 146 (12.5%) |
Technology Access in Dinwiddie County
Computing Device Access in Dinwiddie County
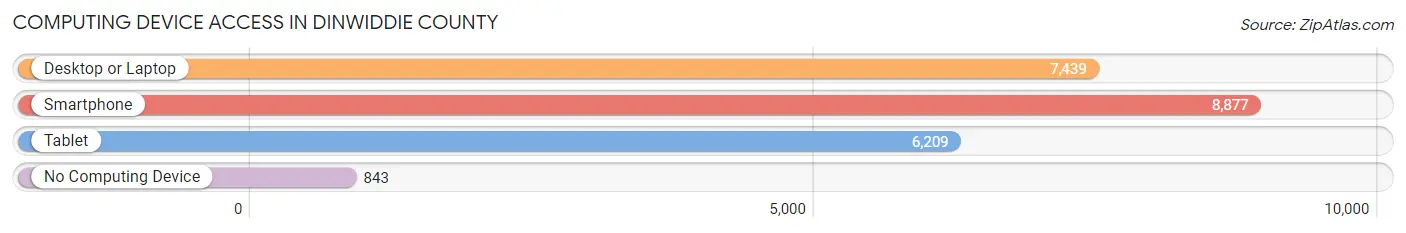
| Device Type | # Households | % Households |
| Desktop or Laptop | 7,439 | 71.3% |
| Smartphone | 8,877 | 85.1% |
| Tablet | 6,209 | 59.5% |
| No Computing Device | 843 | 8.1% |
| Total | 10,432 | 100.0% |
Internet Access in Dinwiddie County
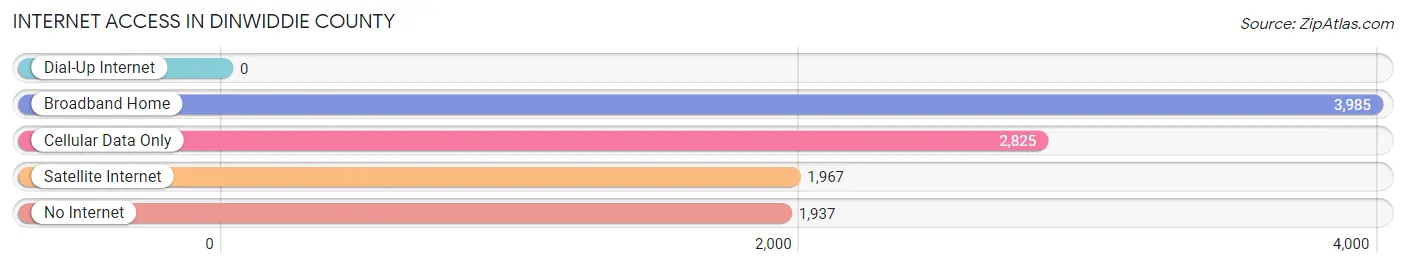
| Internet Type | # Households | % Households |
| Dial-Up Internet | 0 | 0.0% |
| Broadband Home | 3,985 | 38.2% |
| Cellular Data Only | 2,825 | 27.1% |
| Satellite Internet | 1,967 | 18.9% |
| No Internet | 1,937 | 18.6% |
| Total | 10,432 | 100.0% |
Dinwiddie County Summary
Dinwiddie County, Virginia is located in the south-central part of the state, just south of the city of Petersburg. It is bordered by the counties of Prince George, Sussex, Greensville, Brunswick, and Nottoway. The county seat is Dinwiddie, and the county is part of the Richmond-Petersburg Metropolitan Statistical Area.
History
Dinwiddie County was formed in 1752 from Prince George County. It was named for Robert Dinwiddie, the Lieutenant Governor of Virginia from 1751 to 1758. The county was the site of several battles during the American Revolutionary War, including the Battle of Stony Point and the Battle of Dinwiddie Court House.
During the Civil War, Dinwiddie County was the site of several battles, including the Battle of Five Forks and the Battle of Dinwiddie Court House. The county was also the site of the Battle of Sayler's Creek, which was the last major battle of the war in Virginia.
Geography
Dinwiddie County is located in the south-central part of Virginia, just south of the city of Petersburg. It is bordered by the counties of Prince George, Sussex, Greensville, Brunswick, and Nottoway. The county has a total area of 441 square miles, of which 437 square miles is land and 4 square miles is water.
The county is located in the Piedmont region of Virginia, and is mostly flat with rolling hills. The Appomattox River runs through the county, and there are several small lakes and ponds. The county is mostly rural, with some small towns and villages.
Economy
The economy of Dinwiddie County is largely based on agriculture and manufacturing. The county is home to several large farms, and the main crops grown are corn, soybeans, wheat, and hay. The county is also home to several manufacturing companies, including a paper mill, a furniture factory, and a plastics plant.
The county is also home to several military bases, including Fort Pickett and Fort Lee. These bases provide jobs for many of the county's residents.
Demographics
As of the 2010 census, the population of Dinwiddie County was 28,001. The population is mostly white (83.3%), with African Americans making up 12.3% of the population. Other races make up the remaining 4.4%.
The median household income in the county is $50,945, and the median family income is $60,945. The per capita income is $25,945. The unemployment rate is 5.2%.
The county is served by several school districts, including Dinwiddie County Public Schools, Prince George County Public Schools, and Sussex County Public Schools. The county is also home to several colleges and universities, including Virginia State University, Richard Bland College, and Southside Virginia Community College.
Common Questions
What is Per Capita Income in Dinwiddie County?
Per Capita income in Dinwiddie County is $35,506.
What is the Median Family Income in Dinwiddie County?
Median Family Income in Dinwiddie County is $92,397.
What is the Median Household income in Dinwiddie County?
Median Household Income in Dinwiddie County is $77,225.
What is Income or Wage Gap in Dinwiddie County?
Income or Wage Gap in Dinwiddie County is 29.0%.
Women in Dinwiddie County earn 71.0 cents for every dollar earned by a man.
What is Family Income Deficit in Dinwiddie County?
Family Income Deficit in Dinwiddie County is $12,687.
Families that are below poverty line in Dinwiddie County earn $12,687 less on average than the poverty threshold level.
What is Inequality or Gini Index in Dinwiddie County?
Inequality or Gini Index in Dinwiddie County is 0.42.
What is the Total Population of Dinwiddie County?
Total Population of Dinwiddie County is 28,057.
What is the Total Male Population of Dinwiddie County?
Total Male Population of Dinwiddie County is 14,111.
What is the Total Female Population of Dinwiddie County?
Total Female Population of Dinwiddie County is 13,946.
What is the Ratio of Males per 100 Females in Dinwiddie County?
There are 101.18 Males per 100 Females in Dinwiddie County.
What is the Ratio of Females per 100 Males in Dinwiddie County?
There are 98.83 Females per 100 Males in Dinwiddie County.
What is the Median Population Age in Dinwiddie County?
Median Population Age in Dinwiddie County is 43.4 Years.
What is the Average Family Size in Dinwiddie County
Average Family Size in Dinwiddie County is 3.1 People.
What is the Average Household Size in Dinwiddie County
Average Household Size in Dinwiddie County is 2.6 People.
How Large is the Labor Force in Dinwiddie County?
There are 14,225 People in the Labor Forcein in Dinwiddie County.
What is the Percentage of People in the Labor Force in Dinwiddie County?
61.6% of People are in the Labor Force in Dinwiddie County.
What is the Unemployment Rate in Dinwiddie County?
Unemployment Rate in Dinwiddie County is 4.7%.