Dickenson County, VA Map & Demographics
Dickenson County Map
Dickenson County Overview
$25,003
PER CAPITA INCOME
$51,842
AVG FAMILY INCOME
$40,143
AVG HOUSEHOLD INCOME
30.6%
WAGE / INCOME GAP [ % ]
69.4¢/ $1
WAGE / INCOME GAP [ $ ]
$10,010
FAMILY INCOME DEFICIT
0.48
INEQUALITY / GINI INDEX
14,089
TOTAL POPULATION
7,165
MALE POPULATION
6,924
FEMALE POPULATION
103.48
MALES / 100 FEMALES
96.64
FEMALES / 100 MALES
45.5
MEDIAN AGE
3.0
AVG FAMILY SIZE
2.5
AVG HOUSEHOLD SIZE
4,631
LABOR FORCE [ PEOPLE ]
39.6%
PERCENT IN LABOR FORCE
3.4%
UNEMPLOYMENT RATE
Dickenson County Area Codes
Income in Dickenson County
Income Overview in Dickenson County
Per Capita Income in Dickenson County is $25,003, while median incomes of families and households are $51,842 and $40,143 respectively.
| Characteristic | Number | Measure |
| Per Capita Income | 14,089 | $25,003 |
| Median Family Income | 3,809 | $51,842 |
| Mean Family Income | 3,809 | $69,235 |
| Median Household Income | 5,543 | $40,143 |
| Mean Household Income | 5,543 | $56,343 |
| Income Deficit | 3,809 | $10,010 |
| Wage / Income Gap (%) | 14,089 | 30.63% |
| Wage / Income Gap ($) | 14,089 | 69.37¢ per $1 |
| Gini / Inequality Index | 14,089 | 0.48 |
Earnings by Sex in Dickenson County
Average Earnings in Dickenson County are $37,284, $43,699 for men and $30,313 for women, a difference of 30.6%.
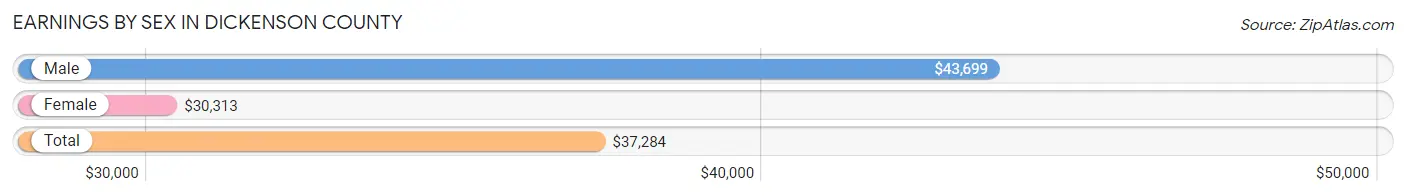
| Sex | Number | Average Earnings |
| Male | 2,547 (51.8%) | $43,699 |
| Female | 2,372 (48.2%) | $30,313 |
| Total | 4,919 (100.0%) | $37,284 |
Earnings by Sex by Income Bracket in Dickenson County
The most common earnings brackets in Dickenson County are $100,000+ for men (377 | 14.8%) and $35,000 to $39,999 for women (252 | 10.6%).
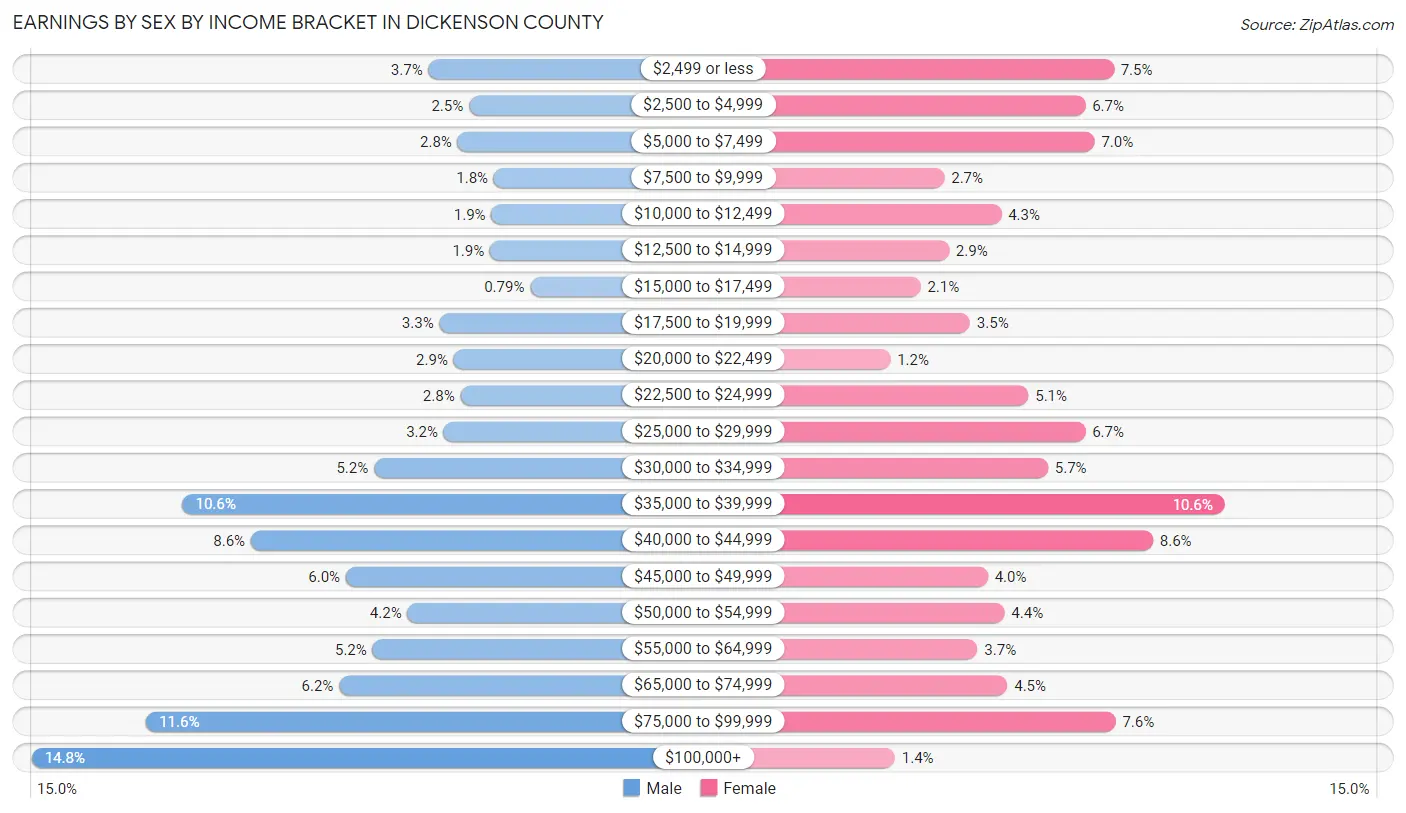
| Income | Male | Female |
| $2,499 or less | 93 (3.6%) | 178 (7.5%) |
| $2,500 to $4,999 | 64 (2.5%) | 159 (6.7%) |
| $5,000 to $7,499 | 72 (2.8%) | 165 (7.0%) |
| $7,500 to $9,999 | 46 (1.8%) | 65 (2.7%) |
| $10,000 to $12,499 | 48 (1.9%) | 103 (4.3%) |
| $12,500 to $14,999 | 49 (1.9%) | 68 (2.9%) |
| $15,000 to $17,499 | 20 (0.8%) | 49 (2.1%) |
| $17,500 to $19,999 | 85 (3.3%) | 82 (3.5%) |
| $20,000 to $22,499 | 75 (2.9%) | 29 (1.2%) |
| $22,500 to $24,999 | 70 (2.8%) | 121 (5.1%) |
| $25,000 to $29,999 | 82 (3.2%) | 159 (6.7%) |
| $30,000 to $34,999 | 132 (5.2%) | 134 (5.7%) |
| $35,000 to $39,999 | 269 (10.6%) | 252 (10.6%) |
| $40,000 to $44,999 | 220 (8.6%) | 204 (8.6%) |
| $45,000 to $49,999 | 152 (6.0%) | 94 (4.0%) |
| $50,000 to $54,999 | 108 (4.2%) | 105 (4.4%) |
| $55,000 to $64,999 | 133 (5.2%) | 87 (3.7%) |
| $65,000 to $74,999 | 157 (6.2%) | 107 (4.5%) |
| $75,000 to $99,999 | 295 (11.6%) | 179 (7.5%) |
| $100,000+ | 377 (14.8%) | 32 (1.3%) |
| Total | 2,547 (100.0%) | 2,372 (100.0%) |
Earnings by Sex by Educational Attainment in Dickenson County
Average earnings in Dickenson County are $48,673 for men and $35,227 for women, a difference of 27.6%. Men with an educational attainment of graduate degree enjoy the highest average annual earnings of $119,583, while those with high school diploma education earn the least with $42,115. Women with an educational attainment of graduate degree earn the most with the average annual earnings of $60,962, while those with high school diploma education have the smallest earnings of $19,492.
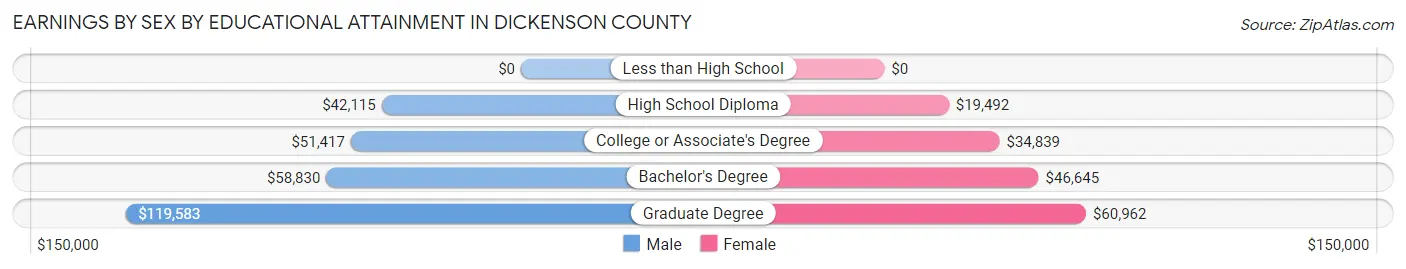
| Educational Attainment | Male Income | Female Income |
| Less than High School | - | - |
| High School Diploma | $42,115 | $19,492 |
| College or Associate's Degree | $51,417 | $34,839 |
| Bachelor's Degree | $58,830 | $46,645 |
| Graduate Degree | $119,583 | $60,962 |
| Total | $48,673 | $35,227 |
Family Income in Dickenson County
Family Income Brackets in Dickenson County
According to the Dickenson County family income data, there are 682 families falling into the $50,000 to $74,999 income range, which is the most common income bracket and makes up 17.9% of all families. Conversely, the $200,000+ income bracket is the least frequent group with only 76 families (2.0%) belonging to this category.
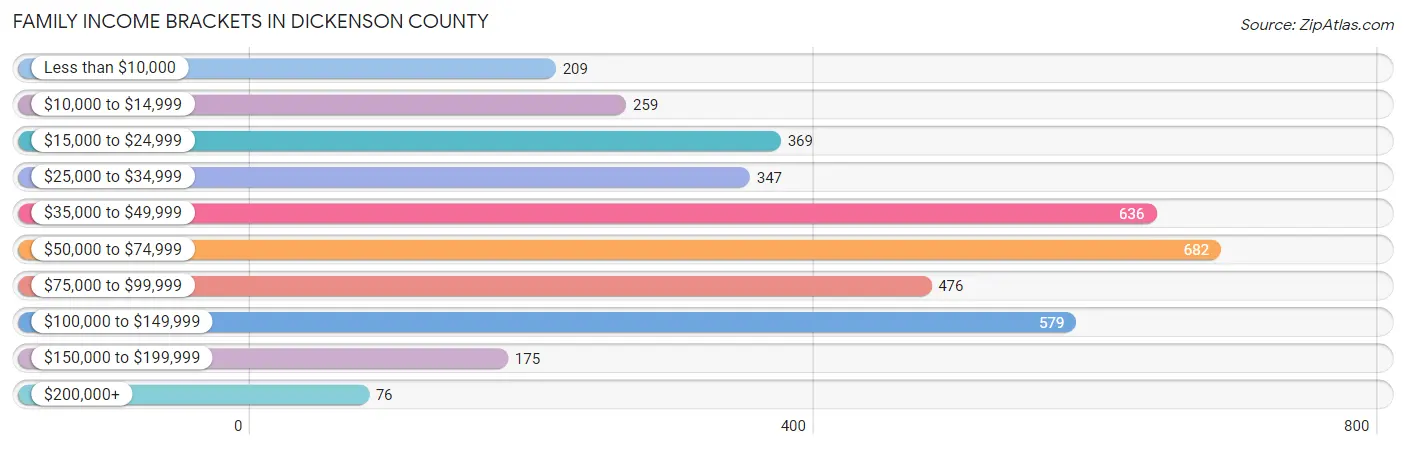
| Income Bracket | # Families | % Families |
| Less than $10,000 | 209 | 5.5% |
| $10,000 to $14,999 | 259 | 6.8% |
| $15,000 to $24,999 | 369 | 9.7% |
| $25,000 to $34,999 | 347 | 9.1% |
| $35,000 to $49,999 | 636 | 16.7% |
| $50,000 to $74,999 | 682 | 17.9% |
| $75,000 to $99,999 | 476 | 12.5% |
| $100,000 to $149,999 | 579 | 15.2% |
| $150,000 to $199,999 | 175 | 4.6% |
| $200,000+ | 76 | 2.0% |
Family Income by Famaliy Size in Dickenson County
6-person families (98 | 2.6%) account for the highest median family income in Dickenson County with $135,779 per family, while 6-person families (98 | 2.6%) have the highest median income of $22,630 per family member.
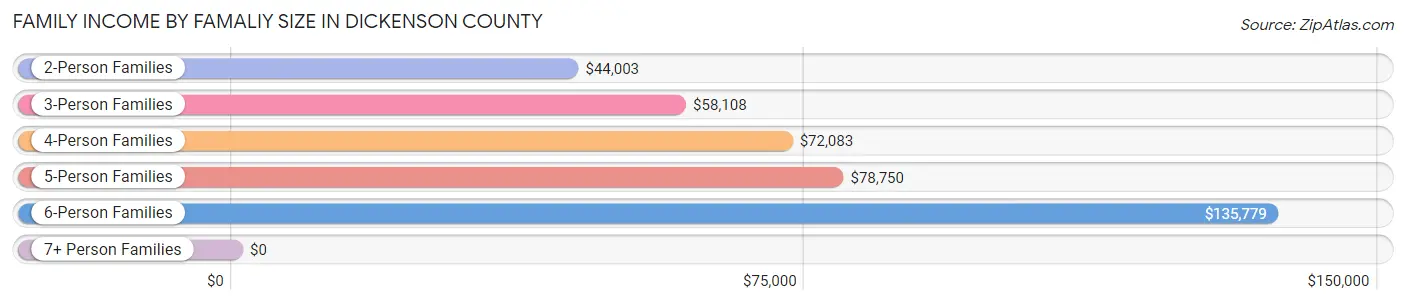
| Income Bracket | # Families | Median Income |
| 2-Person Families | 2,173 (57.1%) | $44,003 |
| 3-Person Families | 760 (20.0%) | $58,108 |
| 4-Person Families | 514 (13.5%) | $72,083 |
| 5-Person Families | 256 (6.7%) | $78,750 |
| 6-Person Families | 98 (2.6%) | $135,779 |
| 7+ Person Families | 8 (0.2%) | $0 |
| Total | 3,809 (100.0%) | $51,842 |
Family Income by Number of Earners in Dickenson County
The median family income in Dickenson County is $51,842, with families comprising 3+ earners (213) having the highest median family income of $122,277, while families with no earners (1,447) have the lowest median family income of $27,312, accounting for 5.6% and 38.0% of families, respectively.
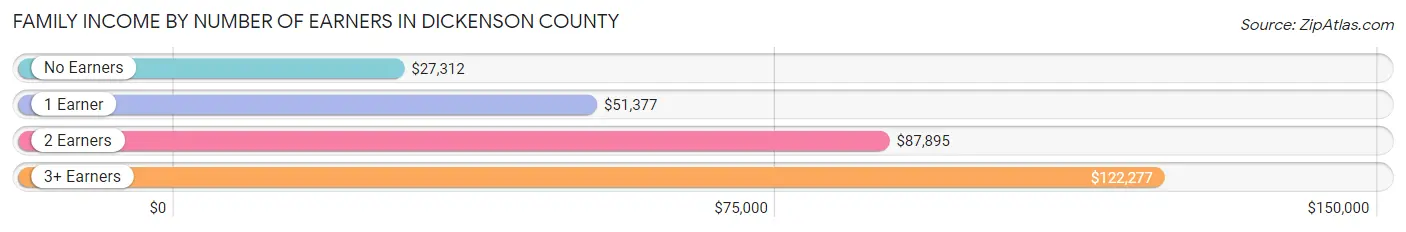
| Number of Earners | # Families | Median Income |
| No Earners | 1,447 (38.0%) | $27,312 |
| 1 Earner | 1,229 (32.3%) | $51,377 |
| 2 Earners | 920 (24.1%) | $87,895 |
| 3+ Earners | 213 (5.6%) | $122,277 |
| Total | 3,809 (100.0%) | $51,842 |
Household Income in Dickenson County
Household Income Brackets in Dickenson County
With 831 households falling in the category, the $35,000 to $49,999 income range is the most frequent in Dickenson County, accounting for 15.0% of all households. In contrast, only 78 households (1.4%) fall into the $200,000+ income bracket, making it the least populous group.

| Income Bracket | # Households | % Households |
| Less than $10,000 | 504 | 9.1% |
| $10,000 to $14,999 | 610 | 11.0% |
| $15,000 to $24,999 | 787 | 14.2% |
| $25,000 to $34,999 | 571 | 10.3% |
| $35,000 to $49,999 | 831 | 15.0% |
| $50,000 to $74,999 | 798 | 14.4% |
| $75,000 to $99,999 | 593 | 10.7% |
| $100,000 to $149,999 | 599 | 10.8% |
| $150,000 to $199,999 | 172 | 3.1% |
| $200,000+ | 78 | 1.4% |
Household Income by Householder Age in Dickenson County
The median household income in Dickenson County is $40,143, with the highest median household income of $52,961 found in the 25 to 44 years age bracket for the primary householder. A total of 1,248 households (22.5%) fall into this category. Meanwhile, the 15 to 24 years age bracket for the primary householder has the lowest median household income of $27,159, with 118 households (2.1%) in this group.
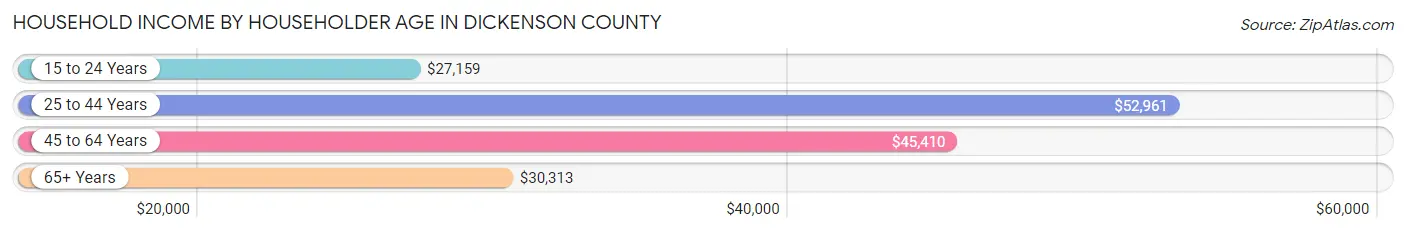
| Income Bracket | # Households | Median Income |
| 15 to 24 Years | 118 (2.1%) | $27,159 |
| 25 to 44 Years | 1,248 (22.5%) | $52,961 |
| 45 to 64 Years | 2,072 (37.4%) | $45,410 |
| 65+ Years | 2,105 (38.0%) | $30,313 |
| Total | 5,543 (100.0%) | $40,143 |
Poverty in Dickenson County
Income Below Poverty by Sex and Age in Dickenson County
With 19.3% poverty level for males and 25.7% for females among the residents of Dickenson County, 12 to 14 year old males and under 5 year old females are the most vulnerable to poverty, with 110 males (34.1%) and 168 females (51.7%) in their respective age groups living below the poverty level.
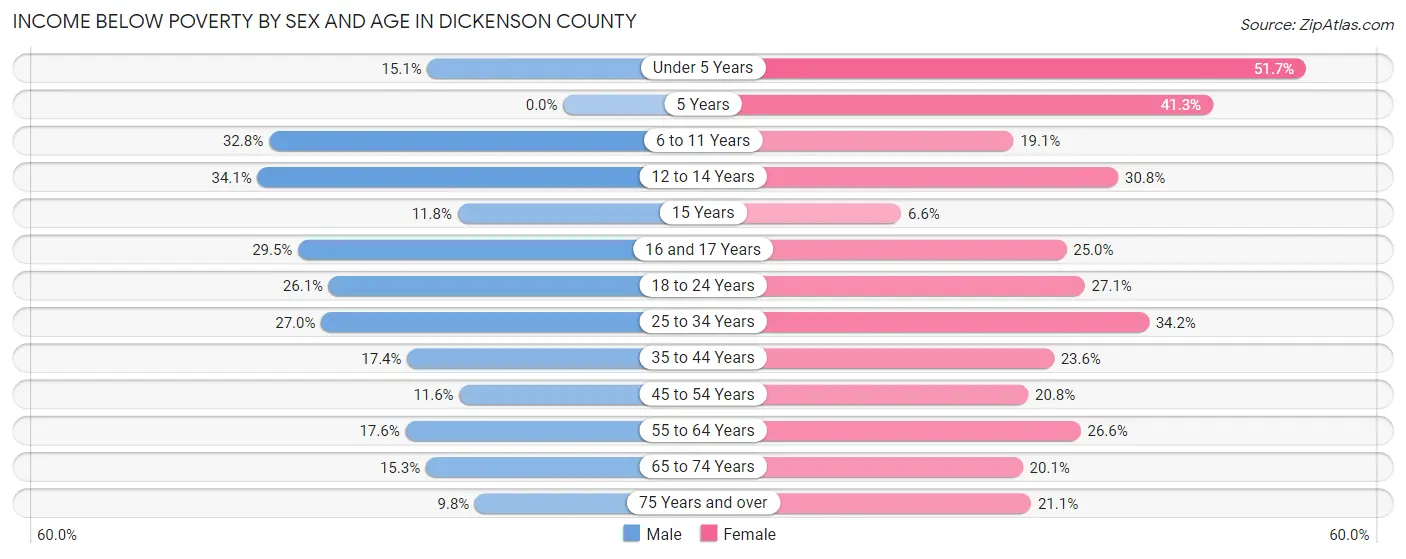
| Age Bracket | Male | Female |
| Under 5 Years | 49 (15.1%) | 168 (51.7%) |
| 5 Years | 0 (0.0%) | 31 (41.3%) |
| 6 to 11 Years | 159 (32.8%) | 67 (19.1%) |
| 12 to 14 Years | 110 (34.1%) | 96 (30.8%) |
| 15 Years | 8 (11.8%) | 7 (6.6%) |
| 16 and 17 Years | 57 (29.5%) | 34 (25.0%) |
| 18 to 24 Years | 124 (26.1%) | 135 (27.1%) |
| 25 to 34 Years | 189 (27.0%) | 243 (34.2%) |
| 35 to 44 Years | 148 (17.4%) | 186 (23.6%) |
| 45 to 54 Years | 110 (11.6%) | 167 (20.7%) |
| 55 to 64 Years | 179 (17.6%) | 259 (26.6%) |
| 65 to 74 Years | 136 (15.3%) | 195 (20.1%) |
| 75 Years and over | 55 (9.8%) | 150 (21.1%) |
| Total | 1,324 (19.3%) | 1,738 (25.7%) |
Income Above Poverty by Sex and Age in Dickenson County
According to the poverty statistics in Dickenson County, males aged 5 years and females aged 15 years are the age groups that are most secure financially, with 100.0% of males and 93.4% of females in these age groups living above the poverty line.
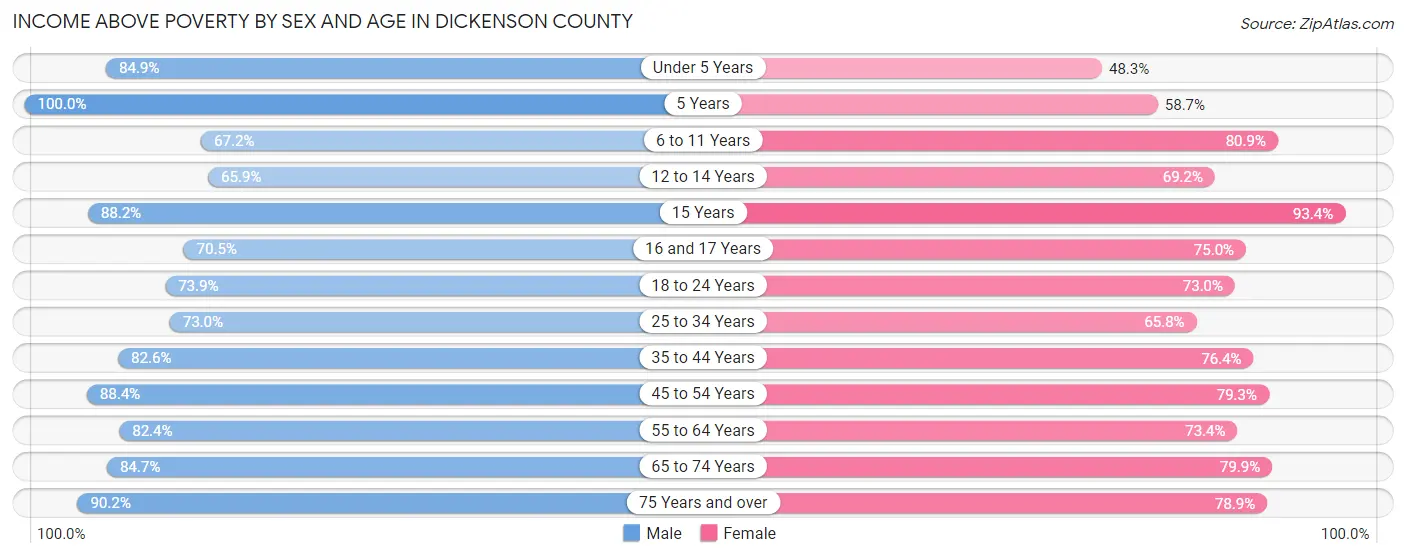
| Age Bracket | Male | Female |
| Under 5 Years | 275 (84.9%) | 157 (48.3%) |
| 5 Years | 24 (100.0%) | 44 (58.7%) |
| 6 to 11 Years | 326 (67.2%) | 284 (80.9%) |
| 12 to 14 Years | 213 (65.9%) | 216 (69.2%) |
| 15 Years | 60 (88.2%) | 99 (93.4%) |
| 16 and 17 Years | 136 (70.5%) | 102 (75.0%) |
| 18 to 24 Years | 351 (73.9%) | 364 (73.0%) |
| 25 to 34 Years | 512 (73.0%) | 468 (65.8%) |
| 35 to 44 Years | 704 (82.6%) | 602 (76.4%) |
| 45 to 54 Years | 841 (88.4%) | 638 (79.2%) |
| 55 to 64 Years | 839 (82.4%) | 715 (73.4%) |
| 65 to 74 Years | 753 (84.7%) | 773 (79.9%) |
| 75 Years and over | 505 (90.2%) | 562 (78.9%) |
| Total | 5,539 (80.7%) | 5,024 (74.3%) |
Income Below Poverty Among Married-Couple Families in Dickenson County
The poverty statistics for married-couple families in Dickenson County show that 11.3% or 324 of the total 2,871 families live below the poverty line. Families with 5 or more children have the highest poverty rate of 100.0%, comprising of 8 families. On the other hand, families with 1 or 2 children have the lowest poverty rate of 6.6%, which includes 59 families.
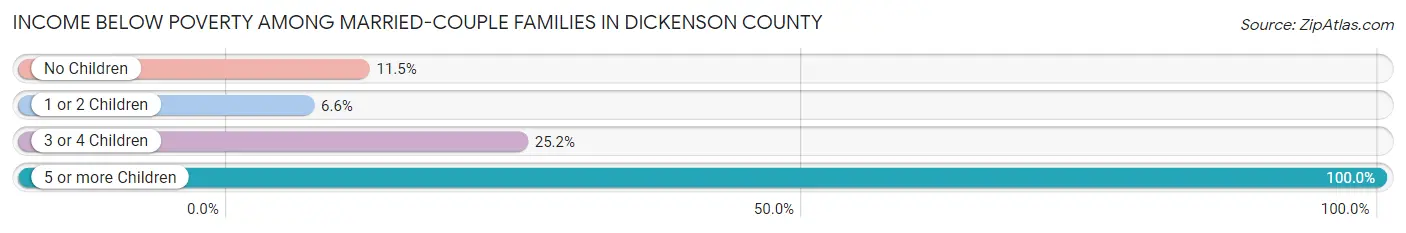
| Children | Above Poverty | Below Poverty |
| No Children | 1,546 (88.5%) | 200 (11.5%) |
| 1 or 2 Children | 832 (93.4%) | 59 (6.6%) |
| 3 or 4 Children | 169 (74.8%) | 57 (25.2%) |
| 5 or more Children | 0 (0.0%) | 8 (100.0%) |
| Total | 2,547 (88.7%) | 324 (11.3%) |
Income Below Poverty Among Single-Parent Households in Dickenson County
According to the poverty data in Dickenson County, 41.6% or 132 single-father households and 39.1% or 243 single-mother households are living below the poverty line. Among single-father households, those with 3 or 4 children have the highest poverty rate, with 8 households (100.0%) experiencing poverty. Likewise, among single-mother households, those with 3 or 4 children have the highest poverty rate, with 11 households (100.0%) falling below the poverty line.
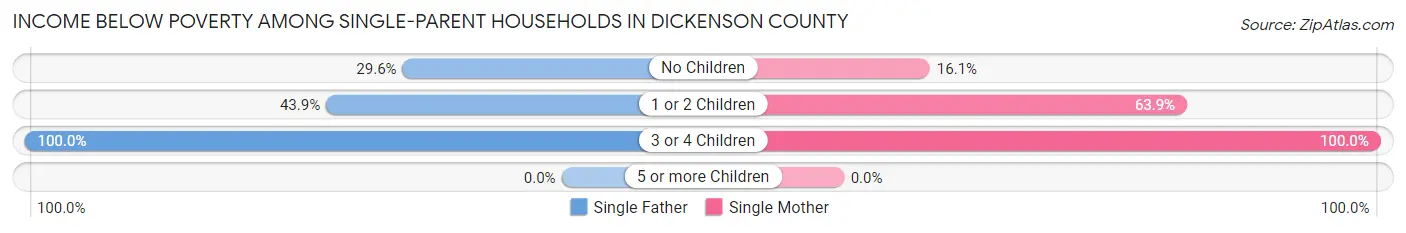
| Children | Single Father | Single Mother |
| No Children | 24 (29.6%) | 53 (16.1%) |
| 1 or 2 Children | 100 (43.9%) | 179 (63.9%) |
| 3 or 4 Children | 8 (100.0%) | 11 (100.0%) |
| 5 or more Children | 0 (0.0%) | 0 (0.0%) |
| Total | 132 (41.6%) | 243 (39.1%) |
Income Below Poverty Among Married-Couple vs Single-Parent Households in Dickenson County
The poverty data for Dickenson County shows that 324 of the married-couple family households (11.3%) and 375 of the single-parent households (40.0%) are living below the poverty level. Within the married-couple family households, those with 5 or more children have the highest poverty rate, with 8 households (100.0%) falling below the poverty line. Among the single-parent households, those with 3 or 4 children have the highest poverty rate, with 19 household (100.0%) living below poverty.
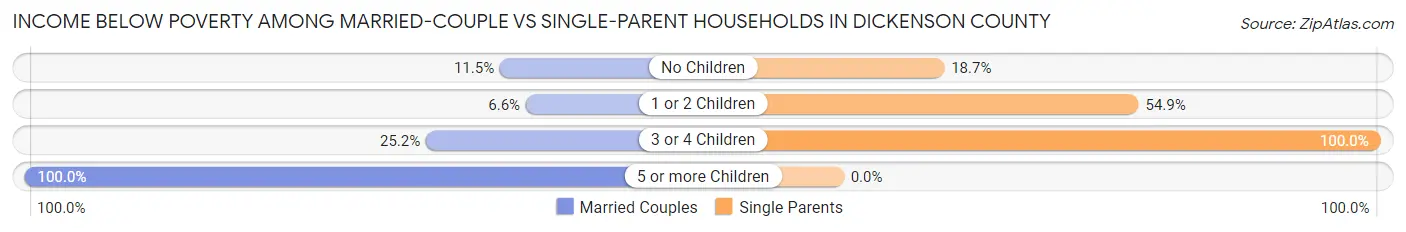
| Children | Married-Couple Families | Single-Parent Households |
| No Children | 200 (11.5%) | 77 (18.7%) |
| 1 or 2 Children | 59 (6.6%) | 279 (54.9%) |
| 3 or 4 Children | 57 (25.2%) | 19 (100.0%) |
| 5 or more Children | 8 (100.0%) | 0 (0.0%) |
| Total | 324 (11.3%) | 375 (40.0%) |
Race in Dickenson County
The most populous races in Dickenson County are White / Caucasian (13,769 | 97.7%), Hispanic or Latino (148 | 1.1%), and Two or more Races (131 | 0.9%).
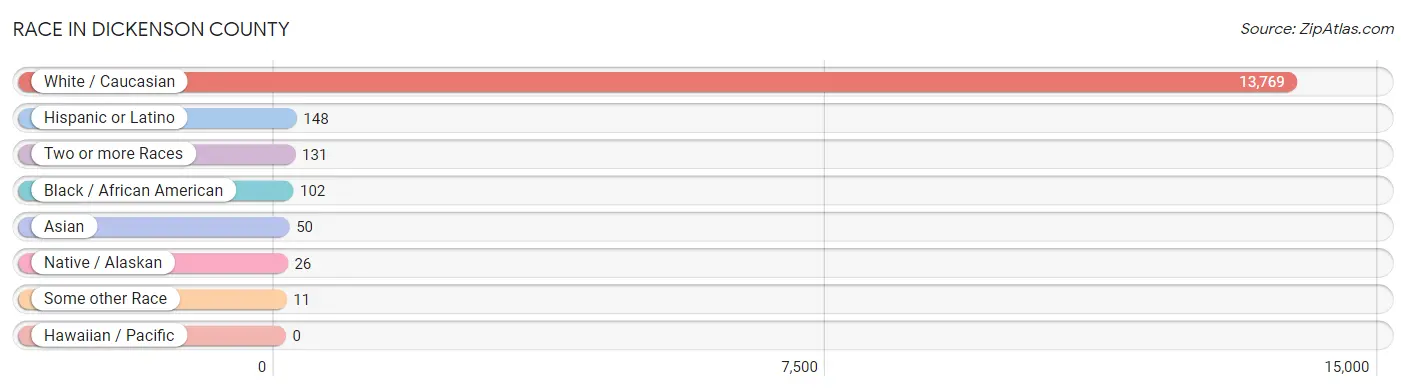
| Race | # Population | % Population |
| Asian | 50 | 0.4% |
| Black / African American | 102 | 0.7% |
| Hawaiian / Pacific | 0 | 0.0% |
| Hispanic or Latino | 148 | 1.1% |
| Native / Alaskan | 26 | 0.2% |
| White / Caucasian | 13,769 | 97.7% |
| Two or more Races | 131 | 0.9% |
| Some other Race | 11 | 0.1% |
| Total | 14,089 | 100.0% |
Ancestry in Dickenson County
The most populous ancestries reported in Dickenson County are American (6,602 | 46.9%), English (1,370 | 9.7%), Irish (1,012 | 7.2%), German (502 | 3.6%), and European (240 | 1.7%), together accounting for 69.0% of all Dickenson County residents.
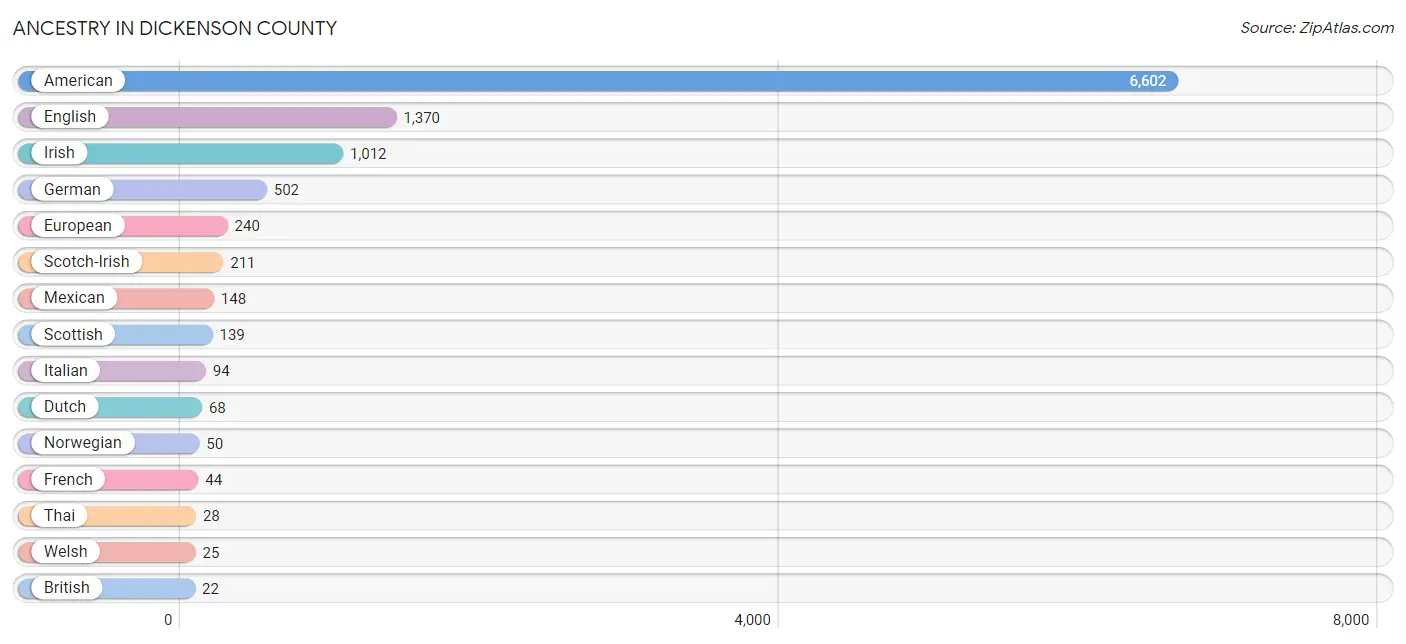
| Ancestry | # Population | % Population |
| African | 5 | 0.0% |
| Albanian | 2 | 0.0% |
| American | 6,602 | 46.9% |
| Belgian | 11 | 0.1% |
| British | 22 | 0.2% |
| Cherokee | 18 | 0.1% |
| Croatian | 22 | 0.2% |
| Dutch | 68 | 0.5% |
| English | 1,370 | 9.7% |
| European | 240 | 1.7% |
| French | 44 | 0.3% |
| French Canadian | 5 | 0.0% |
| German | 502 | 3.6% |
| Ghanaian | 3 | 0.0% |
| Irish | 1,012 | 7.2% |
| Italian | 94 | 0.7% |
| Jamaican | 13 | 0.1% |
| Korean | 22 | 0.2% |
| Lithuanian | 3 | 0.0% |
| Mexican | 148 | 1.1% |
| Mexican American Indian | 4 | 0.0% |
| Norwegian | 50 | 0.4% |
| Polish | 22 | 0.2% |
| Portuguese | 9 | 0.1% |
| Romanian | 8 | 0.1% |
| Scotch-Irish | 211 | 1.5% |
| Scottish | 139 | 1.0% |
| Subsaharan African | 8 | 0.1% |
| Swedish | 3 | 0.0% |
| Thai | 28 | 0.2% |
| Welsh | 25 | 0.2% | View All 31 Rows |
Immigrants in Dickenson County
The most numerous immigrant groups reported in Dickenson County came from Europe (20 | 0.1%), Western Europe (20 | 0.1%), Latin America (19 | 0.1%), Germany (14 | 0.1%), and Caribbean (13 | 0.1%), together accounting for 0.6% of all Dickenson County residents.
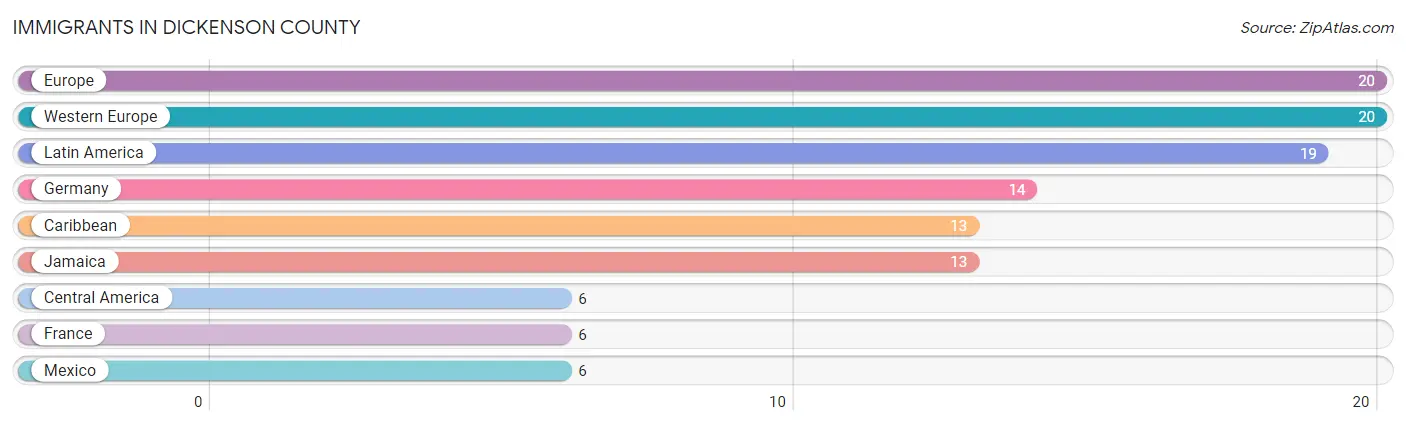
| Immigration Origin | # Population | % Population |
| Caribbean | 13 | 0.1% |
| Central America | 6 | 0.0% |
| Europe | 20 | 0.1% |
| France | 6 | 0.0% |
| Germany | 14 | 0.1% |
| Jamaica | 13 | 0.1% |
| Latin America | 19 | 0.1% |
| Mexico | 6 | 0.0% |
| Western Europe | 20 | 0.1% | View All 9 Rows |
Sex and Age in Dickenson County
Sex and Age in Dickenson County
The most populous age groups in Dickenson County are 55 to 59 Years (582 | 8.1%) for men and 55 to 59 Years (568 | 8.2%) for women.
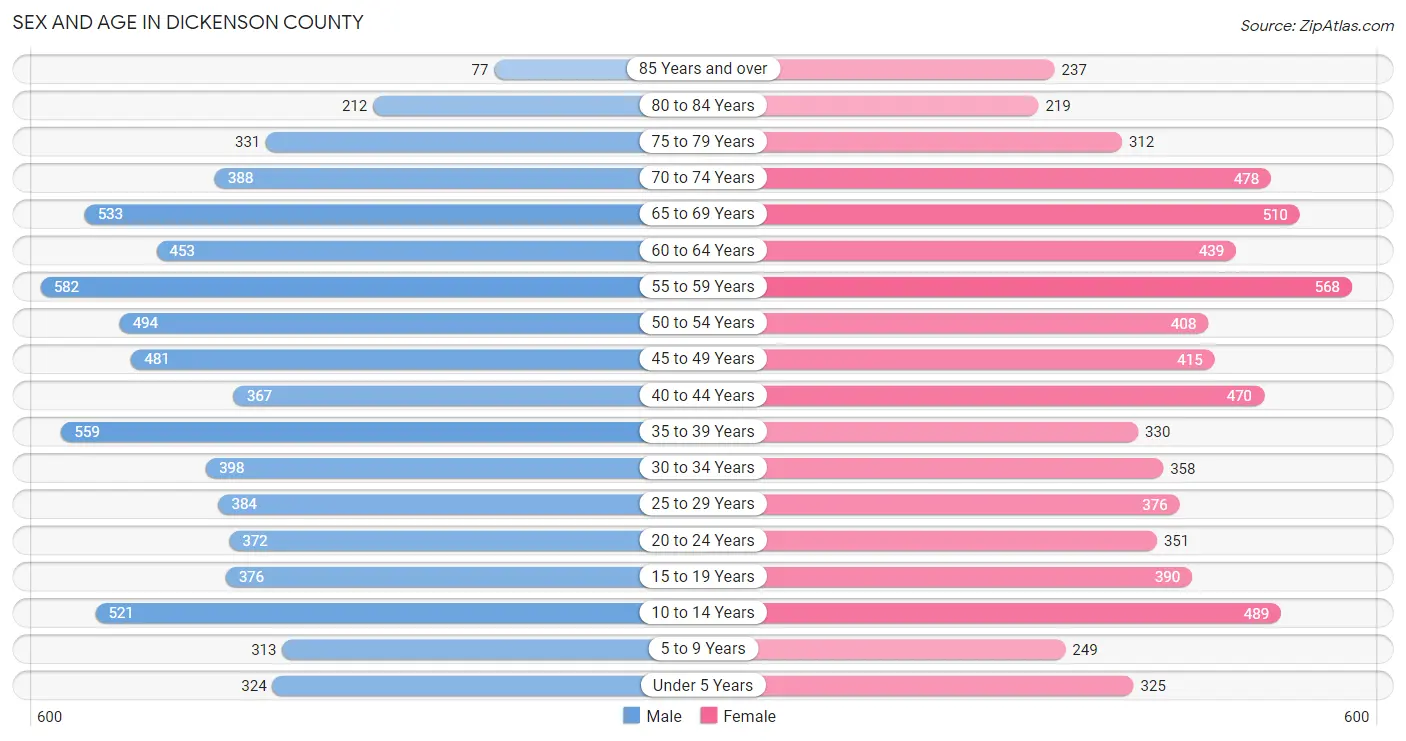
| Age Bracket | Male | Female |
| Under 5 Years | 324 (4.5%) | 325 (4.7%) |
| 5 to 9 Years | 313 (4.4%) | 249 (3.6%) |
| 10 to 14 Years | 521 (7.3%) | 489 (7.1%) |
| 15 to 19 Years | 376 (5.2%) | 390 (5.6%) |
| 20 to 24 Years | 372 (5.2%) | 351 (5.1%) |
| 25 to 29 Years | 384 (5.4%) | 376 (5.4%) |
| 30 to 34 Years | 398 (5.6%) | 358 (5.2%) |
| 35 to 39 Years | 559 (7.8%) | 330 (4.8%) |
| 40 to 44 Years | 367 (5.1%) | 470 (6.8%) |
| 45 to 49 Years | 481 (6.7%) | 415 (6.0%) |
| 50 to 54 Years | 494 (6.9%) | 408 (5.9%) |
| 55 to 59 Years | 582 (8.1%) | 568 (8.2%) |
| 60 to 64 Years | 453 (6.3%) | 439 (6.3%) |
| 65 to 69 Years | 533 (7.4%) | 510 (7.4%) |
| 70 to 74 Years | 388 (5.4%) | 478 (6.9%) |
| 75 to 79 Years | 331 (4.6%) | 312 (4.5%) |
| 80 to 84 Years | 212 (3.0%) | 219 (3.2%) |
| 85 Years and over | 77 (1.1%) | 237 (3.4%) |
| Total | 7,165 (100.0%) | 6,924 (100.0%) |
Families and Households in Dickenson County
Median Family Size in Dickenson County
The median family size in Dickenson County is 2.99 persons per family, with married-couple families (2,871 | 75.4%) accounting for the largest median family size of 3.04 persons per family. On the other hand, single male/father families (317 | 8.3%) represent the smallest median family size with 2.61 persons per family.
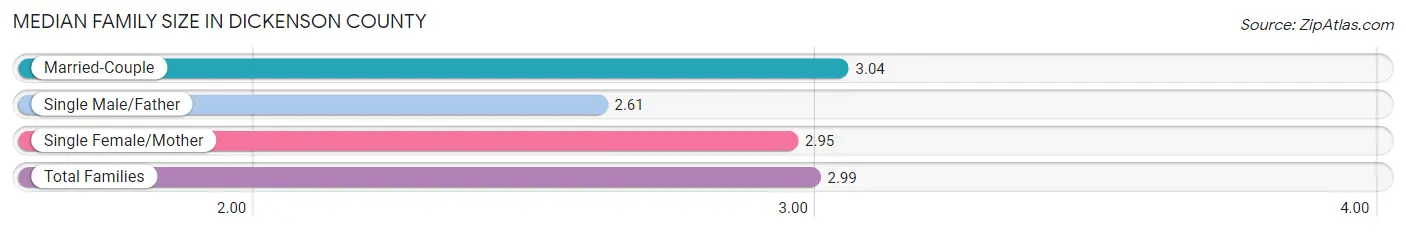
| Family Type | # Families | Family Size |
| Married-Couple | 2,871 (75.4%) | 3.04 |
| Single Male/Father | 317 (8.3%) | 2.61 |
| Single Female/Mother | 621 (16.3%) | 2.95 |
| Total Families | 3,809 (100.0%) | 2.99 |
Median Household Size in Dickenson County
The median household size in Dickenson County is 2.46 persons per household, with single female/mother households (621 | 11.2%) accounting for the largest median household size of 3.16 persons per household. non-family households (1,734 | 31.3%) represent the smallest median household size with 1.14 persons per household.
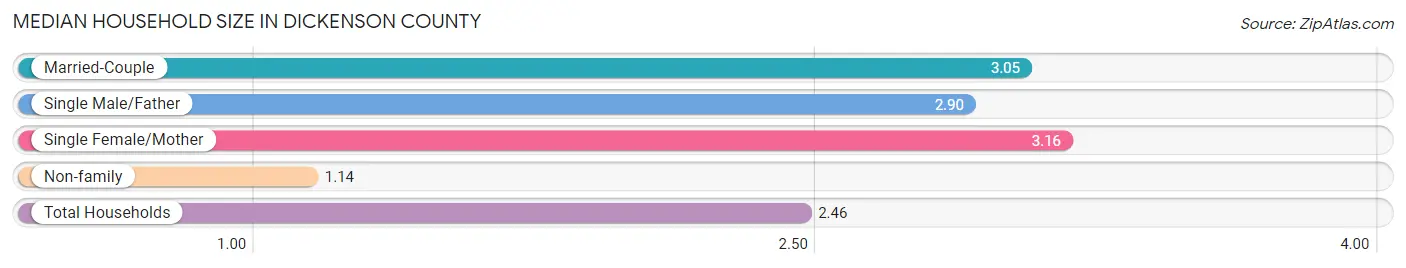
| Household Type | # Households | Household Size |
| Married-Couple | 2,871 (51.8%) | 3.05 |
| Single Male/Father | 317 (5.7%) | 2.90 |
| Single Female/Mother | 621 (11.2%) | 3.16 |
| Non-family | 1,734 (31.3%) | 1.14 |
| Total Households | 5,543 (100.0%) | 2.46 |
Household Size by Marriage Status in Dickenson County
Out of a total of 5,543 households in Dickenson County, 3,809 (68.7%) are family households, while 1,734 (31.3%) are nonfamily households. The most numerous type of family households are 2-person households, comprising 2,059, and the most common type of nonfamily households are 1-person households, comprising 1,634.
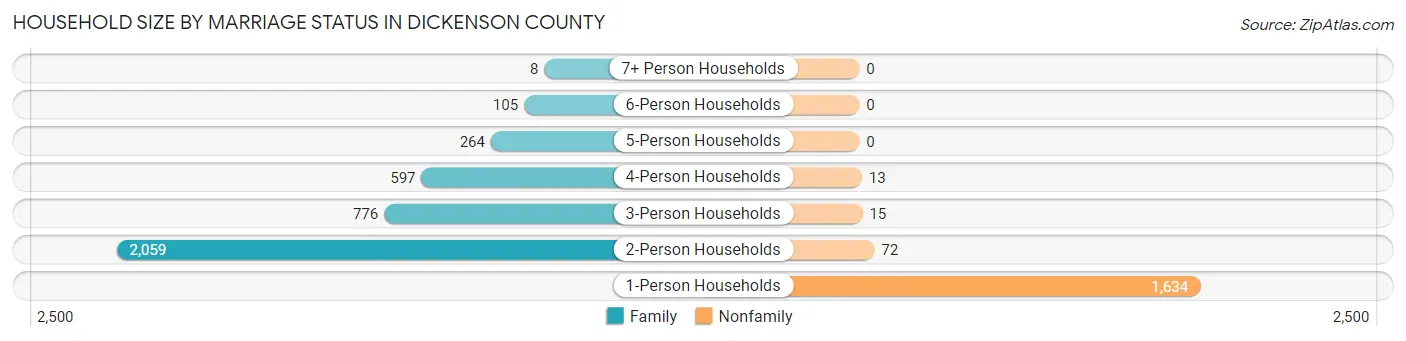
| Household Size | Family Households | Nonfamily Households |
| 1-Person Households | - | 1,634 (29.5%) |
| 2-Person Households | 2,059 (37.1%) | 72 (1.3%) |
| 3-Person Households | 776 (14.0%) | 15 (0.3%) |
| 4-Person Households | 597 (10.8%) | 13 (0.2%) |
| 5-Person Households | 264 (4.8%) | 0 (0.0%) |
| 6-Person Households | 105 (1.9%) | 0 (0.0%) |
| 7+ Person Households | 8 (0.1%) | 0 (0.0%) |
| Total | 3,809 (68.7%) | 1,734 (31.3%) |
Female Fertility in Dickenson County
Fertility by Age in Dickenson County
Average fertility rate in Dickenson County is 83.0 births per 1,000 women. Women in the age bracket of 20 to 34 years have the highest fertility rate with 162.0 births per 1,000 women. Women in the age bracket of 20 to 34 years acount for 77.2% of all women with births.
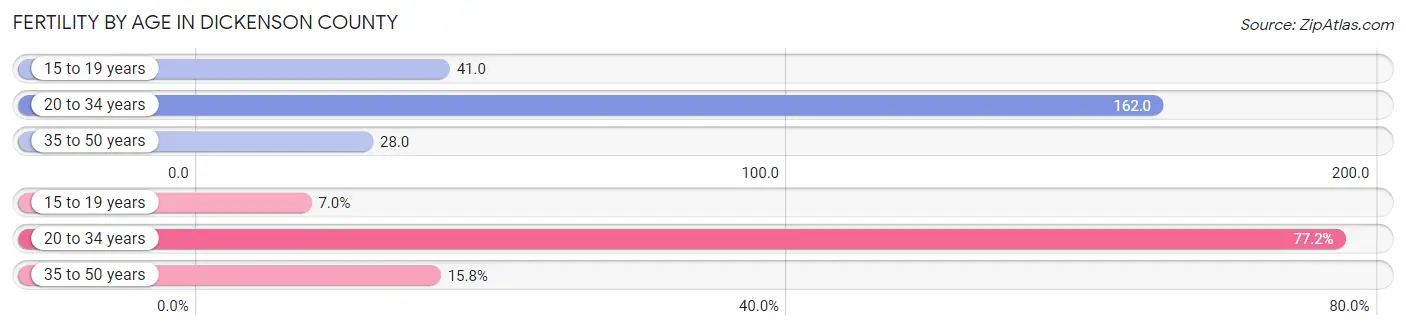
| Age Bracket | Women with Births | Births / 1,000 Women |
| 15 to 19 years | 16 (7.0%) | 41.0 |
| 20 to 34 years | 176 (77.2%) | 162.0 |
| 35 to 50 years | 36 (15.8%) | 28.0 |
| Total | 228 (100.0%) | 83.0 |
Fertility by Age by Marriage Status in Dickenson County
44.7% of women with births (228) in Dickenson County are married. The highest percentage of unmarried women with births falls into 15 to 19 years age bracket with 100.0% of them unmarried at the time of birth, while the lowest percentage of unmarried women with births belong to 35 to 50 years age bracket with 33.3% of them unmarried.
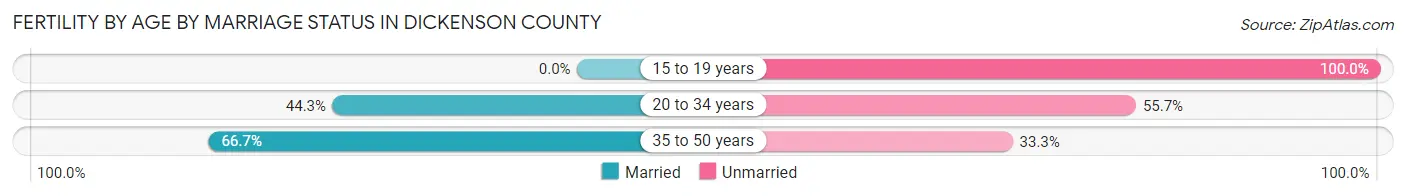
| Age Bracket | Married | Unmarried |
| 15 to 19 years | 0 (0.0%) | 16 (100.0%) |
| 20 to 34 years | 78 (44.3%) | 98 (55.7%) |
| 35 to 50 years | 24 (66.7%) | 12 (33.3%) |
| Total | 102 (44.7%) | 126 (55.3%) |
Fertility by Education in Dickenson County
Average fertility rate in Dickenson County is 83.0 births per 1,000 women. Women with the education attainment of graduate degree have the highest fertility rate of 130.0 births per 1,000 women, while women with the education attainment of less than high school have the lowest fertility at 50.0 births per 1,000 women. Women with the education attainment of college or associate's degree represent 44.3% of all women with births.
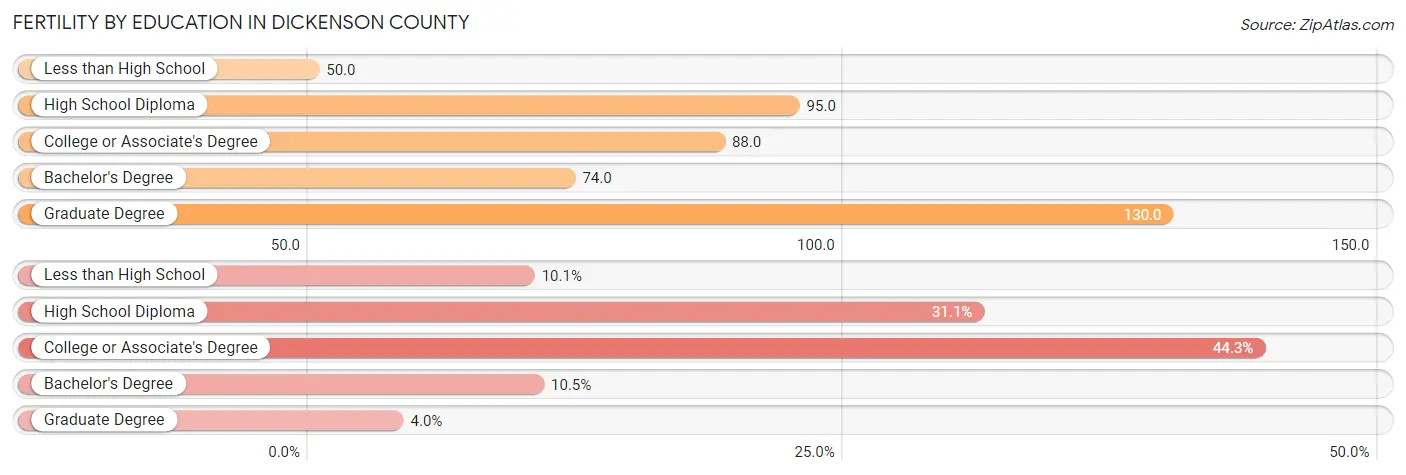
| Educational Attainment | Women with Births | Births / 1,000 Women |
| Less than High School | 23 (10.1%) | 50.0 |
| High School Diploma | 71 (31.1%) | 95.0 |
| College or Associate's Degree | 101 (44.3%) | 88.0 |
| Bachelor's Degree | 24 (10.5%) | 74.0 |
| Graduate Degree | 9 (4.0%) | 130.0 |
| Total | 228 (100.0%) | 83.0 |
Fertility by Education by Marriage Status in Dickenson County
55.3% of women with births in Dickenson County are unmarried. Women with the educational attainment of bachelor's degree are most likely to be married with 100.0% of them married at childbirth, while women with the educational attainment of less than high school are least likely to be married with 100.0% of them unmarried at childbirth.
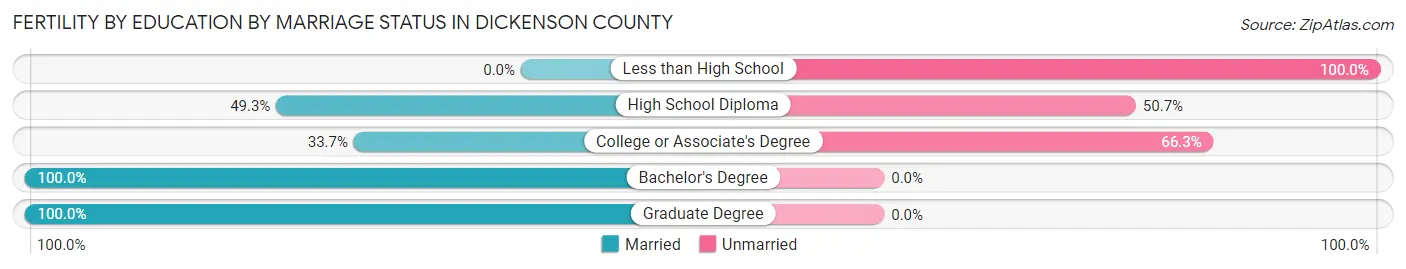
| Educational Attainment | Married | Unmarried |
| Less than High School | 0 (0.0%) | 23 (100.0%) |
| High School Diploma | 35 (49.3%) | 36 (50.7%) |
| College or Associate's Degree | 34 (33.7%) | 67 (66.3%) |
| Bachelor's Degree | 24 (100.0%) | 0 (0.0%) |
| Graduate Degree | 9 (100.0%) | 0 (0.0%) |
| Total | 102 (44.7%) | 126 (55.3%) |
Employment Characteristics in Dickenson County
Employment by Class of Employer in Dickenson County
Among the 4,444 employed individuals in Dickenson County, private company employees (2,751 | 61.9%), local government employees (564 | 12.7%), and state government employees (555 | 12.5%) make up the most common classes of employment.
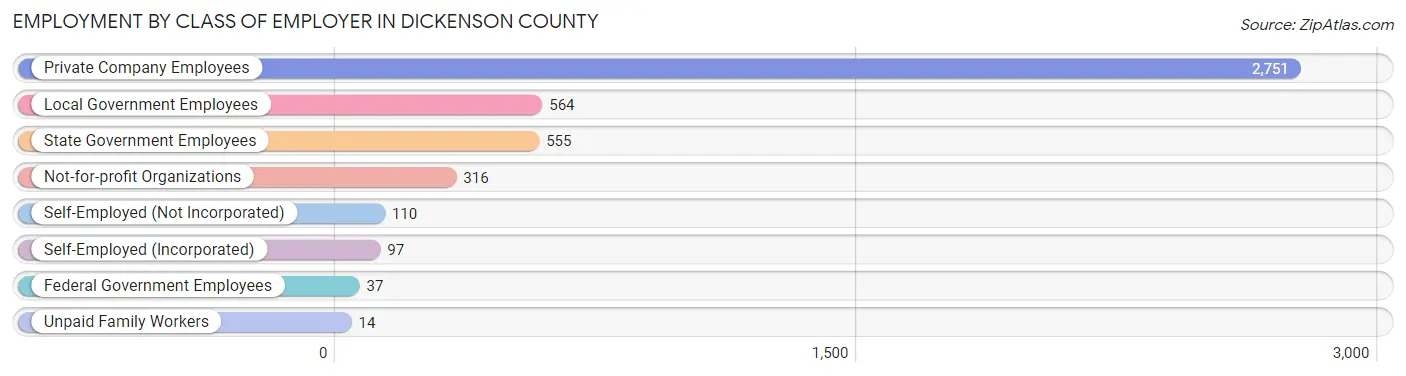
| Employer Class | # Employees | % Employees |
| Private Company Employees | 2,751 | 61.9% |
| Self-Employed (Incorporated) | 97 | 2.2% |
| Self-Employed (Not Incorporated) | 110 | 2.5% |
| Not-for-profit Organizations | 316 | 7.1% |
| Local Government Employees | 564 | 12.7% |
| State Government Employees | 555 | 12.5% |
| Federal Government Employees | 37 | 0.8% |
| Unpaid Family Workers | 14 | 0.3% |
| Total | 4,444 | 100.0% |
Employment Status by Age in Dickenson County
According to the labor force statistics for Dickenson County, out of the total population over 16 years of age (11,694), 39.6% or 4,631 individuals are in the labor force, with 3.4% or 157 of them unemployed. The age group with the highest labor force participation rate is 20 to 24 years, with 70.7% or 511 individuals in the labor force. Within the labor force, the 16 to 19 years age range has the highest percentage of unemployed individuals, with 25.8% or 33 of them being unemployed.
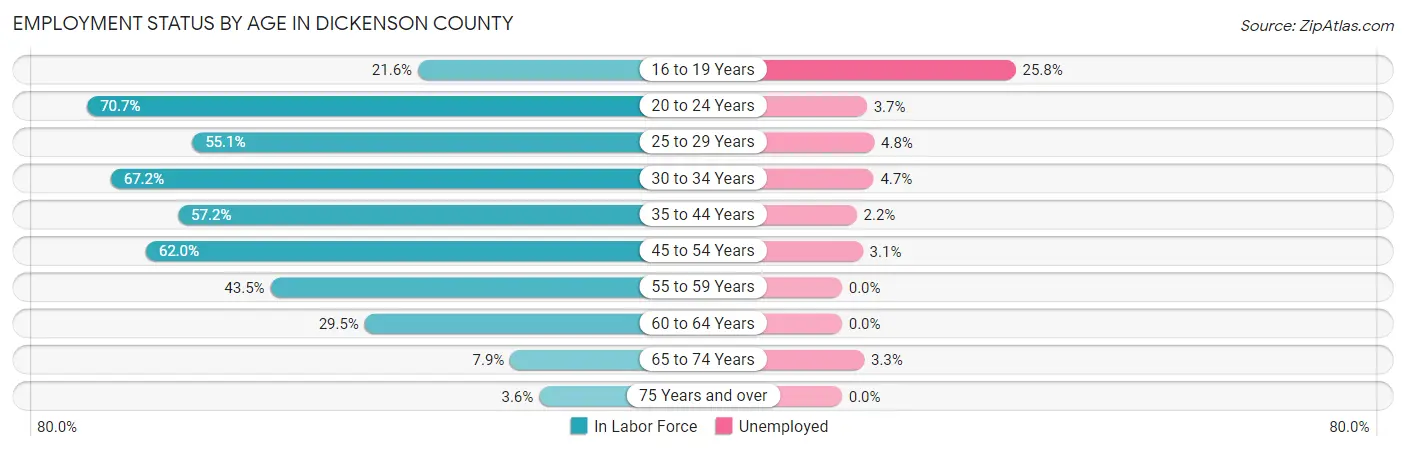
| Age Bracket | In Labor Force | Unemployed |
| 16 to 19 Years | 128 (21.6%) | 33 (25.8%) |
| 20 to 24 Years | 511 (70.7%) | 19 (3.7%) |
| 25 to 29 Years | 419 (55.1%) | 20 (4.8%) |
| 30 to 34 Years | 508 (67.2%) | 24 (4.7%) |
| 35 to 44 Years | 987 (57.2%) | 22 (2.2%) |
| 45 to 54 Years | 1,115 (62.0%) | 35 (3.1%) |
| 55 to 59 Years | 500 (43.5%) | 0 (0.0%) |
| 60 to 64 Years | 263 (29.5%) | 0 (0.0%) |
| 65 to 74 Years | 151 (7.9%) | 5 (3.3%) |
| 75 Years and over | 50 (3.6%) | 0 (0.0%) |
| Total | 4,631 (39.6%) | 157 (3.4%) |
Employment Status by Educational Attainment in Dickenson County
According to labor force statistics for Dickenson County, 53.5% of individuals (3,789) out of the total population between 25 and 64 years of age (7,082) are in the labor force, with 2.7% or 102 of them being unemployed. The group with the highest labor force participation rate are those with the educational attainment of bachelor's degree or higher, with 82.1% or 758 individuals in the labor force. Within the labor force, individuals with college / associate degree education have the highest percentage of unemployment, with 3.8% or 62 of them being unemployed.
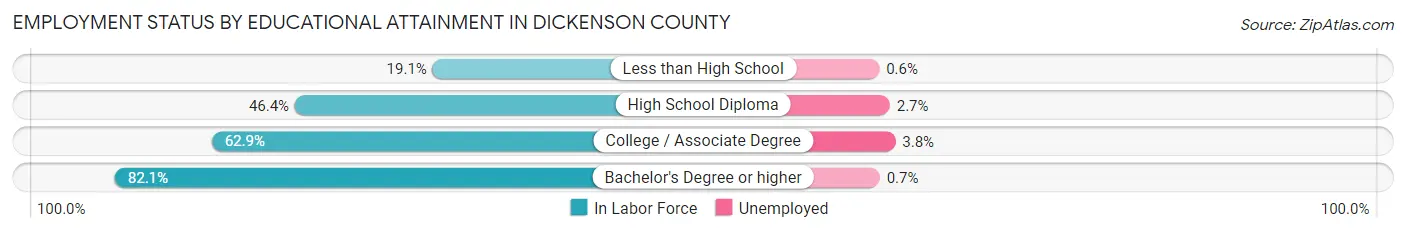
| Educational Attainment | In Labor Force | Unemployed |
| Less than High School | 178 (19.1%) | 6 (0.6%) |
| High School Diploma | 1,215 (46.4%) | 71 (2.7%) |
| College / Associate Degree | 1,640 (62.9%) | 99 (3.8%) |
| Bachelor's Degree or higher | 758 (82.1%) | 6 (0.7%) |
| Total | 3,789 (53.5%) | 191 (2.7%) |
Employment Occupations by Sex in Dickenson County
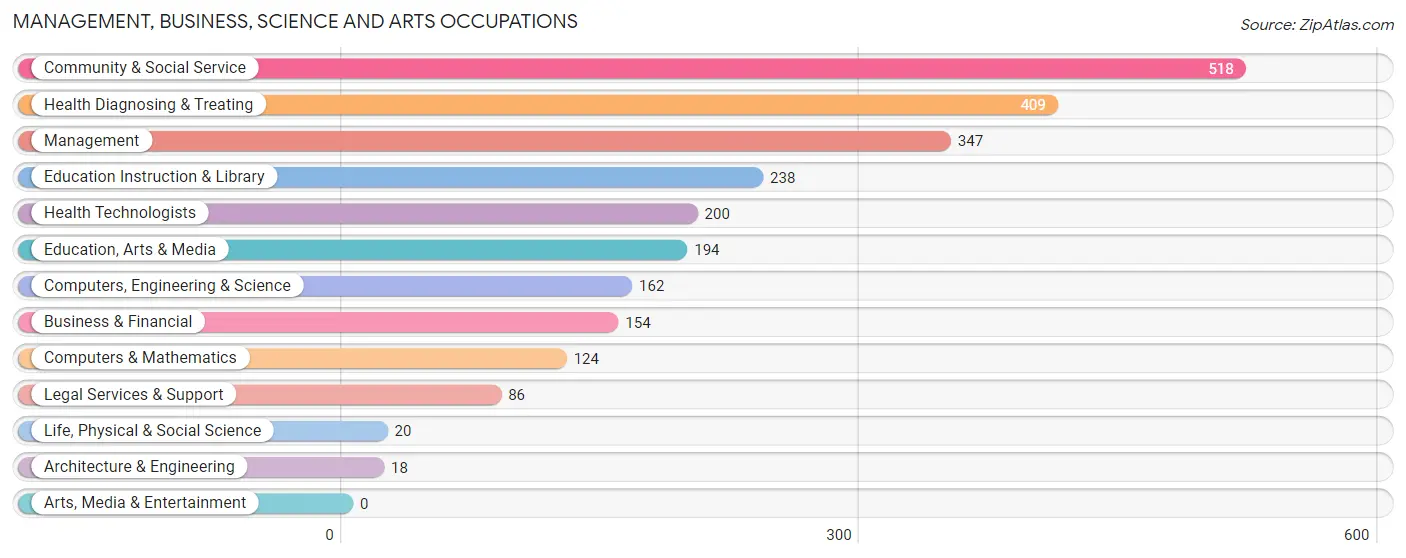
Management, Business, Science and Arts Occupations
The most common Management, Business, Science and Arts occupations in Dickenson County are Community & Social Service (518 | 11.6%), Health Diagnosing & Treating (409 | 9.1%), Management (347 | 7.8%), Education Instruction & Library (238 | 5.3%), and Health Technologists (200 | 4.5%).
Management, Business, Science and Arts Occupations by Sex
Within the Management, Business, Science and Arts occupations in Dickenson County, the most male-oriented occupations are Education, Arts & Media (43.8%), Management (41.2%), and Health Technologists (41.0%), while the most female-oriented occupations are Life, Physical & Social Science (95.0%), Business & Financial (82.5%), and Computers, Engineering & Science (80.2%).
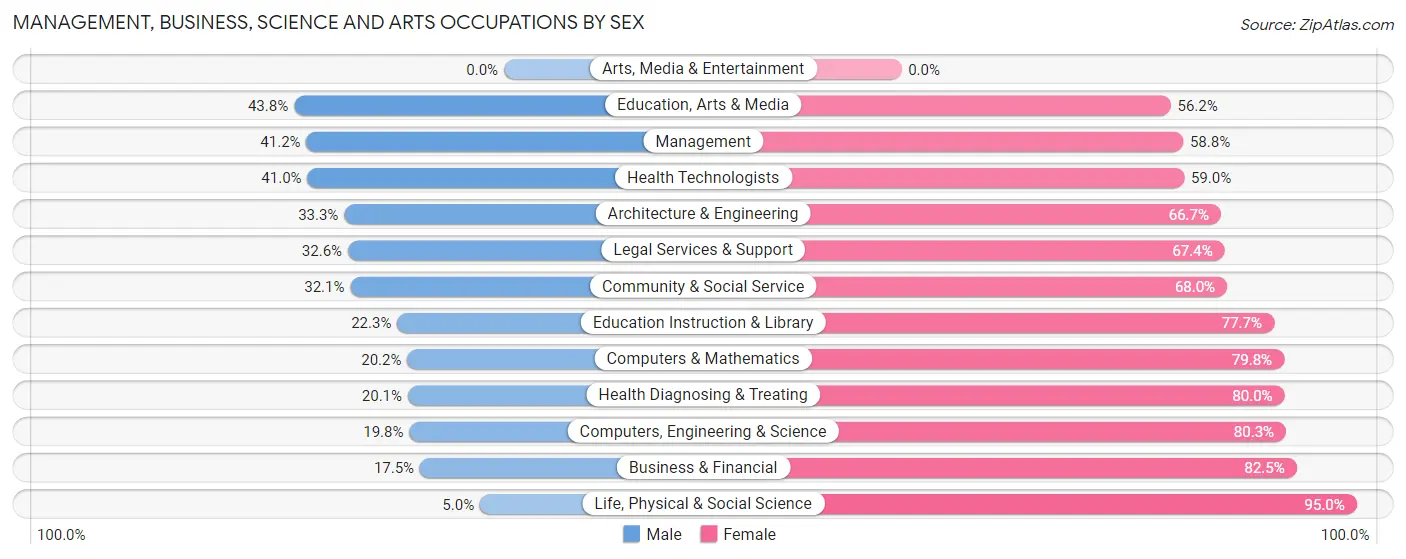
| Occupation | Male | Female |
| Management | 143 (41.2%) | 204 (58.8%) |
| Business & Financial | 27 (17.5%) | 127 (82.5%) |
| Computers, Engineering & Science | 32 (19.8%) | 130 (80.2%) |
| Computers & Mathematics | 25 (20.2%) | 99 (79.8%) |
| Architecture & Engineering | 6 (33.3%) | 12 (66.7%) |
| Life, Physical & Social Science | 1 (5.0%) | 19 (95.0%) |
| Community & Social Service | 166 (32.1%) | 352 (67.9%) |
| Education, Arts & Media | 85 (43.8%) | 109 (56.2%) |
| Legal Services & Support | 28 (32.6%) | 58 (67.4%) |
| Education Instruction & Library | 53 (22.3%) | 185 (77.7%) |
| Arts, Media & Entertainment | 0 (0.0%) | 0 (0.0%) |
| Health Diagnosing & Treating | 82 (20.1%) | 327 (79.9%) |
| Health Technologists | 82 (41.0%) | 118 (59.0%) |
| Total (Category) | 450 (28.3%) | 1,140 (71.7%) |
| Total (Overall) | 2,358 (52.7%) | 2,114 (47.3%) |
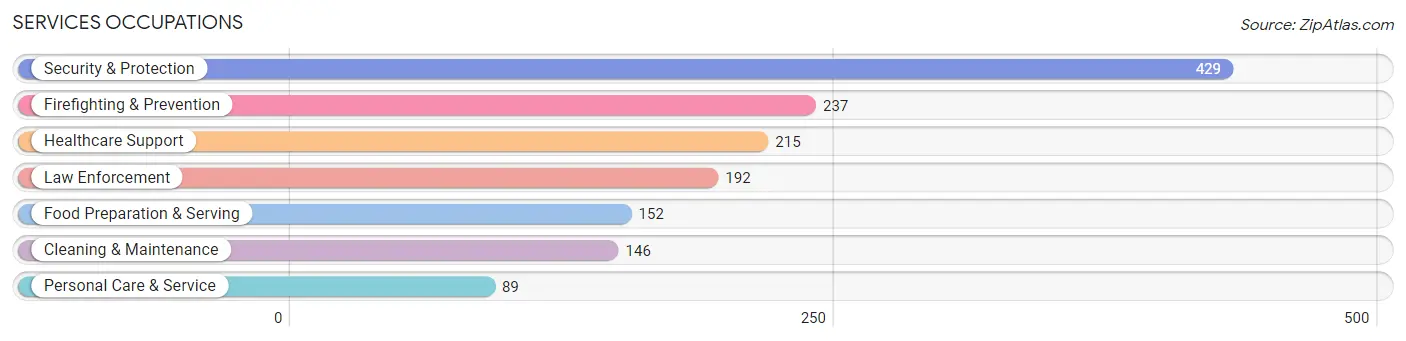
Services Occupations
The most common Services occupations in Dickenson County are Security & Protection (429 | 9.6%), Firefighting & Prevention (237 | 5.3%), Healthcare Support (215 | 4.8%), Law Enforcement (192 | 4.3%), and Food Preparation & Serving (152 | 3.4%).
Services Occupations by Sex
Within the Services occupations in Dickenson County, the most male-oriented occupations are Firefighting & Prevention (100.0%), Security & Protection (98.8%), and Law Enforcement (97.4%), while the most female-oriented occupations are Personal Care & Service (100.0%), Healthcare Support (94.9%), and Food Preparation & Serving (65.8%).
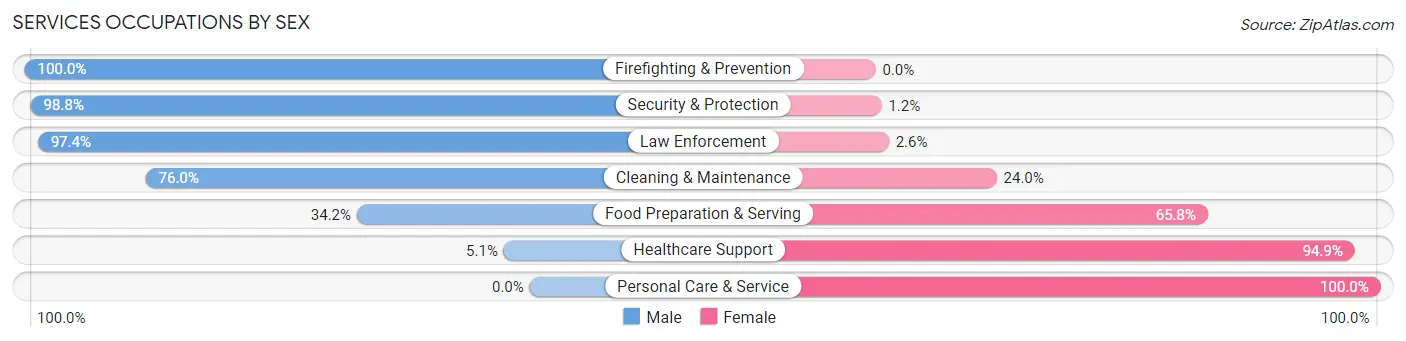
| Occupation | Male | Female |
| Healthcare Support | 11 (5.1%) | 204 (94.9%) |
| Security & Protection | 424 (98.8%) | 5 (1.2%) |
| Firefighting & Prevention | 237 (100.0%) | 0 (0.0%) |
| Law Enforcement | 187 (97.4%) | 5 (2.6%) |
| Food Preparation & Serving | 52 (34.2%) | 100 (65.8%) |
| Cleaning & Maintenance | 111 (76.0%) | 35 (24.0%) |
| Personal Care & Service | 0 (0.0%) | 89 (100.0%) |
| Total (Category) | 598 (58.0%) | 433 (42.0%) |
| Total (Overall) | 2,358 (52.7%) | 2,114 (47.3%) |
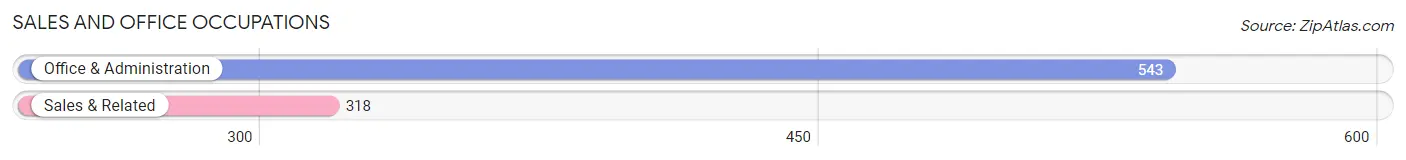
Sales and Office Occupations
The most common Sales and Office occupations in Dickenson County are Office & Administration (543 | 12.1%), and Sales & Related (318 | 7.1%).
Sales and Office Occupations by Sex
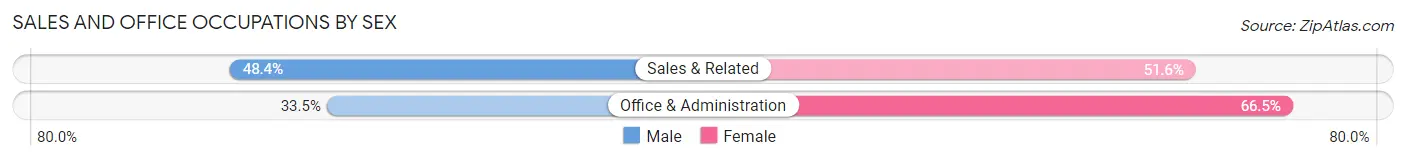
| Occupation | Male | Female |
| Sales & Related | 154 (48.4%) | 164 (51.6%) |
| Office & Administration | 182 (33.5%) | 361 (66.5%) |
| Total (Category) | 336 (39.0%) | 525 (61.0%) |
| Total (Overall) | 2,358 (52.7%) | 2,114 (47.3%) |
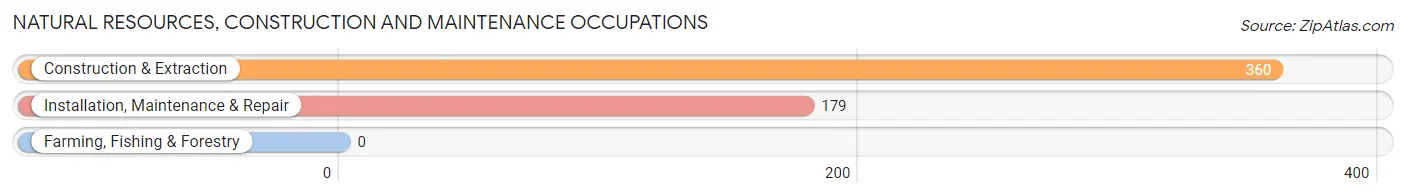
Natural Resources, Construction and Maintenance Occupations
The most common Natural Resources, Construction and Maintenance occupations in Dickenson County are Construction & Extraction (360 | 8.1%), and Installation, Maintenance & Repair (179 | 4.0%).
Natural Resources, Construction and Maintenance Occupations by Sex
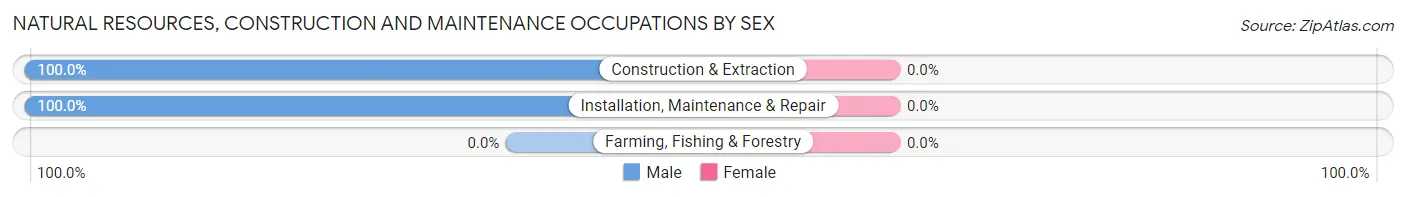
| Occupation | Male | Female |
| Farming, Fishing & Forestry | 0 (0.0%) | 0 (0.0%) |
| Construction & Extraction | 360 (100.0%) | 0 (0.0%) |
| Installation, Maintenance & Repair | 179 (100.0%) | 0 (0.0%) |
| Total (Category) | 539 (100.0%) | 0 (0.0%) |
| Total (Overall) | 2,358 (52.7%) | 2,114 (47.3%) |
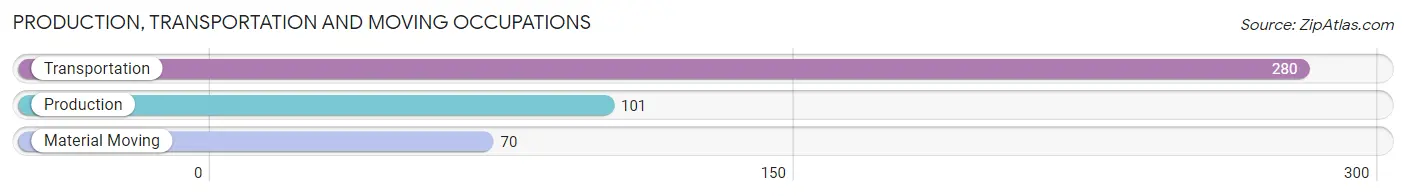
Production, Transportation and Moving Occupations
The most common Production, Transportation and Moving occupations in Dickenson County are Transportation (280 | 6.3%), Production (101 | 2.3%), and Material Moving (70 | 1.6%).
Production, Transportation and Moving Occupations by Sex
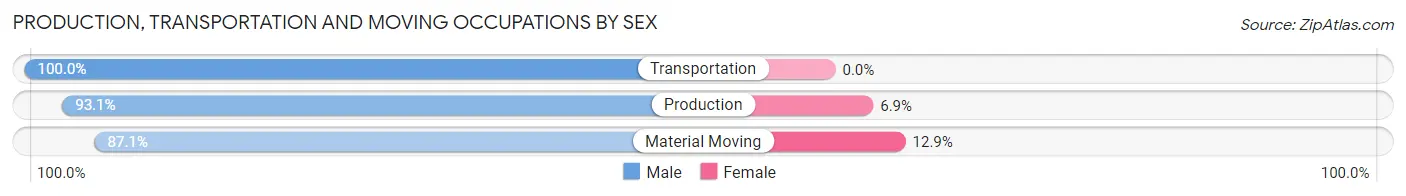
| Occupation | Male | Female |
| Production | 94 (93.1%) | 7 (6.9%) |
| Transportation | 280 (100.0%) | 0 (0.0%) |
| Material Moving | 61 (87.1%) | 9 (12.9%) |
| Total (Category) | 435 (96.5%) | 16 (3.5%) |
| Total (Overall) | 2,358 (52.7%) | 2,114 (47.3%) |
Employment Industries by Sex in Dickenson County
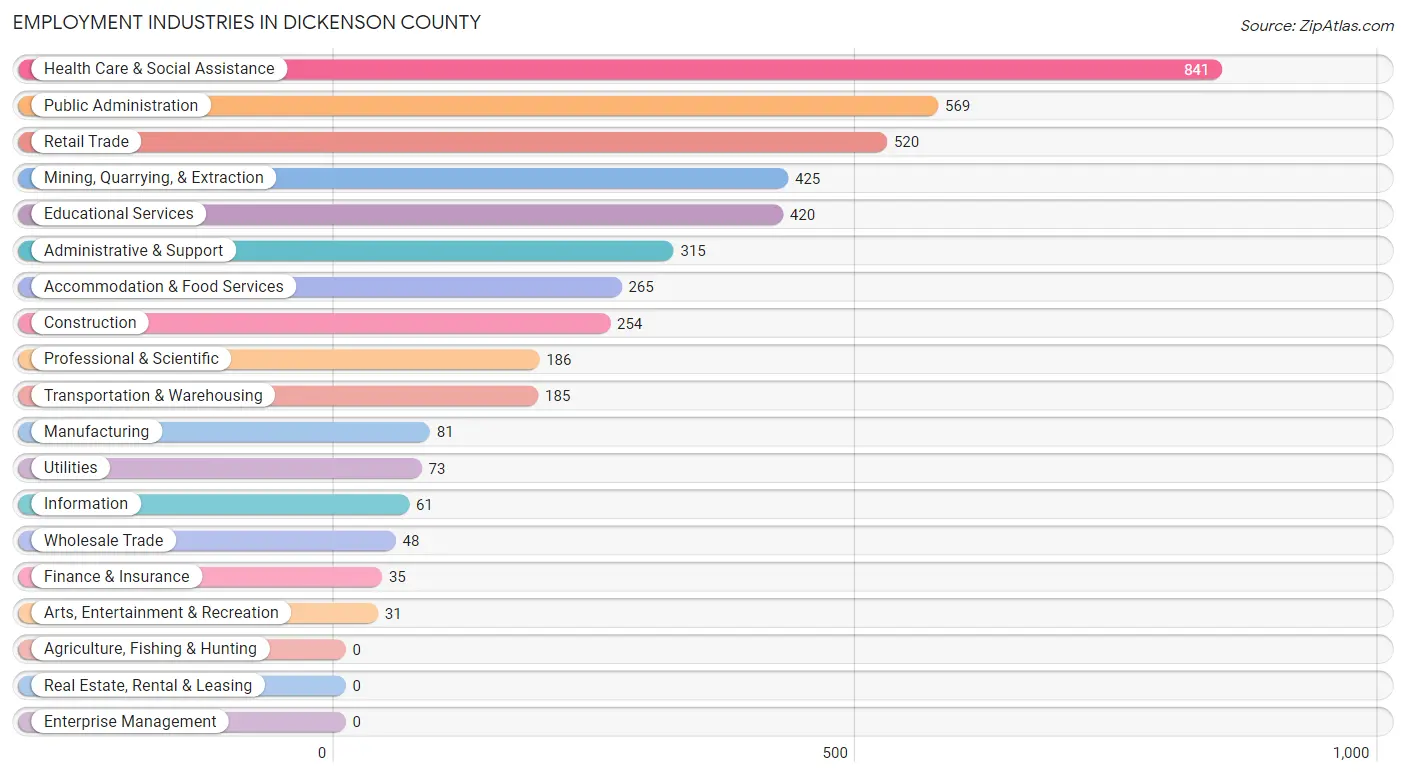
Employment Industries in Dickenson County
The major employment industries in Dickenson County include Health Care & Social Assistance (841 | 18.8%), Public Administration (569 | 12.7%), Retail Trade (520 | 11.6%), Mining, Quarrying, & Extraction (425 | 9.5%), and Educational Services (420 | 9.4%).
Employment Industries by Sex in Dickenson County
The Dickenson County industries that see more men than women are Construction (100.0%), Utilities (100.0%), and Mining, Quarrying, & Extraction (84.7%), whereas the industries that tend to have a higher number of women are Arts, Entertainment & Recreation (80.6%), Health Care & Social Assistance (79.8%), and Professional & Scientific (69.9%).
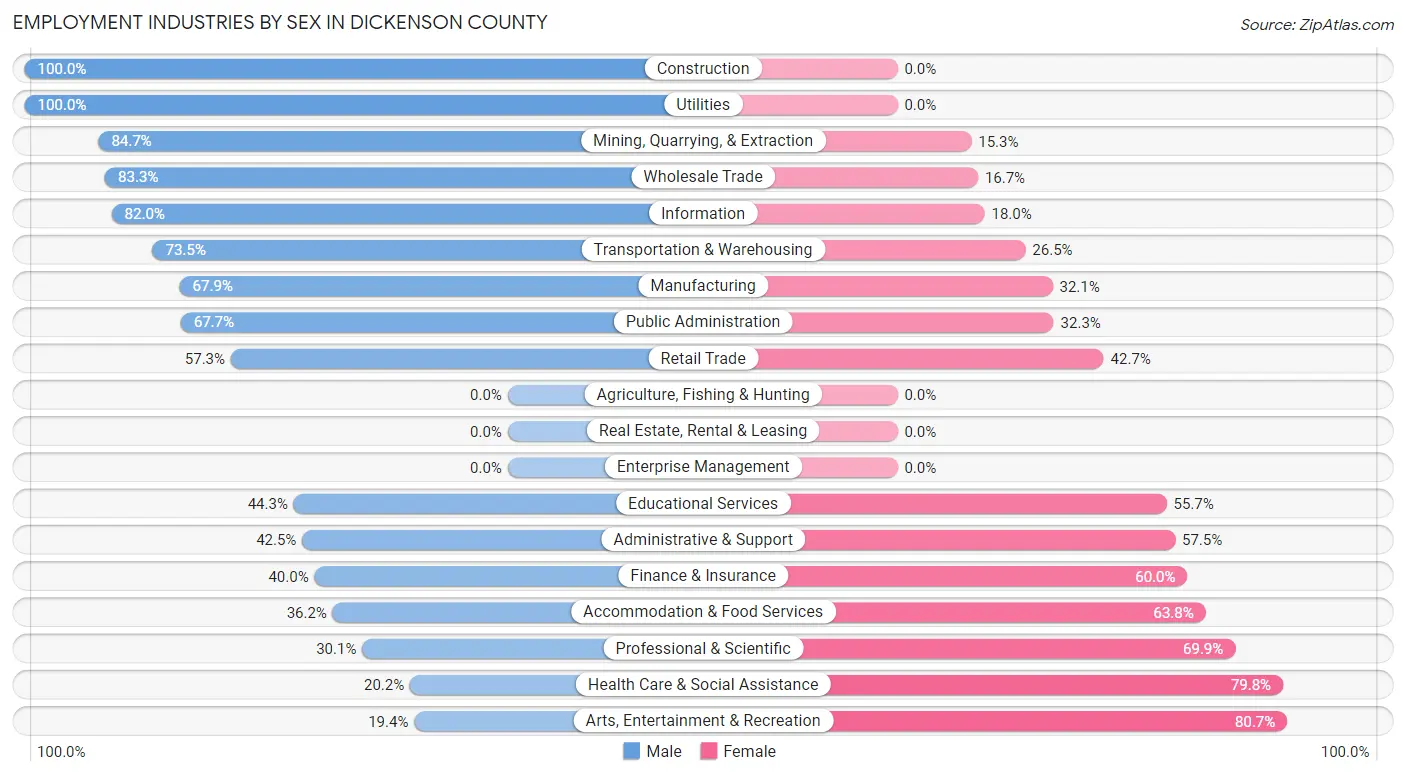
| Industry | Male | Female |
| Agriculture, Fishing & Hunting | 0 (0.0%) | 0 (0.0%) |
| Mining, Quarrying, & Extraction | 360 (84.7%) | 65 (15.3%) |
| Construction | 254 (100.0%) | 0 (0.0%) |
| Manufacturing | 55 (67.9%) | 26 (32.1%) |
| Wholesale Trade | 40 (83.3%) | 8 (16.7%) |
| Retail Trade | 298 (57.3%) | 222 (42.7%) |
| Transportation & Warehousing | 136 (73.5%) | 49 (26.5%) |
| Utilities | 73 (100.0%) | 0 (0.0%) |
| Information | 50 (82.0%) | 11 (18.0%) |
| Finance & Insurance | 14 (40.0%) | 21 (60.0%) |
| Real Estate, Rental & Leasing | 0 (0.0%) | 0 (0.0%) |
| Professional & Scientific | 56 (30.1%) | 130 (69.9%) |
| Enterprise Management | 0 (0.0%) | 0 (0.0%) |
| Administrative & Support | 134 (42.5%) | 181 (57.5%) |
| Educational Services | 186 (44.3%) | 234 (55.7%) |
| Health Care & Social Assistance | 170 (20.2%) | 671 (79.8%) |
| Arts, Entertainment & Recreation | 6 (19.4%) | 25 (80.6%) |
| Accommodation & Food Services | 96 (36.2%) | 169 (63.8%) |
| Public Administration | 385 (67.7%) | 184 (32.3%) |
| Total | 2,358 (52.7%) | 2,114 (47.3%) |
Education in Dickenson County
School Enrollment in Dickenson County
The most common levels of schooling among the 2,099 students in Dickenson County are high school (648 | 30.9%), college / undergraduate (476 | 22.7%), and middle school (464 | 22.1%).
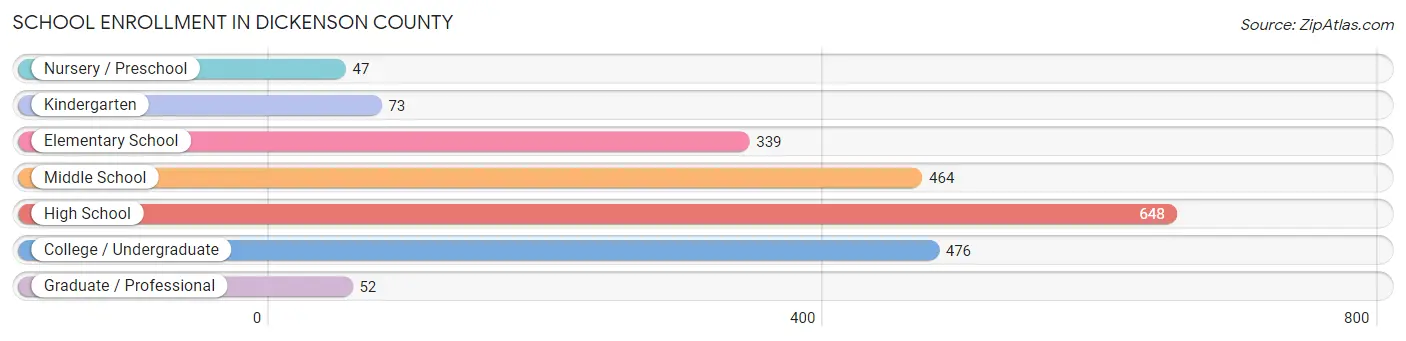
| School Level | # Students | % Students |
| Nursery / Preschool | 47 | 2.2% |
| Kindergarten | 73 | 3.5% |
| Elementary School | 339 | 16.2% |
| Middle School | 464 | 22.1% |
| High School | 648 | 30.9% |
| College / Undergraduate | 476 | 22.7% |
| Graduate / Professional | 52 | 2.5% |
| Total | 2,099 | 100.0% |
School Enrollment by Age by Funding Source in Dickenson County
Out of a total of 2,099 students who are enrolled in schools in Dickenson County, 143 (6.8%) attend a private institution, while the remaining 1,956 (93.2%) are enrolled in public schools. The age group of 25 to 34 year olds has the highest likelihood of being enrolled in private schools, with 64 (39.3% in the age bracket) enrolled. Conversely, the age group of 3 to 4 year olds has the lowest likelihood of being enrolled in a private school, with 39 (100.0% in the age bracket) attending a public institution.
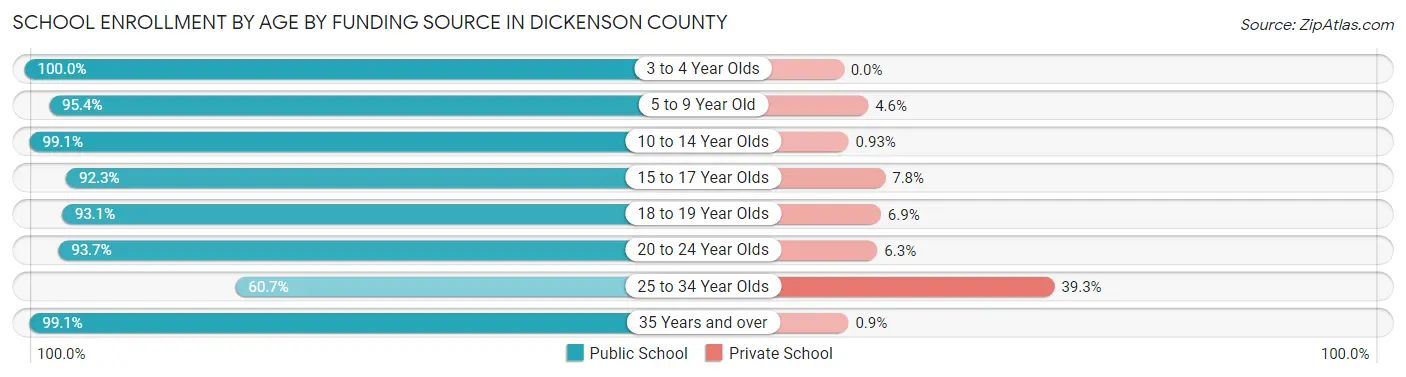
| Age Bracket | Public School | Private School |
| 3 to 4 Year Olds | 39 (100.0%) | 0 (0.0%) |
| 5 to 9 Year Old | 375 (95.4%) | 18 (4.6%) |
| 10 to 14 Year Olds | 636 (99.1%) | 6 (0.9%) |
| 15 to 17 Year Olds | 357 (92.2%) | 30 (7.7%) |
| 18 to 19 Year Olds | 161 (93.1%) | 12 (6.9%) |
| 20 to 24 Year Olds | 179 (93.7%) | 12 (6.3%) |
| 25 to 34 Year Olds | 99 (60.7%) | 64 (39.3%) |
| 35 Years and over | 110 (99.1%) | 1 (0.9%) |
| Total | 1,956 (93.2%) | 143 (6.8%) |
Educational Attainment by Field of Study in Dickenson County
Education (237 | 19.3%), business (179 | 14.6%), arts & humanities (141 | 11.5%), psychology (136 | 11.1%), and science & technology (100 | 8.2%) are the most common fields of study among 1,226 individuals in Dickenson County who have obtained a bachelor's degree or higher.
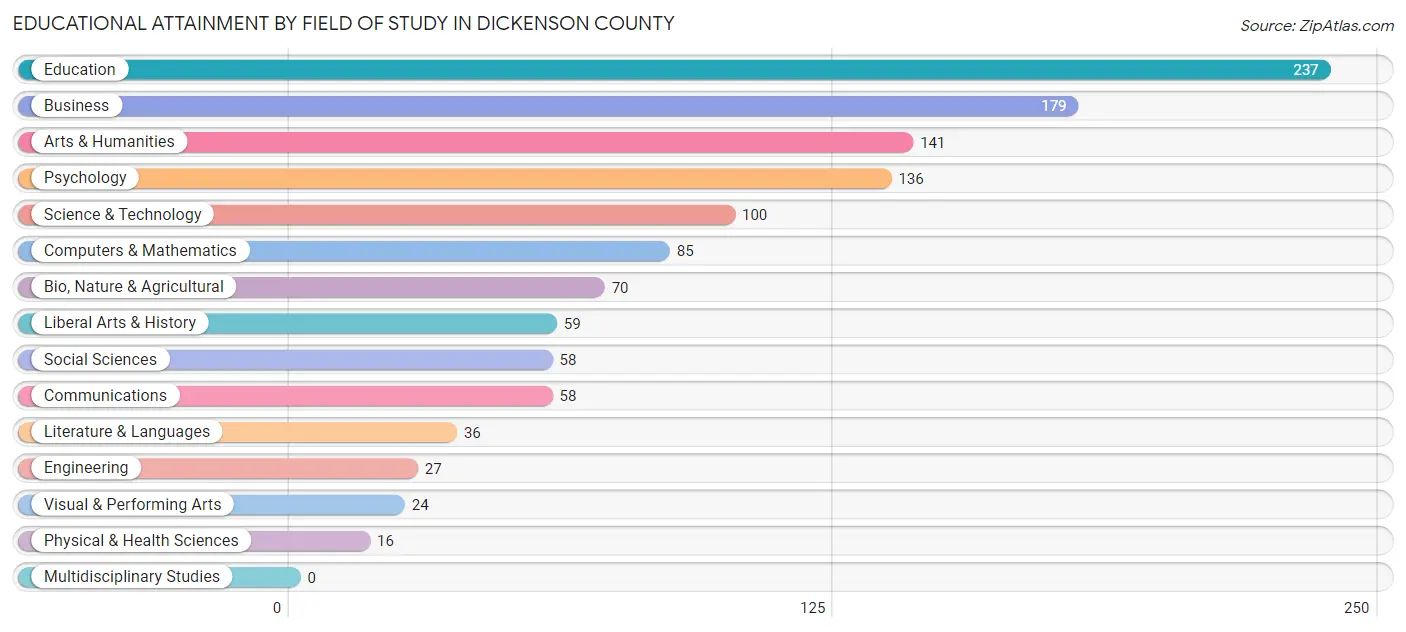
| Field of Study | # Graduates | % Graduates |
| Computers & Mathematics | 85 | 6.9% |
| Bio, Nature & Agricultural | 70 | 5.7% |
| Physical & Health Sciences | 16 | 1.3% |
| Psychology | 136 | 11.1% |
| Social Sciences | 58 | 4.7% |
| Engineering | 27 | 2.2% |
| Multidisciplinary Studies | 0 | 0.0% |
| Science & Technology | 100 | 8.2% |
| Business | 179 | 14.6% |
| Education | 237 | 19.3% |
| Literature & Languages | 36 | 2.9% |
| Liberal Arts & History | 59 | 4.8% |
| Visual & Performing Arts | 24 | 2.0% |
| Communications | 58 | 4.7% |
| Arts & Humanities | 141 | 11.5% |
| Total | 1,226 | 100.0% |
Transportation & Commute in Dickenson County
Vehicle Availability by Sex in Dickenson County
The most prevalent vehicle ownership categories in Dickenson County are males with 2 vehicles (690, accounting for 29.3%) and females with 2 vehicles (630, making up 33.0%).
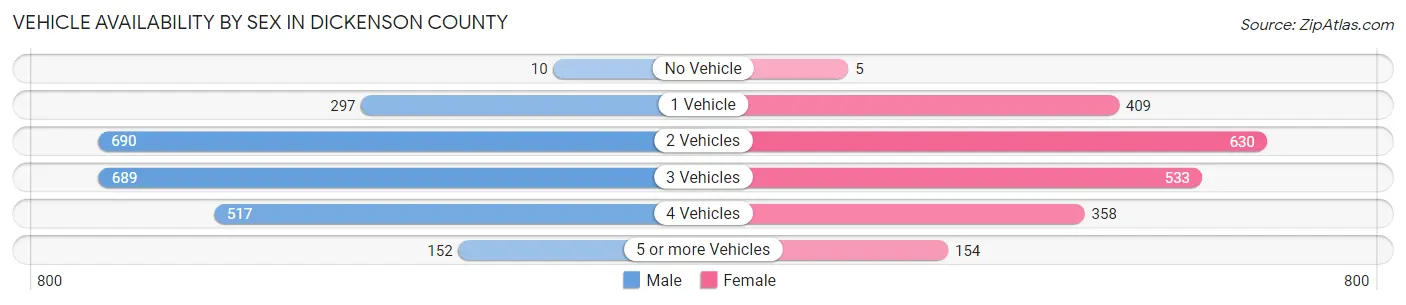
| Vehicles Available | Male | Female |
| No Vehicle | 10 (0.4%) | 5 (0.2%) |
| 1 Vehicle | 297 (12.6%) | 409 (19.6%) |
| 2 Vehicles | 690 (29.3%) | 630 (30.2%) |
| 3 Vehicles | 689 (29.3%) | 533 (25.5%) |
| 4 Vehicles | 517 (22.0%) | 358 (17.1%) |
| 5 or more Vehicles | 152 (6.5%) | 154 (7.4%) |
| Total | 2,355 (100.0%) | 2,089 (100.0%) |
Commute Time in Dickenson County
The most frequently occuring commute durations in Dickenson County are 30 to 34 minutes (786 commuters, 18.2%), 5 to 9 minutes (545 commuters, 12.6%), and 10 to 14 minutes (540 commuters, 12.5%).
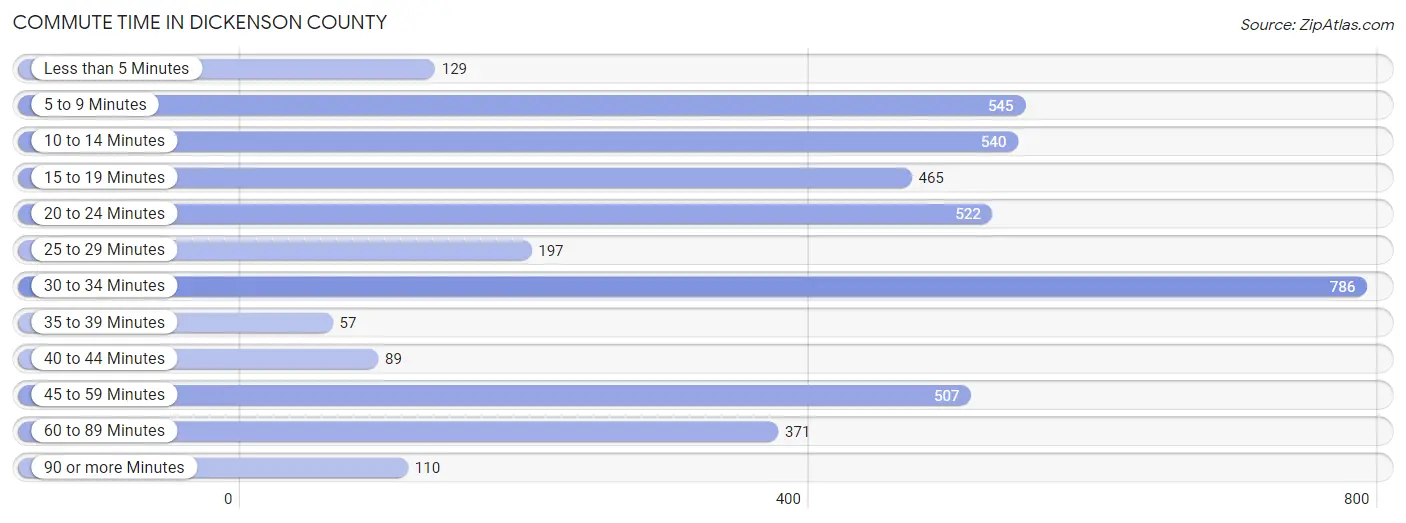
| Commute Time | # Commuters | % Commuters |
| Less than 5 Minutes | 129 | 3.0% |
| 5 to 9 Minutes | 545 | 12.6% |
| 10 to 14 Minutes | 540 | 12.5% |
| 15 to 19 Minutes | 465 | 10.8% |
| 20 to 24 Minutes | 522 | 12.1% |
| 25 to 29 Minutes | 197 | 4.6% |
| 30 to 34 Minutes | 786 | 18.2% |
| 35 to 39 Minutes | 57 | 1.3% |
| 40 to 44 Minutes | 89 | 2.1% |
| 45 to 59 Minutes | 507 | 11.7% |
| 60 to 89 Minutes | 371 | 8.6% |
| 90 or more Minutes | 110 | 2.5% |
Commute Time by Sex in Dickenson County
The most common commute times in Dickenson County are 45 to 59 minutes (328 commuters, 14.4%) for males and 30 to 34 minutes (550 commuters, 27.0%) for females.
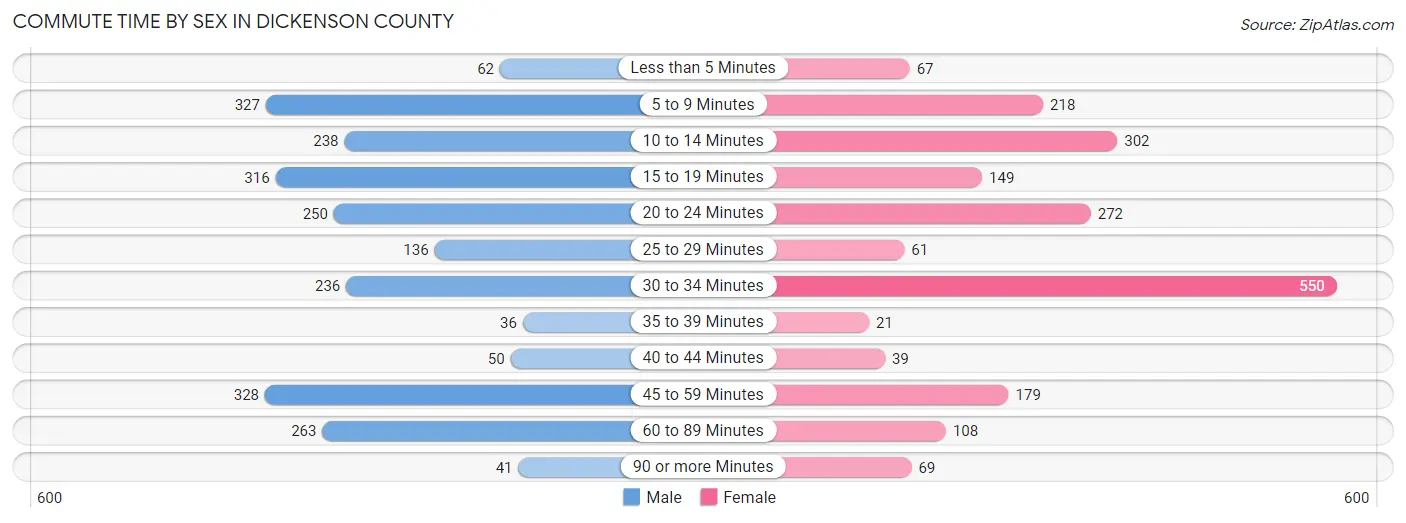
| Commute Time | Male | Female |
| Less than 5 Minutes | 62 (2.7%) | 67 (3.3%) |
| 5 to 9 Minutes | 327 (14.3%) | 218 (10.7%) |
| 10 to 14 Minutes | 238 (10.4%) | 302 (14.8%) |
| 15 to 19 Minutes | 316 (13.8%) | 149 (7.3%) |
| 20 to 24 Minutes | 250 (11.0%) | 272 (13.4%) |
| 25 to 29 Minutes | 136 (6.0%) | 61 (3.0%) |
| 30 to 34 Minutes | 236 (10.3%) | 550 (27.0%) |
| 35 to 39 Minutes | 36 (1.6%) | 21 (1.0%) |
| 40 to 44 Minutes | 50 (2.2%) | 39 (1.9%) |
| 45 to 59 Minutes | 328 (14.4%) | 179 (8.8%) |
| 60 to 89 Minutes | 263 (11.5%) | 108 (5.3%) |
| 90 or more Minutes | 41 (1.8%) | 69 (3.4%) |
Time of Departure to Work by Sex in Dickenson County
The most frequent times of departure to work in Dickenson County are 12:00 AM to 4:59 AM (325, 14.2%) for males and 8:00 AM to 8:29 AM (473, 23.2%) for females.
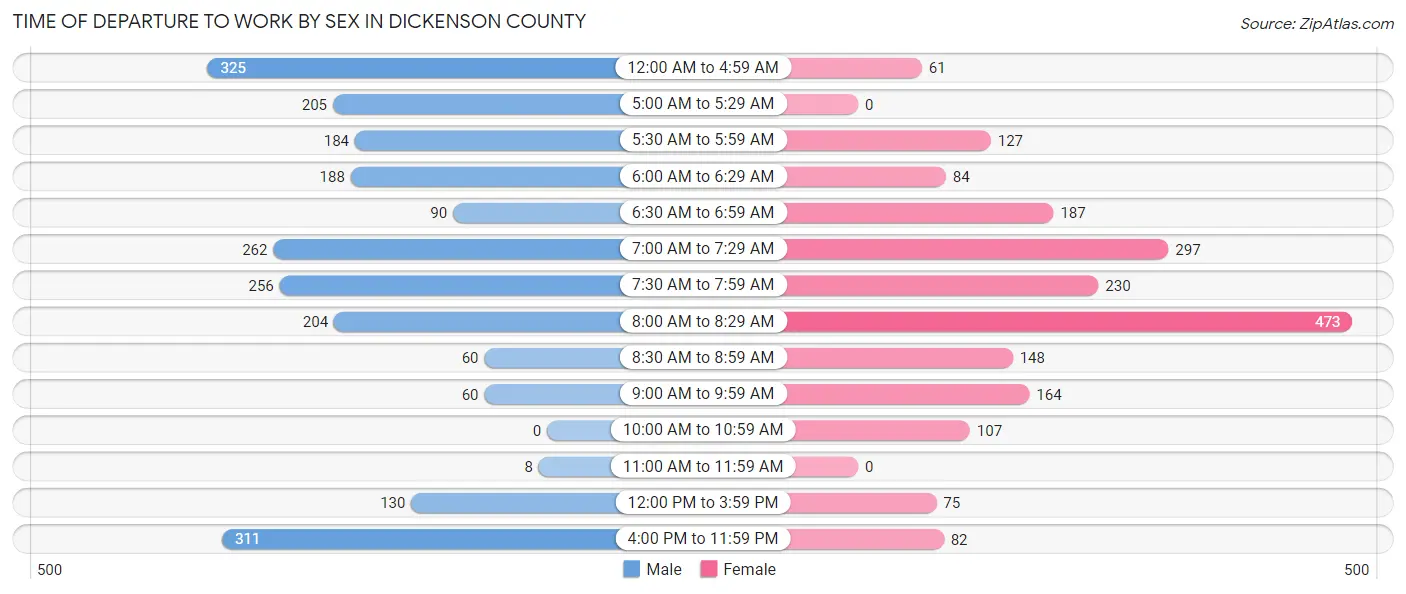
| Time of Departure | Male | Female |
| 12:00 AM to 4:59 AM | 325 (14.2%) | 61 (3.0%) |
| 5:00 AM to 5:29 AM | 205 (9.0%) | 0 (0.0%) |
| 5:30 AM to 5:59 AM | 184 (8.1%) | 127 (6.2%) |
| 6:00 AM to 6:29 AM | 188 (8.2%) | 84 (4.1%) |
| 6:30 AM to 6:59 AM | 90 (3.9%) | 187 (9.2%) |
| 7:00 AM to 7:29 AM | 262 (11.5%) | 297 (14.6%) |
| 7:30 AM to 7:59 AM | 256 (11.2%) | 230 (11.3%) |
| 8:00 AM to 8:29 AM | 204 (8.9%) | 473 (23.2%) |
| 8:30 AM to 8:59 AM | 60 (2.6%) | 148 (7.3%) |
| 9:00 AM to 9:59 AM | 60 (2.6%) | 164 (8.1%) |
| 10:00 AM to 10:59 AM | 0 (0.0%) | 107 (5.3%) |
| 11:00 AM to 11:59 AM | 8 (0.4%) | 0 (0.0%) |
| 12:00 PM to 3:59 PM | 130 (5.7%) | 75 (3.7%) |
| 4:00 PM to 11:59 PM | 311 (13.6%) | 82 (4.0%) |
| Total | 2,283 (100.0%) | 2,035 (100.0%) |
Housing Occupancy in Dickenson County
Occupancy by Ownership in Dickenson County
Of the total 5,543 dwellings in Dickenson County, owner-occupied units account for 4,281 (77.2%), while renter-occupied units make up 1,262 (22.8%).
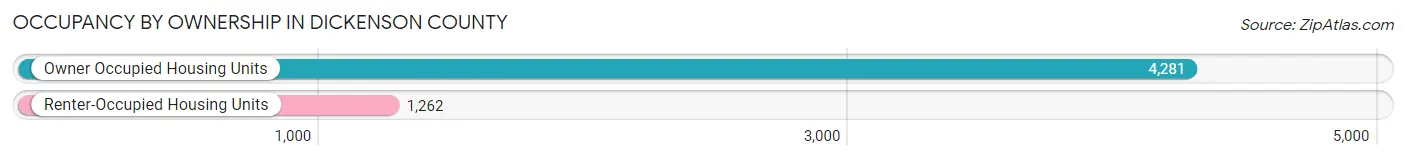
| Occupancy | # Housing Units | % Housing Units |
| Owner Occupied Housing Units | 4,281 | 77.2% |
| Renter-Occupied Housing Units | 1,262 | 22.8% |
| Total Occupied Housing Units | 5,543 | 100.0% |
Occupancy by Household Size in Dickenson County
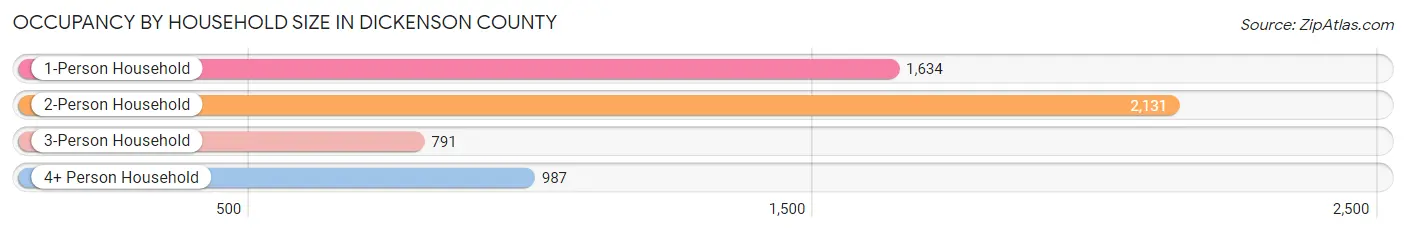
| Household Size | # Housing Units | % Housing Units |
| 1-Person Household | 1,634 | 29.5% |
| 2-Person Household | 2,131 | 38.4% |
| 3-Person Household | 791 | 14.3% |
| 4+ Person Household | 987 | 17.8% |
| Total Housing Units | 5,543 | 100.0% |
Occupancy by Ownership by Household Size in Dickenson County
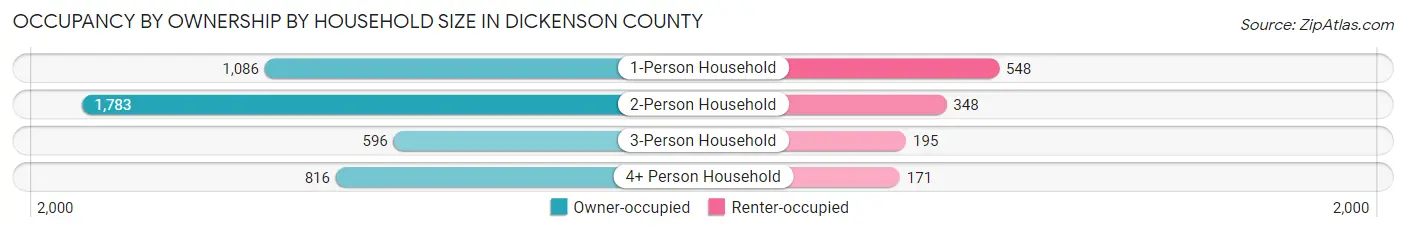
| Household Size | Owner-occupied | Renter-occupied |
| 1-Person Household | 1,086 (66.5%) | 548 (33.5%) |
| 2-Person Household | 1,783 (83.7%) | 348 (16.3%) |
| 3-Person Household | 596 (75.3%) | 195 (24.6%) |
| 4+ Person Household | 816 (82.7%) | 171 (17.3%) |
| Total Housing Units | 4,281 (77.2%) | 1,262 (22.8%) |
Occupancy by Educational Attainment in Dickenson County
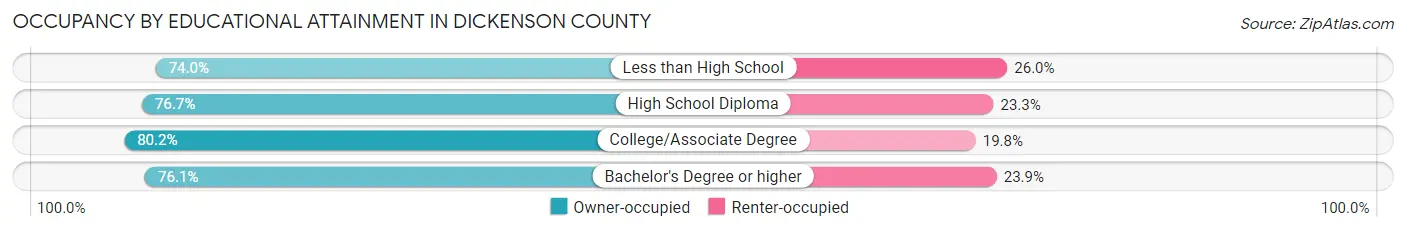
| Household Size | Owner-occupied | Renter-occupied |
| Less than High School | 734 (74.0%) | 258 (26.0%) |
| High School Diploma | 1,575 (76.7%) | 478 (23.3%) |
| College/Associate Degree | 1,377 (80.2%) | 339 (19.8%) |
| Bachelor's Degree or higher | 595 (76.1%) | 187 (23.9%) |
Occupancy by Age of Householder in Dickenson County
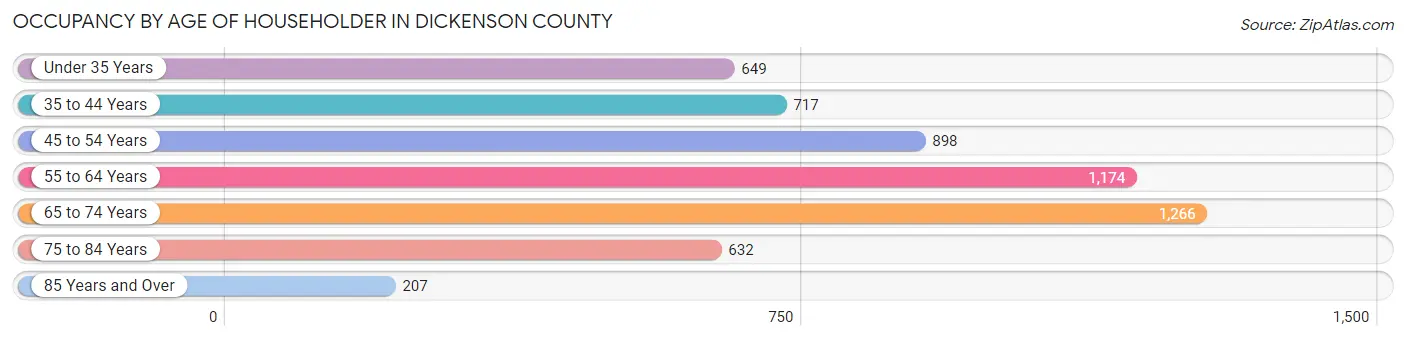
| Age Bracket | # Households | % Households |
| Under 35 Years | 649 | 11.7% |
| 35 to 44 Years | 717 | 12.9% |
| 45 to 54 Years | 898 | 16.2% |
| 55 to 64 Years | 1,174 | 21.2% |
| 65 to 74 Years | 1,266 | 22.8% |
| 75 to 84 Years | 632 | 11.4% |
| 85 Years and Over | 207 | 3.7% |
| Total | 5,543 | 100.0% |
Housing Finances in Dickenson County
Median Income by Occupancy in Dickenson County
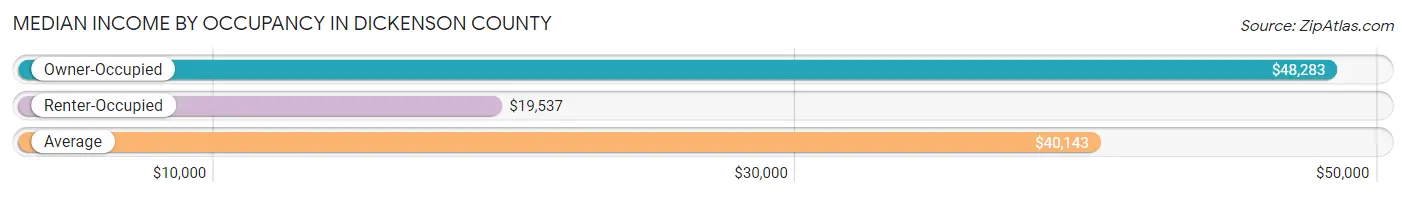
| Occupancy Type | # Households | Median Income |
| Owner-Occupied | 4,281 (77.2%) | $48,283 |
| Renter-Occupied | 1,262 (22.8%) | $19,537 |
| Average | 5,543 (100.0%) | $40,143 |
Occupancy by Householder Income Bracket in Dickenson County
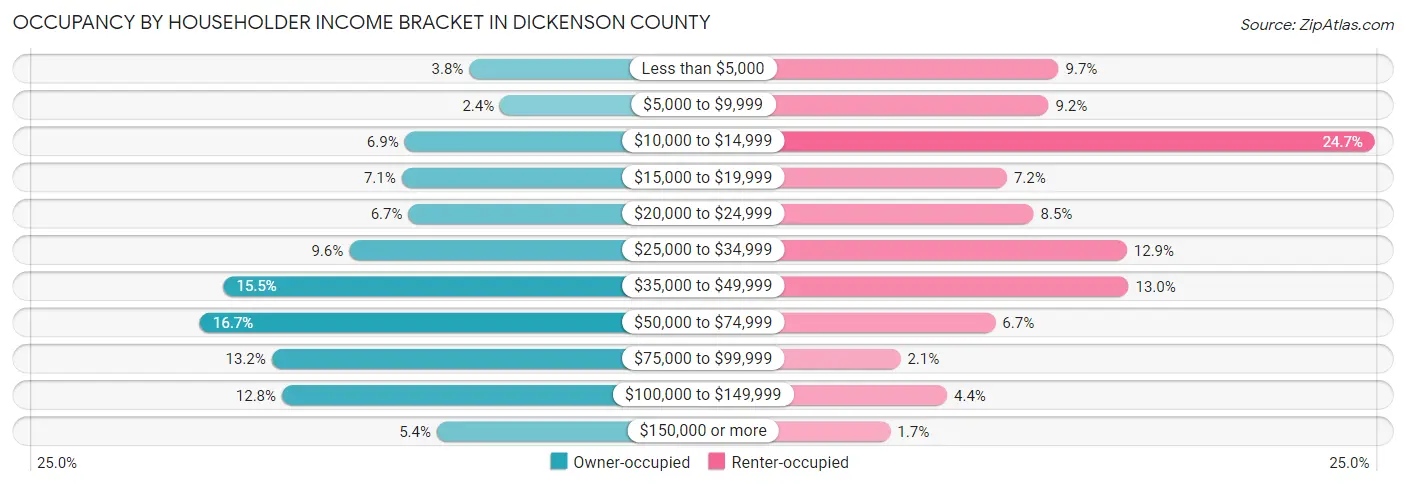
| Income Bracket | Owner-occupied | Renter-occupied |
| Less than $5,000 | 164 (3.8%) | 122 (9.7%) |
| $5,000 to $9,999 | 101 (2.4%) | 116 (9.2%) |
| $10,000 to $14,999 | 296 (6.9%) | 312 (24.7%) |
| $15,000 to $19,999 | 302 (7.0%) | 91 (7.2%) |
| $20,000 to $24,999 | 288 (6.7%) | 107 (8.5%) |
| $25,000 to $34,999 | 409 (9.6%) | 163 (12.9%) |
| $35,000 to $49,999 | 665 (15.5%) | 164 (13.0%) |
| $50,000 to $74,999 | 713 (16.7%) | 84 (6.7%) |
| $75,000 to $99,999 | 567 (13.2%) | 27 (2.1%) |
| $100,000 to $149,999 | 546 (12.8%) | 55 (4.4%) |
| $150,000 or more | 230 (5.4%) | 21 (1.7%) |
| Total | 4,281 (100.0%) | 1,262 (100.0%) |
Monthly Housing Cost Tiers in Dickenson County
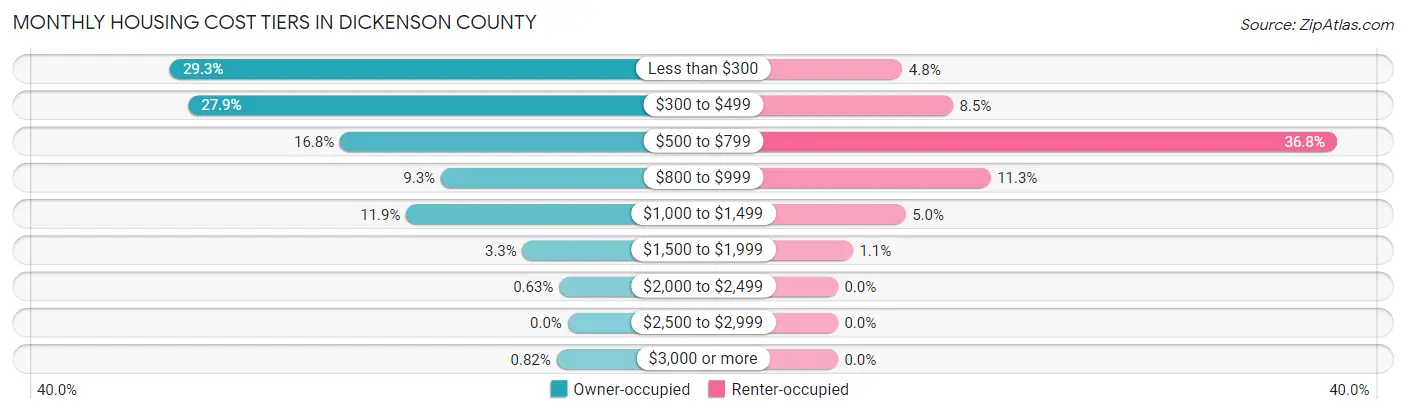
| Monthly Cost | Owner-occupied | Renter-occupied |
| Less than $300 | 1,254 (29.3%) | 60 (4.8%) |
| $300 to $499 | 1,196 (27.9%) | 107 (8.5%) |
| $500 to $799 | 718 (16.8%) | 464 (36.8%) |
| $800 to $999 | 400 (9.3%) | 142 (11.3%) |
| $1,000 to $1,499 | 509 (11.9%) | 63 (5.0%) |
| $1,500 to $1,999 | 142 (3.3%) | 14 (1.1%) |
| $2,000 to $2,499 | 27 (0.6%) | 0 (0.0%) |
| $2,500 to $2,999 | 0 (0.0%) | 0 (0.0%) |
| $3,000 or more | 35 (0.8%) | 0 (0.0%) |
| Total | 4,281 (100.0%) | 1,262 (100.0%) |
Physical Housing Characteristics in Dickenson County
Housing Structures in Dickenson County
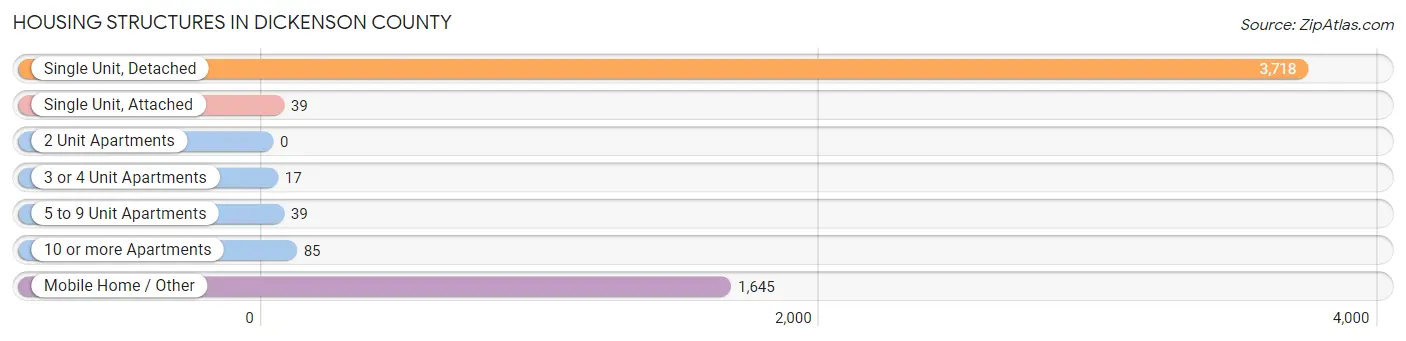
| Structure Type | # Housing Units | % Housing Units |
| Single Unit, Detached | 3,718 | 67.1% |
| Single Unit, Attached | 39 | 0.7% |
| 2 Unit Apartments | 0 | 0.0% |
| 3 or 4 Unit Apartments | 17 | 0.3% |
| 5 to 9 Unit Apartments | 39 | 0.7% |
| 10 or more Apartments | 85 | 1.5% |
| Mobile Home / Other | 1,645 | 29.7% |
| Total | 5,543 | 100.0% |
Housing Structures by Occupancy in Dickenson County
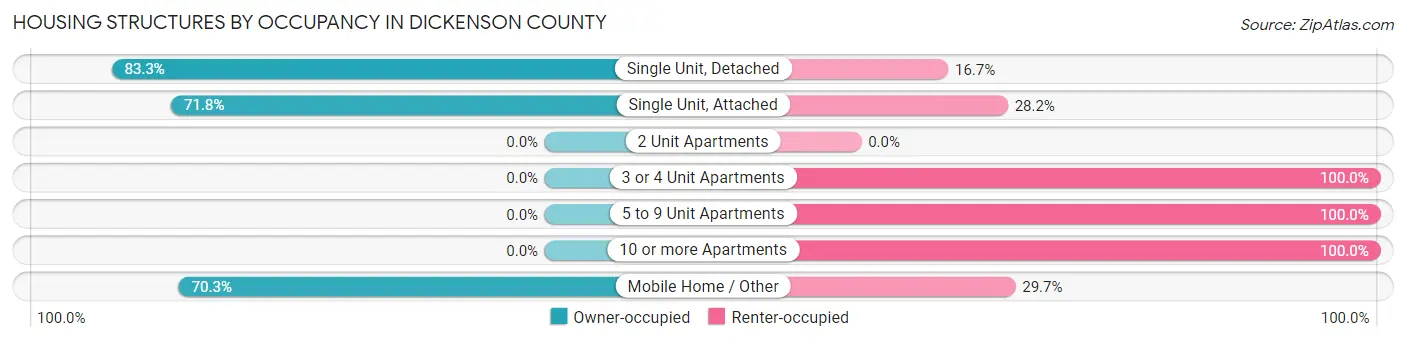
| Structure Type | Owner-occupied | Renter-occupied |
| Single Unit, Detached | 3,096 (83.3%) | 622 (16.7%) |
| Single Unit, Attached | 28 (71.8%) | 11 (28.2%) |
| 2 Unit Apartments | 0 (0.0%) | 0 (0.0%) |
| 3 or 4 Unit Apartments | 0 (0.0%) | 17 (100.0%) |
| 5 to 9 Unit Apartments | 0 (0.0%) | 39 (100.0%) |
| 10 or more Apartments | 0 (0.0%) | 85 (100.0%) |
| Mobile Home / Other | 1,157 (70.3%) | 488 (29.7%) |
| Total | 4,281 (77.2%) | 1,262 (22.8%) |
Housing Structures by Number of Rooms in Dickenson County
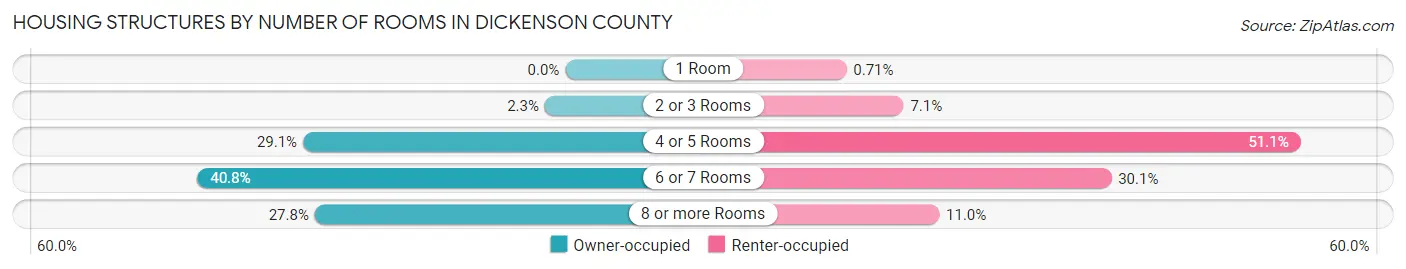
| Number of Rooms | Owner-occupied | Renter-occupied |
| 1 Room | 0 (0.0%) | 9 (0.7%) |
| 2 or 3 Rooms | 97 (2.3%) | 89 (7.0%) |
| 4 or 5 Rooms | 1,246 (29.1%) | 645 (51.1%) |
| 6 or 7 Rooms | 1,748 (40.8%) | 380 (30.1%) |
| 8 or more Rooms | 1,190 (27.8%) | 139 (11.0%) |
| Total | 4,281 (100.0%) | 1,262 (100.0%) |
Housing Structure by Heating Type in Dickenson County
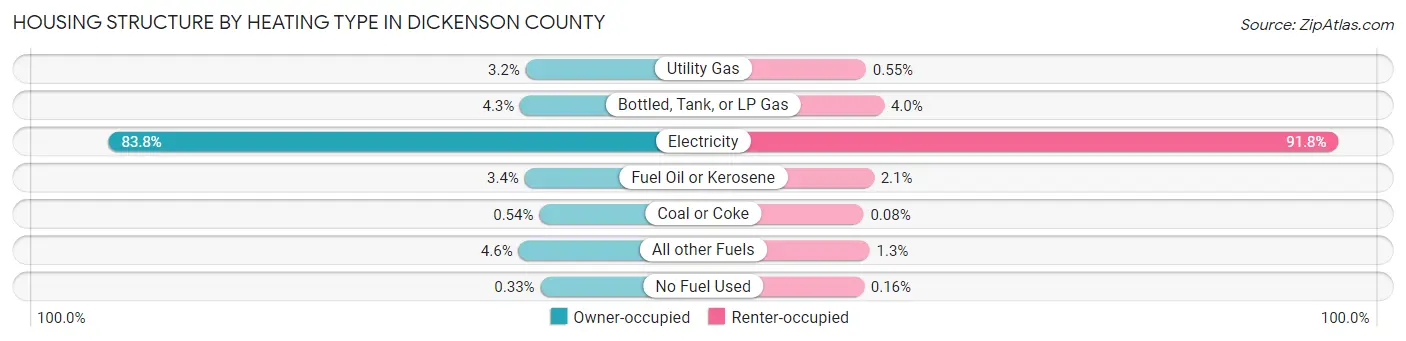
| Heating Type | Owner-occupied | Renter-occupied |
| Utility Gas | 136 (3.2%) | 7 (0.5%) |
| Bottled, Tank, or LP Gas | 182 (4.3%) | 51 (4.0%) |
| Electricity | 3,587 (83.8%) | 1,159 (91.8%) |
| Fuel Oil or Kerosene | 144 (3.4%) | 26 (2.1%) |
| Coal or Coke | 23 (0.5%) | 1 (0.1%) |
| All other Fuels | 195 (4.6%) | 16 (1.3%) |
| No Fuel Used | 14 (0.3%) | 2 (0.2%) |
| Total | 4,281 (100.0%) | 1,262 (100.0%) |
Household Vehicle Usage in Dickenson County
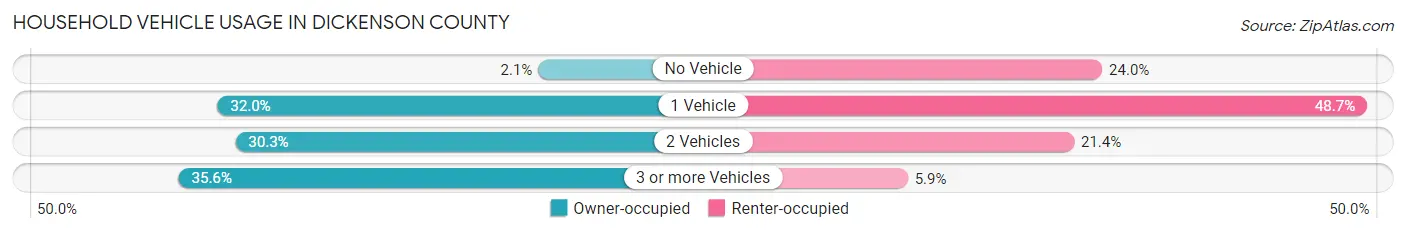
| Vehicles per Household | Owner-occupied | Renter-occupied |
| No Vehicle | 88 (2.1%) | 303 (24.0%) |
| 1 Vehicle | 1,370 (32.0%) | 615 (48.7%) |
| 2 Vehicles | 1,298 (30.3%) | 270 (21.4%) |
| 3 or more Vehicles | 1,525 (35.6%) | 74 (5.9%) |
| Total | 4,281 (100.0%) | 1,262 (100.0%) |
Real Estate & Mortgages in Dickenson County
Real Estate and Mortgage Overview in Dickenson County
| Characteristic | Without Mortgage | With Mortgage |
| Housing Units | 2,894 | 1,387 |
| Median Property Value | $87,100 | $92,900 |
| Median Household Income | $40,827 | $110 |
| Monthly Housing Costs | $326 | $16 |
| Real Estate Taxes | $465 | $28 |
Property Value by Mortgage Status in Dickenson County
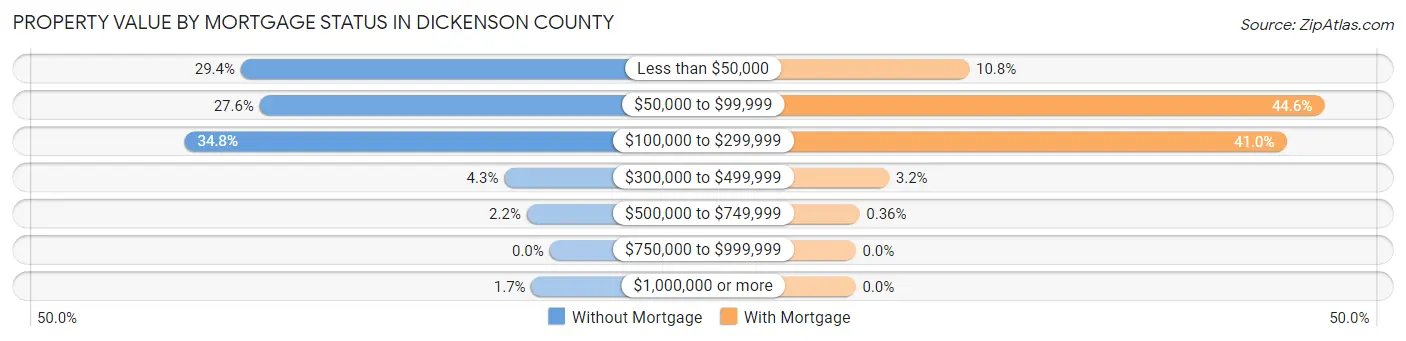
| Property Value | Without Mortgage | With Mortgage |
| Less than $50,000 | 851 (29.4%) | 150 (10.8%) |
| $50,000 to $99,999 | 799 (27.6%) | 619 (44.6%) |
| $100,000 to $299,999 | 1,006 (34.8%) | 569 (41.0%) |
| $300,000 to $499,999 | 125 (4.3%) | 44 (3.2%) |
| $500,000 to $749,999 | 63 (2.2%) | 5 (0.4%) |
| $750,000 to $999,999 | 0 (0.0%) | 0 (0.0%) |
| $1,000,000 or more | 50 (1.7%) | 0 (0.0%) |
| Total | 2,894 (100.0%) | 1,387 (100.0%) |
Household Income by Mortgage Status in Dickenson County
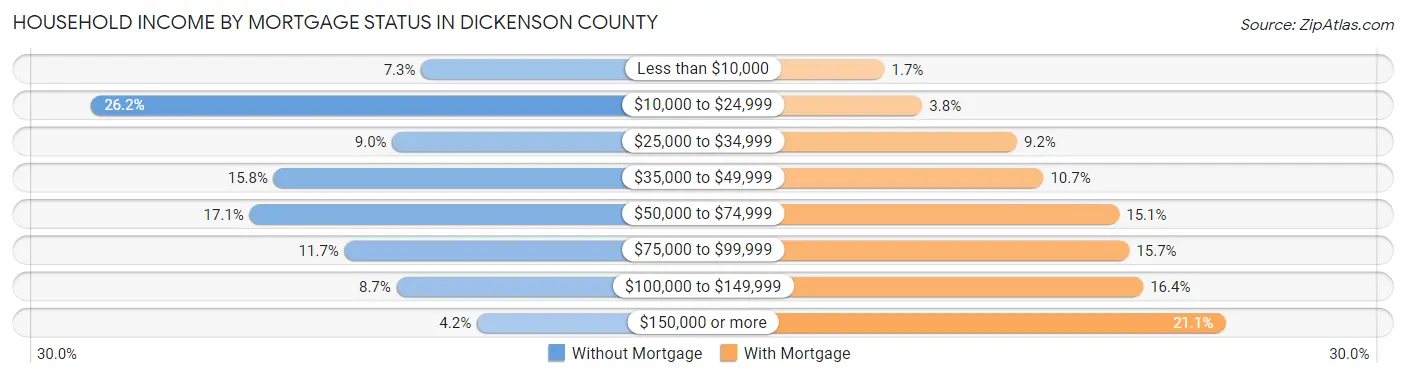
| Household Income | Without Mortgage | With Mortgage |
| Less than $10,000 | 212 (7.3%) | 23 (1.7%) |
| $10,000 to $24,999 | 758 (26.2%) | 53 (3.8%) |
| $25,000 to $34,999 | 260 (9.0%) | 128 (9.2%) |
| $35,000 to $49,999 | 456 (15.8%) | 149 (10.7%) |
| $50,000 to $74,999 | 496 (17.1%) | 209 (15.1%) |
| $75,000 to $99,999 | 339 (11.7%) | 217 (15.7%) |
| $100,000 to $149,999 | 253 (8.7%) | 228 (16.4%) |
| $150,000 or more | 120 (4.2%) | 293 (21.1%) |
| Total | 2,894 (100.0%) | 1,387 (100.0%) |
Property Value to Household Income Ratio in Dickenson County
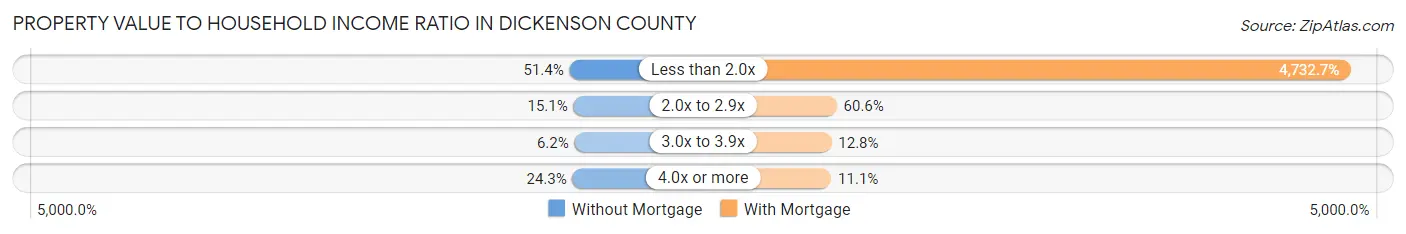
| Value-to-Income Ratio | Without Mortgage | With Mortgage |
| Less than 2.0x | 1,487 (51.4%) | 65,642 (4,732.7%) |
| 2.0x to 2.9x | 438 (15.1%) | 840 (60.6%) |
| 3.0x to 3.9x | 179 (6.2%) | 178 (12.8%) |
| 4.0x or more | 702 (24.3%) | 154 (11.1%) |
| Total | 2,894 (100.0%) | 1,387 (100.0%) |
Real Estate Taxes by Mortgage Status in Dickenson County
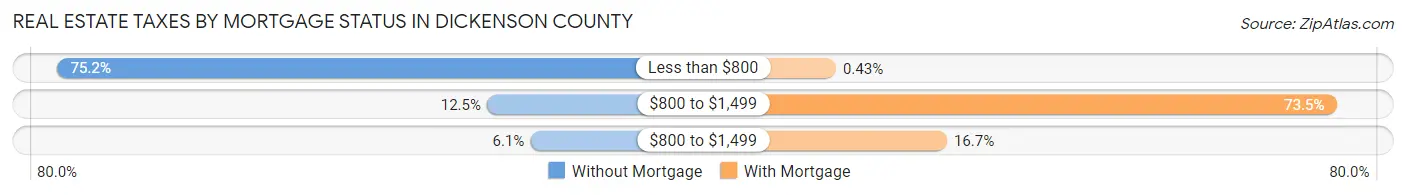
| Property Taxes | Without Mortgage | With Mortgage |
| Less than $800 | 2,176 (75.2%) | 6 (0.4%) |
| $800 to $1,499 | 361 (12.5%) | 1,020 (73.5%) |
| $800 to $1,499 | 177 (6.1%) | 231 (16.7%) |
| Total | 2,894 (100.0%) | 1,387 (100.0%) |
Health & Disability in Dickenson County
Health Insurance Coverage by Age in Dickenson County
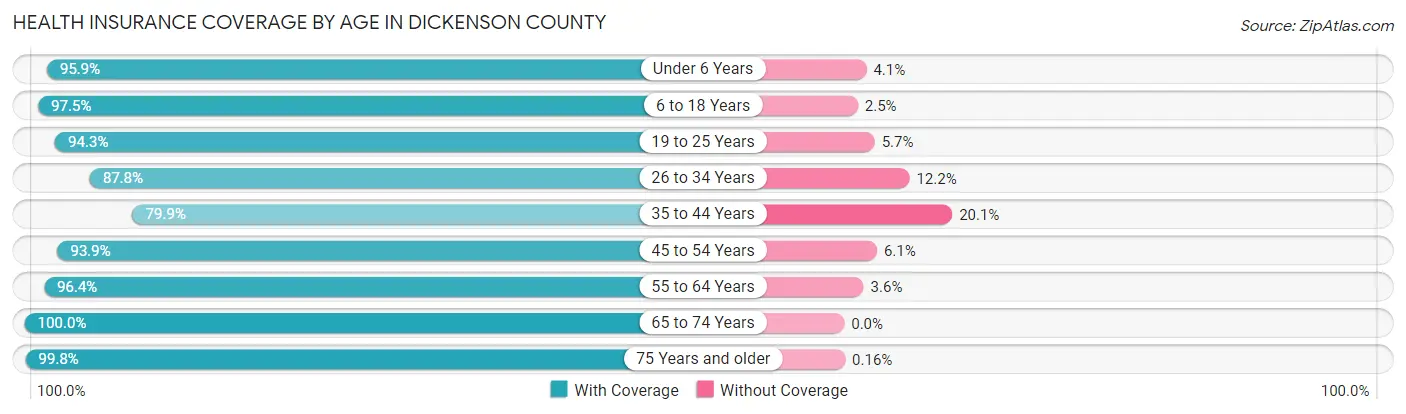
| Age Bracket | With Coverage | Without Coverage |
| Under 6 Years | 717 (95.9%) | 31 (4.1%) |
| 6 to 18 Years | 2,084 (97.5%) | 54 (2.5%) |
| 19 to 25 Years | 880 (94.3%) | 53 (5.7%) |
| 26 to 34 Years | 1,134 (87.8%) | 157 (12.2%) |
| 35 to 44 Years | 1,310 (79.9%) | 330 (20.1%) |
| 45 to 54 Years | 1,648 (93.9%) | 107 (6.1%) |
| 55 to 64 Years | 1,920 (96.4%) | 72 (3.6%) |
| 65 to 74 Years | 1,857 (100.0%) | 0 (0.0%) |
| 75 Years and older | 1,270 (99.8%) | 2 (0.2%) |
| Total | 12,820 (94.1%) | 806 (5.9%) |
Health Insurance Coverage by Citizenship Status in Dickenson County
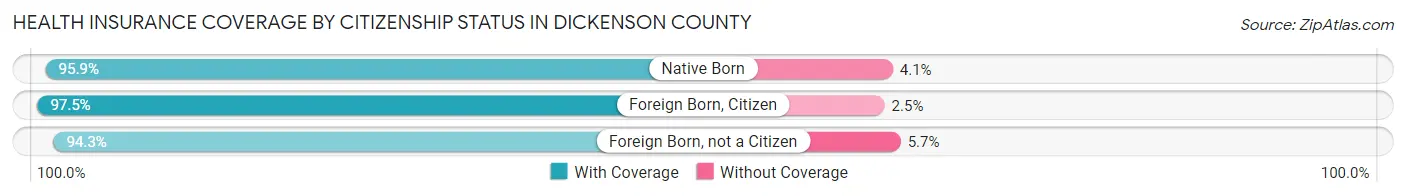
| Citizenship Status | With Coverage | Without Coverage |
| Native Born | 717 (95.9%) | 31 (4.1%) |
| Foreign Born, Citizen | 2,084 (97.5%) | 54 (2.5%) |
| Foreign Born, not a Citizen | 880 (94.3%) | 53 (5.7%) |
Health Insurance Coverage by Household Income in Dickenson County
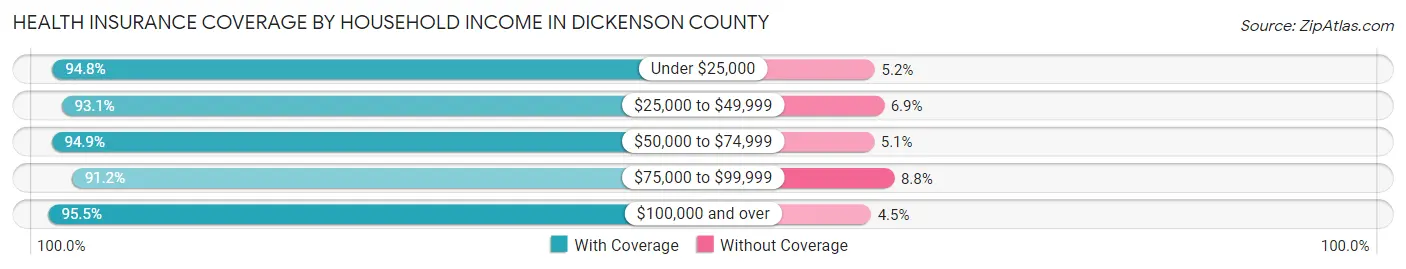
| Household Income | With Coverage | Without Coverage |
| Under $25,000 | 3,240 (94.8%) | 178 (5.2%) |
| $25,000 to $49,999 | 3,033 (93.1%) | 225 (6.9%) |
| $50,000 to $74,999 | 2,065 (94.9%) | 110 (5.1%) |
| $75,000 to $99,999 | 1,598 (91.2%) | 155 (8.8%) |
| $100,000 and over | 2,876 (95.5%) | 135 (4.5%) |
Public vs Private Health Insurance Coverage by Age in Dickenson County
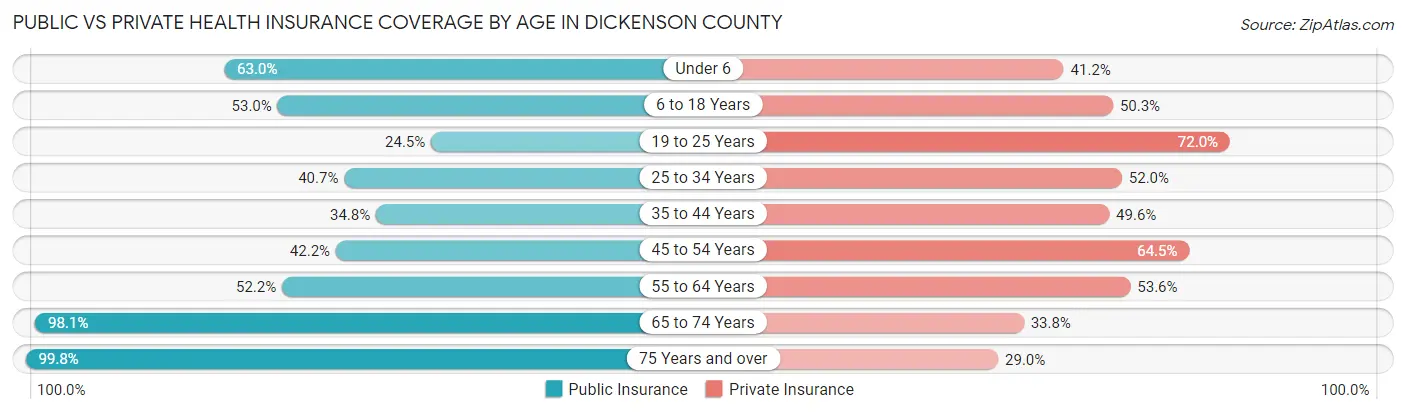
| Age Bracket | Public Insurance | Private Insurance |
| Under 6 | 471 (63.0%) | 308 (41.2%) |
| 6 to 18 Years | 1,134 (53.0%) | 1,076 (50.3%) |
| 19 to 25 Years | 229 (24.5%) | 672 (72.0%) |
| 25 to 34 Years | 525 (40.7%) | 671 (52.0%) |
| 35 to 44 Years | 570 (34.8%) | 814 (49.6%) |
| 45 to 54 Years | 741 (42.2%) | 1,132 (64.5%) |
| 55 to 64 Years | 1,040 (52.2%) | 1,067 (53.6%) |
| 65 to 74 Years | 1,821 (98.1%) | 627 (33.8%) |
| 75 Years and over | 1,270 (99.8%) | 369 (29.0%) |
| Total | 7,801 (57.3%) | 6,736 (49.4%) |
Disability Status by Sex by Age in Dickenson County
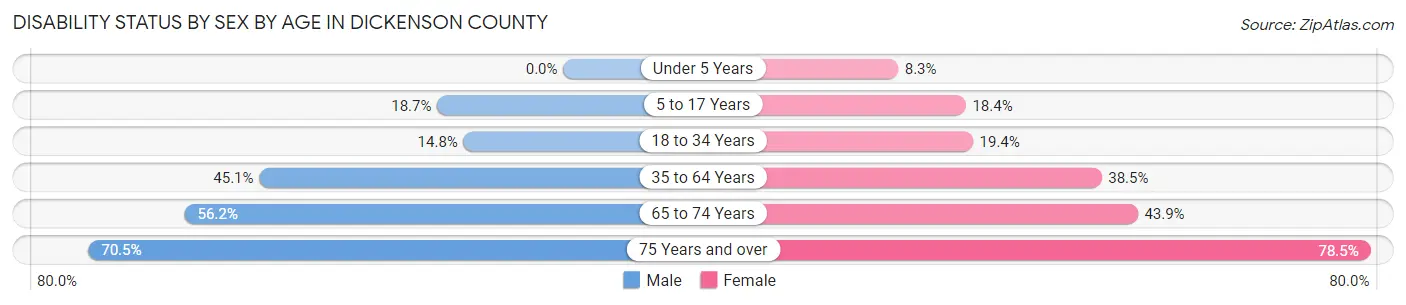
| Age Bracket | Male | Female |
| Under 5 Years | 0 (0.0%) | 27 (8.3%) |
| 5 to 17 Years | 205 (18.7%) | 180 (18.4%) |
| 18 to 34 Years | 174 (14.8%) | 235 (19.4%) |
| 35 to 64 Years | 1,273 (45.1%) | 989 (38.5%) |
| 65 to 74 Years | 500 (56.2%) | 425 (43.9%) |
| 75 Years and over | 395 (70.5%) | 559 (78.5%) |
Disability Class by Sex by Age in Dickenson County
Disability Class: Hearing Difficulty
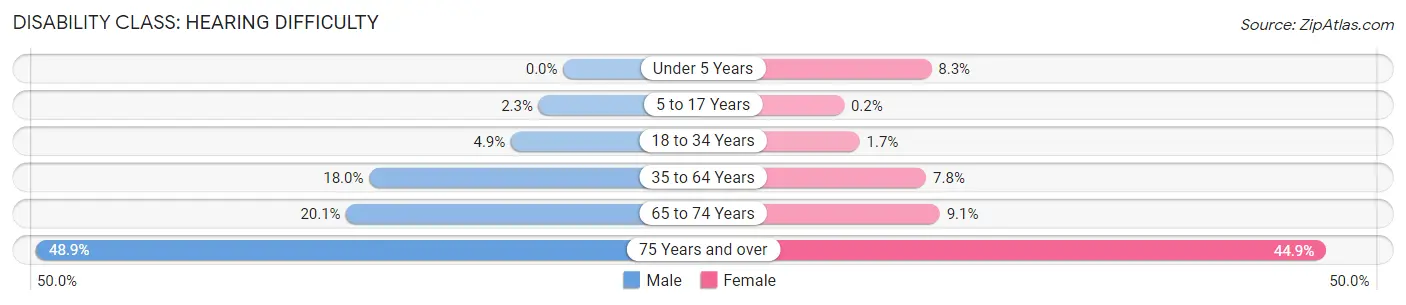
| Age Bracket | Male | Female |
| Under 5 Years | 0 (0.0%) | 27 (8.3%) |
| 5 to 17 Years | 25 (2.3%) | 2 (0.2%) |
| 18 to 34 Years | 57 (4.9%) | 20 (1.7%) |
| 35 to 64 Years | 508 (18.0%) | 201 (7.8%) |
| 65 to 74 Years | 179 (20.1%) | 88 (9.1%) |
| 75 Years and over | 274 (48.9%) | 320 (44.9%) |
Disability Class: Vision Difficulty
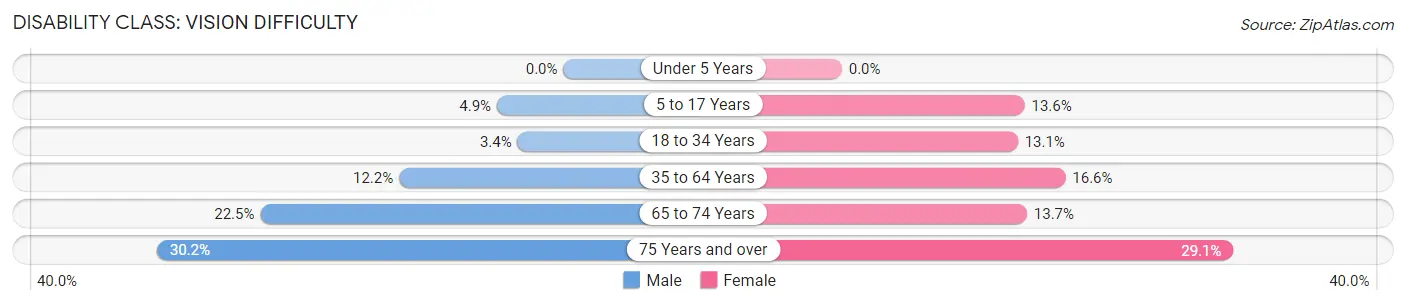
| Age Bracket | Male | Female |
| Under 5 Years | 0 (0.0%) | 0 (0.0%) |
| 5 to 17 Years | 54 (4.9%) | 133 (13.6%) |
| 18 to 34 Years | 40 (3.4%) | 158 (13.1%) |
| 35 to 64 Years | 344 (12.2%) | 426 (16.6%) |
| 65 to 74 Years | 200 (22.5%) | 133 (13.7%) |
| 75 Years and over | 169 (30.2%) | 207 (29.1%) |
Disability Class: Cognitive Difficulty
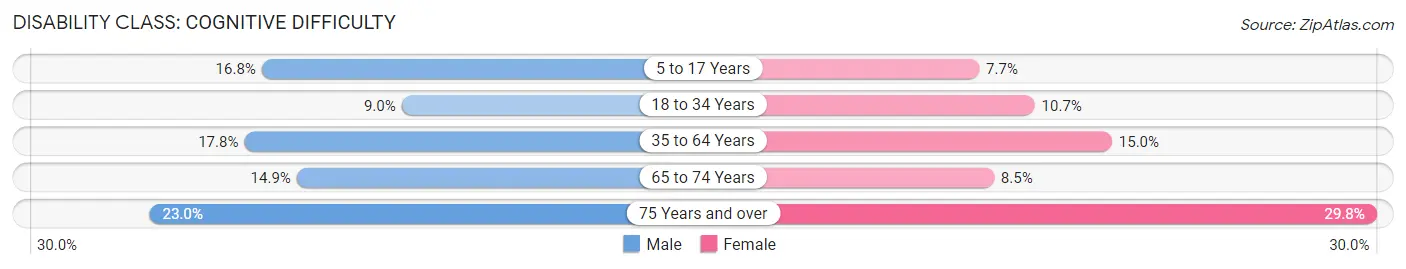
| Age Bracket | Male | Female |
| 5 to 17 Years | 184 (16.8%) | 75 (7.6%) |
| 18 to 34 Years | 106 (9.0%) | 130 (10.7%) |
| 35 to 64 Years | 501 (17.8%) | 386 (15.0%) |
| 65 to 74 Years | 132 (14.8%) | 82 (8.5%) |
| 75 Years and over | 129 (23.0%) | 212 (29.8%) |
Disability Class: Ambulatory Difficulty
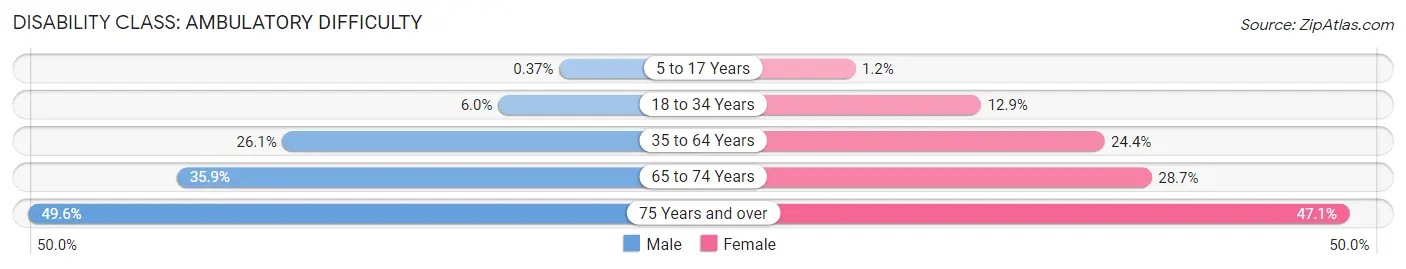
| Age Bracket | Male | Female |
| 5 to 17 Years | 4 (0.4%) | 12 (1.2%) |
| 18 to 34 Years | 71 (6.0%) | 156 (12.9%) |
| 35 to 64 Years | 735 (26.1%) | 625 (24.3%) |
| 65 to 74 Years | 319 (35.9%) | 278 (28.7%) |
| 75 Years and over | 278 (49.6%) | 335 (47.0%) |
Disability Class: Self-Care Difficulty
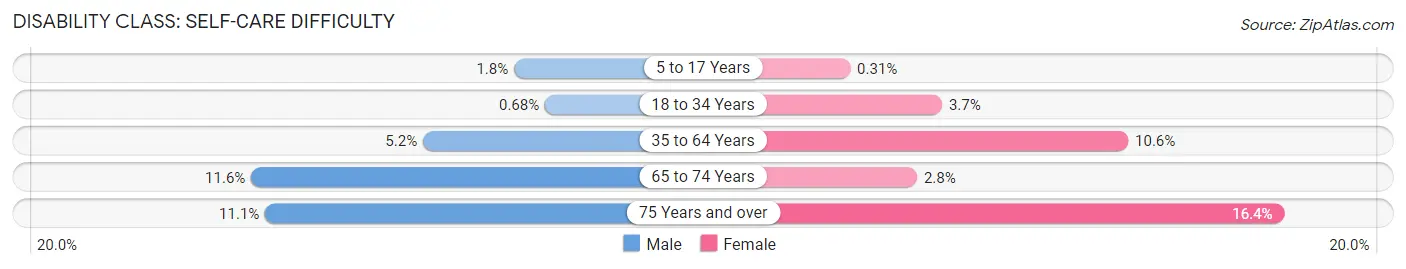
| Age Bracket | Male | Female |
| 5 to 17 Years | 20 (1.8%) | 3 (0.3%) |
| 18 to 34 Years | 8 (0.7%) | 45 (3.7%) |
| 35 to 64 Years | 147 (5.2%) | 273 (10.6%) |
| 65 to 74 Years | 103 (11.6%) | 27 (2.8%) |
| 75 Years and over | 62 (11.1%) | 117 (16.4%) |
Technology Access in Dickenson County
Computing Device Access in Dickenson County
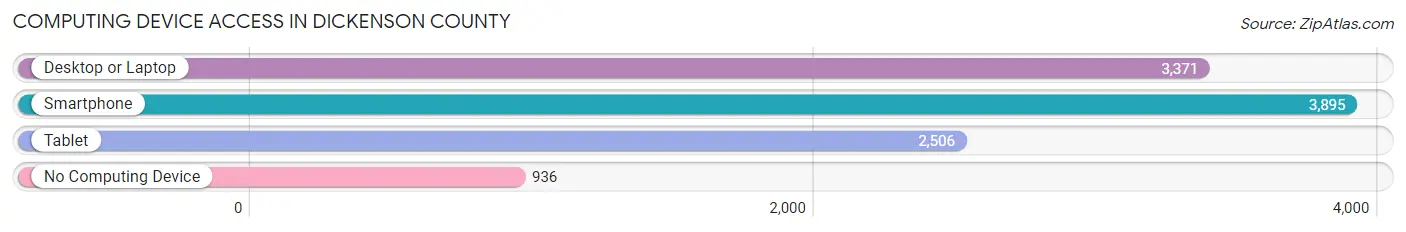
| Device Type | # Households | % Households |
| Desktop or Laptop | 3,371 | 60.8% |
| Smartphone | 3,895 | 70.3% |
| Tablet | 2,506 | 45.2% |
| No Computing Device | 936 | 16.9% |
| Total | 5,543 | 100.0% |
Internet Access in Dickenson County
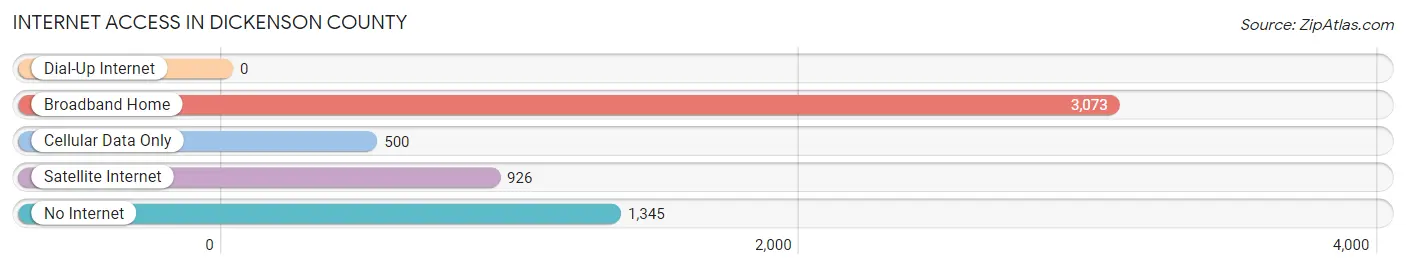
| Internet Type | # Households | % Households |
| Dial-Up Internet | 0 | 0.0% |
| Broadband Home | 3,073 | 55.4% |
| Cellular Data Only | 500 | 9.0% |
| Satellite Internet | 926 | 16.7% |
| No Internet | 1,345 | 24.3% |
| Total | 5,543 | 100.0% |
Dickenson County Summary
Dickenson County is located in the southwestern part of the Commonwealth of Virginia. It is bordered by Buchanan County to the north, Russell County to the east, Wise County to the south, and Kentucky to the west. The county seat is Clintwood, and the county was named for William J. Dickenson, a Confederate soldier and Virginia state senator.
Geography
Dickenson County is located in the Appalachian Mountains and is part of the Cumberland Plateau. The county is mostly mountainous, with elevations ranging from 1,000 to 4,000 feet. The highest point in the county is Flag Rock, which has an elevation of 4,000 feet. The county is drained by the Russell Fork and Clinch Rivers, which flow into the Big Sandy River. The county is also home to several state parks, including Breaks Interstate Park, which is located on the Kentucky-Virginia border.
The county has a total area of 437 square miles, of which 435 square miles is land and 2 square miles is water.
Demographics
As of the 2010 census, the population of Dickenson County was 15,873. The population density was 36.3 people per square mile. The racial makeup of the county was 97.3% White, 0.9% Black or African American, 0.2% Native American, 0.2% Asian, 0.1% Pacific Islander, 0.3% from other races, and 0.9% from two or more races. 1.3% of the population were Hispanic or Latino of any race.
The median income for a household in the county was $25,945, and the median income for a family was $32,813. The per capita income for the county was $14,945. About 20.2% of the population was below the poverty line.
Economy
The economy of Dickenson County is largely based on agriculture and coal mining. The county is home to several large coal mines, including the Virginia-Pocahontas Mine, which is the largest underground coal mine in the United States. The county also has a large timber industry, and is home to several sawmills and lumber companies.
The county is also home to several manufacturing companies, including a furniture factory, a textile mill, and a plastics plant. The county is also home to several tourist attractions, including the Breaks Interstate Park, which is located on the Kentucky-Virginia border.
Conclusion
Dickenson County is a rural county located in the southwestern part of Virginia. The county is mostly mountainous, and is home to several state parks, coal mines, and timber companies. The county has a population of 15,873, and the economy is largely based on agriculture and coal mining. The county is also home to several manufacturing companies, and is a popular tourist destination.
Common Questions
What is Per Capita Income in Dickenson County?
Per Capita income in Dickenson County is $25,003.
What is the Median Family Income in Dickenson County?
Median Family Income in Dickenson County is $51,842.
What is the Median Household income in Dickenson County?
Median Household Income in Dickenson County is $40,143.
What is Income or Wage Gap in Dickenson County?
Income or Wage Gap in Dickenson County is 30.6%.
Women in Dickenson County earn 69.4 cents for every dollar earned by a man.
What is Family Income Deficit in Dickenson County?
Family Income Deficit in Dickenson County is $10,010.
Families that are below poverty line in Dickenson County earn $10,010 less on average than the poverty threshold level.
What is Inequality or Gini Index in Dickenson County?
Inequality or Gini Index in Dickenson County is 0.48.
What is the Total Population of Dickenson County?
Total Population of Dickenson County is 14,089.
What is the Total Male Population of Dickenson County?
Total Male Population of Dickenson County is 7,165.
What is the Total Female Population of Dickenson County?
Total Female Population of Dickenson County is 6,924.
What is the Ratio of Males per 100 Females in Dickenson County?
There are 103.48 Males per 100 Females in Dickenson County.
What is the Ratio of Females per 100 Males in Dickenson County?
There are 96.64 Females per 100 Males in Dickenson County.
What is the Median Population Age in Dickenson County?
Median Population Age in Dickenson County is 45.5 Years.
What is the Average Family Size in Dickenson County
Average Family Size in Dickenson County is 3.0 People.
What is the Average Household Size in Dickenson County
Average Household Size in Dickenson County is 2.5 People.
How Large is the Labor Force in Dickenson County?
There are 4,631 People in the Labor Forcein in Dickenson County.
What is the Percentage of People in the Labor Force in Dickenson County?
39.6% of People are in the Labor Force in Dickenson County.
What is the Unemployment Rate in Dickenson County?
Unemployment Rate in Dickenson County is 3.4%.