Danville city, VA Map & Demographics
Danville city Map
Danville city Overview
$26,453
PER CAPITA INCOME
$54,521
AVG FAMILY INCOME
$41,484
AVG HOUSEHOLD INCOME
34.0%
WAGE / INCOME GAP [ % ]
66.0¢/ $1
WAGE / INCOME GAP [ $ ]
$10,147
FAMILY INCOME DEFICIT
0.49
INEQUALITY / GINI INDEX
42,507
TOTAL POPULATION
19,496
MALE POPULATION
23,011
FEMALE POPULATION
84.72
MALES / 100 FEMALES
118.03
FEMALES / 100 MALES
41.0
MEDIAN AGE
3.0
AVG FAMILY SIZE
2.2
AVG HOUSEHOLD SIZE
17,754
LABOR FORCE [ PEOPLE ]
51.9%
PERCENT IN LABOR FORCE
5.8%
UNEMPLOYMENT RATE
Danville city Area Codes
Income in Danville city
Income Overview in Danville city
Per Capita Income in Danville city is $26,453, while median incomes of families and households are $54,521 and $41,484 respectively.
| Characteristic | Number | Measure |
| Per Capita Income | 42,507 | $26,453 |
| Median Family Income | 9,780 | $54,521 |
| Mean Family Income | 9,780 | $74,298 |
| Median Household Income | 18,755 | $41,484 |
| Mean Household Income | 18,755 | $59,489 |
| Income Deficit | 9,780 | $10,147 |
| Wage / Income Gap (%) | 42,507 | 33.96% |
| Wage / Income Gap ($) | 42,507 | 66.04¢ per $1 |
| Gini / Inequality Index | 42,507 | 0.49 |
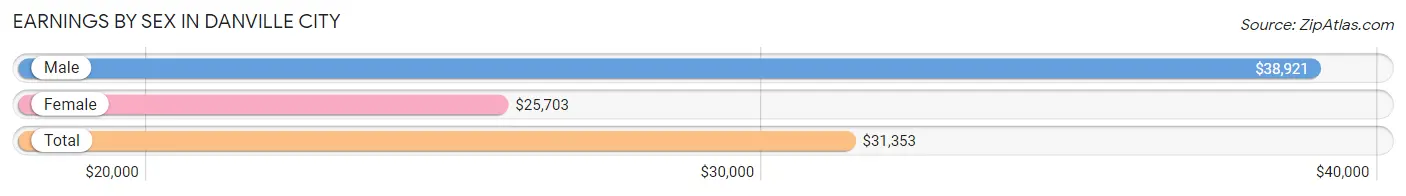
Earnings by Sex in Danville city
Average Earnings in Danville city are $31,353, $38,921 for men and $25,703 for women, a difference of 34.0%.
| Sex | Number | Average Earnings |
| Male | 8,654 (46.4%) | $38,921 |
| Female | 10,016 (53.6%) | $25,703 |
| Total | 18,670 (100.0%) | $31,353 |
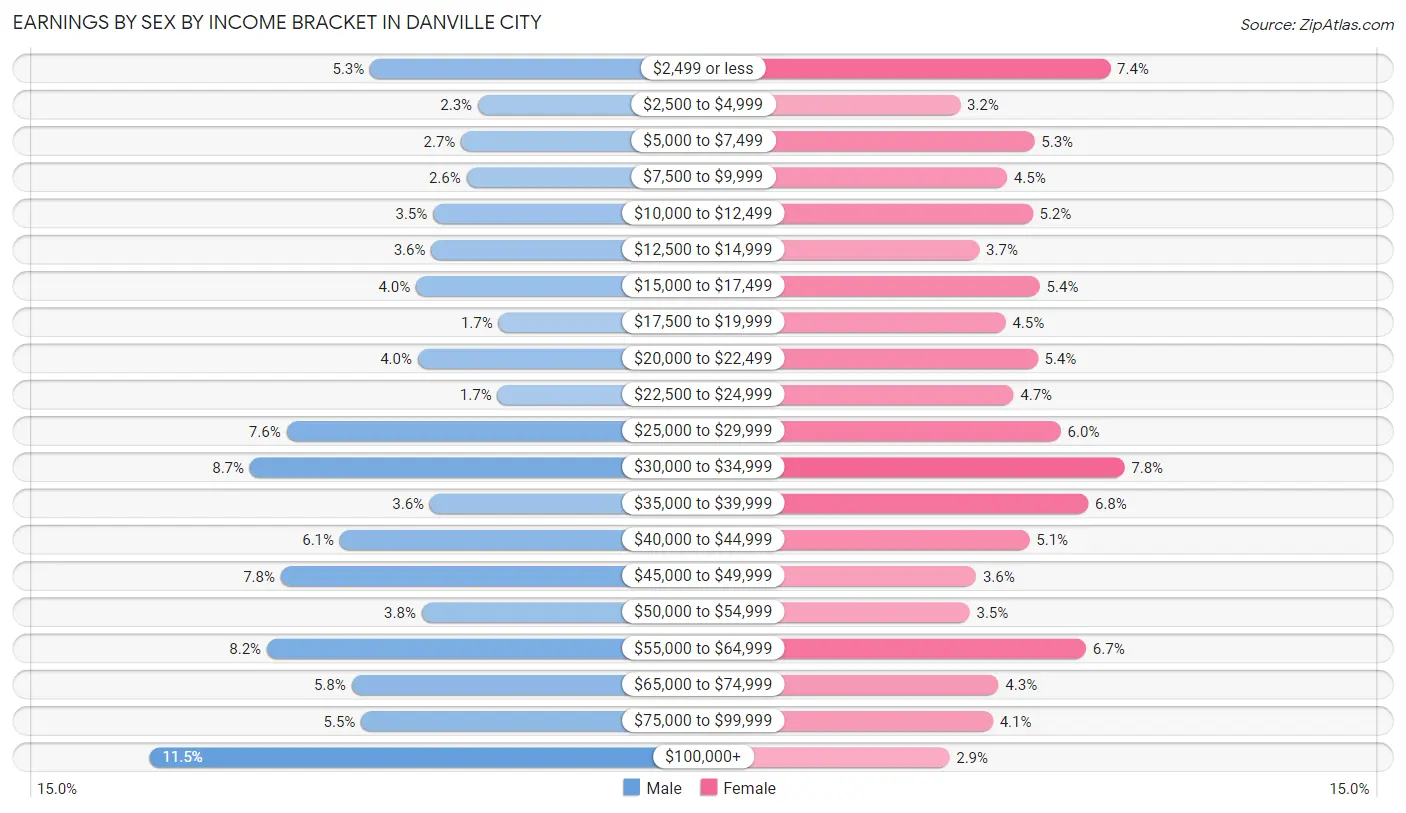
Earnings by Sex by Income Bracket in Danville city
The most common earnings brackets in Danville city are $100,000+ for men (994 | 11.5%) and $30,000 to $34,999 for women (781 | 7.8%).
| Income | Male | Female |
| $2,499 or less | 458 (5.3%) | 741 (7.4%) |
| $2,500 to $4,999 | 196 (2.3%) | 319 (3.2%) |
| $5,000 to $7,499 | 236 (2.7%) | 528 (5.3%) |
| $7,500 to $9,999 | 223 (2.6%) | 451 (4.5%) |
| $10,000 to $12,499 | 305 (3.5%) | 523 (5.2%) |
| $12,500 to $14,999 | 309 (3.6%) | 373 (3.7%) |
| $15,000 to $17,499 | 346 (4.0%) | 543 (5.4%) |
| $17,500 to $19,999 | 145 (1.7%) | 447 (4.5%) |
| $20,000 to $22,499 | 342 (4.0%) | 537 (5.4%) |
| $22,500 to $24,999 | 148 (1.7%) | 469 (4.7%) |
| $25,000 to $29,999 | 661 (7.6%) | 602 (6.0%) |
| $30,000 to $34,999 | 750 (8.7%) | 781 (7.8%) |
| $35,000 to $39,999 | 312 (3.6%) | 679 (6.8%) |
| $40,000 to $44,999 | 531 (6.1%) | 514 (5.1%) |
| $45,000 to $49,999 | 675 (7.8%) | 364 (3.6%) |
| $50,000 to $54,999 | 332 (3.8%) | 346 (3.5%) |
| $55,000 to $64,999 | 709 (8.2%) | 673 (6.7%) |
| $65,000 to $74,999 | 503 (5.8%) | 427 (4.3%) |
| $75,000 to $99,999 | 479 (5.5%) | 411 (4.1%) |
| $100,000+ | 994 (11.5%) | 288 (2.9%) |
| Total | 8,654 (100.0%) | 10,016 (100.0%) |
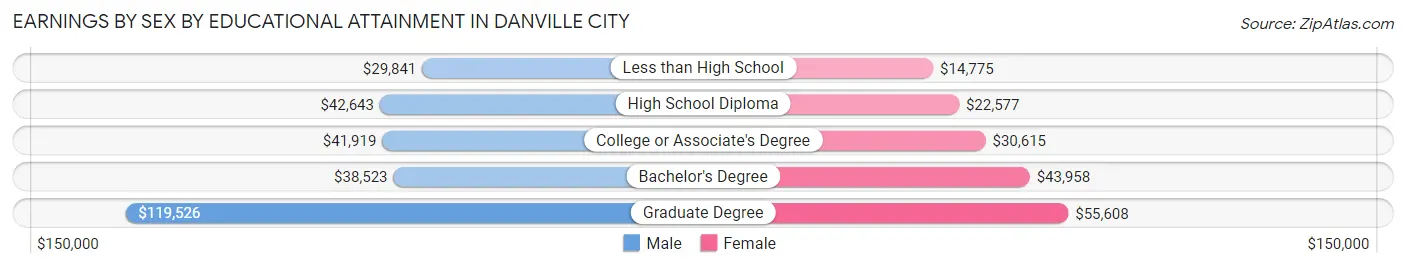
Earnings by Sex by Educational Attainment in Danville city
Average earnings in Danville city are $43,175 for men and $28,465 for women, a difference of 34.1%. Men with an educational attainment of graduate degree enjoy the highest average annual earnings of $119,526, while those with less than high school education earn the least with $29,841. Women with an educational attainment of graduate degree earn the most with the average annual earnings of $55,608, while those with less than high school education have the smallest earnings of $14,775.
| Educational Attainment | Male Income | Female Income |
| Less than High School | $29,841 | $14,775 |
| High School Diploma | $42,643 | $22,577 |
| College or Associate's Degree | $41,919 | $30,615 |
| Bachelor's Degree | $38,523 | $43,958 |
| Graduate Degree | $119,526 | $55,608 |
| Total | $43,175 | $28,465 |
Family Income in Danville city
Family Income Brackets in Danville city
According to the Danville city family income data, there are 1,663 families falling into the $50,000 to $74,999 income range, which is the most common income bracket and makes up 17.0% of all families. Conversely, the $200,000+ income bracket is the least frequent group with only 450 families (4.6%) belonging to this category.
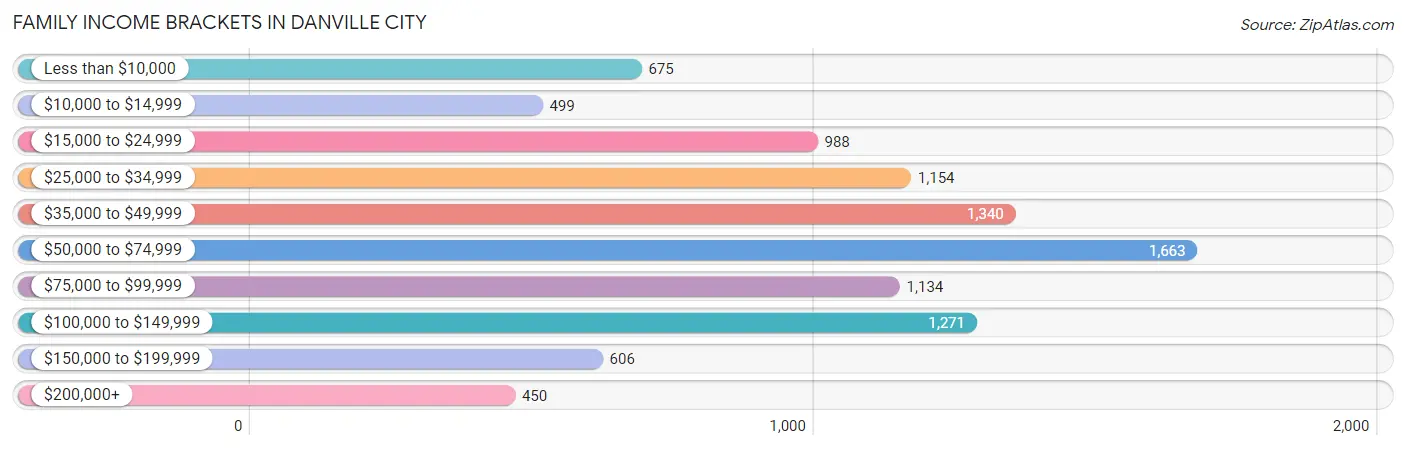
| Income Bracket | # Families | % Families |
| Less than $10,000 | 675 | 6.9% |
| $10,000 to $14,999 | 499 | 5.1% |
| $15,000 to $24,999 | 988 | 10.1% |
| $25,000 to $34,999 | 1,154 | 11.8% |
| $35,000 to $49,999 | 1,340 | 13.7% |
| $50,000 to $74,999 | 1,663 | 17.0% |
| $75,000 to $99,999 | 1,134 | 11.6% |
| $100,000 to $149,999 | 1,271 | 13.0% |
| $150,000 to $199,999 | 606 | 6.2% |
| $200,000+ | 450 | 4.6% |
Family Income by Famaliy Size in Danville city
5-person families (508 | 5.2%) account for the highest median family income in Danville city with $78,093 per family, while 2-person families (5,441 | 55.6%) have the highest median income of $26,418 per family member.
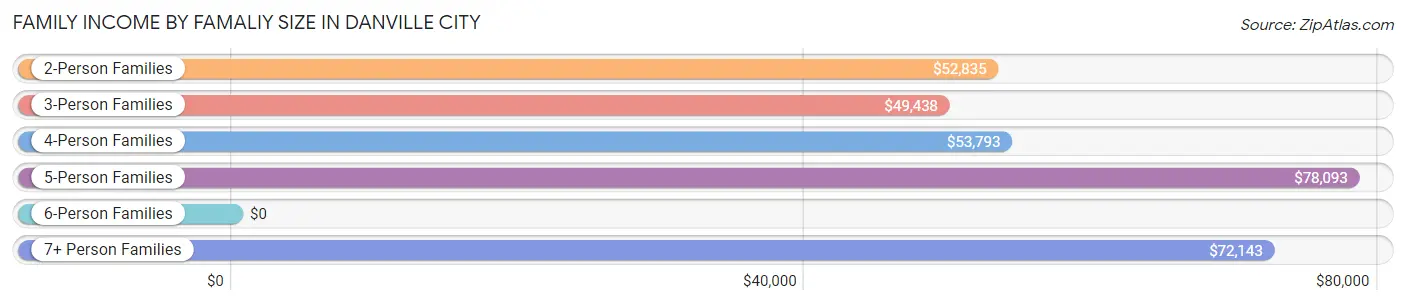
| Income Bracket | # Families | Median Income |
| 2-Person Families | 5,441 (55.6%) | $52,835 |
| 3-Person Families | 2,195 (22.4%) | $49,438 |
| 4-Person Families | 1,224 (12.5%) | $53,793 |
| 5-Person Families | 508 (5.2%) | $78,093 |
| 6-Person Families | 294 (3.0%) | $0 |
| 7+ Person Families | 118 (1.2%) | $72,143 |
| Total | 9,780 (100.0%) | $54,521 |
Family Income by Number of Earners in Danville city
The median family income in Danville city is $54,521, with families comprising 3+ earners (585) having the highest median family income of $131,094, while families with no earners (2,025) have the lowest median family income of $31,391, accounting for 6.0% and 20.7% of families, respectively.
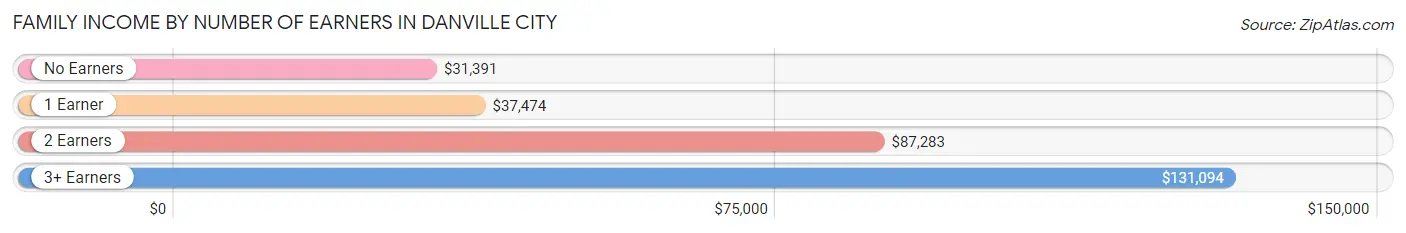
| Number of Earners | # Families | Median Income |
| No Earners | 2,025 (20.7%) | $31,391 |
| 1 Earner | 4,158 (42.5%) | $37,474 |
| 2 Earners | 3,012 (30.8%) | $87,283 |
| 3+ Earners | 585 (6.0%) | $131,094 |
| Total | 9,780 (100.0%) | $54,521 |
Household Income in Danville city
Household Income Brackets in Danville city
With 3,151 households falling in the category, the $50,000 to $74,999 income range is the most frequent in Danville city, accounting for 16.8% of all households. In contrast, only 638 households (3.4%) fall into the $200,000+ income bracket, making it the least populous group.
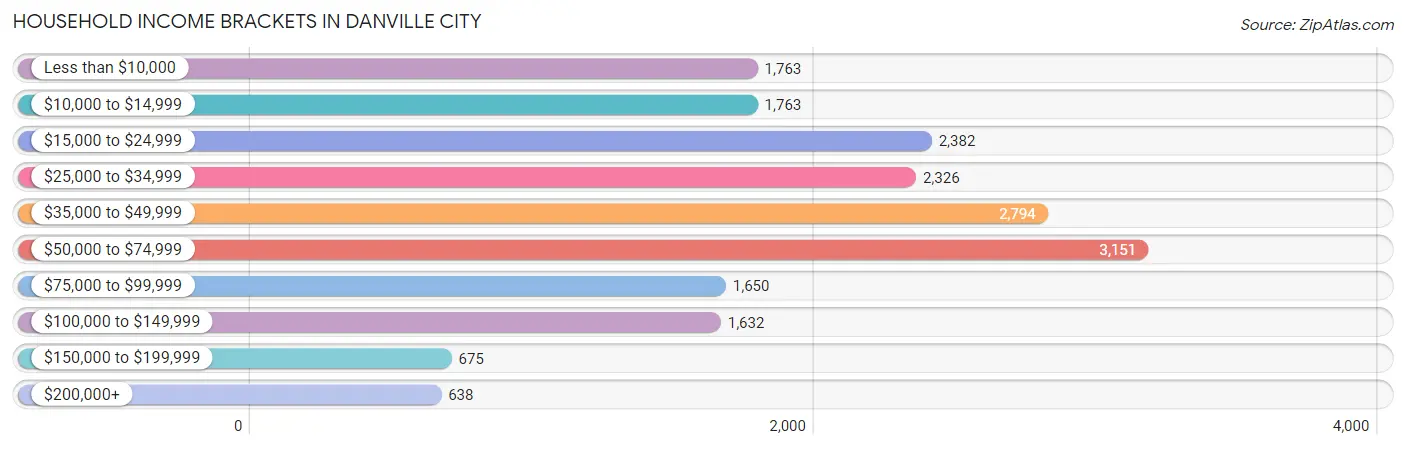
| Income Bracket | # Households | % Households |
| Less than $10,000 | 1,763 | 9.4% |
| $10,000 to $14,999 | 1,763 | 9.4% |
| $15,000 to $24,999 | 2,382 | 12.7% |
| $25,000 to $34,999 | 2,326 | 12.4% |
| $35,000 to $49,999 | 2,794 | 14.9% |
| $50,000 to $74,999 | 3,151 | 16.8% |
| $75,000 to $99,999 | 1,650 | 8.8% |
| $100,000 to $149,999 | 1,632 | 8.7% |
| $150,000 to $199,999 | 675 | 3.6% |
| $200,000+ | 638 | 3.4% |
Household Income by Householder Age in Danville city
The median household income in Danville city is $41,484, with the highest median household income of $47,631 found in the 25 to 44 years age bracket for the primary householder. A total of 4,973 households (26.5%) fall into this category. Meanwhile, the 15 to 24 years age bracket for the primary householder has the lowest median household income of $33,833, with 792 households (4.2%) in this group.
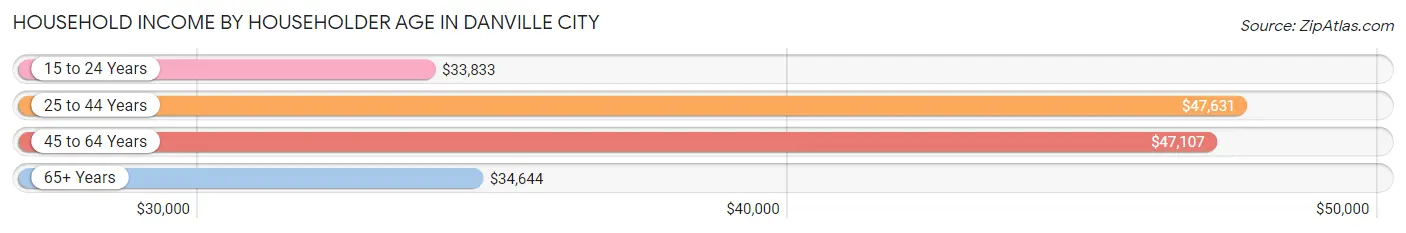
| Income Bracket | # Households | Median Income |
| 15 to 24 Years | 792 (4.2%) | $33,833 |
| 25 to 44 Years | 4,973 (26.5%) | $47,631 |
| 45 to 64 Years | 6,827 (36.4%) | $47,107 |
| 65+ Years | 6,163 (32.9%) | $34,644 |
| Total | 18,755 (100.0%) | $41,484 |
Poverty in Danville city
Income Below Poverty by Sex and Age in Danville city
With 24.0% poverty level for males and 26.4% for females among the residents of Danville city, 16 and 17 year old males and 12 to 14 year old females are the most vulnerable to poverty, with 288 males (48.7%) and 296 females (54.7%) in their respective age groups living below the poverty level.
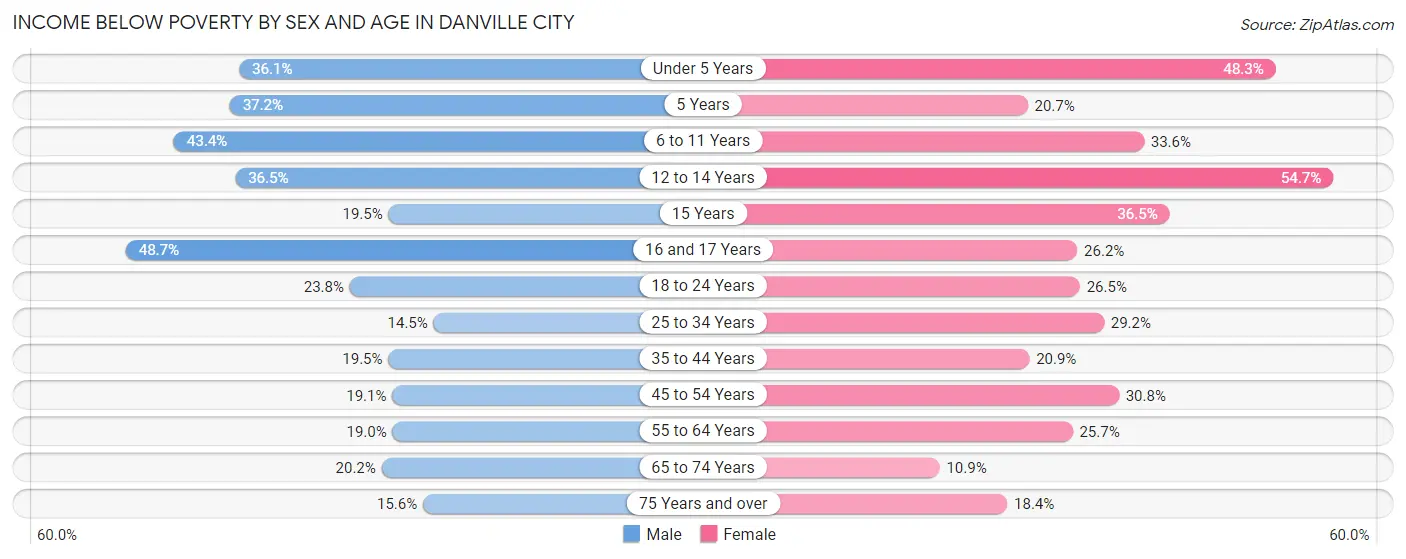
| Age Bracket | Male | Female |
| Under 5 Years | 420 (36.1%) | 598 (48.3%) |
| 5 Years | 107 (37.1%) | 66 (20.7%) |
| 6 to 11 Years | 730 (43.4%) | 603 (33.6%) |
| 12 to 14 Years | 262 (36.5%) | 296 (54.7%) |
| 15 Years | 44 (19.5%) | 104 (36.5%) |
| 16 and 17 Years | 288 (48.7%) | 114 (26.2%) |
| 18 to 24 Years | 385 (23.8%) | 433 (26.5%) |
| 25 to 34 Years | 352 (14.4%) | 842 (29.2%) |
| 35 to 44 Years | 394 (19.5%) | 483 (20.9%) |
| 45 to 54 Years | 388 (19.1%) | 809 (30.8%) |
| 55 to 64 Years | 482 (19.0%) | 832 (25.7%) |
| 65 to 74 Years | 427 (20.2%) | 312 (10.9%) |
| 75 Years and over | 176 (15.6%) | 403 (18.4%) |
| Total | 4,455 (24.0%) | 5,895 (26.4%) |
Income Above Poverty by Sex and Age in Danville city
According to the poverty statistics in Danville city, males aged 25 to 34 years and females aged 65 to 74 years are the age groups that are most secure financially, with 85.6% of males and 89.1% of females in these age groups living above the poverty line.
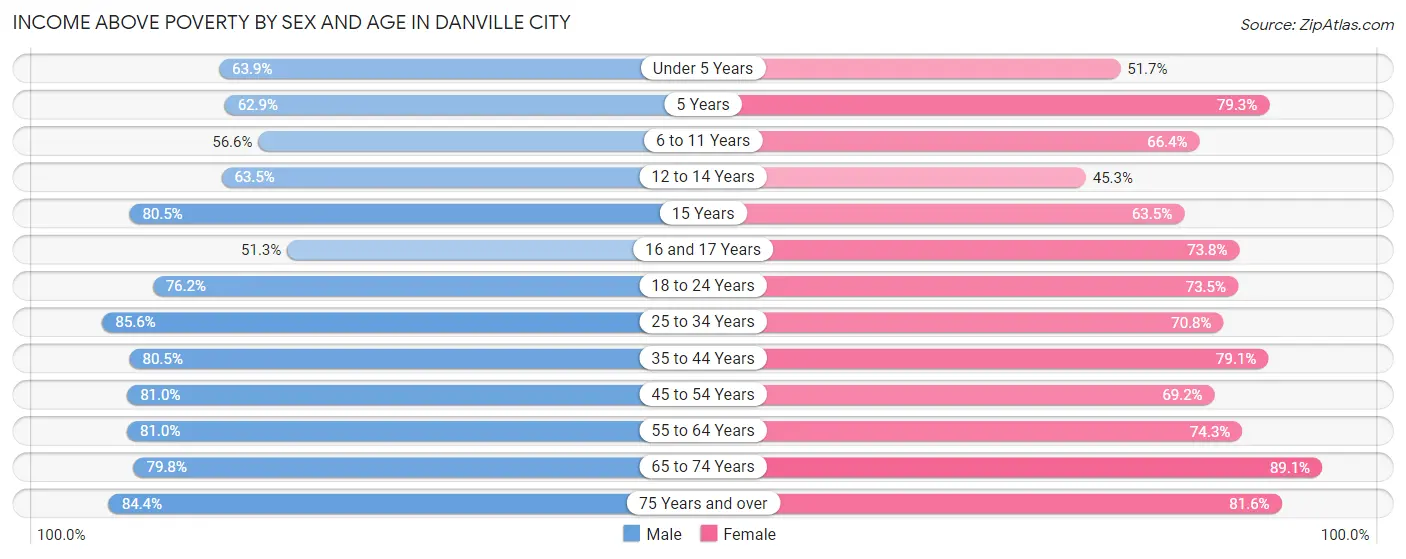
| Age Bracket | Male | Female |
| Under 5 Years | 743 (63.9%) | 640 (51.7%) |
| 5 Years | 181 (62.8%) | 253 (79.3%) |
| 6 to 11 Years | 953 (56.6%) | 1,190 (66.4%) |
| 12 to 14 Years | 455 (63.5%) | 245 (45.3%) |
| 15 Years | 182 (80.5%) | 181 (63.5%) |
| 16 and 17 Years | 303 (51.3%) | 321 (73.8%) |
| 18 to 24 Years | 1,234 (76.2%) | 1,201 (73.5%) |
| 25 to 34 Years | 2,084 (85.6%) | 2,044 (70.8%) |
| 35 to 44 Years | 1,628 (80.5%) | 1,831 (79.1%) |
| 45 to 54 Years | 1,649 (80.9%) | 1,814 (69.2%) |
| 55 to 64 Years | 2,052 (81.0%) | 2,407 (74.3%) |
| 65 to 74 Years | 1,683 (79.8%) | 2,555 (89.1%) |
| 75 Years and over | 950 (84.4%) | 1,786 (81.6%) |
| Total | 14,097 (76.0%) | 16,468 (73.6%) |
Income Below Poverty Among Married-Couple Families in Danville city
The poverty statistics for married-couple families in Danville city show that 7.9% or 421 of the total 5,333 families live below the poverty line. Families with 3 or 4 children have the highest poverty rate of 20.0%, comprising of 97 families. On the other hand, families with 5 or more children have the lowest poverty rate of 0.0%, which includes 0 families.
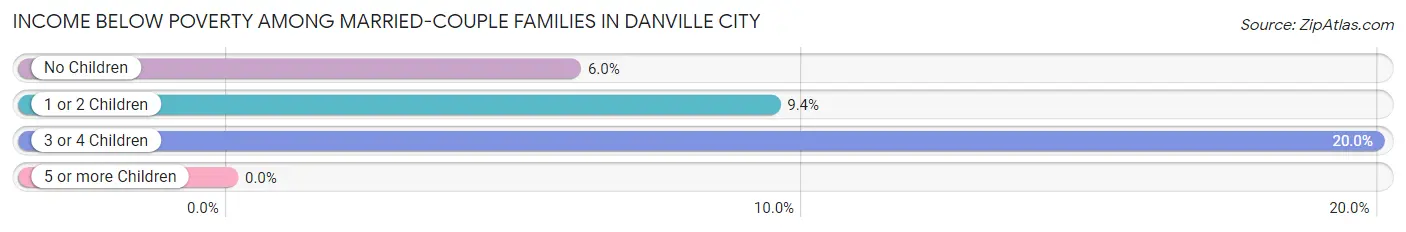
| Children | Above Poverty | Below Poverty |
| No Children | 3,575 (94.0%) | 227 (6.0%) |
| 1 or 2 Children | 931 (90.6%) | 97 (9.4%) |
| 3 or 4 Children | 389 (80.0%) | 97 (20.0%) |
| 5 or more Children | 17 (100.0%) | 0 (0.0%) |
| Total | 4,912 (92.1%) | 421 (7.9%) |
Income Below Poverty Among Single-Parent Households in Danville city
According to the poverty data in Danville city, 26.0% or 226 single-father households and 38.2% or 1,367 single-mother households are living below the poverty line. Among single-father households, those with 3 or 4 children have the highest poverty rate, with 5 households (100.0%) experiencing poverty. Likewise, among single-mother households, those with 5 or more children have the highest poverty rate, with 108 households (93.9%) falling below the poverty line.
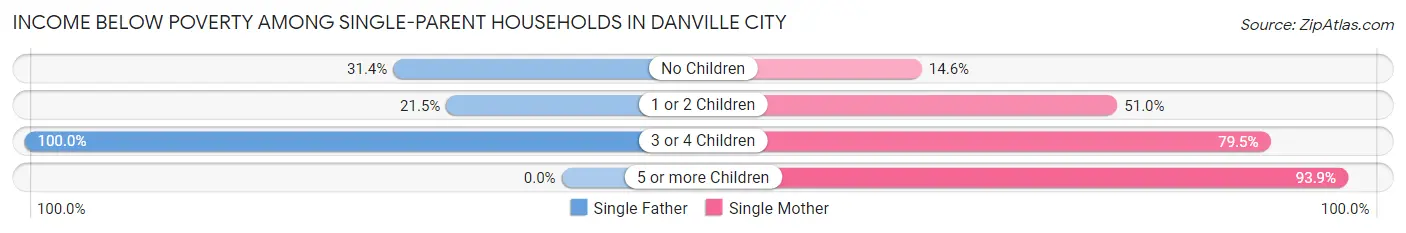
| Children | Single Father | Single Mother |
| No Children | 111 (31.4%) | 224 (14.6%) |
| 1 or 2 Children | 110 (21.5%) | 884 (51.0%) |
| 3 or 4 Children | 5 (100.0%) | 151 (79.5%) |
| 5 or more Children | 0 (0.0%) | 108 (93.9%) |
| Total | 226 (26.0%) | 1,367 (38.2%) |
Income Below Poverty Among Married-Couple vs Single-Parent Households in Danville city
The poverty data for Danville city shows that 421 of the married-couple family households (7.9%) and 1,593 of the single-parent households (35.8%) are living below the poverty level. Within the married-couple family households, those with 3 or 4 children have the highest poverty rate, with 97 households (20.0%) falling below the poverty line. Among the single-parent households, those with 5 or more children have the highest poverty rate, with 108 household (93.9%) living below poverty.
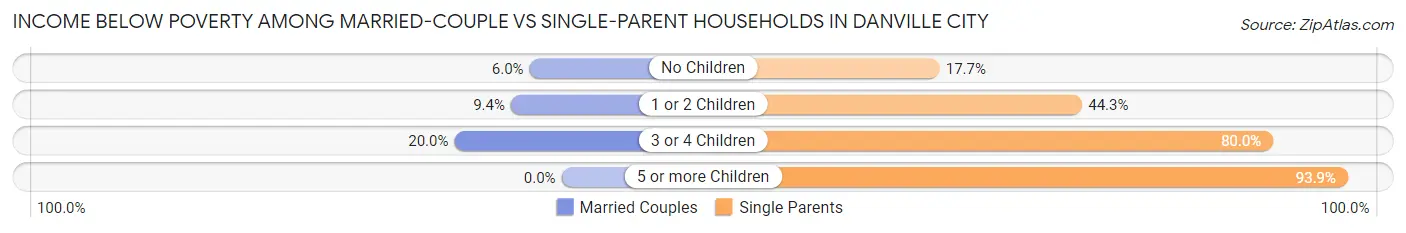
| Children | Married-Couple Families | Single-Parent Households |
| No Children | 227 (6.0%) | 335 (17.7%) |
| 1 or 2 Children | 97 (9.4%) | 994 (44.3%) |
| 3 or 4 Children | 97 (20.0%) | 156 (80.0%) |
| 5 or more Children | 0 (0.0%) | 108 (93.9%) |
| Total | 421 (7.9%) | 1,593 (35.8%) |
Race in Danville city
The most populous races in Danville city are Black / African American (21,338 | 50.2%), White / Caucasian (17,842 | 42.0%), and Two or more Races (2,350 | 5.5%).
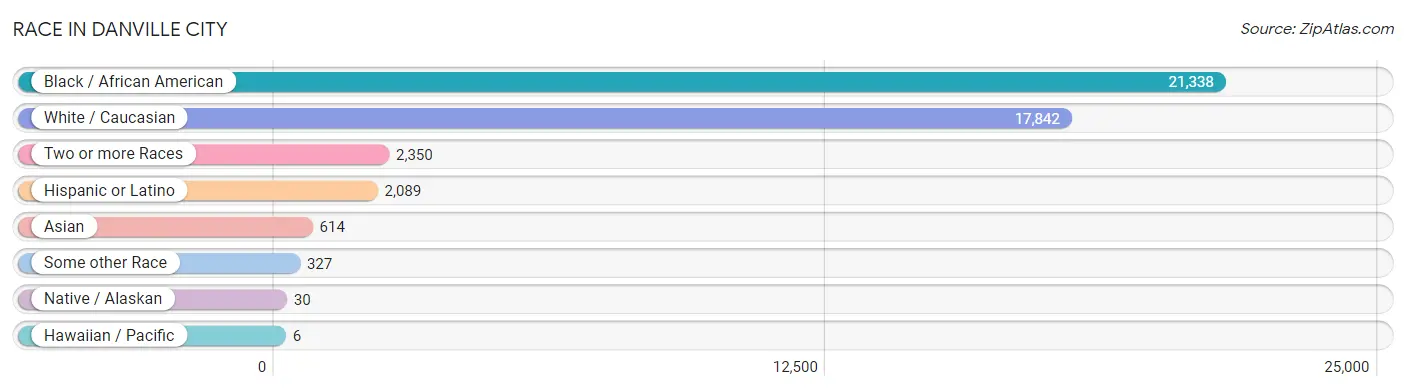
| Race | # Population | % Population |
| Asian | 614 | 1.4% |
| Black / African American | 21,338 | 50.2% |
| Hawaiian / Pacific | 6 | 0.0% |
| Hispanic or Latino | 2,089 | 4.9% |
| Native / Alaskan | 30 | 0.1% |
| White / Caucasian | 17,842 | 42.0% |
| Two or more Races | 2,350 | 5.5% |
| Some other Race | 327 | 0.8% |
| Total | 42,507 | 100.0% |
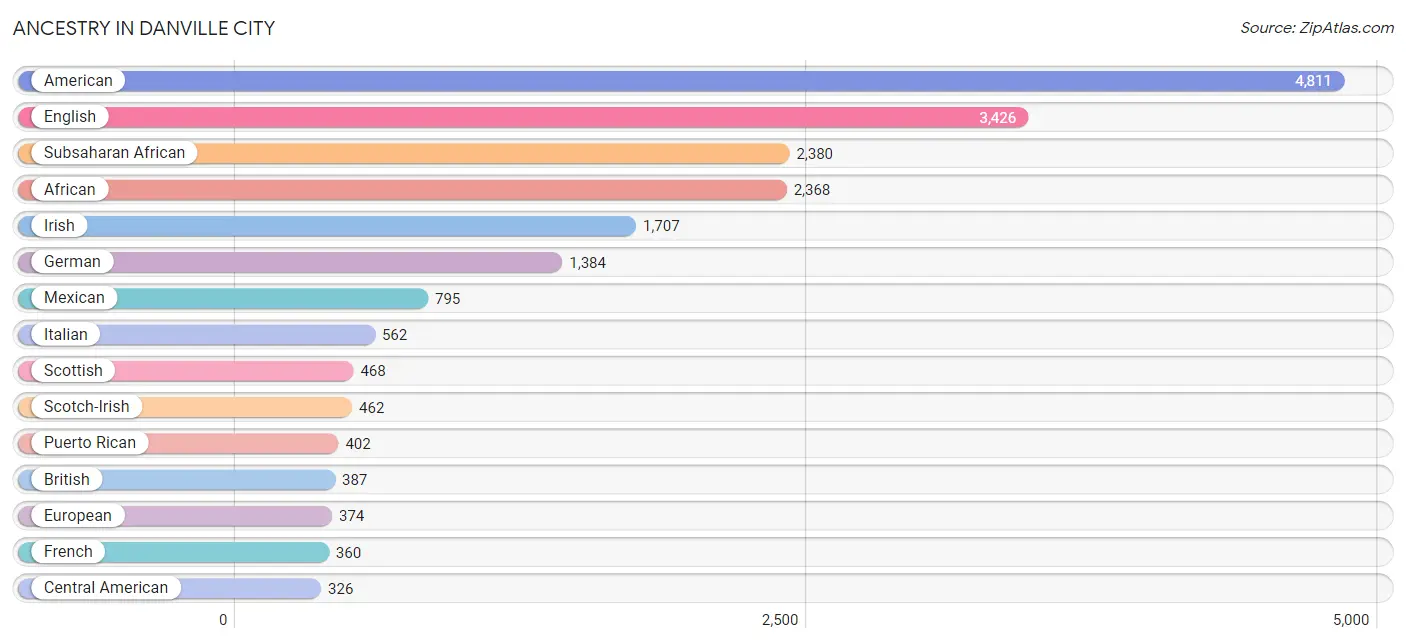
Ancestry in Danville city
The most populous ancestries reported in Danville city are American (4,811 | 11.3%), English (3,426 | 8.1%), Subsaharan African (2,380 | 5.6%), African (2,368 | 5.6%), and Irish (1,707 | 4.0%), together accounting for 34.6% of all Danville city residents.
| Ancestry | # Population | % Population |
| African | 2,368 | 5.6% |
| American | 4,811 | 11.3% |
| Apache | 6 | 0.0% |
| Argentinean | 4 | 0.0% |
| Austrian | 16 | 0.0% |
| Bahamian | 3 | 0.0% |
| Barbadian | 77 | 0.2% |
| Belgian | 54 | 0.1% |
| Bhutanese | 19 | 0.0% |
| British | 387 | 0.9% |
| Burmese | 13 | 0.0% |
| Canadian | 23 | 0.1% |
| Central American | 326 | 0.8% |
| Cherokee | 118 | 0.3% |
| Choctaw | 33 | 0.1% |
| Costa Rican | 3 | 0.0% |
| Creek | 6 | 0.0% |
| Cuban | 80 | 0.2% |
| Czech | 38 | 0.1% |
| Czechoslovakian | 5 | 0.0% |
| Danish | 17 | 0.0% |
| Dominican | 303 | 0.7% |
| Dutch | 102 | 0.2% |
| Eastern European | 5 | 0.0% |
| Ecuadorian | 11 | 0.0% |
| English | 3,426 | 8.1% |
| Ethiopian | 1 | 0.0% |
| European | 374 | 0.9% |
| Finnish | 22 | 0.1% |
| French | 360 | 0.9% |
| French Canadian | 12 | 0.0% |
| German | 1,384 | 3.3% |
| Greek | 19 | 0.0% |
| Guamanian / Chamorro | 3 | 0.0% |
| Honduran | 133 | 0.3% |
| Hungarian | 29 | 0.1% |
| Indian (Asian) | 45 | 0.1% |
| Iranian | 7 | 0.0% |
| Irish | 1,707 | 4.0% |
| Italian | 562 | 1.3% |
| Jamaican | 36 | 0.1% |
| Korean | 137 | 0.3% |
| Mexican | 795 | 1.9% |
| Native Hawaiian | 3 | 0.0% |
| Nigerian | 11 | 0.0% |
| Northern European | 6 | 0.0% |
| Norwegian | 60 | 0.1% |
| Pakistani | 5 | 0.0% |
| Pennsylvania German | 47 | 0.1% |
| Peruvian | 22 | 0.1% |
| Polish | 233 | 0.5% |
| Puerto Rican | 402 | 0.9% |
| Russian | 24 | 0.1% |
| Salvadoran | 190 | 0.4% |
| Scandinavian | 66 | 0.2% |
| Scotch-Irish | 462 | 1.1% |
| Scottish | 468 | 1.1% |
| South American | 70 | 0.2% |
| Spanish | 113 | 0.3% |
| Sri Lankan | 121 | 0.3% |
| Subsaharan African | 2,380 | 5.6% |
| Swedish | 16 | 0.0% |
| Swiss | 6 | 0.0% |
| Thai | 301 | 0.7% |
| Ukrainian | 29 | 0.1% |
| Uruguayan | 33 | 0.1% |
| Vietnamese | 10 | 0.0% |
| Welsh | 173 | 0.4% |
| West Indian | 9 | 0.0% | View All 69 Rows |
Immigrants in Danville city
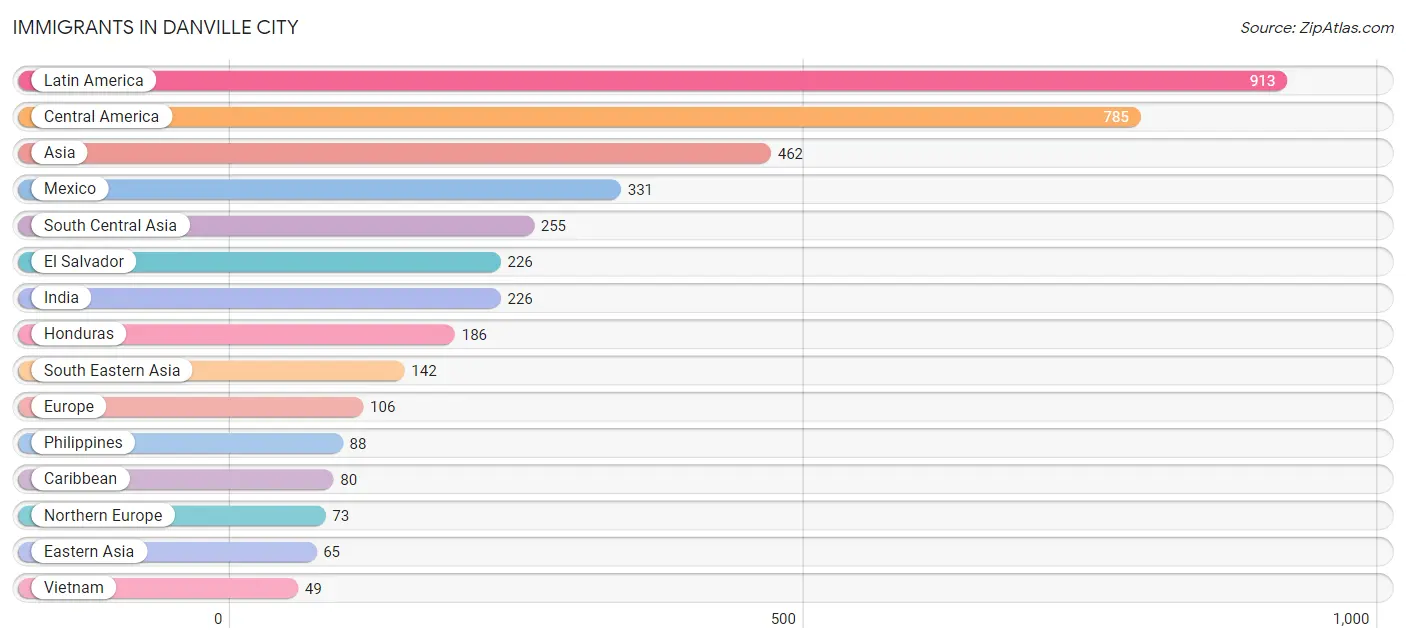
The most numerous immigrant groups reported in Danville city came from Latin America (913 | 2.1%), Central America (785 | 1.8%), Asia (462 | 1.1%), Mexico (331 | 0.8%), and South Central Asia (255 | 0.6%), together accounting for 6.5% of all Danville city residents.
| Immigration Origin | # Population | % Population |
| Africa | 40 | 0.1% |
| Argentina | 4 | 0.0% |
| Asia | 462 | 1.1% |
| Bahamas | 3 | 0.0% |
| Bangladesh | 17 | 0.0% |
| Caribbean | 80 | 0.2% |
| Central America | 785 | 1.8% |
| China | 42 | 0.1% |
| Costa Rica | 3 | 0.0% |
| Denmark | 37 | 0.1% |
| Dominican Republic | 27 | 0.1% |
| Eastern Africa | 1 | 0.0% |
| Eastern Asia | 65 | 0.2% |
| Eastern Europe | 17 | 0.0% |
| Ecuador | 11 | 0.0% |
| El Salvador | 226 | 0.5% |
| England | 21 | 0.1% |
| Ethiopia | 1 | 0.0% |
| Europe | 106 | 0.3% |
| Germany | 16 | 0.0% |
| Grenada | 14 | 0.0% |
| Honduras | 186 | 0.4% |
| India | 226 | 0.5% |
| Jamaica | 36 | 0.1% |
| Japan | 10 | 0.0% |
| Korea | 13 | 0.0% |
| Latin America | 913 | 2.1% |
| Mexico | 331 | 0.8% |
| Morocco | 5 | 0.0% |
| Nigeria | 11 | 0.0% |
| Northern Africa | 5 | 0.0% |
| Northern Europe | 73 | 0.2% |
| Oceania | 5 | 0.0% |
| Pakistan | 12 | 0.0% |
| Panama | 39 | 0.1% |
| Philippines | 88 | 0.2% |
| Poland | 10 | 0.0% |
| Russia | 7 | 0.0% |
| Sierra Leone | 2 | 0.0% |
| South America | 48 | 0.1% |
| South Central Asia | 255 | 0.6% |
| South Eastern Asia | 142 | 0.3% |
| Thailand | 5 | 0.0% |
| Uruguay | 33 | 0.1% |
| Vietnam | 49 | 0.1% |
| Western Africa | 13 | 0.0% |
| Western Europe | 16 | 0.0% | View All 47 Rows |
Sex and Age in Danville city
Sex and Age in Danville city
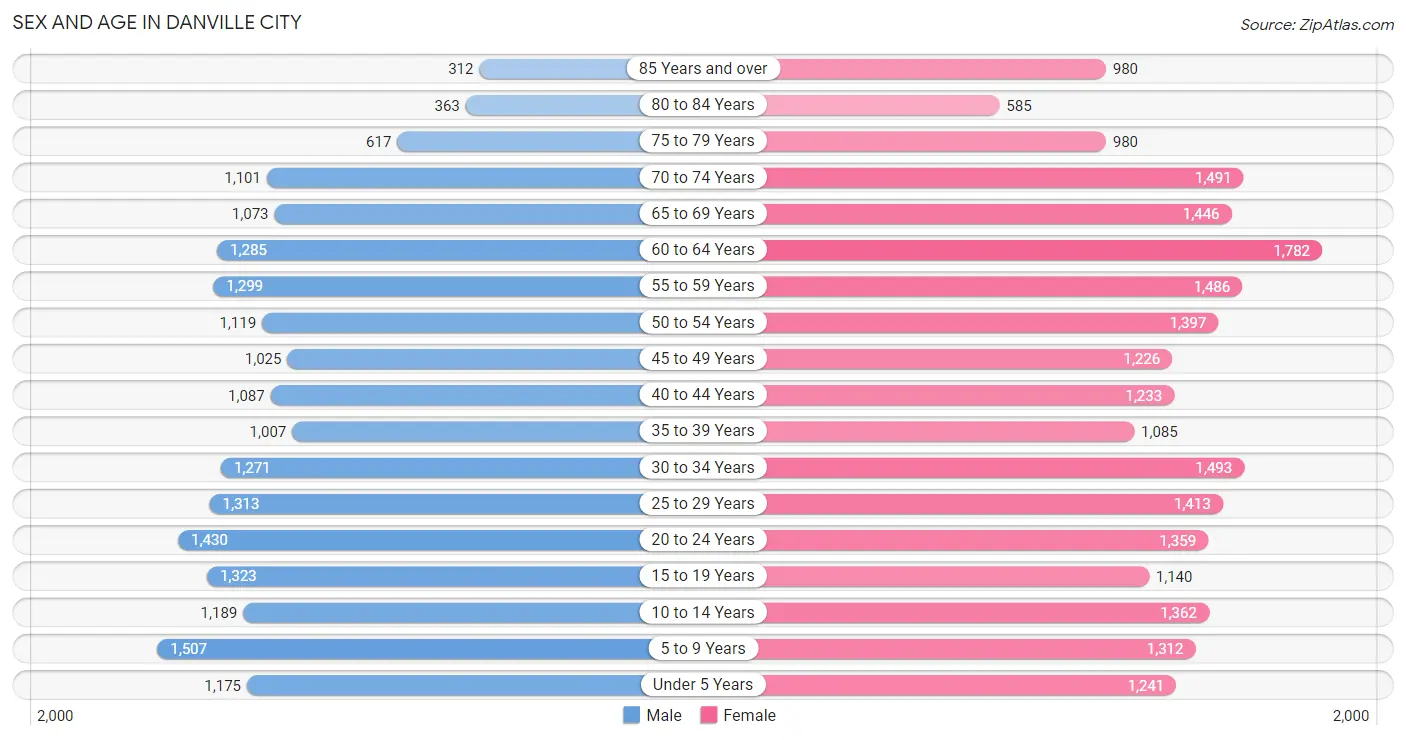
The most populous age groups in Danville city are 5 to 9 Years (1,507 | 7.7%) for men and 60 to 64 Years (1,782 | 7.7%) for women.
| Age Bracket | Male | Female |
| Under 5 Years | 1,175 (6.0%) | 1,241 (5.4%) |
| 5 to 9 Years | 1,507 (7.7%) | 1,312 (5.7%) |
| 10 to 14 Years | 1,189 (6.1%) | 1,362 (5.9%) |
| 15 to 19 Years | 1,323 (6.8%) | 1,140 (5.0%) |
| 20 to 24 Years | 1,430 (7.3%) | 1,359 (5.9%) |
| 25 to 29 Years | 1,313 (6.7%) | 1,413 (6.1%) |
| 30 to 34 Years | 1,271 (6.5%) | 1,493 (6.5%) |
| 35 to 39 Years | 1,007 (5.2%) | 1,085 (4.7%) |
| 40 to 44 Years | 1,087 (5.6%) | 1,233 (5.4%) |
| 45 to 49 Years | 1,025 (5.3%) | 1,226 (5.3%) |
| 50 to 54 Years | 1,119 (5.7%) | 1,397 (6.1%) |
| 55 to 59 Years | 1,299 (6.7%) | 1,486 (6.5%) |
| 60 to 64 Years | 1,285 (6.6%) | 1,782 (7.7%) |
| 65 to 69 Years | 1,073 (5.5%) | 1,446 (6.3%) |
| 70 to 74 Years | 1,101 (5.7%) | 1,491 (6.5%) |
| 75 to 79 Years | 617 (3.2%) | 980 (4.3%) |
| 80 to 84 Years | 363 (1.9%) | 585 (2.5%) |
| 85 Years and over | 312 (1.6%) | 980 (4.3%) |
| Total | 19,496 (100.0%) | 23,011 (100.0%) |
Families and Households in Danville city
Median Family Size in Danville city
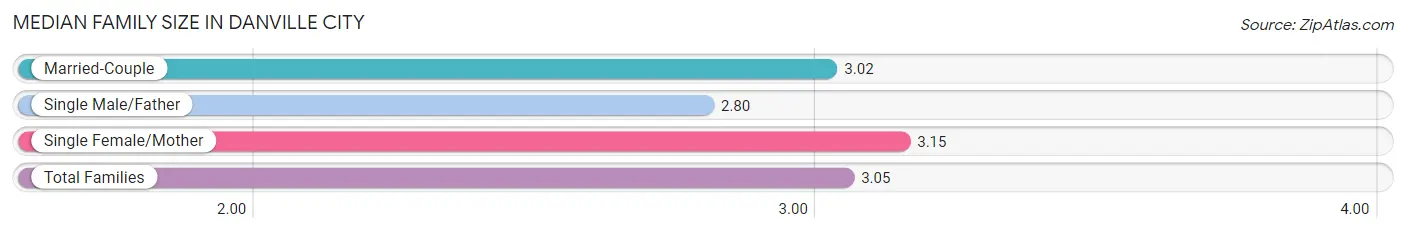
The median family size in Danville city is 3.05 persons per family, with single female/mother families (3,576 | 36.6%) accounting for the largest median family size of 3.15 persons per family. On the other hand, single male/father families (871 | 8.9%) represent the smallest median family size with 2.80 persons per family.
| Family Type | # Families | Family Size |
| Married-Couple | 5,333 (54.5%) | 3.02 |
| Single Male/Father | 871 (8.9%) | 2.80 |
| Single Female/Mother | 3,576 (36.6%) | 3.15 |
| Total Families | 9,780 (100.0%) | 3.05 |
Median Household Size in Danville city
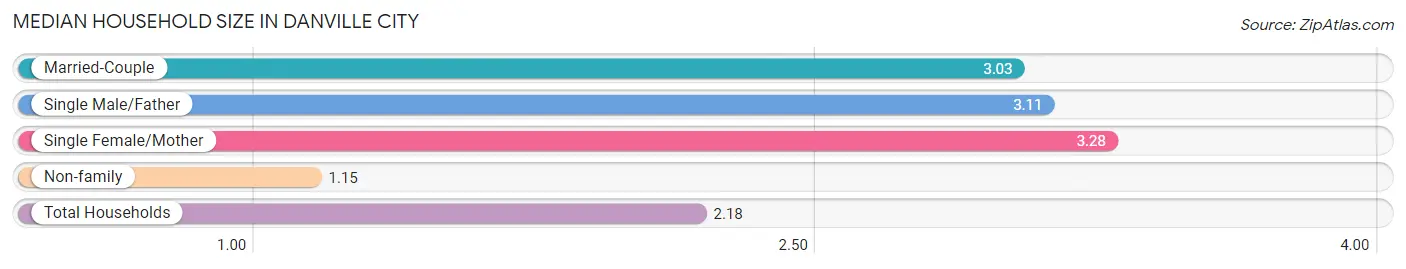
The median household size in Danville city is 2.18 persons per household, with single female/mother households (3,576 | 19.1%) accounting for the largest median household size of 3.28 persons per household. non-family households (8,975 | 47.8%) represent the smallest median household size with 1.15 persons per household.
| Household Type | # Households | Household Size |
| Married-Couple | 5,333 (28.4%) | 3.03 |
| Single Male/Father | 871 (4.6%) | 3.11 |
| Single Female/Mother | 3,576 (19.1%) | 3.28 |
| Non-family | 8,975 (47.8%) | 1.15 |
| Total Households | 18,755 (100.0%) | 2.18 |
Household Size by Marriage Status in Danville city
Out of a total of 18,755 households in Danville city, 9,780 (52.1%) are family households, while 8,975 (47.8%) are nonfamily households. The most numerous type of family households are 2-person households, comprising 5,161, and the most common type of nonfamily households are 1-person households, comprising 7,710.
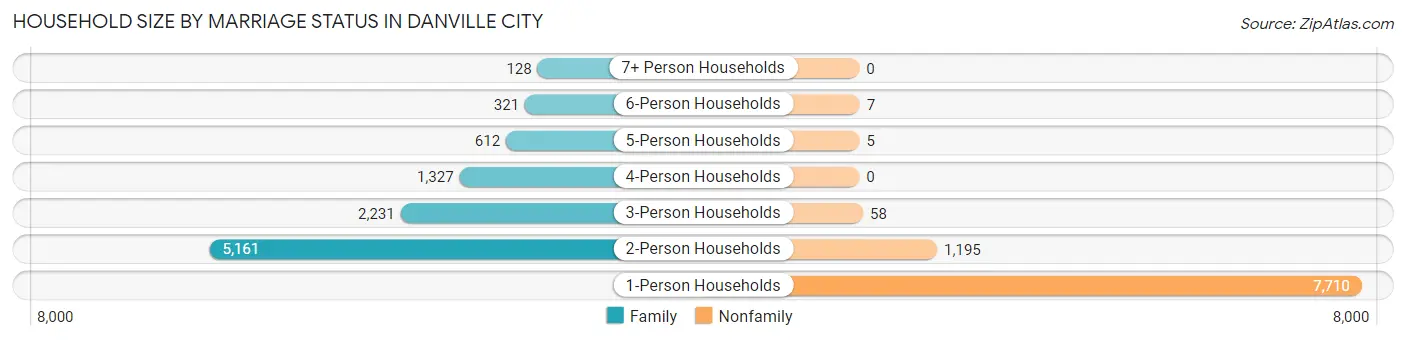
| Household Size | Family Households | Nonfamily Households |
| 1-Person Households | - | 7,710 (41.1%) |
| 2-Person Households | 5,161 (27.5%) | 1,195 (6.4%) |
| 3-Person Households | 2,231 (11.9%) | 58 (0.3%) |
| 4-Person Households | 1,327 (7.1%) | 0 (0.0%) |
| 5-Person Households | 612 (3.3%) | 5 (0.0%) |
| 6-Person Households | 321 (1.7%) | 7 (0.0%) |
| 7+ Person Households | 128 (0.7%) | 0 (0.0%) |
| Total | 9,780 (52.1%) | 8,975 (47.8%) |
Female Fertility in Danville city
Fertility by Age in Danville city
Average fertility rate in Danville city is 48.0 births per 1,000 women. Women in the age bracket of 20 to 34 years have the highest fertility rate with 88.0 births per 1,000 women. Women in the age bracket of 20 to 34 years acount for 85.2% of all women with births.
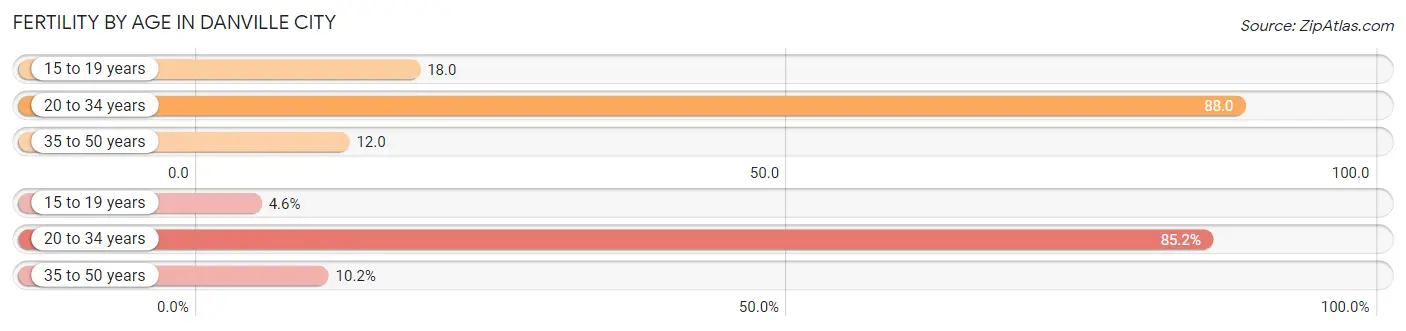
| Age Bracket | Women with Births | Births / 1,000 Women |
| 15 to 19 years | 20 (4.5%) | 18.0 |
| 20 to 34 years | 375 (85.2%) | 88.0 |
| 35 to 50 years | 45 (10.2%) | 12.0 |
| Total | 440 (100.0%) | 48.0 |
Fertility by Age by Marriage Status in Danville city
35.9% of women with births (440) in Danville city are married. The highest percentage of unmarried women with births falls into 15 to 19 years age bracket with 100.0% of them unmarried at the time of birth, while the lowest percentage of unmarried women with births belong to 35 to 50 years age bracket with 35.6% of them unmarried.
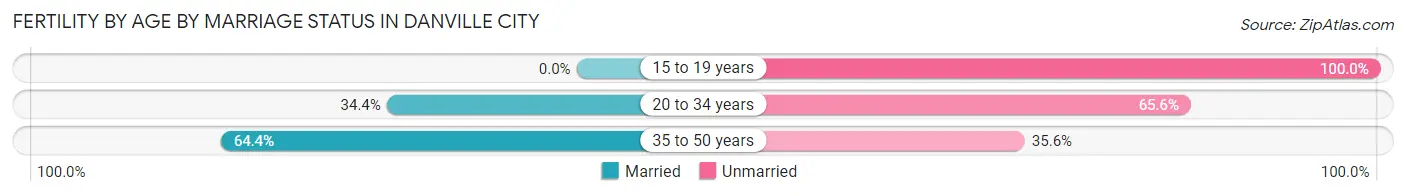
| Age Bracket | Married | Unmarried |
| 15 to 19 years | 0 (0.0%) | 20 (100.0%) |
| 20 to 34 years | 129 (34.4%) | 246 (65.6%) |
| 35 to 50 years | 29 (64.4%) | 16 (35.6%) |
| Total | 158 (35.9%) | 282 (64.1%) |
Fertility by Education in Danville city
Average fertility rate in Danville city is 48.0 births per 1,000 women. Women with the education attainment of graduate degree have the highest fertility rate of 103.0 births per 1,000 women, while women with the education attainment of less than high school have the lowest fertility at 14.0 births per 1,000 women. Women with the education attainment of college or associate's degree represent 36.4% of all women with births.
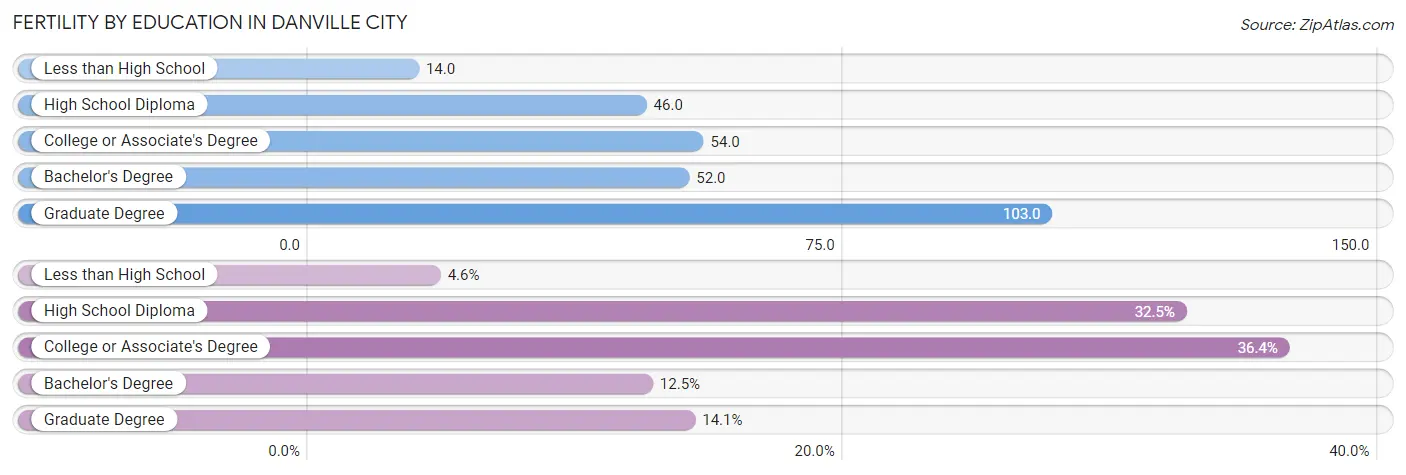
| Educational Attainment | Women with Births | Births / 1,000 Women |
| Less than High School | 20 (4.5%) | 14.0 |
| High School Diploma | 143 (32.5%) | 46.0 |
| College or Associate's Degree | 160 (36.4%) | 54.0 |
| Bachelor's Degree | 55 (12.5%) | 52.0 |
| Graduate Degree | 62 (14.1%) | 103.0 |
| Total | 440 (100.0%) | 48.0 |
Fertility by Education by Marriage Status in Danville city
64.1% of women with births in Danville city are unmarried. Women with the educational attainment of graduate degree are most likely to be married with 100.0% of them married at childbirth, while women with the educational attainment of less than high school are least likely to be married with 100.0% of them unmarried at childbirth.
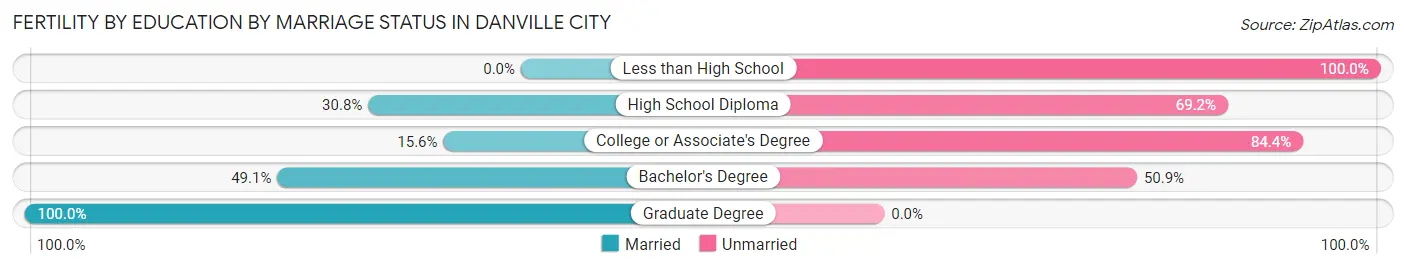
| Educational Attainment | Married | Unmarried |
| Less than High School | 0 (0.0%) | 20 (100.0%) |
| High School Diploma | 44 (30.8%) | 99 (69.2%) |
| College or Associate's Degree | 25 (15.6%) | 135 (84.4%) |
| Bachelor's Degree | 27 (49.1%) | 28 (50.9%) |
| Graduate Degree | 62 (100.0%) | 0 (0.0%) |
| Total | 158 (35.9%) | 282 (64.1%) |
Employment Characteristics in Danville city
Employment by Class of Employer in Danville city
Among the 16,076 employed individuals in Danville city, private company employees (11,676 | 72.6%), local government employees (1,204 | 7.5%), and not-for-profit organizations (952 | 5.9%) make up the most common classes of employment.
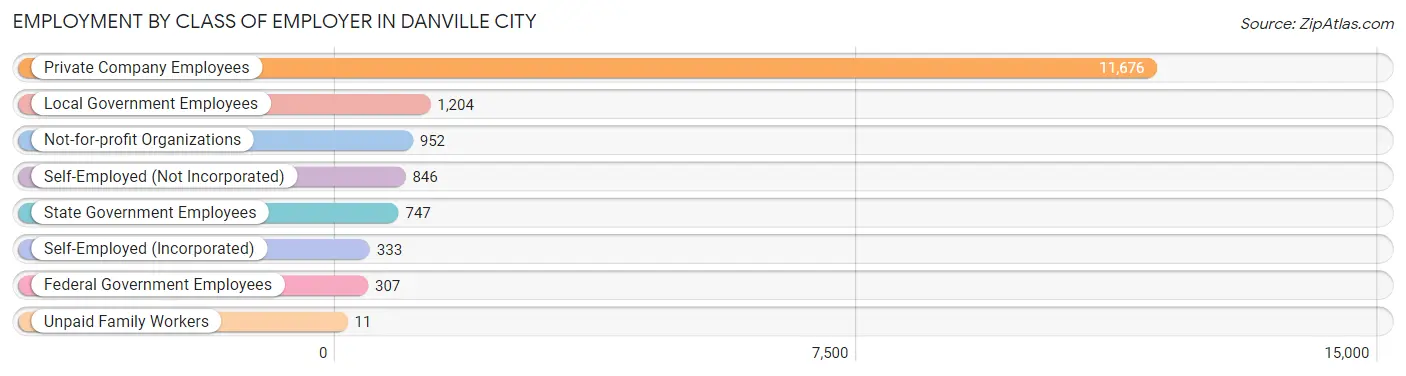
| Employer Class | # Employees | % Employees |
| Private Company Employees | 11,676 | 72.6% |
| Self-Employed (Incorporated) | 333 | 2.1% |
| Self-Employed (Not Incorporated) | 846 | 5.3% |
| Not-for-profit Organizations | 952 | 5.9% |
| Local Government Employees | 1,204 | 7.5% |
| State Government Employees | 747 | 4.6% |
| Federal Government Employees | 307 | 1.9% |
| Unpaid Family Workers | 11 | 0.1% |
| Total | 16,076 | 100.0% |
Employment Status by Age in Danville city
According to the labor force statistics for Danville city, out of the total population over 16 years of age (34,209), 51.9% or 17,754 individuals are in the labor force, with 5.8% or 1,030 of them unemployed. The age group with the highest labor force participation rate is 30 to 34 years, with 81.5% or 2,253 individuals in the labor force. Within the labor force, the 16 to 19 years age range has the highest percentage of unemployed individuals, with 20.2% or 98 of them being unemployed.
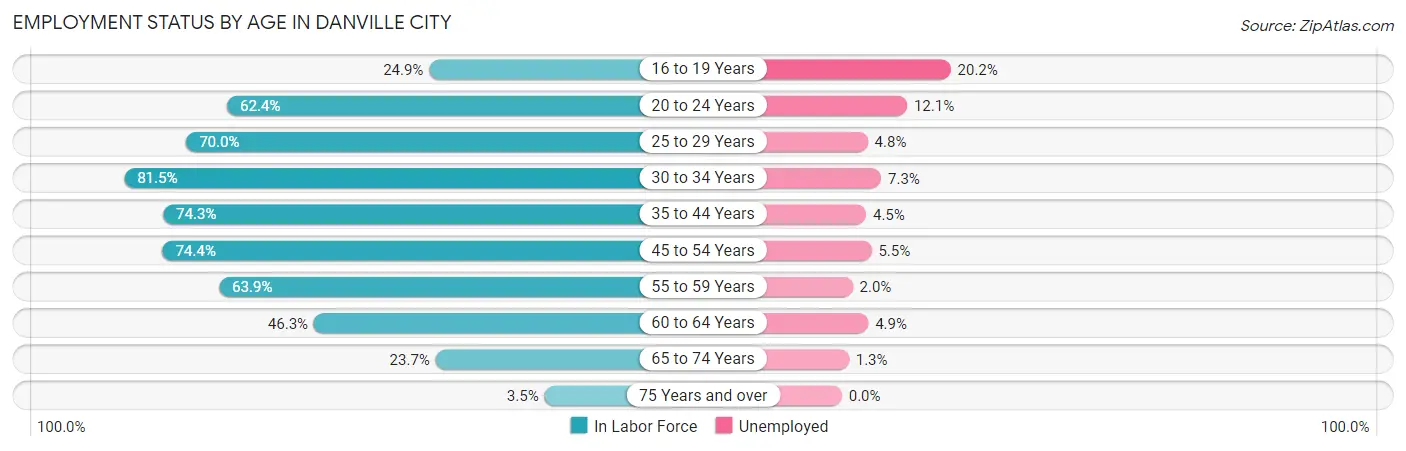
| Age Bracket | In Labor Force | Unemployed |
| 16 to 19 Years | 486 (24.9%) | 98 (20.2%) |
| 20 to 24 Years | 1,740 (62.4%) | 211 (12.1%) |
| 25 to 29 Years | 1,908 (70.0%) | 92 (4.8%) |
| 30 to 34 Years | 2,253 (81.5%) | 164 (7.3%) |
| 35 to 44 Years | 3,278 (74.3%) | 148 (4.5%) |
| 45 to 54 Years | 3,547 (74.4%) | 195 (5.5%) |
| 55 to 59 Years | 1,780 (63.9%) | 36 (2.0%) |
| 60 to 64 Years | 1,420 (46.3%) | 70 (4.9%) |
| 65 to 74 Years | 1,211 (23.7%) | 16 (1.3%) |
| 75 Years and over | 134 (3.5%) | 0 (0.0%) |
| Total | 17,754 (51.9%) | 1,030 (5.8%) |
Employment Status by Educational Attainment in Danville city
According to labor force statistics for Danville city, 69.1% of individuals (14,180) out of the total population between 25 and 64 years of age (20,521) are in the labor force, with 5.0% or 709 of them being unemployed. The group with the highest labor force participation rate are those with the educational attainment of bachelor's degree or higher, with 83.9% or 3,301 individuals in the labor force. Within the labor force, individuals with high school diploma education have the highest percentage of unemployment, with 6.9% or 369 of them being unemployed.
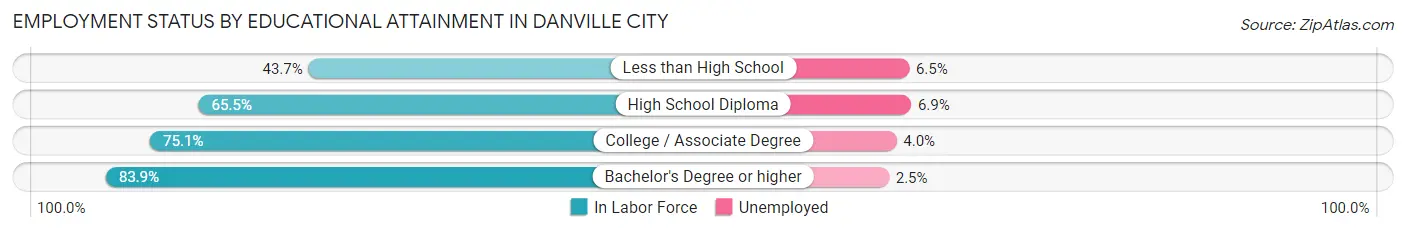
| Educational Attainment | In Labor Force | Unemployed |
| Less than High School | 1,095 (43.7%) | 163 (6.5%) |
| High School Diploma | 5,343 (65.5%) | 563 (6.9%) |
| College / Associate Degree | 4,449 (75.1%) | 237 (4.0%) |
| Bachelor's Degree or higher | 3,301 (83.9%) | 98 (2.5%) |
| Total | 14,180 (69.1%) | 1,026 (5.0%) |
Employment Occupations by Sex in Danville city
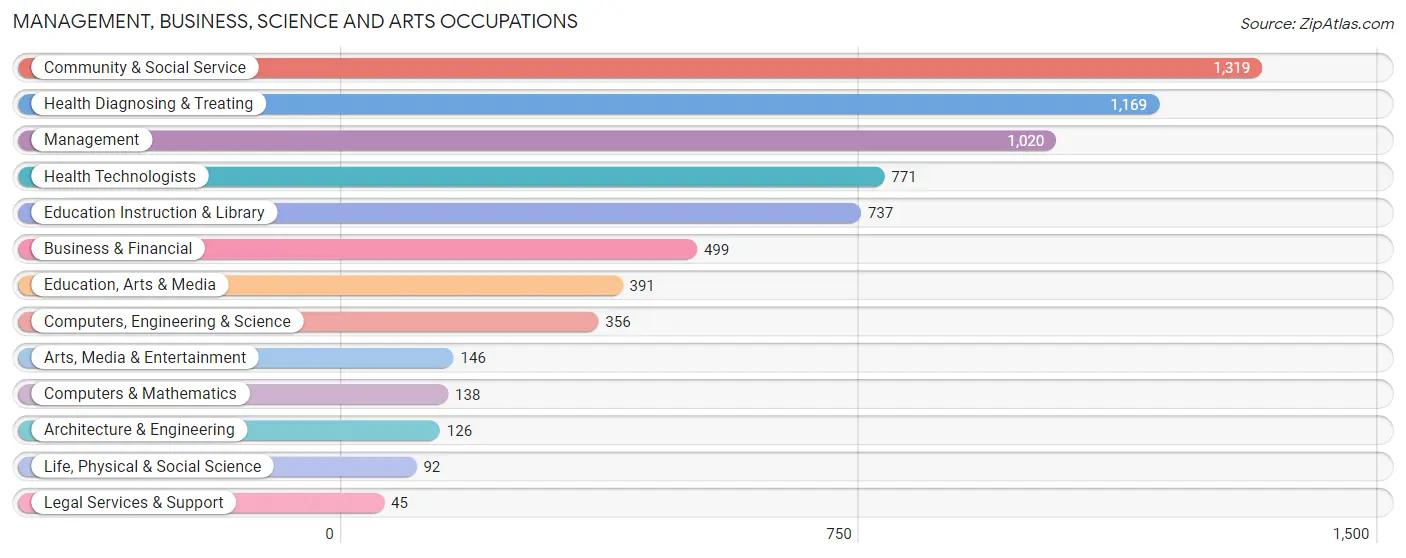
Management, Business, Science and Arts Occupations
The most common Management, Business, Science and Arts occupations in Danville city are Community & Social Service (1,319 | 7.9%), Health Diagnosing & Treating (1,169 | 7.0%), Management (1,020 | 6.1%), Health Technologists (771 | 4.6%), and Education Instruction & Library (737 | 4.4%).
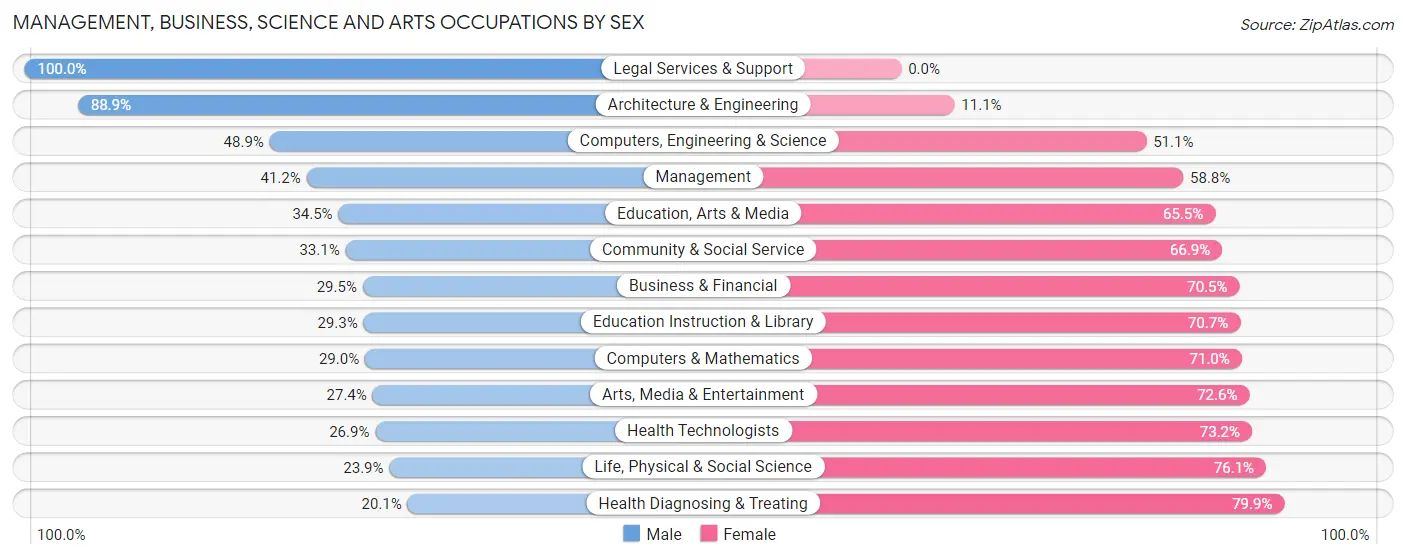
Management, Business, Science and Arts Occupations by Sex
Within the Management, Business, Science and Arts occupations in Danville city, the most male-oriented occupations are Legal Services & Support (100.0%), Architecture & Engineering (88.9%), and Computers, Engineering & Science (48.9%), while the most female-oriented occupations are Health Diagnosing & Treating (79.9%), Life, Physical & Social Science (76.1%), and Health Technologists (73.2%).
| Occupation | Male | Female |
| Management | 420 (41.2%) | 600 (58.8%) |
| Business & Financial | 147 (29.5%) | 352 (70.5%) |
| Computers, Engineering & Science | 174 (48.9%) | 182 (51.1%) |
| Computers & Mathematics | 40 (29.0%) | 98 (71.0%) |
| Architecture & Engineering | 112 (88.9%) | 14 (11.1%) |
| Life, Physical & Social Science | 22 (23.9%) | 70 (76.1%) |
| Community & Social Service | 436 (33.1%) | 883 (66.9%) |
| Education, Arts & Media | 135 (34.5%) | 256 (65.5%) |
| Legal Services & Support | 45 (100.0%) | 0 (0.0%) |
| Education Instruction & Library | 216 (29.3%) | 521 (70.7%) |
| Arts, Media & Entertainment | 40 (27.4%) | 106 (72.6%) |
| Health Diagnosing & Treating | 235 (20.1%) | 934 (79.9%) |
| Health Technologists | 207 (26.9%) | 564 (73.2%) |
| Total (Category) | 1,412 (32.4%) | 2,951 (67.6%) |
| Total (Overall) | 7,687 (46.1%) | 8,983 (53.9%) |
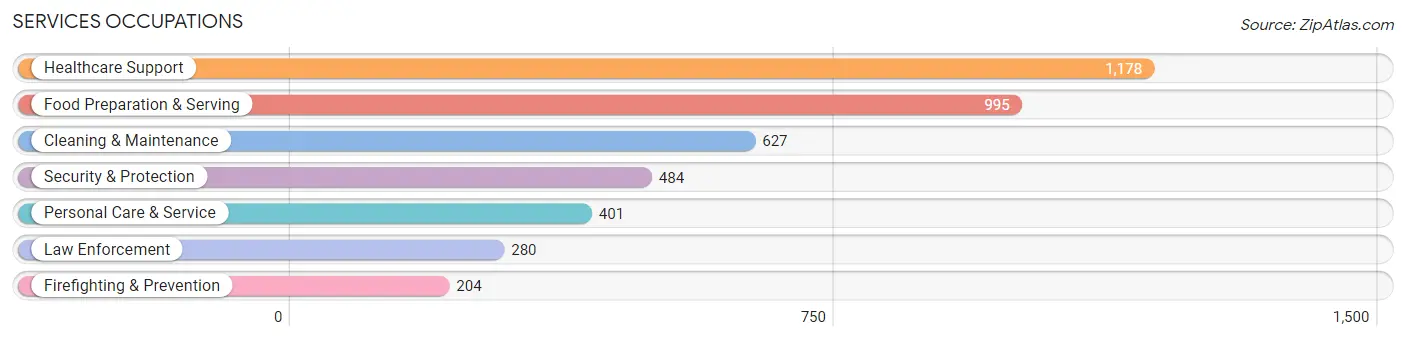
Services Occupations
The most common Services occupations in Danville city are Healthcare Support (1,178 | 7.1%), Food Preparation & Serving (995 | 6.0%), Cleaning & Maintenance (627 | 3.8%), Security & Protection (484 | 2.9%), and Personal Care & Service (401 | 2.4%).
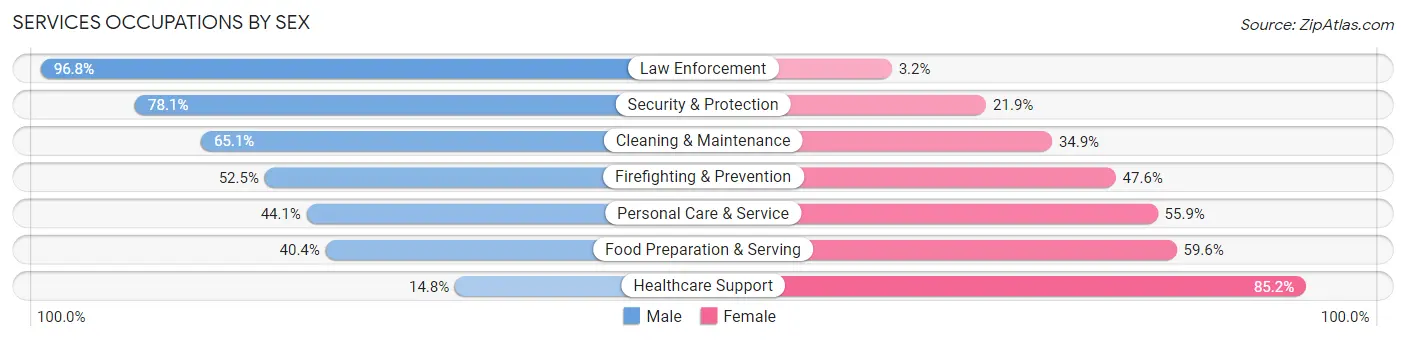
Services Occupations by Sex
Within the Services occupations in Danville city, the most male-oriented occupations are Law Enforcement (96.8%), Security & Protection (78.1%), and Cleaning & Maintenance (65.1%), while the most female-oriented occupations are Healthcare Support (85.2%), Food Preparation & Serving (59.6%), and Personal Care & Service (55.9%).
| Occupation | Male | Female |
| Healthcare Support | 174 (14.8%) | 1,004 (85.2%) |
| Security & Protection | 378 (78.1%) | 106 (21.9%) |
| Firefighting & Prevention | 107 (52.4%) | 97 (47.5%) |
| Law Enforcement | 271 (96.8%) | 9 (3.2%) |
| Food Preparation & Serving | 402 (40.4%) | 593 (59.6%) |
| Cleaning & Maintenance | 408 (65.1%) | 219 (34.9%) |
| Personal Care & Service | 177 (44.1%) | 224 (55.9%) |
| Total (Category) | 1,539 (41.8%) | 2,146 (58.2%) |
| Total (Overall) | 7,687 (46.1%) | 8,983 (53.9%) |
Sales and Office Occupations
The most common Sales and Office occupations in Danville city are Sales & Related (1,745 | 10.5%), and Office & Administration (1,637 | 9.8%).
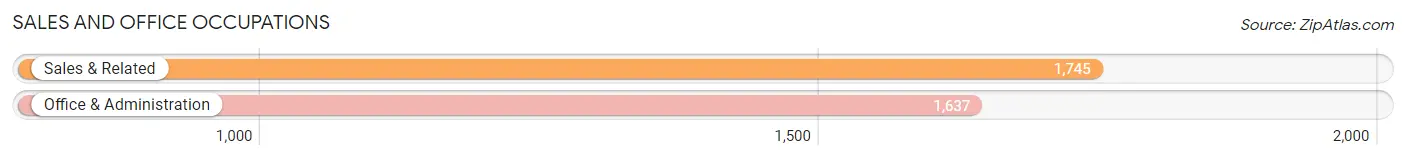
Sales and Office Occupations by Sex

| Occupation | Male | Female |
| Sales & Related | 703 (40.3%) | 1,042 (59.7%) |
| Office & Administration | 298 (18.2%) | 1,339 (81.8%) |
| Total (Category) | 1,001 (29.6%) | 2,381 (70.4%) |
| Total (Overall) | 7,687 (46.1%) | 8,983 (53.9%) |
Natural Resources, Construction and Maintenance Occupations
The most common Natural Resources, Construction and Maintenance occupations in Danville city are Construction & Extraction (984 | 5.9%), and Installation, Maintenance & Repair (432 | 2.6%).
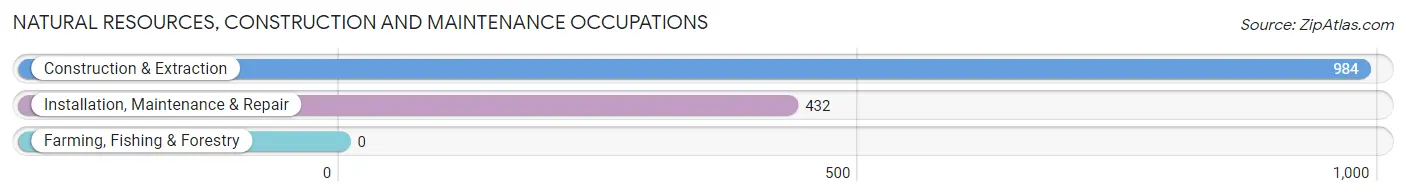
Natural Resources, Construction and Maintenance Occupations by Sex
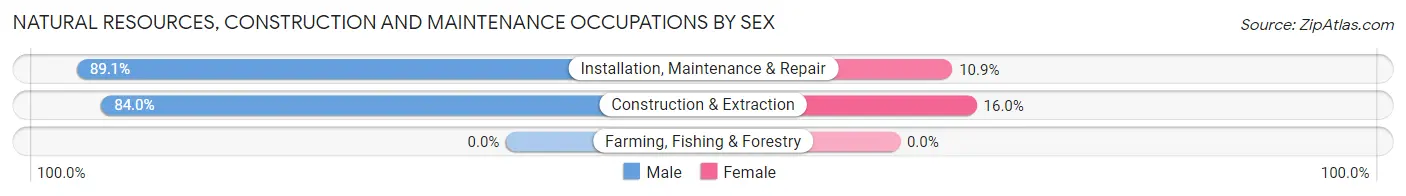
| Occupation | Male | Female |
| Farming, Fishing & Forestry | 0 (0.0%) | 0 (0.0%) |
| Construction & Extraction | 827 (84.0%) | 157 (16.0%) |
| Installation, Maintenance & Repair | 385 (89.1%) | 47 (10.9%) |
| Total (Category) | 1,212 (85.6%) | 204 (14.4%) |
| Total (Overall) | 7,687 (46.1%) | 8,983 (53.9%) |
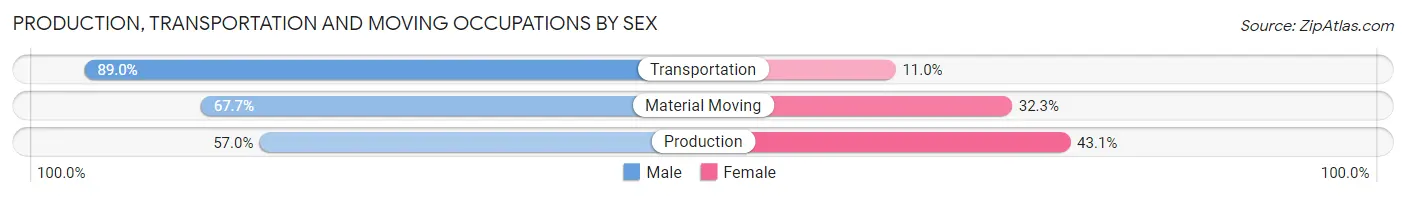
Production, Transportation and Moving Occupations
The most common Production, Transportation and Moving occupations in Danville city are Production (2,035 | 12.2%), Material Moving (1,070 | 6.4%), and Transportation (719 | 4.3%).
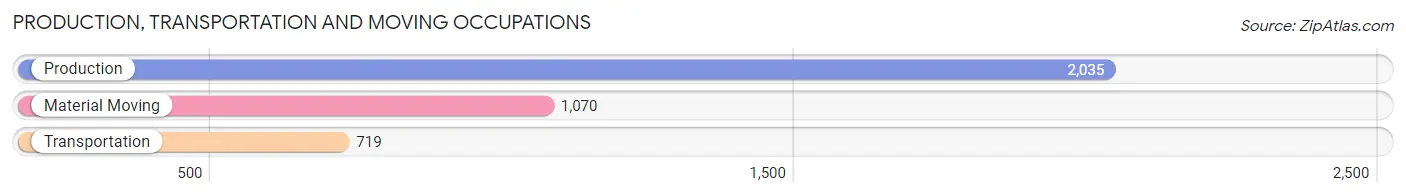
Production, Transportation and Moving Occupations by Sex
| Occupation | Male | Female |
| Production | 1,159 (57.0%) | 876 (43.0%) |
| Transportation | 640 (89.0%) | 79 (11.0%) |
| Material Moving | 724 (67.7%) | 346 (32.3%) |
| Total (Category) | 2,523 (66.0%) | 1,301 (34.0%) |
| Total (Overall) | 7,687 (46.1%) | 8,983 (53.9%) |
Employment Industries by Sex in Danville city
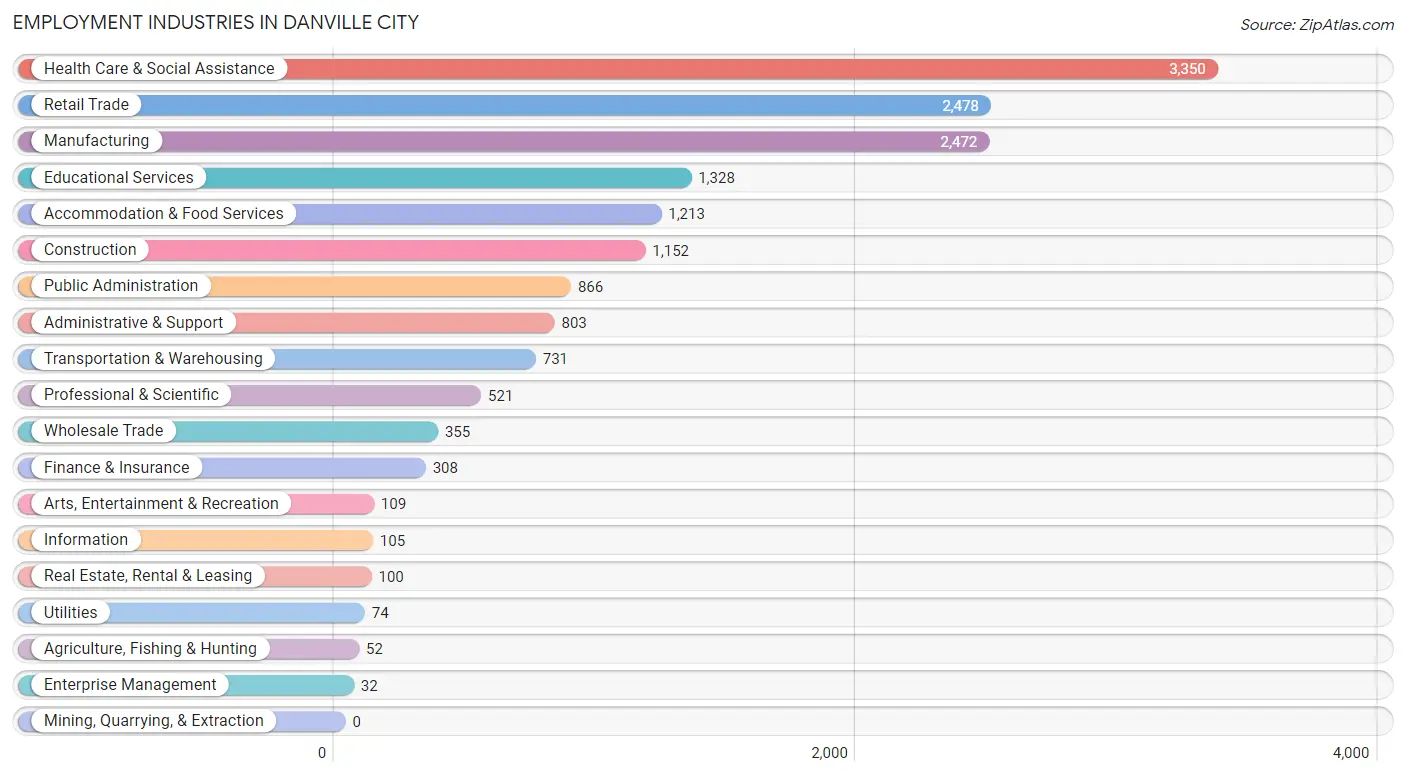
Employment Industries in Danville city
The major employment industries in Danville city include Health Care & Social Assistance (3,350 | 20.1%), Retail Trade (2,478 | 14.9%), Manufacturing (2,472 | 14.8%), Educational Services (1,328 | 8.0%), and Accommodation & Food Services (1,213 | 7.3%).
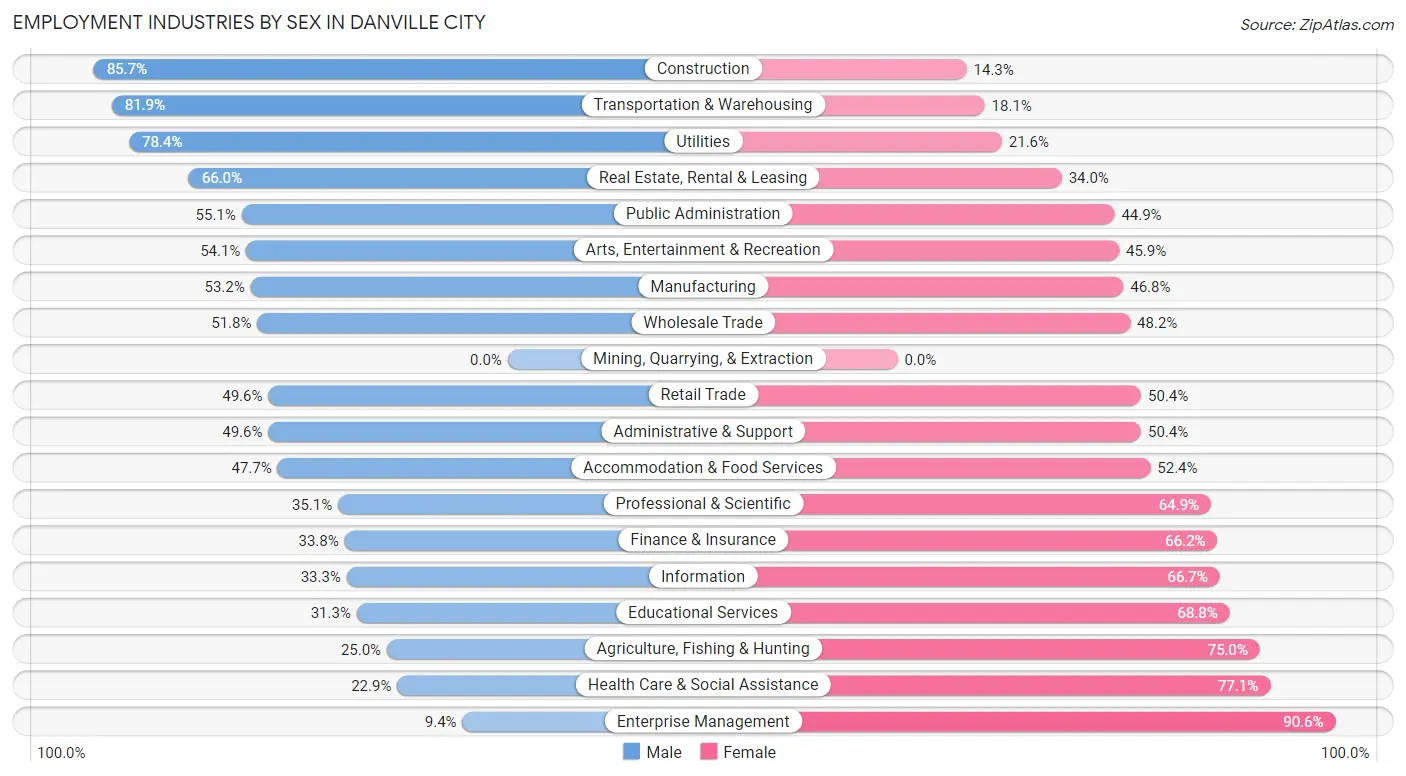
Employment Industries by Sex in Danville city
The Danville city industries that see more men than women are Construction (85.7%), Transportation & Warehousing (81.9%), and Utilities (78.4%), whereas the industries that tend to have a higher number of women are Enterprise Management (90.6%), Health Care & Social Assistance (77.1%), and Agriculture, Fishing & Hunting (75.0%).
| Industry | Male | Female |
| Agriculture, Fishing & Hunting | 13 (25.0%) | 39 (75.0%) |
| Mining, Quarrying, & Extraction | 0 (0.0%) | 0 (0.0%) |
| Construction | 987 (85.7%) | 165 (14.3%) |
| Manufacturing | 1,316 (53.2%) | 1,156 (46.8%) |
| Wholesale Trade | 184 (51.8%) | 171 (48.2%) |
| Retail Trade | 1,228 (49.6%) | 1,250 (50.4%) |
| Transportation & Warehousing | 599 (81.9%) | 132 (18.1%) |
| Utilities | 58 (78.4%) | 16 (21.6%) |
| Information | 35 (33.3%) | 70 (66.7%) |
| Finance & Insurance | 104 (33.8%) | 204 (66.2%) |
| Real Estate, Rental & Leasing | 66 (66.0%) | 34 (34.0%) |
| Professional & Scientific | 183 (35.1%) | 338 (64.9%) |
| Enterprise Management | 3 (9.4%) | 29 (90.6%) |
| Administrative & Support | 398 (49.6%) | 405 (50.4%) |
| Educational Services | 415 (31.2%) | 913 (68.8%) |
| Health Care & Social Assistance | 766 (22.9%) | 2,584 (77.1%) |
| Arts, Entertainment & Recreation | 59 (54.1%) | 50 (45.9%) |
| Accommodation & Food Services | 578 (47.6%) | 635 (52.3%) |
| Public Administration | 477 (55.1%) | 389 (44.9%) |
| Total | 7,687 (46.1%) | 8,983 (53.9%) |
Education in Danville city
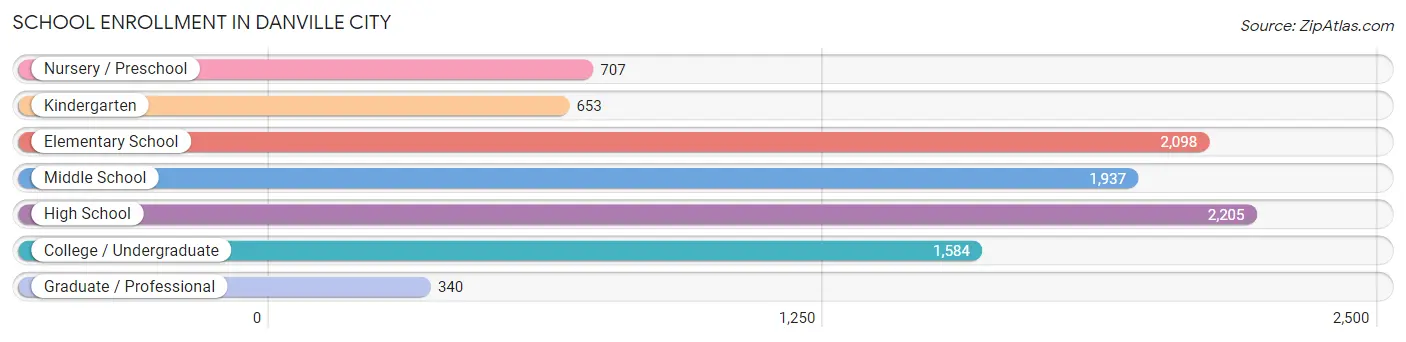
School Enrollment in Danville city
The most common levels of schooling among the 9,524 students in Danville city are high school (2,205 | 23.2%), elementary school (2,098 | 22.0%), and middle school (1,937 | 20.3%).
| School Level | # Students | % Students |
| Nursery / Preschool | 707 | 7.4% |
| Kindergarten | 653 | 6.9% |
| Elementary School | 2,098 | 22.0% |
| Middle School | 1,937 | 20.3% |
| High School | 2,205 | 23.2% |
| College / Undergraduate | 1,584 | 16.6% |
| Graduate / Professional | 340 | 3.6% |
| Total | 9,524 | 100.0% |
School Enrollment by Age by Funding Source in Danville city
Out of a total of 9,524 students who are enrolled in schools in Danville city, 1,581 (16.6%) attend a private institution, while the remaining 7,943 (83.4%) are enrolled in public schools. The age group of 20 to 24 year olds has the highest likelihood of being enrolled in private schools, with 407 (55.4% in the age bracket) enrolled. Conversely, the age group of 5 to 9 year old has the lowest likelihood of being enrolled in a private school, with 2,417 (93.1% in the age bracket) attending a public institution.
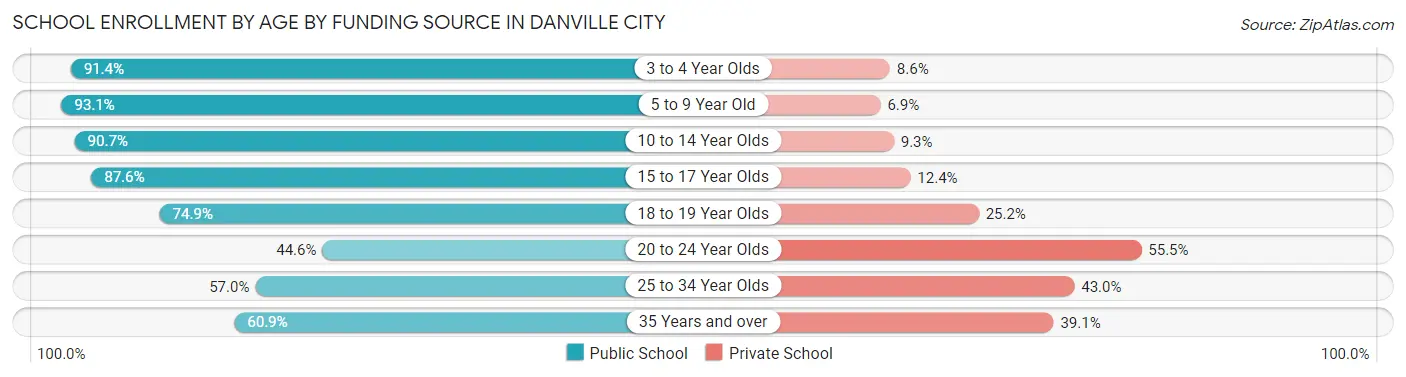
| Age Bracket | Public School | Private School |
| 3 to 4 Year Olds | 584 (91.4%) | 55 (8.6%) |
| 5 to 9 Year Old | 2,417 (93.1%) | 178 (6.9%) |
| 10 to 14 Year Olds | 2,274 (90.7%) | 234 (9.3%) |
| 15 to 17 Year Olds | 1,339 (87.6%) | 190 (12.4%) |
| 18 to 19 Year Olds | 515 (74.9%) | 173 (25.2%) |
| 20 to 24 Year Olds | 327 (44.6%) | 407 (55.4%) |
| 25 to 34 Year Olds | 239 (57.0%) | 180 (43.0%) |
| 35 Years and over | 251 (60.9%) | 161 (39.1%) |
| Total | 7,943 (83.4%) | 1,581 (16.6%) |
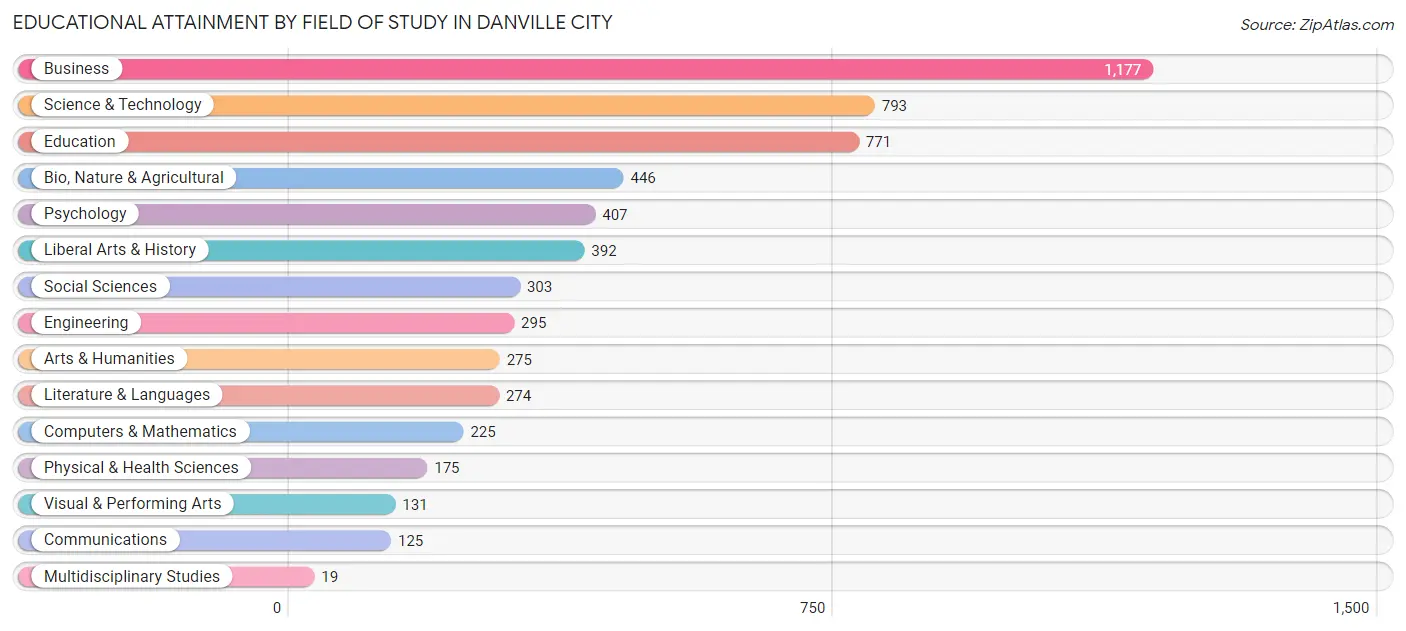
Educational Attainment by Field of Study in Danville city
Business (1,177 | 20.3%), science & technology (793 | 13.7%), education (771 | 13.3%), bio, nature & agricultural (446 | 7.7%), and psychology (407 | 7.0%) are the most common fields of study among 5,808 individuals in Danville city who have obtained a bachelor's degree or higher.
| Field of Study | # Graduates | % Graduates |
| Computers & Mathematics | 225 | 3.9% |
| Bio, Nature & Agricultural | 446 | 7.7% |
| Physical & Health Sciences | 175 | 3.0% |
| Psychology | 407 | 7.0% |
| Social Sciences | 303 | 5.2% |
| Engineering | 295 | 5.1% |
| Multidisciplinary Studies | 19 | 0.3% |
| Science & Technology | 793 | 13.7% |
| Business | 1,177 | 20.3% |
| Education | 771 | 13.3% |
| Literature & Languages | 274 | 4.7% |
| Liberal Arts & History | 392 | 6.8% |
| Visual & Performing Arts | 131 | 2.3% |
| Communications | 125 | 2.1% |
| Arts & Humanities | 275 | 4.7% |
| Total | 5,808 | 100.0% |
Transportation & Commute in Danville city
Vehicle Availability by Sex in Danville city
The most prevalent vehicle ownership categories in Danville city are males with 2 vehicles (2,835, accounting for 37.7%) and females with 2 vehicles (2,264, making up 33.3%).
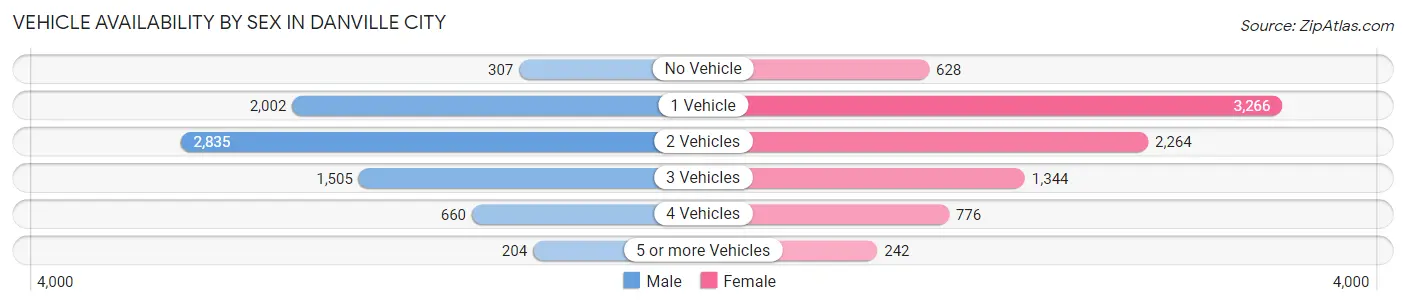
| Vehicles Available | Male | Female |
| No Vehicle | 307 (4.1%) | 628 (7.4%) |
| 1 Vehicle | 2,002 (26.7%) | 3,266 (38.3%) |
| 2 Vehicles | 2,835 (37.7%) | 2,264 (26.6%) |
| 3 Vehicles | 1,505 (20.0%) | 1,344 (15.8%) |
| 4 Vehicles | 660 (8.8%) | 776 (9.1%) |
| 5 or more Vehicles | 204 (2.7%) | 242 (2.8%) |
| Total | 7,513 (100.0%) | 8,520 (100.0%) |
Commute Time in Danville city
The most frequently occuring commute durations in Danville city are 10 to 14 minutes (3,785 commuters, 25.0%), 15 to 19 minutes (3,553 commuters, 23.4%), and 5 to 9 minutes (2,150 commuters, 14.2%).
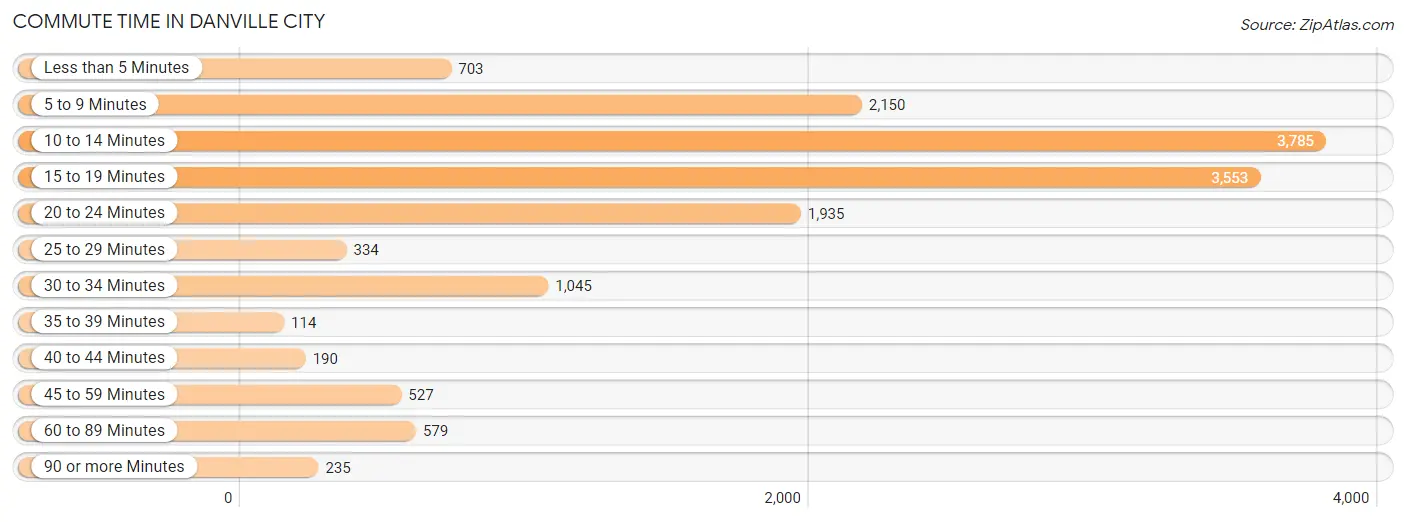
| Commute Time | # Commuters | % Commuters |
| Less than 5 Minutes | 703 | 4.6% |
| 5 to 9 Minutes | 2,150 | 14.2% |
| 10 to 14 Minutes | 3,785 | 25.0% |
| 15 to 19 Minutes | 3,553 | 23.4% |
| 20 to 24 Minutes | 1,935 | 12.8% |
| 25 to 29 Minutes | 334 | 2.2% |
| 30 to 34 Minutes | 1,045 | 6.9% |
| 35 to 39 Minutes | 114 | 0.7% |
| 40 to 44 Minutes | 190 | 1.3% |
| 45 to 59 Minutes | 527 | 3.5% |
| 60 to 89 Minutes | 579 | 3.8% |
| 90 or more Minutes | 235 | 1.5% |
Commute Time by Sex in Danville city
The most common commute times in Danville city are 10 to 14 minutes (1,816 commuters, 25.1%) for males and 10 to 14 minutes (1,969 commuters, 24.9%) for females.
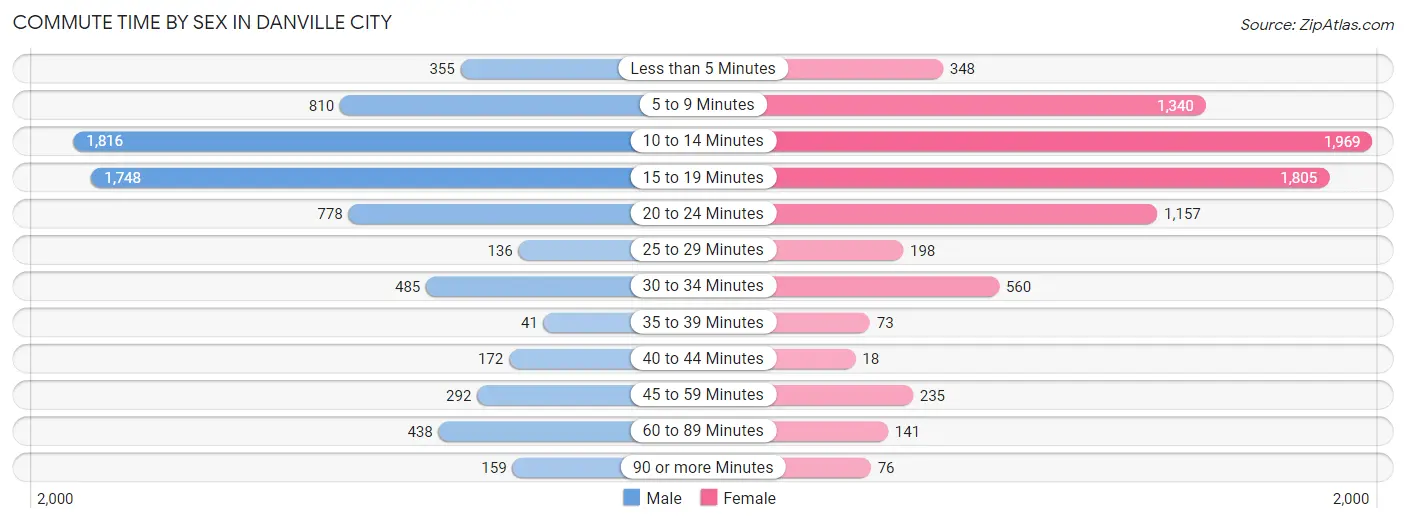
| Commute Time | Male | Female |
| Less than 5 Minutes | 355 (4.9%) | 348 (4.4%) |
| 5 to 9 Minutes | 810 (11.2%) | 1,340 (16.9%) |
| 10 to 14 Minutes | 1,816 (25.1%) | 1,969 (24.9%) |
| 15 to 19 Minutes | 1,748 (24.2%) | 1,805 (22.8%) |
| 20 to 24 Minutes | 778 (10.8%) | 1,157 (14.6%) |
| 25 to 29 Minutes | 136 (1.9%) | 198 (2.5%) |
| 30 to 34 Minutes | 485 (6.7%) | 560 (7.1%) |
| 35 to 39 Minutes | 41 (0.6%) | 73 (0.9%) |
| 40 to 44 Minutes | 172 (2.4%) | 18 (0.2%) |
| 45 to 59 Minutes | 292 (4.0%) | 235 (3.0%) |
| 60 to 89 Minutes | 438 (6.1%) | 141 (1.8%) |
| 90 or more Minutes | 159 (2.2%) | 76 (1.0%) |
Time of Departure to Work by Sex in Danville city
The most frequent times of departure to work in Danville city are 7:00 AM to 7:29 AM (1,213, 16.8%) for males and 8:00 AM to 8:29 AM (1,143, 14.4%) for females.
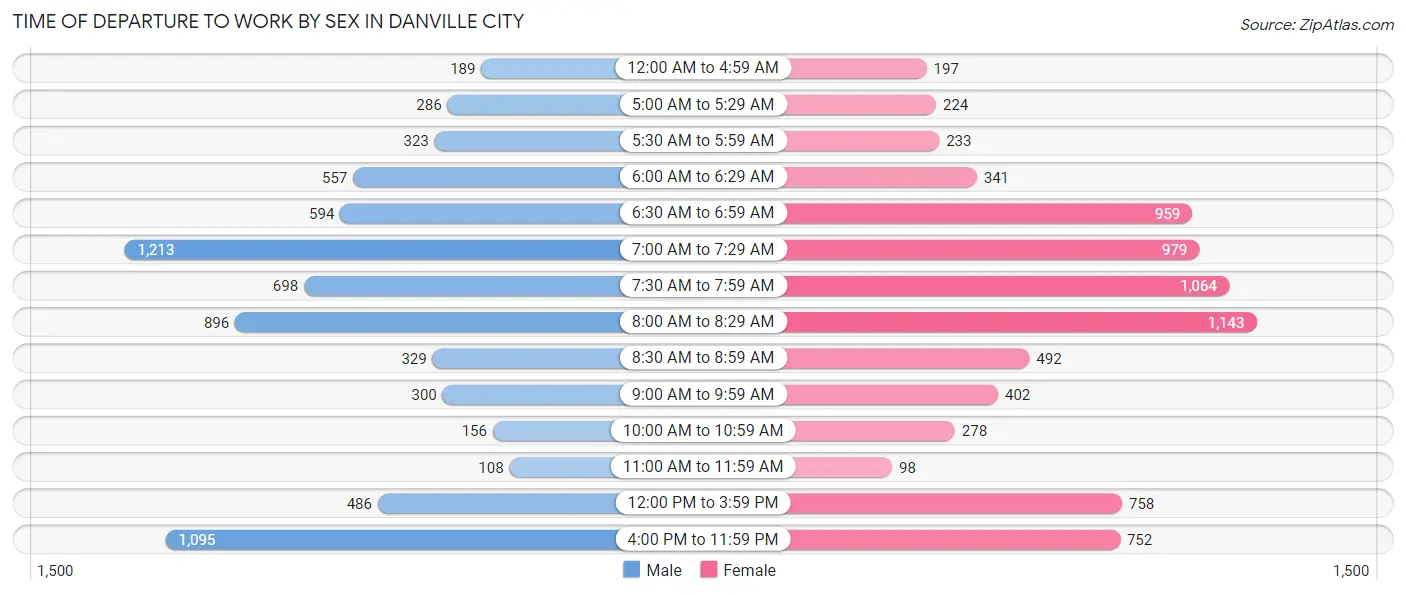
| Time of Departure | Male | Female |
| 12:00 AM to 4:59 AM | 189 (2.6%) | 197 (2.5%) |
| 5:00 AM to 5:29 AM | 286 (4.0%) | 224 (2.8%) |
| 5:30 AM to 5:59 AM | 323 (4.5%) | 233 (2.9%) |
| 6:00 AM to 6:29 AM | 557 (7.7%) | 341 (4.3%) |
| 6:30 AM to 6:59 AM | 594 (8.2%) | 959 (12.1%) |
| 7:00 AM to 7:29 AM | 1,213 (16.8%) | 979 (12.4%) |
| 7:30 AM to 7:59 AM | 698 (9.7%) | 1,064 (13.4%) |
| 8:00 AM to 8:29 AM | 896 (12.4%) | 1,143 (14.4%) |
| 8:30 AM to 8:59 AM | 329 (4.5%) | 492 (6.2%) |
| 9:00 AM to 9:59 AM | 300 (4.2%) | 402 (5.1%) |
| 10:00 AM to 10:59 AM | 156 (2.2%) | 278 (3.5%) |
| 11:00 AM to 11:59 AM | 108 (1.5%) | 98 (1.2%) |
| 12:00 PM to 3:59 PM | 486 (6.7%) | 758 (9.6%) |
| 4:00 PM to 11:59 PM | 1,095 (15.1%) | 752 (9.5%) |
| Total | 7,230 (100.0%) | 7,920 (100.0%) |
Housing Occupancy in Danville city
Occupancy by Ownership in Danville city
Of the total 18,755 dwellings in Danville city, owner-occupied units account for 9,281 (49.5%), while renter-occupied units make up 9,474 (50.5%).
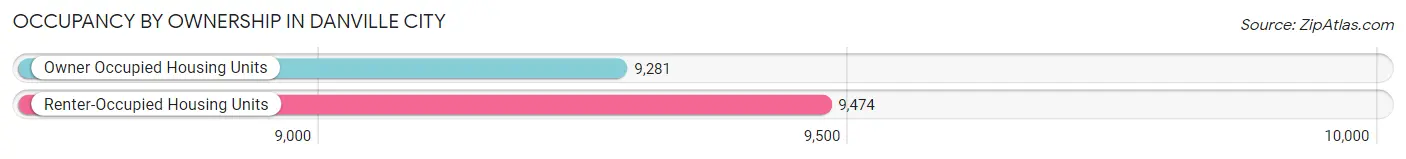
| Occupancy | # Housing Units | % Housing Units |
| Owner Occupied Housing Units | 9,281 | 49.5% |
| Renter-Occupied Housing Units | 9,474 | 50.5% |
| Total Occupied Housing Units | 18,755 | 100.0% |
Occupancy by Household Size in Danville city
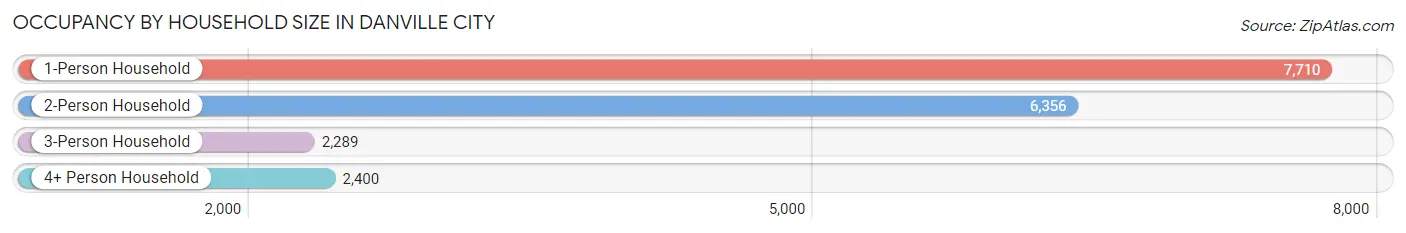
| Household Size | # Housing Units | % Housing Units |
| 1-Person Household | 7,710 | 41.1% |
| 2-Person Household | 6,356 | 33.9% |
| 3-Person Household | 2,289 | 12.2% |
| 4+ Person Household | 2,400 | 12.8% |
| Total Housing Units | 18,755 | 100.0% |
Occupancy by Ownership by Household Size in Danville city
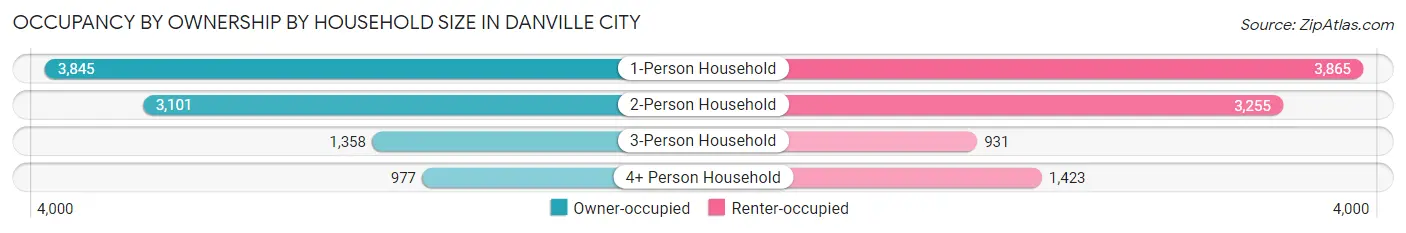
| Household Size | Owner-occupied | Renter-occupied |
| 1-Person Household | 3,845 (49.9%) | 3,865 (50.1%) |
| 2-Person Household | 3,101 (48.8%) | 3,255 (51.2%) |
| 3-Person Household | 1,358 (59.3%) | 931 (40.7%) |
| 4+ Person Household | 977 (40.7%) | 1,423 (59.3%) |
| Total Housing Units | 9,281 (49.5%) | 9,474 (50.5%) |
Occupancy by Educational Attainment in Danville city
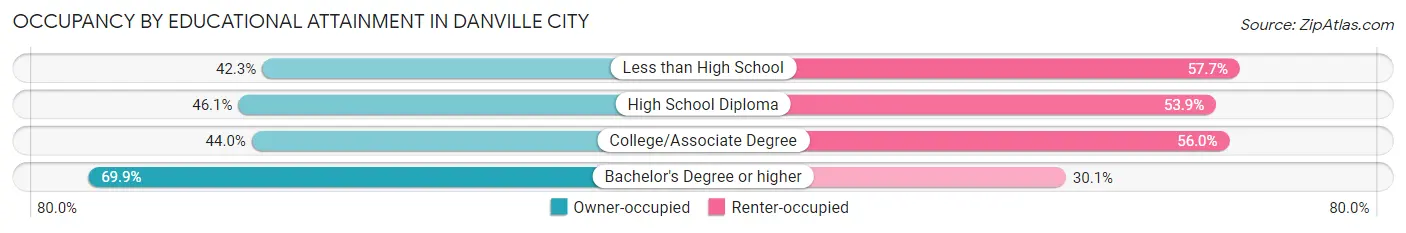
| Household Size | Owner-occupied | Renter-occupied |
| Less than High School | 1,189 (42.3%) | 1,619 (57.7%) |
| High School Diploma | 3,006 (46.1%) | 3,515 (53.9%) |
| College/Associate Degree | 2,553 (44.0%) | 3,250 (56.0%) |
| Bachelor's Degree or higher | 2,533 (69.9%) | 1,090 (30.1%) |
Occupancy by Age of Householder in Danville city
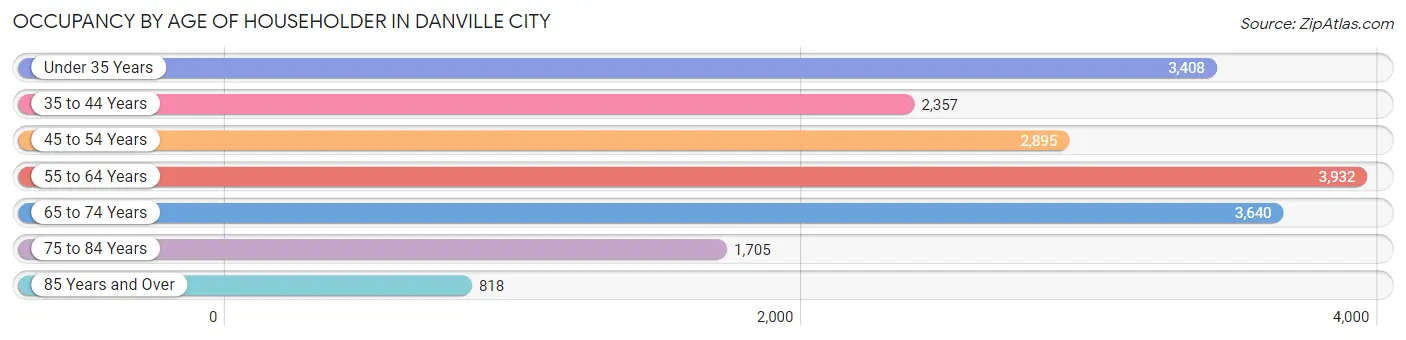
| Age Bracket | # Households | % Households |
| Under 35 Years | 3,408 | 18.2% |
| 35 to 44 Years | 2,357 | 12.6% |
| 45 to 54 Years | 2,895 | 15.4% |
| 55 to 64 Years | 3,932 | 21.0% |
| 65 to 74 Years | 3,640 | 19.4% |
| 75 to 84 Years | 1,705 | 9.1% |
| 85 Years and Over | 818 | 4.4% |
| Total | 18,755 | 100.0% |
Housing Finances in Danville city
Median Income by Occupancy in Danville city
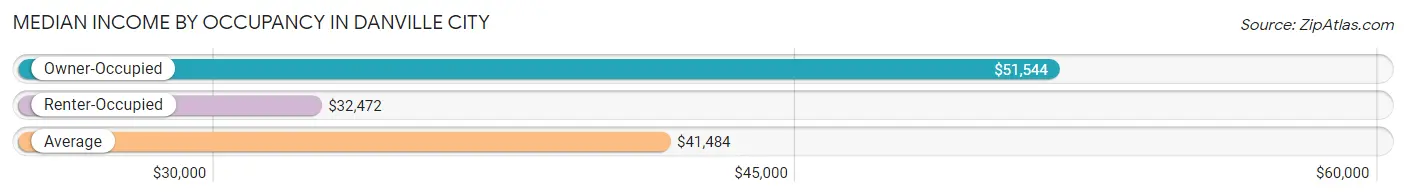
| Occupancy Type | # Households | Median Income |
| Owner-Occupied | 9,281 (49.5%) | $51,544 |
| Renter-Occupied | 9,474 (50.5%) | $32,472 |
| Average | 18,755 (100.0%) | $41,484 |
Occupancy by Householder Income Bracket in Danville city
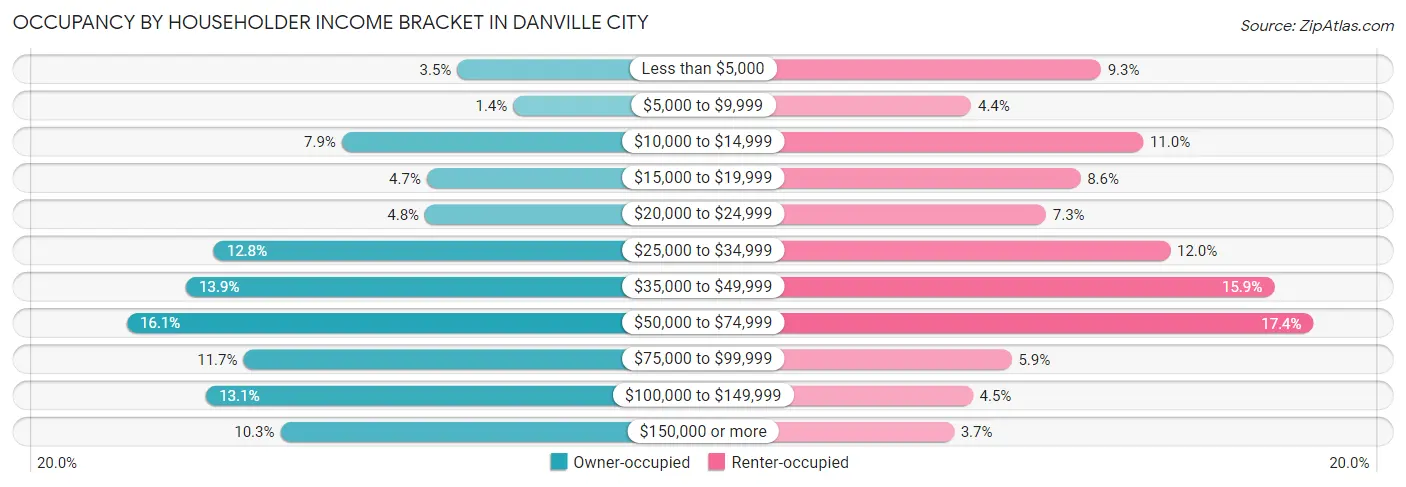
| Income Bracket | Owner-occupied | Renter-occupied |
| Less than $5,000 | 327 (3.5%) | 885 (9.3%) |
| $5,000 to $9,999 | 129 (1.4%) | 417 (4.4%) |
| $10,000 to $14,999 | 735 (7.9%) | 1,037 (11.0%) |
| $15,000 to $19,999 | 434 (4.7%) | 811 (8.6%) |
| $20,000 to $24,999 | 441 (4.8%) | 687 (7.2%) |
| $25,000 to $34,999 | 1,187 (12.8%) | 1,135 (12.0%) |
| $35,000 to $49,999 | 1,285 (13.9%) | 1,510 (15.9%) |
| $50,000 to $74,999 | 1,494 (16.1%) | 1,652 (17.4%) |
| $75,000 to $99,999 | 1,083 (11.7%) | 563 (5.9%) |
| $100,000 to $149,999 | 1,214 (13.1%) | 423 (4.5%) |
| $150,000 or more | 952 (10.3%) | 354 (3.7%) |
| Total | 9,281 (100.0%) | 9,474 (100.0%) |
Monthly Housing Cost Tiers in Danville city
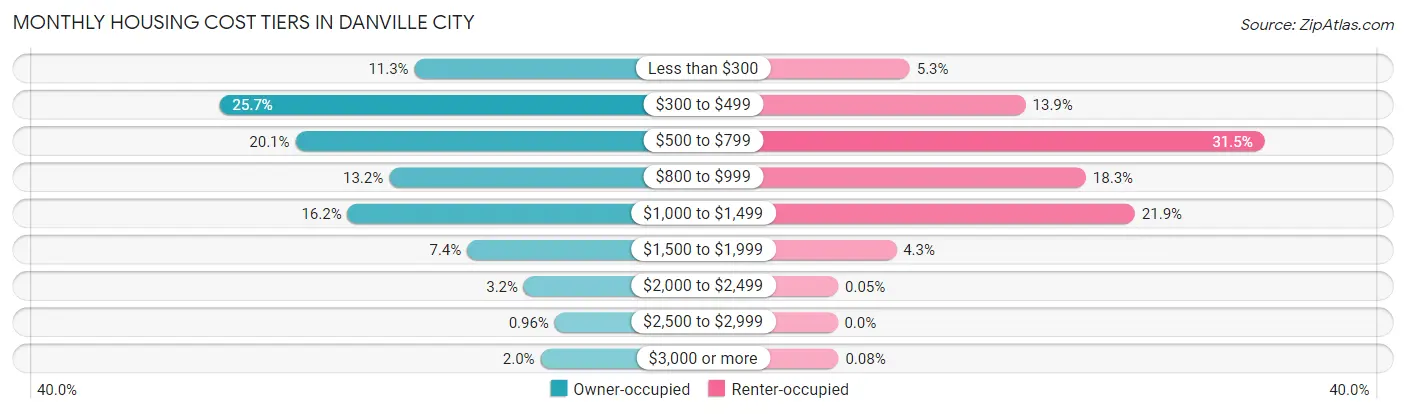
| Monthly Cost | Owner-occupied | Renter-occupied |
| Less than $300 | 1,048 (11.3%) | 505 (5.3%) |
| $300 to $499 | 2,381 (25.7%) | 1,313 (13.9%) |
| $500 to $799 | 1,862 (20.1%) | 2,980 (31.5%) |
| $800 to $999 | 1,221 (13.2%) | 1,734 (18.3%) |
| $1,000 to $1,499 | 1,505 (16.2%) | 2,076 (21.9%) |
| $1,500 to $1,999 | 688 (7.4%) | 410 (4.3%) |
| $2,000 to $2,499 | 300 (3.2%) | 5 (0.1%) |
| $2,500 to $2,999 | 89 (1.0%) | 0 (0.0%) |
| $3,000 or more | 187 (2.0%) | 8 (0.1%) |
| Total | 9,281 (100.0%) | 9,474 (100.0%) |
Physical Housing Characteristics in Danville city
Housing Structures in Danville city
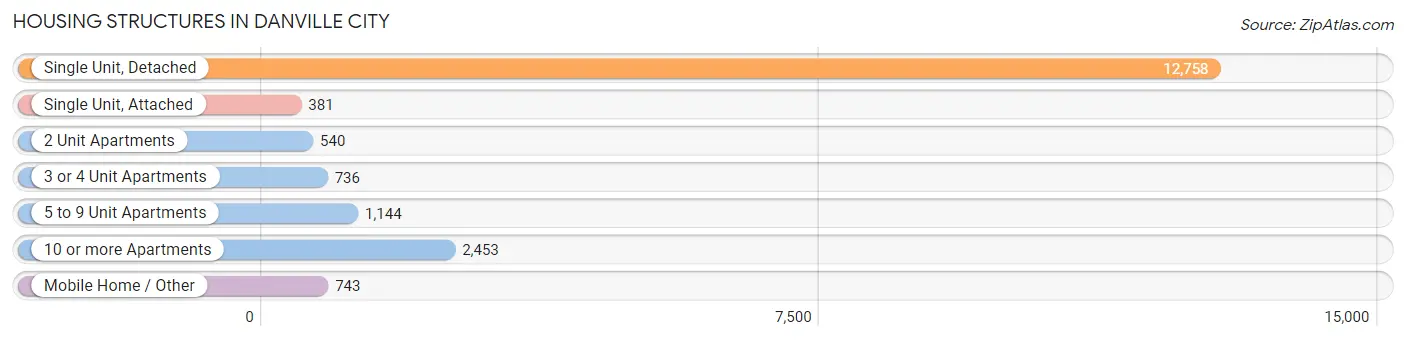
| Structure Type | # Housing Units | % Housing Units |
| Single Unit, Detached | 12,758 | 68.0% |
| Single Unit, Attached | 381 | 2.0% |
| 2 Unit Apartments | 540 | 2.9% |
| 3 or 4 Unit Apartments | 736 | 3.9% |
| 5 to 9 Unit Apartments | 1,144 | 6.1% |
| 10 or more Apartments | 2,453 | 13.1% |
| Mobile Home / Other | 743 | 4.0% |
| Total | 18,755 | 100.0% |
Housing Structures by Occupancy in Danville city
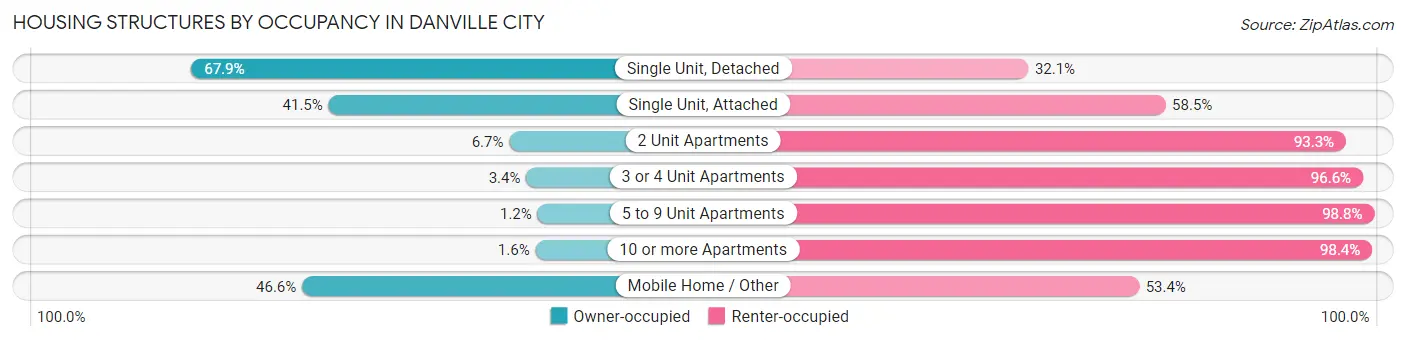
| Structure Type | Owner-occupied | Renter-occupied |
| Single Unit, Detached | 8,662 (67.9%) | 4,096 (32.1%) |
| Single Unit, Attached | 158 (41.5%) | 223 (58.5%) |
| 2 Unit Apartments | 36 (6.7%) | 504 (93.3%) |
| 3 or 4 Unit Apartments | 25 (3.4%) | 711 (96.6%) |
| 5 to 9 Unit Apartments | 14 (1.2%) | 1,130 (98.8%) |
| 10 or more Apartments | 40 (1.6%) | 2,413 (98.4%) |
| Mobile Home / Other | 346 (46.6%) | 397 (53.4%) |
| Total | 9,281 (49.5%) | 9,474 (50.5%) |
Housing Structures by Number of Rooms in Danville city
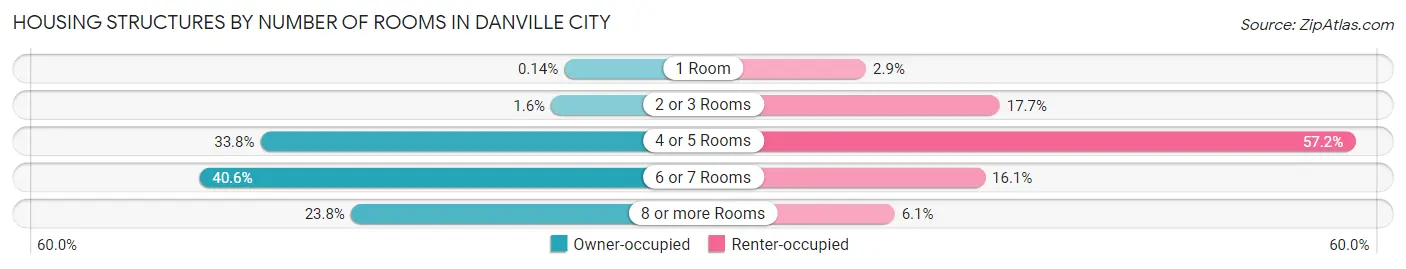
| Number of Rooms | Owner-occupied | Renter-occupied |
| 1 Room | 13 (0.1%) | 276 (2.9%) |
| 2 or 3 Rooms | 148 (1.6%) | 1,681 (17.7%) |
| 4 or 5 Rooms | 3,141 (33.8%) | 5,415 (57.2%) |
| 6 or 7 Rooms | 3,769 (40.6%) | 1,526 (16.1%) |
| 8 or more Rooms | 2,210 (23.8%) | 576 (6.1%) |
| Total | 9,281 (100.0%) | 9,474 (100.0%) |
Housing Structure by Heating Type in Danville city
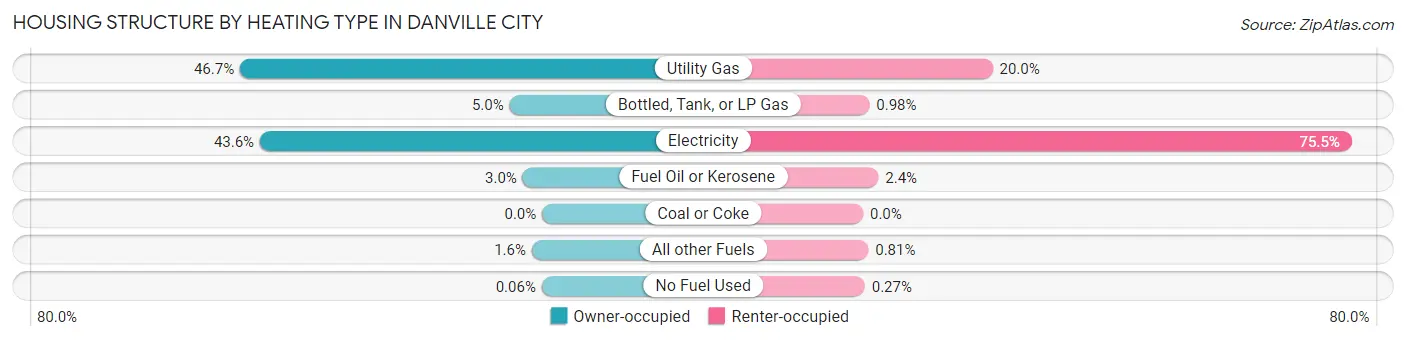
| Heating Type | Owner-occupied | Renter-occupied |
| Utility Gas | 4,334 (46.7%) | 1,897 (20.0%) |
| Bottled, Tank, or LP Gas | 467 (5.0%) | 93 (1.0%) |
| Electricity | 4,048 (43.6%) | 7,156 (75.5%) |
| Fuel Oil or Kerosene | 278 (3.0%) | 225 (2.4%) |
| Coal or Coke | 0 (0.0%) | 0 (0.0%) |
| All other Fuels | 148 (1.6%) | 77 (0.8%) |
| No Fuel Used | 6 (0.1%) | 26 (0.3%) |
| Total | 9,281 (100.0%) | 9,474 (100.0%) |
Household Vehicle Usage in Danville city
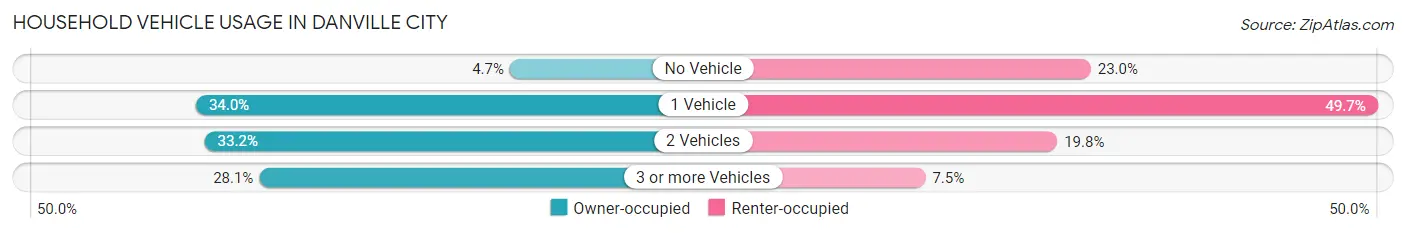
| Vehicles per Household | Owner-occupied | Renter-occupied |
| No Vehicle | 437 (4.7%) | 2,174 (23.0%) |
| 1 Vehicle | 3,156 (34.0%) | 4,710 (49.7%) |
| 2 Vehicles | 3,080 (33.2%) | 1,878 (19.8%) |
| 3 or more Vehicles | 2,608 (28.1%) | 712 (7.5%) |
| Total | 9,281 (100.0%) | 9,474 (100.0%) |
Real Estate & Mortgages in Danville city
Real Estate and Mortgage Overview in Danville city
| Characteristic | Without Mortgage | With Mortgage |
| Housing Units | 4,721 | 4,560 |
| Median Property Value | $89,400 | $120,000 |
| Median Household Income | $42,986 | $548 |
| Monthly Housing Costs | $409 | $179 |
| Real Estate Taxes | $652 | $51 |
Property Value by Mortgage Status in Danville city
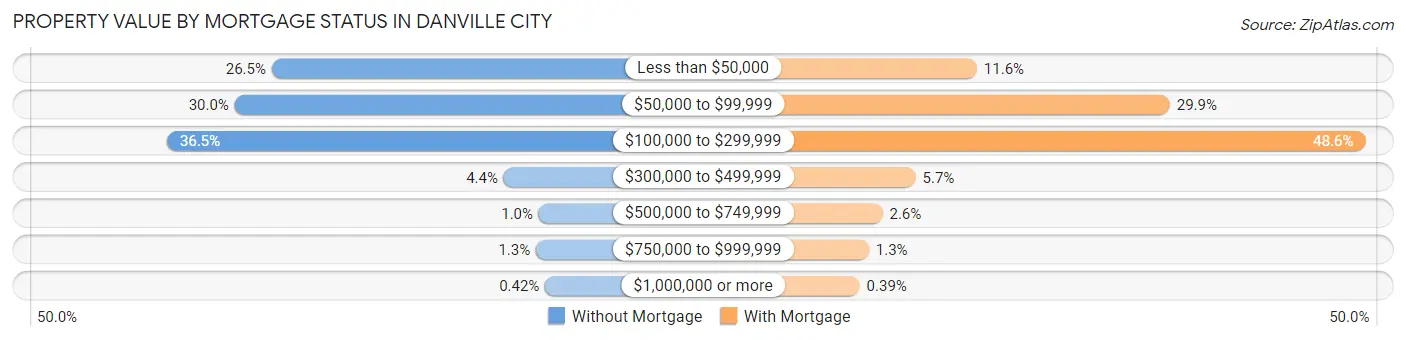
| Property Value | Without Mortgage | With Mortgage |
| Less than $50,000 | 1,249 (26.5%) | 527 (11.6%) |
| $50,000 to $99,999 | 1,416 (30.0%) | 1,365 (29.9%) |
| $100,000 to $299,999 | 1,721 (36.4%) | 2,214 (48.5%) |
| $300,000 to $499,999 | 206 (4.4%) | 261 (5.7%) |
| $500,000 to $749,999 | 48 (1.0%) | 117 (2.6%) |
| $750,000 to $999,999 | 61 (1.3%) | 58 (1.3%) |
| $1,000,000 or more | 20 (0.4%) | 18 (0.4%) |
| Total | 4,721 (100.0%) | 4,560 (100.0%) |
Household Income by Mortgage Status in Danville city
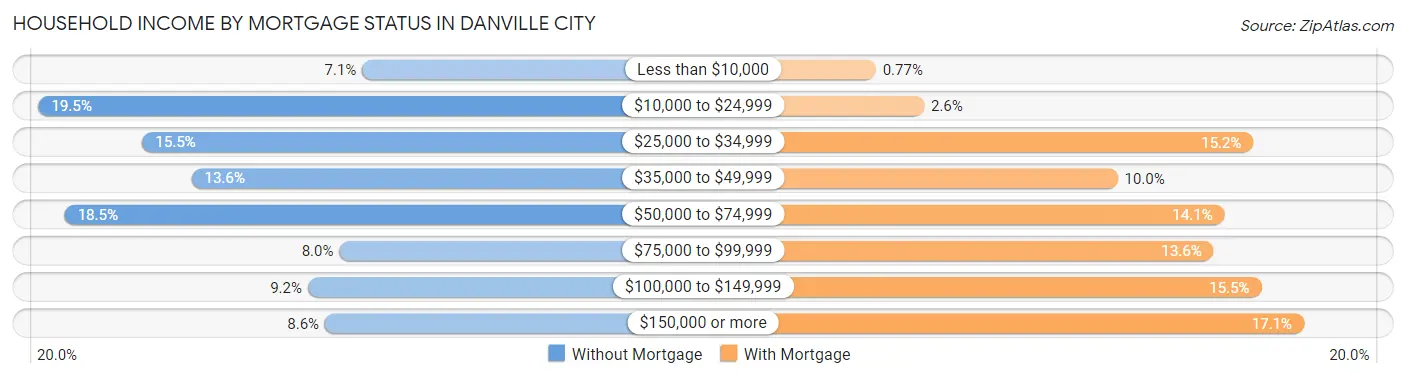
| Household Income | Without Mortgage | With Mortgage |
| Less than $10,000 | 337 (7.1%) | 35 (0.8%) |
| $10,000 to $24,999 | 919 (19.5%) | 119 (2.6%) |
| $25,000 to $34,999 | 732 (15.5%) | 691 (15.1%) |
| $35,000 to $49,999 | 644 (13.6%) | 455 (10.0%) |
| $50,000 to $74,999 | 872 (18.5%) | 641 (14.1%) |
| $75,000 to $99,999 | 378 (8.0%) | 622 (13.6%) |
| $100,000 to $149,999 | 435 (9.2%) | 705 (15.5%) |
| $150,000 or more | 404 (8.6%) | 779 (17.1%) |
| Total | 4,721 (100.0%) | 4,560 (100.0%) |
Property Value to Household Income Ratio in Danville city
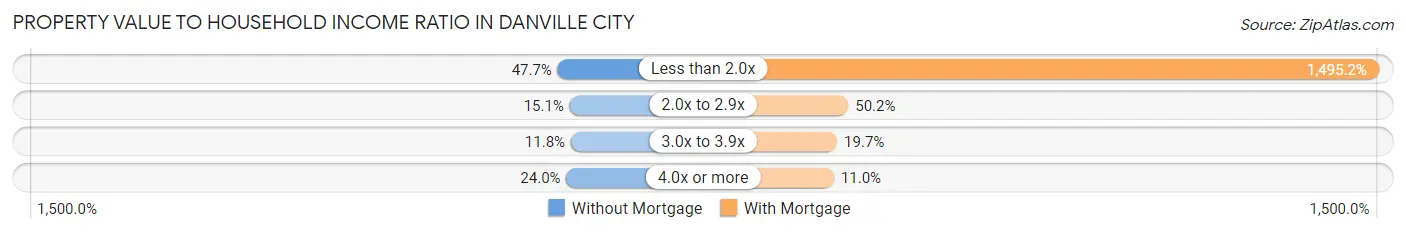
| Value-to-Income Ratio | Without Mortgage | With Mortgage |
| Less than 2.0x | 2,254 (47.7%) | 68,182 (1,495.2%) |
| 2.0x to 2.9x | 713 (15.1%) | 2,287 (50.1%) |
| 3.0x to 3.9x | 555 (11.8%) | 898 (19.7%) |
| 4.0x or more | 1,133 (24.0%) | 502 (11.0%) |
| Total | 4,721 (100.0%) | 4,560 (100.0%) |
Real Estate Taxes by Mortgage Status in Danville city
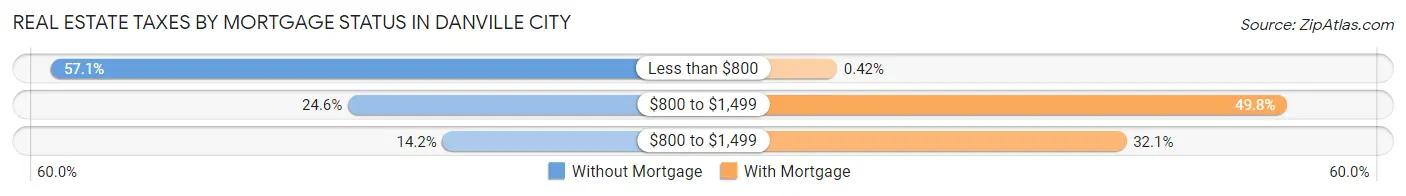
| Property Taxes | Without Mortgage | With Mortgage |
| Less than $800 | 2,696 (57.1%) | 19 (0.4%) |
| $800 to $1,499 | 1,159 (24.5%) | 2,270 (49.8%) |
| $800 to $1,499 | 670 (14.2%) | 1,465 (32.1%) |
| Total | 4,721 (100.0%) | 4,560 (100.0%) |
Health & Disability in Danville city
Health Insurance Coverage by Age in Danville city
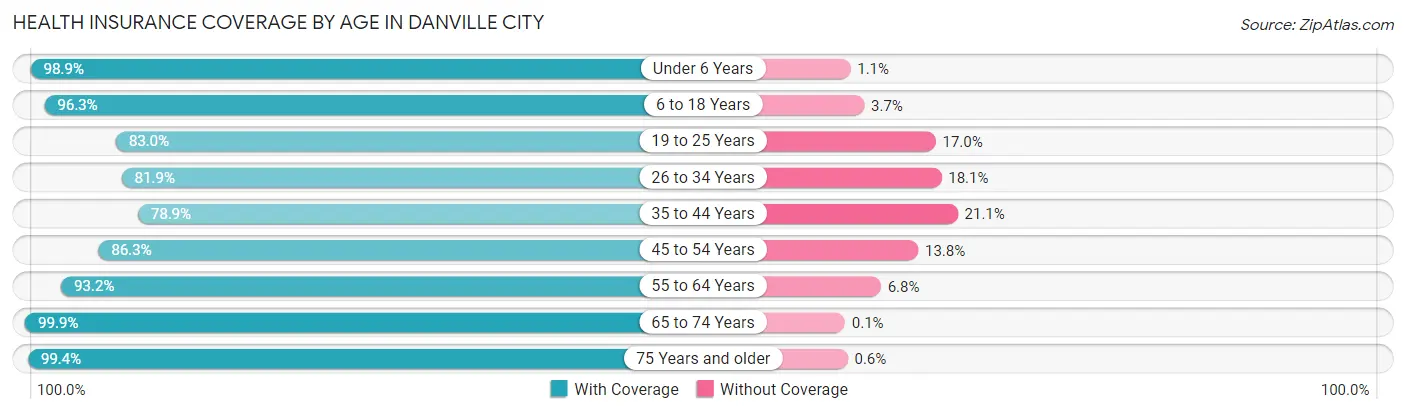
| Age Bracket | With Coverage | Without Coverage |
| Under 6 Years | 2,992 (98.9%) | 34 (1.1%) |
| 6 to 18 Years | 6,499 (96.3%) | 249 (3.7%) |
| 19 to 25 Years | 2,990 (83.0%) | 613 (17.0%) |
| 26 to 34 Years | 4,001 (81.9%) | 883 (18.1%) |
| 35 to 44 Years | 3,420 (78.9%) | 916 (21.1%) |
| 45 to 54 Years | 4,013 (86.3%) | 640 (13.8%) |
| 55 to 64 Years | 5,381 (93.2%) | 392 (6.8%) |
| 65 to 74 Years | 4,972 (99.9%) | 5 (0.1%) |
| 75 Years and older | 3,295 (99.4%) | 20 (0.6%) |
| Total | 37,563 (90.9%) | 3,752 (9.1%) |
Health Insurance Coverage by Citizenship Status in Danville city
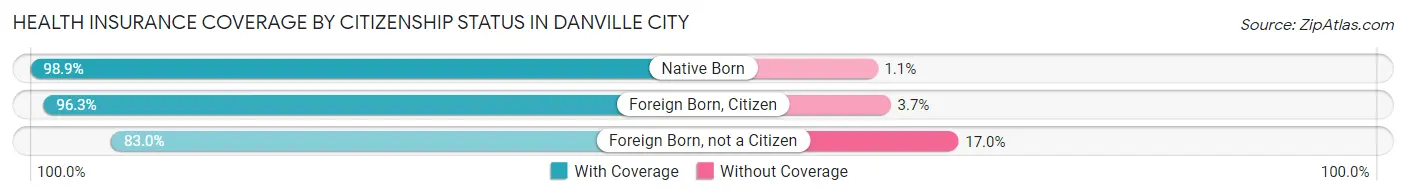
| Citizenship Status | With Coverage | Without Coverage |
| Native Born | 2,992 (98.9%) | 34 (1.1%) |
| Foreign Born, Citizen | 6,499 (96.3%) | 249 (3.7%) |
| Foreign Born, not a Citizen | 2,990 (83.0%) | 613 (17.0%) |
Health Insurance Coverage by Household Income in Danville city
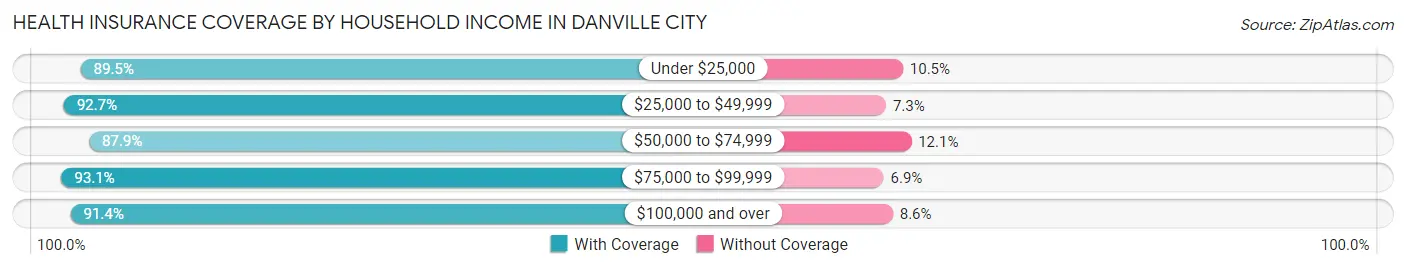
| Household Income | With Coverage | Without Coverage |
| Under $25,000 | 9,397 (89.5%) | 1,103 (10.5%) |
| $25,000 to $49,999 | 9,982 (92.7%) | 791 (7.3%) |
| $50,000 to $74,999 | 5,930 (87.9%) | 814 (12.1%) |
| $75,000 to $99,999 | 4,251 (93.1%) | 315 (6.9%) |
| $100,000 and over | 7,542 (91.4%) | 711 (8.6%) |
Public vs Private Health Insurance Coverage by Age in Danville city
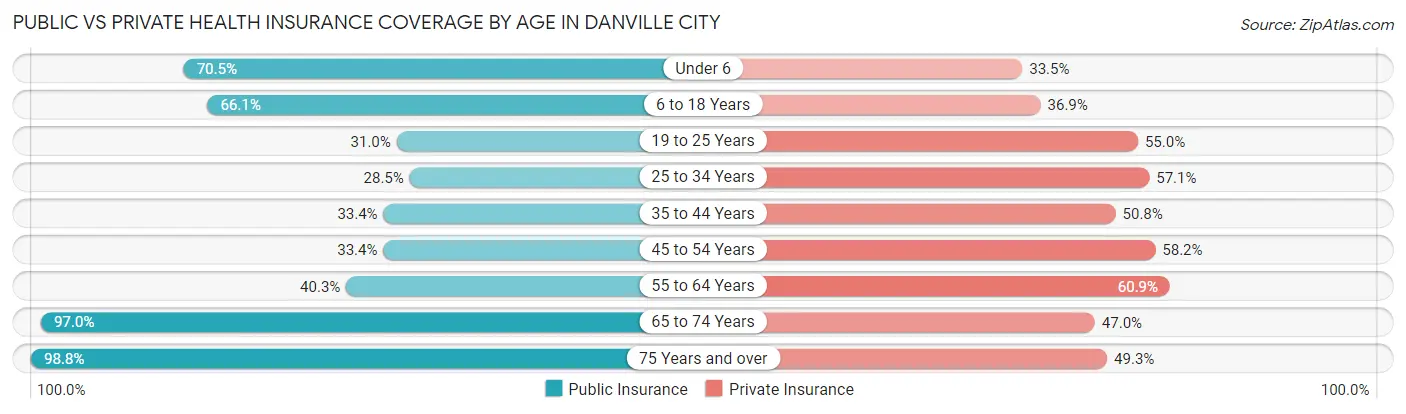
| Age Bracket | Public Insurance | Private Insurance |
| Under 6 | 2,132 (70.5%) | 1,014 (33.5%) |
| 6 to 18 Years | 4,457 (66.0%) | 2,490 (36.9%) |
| 19 to 25 Years | 1,115 (30.9%) | 1,981 (55.0%) |
| 25 to 34 Years | 1,394 (28.5%) | 2,788 (57.1%) |
| 35 to 44 Years | 1,448 (33.4%) | 2,204 (50.8%) |
| 45 to 54 Years | 1,555 (33.4%) | 2,708 (58.2%) |
| 55 to 64 Years | 2,327 (40.3%) | 3,515 (60.9%) |
| 65 to 74 Years | 4,825 (97.0%) | 2,338 (47.0%) |
| 75 Years and over | 3,275 (98.8%) | 1,633 (49.3%) |
| Total | 22,528 (54.5%) | 20,671 (50.0%) |
Disability Status by Sex by Age in Danville city
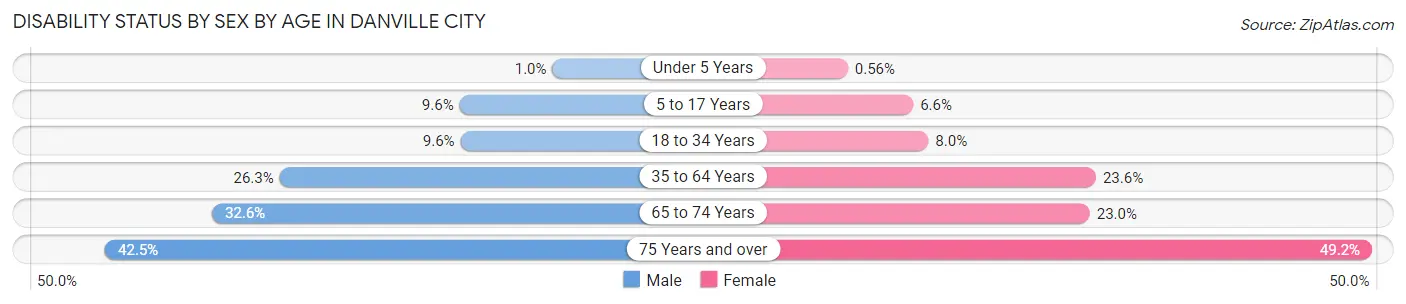
| Age Bracket | Male | Female |
| Under 5 Years | 12 (1.0%) | 7 (0.6%) |
| 5 to 17 Years | 339 (9.6%) | 225 (6.6%) |
| 18 to 34 Years | 408 (9.6%) | 375 (8.0%) |
| 35 to 64 Years | 1,735 (26.3%) | 1,929 (23.6%) |
| 65 to 74 Years | 688 (32.6%) | 660 (23.0%) |
| 75 Years and over | 479 (42.5%) | 1,077 (49.2%) |
Disability Class by Sex by Age in Danville city
Disability Class: Hearing Difficulty
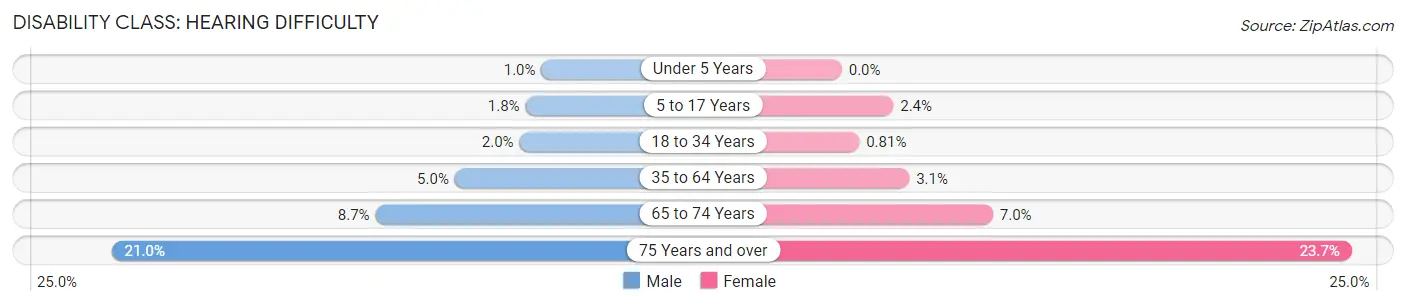
| Age Bracket | Male | Female |
| Under 5 Years | 12 (1.0%) | 0 (0.0%) |
| 5 to 17 Years | 62 (1.8%) | 81 (2.4%) |
| 18 to 34 Years | 87 (2.0%) | 38 (0.8%) |
| 35 to 64 Years | 332 (5.0%) | 256 (3.1%) |
| 65 to 74 Years | 184 (8.7%) | 201 (7.0%) |
| 75 Years and over | 236 (21.0%) | 518 (23.7%) |
Disability Class: Vision Difficulty
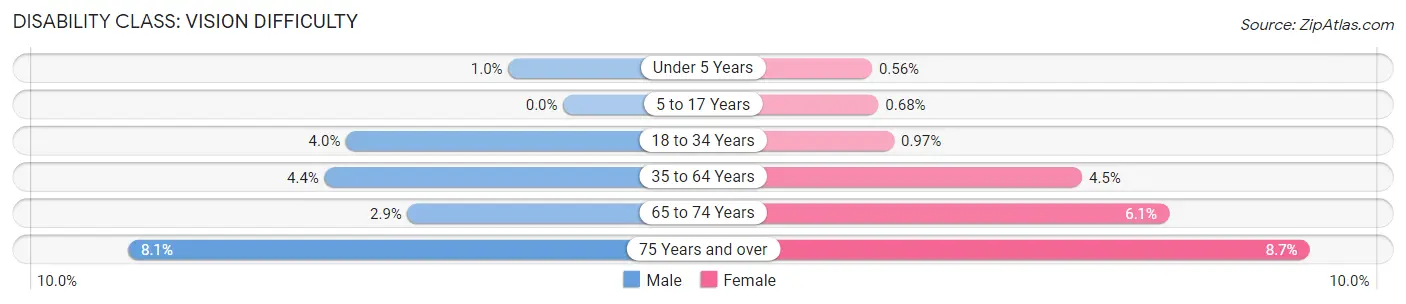
| Age Bracket | Male | Female |
| Under 5 Years | 12 (1.0%) | 7 (0.6%) |
| 5 to 17 Years | 0 (0.0%) | 23 (0.7%) |
| 18 to 34 Years | 172 (4.0%) | 45 (1.0%) |
| 35 to 64 Years | 292 (4.4%) | 365 (4.5%) |
| 65 to 74 Years | 61 (2.9%) | 174 (6.1%) |
| 75 Years and over | 91 (8.1%) | 190 (8.7%) |
Disability Class: Cognitive Difficulty
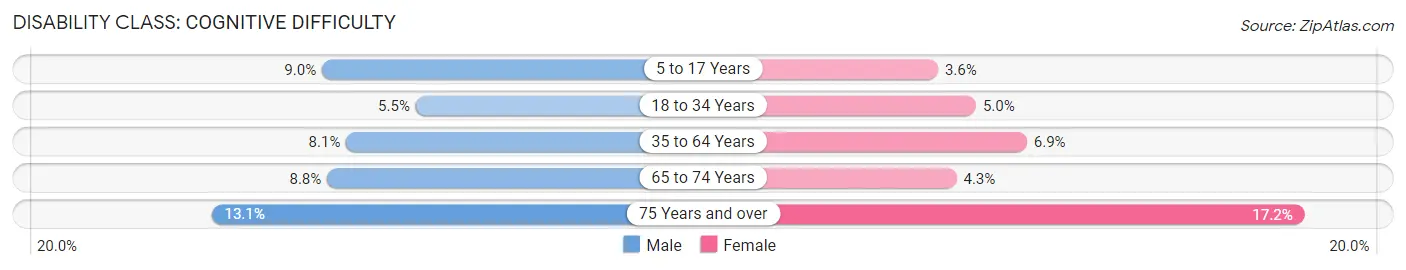
| Age Bracket | Male | Female |
| 5 to 17 Years | 315 (9.0%) | 121 (3.6%) |
| 18 to 34 Years | 234 (5.5%) | 232 (5.0%) |
| 35 to 64 Years | 531 (8.1%) | 562 (6.9%) |
| 65 to 74 Years | 185 (8.8%) | 122 (4.3%) |
| 75 Years and over | 147 (13.1%) | 376 (17.2%) |
Disability Class: Ambulatory Difficulty
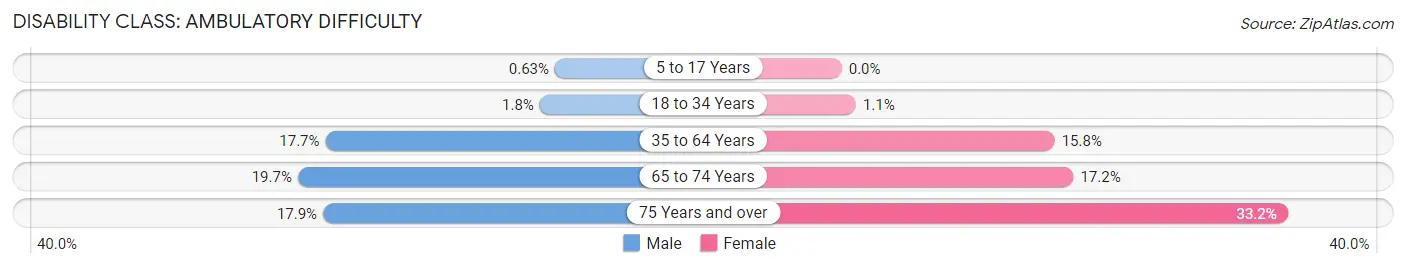
| Age Bracket | Male | Female |
| 5 to 17 Years | 22 (0.6%) | 0 (0.0%) |
| 18 to 34 Years | 75 (1.8%) | 49 (1.1%) |
| 35 to 64 Years | 1,164 (17.7%) | 1,293 (15.8%) |
| 65 to 74 Years | 416 (19.7%) | 493 (17.2%) |
| 75 Years and over | 201 (17.8%) | 726 (33.2%) |
Disability Class: Self-Care Difficulty
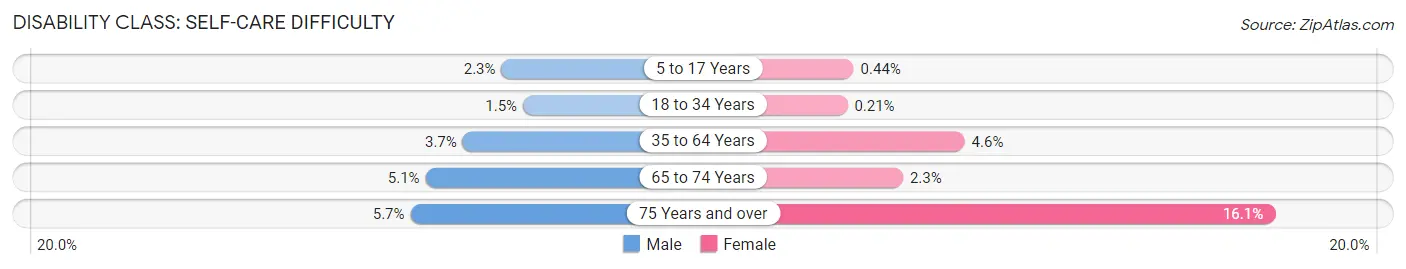
| Age Bracket | Male | Female |
| 5 to 17 Years | 81 (2.3%) | 15 (0.4%) |
| 18 to 34 Years | 64 (1.5%) | 10 (0.2%) |
| 35 to 64 Years | 246 (3.7%) | 373 (4.6%) |
| 65 to 74 Years | 108 (5.1%) | 65 (2.3%) |
| 75 Years and over | 64 (5.7%) | 352 (16.1%) |
Technology Access in Danville city
Computing Device Access in Danville city
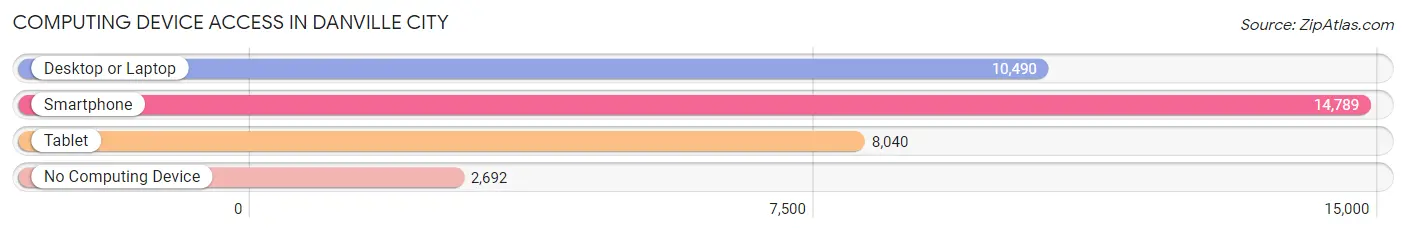
| Device Type | # Households | % Households |
| Desktop or Laptop | 10,490 | 55.9% |
| Smartphone | 14,789 | 78.8% |
| Tablet | 8,040 | 42.9% |
| No Computing Device | 2,692 | 14.3% |
| Total | 18,755 | 100.0% |
Internet Access in Danville city
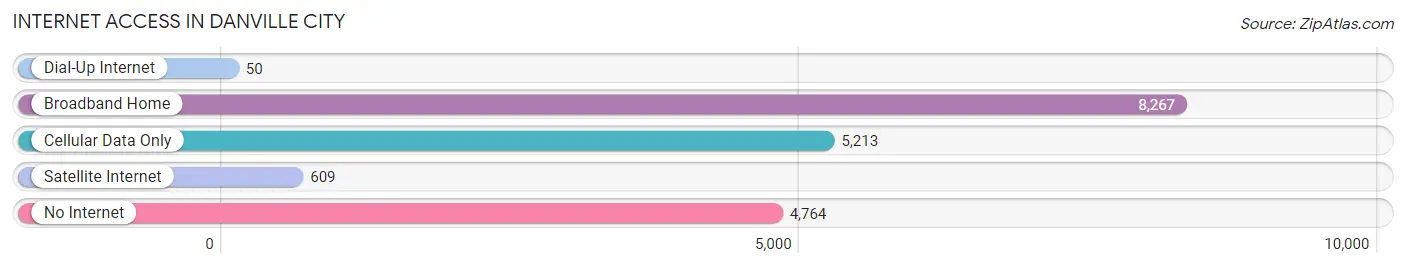
| Internet Type | # Households | % Households |
| Dial-Up Internet | 50 | 0.3% |
| Broadband Home | 8,267 | 44.1% |
| Cellular Data Only | 5,213 | 27.8% |
| Satellite Internet | 609 | 3.3% |
| No Internet | 4,764 | 25.4% |
| Total | 18,755 | 100.0% |
Danville city Summary
Danville City, VA is a city located in the south-central part of the Commonwealth of Virginia. It is the county seat of Pittsylvania County and is situated along the Dan River. The city has a population of 43,055 as of the 2019 census, making it the fifth-largest city in the state.
History
The area that is now Danville City was first settled in 1793 by William Lynch, who established a ferry service across the Dan River. The town was officially established in 1793 and was named after Daniel Lynch, the son of William Lynch. The town was incorporated in 1833 and was designated as the county seat of Pittsylvania County.
In the 19th century, Danville City was a major center for tobacco production and processing. The city was also a major hub for the railroad industry, with several major railroads running through the city. During the Civil War, the city was the site of several battles, including the Battle of Danville in 1864.
Geography
Danville City is located in the south-central part of the Commonwealth of Virginia. It is situated along the Dan River, which forms the border between Pittsylvania County and Halifax County. The city is located approximately 70 miles south of Richmond and 100 miles north of Raleigh, North Carolina.
The city has a total area of 16.3 square miles, of which 16.2 square miles is land and 0.1 square miles is water. The city is located in the Piedmont region of Virginia, which is characterized by rolling hills and valleys.
Economy
Danville City has a diversified economy, with a mix of manufacturing, retail, and service industries. The city is home to several major employers, including Dan River Mills, a textile manufacturer; Danville Regional Medical Center, a hospital; and Goodyear Tire & Rubber Company, a tire manufacturer.
The city is also home to several educational institutions, including Danville Community College, Averett University, and the Institute for Advanced Learning and Research.
Demographics
As of the 2019 census, Danville City had a population of 43,055. The racial makeup of the city was 57.2% White, 37.3% African American, 0.5% Native American, 1.2% Asian, 0.1% Pacific Islander, 1.7% from other races, and 2.1% from two or more races. Hispanic or Latino of any race were 4.2% of the population.
The median household income in Danville City was $37,845, and the median family income was $45,945. The per capita income for the city was $20,945. About 17.2% of the population was below the poverty line.
Danville City is served by the Danville City Public Schools system, which consists of seven elementary schools, two middle schools, and one high school. The city is also home to several private schools, including Danville Christian Academy and Danville Montessori School.
Common Questions
What is Per Capita Income in Danville city?
Per Capita income in Danville city is $26,453.
What is the Median Family Income in Danville city?
Median Family Income in Danville city is $54,521.
What is the Median Household income in Danville city?
Median Household Income in Danville city is $41,484.
What is Income or Wage Gap in Danville city?
Income or Wage Gap in Danville city is 34.0%.
Women in Danville city earn 66.0 cents for every dollar earned by a man.
What is Family Income Deficit in Danville city?
Family Income Deficit in Danville city is $10,147.
Families that are below poverty line in Danville city earn $10,147 less on average than the poverty threshold level.
What is Inequality or Gini Index in Danville city?
Inequality or Gini Index in Danville city is 0.49.
What is the Total Population of Danville city?
Total Population of Danville city is 42,507.
What is the Total Male Population of Danville city?
Total Male Population of Danville city is 19,496.
What is the Total Female Population of Danville city?
Total Female Population of Danville city is 23,011.
What is the Ratio of Males per 100 Females in Danville city?
There are 84.72 Males per 100 Females in Danville city.
What is the Ratio of Females per 100 Males in Danville city?
There are 118.03 Females per 100 Males in Danville city.
What is the Median Population Age in Danville city?
Median Population Age in Danville city is 41.0 Years.
What is the Average Family Size in Danville city
Average Family Size in Danville city is 3.0 People.
What is the Average Household Size in Danville city
Average Household Size in Danville city is 2.2 People.
How Large is the Labor Force in Danville city?
There are 17,754 People in the Labor Forcein in Danville city.
What is the Percentage of People in the Labor Force in Danville city?
51.9% of People are in the Labor Force in Danville city.
What is the Unemployment Rate in Danville city?
Unemployment Rate in Danville city is 5.8%.