Cumberland County, VA Map & Demographics
Cumberland County Map
Cumberland County Overview
$38,099
PER CAPITA INCOME
$68,063
AVG FAMILY INCOME
$56,497
AVG HOUSEHOLD INCOME
3.0%
WAGE / INCOME GAP [ % ]
97.0¢/ $1
WAGE / INCOME GAP [ $ ]
$8,236
FAMILY INCOME DEFICIT
0.50
INEQUALITY / GINI INDEX
9,697
TOTAL POPULATION
4,887
MALE POPULATION
4,810
FEMALE POPULATION
101.60
MALES / 100 FEMALES
98.42
FEMALES / 100 MALES
46.3
MEDIAN AGE
2.8
AVG FAMILY SIZE
2.4
AVG HOUSEHOLD SIZE
5,233
LABOR FORCE [ PEOPLE ]
64.3%
PERCENT IN LABOR FORCE
3.2%
UNEMPLOYMENT RATE
Cumberland County Area Codes
Income in Cumberland County
Income Overview in Cumberland County
Per Capita Income in Cumberland County is $38,099, while median incomes of families and households are $68,063 and $56,497 respectively.
| Characteristic | Number | Measure |
| Per Capita Income | 9,697 | $38,099 |
| Median Family Income | 2,861 | $68,063 |
| Mean Family Income | 2,861 | $109,371 |
| Median Household Income | 4,055 | $56,497 |
| Mean Household Income | 4,055 | $91,502 |
| Income Deficit | 2,861 | $8,236 |
| Wage / Income Gap (%) | 9,697 | 2.99% |
| Wage / Income Gap ($) | 9,697 | 97.01¢ per $1 |
| Gini / Inequality Index | 9,697 | 0.50 |
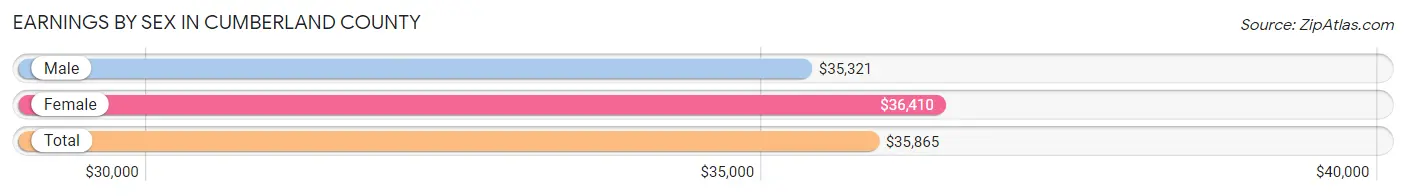
Earnings by Sex in Cumberland County
Average Earnings in Cumberland County are $35,865, $35,321 for men and $36,410 for women, a difference of 3.0%.
| Sex | Number | Average Earnings |
| Male | 2,736 (50.7%) | $35,321 |
| Female | 2,660 (49.3%) | $36,410 |
| Total | 5,396 (100.0%) | $35,865 |
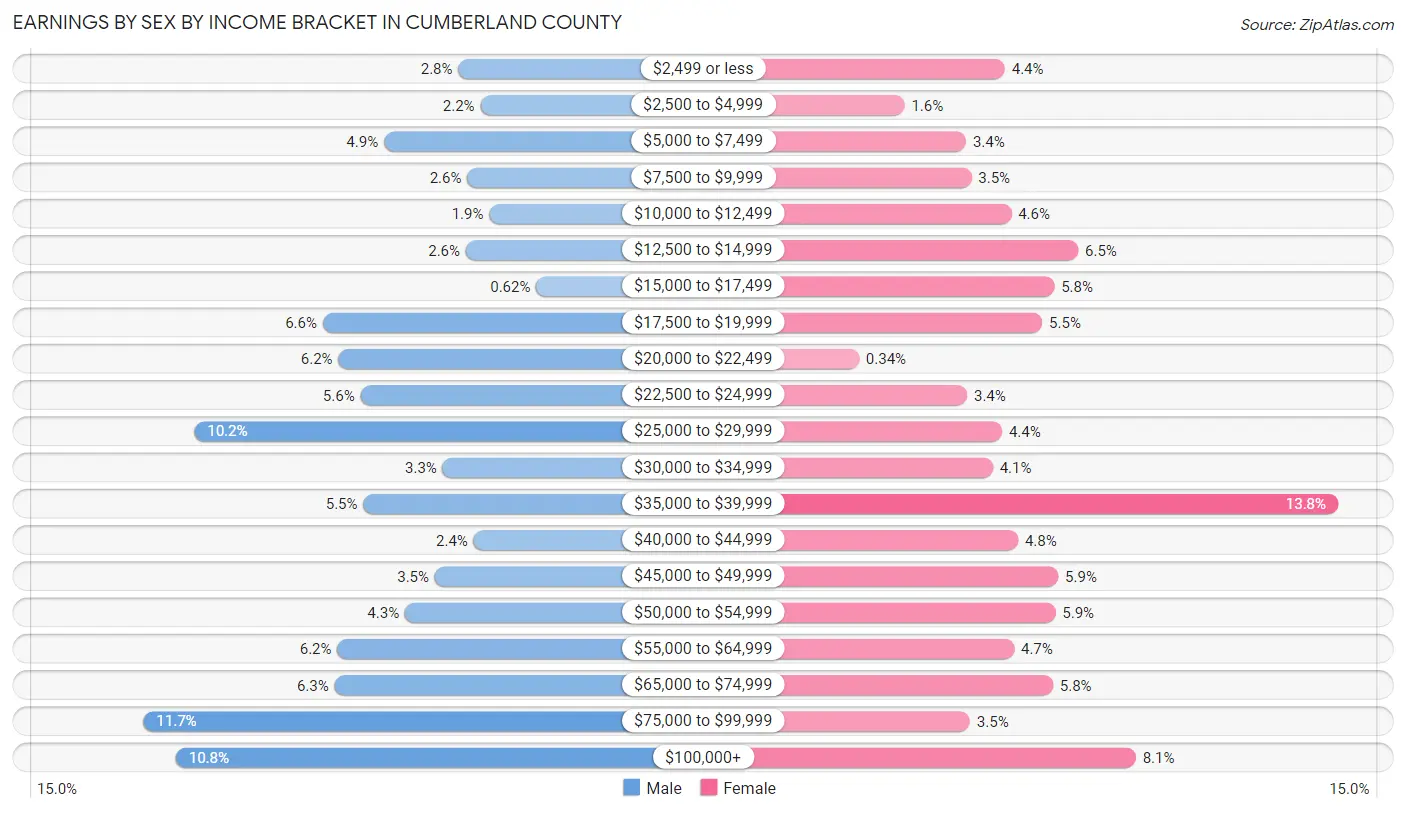
Earnings by Sex by Income Bracket in Cumberland County
The most common earnings brackets in Cumberland County are $75,000 to $99,999 for men (319 | 11.7%) and $35,000 to $39,999 for women (367 | 13.8%).
| Income | Male | Female |
| $2,499 or less | 77 (2.8%) | 118 (4.4%) |
| $2,500 to $4,999 | 60 (2.2%) | 43 (1.6%) |
| $5,000 to $7,499 | 134 (4.9%) | 89 (3.4%) |
| $7,500 to $9,999 | 70 (2.6%) | 93 (3.5%) |
| $10,000 to $12,499 | 53 (1.9%) | 123 (4.6%) |
| $12,500 to $14,999 | 71 (2.6%) | 173 (6.5%) |
| $15,000 to $17,499 | 17 (0.6%) | 155 (5.8%) |
| $17,500 to $19,999 | 181 (6.6%) | 146 (5.5%) |
| $20,000 to $22,499 | 169 (6.2%) | 9 (0.3%) |
| $22,500 to $24,999 | 152 (5.6%) | 90 (3.4%) |
| $25,000 to $29,999 | 280 (10.2%) | 116 (4.4%) |
| $30,000 to $34,999 | 89 (3.3%) | 109 (4.1%) |
| $35,000 to $39,999 | 150 (5.5%) | 367 (13.8%) |
| $40,000 to $44,999 | 65 (2.4%) | 128 (4.8%) |
| $45,000 to $49,999 | 95 (3.5%) | 158 (5.9%) |
| $50,000 to $54,999 | 118 (4.3%) | 156 (5.9%) |
| $55,000 to $64,999 | 170 (6.2%) | 125 (4.7%) |
| $65,000 to $74,999 | 172 (6.3%) | 154 (5.8%) |
| $75,000 to $99,999 | 319 (11.7%) | 92 (3.5%) |
| $100,000+ | 294 (10.7%) | 216 (8.1%) |
| Total | 2,736 (100.0%) | 2,660 (100.0%) |
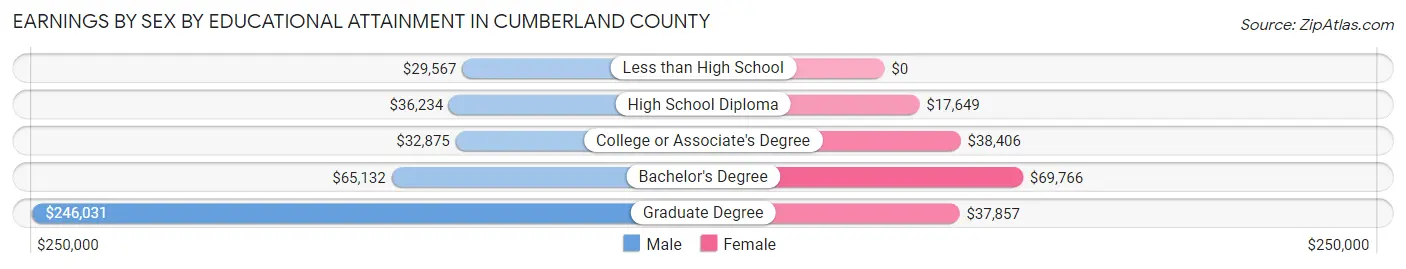
Earnings by Sex by Educational Attainment in Cumberland County
Average earnings in Cumberland County are $37,429 for men and $37,565 for women, a difference of 0.4%. Men with an educational attainment of graduate degree enjoy the highest average annual earnings of $246,031, while those with less than high school education earn the least with $29,567. Women with an educational attainment of bachelor's degree earn the most with the average annual earnings of $69,766, while those with high school diploma education have the smallest earnings of $17,649.
| Educational Attainment | Male Income | Female Income |
| Less than High School | $29,567 | $0 |
| High School Diploma | $36,234 | $17,649 |
| College or Associate's Degree | $32,875 | $38,406 |
| Bachelor's Degree | $65,132 | $69,766 |
| Graduate Degree | $246,031 | $37,857 |
| Total | $37,429 | $37,565 |
Family Income in Cumberland County
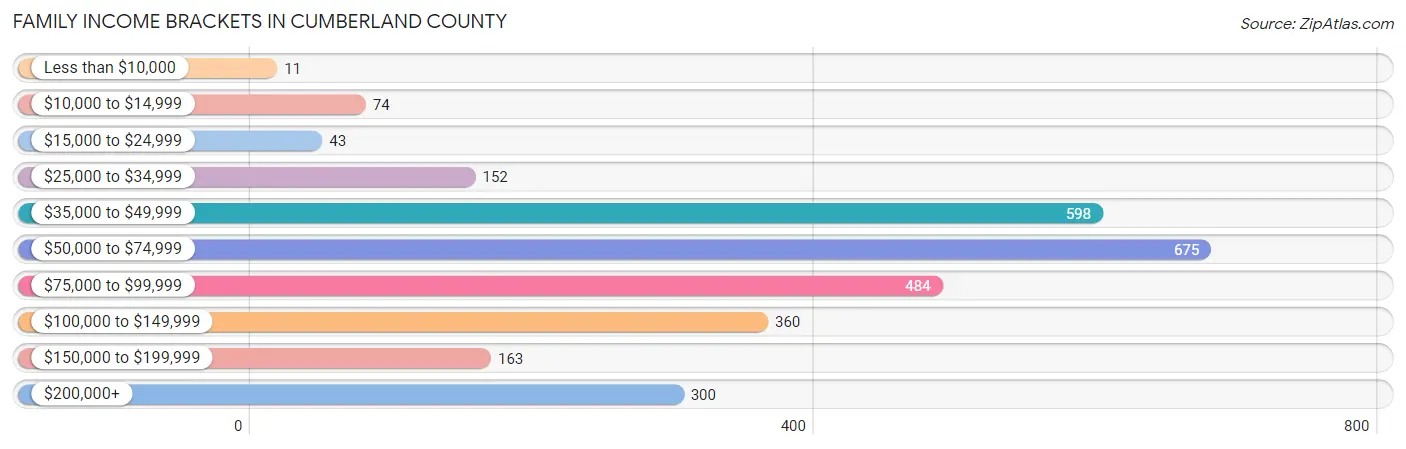
Family Income Brackets in Cumberland County
According to the Cumberland County family income data, there are 675 families falling into the $50,000 to $74,999 income range, which is the most common income bracket and makes up 23.6% of all families. Conversely, the less than $10,000 income bracket is the least frequent group with only 11 families (0.4%) belonging to this category.
| Income Bracket | # Families | % Families |
| Less than $10,000 | 11 | 0.4% |
| $10,000 to $14,999 | 74 | 2.6% |
| $15,000 to $24,999 | 43 | 1.5% |
| $25,000 to $34,999 | 152 | 5.3% |
| $35,000 to $49,999 | 598 | 20.9% |
| $50,000 to $74,999 | 675 | 23.6% |
| $75,000 to $99,999 | 484 | 16.9% |
| $100,000 to $149,999 | 360 | 12.6% |
| $150,000 to $199,999 | 163 | 5.7% |
| $200,000+ | 300 | 10.5% |
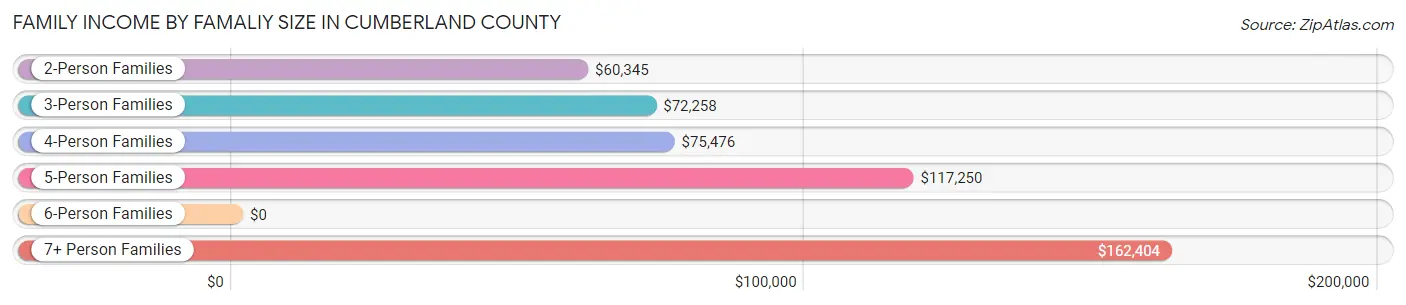
Family Income by Famaliy Size in Cumberland County
7+ person families (95 | 3.3%) account for the highest median family income in Cumberland County with $162,404 per family, while 2-person families (1,590 | 55.6%) have the highest median income of $30,172 per family member.
| Income Bracket | # Families | Median Income |
| 2-Person Families | 1,590 (55.6%) | $60,345 |
| 3-Person Families | 708 (24.7%) | $72,258 |
| 4-Person Families | 362 (12.7%) | $75,476 |
| 5-Person Families | 96 (3.4%) | $117,250 |
| 6-Person Families | 10 (0.4%) | $0 |
| 7+ Person Families | 95 (3.3%) | $162,404 |
| Total | 2,861 (100.0%) | $68,063 |
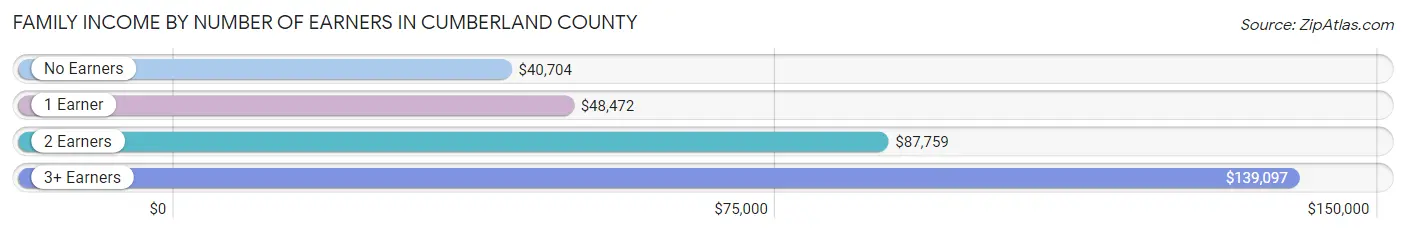
Family Income by Number of Earners in Cumberland County
The median family income in Cumberland County is $68,063, with families comprising 3+ earners (351) having the highest median family income of $139,097, while families with no earners (477) have the lowest median family income of $40,704, accounting for 12.3% and 16.7% of families, respectively.
| Number of Earners | # Families | Median Income |
| No Earners | 477 (16.7%) | $40,704 |
| 1 Earner | 830 (29.0%) | $48,472 |
| 2 Earners | 1,203 (42.0%) | $87,759 |
| 3+ Earners | 351 (12.3%) | $139,097 |
| Total | 2,861 (100.0%) | $68,063 |
Household Income in Cumberland County
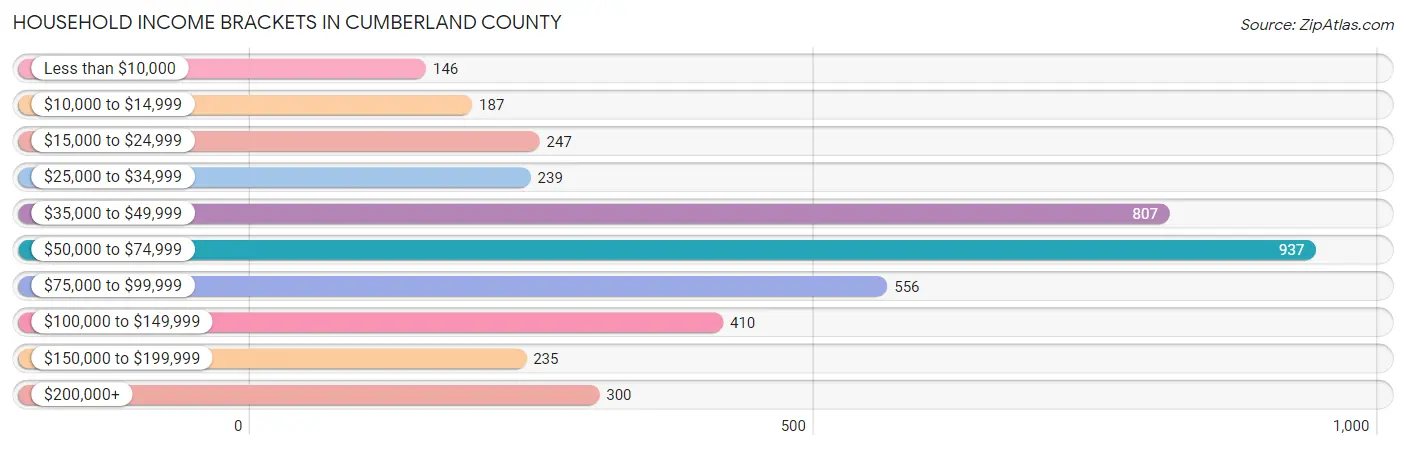
Household Income Brackets in Cumberland County
With 937 households falling in the category, the $50,000 to $74,999 income range is the most frequent in Cumberland County, accounting for 23.1% of all households. In contrast, only 146 households (3.6%) fall into the less than $10,000 income bracket, making it the least populous group.
| Income Bracket | # Households | % Households |
| Less than $10,000 | 146 | 3.6% |
| $10,000 to $14,999 | 187 | 4.6% |
| $15,000 to $24,999 | 247 | 6.1% |
| $25,000 to $34,999 | 239 | 5.9% |
| $35,000 to $49,999 | 807 | 19.9% |
| $50,000 to $74,999 | 937 | 23.1% |
| $75,000 to $99,999 | 556 | 13.7% |
| $100,000 to $149,999 | 410 | 10.1% |
| $150,000 to $199,999 | 235 | 5.8% |
| $200,000+ | 300 | 7.4% |
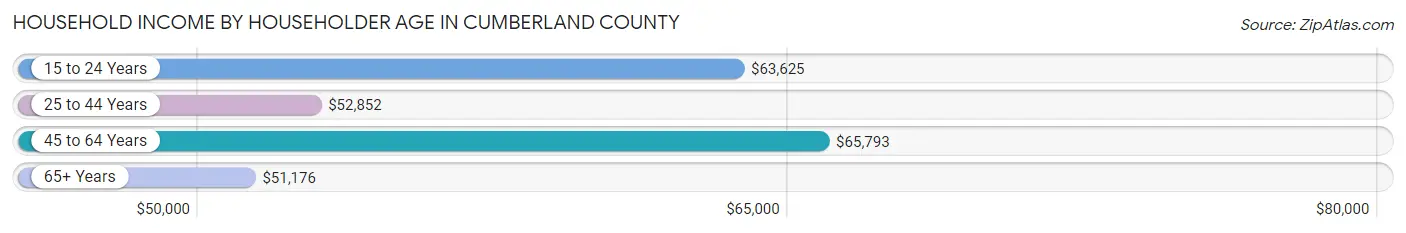
Household Income by Householder Age in Cumberland County
The median household income in Cumberland County is $56,497, with the highest median household income of $65,793 found in the 45 to 64 years age bracket for the primary householder. A total of 1,506 households (37.1%) fall into this category. Meanwhile, the 65+ years age bracket for the primary householder has the lowest median household income of $51,176, with 1,372 households (33.8%) in this group.
| Income Bracket | # Households | Median Income |
| 15 to 24 Years | 112 (2.8%) | $63,625 |
| 25 to 44 Years | 1,065 (26.3%) | $52,852 |
| 45 to 64 Years | 1,506 (37.1%) | $65,793 |
| 65+ Years | 1,372 (33.8%) | $51,176 |
| Total | 4,055 (100.0%) | $56,497 |
Poverty in Cumberland County
Income Below Poverty by Sex and Age in Cumberland County
With 7.8% poverty level for males and 8.1% for females among the residents of Cumberland County, 25 to 34 year old males and 6 to 11 year old females are the most vulnerable to poverty, with 70 males (12.7%) and 39 females (18.7%) in their respective age groups living below the poverty level.
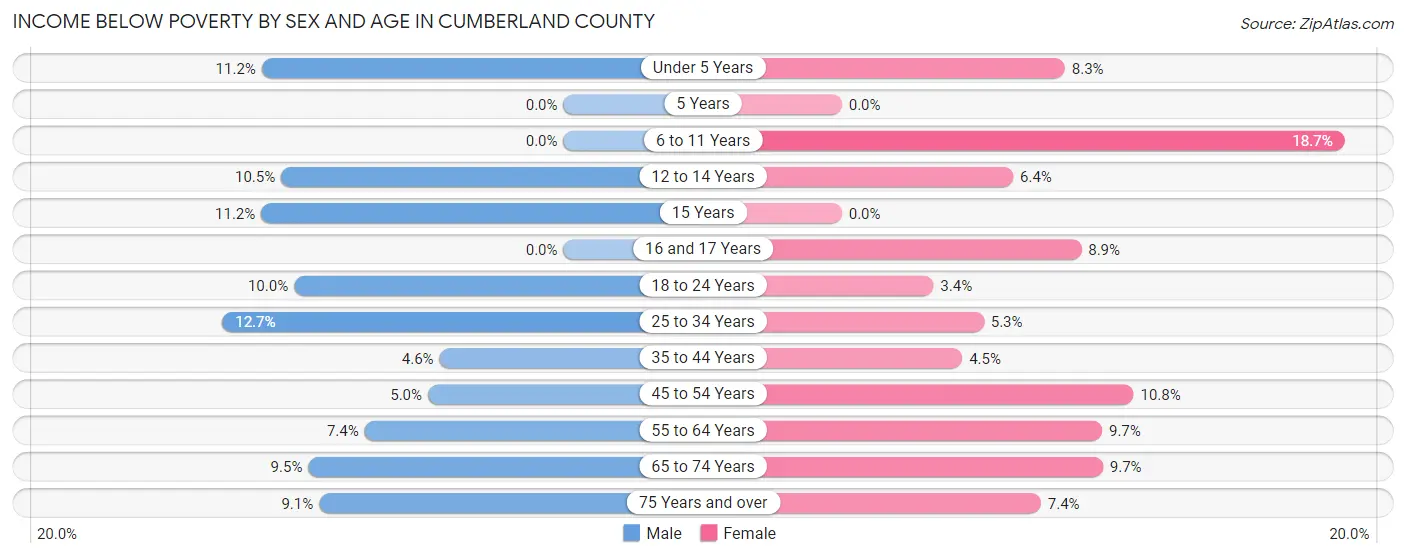
| Age Bracket | Male | Female |
| Under 5 Years | 28 (11.2%) | 14 (8.3%) |
| 5 Years | 0 (0.0%) | 0 (0.0%) |
| 6 to 11 Years | 0 (0.0%) | 39 (18.7%) |
| 12 to 14 Years | 33 (10.5%) | 14 (6.4%) |
| 15 Years | 11 (11.2%) | 0 (0.0%) |
| 16 and 17 Years | 0 (0.0%) | 16 (8.9%) |
| 18 to 24 Years | 35 (10.0%) | 8 (3.4%) |
| 25 to 34 Years | 70 (12.7%) | 30 (5.3%) |
| 35 to 44 Years | 16 (4.6%) | 33 (4.5%) |
| 45 to 54 Years | 38 (5.0%) | 59 (10.8%) |
| 55 to 64 Years | 56 (7.4%) | 72 (9.7%) |
| 65 to 74 Years | 52 (9.5%) | 68 (9.7%) |
| 75 Years and over | 42 (9.1%) | 36 (7.4%) |
| Total | 381 (7.8%) | 389 (8.1%) |
Income Above Poverty by Sex and Age in Cumberland County
According to the poverty statistics in Cumberland County, males aged 5 years and females aged 15 years are the age groups that are most secure financially, with 100.0% of males and 100.0% of females in these age groups living above the poverty line.
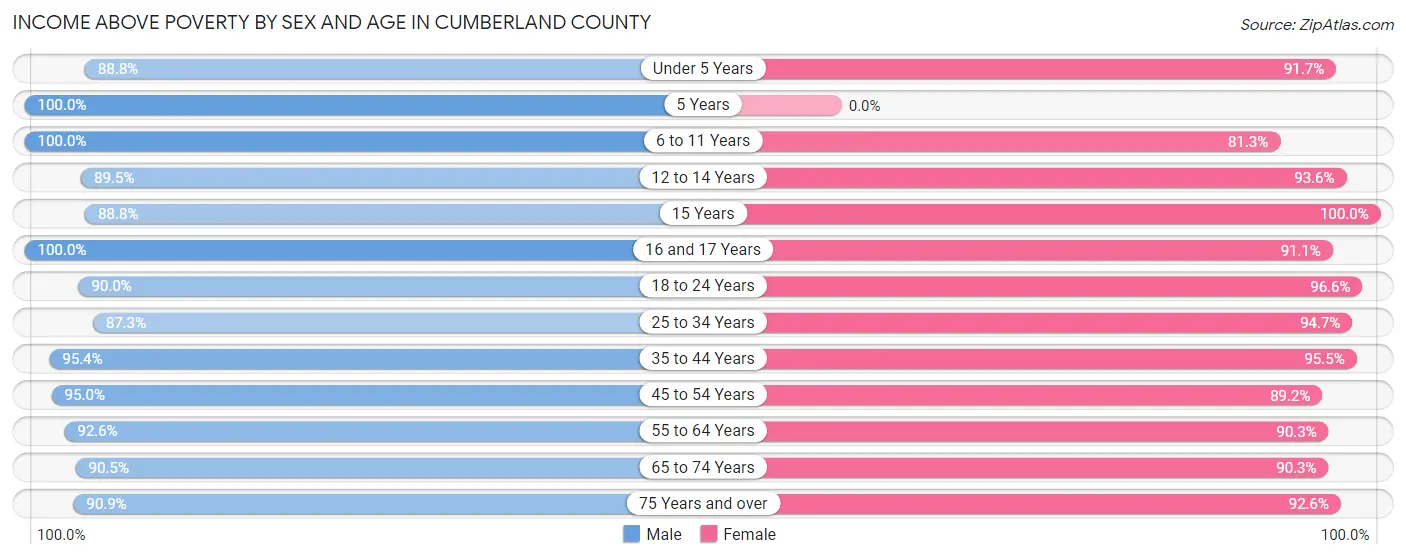
| Age Bracket | Male | Female |
| Under 5 Years | 222 (88.8%) | 155 (91.7%) |
| 5 Years | 26 (100.0%) | 0 (0.0%) |
| 6 to 11 Years | 256 (100.0%) | 170 (81.3%) |
| 12 to 14 Years | 282 (89.5%) | 206 (93.6%) |
| 15 Years | 87 (88.8%) | 10 (100.0%) |
| 16 and 17 Years | 158 (100.0%) | 164 (91.1%) |
| 18 to 24 Years | 315 (90.0%) | 227 (96.6%) |
| 25 to 34 Years | 483 (87.3%) | 539 (94.7%) |
| 35 to 44 Years | 332 (95.4%) | 706 (95.5%) |
| 45 to 54 Years | 718 (95.0%) | 486 (89.2%) |
| 55 to 64 Years | 703 (92.6%) | 673 (90.3%) |
| 65 to 74 Years | 497 (90.5%) | 634 (90.3%) |
| 75 Years and over | 421 (90.9%) | 451 (92.6%) |
| Total | 4,500 (92.2%) | 4,421 (91.9%) |
Income Below Poverty Among Married-Couple Families in Cumberland County
The poverty statistics for married-couple families in Cumberland County show that 3.3% or 65 of the total 2,002 families live below the poverty line. Families with 3 or 4 children have the highest poverty rate of 10.1%, comprising of 9 families. On the other hand, families with 5 or more children have the lowest poverty rate of 0.0%, which includes 0 families.
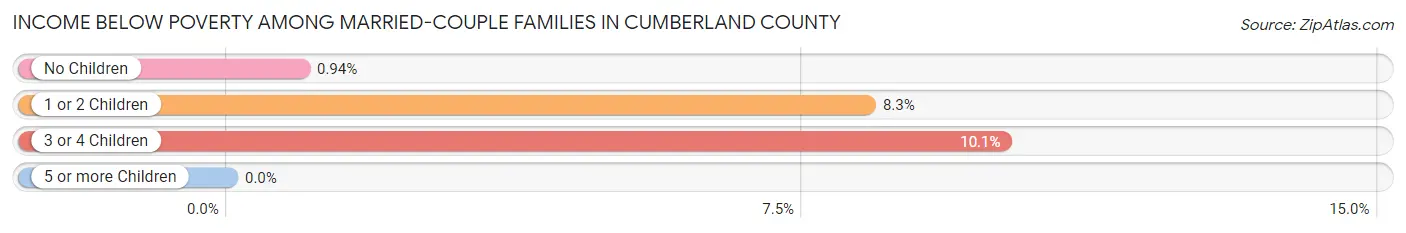
| Children | Above Poverty | Below Poverty |
| No Children | 1,371 (99.1%) | 13 (0.9%) |
| 1 or 2 Children | 473 (91.7%) | 43 (8.3%) |
| 3 or 4 Children | 80 (89.9%) | 9 (10.1%) |
| 5 or more Children | 13 (100.0%) | 0 (0.0%) |
| Total | 1,937 (96.8%) | 65 (3.3%) |
Income Below Poverty Among Single-Parent Households in Cumberland County
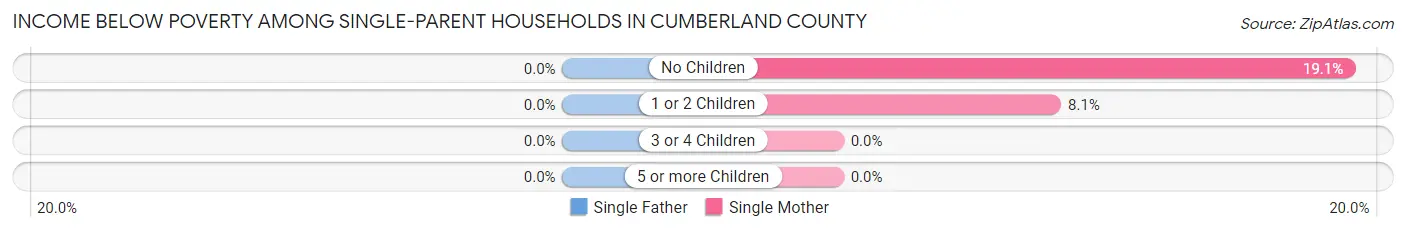
| Children | Single Father | Single Mother |
| No Children | 0 (0.0%) | 32 (19.1%) |
| 1 or 2 Children | 0 (0.0%) | 41 (8.1%) |
| 3 or 4 Children | 0 (0.0%) | 0 (0.0%) |
| 5 or more Children | 0 (0.0%) | 0 (0.0%) |
| Total | 0 (0.0%) | 73 (10.8%) |
Income Below Poverty Among Married-Couple vs Single-Parent Households in Cumberland County
The poverty data for Cumberland County shows that 65 of the married-couple family households (3.3%) and 73 of the single-parent households (8.5%) are living below the poverty level. Within the married-couple family households, those with 3 or 4 children have the highest poverty rate, with 9 households (10.1%) falling below the poverty line. Among the single-parent households, those with no children have the highest poverty rate, with 32 household (9.7%) living below poverty.
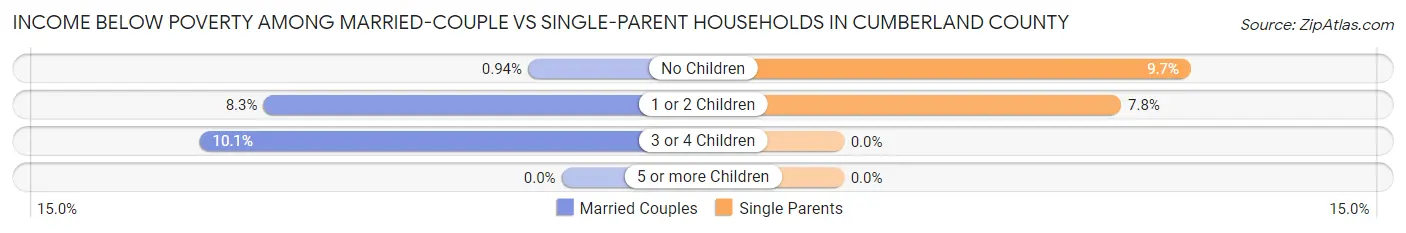
| Children | Married-Couple Families | Single-Parent Households |
| No Children | 13 (0.9%) | 32 (9.7%) |
| 1 or 2 Children | 43 (8.3%) | 41 (7.7%) |
| 3 or 4 Children | 9 (10.1%) | 0 (0.0%) |
| 5 or more Children | 0 (0.0%) | 0 (0.0%) |
| Total | 65 (3.3%) | 73 (8.5%) |
Race in Cumberland County
The most populous races in Cumberland County are White / Caucasian (6,181 | 63.7%), Black / African American (2,946 | 30.4%), and Two or more Races (448 | 4.6%).
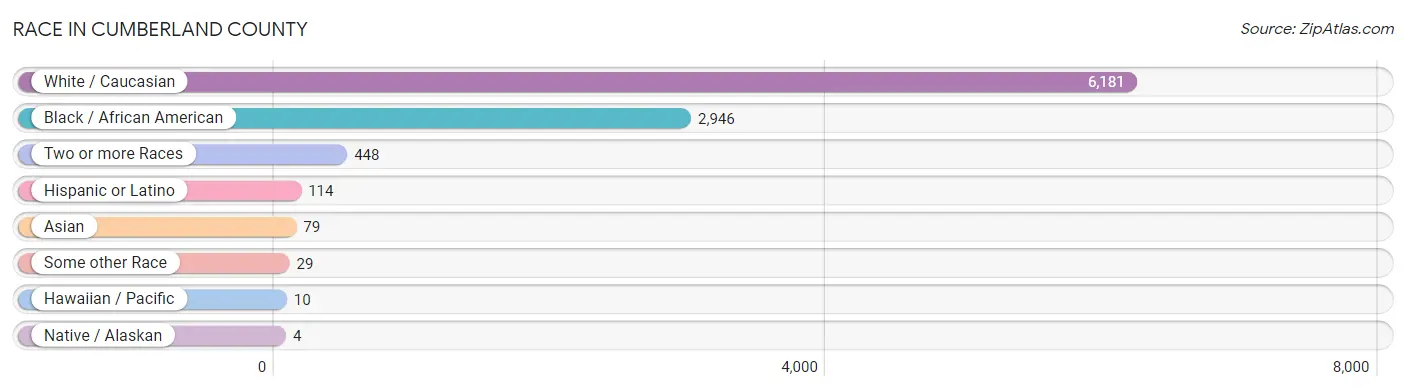
| Race | # Population | % Population |
| Asian | 79 | 0.8% |
| Black / African American | 2,946 | 30.4% |
| Hawaiian / Pacific | 10 | 0.1% |
| Hispanic or Latino | 114 | 1.2% |
| Native / Alaskan | 4 | 0.0% |
| White / Caucasian | 6,181 | 63.7% |
| Two or more Races | 448 | 4.6% |
| Some other Race | 29 | 0.3% |
| Total | 9,697 | 100.0% |
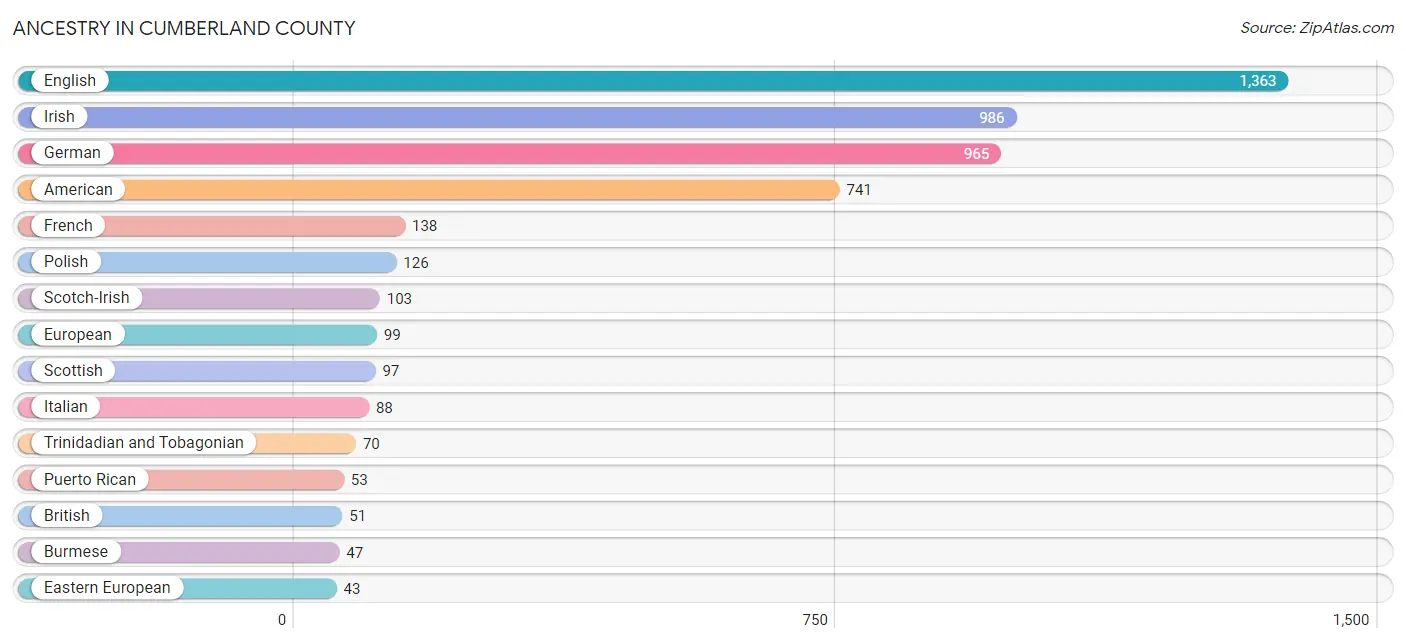
Ancestry in Cumberland County
The most populous ancestries reported in Cumberland County are English (1,363 | 14.1%), Irish (986 | 10.2%), German (965 | 10.0%), American (741 | 7.6%), and French (138 | 1.4%), together accounting for 43.2% of all Cumberland County residents.
| Ancestry | # Population | % Population |
| African | 37 | 0.4% |
| American | 741 | 7.6% |
| British | 51 | 0.5% |
| Burmese | 47 | 0.5% |
| Canadian | 14 | 0.1% |
| Cherokee | 3 | 0.0% |
| Czech | 10 | 0.1% |
| Delaware | 11 | 0.1% |
| Dutch | 16 | 0.2% |
| Eastern European | 43 | 0.4% |
| English | 1,363 | 14.1% |
| European | 99 | 1.0% |
| Fijian | 10 | 0.1% |
| French | 138 | 1.4% |
| French Canadian | 12 | 0.1% |
| German | 965 | 10.0% |
| Hungarian | 10 | 0.1% |
| Iranian | 6 | 0.1% |
| Irish | 986 | 10.2% |
| Italian | 88 | 0.9% |
| Korean | 32 | 0.3% |
| Mexican | 32 | 0.3% |
| Northern European | 37 | 0.4% |
| Paraguayan | 29 | 0.3% |
| Polish | 126 | 1.3% |
| Puerto Rican | 53 | 0.5% |
| Scotch-Irish | 103 | 1.1% |
| Scottish | 97 | 1.0% |
| Slovak | 13 | 0.1% |
| South American | 29 | 0.3% |
| South American Indian | 12 | 0.1% |
| Subsaharan African | 37 | 0.4% |
| Swedish | 28 | 0.3% |
| Trinidadian and Tobagonian | 70 | 0.7% |
| Welsh | 17 | 0.2% |
| Yugoslavian | 10 | 0.1% | View All 36 Rows |
Immigrants in Cumberland County
The most numerous immigrant groups reported in Cumberland County came from Latin America (61 | 0.6%), Caribbean (47 | 0.5%), Trinidad and Tobago (47 | 0.5%), Asia (23 | 0.2%), and Europe (14 | 0.1%), together accounting for 2.0% of all Cumberland County residents.
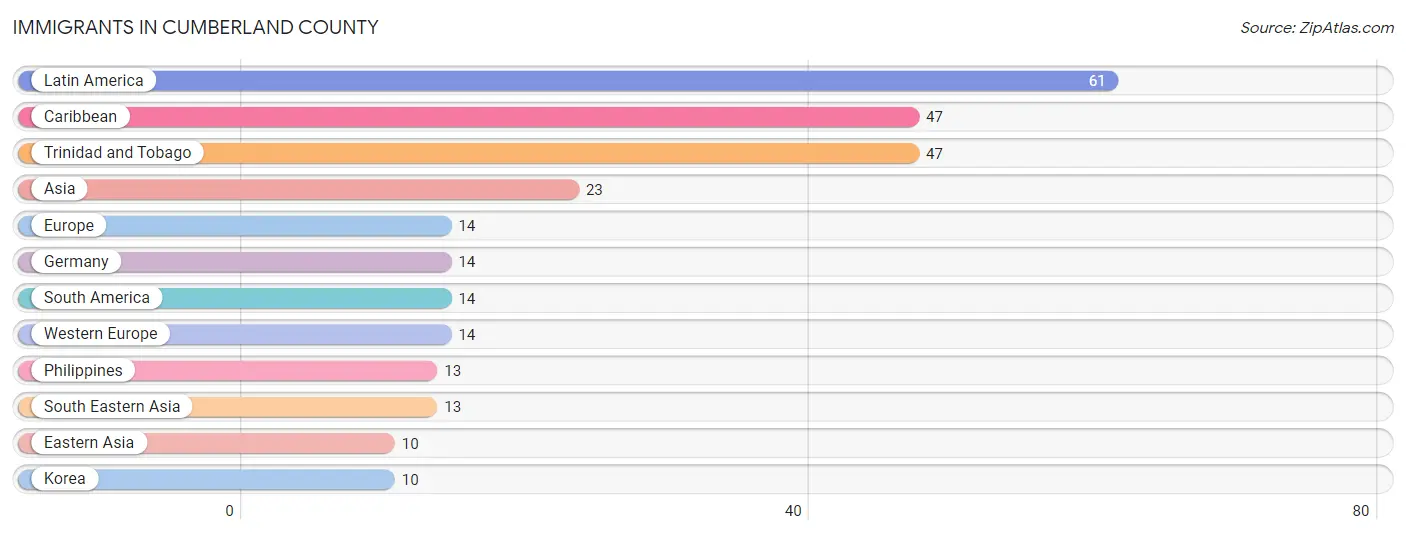
| Immigration Origin | # Population | % Population |
| Asia | 23 | 0.2% |
| Caribbean | 47 | 0.5% |
| Eastern Asia | 10 | 0.1% |
| Europe | 14 | 0.1% |
| Germany | 14 | 0.1% |
| Korea | 10 | 0.1% |
| Latin America | 61 | 0.6% |
| Philippines | 13 | 0.1% |
| South America | 14 | 0.1% |
| South Eastern Asia | 13 | 0.1% |
| Trinidad and Tobago | 47 | 0.5% |
| Western Europe | 14 | 0.1% | View All 12 Rows |
Sex and Age in Cumberland County
Sex and Age in Cumberland County
The most populous age groups in Cumberland County are 60 to 64 Years (481 | 9.8%) for men and 35 to 39 Years (533 | 11.1%) for women.
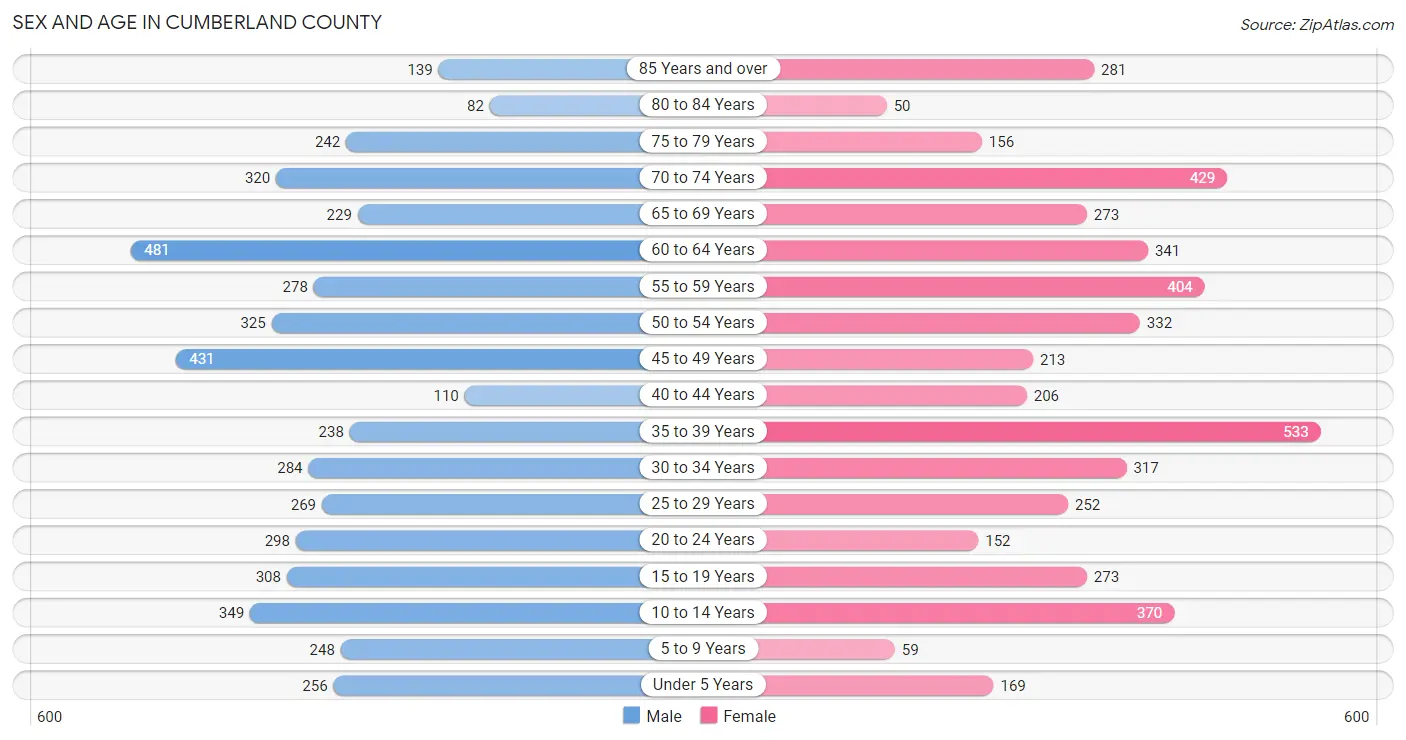
| Age Bracket | Male | Female |
| Under 5 Years | 256 (5.2%) | 169 (3.5%) |
| 5 to 9 Years | 248 (5.1%) | 59 (1.2%) |
| 10 to 14 Years | 349 (7.1%) | 370 (7.7%) |
| 15 to 19 Years | 308 (6.3%) | 273 (5.7%) |
| 20 to 24 Years | 298 (6.1%) | 152 (3.2%) |
| 25 to 29 Years | 269 (5.5%) | 252 (5.2%) |
| 30 to 34 Years | 284 (5.8%) | 317 (6.6%) |
| 35 to 39 Years | 238 (4.9%) | 533 (11.1%) |
| 40 to 44 Years | 110 (2.2%) | 206 (4.3%) |
| 45 to 49 Years | 431 (8.8%) | 213 (4.4%) |
| 50 to 54 Years | 325 (6.7%) | 332 (6.9%) |
| 55 to 59 Years | 278 (5.7%) | 404 (8.4%) |
| 60 to 64 Years | 481 (9.8%) | 341 (7.1%) |
| 65 to 69 Years | 229 (4.7%) | 273 (5.7%) |
| 70 to 74 Years | 320 (6.6%) | 429 (8.9%) |
| 75 to 79 Years | 242 (5.0%) | 156 (3.2%) |
| 80 to 84 Years | 82 (1.7%) | 50 (1.0%) |
| 85 Years and over | 139 (2.8%) | 281 (5.8%) |
| Total | 4,887 (100.0%) | 4,810 (100.0%) |
Families and Households in Cumberland County
Median Family Size in Cumberland County
The median family size in Cumberland County is 2.84 persons per family, with married-couple families (2,002 | 70.0%) accounting for the largest median family size of 3.05 persons per family. On the other hand, single female/mother families (674 | 23.6%) represent the smallest median family size with 2.30 persons per family.
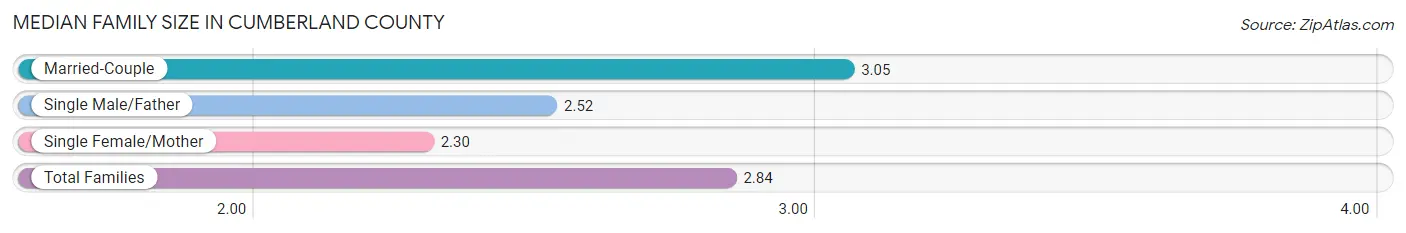
| Family Type | # Families | Family Size |
| Married-Couple | 2,002 (70.0%) | 3.05 |
| Single Male/Father | 185 (6.5%) | 2.52 |
| Single Female/Mother | 674 (23.6%) | 2.30 |
| Total Families | 2,861 (100.0%) | 2.84 |
Median Household Size in Cumberland County
The median household size in Cumberland County is 2.38 persons per household, with married-couple households (2,002 | 49.4%) accounting for the largest median household size of 3.08 persons per household. non-family households (1,194 | 29.4%) represent the smallest median household size with 1.23 persons per household.
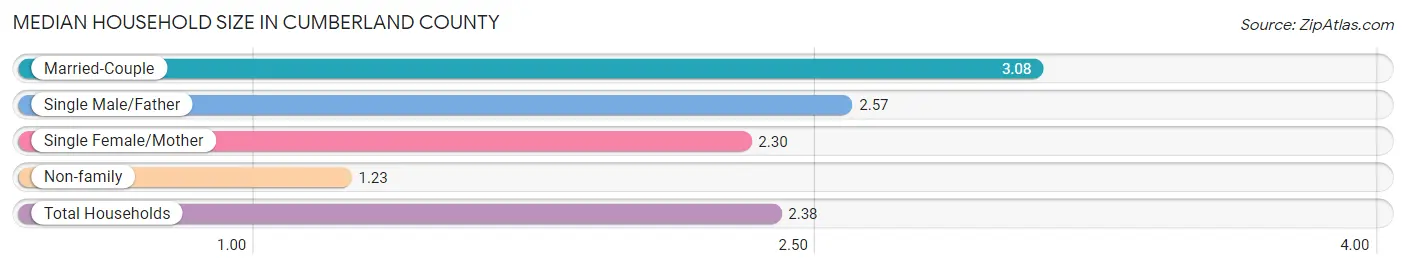
| Household Type | # Households | Household Size |
| Married-Couple | 2,002 (49.4%) | 3.08 |
| Single Male/Father | 185 (4.6%) | 2.57 |
| Single Female/Mother | 674 (16.6%) | 2.30 |
| Non-family | 1,194 (29.4%) | 1.23 |
| Total Households | 4,055 (100.0%) | 2.38 |
Household Size by Marriage Status in Cumberland County
Out of a total of 4,055 households in Cumberland County, 2,861 (70.6%) are family households, while 1,194 (29.4%) are nonfamily households. The most numerous type of family households are 2-person households, comprising 1,590, and the most common type of nonfamily households are 1-person households, comprising 984.
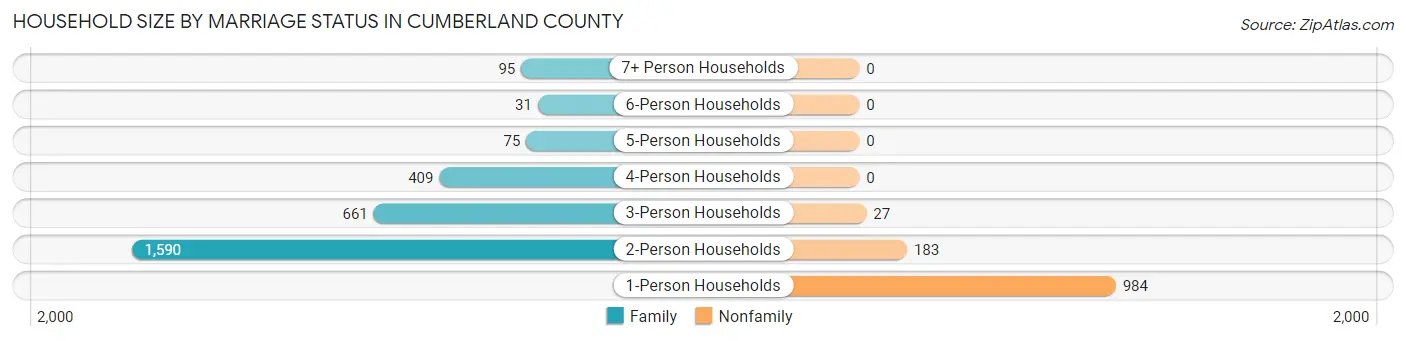
| Household Size | Family Households | Nonfamily Households |
| 1-Person Households | - | 984 (24.3%) |
| 2-Person Households | 1,590 (39.2%) | 183 (4.5%) |
| 3-Person Households | 661 (16.3%) | 27 (0.7%) |
| 4-Person Households | 409 (10.1%) | 0 (0.0%) |
| 5-Person Households | 75 (1.8%) | 0 (0.0%) |
| 6-Person Households | 31 (0.8%) | 0 (0.0%) |
| 7+ Person Households | 95 (2.3%) | 0 (0.0%) |
| Total | 2,861 (70.6%) | 1,194 (29.4%) |
Female Fertility in Cumberland County
Fertility by Age in Cumberland County
Average fertility rate in Cumberland County is 61.0 births per 1,000 women. Women in the age bracket of 20 to 34 years have the highest fertility rate with 168.0 births per 1,000 women. Women in the age bracket of 20 to 34 years acount for 100.0% of all women with births.
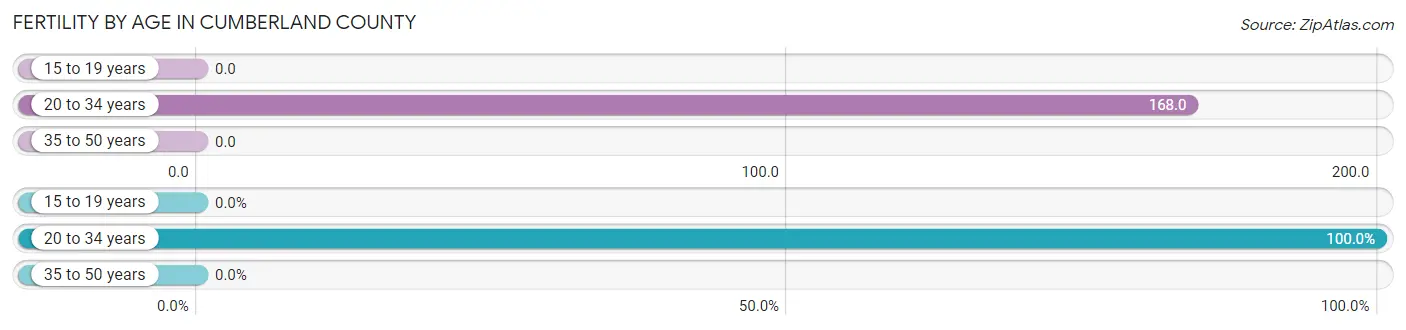
| Age Bracket | Women with Births | Births / 1,000 Women |
| 15 to 19 years | 0 (0.0%) | 0.0 |
| 20 to 34 years | 121 (100.0%) | 168.0 |
| 35 to 50 years | 0 (0.0%) | 0.0 |
| Total | 121 (100.0%) | 61.0 |
Fertility by Age by Marriage Status in Cumberland County
87.6% of women with births (121) in Cumberland County are married. The highest percentage of unmarried women with births falls into 20 to 34 years age bracket with 12.4% of them unmarried at the time of birth, while the lowest percentage of unmarried women with births belong to 20 to 34 years age bracket with 12.4% of them unmarried.
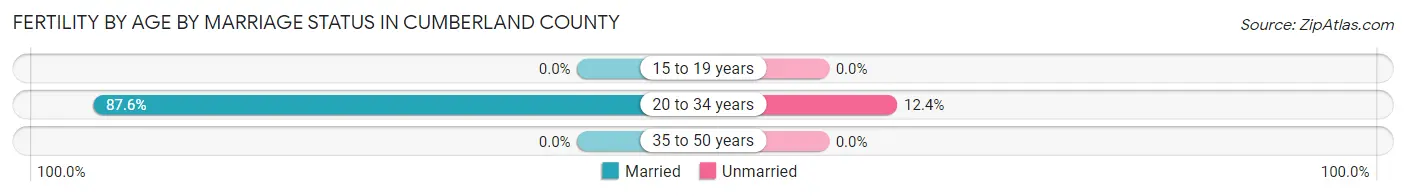
| Age Bracket | Married | Unmarried |
| 15 to 19 years | 0 (0.0%) | 0 (0.0%) |
| 20 to 34 years | 106 (87.6%) | 15 (12.4%) |
| 35 to 50 years | 0 (0.0%) | 0 (0.0%) |
| Total | 106 (87.6%) | 15 (12.4%) |
Fertility by Education in Cumberland County
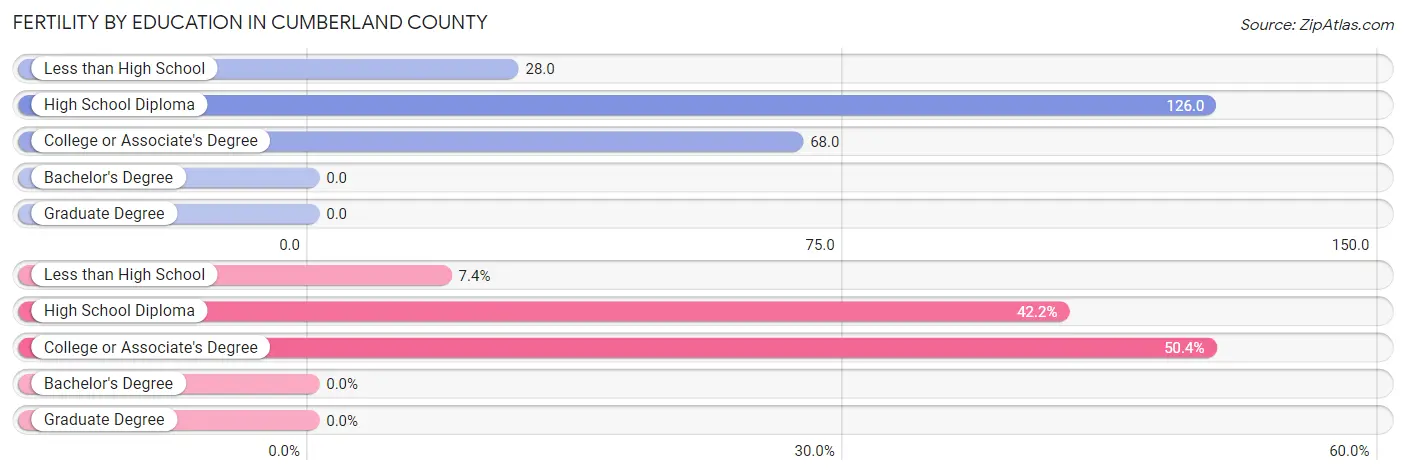
| Educational Attainment | Women with Births | Births / 1,000 Women |
| Less than High School | 9 (7.4%) | 28.0 |
| High School Diploma | 51 (42.1%) | 126.0 |
| College or Associate's Degree | 61 (50.4%) | 68.0 |
| Bachelor's Degree | 0 (0.0%) | 0.0 |
| Graduate Degree | 0 (0.0%) | 0.0 |
| Total | 121 (100.0%) | 61.0 |
Fertility by Education by Marriage Status in Cumberland County
12.4% of women with births in Cumberland County are unmarried. Women with the educational attainment of less than high school are most likely to be married with 100.0% of them married at childbirth, while women with the educational attainment of high school diploma are least likely to be married with 29.4% of them unmarried at childbirth.
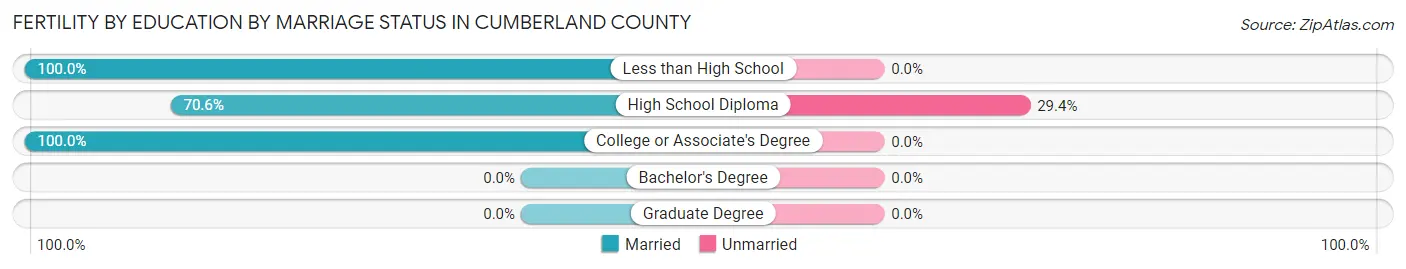
| Educational Attainment | Married | Unmarried |
| Less than High School | 9 (100.0%) | 0 (0.0%) |
| High School Diploma | 36 (70.6%) | 15 (29.4%) |
| College or Associate's Degree | 61 (100.0%) | 0 (0.0%) |
| Bachelor's Degree | 0 (0.0%) | 0 (0.0%) |
| Graduate Degree | 0 (0.0%) | 0 (0.0%) |
| Total | 106 (87.6%) | 15 (12.4%) |
Employment Characteristics in Cumberland County
Employment by Class of Employer in Cumberland County
Among the 4,917 employed individuals in Cumberland County, private company employees (2,769 | 56.3%), state government employees (572 | 11.6%), and self-employed (not incorporated) (435 | 8.8%) make up the most common classes of employment.
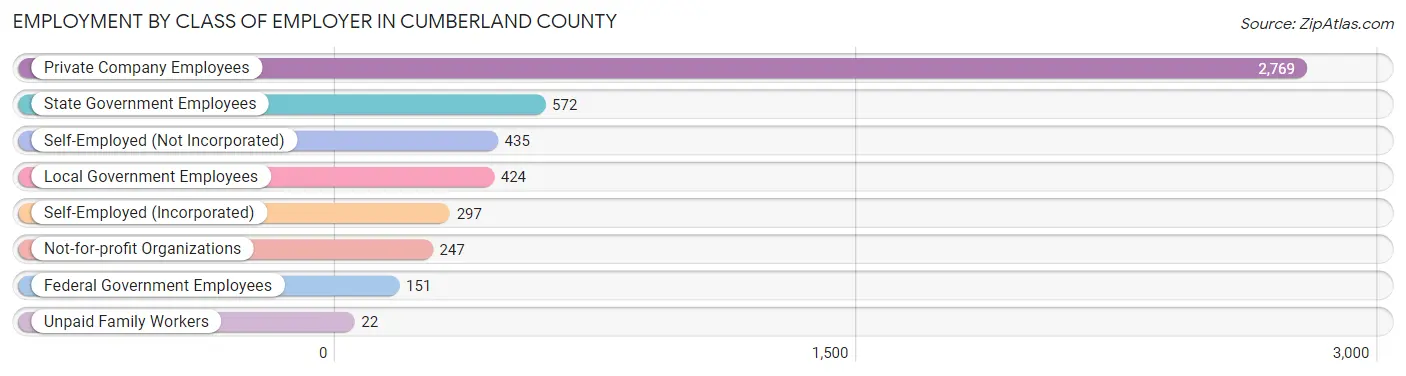
| Employer Class | # Employees | % Employees |
| Private Company Employees | 2,769 | 56.3% |
| Self-Employed (Incorporated) | 297 | 6.0% |
| Self-Employed (Not Incorporated) | 435 | 8.8% |
| Not-for-profit Organizations | 247 | 5.0% |
| Local Government Employees | 424 | 8.6% |
| State Government Employees | 572 | 11.6% |
| Federal Government Employees | 151 | 3.1% |
| Unpaid Family Workers | 22 | 0.4% |
| Total | 4,917 | 100.0% |
Employment Status by Age in Cumberland County
According to the labor force statistics for Cumberland County, out of the total population over 16 years of age (8,138), 64.3% or 5,233 individuals are in the labor force, with 3.2% or 167 of them unemployed. The age group with the highest labor force participation rate is 25 to 29 years, with 92.7% or 483 individuals in the labor force. Within the labor force, the 20 to 24 years age range has the highest percentage of unemployed individuals, with 14.3% or 51 of them being unemployed.
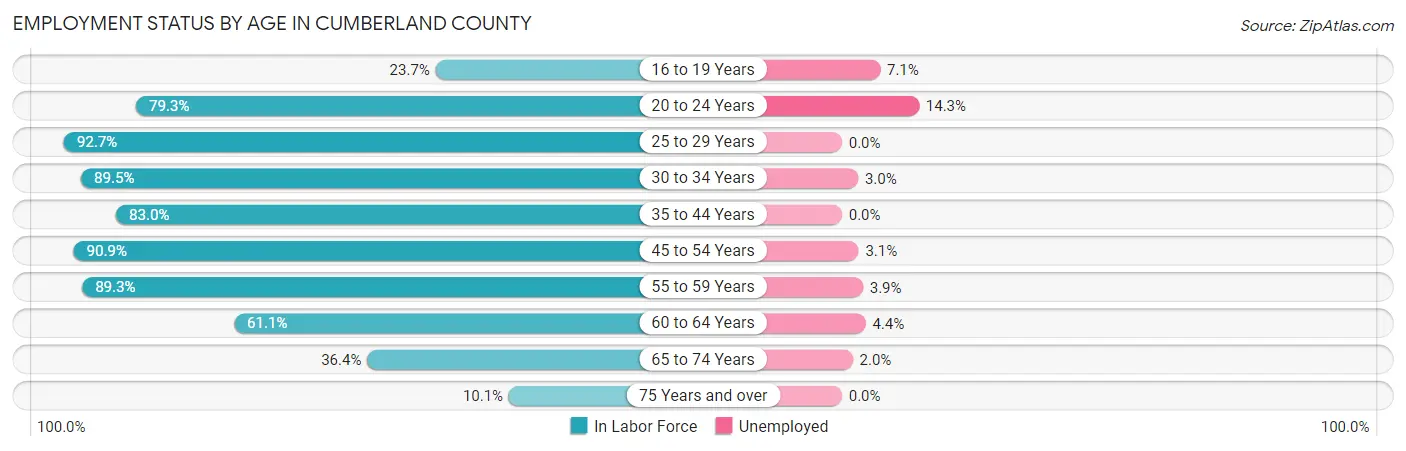
| Age Bracket | In Labor Force | Unemployed |
| 16 to 19 Years | 112 (23.7%) | 8 (7.1%) |
| 20 to 24 Years | 357 (79.3%) | 51 (14.3%) |
| 25 to 29 Years | 483 (92.7%) | 0 (0.0%) |
| 30 to 34 Years | 538 (89.5%) | 16 (3.0%) |
| 35 to 44 Years | 902 (83.0%) | 0 (0.0%) |
| 45 to 54 Years | 1,183 (90.9%) | 37 (3.1%) |
| 55 to 59 Years | 609 (89.3%) | 24 (3.9%) |
| 60 to 64 Years | 502 (61.1%) | 22 (4.4%) |
| 65 to 74 Years | 455 (36.4%) | 9 (2.0%) |
| 75 Years and over | 96 (10.1%) | 0 (0.0%) |
| Total | 5,233 (64.3%) | 167 (3.2%) |
Employment Status by Educational Attainment in Cumberland County
According to labor force statistics for Cumberland County, 84.1% of individuals (4,217) out of the total population between 25 and 64 years of age (5,014) are in the labor force, with 2.3% or 97 of them being unemployed. The group with the highest labor force participation rate are those with the educational attainment of bachelor's degree or higher, with 93.4% or 1,071 individuals in the labor force. Within the labor force, individuals with less than high school education have the highest percentage of unemployment, with 6.7% or 14 of them being unemployed.
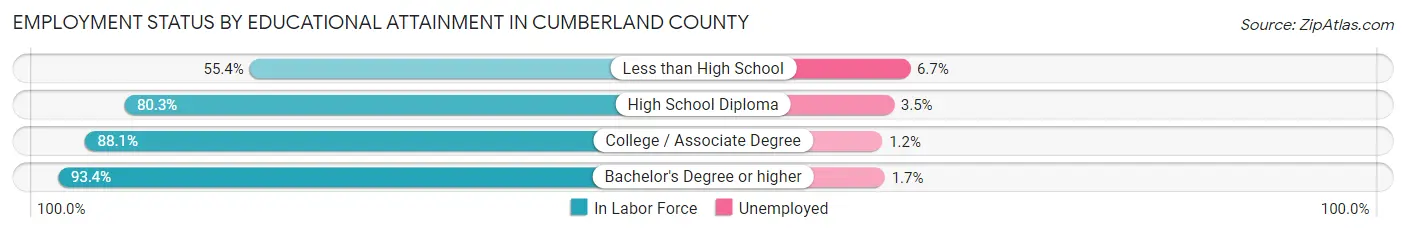
| Educational Attainment | In Labor Force | Unemployed |
| Less than High School | 210 (55.4%) | 25 (6.7%) |
| High School Diploma | 1,414 (80.3%) | 62 (3.5%) |
| College / Associate Degree | 1,521 (88.1%) | 21 (1.2%) |
| Bachelor's Degree or higher | 1,071 (93.4%) | 19 (1.7%) |
| Total | 4,217 (84.1%) | 115 (2.3%) |
Employment Occupations by Sex in Cumberland County
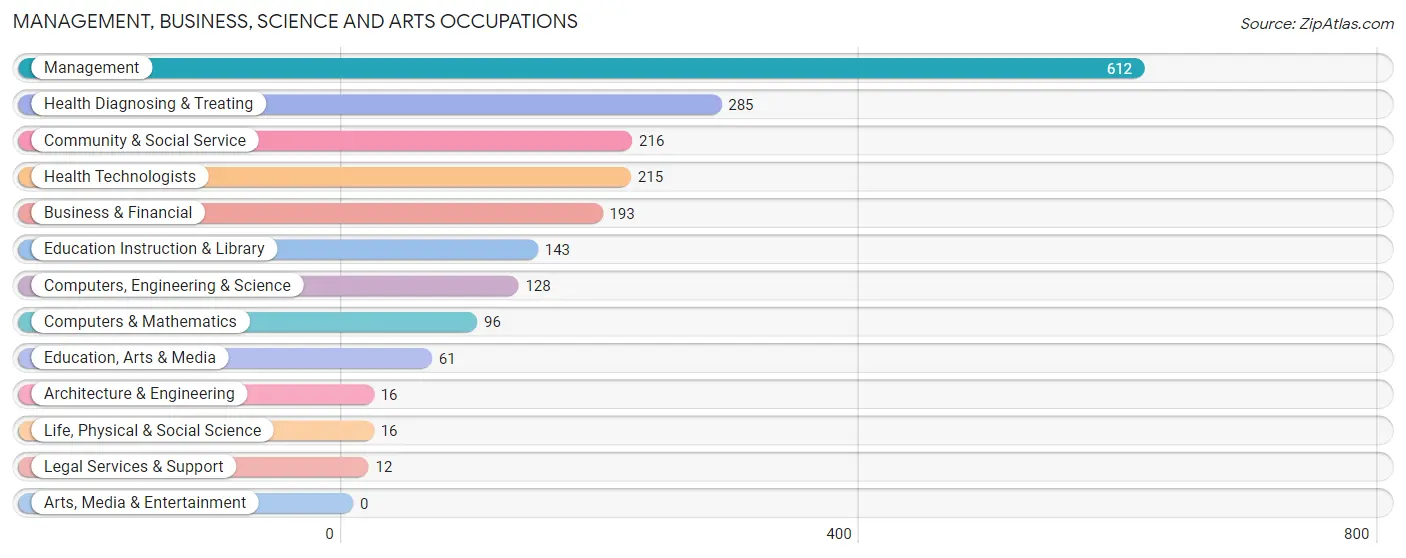
Management, Business, Science and Arts Occupations
The most common Management, Business, Science and Arts occupations in Cumberland County are Management (612 | 12.1%), Health Diagnosing & Treating (285 | 5.6%), Community & Social Service (216 | 4.3%), Health Technologists (215 | 4.2%), and Business & Financial (193 | 3.8%).
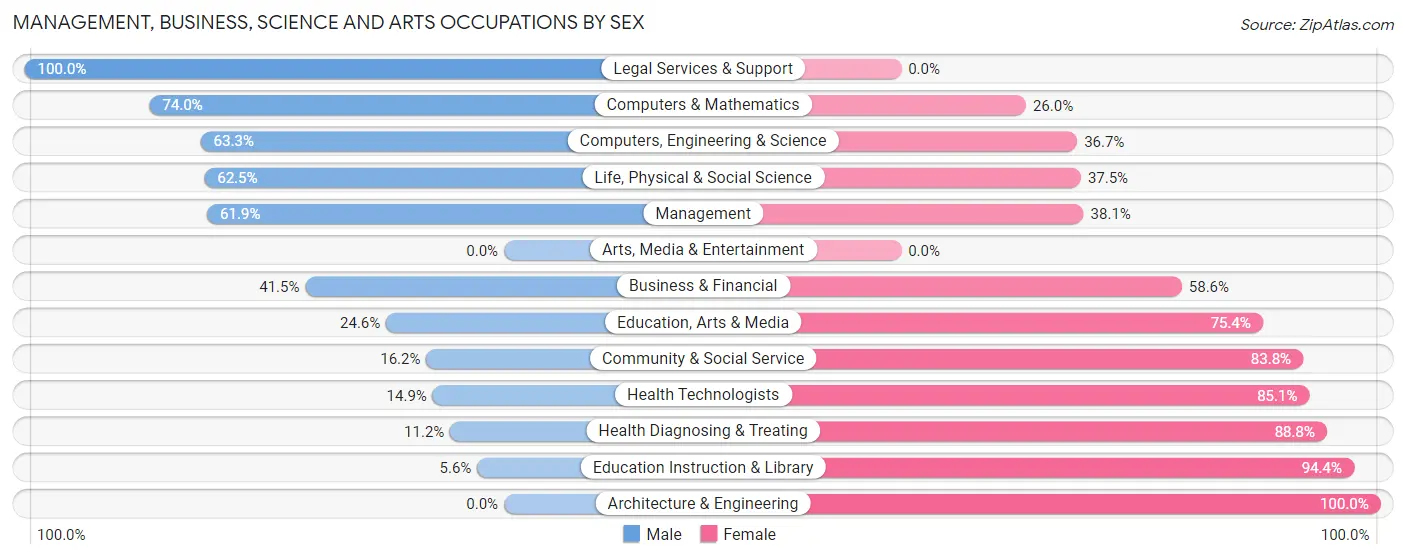
Management, Business, Science and Arts Occupations by Sex
Within the Management, Business, Science and Arts occupations in Cumberland County, the most male-oriented occupations are Legal Services & Support (100.0%), Computers & Mathematics (74.0%), and Computers, Engineering & Science (63.3%), while the most female-oriented occupations are Architecture & Engineering (100.0%), Education Instruction & Library (94.4%), and Health Diagnosing & Treating (88.8%).
| Occupation | Male | Female |
| Management | 379 (61.9%) | 233 (38.1%) |
| Business & Financial | 80 (41.4%) | 113 (58.6%) |
| Computers, Engineering & Science | 81 (63.3%) | 47 (36.7%) |
| Computers & Mathematics | 71 (74.0%) | 25 (26.0%) |
| Architecture & Engineering | 0 (0.0%) | 16 (100.0%) |
| Life, Physical & Social Science | 10 (62.5%) | 6 (37.5%) |
| Community & Social Service | 35 (16.2%) | 181 (83.8%) |
| Education, Arts & Media | 15 (24.6%) | 46 (75.4%) |
| Legal Services & Support | 12 (100.0%) | 0 (0.0%) |
| Education Instruction & Library | 8 (5.6%) | 135 (94.4%) |
| Arts, Media & Entertainment | 0 (0.0%) | 0 (0.0%) |
| Health Diagnosing & Treating | 32 (11.2%) | 253 (88.8%) |
| Health Technologists | 32 (14.9%) | 183 (85.1%) |
| Total (Category) | 607 (42.3%) | 827 (57.7%) |
| Total (Overall) | 2,521 (49.7%) | 2,548 (50.3%) |
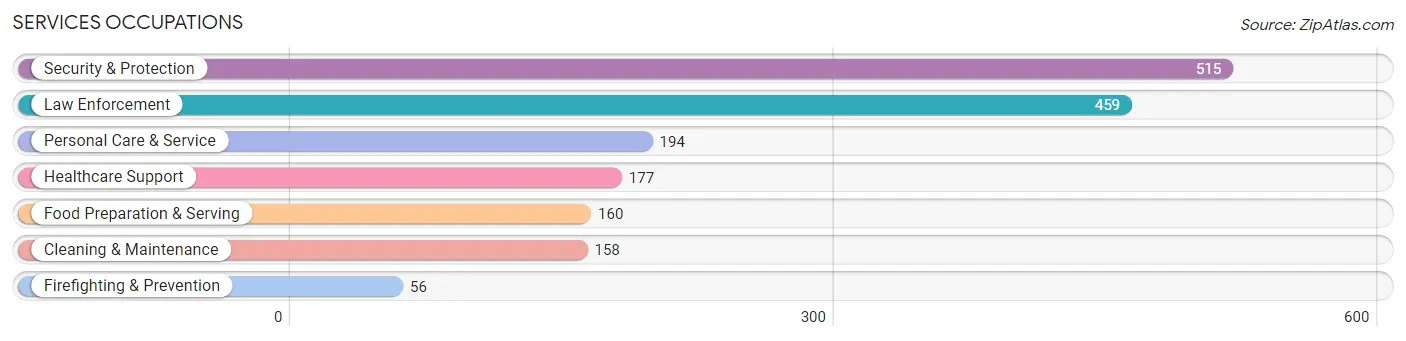
Services Occupations
The most common Services occupations in Cumberland County are Security & Protection (515 | 10.2%), Law Enforcement (459 | 9.1%), Personal Care & Service (194 | 3.8%), Healthcare Support (177 | 3.5%), and Food Preparation & Serving (160 | 3.2%).
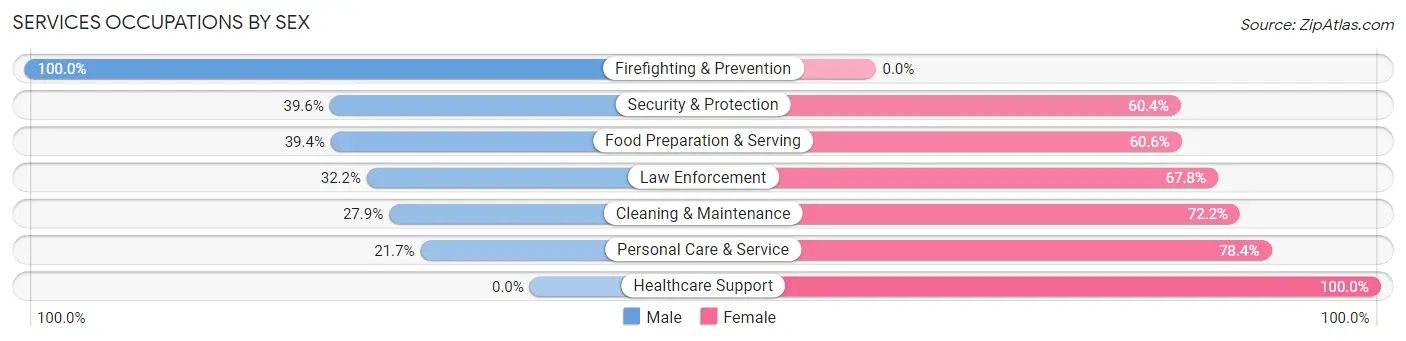
Services Occupations by Sex
Within the Services occupations in Cumberland County, the most male-oriented occupations are Firefighting & Prevention (100.0%), Security & Protection (39.6%), and Food Preparation & Serving (39.4%), while the most female-oriented occupations are Healthcare Support (100.0%), Personal Care & Service (78.3%), and Cleaning & Maintenance (72.2%).
| Occupation | Male | Female |
| Healthcare Support | 0 (0.0%) | 177 (100.0%) |
| Security & Protection | 204 (39.6%) | 311 (60.4%) |
| Firefighting & Prevention | 56 (100.0%) | 0 (0.0%) |
| Law Enforcement | 148 (32.2%) | 311 (67.8%) |
| Food Preparation & Serving | 63 (39.4%) | 97 (60.6%) |
| Cleaning & Maintenance | 44 (27.9%) | 114 (72.2%) |
| Personal Care & Service | 42 (21.6%) | 152 (78.3%) |
| Total (Category) | 353 (29.3%) | 851 (70.7%) |
| Total (Overall) | 2,521 (49.7%) | 2,548 (50.3%) |
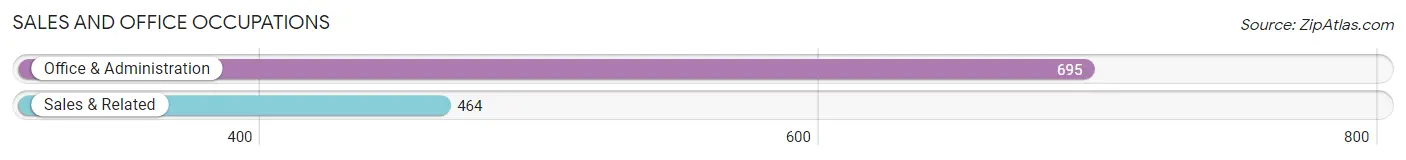
Sales and Office Occupations
The most common Sales and Office occupations in Cumberland County are Office & Administration (695 | 13.7%), and Sales & Related (464 | 9.1%).
Sales and Office Occupations by Sex
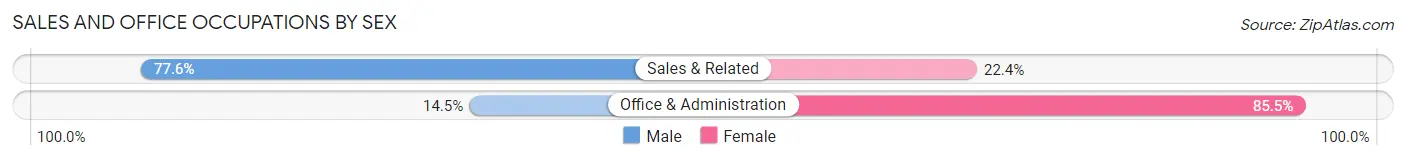
| Occupation | Male | Female |
| Sales & Related | 360 (77.6%) | 104 (22.4%) |
| Office & Administration | 101 (14.5%) | 594 (85.5%) |
| Total (Category) | 461 (39.8%) | 698 (60.2%) |
| Total (Overall) | 2,521 (49.7%) | 2,548 (50.3%) |
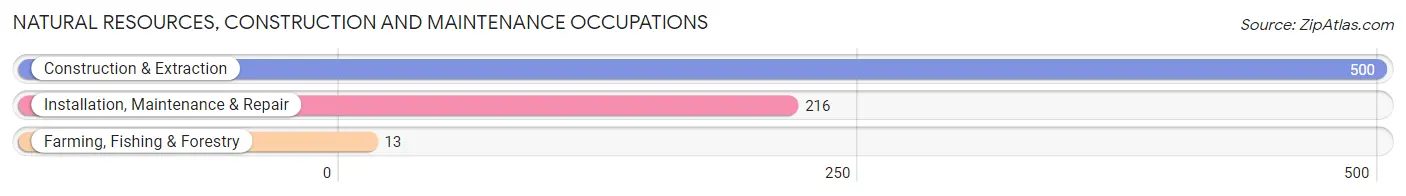
Natural Resources, Construction and Maintenance Occupations
The most common Natural Resources, Construction and Maintenance occupations in Cumberland County are Construction & Extraction (500 | 9.9%), Installation, Maintenance & Repair (216 | 4.3%), and Farming, Fishing & Forestry (13 | 0.3%).
Natural Resources, Construction and Maintenance Occupations by Sex
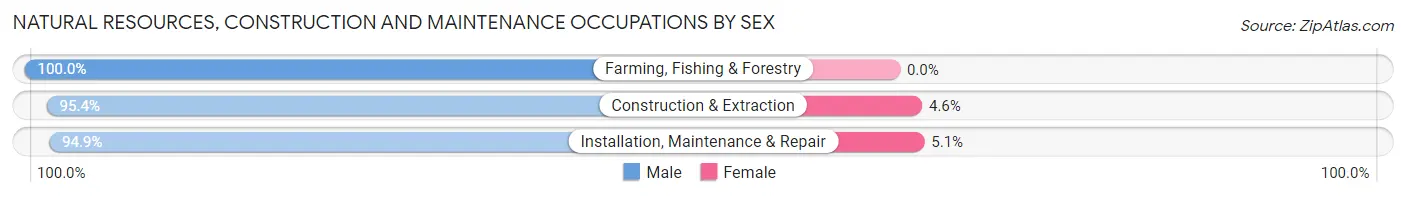
| Occupation | Male | Female |
| Farming, Fishing & Forestry | 13 (100.0%) | 0 (0.0%) |
| Construction & Extraction | 477 (95.4%) | 23 (4.6%) |
| Installation, Maintenance & Repair | 205 (94.9%) | 11 (5.1%) |
| Total (Category) | 695 (95.3%) | 34 (4.7%) |
| Total (Overall) | 2,521 (49.7%) | 2,548 (50.3%) |
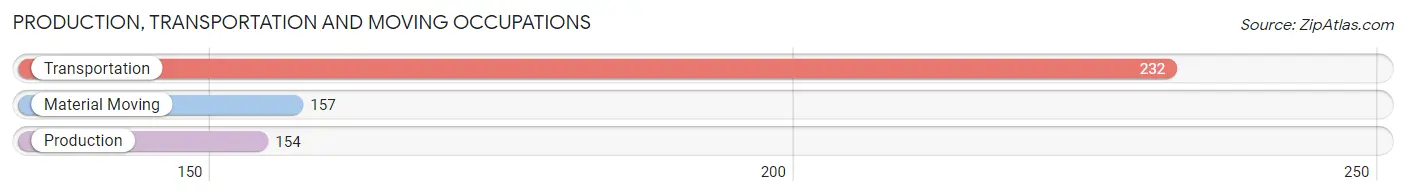
Production, Transportation and Moving Occupations
The most common Production, Transportation and Moving occupations in Cumberland County are Transportation (232 | 4.6%), Material Moving (157 | 3.1%), and Production (154 | 3.0%).
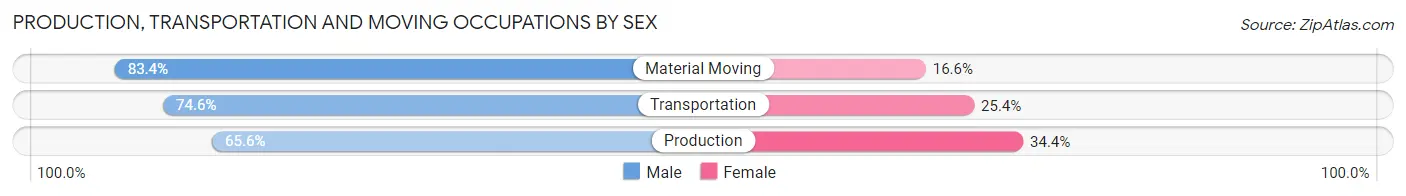
Production, Transportation and Moving Occupations by Sex
| Occupation | Male | Female |
| Production | 101 (65.6%) | 53 (34.4%) |
| Transportation | 173 (74.6%) | 59 (25.4%) |
| Material Moving | 131 (83.4%) | 26 (16.6%) |
| Total (Category) | 405 (74.6%) | 138 (25.4%) |
| Total (Overall) | 2,521 (49.7%) | 2,548 (50.3%) |
Employment Industries by Sex in Cumberland County
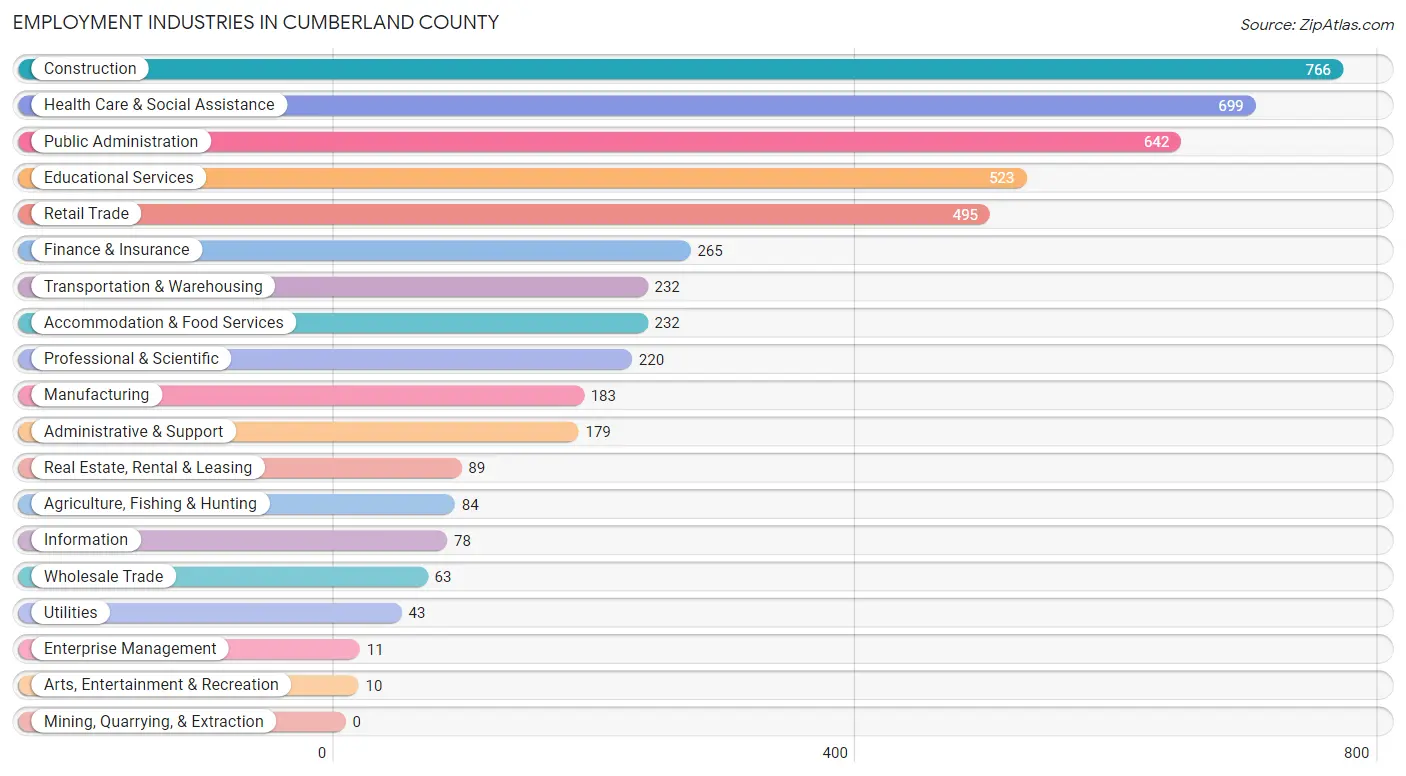
Employment Industries in Cumberland County
The major employment industries in Cumberland County include Construction (766 | 15.1%), Health Care & Social Assistance (699 | 13.8%), Public Administration (642 | 12.7%), Educational Services (523 | 10.3%), and Retail Trade (495 | 9.8%).
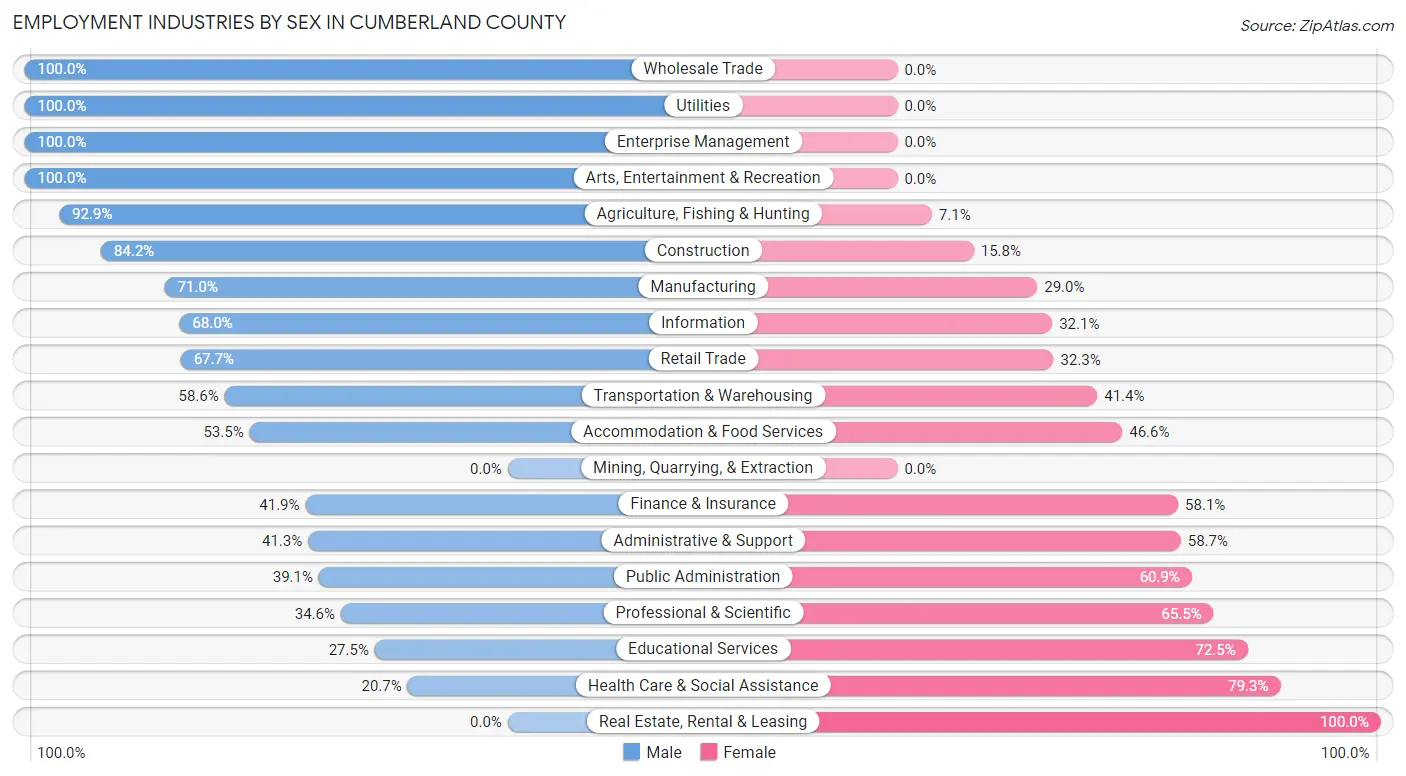
Employment Industries by Sex in Cumberland County
The Cumberland County industries that see more men than women are Wholesale Trade (100.0%), Utilities (100.0%), and Enterprise Management (100.0%), whereas the industries that tend to have a higher number of women are Real Estate, Rental & Leasing (100.0%), Health Care & Social Assistance (79.3%), and Educational Services (72.5%).
| Industry | Male | Female |
| Agriculture, Fishing & Hunting | 78 (92.9%) | 6 (7.1%) |
| Mining, Quarrying, & Extraction | 0 (0.0%) | 0 (0.0%) |
| Construction | 645 (84.2%) | 121 (15.8%) |
| Manufacturing | 130 (71.0%) | 53 (29.0%) |
| Wholesale Trade | 63 (100.0%) | 0 (0.0%) |
| Retail Trade | 335 (67.7%) | 160 (32.3%) |
| Transportation & Warehousing | 136 (58.6%) | 96 (41.4%) |
| Utilities | 43 (100.0%) | 0 (0.0%) |
| Information | 53 (67.9%) | 25 (32.1%) |
| Finance & Insurance | 111 (41.9%) | 154 (58.1%) |
| Real Estate, Rental & Leasing | 0 (0.0%) | 89 (100.0%) |
| Professional & Scientific | 76 (34.5%) | 144 (65.4%) |
| Enterprise Management | 11 (100.0%) | 0 (0.0%) |
| Administrative & Support | 74 (41.3%) | 105 (58.7%) |
| Educational Services | 144 (27.5%) | 379 (72.5%) |
| Health Care & Social Assistance | 145 (20.7%) | 554 (79.3%) |
| Arts, Entertainment & Recreation | 10 (100.0%) | 0 (0.0%) |
| Accommodation & Food Services | 124 (53.4%) | 108 (46.6%) |
| Public Administration | 251 (39.1%) | 391 (60.9%) |
| Total | 2,521 (49.7%) | 2,548 (50.3%) |
Education in Cumberland County
School Enrollment in Cumberland County
The most common levels of schooling among the 1,727 students in Cumberland County are high school (616 | 35.7%), middle school (506 | 29.3%), and elementary school (347 | 20.1%).
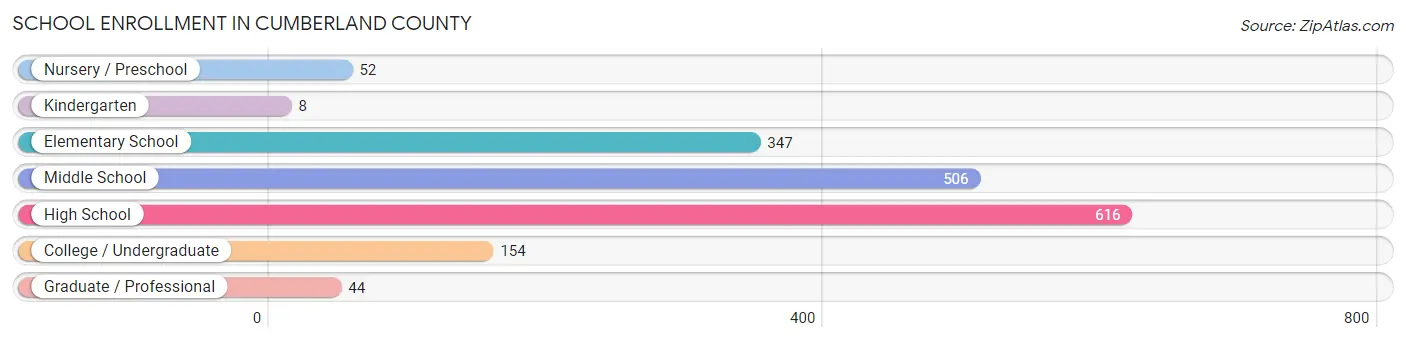
| School Level | # Students | % Students |
| Nursery / Preschool | 52 | 3.0% |
| Kindergarten | 8 | 0.5% |
| Elementary School | 347 | 20.1% |
| Middle School | 506 | 29.3% |
| High School | 616 | 35.7% |
| College / Undergraduate | 154 | 8.9% |
| Graduate / Professional | 44 | 2.5% |
| Total | 1,727 | 100.0% |
School Enrollment by Age by Funding Source in Cumberland County
Out of a total of 1,727 students who are enrolled in schools in Cumberland County, 292 (16.9%) attend a private institution, while the remaining 1,435 (83.1%) are enrolled in public schools. The age group of 20 to 24 year olds has the highest likelihood of being enrolled in private schools, with 11 (68.8% in the age bracket) enrolled. Conversely, the age group of 3 to 4 year olds has the lowest likelihood of being enrolled in a private school, with 52 (100.0% in the age bracket) attending a public institution.
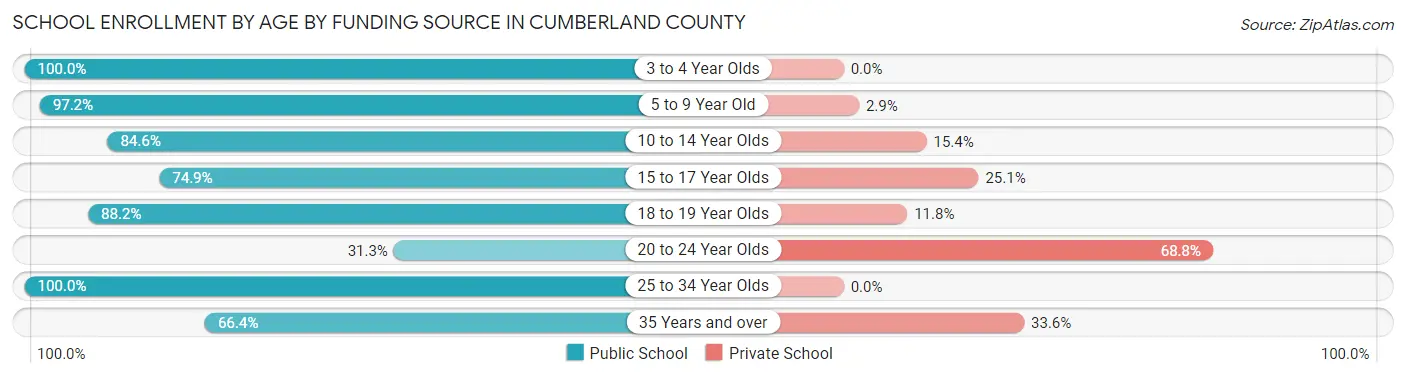
| Age Bracket | Public School | Private School |
| 3 to 4 Year Olds | 52 (100.0%) | 0 (0.0%) |
| 5 to 9 Year Old | 273 (97.2%) | 8 (2.9%) |
| 10 to 14 Year Olds | 608 (84.6%) | 111 (15.4%) |
| 15 to 17 Year Olds | 334 (74.9%) | 112 (25.1%) |
| 18 to 19 Year Olds | 67 (88.2%) | 9 (11.8%) |
| 20 to 24 Year Olds | 5 (31.2%) | 11 (68.8%) |
| 25 to 34 Year Olds | 18 (100.0%) | 0 (0.0%) |
| 35 Years and over | 79 (66.4%) | 40 (33.6%) |
| Total | 1,435 (83.1%) | 292 (16.9%) |
Educational Attainment by Field of Study in Cumberland County
Business (297 | 19.2%), social sciences (247 | 16.0%), science & technology (172 | 11.1%), education (162 | 10.5%), and arts & humanities (133 | 8.6%) are the most common fields of study among 1,548 individuals in Cumberland County who have obtained a bachelor's degree or higher.
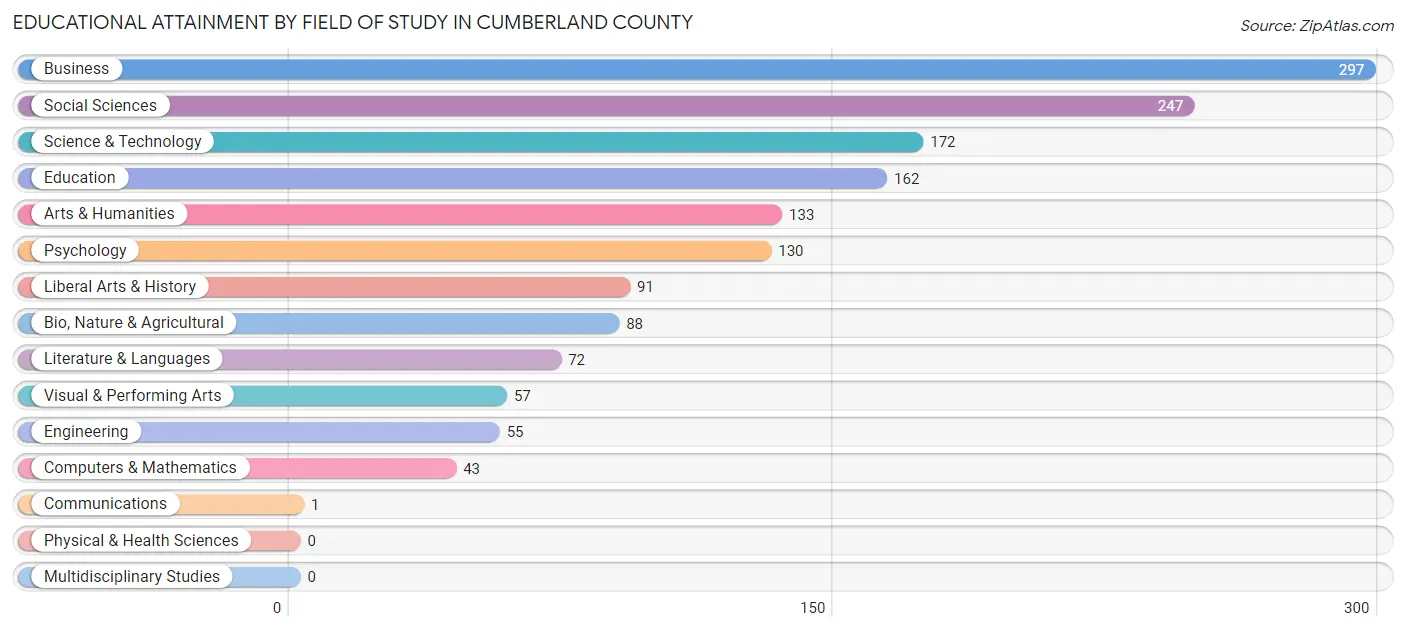
| Field of Study | # Graduates | % Graduates |
| Computers & Mathematics | 43 | 2.8% |
| Bio, Nature & Agricultural | 88 | 5.7% |
| Physical & Health Sciences | 0 | 0.0% |
| Psychology | 130 | 8.4% |
| Social Sciences | 247 | 16.0% |
| Engineering | 55 | 3.5% |
| Multidisciplinary Studies | 0 | 0.0% |
| Science & Technology | 172 | 11.1% |
| Business | 297 | 19.2% |
| Education | 162 | 10.5% |
| Literature & Languages | 72 | 4.6% |
| Liberal Arts & History | 91 | 5.9% |
| Visual & Performing Arts | 57 | 3.7% |
| Communications | 1 | 0.1% |
| Arts & Humanities | 133 | 8.6% |
| Total | 1,548 | 100.0% |
Transportation & Commute in Cumberland County
Vehicle Availability by Sex in Cumberland County
The most prevalent vehicle ownership categories in Cumberland County are males with 3 vehicles (817, accounting for 32.8%) and females with 3 vehicles (538, making up 33.7%).
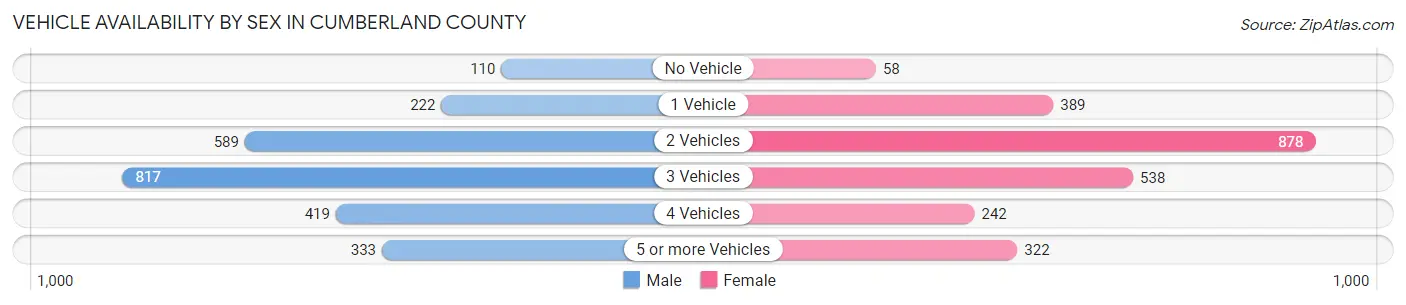
| Vehicles Available | Male | Female |
| No Vehicle | 110 (4.4%) | 58 (2.4%) |
| 1 Vehicle | 222 (8.9%) | 389 (16.0%) |
| 2 Vehicles | 589 (23.6%) | 878 (36.2%) |
| 3 Vehicles | 817 (32.8%) | 538 (22.2%) |
| 4 Vehicles | 419 (16.8%) | 242 (10.0%) |
| 5 or more Vehicles | 333 (13.4%) | 322 (13.3%) |
| Total | 2,490 (100.0%) | 2,427 (100.0%) |
Commute Time in Cumberland County
The most frequently occuring commute durations in Cumberland County are 60 to 89 minutes (1,028 commuters, 22.9%), 30 to 34 minutes (598 commuters, 13.3%), and 10 to 14 minutes (539 commuters, 12.0%).
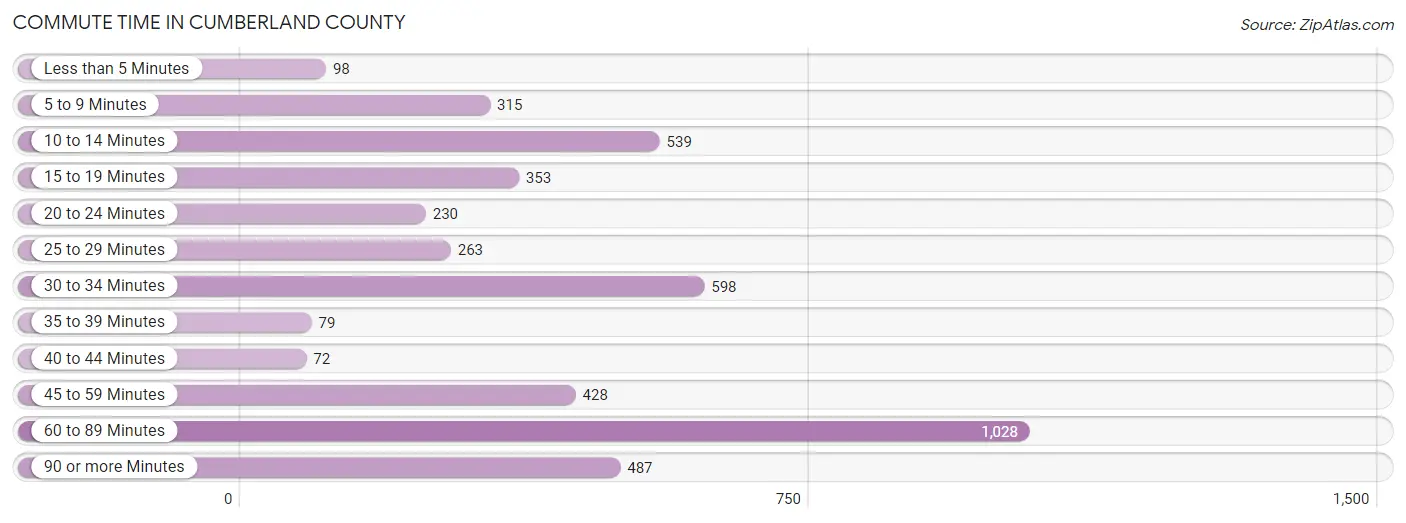
| Commute Time | # Commuters | % Commuters |
| Less than 5 Minutes | 98 | 2.2% |
| 5 to 9 Minutes | 315 | 7.0% |
| 10 to 14 Minutes | 539 | 12.0% |
| 15 to 19 Minutes | 353 | 7.9% |
| 20 to 24 Minutes | 230 | 5.1% |
| 25 to 29 Minutes | 263 | 5.9% |
| 30 to 34 Minutes | 598 | 13.3% |
| 35 to 39 Minutes | 79 | 1.8% |
| 40 to 44 Minutes | 72 | 1.6% |
| 45 to 59 Minutes | 428 | 9.5% |
| 60 to 89 Minutes | 1,028 | 22.9% |
| 90 or more Minutes | 487 | 10.8% |
Commute Time by Sex in Cumberland County
The most common commute times in Cumberland County are 60 to 89 minutes (690 commuters, 30.9%) for males and 30 to 34 minutes (445 commuters, 19.7%) for females.
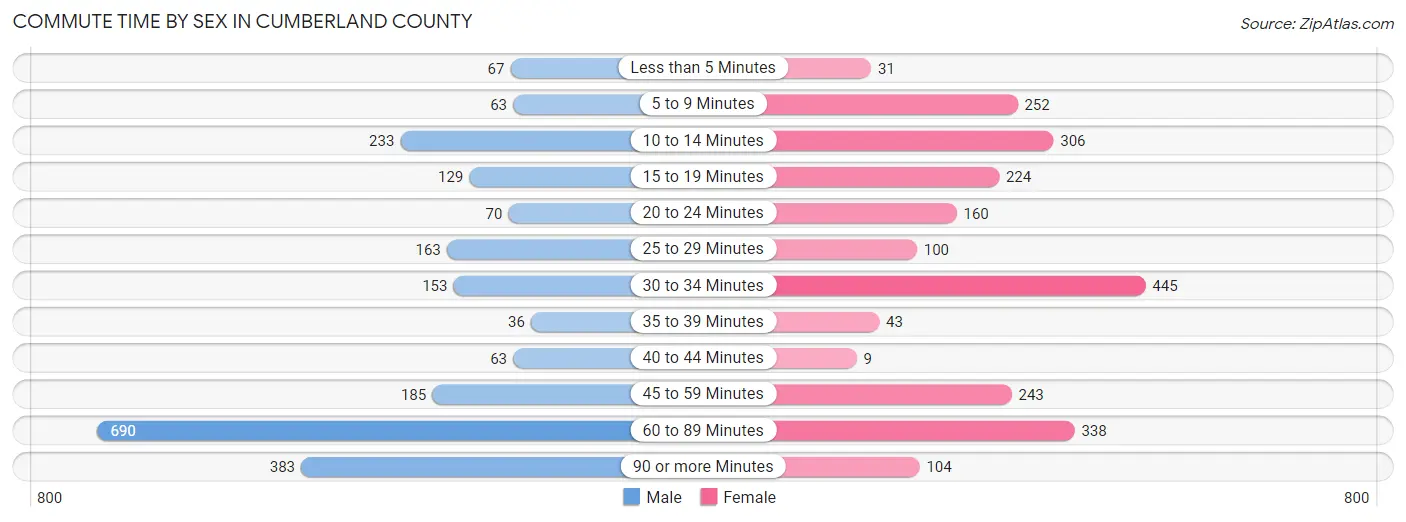
| Commute Time | Male | Female |
| Less than 5 Minutes | 67 (3.0%) | 31 (1.4%) |
| 5 to 9 Minutes | 63 (2.8%) | 252 (11.2%) |
| 10 to 14 Minutes | 233 (10.4%) | 306 (13.6%) |
| 15 to 19 Minutes | 129 (5.8%) | 224 (9.9%) |
| 20 to 24 Minutes | 70 (3.1%) | 160 (7.1%) |
| 25 to 29 Minutes | 163 (7.3%) | 100 (4.4%) |
| 30 to 34 Minutes | 153 (6.9%) | 445 (19.7%) |
| 35 to 39 Minutes | 36 (1.6%) | 43 (1.9%) |
| 40 to 44 Minutes | 63 (2.8%) | 9 (0.4%) |
| 45 to 59 Minutes | 185 (8.3%) | 243 (10.8%) |
| 60 to 89 Minutes | 690 (30.9%) | 338 (15.0%) |
| 90 or more Minutes | 383 (17.1%) | 104 (4.6%) |
Time of Departure to Work by Sex in Cumberland County
The most frequent times of departure to work in Cumberland County are 9:00 AM to 9:59 AM (371, 16.6%) for males and 6:30 AM to 6:59 AM (475, 21.1%) for females.
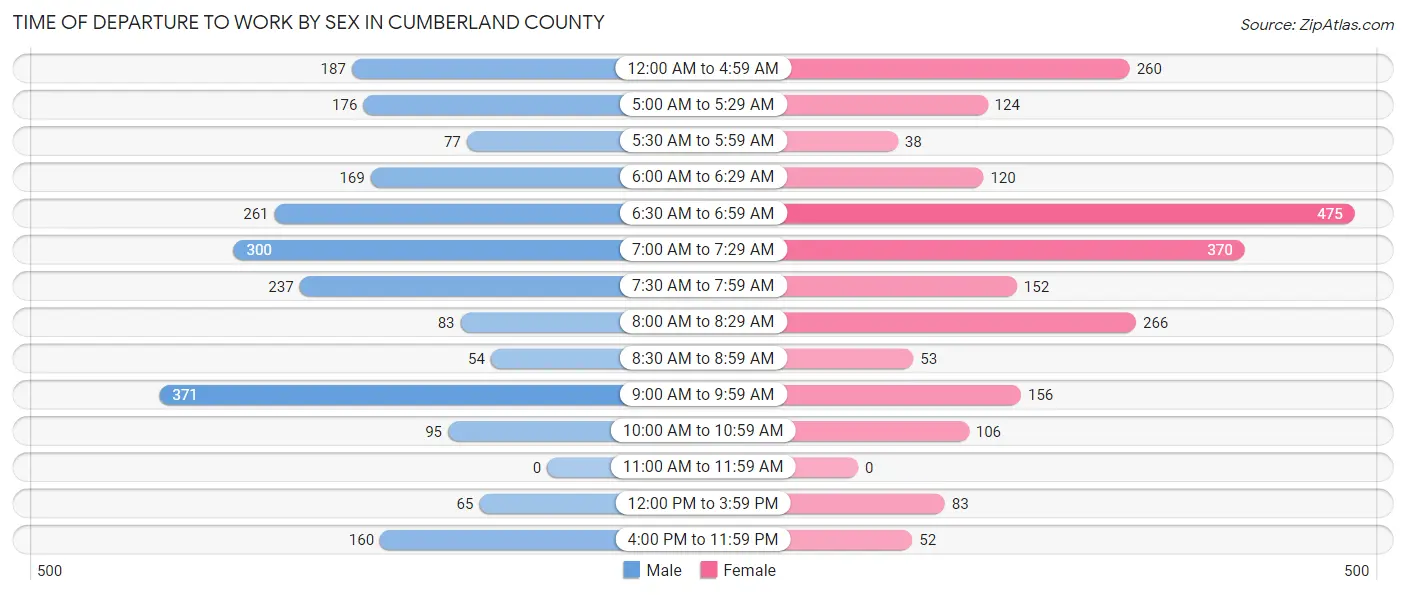
| Time of Departure | Male | Female |
| 12:00 AM to 4:59 AM | 187 (8.4%) | 260 (11.5%) |
| 5:00 AM to 5:29 AM | 176 (7.9%) | 124 (5.5%) |
| 5:30 AM to 5:59 AM | 77 (3.5%) | 38 (1.7%) |
| 6:00 AM to 6:29 AM | 169 (7.6%) | 120 (5.3%) |
| 6:30 AM to 6:59 AM | 261 (11.7%) | 475 (21.1%) |
| 7:00 AM to 7:29 AM | 300 (13.4%) | 370 (16.4%) |
| 7:30 AM to 7:59 AM | 237 (10.6%) | 152 (6.7%) |
| 8:00 AM to 8:29 AM | 83 (3.7%) | 266 (11.8%) |
| 8:30 AM to 8:59 AM | 54 (2.4%) | 53 (2.4%) |
| 9:00 AM to 9:59 AM | 371 (16.6%) | 156 (6.9%) |
| 10:00 AM to 10:59 AM | 95 (4.3%) | 106 (4.7%) |
| 11:00 AM to 11:59 AM | 0 (0.0%) | 0 (0.0%) |
| 12:00 PM to 3:59 PM | 65 (2.9%) | 83 (3.7%) |
| 4:00 PM to 11:59 PM | 160 (7.2%) | 52 (2.3%) |
| Total | 2,235 (100.0%) | 2,255 (100.0%) |
Housing Occupancy in Cumberland County
Occupancy by Ownership in Cumberland County
Of the total 4,055 dwellings in Cumberland County, owner-occupied units account for 3,146 (77.6%), while renter-occupied units make up 909 (22.4%).
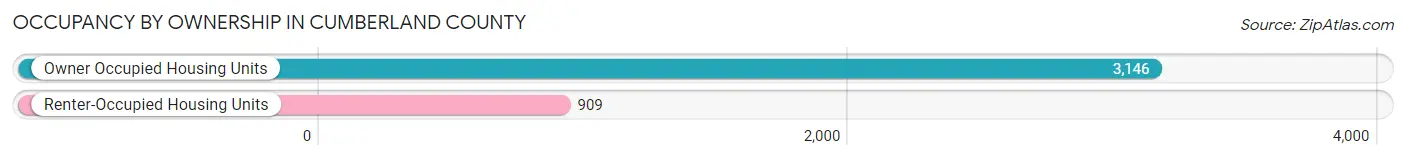
| Occupancy | # Housing Units | % Housing Units |
| Owner Occupied Housing Units | 3,146 | 77.6% |
| Renter-Occupied Housing Units | 909 | 22.4% |
| Total Occupied Housing Units | 4,055 | 100.0% |
Occupancy by Household Size in Cumberland County
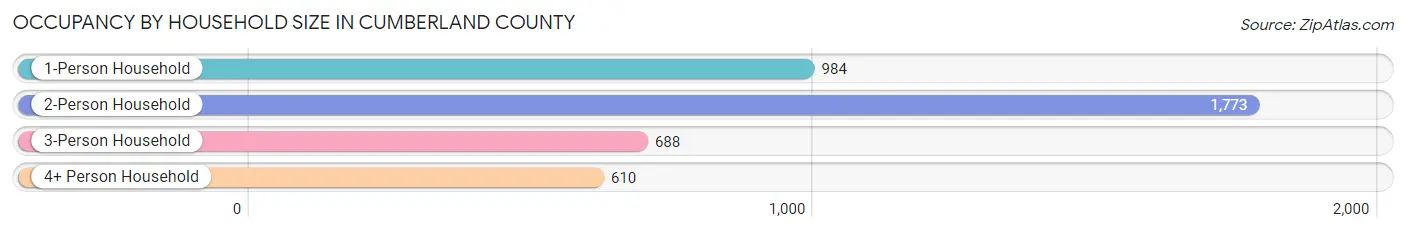
| Household Size | # Housing Units | % Housing Units |
| 1-Person Household | 984 | 24.3% |
| 2-Person Household | 1,773 | 43.7% |
| 3-Person Household | 688 | 17.0% |
| 4+ Person Household | 610 | 15.0% |
| Total Housing Units | 4,055 | 100.0% |
Occupancy by Ownership by Household Size in Cumberland County
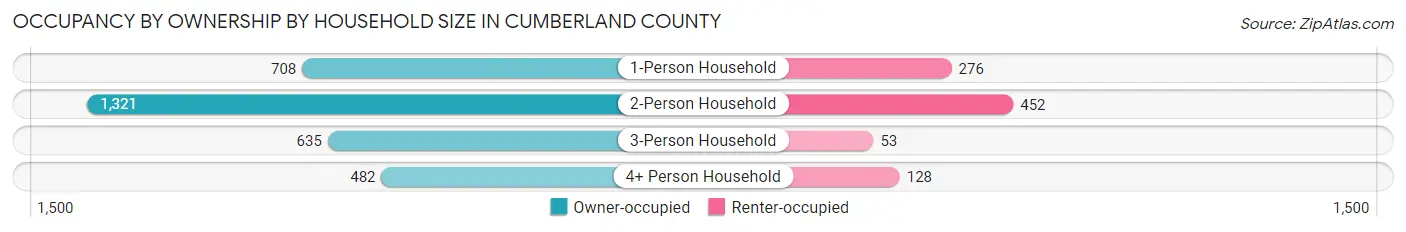
| Household Size | Owner-occupied | Renter-occupied |
| 1-Person Household | 708 (72.0%) | 276 (28.1%) |
| 2-Person Household | 1,321 (74.5%) | 452 (25.5%) |
| 3-Person Household | 635 (92.3%) | 53 (7.7%) |
| 4+ Person Household | 482 (79.0%) | 128 (21.0%) |
| Total Housing Units | 3,146 (77.6%) | 909 (22.4%) |
Occupancy by Educational Attainment in Cumberland County
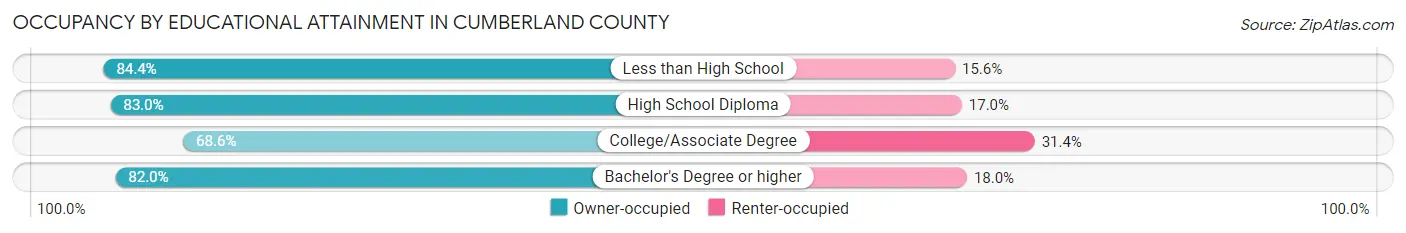
| Household Size | Owner-occupied | Renter-occupied |
| Less than High School | 480 (84.4%) | 89 (15.6%) |
| High School Diploma | 997 (83.0%) | 204 (17.0%) |
| College/Associate Degree | 1,045 (68.6%) | 479 (31.4%) |
| Bachelor's Degree or higher | 624 (82.0%) | 137 (18.0%) |
Occupancy by Age of Householder in Cumberland County
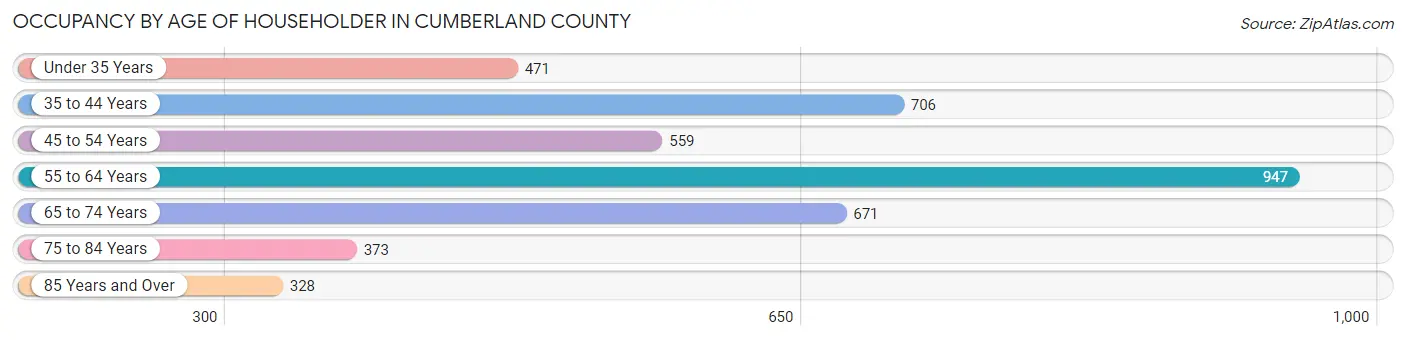
| Age Bracket | # Households | % Households |
| Under 35 Years | 471 | 11.6% |
| 35 to 44 Years | 706 | 17.4% |
| 45 to 54 Years | 559 | 13.8% |
| 55 to 64 Years | 947 | 23.4% |
| 65 to 74 Years | 671 | 16.6% |
| 75 to 84 Years | 373 | 9.2% |
| 85 Years and Over | 328 | 8.1% |
| Total | 4,055 | 100.0% |
Housing Finances in Cumberland County
Median Income by Occupancy in Cumberland County
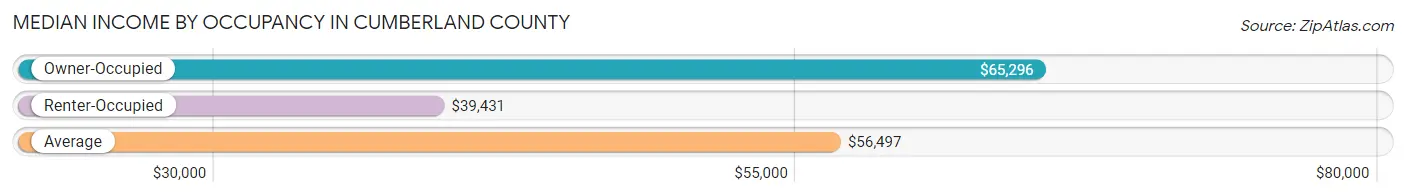
| Occupancy Type | # Households | Median Income |
| Owner-Occupied | 3,146 (77.6%) | $65,296 |
| Renter-Occupied | 909 (22.4%) | $39,431 |
| Average | 4,055 (100.0%) | $56,497 |
Occupancy by Householder Income Bracket in Cumberland County
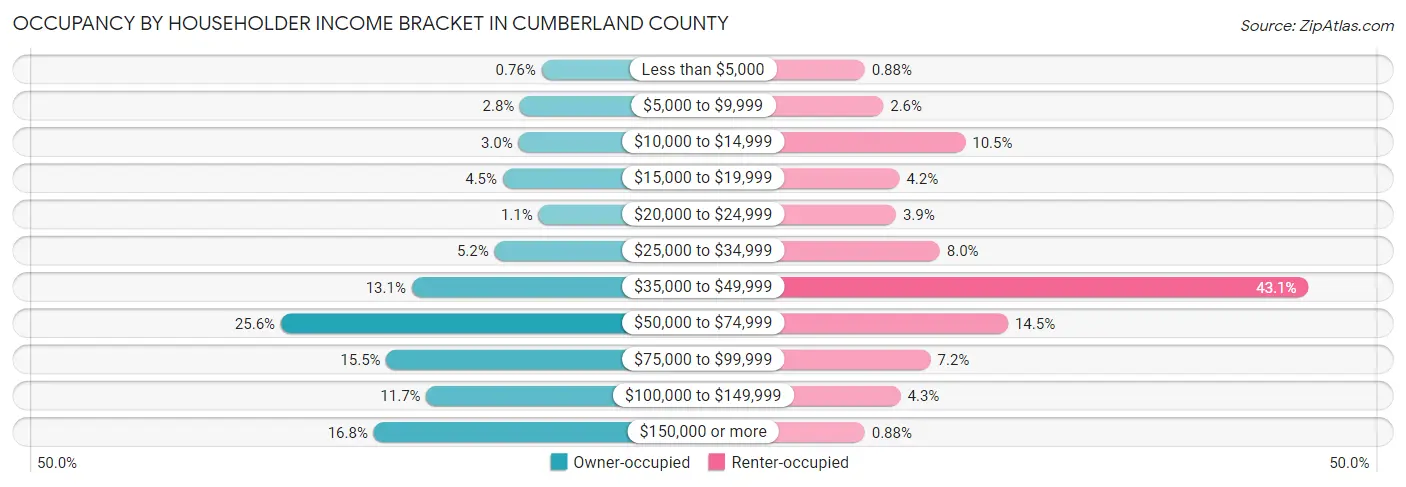
| Income Bracket | Owner-occupied | Renter-occupied |
| Less than $5,000 | 24 (0.8%) | 8 (0.9%) |
| $5,000 to $9,999 | 88 (2.8%) | 24 (2.6%) |
| $10,000 to $14,999 | 93 (3.0%) | 95 (10.4%) |
| $15,000 to $19,999 | 140 (4.4%) | 38 (4.2%) |
| $20,000 to $24,999 | 33 (1.1%) | 35 (3.8%) |
| $25,000 to $34,999 | 165 (5.2%) | 73 (8.0%) |
| $35,000 to $49,999 | 413 (13.1%) | 392 (43.1%) |
| $50,000 to $74,999 | 805 (25.6%) | 132 (14.5%) |
| $75,000 to $99,999 | 489 (15.5%) | 65 (7.1%) |
| $100,000 to $149,999 | 369 (11.7%) | 39 (4.3%) |
| $150,000 or more | 527 (16.8%) | 8 (0.9%) |
| Total | 3,146 (100.0%) | 909 (100.0%) |
Monthly Housing Cost Tiers in Cumberland County
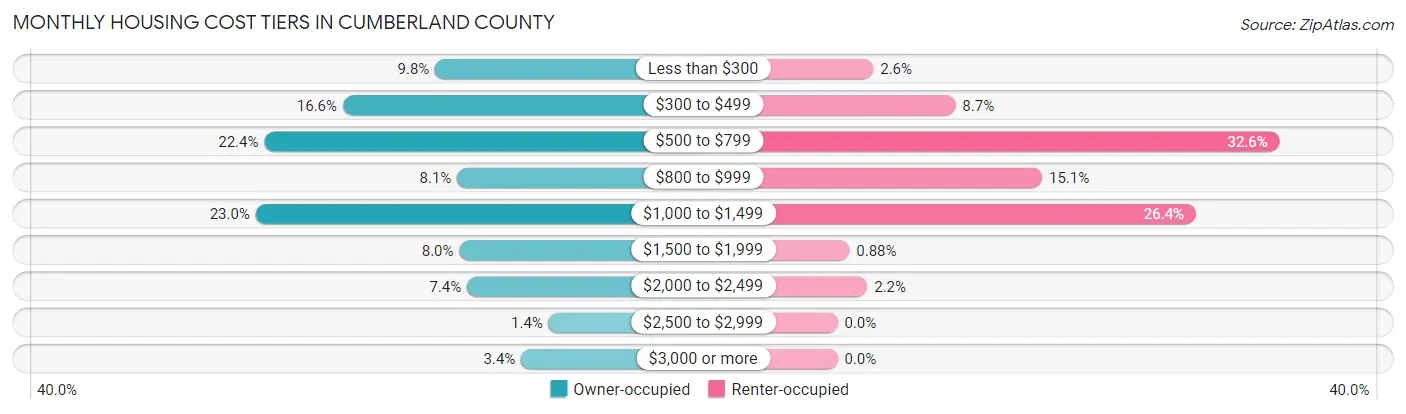
| Monthly Cost | Owner-occupied | Renter-occupied |
| Less than $300 | 307 (9.8%) | 24 (2.6%) |
| $300 to $499 | 521 (16.6%) | 79 (8.7%) |
| $500 to $799 | 703 (22.4%) | 296 (32.6%) |
| $800 to $999 | 256 (8.1%) | 137 (15.1%) |
| $1,000 to $1,499 | 723 (23.0%) | 240 (26.4%) |
| $1,500 to $1,999 | 251 (8.0%) | 8 (0.9%) |
| $2,000 to $2,499 | 233 (7.4%) | 20 (2.2%) |
| $2,500 to $2,999 | 44 (1.4%) | 0 (0.0%) |
| $3,000 or more | 108 (3.4%) | 0 (0.0%) |
| Total | 3,146 (100.0%) | 909 (100.0%) |
Physical Housing Characteristics in Cumberland County
Housing Structures in Cumberland County
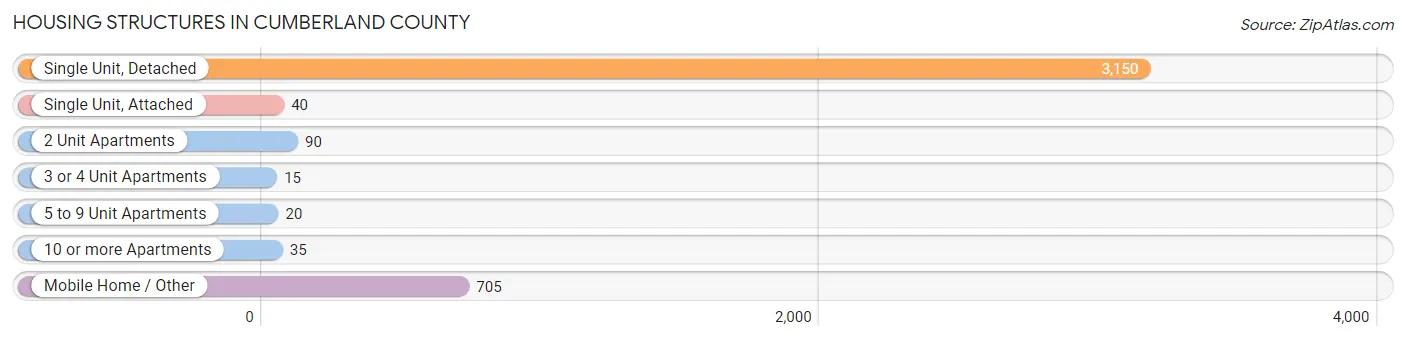
| Structure Type | # Housing Units | % Housing Units |
| Single Unit, Detached | 3,150 | 77.7% |
| Single Unit, Attached | 40 | 1.0% |
| 2 Unit Apartments | 90 | 2.2% |
| 3 or 4 Unit Apartments | 15 | 0.4% |
| 5 to 9 Unit Apartments | 20 | 0.5% |
| 10 or more Apartments | 35 | 0.9% |
| Mobile Home / Other | 705 | 17.4% |
| Total | 4,055 | 100.0% |
Housing Structures by Occupancy in Cumberland County
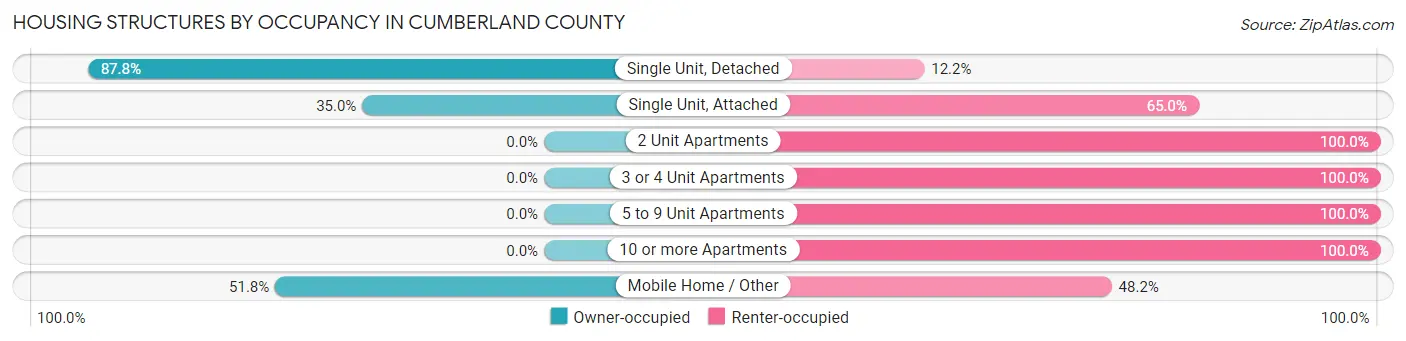
| Structure Type | Owner-occupied | Renter-occupied |
| Single Unit, Detached | 2,767 (87.8%) | 383 (12.2%) |
| Single Unit, Attached | 14 (35.0%) | 26 (65.0%) |
| 2 Unit Apartments | 0 (0.0%) | 90 (100.0%) |
| 3 or 4 Unit Apartments | 0 (0.0%) | 15 (100.0%) |
| 5 to 9 Unit Apartments | 0 (0.0%) | 20 (100.0%) |
| 10 or more Apartments | 0 (0.0%) | 35 (100.0%) |
| Mobile Home / Other | 365 (51.8%) | 340 (48.2%) |
| Total | 3,146 (77.6%) | 909 (22.4%) |
Housing Structures by Number of Rooms in Cumberland County
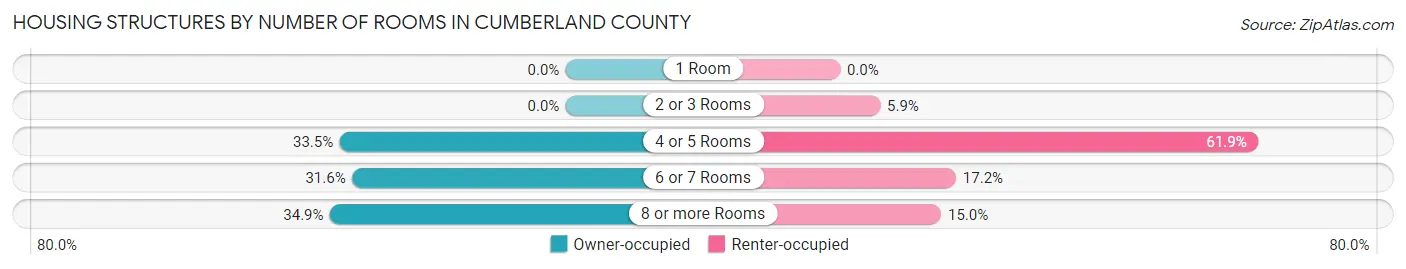
| Number of Rooms | Owner-occupied | Renter-occupied |
| 1 Room | 0 (0.0%) | 0 (0.0%) |
| 2 or 3 Rooms | 0 (0.0%) | 54 (5.9%) |
| 4 or 5 Rooms | 1,053 (33.5%) | 563 (61.9%) |
| 6 or 7 Rooms | 995 (31.6%) | 156 (17.2%) |
| 8 or more Rooms | 1,098 (34.9%) | 136 (15.0%) |
| Total | 3,146 (100.0%) | 909 (100.0%) |
Housing Structure by Heating Type in Cumberland County
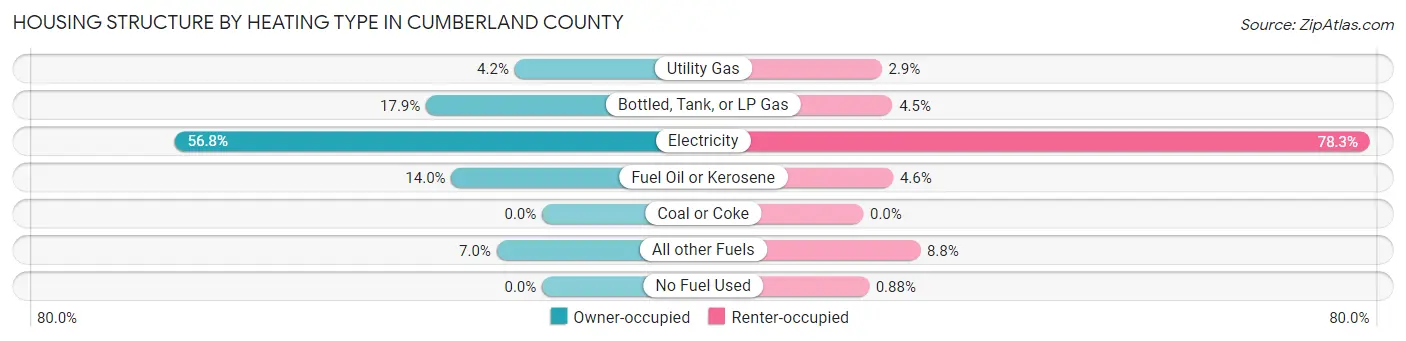
| Heating Type | Owner-occupied | Renter-occupied |
| Utility Gas | 133 (4.2%) | 26 (2.9%) |
| Bottled, Tank, or LP Gas | 564 (17.9%) | 41 (4.5%) |
| Electricity | 1,787 (56.8%) | 712 (78.3%) |
| Fuel Oil or Kerosene | 441 (14.0%) | 42 (4.6%) |
| Coal or Coke | 0 (0.0%) | 0 (0.0%) |
| All other Fuels | 221 (7.0%) | 80 (8.8%) |
| No Fuel Used | 0 (0.0%) | 8 (0.9%) |
| Total | 3,146 (100.0%) | 909 (100.0%) |
Household Vehicle Usage in Cumberland County
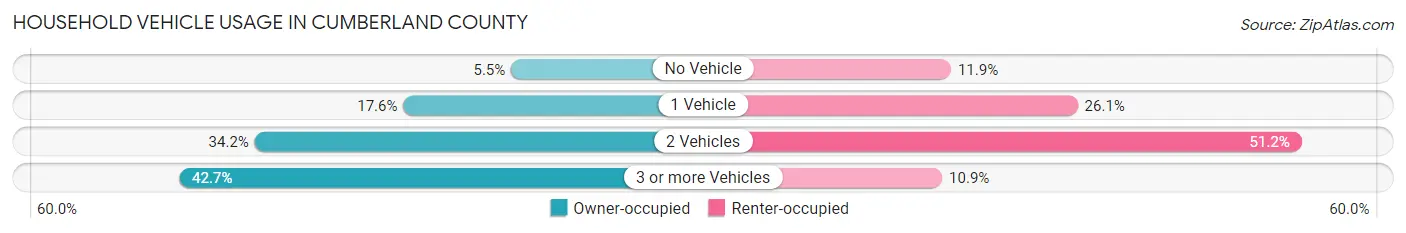
| Vehicles per Household | Owner-occupied | Renter-occupied |
| No Vehicle | 173 (5.5%) | 108 (11.9%) |
| 1 Vehicle | 553 (17.6%) | 237 (26.1%) |
| 2 Vehicles | 1,077 (34.2%) | 465 (51.2%) |
| 3 or more Vehicles | 1,343 (42.7%) | 99 (10.9%) |
| Total | 3,146 (100.0%) | 909 (100.0%) |
Real Estate & Mortgages in Cumberland County
Real Estate and Mortgage Overview in Cumberland County
| Characteristic | Without Mortgage | With Mortgage |
| Housing Units | 1,596 | 1,550 |
| Median Property Value | $203,000 | $213,400 |
| Median Household Income | $63,297 | $238 |
| Monthly Housing Costs | $490 | $108 |
| Real Estate Taxes | $1,257 | $53 |
Property Value by Mortgage Status in Cumberland County
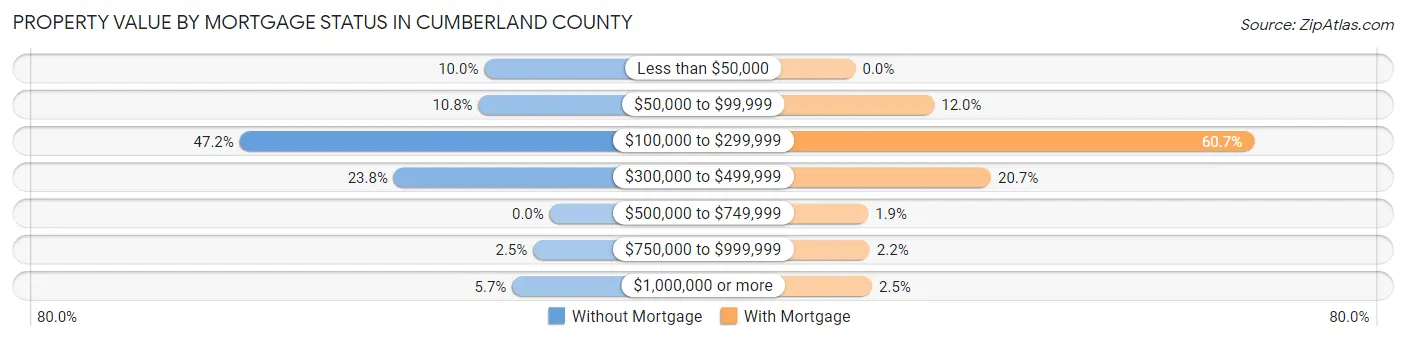
| Property Value | Without Mortgage | With Mortgage |
| Less than $50,000 | 159 (10.0%) | 0 (0.0%) |
| $50,000 to $99,999 | 173 (10.8%) | 186 (12.0%) |
| $100,000 to $299,999 | 754 (47.2%) | 941 (60.7%) |
| $300,000 to $499,999 | 379 (23.7%) | 320 (20.6%) |
| $500,000 to $749,999 | 0 (0.0%) | 30 (1.9%) |
| $750,000 to $999,999 | 40 (2.5%) | 34 (2.2%) |
| $1,000,000 or more | 91 (5.7%) | 39 (2.5%) |
| Total | 1,596 (100.0%) | 1,550 (100.0%) |
Household Income by Mortgage Status in Cumberland County
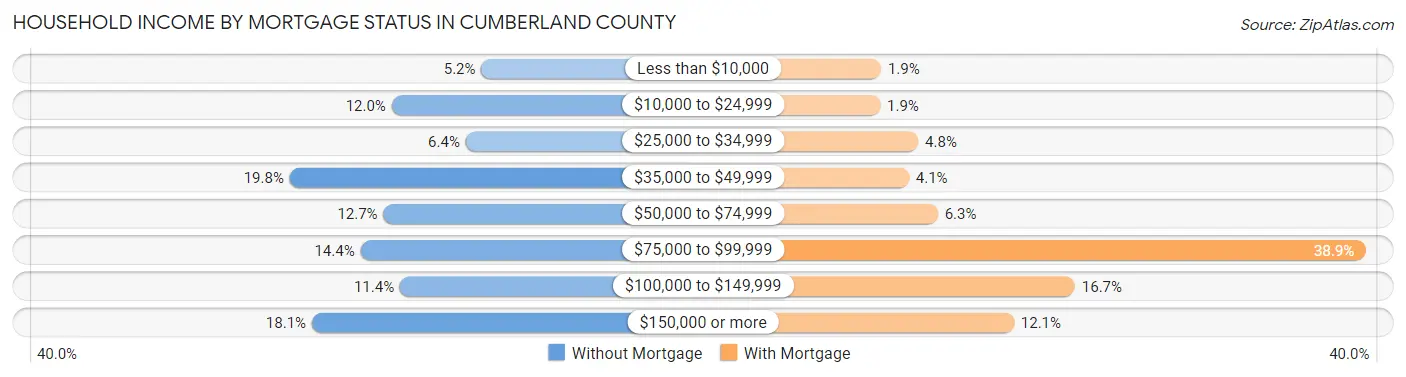
| Household Income | Without Mortgage | With Mortgage |
| Less than $10,000 | 83 (5.2%) | 30 (1.9%) |
| $10,000 to $24,999 | 192 (12.0%) | 29 (1.9%) |
| $25,000 to $34,999 | 102 (6.4%) | 74 (4.8%) |
| $35,000 to $49,999 | 316 (19.8%) | 63 (4.1%) |
| $50,000 to $74,999 | 202 (12.7%) | 97 (6.3%) |
| $75,000 to $99,999 | 230 (14.4%) | 603 (38.9%) |
| $100,000 to $149,999 | 182 (11.4%) | 259 (16.7%) |
| $150,000 or more | 289 (18.1%) | 187 (12.1%) |
| Total | 1,596 (100.0%) | 1,550 (100.0%) |
Property Value to Household Income Ratio in Cumberland County
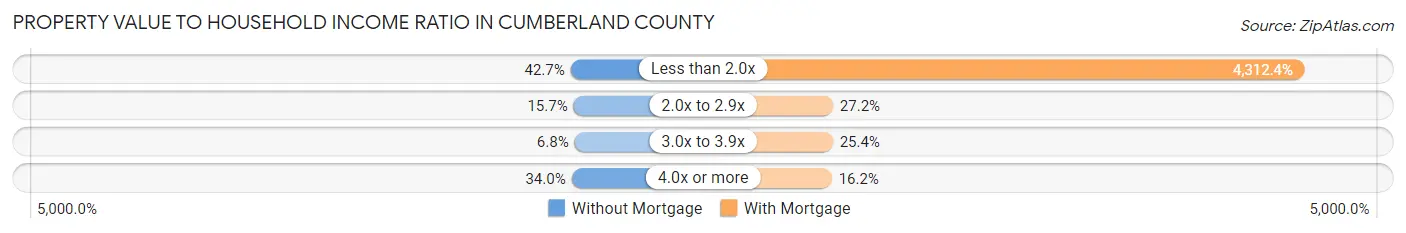
| Value-to-Income Ratio | Without Mortgage | With Mortgage |
| Less than 2.0x | 682 (42.7%) | 66,842 (4,312.4%) |
| 2.0x to 2.9x | 251 (15.7%) | 421 (27.2%) |
| 3.0x to 3.9x | 108 (6.8%) | 393 (25.4%) |
| 4.0x or more | 543 (34.0%) | 251 (16.2%) |
| Total | 1,596 (100.0%) | 1,550 (100.0%) |
Real Estate Taxes by Mortgage Status in Cumberland County
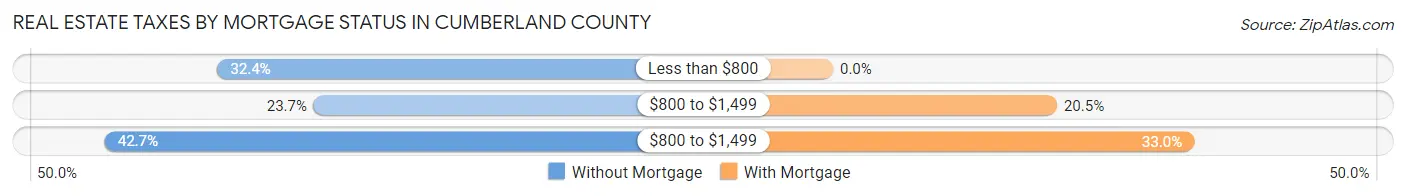
| Property Taxes | Without Mortgage | With Mortgage |
| Less than $800 | 517 (32.4%) | 0 (0.0%) |
| $800 to $1,499 | 378 (23.7%) | 317 (20.4%) |
| $800 to $1,499 | 681 (42.7%) | 511 (33.0%) |
| Total | 1,596 (100.0%) | 1,550 (100.0%) |
Health & Disability in Cumberland County
Health Insurance Coverage by Age in Cumberland County
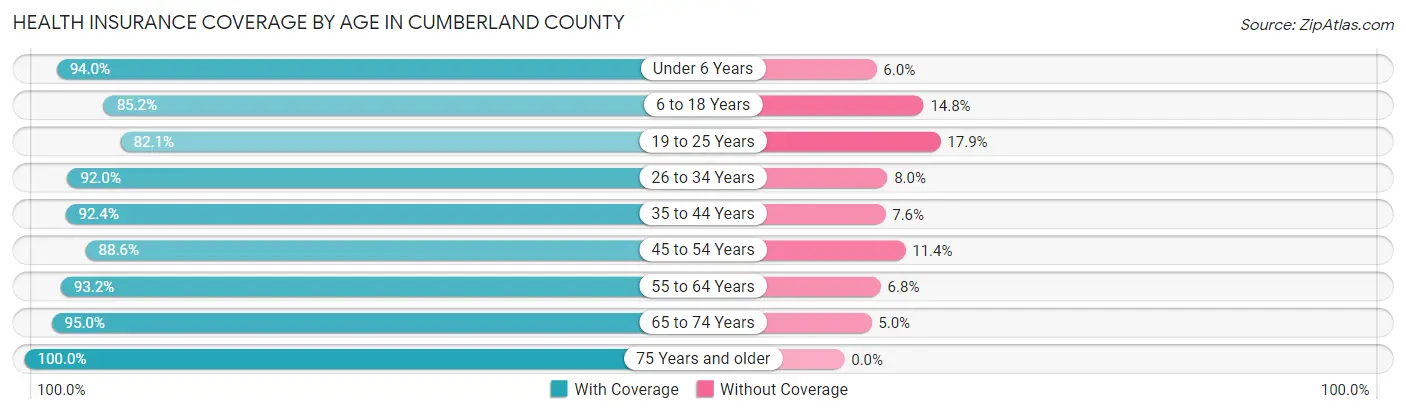
| Age Bracket | With Coverage | Without Coverage |
| Under 6 Years | 424 (94.0%) | 27 (6.0%) |
| 6 to 18 Years | 1,294 (85.2%) | 224 (14.8%) |
| 19 to 25 Years | 449 (82.1%) | 98 (17.9%) |
| 26 to 34 Years | 1,001 (92.0%) | 87 (8.0%) |
| 35 to 44 Years | 1,004 (92.4%) | 83 (7.6%) |
| 45 to 54 Years | 1,153 (88.6%) | 148 (11.4%) |
| 55 to 64 Years | 1,402 (93.2%) | 102 (6.8%) |
| 65 to 74 Years | 1,188 (95.0%) | 63 (5.0%) |
| 75 Years and older | 950 (100.0%) | 0 (0.0%) |
| Total | 8,865 (91.4%) | 832 (8.6%) |
Health Insurance Coverage by Citizenship Status in Cumberland County
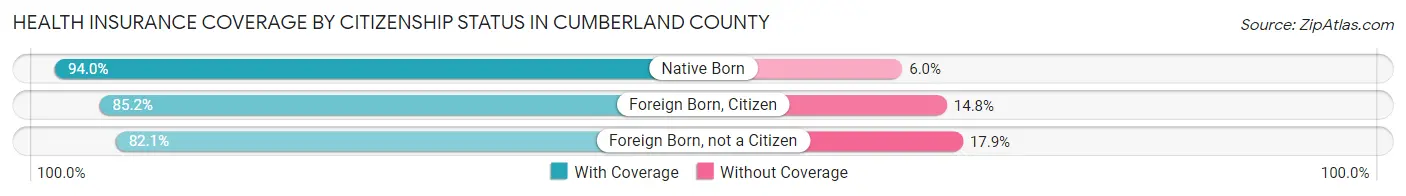
| Citizenship Status | With Coverage | Without Coverage |
| Native Born | 424 (94.0%) | 27 (6.0%) |
| Foreign Born, Citizen | 1,294 (85.2%) | 224 (14.8%) |
| Foreign Born, not a Citizen | 449 (82.1%) | 98 (17.9%) |
Health Insurance Coverage by Household Income in Cumberland County
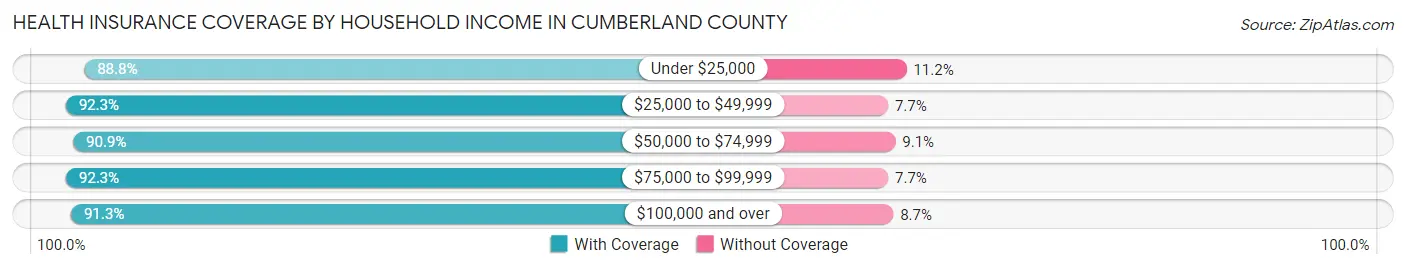
| Household Income | With Coverage | Without Coverage |
| Under $25,000 | 739 (88.8%) | 93 (11.2%) |
| $25,000 to $49,999 | 1,687 (92.3%) | 141 (7.7%) |
| $50,000 to $74,999 | 1,897 (90.9%) | 190 (9.1%) |
| $75,000 to $99,999 | 1,871 (92.3%) | 157 (7.7%) |
| $100,000 and over | 2,635 (91.3%) | 251 (8.7%) |
Public vs Private Health Insurance Coverage by Age in Cumberland County
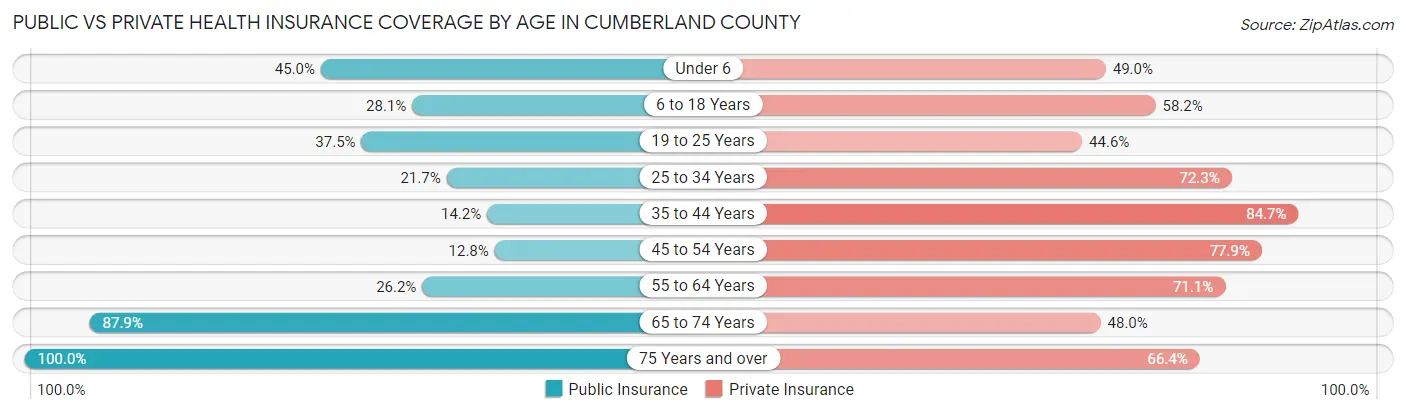
| Age Bracket | Public Insurance | Private Insurance |
| Under 6 | 203 (45.0%) | 221 (49.0%) |
| 6 to 18 Years | 426 (28.1%) | 884 (58.2%) |
| 19 to 25 Years | 205 (37.5%) | 244 (44.6%) |
| 25 to 34 Years | 236 (21.7%) | 787 (72.3%) |
| 35 to 44 Years | 154 (14.2%) | 921 (84.7%) |
| 45 to 54 Years | 166 (12.8%) | 1,014 (77.9%) |
| 55 to 64 Years | 394 (26.2%) | 1,070 (71.1%) |
| 65 to 74 Years | 1,100 (87.9%) | 601 (48.0%) |
| 75 Years and over | 950 (100.0%) | 631 (66.4%) |
| Total | 3,834 (39.5%) | 6,373 (65.7%) |
Disability Status by Sex by Age in Cumberland County
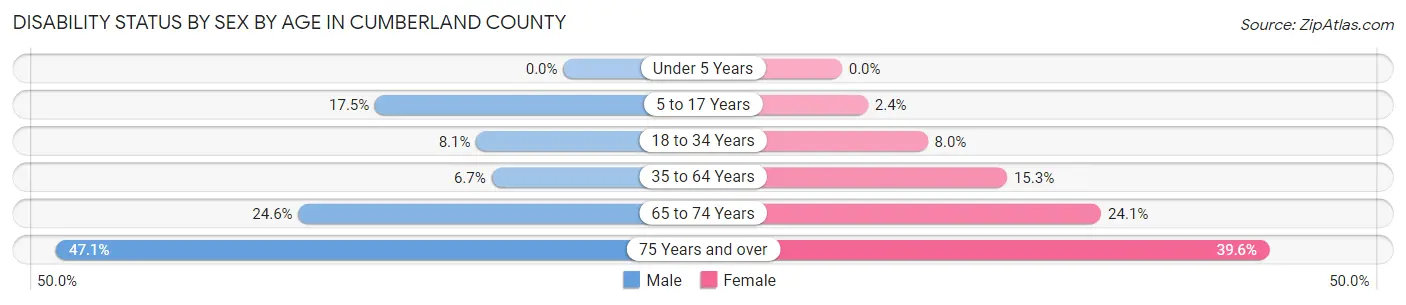
| Age Bracket | Male | Female |
| Under 5 Years | 0 (0.0%) | 0 (0.0%) |
| 5 to 17 Years | 149 (17.5%) | 15 (2.4%) |
| 18 to 34 Years | 73 (8.1%) | 64 (8.0%) |
| 35 to 64 Years | 124 (6.7%) | 311 (15.3%) |
| 65 to 74 Years | 135 (24.6%) | 169 (24.1%) |
| 75 Years and over | 218 (47.1%) | 193 (39.6%) |
Disability Class by Sex by Age in Cumberland County
Disability Class: Hearing Difficulty
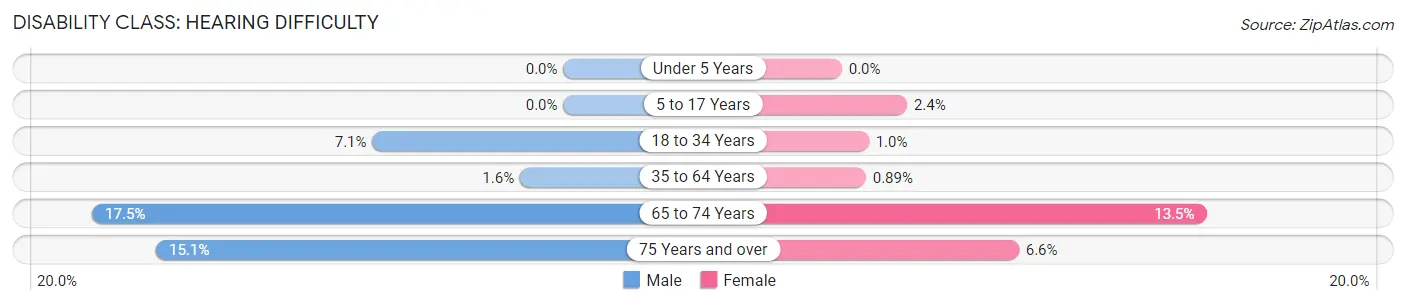
| Age Bracket | Male | Female |
| Under 5 Years | 0 (0.0%) | 0 (0.0%) |
| 5 to 17 Years | 0 (0.0%) | 15 (2.4%) |
| 18 to 34 Years | 64 (7.1%) | 8 (1.0%) |
| 35 to 64 Years | 30 (1.6%) | 18 (0.9%) |
| 65 to 74 Years | 96 (17.5%) | 95 (13.5%) |
| 75 Years and over | 70 (15.1%) | 32 (6.6%) |
Disability Class: Vision Difficulty
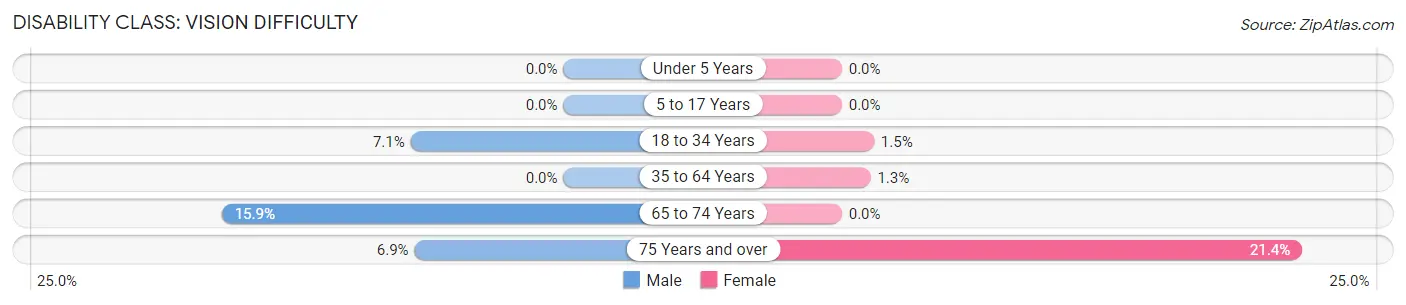
| Age Bracket | Male | Female |
| Under 5 Years | 0 (0.0%) | 0 (0.0%) |
| 5 to 17 Years | 0 (0.0%) | 0 (0.0%) |
| 18 to 34 Years | 64 (7.1%) | 12 (1.5%) |
| 35 to 64 Years | 0 (0.0%) | 27 (1.3%) |
| 65 to 74 Years | 87 (15.9%) | 0 (0.0%) |
| 75 Years and over | 32 (6.9%) | 104 (21.4%) |
Disability Class: Cognitive Difficulty
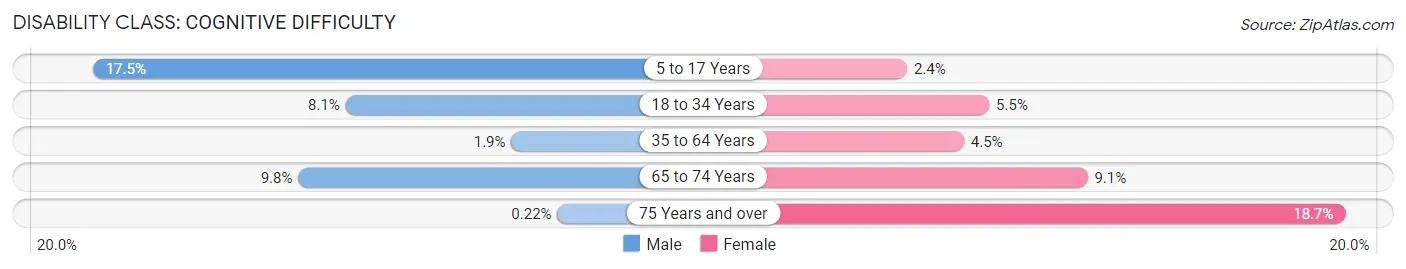
| Age Bracket | Male | Female |
| 5 to 17 Years | 149 (17.5%) | 15 (2.4%) |
| 18 to 34 Years | 73 (8.1%) | 44 (5.5%) |
| 35 to 64 Years | 36 (1.9%) | 92 (4.5%) |
| 65 to 74 Years | 54 (9.8%) | 64 (9.1%) |
| 75 Years and over | 1 (0.2%) | 91 (18.7%) |
Disability Class: Ambulatory Difficulty
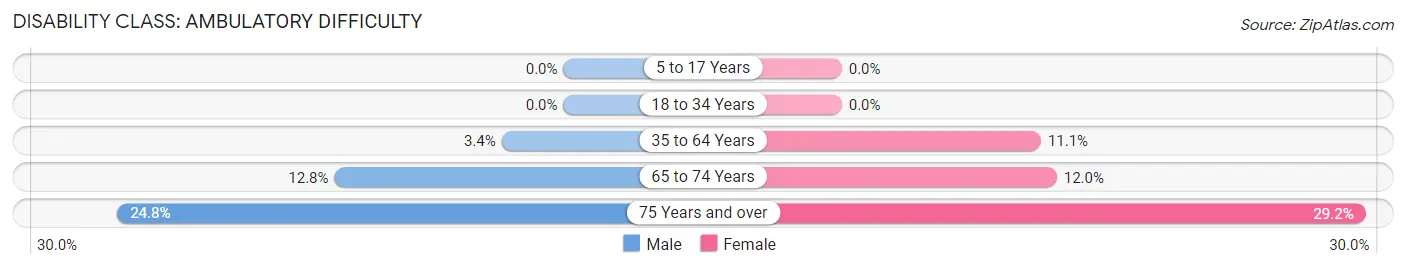
| Age Bracket | Male | Female |
| 5 to 17 Years | 0 (0.0%) | 0 (0.0%) |
| 18 to 34 Years | 0 (0.0%) | 0 (0.0%) |
| 35 to 64 Years | 64 (3.4%) | 225 (11.1%) |
| 65 to 74 Years | 70 (12.8%) | 84 (12.0%) |
| 75 Years and over | 115 (24.8%) | 142 (29.2%) |
Disability Class: Self-Care Difficulty
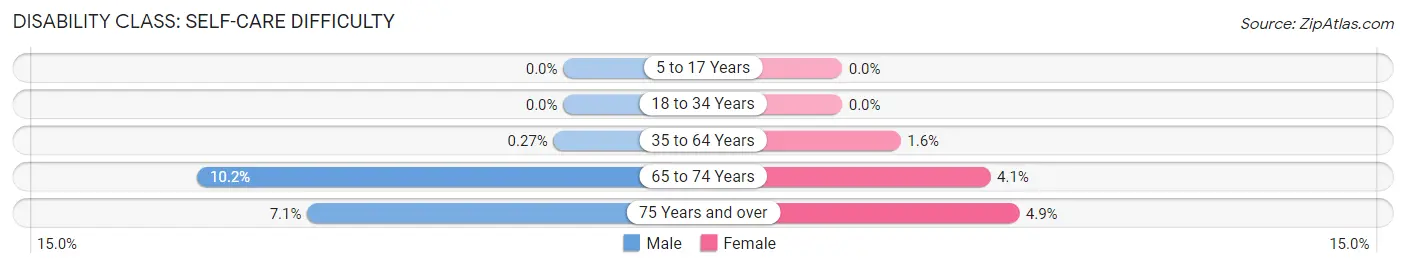
| Age Bracket | Male | Female |
| 5 to 17 Years | 0 (0.0%) | 0 (0.0%) |
| 18 to 34 Years | 0 (0.0%) | 0 (0.0%) |
| 35 to 64 Years | 5 (0.3%) | 33 (1.6%) |
| 65 to 74 Years | 56 (10.2%) | 29 (4.1%) |
| 75 Years and over | 33 (7.1%) | 24 (4.9%) |
Technology Access in Cumberland County
Computing Device Access in Cumberland County
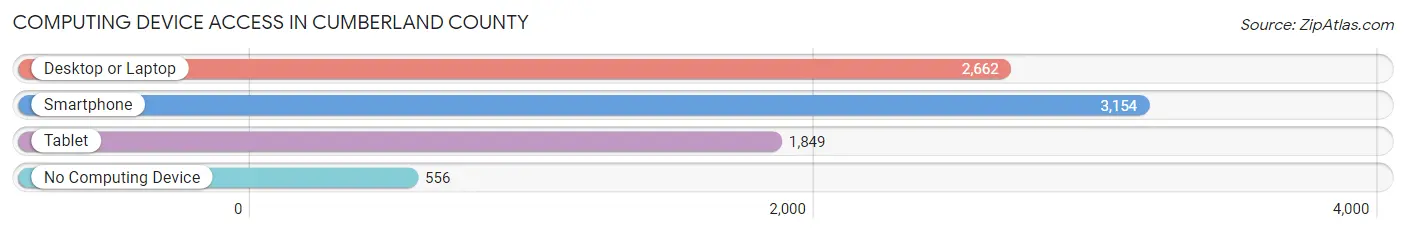
| Device Type | # Households | % Households |
| Desktop or Laptop | 2,662 | 65.6% |
| Smartphone | 3,154 | 77.8% |
| Tablet | 1,849 | 45.6% |
| No Computing Device | 556 | 13.7% |
| Total | 4,055 | 100.0% |
Internet Access in Cumberland County
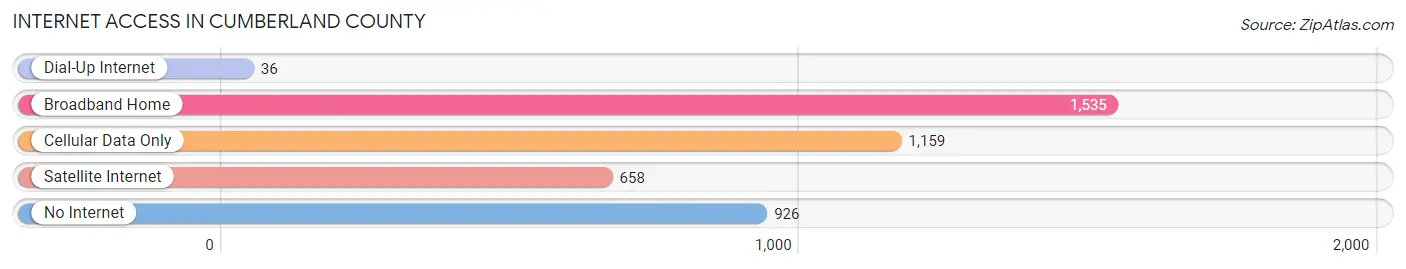
| Internet Type | # Households | % Households |
| Dial-Up Internet | 36 | 0.9% |
| Broadband Home | 1,535 | 37.9% |
| Cellular Data Only | 1,159 | 28.6% |
| Satellite Internet | 658 | 16.2% |
| No Internet | 926 | 22.8% |
| Total | 4,055 | 100.0% |
Cumberland County Summary
Cumberland County, Virginia is located in the south-central part of the state, and is part of the Richmond-Petersburg Metropolitan Statistical Area. The county is bordered by Amelia, Prince Edward, Buckingham, and Powhatan counties. The county seat is the town of Cumberland, and the county is home to approximately 10,000 people.
Geography
Cumberland County is located in the Piedmont region of Virginia, and is characterized by rolling hills and valleys. The county is drained by the Appomattox River, which forms its western border. The county is also home to several small streams, including the Willis River, which flows through the county from north to south. The county is mostly rural, with the majority of the land being used for agricultural purposes. The county is also home to several state parks, including Bear Creek Lake State Park and Cumberland State Park.
Climate
Cumberland County has a humid subtropical climate, with hot, humid summers and mild winters. The average annual temperature is around 60°F, with the average high in the summer months reaching around 90°F and the average low in the winter months reaching around 30°F. The county receives an average of 45 inches of precipitation per year, with the majority of it falling in the summer months.
Demographics
As of the 2010 census, Cumberland County had a population of 10,052. The racial makeup of the county was 79.3% White, 17.7% African American, 0.4% Native American, 0.3% Asian, 0.1% Pacific Islander, 0.7% from other races, and 1.5% from two or more races. Hispanic or Latino of any race were 2.2% of the population.
The median income for a household in the county was $41,945, and the median income for a family was $50,945. The per capita income for the county was $20,945. About 11.3% of families and 14.2% of the population were below the poverty line, including 18.2% of those under age 18 and 11.2% of those age 65 or over.
Economy
Cumberland County’s economy is largely based on agriculture, with the majority of the land being used for farming. The county is home to several large farms, including the Cumberland Farms, which produces corn, soybeans, and wheat. Other crops grown in the county include hay, tobacco, and vegetables.
The county is also home to several small businesses, including restaurants, retail stores, and service providers. The county is also home to several manufacturing companies, including a furniture manufacturer and a paper mill.
The county is served by two major highways, US Route 60 and US Route 360, which provide access to the county from the surrounding areas. The county is also served by the Richmond International Airport, which is located about 40 miles away.
Conclusion
Cumberland County, Virginia is a rural county located in the south-central part of the state. The county is home to approximately 10,000 people, and is characterized by rolling hills and valleys. The county’s economy is largely based on agriculture, with the majority of the land being used for farming. The county is also home to several small businesses, and is served by two major highways and the Richmond International Airport.
Common Questions
What is Per Capita Income in Cumberland County?
Per Capita income in Cumberland County is $38,099.
What is the Median Family Income in Cumberland County?
Median Family Income in Cumberland County is $68,063.
What is the Median Household income in Cumberland County?
Median Household Income in Cumberland County is $56,497.
What is Income or Wage Gap in Cumberland County?
Income or Wage Gap in Cumberland County is 3.0%.
Women in Cumberland County earn 97.0 cents for every dollar earned by a man.
What is Family Income Deficit in Cumberland County?
Family Income Deficit in Cumberland County is $8,236.
Families that are below poverty line in Cumberland County earn $8,236 less on average than the poverty threshold level.
What is Inequality or Gini Index in Cumberland County?
Inequality or Gini Index in Cumberland County is 0.50.
What is the Total Population of Cumberland County?
Total Population of Cumberland County is 9,697.
What is the Total Male Population of Cumberland County?
Total Male Population of Cumberland County is 4,887.
What is the Total Female Population of Cumberland County?
Total Female Population of Cumberland County is 4,810.
What is the Ratio of Males per 100 Females in Cumberland County?
There are 101.60 Males per 100 Females in Cumberland County.
What is the Ratio of Females per 100 Males in Cumberland County?
There are 98.42 Females per 100 Males in Cumberland County.
What is the Median Population Age in Cumberland County?
Median Population Age in Cumberland County is 46.3 Years.
What is the Average Family Size in Cumberland County
Average Family Size in Cumberland County is 2.8 People.
What is the Average Household Size in Cumberland County
Average Household Size in Cumberland County is 2.4 People.
How Large is the Labor Force in Cumberland County?
There are 5,233 People in the Labor Forcein in Cumberland County.
What is the Percentage of People in the Labor Force in Cumberland County?
64.3% of People are in the Labor Force in Cumberland County.
What is the Unemployment Rate in Cumberland County?
Unemployment Rate in Cumberland County is 3.2%.