Culpeper County, VA Map & Demographics
Culpeper County Map
Culpeper County Overview
$39,062
PER CAPITA INCOME
$103,967
AVG FAMILY INCOME
$92,359
AVG HOUSEHOLD INCOME
37.9%
WAGE / INCOME GAP [ % ]
62.1¢/ $1
WAGE / INCOME GAP [ $ ]
$9,140
FAMILY INCOME DEFICIT
0.41
INEQUALITY / GINI INDEX
52,822
TOTAL POPULATION
26,404
MALE POPULATION
26,418
FEMALE POPULATION
99.95
MALES / 100 FEMALES
100.05
FEMALES / 100 MALES
39.5
MEDIAN AGE
3.2
AVG FAMILY SIZE
2.8
AVG HOUSEHOLD SIZE
26,889
LABOR FORCE [ PEOPLE ]
64.7%
PERCENT IN LABOR FORCE
3.9%
UNEMPLOYMENT RATE
Culpeper County Area Codes
Income in Culpeper County
Income Overview in Culpeper County
Per Capita Income in Culpeper County is $39,062, while median incomes of families and households are $103,967 and $92,359 respectively.
| Characteristic | Number | Measure |
| Per Capita Income | 52,822 | $39,062 |
| Median Family Income | 13,955 | $103,967 |
| Mean Family Income | 13,955 | $120,008 |
| Median Household Income | 18,188 | $92,359 |
| Mean Household Income | 18,188 | $112,583 |
| Income Deficit | 13,955 | $9,140 |
| Wage / Income Gap (%) | 52,822 | 37.92% |
| Wage / Income Gap ($) | 52,822 | 62.08¢ per $1 |
| Gini / Inequality Index | 52,822 | 0.41 |
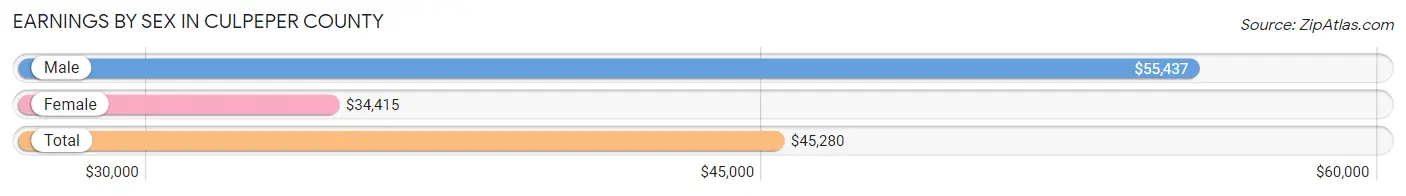
Earnings by Sex in Culpeper County
Average Earnings in Culpeper County are $45,280, $55,437 for men and $34,415 for women, a difference of 37.9%.
| Sex | Number | Average Earnings |
| Male | 15,107 (53.6%) | $55,437 |
| Female | 13,087 (46.4%) | $34,415 |
| Total | 28,194 (100.0%) | $45,280 |
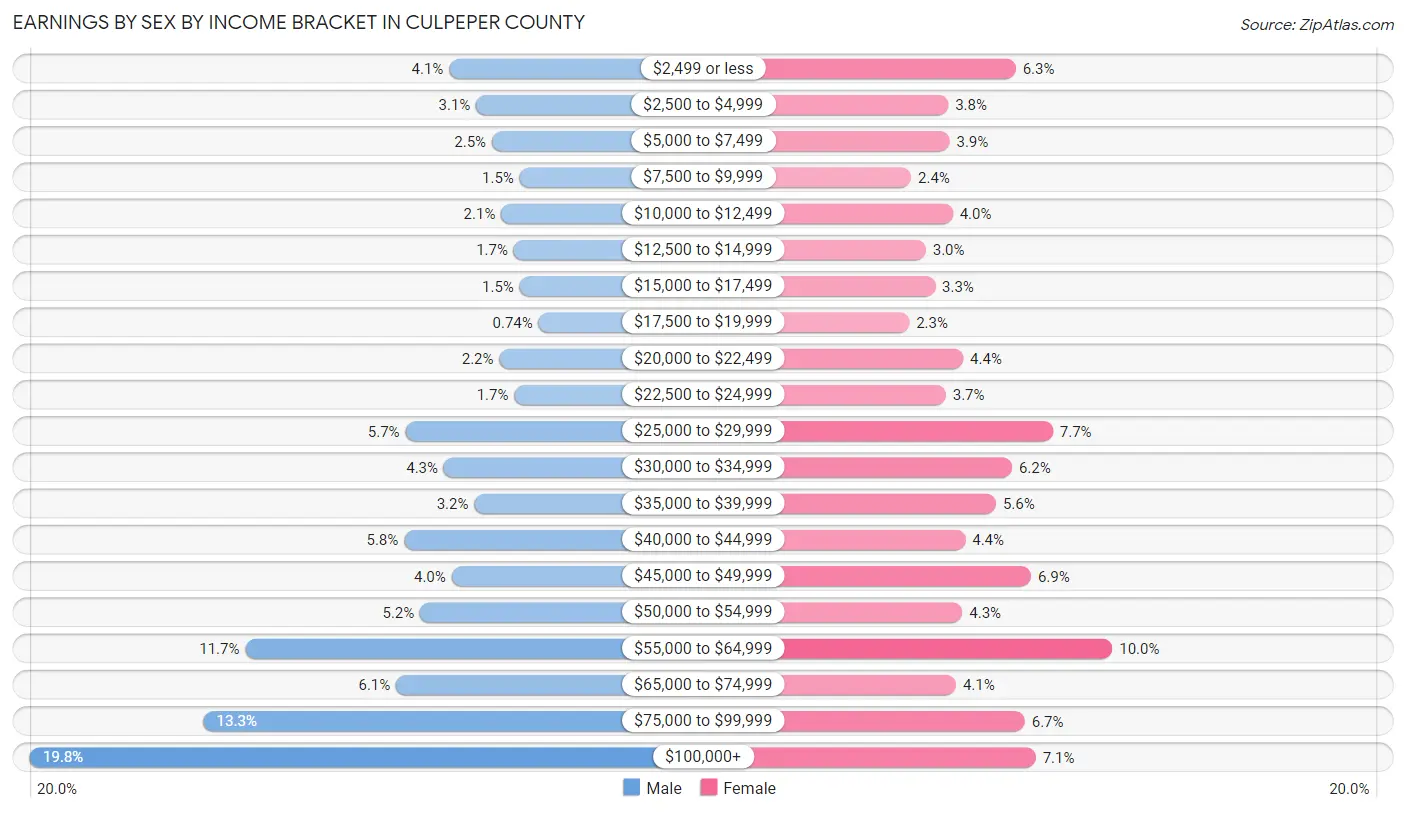
Earnings by Sex by Income Bracket in Culpeper County
The most common earnings brackets in Culpeper County are $100,000+ for men (2,991 | 19.8%) and $55,000 to $64,999 for women (1,302 | 10.0%).
| Income | Male | Female |
| $2,499 or less | 618 (4.1%) | 828 (6.3%) |
| $2,500 to $4,999 | 466 (3.1%) | 497 (3.8%) |
| $5,000 to $7,499 | 376 (2.5%) | 504 (3.8%) |
| $7,500 to $9,999 | 219 (1.5%) | 316 (2.4%) |
| $10,000 to $12,499 | 324 (2.1%) | 519 (4.0%) |
| $12,500 to $14,999 | 252 (1.7%) | 388 (3.0%) |
| $15,000 to $17,499 | 219 (1.5%) | 433 (3.3%) |
| $17,500 to $19,999 | 112 (0.7%) | 306 (2.3%) |
| $20,000 to $22,499 | 334 (2.2%) | 570 (4.4%) |
| $22,500 to $24,999 | 249 (1.7%) | 486 (3.7%) |
| $25,000 to $29,999 | 865 (5.7%) | 1,010 (7.7%) |
| $30,000 to $34,999 | 648 (4.3%) | 810 (6.2%) |
| $35,000 to $39,999 | 476 (3.2%) | 732 (5.6%) |
| $40,000 to $44,999 | 873 (5.8%) | 581 (4.4%) |
| $45,000 to $49,999 | 604 (4.0%) | 903 (6.9%) |
| $50,000 to $54,999 | 783 (5.2%) | 567 (4.3%) |
| $55,000 to $64,999 | 1,772 (11.7%) | 1,302 (10.0%) |
| $65,000 to $74,999 | 919 (6.1%) | 535 (4.1%) |
| $75,000 to $99,999 | 2,007 (13.3%) | 873 (6.7%) |
| $100,000+ | 2,991 (19.8%) | 927 (7.1%) |
| Total | 15,107 (100.0%) | 13,087 (100.0%) |
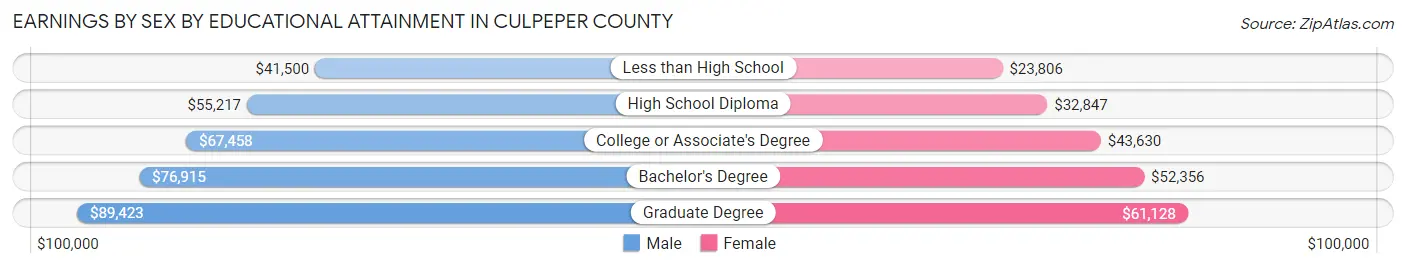
Earnings by Sex by Educational Attainment in Culpeper County
Average earnings in Culpeper County are $58,966 for men and $42,507 for women, a difference of 27.9%. Men with an educational attainment of graduate degree enjoy the highest average annual earnings of $89,423, while those with less than high school education earn the least with $41,500. Women with an educational attainment of graduate degree earn the most with the average annual earnings of $61,128, while those with less than high school education have the smallest earnings of $23,806.
| Educational Attainment | Male Income | Female Income |
| Less than High School | $41,500 | $23,806 |
| High School Diploma | $55,217 | $32,847 |
| College or Associate's Degree | $67,458 | $43,630 |
| Bachelor's Degree | $76,915 | $52,356 |
| Graduate Degree | $89,423 | $61,128 |
| Total | $58,966 | $42,507 |
Family Income in Culpeper County
Family Income Brackets in Culpeper County
According to the Culpeper County family income data, there are 3,768 families falling into the $100,000 to $149,999 income range, which is the most common income bracket and makes up 27.0% of all families. Conversely, the $10,000 to $14,999 income bracket is the least frequent group with only 195 families (1.4%) belonging to this category.
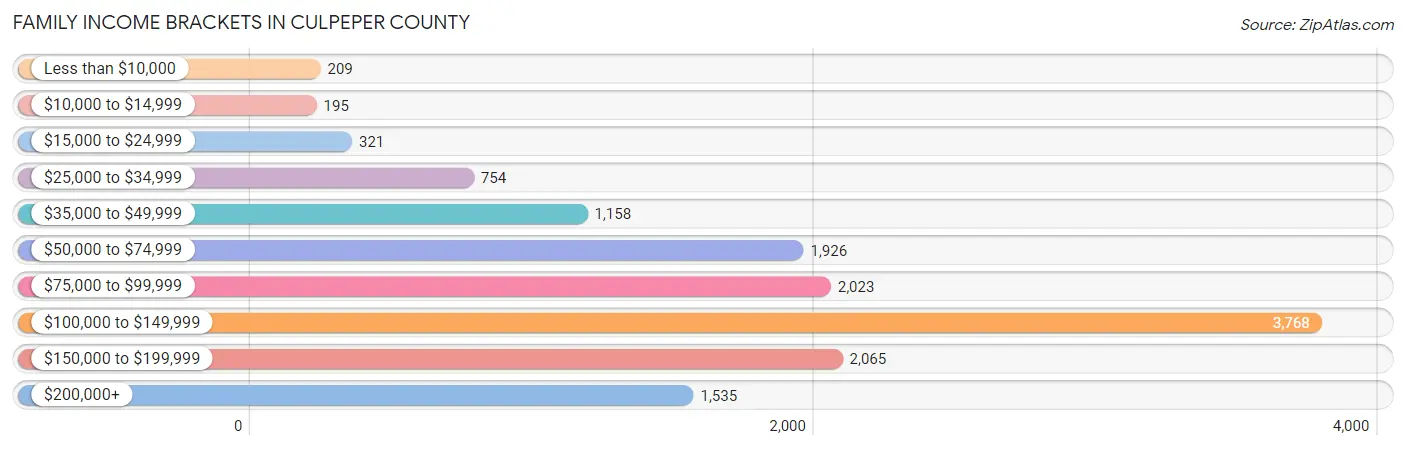
| Income Bracket | # Families | % Families |
| Less than $10,000 | 209 | 1.5% |
| $10,000 to $14,999 | 195 | 1.4% |
| $15,000 to $24,999 | 321 | 2.3% |
| $25,000 to $34,999 | 754 | 5.4% |
| $35,000 to $49,999 | 1,158 | 8.3% |
| $50,000 to $74,999 | 1,926 | 13.8% |
| $75,000 to $99,999 | 2,023 | 14.5% |
| $100,000 to $149,999 | 3,768 | 27.0% |
| $150,000 to $199,999 | 2,065 | 14.8% |
| $200,000+ | 1,535 | 11.0% |
Family Income by Famaliy Size in Culpeper County
7+ person families (364 | 2.6%) account for the highest median family income in Culpeper County with $173,646 per family, while 2-person families (6,094 | 43.7%) have the highest median income of $47,110 per family member.
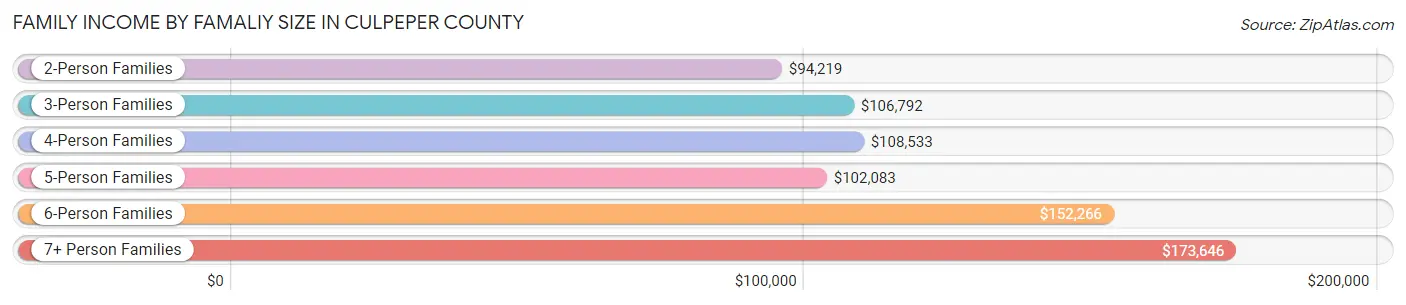
| Income Bracket | # Families | Median Income |
| 2-Person Families | 6,094 (43.7%) | $94,219 |
| 3-Person Families | 3,286 (23.5%) | $106,792 |
| 4-Person Families | 2,523 (18.1%) | $108,533 |
| 5-Person Families | 1,399 (10.0%) | $102,083 |
| 6-Person Families | 289 (2.1%) | $152,266 |
| 7+ Person Families | 364 (2.6%) | $173,646 |
| Total | 13,955 (100.0%) | $103,967 |
Family Income by Number of Earners in Culpeper County
The median family income in Culpeper County is $103,967, with families comprising 3+ earners (2,031) having the highest median family income of $164,243, while families with no earners (1,746) have the lowest median family income of $64,167, accounting for 14.5% and 12.5% of families, respectively.
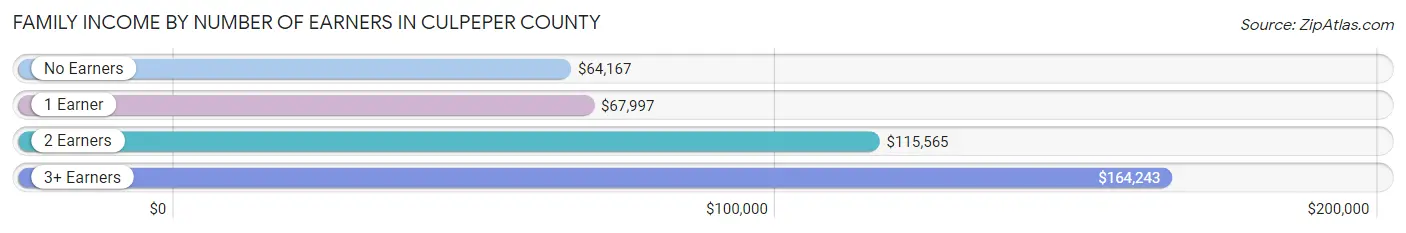
| Number of Earners | # Families | Median Income |
| No Earners | 1,746 (12.5%) | $64,167 |
| 1 Earner | 4,405 (31.6%) | $67,997 |
| 2 Earners | 5,773 (41.4%) | $115,565 |
| 3+ Earners | 2,031 (14.5%) | $164,243 |
| Total | 13,955 (100.0%) | $103,967 |
Household Income in Culpeper County
Household Income Brackets in Culpeper County
With 4,110 households falling in the category, the $100,000 to $149,999 income range is the most frequent in Culpeper County, accounting for 22.6% of all households. In contrast, only 382 households (2.1%) fall into the $10,000 to $14,999 income bracket, making it the least populous group.
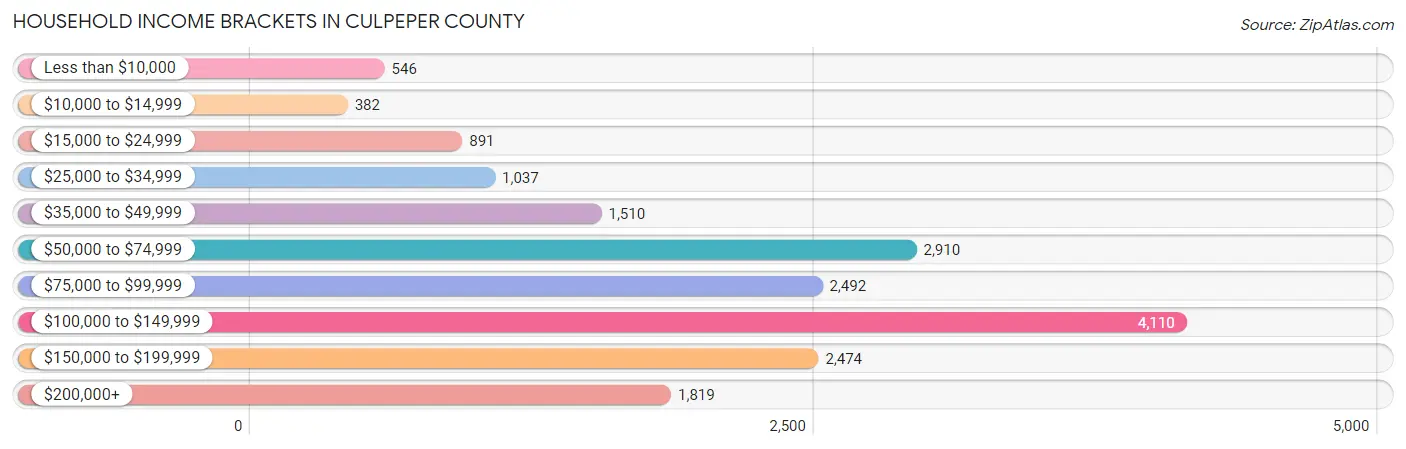
| Income Bracket | # Households | % Households |
| Less than $10,000 | 546 | 3.0% |
| $10,000 to $14,999 | 382 | 2.1% |
| $15,000 to $24,999 | 891 | 4.9% |
| $25,000 to $34,999 | 1,037 | 5.7% |
| $35,000 to $49,999 | 1,510 | 8.3% |
| $50,000 to $74,999 | 2,910 | 16.0% |
| $75,000 to $99,999 | 2,492 | 13.7% |
| $100,000 to $149,999 | 4,110 | 22.6% |
| $150,000 to $199,999 | 2,474 | 13.6% |
| $200,000+ | 1,819 | 10.0% |
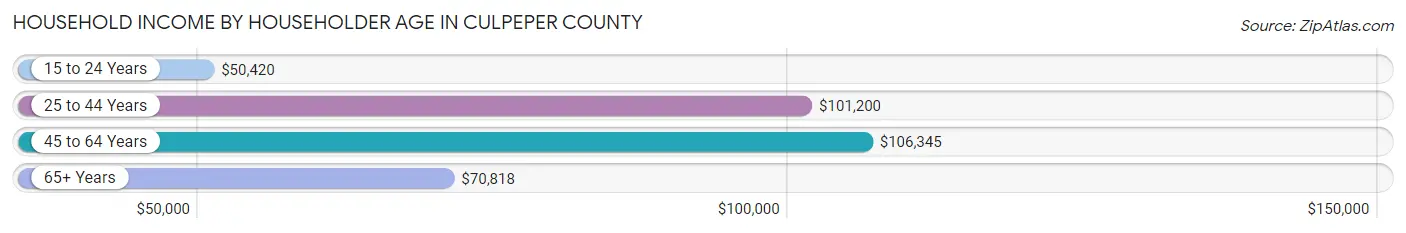
Household Income by Householder Age in Culpeper County
The median household income in Culpeper County is $92,359, with the highest median household income of $106,345 found in the 45 to 64 years age bracket for the primary householder. A total of 7,246 households (39.8%) fall into this category. Meanwhile, the 15 to 24 years age bracket for the primary householder has the lowest median household income of $50,420, with 652 households (3.6%) in this group.
| Income Bracket | # Households | Median Income |
| 15 to 24 Years | 652 (3.6%) | $50,420 |
| 25 to 44 Years | 5,375 (29.5%) | $101,200 |
| 45 to 64 Years | 7,246 (39.8%) | $106,345 |
| 65+ Years | 4,915 (27.0%) | $70,818 |
| Total | 18,188 (100.0%) | $92,359 |
Poverty in Culpeper County
Income Below Poverty by Sex and Age in Culpeper County
With 6.4% poverty level for males and 8.2% for females among the residents of Culpeper County, 12 to 14 year old males and 18 to 24 year old females are the most vulnerable to poverty, with 177 males (16.5%) and 429 females (19.6%) in their respective age groups living below the poverty level.
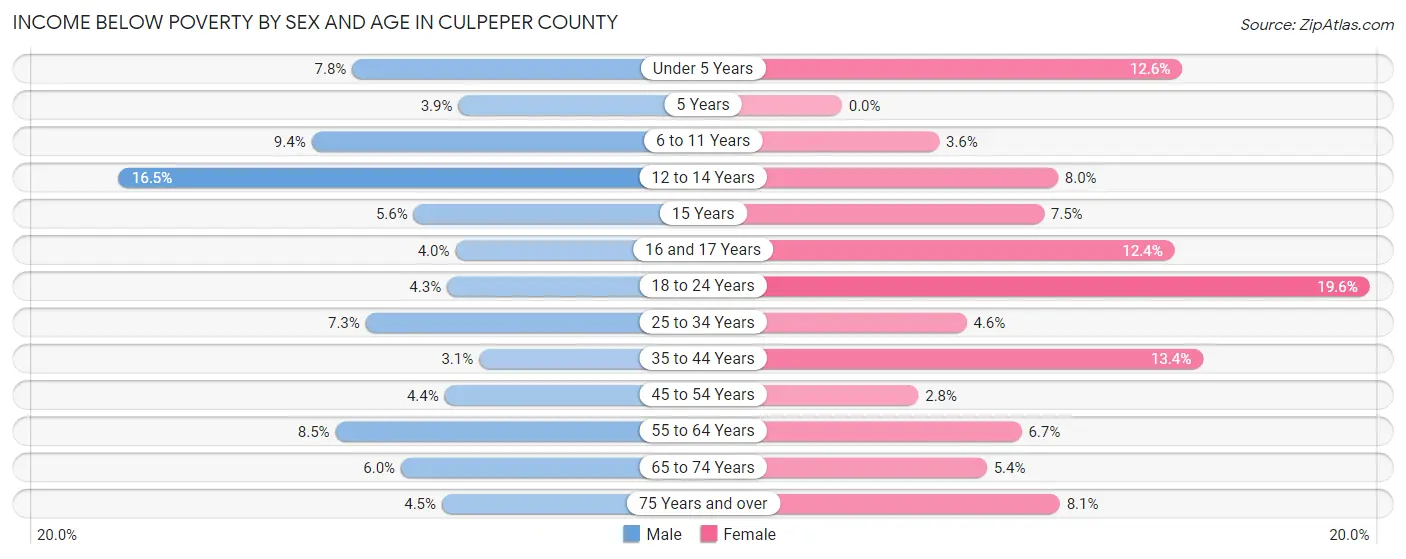
| Age Bracket | Male | Female |
| Under 5 Years | 122 (7.8%) | 208 (12.6%) |
| 5 Years | 18 (3.9%) | 0 (0.0%) |
| 6 to 11 Years | 182 (9.3%) | 79 (3.6%) |
| 12 to 14 Years | 177 (16.5%) | 97 (8.0%) |
| 15 Years | 14 (5.6%) | 21 (7.5%) |
| 16 and 17 Years | 33 (4.0%) | 103 (12.3%) |
| 18 to 24 Years | 93 (4.3%) | 429 (19.6%) |
| 25 to 34 Years | 203 (7.3%) | 127 (4.6%) |
| 35 to 44 Years | 110 (3.1%) | 473 (13.4%) |
| 45 to 54 Years | 136 (4.4%) | 92 (2.8%) |
| 55 to 64 Years | 297 (8.5%) | 238 (6.7%) |
| 65 to 74 Years | 136 (6.0%) | 138 (5.4%) |
| 75 Years and over | 71 (4.5%) | 155 (8.1%) |
| Total | 1,592 (6.4%) | 2,160 (8.2%) |
Income Above Poverty by Sex and Age in Culpeper County
According to the poverty statistics in Culpeper County, males aged 35 to 44 years and females aged 5 years are the age groups that are most secure financially, with 96.9% of males and 100.0% of females in these age groups living above the poverty line.
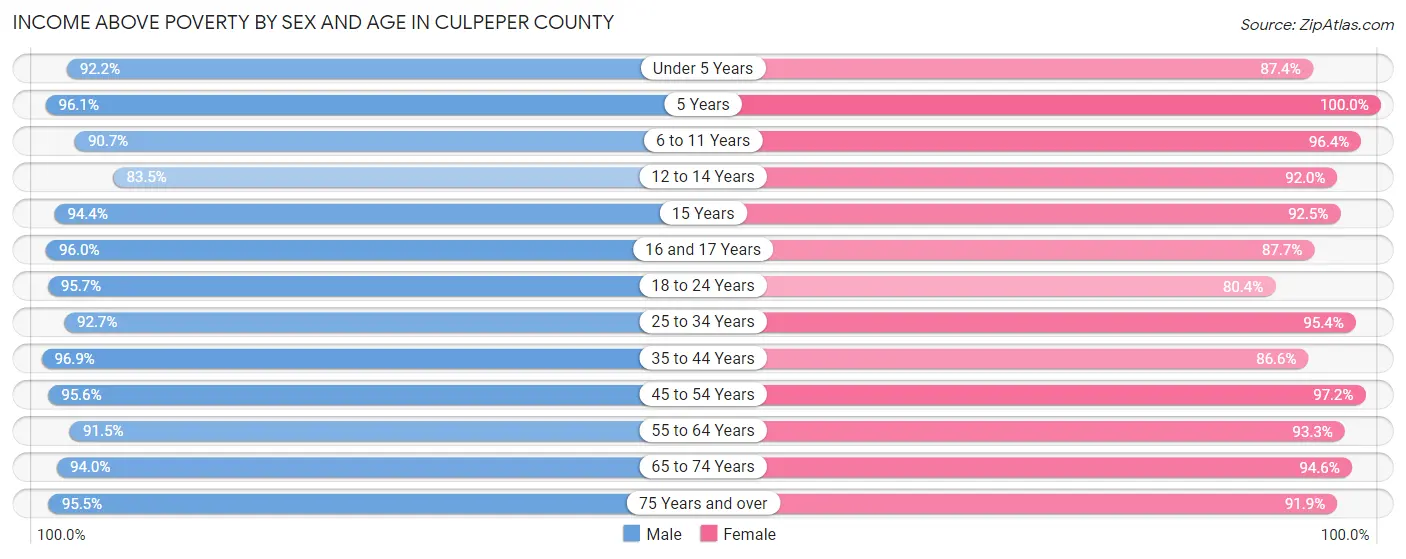
| Age Bracket | Male | Female |
| Under 5 Years | 1,434 (92.2%) | 1,439 (87.4%) |
| 5 Years | 443 (96.1%) | 297 (100.0%) |
| 6 to 11 Years | 1,765 (90.6%) | 2,109 (96.4%) |
| 12 to 14 Years | 896 (83.5%) | 1,112 (92.0%) |
| 15 Years | 238 (94.4%) | 259 (92.5%) |
| 16 and 17 Years | 790 (96.0%) | 731 (87.6%) |
| 18 to 24 Years | 2,059 (95.7%) | 1,761 (80.4%) |
| 25 to 34 Years | 2,563 (92.7%) | 2,615 (95.4%) |
| 35 to 44 Years | 3,404 (96.9%) | 3,053 (86.6%) |
| 45 to 54 Years | 2,950 (95.6%) | 3,147 (97.2%) |
| 55 to 64 Years | 3,214 (91.5%) | 3,332 (93.3%) |
| 65 to 74 Years | 2,118 (94.0%) | 2,427 (94.6%) |
| 75 Years and over | 1,502 (95.5%) | 1,761 (91.9%) |
| Total | 23,376 (93.6%) | 24,043 (91.8%) |
Income Below Poverty Among Married-Couple Families in Culpeper County
The poverty statistics for married-couple families in Culpeper County show that 3.2% or 321 of the total 10,011 families live below the poverty line. Families with 1 or 2 children have the highest poverty rate of 4.5%, comprising of 126 families. On the other hand, families with 5 or more children have the lowest poverty rate of 0.0%, which includes 0 families.
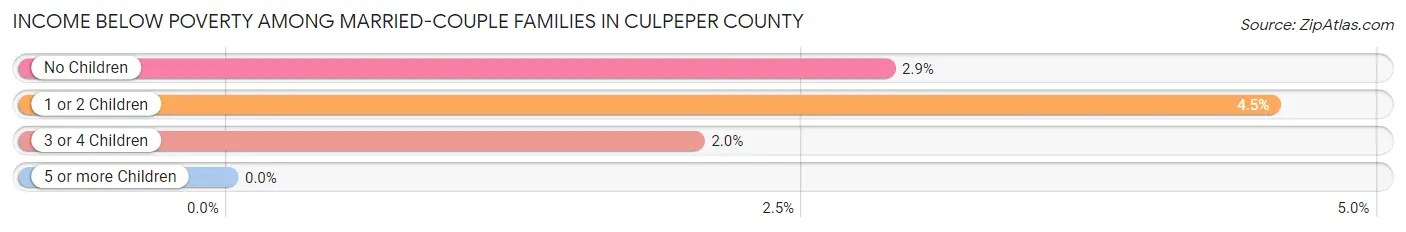
| Children | Above Poverty | Below Poverty |
| No Children | 5,841 (97.1%) | 172 (2.9%) |
| 1 or 2 Children | 2,647 (95.5%) | 126 (4.5%) |
| 3 or 4 Children | 1,109 (98.0%) | 23 (2.0%) |
| 5 or more Children | 93 (100.0%) | 0 (0.0%) |
| Total | 9,690 (96.8%) | 321 (3.2%) |
Income Below Poverty Among Single-Parent Households in Culpeper County
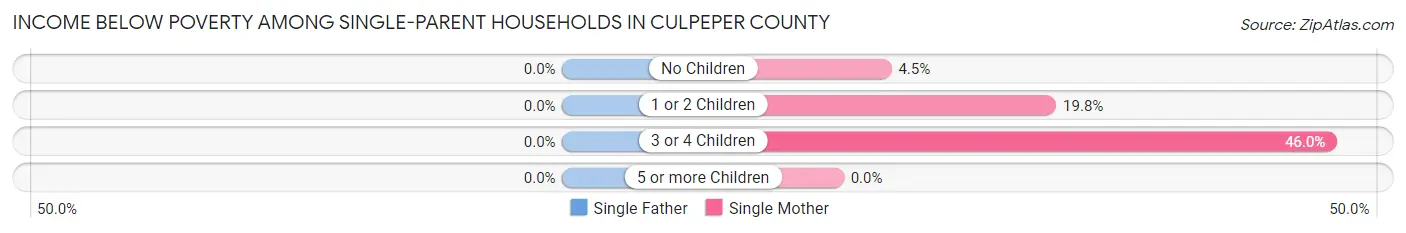
| Children | Single Father | Single Mother |
| No Children | 0 (0.0%) | 56 (4.4%) |
| 1 or 2 Children | 0 (0.0%) | 229 (19.8%) |
| 3 or 4 Children | 0 (0.0%) | 182 (46.0%) |
| 5 or more Children | 0 (0.0%) | 0 (0.0%) |
| Total | 0 (0.0%) | 467 (16.6%) |
Income Below Poverty Among Married-Couple vs Single-Parent Households in Culpeper County
The poverty data for Culpeper County shows that 321 of the married-couple family households (3.2%) and 467 of the single-parent households (11.8%) are living below the poverty level. Within the married-couple family households, those with 1 or 2 children have the highest poverty rate, with 126 households (4.5%) falling below the poverty line. Among the single-parent households, those with 3 or 4 children have the highest poverty rate, with 182 household (34.7%) living below poverty.
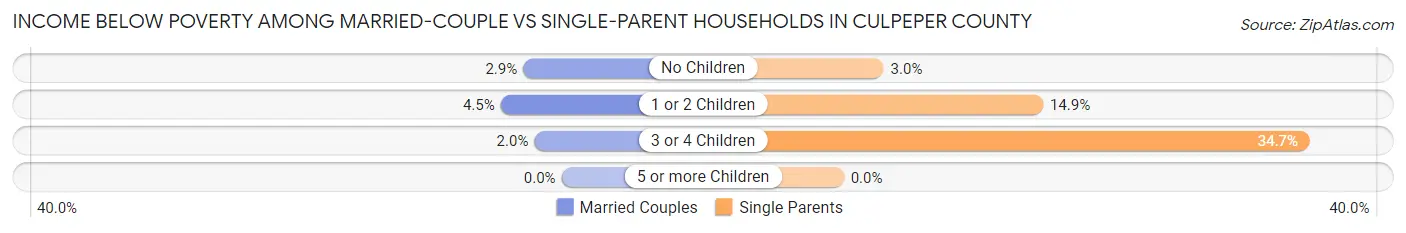
| Children | Married-Couple Families | Single-Parent Households |
| No Children | 172 (2.9%) | 56 (3.0%) |
| 1 or 2 Children | 126 (4.5%) | 229 (14.8%) |
| 3 or 4 Children | 23 (2.0%) | 182 (34.7%) |
| 5 or more Children | 0 (0.0%) | 0 (0.0%) |
| Total | 321 (3.2%) | 467 (11.8%) |
Race in Culpeper County
The most populous races in Culpeper County are White / Caucasian (37,713 | 71.4%), Black / African American (7,070 | 13.4%), and Hispanic or Latino (6,546 | 12.4%).
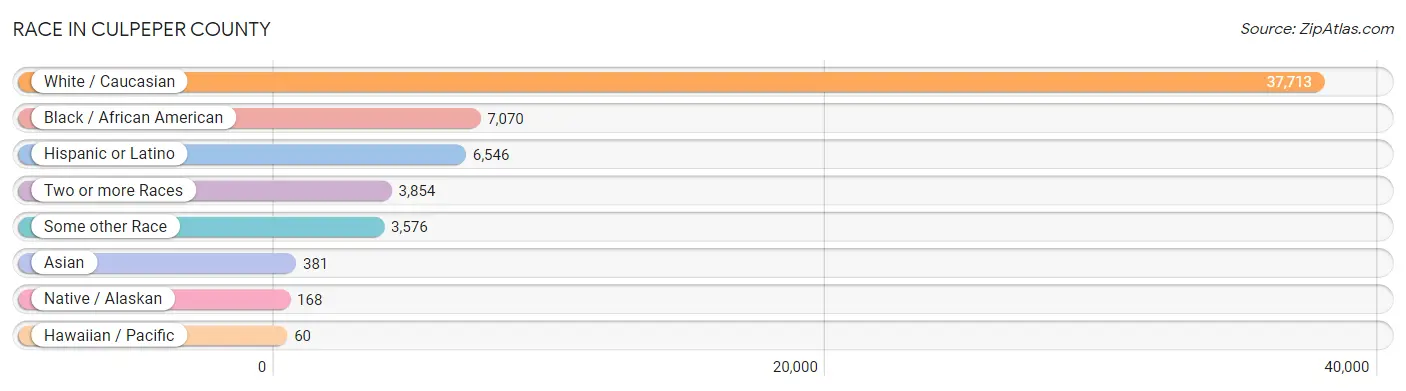
| Race | # Population | % Population |
| Asian | 381 | 0.7% |
| Black / African American | 7,070 | 13.4% |
| Hawaiian / Pacific | 60 | 0.1% |
| Hispanic or Latino | 6,546 | 12.4% |
| Native / Alaskan | 168 | 0.3% |
| White / Caucasian | 37,713 | 71.4% |
| Two or more Races | 3,854 | 7.3% |
| Some other Race | 3,576 | 6.8% |
| Total | 52,822 | 100.0% |
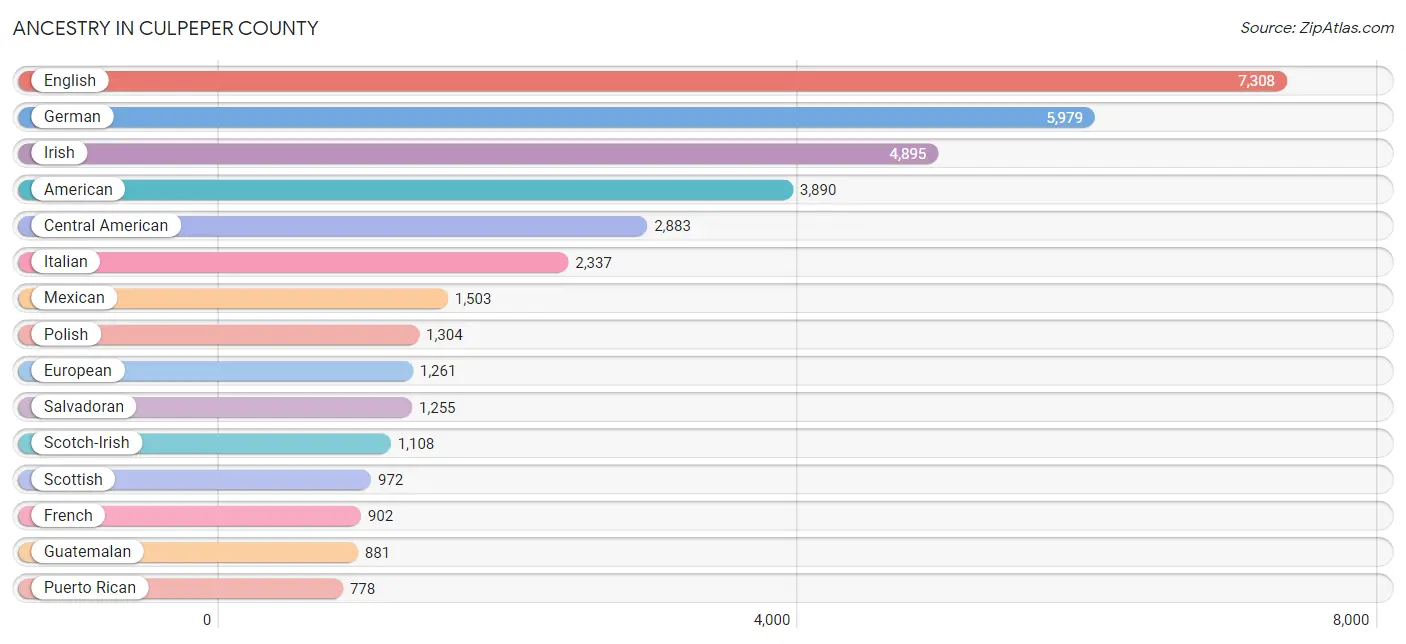
Ancestry in Culpeper County
The most populous ancestries reported in Culpeper County are English (7,308 | 13.8%), German (5,979 | 11.3%), Irish (4,895 | 9.3%), American (3,890 | 7.4%), and Central American (2,883 | 5.5%), together accounting for 47.2% of all Culpeper County residents.
| Ancestry | # Population | % Population |
| African | 116 | 0.2% |
| American | 3,890 | 7.4% |
| Apache | 11 | 0.0% |
| Arab | 564 | 1.1% |
| Argentinean | 18 | 0.0% |
| Austrian | 155 | 0.3% |
| Bahamian | 32 | 0.1% |
| Bhutanese | 316 | 0.6% |
| Blackfeet | 36 | 0.1% |
| Bolivian | 44 | 0.1% |
| British | 296 | 0.6% |
| Bulgarian | 13 | 0.0% |
| Burmese | 46 | 0.1% |
| Canadian | 95 | 0.2% |
| Central American | 2,883 | 5.5% |
| Central American Indian | 31 | 0.1% |
| Cherokee | 92 | 0.2% |
| Chilean | 69 | 0.1% |
| Choctaw | 5 | 0.0% |
| Colombian | 184 | 0.4% |
| Costa Rican | 42 | 0.1% |
| Croatian | 10 | 0.0% |
| Crow | 4 | 0.0% |
| Cuban | 325 | 0.6% |
| Czech | 113 | 0.2% |
| Czechoslovakian | 51 | 0.1% |
| Danish | 107 | 0.2% |
| Dominican | 65 | 0.1% |
| Dutch | 376 | 0.7% |
| Eastern European | 57 | 0.1% |
| Ecuadorian | 27 | 0.1% |
| English | 7,308 | 13.8% |
| Ethiopian | 48 | 0.1% |
| European | 1,261 | 2.4% |
| Finnish | 126 | 0.2% |
| French | 902 | 1.7% |
| French Canadian | 177 | 0.3% |
| German | 5,979 | 11.3% |
| Greek | 205 | 0.4% |
| Guamanian / Chamorro | 8 | 0.0% |
| Guatemalan | 881 | 1.7% |
| Haitian | 57 | 0.1% |
| Honduran | 631 | 1.2% |
| Hungarian | 528 | 1.0% |
| Indian (Asian) | 168 | 0.3% |
| Irish | 4,895 | 9.3% |
| Iroquois | 14 | 0.0% |
| Italian | 2,337 | 4.4% |
| Jamaican | 103 | 0.2% |
| Japanese | 58 | 0.1% |
| Korean | 34 | 0.1% |
| Lebanese | 453 | 0.9% |
| Liberian | 259 | 0.5% |
| Lithuanian | 149 | 0.3% |
| Malaysian | 63 | 0.1% |
| Mexican | 1,503 | 2.9% |
| Native Hawaiian | 50 | 0.1% |
| Navajo | 14 | 0.0% |
| Nicaraguan | 68 | 0.1% |
| Nigerian | 93 | 0.2% |
| Northern European | 25 | 0.1% |
| Norwegian | 117 | 0.2% |
| Pakistani | 56 | 0.1% |
| Panamanian | 6 | 0.0% |
| Pennsylvania German | 9 | 0.0% |
| Peruvian | 182 | 0.3% |
| Polish | 1,304 | 2.5% |
| Portuguese | 85 | 0.2% |
| Puerto Rican | 778 | 1.5% |
| Romanian | 34 | 0.1% |
| Russian | 105 | 0.2% |
| Salvadoran | 1,255 | 2.4% |
| Samoan | 14 | 0.0% |
| Scandinavian | 57 | 0.1% |
| Scotch-Irish | 1,108 | 2.1% |
| Scottish | 972 | 1.8% |
| Sioux | 17 | 0.0% |
| Slovak | 260 | 0.5% |
| Slovene | 238 | 0.4% |
| South African | 57 | 0.1% |
| South American | 575 | 1.1% |
| Spaniard | 68 | 0.1% |
| Spanish | 31 | 0.1% |
| Spanish American Indian | 10 | 0.0% |
| Sri Lankan | 75 | 0.1% |
| Subsaharan African | 592 | 1.1% |
| Swedish | 411 | 0.8% |
| Swiss | 11 | 0.0% |
| Syrian | 22 | 0.0% |
| Thai | 65 | 0.1% |
| Trinidadian and Tobagonian | 6 | 0.0% |
| Turkish | 80 | 0.2% |
| Ukrainian | 52 | 0.1% |
| Venezuelan | 51 | 0.1% |
| Welsh | 298 | 0.6% |
| West Indian | 10 | 0.0% |
| Yugoslavian | 36 | 0.1% | View All 97 Rows |
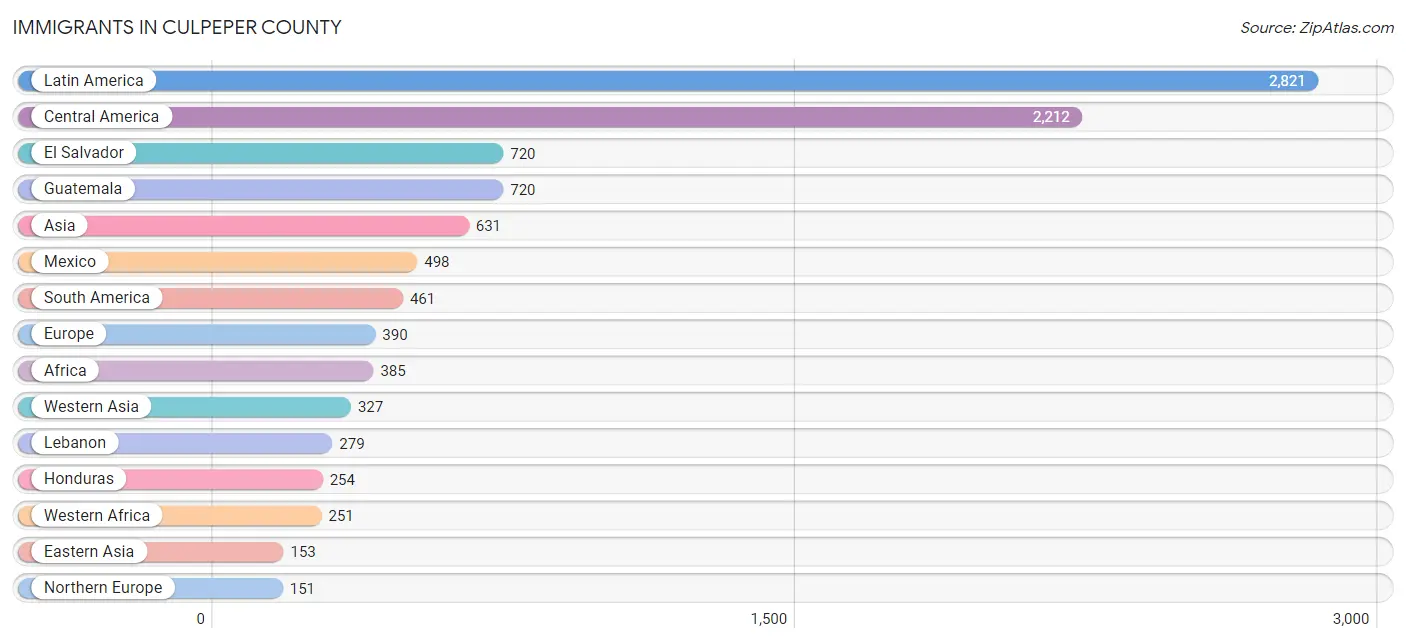
Immigrants in Culpeper County
The most numerous immigrant groups reported in Culpeper County came from Latin America (2,821 | 5.3%), Central America (2,212 | 4.2%), El Salvador (720 | 1.4%), Guatemala (720 | 1.4%), and Asia (631 | 1.2%), together accounting for 13.4% of all Culpeper County residents.
| Immigration Origin | # Population | % Population |
| Africa | 385 | 0.7% |
| Asia | 631 | 1.2% |
| Bahamas | 21 | 0.0% |
| Bolivia | 67 | 0.1% |
| Canada | 42 | 0.1% |
| Caribbean | 148 | 0.3% |
| Central America | 2,212 | 4.2% |
| Chile | 82 | 0.2% |
| China | 67 | 0.1% |
| Colombia | 86 | 0.2% |
| Cuba | 36 | 0.1% |
| Denmark | 20 | 0.0% |
| Dominican Republic | 3 | 0.0% |
| Eastern Africa | 48 | 0.1% |
| Eastern Asia | 153 | 0.3% |
| Eastern Europe | 98 | 0.2% |
| Ecuador | 27 | 0.1% |
| El Salvador | 720 | 1.4% |
| England | 80 | 0.2% |
| Ethiopia | 48 | 0.1% |
| Europe | 390 | 0.7% |
| France | 8 | 0.0% |
| Germany | 99 | 0.2% |
| Ghana | 107 | 0.2% |
| Guatemala | 720 | 1.4% |
| Haiti | 7 | 0.0% |
| Honduras | 254 | 0.5% |
| India | 21 | 0.0% |
| Iraq | 37 | 0.1% |
| Ireland | 36 | 0.1% |
| Israel | 11 | 0.0% |
| Jamaica | 75 | 0.1% |
| Japan | 54 | 0.1% |
| Korea | 32 | 0.1% |
| Laos | 32 | 0.1% |
| Latin America | 2,821 | 5.3% |
| Lebanon | 279 | 0.5% |
| Liberia | 144 | 0.3% |
| Mexico | 498 | 0.9% |
| Nicaragua | 14 | 0.0% |
| Northern Europe | 151 | 0.3% |
| Pakistan | 24 | 0.1% |
| Panama | 6 | 0.0% |
| Peru | 148 | 0.3% |
| Philippines | 23 | 0.0% |
| Poland | 10 | 0.0% |
| Portugal | 34 | 0.1% |
| Russia | 63 | 0.1% |
| South Africa | 16 | 0.0% |
| South America | 461 | 0.9% |
| South Central Asia | 45 | 0.1% |
| South Eastern Asia | 106 | 0.2% |
| Southern Europe | 34 | 0.1% |
| Sweden | 15 | 0.0% |
| Thailand | 31 | 0.1% |
| Trinidad and Tobago | 6 | 0.0% |
| Ukraine | 22 | 0.0% |
| Venezuela | 51 | 0.1% |
| Vietnam | 20 | 0.0% |
| Western Africa | 251 | 0.5% |
| Western Asia | 327 | 0.6% |
| Western Europe | 107 | 0.2% | View All 62 Rows |
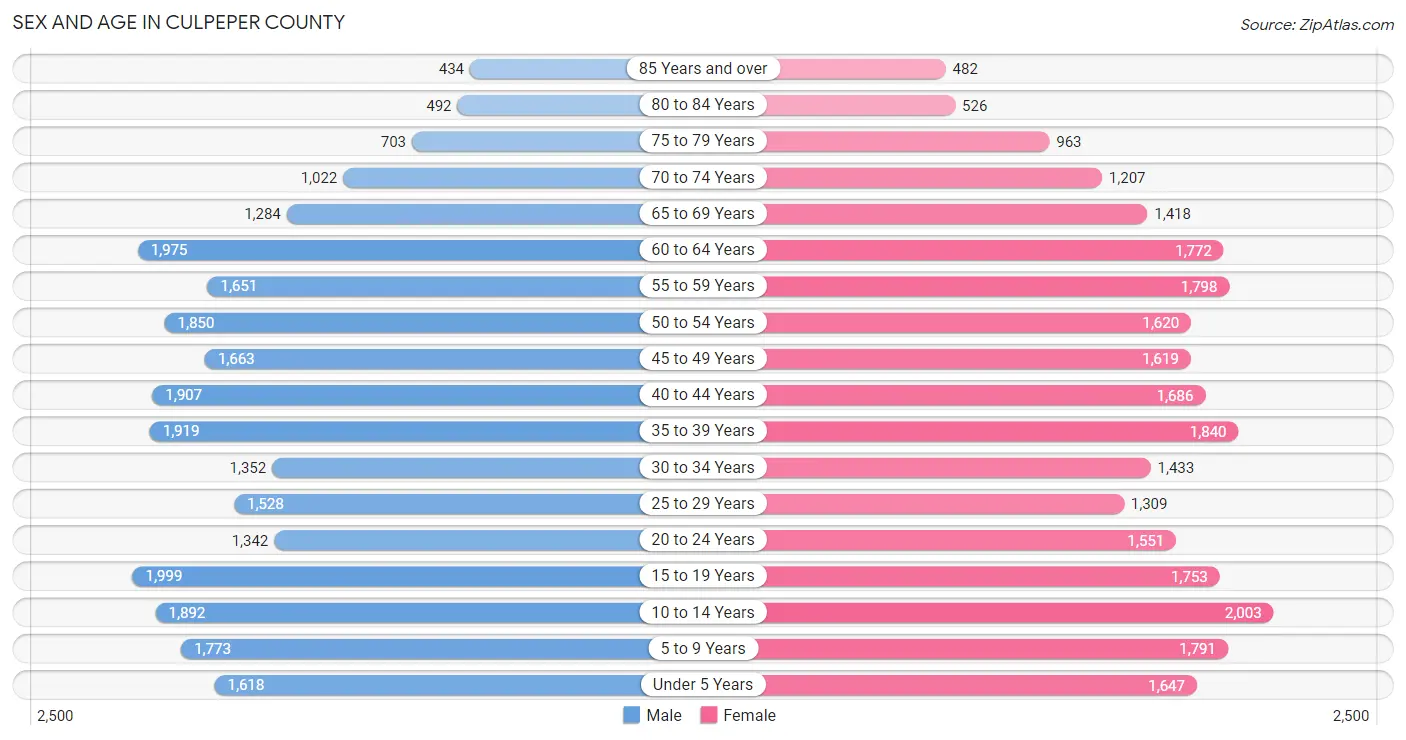
Sex and Age in Culpeper County
Sex and Age in Culpeper County
The most populous age groups in Culpeper County are 15 to 19 Years (1,999 | 7.6%) for men and 10 to 14 Years (2,003 | 7.6%) for women.
| Age Bracket | Male | Female |
| Under 5 Years | 1,618 (6.1%) | 1,647 (6.2%) |
| 5 to 9 Years | 1,773 (6.7%) | 1,791 (6.8%) |
| 10 to 14 Years | 1,892 (7.2%) | 2,003 (7.6%) |
| 15 to 19 Years | 1,999 (7.6%) | 1,753 (6.6%) |
| 20 to 24 Years | 1,342 (5.1%) | 1,551 (5.9%) |
| 25 to 29 Years | 1,528 (5.8%) | 1,309 (5.0%) |
| 30 to 34 Years | 1,352 (5.1%) | 1,433 (5.4%) |
| 35 to 39 Years | 1,919 (7.3%) | 1,840 (7.0%) |
| 40 to 44 Years | 1,907 (7.2%) | 1,686 (6.4%) |
| 45 to 49 Years | 1,663 (6.3%) | 1,619 (6.1%) |
| 50 to 54 Years | 1,850 (7.0%) | 1,620 (6.1%) |
| 55 to 59 Years | 1,651 (6.2%) | 1,798 (6.8%) |
| 60 to 64 Years | 1,975 (7.5%) | 1,772 (6.7%) |
| 65 to 69 Years | 1,284 (4.9%) | 1,418 (5.4%) |
| 70 to 74 Years | 1,022 (3.9%) | 1,207 (4.6%) |
| 75 to 79 Years | 703 (2.7%) | 963 (3.6%) |
| 80 to 84 Years | 492 (1.9%) | 526 (2.0%) |
| 85 Years and over | 434 (1.6%) | 482 (1.8%) |
| Total | 26,404 (100.0%) | 26,418 (100.0%) |
Families and Households in Culpeper County
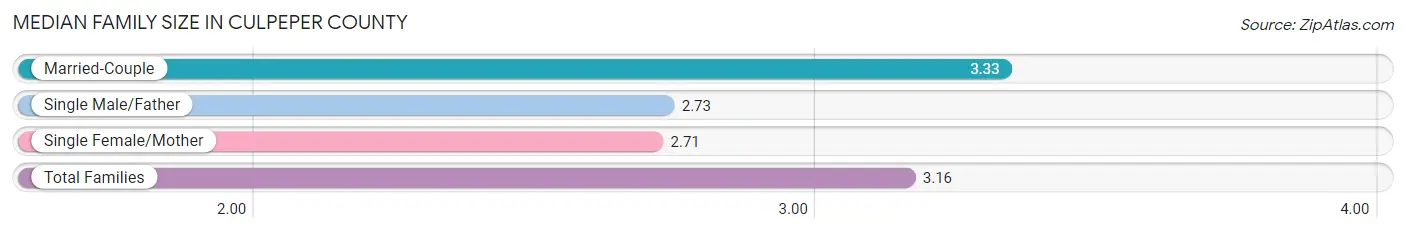
Median Family Size in Culpeper County
The median family size in Culpeper County is 3.16 persons per family, with married-couple families (10,011 | 71.7%) accounting for the largest median family size of 3.33 persons per family. On the other hand, single female/mother families (2,811 | 20.1%) represent the smallest median family size with 2.71 persons per family.
| Family Type | # Families | Family Size |
| Married-Couple | 10,011 (71.7%) | 3.33 |
| Single Male/Father | 1,133 (8.1%) | 2.73 |
| Single Female/Mother | 2,811 (20.1%) | 2.71 |
| Total Families | 13,955 (100.0%) | 3.16 |
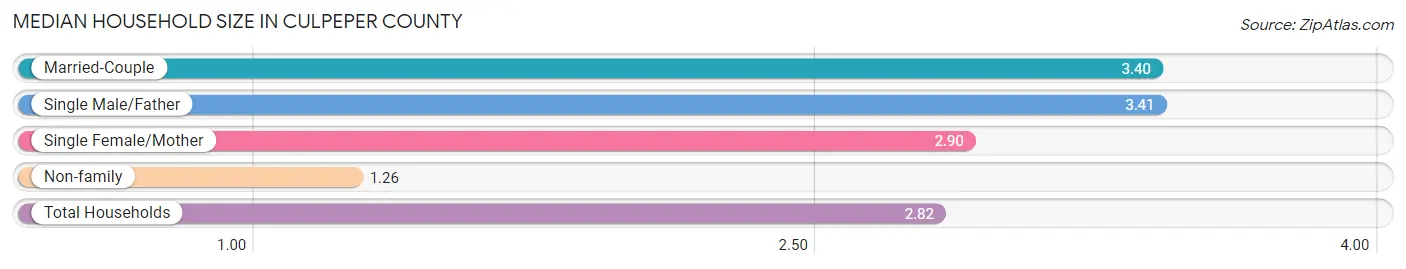
Median Household Size in Culpeper County
The median household size in Culpeper County is 2.82 persons per household, with single male/father households (1,133 | 6.2%) accounting for the largest median household size of 3.41 persons per household. non-family households (4,233 | 23.3%) represent the smallest median household size with 1.26 persons per household.
| Household Type | # Households | Household Size |
| Married-Couple | 10,011 (55.0%) | 3.40 |
| Single Male/Father | 1,133 (6.2%) | 3.41 |
| Single Female/Mother | 2,811 (15.5%) | 2.90 |
| Non-family | 4,233 (23.3%) | 1.26 |
| Total Households | 18,188 (100.0%) | 2.82 |
Household Size by Marriage Status in Culpeper County
Out of a total of 18,188 households in Culpeper County, 13,955 (76.7%) are family households, while 4,233 (23.3%) are nonfamily households. The most numerous type of family households are 2-person households, comprising 5,645, and the most common type of nonfamily households are 1-person households, comprising 3,436.
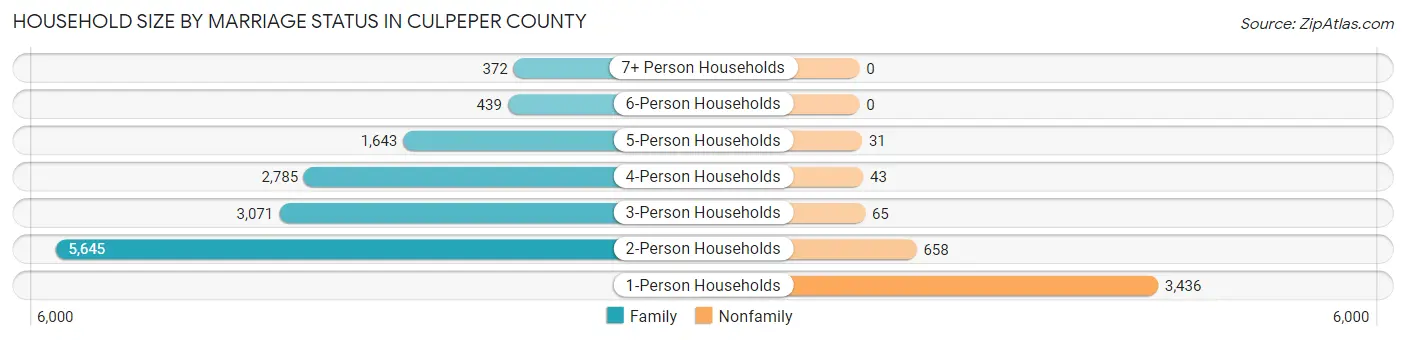
| Household Size | Family Households | Nonfamily Households |
| 1-Person Households | - | 3,436 (18.9%) |
| 2-Person Households | 5,645 (31.0%) | 658 (3.6%) |
| 3-Person Households | 3,071 (16.9%) | 65 (0.4%) |
| 4-Person Households | 2,785 (15.3%) | 43 (0.2%) |
| 5-Person Households | 1,643 (9.0%) | 31 (0.2%) |
| 6-Person Households | 439 (2.4%) | 0 (0.0%) |
| 7+ Person Households | 372 (2.1%) | 0 (0.0%) |
| Total | 13,955 (76.7%) | 4,233 (23.3%) |
Female Fertility in Culpeper County
Fertility by Age in Culpeper County
Average fertility rate in Culpeper County is 40.0 births per 1,000 women. Women in the age bracket of 20 to 34 years have the highest fertility rate with 88.0 births per 1,000 women. Women in the age bracket of 20 to 34 years acount for 81.2% of all women with births.
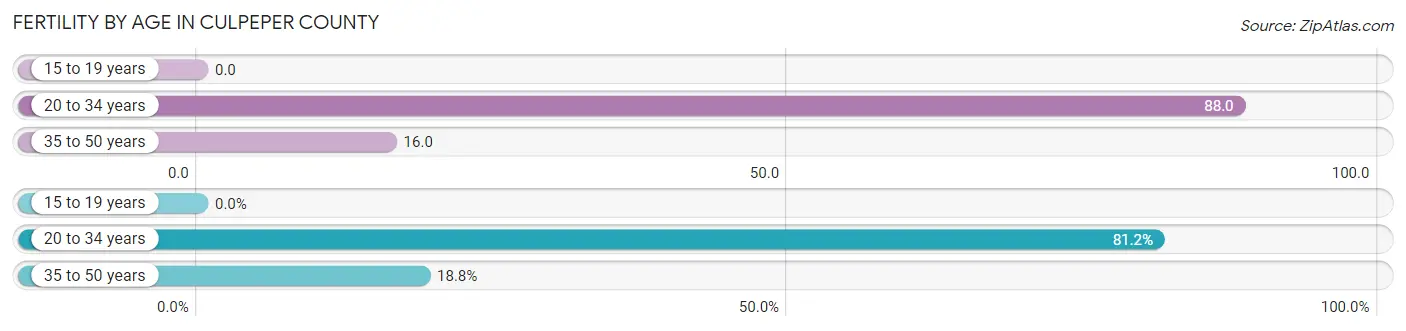
| Age Bracket | Women with Births | Births / 1,000 Women |
| 15 to 19 years | 0 (0.0%) | 0.0 |
| 20 to 34 years | 379 (81.2%) | 88.0 |
| 35 to 50 years | 88 (18.8%) | 16.0 |
| Total | 467 (100.0%) | 40.0 |
Fertility by Age by Marriage Status in Culpeper County
41.8% of women with births (467) in Culpeper County are married. The highest percentage of unmarried women with births falls into 20 to 34 years age bracket with 67.5% of them unmarried at the time of birth, while the lowest percentage of unmarried women with births belong to 35 to 50 years age bracket with 18.2% of them unmarried.
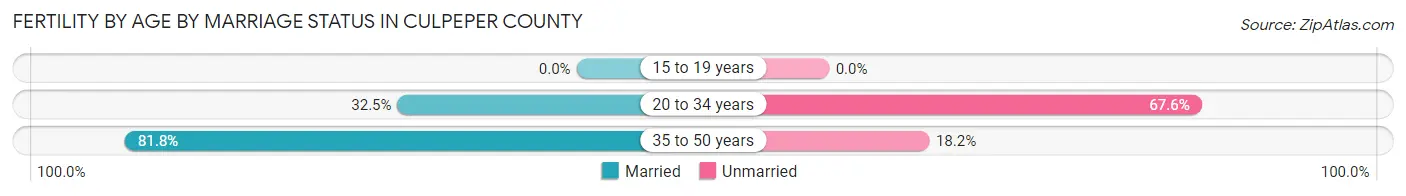
| Age Bracket | Married | Unmarried |
| 15 to 19 years | 0 (0.0%) | 0 (0.0%) |
| 20 to 34 years | 123 (32.5%) | 256 (67.5%) |
| 35 to 50 years | 72 (81.8%) | 16 (18.2%) |
| Total | 195 (41.8%) | 272 (58.2%) |
Fertility by Education in Culpeper County
Average fertility rate in Culpeper County is 40.0 births per 1,000 women. Women with the education attainment of high school diploma have the highest fertility rate of 60.0 births per 1,000 women, while women with the education attainment of graduate degree have the lowest fertility at 17.0 births per 1,000 women. Women with the education attainment of high school diploma represent 44.1% of all women with births.
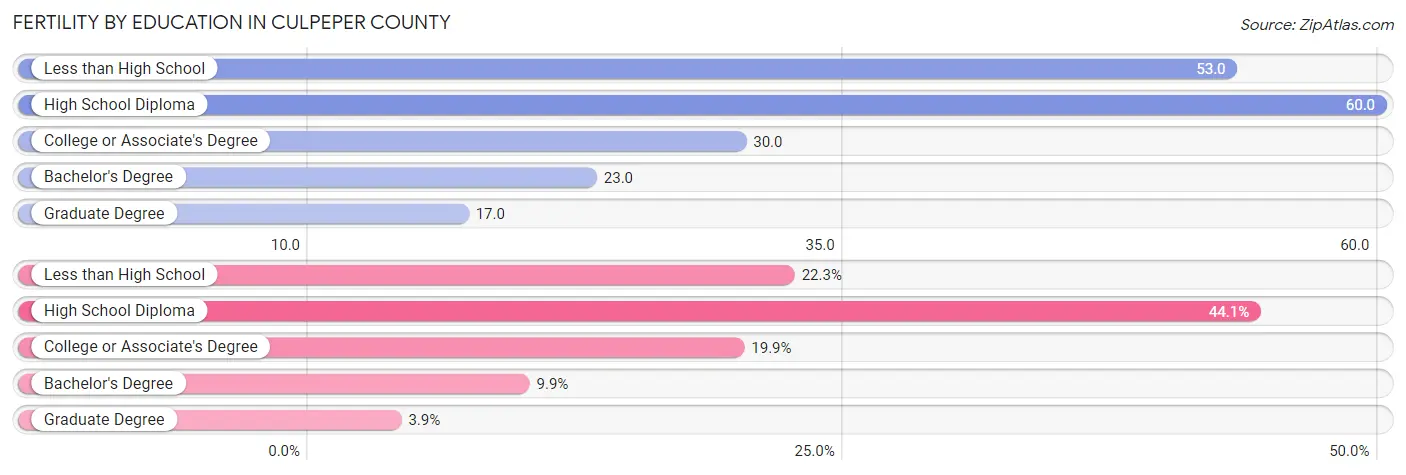
| Educational Attainment | Women with Births | Births / 1,000 Women |
| Less than High School | 104 (22.3%) | 53.0 |
| High School Diploma | 206 (44.1%) | 60.0 |
| College or Associate's Degree | 93 (19.9%) | 30.0 |
| Bachelor's Degree | 46 (9.9%) | 23.0 |
| Graduate Degree | 18 (3.8%) | 17.0 |
| Total | 467 (100.0%) | 40.0 |
Fertility by Education by Marriage Status in Culpeper County
58.2% of women with births in Culpeper County are unmarried. Women with the educational attainment of bachelor's degree are most likely to be married with 100.0% of them married at childbirth, while women with the educational attainment of less than high school are least likely to be married with 95.2% of them unmarried at childbirth.
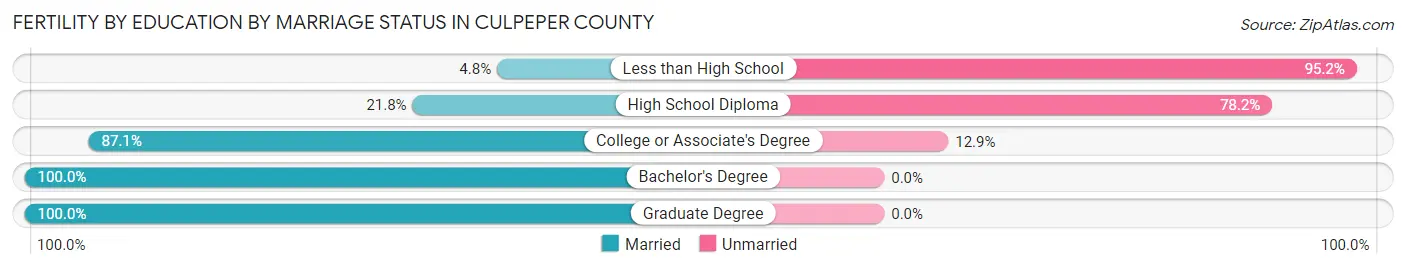
| Educational Attainment | Married | Unmarried |
| Less than High School | 5 (4.8%) | 99 (95.2%) |
| High School Diploma | 45 (21.8%) | 161 (78.2%) |
| College or Associate's Degree | 81 (87.1%) | 12 (12.9%) |
| Bachelor's Degree | 46 (100.0%) | 0 (0.0%) |
| Graduate Degree | 18 (100.0%) | 0 (0.0%) |
| Total | 195 (41.8%) | 272 (58.2%) |
Employment Characteristics in Culpeper County
Employment by Class of Employer in Culpeper County
Among the 25,422 employed individuals in Culpeper County, private company employees (16,860 | 66.3%), local government employees (2,544 | 10.0%), and not-for-profit organizations (1,560 | 6.1%) make up the most common classes of employment.
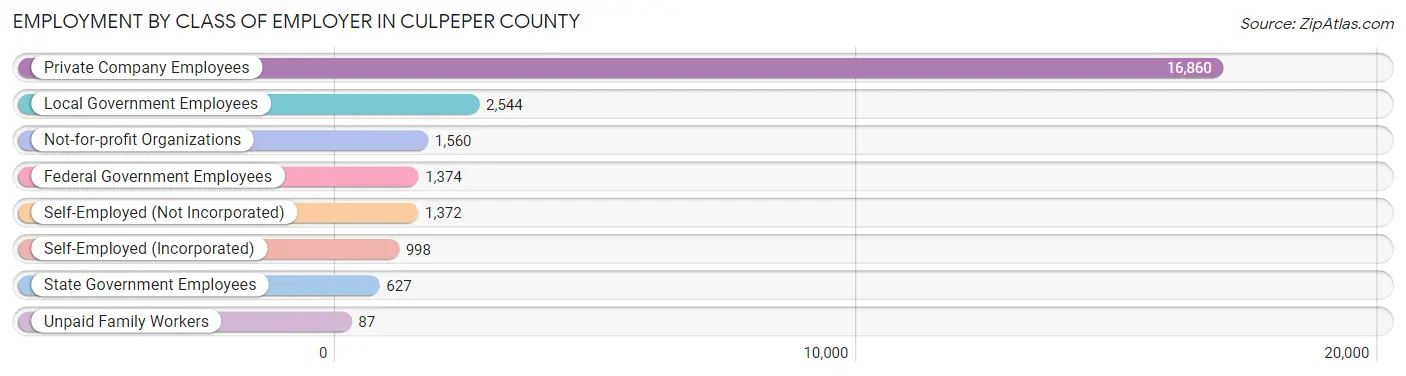
| Employer Class | # Employees | % Employees |
| Private Company Employees | 16,860 | 66.3% |
| Self-Employed (Incorporated) | 998 | 3.9% |
| Self-Employed (Not Incorporated) | 1,372 | 5.4% |
| Not-for-profit Organizations | 1,560 | 6.1% |
| Local Government Employees | 2,544 | 10.0% |
| State Government Employees | 627 | 2.5% |
| Federal Government Employees | 1,374 | 5.4% |
| Unpaid Family Workers | 87 | 0.3% |
| Total | 25,422 | 100.0% |
Employment Status by Age in Culpeper County
According to the labor force statistics for Culpeper County, out of the total population over 16 years of age (41,560), 64.7% or 26,889 individuals are in the labor force, with 3.9% or 1,049 of them unemployed. The age group with the highest labor force participation rate is 30 to 34 years, with 89.0% or 2,479 individuals in the labor force. Within the labor force, the 16 to 19 years age range has the highest percentage of unemployed individuals, with 14.6% or 231 of them being unemployed.
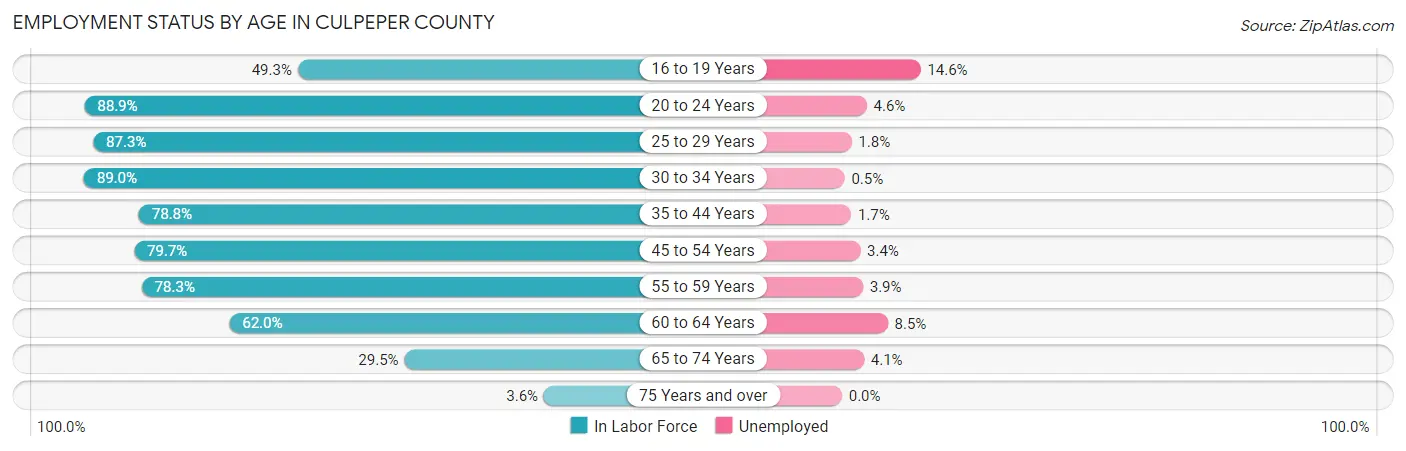
| Age Bracket | In Labor Force | Unemployed |
| 16 to 19 Years | 1,585 (49.3%) | 231 (14.6%) |
| 20 to 24 Years | 2,572 (88.9%) | 118 (4.6%) |
| 25 to 29 Years | 2,477 (87.3%) | 45 (1.8%) |
| 30 to 34 Years | 2,479 (89.0%) | 12 (0.5%) |
| 35 to 44 Years | 5,793 (78.8%) | 98 (1.7%) |
| 45 to 54 Years | 5,381 (79.7%) | 183 (3.4%) |
| 55 to 59 Years | 2,701 (78.3%) | 105 (3.9%) |
| 60 to 64 Years | 2,323 (62.0%) | 197 (8.5%) |
| 65 to 74 Years | 1,455 (29.5%) | 60 (4.1%) |
| 75 Years and over | 130 (3.6%) | 0 (0.0%) |
| Total | 26,889 (64.7%) | 1,049 (3.9%) |
Employment Status by Educational Attainment in Culpeper County
According to labor force statistics for Culpeper County, 78.6% of individuals (21,161) out of the total population between 25 and 64 years of age (26,922) are in the labor force, with 3.0% or 635 of them being unemployed. The group with the highest labor force participation rate are those with the educational attainment of bachelor's degree or higher, with 84.8% or 6,259 individuals in the labor force. Within the labor force, individuals with less than high school education have the highest percentage of unemployment, with 10.5% or 175 of them being unemployed.
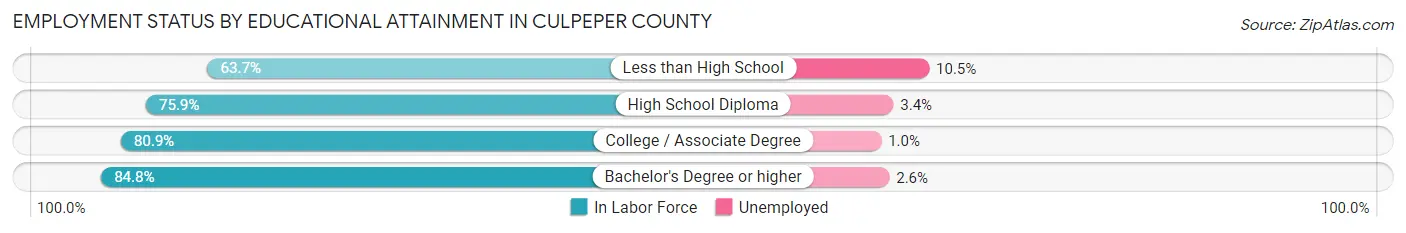
| Educational Attainment | In Labor Force | Unemployed |
| Less than High School | 1,663 (63.7%) | 274 (10.5%) |
| High School Diploma | 6,926 (75.9%) | 310 (3.4%) |
| College / Associate Degree | 6,314 (80.9%) | 78 (1.0%) |
| Bachelor's Degree or higher | 6,259 (84.8%) | 192 (2.6%) |
| Total | 21,161 (78.6%) | 808 (3.0%) |
Employment Occupations by Sex in Culpeper County
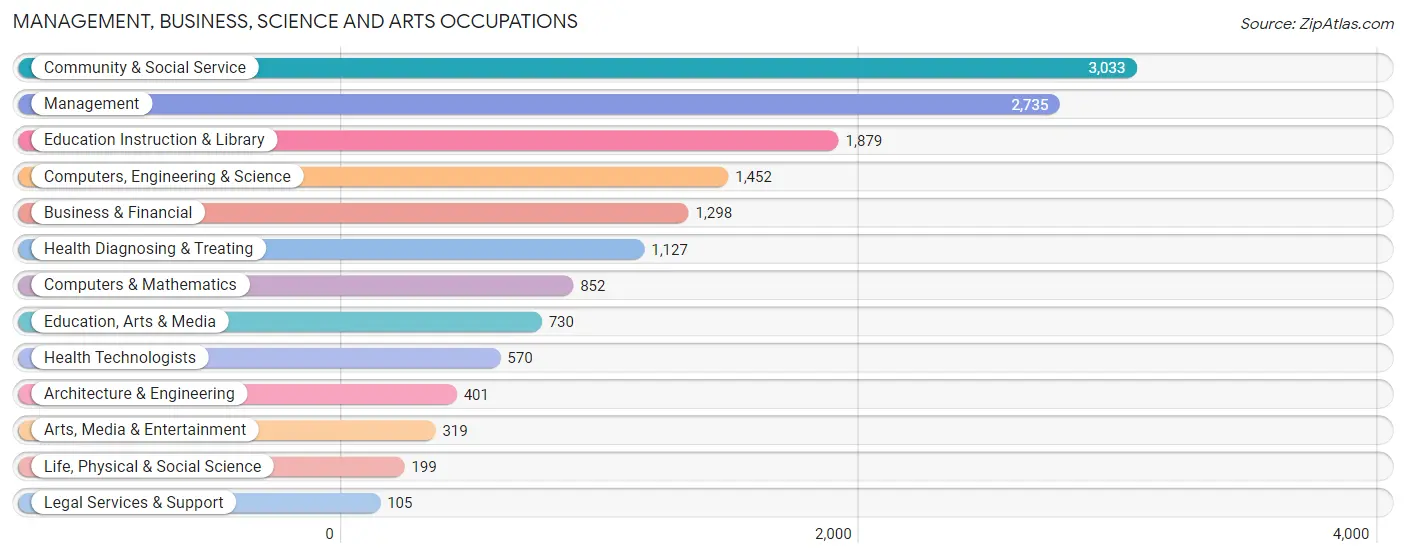
Management, Business, Science and Arts Occupations
The most common Management, Business, Science and Arts occupations in Culpeper County are Community & Social Service (3,033 | 11.8%), Management (2,735 | 10.6%), Education Instruction & Library (1,879 | 7.3%), Computers, Engineering & Science (1,452 | 5.6%), and Business & Financial (1,298 | 5.0%).
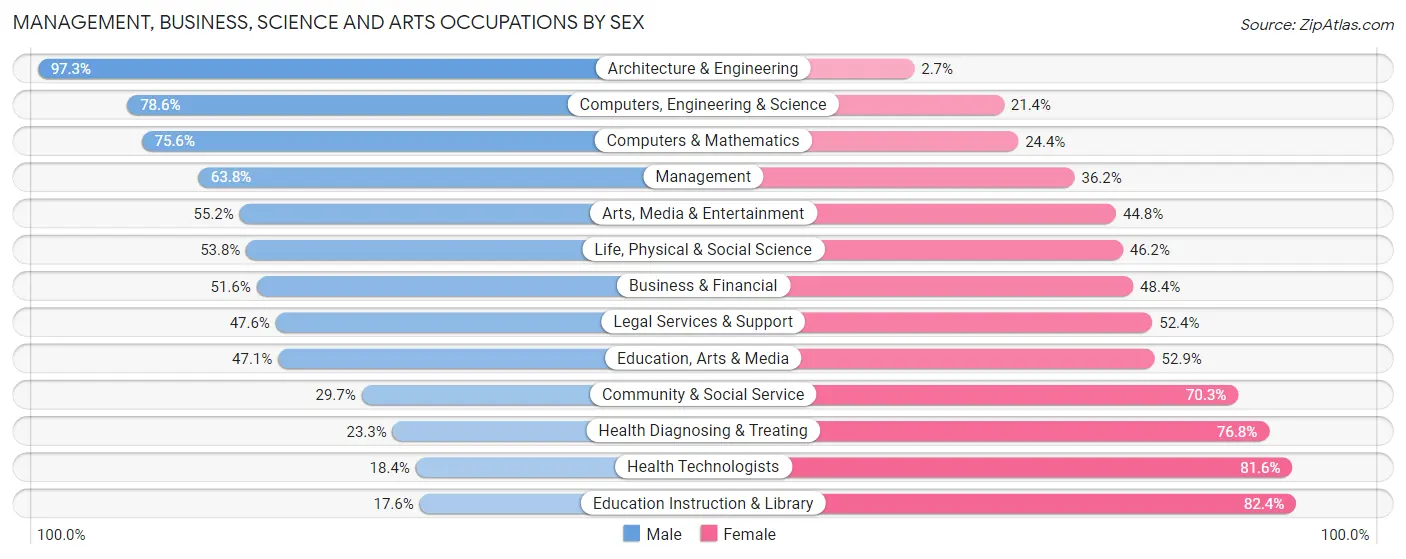
Management, Business, Science and Arts Occupations by Sex
Within the Management, Business, Science and Arts occupations in Culpeper County, the most male-oriented occupations are Architecture & Engineering (97.3%), Computers, Engineering & Science (78.6%), and Computers & Mathematics (75.6%), while the most female-oriented occupations are Education Instruction & Library (82.4%), Health Technologists (81.6%), and Health Diagnosing & Treating (76.7%).
| Occupation | Male | Female |
| Management | 1,746 (63.8%) | 989 (36.2%) |
| Business & Financial | 670 (51.6%) | 628 (48.4%) |
| Computers, Engineering & Science | 1,141 (78.6%) | 311 (21.4%) |
| Computers & Mathematics | 644 (75.6%) | 208 (24.4%) |
| Architecture & Engineering | 390 (97.3%) | 11 (2.7%) |
| Life, Physical & Social Science | 107 (53.8%) | 92 (46.2%) |
| Community & Social Service | 901 (29.7%) | 2,132 (70.3%) |
| Education, Arts & Media | 344 (47.1%) | 386 (52.9%) |
| Legal Services & Support | 50 (47.6%) | 55 (52.4%) |
| Education Instruction & Library | 331 (17.6%) | 1,548 (82.4%) |
| Arts, Media & Entertainment | 176 (55.2%) | 143 (44.8%) |
| Health Diagnosing & Treating | 262 (23.3%) | 865 (76.7%) |
| Health Technologists | 105 (18.4%) | 465 (81.6%) |
| Total (Category) | 4,720 (48.9%) | 4,925 (51.1%) |
| Total (Overall) | 13,681 (53.0%) | 12,113 (47.0%) |
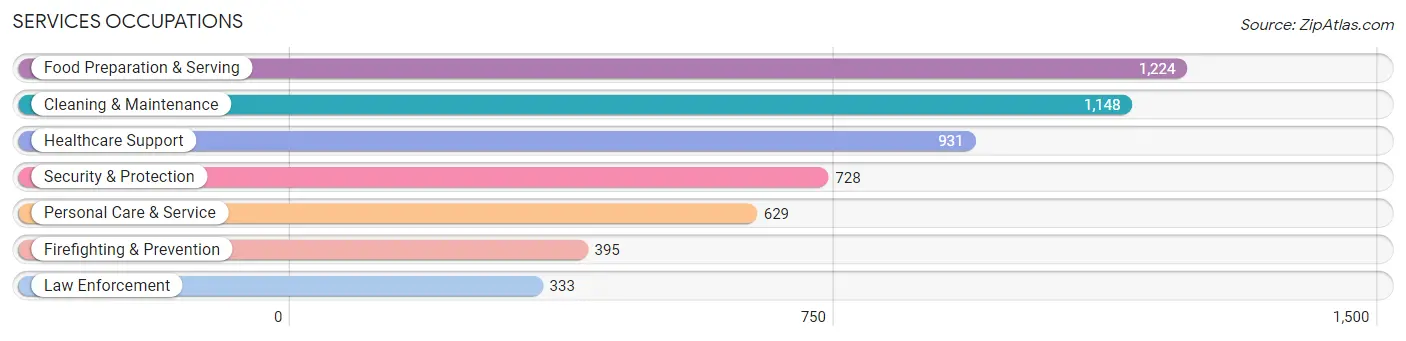
Services Occupations
The most common Services occupations in Culpeper County are Food Preparation & Serving (1,224 | 4.8%), Cleaning & Maintenance (1,148 | 4.4%), Healthcare Support (931 | 3.6%), Security & Protection (728 | 2.8%), and Personal Care & Service (629 | 2.4%).
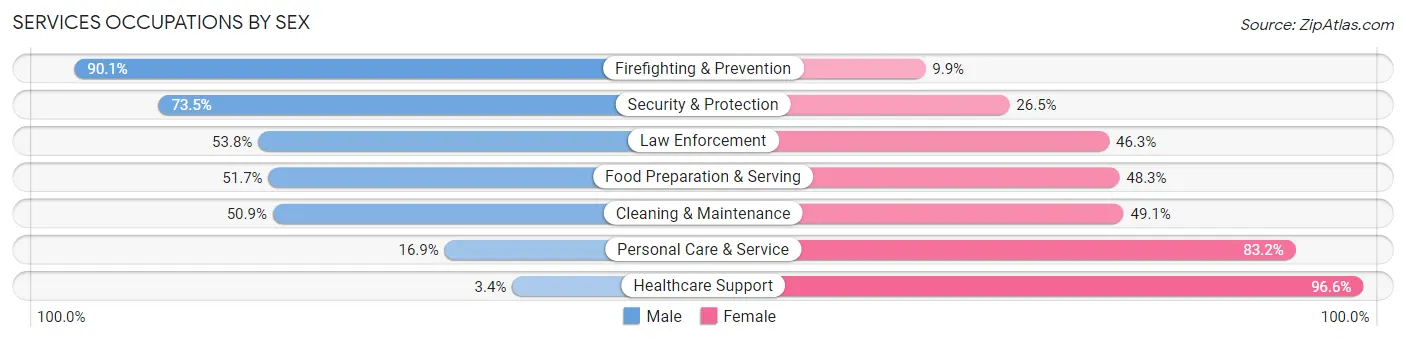
Services Occupations by Sex
Within the Services occupations in Culpeper County, the most male-oriented occupations are Firefighting & Prevention (90.1%), Security & Protection (73.5%), and Law Enforcement (53.7%), while the most female-oriented occupations are Healthcare Support (96.6%), Personal Care & Service (83.2%), and Cleaning & Maintenance (49.1%).
| Occupation | Male | Female |
| Healthcare Support | 32 (3.4%) | 899 (96.6%) |
| Security & Protection | 535 (73.5%) | 193 (26.5%) |
| Firefighting & Prevention | 356 (90.1%) | 39 (9.9%) |
| Law Enforcement | 179 (53.7%) | 154 (46.3%) |
| Food Preparation & Serving | 633 (51.7%) | 591 (48.3%) |
| Cleaning & Maintenance | 584 (50.9%) | 564 (49.1%) |
| Personal Care & Service | 106 (16.9%) | 523 (83.2%) |
| Total (Category) | 1,890 (40.6%) | 2,770 (59.4%) |
| Total (Overall) | 13,681 (53.0%) | 12,113 (47.0%) |
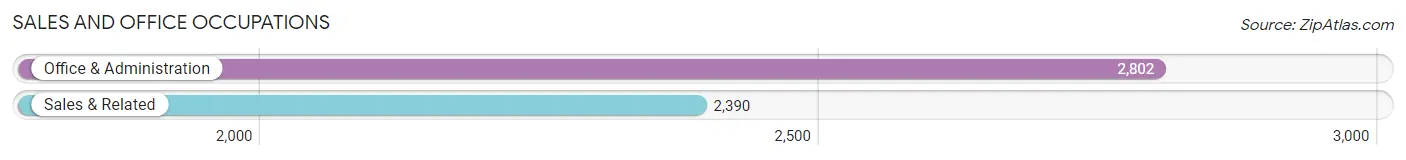
Sales and Office Occupations
The most common Sales and Office occupations in Culpeper County are Office & Administration (2,802 | 10.9%), and Sales & Related (2,390 | 9.3%).
Sales and Office Occupations by Sex

| Occupation | Male | Female |
| Sales & Related | 1,065 (44.6%) | 1,325 (55.4%) |
| Office & Administration | 518 (18.5%) | 2,284 (81.5%) |
| Total (Category) | 1,583 (30.5%) | 3,609 (69.5%) |
| Total (Overall) | 13,681 (53.0%) | 12,113 (47.0%) |
Natural Resources, Construction and Maintenance Occupations
The most common Natural Resources, Construction and Maintenance occupations in Culpeper County are Construction & Extraction (1,659 | 6.4%), Installation, Maintenance & Repair (996 | 3.9%), and Farming, Fishing & Forestry (167 | 0.6%).

Natural Resources, Construction and Maintenance Occupations by Sex

| Occupation | Male | Female |
| Farming, Fishing & Forestry | 117 (70.1%) | 50 (29.9%) |
| Construction & Extraction | 1,659 (100.0%) | 0 (0.0%) |
| Installation, Maintenance & Repair | 996 (100.0%) | 0 (0.0%) |
| Total (Category) | 2,772 (98.2%) | 50 (1.8%) |
| Total (Overall) | 13,681 (53.0%) | 12,113 (47.0%) |
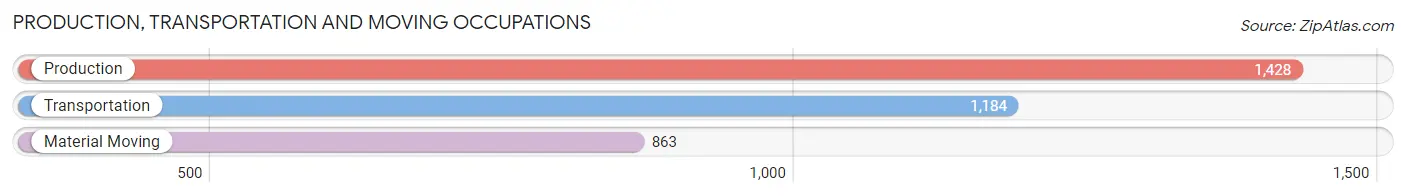
Production, Transportation and Moving Occupations
The most common Production, Transportation and Moving occupations in Culpeper County are Production (1,428 | 5.5%), Transportation (1,184 | 4.6%), and Material Moving (863 | 3.4%).
Production, Transportation and Moving Occupations by Sex
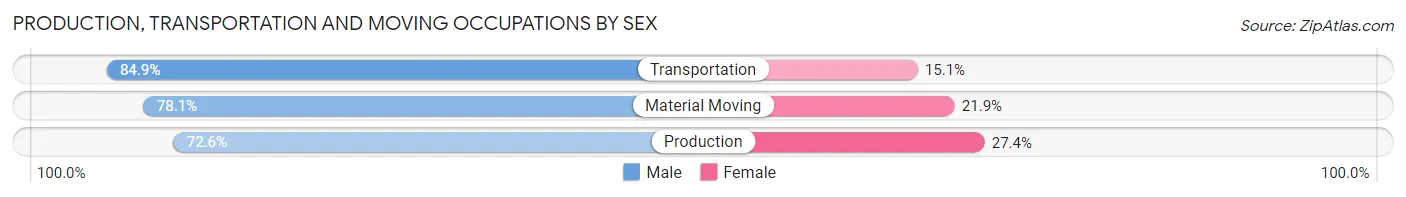
| Occupation | Male | Female |
| Production | 1,037 (72.6%) | 391 (27.4%) |
| Transportation | 1,005 (84.9%) | 179 (15.1%) |
| Material Moving | 674 (78.1%) | 189 (21.9%) |
| Total (Category) | 2,716 (78.2%) | 759 (21.8%) |
| Total (Overall) | 13,681 (53.0%) | 12,113 (47.0%) |
Employment Industries by Sex in Culpeper County
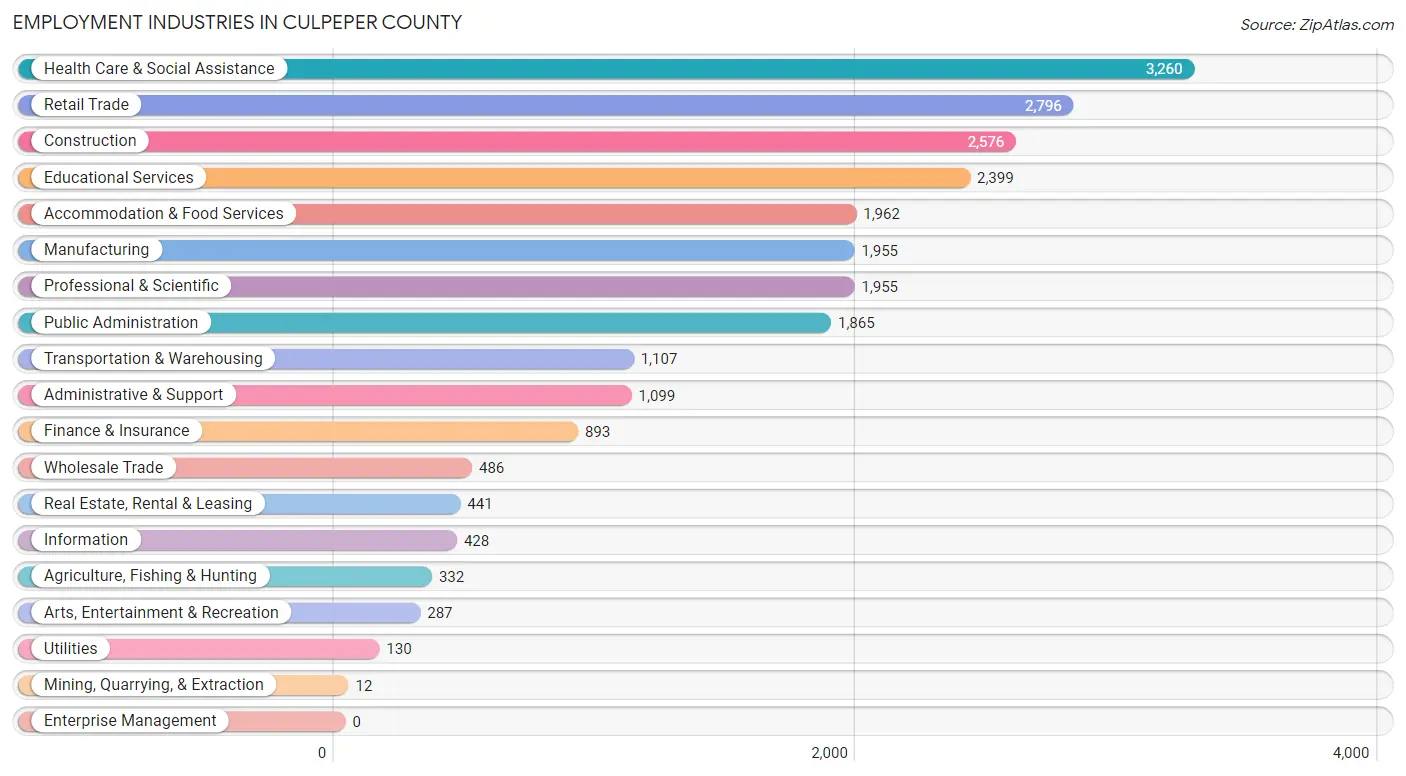
Employment Industries in Culpeper County
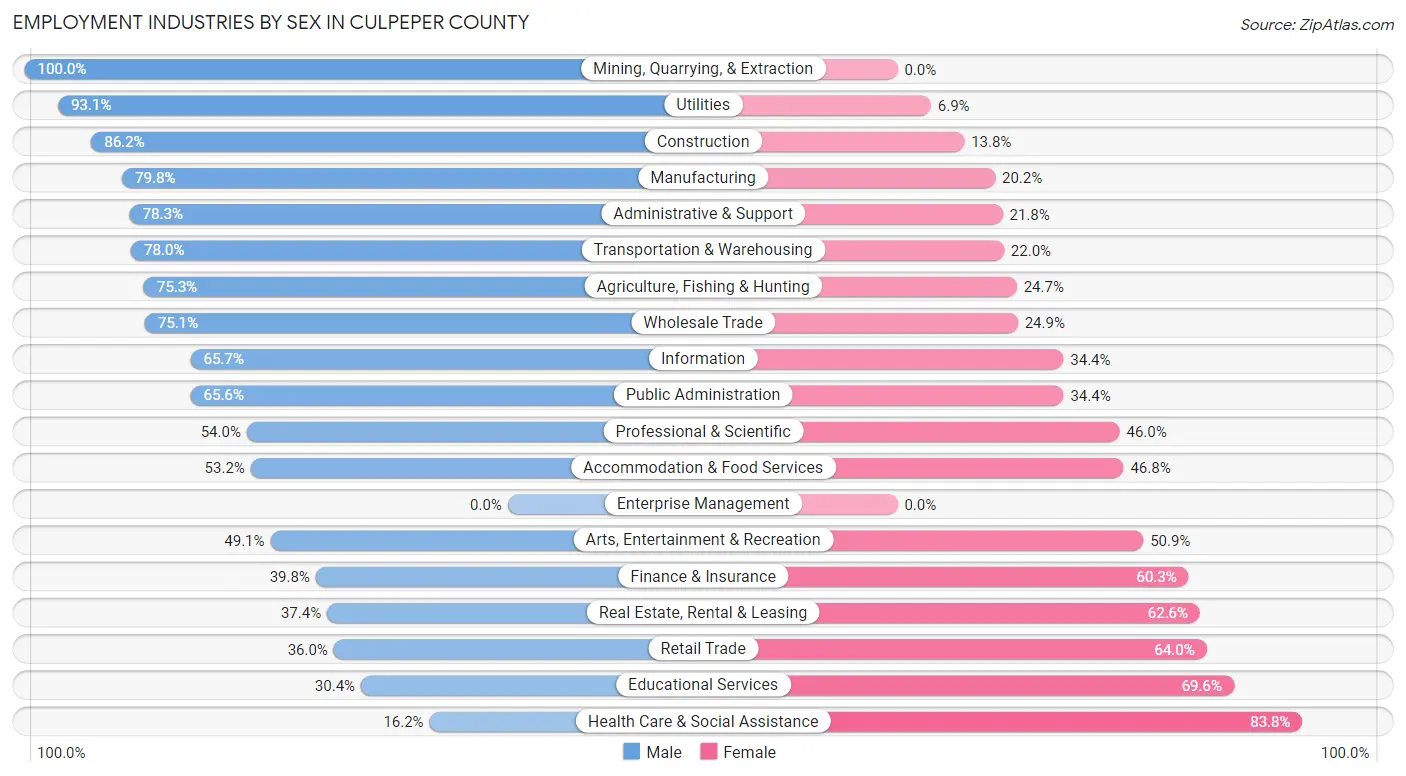
The major employment industries in Culpeper County include Health Care & Social Assistance (3,260 | 12.6%), Retail Trade (2,796 | 10.8%), Construction (2,576 | 10.0%), Educational Services (2,399 | 9.3%), and Accommodation & Food Services (1,962 | 7.6%).
Employment Industries by Sex in Culpeper County
The Culpeper County industries that see more men than women are Mining, Quarrying, & Extraction (100.0%), Utilities (93.1%), and Construction (86.2%), whereas the industries that tend to have a higher number of women are Health Care & Social Assistance (83.8%), Educational Services (69.6%), and Retail Trade (64.0%).
| Industry | Male | Female |
| Agriculture, Fishing & Hunting | 250 (75.3%) | 82 (24.7%) |
| Mining, Quarrying, & Extraction | 12 (100.0%) | 0 (0.0%) |
| Construction | 2,220 (86.2%) | 356 (13.8%) |
| Manufacturing | 1,560 (79.8%) | 395 (20.2%) |
| Wholesale Trade | 365 (75.1%) | 121 (24.9%) |
| Retail Trade | 1,007 (36.0%) | 1,789 (64.0%) |
| Transportation & Warehousing | 863 (78.0%) | 244 (22.0%) |
| Utilities | 121 (93.1%) | 9 (6.9%) |
| Information | 281 (65.6%) | 147 (34.4%) |
| Finance & Insurance | 355 (39.8%) | 538 (60.3%) |
| Real Estate, Rental & Leasing | 165 (37.4%) | 276 (62.6%) |
| Professional & Scientific | 1,056 (54.0%) | 899 (46.0%) |
| Enterprise Management | 0 (0.0%) | 0 (0.0%) |
| Administrative & Support | 860 (78.2%) | 239 (21.7%) |
| Educational Services | 729 (30.4%) | 1,670 (69.6%) |
| Health Care & Social Assistance | 528 (16.2%) | 2,732 (83.8%) |
| Arts, Entertainment & Recreation | 141 (49.1%) | 146 (50.9%) |
| Accommodation & Food Services | 1,044 (53.2%) | 918 (46.8%) |
| Public Administration | 1,224 (65.6%) | 641 (34.4%) |
| Total | 13,681 (53.0%) | 12,113 (47.0%) |
Education in Culpeper County
School Enrollment in Culpeper County
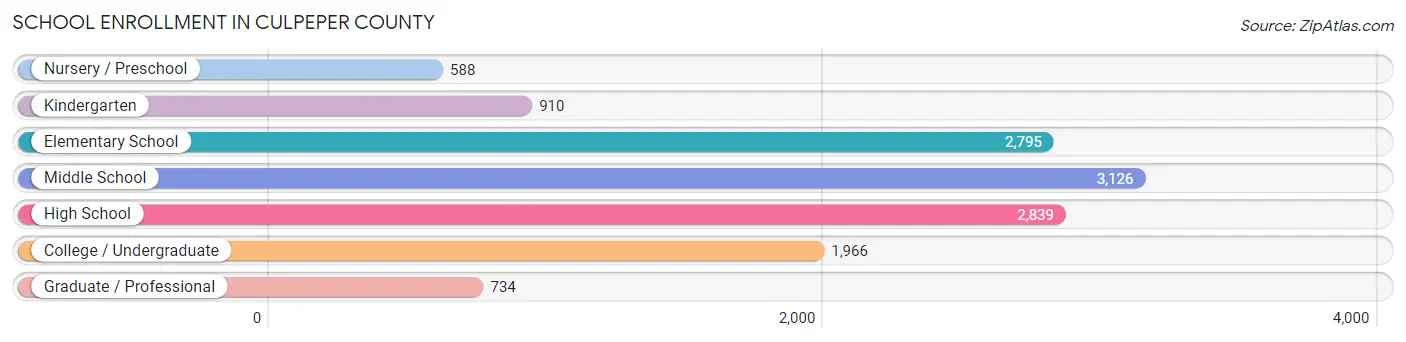
The most common levels of schooling among the 12,958 students in Culpeper County are middle school (3,126 | 24.1%), high school (2,839 | 21.9%), and elementary school (2,795 | 21.6%).
| School Level | # Students | % Students |
| Nursery / Preschool | 588 | 4.5% |
| Kindergarten | 910 | 7.0% |
| Elementary School | 2,795 | 21.6% |
| Middle School | 3,126 | 24.1% |
| High School | 2,839 | 21.9% |
| College / Undergraduate | 1,966 | 15.2% |
| Graduate / Professional | 734 | 5.7% |
| Total | 12,958 | 100.0% |
School Enrollment by Age by Funding Source in Culpeper County
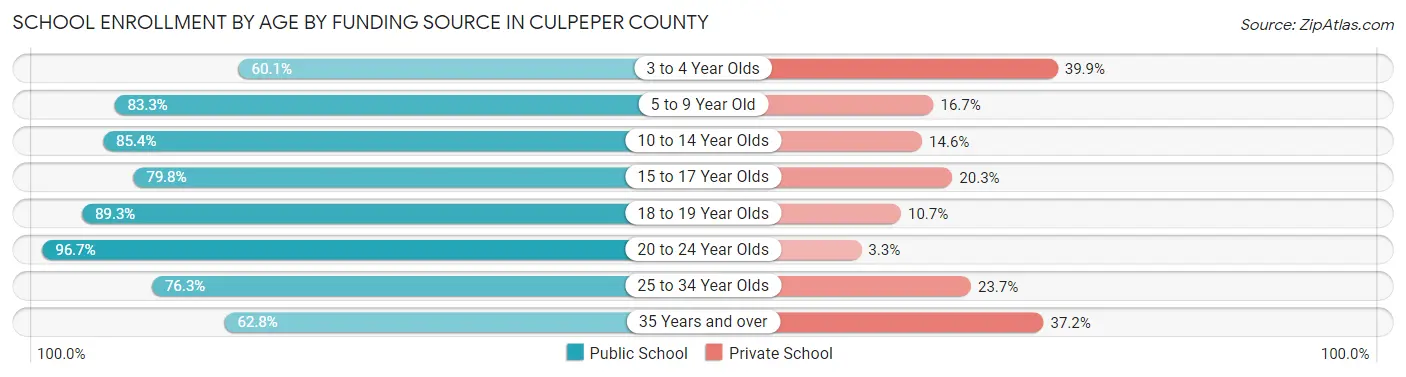
Out of a total of 12,958 students who are enrolled in schools in Culpeper County, 2,397 (18.5%) attend a private institution, while the remaining 10,561 (81.5%) are enrolled in public schools. The age group of 3 to 4 year olds has the highest likelihood of being enrolled in private schools, with 264 (39.9% in the age bracket) enrolled. Conversely, the age group of 20 to 24 year olds has the lowest likelihood of being enrolled in a private school, with 790 (96.7% in the age bracket) attending a public institution.
| Age Bracket | Public School | Private School |
| 3 to 4 Year Olds | 398 (60.1%) | 264 (39.9%) |
| 5 to 9 Year Old | 2,790 (83.3%) | 561 (16.7%) |
| 10 to 14 Year Olds | 3,241 (85.4%) | 555 (14.6%) |
| 15 to 17 Year Olds | 1,666 (79.7%) | 423 (20.3%) |
| 18 to 19 Year Olds | 685 (89.3%) | 82 (10.7%) |
| 20 to 24 Year Olds | 790 (96.7%) | 27 (3.3%) |
| 25 to 34 Year Olds | 376 (76.3%) | 117 (23.7%) |
| 35 Years and over | 617 (62.8%) | 366 (37.2%) |
| Total | 10,561 (81.5%) | 2,397 (18.5%) |
Educational Attainment by Field of Study in Culpeper County
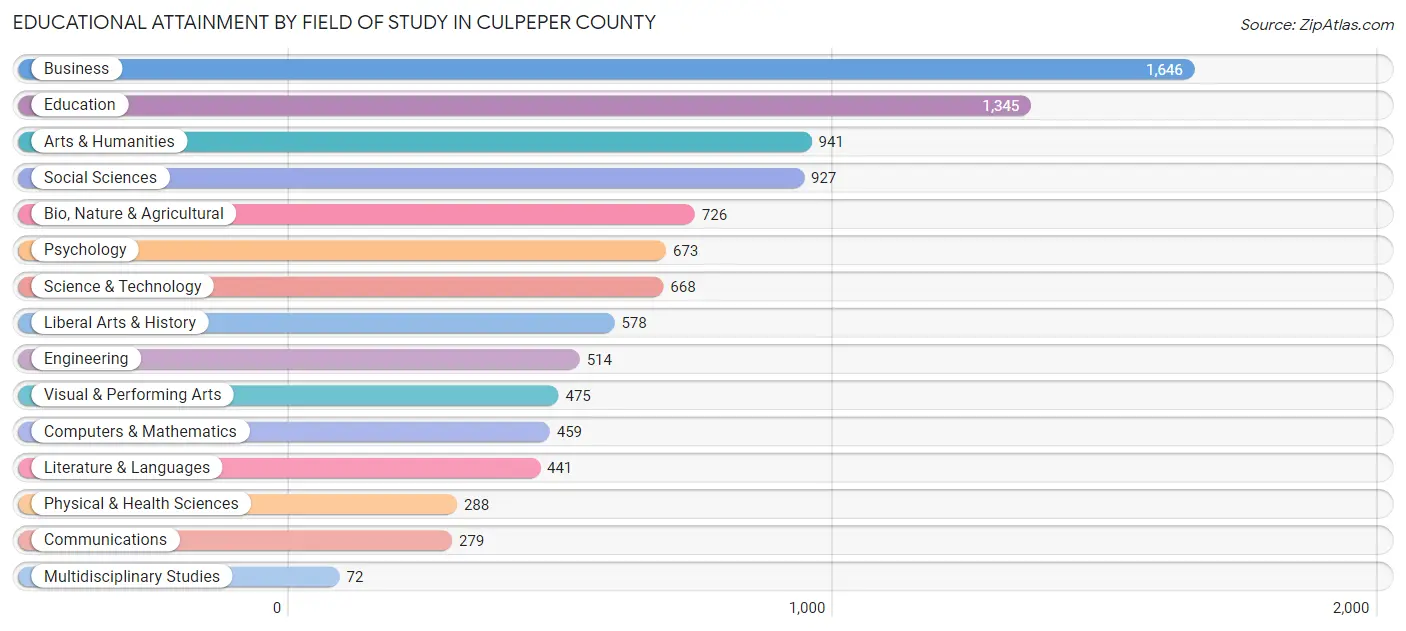
Business (1,646 | 16.4%), education (1,345 | 13.4%), arts & humanities (941 | 9.4%), social sciences (927 | 9.2%), and bio, nature & agricultural (726 | 7.2%) are the most common fields of study among 10,032 individuals in Culpeper County who have obtained a bachelor's degree or higher.
| Field of Study | # Graduates | % Graduates |
| Computers & Mathematics | 459 | 4.6% |
| Bio, Nature & Agricultural | 726 | 7.2% |
| Physical & Health Sciences | 288 | 2.9% |
| Psychology | 673 | 6.7% |
| Social Sciences | 927 | 9.2% |
| Engineering | 514 | 5.1% |
| Multidisciplinary Studies | 72 | 0.7% |
| Science & Technology | 668 | 6.7% |
| Business | 1,646 | 16.4% |
| Education | 1,345 | 13.4% |
| Literature & Languages | 441 | 4.4% |
| Liberal Arts & History | 578 | 5.8% |
| Visual & Performing Arts | 475 | 4.7% |
| Communications | 279 | 2.8% |
| Arts & Humanities | 941 | 9.4% |
| Total | 10,032 | 100.0% |
Transportation & Commute in Culpeper County
Vehicle Availability by Sex in Culpeper County
The most prevalent vehicle ownership categories in Culpeper County are males with 2 vehicles (5,105, accounting for 37.7%) and females with 2 vehicles (3,768, making up 43.1%).
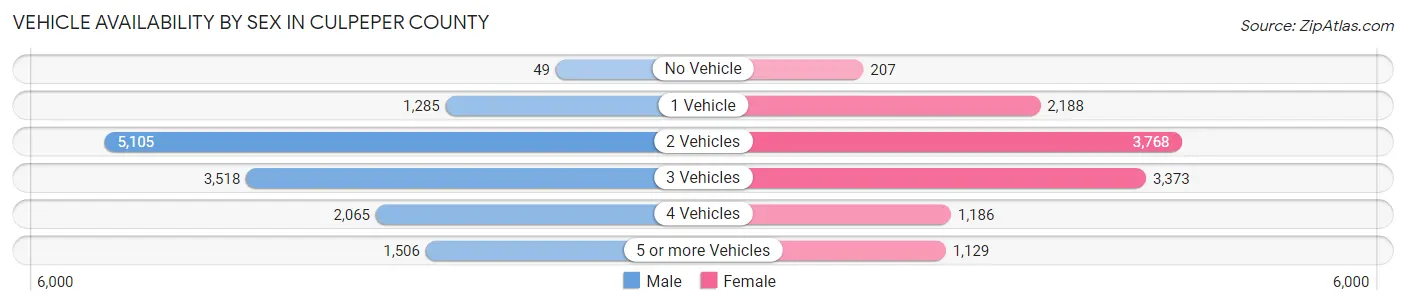
| Vehicles Available | Male | Female |
| No Vehicle | 49 (0.4%) | 207 (1.8%) |
| 1 Vehicle | 1,285 (9.5%) | 2,188 (18.5%) |
| 2 Vehicles | 5,105 (37.7%) | 3,768 (31.8%) |
| 3 Vehicles | 3,518 (26.0%) | 3,373 (28.5%) |
| 4 Vehicles | 2,065 (15.3%) | 1,186 (10.0%) |
| 5 or more Vehicles | 1,506 (11.1%) | 1,129 (9.5%) |
| Total | 13,528 (100.0%) | 11,851 (100.0%) |
Commute Time in Culpeper County
The most frequently occuring commute durations in Culpeper County are 60 to 89 minutes (3,288 commuters, 14.1%), 10 to 14 minutes (3,034 commuters, 13.0%), and 15 to 19 minutes (2,944 commuters, 12.6%).
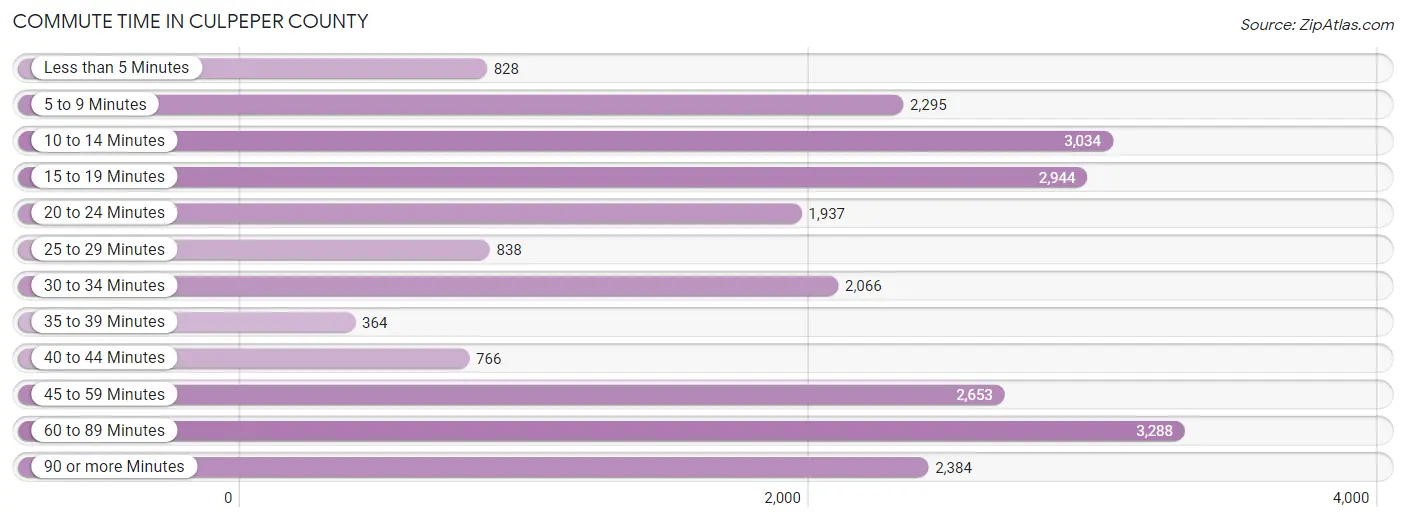
| Commute Time | # Commuters | % Commuters |
| Less than 5 Minutes | 828 | 3.5% |
| 5 to 9 Minutes | 2,295 | 9.8% |
| 10 to 14 Minutes | 3,034 | 13.0% |
| 15 to 19 Minutes | 2,944 | 12.6% |
| 20 to 24 Minutes | 1,937 | 8.3% |
| 25 to 29 Minutes | 838 | 3.6% |
| 30 to 34 Minutes | 2,066 | 8.8% |
| 35 to 39 Minutes | 364 | 1.6% |
| 40 to 44 Minutes | 766 | 3.3% |
| 45 to 59 Minutes | 2,653 | 11.3% |
| 60 to 89 Minutes | 3,288 | 14.1% |
| 90 or more Minutes | 2,384 | 10.2% |
Commute Time by Sex in Culpeper County
The most common commute times in Culpeper County are 60 to 89 minutes (2,099 commuters, 16.7%) for males and 10 to 14 minutes (1,681 commuters, 15.5%) for females.
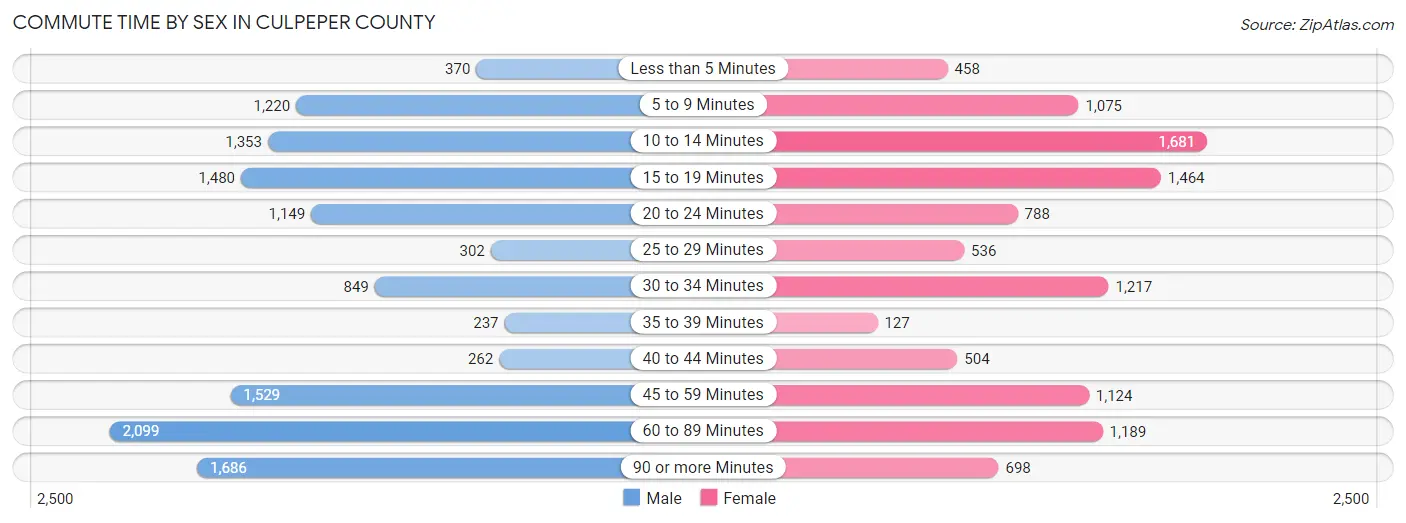
| Commute Time | Male | Female |
| Less than 5 Minutes | 370 (2.9%) | 458 (4.2%) |
| 5 to 9 Minutes | 1,220 (9.7%) | 1,075 (9.9%) |
| 10 to 14 Minutes | 1,353 (10.8%) | 1,681 (15.5%) |
| 15 to 19 Minutes | 1,480 (11.8%) | 1,464 (13.5%) |
| 20 to 24 Minutes | 1,149 (9.2%) | 788 (7.3%) |
| 25 to 29 Minutes | 302 (2.4%) | 536 (4.9%) |
| 30 to 34 Minutes | 849 (6.8%) | 1,217 (11.2%) |
| 35 to 39 Minutes | 237 (1.9%) | 127 (1.2%) |
| 40 to 44 Minutes | 262 (2.1%) | 504 (4.6%) |
| 45 to 59 Minutes | 1,529 (12.2%) | 1,124 (10.3%) |
| 60 to 89 Minutes | 2,099 (16.7%) | 1,189 (11.0%) |
| 90 or more Minutes | 1,686 (13.5%) | 698 (6.4%) |
Time of Departure to Work by Sex in Culpeper County
The most frequent times of departure to work in Culpeper County are 12:00 AM to 4:59 AM (2,025, 16.2%) for males and 7:00 AM to 7:29 AM (1,578, 14.5%) for females.
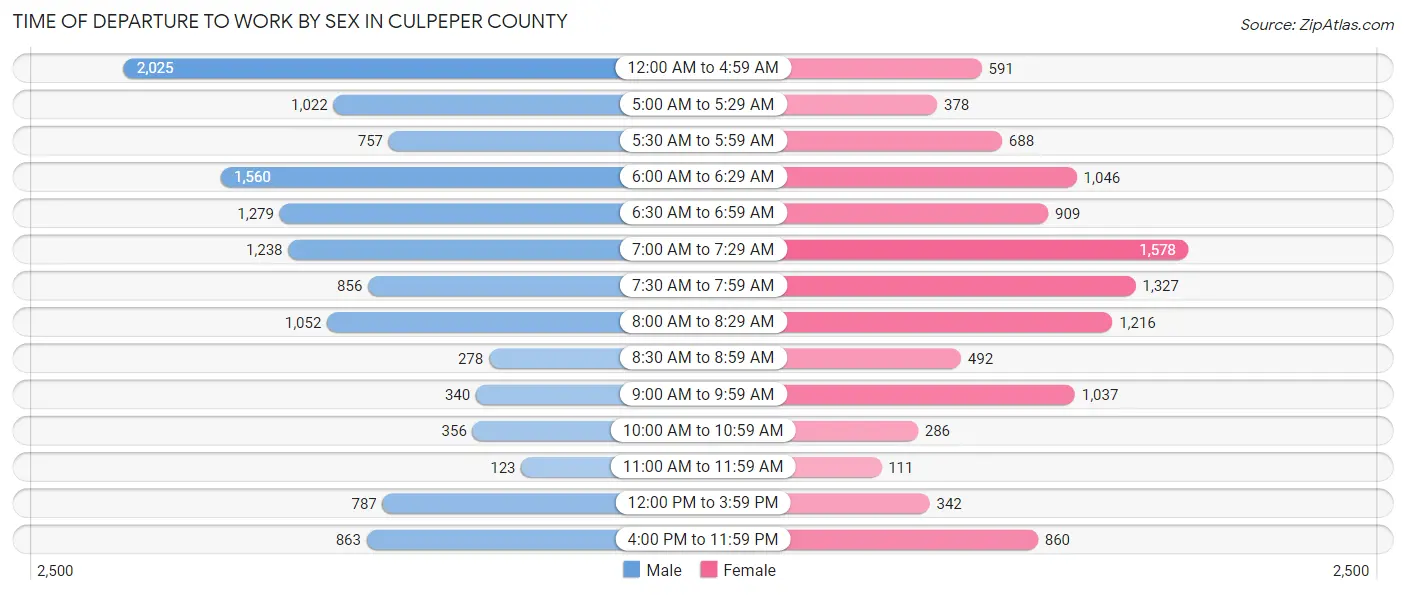
| Time of Departure | Male | Female |
| 12:00 AM to 4:59 AM | 2,025 (16.2%) | 591 (5.4%) |
| 5:00 AM to 5:29 AM | 1,022 (8.2%) | 378 (3.5%) |
| 5:30 AM to 5:59 AM | 757 (6.0%) | 688 (6.3%) |
| 6:00 AM to 6:29 AM | 1,560 (12.4%) | 1,046 (9.6%) |
| 6:30 AM to 6:59 AM | 1,279 (10.2%) | 909 (8.4%) |
| 7:00 AM to 7:29 AM | 1,238 (9.9%) | 1,578 (14.5%) |
| 7:30 AM to 7:59 AM | 856 (6.8%) | 1,327 (12.2%) |
| 8:00 AM to 8:29 AM | 1,052 (8.4%) | 1,216 (11.2%) |
| 8:30 AM to 8:59 AM | 278 (2.2%) | 492 (4.5%) |
| 9:00 AM to 9:59 AM | 340 (2.7%) | 1,037 (9.6%) |
| 10:00 AM to 10:59 AM | 356 (2.8%) | 286 (2.6%) |
| 11:00 AM to 11:59 AM | 123 (1.0%) | 111 (1.0%) |
| 12:00 PM to 3:59 PM | 787 (6.3%) | 342 (3.2%) |
| 4:00 PM to 11:59 PM | 863 (6.9%) | 860 (7.9%) |
| Total | 12,536 (100.0%) | 10,861 (100.0%) |
Housing Occupancy in Culpeper County
Occupancy by Ownership in Culpeper County
Of the total 18,188 dwellings in Culpeper County, owner-occupied units account for 13,505 (74.3%), while renter-occupied units make up 4,683 (25.8%).
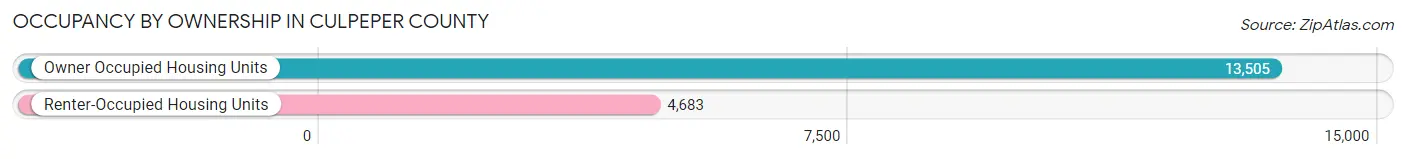
| Occupancy | # Housing Units | % Housing Units |
| Owner Occupied Housing Units | 13,505 | 74.3% |
| Renter-Occupied Housing Units | 4,683 | 25.8% |
| Total Occupied Housing Units | 18,188 | 100.0% |
Occupancy by Household Size in Culpeper County
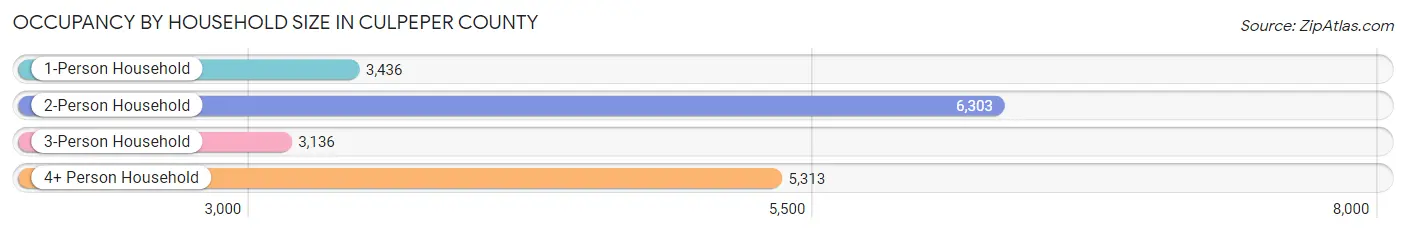
| Household Size | # Housing Units | % Housing Units |
| 1-Person Household | 3,436 | 18.9% |
| 2-Person Household | 6,303 | 34.6% |
| 3-Person Household | 3,136 | 17.2% |
| 4+ Person Household | 5,313 | 29.2% |
| Total Housing Units | 18,188 | 100.0% |
Occupancy by Ownership by Household Size in Culpeper County
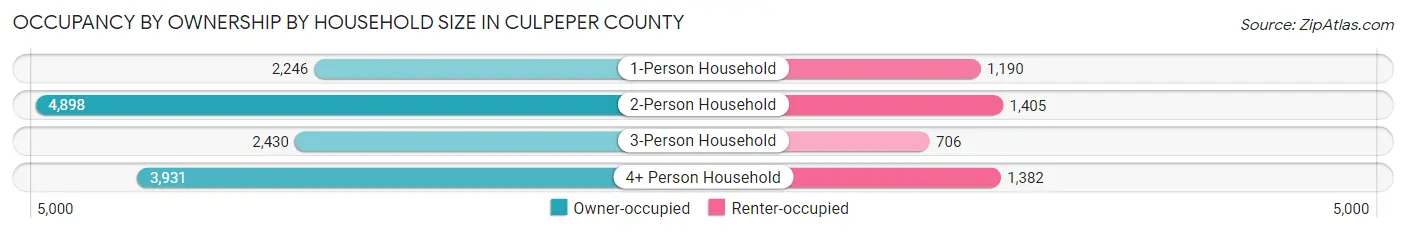
| Household Size | Owner-occupied | Renter-occupied |
| 1-Person Household | 2,246 (65.4%) | 1,190 (34.6%) |
| 2-Person Household | 4,898 (77.7%) | 1,405 (22.3%) |
| 3-Person Household | 2,430 (77.5%) | 706 (22.5%) |
| 4+ Person Household | 3,931 (74.0%) | 1,382 (26.0%) |
| Total Housing Units | 13,505 (74.3%) | 4,683 (25.8%) |
Occupancy by Educational Attainment in Culpeper County
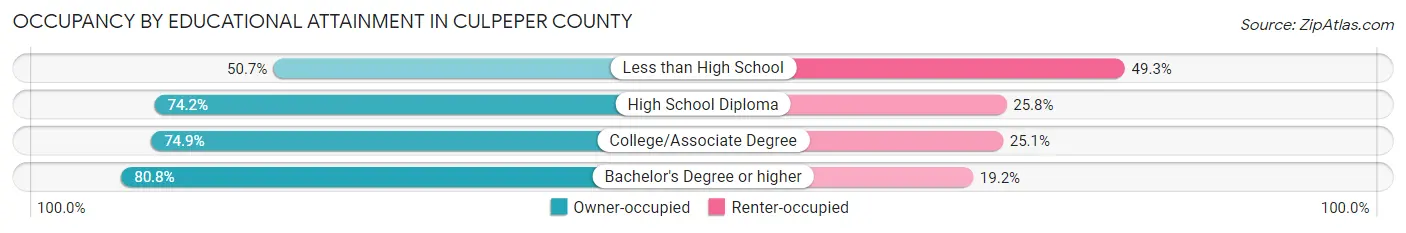
| Household Size | Owner-occupied | Renter-occupied |
| Less than High School | 866 (50.7%) | 841 (49.3%) |
| High School Diploma | 3,804 (74.2%) | 1,322 (25.8%) |
| College/Associate Degree | 4,319 (74.9%) | 1,448 (25.1%) |
| Bachelor's Degree or higher | 4,516 (80.8%) | 1,072 (19.2%) |
Occupancy by Age of Householder in Culpeper County
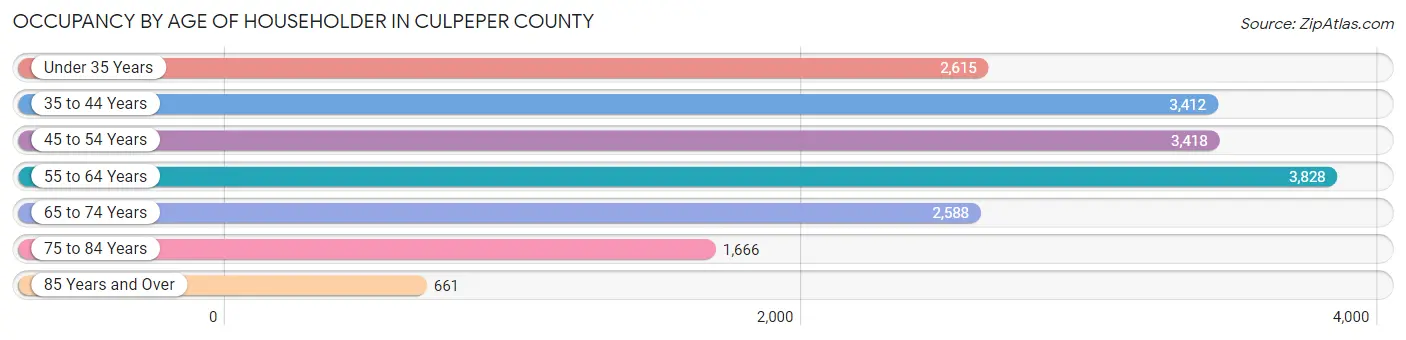
| Age Bracket | # Households | % Households |
| Under 35 Years | 2,615 | 14.4% |
| 35 to 44 Years | 3,412 | 18.8% |
| 45 to 54 Years | 3,418 | 18.8% |
| 55 to 64 Years | 3,828 | 21.0% |
| 65 to 74 Years | 2,588 | 14.2% |
| 75 to 84 Years | 1,666 | 9.2% |
| 85 Years and Over | 661 | 3.6% |
| Total | 18,188 | 100.0% |
Housing Finances in Culpeper County
Median Income by Occupancy in Culpeper County
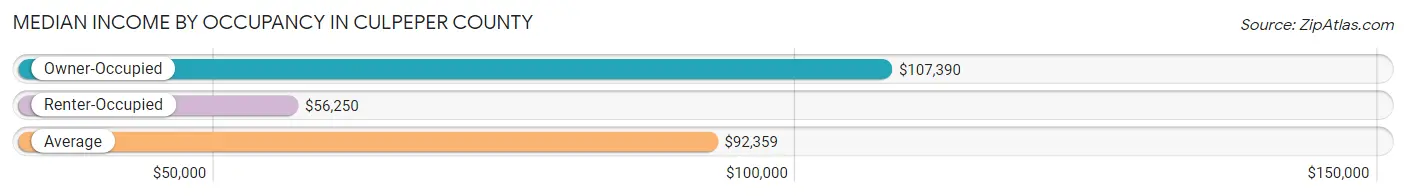
| Occupancy Type | # Households | Median Income |
| Owner-Occupied | 13,505 (74.3%) | $107,390 |
| Renter-Occupied | 4,683 (25.8%) | $56,250 |
| Average | 18,188 (100.0%) | $92,359 |
Occupancy by Householder Income Bracket in Culpeper County
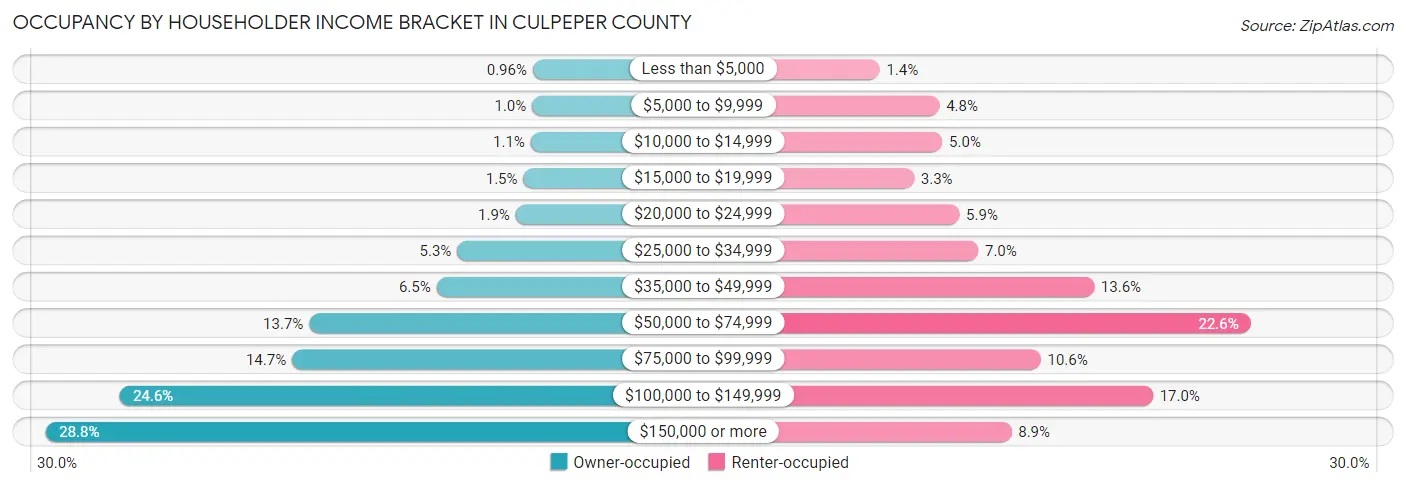
| Income Bracket | Owner-occupied | Renter-occupied |
| Less than $5,000 | 130 (1.0%) | 64 (1.4%) |
| $5,000 to $9,999 | 135 (1.0%) | 224 (4.8%) |
| $10,000 to $14,999 | 146 (1.1%) | 232 (5.0%) |
| $15,000 to $19,999 | 202 (1.5%) | 156 (3.3%) |
| $20,000 to $24,999 | 262 (1.9%) | 277 (5.9%) |
| $25,000 to $34,999 | 713 (5.3%) | 328 (7.0%) |
| $35,000 to $49,999 | 873 (6.5%) | 638 (13.6%) |
| $50,000 to $74,999 | 1,855 (13.7%) | 1,057 (22.6%) |
| $75,000 to $99,999 | 1,988 (14.7%) | 495 (10.6%) |
| $100,000 to $149,999 | 3,316 (24.5%) | 795 (17.0%) |
| $150,000 or more | 3,885 (28.8%) | 417 (8.9%) |
| Total | 13,505 (100.0%) | 4,683 (100.0%) |
Monthly Housing Cost Tiers in Culpeper County
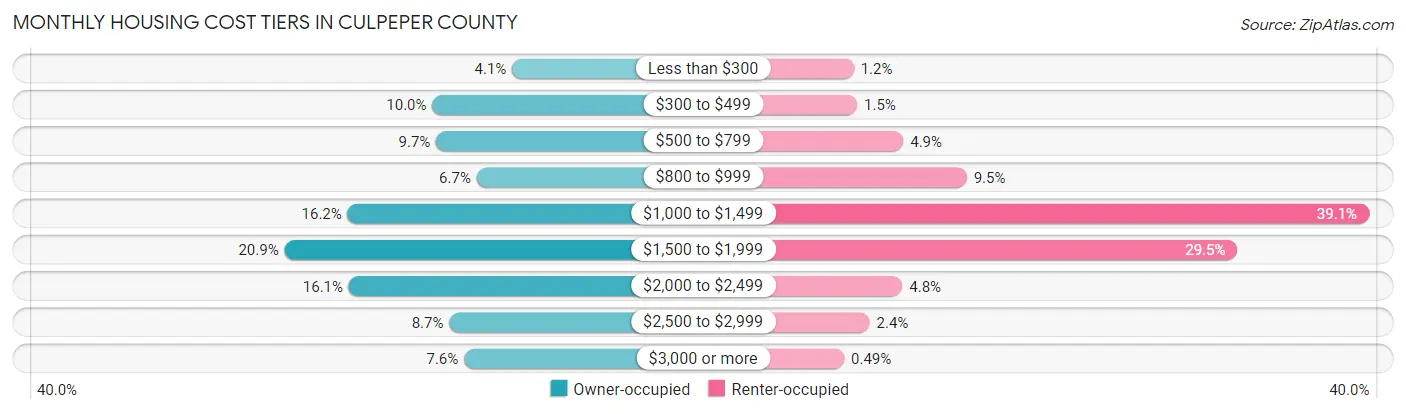
| Monthly Cost | Owner-occupied | Renter-occupied |
| Less than $300 | 553 (4.1%) | 56 (1.2%) |
| $300 to $499 | 1,347 (10.0%) | 68 (1.5%) |
| $500 to $799 | 1,309 (9.7%) | 227 (4.9%) |
| $800 to $999 | 905 (6.7%) | 446 (9.5%) |
| $1,000 to $1,499 | 2,189 (16.2%) | 1,833 (39.1%) |
| $1,500 to $1,999 | 2,817 (20.9%) | 1,379 (29.4%) |
| $2,000 to $2,499 | 2,177 (16.1%) | 224 (4.8%) |
| $2,500 to $2,999 | 1,178 (8.7%) | 111 (2.4%) |
| $3,000 or more | 1,030 (7.6%) | 23 (0.5%) |
| Total | 13,505 (100.0%) | 4,683 (100.0%) |
Physical Housing Characteristics in Culpeper County
Housing Structures in Culpeper County
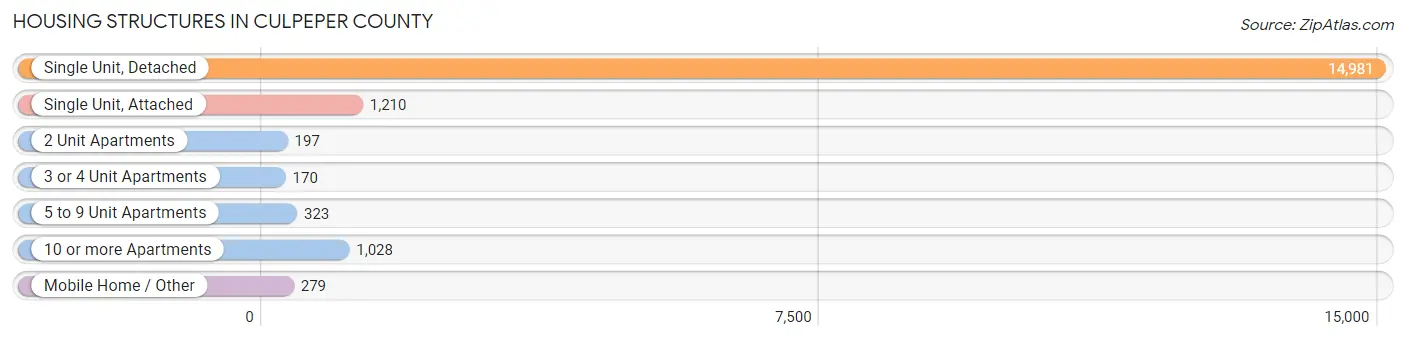
| Structure Type | # Housing Units | % Housing Units |
| Single Unit, Detached | 14,981 | 82.4% |
| Single Unit, Attached | 1,210 | 6.7% |
| 2 Unit Apartments | 197 | 1.1% |
| 3 or 4 Unit Apartments | 170 | 0.9% |
| 5 to 9 Unit Apartments | 323 | 1.8% |
| 10 or more Apartments | 1,028 | 5.7% |
| Mobile Home / Other | 279 | 1.5% |
| Total | 18,188 | 100.0% |
Housing Structures by Occupancy in Culpeper County
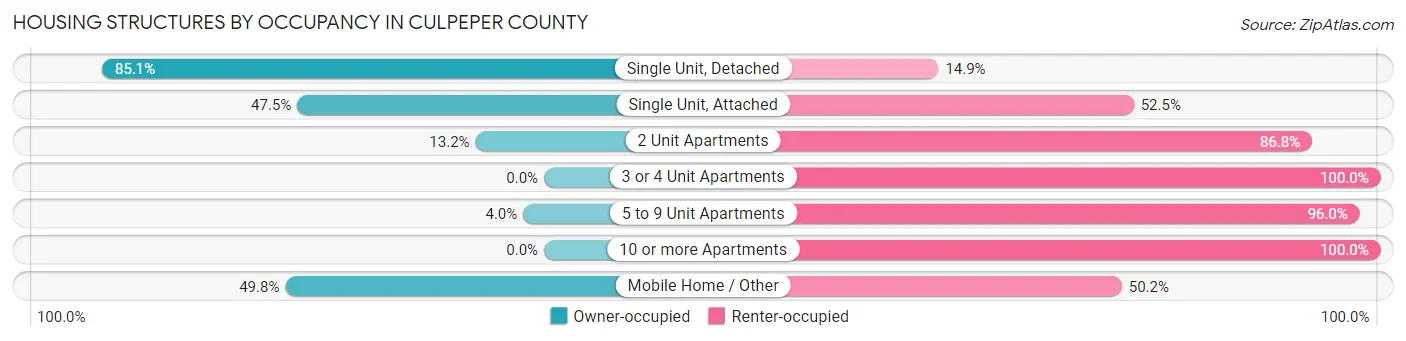
| Structure Type | Owner-occupied | Renter-occupied |
| Single Unit, Detached | 12,752 (85.1%) | 2,229 (14.9%) |
| Single Unit, Attached | 575 (47.5%) | 635 (52.5%) |
| 2 Unit Apartments | 26 (13.2%) | 171 (86.8%) |
| 3 or 4 Unit Apartments | 0 (0.0%) | 170 (100.0%) |
| 5 to 9 Unit Apartments | 13 (4.0%) | 310 (96.0%) |
| 10 or more Apartments | 0 (0.0%) | 1,028 (100.0%) |
| Mobile Home / Other | 139 (49.8%) | 140 (50.2%) |
| Total | 13,505 (74.3%) | 4,683 (25.8%) |
Housing Structures by Number of Rooms in Culpeper County
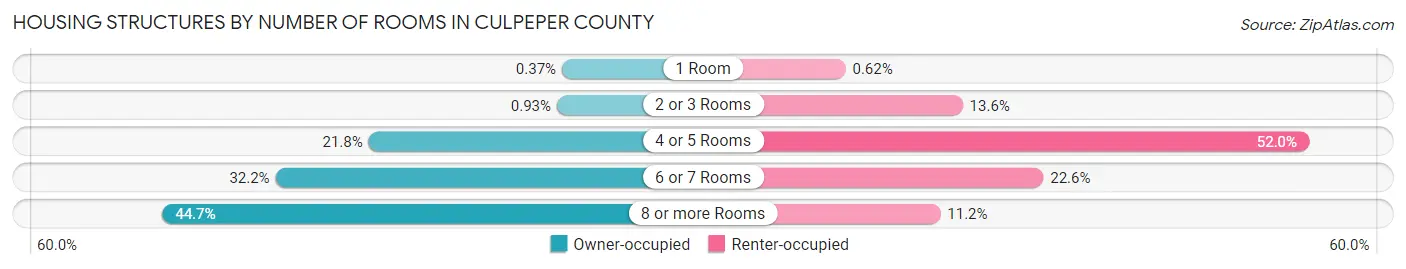
| Number of Rooms | Owner-occupied | Renter-occupied |
| 1 Room | 50 (0.4%) | 29 (0.6%) |
| 2 or 3 Rooms | 126 (0.9%) | 638 (13.6%) |
| 4 or 5 Rooms | 2,948 (21.8%) | 2,437 (52.0%) |
| 6 or 7 Rooms | 4,343 (32.2%) | 1,057 (22.6%) |
| 8 or more Rooms | 6,038 (44.7%) | 522 (11.2%) |
| Total | 13,505 (100.0%) | 4,683 (100.0%) |
Housing Structure by Heating Type in Culpeper County
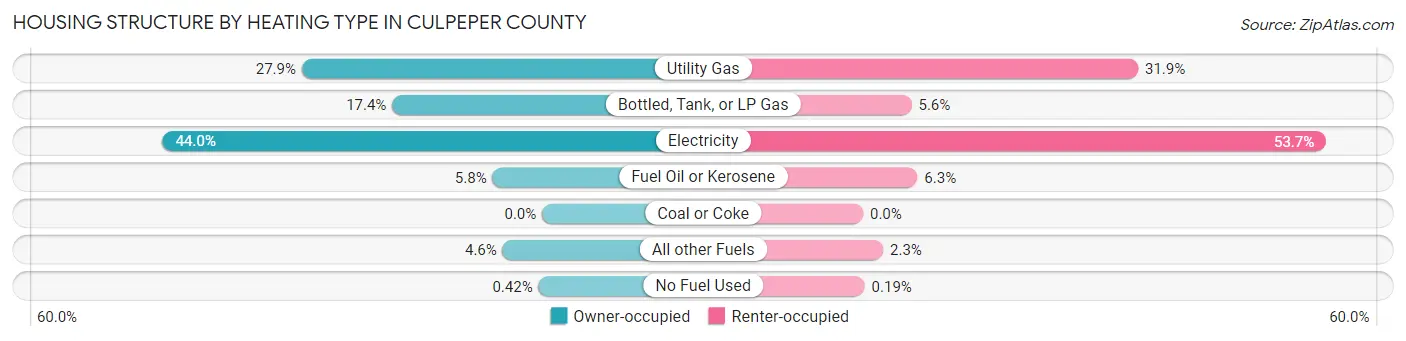
| Heating Type | Owner-occupied | Renter-occupied |
| Utility Gas | 3,763 (27.9%) | 1,493 (31.9%) |
| Bottled, Tank, or LP Gas | 2,347 (17.4%) | 263 (5.6%) |
| Electricity | 5,943 (44.0%) | 2,514 (53.7%) |
| Fuel Oil or Kerosene | 776 (5.8%) | 295 (6.3%) |
| Coal or Coke | 0 (0.0%) | 0 (0.0%) |
| All other Fuels | 619 (4.6%) | 109 (2.3%) |
| No Fuel Used | 57 (0.4%) | 9 (0.2%) |
| Total | 13,505 (100.0%) | 4,683 (100.0%) |
Household Vehicle Usage in Culpeper County
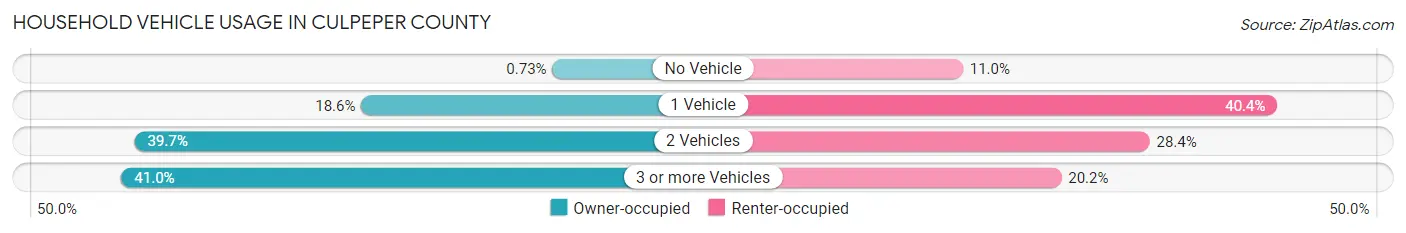
| Vehicles per Household | Owner-occupied | Renter-occupied |
| No Vehicle | 99 (0.7%) | 515 (11.0%) |
| 1 Vehicle | 2,508 (18.6%) | 1,890 (40.4%) |
| 2 Vehicles | 5,367 (39.7%) | 1,332 (28.4%) |
| 3 or more Vehicles | 5,531 (41.0%) | 946 (20.2%) |
| Total | 13,505 (100.0%) | 4,683 (100.0%) |
Real Estate & Mortgages in Culpeper County
Real Estate and Mortgage Overview in Culpeper County
| Characteristic | Without Mortgage | With Mortgage |
| Housing Units | 3,699 | 9,806 |
| Median Property Value | $349,800 | $375,500 |
| Median Household Income | $81,934 | $3,164 |
| Monthly Housing Costs | $506 | $1,030 |
| Real Estate Taxes | $1,902 | $146 |
Property Value by Mortgage Status in Culpeper County
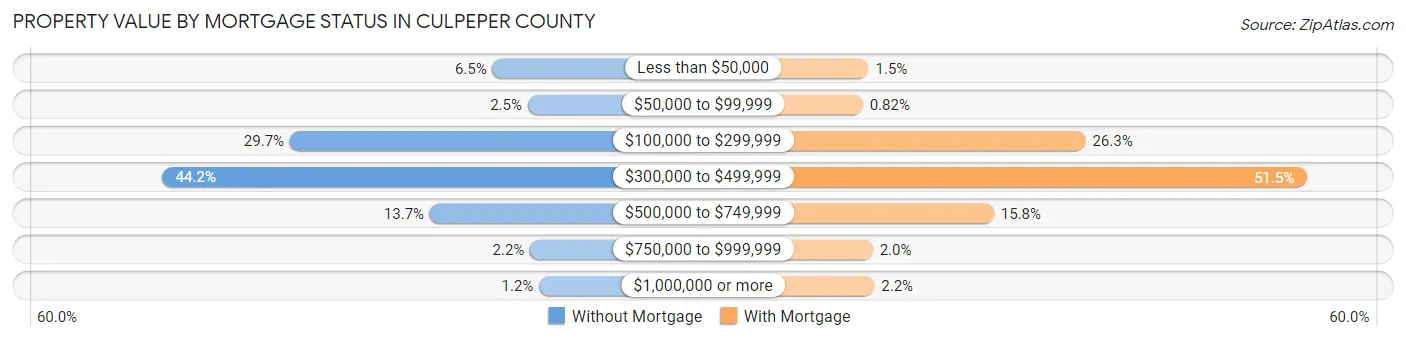
| Property Value | Without Mortgage | With Mortgage |
| Less than $50,000 | 241 (6.5%) | 146 (1.5%) |
| $50,000 to $99,999 | 92 (2.5%) | 80 (0.8%) |
| $100,000 to $299,999 | 1,098 (29.7%) | 2,577 (26.3%) |
| $300,000 to $499,999 | 1,636 (44.2%) | 5,050 (51.5%) |
| $500,000 to $749,999 | 506 (13.7%) | 1,550 (15.8%) |
| $750,000 to $999,999 | 82 (2.2%) | 192 (2.0%) |
| $1,000,000 or more | 44 (1.2%) | 211 (2.1%) |
| Total | 3,699 (100.0%) | 9,806 (100.0%) |
Household Income by Mortgage Status in Culpeper County
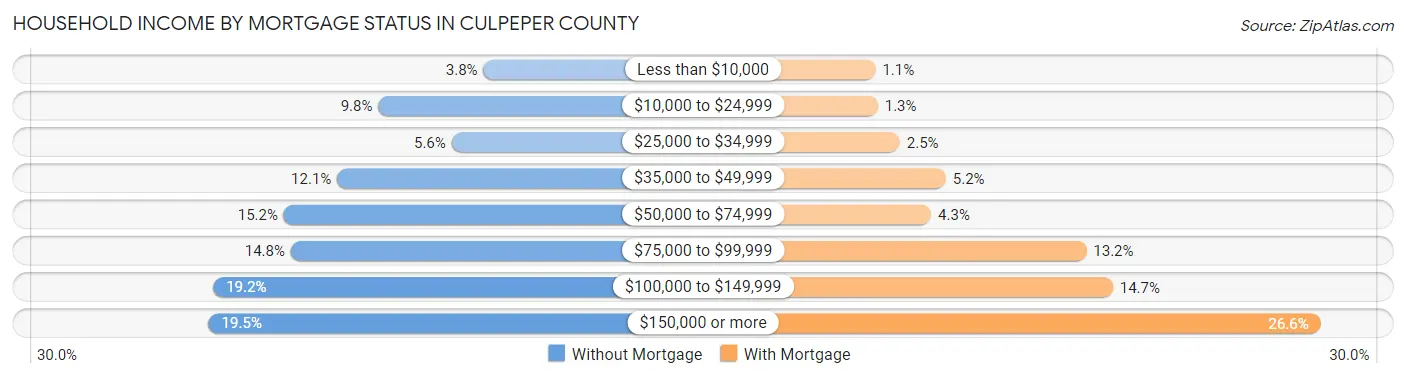
| Household Income | Without Mortgage | With Mortgage |
| Less than $10,000 | 140 (3.8%) | 112 (1.1%) |
| $10,000 to $24,999 | 362 (9.8%) | 125 (1.3%) |
| $25,000 to $34,999 | 207 (5.6%) | 248 (2.5%) |
| $35,000 to $49,999 | 449 (12.1%) | 506 (5.2%) |
| $50,000 to $74,999 | 562 (15.2%) | 424 (4.3%) |
| $75,000 to $99,999 | 547 (14.8%) | 1,293 (13.2%) |
| $100,000 to $149,999 | 711 (19.2%) | 1,441 (14.7%) |
| $150,000 or more | 721 (19.5%) | 2,605 (26.6%) |
| Total | 3,699 (100.0%) | 9,806 (100.0%) |
Property Value to Household Income Ratio in Culpeper County
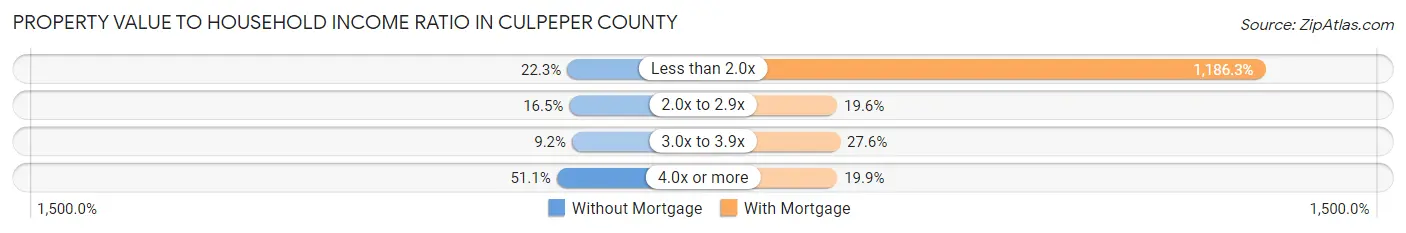
| Value-to-Income Ratio | Without Mortgage | With Mortgage |
| Less than 2.0x | 824 (22.3%) | 116,328 (1,186.3%) |
| 2.0x to 2.9x | 609 (16.5%) | 1,918 (19.6%) |
| 3.0x to 3.9x | 339 (9.2%) | 2,706 (27.6%) |
| 4.0x or more | 1,890 (51.1%) | 1,955 (19.9%) |
| Total | 3,699 (100.0%) | 9,806 (100.0%) |
Real Estate Taxes by Mortgage Status in Culpeper County

| Property Taxes | Without Mortgage | With Mortgage |
| Less than $800 | 333 (9.0%) | 42 (0.4%) |
| $800 to $1,499 | 883 (23.9%) | 292 (3.0%) |
| $800 to $1,499 | 2,300 (62.2%) | 1,696 (17.3%) |
| Total | 3,699 (100.0%) | 9,806 (100.0%) |
Health & Disability in Culpeper County
Health Insurance Coverage by Age in Culpeper County
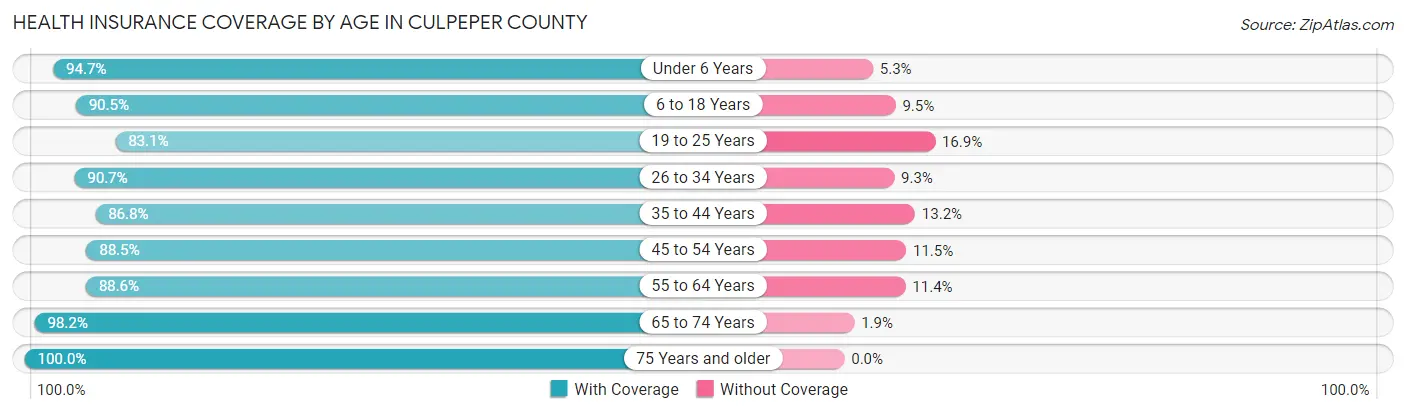
| Age Bracket | With Coverage | Without Coverage |
| Under 6 Years | 3,816 (94.7%) | 215 (5.3%) |
| 6 to 18 Years | 8,712 (90.5%) | 919 (9.5%) |
| 19 to 25 Years | 3,282 (83.1%) | 668 (16.9%) |
| 26 to 34 Years | 4,582 (90.7%) | 469 (9.3%) |
| 35 to 44 Years | 6,106 (86.8%) | 926 (13.2%) |
| 45 to 54 Years | 5,597 (88.5%) | 728 (11.5%) |
| 55 to 64 Years | 6,274 (88.6%) | 807 (11.4%) |
| 65 to 74 Years | 4,730 (98.2%) | 89 (1.8%) |
| 75 Years and older | 3,489 (100.0%) | 0 (0.0%) |
| Total | 46,588 (90.6%) | 4,821 (9.4%) |
Health Insurance Coverage by Citizenship Status in Culpeper County
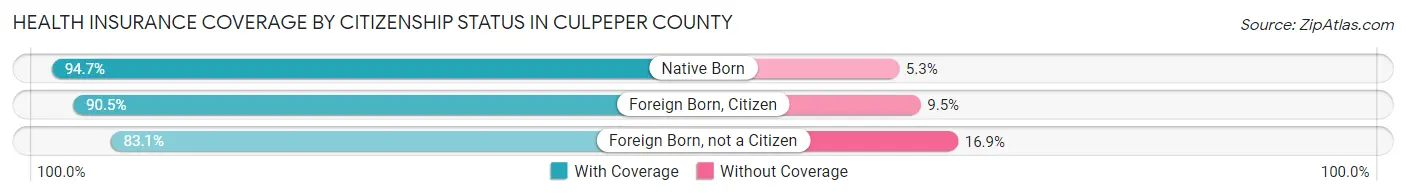
| Citizenship Status | With Coverage | Without Coverage |
| Native Born | 3,816 (94.7%) | 215 (5.3%) |
| Foreign Born, Citizen | 8,712 (90.5%) | 919 (9.5%) |
| Foreign Born, not a Citizen | 3,282 (83.1%) | 668 (16.9%) |
Health Insurance Coverage by Household Income in Culpeper County
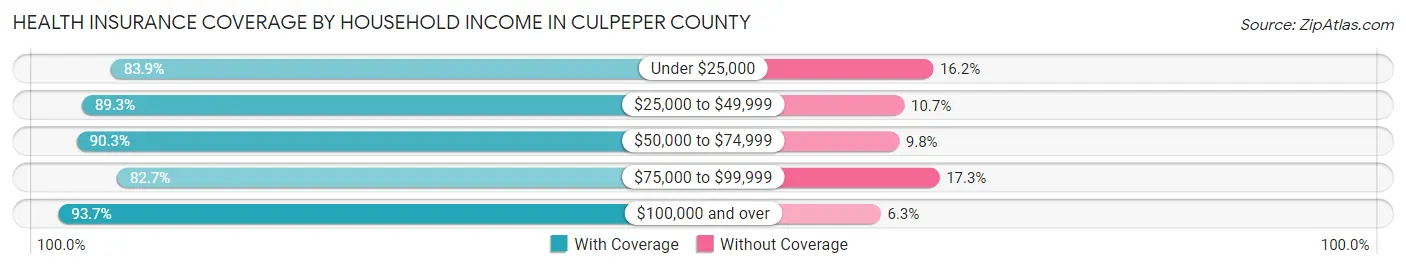
| Household Income | With Coverage | Without Coverage |
| Under $25,000 | 2,440 (83.9%) | 470 (16.2%) |
| $25,000 to $49,999 | 4,956 (89.3%) | 596 (10.7%) |
| $50,000 to $74,999 | 6,672 (90.2%) | 721 (9.8%) |
| $75,000 to $99,999 | 5,919 (82.7%) | 1,239 (17.3%) |
| $100,000 and over | 26,480 (93.7%) | 1,785 (6.3%) |
Public vs Private Health Insurance Coverage by Age in Culpeper County
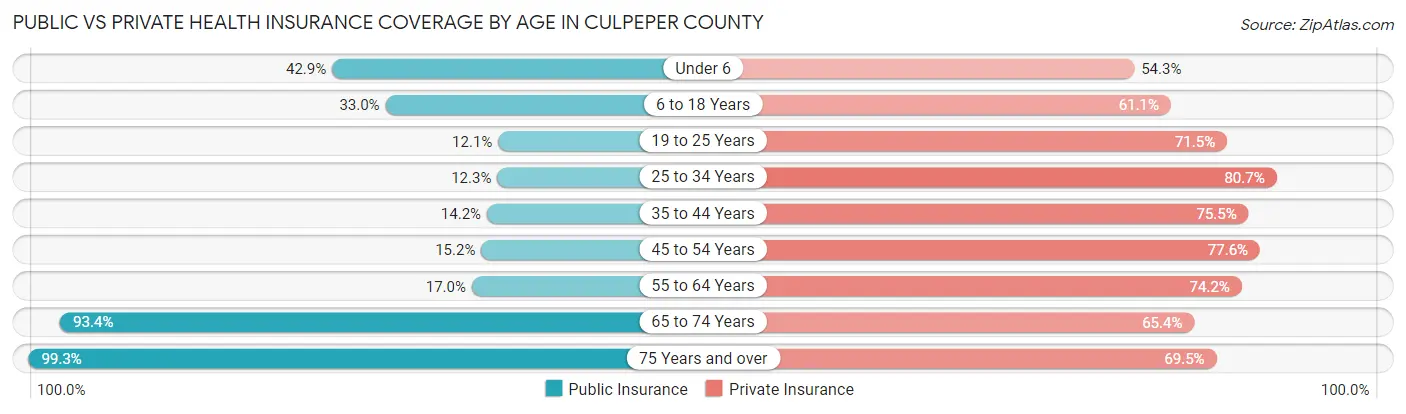
| Age Bracket | Public Insurance | Private Insurance |
| Under 6 | 1,731 (42.9%) | 2,188 (54.3%) |
| 6 to 18 Years | 3,180 (33.0%) | 5,882 (61.1%) |
| 19 to 25 Years | 478 (12.1%) | 2,824 (71.5%) |
| 25 to 34 Years | 620 (12.3%) | 4,075 (80.7%) |
| 35 to 44 Years | 998 (14.2%) | 5,309 (75.5%) |
| 45 to 54 Years | 964 (15.2%) | 4,908 (77.6%) |
| 55 to 64 Years | 1,204 (17.0%) | 5,255 (74.2%) |
| 65 to 74 Years | 4,502 (93.4%) | 3,152 (65.4%) |
| 75 Years and over | 3,464 (99.3%) | 2,426 (69.5%) |
| Total | 17,141 (33.3%) | 36,019 (70.1%) |
Disability Status by Sex by Age in Culpeper County
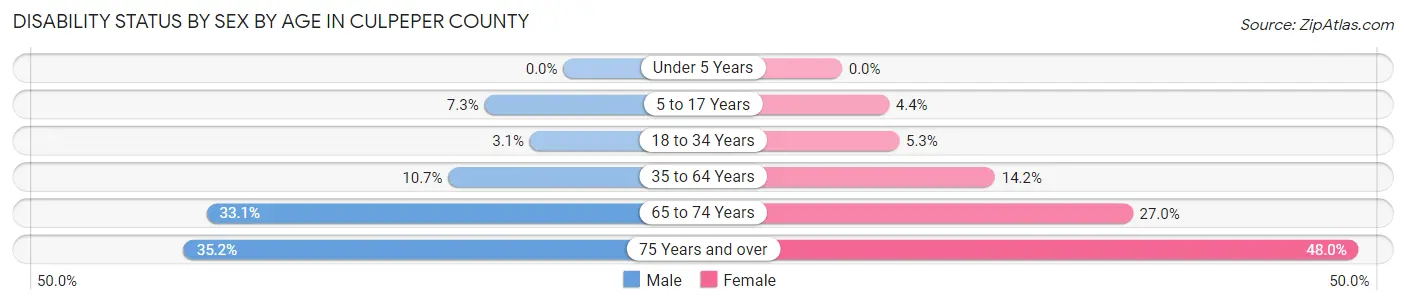
| Age Bracket | Male | Female |
| Under 5 Years | 0 (0.0%) | 0 (0.0%) |
| 5 to 17 Years | 344 (7.3%) | 214 (4.4%) |
| 18 to 34 Years | 152 (3.1%) | 261 (5.3%) |
| 35 to 64 Years | 1,078 (10.7%) | 1,468 (14.2%) |
| 65 to 74 Years | 746 (33.1%) | 692 (27.0%) |
| 75 Years and over | 554 (35.2%) | 919 (48.0%) |
Disability Class by Sex by Age in Culpeper County
Disability Class: Hearing Difficulty
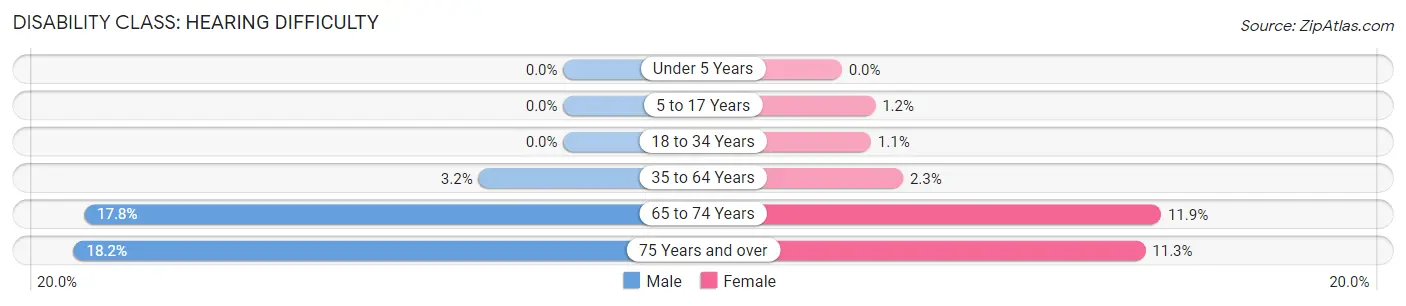
| Age Bracket | Male | Female |
| Under 5 Years | 0 (0.0%) | 0 (0.0%) |
| 5 to 17 Years | 0 (0.0%) | 61 (1.2%) |
| 18 to 34 Years | 0 (0.0%) | 53 (1.1%) |
| 35 to 64 Years | 318 (3.2%) | 235 (2.3%) |
| 65 to 74 Years | 401 (17.8%) | 304 (11.8%) |
| 75 Years and over | 286 (18.2%) | 216 (11.3%) |
Disability Class: Vision Difficulty
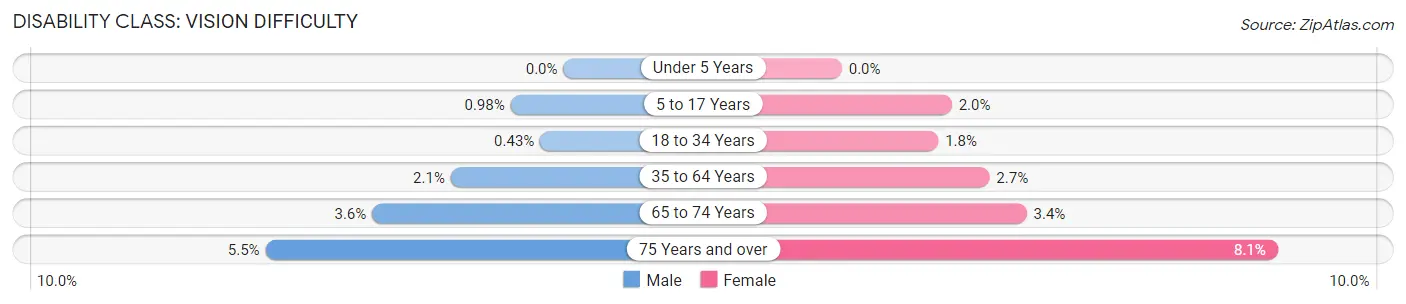
| Age Bracket | Male | Female |
| Under 5 Years | 0 (0.0%) | 0 (0.0%) |
| 5 to 17 Years | 46 (1.0%) | 100 (2.0%) |
| 18 to 34 Years | 21 (0.4%) | 88 (1.8%) |
| 35 to 64 Years | 211 (2.1%) | 283 (2.7%) |
| 65 to 74 Years | 80 (3.5%) | 88 (3.4%) |
| 75 Years and over | 87 (5.5%) | 155 (8.1%) |
Disability Class: Cognitive Difficulty
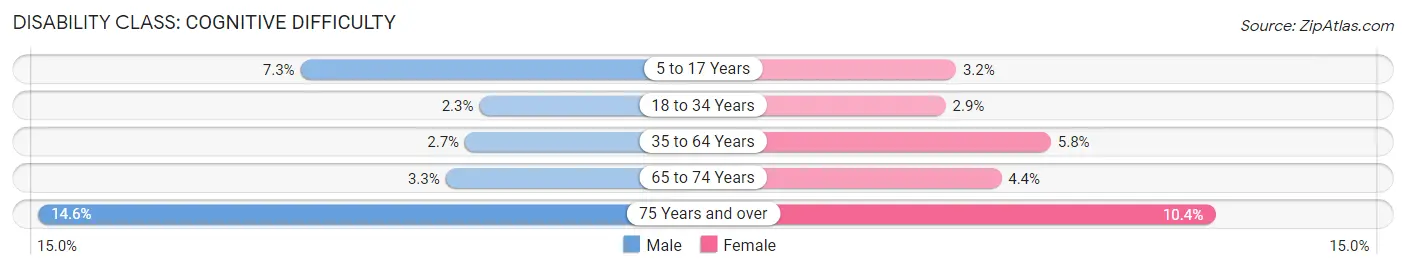
| Age Bracket | Male | Female |
| 5 to 17 Years | 344 (7.3%) | 156 (3.2%) |
| 18 to 34 Years | 114 (2.3%) | 142 (2.9%) |
| 35 to 64 Years | 277 (2.7%) | 601 (5.8%) |
| 65 to 74 Years | 74 (3.3%) | 114 (4.4%) |
| 75 Years and over | 230 (14.6%) | 199 (10.4%) |
Disability Class: Ambulatory Difficulty
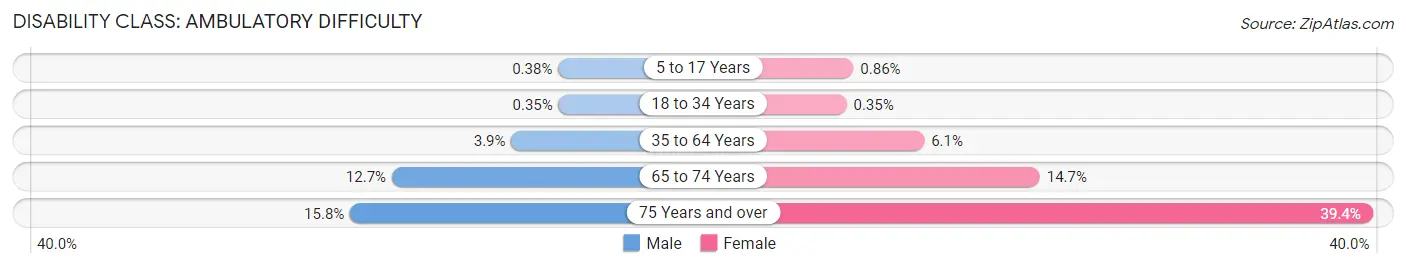
| Age Bracket | Male | Female |
| 5 to 17 Years | 18 (0.4%) | 42 (0.9%) |
| 18 to 34 Years | 17 (0.4%) | 17 (0.4%) |
| 35 to 64 Years | 390 (3.9%) | 633 (6.1%) |
| 65 to 74 Years | 287 (12.7%) | 377 (14.7%) |
| 75 Years and over | 249 (15.8%) | 755 (39.4%) |
Disability Class: Self-Care Difficulty
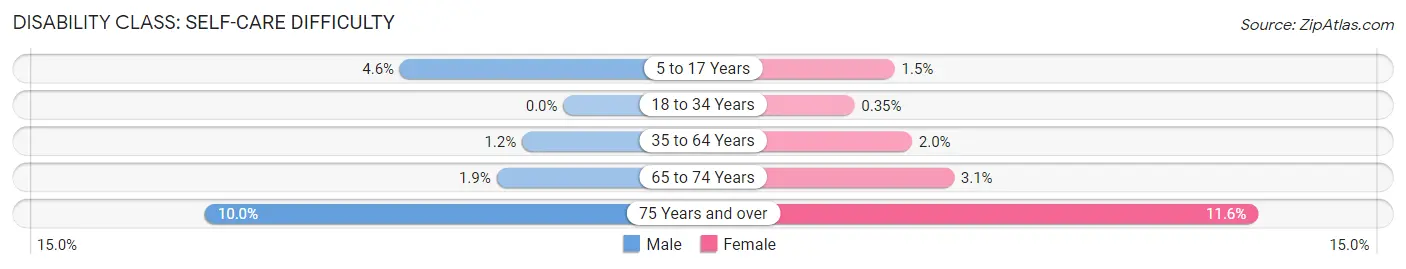
| Age Bracket | Male | Female |
| 5 to 17 Years | 214 (4.5%) | 72 (1.5%) |
| 18 to 34 Years | 0 (0.0%) | 17 (0.4%) |
| 35 to 64 Years | 116 (1.1%) | 202 (1.9%) |
| 65 to 74 Years | 42 (1.9%) | 80 (3.1%) |
| 75 Years and over | 157 (10.0%) | 222 (11.6%) |
Technology Access in Culpeper County
Computing Device Access in Culpeper County
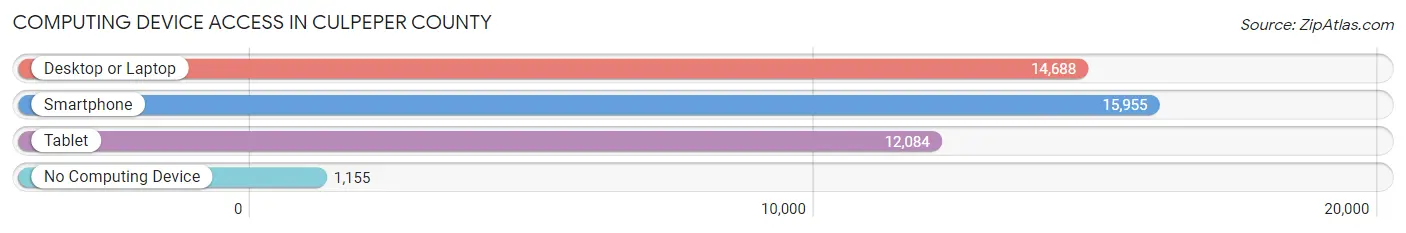
| Device Type | # Households | % Households |
| Desktop or Laptop | 14,688 | 80.8% |
| Smartphone | 15,955 | 87.7% |
| Tablet | 12,084 | 66.4% |
| No Computing Device | 1,155 | 6.4% |
| Total | 18,188 | 100.0% |
Internet Access in Culpeper County
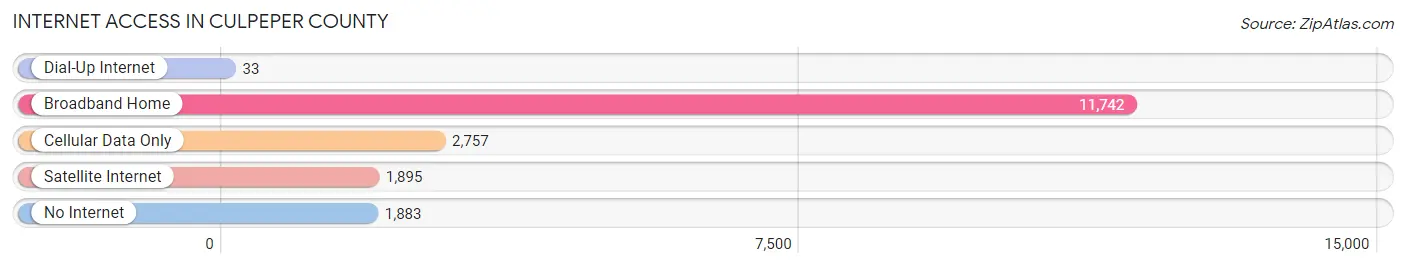
| Internet Type | # Households | % Households |
| Dial-Up Internet | 33 | 0.2% |
| Broadband Home | 11,742 | 64.6% |
| Cellular Data Only | 2,757 | 15.2% |
| Satellite Internet | 1,895 | 10.4% |
| No Internet | 1,883 | 10.3% |
| Total | 18,188 | 100.0% |
Culpeper County Summary
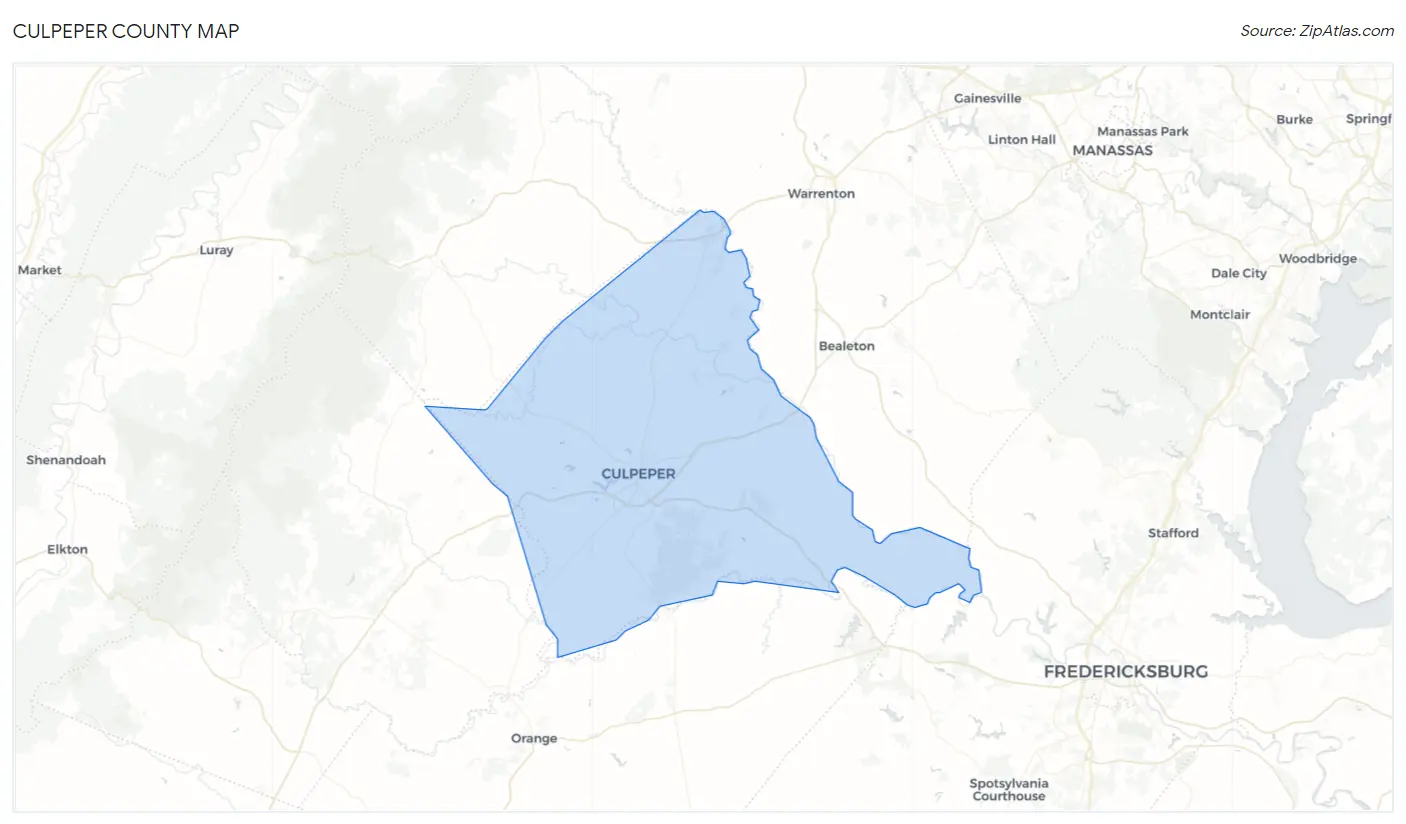
Culpeper County, Virginia is located in the northern part of the state, in the foothills of the Blue Ridge Mountains. It is bordered by Fauquier County to the north, Madison County to the east, Orange County to the south, and Rappahannock County to the west. The county seat is the town of Culpeper.
History
Culpeper County was formed in 1748 from Orange County. It was named for Thomas Lord Culpeper, the Governor of Virginia from 1680 to 1683. The county was the site of several battles during the Civil War, including the Battle of Cedar Mountain and the Battle of Brandy Station.
Geography
Culpeper County covers an area of 437 square miles. It is located in the Piedmont region of Virginia, and is characterized by rolling hills and valleys. The county is drained by the Rappahannock River and its tributaries. The highest point in the county is Bald Knob, which has an elevation of 1,845 feet.
Economy
Agriculture is the main economic activity in Culpeper County. The county is home to several large farms, and the main crops grown are corn, soybeans, wheat, hay, and tobacco. The county also has a thriving wine industry, with several wineries located in the area.
The county is also home to several large employers, including the Culpeper Regional Hospital, the Culpeper County Public Schools, and the Culpeper County Sheriff's Office.
Demographics
As of the 2010 census, Culpeper County had a population of 46,689. The racial makeup of the county was 87.3% White, 8.7% Black or African American, 0.4% Native American, 0.7% Asian, 0.1% Pacific Islander, 1.3% from other races, and 1.6% from two or more races. Hispanic or Latino of any race were 4.2% of the population.
The median household income in the county was $54,845, and the median family income was $63,945. The per capita income was $27,845. About 8.7% of families and 11.2% of the population were below the poverty line, including 15.2% of those under age 18 and 8.2% of those age 65 or over.
Culpeper County is served by the Culpeper County Public Schools, which includes seven elementary schools, two middle schools, and two high schools. The county is also home to several private schools, including the Culpeper Christian School and the Culpeper Baptist Academy.
Common Questions
What is Per Capita Income in Culpeper County?
Per Capita income in Culpeper County is $39,062.
What is the Median Family Income in Culpeper County?
Median Family Income in Culpeper County is $103,967.
What is the Median Household income in Culpeper County?
Median Household Income in Culpeper County is $92,359.
What is Income or Wage Gap in Culpeper County?
Income or Wage Gap in Culpeper County is 37.9%.
Women in Culpeper County earn 62.1 cents for every dollar earned by a man.
What is Family Income Deficit in Culpeper County?
Family Income Deficit in Culpeper County is $9,140.
Families that are below poverty line in Culpeper County earn $9,140 less on average than the poverty threshold level.
What is Inequality or Gini Index in Culpeper County?
Inequality or Gini Index in Culpeper County is 0.41.
What is the Total Population of Culpeper County?
Total Population of Culpeper County is 52,822.
What is the Total Male Population of Culpeper County?
Total Male Population of Culpeper County is 26,404.
What is the Total Female Population of Culpeper County?
Total Female Population of Culpeper County is 26,418.
What is the Ratio of Males per 100 Females in Culpeper County?
There are 99.95 Males per 100 Females in Culpeper County.
What is the Ratio of Females per 100 Males in Culpeper County?
There are 100.05 Females per 100 Males in Culpeper County.
What is the Median Population Age in Culpeper County?
Median Population Age in Culpeper County is 39.5 Years.
What is the Average Family Size in Culpeper County
Average Family Size in Culpeper County is 3.2 People.
What is the Average Household Size in Culpeper County
Average Household Size in Culpeper County is 2.8 People.
How Large is the Labor Force in Culpeper County?
There are 26,889 People in the Labor Forcein in Culpeper County.
What is the Percentage of People in the Labor Force in Culpeper County?
64.7% of People are in the Labor Force in Culpeper County.
What is the Unemployment Rate in Culpeper County?
Unemployment Rate in Culpeper County is 3.9%.